UNITED STATES
SECURITIES AND EXCHANGE COMMISSION Washington, D.C. 20549
FORM N-CSR
CERTIFIED SHAREHOLDER REPORT OF REGISTERED MANAGEMENT INVESTMENT COMPANIES
Investment Company Act file number 811-3855
Fidelity Advisor Series VIII
(Exact name of registrant as specified in charter)
82 Devonshire St., Boston, Massachusetts 02109
(Address of principal executive offices) (Zip code)
Eric D. Roiter, Secretary
82 Devonshire St.
Boston, Massachusetts 02109
(Name and address of agent for service)
|
Registrant's telephone number, including area code: 617-563-7000
| Date of fiscal year end: | | October | | 31 |
| Date of reporting period: | | October | | 31, 2005 |
| Item 1. | | Reports to Stockholders |

Fidelity® Advisor
Diversified International
Fund - Class A, Class T, Class B and Class C
Annual Report
October 31, 2005

| Contents | | | | |
| |
| Chairman’s Message | | 4 | | Ned Johnson’s message to shareholders. |
| Performance | | 6 | | How the fund has done over time. |
| Management’s Discussion | | 8 | | The manager’s review of fund |
| | | | | performance, strategy and outlook. |
| Shareholder Expense | | 9 | | An example of shareholder expenses. |
| Example | | | | |
| Investment Changes | | 11 | | A summary of major shifts in the fund’s |
| | | | | investments over the past six months. |
| Investments | | 12 | | A complete list of the fund’s investments |
| | | | | with their market values. |
| Financial Statements | | 23 | | Statements of assets and liabilities, |
| | | | | operations, and changes in net assets, |
| | | | | as well as financial highlights. |
| Notes | | 32 | | Notes to the financial statements. |
| Report of Independent | | 41 | | |
| Registered Public | | | | |
| Accounting Firm | | | | |
| Trustees and Officers | | 42 | | |
| Distributions | | 52 | | |
| Board Approval of | | 53 | | |
| Investment Advisory | | | | |
| Contracts and | | | | |
| Management Fees | | | | |
To view a fund’s proxy voting guidelines and proxy voting record for the 12-month period ended June 30, visit www.fidelity.com/proxyvotingresults or visit the Securities and Exchange Commission’s (SEC) web site at www.sec.gov. You may also call 1-877-208-0098 to request a free copy of the proxy voting guidelines.
Standard & Poor’s, S&P and S&P 500 are registered service marks of The McGraw-Hill Companies, Inc. and have been licensed for use by Fidelity Distributors Corporation.
Other third party marks appearing herein are the property of their respective owners.
All other marks appearing herein are registered or unregistered trademarks or service marks of FMR Corp. or an affiliated company.
This report and the financial statements contained herein are submitted for the general information of the shareholders of the fund. This report is not authorized for distribution to prospective investors in the fund unless preceded or accompanied by an effective prospectus.
A fund files its complete schedule of portfolio holdings with the SEC for the first and third quarters of each fiscal year on Form N-Q. Forms N-Q are available on the SEC’s web site at http://www.sec.gov. A fund’s Forms N-Q may be reviewed and copied at the SEC’s Public Reference Room in Washington, DC. Information regarding the operation of the SEC’s Public Reference Room may be obtained by calling 1-800-SEC-0330. For a complete list of a fund’s portfolio holdings, view the most recent quarterly holdings report, semiannual report, or annual report on Fidelity’s web site at http://www.advisor.fidelity.com.
NOT FDIC INSURED · MAY LOSE VALUE · NO BANK GUARANTEE
Neither the fund nor Fidelity Distributors Corporation is a bank.
3 Annual Report
Chairman’s Message
(Photograph of Edward C. Johnson 3d)
Dear Shareholder:
During the past year or so, much has been reported about the mutual fund industry, and much of it has been more critical than I believe is warranted. Allegations that some companies have been less than forthright with their shareholders have cast a shadow on the entire industry. I continue to find these reports disturbing, and assert that they do not create an accurate picture of the industry overall. Therefore, I would like to remind everyone where Fidelity stands on these issues. I will say two things specifically regarding allegations that some mutual fund companies were in violation of the Securities and Exchange Commission’s forward pricing rules or were involved in so-called “market timing” activities.
First, Fidelity has no agreements that permit customers who buy fund shares after 4 p.m. to obtain the 4 p.m. price. This is not a new policy. This is not to say that someone could not deceive the company through fraudulent acts. However, we are extremely diligent in preventing fraud from occurring in this manner — and in every other. But I underscore again that Fidelity has no so-called “agreements” that sanction illegal practices.
Second, Fidelity continues to stand on record, as we have for years, in opposition to predatory short-term trading that adversely affects shareholders in a mutual fund. Back in the 1980s, we initiated a fee — which is returned to the fund and, therefore, to investors — to discourage this activity. Further, we took the lead several years ago in developing a Fair Value Pricing Policy to prevent market timing on foreign securities in our funds. I am confident we will find other ways to make it more difficult for predatory traders to operate. However, this will only be achieved through close cooperation among regulators, legislators and the industry.
Yes, there have been unfortunate instances of unethical and illegal activity within the mutual fund industry from time to time. That is true of any industry. When this occurs, confessed or convicted offenders should be dealt with appropriately. But we are still concerned about the risk of over-regulation and the quick application of simplistic solutions to intricate problems. Every system can be improved, and we support and applaud well thought out improvements by regulators, legislators and industry representatives that achieve the common goal of building and protecting the value of investors’ holdings.
For nearly 60 years, Fidelity has worked very hard to improve its products and service to justify your trust. When our family founded this company in 1946, we had only a few hundred customers. Today, we serve more than 18 million customers including individual investors and participants in retirement plans across America.
Annual Report 4
Let me close by saying that we do not take your trust in us for granted, and we realize that we must always work to improve all aspects of our service to you. In turn, we urge you to continue your active participation with your financial matters, so that your interests can be well served.
Best regards,
/s/Edward C. Johnson 3d
5 Annual Report
Performance: The Bottom Line
Average annual total return reflects the change in the value of an investment, assuming reinvestment of the class’ dividend income and capital gains (the profits earned upon the sale of securities that have grown in value) and assuming a constant rate of performance each year. The $10,000 table and the fund’s returns do not reflect the deduction of taxes that a shareholder would pay on fund distributions or the redemption of fund shares. During periods of reimbursement by Fidelity, a fund’s total return will be greater than it would be had the reimbursement not occurred. How a fund did yesterday is no guarantee of how it will do tomorrow. Returns may reflect the conversion of Class B shares to Class A shares after a maximum of seven years.
| Average Annual Total Returns | | | | | | |
| Periods ended October 31, 2005 | | Past 1 | | Past 5 | | Life of |
| | | year | | years | | fundA |
| Class A (incl. 5.75% sales | | | | | | |
| charge) | | 13.57% | | 6.51% | | 10.79% |
| Class T (incl. 3.50% sales | | | | | | |
| charge) | | 15.96% | | 6.69% | | 10.84% |
| Class B (incl. contingent | | | | | | |
| deferred sales charge)B | | 14.35% | | 6.52% | | 10.79% |
| Class C (incl. contingent | | | | | | |
| deferred sales charge)C | | 18.51% | | 6.93% | | 10.86% |
A From December 17, 1998.
B Class B shares’ contingent deferred sales charges included in the past one year, past five year, and
life of fund total return figures are 5%, 2%, and 0%, respectively.
C Class C shares’ contingent deferred sales charges included in the past one year, past five year, and life of fund total return figures are 1%, 0%, and 0%, respectively.
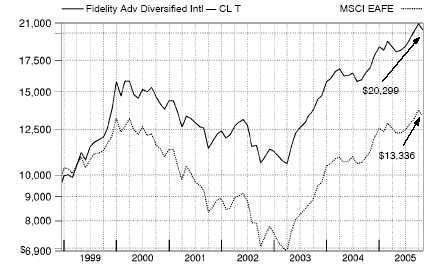
| | $10,000 Over Life of Fund
|
Let’s say hypothetically that $10,000 was invested in Fidelity® Advisor Diversified International Fund — Class T on December 17, 1998, when the fund started, and the current 3.50% sales charge was paid. The chart shows how the value of your investment would have changed, and also shows how the Morgan Stanley Capital InternationalSM Europe, Australasia, Far East (MSCI® EAFE®) Index performed over the same period.
Management’s Discussion of Fund Performance
Comments from Penelope Dobkin, Portfolio Manager of Fidelity® Advisor Diversified International Fund
Foreign stock markets enjoyed broad-based advances during the 12 months ending Octo-ber 31, 2005, encouraged by better-than-expected corporate earnings and markedly improved economies. For the 12 months overall, the Morgan Stanley Capital InternationalSM Europe, Australasia, Far East (MSCI® EAFE®) Index — a performance measure of developed stock markets outside the United States and Canada — gained 18.28% . The Japanese stock market climbed to its highest level in more than four years. Positive economic indicators and Prime Minister Koizumi’s decisive election victory attracted record inflows from overseas investors. In response, the Tokyo Stock Exchange Stock Price Index (TOPIX) soared 22.89% . Southeast Asian equities outside of Japan, particularly South Korea, also responded well to the better macroeconomic environment, illustrated by the 19.44% return for the MSCI All Country Far East ex Japan index. European stock markets were up as well, despite investors’ concern about higher energy prices and potential downgrades to economic growth in the region. For the year overall, the MSCI Europe index rose 16.51% . Although robust, returns for U.S. investors in foreign markets were tempered by the strength of the dollar versus many major currencies.
During the past year, the fund’s Class A, Class T, Class B and Class C shares returned 20.50%, 20.16%, 19.35% and 19.51%, respectively, outpacing the MSCI EAFE index and the LipperSM International Funds Average, which rose 17.75% . Favorable stock selection in banks and diversified financials contributed the most to the fund’s return relative to the index, with holdings in Japanese and emerging-markets banks among the best performers. Stocks in such key markets as Germany, which enjoyed a resurgence in real estate values and in corporate restructuring after 15 years of economic stagnation, also provided a boost to returns, as did Canadian energy stocks, which benefited from healthy production growth. Canadian energy company EnCana was the top contributor versus the index, joined by the strong performance of Brazilian bank Unibanco and State Bank of India. Favorable currency movements in emerging markets such as India and Brazil enhanced our returns in the latter two stocks. By contrast, Brazilian paper company Votorantim Celulose lagged due to a lack of pricing power amid rising energy costs, while weak demand hurt Japanese consumer electronics companies Ricoh and Victor Company. An underweighting in the materials sector also hurt relative performance, as several of the period’s top gainers from this group were absent from the portfolio.
The views expressed in this statement reflect those of the portfolio manager only through the end of the period of the report as stated on the cover and do not necessarily represent the views of Fidelity or any other person in the Fidelity organization. Any such views are subject to change at any time based upon market or other conditions and Fidelity disclaims any responsibility to update such views. These views may not be relied on as investment advice and, because investment decisions for a Fidelity fund are based on numerous factors, may not be relied on as an indication of trading intent on behalf of any Fidelity fund.
Shareholder Expense Example
As a shareholder of the Fund, you incur two types of costs: (1) transaction costs, including sales charges (loads) on purchase payments or redemption proceeds, redemption fees, and (2) ongoing costs, including management fees, distribution and/or service (12b-1) fees and other Fund expenses. This Example is intended to help you understand your ongoing costs (in dollars) of investing in the Fund and to compare these costs with the ongoing costs of investing in other mutual funds.
The Example is based on an investment of $1,000 invested at the beginning of the period and held for the entire period (May 1, 2005 to October 31, 2005).
The first line of the table below for each class of the Fund provides information about actual account values and actual expenses. You may use the information in this line, together with the amount you invested, to estimate the expenses that you paid over the period. Simply divide your account value by $1,000.00 (for example, an $8,600 account value divided by $1,000.00 = 8.6), then multiply the result by the number in the first line for a class of the Fund under the heading entitled “Expenses Paid During Period” to estimate the expenses you paid on your account during this period.
Hypothetical Example for Comparison Purposes
The second line of the table below for each class of the Fund provides information about hypothetical account values and hypothetical expenses based on a Class’ actual expense ratio and an assumed rate of return of 5% per year before expenses, which is not the Class’ actual return. The hypothetical account values and expenses may not be used to estimate the actual ending account balance or expenses you paid for the period. You may use this information to compare the ongoing costs of investing in the Fund and other funds. To do so, compare this 5% hypothetical example with the 5% hypothetical examples that appear in the shareholder reports of the other funds.
Please note that the expenses shown in the table are meant to highlight your ongoing costs only and do not reflect any transaction costs. Therefore, the second line of the table is useful in comparing ongoing costs only, and will not help you determine the relative total costs of owning different funds. In addition, if these transactional costs were included, your costs would have been higher.
| | | | | | | | | | | | | Expenses Paid |
| | | | | Beginning | | | | Ending | | | | During Period* |
| | | | | Account Value | | | | Account Value | | | | May 1, 2005 |
| | | | | May 1, 2005 | | | | October 31, 2005 | | | | to October 31, 2005 |
| Class A | | | | | | | | | | | | |
| Actual | | $ | | 1,000.00 | | $ | | 1,114.20 | | $ | | 6.77 |
| HypotheticalA | | $ | | 1,000.00 | | $ | | 1,018.80 | | $ | | 6.46 |
| Class T | | | | | | | | | | | | |
| Actual | | $ | | 1,000.00 | | $ | | 1,112.20 | | $ | | 7.99 |
| HypotheticalA | | $ | | 1,000.00 | | $ | | 1,017.64 | | $ | | 7.63 |
| Class B | | | | | | | | | | | | |
| Actual | | $ | | 1,000.00 | | $ | | 1,108.60 | | $ | | 11.43 |
| HypotheticalA | | $ | | 1,000.00 | | $ | | 1,014.37 | | $ | | 10.92 |
9 Annual Report
| Shareholder Expense Example - continued | | | | |
| |
| |
| | | | | | | | | | | | | Expenses Paid |
| | | | | Beginning | | | | Ending | | | | During Period* |
| | | | | Account Value | | | | Account Value | | | | May 1, 2005 |
| | | | | May 1, 2005 | | | | October 31, 2005 | | | | to October 31, 2005 |
| Class C | | | | | | | | | | | | |
| Actual | | $ | | 1,000.00 | | $ | | 1,109.50 | | $ | | 10.90 |
| HypotheticalA | | $ | | 1,000.00 | | $ | | 1,014.87 | | $ | | 10.41 |
| Institutional Class | | | | | | | | | | | | |
| Actual | | $ | | 1,000.00 | | $ | | 1,115.60 | | $ | | 5.12 |
| HypotheticalA | | $ | | 1,000.00 | | $ | | 1,020.37 | | $ | | 4.89 |
| |
| A 5% return per year before expenses | | | | | | | | |
* Expenses are equal to each Class’ annualized expense ratio (shown in the table below); multiplied by the average account value over the period, multiplied by 184/365 (to reflect the one-half year period).
| | | Annualized |
| | | Expense Ratio |
| Class A | | 1.27% |
| Class T | | 1.50% |
| Class B | | 2.15% |
| Class C | | 2.05% |
| Institutional Class | | 96% |
Investment Changes
| Top Five Stocks as of October 31, 2005 | | | | |
| | | % of fund’s | | % of fund’s net assets |
| | | net assets | | 6 months ago |
| Total SA (France, Oil, Gas & Consumable Fuels) | | 2.5 | | 2.5 |
| BP PLC sponsored ADR (United Kingdom, Oil, | | | | |
| Gas & Consumable Fuels) | | 2.2 | | 2.1 |
| Novartis AG sponsored ADR (Switzerland, | | | | |
| Pharmaceuticals) | | 2.1 | | 1.6 |
| Vodafone Group PLC sponsored ADR (United | | | | |
| Kingdom, Wireless Telecommunication | | | | |
| Services) | | 2.0 | | 2.3 |
| Allianz AG sponsored ADR (Germany, | | | | |
| Insurance) | | 1.8 | | 1.5 |
| | | 10.6 | | |
| Top Five Market Sectors as of October 31, 2005 | | |
| | | % of fund’s | | % of fund’s net assets |
| | | net assets | | 6 months ago |
| Financials | | 28.1 | | 22.9 |
| Industrials | | 12.9 | | 11.7 |
| Consumer Discretionary | | 12.5 | | 12.8 |
| Energy | | 10.2 | | 8.4 |
| Information Technology | | 9.0 | | 10.6 |
| Top Five Countries as of October 31, 2005 | | |
| (excluding cash equivalents) | | % of fund’s | | % of fund’s net assets |
| | | net assets | | 6 months ago |
| Japan | | 21.0 | | 16.4 |
| France | | 11.6 | | 12.2 |
| Germany | | 11.0 | | 9.4 |
| United Kingdom | | 11.0 | | 11.7 |
| Switzerland | | 8.4 | | 9.4 |
Percentages are adjusted for the effect of open futures contracts, if applicable.
11 Annual Report
| Investments October 31, 2005 | | | | |
| Showing Percentage of Net Assets | | | | | | |
| |
| Common Stocks — 96.6% | | | | | | |
| | | Shares | | Value (Note 1) |
| | | | | | | (000s) |
| |
| Australia – 0.7% | | | | | | |
| CSL Ltd. | | 1,142,744 | | $ | | 32,043 |
| Macquarie Bank Ltd. | | 658,352 | | | | 31,836 |
| TOTAL AUSTRALIA | | | | | | 63,879 |
| |
| Belgium – 0.2% | | | | | | |
| KBC Groupe SA | | 182,138 | | | | 14,847 |
| Bermuda – 0.0% | | | | | | |
| Clear Media Ltd. (a) | | 907,100 | | | | 761 |
| Brazil – 1.8% | | | | | | |
| Banco Bradesco SA (PN) sponsored ADR (non-vtg.) (d) | | 457,500 | | | | 23,740 |
| Banco Nossa Caixa SA | | 222,200 | | | | 3,681 |
| Uniao de Bancos Brasileiros SA (Unibanco) GDR | | 1,443,832 | | | | 75,512 |
| Usinas Siderurgicas de Minas Gerais SA (Usiminas) (PN-A) | | 1,162,900 | | | | 23,446 |
| Votorantim Celulose e Papel SA sponsored ADR (non-vtg.) | | 2,216,200 | | | | 26,528 |
| TOTAL BRAZIL | | | | | | 152,907 |
| |
| Canada – 2.8% | | | | | | |
| ACE Aviation Holdings, Inc. Class A (a) | | 586,200 | | | | 15,387 |
| Canadian Natural Resources Ltd. | | 699,100 | | | | 28,586 |
| Canadian Western Bank, Edmonton | | 685,300 | | | | 20,426 |
| EnCana Corp. | | 1,465,248 | | | | 66,997 |
| ITF Optical Technologies, Inc. Series A (f) | | 1,792 | | | | 0 |
| Jean Coutu Group, Inc.: | | | | | | |
| Class A (e) | | 100 | | | | 1 |
| Class A (sub. vtg.) | | 1,050,940 | | | | 12,805 |
| NOVA Chemicals Corp. | | 489,000 | | | | 17,419 |
| OZ Optics Ltd. unit (a)(f) | | 5,400 | | | | 80 |
| Precision Drilling Corp. (a) | | 841,200 | | | | 38,677 |
| Talisman Energy, Inc. | | 910,600 | | | | 40,333 |
| TOTAL CANADA | | | | | | 240,711 |
| |
| Cayman Islands – 0.5% | | | | | | |
| Apex Silver Mines Ltd. (a)(d) | | 434,100 | | | | 6,650 |
| Foxconn International Holdings Ltd. | | 28,542,000 | | | | 30,559 |
| The9 Computer Technology Consulting Co. Ltd. sponsored | | | | | | |
| ADR (d) | | 245,900 | | | | 4,633 |
| TOTAL CAYMAN ISLANDS | | | | | | 41,842 |
See accompanying notes which are an integral part of the financial statements.
| Common Stocks – continued | | | | | | |
| | | Shares | | Value (Note 1) |
| | | | | | | (000s) |
| |
| China – 0.2% | | | | | | |
| China Construction Bank Corp. (H Shares) | | 54,234,000 | | $ | | 16,441 |
| Global Bio-Chem Technology Group Co. Ltd. | | 11,470,000 | | | | 4,550 |
| TOTAL CHINA | | | | | | 20,991 |
| |
| Denmark – 1.1% | | | | | | |
| Danske Bank AS | | 1,207,875 | | | | 37,881 |
| GN Store Nordic AS | | 1,023,800 | | | | 12,333 |
| Novo Nordisk AS Series B | | 366,993 | | | | 18,804 |
| Vestas Wind Systems AS (a) | | 1,196,000 | | | | 25,886 |
| TOTAL DENMARK | | | | | | 94,904 |
| |
| Finland – 2.1% | | | | | | |
| Fortum Oyj | | 1,857,400 | | | | 32,886 |
| Metso Corp. | | 1,241,700 | | | | 32,300 |
| Neste Oil Oyj | | 874,600 | | | | 27,102 |
| Nokia Corp. sponsored ADR | | 5,135,700 | | | | 86,382 |
| TOTAL FINLAND | | | | | | 178,670 |
| |
| France – 11.6% | | | | | | |
| Accor SA | | 778,600 | | | | 38,883 |
| AXA SA | | 177,200 | | | | 5,132 |
| AXA SA sponsored ADR | | 3,083,300 | | | | 89,292 |
| Bacou Dalloz | | 76,915 | | | | 6,915 |
| BNP Paribas SA | | 1,001,746 | | | | 75,953 |
| CNP Assurances | | 439,993 | | | | 30,618 |
| Eiffage SA | | 268,005 | | | | 23,132 |
| Financiere Marc de Lacharriere SA (Fimalac) | | 431,479 | | | | 23,431 |
| France Telecom SA sponsored ADR | | 2,075,200 | | | | 53,934 |
| L’Air Liquide SA | | 206,700 | | | | 37,588 |
| Lagardere S.C.A. (Reg.) | | 805,682 | | | | 55,389 |
| Neopost SA | | 274,629 | | | | 26,502 |
| Nexity | | 695,066 | | | | 31,737 |
| NRJ Group | | 1,202,020 | | | | 26,772 |
| Orpea (a) | | 187,100 | | | | 10,093 |
| Pernod Ricard SA | | 105,003 | | | | 18,365 |
| Pinault Printemps-Redoute SA | | 46,262 | | | | 4,861 |
| Sanofi-Aventis sponsored ADR | | 1,504,900 | | | | 60,377 |
| Societe des Autoroutes du Nord et de l’Est de la France | | 464,600 | | | | 27,708 |
| Total SA: | | | | | | |
| Series B | | 109,670 | | | | 27,641 |
| sponsored ADR | | 1,440,600 | | | | 181,544 |
See accompanying notes which are an integral part of the financial statements.
13 Annual Report
| Investments - continued | | | | | | |
| |
| |
| Common Stocks – continued | | | | | | |
| | | Shares | | Value (Note 1) |
| | | | | | | (000s) |
| |
| France – continued | | | | | | |
| Vinci SA | | 431,106 | | $ | | 33,695 |
| Vivendi Universal SA sponsored ADR | | 3,266,600 | | | | 102,637 |
| TOTAL FRANCE | | | | | | 992,199 |
| |
| Germany – 11.0% | | | | | | |
| Aareal Bank AG (a) | | 319,896 | | | | 9,771 |
| Allianz AG sponsored ADR | | 10,848,370 | | | | 153,396 |
| Axel Springer Verlag | | 12,220 | | | | 1,562 |
| Bayer AG | | 970,100 | | | | 33,759 |
| Bayer AG sponsored ADR | | 1,060,600 | | | | 36,909 |
| Bilfinger & Berger Bau AG | | 623,800 | | | | 26,995 |
| DaimlerChrysler AG | | 1,102,200 | | | | 55,165 |
| Deutsche Post AG | | 771,500 | | | | 17,202 |
| Deutsche Telekom AG sponsored ADR | | 5,531,200 | | | | 97,902 |
| E.ON AG sponsored ADR | | 2,222,800 | | | | 67,151 |
| Epcos AG (a) | | 679,800 | | | | 8,206 |
| GFK AG | | 378,067 | | | | 12,531 |
| Heidelberger Druckmaschinen AG | | 1,253,500 | | | | 39,820 |
| Hochtief AG | | 1,283,200 | | | | 51,854 |
| Hypo Real Estate Holding AG | | 1,175,040 | | | | 56,822 |
| Interhyp AG | | 47,943 | | | | 2,874 |
| IWKA AG | | 967,900 | | | | 21,465 |
| K&S AG | | 300,432 | | | | 19,711 |
| MAN AG | | 474,143 | | | | 22,013 |
| Merck KGaA | | 105,500 | | | | 8,726 |
| Metro AG | | 676,300 | | | | 30,759 |
| Muenchener Rueckversicherungs-Gesellschaft AG (Reg.) | | 436,000 | | | | 51,220 |
| Q-Cells AG | | 11,950 | | | | 656 |
| RWE AG | | 409,661 | | | | 26,165 |
| SAP AG sponsored ADR | | 852,000 | | | | 36,585 |
| SGL Carbon AG (a) | | 421,900 | | | | 6,175 |
| SolarWorld AG | | 289,406 | | | | 39,105 |
| TOTAL GERMANY | | | | | | 934,499 |
| |
| Greece – 0.3% | | | | | | |
| Greek Organization of Football Prognostics SA | | 946,360 | | | | 27,318 |
| Hong Kong – 0.9% | | | | | | |
| ASM Pacific Technology Ltd. | | 618,500 | | | | 2,860 |
| Cheung Kong Holdings Ltd. | | 1,471,000 | | | | 15,304 |
See accompanying notes which are an integral part of the financial statements.
| Common Stocks – continued | | | | | | |
| | | Shares | | Value (Note 1) |
| | | | | | | (000s) |
| |
| Hong Kong – continued | | | | | | |
| Hutchison Whampoa Ltd. | | 2,255,000 | | $ | | 21,351 |
| Wharf Holdings Ltd. | | 10,710,000 | | | | 36,542 |
| TOTAL HONG KONG | | | | | | 76,057 |
| |
| India – 0.3% | | | | | | |
| Housing Development Finance Corp. Ltd. | | 382,125 | | | | 8,206 |
| Infrastructure Development Finance Co. Ltd. | | 1,266,464 | | | | 1,825 |
| State Bank of India | | 329,089 | | | | 6,824 |
| Suzlon Energy Ltd. (a) | | 630,349 | | | | 9,994 |
| TOTAL INDIA | | | | | | 26,849 |
| |
| Ireland – 0.6% | | | | | | |
| Allied Irish Banks PLC | | 1,559,698 | | | | 32,800 |
| C&C Group PLC | | 2,382,700 | | | | 14,710 |
| TOTAL IRELAND | | | | | | 47,510 |
| |
| Israel – 1.0% | | | | | | |
| Bank Hapoalim BM (Reg.) | | 8,613,900 | | | | 32,992 |
| Bank Leumi le-Israel BM | | 8,532,400 | | | | 27,846 |
| Teva Pharmaceutical Industries Ltd. sponsored ADR | | 565,700 | | | | 21,564 |
| TOTAL ISRAEL | | | | | | 82,402 |
| |
| Italy – 3.0% | | | | | | |
| Autostrade Spa | | 290,316 | | | | 6,636 |
| Banca Intesa Spa | | 10,887,854 | | | | 50,811 |
| Banche Popolari Unite S.c.a.r.l. | | 1,435,200 | | | | 30,383 |
| Banco Popolare di Verona e Novara | | 1,355,466 | | | | 25,023 |
| Davide Campari-Milano Spa | | 1,823,000 | | | | 12,360 |
| ENI Spa sponsored ADR | | 342,800 | | | | 45,850 |
| Lottomatica Spa New | | 486,700 | | | | 17,678 |
| Mediobanca Spa | | 1,112,700 | | | | 19,701 |
| Unicredito Italiano Spa | | 8,816,600 | | | | 49,230 |
| TOTAL ITALY | | | | | | 257,672 |
| |
| Japan – 21.0% | | | | | | |
| Advantest Corp. | | 66,800 | | | | 4,836 |
| Aiful Corp. | | 57,000 | | | | 4,280 |
| Aoyama Trading Co. Ltd. | | 1,147,400 | | | | 34,580 |
| Asahi Breweries Ltd. | | 1,787,800 | | | | 22,403 |
| Asics Corp. | | 1,551,000 | | | | 13,378 |
| Astellas Pharma, Inc. | | 871,500 | | | | 31,321 |
| Bank of Nagoya Ltd. | | 2,275,000 | | | | 20,549 |
See accompanying notes which are an integral part of the financial statements.
15 Annual Report
| Investments - continued | | | | | | |
| |
| |
| Common Stocks – continued | | | | | | |
| | | Shares | | Value (Note 1) |
| | | | | | | (000s) |
| |
| Japan – continued | | | | | | |
| Canon, Inc. sponsored ADR | | 813,400 | | $ | | 43,167 |
| Credit Saison Co. Ltd. | | 1,388,500 | | | | 63,129 |
| Daihatsu Motor Co. Ltd. | | 2,322,000 | | | | 22,160 |
| Daiwa Securities Group, Inc. | | 7,352,000 | | | | 60,422 |
| E*TRADE Securities Co. Ltd. (d) | | 8,321 | | | | 43,741 |
| East Japan Railway Co | | 6,136 | | | | 36,666 |
| Hokuhoku Financial Group, Inc. | | 5,808,000 | | | | 24,093 |
| Honda Motor Co. Ltd. | | 263,400 | | | | 14,650 |
| JAFCO Co. Ltd. | | 281,600 | | | | 16,973 |
| JSR Corp. | | 1,591,600 | | | | 37,698 |
| Juroku Bank Ltd. | | 2,428,000 | | | | 20,270 |
| Kayaba Industry Co. Ltd. | | 2,575,000 | | | | 10,191 |
| Matsushita Electric Industrial Co. Ltd. | | 2,300,000 | | | | 42,320 |
| Millea Holdings, Inc. | | 1,050 | | | | 19,104 |
| Mitsubishi Estate Co. Ltd. | | 1,127,000 | | | | 16,719 |
| Mitsubishi UFJ Financial Group, Inc. | | 1,644 | | | | 20,862 |
| Mitsubishi UFJ Securities Co. Ltd. | | 1,632,000 | | | | 18,670 |
| Mitsui Fudosan Co. Ltd. | | 2,176,000 | | | | 35,710 |
| Mitsui Trust Holdings, Inc. | | 3,905,000 | | | | 47,142 |
| Mizuho Financial Group, Inc. | | 5,509 | | | | 36,831 |
| Murata Manufacturing Co. Ltd. | | 530,200 | | | | 26,494 |
| Nikko Cordial Corp. | | 7,370,000 | | | | 89,356 |
| Nikon Corp. (d) | | 1,893,000 | | | | 24,328 |
| Nippon Chemi-con Corp. | | 5,443,900 | | | | 33,143 |
| Nippon Electric Glass Co. Ltd. | | 2,006,800 | | | | 38,495 |
| Nippon Oil Corp. | | 1,643,000 | | | | 13,987 |
| Nishi-Nippon City Bank Ltd. (a) | | 5,706,000 | | | | 33,306 |
| Nitori Co. Ltd. | | 194,800 | | | | 14,846 |
| Nitto Denko Corp. | | 724,500 | | | | 43,983 |
| Nomura Holdings, Inc. | | 1,559,000 | | | | 24,149 |
| NTT Urban Development Co. | | 3,474 | | | | 20,398 |
| Obayashi Corp. | | 3,146,000 | | | | 23,131 |
| Okamura Corp. | | 1,684,000 | | | | 12,440 |
| OMC Card, Inc. | | 581,000 | | | | 9,776 |
| ORIX Corp. | | 279,100 | | | | 52,378 |
| Ricoh Co. Ltd. | | 1,955,000 | | | | 31,135 |
| Seven & I Holdings Co. Ltd. (a) | | 367,540 | | | | 12,095 |
| SFCG Co. Ltd. | | 130,010 | | | | 31,402 |
| SHIMIZU Corp. | | 6,208,000 | | | | 42,096 |
| Sompo Japan Insurance, Inc | | 1,979,000 | | | | 29,821 |
| Sumitomo Electric Industries Ltd. | | 3,745,000 | | | | 49,362 |
| Sumitomo Forestry Co. Ltd. | | 2,053,000 | | | | 19,042 |
See accompanying notes which are an integral part of the financial statements.
| Common Stocks – continued | | | | | | |
| | | Shares | | Value (Note 1) |
| | | | | | | (000s) |
| |
| Japan – continued | | | | | | |
| Sumitomo Mitsui Financial Group, Inc. | | 10,771 | | $ | | 99,808 |
| Sumitomo Osaka Cement Co. Ltd. | | 8,325,000 | | | | 23,575 |
| T&D Holdings, Inc. | | 433,650 | | | | 27,377 |
| Taiheiyo Cement Corp. | | 4,508,000 | | | | 16,319 |
| Takara Holdings, Inc. | | 569,000 | | | | 3,375 |
| Takefuji Corp. | | 170,700 | | | | 11,989 |
| Tokuyama Corp. | | 3,207,000 | | | | 31,939 |
| Tokyo Electron Ltd. | | 1,537,000 | | | | 77,335 |
| Tokyo Star Bank Ltd. (a) | | 706 | | | | 2,482 |
| Tokyo Tomin Bank Ltd. | | 631,400 | | | | 23,239 |
| Toyoda Machine Works Ltd. | | 1,433,000 | | | | 17,300 |
| Victor Co. of Japan Ltd. (d) | | 3,241,200 | | | | 17,684 |
| TOTAL JAPAN | | | | | | 1,789,450 |
| |
| Korea (South) – 1.8% | | | | | | |
| Hyundai Heavy Industries Co. Ltd. | | 238,250 | | | | 15,495 |
| Hyundai Mipo Dockyard Co. Ltd. | | 271,720 | | | | 16,787 |
| Kookmin Bank sponsored ADR | | 691,410 | | | | 40,392 |
| LG Electronics, Inc. | | 315,190 | | | | 20,439 |
| LG.Philips LCD Co. Ltd. sponsored ADR (a) | | 485,200 | | | | 9,224 |
| Samsung Electronics Co. Ltd. | | 33,771 | | | | 17,856 |
| Shinhan Financial Group Co. Ltd. | | 1,063,534 | | | | 35,451 |
| TOTAL KOREA (SOUTH) | | | | | | 155,644 |
| |
| Luxembourg – 1.6% | | | | | | |
| SES Global unit | | 3,316,753 | | | | 51,886 |
| Stolt-Nielsen SA | | 173,200 | | | | 6,096 |
| Stolt-Nielsen SA Class B sponsored ADR | | 2,137,400 | | | | 76,669 |
| TOTAL LUXEMBOURG | | | | | | 134,651 |
| |
| Mexico – 0.3% | | | | | | |
| Fomento Economico Mexicano SA de CV sponsored ADR | | 312,600 | | | | 21,254 |
| Industrias Penoles SA de CV | | 767,000 | | | | 3,355 |
| TOTAL MEXICO | | | | | | 24,609 |
| |
| Netherlands – 4.7% | | | | | | |
| ASM International NV (Nasdaq) (a) | | 1,358,600 | | | | 18,042 |
| ASML Holding NV (NY Shares) (a) | | 3,702,400 | | | | 62,867 |
| Axalto Holding NV (a) | | 663,700 | | | | 18,068 |
| Fugro NV (Certificaten Van Aandelen) unit | | 492,800 | | | | 13,315 |
| ING Groep NV sponsored ADR | | 2,281,700 | | | | 65,850 |
| Koninklijke Ahold NV (a) | | 2,957,000 | | | | 20,640 |
See accompanying notes which are an integral part of the financial statements.
17 Annual Report
| Investments - continued | | | | | | |
| |
| |
| Common Stocks – continued | | | | | | |
| | | Shares | | Value (Note 1) |
| | | | | | | (000s) |
| |
| Netherlands – continued | | | | | | |
| Koninklijke Numico NV (a) | | 431,286 | | $ | | 17,464 |
| Koninklijke Philips Electronics NV (NY Shares) | | 2,130,000 | | | | 55,721 |
| Koninklijke Wessanen NV | | 2,426,032 | | | | 35,626 |
| Reed Elsevier NV | | 223,900 | | | | 3,017 |
| Reed Elsevier NV sponsored ADR | | 1,466,400 | | | | 39,607 |
| Unilever NV (NY Shares) | | 218,600 | | | | 15,370 |
| VNU NV | | 1,196,553 | | | | 38,054 |
| TOTAL NETHERLANDS | | | | | | 403,641 |
| |
| Netherlands Antilles – 0.4% | | | | | | |
| Schlumberger Ltd. (NY Shares) | | 408,300 | | | | 37,061 |
| New Zealand – 0.0% | | | | | | |
| The Warehouse Group Ltd. | | 730,295 | | | | 1,993 |
| Norway – 0.8% | | | | | | |
| DnB NOR ASA | | 2,104,880 | | | | 21,515 |
| Fred Olsen Energy ASA (a) | | 874,500 | | | | 24,127 |
| Odfjell ASA: | | | | | | |
| (A Shares) | | 40,500 | | | | 777 |
| (B Shares) | | 1,065,750 | | | | 18,511 |
| TOTAL NORWAY | | | | | | 64,930 |
| |
| Portugal – 0.5% | | | | | | |
| Brisa Auto-Estradas de Portugal SA | | 3,785,680 | | | | 29,951 |
| Impresa SGPS (a) | | 2,186,400 | | | | 12,187 |
| TOTAL PORTUGAL | | | | | | 42,138 |
| |
| Russia – 0.5% | | | | | | |
| Novatek JSC: | | | | | | |
| GDR (a) | | 307,700 | | | | 6,917 |
| GDR (a)(e) | | 468,166 | | | | 10,524 |
| Sistema JSFC sponsored GDR (e) | | 976,800 | | | | 21,880 |
| TOTAL RUSSIA | | | | | | 39,321 |
| |
| Singapore – 0.3% | | | | | | |
| STATS ChipPAC Ltd. sponsored ADR (a)(d) | | 4,459,100 | | | | 25,016 |
| South Africa – 1.4% | | | | | | |
| Edgars Consolidated Stores Ltd. | | 4,306,000 | | | | 19,124 |
| FirstRand Ltd. | | 6,481,800 | | | | 15,253 |
| Massmart Holdings Ltd. | | 1,333,776 | | | | 10,297 |
| Standard Bank Group Ltd. | | 2,529,600 | | | | 26,088 |
See accompanying notes which are an integral part of the financial statements.
| Common Stocks – continued | | | | | | |
| | | Shares | | Value (Note 1) |
| | | | | | | (000s) |
| |
| South Africa – continued | | | | | | |
| Steinhoff International Holdings Ltd. | | 13,403,402 | | $ | | 35,077 |
| Sun International Ltd. | | 1,500,000 | | | | 16,990 |
| TOTAL SOUTH AFRICA | | | | | | 122,829 |
| |
| Spain – 1.3% | | | | | | |
| Antena 3 Television SA | | 1,498,088 | | | | 29,128 |
| Banco Bilbao Vizcaya Argentaria SA sponsored ADR | | 408,000 | | | | 7,193 |
| Compania de Distribucion Integral Logista SA | | 105,220 | | | | 5,576 |
| Gestevision Telecinco SA | | 1,123,940 | | | | 24,939 |
| Telefonica SA sponsored ADR | | 970,880 | | | | 46,554 |
| TOTAL SPAIN | | | | | | 113,390 |
| |
| Sweden – 1.5% | | | | | | |
| Eniro AB (d) | | 3,214,100 | | | | 35,122 |
| Gambro AB (A Shares) | | 2,033,072 | | | | 28,728 |
| Securitas AB (B Shares) | | 1,150,600 | | | | 17,487 |
| Telefonaktiebolaget LM Ericsson (B Shares) sponsored ADR (d) | | 1,511,400 | | | | 49,589 |
| TOTAL SWEDEN | | | | | | 130,926 |
| |
| Switzerland – 8.4% | | | | | | |
| ABB Ltd. (Reg.) (a) | | 8,141,450 | | | | 62,269 |
| Actelion Ltd. (Reg.) (a) | | 338,125 | | | | 38,031 |
| Alcon, Inc. | | 200,800 | | | | 26,686 |
| Clariant AG (Reg.) | | 438,315 | | | | 5,848 |
| Compagnie Financiere Richemont unit | | 1,137,738 | | | | 43,289 |
| Credit Suisse Group sponsored ADR | | 642,200 | | | | 28,456 |
| Nestle SA (Reg.) | | 339,614 | | | | 101,161 |
| Novartis AG sponsored ADR | | 3,360,132 | | | | 180,842 |
| Phonak Holding AG | | 265,982 | | | | 11,090 |
| Roche Holding AG (participation certificate) | | 977,215 | | | | 145,997 |
| Societe Generale de Surveillance Holding SA (SGS) (Reg.) | | 20,496 | | | | 15,104 |
| Syngenta AG sponsored ADR | | 1,187,700 | | | | 25,524 |
| UBS AG (NY Shares) | | 369,147 | | | | 31,625 |
| TOTAL SWITZERLAND | | | | | | 715,922 |
| |
| Taiwan – 1.3% | | | | | | |
| Advanced Semiconductor Engineering, Inc. | | 51,971,692 | | | | 31,677 |
| Chi Mei Optoelectronics Corp. | | 24,332,623 | | | | 24,440 |
| Compal Electronics, Inc. | | 14,491,000 | | | | 12,784 |
See accompanying notes which are an integral part of the financial statements.
19 Annual Report
| Investments - continued | | | | | | |
| |
| |
| Common Stocks – continued | | | | | | |
| | | Shares | | Value (Note 1) |
| | | | | | | (000s) |
| |
| Taiwan – continued | | | | | | |
| United Microelectronics Corp. | | 42,384,347 | | $ | | 22,486 |
| United Microelectronics Corp. sponsored ADR (d) | | 6,283,700 | | | | 18,348 |
| TOTAL TAIWAN | | | | | | 109,735 |
| |
| Thailand – 0.1% | | | | | | |
| Thai Oil PCL (For. Reg.) | | 3,184,000 | | | | 5,504 |
| United Kingdom – 11.0% | | | | | | |
| 3i Group PLC | | 1,679,905 | | | | 22,544 |
| Babcock International Group PLC | | 3,347,600 | | | | 11,127 |
| BAE Systems PLC | | 9,191,280 | | | | 53,781 |
| BP PLC sponsored ADR | | 2,781,400 | | | | 184,689 |
| Capita Group PLC | | 5,784,313 | | | | 39,939 |
| EMI Group PLC | | 4,486,500 | | | | 16,998 |
| Group 4 Securicor PLC: | | | | | | |
| (Denmark) | | 2,975,530 | | | | 7,934 |
| (United Kingdom) | | 5,355,100 | | | | 14,269 |
| HSBC Holdings PLC sponsored ADR | | 826,800 | | | | 65,119 |
| Informa PLC | | 1,128,700 | | | | 7,479 |
| Legal & General Group PLC | | 6,762,900 | | | | 12,841 |
| National Grid PLC | | 2,962,375 | | | | 27,089 |
| Prudential PLC | | 3,283,700 | | | | 27,557 |
| Rank Group PLC | | 4,140,427 | | | | 21,698 |
| Reckitt Benckiser PLC | | 155,538 | | | | 4,701 |
| Royal Dutch Shell PLC Class A sponsored ADR | | 1,047,200 | | | | 64,968 |
| Serco Group PLC | | 5,026,248 | | | | 23,604 |
| Smiths Group PLC | | 2,000,700 | | | | 32,322 |
| Tesco PLC | | 9,852,242 | | | | 52,460 |
| Unilever PLC sponsored ADR | | 1,392,200 | | | | 56,523 |
| Vodafone Group PLC sponsored ADR | | 6,479,800 | | | | 170,160 |
| Yell Group PLC | | 2,119,870 | | | | 16,608 |
| TOTAL UNITED KINGDOM | | | | | | 934,410 |
| |
| United States of America – 1.6% | | | | | | |
| Advanced Energy Industries, Inc. (a) | | 320,900 | | | | 3,450 |
| Halliburton Co. | | 464,500 | | | | 27,452 |
| News Corp. Class A | | 1,811,500 | | | | 25,814 |
See accompanying notes which are an integral part of the financial statements.
| Common Stocks – continued | | | | | | |
| | | Shares | | Value (Note 1) |
| | | | | | | (000s) |
| |
| United States of America – continued | | | | | | |
| Synthes, Inc. | | 548,046 | | $ | | 58,029 |
| Transocean, Inc. (a) | | 323,800 | | | | 18,615 |
| TOTAL UNITED STATES OF AMERICA | | | | | | 133,360 |
| |
| TOTAL COMMON STOCKS | | | | | | |
| (Cost $7,081,650) | | | | | | 8,238,548 |
| |
| Preferred Stocks — 1.2% | | | | | | |
| |
| Convertible Preferred Stocks – 0.0% | | | | | | |
| |
| Canada – 0.0% | | | | | | |
| MetroPhotonics, Inc. Series 2 (f) | | 8,500 | | | | 0 |
| Nonconvertible Preferred Stocks – 1.2% | | | | | | |
| |
| Italy – 1.2% | | | | | | |
| Banca Intesa Spa (Risp) | | 6,478,900 | | | | 28,061 |
| Buzzi Unicem Spa (Risp) | | 641,893 | | | | 6,400 |
| Telecom Italia Spa (Risp) | | 26,037,100 | | | | 62,955 |
| Unicredito Italiano Spa (Risp) | | 1,329,088 | | | | 7,939 |
| TOTAL ITALY | | | | | | 105,355 |
| |
| TOTAL PREFERRED STOCKS | | | | | | |
| (Cost $111,653) | | | | | | 105,355 |
| |
| Money Market Funds — 2.8% | | | | | | |
| |
| Fidelity Cash Central Fund, 3.92% (b) | | 165,258,587 | | | | 165,259 |
| Fidelity Securities Lending Cash Central Fund, | | | | | | |
| 3.94% (b)(c) | | 76,889,140 | | | | 76,889 |
| TOTAL MONEY MARKET FUNDS | | | | | | |
| (Cost $242,148) | | | | | | 242,148 |
| |
| TOTAL INVESTMENT PORTFOLIO – 100.6% | | | | | | |
| (Cost $7,435,451) | | | | 8,586,051 |
| |
| NET OTHER ASSETS – (0.6)% | | | | | | (52,292) |
| NET ASSETS – 100% | | $ | | 8,533,759 |
See accompanying notes which are an integral part of the financial statements.
21 Annual Report
Investments - continued
Legend
|
(a) Non-income producing
(b) Affiliated fund that is available only to investment companies and other accounts managed by Fidelity Investments. The rate quoted is the annualized seven-day yield of the fund at period end. A complete unaudited listing of the fund’s holdings as of its most recent quarter end is available upon request.
(c) Investment made with cash collateral received from securities on loan.
(d) Security or a portion of the security is on loan at period end.
(e) Security exempt from registration under Rule 144A of the Securities Act of 1933. These securities may be resold in transactions exempt from registration, normally to qualified institutional buyers. At the period end, the value of these securities amounted to $32,404,000 or 0.4% of net assets.
(f) Restricted securities – Investment in securities not registered under the Securities Act of 1933 (excluding 144A issues). At the end of the period, the value of restricted securities (excluding 144A issues) amounted to $80,000 or 0.0% of net assets.
| Additional information on each holding is as follows: | | | | |
| Security | | Acquisition Date | | | | Acquisition Cost (000s) |
| ITF Optical Technologies, Inc. Series A | | 10/11/00 | | $ | | 90 |
| MetroPhotonics, Inc. Series 2 | | 9/29/00 | | $ | | 85 |
| OZ Optics Ltd. unit | | 8/18/00 | | $ | | 80 |
See accompanying notes which are an integral part of the financial statements.
| Financial Statements | | | | | | | | |
| |
| |
| Statement of Assets and Liabilities | | | | | | | | |
| Amounts in thousands (except per-share amounts) | | | | | | | | October 31, 2005 |
| |
| Assets | | | | | | | | |
| Investment in securities, at value (including securities | | | | | | | | |
| loaned of $76,752) (cost $7,435,451) — See | | | | | | | | |
| accompanying schedule | | | | | | $ | | 8,586,051 |
| Foreign currency held at value (cost $12,402) | | | | | | | | 12,376 |
| Receivable for investments sold | | | | | | | | 107,221 |
| Receivable for fund shares sold | | | | | | | | 29,024 |
| Dividends receivable | | | | | | | | 8,970 |
| Interest receivable | | | | | | | | 566 |
| Other affiliated receivables | | | | | | | | 2 |
| Other receivables | | | | | | | | 878 |
| Total assets | | | | | | | | 8,745,088 |
| |
| Liabilities | | | | | | | | |
| Payable for investments purchased | | $ | | 113,454 | | | | |
| Payable for fund shares redeemed | | | | 9,739 | | | | |
| Accrued management fee | | | | 5,015 | | | | |
| Distribution fees payable | | | | 2,462 | | | | |
| Other affiliated payables | | | | 1,635 | | | | |
| Other payables and accrued expenses | | | | 2,135 | | | | |
| Collateral on securities loaned, at value | | | | 76,889 | | | | |
| Total liabilities | | | | | | | | 211,329 |
| |
| Net Assets | | | | | | $ | | 8,533,759 |
| Net Assets consist of: | | | | | | | | |
| Paid in capital | | | | | | $ | | 6,909,645 |
| Undistributed net investment income | | | | | | | | 60,354 |
| Accumulated undistributed net realized gain (loss) on | | | | | | | | |
| investments and foreign currency transactions | | | | | | | | 414,935 |
| Net unrealized appreciation (depreciation) on | | | | | | | | |
| investments and assets and liabilities in foreign | | | | | | | | |
| currencies | | | | | | | | 1,148,825 |
| Net Assets | | | | | | $ | | 8,533,759 |
See accompanying notes which are an integral part of the financial statements.
23 Annual Report
| Financial Statements - continued | | | | |
| |
| |
| Statement of Assets and Liabilities — continued | | | | |
| Amounts in thousands (except per-share amounts) | | | | October 31, 2005 |
| |
| Calculation of Maximum Offering Price | | | | |
| Class A: | | | | |
| Net Asset Value and redemption price per share | | | | |
| ($2,791,730 ÷ 137,546 shares) | | $ | | 20.30 |
| Maximum offering price per share (100/94.25 of | | | | |
| $20.30) | | $ | | 21.54 |
| Class T: | | | | |
| Net Asset Value and redemption price per share | | | | |
| ($2,419,981 ÷ 120,268 shares) | | $ | | 20.12 |
| Maximum offering price per share (100/96.50 of | | | | |
| $20.12) | | $ | | 20.85 |
| Class B: | | | | |
| Net Asset Value and offering price per share | | | | |
| ($350,685 ÷ 17,888 shares)A | | $ | | 19.60 |
| Class C: | | | | |
| Net Asset Value and offering price per share | | | | |
| ($758,303 ÷ 38,595 shares)A | | $ | | 19.65 |
| Institutional Class: | | | | |
| Net Asset Value, offering price and redemption | | | | |
| price per share ($2,213,060 ÷ 107,617 | | | | |
| shares) | | $ | | 20.56 |
| |
| A Redemption price per share is equal to net asset value less any applicable contingent deferred sales charge. | | | | |
See accompanying notes which are an integral part of the financial statements.
Annual Report 24
| Statement of Operations | | | | | | |
| Amounts in thousands | | | | Year ended October 31, 2005 |
| |
| Investment Income | | | | | | |
| Dividends | | | | $ | | 153,468 |
| Interest | | | | | | 5,494 |
| Security lending | | | | | | 5,615 |
| | | | | | | 164,577 |
| Less foreign taxes withheld | | | | | | (16,915) |
| Total income | | | | | | 147,662 |
| |
| Expenses | | | | | | |
| Management fee | | $ | | 47,855 | | |
| Transfer agent fees | | | | 14,379 | | |
| Distribution fees | | | | 23,448 | | |
| Accounting and security lending fees | | | | 1,818 | | |
| Independent trustees’ compensation | | | | 29 | | |
| Custodian fees and expenses | | | | 2,230 | | |
| Registration fees | | | | 679 | | |
| Audit | | | | 138 | | |
| Legal | | | | 21 | | |
| Miscellaneous | | | | 42 | | |
| Total expenses before reductions | | | | 90,639 | | |
| Expense reductions | | | | (4,086) | | 86,553 |
| |
| Net investment income (loss) | | | | | | 61,109 |
| Realized and Unrealized Gain (Loss) | | | | | | |
| Net realized gain (loss) on: | | | | | | |
| Investment securities (net of foreign taxes of $2,850) . | | 439,484 | | |
| Foreign currency transactions | | | | (3,631) | | |
| Total net realized gain (loss) | | | | | | 435,853 |
| Change in net unrealized appreciation (depreciation) on: | | | | |
| Investment securities (net of increase in deferred for- | | | | |
| eign taxes of $607) | | | | 646,472 | | |
| Assets and liabilities in foreign currencies | | | | (592) | | |
| Total change in net unrealized appreciation | | | | | | |
| (depreciation) | | | | | | 645,880 |
| Net gain (loss) | | | | | | 1,081,733 |
| Net increase (decrease) in net assets resulting from | | | | | | |
| operations | | | | $ | | 1,142,842 |
See accompanying notes which are an integral part of the financial statements.
25 Annual Report
| Financial Statements - continued | | | | | | | | |
| |
| |
| Statement of Changes in Net Assets | | | | | | | | |
| | | | | Year ended | | | | Year ended |
| | | | | October 31, | | | | October 31, |
| Amounts in thousands | | | | 2005 | | | | 2004 |
| Increase (Decrease) in Net Assets | | | | | | | | |
| Operations | | | | | | | | |
| Net investment income (loss) | | $ | | 61,109 | | $ | | 11,332 |
| Net realized gain (loss) | | | | 435,853 | | | | 69,269 |
| Change in net unrealized appreciation (depreciation) . | | | | 645,880 | | | | 311,354 |
| Net increase (decrease) in net assets resulting | | | | | | | | |
| from operations | | | | 1,142,842 | | | | 391,955 |
| Distributions to shareholders from net investment income . | | | | (10,883) | | | | (10,785) |
| Distributions to shareholders from net realized gain | | | | (21,643) | | | | — |
| Total distributions | | | | (32,526) | | | | (10,785) |
| Share transactions — net increase (decrease) | | | | 2,857,486 | | | | 2,786,474 |
| Redemption fees | | | | 289 | | | | 95 |
| Total increase (decrease) in net assets | | | | 3,968,091 | | | | 3,167,739 |
| |
| Net Assets | | | | | | | | |
| Beginning of period | | | | 4,565,668 | | | | 1,397,929 |
| End of period (including undistributed net investment | | | | | | | | |
| income of $60,354 and undistributed net investment | | | | | | | | |
| income of $8,576, respectively) | | $ | | 8,533,759 | | $ | | 4,565,668 |
See accompanying notes which are an integral part of the financial statements.
| Financial Highlights — Class A | | | | | | | | | | | | | | | | |
| |
| Years ended October 31, | | | | 2005 | | | | 2004 | | | | 2003 | | | | 2002 | | | | 2001 |
| Selected Per-Share Data | | | | | | | | | | | | | | | | | | | | |
| Net asset value, beginning of | | | | | | | | | | | | | | | | | | | | |
| period | | $ | | 16.97 | | $ | | 14.60 | | $ | | 11.12 | | $ | | 11.87 | | $ | | 14.54 |
| Income from Investment | | | | | | | | | | | | | | | | | | | | |
| Operations | | | | | | | | | | | | | | | | | | | | |
| Net investment income (loss)C | | | | 19 | | | | .08 | | | | .09 | | | | .07 | | | | .10 |
| Net realized and unrealized | | | | | | | | | | | | | | | | | | | | |
| gain (loss) | | | | 3.27 | | | | 2.41 | | | | 3.45 | | | | (.82) | | | | (2.48) |
| Total from investment operations | | | | 3.46 | | | | 2.49 | | | | 3.54 | | | | (.75) | | | | (2.38) |
| Distributions from net investment | | | | | | | | | | | | | | | | | | | | |
| income | | | | (.05) | | | | (.12) | | | | (.06) | | | | — | | | | (.29) |
| Distributions from net realized | | | | | | | | | | | | | | | | | | | | |
| gain | | | | (.08) | | | | — | | | | — | | | | — | | | | — |
| Total distributions | | | | (.13) | | | | (.12) | | | | (.06) | | | | — | | | | (.29) |
| Redemption fees added to paid in | | | | | | | | | | | | | | | | | | | | |
| capitalC | | | | —E | | | | —E | | | | — | | | | — | | | | — |
| Net asset value, end of period | | $ | | 20.30 | | $ | | 16.97 | | $ | | 14.60 | | $ | | 11.12 | | $ | | 11.87 |
| Total ReturnA,B | | | | 20.50% | | | | 17.15% | | | | 31.99% | | | | (6.32)% | | | | (16.69)% |
| Ratios to Average Net AssetsD | | | | | | | | | | | | | | | | | | | | |
| Expenses before expense | | | | | | | | | | | | | | | | | | | | |
| reductions | | | | 1.27% | | | | 1.31% | | | | 1.42% | | | | 1.46% | | | | 1.50% |
| Expenses net of voluntary | | | | | | | | | | | | | | | | | | | | |
| waivers, if any | | | | 1.27% | | | | 1.31% | | | | 1.42% | | | | 1.46% | | | | 1.50% |
| Expenses net of all reductions | | | | 1.20% | | | | 1.27% | | | | 1.39% | | | | 1.43% | | | | 1.46% |
| Net investment income (loss) | | | | 1.02% | | | | .51% | | | | .71% | | | | .54% | | | | .77% |
| Supplemental Data | | | | | | | | | | | | | | | | | | | | |
| Net assets, end of period | | | | | | | | | | | | | | | | | | | | |
| (in millions) | | $ | | 2,792 | | $ | | 1,294 | | $ | | 241 | | $ | | 52 | | $ | | 38 |
| Portfolio turnover rate | | | | 59% | | | | 72% | | | | 49% | | | | 53% | | | | 84% |
A Total returns would have been lower had certain expenses not been reduced during the periods shown.
B Total returns do not include the effect of the sales charges.
C Calculated based on average shares outstanding during the period.
D Expense ratios reflect operating expenses of the class. Expenses before reductions do not reflect amounts reimbursed by the investment adviser or reductions from brokerage service arrangements or other expense offset arrangements and do not represent the amount paid by the class during periods when reimbursements or reductions occur. Expenses net of any voluntary waivers reflect expenses after reimbursement by the investment adviser but prior to reductions from brokerage service arrangements or other expense offset arrangements. Expenses net of all reductions repre sent the net expenses paid by the class.
E Amount represents less than $.01 per share.
See accompanying notes which are an integral part of the financial statements.
27 Annual Report
| Financial Highlights — Class T | | | | | | | | | | | | | | | | |
| |
| Years ended October 31, | | | | 2005 | | | | 2004 | | | | 2003 | | | | 2002 | | | | 2001 |
| Selected Per-Share Data | | | | | | | | | | | | | | | | | | | | |
| Net asset value, beginning of | | | | | | | | | | | | | | | | | | | | |
| period | | $ | | 16.82 | | $ | | 14.47 | | $ | | 11.01 | | $ | | 11.80 | | $ | | 14.46 |
| Income from Investment | | | | | | | | | | | | | | | | | | | | |
| Operations | | | | | | | | | | | | | | | | | | | | |
| Net investment income (loss)C | | | | 15 | | | | .03 | | | | .05 | | | | .02 | | | | .06 |
| Net realized and unrealized | | | | | | | | | | | | | | | | | | | | |
| gain (loss) | | | | 3.23 | | | | 2.39 | | | | 3.43 | | | | (.81) | | | | (2.46) |
| Total from investment operations | | | | 3.38 | | | | 2.42 | | | | 3.48 | | | | (.79) | | | | (2.40) |
| Distributions from net investment | | | | | | | | | | | | | | | | | | | | |
| income | | | | — | | | | (.07) | | | | (.02) | | | | — | | | | (.26) |
| Distributions from net realized | | | | | | | | | | | | | | | | | | | | |
| gain | | | | (.08) | | | | — | | | | — | | | | — | | | | — |
| Total distributions | | | | (.08) | | | | (.07) | | | | (.02) | | | | — | | | | (.26) |
| Redemption fees added to paid in | | | | | | | | | | | | | | | | | | | | |
| capitalC | | | | —E | | | | —E | | | | — | | | | — | | | | — |
| Net asset value, end of period | | $ | | 20.12 | | $ | | 16.82 | | $ | | 14.47 | | $ | | 11.01 | | $ | | 11.80 |
| Total ReturnA,B | | | | 20.16% | | | | 16.78% | | | | 31.66% | | | | (6.69)% | | | | (16.90)% |
| Ratios to Average Net AssetsD | | | | | | | | | | | | | | | | | | | | |
| Expenses before expense | | | | | | | | | | | | | | | | | | | | |
| reductions | | | | 1.51% | | | | 1.61% | | | | 1.75% | | | | 1.79% | | | | 1.81% |
| Expenses net of voluntary | | | | | | | | | | | | | | | | | | | | |
| waivers, if any | | | | 1.51% | | | | 1.61% | | | | 1.75% | | | | 1.79% | | | | 1.81% |
| Expenses net of all reductions | | | | 1.45% | | | | 1.57% | | | | 1.72% | | | | 1.76% | | | | 1.76% |
| Net investment income (loss) | | | | 77% | | | | .21% | | | | .38% | | | | .21% | | | | .47% |
| Supplemental Data | | | | | | | | | | | | | | | | | | | | |
| Net assets, end of period | | | | | | | | | | | | | | | | | | | | |
| (in millions) | | $ | | 2,420 | | $ | | 1,510 | | $ | | 552 | | $ | | 204 | | $ | | 153 |
| Portfolio turnover rate | | | | 59% | | | | 72% | | | | 49% | | | | 53% | | | | 84% |
A Total returns would have been lower had certain expenses not been reduced during the periods shown.
B Total returns do not include the effect of the sales charges.
C Calculated based on average shares outstanding during the period.
D Expense ratios reflect operating expenses of the class. Expenses before reductions do not reflect amounts reimbursed by the investment adviser or reductions from brokerage service arrangements or other expense offset arrangements and do not represent the amount paid by the class during periods when reimbursements or reductions occur. Expenses net of any voluntary waivers reflect expenses after reimbursement by the investment adviser but prior to reductions from brokerage service arrangements or other expense offset arrangements. Expenses net of all reductions repre sent the net expenses paid by the class.
E Amount represents less than $.01 per share.
See accompanying notes which are an integral part of the financial statements.
| Financial Highlights — Class B | | | | | | | | | | | | | | | | |
| |
| Years ended October 31, | | | | 2005 | | | | 2004 | | | | 2003 | | | | 2002 | | | | 2001 |
| Selected Per-Share Data | | | | | | | | | | | | | | | | | | | | |
| Net asset value, beginning of | | | | | | | | | | | | | | | | | | | | |
| period | | $ | | 16.46 | | $ | | 14.19 | | $ | | 10.84 | | $ | | 11.68 | | $ | | 14.33 |
| Income from Investment | | | | | | | | | | | | | | | | | | | | |
| Operations | | | | | | | | | | | | | | | | | | | | |
| Net investment income (loss)C | | | | 02 | | | | (.07) | | | | (.02) | | | | (.04) | | | | (.01) |
| Net realized and unrealized | | | | | | | | | | | | | | | | | | | | |
| gain (loss) | | | | 3.16 | | | | 2.35 | | | | 3.37 | | | | (.80) | | | | (2.44) |
| Total from investment operations | | | | 3.18 | | | | 2.28 | | | | 3.35 | | | | (.84) | | | | (2.45) |
| Distributions from net investment | | | | | | | | | | | | | | | | | | | | |
| income | | | | — | | | | (.01) | | | | — | | | | — | | | | (.20) |
| Distributions from net realized | | | | | | | | | | | | | | | | | | | | |
| gain | | | | (.04) | | | | — | | | | — | | | | — | | | | — |
| Total distributions | | | | (.04) | | | | (.01) | | | | — | | | | — | | | | (.20) |
| Redemption fees added to paid in | | | | | | | | | | | | | | | | | | | | |
| capitalC | | | | —E | | | | —E | | | | — | | | | — | | | | — |
| Net asset value, end of period | | $ | | 19.60 | | $ | | 16.46 | | $ | | 14.19 | | $ | | 10.84 | | $ | | 11.68 |
| Total ReturnA,B | | | | 19.35% | | | | 16.08% | | | | 30.90% | | | | (7.19)% | | | | (17.33)% |
| Ratios to Average Net AssetsD | | | | | | | | | | | | | | | | | | | | |
| Expenses before expense | | | | | | | | | | | | | | | | | | | | |
| reductions | | | | 2.16% | | | | 2.24% | | | | 2.32% | | | | 2.32% | | | | 2.35% |
| Expenses net of voluntary | | | | | | | | | | | | | | | | | | | | |
| waivers, if any | | | | 2.16% | | | | 2.24% | | | | 2.32% | | | | 2.32% | | | | 2.35% |
| Expenses net of all reductions | | | | 2.10% | | | | 2.20% | | | | 2.29% | | | | 2.29% | | | | 2.30% |
| Net investment income (loss) | | | | 12% | | | | (.42)% | | | | (.19)% | | | | (.32)% | | | | (.07)% |
| Supplemental Data | | | | | | | | | | | | | | | | | | | | |
| Net assets, end of period | | | | | | | | | | | | | | | | | | | | |
| (in millions) | | $ | | 351 | | $ | | 196 | | $ | | 89 | | $ | | 49 | | $ | | 42 |
| Portfolio turnover rate | | | | 59% | | | | 72% | | | | 49% | | | | 53% | | | | 84% |
A Total returns would have been lower had certain expenses not been reduced during the periods shown.
B Total returns do not include the effect of the contingent deferred sales charge.
C Calculated based on average shares outstanding during the period.
D Expense ratios reflect operating expenses of the class. Expenses before reductions do not reflect amounts reimbursed by the investment adviser or reductions from brokerage service arrangements or other expense offset arrangements and do not represent the amount paid by the class during periods when reimbursements or reductions occur. Expenses net of any voluntary waivers reflect expenses after reimbursement by the investment adviser but prior to reductions from brokerage service arrangements or other expense offset arrangements. Expenses net of all reductions repre sent the net expenses paid by the class.
E Amount represents less than $.01 per share.
See accompanying notes which are an integral part of the financial statements.
29 Annual Report
| Financial Highlights — Class C | | | | | | | | | | | | | | | | |
| |
| Years ended October 31, | | | | 2005 | | | | 2004 | | | | 2003 | | | | 2002 | | | | 2001 |
| Selected Per-Share Data | | | | | | | | | | | | | | | | | | | | |
| Net asset value, beginning of | | | | | | | | | | | | | | | | | | | | |
| period | �� | $ | | 16.48 | | $ | | 14.22 | | $ | | 10.86 | | $ | | 11.68 | | $ | | 14.34 |
| Income from Investment | | | | | | | | | | | | | | | | | | | | |
| Operations | | | | | | | | | | | | | | | | | | | | |
| Net investment income (loss)C | | | | 04 | | | | (.05) | | | | (.01) | | | | (.03) | | | | —E |
| Net realized and unrealized | | | | | | | | | | | | | | | | | | | | |
| gain (loss) | | | | 3.17 | | | | 2.35 | | | | 3.37 | | | | (.79) | | | | (2.45) |
| Total from investment operations | | | | 3.21 | | | | 2.30 | | | | 3.36 | | | | (.82) | | | | (2.45) |
| Distributions from net investment | | | | | | | | | | | | | | | | | | | | |
| income | | | | — | | | | (.04) | | | | — | | | | — | | | | (.21) |
| Distributions from net realized | | | | | | | | | | | | | | | | | | | | |
| gain | | | | (.04) | | | | — | | | | — | | | | — | | | | — |
| Total distributions | | | | (.04) | | | | (.04) | | | | — | | | | — | | | | (.21) |
| Redemption fees added to paid in | | | | | | | | | | | | | | | | | | | | |
| capitalC | | | | —E | | | | —E | | | | — | | | | — | | | | — |
| Net asset value, end of period | | $ | | 19.65 | | $ | | 16.48 | | $ | | 14.22 | | $ | | 10.86 | | $ | | 11.68 |
| Total ReturnA,B | | | | 19.51% | | | | 16.21% | | | | 30.94% | | | | (7.02)% | | | | (17.33)% |
| Ratios to Average Net AssetsD | | | | | | | | | | | | | | | | | | | | |
| Expenses before expense | | | | | | | | | | | | | | | | | | | | |
| reductions | | | | 2.05% | | | | 2.13% | | | | 2.23% | | | | 2.25% | | | | 2.28% |
| Expenses net of voluntary | | | | | | | | | | | | | | | | | | | | |
| waivers, if any | | | | 2.05% | | | | 2.13% | | | | 2.23% | | | | 2.25% | | | | 2.28% |
| Expenses net of all reductions | | | | 1.99% | | | | 2.09% | | | | 2.20% | | | | 2.22% | | | | 2.24% |
| Net investment income (loss) | | | | 23% | | | | (.31)% | | | | (.10)% | | | | (.25)% | | | | (.01)% |
| Supplemental Data | | | | | | | | | | | | | | | | | | | | |
| Net assets, end of period | | | | | | | | | | | | | | | | | | | | |
| (in millions) | | $ | | 758 | | $ | | 381 | | $ | | 124 | | $ | | 54 | | $ | | 44 |
| Portfolio turnover rate | | | | 59% | | | | 72% | | | | 49% | | | | 53% | | | | 84% |
A Total returns would have been lower had certain expenses not been reduced during the periods shown.
B Total returns do not include the effect of the contingent deferred sales charge.
C Calculated based on average shares outstanding during the period.
D Expense ratios reflect operating expenses of the class. Expenses before reductions do not reflect amounts reimbursed by the investment adviser or reductions from brokerage service arrangements or other expense offset arrangements and do not represent the amount paid by the class during periods when reimbursements or reductions occur. Expenses net of any voluntary waivers reflect expenses after reimbursement by the investment adviser but prior to reductions from brokerage service arrangements or other expense offset arrangements. Expenses net of all reductions repre sent the net expenses paid by the class.
E Amount represents less than $.01 per share.
See accompanying notes which are an integral part of the financial statements.
| Financial Highlights — Institutional Class | | | | | | | | | | | | |
| |
| Years ended October 31, | | | | 2005 | | | | 2004 | | | | 2003 | | | | 2002 | | | | 2001 |
| Selected Per-Share Data | | | | | | | | | | | | | | | | | | | | |
| Net asset value, beginning of | | | | | | | | | | | | | | | | | | | | |
| period | | $ | | 17.18 | | $ | | 14.74 | | $ | | 11.22 | | $ | | 11.94 | | $ | | 14.60 |
| Income from Investment | | | | | | | | | | | | | | | | | | | | |
| Operations | | | | | | | | | | | | | | | | | | | | |
| Net investment income (loss)B | | | | 25 | | | | .13 | | | | .13 | | | | .11 | | | | .14 |
| Net realized and unrealized | | | | | | | | | | | | | | | | | | | | |
| gain (loss) | | | | 3.30 | | | | 2.44 | | | | 3.48 | | | | (.83) | | | | (2.48) |
| Total from investment operations | | | | 3.55 | | | | 2.57 | | | | 3.61 | | | | (.72) | | | | (2.34) |
| Distributions from net investment | | | | | | | | | | | | | | | | | | | | |
| income | | | | (.09) | | | | (.13) | | | | (.09) | | | | — | | | | (.32) |
| Distributions from net realized | | | | | | | | | | | | | | | | | | | | |
| gain | | | | (.08) | | | | — | | | | — | | | | — | | | | — |
| Total distributions | | | | (.17) | | | | (.13) | | | | (.09) | | | | — | | | | (.32) |
| Redemption fees added to paid in | | | | | | | | | | | | | | | | | | | | |
| capitalB | | | | —D | | | | —D | | | | — | | | | — | | | | — |
| Net asset value, end of period | | $ | | 20.56 | | $ | | 17.18 | | $ | | 14.74 | | $ | | 11.22 | | $ | | 11.94 |
| Total ReturnA | | | | 20.81% | | | | 17.54% | | | | 32.41% | | | | (6.03)% | | | | (16.38)% |
| Ratios to Average Net AssetsC | | | | | | | | | | | | | | | | | | | | |
| Expenses before expense | | | | | | | | | | | | | | | | | | | | |
| reductions | | | | 97% | | | | 1.03% | | | | 1.09% | | | | 1.11% | | | | 1.17% |
| Expenses net of voluntary | | | | | | | | | | | | | | | | | | | | |
| waivers, if any | | | | 97% | | | | 1.03% | | | | 1.09% | | | | 1.11% | | | | 1.17% |
| Expenses net of all reductions | | | | 91% | | | | .98% | | | | 1.06% | | | | 1.07% | | | | 1.12% |
| Net investment income (loss) | | | | 1.32% | | | | .80% | | | | 1.04% | | | | .89% | | | | 1.11% |
| Supplemental Data | | | | | | | | | | | | | | | | | | | | |
| Net assets, end of period | | | | | | | | | | | | | | | | | | | | |
| (in millions) | | $ | | 2,213 | | $ | | 1,185 | | $ | | 391 | | $ | | 88 | | $ | | 43 |
| Portfolio turnover rate | | | | 59% | | | | 72% | | | | 49% | | | | 53% | | | | 84% |
A Total returns would have been lower had certain expenses not been reduced during the periods shown.
B Calculated based on average shares outstanding during the period.
C Expense ratios reflect operating expenses of the class. Expenses before reductions do not reflect amounts reimbursed by the investment adviser or reductions from brokerage service arrangements or other expense offset arrangements and do not represent the amount paid by the class during periods when reimbursements or reductions occur. Expenses net of any voluntary waivers reflect expenses after reimbursement by the investment adviser but prior to reductions from brokerage service arrangements or other expense offset arrangements. Expenses net of all reductions repre sent the net expenses paid by the class.
D Amount represents less than $.01 per share.
See accompanying notes which are an integral part of the financial statements.
31 Annual Report
Notes to Financial Statements
For the period ended October 31, 2005
(Amounts in thousands except ratios)
|
1. Significant Accounting Policies.
Fidelity Advisor Diversified International Fund (the fund) is a fund of Fidelity Advisor Series VIII (the trust) and is authorized to issue an unlimited number of shares. The trust is registered under the Investment Company Act of 1940, as amended (the 1940 Act), as an open-end management investment company organized as a Massachusetts business trust.
The fund offers Class A, Class T, Class B, Class C, and Institutional Class shares, each of which has equal rights as to assets and voting privileges. Each class has exclusive voting rights with respect to matters that affect that class. Class B shares will automatically convert to Class A shares after a holding period of seven years from the initial date of purchase. Investment income, realized and unrealized capital gains and losses, the common expenses of the fund, and certain fund-level expense reductions, if any, are allocated on a pro rata basis to each class based on the relative net assets of each class to the total net assets of the fund. Each class differs with respect to transfer agent and distribution and service plan fees incurred. Certain expense reductions also differ by class.
The fund’s investments in emerging markets can be subject to social, economic, regulatory, and political uncertainties and can be extremely volatile.
The fund may invest in affiliated money market central funds (Money Market Central Funds) which are open-end investment companies available to investment companies and other accounts managed by Fidelity Management & Research Company (FMR) and its affiliates. The financial statements have been prepared in conformity with accounting principles generally accepted in the United States of America, which require management to make certain estimates and assumptions at the date of the financial statements. The following summarizes the significant accounting policies of the fund:
Security Valuation. Investments are valued and net asset value (NAV) per share is calculated (NAV calculation) as of the close of business of the New York Stock Exchange (NYSE), normally 4:00 p.m. Eastern time. Wherever possible, the fund uses independent pricing services approved by the Board of Trustees to value its investments.
Equity securities, including restricted securities, for which market quotations are readily available, are valued at the last reported sale price or official closing price as reported by an independent pricing service on the primary market or exchange on which they are traded. In the event there were no sales during the day or closing prices are not available, securities are valued at the last quoted bid price. Investments in open-end mutual funds, are valued at their closing net asset value each business day. Short-term securities with remaining maturities of sixty days or less for which quotations are not readily available are valued at amortized cost, which approximates value.
1. Significant Accounting Policies - continued
Security Valuation - continued
When current market prices or quotations are not readily available or do not accurately reflect fair value, valuations may be determined in accordance with procedures adopted by the Board of Trustees. For example, when developments occur between the close of a market and the close of the NYSE that may materially affect the value of some or all of the securities, or when trading in a security is halted, those securities may be fair valued. Factors used in the determination of fair value may include monitoring news to identify significant market or security specific events such as changes in the value of U.S. securities market, reviewing developments in foreign markets and evaluating the performance of ADRs, futures contracts and exchange-traded funds. Because the fund’s utilization of fair value pricing depends on market activity, the frequency with which fair value pricing is used can not be predicted and may be utilized to a significant extent. The value of securities used for NAV calculation under fair value pricing may differ from published prices for the same securities.
Foreign Currency. The fund uses foreign currency contracts to facilitate transactions in foreign-denominated securities. Losses from these transactions may arise from changes in the value of the foreign currency or if the counterparties do not perform under the contracts’ terms.
Foreign-denominated assets, including investment securities, and liabilities are translated into U.S. dollars at the exchange rate at period end. Purchases and sales of investment securities, income and dividends received and expenses denominated in foreign currencies are translated into U.S. dollars at the exchange rate in effect on the transaction date.
The effects of exchange rate fluctuations on investments are included with the net realized and unrealized gain (loss) on investment securities. Other foreign currency transactions resulting in realized and unrealized gain (loss) are disclosed separately.
Investment Transactions and Income. Security transactions are accounted for as of trade date. Gains and losses on securities sold are determined on the basis of identified cost. Dividend income is recorded on the ex-dividend date, except for certain dividends from foreign securities where the ex-dividend date may have passed, which are recorded as soon as the fund is informed of the ex-dividend date. Non-cash dividends included in dividend income, if any, are recorded at the fair market value of the securities received. Distributions received on securities that represent a return of capital or capital gain are recorded as a reduction of cost of investments and/or as a realized gain. The fund estimates the components of distributions received that may be considered return of capital distributions or capital gain distributions. Interest income is accrued as earned. Interest income includes coupon interest and amortization of premium and accretion of discount on debt securities. Investment income is recorded net of foreign taxes withheld where recovery of such taxes is uncertain.
33 Annual Report
Notes to Financial Statements - continued
(Amounts in thousands except ratios)
1. Significant Accounting Policies - continued
Expenses. Most expenses of the trust can be directly attributed to a fund. Expenses which cannot be directly attributed are apportioned among each fund in the trust.
Income Tax Information and Distributions to Shareholders. Each year, the fund intends to qualify as a regulated investment company by distributing all of its taxable income and realized gains under Subchapter M of the Internal Revenue Code. As a result, no provision for income taxes is required in the accompanying financial statements. Foreign taxes are provided for based on the fund’s understanding of the tax rules and rates that exist in the foreign markets in which it invests.
Distributions are recorded on the ex-dividend date. Income dividends and capital gain distributions are declared separately for each class. Income and capital gain distributions are determined in accordance with income tax regulations, which may differ from generally accepted accounting principles. In addition, the fund will claim a portion of the payment made to redeeming shareholders as a distribution for income tax purposes.
Capital accounts within the financial statements are adjusted for permanent book-tax differences. These adjustments have no impact on net assets or the results of operations. Temporary book-tax differences will reverse in a subsequent period.
Book-tax differences are primarily due to foreign currency transactions, certain foreign taxes, passive foreign investment companies (PFIC), market discount and losses deferred due to wash sales.
The tax-basis components of distributable earnings and the federal tax cost as of period end were as follows:
| Unrealized appreciation | | $ | | 1,287,906 | | | | |
| Unrealized depreciation | | | | (186,136) | | | | |
| Net unrealized appreciation (depreciation) | | | | 1,101,770 | | | | |
| Undistributed ordinary income | | | | 160,691 | | | | |
| Undistributed long-term capital gain | | | | 315,179 | | | | |
| Cost for federal income tax purposes | | $ | | 7,484,281 | | | | |
| |
| The tax character of distributions paid was as follows: | | | | |
| | | | | October 31, 2005 | | | | October 31, 2004 |
| Ordinary Income | | $ | | 20,958 | | $ | | 10,785 |
| Long-term Capital Gains | | | | 11,568 | | | | — |
| Total | | $ | | 32,526 | | $ | | 10,785 |
1. Significant Accounting Policies - continued
Short-Term Trading (Redemption) Fees. Shares held in the fund less than 30 days are subject to a redemption fee equal to 1.00% of the proceeds of the redeemed shares. All redemption fees, including any estimated redemption fees paid by FMR, are retained by the fund and accounted for as an addition to paid in capital.
Repurchase Agreements. FMR has received an Exemptive Order from the Securities and Exchange Commission (the SEC) which permits the fund and other affiliated entities of FMR to transfer uninvested cash balances into joint trading accounts which are then invested in repurchase agreements. The fund may also invest directly with institutions in repurchase agreements. Repurchase agreements are collateralized by government or non-government securities. Collateral is held in segregated accounts with custodian banks and may be obtained in the event of a default of the counterparty. The fund monitors, on a daily basis, the value of the collateral to ensure it is at least equal to the principal amount of the repurchase agreement (including accrued interest). In the event of a default by the counterparty, realization of the collateral proceeds could be delayed, during which time the value of the collateral may decline.
Restricted Securities. The fund may invest in securities that are subject to legal or contractual restrictions on resale. These securities generally may be resold in transactions exempt from registration or to the public if the securities are registered. Disposal of these securities may involve time-consuming negotiations and expense, and prompt sale at an acceptable price may be difficult. Information regarding restricted securities is included at the end of the fund’s Schedule of Investments.
3. Purchases and Sales of Investments.
Purchases and sales of securities, other than short-term securities and U.S. government securities, aggregated $6,901,019 and $3,810,647, respectively.
4. Fees and Other Transactions with Affiliates.
Management Fee. FMR and its affiliates provide the fund with investment management related services for which the fund pays a monthly management fee. The management fee is the sum of an individual fund fee rate that is based on an annual rate of .45% of the fund’s average net assets and a group fee rate that averaged .27% during the period. The group fee rate is based upon the average net assets of all the mutual funds advised by FMR. The group fee rate decreases as assets under management increase and increases as assets under management decrease. For the period, the total annual management fee rate was .72% of the fund’s average net assets.
35 Annual Report
Notes to Financial Statements - continued
(Amounts in thousands except ratios)
4. Fees and Other Transactions with Affiliates - continued
Distribution and Service Plan. In accordance with Rule 12b-1 of the 1940 Act, the fund has adopted separate Distribution and Service Plans for each class of shares. Certain classes pay Fidelity Distributors Corporation (FDC), an affiliate of FMR, separate Distribution and Service Fees, each of which is based on an annual percentage of each class’ average net assets. In addition, FDC may pay financial intermediaries for selling shares of the fund and providing shareholder support services. For the period, the Distribution and Service Fee rates and the total amounts paid to and retained by FDC were as follows:
| | | Distribution | | Service | | | | Paid to | | | | Retained |
| | | Fee | | Fee | | | | FDC | | | | by FDC |
| Class A | | 0% | | .25% | | $ | | 5,086 | | $ | | 34 |
| Class T | | 25% | | .25% | | | | 9,835 | | | | 436 |
| Class B | | 75% | | .25% | | | | 2,812 | | | | 2,109 |
| Class C | | 75% | | .25% | | | | 5,715 | | | | 2,661 |
| |
| | | | | | | $ | | 23,448 | | $ | | 5,240 |
Sales Load. FDC receives a front-end sales charge of up to 5.75% for selling Class A shares, and 3.50% for selling Class T shares, some of which is paid to financial intermediaries for selling shares of the fund. FDC receives the proceeds of contingent deferred sales charges levied on Class A, Class T, Class B, and Class C redemptions. These charges depend on the holding period. The deferred sales charges range from 5% to 1% for Class B, 1% for Class C, and .25% for certain purchases of Class A and Class T shares.
| For the period, sales charge amounts retained by FDC were as follows: | | |
| | | | | Retained |
| | | | | by FDC |
| Class A | | $ | | 1,377 |
| Class T | | | | 223 |
| Class B* | | | | 360 |
| Class C* | | | | 19 |
| | | $ | | 1,979 |
* When Class B and Class C shares are initially sold, FDC pays commissions from its own resources to financial intermediaries through which the sales are made.
Transfer Agent Fees. Fidelity Investments Institutional Operations Company, Inc. (FIIOC), an affiliate of FMR, is the transfer, dividend disbursing and shareholder servicing agent for each class of the fund. FIIOC receives account fees and asset-based fees that vary according to the account size and type of account of the shareholders of the
4. Fees and Other Transactions with Affiliates - continued
Transfer Agent Fees - continued
respective classes of the fund. FIIOC pays for typesetting, printing and mailing of shareholder reports, except proxy statements. For the period the total transfer agent fees paid by each class to FIIOC, were as follows:
| | | | | | | % of |
| | | | | | | Average |
| | | | | Amount | | Net Assets |
| Class A | | $ | | 4,508 | | .22 |
| Class T | | | | 4,283 | | .22 |
| Class B | | | | 1,030 | | .37 |
| Class C | | | | 1,487 | | .26 |
| Institutional Class | | | | 3,071 | | .17 |
| |
| | | $ | | 14,379 | | |
Accounting and Security Lending Fees. Fidelity Service Company, Inc. (FSC), an affiliate of FMR, maintains the fund’s accounting records. The accounting fee is based on the level of average net assets for the month. Under a separate contract, FSC administers the security lending program. The security lending fee is based on the number and duration of lending transactions.
Affiliated Central Funds. The fund may invest in Money Market Central Funds which seek preservation of capital and current income and are managed by Fidelity Investments Money Management, Inc. (FIMM), an affiliate of FMR.
The Money Market Central Funds do not pay a management fee. Income distributions earned by the fund are recorded as income in the accompanying financial statements and totaled $8,277 for the period.
Brokerage Commissions. The fund placed a portion of its portfolio transactions with brokerage firms which are affiliates of the investment adviser. The commissions paid to these affiliated firms were $15 for the period.
5. Committed Line of Credit.
|
The fund participates with other funds managed by FMR in a $4.2 billion credit facility (the “line of credit”) to be utilized for temporary or emergency purposes to fund shareholder redemptions or for other short-term liquidity purposes. The fund has agreed to pay commitment fees on its pro rata portion of the line of credit. During the period, there were no borrowings on this line of credit.
37 Annual Report
Notes to Financial Statements - continued
(Amounts in thousands except ratios)
6. Security Lending.
The fund lends portfolio securities from time to time in order to earn additional income. The fund receives collateral (in the form of U.S. Treasury obligations, letters of credit and/or cash) against the loaned securities and maintains collateral in an amount not less than 100% of the market value of the loaned securities during the period of the loan. The market value of the loaned securities is determined at the close of business of the fund and any additional required collateral is delivered to the fund on the next business day. If the borrower defaults on its obligation to return the securities loaned because of insolvency or other reasons, a fund could experience delays and costs in recovering the securities loaned or in gaining access to the collateral. Cash collateral is invested in the Fidelity Securities Lending Cash Central Fund. The value of loaned securities and cash collateral at period end are disclosed on the fund’s Statement of Assets and Liabilities. Security lending income represents the income earned on investing cash collateral, less fees and expenses associated with the loan, plus any premium payments that may be received on the loan of certain types of securities.
Many of the brokers with whom FMR places trades on behalf of the fund provided services to the fund in addition to trade execution. These services included payments of certain expenses on behalf of the fund totaling $4,080 for the period. In addition, through arrangements with each class’ transfer agent, credits realized as a result of uninvested cash balances were used to reduce the fund’s expenses. During the period, credits reduced each class’ transfer agent expense as noted in the table below.
| | | | | Transfer Agent |
| | | | | Expense Reduction |
| Class A | | $ | | 6 |
| |
| |
| 8. Other. | | | | |
The fund’s organizational documents provide former and current trustees and officers with a limited indemnification against liabilities arising in connection with the performance of their duties to the fund. In the normal course of business, the fund may also enter into contracts that provide general indemnifications. The fund’s maximum exposure under these arrangements is unknown as this would be dependent on future claims that may be made against the fund. The risk of material loss from such claims is considered remote.
| 9. Distributions to Shareholders. | | | | | | | | | | |
| |
| Distributions to shareholders of each class were as follows: | | | | | | |
| |
| Years ended October 31, | | | | | | 2005 | | | | 2004 |
| From net investment income | | | | | | | | | | | | |
| Class A | | $ | | | | 4,172 | | | $ | 2,739 |
| Class T | | | | | | | | — | | | | 3,117 |
| Class B | | | | | | | | — | | | | 70 |
| Class C | | | | | | | | — | | | | 442 |
| Institutional Class | | | | | | 6,711 | | | | 4,417 |
| Total | | $ | | | | 10,883 | | | $ | 10,785 |
| From net realized gain | | | | | | | | | | | | |
| Class A | | $ | | | | 6,675 | | | $ | — |
| Class T | | | | | | 7,510 | | | | — |
| Class B | | | | | | | | 505 | | | | — |
| Class C | | | | | | | | 988 | | | | — |
| Institutional Class | | | | | | 5,965 | | | | — |
| Total | | $ | | | | 21,643 | | | $ | — |
| |
| 10. Share Transactions. | | | | | | | | | | |
| |
| Transactions for each class of shares were as follows: | | | | | | | | |
| |
| | | Shares | | | | | | Dollars |
| Years ended October 31, | | 2005 | | 2004 | | | | 2005 | | | | 2004 |
| Class A | | | | | | | | | | | | |
| Shares sold | | 83,477 | | 75,525 | | $ | | 1,580,867 | | $ | | 1,219,587 |
| Reinvestment of | | | | | | | | | | | | |
| distributions | | 432 | | 132 | | | | 7,686 | | | | 2,005 |
| Shares redeemed | | (22,583) | | (15,926) | | | | (426,811) | | | | (257,408) |
| Net increase (decrease) . | | 61,326 | | 59,731 | | $ | | 1,161,742 | | $ | | 964,184 |
| Class T | | | | | | | | | | | | |
| Shares sold | | 60,374 | | 67,315 | | $ | | 1,132,534 | | $ | | 1,076,867 |
| Reinvestment of | | | | | | | | | | | | |
| distributions | | 398 | | 183 | | | | 7,025 | | | | 2,756 |
| Shares redeemed | | (30,276) | | (15,917) | | | | (565,431) | | | | (255,724) |
| Net increase (decrease) . | | 30,496 | | 51,581 | | $ | | 574,128 | | $ | | 823,899 |
| Class B | | | | | | | | | | | | |
| Shares sold | | 7,850 | | 6,650 | | $ | | 143,663 | | $ | | 104,459 |
| Reinvestment of | | | | | | | | | | | | |
| distributions | | 25 | | 4 | | | | 427 | | | | 59 |
| Shares redeemed | | (1,900) | | (1,035) | | | | (34,997) | | | | (16,283) |
| Net increase (decrease) . | | 5,975 | | 5,619 | | $ | | 109,093 | | $ | | 88,235 |
39 Annual Report
| Notes to Financial Statements - continued | | | | | | |
| (Amounts in thousands except ratios) | | | | | | | | | | |
| |
| |
| 10. Share Transactions - continued | | | | | | | | |
| |
| Transactions for each class of shares were as follows - continued | | | | |
| |
| | | Shares | | | | | | Dollars | | |
| Years ended October 31, | | 2005 | | 2004 | | | | 2005 | | | | 2004 |
| Class C | | | | | | | | | | | | |
| Shares sold | | 19,454 | | 16,221 | | $ | | 358,671 | | $ | | 254,211 |
| Reinvestment of | | | | | | | | | | | | |
| distributions | | 40 | | 22 | | | | 699 | | | | 327 |
| Shares redeemed | | (4,021) | | (1,843) | | | | (74,121) | | | | (29,087) |
| Net increase (decrease) . | | 15,473 | | 14,400 | | $ | | 285,249 | | $ | | 225,451 |
| Institutional Class | | | | | | | | | | | | |
| Shares sold | | 64,375 | | 56,867 | | $ | | 1,229,041 | | $ | | 924,747 |
| Reinvestment of | | | | | | | | | | | | |
| distributions | | 418 | | 120 | | | | 7,508 | | | | 1,832 |
| Shares redeemed | | (26,125) | | (14,589) | | | | (509,275) | | | | (241,874) |
| Net increase (decrease) . | | 38,668 | | 42,398 | | $ | | 727,274 | | $ | | 684,705 |
Report of Independent Registered Public Accounting Firm
To the Trustees of Fidelity Advisor Series VIII and the Shareholders of Fidelity Advisor Diversified International Fund:
In our opinion, the accompanying statement of assets and liabilities, including the schedule of investments, and the related statements of operations and of changes in net assets and the financial highlights present fairly, in all material respects, the financial position of Fidelity Advisor Diversified International Fund (a fund of Fidelity Advisor Series VIII) at October 31, 2005 and the results of its operations, the changes in its net assets and the financial highlights for the periods indicated, in conformity with accounting principles generally accepted in the United States of America. These financial statements and financial highlights (hereafter referred to as “financial statements”) are the responsibility of the Fidelity Advisor Diversified International Fund’s management; our responsibility is to express an opinion on these financial statements based on our audits. We conducted our audits of these financial statements in accordance with the standards of the Public Company Accounting Oversight Board (United States). Those standards require that we plan and perform the audit to obtain reasonable assurance about whether the financial statements are free of material misstatement. An audit includes examining, on a test basis, evidence supporting the amounts and disclosures in the financial statements, assessing the accounting principles used and significant estimates made by management, and evaluating the overall financial statement presentation. We believe that our audits, which included confirmation of securities at October 31, 2005 by correspondence with the custodian and brokers, provide a reasonable basis for our opinion.
/s/ PricewaterhouseCoopers LLP
PricewaterhouseCoopers LLP
Boston, Massachusetts
December 13, 2005
|
41 Annual Report
Trustees and Officers
The Trustees, Members of the Advisory Board, and executive officers of the trust and fund, as applicable, are listed below. The Board of Trustees governs the fund and is responsible for protecting the interests of shareholders. The Trustees are experienced executives who meet periodically throughout the year to oversee the fund’s activities, review contractual arrangements with companies that provide services to the fund, and review the fund’s performance. Except for William O. McCoy, Stephen P. Jonas, and Kenneth L. Wolfe, each of the Trustees oversees 322 funds advised by FMR or an affiliate. Mr. McCoy oversees 324 funds advised by FMR or an affiliate. Mr. Jonas and Mr. Wolfe oversee 319 funds advised by FMR or an affiliate.
The Trustees hold office without limit in time except that (a) any Trustee may resign; (b) any Trustee may be removed by written instrument, signed by at least two-thirds of the number of Trustees prior to such removal; (c) any Trustee who requests to be retired or who has become incapacitated by illness or injury may be retired by written instrument signed by a majority of the other Trustees; and (d) any Trustee may be removed at any special meeting of shareholders by a two-thirds vote of the outstanding voting securities of the trust. Each Trustee who is not an interested person (as defined in the 1940 Act) (Independent Trustee), shall retire not later than the last day of the calendar year in which his or her 72nd birthday occurs. The Independent Trustees may waive this mandatory retirement age policy with respect to individual Trustees. The executive officers and Advisory Board Members hold office without limit in time, except that any officer and Advisory Board Member may resign or may be removed by a vote of a majority of the Trustees at any regular meeting or any special meeting of the Trustees. Except as indicated, each individual has held the office shown or other offices in the same company for the past five years.
The fund’s Statement of Additional Information (SAI) includes more information about the Trustees. To request a free copy, call Fidelity at 1-877-208-0098.
Interested Trustees*:
Correspondence intended for each Trustee who is an interested person may be sent to Fidelity Investments, 82 Devonshire Street, Boston, Massachusetts 02109.
| Name, Age; Principal Occupation |
| |
| Edward C. Johnson 3d (75)** |
| |
| Year of Election or Appointment: 1983 |
| Mr. Johnson is Chairman of the Board of Trustees. Mr. Johnson serves as |
| Chief Executive Officer, Chairman, and a Director of FMR Corp.; a Di- |
| rector and Chairman of the Board and of the Executive Committee of |
| FMR; Chairman and a Director of Fidelity Management & Research (Far |
| East) Inc.; Chairman and a Director of Fidelity Investments Money Man- |
| agement, Inc.; and Chairman (2001-present) and a Director |
| (2000-present) of FMR Co., Inc. |
Annual Report 42
| Name, Age; Principal Occupation |
| |
| Abigail P. Johnson (43)** |
| |
| Year of Election or Appointment: 2001 |
| Ms. Johnson serves as President of Fidelity Employer Services Company |
| (FESCO) (2005-present). She is President and a Director of Fidelity In- |
| vestments Money Management, Inc. (2001-present), FMR Co., Inc. |
| (2001-present), and a Director of FMR Corp. Previously, Ms. Johnson |
| served as President and a Director of FMR (2001-2005), Senior Vice |
| President of the Fidelity funds (2001-2005), and managed a number of |
| Fidelity funds. |
| |
| Stephen P. Jonas (52) |
| |
| Year of Election or Appointment: 2005 |
| Mr. Jonas is Senior Vice President of Advisor Diversified International |
| (2005-present). He also serves as Senior Vice President of other Fidelity |
| funds (2005-present). Mr. Jonas is Executive Director of FMR |
| (2005-present). Previously, Mr. Jonas served as President of Fidelity |
| Enterprise Operations and Risk Services (2004-2005), Chief Adminis- |
| trative Officer (2002-2004), and Chief Financial Officer of FMR Co. |
| (1998-2000). Mr. Jonas has been with Fidelity Investments since 1987 |
| and has held various financial and management positions including |
| Chief Financial Officer of FMR. In addition, he serves on the Boards of |
| Boston Ballet (2003-present) and Simmons College (2003-present). |
| |
| Robert L. Reynolds (53) |
| |
| Year of Election or Appointment: 2003 |
| Mr. Reynolds is a Director (2003-present) and Chief Operating Officer |
| (2002-present) of FMR Corp. He also serves on the Board at Fidelity |
| Investments Canada, Ltd. (2000-present). Previously, Mr. Reynolds |
| served as President of Fidelity Investments Institutional Retirement Group |
| (1996-2000). |
* Trustees have been determined to be “Interested Trustees” by virtue of, among other things, their affiliation with the trust or various entities under common control with FMR.
** Edward C. Johnson 3d, Trustee, is Abigail P. Johnson’s father.
43 Annual Report
Trustees and Officers - continued
Independent Trustees:
Correspondence intended for each Independent Trustee (that is, the Trustees other than the Interested Trustees) may be sent to Fidelity Investments, P.O. Box 55235, Boston, Massachusetts 02205-5235.
| Name, Age; Principal Occupation |
| |
| Dennis J. Dirks (57) |
| |
| Year of Election or Appointment: 2005 |
| Prior to his retirement in May 2003, Mr. Dirks was Chief Operating |
| Officer and a member of the Board of The Depository Trust & Clearing |
| Corporation (DTCC) (1999-2003). He also served as President, Chief |
| Operating Officer, and Board member of The Depository Trust Comp- |
| any (DTC) (1999-2003) and President and Board member of the |
| National Securities Clearing Corporation (NSCC) (1999-2003). In addi- |
| tion, Mr. Dirks served as Chief Executive Officer and Board member of |
| the Government Securities Clearing Corporation (2001-2003) and Chief |
| Executive Officer and Board member of the Mortgage-Backed Securities |
| Clearing Corporation (2001-2003). Mr. Dirks also serves as a Trustee of |
| Manhattan College (2005-present). |
| |
| Robert M. Gates (62) |
| |
| Year of Election or Appointment: 1997 |
| Dr. Gates is Vice Chairman of the Independent Trustees (2005-present). |
| Dr. Gates is President of Texas A&M University (2002-present). He was |
| Director of the Central Intelligence Agency (CIA) from 1991 to 1993. |
| From 1989 to 1991, Dr. Gates served as Assistant to the President of |
| the United States and Deputy National Security Advisor. Dr. Gates is a |
| Director of NACCO Industries, Inc. (mining and manufacturing), Parker |
| Drilling Co., Inc. (drilling and rental tools for the energy industry, |
| 2001-present), and Brinker International (restaurant management, |
| 2003-present). Previously, Dr. Gates served as a Director of LucasVarity |
| PLC (automotive components and diesel engines), a Director of TRW Inc. |
| (automotive, space, defense, and information technology), and Dean of |
| the George Bush School of Government and Public Service at Texas |
| A&M University (1999-2001). Dr. Gates also is a Trustee of the Forum |
| for International Policy. |
Annual Report 44
| Name, Age; Principal Occupation |
| |
| George H. Heilmeier (69) |
| |
| Year of Election or Appointment: 2004 |
| Dr. Heilmeier is Chairman Emeritus of Telcordia Technologies (commu- |
| nication software and systems), where prior to his retirement, he served |
| as company Chairman and Chief Executive Officer. He currently serves |
| on the Boards of Directors of The Mitre Corporation (systems engineer- |
| ing and information technology support for the government), and HRL |
| Laboratories (private research and development, 2004-present). He is |
| Chairman of the General Motors Science & Technology Advisory Board |
| and a Life Fellow of the Institute of Electrical and Electronics Engineers |
| (IEEE) (2000-present). Dr. Heilmeier is a member of the Defense Science |
| Board and the National Security Agency Advisory Board. He is also a |
| member of the National Academy of Engineering, the American Aca- |
| demy of Arts and Sciences, and the Board of Overseers of the School of |
| Engineering and Applied Science of the University of Pennsylvania. Pre- |
| viously, Dr. Heilmeier served as a Director of TRW Inc. (automotive, |
| space, defense, and information technology, 1992-2002), Compaq |
| (1994-2002), Automatic Data Processing, Inc. (ADP) (technology-based |
| business outsourcing, 1995-2002), INET Technologies Inc. (telecommu- |
| nications network surveillance, 2001-2004), and Teletech Holdings (cus- |
| tomer management services). He is the recipient of the 2005 Kyoto Prize |
| in Advanced Technology for his invention of the liquid display. |
| |
| Marie L. Knowles (59) |
| |
| Year of Election or Appointment: 2001 |
| Prior to Ms. Knowles’ retirement in June 2000, she served as Executive |
| Vice President and Chief Financial Officer of Atlantic Richfield Company |
| (ARCO) (diversified energy, 1996-2000). From 1993 to 1996, she was |
| a Senior Vice President of ARCO and President of ARCO Transportation |
| Company. She served as a Director of ARCO from 1996 to 1998. She |
| currently serves as a Director of Phelps Dodge Corporation (copper |
| mining and manufacturing) and McKesson Corporation (healthcare ser- |
| vice, 2002-present). Ms. Knowles is a Trustee of the Brookings Institution |
| and the Catalina Island Conservancy and also serves as a member of |
| the Advisory Board for the School of Engineering of the University of |
| Southern California. |
45 Annual Report
Trustees and Officers - continued
| Name, Age; Principal Occupation |
| |
| Ned C. Lautenbach (61) |
| |
| Year of Election or Appointment: 2000 |
| Mr. Lautenbach has been a partner of Clayton, Dubilier & Rice, Inc. |
| (private equity investment firm) since September 1998. Previously, Mr. |
| Lautenbach was with the International Business Machines Corporation |
| (IBM) from 1968 until his retirement in 1998. Mr. Lautenbach serves as |
| a Director of Italtel Holding S.p.A. (telecommunications (Milan, Italy), |
| 2004-present) and Eaton Corporation (diversified industrial) as well as |
| the Philharmonic Center for the Arts in Naples, Florida. He also is a |
| member of the Board of Trustees of Fairfield University (2005-present), |
| as well as a member of the Council on Foreign Relations. |
| |
| Marvin L. Mann (72) |
| |
| Year of Election or Appointment: 1993 |
| Mr. Mann is Chairman of the Independent Trustees (2001-present). He is |
| Chairman Emeritus of Lexmark International, Inc. (computer |
| peripherals), where he served as CEO until April 1998, retired as |
| Chairman May 1999, and remains a member of the Board. Prior to |
| 1991, he held the positions of Vice President of International Business |
| Machines Corporation (IBM) and President and General Manager of |
| various IBM divisions and subsidiaries. He is a member of the Executive |
| Committee of the Independent Director’s Council of the Investment Com- |
| pany Institute. In addition, Mr. Mann is a member of the President’s |
| Cabinet at the University of Alabama and the Board of Visitors of the |
| Culverhouse College of Commerce and Business Administration at the |
| University of Alabama. |
| |
| William O. McCoy (72) |
| |
| Year of Election or Appointment: 1997 |
| Prior to his retirement in December 1994, Mr. McCoy was Vice Chair- |
| man of the Board of BellSouth Corporation (telecommunications) and |
| President of BellSouth Enterprises. He is currently a Director of Liberty |
| Corporation (holding company), Duke Realty Corporation (real estate), |
| and Progress Energy, Inc. (electric utility). He is also a partner of Frank- |
| lin Street Partners (private investment management firm) and a member |
| of the Research Triangle Foundation Board. In addition, Mr. McCoy |
| served as the Interim Chancellor (1999-2000) and a member of the |
| Board of Visitors for the University of North Carolina at Chapel Hill and |
| currently serves on the Board of Directors of the University of North |
| Carolina Health Care System and the Board of Visitors of the Kenan- |
| Flagler Business School (University of North Carolina at Chapel Hill). He |
| also served as Vice President of Finance for the University of North Car- |
| olina (16-school system). |
Annual Report 46
| Name, Age; Principal Occupation |
| |
| Cornelia M. Small (61) |
| |
| Year of Election or Appointment: 2005 |
| Ms. Small is a member (2000-present) and Chairperson (2002-present) |
| of the Investment Committee, and a member (2002-present) of the |
| Board of Trustees of Smith College. Previously, she served as Chief In- |
| vestment Officer (1999-2000), Director of Global Equity Investments |
| (1996-1999), and a member of the Board of Directors of Scudder, |
| Stevens & Clark (1990-1997) and Scudder Kemper Investments |
| (1997-1998). In addition, Ms. Small served as Co-Chair (2000-2003) |
| of the Annual Fund for the Fletcher School of Law and Diplomacy. |
| |
| William S. Stavropoulos (66) |
| |
| Year of Election or Appointment: 2001 |
| Mr. Stavropoulos is Chairman of the Board (2000-present) and a Mem- |
| ber of the Board of Directors of The Dow Chemical Company. Since |
| joining The Dow Chemical Company in 1967, Mr. Stavropoulos served |
| in numerous senior management positions, including President |
| (1993-2000; 2002-2003), CEO (1995-2000; 2002-2004), and Chair- |
| man of the Executive Committee (2000-2004). Currently, he is a Direc- |
| tor of NCR Corporation (data warehousing and technology solutions), |
| BellSouth Corporation (telecommunications), Chemical Financial Corpo- |
| ration, Maersk Inc. (industrial conglomerate, 2002-present), and Metal- |
| mark Capital (private equity investment firm, 2005-present). He also |
| serves as a member of the Board of Trustees of the American Enterprise |
| Institute for Public Policy Research. In addition, Mr. Stavropoulos is a |
| member of The Business Council, J.P. Morgan International Council and |
| the University of Notre Dame Advisory Council for the College of |
| Science. |
| |
| Kenneth L. Wolfe (66) |
| |
| Year of Election or Appointment: 2005 |
| Mr. Wolfe also serves as a Trustee (2005-present) or Member of the |
| Advisory Board (2004-present) of other investment companies advised |
| by FMR. Prior to his retirement in 2001, Mr. Wolfe was Chairman and |
| Chief Executive Officer of Hershey Foods Corporation (1993-2001). He |
| currently serves as a member of the boards of Adelphia Communica- |
| tions Corporation (2003-present), Bausch & Lomb, Inc., and Revlon Inc. |
| (2004-present). |
47 Annual Report
Trustees and Officers - continued
Advisory Board Members and Executive Officers:
Correspondence intended for Mr. Gamper may be sent to Fidelity Investments, P.O. Box 55235, Boston, Massachusetts 02205-5235. Correspondence intended for each executive officer and Mr. Lynch may be sent to Fidelity Investments, 82 Devonshire Street, Boston, Massachusetts 02109.
| Name, Age; Principal Occupation |
| |
| Albert R. Gamper, Jr. (63) |
| |
| Year of Election or Appointment: 2005 |
| Member of the Advisory Board of Fidelity Advisor Series VIII. Prior to his |
| retirement in December 2004, Mr. Gamper served as Chairman of the |
| Board of CIT Group Inc. (commercial finance). During his tenure with |
| CIT Group Inc. Mr. Gamper served in numerous senior management |
| positions, including Chairman (1987-1989; 1999-2001; 2002-2004), |
| Chief Executive Officer (1987-2004), and President (1989-2002). He |
| currently serves as a member of the Board of Directors of Public Service |
| Enterprise Group (utilities, 2001-present), Chairman of the Board of |
| Governors, Rutgers University (2004-present), and Chairman of the |
| Board of Saint Barnabas Health Care System. |
| |
| Peter S. Lynch (61) |
| |
| Year of Election or Appointment: 2003 |
| Member of the Advisory Board of Fidelity Advisor Series VIII. Vice |
| Chairman and a Director of FMR, and Vice Chairman (2001-present) |
| and a Director (2000-present) of FMR Co., Inc. Previously, Mr. Lynch |
| served as a Trustee of the Fidelity funds (1990-2003). In addition, he |
| serves as a Trustee of Boston College, Massachusetts Eye & Ear Infir- |
| mary, Historic Deerfield, John F. Kennedy Library, and the Museum of |
| Fine Arts of Boston. |
| |
| Dwight D. Churchill (51) |
| |
| Year of Election or Appointment: 2005 |
| Vice President of Advisor Diversified International. Mr. Churchill also |
| serves as Vice President of certain Equity Funds (2005-present) and |
| certain High Income Funds (2005-present). Previously, he served as |
| Head of Fidelity’s Fixed-Income Division (2000-2005), Vice President of |
| Fidelity’s Money Market Funds (2000-2005), Vice President of Fidelity’s |
| Bond Funds, and Senior Vice President of FIMM (2000) and FMR. Mr. |
| Churchill joined Fidelity in 1993 as Vice President and Group Leader of |
| Taxable Fixed-Income Investments. |
| |
| Penelope A. Dobkin (51) |
| |
| Year of Election or Appointment: 2004 |
| Vice President of Advisor Diversified International. Prior to assuming her |
| current responsibilities, Ms. Dobkin managed a variety of Fidelity funds. |
| Ms. Dobkin also serves as Vice President of FMR and FMR Co., Inc. |
Annual Report 48
| Name, Age; Principal Occupation |
| |
| Eric D. Roiter (56) |
| |
| Year of Election or Appointment: 1998 |
| Secretary of Advisor Diversified International. He also serves as Secre- |
| tary of other Fidelity funds; Vice President, General Counsel, and Secre- |
| tary of FMR Co., Inc. (2001-present) and FMR; Assistant Secretary of |
| Fidelity Management & Research (U.K.) Inc. (2001-present), Fidelity |
| Management & Research (Far East) Inc. (2001-present), and Fidelity |
| Investments Money Management, Inc. (2001-present). Mr. Roiter is an |
| Adjunct Member, Faculty of Law, at Boston College Law School |
| (2003-present). Previously, Mr. Roiter served as Vice President and |
| Secretary of Fidelity Distributors Corporation (FDC) (1998-2005). |
| |
| Stuart Fross (46) |
| |
| Year of Election or Appointment: 2003 |
| Assistant Secretary of Advisor Diversified International. Mr. Fross also |
| serves as Assistant Secretary of other Fidelity funds (2003-present), Vice |
| President and Secretary of FDC (2005-present), and is an employee of |
| FMR. |
| |
| Christine Reynolds (47) |
| |
| Year of Election or Appointment: 2004 |
| President, Treasurer, and Anti-Money Laundering (AML) officer of Advi- |
| sor Diversified International. Ms. Reynolds also serves as President, Trea- |
| surer, and AML officer of other Fidelity funds (2004) and is a Vice |
| President (2003) and an employee (2002) of FMR. Before joining |
| Fidelity Investments, Ms. Reynolds worked at PricewaterhouseCoopers |
| LLP (PwC) (1980-2002), where she was most recently an audit partner |
| with PwC’s investment management practice. |
| |
| Paul M. Murphy (58) |
| |
| Year of Election or Appointment: 2005 |
| Chief Financial Officer of Advisor Diversified International. Mr. Murphy |
| also serves as Chief Financial Officer of other Fidelity funds |
| (2005-present). He also serves as Senior Vice President of Fidelity Pric- |
| ing and Cash Management Services Group (FPCMS). |
| |
| Kenneth A. Rathgeber (58) |
| |
| Year of Election or Appointment: 2004 |
| Chief Compliance Officer of Advisor Diversified International. Mr. Rath- |
| geber also serves as Chief Compliance Officer of other Fidelity funds |
| (2004) and Executive Vice President of Risk Oversight for Fidelity Invest- |
| ments (2002). Previously, he served as Executive Vice President and |
| Chief Operating Officer for Fidelity Investments Institutional Services |
| Company, Inc. (1998-2002). |
49 Annual Report
Trustees and Officers - continued
| Name, Age; Principal Occupation |
| |
| John R. Hebble (47) |
| |
| Year of Election or Appointment: 2003 |
| Deputy Treasurer of Advisor Diversified International. Mr. Hebble also |
| serves as Deputy Treasurer of other Fidelity funds (2003), and is an |
| employee of FMR. Before joining Fidelity Investments, Mr. Hebble |
| worked at Deutsche Asset Management where he served as Director of |
| Fund Accounting (2002-2003) and Assistant Treasurer of the Scudder |
| Funds (1998-2003). |
| |
| Bryan A. Mehrmann (44) |
| |
| Year of Election or Appointment: 2005 |
| Deputy Treasurer of Advisor Diversified International. Mr. Mehrmann |
| also serves as Deputy Treasurer of other Fidelity funds (2005-present) |
| and is an employee of FMR. Previously, Mr. Mehrmann served as Vice |
| President of Fidelity Investments Institutional Services Group (FIIS)/ |
| Fidelity Investments Institutional Operations Corporation, Inc. (FIIOC) |
| Client Services (1998-2004). |
| |
| Kimberley H. Monasterio (41) |
| |
| Year of Election or Appointment: 2004 |
| Deputy Treasurer of Advisor Diversified International. Ms. Monasterio |
| also serves as Deputy Treasurer of other Fidelity funds (2004) and is an |
| employee of FMR (2004). Before joining Fidelity Investments, Ms. |
| Monasterio served as Treasurer (2000-2004) and Chief Financial Offi- |
| cer (2002-2004) of the Franklin Templeton Funds and Senior Vice Presi- |
| dent of Franklin Templeton Services, LLC (2000-2004). |
| |
| Kenneth B. Robins (36) |
| |
| Year of Election or Appointment: 2005 |
| Deputy Treasurer of Advisor Diversified International. Mr. Robins also |
| serves as Deputy Treasurer of other Fidelity funds (2005-present) and is |
| an employee of FMR (2004-present). Before joining Fidelity Investments, |
| Mr. Robins worked at KPMG LLP, where he was a partner in KPMG’s |
| department of professional practice (2002-2004) and a Senior |
| Manager (1999-2000). In addition, Mr. Robins served as Assistant |
| Chief Accountant, United States Securities and Exchange Commission |
| (2000-2002). |
Annual Report 50
| Name, Age; Principal Occupation |
| |
| Robert G. Byrnes (38) |
| |
| Year of Election or Appointment: 2005 |
| Assistant Treasurer of Advisor Diversified International. Mr. Byrnes also |
| serves as Assistant Treasurer of other Fidelity funds (2005-present) and |
| is an employee of FMR (2005-present). Previously, Mr. Byrnes served as |
| Vice President of FPCMS (2003-2005). Before joining Fidelity Invest- |
| ments, Mr. Byrnes worked at Deutsche Asset Management where he |
| served as Vice President of the Investment Operations Group |
| (2000-2003). |
| |
| John H. Costello (59) |
| |
| Year of Election or Appointment: 1998 |
| Assistant Treasurer of Advisor Diversified International. Mr. Costello also |
| serves as Assistant Treasurer of other Fidelity funds and is an employee |
| of FMR. |
| |
| Peter L. Lydecker (51) |
| |
| Year of Election or Appointment: 2004 |
| Assistant Treasurer of Advisor Diversified International. Mr. Lydecker |
| also serves as Assistant Treasurer of other Fidelity funds (2004) and is |
| an employee of FMR. |
| |
| Mark Osterheld (50) |
| |
| Year of Election or Appointment: 2002 |
| Assistant Treasurer of Advisor Diversified International. Mr. Osterheld |
| also serves as Assistant Treasurer of other Fidelity funds (2002) and is |
| an employee of FMR. |
| |
| Gary W. Ryan (47) |
| |
| Year of Election or Appointment: 2005 |
| Assistant Treasurer of Advisor Diversified International. Mr. Ryan also |
| serves as Assistant Treasurer of other Fidelity funds (2005-present) and |
| is an employee of FMR (2005-present). Previously, Mr. Ryan served as |
| Vice President of Fund Reporting in FPCMS (1999-2005). |
| |
| Salvatore Schiavone (39) |
| |
| Year of Election or Appointment: 2005 |
| Assistant Treasurer of Advisor Diversified International. Mr. Schiavone |
| also serves as Assistant Treasurer of other Fidelity funds (2005-present) |
| and is an employee of FMR (2005-present). Before joining Fidelity In- |
| vestments, Mr. Schiavone worked at Deutsche Asset Management, |
| where he most recently served as Assistant Treasurer (2003-2005) of |
| the Scudder Funds and Vice President and Head of Fund Reporting |
| (1996-2003). |
51 Annual Report
The Board of Trustees of Advisor Diversified International Fund voted to pay to shareholders of record at the opening of business on record date, the following distributions per share derived from capital gains realized from sales of portfolio securities, and dividends derived from net investment income:
| | | Pay Date | | Record Date | | Dividends | | Capital Gains |
| Class A | | 12/12/05 | | 12/09/05 | | $.144 | | $.950 |
| Class T | | 12/12/05 | | 12/09/05 | | $.137 | | $.950 |
| Class B | | 12/12/05 | | 12/09/05 | | $.079 | | $.950 |
| Class C | | 12/12/05 | | 12/09/05 | | $.082 | | $.950 |
The fund hereby designates as capital gain dividends: For dividends with respect to the taxable year ended October 31, 2005, $315,626,993, or, if subsequently determined to be different, the net capital gain of such year, and for dividends with respect to the taxable year ended October 31, 2004, $11,119,861, or, if subsequently determined to be different, the excess of: (a) the net capital gain of such year, over (b) amounts previously designated as capital gain dividends with respect to such year.
Class A, Class T, Class B and Class C designates 100% of the dividend distributed during the fiscal year as amounts which may be taken into account as a dividend for purposes of the maximum rate under section 1(h)(11) of the Internal Revenue Code.
The amounts per share which represent income derived from sources within, and taxes paid to, foreign countries or possessions of the United States are as follows:
| | | Pay Date | | Income | | Taxes |
| Class A | | 12/13/04 | | $.106 | | $.016 |
| Class T | | 12/13/04 | | $.056 | | $.016 |
| Class B | | 12/13/04 | | — | | — |
| Class C | | 12/13/04 | | — | | — |
The fund will notify shareholders in January 2006 of amounts for use in preparing 2005 income tax returns.
Board Approval of Investment Advisory Contracts and Management Fees
Advisor Diversified International Fund
Each year, typically in July, the Board of Trustees, including the independent Trustees (together, the Board), votes on the renewal of the management contract and sub-advisory agreements (together, the Advisory Contracts) for the fund. The Board, assisted by the advice of fund counsel and independent Trustees’ counsel, requests and considers a broad range of information throughout the year.
The Board meets regularly each month except August and takes into account throughout the year matters bearing on Advisory Contracts. The Board, acting directly and through its separate committees, considers at each of its meetings factors that are relevant to the annual renewal of the fund’s Advisory Contracts, including the services and support provided to the fund and its shareholders by Fidelity. At the time of the renewal, the Board had 11 standing committees, each composed of independent Trustees with varying backgrounds, to which the Board has assigned specific subject matter responsibilities in order to enhance effective decision-making by the Board. Each committee has adopted a written charter outlining the structure and purposes of the committee. One such committee, the Equity Contract Committee, meets periodically during the first six months of each year and as necessary to consider matters specifically related to the annual renewal of Advisory Contracts. The committee requests and receives information on, and makes recommendations to the independent Trustees concerning, the approval and annual review of the Advisory Contracts.
At its July 2005 meeting, the Board of Trustees, including the independent Trustees, unanimously determined to renew the Advisory Contracts for the fund. In reaching its determination, the Board considered all factors it believed relevant, including (1) the nature, extent, and quality of the services to be provided to the fund and its shareholders by Fidelity (including the investment performance of the fund); (2) the competitiveness of the management fee and total expenses of the fund; (3) the total costs of the services to be provided by and the profits to be realized by the investment adviser and its affiliates from the relationship with the fund; (4) the extent to which economies of scale would be realized as the fund grows; and (5) whether fee levels reflect these economies of scale, if any, for the benefit of fund shareholders.
In determining whether to renew the Advisory Contracts for the fund, the Board ultimately reached a determination, with the assistance of fund counsel and independent Trustees’ counsel, that the renewal of the Advisory Contracts and the compensation to be received by Fidelity under the management contract is consistent with Fidelity’s fiduciary duty under applicable law. In addition to evaluating the specific factors noted above, the Board, in reaching its determination, is aware that shareholders in the fund have a broad range of investment choices available to them, including a wide choice among mutual funds offered by competitors to Fidelity, and that the fund’s shareholders, with the opportunity to review and weigh the disclosure provided by the fund in its
53 Annual Report
Board Approval of Investment Advisory Contracts and Management Fees - continued
prospectus and other public disclosures, have chosen to invest in this fund, managed by Fidelity.
Nature, Extent, and Quality of Services Provided by Fidelity. The Board considered staffing within the investment adviser, FMR, and the sub-advisers (together, the Investment Advisers), including the background of the fund’s portfolio manager and the fund’s investment objective and discipline. The independent Trustees also had discussions with senior management of Fidelity’s investment operations and investment groups. The Board considered the structure of the portfolio manager compensation program and whether this structure provides appropriate incentives.
Fidelity Resources Dedicated to Investment Management and Support Services. The Board reviewed the size, education, and experience of the Investment Advisers’ investment staff, their use of technology, and the Investment Advisers’ approach to recruiting, training, and retaining portfolio managers and other research, advisory, and management personnel. The Board considered Fidelity’s extensive global research capabilities that enable the Investment Advisers to aggregate data from various sources in an effort to produce positive investment results. The Board noted that Fidelity’s analysts have access to a variety of technological tools that enable them to perform both fundamental and quantitative analysis and to specialize in various disciplines. The Board also considered that Fidelity’s portfolio managers and analysts have access to daily portfolio attribution that allows for monitoring of a fund’s portfolio, as well as an electronic communication system that provides immediate real-time access to research concerning issuers and credit enhancers.
Shareholder and Administrative Services. The Board considered the nature, extent, quality, and cost of administrative, distribution, and shareholder services performed by the Investment Advisers and their affiliates under the Advisory Contracts and under separate agreements covering transfer agency, pricing and bookkeeping, and securities lending services for the fund. The Board also considered the nature and extent of the Investment Advisers’ supervision of third party service providers, principally custodians and subcustodians. The Board reviewed the allocation of fund brokerage, including allocations to brokers affiliated with the Investment Advisers, the use of brokerage commissions to pay fund expenses, and the use of “soft” commission dollars to pay for research services. The Board also considered that Fidelity voluntarily decided in 2004 to stop using “soft” commission dollars to pay for market data and, instead, to pay for that data out of its own resources. The Board also considered the resources devoted to, and the record of compliance with, the fund’s compliance policies and procedures.
The Board noted that the growth of fund assets across the complex allows Fidelity to reinvest in the development of services designed to enhance the value or convenience of the Fidelity funds as investment vehicles. These services include 24-hour access to
account information and market information through phone representatives and over the Internet, and investor education materials and asset allocation tools.
Investment in a Large Fund Family. The Board considered the benefits to shareholders of investing in a Fidelity fund, including the benefits of investing in a fund that is part of a large family of funds offering a variety of investment disciplines and providing for a large variety of mutual fund investor services. For example, fund shareholders are offered the privilege of exchanging shares of the fund for shares of other Fidelity funds, as set forth in the fund’s prospectus, without paying an additional sales charge. The Board noted that, since the last Advisory Contract renewals in July 2004, Fidelity has taken a number of actions that benefited particular funds, including (i) voluntarily deciding in 2004 to stop using “soft” commission dollars to pay for market data and, instead, to pay for that data out of its own resources, (ii) contractually agreeing to impose management fee reductions and expense limitations on its five Spartan stock index funds and its stock index fund available through variable insurance products, (iii) contractually agreeing to eliminate the management fees on the Fidelity Freedom Funds and the Fidelity Advisor Freedom Funds, (iv) contractually agreeing to reduce the management fees on most of its investment-grade taxable bond funds, and (v) contractually agreeing to impose expense limitations on its retail and Spartan investment-grade taxable bond funds.
Investment Performance and Compliance. The Board considered whether the fund has operated within its investment objective, as well as its record of compliance with its investment restrictions. It also reviewed the fund’s absolute investment performance for each class, as well as the fund’s relative investment performance for each class measured against (i) a broad-based securities market index, and (ii) a peer group of mutual funds deemed appropriate by the Board over multiple periods. The following charts considered by the Board show, over the one-, three-, and five-year periods ended December 31, 2004, the returns of Class C and Institutional Class of the fund, the returns of a broad-based securities market index (“benchmark”), and a range of returns of a peer group of mutual funds identified by Lipper Inc. as having an investment objective similar to that of the fund. The returns of Class C and Institutional Class represent the performance of classes with the highest and lowest 12b-1 fees, respectively (not necessarily with the highest and lowest total expenses). The box within each chart shows the 25th percentile return (bottom of box) and the 75th percentile return (top of box) of the Lipper peer group. Returns shown above the box are in the first quartile and returns shown below the box are in the fourth quartile. The percentage beaten numbers noted below each chart correspond to the percentile box and represent the percentage of funds in the Lipper peer group whose performance was equal to or lower than that of the class indicated.
55 Annual Report
Board Approval of Investment Advisory Contracts and Management Fees - continued

The Board reviewed the fund’s relative investment performance against its Lipper peer group and stated that the performance of Institutional Class of the fund was in the second quartile for the one-year period and the first quartile for the three- and five-year periods. The Board also stated that the relative investment performance of Institutional Class of the fund has compared favorably to its benchmark over time, although the fund’s one-year cumulative total return was lower than its benchmark. The Board considered that the variations in performance among the fund’s classes reflect the variations in class expenses, which result in lower performance for higher expense classes.
The Board has had thorough discussions with FMR throughout the year about the Board’s and FMR’s concerns about equity research, equity fund performance, and compliance with internal policies governing gifts and entertainment. FMR has taken steps that it believes will refocus and strengthen equity research and equity portfolio management and compliance. The Board noted with favor FMR’s recent reorganization of its senior management team and FMR’s plans to dedicate additional resources to investment research, and participated in the process that led to those changes.
Based on its review, and giving particular weight to the nature and quality of the resources dedicated by the Investment Advisers to maintain and improve relative performance, the Board concluded that the nature, extent, and quality of the services provided by Fidelity will benefit the fund’s shareholders, particularly in light of the Board’s view that the fund’s shareholders benefit from investing in a fund that is part of a large family of funds offering a variety of investment disciplines and services.
Competitiveness of Management Fee and Total Fund Expenses. The Board considered the fund’s management fee and total expenses compared to “mapped groups”
of competitive funds and classes. Fidelity creates “mapped groups” by combining similar Lipper investment objective categories that have comparable management fee characteristics. Combining Lipper investment objective categories aids the Board’s management fee and total expense comparisons by broadening the competitive group used for comparison and by reducing the number of universes to which various Fidelity funds are compared.
The Board considered two proprietary management fee comparisons for the 12-month periods shown in the chart below. The group of Lipper funds used by the Board for management fee comparisons is referred to below as the “Total Mapped Group” and, for the reasons explained above, is broader than the Lipper peer group used by the Board for performance comparisons. The Total Mapped Group comparison focuses on a fund’s standing relative to the total universe of comparable funds available to investors, in terms of gross management fees before expense reimbursements or caps. “TMG %” represents the percentage of funds in the Total Mapped Group that had management fees that were lower than the fund’s. For example, a TMG % of 21% means that 79% of the funds in the Total Mapped Group had higher management fees than the fund. The “Asset-Size Peer Group” (ASPG) comparison focuses on a fund’s standing relative to non-Fidelity funds similar in size to the fund within the Total Mapped Group. The ASPG represents at least 15% of the funds in the Total Mapped Group with comparable asset size and management fee characteristics, subject to a minimum of 50 funds (or all funds in the Total Mapped Group if fewer than 50). Additional information, such as the ASPG quartile (“quadrant”) in which the fund’s management fee ranked, is also included in the chart and considered by the Board.
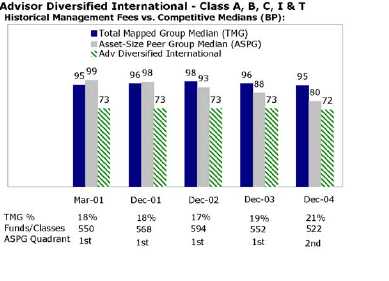
57 Annual Report
Board Approval of Investment Advisory Contracts and Management Fees - continued
The Board noted that the fund’s management fee ranked below the median of its Total Mapped Group and below the median of its ASPG for 2004.
Based on its review, the Board concluded that the fund’s management fee was fair and reasonable in light of the services that the fund receives and the other factors considered.
In its review of each class’s total expenses, the Board considered the fund’s management fee as well as other fund or class expenses, as applicable, such as transfer agent fees, pricing and bookkeeping fees, fund-paid 12b-1 fees, and custodial, legal, and audit fees. The Board also noted the effects of any waivers and reimbursements on fees and expenses. As part of its review, the Board also considered current and historical total expenses of each class of the fund compared to competitive fund median expenses. Each class of the fund is compared to those funds and classes in the Total Mapped Group (used by the Board for management fee comparisons) that have a similar sales load structure.
The Board noted that each class’s total expenses ranked below its competitive median for 2004.
In its review of total expenses, the Board also considered Fidelity fee structures and other information on clients that FMR and its affiliates service in other competitive markets, such as other mutual funds advised or subadvised by FMR or its affiliates, pension plan clients, and other institutional clients.
Based on its review, the Board concluded that the total expenses for each class of the fund were reasonable in light of the services that the fund and its shareholders receive and the other factors considered.
Costs of the Services and Profitability. The Board considered the revenues earned and the expenses incurred by Fidelity in conducting the business of developing, marketing, distributing, managing, administering and servicing the fund and its shareholders. The Board also considered the level of Fidelity’s profits in respect of all the Fidelity funds.
On an annual basis, FMR presents to the Board Fidelity’s profitability for the fund. Fidelity calculates the profitability for each fund, as well as aggregate profitability for groups of Fidelity funds and all Fidelity funds, using a series of detailed revenue and cost allocation methodologies which originate with the audited books and records of Fidelity. The Audit Committee of the Board reviews any significant changes from the prior year’s methodologies.
PricewaterhouseCoopers LLP (PwC), independent registered accounting firm and auditor to Fidelity and certain Fidelity funds, has been engaged annually by the Board as part of the Board’s assessment of the results of Fidelity’s profitability analysis. PwC’s
engagement includes the review and assessment of Fidelity’s methodologies used in determining the revenues and expenses attributable to Fidelity’s mutual fund business, and completion of agreed-upon procedures surrounding the mathematical accuracy of fund profitability and its conformity to allocation methodologies. After considering PwC’s reports issued under the engagement and information provided by Fidelity, the Board believes that while other allocation methods may also be reasonable, Fidelity’s profitability methodologies are reasonable in all material respects.
The Board has also reviewed Fidelity’s non-fund businesses and any fall-out benefits related to the mutual fund business as well as cases where Fidelity’s affiliates may benefit from or be related to the fund’s business. In addition, a special committee of the Board reviewed services provided to Fidelity by its affiliates and determined that the fees that Fidelity paid for such services were reasonable.
The Board considered the costs of the services provided by and the profits realized by Fidelity in connection with the operation of the fund and determined that the amount of profit is a fair entrepreneurial profit for the management of the fund.
Economies of Scale. The Board considered whether there have been economies of scale in respect of the management of the Fidelity funds, whether the Fidelity funds (including the fund) have appropriately benefited from any such economies of scale, and whether there is potential for realization of any further economies of scale. The Board considered the extent to which the fund will benefit from economies of scale through increased services to the fund, through waivers or reimbursements, or through fee or expense reductions, including reductions that occur through operation of the transfer agent agreement. The transfer agent fee varies in part based on the number of accounts in the fund. If the number of accounts decreases or the average account size increases, the overall transfer agent fee rate decreases.
The Board recognized that the fund’s management contract incorporates a “group fee” structure, which provides for lower fee rates as total fund assets under FMR’s management increase, and for higher fee rates as total fund assets under FMR’s management decrease. The Board considered that the group fee is designed to deliver the benefits of economies of scale to fund shareholders when total fund assets increase, even if assets of any particular fund are unchanged or have declined, because some portion of Fidelity’s costs are attributable to services provided to all Fidelity funds, and all funds benefit if those costs can be allocated among more assets. The Board concluded that, given the group fee structure, fund shareholders will achieve a certain level of economies of scale as assets under FMR’s management increase at the fund complex level, regardless of whether Fidelity achieves any such economies of scale.
The Board further concluded that any potential economies of scale are being shared between fund shareholders and Fidelity in an appropriate manner.
59 Annual Report
Board Approval of Investment Advisory Contracts and Management Fees - continued
Additional Information Requested by the Board. In order to develop fully the factual basis for consideration of the Advisory Contracts, the Board requested additional information regarding (i) equity fund transfer agency fees; (ii) Fidelity’s fund profitability methodology and the impact of various changes in the methodology over time; (iii) benefits to shareholders from economies of scale; (iv) composition and characteristics of various fund and industry data used in comparisons; and (v) compensation of portfolio managers and research analysts.
Based on its evaluation of all of the conclusions noted above, and after considering all material factors, the Board ultimately concluded that the existing advisory fee structures are fair and reasonable, and that the fund’s existing Advisory Contracts should be renewed.
61 Annual Report
Investment Adviser
Fidelity Management & Research Company
Boston, MA
Investment Sub-Advisers
FMR Co., Inc.
Fidelity Management & Research
(U.K.) Inc.
Fidelity Management & Research
(Far East) Inc.
Fidelity International
Investment Advisors
Fidelity Investments Japan Limited
Fidelity International Investment
Advisors (U.K.) Limited
General Distributor
Fidelity Distributors Corporation
Boston, MA
Transfer and Service Agents
Fidelity Investments Institutional
Operations Company, Inc.
Boston, MA
Fidelity Service Company, Inc.
Boston, MA
Custodian
State Street Bank and Trust Company
Quincy, MA
|


Fidelity® Advisor
Diversified International
Fund - Institutional Class
Annual Report October 31, 2005

| Contents | | | | |
| |
| Chairman’s Message | | 4 | | Ned Johnson’s message to shareholders. |
| Performance | | 6 | | How the fund has done over time. |
| Management’s Discussion | | 7 | | The manager’s review of fund |
| | | | | performance, strategy and outlook |
| Shareholder Expense | | 8 | | An example of shareholder expenses. |
| Example | | | | |
| Investment Changes | | 10 | | A summary of major shifts in the fund’s |
| | | | | investments over the past six months. |
| Investments | | 11 | | A complete list of the fund’s investments |
| | | | | with their market values. |
| Financial Statements | | 22 | | Statements of assets and liabilities, |
| | | | | operations, and changes in net assets, |
| | | | | as well as financial highlights. |
| Notes | | 31 | | Notes to the financial statements. |
| Report of Independent | | 40 | | |
| Registered Public | | | | |
| Accounting Firm | | | | |
| Trustees and Officers | | 41 | | |
| Distributions | | 51 | | |
| Board Approval of | | 52 | | |
| Investment Advisory | | | | |
| Contracts and | | | | |
| Management Fees | | | | |
To view a fund’s proxy voting guidelines and proxy voting record for the 12-month period ended June 30, visit www.fidelity.com/proxyvotingresults or visit the Securities and Exchange Commission’s (SEC) web site at www.sec.gov. You may also call 1-877-208-0098 to request a free copy of the proxy voting guidelines.
Standard & Poor’s, S&P and S&P 500 are registered service marks of The McGraw-Hill Companies, Inc. and have been licensed for use by Fidelity Distributors Corporation.
Other third party marks appearing herein are the property of their respective owners.
All other marks appearing herein are registered or unregistered trademarks or service marks of FMR Corp. or an affiliated company.
This report and the financial statements contained herein are submitted for the general information of the shareholders of the fund. This report is not authorized for distribution to prospective investors in the fund unless preceded or accompanied by an effective prospectus.
A fund files its complete schedule of portfolio holdings with the SEC for the first and third quarters of each fiscal year on Form N-Q. Forms N-Q are available on the SEC’s web site at http://www.sec.gov. A fund’s Forms N-Q may be reviewed and copied at the SEC’s Public Reference Room in Washington, DC. Information regarding the operation of the SEC’s Public Reference Room may be obtained by calling 1-800-SEC-0330. For a complete list of a fund’s portfolio holdings, view the most recent quarterly holdings report, semiannual report, or annual report on Fidelity’s web site at http://www.advisor.fidelity.com.
NOT FDIC INSURED · MAY LOSE VALUE · NO BANK GUARANTEE
Neither the fund nor Fidelity Distributors Corporation is a bank.
3 Annual Report
Chairman’s Message
(Photograph of Edward C. Johnson 3d)
Dear Shareholder:
During the past year or so, much has been reported about the mutual fund industry, and much of it has been more critical than I believe is warranted. Allegations that some companies have been less than forthright with their shareholders have cast a shadow on the entire industry. I continue to find these reports disturbing, and assert that they do not create an accurate picture of the industry overall. Therefore, I would like to remind everyone where Fidelity stands on these issues. I will say two things specifically regarding allegations that some mutual fund companies were in violation of the Securities and Exchange Commission’s forward pricing rules or were involved in so-called “market timing” activities.
First, Fidelity has no agreements that permit customers who buy fund shares after 4 p.m. to obtain the 4 p.m. price. This is not a new policy. This is not to say that someone could not deceive the company through fraudulent acts. However, we are extremely diligent in preventing fraud from occurring in this manner — and in every other. But I underscore again that Fidelity has no so-called “agreements” that sanction illegal practices.
Second, Fidelity continues to stand on record, as we have for years, in opposition to predatory short-term trading that adversely affects shareholders in a mutual fund. Back in the 1980s, we initiated a fee — which is returned to the fund and, therefore, to investors — to discourage this activity. Further, we took the lead several years ago in developing a Fair Value Pricing Policy to prevent market timing on foreign securities in our funds. I am confident we will find other ways to make it more difficult for predatory traders to operate. However, this will only be achieved through close cooperation among regulators, legislators and the industry.
Yes, there have been unfortunate instances of unethical and illegal activity within the mutual fund industry from time to time. That is true of any industry. When this occurs, confessed or convicted offenders should be dealt with appropriately. But we are still concerned about the risk of over-regulation and the quick application of simplistic solutions to intricate problems. Every system can be improved, and we support and applaud well thought out improvements by regulators, legislators and industry representatives that achieve the common goal of building and protecting the value of investors’ holdings.
For nearly 60 years, Fidelity has worked very hard to improve its products and service to justify your trust. When our family founded this company in 1946, we had only a few hundred customers. Today, we serve more than 18 million customers including individual investors and participants in retirement plans across America.
Annual Report 4
Let me close by saying that we do not take your trust in us for granted, and we realize that we must always work to improve all aspects of our service to you. In turn, we urge you to continue your active participation with your financial matters, so that your interests can be well served.
Best regards,
/s/Edward C. Johnson 3d
5 Annual Report
Performance: The Bottom Line
Average annual total return reflects the change in the value of an investment, assuming reinvestment of the class’ dividend income and capital gains (the profits earned upon the sale of securities that have grown in value) and assuming a constant rate of performance each year. The $10,000 table and the fund’s returns do not reflect the deduction of taxes that a shareholder would pay on fund distributions or the redemption of fund shares. During periods of reimbursement by Fidelity, a fund’s total return will be greater than it would be had the reimbursement not occurred. How a fund did yesterday is no guarantee of how it will do tomorrow.
| Average Annual Total Returns | | | | | | |
| Periods ended October 31, 2005 | | Past 1 | | Past 5 | | Life of |
| | | year | | years | | fundA |
| Institutional Class | | 20.81% | | 8.12% | | 12.09% |
| A From December 17, 1998. | | | | | | |
| |
| $10,000 Over Life of Fund | | | | | | |
Let’s say hypothetically that $10,000 was invested in Fidelity® Advisor Diversified International Fund — Institutional Class on December 17, 1998, when the fund started. The chart shows how the value of your investment would have changed, and also shows how the Morgan Stanley Capital InternationalSMEurope, Australia, Far East (MSCI® EAFE®) Index performed over the same period.
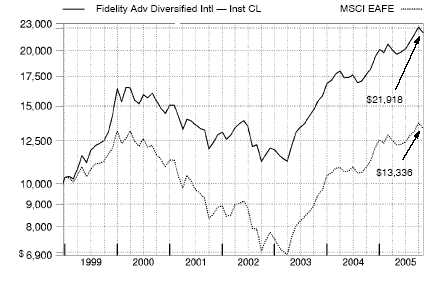
Annual Report 6
Management’s Discussion of Fund Performance
Comments from Penelope Dobkin, Portfolio Manager of Fidelity® Advisor Diversified International Fund
Foreign stock markets enjoyed broad-based advances during the 12 months ending Octo-ber 31, 2005, encouraged by better-than-expected corporate earnings and markedly improved economies. For the 12 months overall, the Morgan Stanley Capital InternationalSM Europe, Australasia, Far East (MSCI® EAFE®) Index — a performance measure of developed stock markets outside the United States and Canada — gained 18.28% . The Japanese stock market climbed to its highest level in more than four years. Positive economic indicators and Prime Minister Koizumi’s decisive election victory attracted record inflows from overseas investors. In response, the Tokyo Stock Exchange Stock Price Index (TOPIX) soared 22.89% . Southeast Asian equities outside of Japan, particularly South Korea, also responded well to the better macroeconomic environment, illustrated by the 19.44% return for the MSCI All Country Far East ex Japan index. European stock markets were up as well, despite investors’ concern about higher energy prices and potential downgrades to economic growth in the region. For the year overall, the MSCI Europe index rose 16.51% . Although robust, returns for U.S. investors in foreign markets were tempered by the strength of the dollar versus many major currencies.
During the past year, the fund’s Institutional Class shares were up 20.81%, outpacing the MSCI EAFE index and the LipperSM International Funds Average, which rose 17.75% . Favorable stock selection in banks and diversified financials contributed the most to the fund’s return relative to the index, with holdings in Japanese and emerging-markets banks among the best performers. Stocks in such key markets as Germany, which enjoyed a resurgence in real estate values and in corporate restructuring after 15 years of economic stagnation, also provided a boost to returns, as did Canadian energy stocks, which benefited from healthy production growth. Canadian energy company EnCana was the top contributor versus the index, joined by the strong performance of Brazilian bank Unibanco and State Bank of India. Favorable currency movements in emerging markets such as India and Brazil enhanced our returns in the latter two stocks. By contrast, Brazilian paper company Votorantim Celulose lagged due to a lack of pricing power amid rising energy costs, while demand hurt Japanese consumer electronics companies Ricoh and Victor Company. An underweighting in the materials sector also hurt relative performance, as several of the period’s top gainers from this group were absent from the portfolio.
The views expressed in this statement reflect those of the portfolio manager only through the end of the period of the report as stated on the cover and do not necessarily represent the views of Fidelity or any other person in the Fidelity organization. Any such views are subject to change at any time based upon market or other conditions and Fidelity disclaims any responsibility to update such views. These views may not be relied on as investment advice and, because investment decisions for a Fidelity fund are based on numerous factors, may not be relied on as an indication of trading intent on behalf of any Fidelity fund.
Shareholder Expense Example
As a shareholder of the Fund, you incur two types of costs: (1) transaction costs, including sales charges (loads) on purchase payments or redemption proceeds, redemption fees, and (2) ongoing costs, including management fees, distribution and/or service (12b-1) fees and other Fund expenses. This Example is intended to help you understand your ongoing costs (in dollars) of investing in the Fund and to compare these costs with the ongoing costs of investing in other mutual funds.
The Example is based on an investment of $1,000 invested at the beginning of the period and held for the entire period (May 1, 2005 to October 31, 2005).
The first line of the table below for each class of the Fund provides information about actual account values and actual expenses. You may use the information in this line, together with the amount you invested, to estimate the expenses that you paid over the period. Simply divide your account value by $1,000.00 (for example, an $8,600 account value divided by $1,000.00 = 8.6), then multiply the result by the number in the first line for a class of the Fund under the heading entitled “Expenses Paid During Period” to estimate the expenses you paid on your account during this period.
Hypothetical Example for Comparison Purposes
The second line of the table below for each class of the Fund provides information about hypothetical account values and hypothetical expenses based on a Class’ actual expense ratio and an assumed rate of return of 5% per year before expenses, which is not the Class’ actual return. The hypothetical account values and expenses may not be used to estimate the actual ending account balance or expenses you paid for the period. You may use this information to compare the ongoing costs of investing in the Fund and other funds. To do so, compare this 5% hypothetical example with the 5% hypothetical examples that appear in the shareholder reports of the other funds.
Please note that the expenses shown in the table are meant to highlight your ongoing costs only and do not reflect any transaction costs. Therefore, the second line of the table is useful in comparing ongoing costs only, and will not help you determine the relative total costs of owning different funds. In addition, if these transactional costs were included, your costs would have been higher.
| | | | | | | | | | | | | Expenses Paid |
| | | | | Beginning | | | | Ending | | | | During Period* |
| | | | | Account Value | | | | Account Value | | | | May 1, 2005 |
| | | | | May 1, 2005 | | | | October 31, 2005 | | to October 31, 2005 |
| Class A | | | | | | | | | | | | |
| Actual | | $ | | 1,000.00 | | $ | | 1,114.20 | | $ | | 6.77 |
| HypotheticalA | | $ | | 1,000.00 | | $ | | 1,018.80 | | $ | | 6.46 |
| Class T | | | | | | | | | | | | |
| Actual | | $ | | 1,000.00 | | $ | | 1,112.20 | | $ | | 7.99 |
| HypotheticalA | | $ | | 1,000.00 | | $ | | 1,017.64 | | $ | | 7.63 |
| Class B | | | | | | | | | | | | |
| Actual | | $ | | 1,000.00 | | $ | | 1,108.60 | | $ | | 11.43 |
| HypotheticalA | | $ | | 1,000.00 | | $ | | 1,014.37 | | $ | | 10.92 |
Annual Report 8
| | | | | | | | | | | | | Expenses Paid |
| | | | | Beginning | | | | Ending | | | | During Period* |
| | | | | Account Value | | | | Account Value | | | | May 1, 2005 |
| | | | | May 1, 2005 | | | | October 31, 2005 | | to October 31, 2005 |
| Class C | | | | | | | | | | | | |
| Actual | | $ | | 1,000.00 | | $ | | 1,109.50 | | $ | | 10.90 |
| HypotheticalA | | $ | | 1,000.00 | | $ | | 1,014.87 | | $ | | 10.41 |
| Institutional Class | | | | | | | | | | | | |
| Actual | | $ | | 1,000.00 | | $ | | 1,115.60 | | $ | | 5.12 |
| HypotheticalA | | $ | | 1,000.00 | | $ | | 1,020.37 | | $ | | 4.89 |
| |
| A 5% return per year before expenses | | | | | | | | |
* Expenses are equal to each Class’ annualized expense ratio (shown in the table below); multiplied by the average account value over the period, multiplied by 184/365 (to reflect the one-half year period).
| | | Annualized |
| | | Expense Ratio |
| Class A | | 1.27% |
| Class T | | 1.50% |
| Class B | | 2.15% |
| Class C | | 2.05% |
| Institutional Class | | 96% |
9 Annual Report
Investment Changes
| Top Five Stocks as of October 31, 2005 | | | | |
| | | % of fund’s | | % of fund’s net assets |
| | | net assets | | 6 months ago |
| Total SA (France, Oil, Gas & Consumable Fuels) | | 2.5 | | 2.5 |
| BP PLC sponsored ADR (United Kingdom, Oil, | | | | |
| Gas & Consumable Fuels) | | 2.2 | | 2.1 |
| Novartis AG sponsored ADR (Switzerland, | | | | |
| Pharmaceuticals) | | 2.1 | | 1.6 |
| Vodafone Group PLC sponsored ADR (United | | | | |
| Kingdom, Wireless Telecommunication | | | | |
| Services) | | 2.0 | | 2.3 |
| Allianz AG sponsored ADR (Germany, | | | | |
| Insurance) | | 1.8 | | 1.5 |
| | | 10.6 | | |
| Top Five Market Sectors as of October 31, 2005 | | |
| | | % of fund’s | | % of fund’s net assets |
| | | net assets | | 6 months ago |
| Financials | | 28.1 | | 22.9 |
| Industrials | | 12.9 | | 11.7 |
| Consumer Discretionary | | 12.5 | | 12.8 |
| Energy | | 10.2 | | 8.4 |
| Information Technology | | 9.0 | | 10.6 |
| Top Five Countries as of October 31, 2005 | | |
| (excluding cash equivalents) | | % of fund’s | | % of fund’s net assets |
| | | net assets | | 6 months ago |
| Japan | | 21.0 | | 16.4 |
| France | | 11.6 | | 12.2 |
| Germany | | 11.0 | | 9.4 |
| United Kingdom | | 11.0 | | 11.7 |
| Switzerland | | 8.4 | | 9.4 |
Percentages are adjusted for the effect of open futures contracts, if applicable.
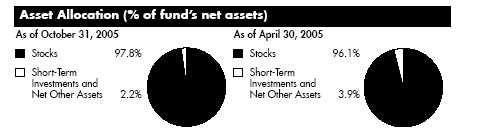
Annual Report 10
| Investments October 31, 2005 | | | | | | |
| Showing Percentage of Net Assets | | | | | | |
| |
| Common Stocks — 96.6% | | | | | | |
| | | Shares | | Value (Note 1) |
| | | | | | | (000s) |
| |
| Australia – 0.7% | | | | | | |
| CSL Ltd. | | 1,142,744 | | $ | | 32,043 |
| Macquarie Bank Ltd. | | 658,352 | | | | 31,836 |
| TOTAL AUSTRALIA | | | | | | 63,879 |
| |
| Belgium – 0.2% | | | | | | |
| KBC Groupe SA | | 182,138 | | | | 14,847 |
| Bermuda – 0.0% | | | | | | |
| Clear Media Ltd. (a) | | 907,100 | | | | 761 |
| Brazil – 1.8% | | | | | | |
| Banco Bradesco SA (PN) sponsored ADR (non-vtg.) (d) | | 457,500 | | | | 23,740 |
| Banco Nossa Caixa SA | | 222,200 | | | | 3,681 |
| Uniao de Bancos Brasileiros SA (Unibanco) GDR | | 1,443,832 | | | | 75,512 |
| Usinas Siderurgicas de Minas Gerais SA (Usiminas) (PN-A) | | 1,162,900 | | | | 23,446 |
| Votorantim Celulose e Papel SA sponsored ADR (non-vtg.) | | 2,216,200 | | | | 26,528 |
| TOTAL BRAZIL | | | | | | 152,907 |
| |
| Canada – 2.8% | | | | | | |
| ACE Aviation Holdings, Inc. Class A (a) | | 586,200 | | | | 15,387 |
| Canadian Natural Resources Ltd. | | 699,100 | | | | 28,586 |
| Canadian Western Bank, Edmonton | | 685,300 | | | | 20,426 |
| EnCana Corp. | | 1,465,248 | | | | 66,997 |
| ITF Optical Technologies, Inc. Series A (f) | | 1,792 | | | | 0 |
| Jean Coutu Group, Inc.: | | | | | | |
| Class A (e) | | 100 | | | | 1 |
| Class A (sub. vtg.) | | 1,050,940 | | | | 12,805 |
| NOVA Chemicals Corp. | | 489,000 | | | | 17,419 |
| OZ Optics Ltd. unit (a)(f) | | 5,400 | | | | 80 |
| Precision Drilling Corp. (a) | | 841,200 | | | | 38,677 |
| Talisman Energy, Inc. | | 910,600 | | | | 40,333 |
| TOTAL CANADA | | | | | | 240,711 |
| |
| Cayman Islands – 0.5% | | | | | | |
| Apex Silver Mines Ltd. (a)(d) | | 434,100 | | | | 6,650 |
| Foxconn International Holdings Ltd. | | 28,542,000 | | | | 30,559 |
| The9 Computer Technology Consulting Co. Ltd. sponsored | | | | | | |
| ADR (d) | | 245,900 | | | | 4,633 |
| TOTAL CAYMAN ISLANDS | | | | | | 41,842 |
See accompanying notes which are an integral part of the financial statements.
11 Annual Report
| Investments - continued | | | | | | |
| |
| |
| Common Stocks – continued | | | | | | |
| | | Shares | | Value (Note 1) |
| | | | | | | (000s) |
| |
| China – 0.2% | | | | | | |
| China Construction Bank Corp. (H Shares) | | 54,234,000 | | $ | | 16,441 |
| Global Bio-Chem Technology Group Co. Ltd. | | 11,470,000 | | | | 4,550 |
| TOTAL CHINA | | | | | | 20,991 |
| |
| Denmark – 1.1% | | | | | | |
| Danske Bank AS | | 1,207,875 | | | | 37,881 |
| GN Store Nordic AS | | 1,023,800 | | | | 12,333 |
| Novo Nordisk AS Series B | | 366,993 | | | | 18,804 |
| Vestas Wind Systems AS (a) | | 1,196,000 | | | | 25,886 |
| TOTAL DENMARK | | | | | | 94,904 |
| |
| Finland – 2.1% | | | | | | |
| Fortum Oyj | | 1,857,400 | | | | 32,886 |
| Metso Corp. | | 1,241,700 | | | | 32,300 |
| Neste Oil Oyj | | 874,600 | | | | 27,102 |
| Nokia Corp. sponsored ADR | | 5,135,700 | | | | 86,382 |
| TOTAL FINLAND | | | | | | 178,670 |
| |
| France – 11.6% | | | | | | |
| Accor SA | | 778,600 | | | | 38,883 |
| AXA SA | | 177,200 | | | | 5,132 |
| AXA SA sponsored ADR | | 3,083,300 | | | | 89,292 |
| Bacou Dalloz | | 76,915 | | | | 6,915 |
| BNP Paribas SA | | 1,001,746 | | | | 75,953 |
| CNP Assurances | | 439,993 | | | | 30,618 |
| Eiffage SA | | 268,005 | | | | 23,132 |
| Financiere Marc de Lacharriere SA (Fimalac) | | 431,479 | | | | 23,431 |
| France Telecom SA sponsored ADR | | 2,075,200 | | | | 53,934 |
| L’Air Liquide SA | | 206,700 | | | | 37,588 |
| Lagardere S.C.A. (Reg.) | | 805,682 | | | | 55,389 |
| Neopost SA | | 274,629 | | | | 26,502 |
| Nexity | | 695,066 | | | | 31,737 |
| NRJ Group | | 1,202,020 | | | | 26,772 |
| Orpea (a) | | 187,100 | | | | 10,093 |
| Pernod Ricard SA | | 105,003 | | | | 18,365 |
| Pinault Printemps-Redoute SA | | 46,262 | | | | 4,861 |
| Sanofi-Aventis sponsored ADR | | 1,504,900 | | | | 60,377 |
| Societe des Autoroutes du Nord et de l’Est de la France | | 464,600 | | | | 27,708 |
| Total SA: | | | | | | |
| Series B | | 109,670 | | | | 27,641 |
| sponsored ADR | | 1,440,600 | | | | 181,544 |
See accompanying notes which are an integral part of the financial statements.
| Common Stocks – continued | | | | | | |
| | | Shares | | Value (Note 1) |
| | | | | | | (000s) |
| |
| France – continued | | | | | | |
| Vinci SA | | 431,106 | | $ | | 33,695 |
| Vivendi Universal SA sponsored ADR | | 3,266,600 | | | | 102,637 |
| TOTAL FRANCE | | | | | | 992,199 |
| |
| Germany – 11.0% | | | | | | |
| Aareal Bank AG (a) | | 319,896 | | | | 9,771 |
| Allianz AG sponsored ADR | | 10,848,370 | | | | 153,396 |
| Axel Springer Verlag | | 12,220 | | | | 1,562 |
| Bayer AG | | 970,100 | | | | 33,759 |
| Bayer AG sponsored ADR | | 1,060,600 | | | | 36,909 |
| Bilfinger & Berger Bau AG | | 623,800 | | | | 26,995 |
| DaimlerChrysler AG | | 1,102,200 | | | | 55,165 |
| Deutsche Post AG | | 771,500 | | | | 17,202 |
| Deutsche Telekom AG sponsored ADR | | 5,531,200 | | | | 97,902 |
| E.ON AG sponsored ADR | | 2,222,800 | | | | 67,151 |
| Epcos AG (a) | | 679,800 | | | | 8,206 |
| GFK AG | | 378,067 | | | | 12,531 |
| Heidelberger Druckmaschinen AG | | 1,253,500 | | | | 39,820 |
| Hochtief AG | | 1,283,200 | | | | 51,854 |
| Hypo Real Estate Holding AG | | 1,175,040 | | | | 56,822 |
| Interhyp AG | | 47,943 | | | | 2,874 |
| IWKA AG | | 967,900 | | | | 21,465 |
| K&S AG | | 300,432 | | | | 19,711 |
| MAN AG | | 474,143 | | | | 22,013 |
| Merck KGaA | | 105,500 | | | | 8,726 |
| Metro AG | | 676,300 | | | | 30,759 |
| Muenchener Rueckversicherungs-Gesellschaft AG (Reg.) | | 436,000 | | | | 51,220 |
| Q-Cells AG | | 11,950 | | | | 656 |
| RWE AG | | 409,661 | | | | 26,165 |
| SAP AG sponsored ADR | | 852,000 | | | | 36,585 |
| SGL Carbon AG (a) | | 421,900 | | | | 6,175 |
| SolarWorld AG | | 289,406 | | | | 39,105 |
| TOTAL GERMANY | | | | | | 934,499 |
| |
| Greece – 0.3% | | | | | | |
| Greek Organization of Football Prognostics SA | | 946,360 | | | | 27,318 |
| Hong Kong – 0.9% | | | | | | |
| ASM Pacific Technology Ltd. | | 618,500 | | | | 2,860 |
| Cheung Kong Holdings Ltd. | | 1,471,000 | | | | 15,304 |
See accompanying notes which are an integral part of the financial statements.
13 Annual Report
| Investments - continued | | | | | | |
| |
| |
| Common Stocks – continued | | | | | | |
| | | Shares | | Value (Note 1) |
| | | | | | | (000s) |
| |
| Hong Kong – continued | | | | | | |
| Hutchison Whampoa Ltd. | | 2,255,000 | | $ | | 21,351 |
| Wharf Holdings Ltd. | | 10,710,000 | | | | 36,542 |
| TOTAL HONG KONG | | | | | | 76,057 |
| |
| India – 0.3% | | | | | | |
| Housing Development Finance Corp. Ltd. | | 382,125 | | | | 8,206 |
| Infrastructure Development Finance Co. Ltd. | | 1,266,464 | | | | 1,825 |
| State Bank of India | | 329,089 | | | | 6,824 |
| Suzlon Energy Ltd. (a) | | 630,349 | | | | 9,994 |
| TOTAL INDIA | | | | | | 26,849 |
| |
| Ireland – 0.6% | | | | | | |
| Allied Irish Banks PLC | | 1,559,698 | | | | 32,800 |
| C&C Group PLC | | 2,382,700 | | | | 14,710 |
| TOTAL IRELAND | | | | | | 47,510 |
| |
| Israel – 1.0% | | | | | | |
| Bank Hapoalim BM (Reg.) | | 8,613,900 | | | | 32,992 |
| Bank Leumi le-Israel BM | | 8,532,400 | | | | 27,846 |
| Teva Pharmaceutical Industries Ltd. sponsored ADR | | 565,700 | | | | 21,564 |
| TOTAL ISRAEL | | | | | | 82,402 |
| |
| Italy – 3.0% | | | | | | |
| Autostrade Spa | | 290,316 | | | | 6,636 |
| Banca Intesa Spa | | 10,887,854 | | | | 50,811 |
| Banche Popolari Unite S.c.a.r.l. | | 1,435,200 | | | | 30,383 |
| Banco Popolare di Verona e Novara | | 1,355,466 | | | | 25,023 |
| Davide Campari-Milano Spa | | 1,823,000 | | | | 12,360 |
| ENI Spa sponsored ADR | | 342,800 | | | | 45,850 |
| Lottomatica Spa New | | 486,700 | | | | 17,678 |
| Mediobanca Spa | | 1,112,700 | | | | 19,701 |
| Unicredito Italiano Spa | | 8,816,600 | | | | 49,230 |
| TOTAL ITALY | | | | | | 257,672 |
| |
| Japan – 21.0% | | | | | | |
| Advantest Corp. | | 66,800 | | | | 4,836 |
| Aiful Corp. | | 57,000 | | | | 4,280 |
| Aoyama Trading Co. Ltd. | | 1,147,400 | | | | 34,580 |
| Asahi Breweries Ltd. | | 1,787,800 | | | | 22,403 |
| Asics Corp. | | 1,551,000 | | | | 13,378 |
| Astellas Pharma, Inc. | | 871,500 | | | | 31,321 |
| Bank of Nagoya Ltd. | | 2,275,000 | | | | 20,549 |
See accompanying notes which are an integral part of the financial statements.
| Common Stocks – continued | | | | | | |
| | | Shares | | Value (Note 1) |
| | | | | | | (000s) |
| |
| Japan – continued | | | | | | |
| Canon, Inc. sponsored ADR | | 813,400 | | $ | | 43,167 |
| Credit Saison Co. Ltd. | | 1,388,500 | | | | 63,129 |
| Daihatsu Motor Co. Ltd. | | 2,322,000 | | | | 22,160 |
| Daiwa Securities Group, Inc. | | 7,352,000 | | | | 60,422 |
| E*TRADE Securities Co. Ltd. (d) | | 8,321 | | | | 43,741 |
| East Japan Railway Co | | 6,136 | | | | 36,666 |
| Hokuhoku Financial Group, Inc. | | 5,808,000 | | | | 24,093 |
| Honda Motor Co. Ltd. | | 263,400 | | | | 14,650 |
| JAFCO Co. Ltd. | | 281,600 | | | | 16,973 |
| JSR Corp. | | 1,591,600 | | | | 37,698 |
| Juroku Bank Ltd. | | 2,428,000 | | | | 20,270 |
| Kayaba Industry Co. Ltd. | | 2,575,000 | | | | 10,191 |
| Matsushita Electric Industrial Co. Ltd. | | 2,300,000 | | | | 42,320 |
| Millea Holdings, Inc. | | 1,050 | | | | 19,104 |
| Mitsubishi Estate Co. Ltd. | | 1,127,000 | | | | 16,719 |
| Mitsubishi UFJ Financial Group, Inc. | | 1,644 | | | | 20,862 |
| Mitsubishi UFJ Securities Co. Ltd. | | 1,632,000 | | | | 18,670 |
| Mitsui Fudosan Co. Ltd. | | 2,176,000 | | | | 35,710 |
| Mitsui Trust Holdings, Inc. | | 3,905,000 | | | | 47,142 |
| Mizuho Financial Group, Inc. | | 5,509 | | | | 36,831 |
| Murata Manufacturing Co. Ltd. | | 530,200 | | | | 26,494 |
| Nikko Cordial Corp. | | 7,370,000 | | | | 89,356 |
| Nikon Corp. (d) | | 1,893,000 | | | | 24,328 |
| Nippon Chemi-con Corp. | | 5,443,900 | | | | 33,143 |
| Nippon Electric Glass Co. Ltd. | | 2,006,800 | | | | 38,495 |
| Nippon Oil Corp. | | 1,643,000 | | | | 13,987 |
| Nishi-Nippon City Bank Ltd. (a) | | 5,706,000 | | | | 33,306 |
| Nitori Co. Ltd. | | 194,800 | | | | 14,846 |
| Nitto Denko Corp. | | 724,500 | | | | 43,983 |
| Nomura Holdings, Inc. | | 1,559,000 | | | | 24,149 |
| NTT Urban Development Co. | | 3,474 | | | | 20,398 |
| Obayashi Corp. | | 3,146,000 | | | | 23,131 |
| Okamura Corp. | | 1,684,000 | | | | 12,440 |
| OMC Card, Inc. | | 581,000 | | | | 9,776 |
| ORIX Corp. | | 279,100 | | | | 52,378 |
| Ricoh Co. Ltd. | | 1,955,000 | | | | 31,135 |
| Seven & I Holdings Co. Ltd. (a) | | 367,540 | | | | 12,095 |
| SFCG Co. Ltd. | | 130,010 | | | | 31,402 |
| SHIMIZU Corp. | | 6,208,000 | | | | 42,096 |
| Sompo Japan Insurance, Inc | | 1,979,000 | | | | 29,821 |
| Sumitomo Electric Industries Ltd. | | 3,745,000 | | | | 49,362 |
| Sumitomo Forestry Co. Ltd. | | 2,053,000 | | | | 19,042 |
See accompanying notes which are an integral part of the financial statements.
15 Annual Report
| Investments - continued | | | | | | |
| |
| |
| Common Stocks – continued | | | | | | |
| | | Shares | | Value (Note 1) |
| | | | | | | (000s) |
| |
| Japan – continued | | | | | | |
| Sumitomo Mitsui Financial Group, Inc. | | 10,771 | | $ | | 99,808 |
| Sumitomo Osaka Cement Co. Ltd. | | 8,325,000 | | | | 23,575 |
| T&D Holdings, Inc. | | 433,650 | | | | 27,377 |
| Taiheiyo Cement Corp. | | 4,508,000 | | | | 16,319 |
| Takara Holdings, Inc. | | 569,000 | | | | 3,375 |
| Takefuji Corp. | | 170,700 | | | | 11,989 |
| Tokuyama Corp. | | 3,207,000 | | | | 31,939 |
| Tokyo Electron Ltd. | | 1,537,000 | | | | 77,335 |
| Tokyo Star Bank Ltd. (a) | | 706 | | | | 2,482 |
| Tokyo Tomin Bank Ltd. | | 631,400 | | | | 23,239 |
| Toyoda Machine Works Ltd. | | 1,433,000 | | | | 17,300 |
| Victor Co. of Japan Ltd. (d) | | 3,241,200 | | | | 17,684 |
| TOTAL JAPAN | | | | | | 1,789,450 |
| |
| Korea (South) – 1.8% | | | | | | |
| Hyundai Heavy Industries Co. Ltd. | | 238,250 | | | | 15,495 |
| Hyundai Mipo Dockyard Co. Ltd. | | 271,720 | | | | 16,787 |
| Kookmin Bank sponsored ADR | | 691,410 | | | | 40,392 |
| LG Electronics, Inc. | | 315,190 | | | | 20,439 |
| LG.Philips LCD Co. Ltd. sponsored ADR (a) | | 485,200 | | | | 9,224 |
| Samsung Electronics Co. Ltd. | | 33,771 | | | | 17,856 |
| Shinhan Financial Group Co. Ltd. | | 1,063,534 | | | | 35,451 |
| TOTAL KOREA (SOUTH) | | | | | | 155,644 |
| |
| Luxembourg – 1.6% | | | | | | |
| SES Global unit | | 3,316,753 | | | | 51,886 |
| Stolt-Nielsen SA | | 173,200 | | | | 6,096 |
| Stolt-Nielsen SA Class B sponsored ADR | | 2,137,400 | | | | 76,669 |
| TOTAL LUXEMBOURG | | | | | | 134,651 |
| |
| Mexico – 0.3% | | | | | | |
| Fomento Economico Mexicano SA de CV sponsored ADR | | 312,600 | | | | 21,254 |
| Industrias Penoles SA de CV | | 767,000 | | | | 3,355 |
| TOTAL MEXICO | | | | | | 24,609 |
| |
| Netherlands – 4.7% | | | | | | |
| ASM International NV (Nasdaq) (a) | | 1,358,600 | | | | 18,042 |
| ASML Holding NV (NY Shares) (a) | | 3,702,400 | | | | 62,867 |
| Axalto Holding NV (a) | | 663,700 | | | | 18,068 |
| Fugro NV (Certificaten Van Aandelen) unit | | 492,800 | | | | 13,315 |
| ING Groep NV sponsored ADR | | 2,281,700 | | | | 65,850 |
| Koninklijke Ahold NV (a) | | 2,957,000 | | | | 20,640 |
See accompanying notes which are an integral part of the financial statements.
| Common Stocks – continued | | | | | | |
| | | Shares | | Value (Note 1) |
| | | | | | | (000s) |
| |
| Netherlands – continued | | | | | | |
| Koninklijke Numico NV (a) | | 431,286 | | $ | | 17,464 |
| Koninklijke Philips Electronics NV (NY Shares) | | 2,130,000 | | | | 55,721 |
| Koninklijke Wessanen NV | | 2,426,032 | | | | 35,626 |
| Reed Elsevier NV | | 223,900 | | | | 3,017 |
| Reed Elsevier NV sponsored ADR | | 1,466,400 | | | | 39,607 |
| Unilever NV (NY Shares) | | 218,600 | | | | 15,370 |
| VNU NV | | 1,196,553 | | | | 38,054 |
| TOTAL NETHERLANDS | | | | | | 403,641 |
| |
| Netherlands Antilles – 0.4% | | | | | | |
| Schlumberger Ltd. (NY Shares) | | 408,300 | | | | 37,061 |
| New Zealand – 0.0% | | | | | | |
| The Warehouse Group Ltd. | | 730,295 | | | | 1,993 |
| Norway – 0.8% | | | | | | |
| DnB NOR ASA | | 2,104,880 | | | | 21,515 |
| Fred Olsen Energy ASA (a) | | 874,500 | | | | 24,127 |
| Odfjell ASA: | | | | | | |
| (A Shares) | | 40,500 | | | | 777 |
| (B Shares) | | 1,065,750 | | | | 18,511 |
| TOTAL NORWAY | | | | | | 64,930 |
| |
| Portugal – 0.5% | | | | | | |
| Brisa Auto-Estradas de Portugal SA | | 3,785,680 | | | | 29,951 |
| Impresa SGPS (a) | | 2,186,400 | | | | 12,187 |
| TOTAL PORTUGAL | | | | | | 42,138 |
| |
| Russia – 0.5% | | | | | | |
| Novatek JSC: | | | | | | |
| GDR (a) | | 307,700 | | | | 6,917 |
| GDR (a)(e) | | 468,166 | | | | 10,524 |
| Sistema JSFC sponsored GDR (e) | | 976,800 | | | | 21,880 |
| TOTAL RUSSIA | | | | | | 39,321 |
| |
| Singapore – 0.3% | | | | | | |
| STATS ChipPAC Ltd. sponsored ADR (a)(d) | | 4,459,100 | | | | 25,016 |
| South Africa – 1.4% | | | | | | |
| Edgars Consolidated Stores Ltd. | | 4,306,000 | | | | 19,124 |
| FirstRand Ltd. | | 6,481,800 | | | | 15,253 |
| Massmart Holdings Ltd. | | 1,333,776 | | | | 10,297 |
| Standard Bank Group Ltd. | | 2,529,600 | | | | 26,088 |
See accompanying notes which are an integral part of the financial statements.
17 Annual Report
| Investments - continued | | | | | | |
| |
| |
| Common Stocks – continued | | | | | | |
| | | Shares | | Value (Note 1) |
| | | | | | | (000s) |
| |
| South Africa – continued | | | | | | |
| Steinhoff International Holdings Ltd. | | 13,403,402 | | $ | | 35,077 |
| Sun International Ltd. | | 1,500,000 | | | | 16,990 |
| TOTAL SOUTH AFRICA | | | | | | 122,829 |
| |
| Spain – 1.3% | | | | | | |
| Antena 3 Television SA | | 1,498,088 | | | | 29,128 |
| Banco Bilbao Vizcaya Argentaria SA sponsored ADR | | 408,000 | | | | 7,193 |
| Compania de Distribucion Integral Logista SA | | 105,220 | | | | 5,576 |
| Gestevision Telecinco SA | | 1,123,940 | | | | 24,939 |
| Telefonica SA sponsored ADR | | 970,880 | | | | 46,554 |
| TOTAL SPAIN | | | | | | 113,390 |
| |
| Sweden – 1.5% | | | | | | |
| Eniro AB (d) | | 3,214,100 | | | | 35,122 |
| Gambro AB (A Shares) | | 2,033,072 | | | | 28,728 |
| Securitas AB (B Shares) | | 1,150,600 | | | | 17,487 |
| Telefonaktiebolaget LM Ericsson (B Shares) sponsored ADR (d) | | 1,511,400 | | | | 49,589 |
| TOTAL SWEDEN | | | | | | 130,926 |
| |
| Switzerland – 8.4% | | | | | | |
| ABB Ltd. (Reg.) (a) | | 8,141,450 | | | | 62,269 |
| Actelion Ltd. (Reg.) (a) | | 338,125 | | | | 38,031 |
| Alcon, Inc. | | 200,800 | | | | 26,686 |
| Clariant AG (Reg.) | | 438,315 | | | | 5,848 |
| Compagnie Financiere Richemont unit | | 1,137,738 | | | | 43,289 |
| Credit Suisse Group sponsored ADR | | 642,200 | | | | 28,456 |
| Nestle SA (Reg.) | | 339,614 | | | | 101,161 |
| Novartis AG sponsored ADR | | 3,360,132 | | | | 180,842 |
| Phonak Holding AG | | 265,982 | | | | 11,090 |
| Roche Holding AG (participation certificate) | | 977,215 | | | | 145,997 |
| Societe Generale de Surveillance Holding SA (SGS) (Reg.) | | 20,496 | | | | 15,104 |
| Syngenta AG sponsored ADR | | 1,187,700 | | | | 25,524 |
| UBS AG (NY Shares) | | 369,147 | | | | 31,625 |
| TOTAL SWITZERLAND | | | | | | 715,922 |
| |
| Taiwan – 1.3% | | | | | | |
| Advanced Semiconductor Engineering, Inc. | | 51,971,692 | | | | 31,677 |
| Chi Mei Optoelectronics Corp. | | 24,332,623 | | | | 24,440 |
| Compal Electronics, Inc. | | 14,491,000 | | | | 12,784 |
See accompanying notes which are an integral part of the financial statements.
| Common Stocks – continued | | | | | | |
| | | Shares | | Value (Note 1) |
| | | | | | | (000s) |
| |
| Taiwan – continued | | | | | | |
| United Microelectronics Corp. | | 42,384,347 | | $ | | 22,486 |
| United Microelectronics Corp. sponsored ADR (d) | | 6,283,700 | | | | 18,348 |
| TOTAL TAIWAN | | | | | | 109,735 |
| |
| Thailand – 0.1% | | | | | | |
| Thai Oil PCL (For. Reg.) | | 3,184,000 | | | | 5,504 |
| United Kingdom – 11.0% | | | | | | |
| 3i Group PLC | | 1,679,905 | | | | 22,544 |
| Babcock International Group PLC | | 3,347,600 | | | | 11,127 |
| BAE Systems PLC | | 9,191,280 | | | | 53,781 |
| BP PLC sponsored ADR | | 2,781,400 | | | | 184,689 |
| Capita Group PLC | | 5,784,313 | | | | 39,939 |
| EMI Group PLC | | 4,486,500 | | | | 16,998 |
| Group 4 Securicor PLC: | | | | | | |
| (Denmark) | | 2,975,530 | | | | 7,934 |
| (United Kingdom) | | 5,355,100 | | | | 14,269 |
| HSBC Holdings PLC sponsored ADR | | 826,800 | | | | 65,119 |
| Informa PLC | | 1,128,700 | | | | 7,479 |
| Legal & General Group PLC | | 6,762,900 | | | | 12,841 |
| National Grid PLC | | 2,962,375 | | | | 27,089 |
| Prudential PLC | | 3,283,700 | | | | 27,557 |
| Rank Group PLC | | 4,140,427 | | | | 21,698 |
| Reckitt Benckiser PLC | | 155,538 | | | | 4,701 |
| Royal Dutch Shell PLC Class A sponsored ADR | | 1,047,200 | | | | 64,968 |
| Serco Group PLC | | 5,026,248 | | | | 23,604 |
| Smiths Group PLC | | 2,000,700 | | | | 32,322 |
| Tesco PLC | | 9,852,242 | | | | 52,460 |
| Unilever PLC sponsored ADR | | 1,392,200 | | | | 56,523 |
| Vodafone Group PLC sponsored ADR | | 6,479,800 | | | | 170,160 |
| Yell Group PLC | | 2,119,870 | | | | 16,608 |
| TOTAL UNITED KINGDOM | | | | | | 934,410 |
| |
| United States of America – 1.6% | | | | | | |
| Advanced Energy Industries, Inc. (a) | | 320,900 | | | | 3,450 |
| Halliburton Co. | | 464,500 | | | | 27,452 |
| News Corp. Class A | | 1,811,500 | | | | 25,814 |
See accompanying notes which are an integral part of the financial statements.
19 Annual Report
| Investments - continued | | | | | | |
| |
| |
| Common Stocks – continued | | | | | | |
| | | Shares | | Value (Note 1) |
| | | | | | | (000s) |
| |
| United States of America – continued | | | | | | |
| Synthes, Inc. | | 548,046 | | $ | | 58,029 |
| Transocean, Inc. (a) | | 323,800 | | | | 18,615 |
| TOTAL UNITED STATES OF AMERICA | | | | | | 133,360 |
| |
| TOTAL COMMON STOCKS | | | | | | |
| (Cost $7,081,650) | | | | | | 8,238,548 |
| |
| Preferred Stocks — 1.2% | | | | | | |
| |
| Convertible Preferred Stocks – 0.0% | | | | | | |
| |
| Canada – 0.0% | | | | | | |
| MetroPhotonics, Inc. Series 2 (f) | | 8,500 | | | | 0 |
| Nonconvertible Preferred Stocks – 1.2% | | | | | | |
| |
| Italy – 1.2% | | | | | | |
| Banca Intesa Spa (Risp) | | 6,478,900 | | | | 28,061 |
| Buzzi Unicem Spa (Risp) | | 641,893 | | | | 6,400 |
| Telecom Italia Spa (Risp) | | 26,037,100 | | | | 62,955 |
| Unicredito Italiano Spa (Risp) | | 1,329,088 | | | | 7,939 |
| TOTAL ITALY | | | | | | 105,355 |
| |
| TOTAL PREFERRED STOCKS | | | | | | |
| (Cost $111,653) | | | | | | 105,355 |
| |
| Money Market Funds — 2.8% | | | | | | |
| |
| Fidelity Cash Central Fund, 3.92% (b) | | 165,258,587 | | | | 165,259 |
| Fidelity Securities Lending Cash Central Fund, | | | | | | |
| 3.94% (b)(c) | | 76,889,140 | | | | 76,889 |
| TOTAL MONEY MARKET FUNDS | | | | | | |
| (Cost $242,148) | | | | | | 242,148 |
| |
| TOTAL INVESTMENT PORTFOLIO – 100.6% | | | | | | |
| (Cost $7,435,451) | | | | 8,586,051 |
| |
| NET OTHER ASSETS – (0.6)% | | | | | | (52,292) |
| NET ASSETS – 100% | | $ | | 8,533,759 |
See accompanying notes which are an integral part of the financial statements.
(a) Non-income producing
(b) Affiliated fund that is available only to investment companies and other accounts managed by Fidelity Investments. The rate quoted is the annualized seven-day yield of the fund at period end. A complete unaudited listing of the fund’s holdings as of its most recent quarter end is available upon request.
(c) Investment made with cash collateral received from securities on loan.
(d) Security or a portion of the security is on loan at period end.
(e) Security exempt from registration under Rule 144A of the Securities Act of 1933. These securities may be resold in transactions exempt from registration, normally to qualified institutional buyers. At the period end, the value of these securities amounted to $32,404,000 or 0.4% of net assets.
(f) Restricted securities – Investment in securities not registered under the Securities Act of 1933 (excluding 144A issues). At the end of the period, the value of restricted securities (excluding 144A issues) amounted to $80,000 or 0.0% of net assets.
| Additional information on each holding is as follows: | | | | |
| Security | | Acquisition Date | | | | Acquisition Cost (000s) |
| ITF Optical Technologies, Inc. Series A | | 10/11/00 | | $ | | 90 |
| MetroPhotonics, Inc. Series 2 | | 9/29/00 | | $ | | 85 |
| OZ Optics Ltd. unit | | 8/18/00 | | $ | | 80 |
See accompanying notes which are an integral part of the financial statements.
21 Annual Report
| Financial Statements | | | | | | | | |
| |
| |
| Statement of Assets and Liabilities | | | | | | | | |
| Amounts in thousands (except per-share amounts) | | | | | | | | October 31, 2005 |
| |
| Assets | | | | | | | | |
| Investment in securities, at value (including securities | | | | | | | | |
| loaned of $76,752) (cost $7,435,451) — See | | | | | | | | |
| accompanying schedule | | | | | | $ | | 8,586,051 |
| Foreign currency held at value (cost $12,402) | | | | | | | | 12,376 |
| Receivable for investments sold | | | | | | | | 107,221 |
| Receivable for fund shares sold | | | | | | | | 29,024 |
| Dividends receivable | | | | | | | | 8,970 |
| Interest receivable | | | | | | | | 566 |
| Other affiliated receivables | | | | | | | | 2 |
| Other receivables | | | | | | | | 878 |
| Total assets | | | | | | | | 8,745,088 |
| |
| Liabilities | | | | | | | | |
| Payable for investments purchased | | $ | | 113,454 | | | | |
| Payable for fund shares redeemed | | | | 9,739 | | | | |
| Accrued management fee | | | | 5,015 | | | | |
| Distribution fees payable | | | | 2,462 | | | | |
| Other affiliated payables | | | | 1,635 | | | | |
| Other payables and accrued expenses | | | | 2,135 | | | | |
| Collateral on securities loaned, at value | | | | 76,889 | | | | |
| Total liabilities | | | | | | | | 211,329 |
| |
| Net Assets | | | | | | $ | | 8,533,759 |
| Net Assets consist of: | | | | | | | | |
| Paid in capital | | | | | | $ | | 6,909,645 |
| Undistributed net investment income | | | | | | | | 60,354 |
| Accumulated undistributed net realized gain (loss) on | | | | | | | | |
| investments and foreign currency transactions | | | | | | | | 414,935 |
| Net unrealized appreciation (depreciation) on | | | | | | | | |
| investments and assets and liabilities in foreign | | | | | | | | |
| currencies | | | | | | | | 1,148,825 |
| Net Assets | | | | | | $ | | 8,533,759 |
See accompanying notes which are an integral part of the financial statements.
| Statement of Assets and Liabilities — continued | | | | |
| Amounts in thousands (except per-share amounts) | | | | October 31, 2005 |
| |
| Calculation of Maximum Offering Price | | | | |
| Class A: | | | | |
| Net Asset Value and redemption price per share | | | | |
| ($2,791,730 ÷ 137,546 shares) | | $ | | 20.30 |
| Maximum offering price per share (100/94.25 of | | | | |
| $20.30) | | $ | | 21.54 |
| Class T: | | | | |
| Net Asset Value and redemption price per share | | | | |
| ($2,419,981 ÷ 120,268 shares) | | $ | | 20.12 |
| Maximum offering price per share (100/96.50 of | | | | |
| $20.12) | | $ | | 20.85 |
| Class B: | | | | |
| Net Asset Value and offering price per share | | | | |
| ($350,685 ÷ 17,888 shares)A | | $ | | 19.60 |
| Class C: | | | | |
| Net Asset Value and offering price per share | | | | |
| ($758,303 ÷ 38,595 shares)A | | $ | | 19.65 |
| Institutional Class: | | | | |
| Net Asset Value, offering price and redemption | | | | |
| price per share ($2,213,060 ÷ 107,617 | | | | |
| shares) | | $ | | 20.56 |
| |
| A Redemption price per share is equal to net asset value less any applicable contingent deferred sales charge. | | | | |
See accompanying notes which are an integral part of the financial statements.
23 Annual Report
| Financial Statements - continued | | | | | | |
| |
| |
| Statement of Operations | | | | | | |
| Amounts in thousands | | | | Year ended October 31, 2005 |
| |
| Investment Income | | | | | | |
| Dividends | | | | $ | | 153,468 |
| Interest | | | | | | 5,494 |
| Security lending | | | | | | 5,615 |
| | | | | | | 164,577 |
| Less foreign taxes withheld | | | | | | (16,915) |
| Total income | | | | | | 147,662 |
| |
| Expenses | | | | | | |
| Management fee | | $ | | 47,855 | | |
| Transfer agent fees | | | | 14,379 | | |
| Distribution fees | | | | 23,448 | | |
| Accounting and security lending fees | | | | 1,818 | | |
| Independent trustees’ compensation | | | | 29 | | |
| Custodian fees and expenses | | | | 2,230 | | |
| Registration fees | | | | 679 | | |
| Audit | | | | 138 | | |
| Legal | | | | 21 | | |
| Miscellaneous | | | | 42 | | |
| Total expenses before reductions | | | | 90,639 | | |
| Expense reductions | | | | (4,086) | | 86,553 |
| |
| Net investment income (loss) | | | | | | 61,109 |
| Realized and Unrealized Gain (Loss) | | | | | | |
| Net realized gain (loss) on: | | | | | | |
| Investment securities (net of foreign taxes of $2,850) . | | 439,484 | | |
| Foreign currency transactions | | | | (3,631) | | |
| Total net realized gain (loss) | | | | | | 435,853 |
| Change in net unrealized appreciation (depreciation) on: | | | | |
| Investment securities (net of increase in deferred for- | | | | |
| eign taxes of $607) | | | | 646,472 | | |
| Assets and liabilities in foreign currencies | | | | (592) | | |
| Total change in net unrealized appreciation | | | | | | |
| (depreciation) | | | | | | 645,880 |
| Net gain (loss) | | | | | | 1,081,733 |
| Net increase (decrease) in net assets resulting from | | | | | | |
| operations | | | | $ | | 1,142,842 |
See accompanying notes which are an integral part of the financial statements.
| Statement of Changes in Net Assets | | | | | | | | |
| | | | | Year ended | | | | Year ended |
| | | | | October 31, | | | | October 31, |
| Amounts in thousands | | | | 2005 | | | | 2004 |
| Increase (Decrease) in Net Assets | | | | | | | | |
| Operations | | | | | | | | |
| Net investment income (loss) | | $ | | 61,109 | | $ | | 11,332 |
| Net realized gain (loss) | | | | 435,853 | | | | 69,269 |
| Change in net unrealized appreciation (depreciation) . | | | | 645,880 | | | | 311,354 |
| Net increase (decrease) in net assets resulting | | | | | | | | |
| from operations | | | | 1,142,842 | | | | 391,955 |
| Distributions to shareholders from net investment income . | | | | (10,883) | | | | (10,785) |
| Distributions to shareholders from net realized gain | | | | (21,643) | | | | — |
| Total distributions | | | | (32,526) | | | | (10,785) |
| Share transactions — net increase (decrease) | | | | 2,857,486 | | | | 2,786,474 |
| Redemption fees | | | | 289 | | | | 95 |
| Total increase (decrease) in net assets | | | | 3,968,091 | | | | 3,167,739 |
| |
| Net Assets | | | | | | | | |
| Beginning of period | | | | 4,565,668 | | | | 1,397,929 |
| End of period (including undistributed net investment | | | | | | | | |
| income of $60,354 and undistributed net investment | | | | | | | | |
| income of $8,576, respectively) | | $ | | 8,533,759 | | $ | | 4,565,668 |
See accompanying notes which are an integral part of the financial statements.
25 Annual Report
| Financial Highlights — Class A | | | | | | | | | | | | | | | | |
| |
| Years ended October 31, | | | | 2005 | | | | 2004 | | | | 2003 | | | | 2002 | | | | 2001 |
| Selected Per-Share Data | | | | | | | | | | | | | | | | | | | | |
| Net asset value, beginning of | | | | | | | | | | | | | | | | | | | | |
| period | | $ | | 16.97 | | $ | | 14.60 | | $ | | 11.12 | | $ | | 11.87 | | $ | | 14.54 |
| Income from Investment | | | | | | | | | | | | | | | | | | | | |
| Operations | | | | | | | | | | | | | | | | | | | | |
| Net investment income (loss)C | | | | 19 | | | | .08 | | | | .09 | | | | .07 | | | | .10 |
| Net realized and unrealized | | | | | | | | | | | | | | | | | | | | |
| gain (loss) | | | | 3.27 | | | | 2.41 | | | | 3.45 | | | | (.82) | | | | (2.48) |
| Total from investment operations | | | | 3.46 | | | | 2.49 | | | | 3.54 | | | | (.75) | | | | (2.38) |
| Distributions from net investment | | | | | | | | | | | | | | | | | | | | |
| income | | | | (.05) | | | | (.12) | | | | (.06) | | | | — | | | | (.29) |
| Distributions from net realized | | | | | | | | | | | | | | | | | | | | |
| gain | | | | (.08) | | | | — | | | | — | | | | — | | | | — |
| Total distributions | | | | (.13) | | | | (.12) | | | | (.06) | | | | — | | | | (.29) |
| Redemption fees added to paid in | | | | | | | | | | | | | | | | | | | | |
| capitalC | | | | —E | | | | —E | | | | — | | | | — | | | | — |
| Net asset value, end of period | | $ | | 20.30 | | $ | | 16.97 | | $ | | 14.60 | | $ | | 11.12 | | $ | | 11.87 |
| Total ReturnA,B | | | | 20.50% | | | | 17.15% | | | | 31.99% | | | | (6.32)% | | | | (16.69)% |
| Ratios to Average Net AssetsD | | | | | | | | | | | | | | | | | | | | |
| Expenses before expense | | | | | | | | | | | | | | | | | | | | |
| reductions | | | | 1.27% | | | | 1.31% | | | | 1.42% | | | | 1.46% | | | | 1.50% |
| Expenses net of voluntary | | | | | | | | | | | | | | | | | | | | |
| waivers, if any | | | | 1.27% | | | | 1.31% | | | | 1.42% | | | | 1.46% | | | | 1.50% |
| Expenses net of all reductions | | | | 1.20% | | | | 1.27% | | | | 1.39% | | | | 1.43% | | | | 1.46% |
| Net investment income (loss) | | | | 1.02% | | | | .51% | | | | .71% | | | | .54% | | | | .77% |
| Supplemental Data | | | | | | | | | | | | | | | | | | | | |
| Net assets, end of period | | | | | | | | | | | | | | | | | | | | |
| (in millions) | | $ | | 2,792 | | $ | | 1,294 | | $ | | 241 | | $ | | 52 | | $ | | 38 |
| Portfolio turnover rate | | | | 59% | | | | 72% | | | | 49% | | | | 53% | | | | 84% |
A Total returns would have been lower had certain expenses not been reduced during the periods shown.
B Total returns do not include the effect of the sales charges.
C Calculated based on average shares outstanding during the period.
D Expense ratios reflect operating expenses of the class. Expenses before reductions do not reflect amounts reimbursed by the investment adviser or reductions from brokerage service arrangements or other expense offset arrangements and do not represent the amount paid by the class during periods when reimbursements or reductions occur. Expenses net of any voluntary waivers reflect expenses after reimbursement by the investment adviser but prior to reductions from brokerage service arrangements or other expense offset arrangements. Expenses net of all reductions repre sent the net expenses paid by the class.
E Amount represents less than $.01 per share.
See accompanying notes which are an integral part of the financial statements.
| Financial Highlights — Class T | | | | | | | | | | | | | | | | |
| |
| Years ended October 31, | | | | 2005 | | | | 2004 | | | | 2003 | | | | 2002 | | | | 2001 |
| Selected Per-Share Data | | | | | | | | | | | | | | | | | | | | |
| Net asset value, beginning of | | | | | | | | | | | | | | | | | | | | |
| period | | $ | | 16.82 | | $ | | 14.47 | | $ | | 11.01 | | $ | | 11.80 | | $ | | 14.46 |
| Income from Investment | | | | | | | | | | | | | | | | | | | | |
| Operations | | | | | | | | | | | | | | | | | | | | |
| Net investment income (loss)C | | | | 15 | | | | .03 | | | | .05 | | | | .02 | | | | .06 |
| Net realized and unrealized | | | | | | | | | | | | | | | | | | | | |
| gain (loss) | | | | 3.23 | | | | 2.39 | | | | 3.43 | | | | (.81) | | | | (2.46) |
| Total from investment operations | | | | 3.38 | | | | 2.42 | | | | 3.48 | | | | (.79) | | | | (2.40) |
| Distributions from net investment | | | | | | | | | | | | | | | | | | | | |
| income | | | | — | | | | (.07) | | | | (.02) | | | | — | | | | (.26) |
| Distributions from net realized | | | | | | | | | | | | | | | | | | | | |
| gain | | | | (.08) | | | | — | | | | — | | | | — | | | | — |
| Total distributions | | | | (.08) | | | | (.07) | | | | (.02) | | | | — | | | | (.26) |
| Redemption fees added to paid in | | | | | | | | | | | | | | | | | | | | |
| capitalC | | | | —E | | | | —E | | | | — | | | | — | | | | — |
| Net asset value, end of period | | $ | | 20.12 | | $ | | 16.82 | | $ | | 14.47 | | $ | | 11.01 | | $ | | 11.80 |
| Total ReturnA,B | | | | 20.16% | | | | 16.78% | | | | 31.66% | | | | (6.69)% | | | | (16.90)% |
| Ratios to Average Net AssetsD | | | | | | | | | | | | | | | | | | | | |
| Expenses before expense | | | | | | | | | | | | | | | | | | | | |
| reductions | | | | 1.51% | | | | 1.61% | | | | 1.75% | | | | 1.79% | | | | 1.81% |
| Expenses net of voluntary | | | | | | | | | | | | | | | | | | | | |
| waivers, if any | | | | 1.51% | | | | 1.61% | | | | 1.75% | | | | 1.79% | | | | 1.81% |
| Expenses net of all reductions | | | | 1.45% | | | | 1.57% | | | | 1.72% | | | | 1.76% | | | | 1.76% |
| Net investment income (loss) | | | | 77% | | | | .21% | | | | .38% | | | | .21% | | | | .47% |
| Supplemental Data | | | | | | | | | | | | | | | | | | | | |
| Net assets, end of period | | | | | | | | | | | | | | | | | | | | |
| (in millions) | | $ | | 2,420 | | $ | | 1,510 | | $ | | 552 | | $ | | 204 | | $ | | 153 |
| Portfolio turnover rate | | | | 59% | | | | 72% | | | | 49% | | | | 53% | | | | 84% |
A Total returns would have been lower had certain expenses not been reduced during the periods shown.
B Total returns do not include the effect of the sales charges.
C Calculated based on average shares outstanding during the period.
D Expense ratios reflect operating expenses of the class. Expenses before reductions do not reflect amounts reimbursed by the investment adviser or reductions from brokerage service arrangements or other expense offset arrangements and do not represent the amount paid by the class during periods when reimbursements or reductions occur. Expenses net of any voluntary waivers reflect expenses after reimbursement by the investment adviser but prior to reductions from brokerage service arrangements or other expense offset arrangements. Expenses net of all reductions repre sent the net expenses paid by the class.
E Amount represents less than $.01 per share.
See accompanying notes which are an integral part of the financial statements.
27 Annual Report
| Financial Highlights — Class B | | | | | | | | | | | | | | | | |
| |
| Years ended October 31, | | | | 2005 | | | | 2004 | | | | 2003 | | | | 2002 | | | | 2001 |
| Selected Per-Share Data | | | | | | | | | | | | | | | | | | | | |
| Net asset value, beginning of | | | | | | | | | | | | | | | | | | | | |
| period | | $ | | 16.46 | | $ | | 14.19 | | $ | | 10.84 | | $ | | 11.68 | | $ | | 14.33 |
| Income from Investment | | | | | | | | | | | | | | | | | | | | |
| Operations | | | | | | | | | | | | | | | | | | | | |
| Net investment income (loss)C | | | | 02 | | | | (.07) | | | | (.02) | | | | (.04) | | | | (.01) |
| Net realized and unrealized | | | | | | | | | | | | | | | | | | | | |
| gain (loss) | | | | 3.16 | | | | 2.35 | | | | 3.37 | | | | (.80) | | | | (2.44) |
| Total from investment operations | | | | 3.18 | | | | 2.28 | | | | 3.35 | | | | (.84) | | | | (2.45) |
| Distributions from net investment | | | | | | | | | | | | | | | | | | | | |
| income | | | | — | | | | (.01) | | | | — | | | | — | | | | (.20) |
| Distributions from net realized | | | | | | | | | | | | | | | | | | | | |
| gain | | | | (.04) | | | | — | | | | — | | | | — | | | | — |
| Total distributions | | | | (.04) | | | | (.01) | | | | — | | | | — | | | | (.20) |
| Redemption fees added to paid in | | | | | | | | | | | | | | | | | | | | |
| capitalC | | | | —E | | | | —E | | | | — | | | | — | | | | — |
| Net asset value, end of period | | $ | | 19.60 | | $ | | 16.46 | | $ | | 14.19 | | $ | | 10.84 | | $ | | 11.68 |
| Total ReturnA,B | | | | 19.35% | | | | 16.08% | | | | 30.90% | | | | (7.19)% | | | | (17.33)% |
| Ratios to Average Net AssetsD | | | | | | | | | | | | | | | | | | | | |
| Expenses before expense | | | | | | | | | | | | | | | | | | | | |
| reductions | | | | 2.16% | | | | 2.24% | | | | 2.32% | | | | 2.32% | | | | 2.35% |
| Expenses net of voluntary | | | | | | | | | | | | | | | | | | | | |
| waivers, if any | | | | 2.16% | | | | 2.24% | | | | 2.32% | | | | 2.32% | | | | 2.35% |
| Expenses net of all reductions | | | | 2.10% | | | | 2.20% | | | | 2.29% | | | | 2.29% | | | | 2.30% |
| Net investment income (loss) | | | | 12% | | | | (.42)% | | | | (.19)% | | | | (.32)% | | | | (.07)% |
| Supplemental Data | | | | | | | | | | | | | | | | | | | | |
| Net assets, end of period | | | | | | | | | | | | | | | | | | | | |
| (in millions) | | $ | | 351 | | $ | | 196 | | $ | | 89 | | $ | | 49 | | $ | | 42 |
| Portfolio turnover rate | | | | 59% | | | | 72% | | | | 49% | | | | 53% | | | | 84% |
A Total returns would have been lower had certain expenses not been reduced during the periods shown.
B Total returns do not include the effect of the contingent deferred sales charge.
C Calculated based on average shares outstanding during the period.
D Expense ratios reflect operating expenses of the class. Expenses before reductions do not reflect amounts reimbursed by the investment adviser or reductions from brokerage service arrangements or other expense offset arrangements and do not represent the amount paid by the class during periods when reimbursements or reductions occur. Expenses net of any voluntary waivers reflect expenses after reimbursement by the investment adviser but prior to reductions from brokerage service arrangements or other expense offset arrangements. Expenses net of all reductions repre sent the net expenses paid by the class.
E Amount represents less than $.01 per share.
See accompanying notes which are an integral part of the financial statements.
| Financial Highlights — Class C | | | | | | | | | | | | | | | | |
| |
| Years ended October 31, | | | | 2005 | | | | 2004 | | | | 2003 | | | | 2002 | | | | 2001 |
| Selected Per-Share Data | | | | | | | | | | | | | | | | | | | | |
| Net asset value, beginning of | | | | | | | | | | | | | | | | | | | | |
| period | | $ | | 16.48 | | $ | | 14.22 | | $ | | 10.86 | | $ | | 11.68 | | $ | | 14.34 |
| Income from Investment | | | | | | | | | | | | | | | | | | | | |
| Operations | | | | | | | | | | | | | | | | | | | | |
| Net investment income (loss)C | | | | 04 | | | | (.05) | | | | (.01) | | | | (.03) | | | | —E |
| Net realized and unrealized | | | | | | | | | | | | | | | | | | | | |
| gain (loss) | | | | 3.17 | | | | 2.35 | | | | 3.37 | | | | (.79) | | | | (2.45) |
| Total from investment operations | | | | 3.21 | | | | 2.30 | | | | 3.36 | | | | (.82) | | | | (2.45) |
| Distributions from net investment | | | | | | | | | | | | | | | | | | | | |
| income | | | | — | | | | (.04) | | | | — | | | | — | | | | (.21) |
| Distributions from net realized | | | | | | | | | | | | | | | | | | | | |
| gain | | | | (.04) | | | | — | | | | — | | | | — | | | | — |
| Total distributions | | | | (.04) | | | | (.04) | | | | — | | | | — | | | | (.21) |
| Redemption fees added to paid in | | | | | | | | | | | | | | | | | | | | |
| capitalC | | | | —E | | | | —E | | | | — | | | | — | | | | — |
| Net asset value, end of period | | $ | | 19.65 | | $ | | 16.48 | | $ | | 14.22 | | $ | | 10.86 | | $ | | 11.68 |
| Total ReturnA,B | | | | 19.51% | | | | 16.21% | | | | 30.94% | | | | (7.02)% | | | | (17.33)% |
| Ratios to Average Net AssetsD | | | | | | | | | | | | | | | | | | | | |
| Expenses before expense | | | | | | | | | | | | | | | | | | | | |
| reductions | | | | 2.05% | | | | 2.13% | | | | 2.23% | | | | 2.25% | | | | 2.28% |
| Expenses net of voluntary | | | | | | | | | | | | | | | | | | | | |
| waivers, if any | | | | 2.05% | | | | 2.13% | | | | 2.23% | | | | 2.25% | | | | 2.28% |
| Expenses net of all reductions | | | | 1.99% | | | | 2.09% | | | | 2.20% | | | | 2.22% | | | | 2.24% |
| Net investment income (loss) | | | | 23% | | | | (.31)% | | | | (.10)% | | | | (.25)% | | | | (.01)% |
| Supplemental Data | | | | | | | | | | | | | | | | | | | | |
| Net assets, end of period | | | | | | | | | | | | | | | | | | | | |
| (in millions) | | $ | | 758 | | $ | | 381 | | $ | | 124 | | $ | | 54 | | $ | | 44 |
| Portfolio turnover rate | | | | 59% | | | | 72% | | | | 49% | | | | 53% | | | | 84% |
A Total returns would have been lower had certain expenses not been reduced during the periods shown.
B Total returns do not include the effect of the contingent deferred sales charge.
C Calculated based on average shares outstanding during the period.
D Expense ratios reflect operating expenses of the class. Expenses before reductions do not reflect amounts reimbursed by the investment adviser or reductions from brokerage service arrangements or other expense offset arrangements and do not represent the amount paid by the class during periods when reimbursements or reductions occur. Expenses net of any voluntary waivers reflect expenses after reimbursement by the investment adviser but prior to reductions from brokerage service arrangements or other expense offset arrangements. Expenses net of all reductions repre sent the net expenses paid by the class.
E Amount represents less than $.01 per share.
See accompanying notes which are an integral part of the financial statements.
29 Annual Report
| Financial Highlights — Institutional Class | | | | | | | | | | | | |
| |
| Years ended October 31, | | | | 2005 | | | | 2004 | | | | 2003 | | | | 2002 | | | | 2001 |
| Selected Per-Share Data | | | | | | | | | | | | | | | | | | | | |
| Net asset value, beginning of | | | | | | | | | | | | | | | | | | | | |
| period | | $ | | 17.18 | | $ | | 14.74 | | $ | | 11.22 | | $ | | 11.94 | | $ | | 14.60 |
| Income from Investment | | | | | | | | | | | | | | | | | | | | |
| Operations | | | | | | | | | | | | | | | | | | | | |
| Net investment income (loss)B | | | | 25 | | | | .13 | | | | .13 | | | | .11 | | | | .14 |
| Net realized and unrealized | | | | | | | | | | | | | | | | | | | | |
| gain (loss) | | | | 3.30 | | | | 2.44 | | | | 3.48 | | | | (.83) | | | | (2.48) |
| Total from investment operations | | | | 3.55 | | | | 2.57 | | | | 3.61 | | | | (.72) | | | | (2.34) |
| Distributions from net investment | | | | | | | | | | | | | | | | | | | | |
| income | | | | (.09) | | | | (.13) | | | | (.09) | | | | — | | | | (.32) |
| Distributions from net realized | | | | | | | | | | | | | | | | | | | | |
| gain | | | | (.08) | | | | — | | | | — | | | | — | | | | — |
| Total distributions | | | | (.17) | | | | (.13) | | | | (.09) | | | | — | | | | (.32) |
| Redemption fees added to paid in | | | | | | | | | | | | | | | | | | | | |
| capitalB | | | | —D | | | | —D | | | | — | | | | — | | | | — |
| Net asset value, end of period | | $ | | 20.56 | | $ | | 17.18 | | $ | | 14.74 | | $ | | 11.22 | | $ | | 11.94 |
| Total ReturnA | | | | 20.81% | | | | 17.54% | | | | 32.41% | | | | (6.03)% | | | | (16.38)% |
| Ratios to Average Net AssetsC | | | | | | | | | | | | | | | | | | | | |
| Expenses before expense | | | | | | | | | | | | | | | | | | | | |
| reductions | | | | 97% | | | | 1.03% | | | | 1.09% | | | | 1.11% | | | | 1.17% |
| Expenses net of voluntary | | | | | | | | | | | | | | | | | | | | |
| waivers, if any | | | | 97% | | | | 1.03% | | | | 1.09% | | | | 1.11% | | | | 1.17% |
| Expenses net of all reductions | | | | 91% | | | | .98% | | | | 1.06% | | | | 1.07% | | | | 1.12% |
| Net investment income (loss) | | | | 1.32% | | | | .80% | | | | 1.04% | | | | .89% | | | | 1.11% |
| Supplemental Data | | | | | | | | | | | | | | | | | | | | |
| Net assets, end of period | | | | | | | | | | | | | | | | | | | | |
| (in millions) | | $ | | 2,213 | | $ | | 1,185 | | $ | | 391 | | $ | | 88 | | $ | | 43 |
| Portfolio turnover rate | | | | 59% | | | | 72% | | | | 49% | | | | 53% | | | | 84% |
A Total returns would have been lower had certain expenses not been reduced during the periods shown.
B Calculated based on average shares outstanding during the period.
C Expense ratios reflect operating expenses of the class. Expenses before reductions do not reflect amounts reimbursed by the investment adviser or reductions from brokerage service arrangements or other expense offset arrangements and do not represent the amount paid by the class during periods when reimbursements or reductions occur. Expenses net of any voluntary waivers reflect expenses after reimbursement by the investment adviser but prior to reductions from brokerage service arrangements or other expense offset arrangements. Expenses net of all reductions repre sent the net expenses paid by the class.
D Amount represents less than $.01 per share.
See accompanying notes which are an integral part of the financial statements.
Notes to Financial Statements
For the period ended October 31, 2005
(Amounts in thousands except ratios)
|
1. Significant Accounting Policies.
Fidelity Advisor Diversified International Fund (the fund) is a fund of Fidelity Advisor Series VIII (the trust) and is authorized to issue an unlimited number of shares. The trust is registered under the Investment Company Act of 1940, as amended (the 1940 Act), as an open-end management investment company organized as a Massachusetts business trust.
The fund offers Class A, Class T, Class B, Class C, and Institutional Class shares, each of which has equal rights as to assets and voting privileges. Each class has exclusive voting rights with respect to matters that affect that class. Class B shares will automatically convert to Class A shares after a holding period of seven years from the initial date of purchase. Investment income, realized and unrealized capital gains and losses, the common expenses of the fund, and certain fund-level expense reductions, if any, are allocated on a pro rata basis to each class based on the relative net assets of each class to the total net assets of the fund. Each class differs with respect to transfer agent and distribution and service plan fees incurred. Certain expense reductions also differ by class.
The fund’s investments in emerging markets can be subject to social, economic, regulatory, and political uncertainties and can be extremely volatile.
The fund may invest in affiliated money market central funds (Money Market Central Funds) which are open-end investment companies available to investment companies and other accounts managed by Fidelity Management & Research Company (FMR) and its affiliates. The financial statements have been prepared in conformity with accounting principles generally accepted in the United States of America, which require management to make certain estimates and assumptions at the date of the financial statements. The following summarizes the significant accounting policies of the fund:
Security Valuation. Investments are valued and net asset value (NAV) per share is calculated (NAV calculation) as of the close of business of the New York Stock Exchange (NYSE), normally 4:00 p.m. Eastern time. Wherever possible, the fund uses independent pricing services approved by the Board of Trustees to value its investments.
Equity securities, including restricted securities, for which market quotations are readily available, are valued at the last reported sale price or official closing price as reported by an independent pricing service on the primary market or exchange on which they are traded. In the event there were no sales during the day or closing prices are not available, securities are valued at the last quoted bid price. Investments in open-end mutual funds, are valued at their closing net asset value each business day. Short-term securities with remaining maturities of sixty days or less for which quotations are not readily available are valued at amortized cost, which approximates value.
31 Annual Report
Notes to Financial Statements - continued
(Amounts in thousands except ratios)
1. Significant Accounting Policies - continued
Security Valuation - continued
When current market prices or quotations are not readily available or do not accurately reflect fair value, valuations may be determined in accordance with procedures adopted by the Board of Trustees. For example, when developments occur between the close of a market and the close of the NYSE that may materially affect the value of some or all of the securities, or when trading in a security is halted, those securities may be fair valued. Factors used in the determination of fair value may include monitoring news to identify significant market or security specific events such as changes in the value of U.S. securities market, reviewing developments in foreign markets and evaluating the performance of ADRs, futures contracts and exchange-traded funds. Because the fund’s utilization of fair value pricing depends on market activity, the frequency with which fair value pricing is used can not be predicted and may be utilized to a significant extent. The value of securities used for NAV calculation under fair value pricing may differ from published prices for the same securities.
Foreign Currency. The fund uses foreign currency contracts to facilitate transactions in foreign-denominated securities. Losses from these transactions may arise from changes in the value of the foreign currency or if the counterparties do not perform under the contracts’ terms.
Foreign-denominated assets, including investment securities, and liabilities are translated into U.S. dollars at the exchange rate at period end. Purchases and sales of investment securities, income and dividends received and expenses denominated in foreign currencies are translated into U.S. dollars at the exchange rate in effect on the transaction date.
The effects of exchange rate fluctuations on investments are included with the net realized and unrealized gain (loss) on investment securities. Other foreign currency transactions resulting in realized and unrealized gain (loss) are disclosed separately.
Investment Transactions and Income. Security transactions are accounted for as of trade date. Gains and losses on securities sold are determined on the basis of identified cost. Dividend income is recorded on the ex-dividend date, except for certain dividends from foreign securities where the ex-dividend date may have passed, which are recorded as soon as the fund is informed of the ex-dividend date. Non-cash dividends included in dividend income, if any, are recorded at the fair market value of the securities received. Distributions received on securities that represent a return of capital or capital gain are recorded as a reduction of cost of investments and/or as a realized gain. The fund estimates the components of distributions received that may be considered return of capital distributions or capital gain distributions. Interest income is accrued as earned. Interest income includes coupon interest and amortization of premium and accretion of discount on debt securities. Investment income is recorded net of foreign taxes withheld where recovery of such taxes is uncertain.
1. Significant Accounting Policies - continued
Expenses. Most expenses of the trust can be directly attributed to a fund. Expenses which cannot be directly attributed are apportioned among each fund in the trust.
Income Tax Information and Distributions to Shareholders. Each year, the fund intends to qualify as a regulated investment company by distributing all of its taxable income and realized gains under Subchapter M of the Internal Revenue Code. As a result, no provision for income taxes is required in the accompanying financial statements. Foreign taxes are provided for based on the fund’s understanding of the tax rules and rates that exist in the foreign markets in which it invests.
Distributions are recorded on the ex-dividend date. Income dividends and capital gain distributions are declared separately for each class. Income and capital gain distributions are determined in accordance with income tax regulations, which may differ from generally accepted accounting principles. In addition, the fund will claim a portion of the payment made to redeeming shareholders as a distribution for income tax purposes.
Capital accounts within the financial statements are adjusted for permanent book-tax differences. These adjustments have no impact on net assets or the results of operations. Temporary book-tax differences will reverse in a subsequent period.
Book-tax differences are primarily due to foreign currency transactions, certain foreign taxes, passive foreign investment companies (PFIC), market discount and losses deferred due to wash sales.
The tax-basis components of distributable earnings and the federal tax cost as of period end were as follows:
| Unrealized appreciation | | $ | | 1,287,906 | | | | |
| Unrealized depreciation | | | | (186,136) | | | | |
| Net unrealized appreciation (depreciation) | | | | 1,101,770 | | | | |
| Undistributed ordinary income | | | | 160,691 | | | | |
| Undistributed long-term capital gain | | | | 315,179 | | | | |
| Cost for federal income tax purposes | | $ | | 7,484,281 | | | | |
| |
| The tax character of distributions paid was as follows: | | | | |
| | | | | October 31, 2005 | | | | October 31, 2004 |
| Ordinary Income | | $ | | 20,958 | | $ | | 10,785 |
| Long-term Capital Gains | | | | 11,568 | | | | — |
| Total | | $ | | 32,526 | | $ | | 10,785 |
33 Annual Report
Notes to Financial Statements - continued
(Amounts in thousands except ratios)
1. Significant Accounting Policies - continued
Short-Term Trading (Redemption) Fees. Shares held in the fund less than 30 days are subject to a redemption fee equal to 1.00% of the proceeds of the redeemed shares. All redemption fees, including any estimated redemption fees paid by FMR, are retained by the fund and accounted for as an addition to paid in capital.
Repurchase Agreements. FMR has received an Exemptive Order from the Securities and Exchange Commission (the SEC) which permits the fund and other affiliated entities of FMR to transfer uninvested cash balances into joint trading accounts which are then invested in repurchase agreements. The fund may also invest directly with institutions in repurchase agreements. Repurchase agreements are collateralized by government or non-government securities. Collateral is held in segregated accounts with custodian banks and may be obtained in the event of a default of the counterparty. The fund monitors, on a daily basis, the value of the collateral to ensure it is at least equal to the principal amount of the repurchase agreement (including accrued interest). In the event of a default by the counterparty, realization of the collateral proceeds could be delayed, during which time the value of the collateral may decline.
Restricted Securities. The fund may invest in securities that are subject to legal or contractual restrictions on resale. These securities generally may be resold in transactions exempt from registration or to the public if the securities are registered. Disposal of these securities may involve time-consuming negotiations and expense, and prompt sale at an acceptable price may be difficult. Information regarding restricted securities is included at the end of the fund’s Schedule of Investments.
3. Purchases and Sales of Investments.
Purchases and sales of securities, other than short-term securities and U.S. government securities, aggregated $6,901,019 and $3,810,647, respectively.
4. Fees and Other Transactions with Affiliates.
Management Fee. FMR and its affiliates provide the fund with investment management related services for which the fund pays a monthly management fee. The management fee is the sum of an individual fund fee rate that is based on an annual rate of .45% of the fund’s average net assets and a group fee rate that averaged .27% during the period. The group fee rate is based upon the average net assets of all the mutual funds advised by FMR. The group fee rate decreases as assets under management increase and increases as assets under management decrease. For the period, the total annual management fee rate was .72% of the fund’s average net assets.
4. Fees and Other Transactions with Affiliates - continued
Distribution and Service Plan. In accordance with Rule 12b-1 of the 1940 Act, the fund has adopted separate Distribution and Service Plans for each class of shares. Certain classes pay Fidelity Distributors Corporation (FDC), an affiliate of FMR, separate Distribution and Service Fees, each of which is based on an annual percentage of each class’ average net assets. In addition, FDC may pay financial intermediaries for selling shares of the fund and providing shareholder support services. For the period, the Distribution and Service Fee rates and the total amounts paid to and retained by FDC were as follows:
| | | Distribution | | Service | | | | Paid to | | | | Retained |
| | | Fee | | Fee | | | | FDC | | | | by FDC |
| Class A | | 0% | | .25% | | $ | | 5,086 | | $ | | 34 |
| Class T | | 25% | | .25% | | | | 9,835 | | | | 436 |
| Class B | | 75% | | .25% | | | | 2,812 | | | | 2,109 |
| Class C | | 75% | | .25% | | | | 5,715 | | | | 2,661 |
| |
| | | | | | | $ | | 23,448 | | $ | | 5,240 |
Sales Load. FDC receives a front-end sales charge of up to 5.75% for selling Class A shares, and 3.50% for selling Class T shares, some of which is paid to financial intermediaries for selling shares of the fund. FDC receives the proceeds of contingent deferred sales charges levied on Class A, Class T, Class B, and Class C redemptions. These charges depend on the holding period. The deferred sales charges range from 5% to 1% for Class B, 1% for Class C, and .25% for certain purchases of Class A and Class T shares.
| For the period, sales charge amounts retained by FDC were as follows: | | |
| | | | | Retained |
| | | | | by FDC |
| Class A | | $ | | 1,377 |
| Class T | | | | 223 |
| Class B* | | | | 360 |
| Class C* | | | | 19 |
| | | $ | | 1,979 |
* When Class B and Class C shares are initially sold, FDC pays commissions from its own resources to financial intermediaries through which the sales are made.
Transfer Agent Fees. Fidelity Investments Institutional Operations Company, Inc. (FIIOC), an affiliate of FMR, is the transfer, dividend disbursing and shareholder servicing agent for each class of the fund. FIIOC receives account fees and asset-based fees that vary according to the account size and type of account of the shareholders of the
35 Annual Report
Notes to Financial Statements - continued
(Amounts in thousands except ratios)
4. Fees and Other Transactions with Affiliates - continued
Transfer Agent Fees - continued
respective classes of the fund. FIIOC pays for typesetting, printing and mailing of shareholder reports, except proxy statements. For the period the total transfer agent fees paid by each class to FIIOC, were as follows:
| | | | | | | % of |
| | | | | | | Average |
| | | | | Amount | | Net Assets |
| Class A | | $ | | 4,508 | | .22 |
| Class T | | | | 4,283 | | .22 |
| Class B | | | | 1,030 | | .37 |
| Class C | | | | 1,487 | | .26 |
| Institutional Class | | | | 3,071 | | .17 |
| |
| | | $ | | 14,379 | | |
Accounting and Security Lending Fees. Fidelity Service Company, Inc. (FSC), an affiliate of FMR, maintains the fund’s accounting records. The accounting fee is based on the level of average net assets for the month. Under a separate contract, FSC administers the security lending program. The security lending fee is based on the number and duration of lending transactions.
Affiliated Central Funds. The fund may invest in Money Market Central Funds which seek preservation of capital and current income and are managed by Fidelity Investments Money Management, Inc. (FIMM), an affiliate of FMR.
The Money Market Central Funds do not pay a management fee. Income distributions earned by the fund are recorded as income in the accompanying financial statements and totaled $8,277 for the period.
Brokerage Commissions. The fund placed a portion of its portfolio transactions with brokerage firms which are affiliates of the investment adviser. The commissions paid to these affiliated firms were $15 for the period.
5. Committed Line of Credit.
|
The fund participates with other funds managed by FMR in a $4.2 billion credit facility (the “line of credit”) to be utilized for temporary or emergency purposes to fund shareholder redemptions or for other short-term liquidity purposes. The fund has agreed to pay commitment fees on its pro rata portion of the line of credit. During the period, there were no borrowings on this line of credit.
The fund lends portfolio securities from time to time in order to earn additional income. The fund receives collateral (in the form of U.S. Treasury obligations, letters of credit and/or cash) against the loaned securities and maintains collateral in an amount not less than 100% of the market value of the loaned securities during the period of the loan. The market value of the loaned securities is determined at the close of business of the fund and any additional required collateral is delivered to the fund on the next business day. If the borrower defaults on its obligation to return the securities loaned because of insolvency or other reasons, a fund could experience delays and costs in recovering the securities loaned or in gaining access to the collateral. Cash collateral is invested in the Fidelity Securities Lending Cash Central Fund. The value of loaned securities and cash collateral at period end are disclosed on the fund’s Statement of Assets and Liabilities. Security lending income represents the income earned on investing cash collateral, less fees and expenses associated with the loan, plus any premium payments that may be received on the loan of certain types of securities.
Many of the brokers with whom FMR places trades on behalf of the fund provided services to the fund in addition to trade execution. These services included payments of certain expenses on behalf of the fund totaling $4,080 for the period. In addition, through arrangements with each class’ transfer agent, credits realized as a result of uninvested cash balances were used to reduce the fund’s expenses. During the period, credits reduced each class’ transfer agent expense as noted in the table below.
| | | | | Transfer Agent |
| | | | | Expense Reduction |
| Class A | | $ | | 6 |
| |
| |
| 8. Other. | | | | |
The fund’s organizational documents provide former and current trustees and officers with a limited indemnification against liabilities arising in connection with the performance of their duties to the fund. In the normal course of business, the fund may also enter into contracts that provide general indemnifications. The fund’s maximum exposure under these arrangements is unknown as this would be dependent on future claims that may be made against the fund. The risk of material loss from such claims is considered remote.
37 Annual Report
| Notes to Financial Statements - continued | | | | |
| (Amounts in thousands except ratios) | | | | | | | | | | |
| |
| |
| 9. Distributions to Shareholders. | | | | | | | | | | |
| |
| Distributions to shareholders of each class were as follows: | | | | | | |
| |
| Years ended October 31, | | | | 2005 | | | | | | 2004 |
| From net investment income | | | | | | | | | | | | |
| Class A | | $ | | | | 4,172 $ | | | | 2,739 |
| Class T | | | | | | | | — | | | | 3,117 |
| Class B | | | | | | | | — | | | | 70 |
| Class C | | | | | | | | — | | | | 442 |
| Institutional Class | | | | | | 6,711 | | | | 4,417 |
| Total | | $ | | | | 10,883 $ | | | | 10,785 |
| From net realized gain | | | | | | | | | | | | |
| Class A | | $ | | | | 6,675 $ | | | | — |
| Class T | | | | | | 7,510 | | | | — |
| Class B | | | | | | | | 505 | | | | — |
| Class C | | | | | | | | 988 | | | | — |
| Institutional Class | | | | | | 5,965 | | | | — |
| Total | | $ | | | | 21,643 $ | | | | — |
| |
| 10. Share Transactions. | | | | | | | | | | |
| |
| Transactions for each class of shares were as follows: | | | | | | | | |
| |
| | | Shares | | | | | | Dollars |
| Years ended October 31, | | 2005 | | 2004 | | | | 2005 | | | | 2004 |
| Class A | | | | | | | | | | | | |
| Shares sold | | 83,477 | | 75,525 | | $ | | 1,580,867 | | $ | | 1,219,587 |
| Reinvestment of | | | | | | | | | | | | |
| distributions | | 432 | | 132 | | | | 7,686 | | | | 2,005 |
| Shares redeemed | | (22,583) | | (15,926) | | | | (426,811) | | | | (257,408) |
| Net increase (decrease) . | | 61,326 | | 59,731 | | $ | | 1,161,742 | | $ | | 964,184 |
| Class T | | | | | | | | | | | | |
| Shares sold | | 60,374 | | 67,315 | | $ | | 1,132,534 | | $ | | 1,076,867 |
| Reinvestment of | | | | | | | | | | | | |
| distributions | | 398 | | 183 | | | | 7,025 | | | | 2,756 |
| Shares redeemed | | (30,276) | | (15,917) | | | | (565,431) | | | | (255,724) |
| Net increase (decrease) . | | 30,496 | | 51,581 | | $ | | 574,128 | | $ | | 823,899 |
| Class B | | | | | | | | | | | | |
| Shares sold | | 7,850 | | 6,650 | | $ | | 143,663 | | $ | | 104,459 |
| Reinvestment of | | | | | | | | | | | | |
| distributions | | 25 | | 4 | | | | 427 | | | | 59 |
| Shares redeemed | | (1,900) | | (1,035) | | | | (34,997) | | | | (16,283) |
| Net increase (decrease) . | | 5,975 | | 5,619 | | $ | | 109,093 | | $ | | 88,235 |
| 10. Share Transactions - continued | | | | | | | | |
| |
| Transactions for each class of shares were as follows - continued | | | | |
| |
| | | Shares | | | | | | Dollars | | |
| Years ended October 31, | | 2005 | | 2004 | | | | 2005 | | | | 2004 |
| Class C | | | | | | | | | | | | |
| Shares sold | | 19,454 | | 16,221 | | $ | | 358,671 | | $ | | 254,211 |
| Reinvestment of | | | | | | | | | | | | |
| distributions | | 40 | | 22 | | | | 699 | | | | 327 |
| Shares redeemed | | (4,021) | | (1,843) | | | | (74,121) | | | | (29,087) |
| Net increase (decrease) . | | 15,473 | | 14,400 | | $ | | 285,249 | | $ | | 225,451 |
| Institutional Class | | | | | | | | | | | | |
| Shares sold | | 64,375 | | 56,867 | | $ | | 1,229,041 | | $ | | 924,747 |
| Reinvestment of | | | | | | | | | | | | |
| distributions | | 418 | | 120 | | | | 7,508 | | | | 1,832 |
| Shares redeemed | | (26,125) | | (14,589) | | | | (509,275) | | | | (241,874) |
| Net increase (decrease) . | | 38,668 | | 42,398 | | $ | | 727,274 | | $ | | 684,705 |
39 Annual Report
Report of Independent Registered Public Accounting Firm
To the Trustees of Fidelity Advisor Series VIII and the Shareholders of Fidelity Advisor Diversified International Fund:
In our opinion, the accompanying statement of assets and liabilities, including the schedule of investments, and the related statements of operations and of changes in net assets and the financial highlights present fairly, in all material respects, the financial position of Fidelity Advisor Diversified International Fund (a fund of Fidelity Advisor Series VIII) at October 31, 2005 and the results of its operations, the changes in its net assets and the financial highlights for the periods indicated, in conformity with accounting principles generally accepted in the United States of America. These financial statements and financial highlights (hereafter referred to as “financial statements”) are the responsibility of the Fidelity Advisor Diversified International Fund’s management; our responsibility is to express an opinion on these financial statements based on our audits. We conducted our audits of these financial statements in accordance with the standards of the Public Company Accounting Oversight Board (United States). Those standards require that we plan and perform the audit to obtain reasonable assurance about whether the financial statements are free of material misstatement. An audit includes examining, on a test basis, evidence supporting the amounts and disclosures in the financial statements, assessing the accounting principles used and significant estimates made by management, and evaluating the overall financial statement presentation. We believe that our audits, which included confirmation of securities at October 31, 2005 by correspondence with the custodian and brokers, provide a reasonable basis for our opinion.
/s/ PricewaterhouseCoopers LLP
PricewaterhouseCoopers LLP
Boston, Massachusetts
December 13, 2005
|
Trustees and Officers
The Trustees, Members of the Advisory Board, and executive officers of the trust and fund, as applicable, are listed below. The Board of Trustees governs the fund and is responsible for protecting the interests of shareholders. The Trustees are experienced executives who meet periodically throughout the year to oversee the fund’s activities, review contractual arrangements with companies that provide services to the fund, and review the fund’s performance. Except for William O. McCoy, Stephen P. Jonas, and Kenneth L. Wolfe, each of the Trustees oversees 322 funds advised by FMR or an affiliate. Mr. McCoy oversees 324 funds advised by FMR or an affiliate. Mr. Jonas and Mr. Wolfe oversee 319 funds advised by FMR or an affiliate.
The Trustees hold office without limit in time except that (a) any Trustee may resign; (b) any Trustee may be removed by written instrument, signed by at least two-thirds of the number of Trustees prior to such removal; (c) any Trustee who requests to be retired or who has become incapacitated by illness or injury may be retired by written instrument signed by a majority of the other Trustees; and (d) any Trustee may be removed at any special meeting of shareholders by a two-thirds vote of the outstanding voting securities of the trust. Each Trustee who is not an interested person (as defined in the 1940 Act) (Independent Trustee), shall retire not later than the last day of the calendar year in which his or her 72nd birthday occurs. The Independent Trustees may waive this mandatory retirement age policy with respect to individual Trustees. The executive officers and Advisory Board Members hold office without limit in time, except that any officer and Advisory Board Member may resign or may be removed by a vote of a majority of the Trustees at any regular meeting or any special meeting of the Trustees. Except as indicated, each individual has held the office shown or other offices in the same company for the past five years.
The fund’s Statement of Additional Information (SAI) includes more information about the Trustees. To request a free copy, call Fidelity at 1-877-208-0098.
Interested Trustees*:
Correspondence intended for each Trustee who is an interested person may be sent to Fidelity Investments, 82 Devonshire Street, Boston, Massachusetts 02109.
| Name, Age; Principal Occupation |
| |
| Edward C. Johnson 3d (75)** |
| |
| Year of Election or Appointment: 1983 |
| Mr. Johnson is Chairman of the Board of Trustees. Mr. Johnson serves as |
| Chief Executive Officer, Chairman, and a Director of FMR Corp.; a Di- |
| rector and Chairman of the Board and of the Executive Committee of |
| FMR; Chairman and a Director of Fidelity Management & Research (Far |
| East) Inc.; Chairman and a Director of Fidelity Investments Money Man- |
| agement, Inc.; and Chairman (2001-present) and a Director |
| (2000-present) of FMR Co., Inc. |
41 Annual Report
Trustees and Officers - continued
| Name, Age; Principal Occupation |
| |
| Abigail P. Johnson (43)** |
| |
| Year of Election or Appointment: 2001 |
| Ms. Johnson serves as President of Fidelity Employer Services Company |
| (FESCO) (2005-present). She is President and a Director of Fidelity In- |
| vestments Money Management, Inc. (2001-present), FMR Co., Inc. |
| (2001-present), and a Director of FMR Corp. Previously, Ms. Johnson |
| served as President and a Director of FMR (2001-2005), Senior Vice |
| President of the Fidelity funds (2001-2005), and managed a number of |
| Fidelity funds. |
| |
| Stephen P. Jonas (52) |
| |
| Year of Election or Appointment: 2005 |
| Mr. Jonas is Senior Vice President of Advisor Diversified International |
| (2005-present). He also serves as Senior Vice President of other Fidelity |
| funds (2005-present). Mr. Jonas is Executive Director of FMR |
| (2005-present). Previously, Mr. Jonas served as President of Fidelity |
| Enterprise Operations and Risk Services (2004-2005), Chief Adminis- |
| trative Officer (2002-2004), and Chief Financial Officer of FMR Co. |
| (1998-2000). Mr. Jonas has been with Fidelity Investments since 1987 |
| and has held various financial and management positions including |
| Chief Financial Officer of FMR. In addition, he serves on the Boards of |
| Boston Ballet (2003-present) and Simmons College (2003-present). |
| |
| Robert L. Reynolds (53) |
| |
| Year of Election or Appointment: 2003 |
| Mr. Reynolds is a Director (2003-present) and Chief Operating Officer |
| (2002-present) of FMR Corp. He also serves on the Board at Fidelity |
| Investments Canada, Ltd. (2000-present). Previously, Mr. Reynolds |
| served as President of Fidelity Investments Institutional Retirement Group |
| (1996-2000). |
* Trustees have been determined to be “Interested Trustees” by virtue of, among other things, their affiliation with the trust or various entities under common control with FMR.
** Edward C. Johnson 3d, Trustee, is Abigail P. Johnson’s father.
Annual Report 42
Independent Trustees:
Correspondence intended for each Independent Trustee (that is, the Trustees other than the Interested Trustees) may be sent to Fidelity Investments, P.O. Box 55235, Boston, Massachusetts 02205-5235.
| Name, Age; Principal Occupation |
| |
| Dennis J. Dirks (57) |
| |
| Year of Election or Appointment: 2005 |
| Prior to his retirement in May 2003, Mr. Dirks was Chief Operating |
| Officer and a member of the Board of The Depository Trust & Clearing |
| Corporation (DTCC) (1999-2003). He also served as President, Chief |
| Operating Officer, and Board member of The Depository Trust Comp- |
| any (DTC) (1999-2003) and President and Board member of the |
| National Securities Clearing Corporation (NSCC) (1999-2003). In addi- |
| tion, Mr. Dirks served as Chief Executive Officer and Board member of |
| the Government Securities Clearing Corporation (2001-2003) and Chief |
| Executive Officer and Board member of the Mortgage-Backed Securities |
| Clearing Corporation (2001-2003). Mr. Dirks also serves as a Trustee of |
| Manhattan College (2005-present). |
| |
| Robert M. Gates (62) |
| |
| Year of Election or Appointment: 1997 |
| Dr. Gates is Vice Chairman of the Independent Trustees (2005-present). |
| Dr. Gates is President of Texas A&M University (2002-present). He was |
| Director of the Central Intelligence Agency (CIA) from 1991 to 1993. |
| From 1989 to 1991, Dr. Gates served as Assistant to the President of |
| the United States and Deputy National Security Advisor. Dr. Gates is a |
| Director of NACCO Industries, Inc. (mining and manufacturing), Parker |
| Drilling Co., Inc. (drilling and rental tools for the energy industry, |
| 2001-present), and Brinker International (restaurant management, |
| 2003-present). Previously, Dr. Gates served as a Director of LucasVarity |
| PLC (automotive components and diesel engines), a Director of TRW Inc. |
| (automotive, space, defense, and information technology), and Dean of |
| the George Bush School of Government and Public Service at Texas |
| A&M University (1999-2001). Dr. Gates also is a Trustee of the Forum |
| for International Policy. |
43 Annual Report
Trustees and Officers - continued
| Name, Age; Principal Occupation |
| |
| George H. Heilmeier (69) |
| |
| Year of Election or Appointment: 2004 |
| Dr. Heilmeier is Chairman Emeritus of Telcordia Technologies (commu- |
| nication software and systems), where prior to his retirement, he served |
| as company Chairman and Chief Executive Officer. He currently serves |
| on the Boards of Directors of The Mitre Corporation (systems engineer- |
| ing and information technology support for the government), and HRL |
| Laboratories (private research and development, 2004-present). He is |
| Chairman of the General Motors Science & Technology Advisory Board |
| and a Life Fellow of the Institute of Electrical and Electronics Engineers |
| (IEEE) (2000-present). Dr. Heilmeier is a member of the Defense Science |
| Board and the National Security Agency Advisory Board. He is also a |
| member of the National Academy of Engineering, the American Aca- |
| demy of Arts and Sciences, and the Board of Overseers of the School of |
| Engineering and Applied Science of the University of Pennsylvania. Pre- |
| viously, Dr. Heilmeier served as a Director of TRW Inc. (automotive, |
| space, defense, and information technology, 1992-2002), Compaq |
| (1994-2002), Automatic Data Processing, Inc. (ADP) (technology-based |
| business outsourcing, 1995-2002), INET Technologies Inc. (telecommu- |
| nications network surveillance, 2001-2004), and Teletech Holdings (cus- |
| tomer management services). He is the recipient of the 2005 Kyoto Prize |
| in Advanced Technology for his invention of the liquid display. |
| |
| Marie L. Knowles (59) |
| |
| Year of Election or Appointment: 2001 |
| Prior to Ms. Knowles’ retirement in June 2000, she served as Executive |
| Vice President and Chief Financial Officer of Atlantic Richfield Company |
| (ARCO) (diversified energy, 1996-2000). From 1993 to 1996, she was |
| a Senior Vice President of ARCO and President of ARCO Transportation |
| Company. She served as a Director of ARCO from 1996 to 1998. She |
| currently serves as a Director of Phelps Dodge Corporation (copper |
| mining and manufacturing) and McKesson Corporation (healthcare ser- |
| vice, 2002-present). Ms. Knowles is a Trustee of the Brookings Institution |
| and the Catalina Island Conservancy and also serves as a member of |
| the Advisory Board for the School of Engineering of the University of |
| Southern California. |
Annual Report 44
| Name, Age; Principal Occupation |
| |
| Ned C. Lautenbach (61) |
| |
| Year of Election or Appointment: 2000 |
| Mr. Lautenbach has been a partner of Clayton, Dubilier & Rice, Inc. |
| (private equity investment firm) since September 1998. Previously, Mr. |
| Lautenbach was with the International Business Machines Corporation |
| (IBM) from 1968 until his retirement in 1998. Mr. Lautenbach serves as |
| a Director of Italtel Holding S.p.A. (telecommunications (Milan, Italy), |
| 2004-present) and Eaton Corporation (diversified industrial) as well as |
| the Philharmonic Center for the Arts in Naples, Florida. He also is a |
| member of the Board of Trustees of Fairfield University (2005-present), |
| as well as a member of the Council on Foreign Relations. |
| |
| Marvin L. Mann (72) |
| |
| Year of Election or Appointment: 1993 |
| Mr. Mann is Chairman of the Independent Trustees (2001-present). He is |
| Chairman Emeritus of Lexmark International, Inc. (computer |
| peripherals), where he served as CEO until April 1998, retired as |
| Chairman May 1999, and remains a member of the Board. Prior to |
| 1991, he held the positions of Vice President of International Business |
| Machines Corporation (IBM) and President and General Manager of |
| various IBM divisions and subsidiaries. He is a member of the Executive |
| Committee of the Independent Director’s Council of the Investment Com- |
| pany Institute. In addition, Mr. Mann is a member of the President’s |
| Cabinet at the University of Alabama and the Board of Visitors of the |
| Culverhouse College of Commerce and Business Administration at the |
| University of Alabama. |
| |
| William O. McCoy (72) |
| |
| Year of Election or Appointment: 1997 |
| Prior to his retirement in December 1994, Mr. McCoy was Vice Chair- |
| man of the Board of BellSouth Corporation (telecommunications) and |
| President of BellSouth Enterprises. He is currently a Director of Liberty |
| Corporation (holding company), Duke Realty Corporation (real estate), |
| and Progress Energy, Inc. (electric utility). He is also a partner of Frank- |
| lin Street Partners (private investment management firm) and a member |
| of the Research Triangle Foundation Board. In addition, Mr. McCoy |
| served as the Interim Chancellor (1999-2000) and a member of the |
| Board of Visitors for the University of North Carolina at Chapel Hill and |
| currently serves on the Board of Directors of the University of North |
| Carolina Health Care System and the Board of Visitors of the Kenan- |
| Flagler Business School (University of North Carolina at Chapel Hill). He |
| also served as Vice President of Finance for the University of North Car- |
| olina (16-school system). |
45 Annual Report
Trustees and Officers - continued
| Name, Age; Principal Occupation |
| |
| Cornelia M. Small (61) |
| |
| Year of Election or Appointment: 2005 |
| Ms. Small is a member (2000-present) and Chairperson (2002-present) |
| of the Investment Committee, and a member (2002-present) of the |
| Board of Trustees of Smith College. Previously, she served as Chief In- |
| vestment Officer (1999-2000), Director of Global Equity Investments |
| (1996-1999), and a member of the Board of Directors of Scudder, |
| Stevens & Clark (1990-1997) and Scudder Kemper Investments |
| (1997-1998). In addition, Ms. Small served as Co-Chair (2000-2003) |
| of the Annual Fund for the Fletcher School of Law and Diplomacy. |
| |
| William S. Stavropoulos (66) |
| |
| Year of Election or Appointment: 2001 |
| Mr. Stavropoulos is Chairman of the Board (2000-present) and a Mem- |
| ber of the Board of Directors of The Dow Chemical Company. Since |
| joining The Dow Chemical Company in 1967, Mr. Stavropoulos served |
| in numerous senior management positions, including President |
| (1993-2000; 2002-2003), CEO (1995-2000; 2002-2004), and Chair- |
| man of the Executive Committee (2000-2004). Currently, he is a Direc- |
| tor of NCR Corporation (data warehousing and technology solutions), |
| BellSouth Corporation (telecommunications), Chemical Financial Corpo- |
| ration, Maersk Inc. (industrial conglomerate, 2002-present), and Metal- |
| mark Capital (private equity investment firm, 2005-present). He also |
| serves as a member of the Board of Trustees of the American Enterprise |
| Institute for Public Policy Research. In addition, Mr. Stavropoulos is a |
| member of The Business Council, J.P. Morgan International Council and |
| the University of Notre Dame Advisory Council for the College of |
| Science. |
| |
| Kenneth L. Wolfe (66) |
| |
| Year of Election or Appointment: 2005 |
| Mr. Wolfe also serves as a Trustee (2005-present) or Member of the |
| Advisory Board (2004-present) of other investment companies advised |
| by FMR. Prior to his retirement in 2001, Mr. Wolfe was Chairman and |
| Chief Executive Officer of Hershey Foods Corporation (1993-2001). He |
| currently serves as a member of the boards of Adelphia Communica- |
| tions Corporation (2003-present), Bausch & Lomb, Inc., and Revlon Inc. |
| (2004-present). |
Annual Report 46
Advisory Board Members and Executive Officers:
Correspondence intended for Mr. Gamper may be sent to Fidelity Investments, P.O. Box 55235, Boston, Massachusetts 02205-5235. Correspondence intended for each executive officer and Mr. Lynch may be sent to Fidelity Investments, 82 Devonshire Street, Boston, Massachusetts 02109.
| Name, Age; Principal Occupation |
| |
| Albert R. Gamper, Jr. (63) |
| |
| Year of Election or Appointment: 2005 |
| Member of the Advisory Board of Fidelity Advisor Series VIII. Prior to his |
| retirement in December 2004, Mr. Gamper served as Chairman of the |
| Board of CIT Group Inc. (commercial finance). During his tenure with |
| CIT Group Inc. Mr. Gamper served in numerous senior management |
| positions, including Chairman (1987-1989; 1999-2001; 2002-2004), |
| Chief Executive Officer (1987-2004), and President (1989-2002). He |
| currently serves as a member of the Board of Directors of Public Service |
| Enterprise Group (utilities, 2001-present), Chairman of the Board of |
| Governors, Rutgers University (2004-present), and Chairman of the |
| Board of Saint Barnabas Health Care System. |
| |
| Peter S. Lynch (61) |
| |
| Year of Election or Appointment: 2003 |
| Member of the Advisory Board of Fidelity Advisor Series VIII. Vice |
| Chairman and a Director of FMR, and Vice Chairman (2001-present) |
| and a Director (2000-present) of FMR Co., Inc. Previously, Mr. Lynch |
| served as a Trustee of the Fidelity funds (1990-2003). In addition, he |
| serves as a Trustee of Boston College, Massachusetts Eye & Ear Infir- |
| mary, Historic Deerfield, John F. Kennedy Library, and the Museum of |
| Fine Arts of Boston. |
| |
| Dwight D. Churchill (51) |
| |
| Year of Election or Appointment: 2005 |
| Vice President of Advisor Diversified International. Mr. Churchill also |
| serves as Vice President of certain Equity Funds (2005-present) and |
| certain High Income Funds (2005-present). Previously, he served as |
| Head of Fidelity’s Fixed-Income Division (2000-2005), Vice President of |
| Fidelity’s Money Market Funds (2000-2005), Vice President of Fidelity’s |
| Bond Funds, and Senior Vice President of FIMM (2000) and FMR. Mr. |
| Churchill joined Fidelity in 1993 as Vice President and Group Leader of |
| Taxable Fixed-Income Investments. |
| |
| Penelope A. Dobkin (51) |
| |
| Year of Election or Appointment: 2004 |
| Vice President of Advisor Diversified International. Prior to assuming her |
| current responsibilities, Ms. Dobkin managed a variety of Fidelity funds. |
| Ms. Dobkin also serves as Vice President of FMR and FMR Co., Inc. |
47 Annual Report
Trustees and Officers - continued
| Name, Age; Principal Occupation |
| |
| Eric D. Roiter (56) |
| |
| Year of Election or Appointment: 1998 |
| Secretary of Advisor Diversified International. He also serves as Secre- |
| tary of other Fidelity funds; Vice President, General Counsel, and Secre- |
| tary of FMR Co., Inc. (2001-present) and FMR; Assistant Secretary of |
| Fidelity Management & Research (U.K.) Inc. (2001-present), Fidelity |
| Management & Research (Far East) Inc. (2001-present), and Fidelity |
| Investments Money Management, Inc. (2001-present). Mr. Roiter is an |
| Adjunct Member, Faculty of Law, at Boston College Law School |
| (2003-present). Previously, Mr. Roiter served as Vice President and |
| Secretary of Fidelity Distributors Corporation (FDC) (1998-2005). |
| |
| Stuart Fross (46) |
| |
| Year of Election or Appointment: 2003 |
| Assistant Secretary of Advisor Diversified International. Mr. Fross also |
| serves as Assistant Secretary of other Fidelity funds (2003-present), Vice |
| President and Secretary of FDC (2005-present), and is an employee of |
| FMR. |
| |
| Christine Reynolds (47) |
| |
| Year of Election or Appointment: 2004 |
| President, Treasurer, and Anti-Money Laundering (AML) officer of Advi- |
| sor Diversified International. Ms. Reynolds also serves as President, Trea- |
| surer, and AML officer of other Fidelity funds (2004) and is a Vice |
| President (2003) and an employee (2002) of FMR. Before joining |
| Fidelity Investments, Ms. Reynolds worked at PricewaterhouseCoopers |
| LLP (PwC) (1980-2002), where she was most recently an audit partner |
| with PwC’s investment management practice. |
| |
| Paul M. Murphy (58) |
| |
| Year of Election or Appointment: 2005 |
| Chief Financial Officer of Advisor Diversified International. Mr. Murphy |
| also serves as Chief Financial Officer of other Fidelity funds |
| (2005-present). He also serves as Senior Vice President of Fidelity Pric- |
| ing and Cash Management Services Group (FPCMS). |
| |
| Kenneth A. Rathgeber (58) |
| |
| Year of Election or Appointment: 2004 |
| Chief Compliance Officer of Advisor Diversified International. Mr. Rath- |
| geber also serves as Chief Compliance Officer of other Fidelity funds |
| (2004) and Executive Vice President of Risk Oversight for Fidelity Invest- |
| ments (2002). Previously, he served as Executive Vice President and |
| Chief Operating Officer for Fidelity Investments Institutional Services |
| Company, Inc. (1998-2002). |
Annual Report 48
| Name, Age; Principal Occupation |
| |
| John R. Hebble (47) |
| |
| Year of Election or Appointment: 2003 |
| Deputy Treasurer of Advisor Diversified International. Mr. Hebble also |
| serves as Deputy Treasurer of other Fidelity funds (2003), and is an |
| employee of FMR. Before joining Fidelity Investments, Mr. Hebble |
| worked at Deutsche Asset Management where he served as Director of |
| Fund Accounting (2002-2003) and Assistant Treasurer of the Scudder |
| Funds (1998-2003). |
| |
| Bryan A. Mehrmann (44) |
| |
| Year of Election or Appointment: 2005 |
| Deputy Treasurer of Advisor Diversified International. Mr. Mehrmann |
| also serves as Deputy Treasurer of other Fidelity funds (2005-present) |
| and is an employee of FMR. Previously, Mr. Mehrmann served as Vice |
| President of Fidelity Investments Institutional Services Group (FIIS)/ |
| Fidelity Investments Institutional Operations Corporation, Inc. (FIIOC) |
| Client Services (1998-2004). |
| |
| Kimberley H. Monasterio (41) |
| |
| Year of Election or Appointment: 2004 |
| Deputy Treasurer of Advisor Diversified International. Ms. Monasterio |
| also serves as Deputy Treasurer of other Fidelity funds (2004) and is an |
| employee of FMR (2004). Before joining Fidelity Investments, Ms. |
| Monasterio served as Treasurer (2000-2004) and Chief Financial Offi- |
| cer (2002-2004) of the Franklin Templeton Funds and Senior Vice Presi- |
| dent of Franklin Templeton Services, LLC (2000-2004). |
| |
| Kenneth B. Robins (36) |
| |
| Year of Election or Appointment: 2005 |
| Deputy Treasurer of Advisor Diversified International. Mr. Robins also |
| serves as Deputy Treasurer of other Fidelity funds (2005-present) and is |
| an employee of FMR (2004-present). Before joining Fidelity Investments, |
| Mr. Robins worked at KPMG LLP, where he was a partner in KPMG’s |
| department of professional practice (2002-2004) and a Senior |
| Manager (1999-2000). In addition, Mr. Robins served as Assistant |
| Chief Accountant, United States Securities and Exchange Commission |
| (2000-2002). |
49 Annual Report
Trustees and Officers - continued
| Name, Age; Principal Occupation |
| |
| Robert G. Byrnes (38) |
| |
| Year of Election or Appointment: 2005 |
| Assistant Treasurer of Advisor Diversified International. Mr. Byrnes also |
| serves as Assistant Treasurer of other Fidelity funds (2005-present) and |
| is an employee of FMR (2005-present). Previously, Mr. Byrnes served as |
| Vice President of FPCMS (2003-2005). Before joining Fidelity Invest- |
| ments, Mr. Byrnes worked at Deutsche Asset Management where he |
| served as Vice President of the Investment Operations Group |
| (2000-2003). |
| |
| John H. Costello (59) |
| |
| Year of Election or Appointment: 1998 |
| Assistant Treasurer of Advisor Diversified International. Mr. Costello also |
| serves as Assistant Treasurer of other Fidelity funds and is an employee |
| of FMR. |
| |
| Peter L. Lydecker (51) |
| |
| Year of Election or Appointment: 2004 |
| Assistant Treasurer of Advisor Diversified International. Mr. Lydecker |
| also serves as Assistant Treasurer of other Fidelity funds (2004) and is |
| an employee of FMR. |
| |
| Mark Osterheld (50) |
| |
| Year of Election or Appointment: 2002 |
| Assistant Treasurer of Advisor Diversified International. Mr. Osterheld |
| also serves as Assistant Treasurer of other Fidelity funds (2002) and is |
| an employee of FMR. |
| |
| Gary W. Ryan (47) |
| |
| Year of Election or Appointment: 2005 |
| Assistant Treasurer of Advisor Diversified International. Mr. Ryan also |
| serves as Assistant Treasurer of other Fidelity funds (2005-present) and |
| is an employee of FMR (2005-present). Previously, Mr. Ryan served as |
| Vice President of Fund Reporting in FPCMS (1999-2005). |
| |
| Salvatore Schiavone (39) |
| |
| Year of Election or Appointment: 2005 |
| Assistant Treasurer of Advisor Diversified International. Mr. Schiavone |
| also serves as Assistant Treasurer of other Fidelity funds (2005-present) |
| and is an employee of FMR (2005-present). Before joining Fidelity In- |
| vestments, Mr. Schiavone worked at Deutsche Asset Management, |
| where he most recently served as Assistant Treasurer (2003-2005) of |
| the Scudder Funds and Vice President and Head of Fund Reporting |
| (1996-2003). |
Annual Report 50
The Board of Trustees of Advisor Diversified International Fund voted to pay to shareholders of record at the opening of business on record date, the following distributions per share derived from capital gains realized from sales of portfolio securities, and dividends derived from net investment income:
| | | Pay Date | | Record Date | | Dividends | | Capital Gains |
| Institutional Class | | 12/12/05 | | 12/9/05 | | $.178 | | $.950 |
The fund hereby designates as capital gain dividends: For dividends with respect to the taxable year ended October 31, 2005, $315,626,993, or, if subsequently determined to be different, the net capital gain of such year, and for dividends with respect to the taxable year ended October 31 2004, $11,119,861, or, if subsequently determined to be different, the excess of: (a) the net capital gain of such year, over (b) amounts previously designated as capital gain dividends with respect to such year.
Institutional Class designates 100% of the dividend distributed during the fiscal year as amounts which may be taken into account as a dividend for purposes of the maximum rate under section 1(h)(11) of the Internal Revenue Code.
The amounts per share which represent income derived from sources within, and taxes paid to, foreign countries or possessions of the United States are as follows:
| | | Pay Date | | Dividends | | Capital Gains |
| Institutional Class | | 12/13/04 | | $.146 | | $.016 |
The fund will notify shareholders in January 2006 of amounts for use in preparing 2005 income tax returns.
51 Annual Report
Board Approval of Investment Advisory Contracts and Management Fees
Advisor Diversified International Fund
Each year, typically in July, the Board of Trustees, including the independent Trustees (together, the Board), votes on the renewal of the management contract and sub-advisory agreements (together, the Advisory Contracts) for the fund. The Board, assisted by the advice of fund counsel and independent Trustees’ counsel, requests and considers a broad range of information throughout the year.
The Board meets regularly each month except August and takes into account throughout the year matters bearing on Advisory Contracts. The Board, acting directly and through its separate committees, considers at each of its meetings factors that are relevant to the annual renewal of the fund’s Advisory Contracts, including the services and support provided to the fund and its shareholders by Fidelity. At the time of the renewal, the Board had 11 standing committees, each composed of independent Trustees with varying backgrounds, to which the Board has assigned specific subject matter responsibilities in order to enhance effective decision-making by the Board. Each committee has adopted a written charter outlining the structure and purposes of the committee. One such committee, the Equity Contract Committee, meets periodically during the first six months of each year and as necessary to consider matters specifically related to the annual renewal of Advisory Contracts. The committee requests and receives information on, and makes recommendations to the independent Trustees concerning, the approval and annual review of the Advisory Contracts.
At its July 2005 meeting, the Board of Trustees, including the independent Trustees, unanimously determined to renew the Advisory Contracts for the fund. In reaching its determination, the Board considered all factors it believed relevant, including (1) the nature, extent, and quality of the services to be provided to the fund and its shareholders by Fidelity (including the investment performance of the fund); (2) the competitiveness of the management fee and total expenses of the fund; (3) the total costs of the services to be provided by and the profits to be realized by the investment adviser and its affiliates from the relationship with the fund; (4) the extent to which economies of scale would be realized as the fund grows; and (5) whether fee levels reflect these economies of scale, if any, for the benefit of fund shareholders.
In determining whether to renew the Advisory Contracts for the fund, the Board ultimately reached a determination, with the assistance of fund counsel and independent Trustees’ counsel, that the renewal of the Advisory Contracts and the compensation to be received by Fidelity under the management contract is consistent with Fidelity’s fiduciary duty under applicable law. In addition to evaluating the specific factors noted above, the Board, in reaching its determination, is aware that shareholders in the fund have a broad range of investment choices available to them, including a wide choice among mutual funds offered by competitors to Fidelity, and that the fund’s shareholders, with the opportunity to review and weigh the disclosure provided by the fund in its
prospectus and other public disclosures, have chosen to invest in this fund, managed by Fidelity.
Nature, Extent, and Quality of Services Provided by Fidelity. The Board considered staffing within the investment adviser, FMR, and the sub-advisers (together, the Investment Advisers), including the background of the fund’s portfolio manager and the fund’s investment objective and discipline. The independent Trustees also had discussions with senior management of Fidelity’s investment operations and investment groups. The Board considered the structure of the portfolio manager compensation program and whether this structure provides appropriate incentives.
Fidelity Resources Dedicated to Investment Management and Support Services. The Board reviewed the size, education, and experience of the Investment Advisers’ investment staff, their use of technology, and the Investment Advisers’ approach to recruiting, training, and retaining portfolio managers and other research, advisory, and management personnel. The Board considered Fidelity’s extensive global research capabilities that enable the Investment Advisers to aggregate data from various sources in an effort to produce positive investment results. The Board noted that Fidelity’s analysts have access to a variety of technological tools that enable them to perform both fundamental and quantitative analysis and to specialize in various disciplines. The Board also considered that Fidelity’s portfolio managers and analysts have access to daily portfolio attribution that allows for monitoring of a fund’s portfolio, as well as an electronic communication system that provides immediate real-time access to research concerning issuers and credit enhancers.
Shareholder and Administrative Services. The Board considered the nature, extent, quality, and cost of administrative, distribution, and shareholder services performed by the Investment Advisers and their affiliates under the Advisory Contracts and under separate agreements covering transfer agency, pricing and bookkeeping, and securities lending services for the fund. The Board also considered the nature and extent of the Investment Advisers’ supervision of third party service providers, principally custodians and subcustodians. The Board reviewed the allocation of fund brokerage, including allocations to brokers affiliated with the Investment Advisers, the use of brokerage commissions to pay fund expenses, and the use of “soft” commission dollars to pay for research services. The Board also considered that Fidelity voluntarily decided in 2004 to stop using “soft” commission dollars to pay for market data and, instead, to pay for that data out of its own resources. The Board also considered the resources devoted to, and the record of compliance with, the fund’s compliance policies and procedures.
The Board noted that the growth of fund assets across the complex allows Fidelity to reinvest in the development of services designed to enhance the value or convenience of the Fidelity funds as investment vehicles. These services include 24-hour access to
53 Annual Report
Board Approval of Investment Advisory Contracts and Management Fees - continued
account information and market information through phone representatives and over the Internet, and investor education materials and asset allocation tools.
Investment in a Large Fund Family. The Board considered the benefits to shareholders of investing in a Fidelity fund, including the benefits of investing in a fund that is part of a large family of funds offering a variety of investment disciplines and providing for a large variety of mutual fund investor services. For example, fund shareholders are offered the privilege of exchanging shares of the fund for shares of other Fidelity funds, as set forth in the fund’s prospectus, without paying an additional sales charge. The Board noted that, since the last Advisory Contract renewals in July 2004, Fidelity has taken a number of actions that benefited particular funds, including (i) voluntarily deciding in 2004 to stop using “soft” commission dollars to pay for market data and, instead, to pay for that data out of its own resources, (ii) contractually agreeing to impose management fee reductions and expense limitations on its five Spartan stock index funds and its stock index fund available through variable insurance products, (iii) contractually agreeing to eliminate the management fees on the Fidelity Freedom Funds and the Fidelity Advisor Freedom Funds, (iv) contractually agreeing to reduce the management fees on most of its investment-grade taxable bond funds, and (v) contractually agreeing to impose expense limitations on its retail and Spartan investment-grade taxable bond funds.
Investment Performance and Compliance. The Board considered whether the fund has operated within its investment objective, as well as its record of compliance with its investment restrictions. It also reviewed the fund’s absolute investment performance for each class, as well as the fund’s relative investment performance for each class measured against (i) a broad-based securities market index, and (ii) a peer group of mutual funds deemed appropriate by the Board over multiple periods. The following charts considered by the Board show, over the one-, three-, and five-year periods ended December 31, 2004, the returns of Class C and Institutional Class of the fund, the returns of a broad-based securities market index (“benchmark”), and a range of returns of a peer group of mutual funds identified by Lipper Inc. as having an investment objective similar to that of the fund. The returns of Class C and Institutional Class represent the performance of classes with the highest and lowest 12b-1 fees, respectively (not necessarily with the highest and lowest total expenses). The box within each chart shows the 25th percentile return (bottom of box) and the 75th percentile return (top of box) of the Lipper peer group. Returns shown above the box are in the first quartile and returns shown below the box are in the fourth quartile. The percentage beaten numbers noted below each chart correspond to the percentile box and represent the percentage of funds in the Lipper peer group whose performance was equal to or lower than that of the class indicated.
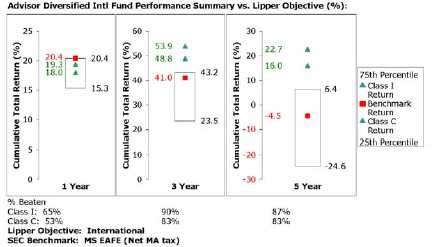
The Board reviewed the fund’s relative investment performance against its Lipper peer group and stated that the performance of Institutional Class of the fund was in the second quartile for the one-year period and the first quartile for the three- and five-year periods. The Board also stated that the relative investment performance of Institutional Class of the fund has compared favorably to its benchmark over time, although the fund’s one-year cumulative total return was lower than its benchmark. The Board considered that the variations in performance among the fund’s classes reflect the variations in class expenses, which result in lower performance for higher expense classes.
The Board has had thorough discussions with FMR throughout the year about the Board’s and FMR’s concerns about equity research, equity fund performance, and compliance with internal policies governing gifts and entertainment. FMR has taken steps that it believes will refocus and strengthen equity research and equity portfolio management and compliance. The Board noted with favor FMR’s recent reorganization of its senior management team and FMR’s plans to dedicate additional resources to investment research, and participated in the process that led to those changes.
Based on its review, and giving particular weight to the nature and quality of the resources dedicated by the Investment Advisers to maintain and improve relative performance, the Board concluded that the nature, extent, and quality of the services provided by Fidelity will benefit the fund’s shareholders, particularly in light of the Board’s view that the fund’s shareholders benefit from investing in a fund that is part of a large family of funds offering a variety of investment disciplines and services.
Competitiveness of Management Fee and Total Fund Expenses. The Board considered the fund’s management fee and total expenses compared to “mapped groups”
55 Annual Report
Board Approval of Investment Advisory Contracts and Management Fees - continued
of competitive funds and classes. Fidelity creates “mapped groups” by combining similar Lipper investment objective categories that have comparable management fee characteristics. Combining Lipper investment objective categories aids the Board’s management fee and total expense comparisons by broadening the competitive group used for comparison and by reducing the number of universes to which various Fidelity funds are compared.
The Board considered two proprietary management fee comparisons for the 12-month periods shown in the chart below. The group of Lipper funds used by the Board for management fee comparisons is referred to below as the “Total Mapped Group” and, for the reasons explained above, is broader than the Lipper peer group used by the Board for performance comparisons. The Total Mapped Group comparison focuses on a fund’s standing relative to the total universe of comparable funds available to investors, in terms of gross management fees before expense reimbursements or caps. “TMG %” represents the percentage of funds in the Total Mapped Group that had management fees that were lower than the fund’s. For example, a TMG % of 21% means that 79% of the funds in the Total Mapped Group had higher management fees than the fund. The “Asset-Size Peer Group” (ASPG) comparison focuses on a fund’s standing relative to non-Fidelity funds similar in size to the fund within the Total Mapped Group. The ASPG represents at least 15% of the funds in the Total Mapped Group with comparable asset size and management fee characteristics, subject to a minimum of 50 funds (or all funds in the Total Mapped Group if fewer than 50). Additional information, such as the ASPG quartile (“quadrant”) in which the fund’s management fee ranked, is also included in the chart and considered by the Board.
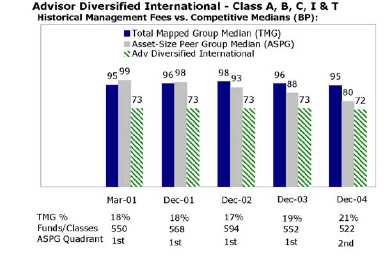
Annual Report 56
The Board noted that the fund’s management fee ranked below the median of its Total Mapped Group and below the median of its ASPG for 2004.
Based on its review, the Board concluded that the fund’s management fee was fair and reasonable in light of the services that the fund receives and the other factors considered.
In its review of each class’s total expenses, the Board considered the fund’s management fee as well as other fund or class expenses, as applicable, such as transfer agent fees, pricing and bookkeeping fees, fund-paid 12b-1 fees, and custodial, legal, and audit fees. The Board also noted the effects of any waivers and reimbursements on fees and expenses. As part of its review, the Board also considered current and historical total expenses of each class of the fund compared to competitive fund median expenses. Each class of the fund is compared to those funds and classes in the Total Mapped Group (used by the Board for management fee comparisons) that have a similar sales load structure.
The Board noted that each class’s total expenses ranked below its competitive median for 2004.
In its review of total expenses, the Board also considered Fidelity fee structures and other information on clients that FMR and its affiliates service in other competitive markets, such as other mutual funds advised or subadvised by FMR or its affiliates, pension plan clients, and other institutional clients.
Based on its review, the Board concluded that the total expenses for each class of the fund were reasonable in light of the services that the fund and its shareholders receive and the other factors considered.
Costs of the Services and Profitability. The Board considered the revenues earned and the expenses incurred by Fidelity in conducting the business of developing, marketing, distributing, managing, administering and servicing the fund and its shareholders. The Board also considered the level of Fidelity’s profits in respect of all the Fidelity funds.
On an annual basis, FMR presents to the Board Fidelity’s profitability for the fund. Fidelity calculates the profitability for each fund, as well as aggregate profitability for groups of Fidelity funds and all Fidelity funds, using a series of detailed revenue and cost allocation methodologies which originate with the audited books and records of Fidelity. The Audit Committee of the Board reviews any significant changes from the prior year’s methodologies.
PricewaterhouseCoopers LLP (PwC), independent registered accounting firm and auditor to Fidelity and certain Fidelity funds, has been engaged annually by the Board as part of the Board’s assessment of the results of Fidelity’s profitability analysis. PwC’s
57 Annual Report
Board Approval of Investment Advisory Contracts and Management Fees - continued
engagement includes the review and assessment of Fidelity’s methodologies used in determining the revenues and expenses attributable to Fidelity’s mutual fund business, and completion of agreed-upon procedures surrounding the mathematical accuracy of fund profitability and its conformity to allocation methodologies. After considering PwC’s reports issued under the engagement and information provided by Fidelity, the Board believes that while other allocation methods may also be reasonable, Fidelity’s profitability methodologies are reasonable in all material respects.
The Board has also reviewed Fidelity’s non-fund businesses and any fall-out benefits related to the mutual fund business as well as cases where Fidelity’s affiliates may benefit from or be related to the fund’s business. In addition, a special committee of the Board reviewed services provided to Fidelity by its affiliates and determined that the fees that Fidelity paid for such services were reasonable.
The Board considered the costs of the services provided by and the profits realized by Fidelity in connection with the operation of the fund and determined that the amount of profit is a fair entrepreneurial profit for the management of the fund.
Economies of Scale. The Board considered whether there have been economies of scale in respect of the management of the Fidelity funds, whether the Fidelity funds (including the fund) have appropriately benefited from any such economies of scale, and whether there is potential for realization of any further economies of scale. The Board considered the extent to which the fund will benefit from economies of scale through increased services to the fund, through waivers or reimbursements, or through fee or expense reductions, including reductions that occur through operation of the transfer agent agreement. The transfer agent fee varies in part based on the number of accounts in the fund. If the number of accounts decreases or the average account size increases, the overall transfer agent fee rate decreases.
The Board recognized that the fund’s management contract incorporates a “group fee” structure, which provides for lower fee rates as total fund assets under FMR’s management increase, and for higher fee rates as total fund assets under FMR’s management decrease. The Board considered that the group fee is designed to deliver the benefits of economies of scale to fund shareholders when total fund assets increase, even if assets of any particular fund are unchanged or have declined, because some portion of Fidelity’s costs are attributable to services provided to all Fidelity funds, and all funds benefit if those costs can be allocated among more assets. The Board concluded that, given the group fee structure, fund shareholders will achieve a certain level of economies of scale as assets under FMR’s management increase at the fund complex level, regardless of whether Fidelity achieves any such economies of scale.
The Board further concluded that any potential economies of scale are being shared between fund shareholders and Fidelity in an appropriate manner.
Additional Information Requested by the Board. In order to develop fully the factual basis for consideration of the Advisory Contracts, the Board requested additional information regarding (i) equity fund transfer agency fees; (ii) Fidelity’s fund profitability methodology and the impact of various changes in the methodology over time; (iii) benefits to shareholders from economies of scale; (iv) composition and characteristics of various fund and industry data used in comparisons; and (v) compensation of portfolio managers and research analysts.
Based on its evaluation of all of the conclusions noted above, and after considering all material factors, the Board ultimately concluded that the existing advisory fee structures are fair and reasonable, and that the fund’s existing Advisory Contracts should be renewed.
59 Annual Report
61 Annual Report
63 Annual Report
Investment Adviser
Fidelity Management & Research Company
Boston, MA
Investment Sub-Advisers
FMR Co., Inc.
Fidelity Management & Research
(U.K.) Inc.
Fidelity Management & Research
(Far East) Inc.
Fidelity International
Investment Advisors
Fidelity Investments Japan Limited
Fidelity International Investment
Advisors (U.K.) Limited
General Distributor
Fidelity Distributors Corporation
Boston, MA
Transfer and Service Agents
Fidelity Investments Institutional
Operations Company, Inc.
Boston, MA
Fidelity Service Company, Inc.
Boston, MA
Custodian
State Street Bank and Trust Company
Quincy, MA
|


Fidelity® Advisor
Emerging Asia
Fund - Class A, Class T, Class B and Class C
Annual Report October 31, 2005

| Contents | | | | |
| |
| Chairman’s Message | | 4 | | Ned Johnson’s message to shareholders. |
| Performance | | 6 | | How the fund has done over time. |
| Management’s Discussion | | 8 | | The manager’s review of fund |
| | | | | performance, strategy and outlook. |
| Shareholder Expense | | 9 | | An example of shareholder expenses. |
| Example | | | | |
| Investment Changes | | 11 | | A summary of major shifts in the fund’s |
| | | | | investments over the past six months. |
| Investments | | 12 | | A complete list of the fund’s investments |
| | | | | with their market values. |
| Financial Statements | | 18 | | Statements of assets and liabilities, |
| | | | | operations, and changes in net assets, |
| | | | | as well as financial highlights. |
| Notes | | 27 | | Notes to the financial statements. |
| Report of Independent | | 36 | | |
| Registered Public | | | | |
| Accounting Firm | | | | |
| Trustees and Officers | | 37 | | |
| Distributions | | 47 | | |
| Board Approval of | | 48 | | |
| Investment Advisory | | | | |
| Contracts and | | | | |
| Management Fees | | | | |
To view a fund’s proxy voting guidelines and proxy voting record for the 12-month period ended June 30, visit www.fidelity.com/proxyvotingresults or visit the Securities and Exchange Commission’s (SEC) web site at www.sec.gov. You may also call 1-877-208-0098 to request a free copy of the proxy voting guidelines.
Standard & Poor’s, S&P and S&P 500 are registered service marks of The McGraw-Hill Companies, Inc. and have been licensed for use by Fidelity Distributors Corporation.
Other third party marks appearing herein are the property of their respective owners.
All other marks appearing herein are registered or unregistered trademarks or service marks of FMR Corp. or an affiliated company.
This report and the financial statements contained herein are submitted for the general information of the shareholders of the fund. This report is not authorized for distribution to prospective investors in the fund unless preceded or accompanied by an effective prospectus.
A fund files its complete schedule of portfolio holdings with the SEC for the first and third quarters of each fiscal year on Form N-Q. Forms N-Q are available on the SEC’s web site at http://www.sec.gov. A fund’s Forms N-Q may be reviewed and copied at the SEC’s Public Reference Room in Washington, DC. Information regarding the operation of the SEC’s Public Reference Room may be obtained by calling 1-800-SEC-0330. For a complete list of a fund’s portfolio holdings, view the most recent quarterly holdings report, semiannual report, or annual report on Fidelity’s web site at http://www.advisor.fidelity.com.
NOT FDIC INSURED · MAY LOSE VALUE · NO BANK GUARANTEE
Neither the fund nor Fidelity Distributors Corporation is a bank.
3 Annual Report
Chairman’s Message
(Photograph of Edward C. Johnson 3d)
Dear Shareholder:
During the past year or so, much has been reported about the mutual fund industry, and much of it has been more critical than I believe is warranted. Allegations that some companies have been less than forthright with their shareholders have cast a shadow on the entire industry. I continue to find these reports disturbing, and assert that they do not create an accurate picture of the industry overall. Therefore, I would like to remind everyone where Fidelity stands on these issues. I will say two things specifically regarding allegations that some mutual fund companies were in violation of the Securities and Exchange Commission’s forward pricing rules or were involved in so-called “market timing” activities.
First, Fidelity has no agreements that permit customers who buy fund shares after 4 p.m. to obtain the 4 p.m. price. This is not a new policy. This is not to say that someone could not deceive the company through fraudulent acts. However, we are extremely diligent in preventing fraud from occurring in this manner — and in every other. But I underscore again that Fidelity has no so-called “agreements” that sanction illegal practices.
Second, Fidelity continues to stand on record, as we have for years, in opposition to predatory short-term trading that adversely affects shareholders in a mutual fund. Back in the 1980s, we initiated a fee — which is returned to the fund and, therefore, to investors — to discourage this activity. Further, we took the lead several years ago in developing a Fair Value Pricing Policy to prevent market timing on foreign securities in our funds. I am confident we will find other ways to make it more difficult for predatory traders to operate. However, this will only be achieved through close cooperation among regulators, legislators and the industry.
Yes, there have been unfortunate instances of unethical and illegal activity within the mutual fund industry from time to time. That is true of any industry. When this occurs, confessed or convicted offenders should be dealt with appropriately. But we are still concerned about the risk of over-regulation and the quick application of simplistic solutions to intricate problems. Every system can be improved, and we support and applaud well thought out improvements by regulators, legislators and industry representatives that achieve the common goal of building and protecting the value of investors’ holdings.
For nearly 60 years, Fidelity has worked very hard to improve its products and service to justify your trust. When our family founded this company in 1946, we had only a few hundred customers. Today, we serve more than 18 million customers including individual investors and participants in retirement plans across America.
Annual Report 4
Let me close by saying that we do not take your trust in us for granted, and we realize that we must always work to improve all aspects of our service to you. In turn, we urge you to continue your active participation with your financial matters, so that your interests can be well served.
Best regards,
/s/Edward C. Johnson 3d
5 Annual Report
Performance: The Bottom Line
Average annual total return reflects the change in the value of an investment, assuming reinvestment of the class’ dividend income and capital gains (the profits earned upon the sale of securities that have grown in value) and assuming a constant rate of performance each year. The $10,000 table and the fund’s returns do not reflect the deduction of taxes that a shareholder would pay on fund distributions or the redemption of fund shares. During periods of reimbursement by Fidelity, a fund’s total return will be greater than it would be had the reimbursement not occurred. How a fund did yesterday is no guarantee of how it will do tomorrow. Returns may reflect the conversion of Class B shares to Class A shares after a maximum of seven years.
| Average Annual Total Returns | | | | | | |
| Periods ended October 31, 2005 | | Past 1 | | Past 5 | | Past 10 |
| | | year | | years | | years |
| Class A (incl. 5.75% sales charge)A | | 19.91% | | 6.61% | | 2.61% |
| Class T (incl. 3.50% sales charge)B | | 22.45% | | 6.84% | | 2.69% |
| Class B (incl. contingent deferred | | | | | | |
| sales charge)C | | 21.31% | | 6.78% | | 2.72% |
| Class C (incl. contingent deferred | | | | | | |
| sales charge)D | | 25.31% | | 7.08% | | 2.73% |
A Class A’s 12b-1 fee may have ranged over time between 0.25% and 0.35%, as an equivalent amount of brokerage commissions of up to 0.10% of the class’s average net assets may have been used to promote the sale of class shares. This practice has been discontinued and no commissions incurred after June 30, 2003 have been used to pay distribution expenses. Class A’s 12b-1 plan currently authorizes a 0.25% 12b-1 fee. The initial offering of Class A shares took place on June 16, 1999. Returns between March 25, 1995 and June 16, 1999 are those of Fidelity Advisor Emerging Asia Fund, Inc., the Closed-End Fund. On June 15, 1999, the Closed-End Fund reorganized as an open-end fund through a transfer of all its assets and liabilities to Fidelity Advisor Emerging Asia Fund (the fund). Shareholders of the Closed-End Fund received Class A shares of the fund in exchange for their shares of the Closed-End Fund. If Class A shares’ total expenses, including its 12b-1 fee, had been reflected in the Closed-End Fund’s performance, Class A’s returns, prior to June 16,1999, may have been lower.
B Class T’s 12b-1 fee may have ranged over time between 0.50% and 0.60%, as an equivalent amount of brokerage commissions of up to 0.10% of the class’s average net assets may have been used to promote the sale of class shares. This practice has been discontinued and no commissions incurred after June 30, 2003 have been used to pay distribution expenses. Class T’s 12b-1 plan currently authorizes a 0.50% 12b-1 fee. The initial offering of Class T shares took place on June 16, 1999. Returns between March 25, 1995 and June 16, 1999 are those of Fidelity Advisor Emerging Asia Fund, Inc., the Closed-End Fund. On June 15, 1999, the Closed-End Fund reorganized as an open-end fund through a transfer of all its assets and liabilities to Fidelity Advisor Emerging Asia Fund (the fund). Shareholders of the Closed-End Fund received Class A shares of the fund in exchange for their shares of the Closed-End Fund. If Class T shares total expenses, including its 12b-1 fee, had been reflected in the Closed-End Fund’s performance, Class T’s returns, prior to June 16, 1999, may have been lower.
C Class B shares bear a 1.00% 12b-1 fee that is reflected in returns after June 16, 1999. The initial offering of Class B shares took place on June 16, 1999. Returns between March 25, 1995 and June 16, 1999 are those of Fidelity Advisor Emerging Asia Fund, Inc., the Closed-End Fund. On June 15, 1999, the Closed-End Fund reorganized as an open-end fund through a transfer of all its assets and liabilities to Fidelity Advisor Emerging Asia Fund (the fund). Shareholders of the Closed-End Fund received Class A shares of the fund in exchange for their shares of the Closed-End Fund. If Class B shares’ total expenses, including its 1.00% 12b-1 fee, had been reflected in the Closed-End Fund’s performance, Class B’s returns, prior to June 16, 1999, may have been lower. Class B shares’ contingent deferred sales charges included in the past one year, past five year, and past 10 year total return figures are 5%, 2%, and 0%, respectively.
D Class C shares bear a 1.00% 12b-1 fee that is reflected in returns after June 16, 1999. The initial offering of Class C shares took place on June 16, 1999. Returns between March 25, 1995 and June 16, 1999 are those of Fidelity Advisor Emerging Asia Fund, Inc., the Closed-End Fund. On June 15, 1999, the Closed-End Fund reorganized as an open-end fund through a transfer of all its assets and liabilities to Fidelity Advisor Emerging Asia Fund (the fund). Shareholders of the Closed-End Fund received Class A shares of the fund in exchange for their shares of the Closed-End Fund. If Class C shares’ total expenses, including its 1.00% 12b-1 fee, had been reflected in the Closed-End Fund’s performance, Class C’s returns, prior to June 16, 1999, may have been lower. Class C shares’ contingent deferred sales charge included in the past one year, past five year, and past 10 year total return figures are 1%, 0%, and 0%, respectively.
Let’s say hypothetically that $10,000 was invested in Fidelity® Advisor Emerging Asia Fund — Class T on October 31, 1995, and the current 3.50% sales charge was paid. The chart shows how the value of your investment would have changed, and also shows how the Morgan Stanley Capital InternationalSM AC Asia ex Japan Index performed over the same period.
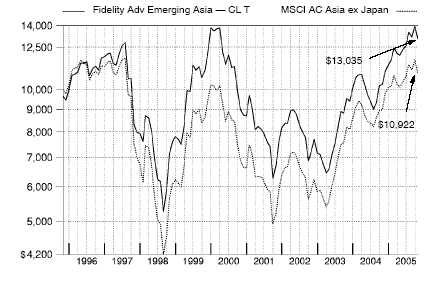
7 Annual Report
7
Management’s Discussion of Fund Performance
Comments from Kevin Chang, Portfolio Manager of Fidelity® Advisor Emerging Asia
Roller coaster analogies are commonly used to describe the frequent ups and downs of Asian equity markets. Take 1999, for instance, when the Morgan Stanley Capital InternationalSM (MSCI) All Country Asia ex Japan Index — designed to measure equity market performance in Asia, except for Japan — jumped 64.67%, only to lose 35.22% the following year. That’s a 100 percentage-point turnaround. For the past two-plus years, though, Asian stocks climbed higher, fueled in part by stronger economies and improved domestic demand. For the 12-month period ending October 31, 2005, the Morgan Stanley index returned 21.25% . Its largest component on average during the period — South Korea —had one of the highest returns, gaining more than 43%. Korea’s performance, combined with India’s strong showing, accounted for much of the index’s final tally, as the second-and third-largest country weightings — Hong Kong and Taiwan — both underperformed the benchmark’s overall return. The index overall fell 6.56% in the final month of the period — another reminder of the considerable volatility in the region’s stocks.
For the 12 months ending October 31, 2005, the fund’s Class A, Class T, Class B and Class C shares returned 27.23%, 26.89%, 26.31% and 26.31%, respectively. Those results beat the MSCI index, as well as the 25.23% return of the LipperSM Pacific Region ex Japan Funds Average. A key reason for the fund’s outperformance versus the index was rewarding stock selection in the industrials sector, particularly among South Korean and Indian companies. In Korea, an overweighted position in niche shipbuilder Hyundai Mipo Dockyard added value. The company continued to see strong demand for its products given the under-ordering of these ships that had occurred previously. Performance also was aided by overweighted positions in the top two Korean car makers, Hyundai Motor and Kia Motors. Conversely, the performance of Hong Kong-listed HSBC Holdings, one of the world’s largest banks, was disappointing. The U.K.-based company suffered from the rising interest rate environment. Performance also was hampered on a relative basis by not owning index component China Mobile, the leading wireless operator in China. I was concerned about potential regulatory changes that could trigger increased competition for China Mobile. However, amid uncertain timing of potential industry restructuring and a benign current competitive environment, the company’s operational results — and its share price — were strong.
The views expressed in this statement reflect those of the portfolio manager only through the end of the period of the report as stated on the cover and do not necessarily represent the views of Fidelity or any other person in the Fidelity organization. Any such views are subject to change at any time based upon market or other conditions and Fidelity disclaims any responsibility to update such views. These views may not be relied on as investment advice and, because investment decisions for a Fidelity fund are based on numerous factors, may not be relied on as an indication of trading intent on behalf of any Fidelity fund.
Shareholder Expense Example
As a shareholder of the Fund, you incur two types of costs: (1) transaction costs, including sales charges (loads) on purchase payments or redemption proceeds, redemption fees, and (2) ongoing costs, including management fees, distribution and/or service (12b-1) fees and other Fund expenses. This Example is intended to help you understand your ongoing costs (in dollars) of investing in the Fund and to compare these costs with the ongoing costs of investing in other mutual funds.
The Example is based on an investment of $1,000 invested at the beginning of the period and held for the entire period (May 1, 2005 to October 31, 2005).
The first line of the table below for each class of the Fund provides information about actual account values and actual expenses. You may use the information in this line, together with the amount you invested, to estimate the expenses that you paid over the period. Simply divide your account value by $1,000.00 (for example, an $8,600 account value divided by $1,000.00 = 8.6), then multiply the result by the number in the first line for a class of the Fund under the heading entitled “Expenses Paid During Period” to estimate the expenses you paid on your account during this period.
Hypothetical Example for Comparison Purposes
The second line of the table below for each class of the Fund provides information about hypothetical account values and hypothetical expenses based on a Class’ actual expense ratio and an assumed rate of return of 5% per year before expenses, which is not the Class’ actual return. The hypothetical account values and expenses may not be used to estimate the actual ending account balance or expenses you paid for the period. You may use this information to compare the ongoing costs of investing in the Fund and other funds. To do so, compare this 5% hypothetical example with the 5% hypothetical examples that appear in the shareholder reports of the other funds.
9 Annual Report
Shareholder Expense Example - continued
Please note that the expenses shown in the table are meant to highlight your ongoing costs only and do not reflect any transaction costs. Therefore, the second line of the table is useful in comparing ongoing costs only, and will not help you determine the relative total costs of owning different funds. In addition, if these transactional costs were included, your costs would have been higher.
| | | | | | | | | | | | | Expenses Paid |
| | | | | Beginning | | | | Ending | | | | During Period* |
| | | | | Account Value | | | | Account Value | | | | May 1, 2005 |
| | | | | May 1, 2005 | | | | October 31, 2005 | | to October 31, 2005 |
| Class A | | | | | | | | | | | | |
| Actual | | $ | | 1,000.00 | | $ | | 1,090.60 | | $ | | 7.90 |
| HypotheticalA | | $ | | 1,000.00 | | $ | | 1,017.64 | | $ | | 7.63 |
| Class T | | | | | | | | | | | | |
| Actual | | $ | | 1,000.00 | | $ | | 1,089.30 | | $ | | 9.22 |
| HypotheticalA | | $ | | 1,000.00 | | $ | | 1,016.38 | | $ | | 8.89 |
| Class B | | | | | | | | | | | | |
| Actual | | $ | | 1,000.00 | | $ | | 1,086.60 | | $ | | 11.83 |
| HypotheticalA | | $ | | 1,000.00 | | $ | | 1,013.86 | | $ | | 11.42 |
| Class C | | | | | | | | | | | | |
| Actual | | $ | | 1,000.00 | | $ | | 1,086.60 | | $ | | 11.83 |
| HypotheticalA | | $ | | 1,000.00 | | $ | | 1,013.86 | | $ | | 11.42 |
| Institutional Class | | | | | | | | | | | | |
| Actual | | $ | | 1,000.00 | | $ | | 1,091.70 | | $ | | 6.59 |
| HypotheticalA | | $ | | 1,000.00 | | $ | | 1,018.90 | | $ | | 6.36 |
| |
| A 5% return per year before expenses | | | | | | | | |
* Expenses are equal to each Class’ annualized expense ratio (shown in the table below); multiplied by the average account value over the period, multiplied by 184/365 (to reflect the one-half year period).
| | | Annualized |
| | | Expense Ratio |
| Class A | | 1.50% |
| Class T | | 1.75% |
| Class B | | 2.25% |
| Class C | | 2.25% |
| Institutional Class | | 1.25% |
Investment Changes
| Top Ten Stocks as of October 31, 2005 | | | | |
| | | % of fund’s | | % of fund’s net assets |
| | | net assets | | 6 months ago |
| Samsung Electronics Co. Ltd. | | 6.7 | | 6.2 |
| Hyundai Motor Co. | | 2.8 | | 3.0 |
| Hutchison Whampoa Ltd. | | 2.8 | | 2.4 |
| Taiwan Semiconductor Manufacturing Co. Ltd. | | 2.3 | | 1.6 |
| Kookmin Bank | | 2.2 | | 3.1 |
| CNOOC Ltd. | | 1.7 | | 1.9 |
| Hong Kong & China Gas Co. Ltd. | | 1.4 | | 0.0 |
| State Bank of India | | 1.3 | | 1.3 |
| PetroChina Co. Ltd. (H Shares) | | 1.3 | | 1.3 |
| Parkway Holdings Ltd. | | 1.0 | | 0.4 |
| | | 23.5 | | |
| Top Five Market Sectors as of October 31, 2005 | | |
| | | % of fund’s | | % of fund’s net assets |
| | | net assets | | 6 months ago |
| Information Technology | | 22.1 | | 18.5 |
| Financials | | 18.4 | | 26.4 |
| Industrials | | 15.0 | | 14.2 |
| Consumer Discretionary | | 10.3 | | 11.7 |
| Energy | | 6.7 | | 8.4 |
11 Annual Report
| Investments October 31, 2005 | | | | | | |
| Showing Percentage of Net Assets | | | | | | |
| |
| Common Stocks — 84.7% | | | | | | |
| | | Shares | | Value (Note 1) |
| |
| Australia – 0.1% | | | | | | |
| Healthscope Ltd. | | 12,800 | | $ | | 54,556 |
| Healthscope Ltd. rights 11/8/05 (a) | | 1,600 | | | | 718 |
| TOTAL AUSTRALIA | | | | | | 55,274 |
| |
| Bermuda – 1.1% | | | | | | |
| China Lotsynergy Holding Ltd. (a) | | 1,070,000 | | | | 351,969 |
| Ports Design Ltd. | | 375,000 | | | | 350,711 |
| Skyworth Digital Holdings Ltd. | | 784,000 | | | | 117,315 |
| TOTAL BERMUDA | | | | | | 819,995 |
| |
| Cayman Islands – 1.0% | | | | | | |
| Baidu.com, Inc. ADR (d) | | 5,800 | | | | 402,752 |
| Beauty China Holdings Ltd. | | 248,000 | | | | 73,206 |
| Dynasty Fine Wines Group Ltd. | | 746,000 | | | | 259,826 |
| TOTAL CAYMAN ISLANDS | | | | | | 735,784 |
| |
| China – 7.1% | | | | | | |
| Anhui Conch Cement Co. Ltd. (H Shares) | | 296,000 | | | | 309,284 |
| China Construction Bank Corp. (H Shares) | | 933,000 | | | | 282,833 |
| China International Marine Containers Co. Ltd. (B Shares) | | 580,600 | | | | 483,078 |
| China Petroleum & Chemical Corp. (H Shares) | | 1,800,000 | | | | 724,500 |
| Chitaly Holdings Ltd. | | 332,000 | | | | 174,520 |
| Chongqing Changan Automobile Co. Ltd. (B Shares) | | 700,000 | | | | 204,977 |
| Enric Energy Equipment Holdings Ltd. | | 66,000 | | | | 15,240 |
| PetroChina Co. Ltd. (H Shares) | | 1,228,000 | | | | 942,245 |
| Ping An Insurance (Group) Co. of China, Ltd. (H Shares) | | 82,500 | | | | 133,561 |
| Shanghai Electric (Group) Corp. (H Shares) | | 926,000 | | | | 292,656 |
| Shanghai Zhenhua Port Machinery Co. Ltd. (B Shares) | | 301,150 | | | | 242,125 |
| Shenergy Co. Ltd. warrants (UBS Warrant Programme) | | | | | | |
| 2/16/06 (a) | | 390,056 | | | | 255,711 |
| Sina Corp. (a) | | 23,000 | | | | 583,050 |
| Weichai Power Co. Ltd. (H Shares) | | 124,000 | | | | 236,736 |
| Yantai Changyu Pioneer Wine Co. (B Shares) | | 85,700 | | | | 143,716 |
| ZTE Corp. (H Shares) | | 83,400 | | | | 246,367 |
| TOTAL CHINA | | | | | | 5,270,599 |
| |
| Hong Kong – 12.8% | | | | | | |
| Automated Systems Holdings Ltd. | | 500,000 | | | | 122,547 |
| Burwill Holdings Ltd. | | 3,000,000 | | | | 232,195 |
| Cheung Kong Holdings Ltd. | | 50,000 | | | | 520,182 |
| China Unicom Ltd. | | 600,000 | | | | 460,520 |
| CNOOC Ltd. | | 1,880,500 | | | | 1,235,489 |
| Denway Motors Ltd. | | 900,000 | | | | 269,927 |
See accompanying notes which are an integral part of the financial statements.
| Common Stocks – continued | | | | | | |
| | | Shares | | Value (Note 1) |
| |
| Hong Kong – continued | | | | | | |
| Esprit Holdings Ltd. | | 32,500 | | $ | | 229,115 |
| Great Eagle Holdings Ltd. | | 128,000 | | | | 304,640 |
| Hang Seng Bank Ltd. | | 30,000 | | | | 388,927 |
| Hong Kong & China Gas Co. Ltd. | | 500,000 | | | | 1,031,978 |
| Hong Kong & Shanghai Hotels Ltd. | | 174,000 | | | | 173,953 |
| Hopewell Holdings Ltd. | | 99,000 | | | | 241,367 |
| Hutchison Whampoa Ltd. | | 217,000 | | | | 2,054,643 |
| JCG Holdings Ltd. | | 582,000 | | | | 578,089 |
| K Wah Construction Materials Ltd. | | 98,000 | | | | 53,727 |
| Next Media Ltd. (a) | | 604,000 | | | | 239,587 |
| Shanghai Industrial Holdings Ltd. Class H | | 170,000 | | | | 302,628 |
| Sun Hung Kai Properties Ltd. | | 25,000 | | | | 236,388 |
| Wharf Holdings Ltd. | | 153,000 | | | | 522,033 |
| Wing Hang Bank Ltd. | | 50,000 | | | | 341,520 |
| TOTAL HONG KONG | | | | | | 9,539,455 |
| |
| India – 7.5% | | | | | | |
| Alembic Ltd. | | 29,900 | | | | 160,911 |
| Bank of Baroda | | 50,000 | | | | 245,207 |
| Bharti Televentures Ltd. (a) | | 50,000 | | | | 359,308 |
| Cipla Ltd. | | 50,000 | | | | 399,767 |
| Gateway Distriparks Ltd. | | 23,276 | | | | 118,523 |
| Geodesic Information Systems Ltd. | | 60,000 | | | | 290,881 |
| Housing Development Finance Corp. Ltd. | | 22,900 | | | | 491,789 |
| IL&FS Investsmart Ltd. | | 63,876 | | | | 270,272 |
| Indian Rayon & Industries, Inc. | | 20,000 | | | | 261,704 |
| ITC Ltd. | | 141,450 | | | | 377,242 |
| IVRCL Infrastructures & Projects Ltd. | | 13,000 | | | | 186,549 |
| Max India Ltd. (a) | | 22,250 | | | | 291,244 |
| Oil & Natural Gas Corp. Ltd. | | 23,263 | | | | 479,532 |
| Punjab National Bank | | 26,984 | | | | 259,345 |
| Reliance Industries Ltd. | | 20,000 | | | | 338,363 |
| Shree Renuka Sugars Ltd. | | 1,486 | | | | 8,582 |
| State Bank of India | | 45,830 | | | | 950,380 |
| Zen Technologies Ltd. | | 30,000 | | | | 98,147 |
| TOTAL INDIA | | | | | | 5,587,746 |
| |
| Indonesia – 1.1% | | | | | | |
| PT Mitra Adiperkasa Tbk | | 2,913,500 | | | | 287,825 |
| PT Semen Gresik Tbk | | 168,500 | | | | 311,282 |
| PT Telkomunikasi Indonesia Tbk Series B | | 513,500 | | | | 253,643 |
| TOTAL INDONESIA | | | | | | 852,750 |
See accompanying notes which are an integral part of the financial statements.
13 Annual Report
| Investments - continued | | | | | | |
| |
| |
| Common Stocks – continued | | | | | | |
| | | Shares | | Value (Note 1) |
| |
| Korea (South) – 20.1% | | | | | | |
| Binggrea Co. Ltd. | | 5,980 | | $ | | 248,021 |
| CDNetworks Co. Ltd. | | 22,355 | | | | 374,724 |
| Core Logic, Inc. | | 6,500 | | | | 227,562 |
| Daewoo Shipbuilding & Marine Engineering Co. Ltd. | | 15,510 | | | | 309,011 |
| Doosan Heavy Industries & Construction Co. Ltd. | | 16,000 | | | | 346,360 |
| Hyundai Department Store Co. Ltd. | | 5,000 | | | | 331,896 |
| Hyundai Engineering & Construction Co. Ltd. (a) | | 16,000 | | | | 497,318 |
| Hyundai Mipo Dockyard Co. Ltd. | | 8,680 | | | | 536,264 |
| Keangnam Enterprises (a) | | 20,000 | | | | 191,571 |
| Kia Motors Corp. | | 21,830 | | | | 392,062 |
| Kookmin Bank | | 30,140 | | | | 1,654,235 |
| Korea Investment Holdings Co. Ltd. | | 23,900 | | | | 613,525 |
| LG Electronics, Inc. | | 1,850 | | | | 119,966 |
| LG Household & Health Care Ltd. | | 10,000 | | | | 545,977 |
| NHN Corp. (a) | | 4,000 | | | | 664,751 |
| Orion Corp. | | 3,000 | | | | 581,896 |
| S-Oil Corp. | | 7,070 | | | | 528,895 |
| Samsung Electronics Co. Ltd. | | 9,497 | | | | 5,021,401 |
| SFA Engineering Corp. | | 8,000 | | | | 190,805 |
| Shinhan Financial Group Co. Ltd. | | 16,960 | | | | 565,333 |
| Shinsegae Co. Ltd. | | 1,720 | | | | 616,168 |
| YBM Sisa.com, Inc. | | 20,000 | | | | 375,479 |
| TOTAL KOREA (SOUTH) | | | | | | 14,933,220 |
| |
| Malaysia – 4.3% | | | | | | |
| AMMB Holdings BHD | | 1,000,000 | | | | 630,464 |
| Commerce Asset Holding BHD | | 500,000 | | | | 728,477 |
| IOI Corp. BHD | | 200,000 | | | | 694,040 |
| Malakoff BHD | | 150,000 | | | | 311,921 |
| Malayan Banking BHD | | 94,700 | | | | 290,999 |
| Malaysian International Shipping Corp. BHD (For. Reg.) | | 139,000 | | | | 349,801 |
| Public Bank BHD (For. Reg.) | | 46,225 | | | | 80,817 |
| Tenaga Nasional BHD | | 55,200 | | | | 146,225 |
| TOTAL MALAYSIA | | | | | | 3,232,744 |
| |
| Philippines – 1.5% | | | | | | |
| Banco de Oro Universal Bank | | 300,000 | | | | 169,337 |
| Manila Water Co., Inc. | | 2,500,000 | | | | 291,333 |
| Philippine Long Distance Telephone Co. | | 5,580 | | | | 170,184 |
| San Miguel Corp. Class B | | 314,000 | | | | 514,567 |
| TOTAL PHILIPPINES | | | | | | 1,145,421 |
See accompanying notes which are an integral part of the financial statements.
| Common Stocks – continued | | | | | | |
| | | Shares | | Value (Note 1) |
| |
| Singapore – 6.7% | | | | | | |
| CapitaLand Ltd. | | 72,000 | | $ | | 135,171 |
| Chartered Semiconductor Manufacturing Ltd. (a) | | 321,000 | | | | 198,985 |
| DBS Group Holdings Ltd. | | 52,000 | | | | 469,699 |
| GES International Ltd. | | 479,000 | | | | 262,993 |
| HTL International Holdings Ltd. | | 259,000 | | | | 192,662 |
| Keppel Corp. Ltd. | | 55,000 | | | | 376,657 |
| Oversea-Chinese Banking Corp. Ltd. | | 40,000 | | | | 148,774 |
| Parkway Holdings Ltd. | | 653,000 | | | | 763,314 |
| Petra Foods Ltd. | | 323,000 | | | | 198,317 |
| Sembcorp Marine Ltd. | | 400,000 | | | | 647,047 |
| Shanghai Asia Holdings Ltd. | | 1,282,000 | | | | 121,097 |
| SIA Engineering Co. Ltd. | | 261,000 | | | | 383,676 |
| Singapore Post Ltd. | | 900,000 | | | | 605,721 |
| STATS ChipPAC Ltd. (a) | | 475,000 | | | | 260,796 |
| United Overseas Bank Ltd. | | 28,000 | | | | 228,119 |
| United Overseas Land Ltd. | | 2,800 | | | | 3,868 |
| TOTAL SINGAPORE | | | | | | 4,996,896 |
| |
| Taiwan – 15.1% | | | | | | |
| Acer, Inc. | | 362,520 | | | | 733,651 |
| Advanced Semiconductor Engineering, Inc. | | 30,000 | | | | 18,285 |
| Advantech Co. Ltd. | | 98,312 | | | | 216,247 |
| Ambassador Hotel | | 700,000 | | | | 486,118 |
| Cathay Financial Holding Co. Ltd. | | 219,000 | | | | 385,109 |
| Chinatrust Financial Holding Co. Ltd. | | 227,285 | | | | 176,468 |
| Chipbond Technology Corp. | | 157,972 | | | | 204,813 |
| Chunghwa Telecom Co. Ltd. | | 220,000 | | | | 372,442 |
| Chunghwa Telecom Co. Ltd. sponsored ADR | | 20,000 | | | | 346,400 |
| Delta Electronics, Inc. | | 300,000 | | | | 505,194 |
| EVA Airways Corp. | | 1,138,000 | | | | 440,934 |
| Formosa International Hotel Corp. | | 166,000 | | | | 259,750 |
| High Tech Computer Corp. | | 60,000 | | | | 636,633 |
| Inventec Appliances Corp. | | 5,000 | | | | 19,522 |
| Kinik Co. | | 92,000 | | | | 182,072 |
| MediaTek, Inc. | | 64,000 | | | | 552,226 |
| Motech Industries, Inc. | | 25,965 | | | | 283,242 |
| Novatek Microelectronics Corp. | | 79,449 | | | | 346,908 |
| Pihsiang Machinery Manufacturing Co. | | 163,620 | | | | 237,494 |
| Powerchip Semiconductor Corp. | | 575,931 | | | | 272,933 |
| Sino-American Silicon Prds, Inc. | | 289,144 | | | | 339,546 |
| Springsoft, Inc. | | 144,179 | | | | 212,284 |
| Sunplus Technology Co. Ltd. | | 178,439 | | | | 155,562 |
See accompanying notes which are an integral part of the financial statements.
15 Annual Report
| Investments - continued | | | | | | |
| |
| |
| Common Stocks – continued | | | | | | |
| | | Shares | | Value (Note 1) |
| |
| Taiwan – continued | | | | | | |
| Taiwan Cement Corp. | | 735,000 | | $ | | 451,276 |
| Taiwan Secom Co. | | 400,000 | | | | 540,661 |
| Taiwan Semiconductor Manufacturing Co. Ltd. | | 877,797 | | | | 1,360,459 |
| Taiwan Semiconductor Manufacturing Co. Ltd. sponsored ADR | | 46,619 | | | | 376,682 |
| United Microelectronics Corp. | | 376,093 | | | | 199,528 |
| United Microelectronics Corp. sponsored ADR (d) | | 87,754 | | | | 256,242 |
| Yageo Corp. (a) | | 908,000 | | | | 276,041 |
| Yuanta Core Pacific Securities Co. Ltd. | | 692,294 | | | | 371,408 |
| TOTAL TAIWAN | | | | | | 11,216,130 |
| |
| Thailand – 4.6% | | | | | | |
| Advanced Info Service PCL (For. Reg.) | | 91,400 | | | | 224,129 |
| Asia Credit PCL (For. Reg.) (a) | | 901,100 | | | | 127,056 |
| Bangkok Bank Ltd. PCL (For. Reg.) | | 109,400 | | | | 276,317 |
| Bumrungrad Hospital PCL (For. Reg.) | | 680,500 | | | | 446,380 |
| Central Pattana PCL (For. Reg.) | | 176,000 | | | | 51,790 |
| Home Product Center PCL (For. Reg.) | | 1,491,100 | | | | 255,951 |
| Krung Thai Bank Public Co. Ltd. | | 526,100 | | | | 129,009 |
| Land & House PCL unit | | 2,239,200 | | | | 436,529 |
| Minor International PCL (For. Reg.) | | 1,806,740 | | | | 248,106 |
| PTT Exploration & Production PCL (For. Reg.) | | 47,100 | | | | 485,091 |
| Shin Corp. PCL (For. Reg.) | | 129,900 | | | | 121,045 |
| Sino Thai Engineering & Construction PCL: | | | | | | |
| (For. Reg.) | | 853,000 | | | | 244,730 |
| (For. Reg.) warrants 3/17/08 (a) | | 142,167 | | | | 17,222 |
| Thai Oil PCL (For. Reg.) | | 141,800 | | | | 245,142 |
| True Corp. PCL (a) | | 700,000 | | | | 127,023 |
| True Corp. PCL (For. Reg.) rights 4/30/08 (a) | | 190,863 | | | | 0 |
| TOTAL THAILAND | | | | | | 3,435,520 |
| |
| United Kingdom – 1.7% | | | | | | |
| Astro All Asia Networks PLC | | 350,000 | | | | 509,934 |
| HSBC Holdings PLC (Hong Kong) (Reg.) | | 46,176 | | | | 727,364 |
| TOTAL UNITED KINGDOM | | | | | | 1,237,298 |
| |
| TOTAL COMMON STOCKS | | | | | | |
| (Cost $56,753,129) | | | | 63,058,832 |
See accompanying notes which are an integral part of the financial statements.
| Nonconvertible Preferred Stocks — 3.6% | | | | |
| | | Shares | | Value (Note 1) |
| Korea (South) – 3.6% | | | | |
| Hyundai Motor Co. | | 41,490 | | $ 2,102,318 |
| Samsung Electronics Co. Ltd. | | 1,400 | | 569,923 |
| TOTAL NONCONVERTIBLE PREFERRED STOCKS | | | | |
| (Cost $1,463,199) | | | | 2,672,241 |
| Money Market Funds — 13.9% | | | | |
| Fidelity Cash Central Fund, 3.92% (b) | | 9,857,595 | | 9,857,595 |
| Fidelity Securities Lending Cash Central Fund, | | | | |
| 3.94% (b)(c) | | 501,050 | | 501,050 |
| TOTAL MONEY MARKET FUNDS | | | | |
| (Cost $10,358,645) | | | | 10,358,645 |
| TOTAL INVESTMENT PORTFOLIO – 102.2% | | | | |
| (Cost $68,574,973) | | | | 76,089,718 |
| |
| NET OTHER ASSETS – (2.2)% | | | | (1,647,025) |
| NET ASSETS – 100% | | $ | | 74,442,693 |
(a) Non-income producing
(b) Affiliated fund that is available only to investment companies and other accounts managed by Fidelity Investments. The rate quoted is the annualized seven-day yield of the fund at period end. A complete unaudited listing of the fund’s holdings as of its most recent quarter end is available upon request.
(c) Investment made with cash collateral received from securities on loan.
(d) Security or a portion of the security is on loan at period end.
See accompanying notes which are an integral part of the financial statements.
17 Annual Report
| Financial Statements | | | | | | | | |
| |
| |
| Statement of Assets and Liabilities | | �� | | | | | | |
| | | | | | | | | October 31, 2005 |
| |
| Assets | | | | | | | | |
| Investment in securities, at value (including securities | | | | | | | | |
| loaned of $496,476) (cost $68,574,973) — See | | | | | | | | |
| accompanying schedule | | | | | | $ | | 76,089,718 |
| Cash | | | | | | | | 1,680 |
| Foreign currency held at value (cost $541,662) | | | | | | | | 541,784 |
| Receivable for investments sold | | | | | | | | 1,196,871 |
| Receivable for fund shares sold | | | | | | | | 160,959 |
| Dividends receivable | | | | | | | | 11,876 |
| Interest receivable | | | | | | | | 23,825 |
| Receivable from investment adviser for expense | | | | | | | | |
| reductions | | | | | | | | 16,382 |
| Other affiliated receivables | | | | | | | | 71 |
| Other receivables | | | | | | | | 276,656 |
| Total assets | | | | | | | | 78,319,822 |
| |
| Liabilities | | | | | | | | |
| Payable for investments purchased | | $ | | 2,962,080 | | | | |
| Payable for fund shares redeemed | | | | 199,605 | | | | |
| Accrued management fee | | | | 44,111 | | | | |
| Distribution fees payable | | | | 33,404 | | | | |
| Other affiliated payables | | | | 23,963 | | | | |
| Other payables and accrued expenses | | | | 112,916 | | | | |
| Collateral on securities loaned, at value | | | | 501,050 | | | | |
| Total liabilities | | | | | | | | 3,877,129 |
| |
| Net Assets | | | | | | $ | | 74,442,693 |
| Net Assets consist of: | | | | | | | | |
| Paid in capital | | | | | | $ | | 60,448,315 |
| Undistributed net investment income | | | | | | | | 458,779 |
| Accumulated undistributed net realized gain (loss) on | | | | | | | | |
| investments and foreign currency transactions | | | | | | | | 6,021,199 |
| Net unrealized appreciation (depreciation) on | | | | | | | | |
| investments and assets and liabilities in foreign | | | | | | | | |
| currencies | | | | | | | | 7,514,400 |
| Net Assets | | | | | | $ | | 74,442,693 |
See accompanying notes which are an integral part of the financial statements.
| Statement of Assets and Liabilities — continued | | | | |
| | | October 31, 2005 |
| Calculation of Maximum Offering Price | | | | |
| Class A: | | | | |
| Net Asset Value and redemption price per share | | | | |
| ($30,781,763 ÷ 1,738,792 shares) | | $ | | 17.70 |
| Maximum offering price per share (100/94.25 of | | | | |
| $17.70) | | $ | | 18.78 |
| Class T: | | | | |
| Net Asset Value and redemption price per share | | | | |
| ($14,074,363 ÷ 806,398 shares) | | $ | | 17.45 |
| Maximum offering price per share (100/96.50 of | | | | |
| $17.45) | | $ | | 18.08 |
| Class B: | | | | |
| Net Asset Value and offering price per share | | | | |
| ($11,504,464 ÷ 679,133 shares)A | | $ | | 16.94 |
| Class C: | | | | |
| Net Asset Value and offering price per share | | | | |
| ($13,291,127 ÷ 784,401 shares)A | | $ | | 16.94 |
| |
| Institutional Class: | | | | |
| Net Asset Value, offering price and redemption | | | | |
| price per share ($4,790,976 ÷ 266,626 | | | | |
| shares) | | $ | | 17.97 |
| A Redemption price per share is equal to net asset value less any applicable contingent deferred sales charge. | | | | |
See accompanying notes which are an integral part of the financial statements.
19 Annual Report
| Financial Statements - continued | | | | | | |
| |
| |
| Statement of Operations | | | | | | |
| | | | | Year ended October 31, 2005 |
| |
| Investment Income | | | | | | |
| Dividends | | | | $ | | 1,640,625 |
| Interest | | | | | | 86,355 |
| Security lending | | | | | | 5,791 |
| | | | | | | 1,732,771 |
| Less foreign taxes withheld | | | | | | (222,708) |
| Total income | | | | | | 1,510,063 |
| |
| Expenses | | | | | | |
| Management fee | | $ | | 413,094 | | |
| Transfer agent fees | | | | 208,468 | | |
| Distribution fees | | | | 309,494 | | |
| Accounting and security lending fees | | | | 32,925 | | |
| Independent trustees’ compensation | | | | 254 | | |
| Custodian fees and expenses | | | | 155,396 | | |
| Registration fees | | | | 45,380 | | |
| Audit | | | | 105,867 | | |
| Legal | | | | 7,279 | | |
| Miscellaneous | | | | 1,441 | | |
| Total expenses before reductions | | | | 1,279,598 | | |
| Expense reductions | | | | (228,315) | | 1,051,283 |
| |
| Net investment income (loss) | | | | | | 458,780 |
| Realized and Unrealized Gain (Loss) | | | | | | |
| Net realized gain (loss) on: | | | | | | |
| Investment securities | | | | 6,324,773 | | |
| Foreign currency transactions | | | | (48,752) | | |
| Total net realized gain (loss) | | | | | | 6,276,021 |
| Change in net unrealized appreciation (depreciation) on: | | | | |
| Investment securities | | | | 4,767,642 | | |
| Assets and liabilities in foreign currencies | | | | (18,829) | | |
| Total change in net unrealized appreciation | | | | | | |
| (depreciation) | | | | | | 4,748,813 |
| Net gain (loss) | | | | | | 11,024,834 |
| Net increase (decrease) in net assets resulting from | | | | | | |
| operations | | | | $ | | 11,483,614 |
See accompanying notes which are an integral part of the financial statements.
| Statement of Changes in Net Assets | | | | | | | | |
| | | | | Year ended | | | | Year ended |
| | | | | October 31, | | | | October 31, |
| | | | | 2005 | | | | 2004 |
| Increase (Decrease) in Net Assets | | | | | | | | |
| Operations | | | | | | | | |
| Net investment income (loss) | | $ | | 458,780 | | $ | | (21,099) |
| Net realized gain (loss) | | | | 6,276,021 | | | | 5,045,008 |
| Change in net unrealized appreciation (depreciation) . | | | | 4,748,813 | | | | (2,706,763) |
| Net increase (decrease) in net assets resulting | | | | | | | | |
| from operations | | | | 11,483,614 | | | | 2,317,146 |
| Distributions to shareholders from net investment income . | | | | �� | | | | (387,542) |
| Distributions to shareholders from net realized gain | | | | (154,881) | | | | — |
| Total distributions | | | | (154,881) | | | | (387,542) |
| Share transactions -- net increase (decrease) | | | | 20,346,589 | | | | 389,641 |
| Redemption fees | | | | 10,434 | | | | 18,627 |
| Total increase (decrease) in net assets | | | | 31,685,756 | | | | 2,337,872 |
| |
| Net Assets | | | | | | | | |
| Beginning of period | | | | 42,756,937 | | | | 40,419,065 |
| End of period (including undistributed net investment | | | | | | | | |
| income of $458,779 and accumulated net invest- | | | | | | | | |
| ment loss of $1,228, respectively) | | $ | | 74,442,693 | | $ | | 42,756,937 |
See accompanying notes which are an integral part of the financial statements.
21 Annual Report
| Financial Highlights — Class A | | | | | | | | | | |
| |
| Years ended October 31, | | 2005 | | 2004 | | 2003 | | | | 2002 | | 2001 |
| Selected Per-Share Data | | | | | | | | | | | | |
| Net asset value, beginning of | | | | | | | | | | | | |
| period | | $ 13.96 | | $ 13.07 | | $ 9.89 | | $ | | 9.15 | | $ 12.29 |
| Income from Investment | | | | | | | | | | | | |
| Operations | | | | | | | | | | | | |
| Net investment income (loss)C | | 18 | | .03 | | .07 | | | | (.02) | | (.03) |
| Net realized and unrealized | | | | | | | | | | | | |
| gain (loss) | | 3.61 | | 1.00F | | 3.11 | | | | .76 | | (3.11) |
| Total from investment operations | | 3.79 | | 1.03 | | 3.18 | | | | .74 | | (3.14) |
| Distributions from net investment | | | | | | | | | | | | |
| income | | — | | (.15) | | — | | | | — | | — |
| Distributions from net realized | | | | | | | | | | | | |
| gain | | (.05) | | — | | — | | | | — | | — |
| Total distributions | | (.05) | | (.15) | | — | | | | — | | — |
| Redemption fees added to paid in | | | | | | | | | | | | |
| capitalC | | —E | | .01 | | — | | | | — | | — |
| Net asset value, end of period | | $ 17.70 | | $ 13.96 | | $ 13.07 | | $ | | 9.89 | | $ 9.15 |
| Total ReturnA,B | | 27.23% | | 8.01%F | | 32.15% | | | | 8.09% | | (25.55)% |
| Ratios to Average Net AssetsD | | | | | | | | | | | | |
| Expenses before expense | | | | | | | | | | | | |
| reductions | | 1.90% | | 2.24% | | 2.81% | | | | 2.56% | | 2.56% |
| Expenses net of voluntary waiv- | | | | | | | | | | | | |
| ers, if any | | 1.61% | | 2.00% | | 2.02% | | | | 2.00% | | 2.00% |
| Expenses net of all reductions | | 1.55% | | 1.99% | | 2.02% | | | | 1.98% | | 1.97% |
| Net investment income (loss) | | 1.08% | | .21% | | .70% | | | | (.17)% | | (.26)% |
| Supplemental Data | | | | | | | | | | | | |
| Net assets, end of period (000 | | | | | | | | | | | | |
| omitted) | | $30,782 | | $21,099 | | $24,161 | | $18,314 | | $18,151 |
| Portfolio turnover rate | | 66% | | 232% | | 172% | | | | 121% | | 62% |
A Total returns would have been lower had certain expenses not been reduced during the periods shown.
B Total returns do not include the effect of the sales charges.
C Calculated based on average shares outstanding during the period.
D Expense ratios reflect operating expenses of the class. Expenses before reductions do not reflect amounts reimbursed by the investment adviser or reductions from brokerage service arrangements or other expense offset arrangements and do not represent the amount paid by the class during periods when reimbursements or reductions occur. Expenses net of any voluntary waivers reflect expenses after reimbursement by the investment adviser but prior to reductions from brokerage service arrangements or other expense offset arrangements. Expenses net of all reductions repre sent the net expenses paid by the class.
E Amount represents less than $.01 per share.
F In 2004 the fund received a favorable ruling in India which entitles the fund to a refund of capital gains taxes paid in the current and prior years. The impact to the fund was an increase in realized and unrealized gain (loss) per share of $.51. Excluding this benefit, the total return would have been 4.18% . The realized and unrealized gains were allocated on a pro rata basis to each class based on the relative net assets of each class to the total net assets of the fund.
See accompanying notes which are an integral part of the financial statements.
| Financial Highlights — Class T | | | | | | | | | | | | |
| |
| Years ended October 31, | | 2005 | | 2004 | | | | 2003 | | | | 2002 | | 2001 |
| Selected Per-Share Data | | | | | | | | | | | | | | |
| Net asset value, beginning of | | | | | | | | | | | | | | |
| period | | $ 13.80 | | $ 12.92 | | $ | | 9.81 | | $ | | 9.09 | | $ 12.25 |
| Income from Investment | | | | | | | | | | | | | | |
| Operations | | | | | | | | | | | | | | |
| Net investment income (loss)C | | 14 | | —E | | | | .05 | | | | (.05) | | (.06) |
| Net realized and unrealized | | | | | | | | | | | | | | |
| gain (loss) | | 3.56 | | .99F | | | | 3.06 | | | | .77 | | (3.10) |
| Total from investment operations | | 3.70 | | .99 | | | | 3.11 | | | | .72 | | (3.16) |
| Distributions from net investment | | | | | | | | | | | | | | |
| income | | — | | (.12) | | | | — | | | | — | | — |
| Distributions from net realized | | | | | | | | | | | | | | |
| gain | | (.05) | | — | | | | — | | | | — | | — |
| Total distributions | | (.05) | | (.12) | | | | — | | | | — | | — |
| Redemption fees added to paid in | | | | | | | | | | | | | | |
| capitalC | | —E | | .01 | | | | — | | | | — | | — |
| Net asset value, end of period | | $ 17.45 | | $ 13.80 | | $ | | 12.92 | | $ | | 9.81 | | $ 9.09 |
| Total ReturnA,B | | 26.89% | | 7.78%F | | | | 31.70% | | | | 7.92% | | (25.80)% |
| Ratios to Average Net AssetsD | | | | | | | | | | | | | | |
| Expenses before expense | | | | | | | | | | | | | | |
| reductions | | 2.27% | | 2.76% | | | | 3.43% | | | �� | 3.16% | | 3.41% |
| Expenses net of voluntary waiv- | | | | | | | | | | | | | | |
| ers, if any | | 1.84% | | 2.25% | | | | 2.27% | | | | 2.25% | | 2.25% |
| Expenses net of all reductions | | 1.79% | | 2.24% | | | | 2.26% | | | | 2.23% | | 2.22% |
| Net investment income (loss) | | 85% | | (.04)% | | | | .45% | | | | (.42)% | | (.51)% |
| Supplemental Data | | | | | | | | | | | | | | |
| Net assets, end of period (000 | | | | | | | | | | | | | | |
| omitted) | | $14,074 | | $ 7,658 | | $ | | 4,982 | | $ 4,347 | | $ 2,842 |
| Portfolio turnover rate | | 66% | | 232% | | | | 172% | | | | 121% | | 62% |
A Total returns would have been lower had certain expenses not been reduced during the periods shown.
B Total returns do not include the effect of the sales charges.
C Calculated based on average shares outstanding during the period.
D Expense ratios reflect operating expenses of the class. Expenses before reductions do not reflect amounts reimbursed by the investment adviser or reductions from brokerage service arrangements or other expense offset arrangements and do not represent the amount paid by the class during periods when reimbursements or reductions occur. Expenses net of any voluntary waivers reflect expenses after reimbursement by the investment adviser but prior to reductions from brokerage service arrangements or other expense offset arrangements. Expenses net of all reductions repre sent the net expenses paid by the class.
E Amount represents less than $.01 per share.
F In 2004 the fund received a favorable ruling in India which entitles the fund to a refund of capital gains taxes paid in the current and prior years. The impact to the fund was an increase in realized and unrealized gain (loss) per share of $.50. Excluding this benefit, the total return would have been 3.95% . The realized and unrealized gains were allocated on a pro rata basis to each class based on the relative net assets of each class to the total net assets of the fund.
See accompanying notes which are an integral part of the financial statements.
23 Annual Report
| Financial Highlights — Class B | | | | | | | | | | | | |
| |
| Years ended October 31, | | 2005 | | 2004 | | | | 2003 | | | | 2002 | | 2001 |
| Selected Per-Share Data | | | | | | | | | | | | | | |
| Net asset value, beginning of | | | | | | | | | | | | | | |
| period | | $ 13.46 | | $ 12.64 | | $ | | 9.63 | | $ | | 8.97 | | $ 12.15 |
| Income from Investment | | | | | | | | | | | | | | |
| Operations | | | | | | | | | | | | | | |
| Net investment income (loss)C | | 06 | | (.07) | | | | (.01) | | | | (.10) | | (.11) |
| Net realized and unrealized | | | | | | | | | | | | | | |
| gain (loss) | | 3.47 | | .96F | | | | 3.02 | | | | .76 | | (3.07) |
| Total from investment operations | | 3.53 | | .89 | | | | 3.01 | | | | .66 | | (3.18) |
| Distributions from net investment | | | | | | | | | | | | | | |
| income | | — | | (.08) | | | | — | | | | — | | — |
| Distributions from net realized | | | | | | | | | | | | | | |
| gain | | (.05) | | — | | | | — | | | | — | | — |
| Total distributions | | (.05) | | (.08) | | | | — | | | | — | | — |
| Redemption fees added to paid in | | | | | | | | | | | | | | |
| capitalC | | —E | | .01 | | | | — | | | | — | | — |
| Net asset value, end of period | | $ 16.94 | | $ 13.46 | | $ | | 12.64 | | $ | | 9.63 | | $ 8.97 |
| Total ReturnA,B | | 26.31% | | 7.14%F | | | | 31.26% | | | | 7.36% | | (26.17)% |
| Ratios to Average Net AssetsD | | | | | | | | | | | | | | |
| Expenses before expense | | | | | | | | | | | | | | |
| reductions | | 2.75% | | 3.19% | | | | 3.87% | | | | 3.63% | | 3.66% |
| Expenses net of voluntary waiv- | | | | | | | | | | | | | | |
| ers, if any | | 2.35% | | 2.75% | | | | 2.77% | | | | 2.75% | | 2.75% |
| Expenses net of all reductions | | 2.29% | | 2.74% | | | | 2.77% | | | | 2.73% | | 2.72% |
| Net investment income (loss) | | 34% | | (.54)% | | | | (.05)% | | | | (.92)% | | (1.01)% |
| Supplemental Data | | | | | | | | | | | | | | |
| Net assets, end of period (000 | | | | | | | | | | | | | | |
| omitted) | | $11,504 | | $ 7,065 | | $ | | 5,157 | | $ 2,787 | | $ 2,466 |
| Portfolio turnover rate | | 66% | | 232% | | | | 172% | | | | 121% | | 62% |
A Total returns would have been lower had certain expenses not been reduced during the periods shown.
B Total returns do not include the effect of the contingent deferred sales charge.
C Calculated based on average shares outstanding during the period.
D Expense ratios reflect operating expenses of the class. Expenses before reductions do not reflect amounts reimbursed by the investment adviser or reductions from brokerage service arrangements or other expense offset arrangements and do not represent the amount paid by the class during periods when reimbursements or reductions occur. Expenses net of any voluntary waivers reflect expenses after reimbursement by the investment adviser but prior to reductions from brokerage service arrangements or other expense offset arrangements. Expenses net of all reductions repre sent the net expenses paid by the class.
E Amount represents less than $.01 per share.
F In 2004 the fund received a favorable ruling in India which entitles the fund to a refund of capital gains taxes paid in the current and prior years. The impact to the fund was an increase in realized and unrealized gain (loss) per share of $.49. Excluding this benefit, the total return would have been 3.31% . The realized and unrealized gains were allocated on a pro rata basis to each class based on the relative net assets of each class to the total net assets of the fund.
See accompanying notes which are an integral part of the financial statements.
| Financial Highlights — Class C | | | | | | | | | | | | |
| |
| Years ended October 31, | | 2005 | | 2004 | | | | 2003 | | | | 2002 | | 2001 |
| Selected Per-Share Data | | | | | | | | | | | | | | |
| Net asset value, beginning of | | | | | | | | | | | | | | |
| period | | $ 13.46 | | $ 12.65 | | $ | | 9.64 | | $ | | 8.98 | | $ 12.16 |
| Income from Investment | | | | | | | | | | | | | | |
| Operations | | | | | | | | | | | | | | |
| Net investment income (loss)C | | 06 | | (.07) | | | | (.01) | | | | (.10) | | (.11) |
| Net realized and unrealized | | | | | | | | | | | | | | |
| gain (loss) | | 3.47 | | .96F | | | | 3.02 | | | | .76 | | (3.07) |
| Total from investment operations | | 3.53 | | .89 | | | | 3.01 | | | | .66 | | (3.18) |
| Distributions from net investment | | | | | | | | | | | | | | |
| income | | — | | (.09) | | | | — | | | | — | | — |
| Distributions from net realized | | | | | | | | | | | | | | |
| gain | | (.05) | | — | | | | — | | | | — | | — |
| Total distributions | | (.05) | | (.09) | | | | — | | | | — | | — |
| Redemption fees added to paid in | | | | | | | | | | | | | | |
| capitalC | | —E | | .01 | | | | — | | | | — | | — |
| Net asset value, end of period | | $ 16.94 | | $ 13.46 | | $ | | 12.65 | | $ | | 9.64 | | $ 8.98 |
| Total ReturnA,B | | 26.31% | | 7.14%F | | | | 31.22% | | | | 7.35% | | (26.15)% |
| Ratios to Average Net AssetsD | | | | | | | | | | | | | | |
| Expenses before expense | | | | | | | | | | | | | | |
| reductions | | 2.67% | | 3.02% | | | | 3.70% | | | | 3.53% | | 3.52% |
| Expenses net of voluntary waiv- | | | | | | | | | | | | | | |
| ers, if any | | 2.34% | | 2.75% | | | | 2.77% | | | | 2.75% | | 2.75% |
| Expenses net of all reductions | | 2.28% | | 2.74% | | | | 2.76% | | | | 2.73% | | 2.72% |
| Net investment income (loss) | | 35% | | (.54)% | | | | (.05)% | | | | (.92)% | | (1.01)% |
| Supplemental Data | | | | | | | | | | | | | | |
| Net assets, end of period (000 | | | | | | | | | | | | | | |
| omitted) | | $13,291 | | $ 6,484 | | $ | | 4,581 | | $ 2,220 | | $ 1,263 |
| Portfolio turnover rate | | 66% | | 232% | | | | 172% | | | | 121% | | 62% |
A Total returns would have been lower had certain expenses not been reduced during the periods shown.
B Total returns do not include the effect of the contingent deferred sales charge.
C Calculated based on average shares outstanding during the period.
D Expense ratios reflect operating expenses of the class. Expenses before reductions do not reflect amounts reimbursed by the investment adviser or reductions from brokerage service arrangements or other expense offset arrangements and do not represent the amount paid by the class during periods when reimbursements or reductions occur. Expenses net of any voluntary waivers reflect expenses after reimbursement by the investment adviser but prior to reductions from brokerage service arrangements or other expense offset arrangements. Expenses net of all reductions repre sent the net expenses paid by the class.
E Amount represents less than $.01 per share.
F In 2004 the fund received a favorable ruling in India which entitles the fund to a refund of capital gains taxes paid in the current and prior years. The impact to the fund was an increase in realized and unrealized gain (loss) per share of $.49. Excluding this benefit, the total return would have been 3.31% . The realized and unrealized gains were allocated on a pro rata basis to each class based on the relative net assets of each class to the total net assets of the fund.
See accompanying notes which are an integral part of the financial statements.
25 Annual Report
| Financial Highlights — Institutional Class | | | | | | | | | | | | |
| |
| Years ended October 31, | | 2005 | | 2004 | | | | 2003 | | | | 2002 | | | | 2001 |
| Selected Per-Share Data | | | | | | | | | | | | | | | | |
| Net asset value, beginning of | | | | | | | | | | | | | | | | |
| period | | $ 14.13 | | $ 13.20 | | $ | | 9.97 | | $ | | 9.21 | | $ 12.34 |
| Income from Investment | | | | | | | | | | | | | | | | |
| Operations | | | | | | | | | | | | | | | | |
| Net investment income (loss)B | | 24 | | .06 | | | | .10 | | | | .01 | | | | —D |
| Net realized and unrealized | | | | | | | | | | | | | | | | |
| gain (loss) | | 3.65 | | 1.01E | | | | 3.13 | | | | .75 | | | | (3.13) |
| Total from investment operations | | 3.89 | | 1.07 | | | | 3.23 | | | | .76 | | | | (3.13) |
| Distributions from net investment | | | | | | | | | | | | | | | | |
| income | | — | | (.15) | | | | — | | | | — | | | | — |
| Distributions from net realized | | | | | | | | | | | | | | | | |
| gain | | (.05) | | — | | | | — | | | | — | | | | — |
| Total distributions | | (.05) | | (.15) | | | | — | | | | — | | | | — |
| Redemption fees added to paid in | | | | | | | | | | | | | | | | |
| capitalB | | —D | | .01 | | | | — | | | | — | | | | — |
| Net asset value, end of period | | $ 17.97 | | $ 14.13 | | $ | | 13.20 | | $ | | 9.97 | | $ | | 9.21 |
| Total ReturnA | | 27.61% | | 8.24%E | | | | 32.40% | | | | 8.25% | | | | (25.36)% |
| Ratios to Average Net AssetsC | | | | | | | | | | | | | | | | |
| Expenses before expense | | | | | | | | | | | | | | | | |
| reductions | | 1.52% | | 2.11% | | | | 2.55% | | | | 2.18% | | | | 2.20% |
| Expenses net of voluntary waiv- | | | | | | | | | | | | | | | | |
| ers, if any | | 1.29% | | 1.75% | | | | 1.77% | | | | 1.75% | | | | 1.75% |
| Expenses net of all reductions | | 1.24% | | 1.74% | | | | 1.77% | | | | 1.73% | | | | 1.72% |
| Net investment income (loss) | | 1.40% | | .46% | | | | .94% | | | | .08% | | | | (.01)% |
| Supplemental Data | | | | | | | | | | | | | | | | |
| Net assets, end of period (000 | | | | | | | | | | | | | | | | |
| omitted) | | $ 4,791 | | $ 452 | | $ | | 1,538 | | $ | | 674 | | $ | | 658 |
| Portfolio turnover rate | | 66% | | 232% | | | | 172% | | | | 121% | | | | 62% |
A Total returns would have been lower had certain expenses not been reduced during the periods shown.
B Calculated based on average shares outstanding during the period.
C Expense ratios reflect operating expenses of the class. Expenses before reductions do not reflect amounts reimbursed by the investment adviser or reductions from brokerage service arrangements or other expense offset arrangements and do not represent the amount paid by the class during periods when reimbursements or reductions occur. Expenses net of any voluntary waivers reflect expenses after reimbursement by the investment adviser but prior to reductions from brokerage service arrangements or other expense offset arrangements. Expenses net of all reductions repre sent the net expenses paid by the class.
D Amount represents less than $.01 per share.
E In 2004 the fund received a favorable ruling in India which entitles the fund to a refund of capital gains taxes paid in the current and prior years. The impact to the fund was an increase in realized and unrealized gain (loss) per share of $.51. Excluding this benefit, the total return would have been 4.41% . The realized and unrealized gains were allocated on a pro rata basis to each class based on the relative net assets of each class to the total net assets of the fund.
See accompanying notes which are an integral part of the financial statements.
Notes to Financial Statements
For the period ended October 31, 2005
|
1. Significant Accounting Policies.
Fidelity Advisor Emerging Asia Fund (the fund) is a fund of Fidelity Advisor Series VIII (the trust) and is authorized to issue an unlimited number of shares. The trust is registered under the Investment Company Act of 1940, as amended (the 1940 Act), as an open-end management investment company organized as a Massachusetts business trust.
The fund offers Class A, Class T, Class B, Class C, and Institutional Class shares, each of which has equal rights as to assets and voting privileges. Each class has exclusive voting rights with respect to matters that affect that class. Class B shares will automatically convert to Class A shares after a holding period of seven years from the initial date of purchase. Investment income, realized and unrealized capital gains and losses, the common expenses of the fund, and certain fund-level expense reductions, if any, are allocated on a pro rata basis to each class based on the relative net assets of each class to the total net assets of the fund. Each class differs with respect to transfer agent and distribution and service plan fees incurred. Certain expense reductions also differ by class.
The fund’s investments in emerging markets can be subject to social, economic, regulatory, and political uncertainties and can be extremely volatile.
The fund may invest in affiliated money market central funds (Money Market Central Funds), collectively referred to as Central Funds, which are open-end investment companies available to investment companies and other accounts managed by Fidelity Management & Research Company (FMR) and its affiliates. The financial statements have been prepared in conformity with accounting principles generally accepted in the United States of America, which require management to make certain estimates and assumptions at the date of the financial statements. The following summarizes the significant accounting policies of the fund:
Security Valuation. Investments are valued and net asset value (NAV) per share is calculated (NAV calculation) as of the close of business of the New York Stock Exchange (NYSE), normally 4:00 p.m. Eastern time. Wherever possible, the fund uses independent pricing services approved by the Board of Trustees to value its investments.
Equity securities, including restricted securities, for which market quotations are readily available, are valued at the last reported sale price or official closing price as reported by an independent pricing service on the primary market or exchange on which they are traded. In the event there were no sales during the day or closing prices are not available, securities are valued at the last quoted bid price. Investments in open-end mutual funds, are valued at their closing net asset value each business day. Short-term securities with remaining maturities of sixty days or less for which quotations are not readily available are valued at amortized cost, which approximates value.
27 Annual Report
Notes to Financial Statements - continued
1. Significant Accounting Policies - continued
Security Valuation - continued
When current market prices or quotations are not readily available or do not accurately reflect fair value, valuations may be determined in accordance with procedures adopted by the Board of Trustees. For example, when developments occur between the close of a market and the close of the NYSE that may materially affect the value of some or all of the securities, or when trading in a security is halted, those securities may be fair valued. Factors used in the determination of fair value may include monitoring news to identify significant market or security specific events such as changes in the value of U.S. securities market, reviewing developments in foreign markets and evaluating the performance of ADRs, futures contracts and exchange-traded funds. Because the fund’s utilization of fair value pricing depends on market activity, the frequency with which fair value pricing is used can not be predicted and may be utilized to a significant extent. The value of securities used for NAV calculation under fair value pricing may differ from published prices for the same securities.
Foreign Currency. The fund uses foreign currency contracts to facilitate transactions in foreign-denominated securities. Losses from these transactions may arise from changes in the value of the foreign currency or if the counterparties do not perform under the contracts’ terms.
Foreign-denominated assets, including investment securities, and liabilities are translated into U.S. dollars at the exchange rate at period end. Purchases and sales of investment securities, income and dividends received and expenses denominated in foreign currencies are translated into U.S. dollars at the exchange rate in effect on the transaction date.
The effects of exchange rate fluctuations on investments are included with the net realized and unrealized gain (loss) on investment securities. Other foreign currency transactions resulting in realized and unrealized gain (loss) are disclosed separately.
Investment Transactions and Income. Security transactions are accounted for as of trade date. Gains and losses on securities sold are determined on the basis of identified cost. Dividend income is recorded on the ex-dividend date, except for certain dividends from foreign securities where the ex-dividend date may have passed, which are recorded as soon as the fund is informed of the ex-dividend date. Non-cash dividends included in dividend income, if any, are recorded at the fair market value of the securities received. Interest income is accrued as earned. Interest income includes coupon interest and amortization of premium and accretion of discount on debt securities. Investment income is recorded net of foreign taxes withheld where recovery of such taxes is uncertain.
1. Significant Accounting Policies - continued
Expenses. Most expenses of the trust can be directly attributed to a fund. Expenses which cannot be directly attributed are apportioned among each fund in the trust.
Income Tax Information and Distributions to Shareholders. Each year, the fund intends to qualify as a regulated investment company by distributing all of its taxable income and realized gains under Subchapter M of the Internal Revenue Code. As a result, no provision for income taxes is required in the accompanying financial statements. Foreign taxes are provided for based on the fund’s understanding of the tax rules and rates that exist in the foreign markets in which it invests.
On September 27, 2004, the fund received a final and favorable ruling in India regarding the applicability of taxes imposed by the country on realized capital gains under the US/India tax treaty. The favorable ruling entitled the fund to a refund of capital gains taxes paid in prior years and exempts the fund from taxes on future realized gains. The total benefit to the fund resulting from the ruling was US $1,547,115, and the per-share and total return impacts are disclosed on the Financial Highlights. A receivable balance of $270,638 for the tax refund is reflected in “Other Receivables” on the Statement of Assets and Liabilities.
Distributions are recorded on the ex-dividend date. Income dividends and capital gain distributions are declared separately for each class. Income and capital gain distributions are determined in accordance with income tax regulations, which may differ from generally accepted accounting principles. In addition, the fund will claim a portion of the payment made to redeeming shareholders as a distribution for income tax purposes.
Capital accounts within the financial statements are adjusted for permanent book-tax differences. These adjustments have no impact on net assets or the results of operations. Temporary book-tax differences will reverse in a subsequent period.
Book-tax differences are primarily due to foreign currency transactions, passive foreign investment companies (PFIC), and losses deferred due to wash sales.
The tax-basis components of distributable earnings and the federal tax cost as of period end were as follows:
| Unrealized appreciation | | $ | | 10,149,572 |
| Unrealized depreciation | | | | (3,090,529) |
| Net unrealized appreciation (depreciation) | | | | 7,059,043 |
| Undistributed ordinary income | | | | 5,321,308 |
| Undistributed long-term capital gain | | | | 1,375,822 |
| |
| Cost for federal income tax purposes | | $ | | 69,030,675 |
29 Annual Report
Notes to Financial Statements - continued
1. Significant Accounting Policies - continued
Income Tax Information and Distributions to Shareholders - continued
| The tax character of distributions paid was as follows: | | | | |
| | | | | October 31, 2005 | | | | October 31, 2004 |
| Ordinary Income | | $ | | — | | $ | | 275,262 |
| Long-term Capital Gains | | | | 154,881 | | | | 112,280 |
| Total | | $ | | 154,881 | | $ | | 387,542 |
Short-Term Trading (Redemption) Fees. Shares held in the fund less than 90 days are subject to a redemption fee equal to 1.50% of the proceeds of the redeemed shares. All redemption fees, including any estimated redemption fees paid by FMR are retained by the fund and accounted for as an addition to paid in capital.
Repurchase Agreements. FMR has received an Exemptive Order from the Securities and Exchange Commission (the SEC) which permits the fund and other affiliated entities of FMR to transfer uninvested cash balances into joint trading accounts which are then invested in repurchase agreements. The fund may also invest directly with institutions in repurchase agreements. Repurchase agreements are collateralized by government or non-government securities. Collateral is held in segregated accounts with custodian banks and may be obtained in the event of a default of the counterparty. The fund monitors, on a daily basis, the value of the collateral to ensure it is at least equal to the principal amount of the repurchase agreement (including accrued interest). In the event of a default by the counterparty, realization of the collateral proceeds could be delayed, during which time the value of the collateral may decline.
3. Purchases and Sales of Investments.
Purchases and sales of securities, other than short-term securities and U.S. government securities, aggregated $51,484,418 and $35,285,587, respectively.
4. Fees and Other Transactions with Affiliates.
Management Fee. FMR and its affiliates provide the fund with investment management related services for which the fund pays a monthly management fee. The management fee is the sum of an individual fund fee rate that is based on an annual rate of .45% of the fund’s average net assets and a group fee rate that averaged .27% during the period. The group fee rate is based upon the average net assets of all the mutual funds advised by FMR. The group fee rate decreases as assets under management increase and increases as assets under management decrease. For the period, the total annual management fee rate was .72% of the fund’s average net assets.
4. Fees and Other Transactions with Affiliates - continued
Distribution and Service Plan. In accordance with Rule 12b-1 of the 1940 Act, the fund has adopted separate Distribution and Service Plans for each class of shares. Certain classes pay Fidelity Distributors Corporation (FDC), an affiliate of FMR, separate Distribution and Service Fees, each of which is based on an annual percentage of each class’ average net assets. In addition, FDC may pay financial intermediaries for selling shares of the fund and providing shareholder support services. For the period, the Distribution and Service Fee rates and the total amounts paid to and retained by FDC were as follows:
| | | Distribution | | Service | | | | Paid to | | | | Retained |
| | | Fee | | Fee | | | | FDC | | | | by FDC |
| Class A | | 0% | | .25% | | $ | | 64,382 | | $ | | 3,875 |
| Class T | | 25% | | .25% | | | | 55,806 | | | | — |
| Class B | | 75% | | .25% | | | | 95,080 | | | | 71,310 |
| Class C | | 75% | | .25% | | | | 94,226 | | | | 29,064 |
| |
| | | | | | | $ | | 309,494 | | $ | | 104,249 |
Sales Load. FDC receives a front-end sales charge of up to 5.75% for selling Class A shares, and 3.50% for selling Class T shares, some of which is paid to financial intermediaries for selling shares of the fund. FDC receives the proceeds of contingent deferred sales charges levied on Class A, Class T, Class B, and Class C redemptions. These charges depend on the holding period. The deferred sales charges range from 5% to 1% for Class B, 1% for Class C, and .25% for certain purchases of Class A and Class T shares.
| For the period, sales charge amounts retained by FDC were as follows: | | |
| | | | | Retained |
| | | | | by FDC |
| Class A | | $ | | 31,068 |
| Class T | | | | 7,855 |
| Class B* | | | | 15,463 |
| Class C* | | | | 3,063 |
| | | $ | | 57,449 |
* When Class B and Class C shares are initially sold, FDC pays commissions from its own resources to financial intermediaries through which the sales are made.
31 Annual Report
Notes to Financial Statements - continued
4. Fees and Other Transactions with Affiliates - continued
Transfer Agent Fees. Fidelity Investments Institutional Operations Company, Inc. (FIIOC), an affiliate of FMR, is the transfer, dividend disbursing and shareholder servicing agent for each class of the fund. FIIOC receives account fees and asset-based fees that vary according to the account size and type of account of the shareholders of the respective classes of the fund. FIIOC pays for typesetting, printing and mailing of shareholder reports, except proxy statements. For the period the total transfer agent fees paid by each class to FIIOC, were as follows:
| | | | | | | % of |
| | | | | | | Average |
| | | | | Amount | | Net Assets |
| Class A | | $ | | 79,535 | | .31 |
| Class T | | | | 50,773 | | .45 |
| Class B | | | | 40,588 | | .43 |
| Class C | | | | 33,669 | | .36 |
| Institutional Class | | | | 3,903 | | .28 |
| | | $ | | 208,468 | | |
Accounting and Security Lending Fees. Fidelity Service Company, Inc. (FSC), an affiliate of FMR, maintains the fund’s accounting records. The accounting fee is based on the level of average net assets for the month. Under a separate contract, FSC administers the security lending program. The security lending fee is based on the number and duration of lending transactions.
Affiliated Central Funds. The fund may invest in Money Market Central Funds which seek preservation of capital and current income and are managed by Fidelity Investments Money Management, Inc. (FIMM), an affiliate of FMR.
The Money Market Central Funds do not pay a management fee. Income distributions earned by the fund are recorded as income in the accompanying financial statements and totaled $96,744 for the period.
5. Committed Line of Credit.
|
The fund participates with other funds managed by FMR in a $4.2 billion credit facility (the “line of credit”) to be utilized for temporary or emergency purposes to fund shareholder redemptions or for other short-term liquidity purposes. The fund has agreed to pay commitment fees on its pro rata portion of the line of credit. During the period, there were no borrowings on this line of credit.
The fund lends portfolio securities from time to time in order to earn additional income. The fund receives collateral (in the form of U.S. Treasury obligations, letters of credit and/or cash) against the loaned securities and maintains collateral in an amount not less
6. Security Lending - continued
than 100% of the market value of the loaned securities during the period of the loan. The market value of the loaned securities is determined at the close of business of the fund and any additional required collateral is delivered to the fund on the next business day. If the borrower defaults on its obligation to return the securities loaned because of insolvency or other reasons, a fund could experience delays and costs in recovering the securities loaned or in gaining access to the collateral. Cash collateral is invested in the Fidelity Securities Lending Cash Central Fund. The value of loaned securities and cash collateral at period end are disclosed on the fund’s Statement of Assets and Liabilities. Security lending income represents the income earned on investing cash collateral, less fees and expenses associated with the loan, plus any premium payments that may be received on the loan of certain types of securities.
FMR voluntarily agreed to reimburse each class to the extent annual operating expenses exceeded certain levels of average net assets as noted in the table below. Some expenses, for example interest expense, are excluded from this reimbursement.
| The following classes were in reimbursement during the period: | | | | |
| | | Expense | | | | Reimbursement |
| | | Limitations | | | | from adviser |
| Class A | | 2.00% | | -- | | 1.50%* | | $ | | 75,118 |
| Class T | | 2.25% | | -- | | 1.75%* | | | | 47,967 |
| Class B | | 2.75% | | -- | | 2.25%* | | | | 38,152 |
| Class C | | 2.75% | | -- | | 2.25%* | | | | 31,072 |
| Institutional Class | | 1.75% | | -- | | 1.25%* | | | | 3,161 |
| | | | | | | | | $ | | 195,470 |
| * Expense limitation in effect at period end. | | | | | | | | | | |
Many of the brokers with whom FMR places trades on behalf of the fund provided services to the fund in addition to trade execution. These services included payments of certain expenses on behalf of the fund totaling $32,744 for the period. In addition, through arrangements with the fund’s custodian, credits realized as a result of uninvested cash balances were used to reduce the fund’s expenses. During the period, these credits reduced the fund’s custody expenses by $101.
The fund’s organizational documents provide former and current trustees and officers with a limited indemnification against liabilities arising in connection with the performance of their duties to the fund. In the normal course of business, the fund may also
33 Annual Report
Notes to Financial Statements - continued
8. Other - continued
enter into contracts that provide general indemnifications. The fund’s maximum exposure under these arrangements is unknown as this would be dependent on future claims that may be made against the fund. The risk of material loss from such claims is considered remote.
| 9. Distributions to Shareholders. | | | | | | |
| |
| Distributions to shareholders of each class were as follows: | | | | |
| |
| Years ended October 31, | | | | 2005 | | | | 2004 |
| From net investment income | | | | | | | | |
| Class A | | $ | | — | | $ | | 262,328 |
| Class T | | | | — | | | | 47,004 |
| Class B | | | | — | | | | 33,782 |
| Class C | | | | — | | | | 35,907 |
| Institutional Class | | | | — | | | | 8,521 |
| Total | | $ | | — | | $ | | 387,542 |
| From net realized gain | | | | | | | | |
| Class A | | $ | | 75,153 | | $ | | — |
| Class T | | | | 27,877 | | | | — |
| Class B | | | | 25,998 | | | | — |
| Class C | | | | 24,310 | | | | — |
| Institutional Class | | | | 1,543 | | | | — |
| Total | | $ | | 154,881 | | $ | | — |
| 10. Share Transactions. | | | | | | | | | | | | |
| |
| Transactions for each class of shares were as follows: | | | | | | | | |
| |
| | | Shares | | | | | | Dollars |
| Years ended October 31, | | 2005 | | 2004 | | | | 2005 | | | | 2004 |
| Class A | | | | | | | | | | | | |
| Shares sold | | 518,720 | | 434,733 | | $ | | 9,010,497 | | $ | | 6,185,174 |
| Reinvestment of distributions | | 3,450 | | 12,079 | | | | 49,821 | | | | 161,725 |
| Shares redeemed | | (294,932) | | (783,804) | | | | (4,849,332) | | | | (10,515,828) |
| Net increase (decrease) | | 227,238 | | (336,992) $ | | 4,210,986 | | $ (4,168,929) |
| Class T | | | | | | | | | | | | |
| Shares sold | | 415,914 | | 380,716 | | $ | | 7,007,372 | | $ | | 5,152,134 |
| Reinvestment of distributions | | 1,927 | | 3,427 | | | | 27,491 | | | | 45,376 |
| Shares redeemed | | (166,466) | | (214,653) | | | | (2,751,962) | | | | (2,869,764) |
| Net increase (decrease) | | 251,375 | | 169,490 | | $ | | 4,282,901 | | $ | | 2,327,746 |
| Class B | | | | | | | | | | | | |
| Shares sold | | 286,104 | | 349,019 | | $ | | 4,680,793 | | $ | | 4,672,186 |
| Reinvestment of distributions | | 1,678 | | 2,359 | | | | 23,339 | | | | 30,615 |
| Shares redeemed | | (133,436) | | (234,681) | | | | (2,146,830) | | | | (3,052,361) |
| Net increase (decrease) | | 154,346 | | 116,697 | | $ | | 2,557,302 | | $ | | 1,650,440 |
| Class C | | | | | | | | | | | | |
| Shares sold | | 436,813 | | 348,062 | | $ | | 7,256,680 | | $ | | 4,708,149 |
| Reinvestment of distributions | | 1,423 | | 2,295 | | | | 19,794 | | | | 29,763 |
| Shares redeemed | | (135,427) | | (230,906) | | | | (2,135,513) | | | | (3,009,906) |
| Net increase (decrease) | | 302,809 | | 119,451 | | $ | | 5,140,961 | | $ | | 1,728,006 |
| Institutional Class | | | | | | | | | | | | |
| Shares sold | | 257,830 | | 57,551 | | $ | | 4,557,639 | | $ | | 812,450 |
| Reinvestment of distributions | | 24 | | 102 | | | | 347 | | | | 1,386 |
| Shares redeemed | | (23,195) | | (142,162) | | | | (403,547) | | | | (1,961,458) |
| Net increase (decrease) | | 234,659 | | (84,509) | | $ | | 4,154,439 | | $ (1,147,622) |
35 Annual Report
Report of Independent Registered Public Accounting Firm
To the Trustees of Fidelity Advisor Series VIII and the Shareholders of Fidelity Advisor Emerging Asia Fund:
In our opinion, the accompanying statement of assets and liabilities, including the schedule of investments, and the related statements of operations and of changes in net assets and the financial highlights present fairly, in all material respects, the financial position of Fidelity Advisor Emerging Asia Fund (a fund of Fidelity Advisor Series VIII) at October 31, 2005 and the results of its operations, the changes in its net assets and the financial highlights for the periods indicated, in conformity with accounting principles generally accepted in the United States of America. These financial statements and financial highlights (hereafter referred to as “financial statements”) are the responsibility of the Fidelity Advisor Emerging Asia Fund’s management; our responsibility is to express an opinion on these financial statements based on our audits. We conducted our audits of these financial statements in accordance with the standards of the Public Company Accounting Oversight Board (United States). Those standards require that we plan and perform the audit to obtain reasonable assurance about whether the financial statements are free of material misstatement. An audit includes examining, on a test basis, evidence supporting the amounts and disclosures in the financial statements, assessing the accounting principles used and significant estimates made by management, and evaluating the overall financial statement presentation. We believe that our audits, which included confirmation of securities at October 31, 2005 by correspondence with the custodian and brokers, provide a reasonable basis for our opinion.
/s/ PricewaterhouseCoopers LLP
PricewaterhouseCoopers LLP
Boston, Massachusetts
December 19, 2005
|
Trustees and Officers
The Trustees, Members of the Advisory Board, and executive officers of the trust and fund, as applicable, are listed below. The Board of Trustees governs the fund and is responsible for protecting the interests of shareholders. The Trustees are experienced executives who meet periodically throughout the year to oversee the fund’s activities, review contractual arrangements with companies that provide services to the fund, and review the fund’s performance. Except for William O. McCoy, Stephen P. Jonas, and Kenneth L. Wolfe, each of the Trustees oversees 322 funds advised by FMR or an affiliate. Mr. McCoy oversees 324 funds advised by FMR or an affiliate. Mr. Jonas and Mr. Wolfe oversee 319 funds advised by FMR or an affiliate.
The Trustees hold office without limit in time except that (a) any Trustee may resign; (b) any Trustee may be removed by written instrument, signed by at least two-thirds of the number of Trustees prior to such removal; (c) any Trustee who requests to be retired or who has become incapacitated by illness or injury may be retired by written instrument signed by a majority of the other Trustees; and (d) any Trustee may be removed at any special meeting of shareholders by a two-thirds vote of the outstanding voting securities of the trust. Each Trustee who is not an interested person (as defined in the 1940 Act) (Independent Trustee), shall retire not later than the last day of the calendar year in which his or her 72nd birthday occurs. The Independent Trustees may waive this mandatory retirement age policy with respect to individual Trustees. The executive officers and Advisory Board Members hold office without limit in time, except that any officer and Advisory Board Member may resign or may be removed by a vote of a majority of the Trustees at any regular meeting or any special meeting of the Trustees. Except as indicated, each individual has held the office shown or other offices in the same company for the past five years.
The fund’s Statement of Additional Information (SAI) includes more information about the Trustees. To request a free copy, call Fidelity at 1-877-208-0098.
Interested Trustees*:
Correspondence intended for each Trustee who is an interested person may be sent to Fidelity Investments, 82 Devonshire Street, Boston, Massachusetts 02109.
| Name, Age; Principal Occupation |
| |
| Edward C. Johnson 3d (75)** |
| |
| Year of Election or Appointment: 1983 |
| Mr. Johnson is Chairman of the Board of Trustees. Mr. Johnson serves as |
| Chief Executive Officer, Chairman, and a Director of FMR Corp.; a Di- |
| rector and Chairman of the Board and of the Executive Committee of |
| FMR; Chairman and a Director of Fidelity Management & Research (Far |
| East) Inc.; Chairman and a Director of Fidelity Investments Money Man- |
| agement, Inc.; and Chairman (2001-present) and a Director |
| (2000-present) of FMR Co., Inc. |
37 Annual Report
Trustees and Officers - continued
| Name, Age; Principal Occupation |
| |
| Abigail P. Johnson (43)** |
| |
| Year of Election or Appointment: 2001 |
| Ms. Johnson serves as President of Fidelity Employer Services Company |
| (FESCO) (2005-present). She is President and a Director of Fidelity In- |
| vestments Money Management, Inc. (2001-present), FMR Co., Inc. |
| (2001-present), and a Director of FMR Corp. Previously, Ms. Johnson |
| served as President and a Director of FMR (2001-2005), Senior Vice |
| President of the Fidelity funds (2001-2005), and managed a number of |
| Fidelity funds. |
| |
| Stephen P. Jonas (52) |
| |
| Year of Election or Appointment: 2005 |
| Mr. Jonas is Senior Vice President of Advisor Emerging Asia |
| (2005-present). He also serves as Senior Vice President of other Fidelity |
| funds (2005-present). Mr. Jonas is Executive Director of FMR |
| (2005-present). Previously, Mr. Jonas served as President of Fidelity En- |
| terprise Operations and Risk Services (2004-2005), Chief Administra- |
| tive Officer (2002-2004), and Chief Financial Officer of FMR Co. |
| (1998-2000). Mr. Jonas has been with Fidelity Investments since 1987 |
| and has held various financial and management positions including |
| Chief Financial Officer of FMR. In addition, he serves on the Boards of |
| Boston Ballet (2003-present) and Simmons College (2003-present). |
| |
| Robert L. Reynolds (53) |
| |
| Year of Election or Appointment: 2003 |
| Mr. Reynolds is a Director (2003-present) and Chief Operating Officer |
| (2002-present) of FMR Corp. He also serves on the Board at Fidelity |
| Investments Canada, Ltd. (2000-present). Previously, Mr. Reynolds |
| served as President of Fidelity Investments Institutional Retirement Group |
| (1996-2000). |
* Trustees have been determined to be “Interested Trustees” by virtue of, among other things, their affiliation with the trust or various entities under common control with FMR.
** Edward C. Johnson 3d, Trustee, is Abigail P. Johnson’s father.
Annual Report 38
Independent Trustees:
Correspondence intended for each Independent Trustee (that is, the Trustees other than the Interested Trustees) may be sent to Fidelity Investments, P.O. Box 55235, Boston, Massachusetts 02205-5235.
| Name, Age; Principal Occupation |
| |
| Dennis J. Dirks (57) |
| |
| Year of Election or Appointment: 2005 |
| Prior to his retirement in May 2003, Mr. Dirks was Chief Operating |
| Officer and a member of the Board of The Depository Trust & Clearing |
| Corporation (DTCC) (1999-2003). He also served as President, Chief |
| Operating Officer, and Board member of The Depository Trust |
| Company (DTC) (1999-2003) and President and Board member of the |
| National Securities Clearing Corporation (NSCC) (1999-2003). In addi- |
| tion, Mr. Dirks served as Chief Executive Officer and Board member of |
| the Government Securities Clearing Corporation (2001-2003) and Chief |
| Executive Officer and Board member of the Mortgage-Backed Securities |
| Clearing Corporation (2001-2003). Mr. Dirks also serves as a Trustee of |
| Manhattan College (2005-present). |
| |
| Robert M. Gates (62) |
| |
| Year of Election or Appointment: 1997 |
| Dr. Gates is Vice Chairman of the Independent Trustees (2005-present). |
| Dr. Gates is President of Texas A&M University (2002-present). He was |
| Director of the Central Intelligence Agency (CIA) from 1991 to 1993. |
| From 1989 to 1991, Dr. Gates served as Assistant to the President of |
| the United States and Deputy National Security Advisor. Dr. Gates is a |
| Director of NACCO Industries, Inc. (mining and manufacturing), Parker |
| Drilling Co., Inc. (drilling and rental tools for the energy industry, |
| 2001-present), and Brinker International (restaurant management, |
| 2003-present). Previously, Dr. Gates served as a Director of LucasVarity |
| PLC (automotive components and diesel engines), a Director of TRW Inc. |
| (automotive, space, defense, and information technology), and Dean of |
| the George Bush School of Government and Public Service at Texas |
| A&M University (1999-2001). Dr. Gates also is a Trustee of the Forum |
| for International Policy. |
39 Annual Report
Trustees and Officers - continued
| Name, Age; Principal Occupation |
| |
| George H. Heilmeier (69) |
| |
| Year of Election or Appointment: 2004 |
| Dr. Heilmeier is Chairman Emeritus of Telcordia Technologies (commu- |
| nication software and systems), where prior to his retirement, he served |
| as company Chairman and Chief Executive Officer. He currently serves |
| on the Boards of Directors of The Mitre Corporation (systems engineer- |
| ing and information technology support for the government), and HRL |
| Laboratories (private research and development, 2004-present). He is |
| Chairman of the General Motors Science & Technology Advisory Board |
| and a Life Fellow of the Institute of Electrical and Electronics Engineers |
| (IEEE) (2000-present). Dr. Heilmeier is a member of the Defense Science |
| Board and the National Security Agency Advisory Board. He is also a |
| member of the National Academy of Engineering, the American |
| Academy of Arts and Sciences, and the Board of Overseers of the |
| School of Engineering and Applied Science of the University of Pennsyl- |
| vania. Previously, Dr. Heilmeier served as a Director of TRW Inc. (auto- |
| motive, space, defense, and information technology, 1992-2002), |
| Compaq (1994-2002), Automatic Data Processing, Inc. (ADP) |
| (technology-based business outsourcing, 1995-2002), INET Technolo- |
| gies Inc. (telecommunications network surveillance, 2001-2004), and |
| Teletech Holdings (customer management services). He is the recipient of |
| the 2005 Kyoto Prize in Advanced Technology for his invention of the |
| liquid display. |
| |
| Marie L. Knowles (59) |
| |
| Year of Election or Appointment: 2001 |
| Prior to Ms. Knowles’ retirement in June 2000, she served as Executive |
| Vice President and Chief Financial Officer of Atlantic Richfield Company |
| (ARCO) (diversified energy, 1996-2000). From 1993 to 1996, she was |
| a Senior Vice President of ARCO and President of ARCO Transportation |
| Company. She served as a Director of ARCO from 1996 to 1998. She |
| currently serves as a Director of Phelps Dodge Corporation (copper |
| mining and manufacturing) and McKesson Corporation (healthcare ser- |
| vice, 2002-present). Ms. Knowles is a Trustee of the Brookings Institution |
| and the Catalina Island Conservancy and also serves as a member of |
| the Advisory Board for the School of Engineering of the University of |
| Southern California. |
Annual Report 40
| Name, Age; Principal Occupation |
| |
| Ned C. Lautenbach (61) |
| |
| Year of Election or Appointment: 2000 |
| Mr. Lautenbach has been a partner of Clayton, Dubilier & Rice, Inc. |
| (private equity investment firm) since September 1998. Previously, Mr. |
| Lautenbach was with the International Business Machines Corporation |
| (IBM) from 1968 until his retirement in 1998. Mr. Lautenbach serves as |
| a Director of Italtel Holding S.p.A. (telecommunications (Milan, Italy), |
| 2004-present) and Eaton Corporation (diversified industrial) as well as |
| the Philharmonic Center for the Arts in Naples, Florida. He also is a |
| member of the Board of Trustees of Fairfield University (2005-present), |
| as well as a member of the Council on Foreign Relations. |
| |
| Marvin L. Mann (72) |
| |
| Year of Election or Appointment: 1993 |
| Mr. Mann is Chairman of the Independent Trustees (2001-present). He is |
| Chairman Emeritus of Lexmark International, Inc. (computer |
| peripherals), where he served as CEO until April 1998, retired as |
| Chairman May 1999, and remains a member of the Board. Prior to |
| 1991, he held the positions of Vice President of International Business |
| Machines Corporation (IBM) and President and General Manager of |
| various IBM divisions and subsidiaries. He is a member of the Executive |
| Committee of the Independent Director’s Council of the Investment Com- |
| pany Institute. In addition, Mr. Mann is a member of the President’s |
| Cabinet at the University of Alabama and the Board of Visitors of the |
| Culverhouse College of Commerce and Business Administration at the |
| University of Alabama. |
| |
| William O. McCoy (72) |
| |
| Year of Election or Appointment: 1997 |
| Prior to his retirement in December 1994, Mr. McCoy was Vice Chair- |
| man of the Board of BellSouth Corporation (telecommunications) and |
| President of BellSouth Enterprises. He is currently a Director of Liberty |
| Corporation (holding company), Duke Realty Corporation (real estate), |
| and Progress Energy, Inc. (electric utility). He is also a partner of Frank- |
| lin Street Partners (private investment management firm) and a member |
| of the Research Triangle Foundation Board. In addition, Mr. McCoy |
| served as the Interim Chancellor (1999-2000) and a member of the |
| Board of Visitors for the University of North Carolina at Chapel Hill and |
| currently serves on the Board of Directors of the University of North |
| Carolina Health Care System and the Board of Visitors of the Kenan- |
| Flagler Business School (University of North Carolina at Chapel Hill). He |
| also served as Vice President of Finance for the University of North Car- |
| olina (16-school system). |
41 Annual Report
Trustees and Officers - continued
| Name, Age; Principal Occupation |
| |
| Cornelia M. Small (61) |
| |
| Year of Election or Appointment: 2005 |
| Ms. Small is a member (2000-present) and Chairperson (2002-present) |
| of the Investment Committee, and a member (2002-present) of the |
| Board of Trustees of Smith College. Previously, she served as Chief In- |
| vestment Officer (1999-2000), Director of Global Equity Investments |
| (1996-1999), and a member of the Board of Directors of Scudder, |
| Stevens & Clark (1990-1997) and Scudder Kemper Investments |
| (1997-1998). In addition, Ms. Small served as Co-Chair (2000-2003) |
| of the Annual Fund for the Fletcher School of Law and Diplomacy. |
| |
| William S. Stavropoulos (66) |
| |
| Year of Election or Appointment: 2001 |
| Mr. Stavropoulos is Chairman of the Board (2000-present) and a Mem- |
| ber of the Board of Directors of The Dow Chemical Company. Since |
| joining The Dow Chemical Company in 1967, Mr. Stavropoulos served |
| in numerous senior management positions, including President |
| (1993-2000; 2002-2003), CEO (1995-2000; 2002-2004), and Chair- |
| man of the Executive Committee (2000-2004). Currently, he is a Direc- |
| tor of NCR Corporation (data warehousing and technology solutions), |
| BellSouth Corporation (telecommunications), Chemical Financial Corpo- |
| ration, Maersk Inc. (industrial conglomerate, 2002-present), and Metal- |
| mark Capital (private equity investment firm, 2005-present). He also |
| serves as a member of the Board of Trustees of the American Enterprise |
| Institute for Public Policy Research. In addition, Mr. Stavropoulos is a |
| member of The Business Council, J.P. Morgan International Council and |
| the University of Notre Dame Advisory Council for the College of |
| Science. |
| |
| Kenneth L. Wolfe (66) |
| |
| Year of Election or Appointment: 2005 |
| Mr. Wolfe also serves as a Trustee (2005-present) or Member of the |
| Advisory Board (2004-present) of other investment companies advised |
| by FMR. Prior to his retirement in 2001, Mr. Wolfe was Chairman and |
| Chief Executive Officer of Hershey Foods Corporation (1993-2001). He |
| currently serves as a member of the boards of Adelphia Communica- |
| tions Corporation (2003-present), Bausch & Lomb, Inc., and Revlon Inc. |
| (2004-present). |
Annual Report 42
Advisory Board Members and Executive Officers:
Correspondence intended for Mr. Gamper may be sent to Fidelity Investments, P.O. Box 55235, Boston, Massachusetts 02205-5235. Correspondence intended for each executive officer and Mr. Lynch may be sent to Fidelity Investments, 82 Devonshire Street, Boston, Massachusetts 02109.
| Name, Age; Principal Occupation |
| |
| Albert R. Gamper, Jr. (63) |
| |
| Year of Election or Appointment: 2005 |
| Member of the Advisory Board of Fidelity Advisor Series VIII. Prior to his |
| retirement in December 2004, Mr. Gamper served as Chairman of the |
| Board of CIT Group Inc. (commercial finance). During his tenure with |
| CIT Group Inc. Mr. Gamper served in numerous senior management |
| positions, including Chairman (1987-1989; 1999-2001; 2002-2004), |
| Chief Executive Officer (1987-2004), and President (1989-2002). He |
| currently serves as a member of the Board of Directors of Public Service |
| Enterprise Group (utilities, 2001-present), Chairman of the Board of |
| Governors, Rutgers University (2004-present), and Chairman of the |
| Board of Saint Barnabas Health Care System. |
| |
| Peter S. Lynch (61) |
| |
| Year of Election or Appointment: 2003 |
| Member of the Advisory Board of Fidelity Advisor Series VIII. Vice |
| Chairman and a Director of FMR, and Vice Chairman (2001-present) |
| and a Director (2000-present) of FMR Co., Inc. Previously, Mr. Lynch |
| served as a Trustee of the Fidelity funds (1990-2003). In addition, he |
| serves as a Trustee of Boston College, Massachusetts Eye & Ear Infir- |
| mary, Historic Deerfield, John F. Kennedy Library, and the Museum of |
| Fine Arts of Boston. |
| |
| Dwight D. Churchill (51) |
| |
| Year of Election or Appointment: 2005 |
| Vice President of Advisor Emerging Asia. Mr. Churchill also serves as |
| Vice President of certain Equity Funds (2005-present) and certain High |
| Income Funds (2005-present). Previously, he served as Head of Fidelity’s |
| Fixed-Income Division (2000-2005), Vice President of Fidelity’s Money |
| Market Funds (2000-2005), Vice President of Fidelity’s Bond Funds, and |
| Senior Vice President of FIMM (2000) and FMR. Mr. Churchill joined |
| Fidelity in 1993 as Vice President and Group Leader of Taxable Fixed- |
| Income Investments. |
43 Annual Report
Trustees and Officers - continued
| Name, Age; Principal Occupation |
| |
| Eric D. Roiter (56) |
| |
| Year of Election or Appointment: 1998 |
| Secretary of Advisor Emerging Asia. He also serves as Secretary of |
| other Fidelity funds; Vice President, General Counsel, and Secretary of |
| FMR Co., Inc. (2001-present) and FMR; Assistant Secretary of Fidelity |
| Management & Research (U.K.) Inc. (2001-present), Fidelity Manage- |
| ment & Research (Far East) Inc. (2001-present), and Fidelity Investments |
| Money Management, Inc. (2001-present). Mr. Roiter is an Adjunct |
| Member, Faculty of Law, at Boston College Law School (2003-present). |
| Previously, Mr. Roiter served as Vice President and Secretary of Fidelity |
| Distributors Corporation (FDC) (1998-2005). |
| |
| Stuart Fross (46) |
| |
| Year of Election or Appointment: 2003 |
| Assistant Secretary of Advisor Emerging Asia. Mr. Fross also serves as |
| Assistant Secretary of other Fidelity funds (2003-present), Vice President |
| and Secretary of FDC (2005-present), and is an employee of FMR. |
| |
| Christine Reynolds (47) |
| |
| Year of Election or Appointment: 2004 |
| President, Treasurer, and Anti-Money Laundering (AML) officer of Advi- |
| sor Emerging Asia. Ms. Reynolds also serves as President, Treasurer, |
| and AML officer of other Fidelity funds (2004) and is a Vice President |
| (2003) and an employee (2002) of FMR. Before joining Fidelity Invest- |
| ments, Ms. Reynolds worked at PricewaterhouseCoopers LLP (PwC) |
| (1980-2002), where she was most recently an audit partner with PwC’s |
| investment management practice. |
| |
| Paul M. Murphy (58) |
| |
| Year of Election or Appointment: 2005 |
| Chief Financial Officer of Advisor Emerging Asia. Mr. Murphy also |
| serves as Chief Financial Officer of other Fidelity funds (2005-present). |
| He also serves as Senior Vice President of Fidelity Pricing and Cash |
| Management Services Group (FPCMS). |
| |
| Kenneth A. Rathgeber (58) |
| |
| Year of Election or Appointment: 2004 |
| Chief Compliance Officer of Advisor Emerging Asia. Mr. Rathgeber also |
| serves as Chief Compliance Officer of other Fidelity funds (2004) and |
| Executive Vice President of Risk Oversight for Fidelity Investments |
| (2002). Previously, he served as Executive Vice President and Chief Op- |
| erating Officer for Fidelity Investments Institutional Services Company, |
| Inc. (1998-2002). |
Annual Report 44
| Name, Age; Principal Occupation |
| |
| John R. Hebble (47) |
| |
| Year of Election or Appointment: 2003 |
| Deputy Treasurer of Advisor Emerging Asia. Mr. Hebble also serves as |
| Deputy Treasurer of other Fidelity funds (2003), and is an employee of |
| FMR. Before joining Fidelity Investments, Mr. Hebble worked at Deutsche |
| Asset Management where he served as Director of Fund Accounting |
| (2002-2003) and Assistant Treasurer of the Scudder Funds |
| (1998-2003). |
| |
| Bryan A. Mehrmann (44) |
| |
| Year of Election or Appointment: 2005 |
| Deputy Treasurer of Advisor Emerging Asia. Mr. Mehrmann also serves |
| as Deputy Treasurer of other Fidelity funds (2005-present) and is an |
| employee of FMR. Previously, Mr. Mehrmann served as Vice President of |
| Fidelity Investments Institutional Services Group (FIIS)/Fidelity Investments |
| Institutional Operations Corporation, Inc. (FIIOC) Client Services |
| (1998-2004). |
| |
| Kimberley H. Monasterio (41) |
| |
| Year of Election or Appointment: 2004 |
| Deputy Treasurer of Advisor Emerging Asia. Ms. Monasterio also serves |
| as Deputy Treasurer of other Fidelity funds (2004) and is an employee |
| of FMR (2004). Before joining Fidelity Investments, Ms. Monasterio |
| served as Treasurer (2000-2004) and Chief Financial Officer |
| (2002-2004) of the Franklin Templeton Funds and Senior Vice President |
| of Franklin Templeton Services, LLC (2000-2004). |
| |
| Kenneth B. Robins (36) |
| |
| Year of Election or Appointment: 2005 |
| Deputy Treasurer of Advisor Emerging Asia. Mr. Robins also serves as |
| Deputy Treasurer of other Fidelity funds (2005-present) and is an em- |
| ployee of FMR (2004-present). Before joining Fidelity Investments, Mr. |
| Robins worked at KPMG LLP, where he was a partner in KPMG’s de- |
| partment of professional practice (2002-2004) and a Senior Manager |
| (1999-2000). In addition, Mr. Robins served as Assistant Chief Accoun- |
| tant, United States Securities and Exchange Commission (2000-2002). |
| |
| Robert G. Byrnes (38) |
| |
| Year of Election or Appointment: 2005 |
| Assistant Treasurer of Advisor Emerging Asia. Mr. Byrnes also serves as |
| Assistant Treasurer of other Fidelity funds (2005-present) and is an em- |
| ployee of FMR (2005-present). Previously, Mr. Byrnes served as Vice |
| President of FPCMS (2003-2005). Before joining Fidelity Investments, |
| Mr. Byrnes worked at Deutsche Asset Management where he served as |
| Vice President of the Investment Operations Group (2000-2003). |
45 Annual Report
Trustees and Officers - continued
| Name, Age; Principal Occupation |
| |
| John H. Costello (59) |
| |
| Year of Election or Appointment: 1994 |
| Assistant Treasurer of Advisor Emerging Asia. Mr. Costello also serves |
| as Assistant Treasurer of other Fidelity funds and is an employee of |
| FMR. |
| |
| Peter L. Lydecker (51) |
| |
| Year of Election or Appointment: 2004 |
| Assistant Treasurer of Advisor Emerging Asia. Mr. Lydecker also serves |
| as Assistant Treasurer of other Fidelity funds (2004) and is an employee |
| of FMR. |
| |
| Mark Osterheld (50) |
| |
| Year of Election or Appointment: 2002 |
| Assistant Treasurer of Advisor Emerging Asia. Mr. Osterheld also serves |
| as Assistant Treasurer of other Fidelity funds (2002) and is an employee |
| of FMR. |
| |
| Gary W. Ryan (47) |
| |
| Year of Election or Appointment: 2005 |
| Assistant Treasurer of Advisor Emerging Asia. Mr. Ryan also serves as |
| Assistant Treasurer of other Fidelity funds (2005-present) and is an em- |
| ployee of FMR (2005-present). Previously, Mr. Ryan served as Vice Pres- |
| ident of Fund Reporting in FPCMS (1999-2005). |
| |
| Salvatore Schiavone (39) |
| |
| Year of Election or Appointment: 2005 |
| Assistant Treasurer of Advisor Emerging Asia. Mr. Schiavone also serves |
| as Assistant Treasurer of other Fidelity funds (2005-present) and is an |
| employee of FMR (2005-present). Before joining Fidelity Investments, |
| Mr. Schiavone worked at Deutsche Asset Management, where he most |
| recently served as Assistant Treasurer (2003-2005) of the Scudder |
| Funds and Vice President and Head of Fund Reporting (1996-2003). |
Annual Report 46
The Board of Trustees of Fidelity Advisor Emerging Asia Fund voted to pay to shareholders of record at the opening of business on record date, the following distributions per share derived from capital gains realized from sales of portfolio securities, and dividends derived from net investment income:
| | | Pay Date | | Record Date | | Dividends | | Capital Gains |
| Class A | | 12/12/05 | | 12/09/05 | | $.163 | | $1.39 |
| Class T | | 12/12/05 | | 12/09/05 | | $.124 | | $1.39 |
| Class B | | 12/12/05 | | 12/09/05 | | $.042 | | $1.39 |
| Class C | | 12/12/05 | | 12/09/05 | | $.070 | | $1.39 |
The fund hereby designates as capital gain dividends: For dividends with respect to the taxable year ended October 31, 2005, $1,400,505, or, if subsequently determined to be different, the net capital gain of such year, and for dividends with respect to the taxable year ended October 31, 2004, $130,197, or, if subsequently determined to be different, the excess of: (a) the net capital gain of such year, over (b) amounts previously designated as capital gain dividends with respect to such year.
The fund will notify shareholders in January 2006 of amounts for use in preparing 2005 income tax returns.
47 Annual Report
Board Approval of Investment Advisory Contracts and Management Fees
Advisor Emerging Asia Fund
Each year, typically in July, the Board of Trustees, including the independent Trustees (together, the Board), votes on the renewal of the management contract and sub-advisory agreements (together, the Advisory Contracts) for the fund. The Board, assisted by the advice of fund counsel and independent Trustees’ counsel, requests and considers a broad range of information throughout the year.
The Board meets regularly each month except August and takes into account throughout the year matters bearing on Advisory Contracts. The Board, acting directly and through its separate committees, considers at each of its meetings factors that are relevant to the annual renewal of the fund’s Advisory Contracts, including the services and support provided to the fund and its shareholders by Fidelity. At the time of the renewal, the Board had 11 standing committees, each composed of independent Trustees with varying backgrounds, to which the Board has assigned specific subject matter responsibilities in order to enhance effective decision-making by the Board. Each committee has adopted a written charter outlining the structure and purposes of the committee. One such committee, the Equity Contract Committee, meets periodically during the first six months of each year and as necessary to consider matters specifically related to the annual renewal of Advisory Contracts. The committee requests and receives information on, and makes recommendations to the independent Trustees concerning, the approval and annual review of the Advisory Contracts.
At its July 2005 meeting, the Board of Trustees, including the independent Trustees, unanimously determined to renew the Advisory Contracts for the fund. In reaching its determination, the Board considered all factors it believed relevant, including (1) the nature, extent, and quality of the services to be provided to the fund and its shareholders by Fidelity (including the investment performance of the fund); (2) the competitiveness of the management fee and total expenses of the fund; (3) the total costs of the services to be provided by and the profits to be realized by the investment adviser and its affiliates from the relationship with the fund; (4) the extent to which economies of scale would be realized as the fund grows; and (5) whether fee levels reflect these economies of scale, if any, for the benefit of fund shareholders.
In determining whether to renew the Advisory Contracts for the fund, the Board ultimately reached a determination, with the assistance of fund counsel and independent Trustees’ counsel, that the renewal of the Advisory Contracts and the compensation to be received by Fidelity under the management contract is consistent with Fidelity’s fiduciary duty under applicable law. In addition to evaluating the specific factors noted above, the Board, in reaching its determination, is aware that shareholders in the fund have a broad range of investment choices available to them, including a wide choice among mutual funds offered by competitors to Fidelity, and that the fund’s shareholders, with the opportunity to review and weigh the disclosure provided by the fund in its
prospectus and other public disclosures, have chosen to invest in this fund, managed by Fidelity.
Nature, Extent, and Quality of Services Provided by Fidelity. The Board considered staffing within the investment adviser, FMR, and the sub-advisers (together, the Investment Advisers), including the background of the fund’s portfolio manager and the fund’s investment objective and discipline. The independent Trustees also had discussions with senior management of Fidelity’s investment operations and investment groups. The Board considered the structure of the portfolio manager compensation program and whether this structure provides appropriate incentives.
Fidelity Resources Dedicated to Investment Management and Support Services. The Board reviewed the size, education, and experience of the Investment Advisers’ investment staff, their use of technology, and the Investment Advisers’ approach to recruiting, training, and retaining portfolio managers and other research, advisory, and management personnel. The Board considered Fidelity’s extensive global research capabilities that enable the Investment Advisers to aggregate data from various sources in an effort to produce positive investment results. The Board noted that Fidelity’s analysts have access to a variety of technological tools that enable them to perform both fundamental and quantitative analysis and to specialize in various disciplines. The Board also considered that Fidelity’s portfolio managers and analysts have access to daily portfolio attribution that allows for monitoring of a fund’s portfolio, as well as an electronic communication system that provides immediate real-time access to research concerning issuers and credit enhancers.
Shareholder and Administrative Services. The Board considered the nature, extent, quality, and cost of administrative, distribution, and shareholder services performed by the Investment Advisers and their affiliates under the Advisory Contracts and under separate agreements covering transfer agency, pricing and bookkeeping, and securities lending services for the fund. The Board also considered the nature and extent of the Investment Advisers’ supervision of third party service providers, principally custodians and subcustodians. The Board reviewed the allocation of fund brokerage, including allocations to brokers affiliated with the Investment Advisers, the use of brokerage commissions to pay fund expenses, and the use of “soft” commission dollars to pay for research services. The Board also considered that Fidelity voluntarily decided in 2004 to stop using “soft” commission dollars to pay for market data and, instead, to pay for that data out of its own resources. The Board also considered the resources devoted to, and the record of compliance with, the fund’s compliance policies and procedures.
The Board noted that the growth of fund assets across the complex allows Fidelity to reinvest in the development of services designed to enhance the value or convenience of the Fidelity funds as investment vehicles. These services include 24-hour access to
49 Annual Report
Board Approval of Investment Advisory Contracts and Management Fees - continued
account information and market information through phone representatives and over the Internet, and investor education materials and asset allocation tools.
Investment in a Large Fund Family. The Board considered the benefits to shareholders of investing in a Fidelity fund, including the benefits of investing in a fund that is part of a large family of funds offering a variety of investment disciplines and providing for a large variety of mutual fund investor services. For example, fund shareholders are offered the privilege of exchanging shares of the fund for shares of other Fidelity funds, as set forth in the fund’s prospectus, without paying an additional sales charge. The Board noted that, since the last Advisory Contract renewals in July 2004, Fidelity has taken a number of actions that benefited particular funds, including (i) voluntarily deciding in 2004 to stop using “soft” commission dollars to pay for market data and, instead, to pay for that data out of its own resources, (ii) contractually agreeing to impose management fee reductions and expense limitations on its five Spartan stock index funds and its stock index fund available through variable insurance products, (iii) contractually agreeing to eliminate the management fees on the Fidelity Freedom Funds and the Fidelity Advisor Freedom Funds, (iv) contractually agreeing to reduce the management fees on most of its investment-grade taxable bond funds, and (v) contractually agreeing to impose expense limitations on its retail and Spartan investment-grade taxable bond funds.
Investment Performance and Compliance. The Board considered whether the fund has operated within its investment objective, as well as its record of compliance with its investment restrictions. It also reviewed the fund’s absolute investment performance for each class, as well as the fund’s relative investment performance for each class measured against (i) a broad-based securities market index, and (ii) a peer group of mutual funds over multiple periods. The following charts considered by the Board show, over the one-, three-, and five-year periods ended December 31, 2004, the returns of Class C and Institutional Class of the fund, the returns of a broad-based securities market index (“benchmark”), and a range of returns of a peer group of mutual funds identified by Lipper Inc. as having an investment objective similar to that of the fund. The returns of Class C and Institutional Class represent the performance of classes with the highest and lowest 12b-1 fees, respectively (not necessarily with the highest and lowest total expenses). The box within each chart shows the 25th percentile return (bottom of box) and the 75th percentile return (top of box) of the Lipper peer group. Returns shown above the box are in the first quartile and returns shown below the box are in the fourth quartile. The percentage beaten numbers noted below each chart correspond to the percentile box and represent the percentage of funds in the Lipper peer group whose performance was equal to or lower than that of the class indicated.

The Board reviewed the fund’s relative investment performance against its Lipper peer group and stated that the performance of Institutional Class of the fund was in the fourth quartile for the one-, three-, and five-year periods. The Board noted that FMR does not consider that Lipper peer group to be a meaningful comparison for the fund, however, because unlike most of its Lipper peers, the fund focuses its investments on securities of emerging market issuers. The Board also stated that the relative investment performance of the fund was lower than its benchmark over time. The Board considered that the variations in performance among the fund’s classes reflect the variations in class expenses, which result in lower performance for higher expense classes.
The Board has had thorough discussions with FMR throughout the year about the Board’s and FMR’s concerns about equity research, equity fund performance, and compliance with internal policies governing gifts and entertainment. FMR has taken steps that it believes will refocus and strengthen equity research and equity portfolio management and compliance. The Board noted with favor FMR’s recent reorganization of its senior management team and FMR’s plans to dedicate additional resources to investment research, and participated in the process that led to those changes.
Based on its review, and giving particular weight to the nature and quality of the resources dedicated by the Investment Advisers to maintain and improve relative performance, the Board concluded that the nature, extent, and quality of the services provided by Fidelity will benefit the fund’s shareholders, particularly in light of the Board’s view that the fund’s shareholders benefit from investing in a fund that is part of a large family of funds offering a variety of investment disciplines and services.
51 Annual Report
Board Approval of Investment Advisory Contracts and Management Fees - continued
Competitiveness of Management Fee and Total Fund Expenses. The Board considered the fund’s management fee and total expenses compared to “mapped groups” of competitive funds and classes. Fidelity creates “mapped groups” by combining similar Lipper investment objective categories that have comparable management fee characteristics. Combining Lipper investment objective categories aids the Board’s management fee and total expense comparisons by broadening the competitive group used for comparison and by reducing the number of universes to which various Fidelity funds are compared.
The Board considered two proprietary management fee comparisons for the 12-month periods shown in the chart below. The group of Lipper funds used by the Board for management fee comparisons is referred to below as the “Total Mapped Group” and, for the reasons explained above, is broader than the Lipper peer group used by the Board for performance comparisons. The Total Mapped Group comparison focuses on a fund’s standing relative to the total universe of comparable funds available to investors, in terms of gross management fees before expense reimbursements or caps. “TMG %” represents the percentage of funds in the Total Mapped Group that had management fees that were lower than the fund’s. For example, a TMG % of 12% means that 88% of the funds in the Total Mapped Group had higher management fees than the fund. The “Asset-Size Peer Group” (ASPG) comparison focuses on a fund’s standing relative to non-Fidelity funds similar in size to the fund within the Total Mapped Group. The ASPG represents at least 15% of the funds in the Total Mapped Group with comparable asset size and management fee characteristics, subject to a minimum of 50 funds (or all funds in the Total Mapped Group if fewer than 50). Additional information, such as the ASPG quartile (“quadrant”) in which the fund’s management fee ranked, is also included in the chart and considered by the Board.

The Board noted that the fund’s management fee ranked below the median of its Total Mapped Group and below the median of its ASPG for 2004.
Based on its review, the Board concluded that the fund’s management fee was fair and reasonable in light of the services that the fund receives and the other factors considered.
In its review of each class’s total expenses, the Board considered the fund’s management fee as well as other fund or class expenses, as applicable, such as transfer agent fees, pricing and bookkeeping fees, fund-paid 12b-1 fees, and custodial, legal, and audit fees. The Board also noted the effects of any waivers and reimbursements on fees and expenses. As part of its review, the Board also considered current and historical total expenses of each class of the fund compared to competitive fund median expenses. Each class of the fund is compared to those funds and classes in the Total Mapped Group (used by the Board for management fee comparisons) that have a similar sales load structure.
The Board noted that the total expenses of Class A ranked below its competitive median for 2004, the total expenses of each of Class B and Class C ranked equal to its competitive median for 2004, and the total expenses of each of Class T and Institutional Class ranked above its competitive median for 2004. The Board noted that the fund offers multiple classes, each of which has a different sales load and 12b-1 fee structure, and that the multiple structures are intended to offer a range of pricing options for the intermediary market. The Board also noted that the total expenses of the classes vary primarily by the level of their 12b-1 fees, although differences in transfer agent fees may also cause expenses to vary from class to class.
53 Annual Report
Board Approval of Investment Advisory Contracts and Management Fees - continued
Furthermore, the Board considered that on December 16, 2004, it had approved changes (effective January 1, 2005) in the transfer agent and service agreements for the fund that established maximum transfer agent fees and eliminated the minimum pricing and bookkeeping fee to prevent small funds or funds with small average account sizes from having relatively high fees in basis points (the “small-fund fee reductions”). The Board considered that, if the small-fund fee reductions had been in effect in 2004, the total expenses of each of Class T and Institutional Class would have ranked below the median.
In its review of total expenses, the Board also considered Fidelity fee structures and other information on clients that FMR and its affiliates service in other competitive markets, such as other mutual funds advised or subadvised by FMR or its affiliates, pension plan clients, and other institutional clients.
Based on its review, the Board concluded that the total expenses for each class of the fund were reasonable, although in some cases above the median of the universe presented for comparison, in light of the services that the fund and its shareholders receive and the other factors considered.
Costs of the Services and Profitability. The Board considered the revenues earned and the expenses incurred by Fidelity in conducting the business of developing, marketing, distributing, managing, administering and servicing the fund and its shareholders. The Board also considered the level of Fidelity’s profits in respect of all the Fidelity funds.
On an annual basis, FMR presents to the Board Fidelity’s profitability for the fund. Fidelity calculates the profitability for each fund, as well as aggregate profitability for groups of Fidelity funds and all Fidelity funds, using a series of detailed revenue and cost allocation methodologies which originate with the audited books and records of Fidelity. The Audit Committee of the Board reviews any significant changes from the prior year’s methodologies.
PricewaterhouseCoopers LLP (PwC), independent registered accounting firm and auditor to Fidelity and certain Fidelity funds, has been engaged annually by the Board as part of the Board’s assessment of the results of Fidelity’s profitability analysis. PwC’s engagement includes the review and assessment of Fidelity’s methodologies used in determining the revenues and expenses attributable to Fidelity’s mutual fund business, and completion of agreed-upon procedures surrounding the mathematical accuracy of fund profitability and its conformity to allocation methodologies. After considering PwC’s reports issued under the engagement and information provided by Fidelity, the Board believes that while other allocation methods may also be reasonable, Fidelity’s profitability methodologies are reasonable in all material respects.
The Board has also reviewed Fidelity’s non-fund businesses and any fall-out benefits related to the mutual fund business as well as cases where Fidelity’s affiliates may
benefit from or be related to the fund’s business. In addition, a special committee of the Board reviewed services provided to Fidelity by its affiliates and determined that the fees that Fidelity paid for such services were reasonable.
The Board considered the costs of the services provided by and the profits realized by Fidelity in connection with the operation of the fund and determined that the amount of profit is a fair entrepreneurial profit for the management of the fund.
Economies of Scale. The Board considered whether there have been economies of scale in respect of the management of the Fidelity funds, whether the Fidelity funds (including the fund) have appropriately benefited from any such economies of scale, and whether there is potential for realization of any further economies of scale. The Board considered the extent to which the fund will benefit from economies of scale through increased services to the fund, through waivers or reimbursements, or through fee or expense reductions, including reductions that occur through operation of the transfer agent agreement. The transfer agent fee varies in part based on the number of accounts in the fund. If the number of accounts decreases or the average account size increases, the overall transfer agent fee rate decreases.
The Board recognized that the fund’s management contract incorporates a “group fee” structure, which provides for lower fee rates as total fund assets under FMR’s management increase, and for higher fee rates as total fund assets under FMR’s management decrease. The Board considered that the group fee is designed to deliver the benefits of economies of scale to fund shareholders when total fund assets increase, even if assets of any particular fund are unchanged or have declined, because some portion of Fidelity’s costs are attributable to services provided to all Fidelity funds, and all funds benefit if those costs can be allocated among more assets. The Board concluded that, given the group fee structure, fund shareholders will achieve a certain level of economies of scale as assets under FMR’s management increase at the fund complex level, regardless of whether Fidelity achieves any such economies of scale.
The Board further concluded that any potential economies of scale are being shared between fund shareholders and Fidelity in an appropriate manner.
Additional Information Requested by the Board. In order to develop fully the factual basis for consideration of the Advisory Contracts, the Board requested additional information regarding (i) equity fund transfer agency fees; (ii) Fidelity’s fund profitability methodology and the impact of various changes in the methodology over time; (iii) benefits to shareholders from economies of scale; (iv) composition and characteristics of various fund and industry data used in comparisons; and (v) compensation of portfolio managers and research analysts.
Based on its evaluation of all of the conclusions noted above, and after considering all material factors, the Board ultimately concluded that the existing advisory fee structures
55 Annual Report
Board Approval of Investment Advisory Contracts and Management Fees - continued
are fair and reasonable, and that the fund’s existing Advisory Contracts should be renewed.
57 Annual Report
59 Annual Report
61 Annual Report
Investment Adviser
Fidelity Management & Research Company
Boston, MA
Investment Sub-Advisers
FMR Co., Inc.
Fidelity Management & Research
(U.K.) Inc.
Fidelity Management & Research
(Far East) Inc.
Fidelity International
Investment Advisors
Fidelity Investments Japan Limited
Fidelity International Investment
Advisors (U.K.) Limited
General Distributor
Fidelity Distributors Corporation
Boston, MA
Transfer and Service Agents
Fidelity Investments Institutional
Operations Company, Inc.
Boston, MA
Fidelity Service Company, Inc.
Boston, MA
Custodian
Brown Brothers Harriman & Co.
Boston, MA
|


Fidelity® Advisor
Emerging Asia
Fund - Institutional Class
Annual Report October 31, 2005

| Contents | | | | |
| |
| Chairman’s Message | | 4 | | Ned Johnson’s message to shareholders. |
| Performance | | 6 | | How the fund has done over time. |
| Management’s Discussion | | 7 | | The manager’s review of fund |
| | | | | performance, strategy and outlook. |
| Shareholder Expense | | 8 | | An example of shareholder expenses. |
| Example | | | | |
| Investment Changes | | 10 | | A summary of major shifts in the fund’s |
| | | | | investments over the past six months. |
| Investments | | 11 | | A complete list of the fund’s investments |
| | | | | with their market values. |
| Financial Statements | | 17 | | Statements of assets and liabilities, |
| | | | | operations, and changes in net assets, |
| | | | | as well as financial highlights. |
| Notes | | 26 | | Notes to the financial statements. |
| Report of Independent | | 35 | | |
| Registered Public | | | | |
| Accounting Firm | | | | |
| Trustees and Officers | | 36 | | |
| Distributions | | 46 | | |
| Board Approval of | | 47 | | |
| Investment Advisory | | | | |
| Contracts and | | | | |
| Management Fees | | | | |
To view a fund’s proxy voting guidelines and proxy voting record for the 12-month period ended June 30, visit www.fidelity.com/proxyvotingresults or visit the Securities and Exchange Commission’s (SEC) web site at www.sec.gov. You may also call 1-877-208-0098 to request a free copy of the proxy voting guidelines.
Standard & Poor’s, S&P and S&P 500 are registered service marks of The McGraw-Hill Companies, Inc. and have been licensed for use by Fidelity Distributors Corporation.
Other third party marks appearing herein are the property of their respective owners.
All other marks appearing herein are registered or unregistered trademarks or service marks of FMR Corp. or an affiliated company.
This report and the financial statements contained herein are submitted for the general information of the shareholders of the fund. This report is not authorized for distribution to prospective investors in the fund unless preceded or accompanied by an effective prospectus.
A fund files its complete schedule of portfolio holdings with the SEC for the first and third quarters of each fiscal year on Form N-Q. Forms N-Q are available on the SEC’s web site at http://www.sec.gov. A fund’s Forms N-Q may be reviewed and copied at the SEC’s Public Reference Room in Washington, DC. Information regarding the operation of the SEC’s Public Reference Room may be obtained by calling 1-800-SEC-0330. For a complete list of a fund’s portfolio holdings, view the most recent quarterly holdings report, semiannual report, or annual report on Fidelity’s web site at http://www.advisor.fidelity.com.
NOT FDIC INSURED · MAY LOSE VALUE · NO BANK GUARANTEE
Neither the fund nor Fidelity Distributors Corporation is a bank.
3 Annual Report
Chairman’s Message
(Photograph of Edward C. Johnson 3d)
Dear Shareholder:
During the past year or so, much has been reported about the mutual fund industry, and much of it has been more critical than I believe is warranted. Allegations that some companies have been less than forthright with their shareholders have cast a shadow on the entire industry. I continue to find these reports disturbing, and assert that they do not create an accurate picture of the industry overall. Therefore, I would like to remind everyone where Fidelity stands on these issues. I will say two things specifically regarding allegations that some mutual fund companies were in violation of the Securities and Exchange Commission’s forward pricing rules or were involved in so-called “market timing” activities.
First, Fidelity has no agreements that permit customers who buy fund shares after 4 p.m. to obtain the 4 p.m. price. This is not a new policy. This is not to say that someone could not deceive the company through fraudulent acts. However, we are extremely diligent in preventing fraud from occurring in this manner — and in every other. But I underscore again that Fidelity has no so-called “agreements” that sanction illegal practices.
Second, Fidelity continues to stand on record, as we have for years, in opposition to predatory short-term trading that adversely affects shareholders in a mutual fund. Back in the 1980s, we initiated a fee — which is returned to the fund and, therefore, to investors — to discourage this activity. Further, we took the lead several years ago in developing a Fair Value Pricing Policy to prevent market timing on foreign securities in our funds. I am confident we will find other ways to make it more difficult for predatory traders to operate. However, this will only be achieved through close cooperation among regulators, legislators and the industry.
Yes, there have been unfortunate instances of unethical and illegal activity within the mutual fund industry from time to time. That is true of any industry. When this occurs, confessed or convicted offenders should be dealt with appropriately. But we are still concerned about the risk of over-regulation and the quick application of simplistic solutions to intricate problems. Every system can be improved, and we support and applaud well thought out improvements by regulators, legislators and industry representatives that achieve the common goal of building and protecting the value of investors’ holdings.
For nearly 60 years, Fidelity has worked very hard to improve its products and service to justify your trust. When our family founded this company in 1946, we had only a few hundred customers. Today, we serve more than 18 million customers including individual investors and participants in retirement plans across America.
Annual Report 4
Let me close by saying that we do not take your trust in us for granted, and we realize that we must always work to improve all aspects of our service to you. In turn, we urge you to continue your active participation with your financial matters, so that your interests can be well served.
Best regards,
/s/Edward C. Johnson 3d
5 Annual Report
Performance: The Bottom Line
Average annual total return reflects the change in the value of an investment, assuming reinvestment of the class’ dividend income and capital gains (the profits earned upon the sale of securities that have grown in value) and assuming a constant rate of performance each year. The $10,000 table and the fund’s returns do not reflect the deduction of taxes that a shareholder would pay on fund distributions or the redemption of fund shares. During periods of reimbursement by Fidelity, a fund’s total return will be greater than it would be had the reimbursement not occurred. How a fund did yesterday is no guarantee of how it will do tomorrow.
| Average Annual Total Returns | | | | | | |
| Periods ended October 31, 2005 | | Past 1 | | Past 5 | | Past 10 |
| | | year | | years | | years |
| Institutional ClassA | | 27.61% | | 8.12% | | 3.38% |
A Institutional Class shares are sold to eligible investors without a sales load or 12b-1 fee. Returns between March 25, 1995 and June 16, 1999 are those of Fidelity Advisor Emerging Asia Fund, Inc., the Closed-End Fund. On June 15, 1999, the Closed-End Fund reorganized as an open-end fund through a transfer of all its assets and liabilities to Fidelity Advisor Emerging Asia Fund (the fund). Shareholders of the Closed-End Fund received Class A shares of the fund in exchange for their shares of the Closed-End Fund. If the effect of Institutional Class expenses was reflected, returns may be lower than shown because Institutional Class shares of the fund may have higher total expenses than the Closed-End Fund.
Let’s say hypothetically that $10,000 was invested in Fidelityr Advisor Emerging Asia Fund — Institutional Class on October 31, 1995. The chart shows how the value of your investment would have changed, and also shows how the Morgan Stanley Capital InternationalSM AC Asia ex Japan Index performed over the same period.
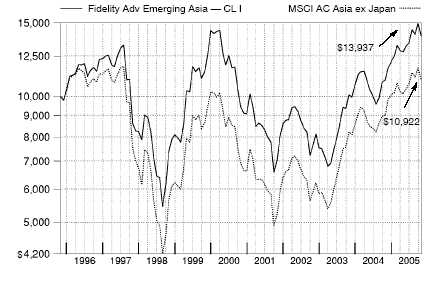
Annual Report 6
Management’s Discussion of Fund Performance
Comments from Kevin Chang, Portfolio Manager of Fidelity® Advisor Emerging Asia
Roller coaster analogies are commonly used to describe the frequent ups and downs of Asian equity markets. Take 1999, for instance, when the Morgan Stanley Capital InternationalSM All Country Asia ex Japan Index — designed to measure equity market performance in Asia, except for Japan — jumped 64.67%, only to lose 35.22% the following year. That’s a 100 percentage-point turnaround. For the past two-plus years, though, Asian stocks climbed higher, fueled in part by stronger economies and improved domestic demand. For the 12-month period ending October 31, 2005, the Morgan Stanley index returned 21.25% . Its largest component on average during the period — South Korea — had one of the highest returns, gaining more than 43%. Korea’s performance, combined with India’s strong showing, accounted for much of the index’s final tally, as the second- and third-largest country weightings — Hong Kong and Taiwan — both underperformed the benchmark’s overall return. The index overall fell 6.56% in the final month of the period — another reminder of the considerable volatility in the region’s stocks.
For the 12 months ending October 31, 2005, the fund’s Institutional Class shares returned 27.61% . That result beat the MSCI index, as well as the 25.23% return of the LipperSM Pacific Region ex Japan Funds Average. A key reason for the fund’s outperformance versus the index was rewarding stock selection in the industrials sector, particularly among South Korean and Indian companies. In Korea, an overweighted position in niche shipbuilder Hyundai Mipo Dockyard added value. The company continued to see strong demand for its products given the under-ordering of these ships that had occurred previously. Performance also was aided by overweighted positions in the top two Korean car makers, Hyundai Motor and Kia Motors. Conversely, the performance of Hong Kong-listed HSBC Holdings, one of the world’s largest banks, was disappointing. The U.K.-based company suffered from the rising interest rate environment. Performance also was hampered on a relative basis by not owning index component China Mobile, the leading wireless operator in China. I was concerned about potential regulatory changes that could trigger increased competition for China Mobile. However, amid uncertain timing of potential industry restructuring and a benign current competitive environment, the company’s operational results — and its share price — were strong.
The views expressed in this statement reflect those of the portfolio manager only through the end of the period of the report as stated on the cover and do not necessarily represent the views of Fidelity or any other person in the Fidelity organization. Any such views are subject to change at any time based upon market or other conditions and Fidelity disclaims any responsibility to update such views. These views may not be relied on as investment advice and, because investment decisions for a Fidelity fund are based on numerous factors, may not be relied on as an indication of trading intent on behalf of any Fidelity fund.
Shareholder Expense Example
As a shareholder of the Fund, you incur two types of costs: (1) transaction costs, including sales charges (loads) on purchase payments or redemption proceeds, redemption fees, and (2) ongoing costs, including management fees, distribution and/or service (12b-1) fees and other Fund expenses. This Example is intended to help you understand your ongoing costs (in dollars) of investing in the Fund and to compare these costs with the ongoing costs of investing in other mutual funds.
The Example is based on an investment of $1,000 invested at the beginning of the period and held for the entire period (May 1, 2005 to October 31, 2005).
The first line of the table below for each class of the Fund provides information about actual account values and actual expenses. You may use the information in this line, together with the amount you invested, to estimate the expenses that you paid over the period. Simply divide your account value by $1,000.00 (for example, an $8,600 account value divided by $1,000.00 = 8.6), then multiply the result by the number in the first line for a class of the Fund under the heading entitled “Expenses Paid During Period” to estimate the expenses you paid on your account during this period.
Hypothetical Example for Comparison Purposes
The second line of the table below for each class of the Fund provides information about hypothetical account values and hypothetical expenses based on a Class’ actual expense ratio and an assumed rate of return of 5% per year before expenses, which is not the Class’ actual return. The hypothetical account values and expenses may not be used to estimate the actual ending account balance or expenses you paid for the period. You may use this information to compare the ongoing costs of investing in the Fund and other funds. To do so, compare this 5% hypothetical example with the 5% hypothetical examples that appear in the shareholder reports of the other funds.
Please note that the expenses shown in the table are meant to highlight your ongoing costs only and do not reflect any transaction costs. Therefore, the second line of the table is useful in comparing ongoing costs only, and will not help you determine the relative total costs of owning different funds. In addition, if these transactional costs were included, your costs would have been higher.
| | | | | | | | | | | | | Expenses Paid |
| | | | | Beginning | | | | Ending | | | | During Period* |
| | | | | Account Value | | | | Account Value | | | | May 1, 2005 |
| | | | | May 1, 2005 | | | | October 31, 2005 | | to October 31, 2005 |
| Class A | | | | | | | | | | | | |
| Actual | | $ | | 1,000.00 | | $ | | 1,090.60 | | $ | | 7.90 |
| HypotheticalA | | $ | | 1,000.00 | | $ | | 1,017.64 | | $ | | 7.63 |
| Class T | | | | | | | | | | | | |
| Actual | | $ | | 1,000.00 | | $ | | 1,089.30 | | $ | | 9.22 |
| HypotheticalA | | $ | | 1,000.00 | | $ | | 1,016.38 | | $ | | 8.89 |
| Class B | | | | | | | | | | | | |
| Actual | | $ | | 1,000.00 | | $ | | 1,086.60 | | $ | | 11.83 |
| HypotheticalA | | $ | | 1,000.00 | | $ | | 1,013.86 | | $ | | 11.42 |
| Class C | | | | | | | | | | | | |
| Actual | | $ | | 1,000.00 | | $ | | 1,086.60 | | $ | | 11.83 |
| HypotheticalA | | $ | | 1,000.00 | | $ | | 1,013.86 | | $ | | 11.42 |
| Institutional Class | | | | | | | | | | | | |
| Actual | | $ | | 1,000.00 | | $ | | 1,091.70 | | $ | | 6.59 |
| HypotheticalA | | $ | | 1,000.00 | | $ | | 1,018.90 | | $ | | 6.36 |
| |
| A 5% return per year before expenses | | | | | | | | |
* Expenses are equal to each Class’ annualized expense ratio (shown in the table below); multiplied by the average account value over the period, multiplied by 184/365 (to reflect the one-half year period).
| | | Annualized |
| | | Expense Ratio |
| Class A | | 1.50% |
| Class T | | 1.75% |
| Class B | | 2.25% |
| Class C | | 2.25% |
| Institutional Class | | 1.25% |
9 Annual Report
Investment Changes
| Top Ten Stocks as of October 31, 2005 | | | | |
| | | % of fund’s | | % of fund’s net assets |
| | | net assets | | 6 months ago |
| Samsung Electronics Co. Ltd. | | 6.7 | | 6.2 |
| Hyundai Motor Co. | | 2.8 | | 3.0 |
| Hutchison Whampoa Ltd. | | 2.8 | | 2.4 |
| Taiwan Semiconductor Manufacturing Co. Ltd. | | 2.3 | | 1.6 |
| Kookmin Bank | | 2.2 | | 3.1 |
| CNOOC Ltd. | | 1.7 | | 1.9 |
| Hong Kong & China Gas Co. Ltd. | | 1.4 | | 0.0 |
| State Bank of India | | 1.3 | | 1.3 |
| PetroChina Co. Ltd. (H Shares) | | 1.3 | | 1.3 |
| Parkway Holdings Ltd. | | 1.0 | | 0.4 |
| | | 23.5 | | |
| Top Five Market Sectors as of October 31, 2005 | | |
| | | % of fund’s | | % of fund’s net assets |
| | | net assets | | 6 months ago |
| Information Technology | | 22.1 | | 18.5 |
| Financials | | 18.4 | | 26.4 |
| Industrials | | 15.0 | | 14.2 |
| Consumer Discretionary | | 10.3 | | 11.7 |
| Energy | | 6.7 | | 8.4 |
Annual Report 10
| Investments October 31, 2005 | | | | | | |
| Showing Percentage of Net Assets | | | | | | |
| |
| Common Stocks — 84.7% | | | | | | |
| | | Shares | | Value (Note 1) |
| |
| Australia – 0.1% | | | | | | |
| Healthscope Ltd. | | 12,800 | | $ | | 54,556 |
| Healthscope Ltd. rights 11/8/05 (a) | | 1,600 | | | | 718 |
| TOTAL AUSTRALIA | | | | | | 55,274 |
| |
| Bermuda – 1.1% | | | | | | |
| China Lotsynergy Holding Ltd. (a) | | 1,070,000 | | | | 351,969 |
| Ports Design Ltd. | | 375,000 | | | | 350,711 |
| Skyworth Digital Holdings Ltd. | | 784,000 | | | | 117,315 |
| TOTAL BERMUDA | | | | | | 819,995 |
| |
| Cayman Islands – 1.0% | | | | | | |
| Baidu.com, Inc. ADR (d) | | 5,800 | | | | 402,752 |
| Beauty China Holdings Ltd. | | 248,000 | | | | 73,206 |
| Dynasty Fine Wines Group Ltd. | | 746,000 | | | | 259,826 |
| TOTAL CAYMAN ISLANDS | | | | | | 735,784 |
| |
| China – 7.1% | | | | | | |
| Anhui Conch Cement Co. Ltd. (H Shares) | | 296,000 | | | | 309,284 |
| China Construction Bank Corp. (H Shares) | | 933,000 | | | | 282,833 |
| China International Marine Containers Co. Ltd. (B Shares) | | 580,600 | | | | 483,078 |
| China Petroleum & Chemical Corp. (H Shares) | | 1,800,000 | | | | 724,500 |
| Chitaly Holdings Ltd. | | 332,000 | | | | 174,520 |
| Chongqing Changan Automobile Co. Ltd. (B Shares) | | 700,000 | | | | 204,977 |
| Enric Energy Equipment Holdings Ltd. | | 66,000 | | | | 15,240 |
| PetroChina Co. Ltd. (H Shares) | | 1,228,000 | | | | 942,245 |
| Ping An Insurance (Group) Co. of China, Ltd. (H Shares) | | 82,500 | | | | 133,561 |
| Shanghai Electric (Group) Corp. (H Shares) | | 926,000 | | | | 292,656 |
| Shanghai Zhenhua Port Machinery Co. Ltd. (B Shares) | | 301,150 | | | | 242,125 |
| Shenergy Co. Ltd. warrants (UBS Warrant Programme) | | | | | | |
| 2/16/06 (a) | | 390,056 | | | | 255,711 |
| Sina Corp. (a) | | 23,000 | | | | 583,050 |
| Weichai Power Co. Ltd. (H Shares) | | 124,000 | | | | 236,736 |
| Yantai Changyu Pioneer Wine Co. (B Shares) | | 85,700 | | | | 143,716 |
| ZTE Corp. (H Shares) | | 83,400 | | | | 246,367 |
| TOTAL CHINA | | | | | | 5,270,599 |
| |
| Hong Kong – 12.8% | | | | | | |
| Automated Systems Holdings Ltd. | | 500,000 | | | | 122,547 |
| Burwill Holdings Ltd. | | 3,000,000 | | | | 232,195 |
| Cheung Kong Holdings Ltd. | | 50,000 | | | | 520,182 |
| China Unicom Ltd. | | 600,000 | | | | 460,520 |
| CNOOC Ltd. | | 1,880,500 | | | | 1,235,489 |
| Denway Motors Ltd. | | 900,000 | | | | 269,927 |
See accompanying notes which are an integral part of the financial statements.
11 Annual Report
| Investments - continued | | | | | | |
| |
| |
| Common Stocks – continued | | | | | | |
| | | Shares | | Value (Note 1) |
| |
| Hong Kong – continued | | | | | | |
| Esprit Holdings Ltd. | | 32,500 | | $ | | 229,115 |
| Great Eagle Holdings Ltd. | | 128,000 | | | | 304,640 |
| Hang Seng Bank Ltd. | | 30,000 | | | | 388,927 |
| Hong Kong & China Gas Co. Ltd. | | 500,000 | | | | 1,031,978 |
| Hong Kong & Shanghai Hotels Ltd. | | 174,000 | | | | 173,953 |
| Hopewell Holdings Ltd. | | 99,000 | | | | 241,367 |
| Hutchison Whampoa Ltd. | | 217,000 | | | | 2,054,643 |
| JCG Holdings Ltd. | | 582,000 | | | | 578,089 |
| K Wah Construction Materials Ltd. | | 98,000 | | | | 53,727 |
| Next Media Ltd. (a) | | 604,000 | | | | 239,587 |
| Shanghai Industrial Holdings Ltd. Class H | | 170,000 | | | | 302,628 |
| Sun Hung Kai Properties Ltd. | | 25,000 | | | | 236,388 |
| Wharf Holdings Ltd. | | 153,000 | | | | 522,033 |
| Wing Hang Bank Ltd. | | 50,000 | | | | 341,520 |
| TOTAL HONG KONG | | | | | | 9,539,455 |
| |
| India – 7.5% | | | | | | |
| Alembic Ltd. | | 29,900 | | | | 160,911 |
| Bank of Baroda | | 50,000 | | | | 245,207 |
| Bharti Televentures Ltd. (a) | | 50,000 | | | | 359,308 |
| Cipla Ltd. | | 50,000 | | | | 399,767 |
| Gateway Distriparks Ltd. | | 23,276 | | | | 118,523 |
| Geodesic Information Systems Ltd. | | 60,000 | | | | 290,881 |
| Housing Development Finance Corp. Ltd. | | 22,900 | | | | 491,789 |
| IL&FS Investsmart Ltd. | | 63,876 | | | | 270,272 |
| Indian Rayon & Industries, Inc. | | 20,000 | | | | 261,704 |
| ITC Ltd. | | 141,450 | | | | 377,242 |
| IVRCL Infrastructures & Projects Ltd. | | 13,000 | | | | 186,549 |
| Max India Ltd. (a) | | 22,250 | | | | 291,244 |
| Oil & Natural Gas Corp. Ltd. | | 23,263 | | | | 479,532 |
| Punjab National Bank | | 26,984 | | | | 259,345 |
| Reliance Industries Ltd. | | 20,000 | | | | 338,363 |
| Shree Renuka Sugars Ltd. | | 1,486 | | | | 8,582 |
| State Bank of India | | 45,830 | | | | 950,380 |
| Zen Technologies Ltd. | | 30,000 | | | | 98,147 |
| TOTAL INDIA | | | | | | 5,587,746 |
| |
| Indonesia – 1.1% | | | | | | |
| PT Mitra Adiperkasa Tbk | | 2,913,500 | | | | 287,825 |
| PT Semen Gresik Tbk | | 168,500 | | | | 311,282 |
| PT Telkomunikasi Indonesia Tbk Series B | | 513,500 | | | | 253,643 |
| TOTAL INDONESIA | | | | | | 852,750 |
See accompanying notes which are an integral part of the financial statements.
| Common Stocks – continued | | | | | | |
| | | Shares | | Value (Note 1) |
| |
| Korea (South) – 20.1% | | | | | | |
| Binggrea Co. Ltd. | | 5,980 | | $ | | 248,021 |
| CDNetworks Co. Ltd. | | 22,355 | | | | 374,724 |
| Core Logic, Inc. | | 6,500 | | | | 227,562 |
| Daewoo Shipbuilding & Marine Engineering Co. Ltd. | | 15,510 | | | | 309,011 |
| Doosan Heavy Industries & Construction Co. Ltd. | | 16,000 | | | | 346,360 |
| Hyundai Department Store Co. Ltd. | | 5,000 | | | | 331,896 |
| Hyundai Engineering & Construction Co. Ltd. (a) | | 16,000 | | | | 497,318 |
| Hyundai Mipo Dockyard Co. Ltd. | | 8,680 | | | | 536,264 |
| Keangnam Enterprises (a) | | 20,000 | | | | 191,571 |
| Kia Motors Corp. | | 21,830 | | | | 392,062 |
| Kookmin Bank | | 30,140 | | | | 1,654,235 |
| Korea Investment Holdings Co. Ltd. | | 23,900 | | | | 613,525 |
| LG Electronics, Inc. | | 1,850 | | | | 119,966 |
| LG Household & Health Care Ltd. | | 10,000 | | | | 545,977 |
| NHN Corp. (a) | | 4,000 | | | | 664,751 |
| Orion Corp. | | 3,000 | | | | 581,896 |
| S-Oil Corp. | | 7,070 | | | | 528,895 |
| Samsung Electronics Co. Ltd. | | 9,497 | | | | 5,021,401 |
| SFA Engineering Corp. | | 8,000 | | | | 190,805 |
| Shinhan Financial Group Co. Ltd. | | 16,960 | | | | 565,333 |
| Shinsegae Co. Ltd. | | 1,720 | | | | 616,168 |
| YBM Sisa.com, Inc. | | 20,000 | | | | 375,479 |
| TOTAL KOREA (SOUTH) | | | | | | 14,933,220 |
| |
| Malaysia – 4.3% | | | | | | |
| AMMB Holdings BHD | | 1,000,000 | | | | 630,464 |
| Commerce Asset Holding BHD | | 500,000 | | | | 728,477 |
| IOI Corp. BHD | | 200,000 | | | | 694,040 |
| Malakoff BHD | | 150,000 | | | | 311,921 |
| Malayan Banking BHD | | 94,700 | | | | 290,999 |
| Malaysian International Shipping Corp. BHD (For. Reg.) | | 139,000 | | | | 349,801 |
| Public Bank BHD (For. Reg.) | | 46,225 | | | | 80,817 |
| Tenaga Nasional BHD | | 55,200 | | | | 146,225 |
| TOTAL MALAYSIA | | | | | | 3,232,744 |
| |
| Philippines – 1.5% | | | | | | |
| Banco de Oro Universal Bank | | 300,000 | | | | 169,337 |
| Manila Water Co., Inc. | | 2,500,000 | | | | 291,333 |
| Philippine Long Distance Telephone Co. | | 5,580 | | | | 170,184 |
| San Miguel Corp. Class B | | 314,000 | | | | 514,567 |
| TOTAL PHILIPPINES | | | | | | 1,145,421 |
See accompanying notes which are an integral part of the financial statements.
13 Annual Report
| Investments - continued | | | | | | |
| |
| |
| Common Stocks – continued | | | | | | |
| | | Shares | | Value (Note 1) |
| |
| Singapore – 6.7% | | | | | | |
| CapitaLand Ltd. | | 72,000 | | $ | | 135,171 |
| Chartered Semiconductor Manufacturing Ltd. (a) | | 321,000 | | | | 198,985 |
| DBS Group Holdings Ltd. | | 52,000 | | | | 469,699 |
| GES International Ltd. | | 479,000 | | | | 262,993 |
| HTL International Holdings Ltd. | | 259,000 | | | | 192,662 |
| Keppel Corp. Ltd. | | 55,000 | | | | 376,657 |
| Oversea-Chinese Banking Corp. Ltd. | | 40,000 | | | | 148,774 |
| Parkway Holdings Ltd. | | 653,000 | | | | 763,314 |
| Petra Foods Ltd. | | 323,000 | | | | 198,317 |
| Sembcorp Marine Ltd. | | 400,000 | | | | 647,047 |
| Shanghai Asia Holdings Ltd. | | 1,282,000 | | | | 121,097 |
| SIA Engineering Co. Ltd. | | 261,000 | | | | 383,676 |
| Singapore Post Ltd. | | 900,000 | | | | 605,721 |
| STATS ChipPAC Ltd. (a) | | 475,000 | | | | 260,796 |
| United Overseas Bank Ltd. | | 28,000 | | | | 228,119 |
| United Overseas Land Ltd. | | 2,800 | | | | 3,868 |
| TOTAL SINGAPORE | | | | | | 4,996,896 |
| |
| Taiwan – 15.1% | | | | | | |
| Acer, Inc. | | 362,520 | | | | 733,651 |
| Advanced Semiconductor Engineering, Inc. | | 30,000 | | | | 18,285 |
| Advantech Co. Ltd. | | 98,312 | | | | 216,247 |
| Ambassador Hotel | | 700,000 | | | | 486,118 |
| Cathay Financial Holding Co. Ltd. | | 219,000 | | | | 385,109 |
| Chinatrust Financial Holding Co. Ltd. | | 227,285 | | | | 176,468 |
| Chipbond Technology Corp. | | 157,972 | | | | 204,813 |
| Chunghwa Telecom Co. Ltd. | | 220,000 | | | | 372,442 |
| Chunghwa Telecom Co. Ltd. sponsored ADR | | 20,000 | | | | 346,400 |
| Delta Electronics, Inc. | | 300,000 | | | | 505,194 |
| EVA Airways Corp. | | 1,138,000 | | | | 440,934 |
| Formosa International Hotel Corp. | | 166,000 | | | | 259,750 |
| High Tech Computer Corp. | | 60,000 | | | | 636,633 |
| Inventec Appliances Corp. | | 5,000 | | | | 19,522 |
| Kinik Co. | | 92,000 | | | | 182,072 |
| MediaTek, Inc. | | 64,000 | | | | 552,226 |
| Motech Industries, Inc. | | 25,965 | | | | 283,242 |
| Novatek Microelectronics Corp. | | 79,449 | | | | 346,908 |
| Pihsiang Machinery Manufacturing Co. | | 163,620 | | | | 237,494 |
| Powerchip Semiconductor Corp. | | 575,931 | | | | 272,933 |
| Sino-American Silicon Prds, Inc. | | 289,144 | | | | 339,546 |
| Springsoft, Inc. | | 144,179 | | | | 212,284 |
| Sunplus Technology Co. Ltd. | | 178,439 | | | | 155,562 |
See accompanying notes which are an integral part of the financial statements.
| Common Stocks – continued | | | | | | |
| | | Shares | | Value (Note 1) |
| |
| Taiwan – continued | | | | | | |
| Taiwan Cement Corp. | | 735,000 | | $ | | 451,276 |
| Taiwan Secom Co. | | 400,000 | | | | 540,661 |
| Taiwan Semiconductor Manufacturing Co. Ltd. | | 877,797 | | | | 1,360,459 |
| Taiwan Semiconductor Manufacturing Co. Ltd. sponsored ADR | | 46,619 | | | | 376,682 |
| United Microelectronics Corp. | | 376,093 | | | | 199,528 |
| United Microelectronics Corp. sponsored ADR (d) | | 87,754 | | | | 256,242 |
| Yageo Corp. (a) | | 908,000 | | | | 276,041 |
| Yuanta Core Pacific Securities Co. Ltd. | | 692,294 | | | | 371,408 |
| TOTAL TAIWAN | | | | | | 11,216,130 |
| |
| Thailand – 4.6% | | | | | | |
| Advanced Info Service PCL (For. Reg.) | | 91,400 | | | | 224,129 |
| Asia Credit PCL (For. Reg.) (a) | | 901,100 | | | | 127,056 |
| Bangkok Bank Ltd. PCL (For. Reg.) | | 109,400 | | | | 276,317 |
| Bumrungrad Hospital PCL (For. Reg.) | | 680,500 | | | | 446,380 |
| Central Pattana PCL (For. Reg.) | | 176,000 | | | | 51,790 |
| Home Product Center PCL (For. Reg.) | | 1,491,100 | | | | 255,951 |
| Krung Thai Bank Public Co. Ltd. | | 526,100 | | | | 129,009 |
| Land & House PCL unit | | 2,239,200 | | | | 436,529 |
| Minor International PCL (For. Reg.) | | 1,806,740 | | | | 248,106 |
| PTT Exploration & Production PCL (For. Reg.) | | 47,100 | | | | 485,091 |
| Shin Corp. PCL (For. Reg.) | | 129,900 | | | | 121,045 |
| Sino Thai Engineering & Construction PCL: | | | | | | |
| (For. Reg.) | | 853,000 | | | | 244,730 |
| (For. Reg.) warrants 3/17/08 (a) | | 142,167 | | | | 17,222 |
| Thai Oil PCL (For. Reg.) | | 141,800 | | | | 245,142 |
| True Corp. PCL (a) | | 700,000 | | | | 127,023 |
| True Corp. PCL (For. Reg.) rights 4/30/08 (a) | | 190,863 | | | | 0 |
| TOTAL THAILAND | | | | | | 3,435,520 |
| |
| United Kingdom – 1.7% | | | | | | |
| Astro All Asia Networks PLC | | 350,000 | | | | 509,934 |
| HSBC Holdings PLC (Hong Kong) (Reg.) | | 46,176 | | | | 727,364 |
| TOTAL UNITED KINGDOM | | | | | | 1,237,298 |
| |
| TOTAL COMMON STOCKS | | | | | | |
| (Cost $56,753,129) | | | | 63,058,832 |
See accompanying notes which are an integral part of the financial statements.
15 Annual Report
| Investments - continued | | | | |
| |
| Nonconvertible Preferred Stocks — 3.6% | | | | |
| | | Shares | | Value (Note 1) |
| Korea (South) – 3.6% | | | | |
| Hyundai Motor Co. | | 41,490 | | $ 2,102,318 |
| Samsung Electronics Co. Ltd. | | 1,400 | | 569,923 |
| TOTAL NONCONVERTIBLE PREFERRED STOCKS | | | | |
| (Cost $1,463,199) | | | | 2,672,241 |
| Money Market Funds — 13.9% | | | | |
| Fidelity Cash Central Fund, 3.92% (b) | | 9,857,595 | | 9,857,595 |
| Fidelity Securities Lending Cash Central Fund, | | | | |
| 3.94% (b)(c) | | 501,050 | | 501,050 |
| TOTAL MONEY MARKET FUNDS | | | | |
| (Cost $10,358,645) | | | | 10,358,645 |
| TOTAL INVESTMENT PORTFOLIO – 102.2% | | | | |
| (Cost $68,574,973) | | | | 76,089,718 |
| |
| NET OTHER ASSETS – (2.2)% | | | | (1,647,025) |
| NET ASSETS – 100% | | $ | | 74,442,693 |
(a) Non-income producing
(b) Affiliated fund that is available only to investment companies and other accounts managed by Fidelity Investments. The rate quoted is the annualized seven-day yield of the fund at period end. A complete unaudited listing of the fund’s holdings as of its most recent quarter end is available upon request.
(c) Investment made with cash collateral received from securities on loan.
(d) Security or a portion of the security is on loan at period end.
See accompanying notes which are an integral part of the financial statements.
| Financial Statements | | | | | | | | |
| |
| |
| Statement of Assets and Liabilities | | | | | | | | |
| | | | | | | | | October 31, 2005 |
| |
| Assets | | | | | | | | |
| Investment in securities, at value (including securities | | | | | | | | |
| loaned of $496,476) (cost $68,574,973) — See | | | | | | | | |
| accompanying schedule | | | | | | $ | | 76,089,718 |
| Cash | | | | | | | | 1,680 |
| Foreign currency held at value (cost $541,662) | | | | | | | | 541,784 |
| Receivable for investments sold | | | | | | | | 1,196,871 |
| Receivable for fund shares sold | | | | | | | | 160,959 |
| Dividends receivable | | | | | | | | 11,876 |
| Interest receivable | | | | | | | | 23,825 |
| Receivable from investment adviser for expense | | | | | | | | |
| reductions | | | | | | | | 16,382 |
| Other affiliated receivables | | | | | | | | 71 |
| Other receivables | | | | | | | | 276,656 |
| Total assets | | | | | | | | 78,319,822 |
| |
| Liabilities | | | | | | | | |
| Payable for investments purchased | | $ | | 2,962,080 | | | | |
| Payable for fund shares redeemed | | | | 199,605 | | | | |
| Accrued management fee | | | | 44,111 | | | | |
| Distribution fees payable | | | | 33,404 | | | | |
| Other affiliated payables | | | | 23,963 | | | | |
| Other payables and accrued expenses | | | | 112,916 | | | | |
| Collateral on securities loaned, at value | | | | 501,050 | | | | |
| Total liabilities | | | | | | | | 3,877,129 |
| |
| Net Assets | | | | | | $ | | 74,442,693 |
| Net Assets consist of: | | | | | | | | |
| Paid in capital | | | | | | $ | | 60,448,315 |
| Undistributed net investment income | | | | | | | | 458,779 |
| Accumulated undistributed net realized gain (loss) on | | | | | | | | |
| investments and foreign currency transactions | | | | | | | | 6,021,199 |
| Net unrealized appreciation (depreciation) on | | | | | | | | |
| investments and assets and liabilities in foreign | | | | | | | | |
| currencies | | | | | | | | 7,514,400 |
| Net Assets | | | | | | $ | | 74,442,693 |
See accompanying notes which are an integral part of the financial statements.
17 Annual Report
| Financial Statements - continued | | | | |
| |
| |
| Statement of Assets and Liabilities — continued | | | | |
| | | October 31, 2005 |
| Calculation of Maximum Offering Price | | | | |
| Class A: | | | | |
| Net Asset Value and redemption price per share | | | | |
| ($30,781,763 ÷ 1,738,792 shares) | | $ | | 17.70 |
| Maximum offering price per share (100/94.25 of | | | | |
| $17.70) | | $ | | 18.78 |
| Class T: | | | | |
| Net Asset Value and redemption price per share | | | | |
| ($14,074,363 ÷ 806,398 shares) | | $ | | 17.45 |
| Maximum offering price per share (100/96.50 of | | | | |
| $17.45) | | $ | | 18.08 |
| Class B: | | | | |
| Net Asset Value and offering price per share | | | | |
| ($11,504,464 ÷ 679,133 shares)A | | $ | | 16.94 |
| Class C: | | | | |
| Net Asset Value and offering price per share | | | | |
| ($13,291,127 ÷ 784,401 shares)A | | $ | | 16.94 |
| |
| Institutional Class: | | | | |
| Net Asset Value, offering price and redemption | | | | |
| price per share ($4,790,976 ÷ 266,626 | | | | |
| shares) | | $ | | 17.97 |
| A Redemption price per share is equal to net asset value less any applicable contingent deferred sales charge. | | | | |
See accompanying notes which are an integral part of the financial statements.
Annual Report 18
| Statement of Operations | | | | | | |
| | | | | Year ended October 31, 2005 |
| |
| Investment Income | | | | | | |
| Dividends | | | | $ | | 1,640,625 |
| Interest | | | | | | 86,355 |
| Security lending | | | | | | 5,791 |
| | | | | | | 1,732,771 |
| Less foreign taxes withheld | | | | | | (222,708) |
| Total income | | | | | | 1,510,063 |
| |
| Expenses | | | | | | |
| Management fee | | $ | | 413,094 | | |
| Transfer agent fees | | | | 208,468 | | |
| Distribution fees | | | | 309,494 | | |
| Accounting and security lending fees | | | | 32,925 | | |
| Independent trustees’ compensation | | | | 254 | | |
| Custodian fees and expenses | | | | 155,396 | | |
| Registration fees | | | | 45,380 | | |
| Audit | | | | 105,867 | | |
| Legal | | | | 7,279 | | |
| Miscellaneous | | | | 1,441 | | |
| Total expenses before reductions | | | | 1,279,598 | | |
| Expense reductions | | | | (228,315) | | 1,051,283 |
| |
| Net investment income (loss) | | | | | | 458,780 |
| Realized and Unrealized Gain (Loss) | | | | | | |
| Net realized gain (loss) on: | | | | | | |
| Investment securities | | | | 6,324,773 | | |
| Foreign currency transactions | | | | (48,752) | | |
| Total net realized gain (loss) | | | | | | 6,276,021 |
| Change in net unrealized appreciation (depreciation) on: | | | | |
| Investment securities | | | | 4,767,642 | | |
| Assets and liabilities in foreign currencies | | | | (18,829) | | |
| Total change in net unrealized appreciation | | | | | | |
| (depreciation) | | | | | | 4,748,813 |
| Net gain (loss) | | | | | | 11,024,834 |
| Net increase (decrease) in net assets resulting from | | | | | | |
| operations | | | | $ | | 11,483,614 |
See accompanying notes which are an integral part of the financial statements.
19 Annual Report
| Financial Statements - continued | | | | | | | | |
| |
| |
| Statement of Changes in Net Assets | | | | | | | | |
| | | | | Year ended | | | | Year ended |
| | | | | October 31, | | | | October 31, |
| | | | | 2005 | | | | 2004 |
| Increase (Decrease) in Net Assets | | | | | | | | |
| Operations | | | | | | | | |
| Net investment income (loss) | | $ | | 458,780 | | $ | | (21,099) |
| Net realized gain (loss) | | | | 6,276,021 | | | | 5,045,008 |
| Change in net unrealized appreciation (depreciation) . | | 4,748,813 | | | | (2,706,763) |
| Net increase (decrease) in net assets resulting | | | | | | | | |
| from operations | | | | 11,483,614 | | | | 2,317,146 |
| Distributions to shareholders from net investment income | | . | | — | | | | (387,542) |
| Distributions to shareholders from net realized gain | | | | (154,881) | | | | — |
| Total distributions | | | | (154,881) | | | | (387,542) |
| Share transactions -- net increase (decrease) | | | | 20,346,589 | | | | 389,641 |
| Redemption fees | | | | 10,434 | | | | 18,627 |
| Total increase (decrease) in net assets | | | | 31,685,756 | | | | 2,337,872 |
| |
| Net Assets | | | | | | | | |
| Beginning of period | | | | 42,756,937 | | | | 40,419,065 |
| End of period (including undistributed net investment | | | | | | | | |
| income of $458,779 and accumulated net invest- | | | | | | | | |
| ment loss of $1,228, respectively) | | $ | | 74,442,693 | | $ | | 42,756,937 |
See accompanying notes which are an integral part of the financial statements.
| Financial Highlights — Class A | | | | | | | | | | |
| |
| Years ended October 31, | | 2005 | | 2004 | | 2003 | | | | 2002 | | 2001 |
| Selected Per-Share Data | | | | | | | | | | | | |
| Net asset value, beginning of | | | | | | | | | | | | |
| period | | $ 13.96 | | $ 13.07 | | $ 9.89 | | $ | | 9.15 | | $ 12.29 |
| Income from Investment | | | | | | | | | | | | |
| Operations | | | | | | | | | | | | |
| Net investment income (loss)C | | 18 | | .03 | | .07 | | | | (.02) | | (.03) |
| Net realized and unrealized | | | | | | | | | | | | |
| gain (loss) | | 3.61 | | 1.00F | | 3.11 | | | | .76 | | (3.11) |
| Total from investment operations | | 3.79 | | 1.03 | | 3.18 | | | | .74 | | (3.14) |
| Distributions from net investment | | | | | | | | | | | | |
| income | | — | | (.15) | | — | | | | — | | — |
| Distributions from net realized | | | | | | | | | | | | |
| gain | | (.05) | | — | | — | | | | — | | — |
| Total distributions | | (.05) | | (.15) | | — | | | | — | | — |
| Redemption fees added to paid in | | | | | | | | | | | | |
| capitalC | | —E | | .01 | | — | | | | — | | — |
| Net asset value, end of period | | $ 17.70 | | $ 13.96 | | $ 13.07 | | $ | | 9.89 | | $ 9.15 |
| Total ReturnA,B | | 27.23% | | 8.01%F | | 32.15% | | | | 8.09% | | (25.55)% |
| Ratios to Average Net AssetsD | | | | | | | | | | | | |
| Expenses before expense | | | | | | | | | | | | |
| reductions | | 1.90% | | 2.24% | | 2.81% | | | | 2.56% | | 2.56% |
| Expenses net of voluntary waiv- | | | | | | | | | | | | |
| ers, if any | | 1.61% | | 2.00% | | 2.02% | | | | 2.00% | | 2.00% |
| Expenses net of all reductions | | 1.55% | | 1.99% | | 2.02% | | | | 1.98% | | 1.97% |
| Net investment income (loss) | | 1.08% | | .21% | | .70% | | | | (.17)% | | (.26)% |
| Supplemental Data | | | | | | | | | | | | |
| Net assets, end of period (000 | | | | | | | | | | | | |
| omitted) | | $30,782 | | $21,099 | | $24,161 | | $18,314 | | $18,151 |
| Portfolio turnover rate | | 66% | | 232% | | 172% | | | | 121% | | 62% |
A Total returns would have been lower had certain expenses not been reduced during the periods shown.
B Total returns do not include the effect of the sales charges.
C Calculated based on average shares outstanding during the period.
D Expense ratios reflect operating expenses of the class. Expenses before reductions do not reflect amounts reimbursed by the investment adviser or reductions from brokerage service arrangements or other expense offset arrangements and do not represent the amount paid by the class during periods when reimbursements or reductions occur. Expenses net of any voluntary waivers reflect expenses after reimbursement by the investment adviser but prior to reductions from brokerage service arrangements or other expense offset arrangements. Expenses net of all reductions repre sent the net expenses paid by the class.
E Amount represents less than $.01 per share.
F In 2004 the fund received a favorable ruling in India which entitles the fund to a refund of capital gains taxes paid in the current and prior years. The impact to the fund was an increase in realized and unrealized gain (loss) per share of $.51. Excluding this benefit, the total return would have been 4.18% . The realized and unrealized gains were allocated on a pro rata basis to each class based on the relative net assets of each class to the total net assets of the fund.
See accompanying notes which are an integral part of the financial statements.
21 Annual Report
| Financial Highlights — Class T | | | | | | | | | | | | |
| |
| Years ended October 31, | | 2005 | | 2004 | | | | 2003 | | | | 2002 | | 2001 |
| Selected Per-Share Data | | | | | | | | | | | | | | |
| Net asset value, beginning of | | | | | | | | | | | | | | |
| period | | $ 13.80 | | $ 12.92 | | $ | | 9.81 | | $ | | 9.09 | | $ 12.25 |
| Income from Investment | | | | | | | | | | | | | | |
| Operations | | | | | | | | | | | | | | |
| Net investment income (loss)C | | 14 | | —E | | | | .05 | | | | (.05) | | (.06) |
| Net realized and unrealized | | | | | | | | | | | | | | |
| gain (loss) | | 3.56 | | .99F | | | | 3.06 | | | | .77 | | (3.10) |
| Total from investment operations | | 3.70 | | .99 | | | | 3.11 | | | | .72 | | (3.16) |
| Distributions from net investment | | | | | | | | | | | | | | |
| income | | — | | (.12) | | | | — | | | | — | | — |
| Distributions from net realized | | | | | | | | | | | | | | |
| gain | | (.05) | | — | | | | — | | | | — | | — |
| Total distributions | | (.05) | | (.12) | | | | — | | | | — | | — |
| Redemption fees added to paid in | | | | | | | | | | | | | | |
| capitalC | | —E | | .01 | | | | — | | | | — | | — |
| Net asset value, end of period | | $ 17.45 | | $ 13.80 | | $ | | 12.92 | | $ | | 9.81 | | $ 9.09 |
| Total ReturnA,B | | 26.89% | | 7.78%F | | | | 31.70% | | | | 7.92% | | (25.80)% |
| Ratios to Average Net AssetsD | | | | | | | | | | | | | | |
| Expenses before expense | | | | | | | | | | | | | | |
| reductions | | 2.27% | | 2.76% | | | | 3.43% | | | | 3.16% | | 3.41% |
| Expenses net of voluntary waiv- | | | | | | | | | | | | | | |
| ers, if any | | 1.84% | | 2.25% | | | | 2.27% | | | | 2.25% | | 2.25% |
| Expenses net of all reductions | | 1.79% | | 2.24% | | | | 2.26% | | | | 2.23% | | 2.22% |
| Net investment income (loss) | | 85% | | (.04)% | | | | .45% | | | | (.42)% | | (.51)% |
| Supplemental Data | | | | | | | | | | | | | | |
| Net assets, end of period (000 | | | | | | | | | | | | | | |
| omitted) | | $14,074 | | $ 7,658 | | $ | | 4,982 | | $ 4,347 | | $ 2,842 |
| Portfolio turnover rate | | 66% | | 232% | | | | 172% | | | | 121% | | 62% |
A Total returns would have been lower had certain expenses not been reduced during the periods shown.
B Total returns do not include the effect of the sales charges.
C Calculated based on average shares outstanding during the period.
D Expense ratios reflect operating expenses of the class. Expenses before reductions do not reflect amounts reimbursed by the investment adviser or reductions from brokerage service arrangements or other expense offset arrangements and do not represent the amount paid by the class during periods when reimbursements or reductions occur. Expenses net of any voluntary waivers reflect expenses after reimbursement by the investment adviser but prior to reductions from brokerage service arrangements or other expense offset arrangements. Expenses net of all reductions repre sent the net expenses paid by the class.
E Amount represents less than $.01 per share.
F In 2004 the fund received a favorable ruling in India which entitles the fund to a refund of capital gains taxes paid in the current and prior years. The impact to the fund was an increase in realized and unrealized gain (loss) per share of $.50. Excluding this benefit, the total return would have been 3.95% . The realized and unrealized gains were allocated on a pro rata basis to each class based on the relative net assets of each class to the total net assets of the fund.
See accompanying notes which are an integral part of the financial statements.
| Financial Highlights — Class B | | | | | | | | | | | | |
| |
| Years ended October 31, | | 2005 | | 2004 | | | | 2003 | | | | 2002 | | 2001 |
| Selected Per-Share Data | | | | | | | | | | | | | | |
| Net asset value, beginning of | | | | | | | | | | | | | | |
| period | | $ 13.46 | | $ 12.64 | | $ | | 9.63 | | $ | | 8.97 | | $ 12.15 |
| Income from Investment | | | | | | | | | | | | | | |
| Operations | | | | | | | | | | | | | | |
| Net investment income (loss)C | | 06 | | (.07) | | | | (.01) | | | | (.10) | | (.11) |
| Net realized and unrealized | | | | | | | | | | | | | | |
| gain (loss) | | 3.47 | | .96F | | | | 3.02 | | | | .76 | | (3.07) |
| Total from investment operations | | 3.53 | | .89 | | | | 3.01 | | | | .66 | | (3.18) |
| Distributions from net investment | | | | | | | | | | | | | | |
| income | | — | | (.08) | | | | — | | | | — | | — |
| Distributions from net realized | | | | | | | | | | | | | | |
| gain | | (.05) | | — | | | | — | | | | — | | — |
| Total distributions | | (.05) | | (.08) | | | | — | | | | — | | — |
| Redemption fees added to paid in | | | | | | | | | | | | | | |
| capitalC | | —E | | .01 | | | | — | | | | — | | — |
| Net asset value, end of period | | $ 16.94 | | $ 13.46 | | $ | | 12.64 | | $ | | 9.63 | | $ 8.97 |
| Total ReturnA,B | | 26.31% | | 7.14%F | | | | 31.26% | | | | 7.36% | | (26.17)% |
| Ratios to Average Net AssetsD | | | | | | | | | | | | | | |
| Expenses before expense | | | | | | | | | | | | | | |
| reductions | | 2.75% | | 3.19% | | | | 3.87% | | | | 3.63% | | 3.66% |
| Expenses net of voluntary waiv- | | | | | | | | | | | | | | |
| ers, if any | | 2.35% | | 2.75% | | | | 2.77% | | | | 2.75% | | 2.75% |
| Expenses net of all reductions | | 2.29% | | 2.74% | | | | 2.77% | | | | 2.73% | | 2.72% |
| Net investment income (loss) | | 34% | | (.54)% | | | | (.05)% | | | | (.92)% | | (1.01)% |
| Supplemental Data | | | | | | | | | | | | | | |
| Net assets, end of period (000 | | | | | | | | | | | | | | |
| omitted) | | $11,504 | | $ 7,065 | | $ | | 5,157 | | $ 2,787 | | $ 2,466 |
| Portfolio turnover rate | | 66% | | 232% | | | | 172% | | | | 121% | | 62% |
A Total returns would have been lower had certain expenses not been reduced during the periods shown.
B Total returns do not include the effect of the contingent deferred sales charge.
C Calculated based on average shares outstanding during the period.
D Expense ratios reflect operating expenses of the class. Expenses before reductions do not reflect amounts reimbursed by the investment adviser or reductions from brokerage service arrangements or other expense offset arrangements and do not represent the amount paid by the class during periods when reimbursements or reductions occur. Expenses net of any voluntary waivers reflect expenses after reimbursement by the investment adviser but prior to reductions from brokerage service arrangements or other expense offset arrangements. Expenses net of all reductions repre sent the net expenses paid by the class.
E Amount represents less than $.01 per share.
F In 2004 the fund received a favorable ruling in India which entitles the fund to a refund of capital gains taxes paid in the current and prior years. The impact to the fund was an increase in realized and unrealized gain (loss) per share of $.49. Excluding this benefit, the total return would have been 3.31% . The realized and unrealized gains were allocated on a pro rata basis to each class based on the relative net assets of each class to the total net assets of the fund.
See accompanying notes which are an integral part of the financial statements.
23 Annual Report
| Financial Highlights — Class C | | | | | | | | | | | | |
| |
| Years ended October 31, | | 2005 | | 2004 | | | | 2003 | | | | 2002 | | 2001 |
| Selected Per-Share Data | | | | | | | | | | | | | | |
| Net asset value, beginning of | | | | | | | | | | | | | | |
| period | | $ 13.46 | | $ 12.65 | | $ | | 9.64 | | $ | | 8.98 | | $ 12.16 |
| Income from Investment | | | | | | | | | | | | | | |
| Operations | | | | | | | | | | | | | | |
| Net investment income (loss)C | | 06 | | (.07) | | | | (.01) | | | | (.10) | | (.11) |
| Net realized and unrealized | | | | | | | | | | | | | | |
| gain (loss) | | 3.47 | | .96F | | | | 3.02 | | | | .76 | | (3.07) |
| Total from investment operations | | 3.53 | | .89 | | | | 3.01 | | | | .66 | | (3.18) |
| Distributions from net investment | | | | | | | | | | | | | | |
| income | | — | | (.09) | | | | — | | | | — | | — |
| Distributions from net realized | | | | | | | | | | | | | | |
| gain | | (.05) | | — | | | | — | | | | — | | — |
| Total distributions | | (.05) | | (.09) | | | | — | | | | — | | — |
| Redemption fees added to paid in | | | | | | | | | | | | | | |
| capitalC | | —E | | .01 | | | | — | | | | — | | — |
| Net asset value, end of period | | $ 16.94 | | $ 13.46 | | $ | | 12.65 | | $ | | 9.64 | | $ 8.98 |
| Total ReturnA,B | | 26.31% | | 7.14%F | | | | 31.22% | | | | 7.35% | | (26.15)% |
| Ratios to Average Net AssetsD | | | | | | | | | | | | | | |
| Expenses before expense | | | | | | | | | | | | | | |
| reductions | | 2.67% | | 3.02% | | | | 3.70% | | | | 3.53% | | 3.52% |
| Expenses net of voluntary waiv- | | | | | | | | | | | | | | |
| ers, if any | | 2.34% | | 2.75% | | | | 2.77% | | | | 2.75% | | 2.75% |
| Expenses net of all reductions | | 2.28% | | 2.74% | | | | 2.76% | | | | 2.73% | | 2.72% |
| Net investment income (loss) | | 35% | | (.54)% | | | | (.05)% | | | | (.92)% | | (1.01)% |
| Supplemental Data | | | | | | | | | | | | | | |
| Net assets, end of period (000 | | | | | | | | | | | | | | |
| omitted) | | $13,291 | | $ 6,484 | | $ | | 4,581 | | $ 2,220 | | $ 1,263 |
| Portfolio turnover rate | | 66% | | 232% | | | | 172% | | | | 121% | | 62% |
A Total returns would have been lower had certain expenses not been reduced during the periods shown.
B Total returns do not include the effect of the contingent deferred sales charge.
C Calculated based on average shares outstanding during the period.
D Expense ratios reflect operating expenses of the class. Expenses before reductions do not reflect amounts reimbursed by the investment adviser or reductions from brokerage service arrangements or other expense offset arrangements and do not represent the amount paid by the class during periods when reimbursements or reductions occur. Expenses net of any voluntary waivers reflect expenses after reimbursement by the investment adviser but prior to reductions from brokerage service arrangements or other expense offset arrangements. Expenses net of all reductions repre sent the net expenses paid by the class.
E Amount represents less than $.01 per share.
F In 2004 the fund received a favorable ruling in India which entitles the fund to a refund of capital gains taxes paid in the current and prior years. The impact to the fund was an increase in realized and unrealized gain (loss) per share of $.49. Excluding this benefit, the total return would have been 3.31% . The realized and unrealized gains were allocated on a pro rata basis to each class based on the relative net assets of each class to the total net assets of the fund.
See accompanying notes which are an integral part of the financial statements.
| Financial Highlights — Institutional Class | | | | | | | | | | | | |
| |
| Years ended October 31, | | 2005 | | 2004 | | | | 2003 | | | | 2002 | | | | 2001 |
| Selected Per-Share Data | | | | | | | | | | | | | | | | |
| Net asset value, beginning of | | | | | | | | | | | | | | | | |
| period | | $ 14.13 | | $ 13.20 | | $ | | 9.97 | | $ | | 9.21 | | $ 12.34 |
| Income from Investment | | | | | | | | | | | | | | | | |
| Operations | | | | | | | | | | | | | | | | |
| Net investment income (loss)B | | 24 | | .06 | | | | .10 | | | | .01 | | | | —D |
| Net realized and unrealized | | | | | | | | | | | | | | | | |
| gain (loss) | | 3.65 | | 1.01E | | | | 3.13 | | | | .75 | | | | (3.13) |
| Total from investment operations | | 3.89 | | 1.07 | | | | 3.23 | | | | .76 | | | | (3.13) |
| Distributions from net investment | | | | | | | | | | | | | | | | |
| income | | — | | (.15) | | | | — | | | | — | | | | — |
| Distributions from net realized | | | | | | | | | | | | | | | | |
| gain | | (.05) | | — | | | | — | | | | — | | | | — |
| Total distributions | | (.05) | | (.15) | | | | — | | | | — | | | | — |
| Redemption fees added to paid in | | | | | | | | | | | | | | | | |
| capitalB | | —D | | .01 | | | | — | | | | — | | | | — |
| Net asset value, end of period | | $ 17.97 | | $ 14.13 | | $ | | 13.20 | | $ | | 9.97 | | $ | | 9.21 |
| Total ReturnA | | 27.61% | | 8.24%E | | | | 32.40% | | | | 8.25% | | | | (25.36)% |
| Ratios to Average Net AssetsC | | | | | | | | | | | | | | | | |
| Expenses before expense | | | | | | | | | | | | | | | | |
| reductions | | 1.52% | | 2.11% | | | | 2.55% | | | | 2.18% | | | | 2.20% |
| Expenses net of voluntary waiv- | | | | | | | | | | | | | | | | |
| ers, if any | | 1.29% | | 1.75% | | | | 1.77% | | | | 1.75% | | | | 1.75% |
| Expenses net of all reductions | | 1.24% | | 1.74% | | | | 1.77% | | | | 1.73% | | | | 1.72% |
| Net investment income (loss) | | 1.40% | | .46% | | | | .94% | | | | .08% | | | | (.01)% |
| Supplemental Data | | | | | | | | | | | | | | | | |
| Net assets, end of period (000 | | | | | | | | | | | | | | | | |
| omitted) | | $ 4,791 | | $ 452 | | $ | | 1,538 | | $ | | 674 | | $ | | 658 |
| Portfolio turnover rate | | 66% | | 232% | | | | 172% | | | | 121% | | | | 62% |
A Total returns would have been lower had certain expenses not been reduced during the periods shown.
B Calculated based on average shares outstanding during the period.
C Expense ratios reflect operating expenses of the class. Expenses before reductions do not reflect amounts reimbursed by the investment adviser or reductions from brokerage service arrangements or other expense offset arrangements and do not represent the amount paid by the class during periods when reimbursements or reductions occur. Expenses net of any voluntary waivers reflect expenses after reimbursement by the investment adviser but prior to reductions from brokerage service arrangements or other expense offset arrangements. Expenses net of all reductions repre sent the net expenses paid by the class.
D Amount represents less than $.01 per share.
E In 2004 the fund received a favorable ruling in India which entitles the fund to a refund of capital gains taxes paid in the current and prior years. The impact to the fund was an increase in realized and unrealized gain (loss) per share of $.51. Excluding this benefit, the total return would have been 4.41% . The realized and unrealized gains were allocated on a pro rata basis to each class based on the relative net assets of each class to the total net assets of the fund.
See accompanying notes which are an integral part of the financial statements.
25 Annual Report
Notes to Financial Statements
For the period ended October 31, 2005
|
1. Significant Accounting Policies.
Fidelity Advisor Emerging Asia Fund (the fund) is a fund of Fidelity Advisor Series VIII (the trust) and is authorized to issue an unlimited number of shares. The trust is registered under the Investment Company Act of 1940, as amended (the 1940 Act), as an open-end management investment company organized as a Massachusetts business trust.
The fund offers Class A, Class T, Class B, Class C, and Institutional Class shares, each of which has equal rights as to assets and voting privileges. Each class has exclusive voting rights with respect to matters that affect that class. Class B shares will automatically convert to Class A shares after a holding period of seven years from the initial date of purchase. Investment income, realized and unrealized capital gains and losses, the common expenses of the fund, and certain fund-level expense reductions, if any, are allocated on a pro rata basis to each class based on the relative net assets of each class to the total net assets of the fund. Each class differs with respect to transfer agent and distribution and service plan fees incurred. Certain expense reductions also differ by class.
The fund’s investments in emerging markets can be subject to social, economic, regulatory, and political uncertainties and can be extremely volatile.
The fund may invest in affiliated money market central funds (Money Market Central Funds), collectively referred to as Central Funds, which are open-end investment companies available to investment companies and other accounts managed by Fidelity Management & Research Company (FMR) and its affiliates. The financial statements have been prepared in conformity with accounting principles generally accepted in the United States of America, which require management to make certain estimates and assumptions at the date of the financial statements. The following summarizes the significant accounting policies of the fund:
Security Valuation. Investments are valued and net asset value (NAV) per share is calculated (NAV calculation) as of the close of business of the New York Stock Exchange (NYSE), normally 4:00 p.m. Eastern time. Wherever possible, the fund uses independent pricing services approved by the Board of Trustees to value its investments.
Equity securities, including restricted securities, for which market quotations are readily available, are valued at the last reported sale price or official closing price as reported by an independent pricing service on the primary market or exchange on which they are traded. In the event there were no sales during the day or closing prices are not available, securities are valued at the last quoted bid price. Investments in open-end mutual funds, are valued at their closing net asset value each business day. Short-term securities with remaining maturities of sixty days or less for which quotations are not readily available are valued at amortized cost, which approximates value.
1. Significant Accounting Policies - continued
Security Valuation - continued
When current market prices or quotations are not readily available or do not accurately reflect fair value, valuations may be determined in accordance with procedures adopted by the Board of Trustees. For example, when developments occur between the close of a market and the close of the NYSE that may materially affect the value of some or all of the securities, or when trading in a security is halted, those securities may be fair valued. Factors used in the determination of fair value may include monitoring news to identify significant market or security specific events such as changes in the value of U.S. securities market, reviewing developments in foreign markets and evaluating the performance of ADRs, futures contracts and exchange-traded funds. Because the fund’s utilization of fair value pricing depends on market activity, the frequency with which fair value pricing is used can not be predicted and may be utilized to a significant extent. The value of securities used for NAV calculation under fair value pricing may differ from published prices for the same securities.
Foreign Currency. The fund uses foreign currency contracts to facilitate transactions in foreign-denominated securities. Losses from these transactions may arise from changes in the value of the foreign currency or if the counterparties do not perform under the contracts’ terms.
Foreign-denominated assets, including investment securities, and liabilities are translated into U.S. dollars at the exchange rate at period end. Purchases and sales of investment securities, income and dividends received and expenses denominated in foreign currencies are translated into U.S. dollars at the exchange rate in effect on the transaction date.
The effects of exchange rate fluctuations on investments are included with the net realized and unrealized gain (loss) on investment securities. Other foreign currency transactions resulting in realized and unrealized gain (loss) are disclosed separately.
Investment Transactions and Income. Security transactions are accounted for as of trade date. Gains and losses on securities sold are determined on the basis of identified cost. Dividend income is recorded on the ex-dividend date, except for certain dividends from foreign securities where the ex-dividend date may have passed, which are recorded as soon as the fund is informed of the ex-dividend date. Non-cash dividends included in dividend income, if any, are recorded at the fair market value of the securities received. Interest income is accrued as earned. Interest income includes coupon interest and amortization of premium and accretion of discount on debt securities. Investment income is recorded net of foreign taxes withheld where recovery of such taxes is uncertain.
27 Annual Report
Notes to Financial Statements - continued
1. Significant Accounting Policies - continued
Expenses. Most expenses of the trust can be directly attributed to a fund. Expenses which cannot be directly attributed are apportioned among each fund in the trust.
Income Tax Information and Distributions to Shareholders. Each year, the fund intends to qualify as a regulated investment company by distributing all of its taxable income and realized gains under Subchapter M of the Internal Revenue Code. As a result, no provision for income taxes is required in the accompanying financial statements. Foreign taxes are provided for based on the fund’s understanding of the tax rules and rates that exist in the foreign markets in which it invests.
On September 27, 2004, the fund received a final and favorable ruling in India regarding the applicability of taxes imposed by the country on realized capital gains under the US/India tax treaty. The favorable ruling entitled the fund to a refund of capital gains taxes paid in prior years and exempts the fund from taxes on future realized gains. The total benefit to the fund resulting from the ruling was US $1,547,115, and the per-share and total return impacts are disclosed on the Financial Highlights. A receivable balance of $270,638 for the tax refund is reflected in “Other Receivables” on the Statement of Assets and Liabilities.
Distributions are recorded on the ex-dividend date. Income dividends and capital gain distributions are declared separately for each class. Income and capital gain distributions are determined in accordance with income tax regulations, which may differ from generally accepted accounting principles. In addition, the fund will claim a portion of the payment made to redeeming shareholders as a distribution for income tax purposes.
Capital accounts within the financial statements are adjusted for permanent book-tax differences. These adjustments have no impact on net assets or the results of operations. Temporary book-tax differences will reverse in a subsequent period.
Book-tax differences are primarily due to foreign currency transactions, passive foreign investment companies (PFIC), and losses deferred due to wash sales.
The tax-basis components of distributable earnings and the federal tax cost as of period end were as follows:
| Unrealized appreciation | | $ | | 10,149,572 |
| Unrealized depreciation | | | | (3,090,529) |
| Net unrealized appreciation (depreciation) | | | | 7,059,043 |
| Undistributed ordinary income | | | | 5,321,308 |
| Undistributed long-term capital gain | | | | 1,375,822 |
| |
| Cost for federal income tax purposes | | $ | | 69,030,675 |
1. Significant Accounting Policies - continued
Income Tax Information and Distributions to Shareholders - continued
| The tax character of distributions paid was as follows: | | | | |
| | | | | October 31, 2005 | | | | October 31, 2004 |
| Ordinary Income | | $ | | — | | $ | | 275,262 |
| Long-term Capital Gains | | | | 154,881 | | | | 112,280 |
| Total | | $ | | 154,881 | | $ | | 387,542 |
Short-Term Trading (Redemption) Fees. Shares held in the fund less than 90 days are subject to a redemption fee equal to 1.50% of the proceeds of the redeemed shares. All redemption fees, including any estimated redemption fees paid by FMR are retained by the fund and accounted for as an addition to paid in capital.
Repurchase Agreements. FMR has received an Exemptive Order from the Securities and Exchange Commission (the SEC) which permits the fund and other affiliated entities of FMR to transfer uninvested cash balances into joint trading accounts which are then invested in repurchase agreements. The fund may also invest directly with institutions in repurchase agreements. Repurchase agreements are collateralized by government or non-government securities. Collateral is held in segregated accounts with custodian banks and may be obtained in the event of a default of the counterparty. The fund monitors, on a daily basis, the value of the collateral to ensure it is at least equal to the principal amount of the repurchase agreement (including accrued interest). In the event of a default by the counterparty, realization of the collateral proceeds could be delayed, during which time the value of the collateral may decline.
3. Purchases and Sales of Investments.
Purchases and sales of securities, other than short-term securities and U.S. government securities, aggregated $51,484,418 and $35,285,587, respectively.
4. Fees and Other Transactions with Affiliates.
Management Fee. FMR and its affiliates provide the fund with investment management related services for which the fund pays a monthly management fee. The management fee is the sum of an individual fund fee rate that is based on an annual rate of .45% of the fund’s average net assets and a group fee rate that averaged .27% during the period. The group fee rate is based upon the average net assets of all the mutual funds advised by FMR. The group fee rate decreases as assets under management increase and increases as assets under management decrease. For the period, the total annual management fee rate was .72% of the fund’s average net assets.
29 Annual Report
Notes to Financial Statements - continued
4. Fees and Other Transactions with Affiliates - continued
Distribution and Service Plan. In accordance with Rule 12b-1 of the 1940 Act, the fund has adopted separate Distribution and Service Plans for each class of shares. Certain classes pay Fidelity Distributors Corporation (FDC), an affiliate of FMR, separate Distribution and Service Fees, each of which is based on an annual percentage of each class’ average net assets. In addition, FDC may pay financial intermediaries for selling shares of the fund and providing shareholder support services. For the period, the Distribution and Service Fee rates and the total amounts paid to and retained by FDC were as follows:
| | | Distribution | | Service | | | | Paid to | | | | Retained |
| | | Fee | | Fee | | | | FDC | | | | by FDC |
| Class A | | 0% | | .25% | | $ | | 64,382 | | $ | | 3,875 |
| Class T | | 25% | | .25% | | | | 55,806 | | | | — |
| Class B | | 75% | | .25% | | | | 95,080 | | | | 71,310 |
| Class C | | 75% | | .25% | | | | 94,226 | | | | 29,064 |
| |
| | | | | | | $ | | 309,494 | | $ | | 104,249 |
Sales Load. FDC receives a front-end sales charge of up to 5.75% for selling Class A shares, and 3.50% for selling Class T shares, some of which is paid to financial intermediaries for selling shares of the fund. FDC receives the proceeds of contingent deferred sales charges levied on Class A, Class T, Class B, and Class C redemptions. These charges depend on the holding period. The deferred sales charges range from 5% to 1% for Class B, 1% for Class C, and .25% for certain purchases of Class A and Class T shares.
| For the period, sales charge amounts retained by FDC were as follows: | | |
| | | | | Retained |
| | | | | by FDC |
| Class A | | $ | | 31,068 |
| Class T | | | | 7,855 |
| Class B* | | | | 15,463 |
| Class C* | | | | 3,063 |
| | | $ | | 57,449 |
* When Class B and Class C shares are initially sold, FDC pays commissions from its own resources to financial intermediaries through which the sales are made.
4. Fees and Other Transactions with Affiliates - continued
Transfer Agent Fees. Fidelity Investments Institutional Operations Company, Inc. (FIIOC), an affiliate of FMR, is the transfer, dividend disbursing and shareholder servicing agent for each class of the fund. FIIOC receives account fees and asset-based fees that vary according to the account size and type of account of the shareholders of the respective classes of the fund. FIIOC pays for typesetting, printing and mailing of shareholder reports, except proxy statements. For the period the total transfer agent fees paid by each class to FIIOC, were as follows:
| | | | | | | % of |
| | | | | | | Average |
| | | | | Amount | | Net Assets |
| Class A | | $ | | 79,535 | | .31 |
| Class T | | | | 50,773 | | .45 |
| Class B | | | | 40,588 | | .43 |
| Class C | | | | 33,669 | | .36 |
| Institutional Class | | | | 3,903 | | .28 |
| | | $ | | 208,468 | | |
Accounting and Security Lending Fees. Fidelity Service Company, Inc. (FSC), an affiliate of FMR, maintains the fund’s accounting records. The accounting fee is based on the level of average net assets for the month. Under a separate contract, FSC administers the security lending program. The security lending fee is based on the number and duration of lending transactions.
Affiliated Central Funds. The fund may invest in Money Market Central Funds which seek preservation of capital and current income and are managed by Fidelity Investments Money Management, Inc. (FIMM), an affiliate of FMR.
The Money Market Central Funds do not pay a management fee. Income distributions earned by the fund are recorded as income in the accompanying financial statements and totaled $96,744 for the period.
5. Committed Line of Credit.
|
The fund participates with other funds managed by FMR in a $4.2 billion credit facility (the “line of credit”) to be utilized for temporary or emergency purposes to fund shareholder redemptions or for other short-term liquidity purposes. The fund has agreed to pay commitment fees on its pro rata portion of the line of credit. During the period, there were no borrowings on this line of credit.
The fund lends portfolio securities from time to time in order to earn additional income. The fund receives collateral (in the form of U.S. Treasury obligations, letters of credit and/or cash) against the loaned securities and maintains collateral in an amount not less
31 Annual Report
Notes to Financial Statements - continued
6. Security Lending - continued
than 100% of the market value of the loaned securities during the period of the loan. The market value of the loaned securities is determined at the close of business of the fund and any additional required collateral is delivered to the fund on the next business day. If the borrower defaults on its obligation to return the securities loaned because of insolvency or other reasons, a fund could experience delays and costs in recovering the securities loaned or in gaining access to the collateral. Cash collateral is invested in the Fidelity Securities Lending Cash Central Fund. The value of loaned securities and cash collateral at period end are disclosed on the fund’s Statement of Assets and Liabilities. Security lending income represents the income earned on investing cash collateral, less fees and expenses associated with the loan, plus any premium payments that may be received on the loan of certain types of securities.
FMR voluntarily agreed to reimburse each class to the extent annual operating expenses exceeded certain levels of average net assets as noted in the table below. Some expenses, for example interest expense, are excluded from this reimbursement.
| The following classes were in reimbursement during the period: | | | | |
| | | Expense | | | | Reimbursement |
| | | Limitations | | | | from adviser |
| Class A | | 2.00% | | -- | | 1.50%* | | $ | | 75,118 |
| Class T | | 2.25% | | -- | | 1.75%* | | | | 47,967 |
| Class B | | 2.75% | | -- | | 2.25%* | | | | 38,152 |
| Class C | | 2.75% | | -- | | 2.25%* | | | | 31,072 |
| Institutional Class | | 1.75% | | -- | | 1.25%* | | | | 3,161 |
| | | | | | | | | $ | | 195,470 |
| * Expense limitation in effect at period end. | | | | | | | | | | |
Many of the brokers with whom FMR places trades on behalf of the fund provided services to the fund in addition to trade execution. These services included payments of certain expenses on behalf of the fund totaling $32,744 for the period. In addition, through arrangements with the fund’s custodian, credits realized as a result of uninvested cash balances were used to reduce the fund’s expenses. During the period, these credits reduced the fund’s custody expenses by $101.
The fund’s organizational documents provide former and current trustees and officers with a limited indemnification against liabilities arising in connection with the performance of their duties to the fund. In the normal course of business, the fund may also
enter into contracts that provide general indemnifications. The fund’s maximum exposure under these arrangements is unknown as this would be dependent on future claims that may be made against the fund. The risk of material loss from such claims is considered remote.
| 9. Distributions to Shareholders. | | | | | | |
| |
| Distributions to shareholders of each class were as follows: | | | | |
| |
| Years ended October 31, | | | | 2005 | | | | 2004 |
| From net investment income | | | | | | | | |
| Class A | | $ | | — | | $ | | 262,328 |
| Class T | | | | — | | | | 47,004 |
| Class B | | | | — | | | | 33,782 |
| Class C | | | | — | | | | 35,907 |
| Institutional Class | | | | — | | | | 8,521 |
| Total | | $ | | — | | $ | | 387,542 |
| From net realized gain | | | | | | | | |
| Class A | | $ | | 75,153 | | $ | | — |
| Class T | | | | 27,877 | | | | — |
| Class B | | | | 25,998 | | | | — |
| Class C | | | | 24,310 | | | | — |
| Institutional Class | | | | 1,543 | | | | — |
| Total | | $ | | 154,881 | | $ | | — |
33 Annual Report
| Notes to Financial Statements - continued | | | | | | | | |
| |
| |
| 10. Share Transactions. | | | | | | | | | | | | |
| |
| Transactions for each class of shares were as follows: | | | | | | | | |
| |
| | | Shares | | | | | | Dollars |
| Years ended October 31, | | 2005 | | 2004 | | | | 2005 | | | | 2004 |
| Class A | | | | | | | | | | | | |
| Shares sold | | 518,720 | | 434,733 | | $ | | 9,010,497 | | $ | | 6,185,174 |
| Reinvestment of distributions | | 3,450 | | 12,079 | | | | 49,821 | | | | 161,725 |
| Shares redeemed | | (294,932) | | (783,804) | | | | (4,849,332) | | | | (10,515,828) |
| Net increase (decrease) | | 227,238 | | (336,992) $ | | 4,210,986 | | $ (4,168,929) |
| Class T | | | | | | | | | | | | |
| Shares sold | | 415,914 | | 380,716 | | $ | | 7,007,372 | | $ | | 5,152,134 |
| Reinvestment of distributions | | 1,927 | | 3,427 | | | | 27,491 | | | | 45,376 |
| Shares redeemed | | (166,466) | | (214,653) | | | | (2,751,962) | | | | (2,869,764) |
| Net increase (decrease) | | 251,375 | | 169,490 | | $ | | 4,282,901 | | $ | | 2,327,746 |
| Class B | | | | | | | | | | | | |
| Shares sold | | 286,104 | | 349,019 | | $ | | 4,680,793 | | $ | | 4,672,186 |
| Reinvestment of distributions | | 1,678 | | 2,359 | | | | 23,339 | | | | 30,615 |
| Shares redeemed | | (133,436) | | (234,681) | | | | (2,146,830) | | | | (3,052,361) |
| Net increase (decrease) | | 154,346 | | 116,697 | | $ | | 2,557,302 | | $ | | 1,650,440 |
| Class C | | | | | | | | | | | | |
| Shares sold | | 436,813 | | 348,062 | | $ | | 7,256,680 | | $ | | 4,708,149 |
| Reinvestment of distributions | | 1,423 | | 2,295 | | | | 19,794 | | | | 29,763 |
| Shares redeemed | | (135,427) | | (230,906) | | | | (2,135,513) | | | | (3,009,906) |
| Net increase (decrease) | | 302,809 | | 119,451 | | $ | | 5,140,961 | | $ | | 1,728,006 |
| Institutional Class | | | | | | | | | | | | |
| Shares sold | | 257,830 | | 57,551 | | $ | | 4,557,639 | | $ | | 812,450 |
| Reinvestment of distributions | | 24 | | 102 | | | | 347 | | | | 1,386 |
| Shares redeemed | | (23,195) | | (142,162) | | | | (403,547) | | | | (1,961,458) |
| Net increase (decrease) | | 234,659 | | (84,509) | | $ | | 4,154,439 | | $ (1,147,622) |
Report of Independent Registered Public Accounting Firm
To the Trustees of Fidelity Advisor Series VIII and the Shareholders of Fidelity Advisor Emerging Asia Fund:
In our opinion, the accompanying statement of assets and liabilities, including the schedule of investments, and the related statements of operations and of changes in net assets and the financial highlights present fairly, in all material respects, the financial position of Fidelity Advisor Emerging Asia Fund (a fund of Fidelity Advisor Series VIII) at October 31, 2005 and the results of its operations, the changes in its net assets and the financial highlights for the periods indicated, in conformity with accounting principles generally accepted in the United States of America. These financial statements and financial highlights (hereafter referred to as “financial statements”) are the responsibility of the Fidelity Advisor Emerging Asia Fund’s management; our responsibility is to express an opinion on these financial statements based on our audits. We conducted our audits of these financial statements in accordance with the standards of the Public Company Accounting Oversight Board (United States). Those standards require that we plan and perform the audit to obtain reasonable assurance about whether the financial statements are free of material misstatement. An audit includes examining, on a test basis, evidence supporting the amounts and disclosures in the financial statements, assessing the accounting principles used and significant estimates made by management, and evaluating the overall financial statement presentation. We believe that our audits, which included confirmation of securities at October 31, 2005 by correspondence with the custodian and brokers, provide a reasonable basis for our opinion.
/s/ PricewaterhouseCoopers LLP
PricewaterhouseCoopers LLP
Boston, Massachusetts
December 19, 2005
|
35 Annual Report
Trustees and Officers
The Trustees, Members of the Advisory Board, and executive officers of the trust and fund, as applicable, are listed below. The Board of Trustees governs the fund and is responsible for protecting the interests of shareholders. The Trustees are experienced executives who meet periodically throughout the year to oversee the fund’s activities, review contractual arrangements with companies that provide services to the fund, and review the fund’s performance. Except for William O. McCoy, Stephen P. Jonas, and Kenneth L. Wolfe, each of the Trustees oversees 322 funds advised by FMR or an affiliate. Mr. McCoy oversees 324 funds advised by FMR or an affiliate. Mr. Jonas and Mr. Wolfe oversee 319 funds advised by FMR or an affiliate.
The Trustees hold office without limit in time except that (a) any Trustee may resign; (b) any Trustee may be removed by written instrument, signed by at least two-thirds of the number of Trustees prior to such removal; (c) any Trustee who requests to be retired or who has become incapacitated by illness or injury may be retired by written instrument signed by a majority of the other Trustees; and (d) any Trustee may be removed at any special meeting of shareholders by a two-thirds vote of the outstanding voting securities of the trust. Each Trustee who is not an interested person (as defined in the 1940 Act) (Independent Trustee), shall retire not later than the last day of the calendar year in which his or her 72nd birthday occurs. The Independent Trustees may waive this mandatory retirement age policy with respect to individual Trustees. The executive officers and Advisory Board Members hold office without limit in time, except that any officer and Advisory Board Member may resign or may be removed by a vote of a majority of the Trustees at any regular meeting or any special meeting of the Trustees. Except as indicated, each individual has held the office shown or other offices in the same company for the past five years.
The fund’s Statement of Additional Information (SAI) includes more information about the Trustees. To request a free copy, call Fidelity at 1-877-208-0098.
Interested Trustees*:
Correspondence intended for each Trustee who is an interested person may be sent to Fidelity Investments, 82 Devonshire Street, Boston, Massachusetts 02109.
| Name, Age; Principal Occupation |
| |
| Edward C. Johnson 3d (75)** |
| |
| Year of Election or Appointment: 1983 |
| Mr. Johnson is Chairman of the Board of Trustees. Mr. Johnson serves as |
| Chief Executive Officer, Chairman, and a Director of FMR Corp.; a Di- |
| rector and Chairman of the Board and of the Executive Committee of |
| FMR; Chairman and a Director of Fidelity Management & Research (Far |
| East) Inc.; Chairman and a Director of Fidelity Investments Money Man- |
| agement, Inc.; and Chairman (2001-present) and a Director |
| (2000-present) of FMR Co., Inc. |
Annual Report 36
| Name, Age; Principal Occupation |
| |
| Abigail P. Johnson (43)** |
| |
| Year of Election or Appointment: 2001 |
| Ms. Johnson serves as President of Fidelity Employer Services Company |
| (FESCO) (2005-present). She is President and a Director of Fidelity In- |
| vestments Money Management, Inc. (2001-present), FMR Co., Inc. |
| (2001-present), and a Director of FMR Corp. Previously, Ms. Johnson |
| served as President and a Director of FMR (2001-2005), Senior Vice |
| President of the Fidelity funds (2001-2005), and managed a number of |
| Fidelity funds. |
| |
| Stephen P. Jonas (52) |
| |
| Year of Election or Appointment: 2005 |
| Mr. Jonas is Senior Vice President of Advisor Emerging Asia |
| (2005-present). He also serves as Senior Vice President of other Fidelity |
| funds (2005-present). Mr. Jonas is Executive Director of FMR |
| (2005-present). Previously, Mr. Jonas served as President of Fidelity En- |
| terprise Operations and Risk Services (2004-2005), Chief Administra- |
| tive Officer (2002-2004), and Chief Financial Officer of FMR Co. |
| (1998-2000). Mr. Jonas has been with Fidelity Investments since 1987 |
| and has held various financial and management positions including |
| Chief Financial Officer of FMR. In addition, he serves on the Boards of |
| Boston Ballet (2003-present) and Simmons College (2003-present). |
| |
| Robert L. Reynolds (53) |
| |
| Year of Election or Appointment: 2003 |
| Mr. Reynolds is a Director (2003-present) and Chief Operating Officer |
| (2002-present) of FMR Corp. He also serves on the Board at Fidelity |
| Investments Canada, Ltd. (2000-present). Previously, Mr. Reynolds |
| served as President of Fidelity Investments Institutional Retirement Group |
| (1996-2000). |
* Trustees have been determined to be “Interested Trustees” by virtue of, among other things, their affiliation with the trust or various entities under common control with FMR.
** Edward C. Johnson 3d, Trustee, is Abigail P. Johnson’s father.
37 Annual Report
Trustees and Officers - continued
Independent Trustees:
Correspondence intended for each Independent Trustee (that is, the Trustees other than the Interested Trustees) may be sent to Fidelity Investments, P.O. Box 55235, Boston, Massachusetts 02205-5235.
| Name, Age; Principal Occupation |
| |
| Dennis J. Dirks (57) |
| |
| Year of Election or Appointment: 2005 |
| Prior to his retirement in May 2003, Mr. Dirks was Chief Operating |
| Officer and a member of the Board of The Depository Trust & Clearing |
| Corporation (DTCC) (1999-2003). He also served as President, Chief |
| Operating Officer, and Board member of The Depository Trust |
| Company (DTC) (1999-2003) and President and Board member of the |
| National Securities Clearing Corporation (NSCC) (1999-2003). In addi- |
| tion, Mr. Dirks served as Chief Executive Officer and Board member of |
| the Government Securities Clearing Corporation (2001-2003) and Chief |
| Executive Officer and Board member of the Mortgage-Backed Securities |
| Clearing Corporation (2001-2003). Mr. Dirks also serves as a Trustee of |
| Manhattan College (2005-present). |
| |
| Robert M. Gates (62) |
| |
| Year of Election or Appointment: 1997 |
| Dr. Gates is Vice Chairman of the Independent Trustees (2005-present). |
| Dr. Gates is President of Texas A&M University (2002-present). He was |
| Director of the Central Intelligence Agency (CIA) from 1991 to 1993. |
| From 1989 to 1991, Dr. Gates served as Assistant to the President of |
| the United States and Deputy National Security Advisor. Dr. Gates is a |
| Director of NACCO Industries, Inc. (mining and manufacturing), Parker |
| Drilling Co., Inc. (drilling and rental tools for the energy industry, |
| 2001-present), and Brinker International (restaurant management, |
| 2003-present). Previously, Dr. Gates served as a Director of LucasVarity |
| PLC (automotive components and diesel engines), a Director of TRW Inc. |
| (automotive, space, defense, and information technology), and Dean of |
| the George Bush School of Government and Public Service at Texas |
| A&M University (1999-2001). Dr. Gates also is a Trustee of the Forum |
| for International Policy. |
Annual Report 38
| Name, Age; Principal Occupation |
| |
| George H. Heilmeier (69) |
| |
| Year of Election or Appointment: 2004 |
| Dr. Heilmeier is Chairman Emeritus of Telcordia Technologies (commu- |
| nication software and systems), where prior to his retirement, he served |
| as company Chairman and Chief Executive Officer. He currently serves |
| on the Boards of Directors of The Mitre Corporation (systems engineer- |
| ing and information technology support for the government), and HRL |
| Laboratories (private research and development, 2004-present). He is |
| Chairman of the General Motors Science & Technology Advisory Board |
| and a Life Fellow of the Institute of Electrical and Electronics Engineers |
| (IEEE) (2000-present). Dr. Heilmeier is a member of the Defense Science |
| Board and the National Security Agency Advisory Board. He is also a |
| member of the National Academy of Engineering, the American |
| Academy of Arts and Sciences, and the Board of Overseers of the |
| School of Engineering and Applied Science of the University of Pennsyl- |
| vania. Previously, Dr. Heilmeier served as a Director of TRW Inc. (auto- |
| motive, space, defense, and information technology, 1992-2002), |
| Compaq (1994-2002), Automatic Data Processing, Inc. (ADP) |
| (technology-based business outsourcing, 1995-2002), INET Technolo- |
| gies Inc. (telecommunications network surveillance, 2001-2004), and |
| Teletech Holdings (customer management services). He is the recipient of |
| the 2005 Kyoto Prize in Advanced Technology for his invention of the |
| liquid display. |
| |
| Marie L. Knowles (59) |
| |
| Year of Election or Appointment: 2001 |
| Prior to Ms. Knowles’ retirement in June 2000, she served as Executive |
| Vice President and Chief Financial Officer of Atlantic Richfield Company |
| (ARCO) (diversified energy, 1996-2000). From 1993 to 1996, she was |
| a Senior Vice President of ARCO and President of ARCO Transportation |
| Company. She served as a Director of ARCO from 1996 to 1998. She |
| currently serves as a Director of Phelps Dodge Corporation (copper |
| mining and manufacturing) and McKesson Corporation (healthcare ser- |
| vice, 2002-present). Ms. Knowles is a Trustee of the Brookings Institution |
| and the Catalina Island Conservancy and also serves as a member of |
| the Advisory Board for the School of Engineering of the University of |
| Southern California. |
39 Annual Report
Trustees and Officers - continued
| Name, Age; Principal Occupation |
| |
| Ned C. Lautenbach (61) |
| |
| Year of Election or Appointment: 2000 |
| Mr. Lautenbach has been a partner of Clayton, Dubilier & Rice, Inc. |
| (private equity investment firm) since September 1998. Previously, Mr. |
| Lautenbach was with the International Business Machines Corporation |
| (IBM) from 1968 until his retirement in 1998. Mr. Lautenbach serves as |
| a Director of Italtel Holding S.p.A. (telecommunications (Milan, Italy), |
| 2004-present) and Eaton Corporation (diversified industrial) as well as |
| the Philharmonic Center for the Arts in Naples, Florida. He also is a |
| member of the Board of Trustees of Fairfield University (2005-present), |
| as well as a member of the Council on Foreign Relations. |
| |
| Marvin L. Mann (72) |
| |
| Year of Election or Appointment: 1993 |
| Mr. Mann is Chairman of the Independent Trustees (2001-present). He is |
| Chairman Emeritus of Lexmark International, Inc. (computer |
| peripherals), where he served as CEO until April 1998, retired as |
| Chairman May 1999, and remains a member of the Board. Prior to |
| 1991, he held the positions of Vice President of International Business |
| Machines Corporation (IBM) and President and General Manager of |
| various IBM divisions and subsidiaries. He is a member of the Executive |
| Committee of the Independent Director’s Council of the Investment Com- |
| pany Institute. In addition, Mr. Mann is a member of the President’s |
| Cabinet at the University of Alabama and the Board of Visitors of the |
| Culverhouse College of Commerce and Business Administration at the |
| University of Alabama. |
| |
| William O. McCoy (72) |
| |
| Year of Election or Appointment: 1997 |
| Prior to his retirement in December 1994, Mr. McCoy was Vice Chair- |
| man of the Board of BellSouth Corporation (telecommunications) and |
| President of BellSouth Enterprises. He is currently a Director of Liberty |
| Corporation (holding company), Duke Realty Corporation (real estate), |
| and Progress Energy, Inc. (electric utility). He is also a partner of Frank- |
| lin Street Partners (private investment management firm) and a member |
| of the Research Triangle Foundation Board. In addition, Mr. McCoy |
| served as the Interim Chancellor (1999-2000) and a member of the |
| Board of Visitors for the University of North Carolina at Chapel Hill and |
| currently serves on the Board of Directors of the University of North |
| Carolina Health Care System and the Board of Visitors of the Kenan- |
| Flagler Business School (University of North Carolina at Chapel Hill). He |
| also served as Vice President of Finance for the University of North Car- |
| olina (16-school system). |
Annual Report 40
| Name, Age; Principal Occupation |
| |
| Cornelia M. Small (61) |
| |
| Year of Election or Appointment: 2005 |
| Ms. Small is a member (2000-present) and Chairperson (2002-present) |
| of the Investment Committee, and a member (2002-present) of the |
| Board of Trustees of Smith College. Previously, she served as Chief In- |
| vestment Officer (1999-2000), Director of Global Equity Investments |
| (1996-1999), and a member of the Board of Directors of Scudder, |
| Stevens & Clark (1990-1997) and Scudder Kemper Investments |
| (1997-1998). In addition, Ms. Small served as Co-Chair (2000-2003) |
| of the Annual Fund for the Fletcher School of Law and Diplomacy. |
| |
| William S. Stavropoulos (66) |
| |
| Year of Election or Appointment: 2001 |
| Mr. Stavropoulos is Chairman of the Board (2000-present) and a Mem- |
| ber of the Board of Directors of The Dow Chemical Company. Since |
| joining The Dow Chemical Company in 1967, Mr. Stavropoulos served |
| in numerous senior management positions, including President |
| (1993-2000; 2002-2003), CEO (1995-2000; 2002-2004), and Chair- |
| man of the Executive Committee (2000-2004). Currently, he is a Direc- |
| tor of NCR Corporation (data warehousing and technology solutions), |
| BellSouth Corporation (telecommunications), Chemical Financial Corpo- |
| ration, Maersk Inc. (industrial conglomerate, 2002-present), and Metal- |
| mark Capital (private equity investment firm, 2005-present). He also |
| serves as a member of the Board of Trustees of the American Enterprise |
| Institute for Public Policy Research. In addition, Mr. Stavropoulos is a |
| member of The Business Council, J.P. Morgan International Council and |
| the University of Notre Dame Advisory Council for the College of |
| Science. |
| |
| Kenneth L. Wolfe (66) |
| |
| Year of Election or Appointment: 2005 |
| Mr. Wolfe also serves as a Trustee (2005-present) or Member of the |
| Advisory Board (2004-present) of other investment companies advised |
| by FMR. Prior to his retirement in 2001, Mr. Wolfe was Chairman and |
| Chief Executive Officer of Hershey Foods Corporation (1993-2001). He |
| currently serves as a member of the boards of Adelphia Communica- |
| tions Corporation (2003-present), Bausch & Lomb, Inc., and Revlon Inc. |
| (2004-present). |
41 Annual Report
Trustees and Officers - continued
Advisory Board Members and Executive Officers:
Correspondence intended for Mr. Gamper may be sent to Fidelity Investments, P.O. Box 55235, Boston, Massachusetts 02205-5235. Correspondence intended for each executive officer and Mr. Lynch may be sent to Fidelity Investments, 82 Devonshire Street, Boston, Massachusetts 02109.
| Name, Age; Principal Occupation |
| |
| Albert R. Gamper, Jr. (63) |
| |
| Year of Election or Appointment: 2005 |
| Member of the Advisory Board of Fidelity Advisor Series VIII. Prior to his |
| retirement in December 2004, Mr. Gamper served as Chairman of the |
| Board of CIT Group Inc. (commercial finance). During his tenure with |
| CIT Group Inc. Mr. Gamper served in numerous senior management |
| positions, including Chairman (1987-1989; 1999-2001; 2002-2004), |
| Chief Executive Officer (1987-2004), and President (1989-2002). He |
| currently serves as a member of the Board of Directors of Public Service |
| Enterprise Group (utilities, 2001-present), Chairman of the Board of |
| Governors, Rutgers University (2004-present), and Chairman of the |
| Board of Saint Barnabas Health Care System. |
| |
| Peter S. Lynch (61) |
| |
| Year of Election or Appointment: 2003 |
| Member of the Advisory Board of Fidelity Advisor Series VIII. Vice |
| Chairman and a Director of FMR, and Vice Chairman (2001-present) |
| and a Director (2000-present) of FMR Co., Inc. Previously, Mr. Lynch |
| served as a Trustee of the Fidelity funds (1990-2003). In addition, he |
| serves as a Trustee of Boston College, Massachusetts Eye & Ear Infir- |
| mary, Historic Deerfield, John F. Kennedy Library, and the Museum of |
| Fine Arts of Boston. |
| |
| Dwight D. Churchill (51) |
| |
| Year of Election or Appointment: 2005 |
| Vice President of Advisor Emerging Asia. Mr. Churchill also serves as |
| Vice President of certain Equity Funds (2005-present) and certain High |
| Income Funds (2005-present). Previously, he served as Head of Fidelity’s |
| Fixed-Income Division (2000-2005), Vice President of Fidelity’s Money |
| Market Funds (2000-2005), Vice President of Fidelity’s Bond Funds, and |
| Senior Vice President of FIMM (2000) and FMR. Mr. Churchill joined |
| Fidelity in 1993 as Vice President and Group Leader of Taxable Fixed- |
| Income Investments. |
Annual Report 42
| Name, Age; Principal Occupation |
| |
| Eric D. Roiter (56) |
| |
| Year of Election or Appointment: 1998 |
| Secretary of Advisor Emerging Asia. He also serves as Secretary of |
| other Fidelity funds; Vice President, General Counsel, and Secretary of |
| FMR Co., Inc. (2001-present) and FMR; Assistant Secretary of Fidelity |
| Management & Research (U.K.) Inc. (2001-present), Fidelity Manage- |
| ment & Research (Far East) Inc. (2001-present), and Fidelity Investments |
| Money Management, Inc. (2001-present). Mr. Roiter is an Adjunct |
| Member, Faculty of Law, at Boston College Law School (2003-present). |
| Previously, Mr. Roiter served as Vice President and Secretary of Fidelity |
| Distributors Corporation (FDC) (1998-2005). |
| |
| Stuart Fross (46) |
| |
| Year of Election or Appointment: 2003 |
| Assistant Secretary of Advisor Emerging Asia. Mr. Fross also serves as |
| Assistant Secretary of other Fidelity funds (2003-present), Vice President |
| and Secretary of FDC (2005-present), and is an employee of FMR. |
| |
| Christine Reynolds (47) |
| |
| Year of Election or Appointment: 2004 |
| President, Treasurer, and Anti-Money Laundering (AML) officer of Advi- |
| sor Emerging Asia. Ms. Reynolds also serves as President, Treasurer, |
| and AML officer of other Fidelity funds (2004) and is a Vice President |
| (2003) and an employee (2002) of FMR. Before joining Fidelity Invest- |
| ments, Ms. Reynolds worked at PricewaterhouseCoopers LLP (PwC) |
| (1980-2002), where she was most recently an audit partner with PwC’s |
| investment management practice. |
| |
| Paul M. Murphy (58) |
| |
| Year of Election or Appointment: 2005 |
| Chief Financial Officer of Advisor Emerging Asia. Mr. Murphy also |
| serves as Chief Financial Officer of other Fidelity funds (2005-present). |
| He also serves as Senior Vice President of Fidelity Pricing and Cash |
| Management Services Group (FPCMS). |
| |
| Kenneth A. Rathgeber (58) |
| |
| Year of Election or Appointment: 2004 |
| Chief Compliance Officer of Advisor Emerging Asia. Mr. Rathgeber also |
| serves as Chief Compliance Officer of other Fidelity funds (2004) and |
| Executive Vice President of Risk Oversight for Fidelity Investments |
| (2002). Previously, he served as Executive Vice President and Chief Op- |
| erating Officer for Fidelity Investments Institutional Services Company, |
| Inc. (1998-2002). |
43 Annual Report
Trustees and Officers - continued
| Name, Age; Principal Occupation |
| |
| John R. Hebble (47) |
| |
| Year of Election or Appointment: 2003 |
| Deputy Treasurer of Advisor Emerging Asia. Mr. Hebble also serves as |
| Deputy Treasurer of other Fidelity funds (2003), and is an employee of |
| FMR. Before joining Fidelity Investments, Mr. Hebble worked at Deutsche |
| Asset Management where he served as Director of Fund Accounting |
| (2002-2003) and Assistant Treasurer of the Scudder Funds |
| (1998-2003). |
| |
| Bryan A. Mehrmann (44) |
| |
| Year of Election or Appointment: 2005 |
| Deputy Treasurer of Advisor Emerging Asia. Mr. Mehrmann also serves |
| as Deputy Treasurer of other Fidelity funds (2005-present) and is an |
| employee of FMR. Previously, Mr. Mehrmann served as Vice President of |
| Fidelity Investments Institutional Services Group (FIIS)/Fidelity Investments |
| Institutional Operations Corporation, Inc. (FIIOC) Client Services |
| (1998-2004). |
| |
| Kimberley H. Monasterio (41) |
| |
| Year of Election or Appointment: 2004 |
| Deputy Treasurer of Advisor Emerging Asia. Ms. Monasterio also serves |
| as Deputy Treasurer of other Fidelity funds (2004) and is an employee |
| of FMR (2004). Before joining Fidelity Investments, Ms. Monasterio |
| served as Treasurer (2000-2004) and Chief Financial Officer |
| (2002-2004) of the Franklin Templeton Funds and Senior Vice President |
| of Franklin Templeton Services, LLC (2000-2004). |
| |
| Kenneth B. Robins (36) |
| |
| Year of Election or Appointment: 2005 |
| Deputy Treasurer of Advisor Emerging Asia. Mr. Robins also serves as |
| Deputy Treasurer of other Fidelity funds (2005-present) and is an em- |
| ployee of FMR (2004-present). Before joining Fidelity Investments, Mr. |
| Robins worked at KPMG LLP, where he was a partner in KPMG’s de- |
| partment of professional practice (2002-2004) and a Senior Manager |
| (1999-2000). In addition, Mr. Robins served as Assistant Chief Accoun- |
| tant, United States Securities and Exchange Commission (2000-2002). |
| |
| Robert G. Byrnes (38) |
| |
| Year of Election or Appointment: 2005 |
| Assistant Treasurer of Advisor Emerging Asia. Mr. Byrnes also serves as |
| Assistant Treasurer of other Fidelity funds (2005-present) and is an em- |
| ployee of FMR (2005-present). Previously, Mr. Byrnes served as Vice |
| President of FPCMS (2003-2005). Before joining Fidelity Investments, |
| Mr. Byrnes worked at Deutsche Asset Management where he served as |
| Vice President of the Investment Operations Group (2000-2003). |
Annual Report 44
| Name, Age; Principal Occupation |
| |
| John H. Costello (59) |
| |
| Year of Election or Appointment: 1994 |
| Assistant Treasurer of Advisor Emerging Asia. Mr. Costello also serves |
| as Assistant Treasurer of other Fidelity funds and is an employee of |
| FMR. |
| |
| Peter L. Lydecker (51) |
| |
| Year of Election or Appointment: 2004 |
| Assistant Treasurer of Advisor Emerging Asia. Mr. Lydecker also serves |
| as Assistant Treasurer of other Fidelity funds (2004) and is an employee |
| of FMR. |
| |
| Mark Osterheld (50) |
| |
| Year of Election or Appointment: 2002 |
| Assistant Treasurer of Advisor Emerging Asia. Mr. Osterheld also serves |
| as Assistant Treasurer of other Fidelity funds (2002) and is an employee |
| of FMR. |
| |
| Gary W. Ryan (47) |
| |
| Year of Election or Appointment: 2005 |
| Assistant Treasurer of Advisor Emerging Asia. Mr. Ryan also serves as |
| Assistant Treasurer of other Fidelity funds (2005-present) and is an em- |
| ployee of FMR (2005-present). Previously, Mr. Ryan served as Vice Pres- |
| ident of Fund Reporting in FPCMS (1999-2005). |
| |
| Salvatore Schiavone (39) |
| |
| Year of Election or Appointment: 2005 |
| Assistant Treasurer of Advisor Emerging Asia. Mr. Schiavone also serves |
| as Assistant Treasurer of other Fidelity funds (2005-present) and is an |
| employee of FMR (2005-present). Before joining Fidelity Investments, |
| Mr. Schiavone worked at Deutsche Asset Management, where he most |
| recently served as Assistant Treasurer (2003-2005) of the Scudder |
| Funds and Vice President and Head of Fund Reporting (1996-2003). |
45 Annual Report
The Board of Trustees of Fidelity Advisor Emerging Asia Fund voted to pay to shareholders of record at the opening of business on record date, the following distributions per share derived from capital gains realized from sales of portfolio securities, and dividends derived from net investment income:
| | | Pay Date | | Record Date | | Dividends | | Capital Gains |
| Institutional Class | | 12/12/05 | | 12/09/05 | | $.206 | | $1.39 |
The fund hereby designates as capital gain dividends: For dividends with respect to the taxable year ended October 31, 2005, $1,400,505, or, if subsequently determined to be different, the net capital gain of such year, and for dividends with respect to the taxable year ended October 31, 2004, $130,197, or, if subsequently determined to be different, the excess of: (a) the net capital gain of such year, over (b) amounts previously designated as capital gain dividends with respect to such year.
The fund will notify shareholders in January 2006 of amounts for use in preparing 2005 income tax returns.
Board Approval of Investment Advisory Contracts and Management Fees
Advisor Emerging Asia Fund
Each year, typically in July, the Board of Trustees, including the independent Trustees (together, the Board), votes on the renewal of the management contract and sub-advisory agreements (together, the Advisory Contracts) for the fund. The Board, assisted by the advice of fund counsel and independent Trustees’ counsel, requests and considers a broad range of information throughout the year.
The Board meets regularly each month except August and takes into account throughout the year matters bearing on Advisory Contracts. The Board, acting directly and through its separate committees, considers at each of its meetings factors that are relevant to the annual renewal of the fund’s Advisory Contracts, including the services and support provided to the fund and its shareholders by Fidelity. At the time of the renewal, the Board had 11 standing committees, each composed of independent Trustees with varying backgrounds, to which the Board has assigned specific subject matter responsibilities in order to enhance effective decision-making by the Board. Each committee has adopted a written charter outlining the structure and purposes of the committee. One such committee, the Equity Contract Committee, meets periodically during the first six months of each year and as necessary to consider matters specifically related to the annual renewal of Advisory Contracts. The committee requests and receives information on, and makes recommendations to the independent Trustees concerning, the approval and annual review of the Advisory Contracts.
At its July 2005 meeting, the Board of Trustees, including the independent Trustees, unanimously determined to renew the Advisory Contracts for the fund. In reaching its determination, the Board considered all factors it believed relevant, including (1) the nature, extent, and quality of the services to be provided to the fund and its shareholders by Fidelity (including the investment performance of the fund); (2) the competitiveness of the management fee and total expenses of the fund; (3) the total costs of the services to be provided by and the profits to be realized by the investment adviser and its affiliates from the relationship with the fund; (4) the extent to which economies of scale would be realized as the fund grows; and (5) whether fee levels reflect these economies of scale, if any, for the benefit of fund shareholders.
In determining whether to renew the Advisory Contracts for the fund, the Board ultimately reached a determination, with the assistance of fund counsel and independent Trustees’ counsel, that the renewal of the Advisory Contracts and the compensation to be received by Fidelity under the management contract is consistent with Fidelity’s fiduciary duty under applicable law. In addition to evaluating the specific factors noted above, the Board, in reaching its determination, is aware that shareholders in the fund have a broad range of investment choices available to them, including a wide choice among mutual funds offered by competitors to Fidelity, and that the fund’s shareholders, with the opportunity to review and weigh the disclosure provided by the fund in its
47 Annual Report
Board Approval of Investment Advisory Contracts and Management Fees - continued
prospectus and other public disclosures, have chosen to invest in this fund, managed by Fidelity.
Nature, Extent, and Quality of Services Provided by Fidelity. The Board considered staffing within the investment adviser, FMR, and the sub-advisers (together, the Investment Advisers), including the background of the fund’s portfolio manager and the fund’s investment objective and discipline. The independent Trustees also had discussions with senior management of Fidelity’s investment operations and investment groups. The Board considered the structure of the portfolio manager compensation program and whether this structure provides appropriate incentives.
Fidelity Resources Dedicated to Investment Management and Support Services. The Board reviewed the size, education, and experience of the Investment Advisers’ investment staff, their use of technology, and the Investment Advisers’ approach to recruiting, training, and retaining portfolio managers and other research, advisory, and management personnel. The Board considered Fidelity’s extensive global research capabilities that enable the Investment Advisers to aggregate data from various sources in an effort to produce positive investment results. The Board noted that Fidelity’s analysts have access to a variety of technological tools that enable them to perform both fundamental and quantitative analysis and to specialize in various disciplines. The Board also considered that Fidelity’s portfolio managers and analysts have access to daily portfolio attribution that allows for monitoring of a fund’s portfolio, as well as an electronic communication system that provides immediate real-time access to research concerning issuers and credit enhancers.
Shareholder and Administrative Services. The Board considered the nature, extent, quality, and cost of administrative, distribution, and shareholder services performed by the Investment Advisers and their affiliates under the Advisory Contracts and under separate agreements covering transfer agency, pricing and bookkeeping, and securities lending services for the fund. The Board also considered the nature and extent of the Investment Advisers’ supervision of third party service providers, principally custodians and subcustodians. The Board reviewed the allocation of fund brokerage, including allocations to brokers affiliated with the Investment Advisers, the use of brokerage commissions to pay fund expenses, and the use of “soft” commission dollars to pay for research services. The Board also considered that Fidelity voluntarily decided in 2004 to stop using “soft” commission dollars to pay for market data and, instead, to pay for that data out of its own resources. The Board also considered the resources devoted to, and the record of compliance with, the fund’s compliance policies and procedures.
The Board noted that the growth of fund assets across the complex allows Fidelity to reinvest in the development of services designed to enhance the value or convenience of the Fidelity funds as investment vehicles. These services include 24-hour access to
account information and market information through phone representatives and over the Internet, and investor education materials and asset allocation tools.
Investment in a Large Fund Family. The Board considered the benefits to shareholders of investing in a Fidelity fund, including the benefits of investing in a fund that is part of a large family of funds offering a variety of investment disciplines and providing for a large variety of mutual fund investor services. For example, fund shareholders are offered the privilege of exchanging shares of the fund for shares of other Fidelity funds, as set forth in the fund’s prospectus, without paying an additional sales charge. The Board noted that, since the last Advisory Contract renewals in July 2004, Fidelity has taken a number of actions that benefited particular funds, including (i) voluntarily deciding in 2004 to stop using “soft” commission dollars to pay for market data and, instead, to pay for that data out of its own resources, (ii) contractually agreeing to impose management fee reductions and expense limitations on its five Spartan stock index funds and its stock index fund available through variable insurance products, (iii) contractually agreeing to eliminate the management fees on the Fidelity Freedom Funds and the Fidelity Advisor Freedom Funds, (iv) contractually agreeing to reduce the management fees on most of its investment-grade taxable bond funds, and (v) contractually agreeing to impose expense limitations on its retail and Spartan investment-grade taxable bond funds.
Investment Performance and Compliance. The Board considered whether the fund has operated within its investment objective, as well as its record of compliance with its investment restrictions. It also reviewed the fund’s absolute investment performance for each class, as well as the fund’s relative investment performance for each class measured against (i) a broad-based securities market index, and (ii) a peer group of mutual funds over multiple periods. The following charts considered by the Board show, over the one-, three-, and five-year periods ended December 31, 2004, the returns of Class C and Institutional Class of the fund, the returns of a broad-based securities market index (“benchmark”), and a range of returns of a peer group of mutual funds identified by Lipper Inc. as having an investment objective similar to that of the fund. The returns of Class C and Institutional Class represent the performance of classes with the highest and lowest 12b-1 fees, respectively (not necessarily with the highest and lowest total expenses). The box within each chart shows the 25th percentile return (bottom of box) and the 75th percentile return (top of box) of the Lipper peer group. Returns shown above the box are in the first quartile and returns shown below the box are in the fourth quartile. The percentage beaten numbers noted below each chart correspond to the percentile box and represent the percentage of funds in the Lipper peer group whose performance was equal to or lower than that of the class indicated.
49 Annual Report
Board Approval of Investment Advisory Contracts and Management Fees - continued

The Board reviewed the fund’s relative investment performance against its Lipper peer group and stated that the performance of Institutional Class of the fund was in the fourth quartile for the one-, three-, and five-year periods. The Board noted that FMR does not consider that Lipper peer group to be a meaningful comparison for the fund, however, because unlike most of its Lipper peers, the fund focuses its investments on securities of emerging market issuers. The Board also stated that the relative investment performance of the fund was lower than its benchmark over time. The Board considered that the variations in performance among the fund’s classes reflect the variations in class expenses, which result in lower performance for higher expense classes.
The Board has had thorough discussions with FMR throughout the year about the Board’s and FMR’s concerns about equity research, equity fund performance, and compliance with internal policies governing gifts and entertainment. FMR has taken steps that it believes will refocus and strengthen equity research and equity portfolio management and compliance. The Board noted with favor FMR’s recent reorganization of its senior management team and FMR’s plans to dedicate additional resources to investment research, and participated in the process that led to those changes.
Based on its review, and giving particular weight to the nature and quality of the resources dedicated by the Investment Advisers to maintain and improve relative performance, the Board concluded that the nature, extent, and quality of the services provided by Fidelity will benefit the fund’s shareholders, particularly in light of the Board’s view that the fund’s shareholders benefit from investing in a fund that is part of a large family of funds offering a variety of investment disciplines and services.
Competitiveness of Management Fee and Total Fund Expenses. The Board considered the fund’s management fee and total expenses compared to “mapped groups” of competitive funds and classes. Fidelity creates “mapped groups” by combining similar Lipper investment objective categories that have comparable management fee characteristics. Combining Lipper investment objective categories aids the Board’s management fee and total expense comparisons by broadening the competitive group used for comparison and by reducing the number of universes to which various Fidelity funds are compared.
The Board considered two proprietary management fee comparisons for the 12-month periods shown in the chart below. The group of Lipper funds used by the Board for management fee comparisons is referred to below as the “Total Mapped Group” and, for the reasons explained above, is broader than the Lipper peer group used by the Board for performance comparisons. The Total Mapped Group comparison focuses on a fund’s standing relative to the total universe of comparable funds available to investors, in terms of gross management fees before expense reimbursements or caps. “TMG %” represents the percentage of funds in the Total Mapped Group that had management fees that were lower than the fund’s. For example, a TMG % of 12% means that 88% of the funds in the Total Mapped Group had higher management fees than the fund. The “Asset-Size Peer Group” (ASPG) comparison focuses on a fund’s standing relative to non-Fidelity funds similar in size to the fund within the Total Mapped Group. The ASPG represents at least 15% of the funds in the Total Mapped Group with comparable asset size and management fee characteristics, subject to a minimum of 50 funds (or all funds in the Total Mapped Group if fewer than 50). Additional information, such as the ASPG quartile (“quadrant”) in which the fund’s management fee ranked, is also included in the chart and considered by the Board.
51 Annual Report
Board Approval of Investment Advisory Contracts and Management Fees - continued

The Board noted that the fund’s management fee ranked below the median of its Total Mapped Group and below the median of its ASPG for 2004.
Based on its review, the Board concluded that the fund’s management fee was fair and reasonable in light of the services that the fund receives and the other factors considered.
In its review of each class’s total expenses, the Board considered the fund’s management fee as well as other fund or class expenses, as applicable, such as transfer agent fees, pricing and bookkeeping fees, fund-paid 12b-1 fees, and custodial, legal, and audit fees. The Board also noted the effects of any waivers and reimbursements on fees and expenses. As part of its review, the Board also considered current and historical total expenses of each class of the fund compared to competitive fund median expenses. Each class of the fund is compared to those funds and classes in the Total Mapped Group (used by the Board for management fee comparisons) that have a similar sales load structure.
The Board noted that the total expenses of Class A ranked below its competitive median for 2004, the total expenses of each of Class B and Class C ranked equal to its competitive median for 2004, and the total expenses of each of Class T and Institutional Class ranked above its competitive median for 2004. The Board noted that the fund offers multiple classes, each of which has a different sales load and 12b-1 fee structure, and that the multiple structures are intended to offer a range of pricing options for the intermediary market. The Board also noted that the total expenses of the classes vary primarily by the level of their 12b-1 fees, although differences in transfer agent fees may also cause expenses to vary from class to class.
Furthermore, the Board considered that on December 16, 2004, it had approved changes (effective January 1, 2005) in the transfer agent and service agreements for the fund that established maximum transfer agent fees and eliminated the minimum pricing and bookkeeping fee to prevent small funds or funds with small average account sizes from having relatively high fees in basis points (the “small-fund fee reductions”). The Board considered that, if the small-fund fee reductions had been in effect in 2004, the total expenses of each of Class T and Institutional Class would have ranked below the median.
In its review of total expenses, the Board also considered Fidelity fee structures and other information on clients that FMR and its affiliates service in other competitive markets, such as other mutual funds advised or subadvised by FMR or its affiliates, pension plan clients, and other institutional clients.
Based on its review, the Board concluded that the total expenses for each class of the fund were reasonable, although in some cases above the median of the universe presented for comparison, in light of the services that the fund and its shareholders receive and the other factors considered.
Costs of the Services and Profitability. The Board considered the revenues earned and the expenses incurred by Fidelity in conducting the business of developing, marketing, distributing, managing, administering and servicing the fund and its shareholders. The Board also considered the level of Fidelity’s profits in respect of all the Fidelity funds.
On an annual basis, FMR presents to the Board Fidelity’s profitability for the fund. Fidelity calculates the profitability for each fund, as well as aggregate profitability for groups of Fidelity funds and all Fidelity funds, using a series of detailed revenue and cost allocation methodologies which originate with the audited books and records of Fidelity. The Audit Committee of the Board reviews any significant changes from the prior year’s methodologies.
PricewaterhouseCoopers LLP (PwC), independent registered accounting firm and auditor to Fidelity and certain Fidelity funds, has been engaged annually by the Board as part of the Board’s assessment of the results of Fidelity’s profitability analysis. PwC’s engagement includes the review and assessment of Fidelity’s methodologies used in determining the revenues and expenses attributable to Fidelity’s mutual fund business, and completion of agreed-upon procedures surrounding the mathematical accuracy of fund profitability and its conformity to allocation methodologies. After considering PwC’s reports issued under the engagement and information provided by Fidelity, the Board believes that while other allocation methods may also be reasonable, Fidelity’s profitability methodologies are reasonable in all material respects.
The Board has also reviewed Fidelity’s non-fund businesses and any fall-out benefits related to the mutual fund business as well as cases where Fidelity’s affiliates may
53 Annual Report
Board Approval of Investment Advisory Contracts and Management Fees - continued
benefit from or be related to the fund’s business. In addition, a special committee of the Board reviewed services provided to Fidelity by its affiliates and determined that the fees that Fidelity paid for such services were reasonable.
The Board considered the costs of the services provided by and the profits realized by Fidelity in connection with the operation of the fund and determined that the amount of profit is a fair entrepreneurial profit for the management of the fund.
Economies of Scale. The Board considered whether there have been economies of scale in respect of the management of the Fidelity funds, whether the Fidelity funds (including the fund) have appropriately benefited from any such economies of scale, and whether there is potential for realization of any further economies of scale. The Board considered the extent to which the fund will benefit from economies of scale through increased services to the fund, through waivers or reimbursements, or through fee or expense reductions, including reductions that occur through operation of the transfer agent agreement. The transfer agent fee varies in part based on the number of accounts in the fund. If the number of accounts decreases or the average account size increases, the overall transfer agent fee rate decreases.
The Board recognized that the fund’s management contract incorporates a “group fee” structure, which provides for lower fee rates as total fund assets under FMR’s management increase, and for higher fee rates as total fund assets under FMR’s management decrease. The Board considered that the group fee is designed to deliver the benefits of economies of scale to fund shareholders when total fund assets increase, even if assets of any particular fund are unchanged or have declined, because some portion of Fidelity’s costs are attributable to services provided to all Fidelity funds, and all funds benefit if those costs can be allocated among more assets. The Board concluded that, given the group fee structure, fund shareholders will achieve a certain level of economies of scale as assets under FMR’s management increase at the fund complex level, regardless of whether Fidelity achieves any such economies of scale.
The Board further concluded that any potential economies of scale are being shared between fund shareholders and Fidelity in an appropriate manner.
Additional Information Requested by the Board. In order to develop fully the factual basis for consideration of the Advisory Contracts, the Board requested additional information regarding (i) equity fund transfer agency fees; (ii) Fidelity’s fund profitability methodology and the impact of various changes in the methodology over time; (iii) benefits to shareholders from economies of scale; (iv) composition and characteristics of various fund and industry data used in comparisons; and (v) compensation of portfolio managers and research analysts.
Based on its evaluation of all of the conclusions noted above, and after considering all material factors, the Board ultimately concluded that the existing advisory fee structures
are fair and reasonable, and that the fund’s existing Advisory Contracts should be renewed.
55 Annual Report
Investment Adviser
Fidelity Management & Research Company
Boston, MA
Investment Sub-Advisers
FMR Co., Inc.
Fidelity Management & Research
(U.K.) Inc.
Fidelity Management & Research
(Far East) Inc.
Fidelity International
Investment Advisors
Fidelity Investments Japan Limited
Fidelity International Investment
Advisors (U.K.) Limited
General Distributor
Fidelity Distributors Corporation
Boston, MA
Transfer and Service Agents
Fidelity Investments Institutional
Operations Company, Inc.
Boston, MA
Fidelity Service Company, Inc.
Boston, MA
Custodian
Brown Brothers Harriman & Co.
Boston, MA
|


Fidelity® Advisor
Emerging Markets
Fund - Class A, Class T, Class B and Class C
Annual Report October 31, 2005

| Contents | | | | |
| |
| Chairman’s Message | | 4 | | Ned Johnson’s message to shareholders. |
| Performance | | 6 | | How the fund has done over time. |
| Management’s Discussion | | 8 | | The manager’s review of fund |
| | | | | performance, strategy and outlook. |
| Shareholder Expense | | 9 | | An example of shareholder expenses. |
| Example | | | | |
| Investment Changes | | 11 | | A summary of major shifts in the fund’s |
| | | | | investments over the past six months. |
| Investments | | 12 | | A complete list of the fund’s investments |
| | | | | with their market values. |
| Financial Statements | | 20 | | Statements of assets and liabilities, |
| | | | | operations, and changes in net assets, |
| | | | | as well as financial highlights. |
| Notes | | 29 | | Notes to the financial statements. |
| Report of Independent | | 37 | | |
| Registered Public | | | | |
| Accounting Firm | | | | |
| Trustees and Officers | | 39 | | |
| Board Approval of | | 49 | | |
| Investment Advisory | | | | |
| Contracts and | | | | |
| Management Fees | | | | |
To view a fund’s proxy voting guidelines and proxy voting record for the 12-month period ended June 30, visit www.fidelity.com/proxyvotingresults or visit the Securities and Exchange Commission’s (SEC) web site at www.sec.gov. You may also call 1-877-208-0098 to request a free copy of the proxy voting guidelines.
Standard & Poor’s, S&P and S&P 500 are registered service marks of The McGraw-Hill Companies, Inc. and have been licensed for use by Fidelity Distributors Corporation.
Other third party marks appearing herein are the property of their respective owners.
All other marks appearing herein are registered or unregistered trademarks or service marks of FMR Corp. or an affiliated company.
This report and the financial statements contained herein are submitted for the general information of the shareholders of the fund. This report is not authorized for distribution to prospective investors in the fund unless preceded or accompanied by an effective prospectus.
A fund files its complete schedule of portfolio holdings with the SEC for the first and third quarters of each fiscal year on Form N-Q. Forms N-Q are available on the SEC’s web site at http://www.sec.gov. A fund’s Forms N-Q may be reviewed and copied at the SEC’s Public Reference Room in Washington, DC. Information regarding the operation of the SEC’s Public Reference Room may be obtained by calling 1-800-SEC-0330. For a complete list of a fund’s portfolio holdings, view the most recent quarterly holdings report, semiannual report, or annual report on Fidelity’s web site at http://www.advisor.fidelity.com.
NOT FDIC INSURED · MAY LOSE VALUE · NO BANK GUARANTEE
Neither the fund nor Fidelity Distributors Corporation is a bank.
3 Annual Report
Chairman’s Message
(Photograph of Edward C. Johnson 3d)
Dear Shareholder:
During the past year or so, much has been reported about the mutual fund industry, and much of it has been more critical than I believe is warranted. Allegations that some companies have been less than forthright with their shareholders have cast a shadow on the entire industry. I continue to find these reports disturbing, and assert that they do not create an accurate picture of the industry overall. Therefore, I would like to remind everyone where Fidelity stands on these issues. I will say two things specifically regarding allegations that some mutual fund companies were in violation of the Securities and Exchange Commission’s forward pricing rules or were involved in so-called “market timing” activities.
First, Fidelity has no agreements that permit customers who buy fund shares after 4 p.m. to obtain the 4 p.m. price. This is not a new policy. This is not to say that someone could not deceive the company through fraudulent acts. However, we are extremely diligent in preventing fraud from occurring in this manner — and in every other. But I underscore again that Fidelity has no so-called “agreements” that sanction illegal practices.
Second, Fidelity continues to stand on record, as we have for years, in opposition to predatory short-term trading that adversely affects shareholders in a mutual fund. Back in the 1980s, we initiated a fee — which is returned to the fund and, therefore, to investors — to discourage this activity. Further, we took the lead several years ago in developing a Fair Value Pricing Policy to prevent market timing on foreign securities in our funds. I am confident we will find other ways to make it more difficult for predatory traders to operate. However, this will only be achieved through close cooperation among regulators, legislators and the industry.
Yes, there have been unfortunate instances of unethical and illegal activity within the mutual fund industry from time to time. That is true of any industry. When this occurs, confessed or convicted offenders should be dealt with appropriately. But we are still concerned about the risk of over-regulation and the quick application of simplistic solutions to intricate problems. Every system can be improved, and we support and applaud well thought out improvements by regulators, legislators and industry representatives that achieve the common goal of building and protecting the value of investors’ holdings.
For nearly 60 years, Fidelity has worked very hard to improve its products and service to justify your trust. When our family founded this company in 1946, we had only a few hundred customers. Today, we serve more than 18 million customers including individual investors and participants in retirement plans across America.
Annual Report 4
Let me close by saying that we do not take your trust in us for granted, and we realize that we must always work to improve all aspects of our service to you. In turn, we urge you to continue your active participation with your financial matters, so that your interests can be well served.
Best regards,
/s/Edward C. Johnson 3d
5 Annual Report
Performance: The Bottom Line
Average annual total return reflects the change in the value of an investment, assuming reinvestment of the class’ dividend income and capital gains (the profits earned upon the sale of securities that have grown in value) and assuming a constant rate of performance each year. The $10,000 table and the fund’s returns do not reflect the deduction of taxes that a shareholder would pay on fund distributions or the redemption of fund shares. During periods of reimbursement by Fidelity, a fund’s total return will be greater than it would be had the reimbursement not occurred. How a fund did yesterday is no guarantee of how it will do tomorrow.
| Average Annual Total Returns | | | | |
| Periods ended October 31, 2005 | | Past 1 | | Life of |
| | | year | | FundA |
| Fidelity Advisor Emerging Markets | | | | |
| Class A (incl. 5.75% sales charge) | | 31.30% | | 17.68% |
| Class T (incl. 3.50% sales charge) | | 33.98% | | 19.11% |
| Class B (incl. contingent deferred sales charge)B | | 33.15% | | 18.94% |
| Class C (incl. contingent deferred sales charge)C | | 37.25% | | 21.25% |
A From March 29, 2004.
B Class B shares’ contingent deferred sales charges included in the past one year and life of fund
total return figures are 5% and 4%, respectively.
|
C Class C shares’ contingent deferred sales charge included in the past one year and life of fund total return figures are 1% and 0%, respectively.
| | $10,000 Over Life of Fund
|
Let’s say hypothetically that $10,000 was invested in Fidelity® Advisor Emerging Markets Fund — Class T on March 29, 2004, when the fund started, and the current 3.50% sales charge was paid. The chart shows how the value of your investment would have changed, and also shows how the Morgan Stanley Capital InternationalSM Emerging Markets Index performed over the same period.

Management’s Discussion of Fund Performance
Comments from Robert von Rekowsky, Portfolio Manager of Fidelity® Advisor Emerging Markets Fund
Emerging-markets stocks posted strong gains for the year ending October 31, 2005, as the Morgan Stanley Capital InternationalSM Emerging Markets Index soared 34.34% . The lofty return was largely driven by the skyrocketing prices of oil and other commodities. Many emerging markets are commodity exporters — particularly in Latin America — which helped the economies and fiscal health of these countries. As such, the Latin American region generally outperformed other emerging markets. Still, neither of the top two performers were in the Western Hemisphere. Egypt and Jordan topped the index, despite making up less than 1.00% of the index combined on average during the period. Stocks in the Far East posted strong absolute returns, but mostly trailed other emerging markets because they are primarily exporters of technology, which saw diminished demand. South Korea, the largest component of the index during the past year, rose more than 46%. However, Taiwan, the second-largest constituent, was a significant drag, gaining only 4%. Brazil, the largest Latin American component, was up more than 75%.
During the past year, the fund’s Class A, Class T, Class B and Class C shares gained 39.31%, 38.84%, 38.15% and 38.25%, respectively, outpacing the MSCIr Emerging Markets index and the LipperSM Emerging Markets Funds Average, which returned 32.14% . Despite increasing oil prices, concerns about rising U.S. interest rates and uncertainty regarding global growth, emerging-markets equities performed quite well. Good stock picking and the resulting country weightings fueled the fund’s outperformance versus the index. In terms of individual holdings, Samsung Electronics — by far the largest position in the fund — was a strong contributor in absolute terms. Samsung is the low-cost leader in most of its businesses and has made great strides in building its brand name. America Movil, a mobile phone company headquartered in Mexico, was another contributor — both on an absolute basis and relative to the index. The company benefited from subscriber additions in South and Central America, where mobile phone penetration was low. Egyptian mobile phone company Orascom Telecom, and Brazilian bank Banco Bradesco, also boosted returns. On a less favorable note, profitability concerns hurt Harmony Gold, a South African mining company. China International Marine Containers — the world’s largest manufacturer of shipping containers — was another notable detractor. Investor concerns about weakening global shipping demand put pressure on its shares.
The views expressed in this statement reflect those of the portfolio manager only through the end of the period of the report as stated on the cover and do not necessarily represent the views of Fidelity or any other person in the Fidelity organization. Any such views are subject to change at any time based upon market or other conditions and Fidelity disclaims any responsibility to update such views. These views may not be relied on as investment advice and, because investment decisions for a Fidelity fund are based on numerous factors, may not be relied on as an indication of trading intent on behalf of any Fidelity fund.
Shareholder Expense Example
As a shareholder of the Fund, you incur two types of costs: (1) transaction costs, including sales charges (loads) on purchase payments or redemption proceeds, redemption fees, and (2) ongoing costs, including management fees, distribution and/or service (12b-1) fees and other Fund expenses. This Example is intended to help you understand your ongoing costs (in dollars) of investing in the Fund and to compare these costs with the ongoing costs of investing in other mutual funds.
The Example is based on an investment of $1,000 invested at the beginning of the period and held for the entire period (May 1, 2005 to October 31, 2005).
The first line of the table below for each class of the Fund provides information about actual account values and actual expenses. You may use the information in this line, together with the amount you invested, to estimate the expenses that you paid over the period. Simply divide your account value by $1,000.00 (for example, an $8,600 account value divided by $1,000.00 = 8.6), then multiply the result by the number in the first line for a class of the Fund under the heading entitled “Expenses Paid During Period” to estimate the expenses you paid on your account during this period.
Hypothetical Example for Comparison Purposes
The second line of the table below for each class of the Fund provides information about hypothetical account values and hypothetical expenses based on a Class’ actual expense ratio and an assumed rate of return of 5% per year before expenses, which is not the Class’ actual return. The hypothetical account values and expenses may not be used to estimate the actual ending account balance or expenses you paid for the period. You may use this information to compare the ongoing costs of investing in the Fund and other funds. To do so, compare this 5% hypothetical example with the 5% hypothetical examples that appear in the shareholder reports of the other funds.
Please note that the expenses shown in the table are meant to highlight your ongoing costs only and do not reflect any transaction costs. Therefore, the second line of the table is useful in comparing ongoing costs only, and will not help you determine the relative total costs of owning different funds. In addition, if these transactional costs were included, your costs would have been higher.
| | | | | | | | | | | | | Expenses Paid |
| | | | | Beginning | | | | Ending | | | | During Period* |
| | | | | Account Value | | | | Account Value | | | | May 1, 2005 |
| | | | | May 1, 2005 | | | | October 31, 2005 | | to October 31, 2005 |
| Class A | | | | | | | | | | | | |
| Actual | | $ | | 1,000.00 | | $ | | 1,212.50 | | $ | | 8.92 |
| HypotheticalA | | $ | | 1,000.00 | | $ | | 1,017.14 | | $ | | 8.13 |
| Class T | | | | | | | | | | | | |
| Actual | | $ | | 1,000.00 | | $ | | 1,210.40 | | $ | | 10.31 |
| HypotheticalA | | $ | | 1,000.00 | | $ | | 1,015.88 | | $ | | 9.40 |
| Class B | | | | | | | | | | | | |
| Actual | | $ | | 1,000.00 | | $ | | 1,207.10 | | $ | | 13.07 |
| HypotheticalA | | $ | | 1,000.00 | | $ | | 1,013.36 | | $ | | 11.93 |
9 Annual Report
| Shareholder Expense Example - continued | | | | |
| |
| |
| | | | | | | | | | | | | Expenses Paid |
| | | | | Beginning | | | | Ending | | | | During Period* |
| | | | | Account Value | | | | Account Value | | | | May 1, 2005 |
| | | | | May 1, 2005 | | | | October 31, 2005 | | to October 31, 2005 |
| Class C | | | | | | | | | | | | |
| Actual | | $ | | 1,000.00 | | $ | | 1,208.00 | | $ | | 13.08 |
| HypotheticalA | | $ | | 1,000.00 | | $ | | 1,013.36 | | $ | | 11.93 |
| Institutional Class | | | | | | | | | | | | |
| Actual | | $ | | 1,000.00 | | $ | | 1,213.70 | | $ | | 7.53 |
| HypotheticalA | | $ | | 1,000.00 | | $ | | 1,018.40 | | $ | | 6.87 |
| |
| A 5% return per year before expenses | | | | | | | | |
* Expenses are equal to each Class’ annualized expense ratio (shown in the table below); multiplied by the average account value over the period, multiplied by 184/365 (to reflect the one-half year period).
| | | Annualized |
| | | Expense Ratio |
| Class A | | 1.60% |
| Class T | | 1.85% |
| Class B | | 2.35% |
| Class C | | 2.35% |
| Institutional Class | | 1.35% |
Investment Changes
| Top Five Stocks as of October 31, 2005 | | | | |
| | | % of fund’s | | % of fund’s net assets |
| | | net assets | | 6 months ago |
| Samsung Electronics Co. Ltd. (Korea (South), | | | | |
| Semiconductors & Semiconductor Equipment) | | 5.6 | | 6.6 |
| America Movil SA de CV Series L sponsored | | | | |
| ADR (Mexico, Wireless Telecommunication | | | | |
| Services) | | 3.1 | | 2.4 |
| Lukoil Oil Co. sponsored ADR (Russia, Oil, Gas | | | | |
| & Consumable Fuels) | | 2.8 | | 1.5 |
| Petroleo Brasileiro SA Petrobas (Brazil, Oil, Gas | | | | |
| & Consumable Fuels) | | 2.5 | | 1.9 |
| China Mobile (Hong Kong) Ltd. (Hong Kong, | | | | |
| Wireless Telecommunication Services) | | 1.9 | | 0.0 |
| | | 15.9 | | |
| Top Five Market Sectors as of October 31, 2005 | | |
| | | % of fund’s | | % of fund’s net assets |
| | | net assets | | 6 months ago |
| Financials | | 20.2 | | 19.9 |
| Information Technology | | 17.1 | | 16.0 |
| Energy | | 14.3 | | 10.7 |
| Telecommunication Services | | 11.0 | | 11.0 |
| Materials | | 10.5 | | 10.3 |
| Top Five Countries as of October 31, 2005 | | |
| (excluding cash equivalents) | | % of fund’s | | % of fund’s net assets |
| | | net assets | | 6 months ago |
| Korea (South) | | 21.9 | | 23.2 |
| Brazil | | 13.5 | | 9.1 |
| South Africa | | 9.8 | | 11.4 |
| Taiwan | | 8.8 | | 8.9 |
| Russia | | 7.2 | | 5.3 |
| Percentages are adjusted for the effect of open futures contracts, if applicable. | | |
11 Annual Report
| Investments October 31, 2005 | | | | | | |
| Showing Percentage of Net Assets | | | | | | |
| |
| Common Stocks — 96.8% | | | | | | |
| | | Shares | | Value (Note 1) |
| |
| Argentina – 0.3% | | | | | | |
| Inversiones y Representaciones SA sponsored GDR (a) | | 5,600 | | $ | | 64,792 |
| Nortel Inversora SA (PN-B) sponsored ADR (a) | | 2,000 | | | | 20,020 |
| TOTAL ARGENTINA | | | | | | 84,812 |
| |
| Austria – 0.7% | | | | | | |
| Raiffeisen International Bank Holding AG | | 3,300 | | | | 207,683 |
| Bermuda – 0.8% | | | | | | |
| Aquarius Platinum Ltd. (Australia) | | 10,500 | | | | 78,514 |
| Central European Media Enterprises Ltd. Class A (a) | | 2,800 | | | | 130,172 |
| Sinochem Hong Kong Holding Ltd. (a) | | 195,200 | | | | 31,475 |
| TOTAL BERMUDA | | | | | | 240,161 |
| |
| Brazil – 13.5% | | | | | | |
| AES Tiete SA (PN) | | 4,793,600 | | | | 105,375 |
| Banco Bradesco SA: | | | | | | |
| (PN) | | 9,000 | | | | 463,229 |
| (PN) sponsored ADR (non-vtg.) | | 1,100 | | | | 57,079 |
| Banco Itau Holding Financeira SA (PN) | | 14,470 | | | | 345,139 |
| Banco Nossa Caixa SA | | 700 | | | | 11,595 |
| Companhia Energetica de Minas Gerais (CEMIG) (PN) | | | | | | |
| sponsored ADR (non-vtg.) | | 6,200 | | | | 225,680 |
| Companhia Vale do Rio Doce: | | | | | | |
| (PN-A) sponsored ADR (non-vtg.) (a) | | 14,500 | | | | 535,050 |
| sponsored ADR (non-vtg.) | | 4,900 | | | | 202,517 |
| Diagnosticos da America SA | | 6,200 | | | | 101,048 |
| Itausa Investimentos Itau SA (PN) | | 42,800 | | | | 128,107 |
| Lojas Renner SA | | 4,500 | | | | 119,904 |
| Natura Cosmeticos SA | | 2,200 | | | | 88,897 |
| NET Servicos de Communicacao SA sponsored ADR | | 23,900 | | | | 95,839 |
| Petroleo Brasileiro SA Petrobras: | | | | | | |
| (PN) | | 25,900 | | | | 368,061 |
| (PN) sponsored ADR (non-vtg.) | | 6,300 | | | | 361,431 |
| sponsored ADR (non-vtg.) | | 4,800 | | | | 306,720 |
| Telesp Celular Participacoes SA (PN) (a) | | 4,800 | | | | 16,861 |
| Uniao de Bancos Brasileiros SA (Unibanco): | | | | | | |
| unit | | 9,600 | | | | 100,698 |
| GDR | | 2,500 | | | | 130,750 |
| Usinas Siderurgicas de Minas Gerais SA (Usiminas) (PN-A) | | 6,400 | | | | 129,035 |
| TOTAL BRAZIL | | | | | | 3,893,015 |
| |
| British Virgin Islands – 0.1% | | | | | | |
| Titanium Resources Group Ltd. | | 22,300 | | | | 21,517 |
See accompanying notes which are an integral part of the financial statements.
| Common Stocks – continued | | | | | | |
| | | Shares | | Value (Note 1) |
| |
| Cayman Islands – 0.5% | | | | | | |
| Foxconn International Holdings Ltd. | | 131,000 | | $ | | 140,259 |
| China – 2.2% | | | | | | |
| Anhui Expressway Co. Ltd. (H Shares) | | 60,000 | | | | 30,379 |
| Beijing Capital International Airport Co. Ltd. (H Shares) | | 92,000 | | | | 37,087 |
| China Construction Bank Corp. (H Shares) | | 373,300 | | | | 113,164 |
| China International Marine Containers Co. Ltd. (B Shares) | | 54,200 | | | | 45,096 |
| China Petroleum & Chemical Corp. (H Shares) | | 550,800 | | | | 221,697 |
| China Shenhua Energy Co. Ltd. (H Shares) | | 80,400 | | | | 88,157 |
| Xinao Gas Holdings Ltd. | | 122,000 | | | | 92,852 |
| TOTAL CHINA | | | | | | 628,432 |
| |
| Czech Republic – 0.6% | | | | | | |
| Ceske Energeticke Zavody AS | | 6,800 | | | | 178,514 |
| Egypt – 1.6% | | | | | | |
| Commercial International Bank Ltd. sponsored GDR | | 7,200 | | | | 67,680 |
| Eastern Tobacco Co. | | 2,400 | | | | 95,475 |
| Misr International Bank Sae GDR | | 3,550 | | | | 13,313 |
| Orascom Construction Industries SAE GDR | | 1,720 | | | | 118,164 |
| Orascom Telecom SAE GDR | | 3,192 | | | | 156,568 |
| TOTAL EGYPT | | | | | | 451,200 |
| |
| Hong Kong – 2.9% | | | | | | |
| Chaoda Modern Agriculture (Holdings) Ltd. | | 240,700 | | | | 90,820 |
| China Mobile (Hong Kong) Ltd. | | 121,700 | | | | 546,433 |
| China Overseas Land & Investment Ltd. | | 269,700 | | | | 82,628 |
| Kerry Properties Ltd. | | 44,000 | | | | 110,112 |
| TOTAL HONG KONG | | | | | | 829,993 |
| |
| Hungary – 0.8% | | | | | | |
| OTP Bank Rt. | | 6,700 | | | | 239,503 |
| India – 3.0% | | | | | | |
| Apollo Hospitals Enterprise Ltd. GDR (a)(c) | | 2,500 | | | | 23,868 |
| Bharat Forge Ltd. | | 5,717 | | | | 40,832 |
| Bharti Televentures Ltd. (a) | | 6,191 | | | | 44,489 |
| Crompton Greaves Ltd. | | 4,835 | | | | 66,019 |
| Gujarat Ambuja Cement Ltd. | | 37,659 | | | | 58,030 |
| Jaiprakash Associates Ltd. | | 6,078 | | | | 37,726 |
| Larsen & Toubro Ltd. | | 3,375 | | | | 104,743 |
| Oil & Natural Gas Corp. Ltd. | | 6,585 | | | | 135,740 |
| Reliance Industries Ltd. | | 12,599 | | | | 213,152 |
See accompanying notes which are an integral part of the financial statements.
13 Annual Report
| Investments - continued | | | | | | |
| |
| |
| Common Stocks – continued | | | | | | |
| | | Shares | | Value (Note 1) |
| |
| India – continued | | | | | | |
| State Bank of India | | 6,649 | | $ | | 137,881 |
| Suzlon Energy Ltd. (a) | | 300 | | | | 4,757 |
| TOTAL INDIA | | | | | | 867,237 |
| |
| Indonesia – 0.7% | | | | | | |
| PT Aneka Tambang Tbk | | 330,000 | | | | 83,947 |
| PT Bank Central Asia Tbk | | 360,800 | | | | 114,950 |
| TOTAL INDONESIA | | | | | | 198,897 |
| |
| Israel – 4.5% | | | | | | |
| Bank Hapoalim BM (Reg.) | | 36,528 | | | | 139,907 |
| ECI Telecom Ltd. (a) | | 5,300 | | | | 40,280 |
| Israel Chemicals Ltd. | | 40,800 | | | | 154,863 |
| Ituran Location & Control Ltd. | | 3,300 | | | | 42,900 |
| M-Systems Flash Disk Pioneers Ltd. (a) | | 4,000 | | | | 126,760 |
| Nice Systems Ltd. sponsored ADR (a) | | 1,600 | | | | 69,872 |
| Orckit Communications Ltd. (a) | | 7,800 | | | | 166,842 |
| Partner Communications Co. Ltd. ADR | | 9,300 | | | | 75,702 |
| RADWARE Ltd. (a) | | 4,300 | | | | 79,163 |
| Teva Pharmaceutical Industries Ltd. sponsored ADR | | 10,800 | | | | 411,696 |
| TOTAL ISRAEL | | | | | | 1,307,985 |
| |
| Korea (South) – 21.6% | | | | | | |
| Asiana Airlines, Inc. (a) | | 9,318 | | | | 39,137 |
| CJ Home Shopping | | 1,199 | | | | 106,233 |
| Core Logic, Inc. | | 1,400 | | | | 49,013 |
| Daegu Bank Co. Ltd. | | 16,870 | | | | 201,180 |
| Daelim Industrial Co. | | 3,220 | | | | 187,525 |
| Daewoo Shipbuilding & Marine Engineering Co. Ltd. | | 9,370 | | | | 186,682 |
| Dongbu Insurance Co. Ltd. | | 7,070 | | | | 88,375 |
| Hanil Cement Co. Ltd. | | 1,530 | | | | 99,362 |
| Hanwha Corp. | | 3,770 | | | | 70,417 |
| Hynix Semiconductor, Inc. (a) | | 2,430 | | | | 44,341 |
| Hyundai Department Store Co. Ltd. | | 1,850 | | | | 122,802 |
| Hyundai Heavy Industries Co. Ltd. | | 830 | | | | 53,982 |
| Hyundai Mipo Dockyard Co. Ltd. | | 1,970 | | | | 121,710 |
| Hyundai Motor Co. | | 5,940 | | | | 435,827 |
| Hyundai Securities Co. Ltd. (a) | | 9,580 | | | | 88,184 |
| Industrial Bank of Korea | | 10,590 | | | | 125,782 |
| Kia Motors Corp. | | 8,190 | | | | 147,090 |
| Korea Exchange Bank (a) | | 3,390 | | | | 37,342 |
| Korea Gas Corp. | | 3,700 | | | | 127,586 |
| Korea Investment Holdings Co. Ltd. | | 4,300 | | | | 110,383 |
See accompanying notes which are an integral part of the financial statements.
| Common Stocks – continued | | | | | | |
| | | Shares | | Value (Note 1) |
| |
| Korea (South) – continued | | | | | | |
| Korean Air Co. Ltd. | | 3,060 | | $ | | 57,155 |
| Kumho Tire Co., Inc. | | 1,820 | | | | 26,934 |
| Kyeryong Construction Industrial Co. Ltd. | | 2,370 | | | | 58,228 |
| LG Electronics, Inc. | | 3,120 | | | | 202,322 |
| LG Engineering & Construction Co. Ltd. | | 4,210 | | | | 180,457 |
| MegaStudy Co. Ltd. | | 1,979 | | | | 78,383 |
| NHN Corp. (a) | | 914 | | | | 151,896 |
| POSCO | | 1,170 | | | | 237,026 |
| Pusan Bank | | 8,280 | | | | 86,052 |
| Pyung Hwa Industrial Co. Ltd. | | 12,167 | | | | 75,869 |
| Samchully Co. Ltd. | | 1,000 | | | | 108,238 |
| Samsung Electronics Co. Ltd. | | 3,076 | | | | 1,626,384 |
| Samsung Heavy Industries Ltd. | | 10,390 | | | | 131,865 |
| Shinhan Financial Group Co. Ltd. | | 7,200 | | | | 240,000 |
| SK Corp. | | 4,440 | | | | 227,529 |
| Ssangyong Motor Co. (a) | | 9,500 | | | | 73,889 |
| Woongjin Coway Co. Ltd. | | 2,200 | | | | 37,931 |
| Wooree Lighting Co. Ltd. | | 13,100 | | | | 69,139 |
| Woori Finance Holdings Co. Ltd. | | 8,610 | | | | 132,366 |
| TOTAL KOREA (SOUTH) | | | | | | 6,244,616 |
| |
| Lebanon – 0.2% | | | | | | |
| Solidere GDR (a) | | 4,600 | | | | 64,400 |
| Luxembourg – 1.1% | | | | | | |
| Evraz Group SA GDR | | 4,300 | | | | 73,100 |
| Orco Property Group | | 1,000 | | | | 63,654 |
| Tenaris SA sponsored ADR | | 1,700 | | | | 186,745 |
| TOTAL LUXEMBOURG | | | | | | 323,499 |
| |
| Mexico – 7.2% | | | | | | |
| America Movil SA de CV Series L sponsored ADR | | 34,000 | | | | 892,500 |
| Cemex SA de CV sponsored ADR | | 8,400 | | | | 437,388 |
| Grupo Financiero Banorte SA de CV Series O | | 13,189 | | | | 112,448 |
| Grupo Mexico SA de CV Series B | | 88,849 | | | | 171,421 |
| Sare Holding SA de CV Series B (a) | | 39,200 | | | | 40,341 |
| Urbi, Desarrollos Urbanos, SA de CV (a) | | 23,800 | | | | 152,253 |
| Wal-Mart de Mexico SA de CV Series V | | 54,852 | | | | 267,852 |
| TOTAL MEXICO | | | | | | 2,074,203 |
| |
| Oman – 0.2% | | | | | | |
| BankMuscat SAOG sponsored GDR (a)(c) | | 2,500 | | | | 62,500 |
See accompanying notes which are an integral part of the financial statements.
15 Annual Report
| Investments - continued | | | | | | |
| |
| |
| Common Stocks – continued | | | | | | |
| | | Shares | | Value (Note 1) |
| |
| Philippines – 0.5% | | | | | | |
| Philippine Long Distance Telephone Co. | | 4,990 | | $ | | 152,190 |
| Poland – 0.3% | | | | | | |
| Globe Trade Centre SA (a) | | 1,100 | | | | 46,580 |
| Grupa Lotos SA | | 3,900 | | | | 47,775 |
| TOTAL POLAND | | | | | | 94,355 |
| |
| Russia – 7.2% | | | | | | |
| Lukoil Oil Co. sponsored ADR | | 14,638 | | | | 817,532 |
| Mobile TeleSystems OJSC sponsored ADR | | 5,400 | | | | 199,746 |
| Novatek JSC GDR (a)(c) | | 6,300 | | | | 141,624 |
| OAO Gazprom sponsored ADR | | 4,634 | | | | 276,882 |
| RBC Information Systems Jsc (a) | | 6,100 | | | | 33,123 |
| Sberbank RF GDR (a) | | 1,500 | | | | 133,394 |
| Seventh Continent (a) | | 3,300 | | | | 70,125 |
| Sibneft sponsored ADR (a) | | 2,288 | | | | 41,184 |
| Sistema JSFC sponsored: | | | | | | |
| GDR (c) | | 3,900 | | | | 87,360 |
| GDR | | 5,000 | | | | 112,000 |
| Vimpel Communications sponsored ADR (a) | | 2,800 | | | | 112,000 |
| VSMPO-Avisma Corp. (a) | | 400 | | | | 62,600 |
| TOTAL RUSSIA | | | | | | 2,087,570 |
| |
| Singapore – 0.2% | | | | | | |
| Boustead Singapore Ltd. | | 92,000 | | | | 52,142 |
| South Africa – 9.8% | | | | | | |
| Absa Group Ltd. | | 8,710 | | | | 115,528 |
| Aflease Gold & Uranium Resources Ltd. (a) | | 36,213 | | | | 26,175 |
| African Bank Investments Ltd. | | 66,347 | | | | 197,854 |
| Aspen Pharmacare Holdings PLC | | 6,000 | | | | 27,720 |
| Aveng Ltd. | | 31,888 | | | | 80,076 |
| Edgars Consolidated Stores Ltd. | | 37,630 | | | | 167,120 |
| Foschini Ltd. | | 11,100 | | | | 70,719 |
| Impala Platinum Holdings Ltd. | | 2,008 | | | | 219,967 |
| JD Group Ltd. | | 13,800 | | | | 147,563 |
| Lewis Group Ltd. | | 8,422 | | | | 50,394 |
| Massmart Holdings Ltd. | | 9,100 | | | | 70,250 |
| MTN Group Ltd. | | 56,300 | | | | 419,523 |
| Naspers Ltd. Class N sponsored ADR | | 11,100 | | | | 161,394 |
| Sasol Ltd. | | 15,170 | | | | 479,291 |
| Standard Bank Group Ltd. | | 30,900 | | | | 318,671 |
| Steinhoff International Holdings Ltd. | | 50,900 | | | | 133,205 |
See accompanying notes which are an integral part of the financial statements.
| Common Stocks – continued | | | | | | |
| | | Shares | | Value (Note 1) |
| |
| South Africa – continued | | | | | | |
| Sun International Ltd. | | 5,500 | | $ | | 62,295 |
| Telkom SA Ltd. | | 3,996 | | | | 75,483 |
| TOTAL SOUTH AFRICA | | | | | | 2,823,228 |
| |
| Taiwan – 8.8% | | | | | | |
| Acer, Inc. | | 67,460 | | | | 136,522 |
| ASUSTeK Computer, Inc. | | 20,000 | | | | 52,337 |
| China Motor Co. Ltd. | | 42,340 | | | | 39,562 |
| Chinatrust Financial Holding Co. Ltd. | | 187,962 | | | | 145,937 |
| Chipbond Technology Corp. | | 90,710 | | | | 117,607 |
| Compal Electronics, Inc. | | 131,000 | | | | 115,572 |
| Delta Electronics, Inc. | | 62,984 | | | | 106,064 |
| Far EasTone Telecommunications Co. Ltd. | | 108,100 | | | | 125,655 |
| First Financial Holding Co. Ltd. | | 137,900 | | | | 92,477 |
| High Tech Computer Corp. | | 18,200 | | | | 193,112 |
| Hon Hai Precision Industry Co. Ltd. (Foxconn) | | 85,010 | | | | 367,389 |
| MediaTek, Inc. | | 20,900 | | | | 180,336 |
| Motech Industries, Inc. | | 3,185 | | | | 34,744 |
| Novatek Microelectronics Corp. | | 34,754 | | | | 151,751 |
| Siliconware Precision Industries Co. Ltd. | | 145,000 | | | | 130,084 |
| Taiwan Semiconductor Manufacturing Co. Ltd. | | 279,631 | | | | 433,388 |
| United Microelectronics Corp. | | 198,291 | | | | 105,199 |
| XAC Automation Corp. | | 7,350 | | | | 5,729 |
| TOTAL TAIWAN | | | | | | 2,533,465 |
| |
| Thailand – 1.0% | | | | | | |
| Minor International PCL (For. Reg.) | | 72,100 | | | | 9,901 |
| Siam Cement PCL (For. Reg.) | | 29,200 | | | | 164,689 |
| Siam Commercial Bank PCL (For. Reg.) | | 109,000 | | | | 126,294 |
| TOTAL THAILAND | | | | | | 300,884 |
| |
| Turkey – 4.4% | | | | | | |
| Acibadem Saglik Hizmetleri AS | | 9,000 | | | | 59,933 |
| Akbank T. A. S. | | 35,400 | | | | 220,022 |
| Alarko Gayrimenkul Yatirim Ortakligi AS (a) | | 1,800 | | | | 82,575 |
| Arcelik AS | | 8,600 | | | | 51,225 |
| Aygaz AS | | 11,000 | | | | 31,905 |
| Boyner Buyuk Magazacilik AS (a) | | 12,600 | | | | 35,987 |
| Denizbank AS | | 13,800 | | | | 77,092 |
| Dogan Yayin Holding AS | | 39,312 | | | | 99,480 |
| Dogus Otomotiv Servis ve Ticaret AS | | 9,400 | | | | 34,359 |
| Enka Insaat ve Sanayi AS | | 6,500 | | | | 71,661 |
| Eregli Demir ve Celik Fabrikalari TAS | | 2,000 | | | | 10,803 |
See accompanying notes which are an integral part of the financial statements.
17 Annual Report
| Investments - continued | | | | | | |
| |
| |
| Common Stocks – continued | | | | | | |
| | | Shares | | Value (Note 1) |
| |
| Turkey – continued | | | | | | |
| Finansbank AS | | 52,076 | | $ | | 157,981 |
| Tupras-Turkiye Petrol Rafinerileri AS | | 6,800 | | | | 116,226 |
| Turk Traktor ve Ziraat Makinalari AS | | 7,800 | | | | 41,265 |
| Turkiye Is Bankasi AS Series C unit | | 18,998 | | | | 131,433 |
| Yapi ve Kredi Bankasi AS (a) | | 16,864 | | | | 62,889 |
| TOTAL TURKEY | | | | | | 1,284,836 |
| |
| Ukraine – 0.3% | | | | | | |
| Stirol sponsored ADR (a) | | 480 | | | | 62,143 |
| Ukrnafta Open JSC sponsored ADR (a) | | 185 | | | | 39,109 |
| TOTAL UKRAINE | | | | | | 101,252 |
| |
| United Arab Emirates – 0.3% | | | | | | |
| Investcom LLC GDR | | 6,300 | | | | 85,113 |
| United Kingdom – 0.5% | | | | | | |
| Kazakhmys PLC | | 8,100 | | | | 77,439 |
| Oxus Gold PLC (a) | | 51,200 | | | | 56,201 |
| TOTAL UNITED KINGDOM | | | | | | 133,640 |
| |
| United States of America – 1.0% | | | | | | |
| Central European Distribution Corp. (a) | | 3,336 | | | | 132,806 |
| CTC Media, Inc. (d) | | 799 | | | | 11,998 |
| DSP Group, Inc. (a) | | 3,100 | | | | 76,198 |
| Zoran Corp. (a) | | 3,700 | | | | 54,316 |
| TOTAL UNITED STATES OF AMERICA | | | | | | 275,318 |
| |
| TOTAL COMMON STOCKS | | | | | | |
| (Cost $24,291,086) | | | | 27,982,419 |
| |
| Nonconvertible Preferred Stocks — 0.3% | | | | | | |
| |
| Korea (South) – 0.3% | | | | | | |
| Samsung Electronics Co. Ltd. | | | | | | |
| (Cost $70,695) | | 220 | | | | 89,559 |
See accompanying notes which are an integral part of the financial statements.
| Money Market Funds — 3.7% | | | | | | |
| | | Shares | | | | Value (Note 1) |
| Fidelity Cash Central Fund, 3.92% (b) | | | | | | |
| (Cost $1,084,003) | | 1,084,003 | | $ | | 1,084,003 |
| TOTAL INVESTMENT PORTFOLIO – 100.8% | | | | | | |
| (Cost $25,445,784) | | | | | | 29,155,981 |
| |
| NET OTHER ASSETS – (0.8)% | | | | | | (240,784) |
| NET ASSETS – 100% | | | | $ | | 28,915,197 |
(a) Non-income producing
(b) Affiliated fund that is available only to investment companies and other accounts managed by Fidelity Investments. The rate quoted is the annualized seven-day yield of the fund at period end. A complete unaudited listing of the fund’s holdings as of its most recent quarter end is available upon request.
(c) Security exempt from registration under Rule 144A of the Securities Act of 1933. These securities may be resold in transactions exempt from registration, normally to qualified institutional buyers. At the period end, the value of these securities amounted to $315,352 or 1.1% of net assets.
(d) Restricted securities – Investment in securities not registered under the Securities Act of 1933 (excluding 144A issues). At the end of the period, the value of restricted securities (excluding 144A issues) amounted to $11,998 or 0.0% of net assets.
| Additional information on each holding is as follows: | | | | |
| Security | | Acquisition Date | | | | Acquisition Cost |
| CTC Media, Inc. | | 1/26/05 | | $ | | 11,998 |
At October 31, 2005, the fund had a capital loss carryforward of approximately $81,011 all of which will expire on October 31, 2012.
See accompanying notes which are an integral part of the financial statements.
19 Annual Report
| Financial Statements | | | | | | | | |
| |
| |
| Statement of Assets and Liabilities | | | | | | | | |
| | | | | | | | | October 31, 2005 |
| |
| Assets | | | | | | | | |
| Investment in securities, at value (cost $25,445,784) — | | | | | | | | |
| See accompanying schedule | | | | | | $ | | 29,155,981 |
| Receivable for investments sold | | | | | | | | 173,248 |
| Receivable for fund shares sold | | | | | | | | 403,511 |
| Dividends receivable | | | | | | | | 33,414 |
| Interest receivable | | | | | | | | 4,026 |
| Receivable from investment adviser for expense | | | | | | | | |
| reductions | | | | | | | | 52,372 |
| Other affiliated receivables | | | | | | | | 797 |
| Other receivables | | | | | | | | 3,976 |
| Total assets | | | | | | | | 29,827,325 |
| |
| Liabilities | | | | | | | | |
| Payable to custodian bank | | $ | | 39,516 | | | | |
| Payable for investments purchased | | | | 740,784 | | | | |
| Payable for fund shares redeemed | | | | 11,538 | | | | |
| Accrued management fee | | | | 18,555 | | | | |
| Distribution fees payable | | | | 13,043 | | | | |
| Other affiliated payables | | | | 9,637 | | | | |
| Other payables and accrued expenses | | | | 79,055 | | | | |
| Total liabilities | | | | | | | | 912,128 |
| |
| Net Assets | | | | | | $ | | 28,915,197 |
| Net Assets consist of: | | | | | | | | |
| Paid in capital | | | | | | $ | | 25,256,132 |
| Undistributed net investment income | | | | | | | | 81,262 |
| Accumulated undistributed net realized gain (loss) on | | | | | | | | |
| investments and foreign currency transactions | | | | | | | | (117,427) |
| Net unrealized appreciation (depreciation) on | | | | | | | | |
| investments and assets and liabilities in foreign | | | | | | | | |
| currencies | | | | | | | | 3,695,230 |
| Net Assets | | | | | | $ | | 28,915,197 |
See accompanying notes which are an integral part of the financial statements.
| Statement of Assets and Liabilities - continued | | | | |
| | | October 31, 2005 |
| |
| Calculation of Maximum Offering Price | | | | |
| Class A: | | | | |
| Net Asset Value and redemption price per share | | | | |
| ($9,616,852 ÷ 699,345 shares) | | $ | | 13.75 |
| Maximum offering price per share (100/94.25 of | | | | |
| $13.75) | | $ | | 14.59 |
| Class T: | | | | |
| Net Asset Value and redemption price per share | | | | |
| ($6,800,914 ÷ 496,671 shares) | | $ | | 13.69 |
| Maximum offering price per share (100/96.50 of | | | | |
| $13.69) | | $ | | 14.19 |
| Class B: | | | | |
| Net Asset Value and offering price per share | | | | |
| ($4,997,022 ÷ 367,963 shares)A | | $ | | 13.58 |
| Class C: | | | | |
| Net Asset Value and offering price per share | | | | |
| ($5,890,497 ÷ 433,567 shares)A | | $ | | 13.59 |
| Institutional Class: | | | | |
| Net Asset Value, offering price and redemption | | | | |
| price per share ($1,609,912 ÷ 116,624 | | | | |
| shares) | | $ | | 13.80 |
| A Redemption price per share is equal to net asset value less any applicable contingent deferred sales charge. | | | | |
See accompanying notes which are an integral part of the financial statements.
21 Annual Report
| Financial Statements - continued | | | | | | |
| |
| |
| Statement of Operations | | | | | | |
| | | | | Year ended October 31, 2005 |
| |
| Investment Income | | | | | | |
| Dividends | | | | $ | | 372,944 |
| Interest | | | | | | 17,149 |
| | | | | | | 390,093 |
| Less foreign taxes withheld | | | | | | (41,932) |
| Total income | | | | | | 348,161 |
| |
| Expenses | | | | | | |
| Management fee | | $ | | 115,315 | | |
| Transfer agent fees | | | | 59,430 | | |
| Distribution fees | | | | 83,800 | | |
| Accounting fees and expenses | | | | 12,972 | | |
| Independent trustees’ compensation | | | | 54 | | |
| Custodian fees and expenses | | | | 94,604 | | |
| Registration fees | | | | 89,862 | | |
| Audit | | | | 49,903 | | |
| Legal | | | | 1,285 | | |
| Miscellaneous | | | | 91 | | |
| Total expenses before reductions | | | | 507,316 | | |
| Expense reductions | | | | (243,725) | | 263,591 |
| |
| Net investment income (loss) | | | | | | 84,570 |
| Realized and Unrealized Gain (Loss) | | | | | | |
| Net realized gain (loss) on: | | | | | | |
| Investment securities (net of foreign taxes of $1,975) . | | 75,734 | | |
| Foreign currency transactions | | | | (17,575) | | |
| Total net realized gain (loss) | | | | | | 58,159 |
| Change in net unrealized appreciation (depreciation) on: | | | | |
| Investment securities (net of increase in deferred for- | | | | |
| eign taxes of $14,460) | | | | 3,426,080 | | |
| Assets and liabilities in foreign currencies | | | | (731) | | |
| Total change in net unrealized appreciation | | | | | | |
| (depreciation) | | | | | | 3,425,349 |
| Net gain (loss) | | | | | | 3,483,508 |
| Net increase (decrease) in net assets resulting from | | | | | | |
| operations | | | | $ | | 3,568,078 |
See accompanying notes which are an integral part of the financial statements.
| Statement of Changes in Net Assets | | | | | | | | |
| | | | | | | | | March 29, 2004 |
| | | | | Year ended | | (commencement of |
| | | | | October 31, | | | | operations) to |
| | | | | 2005 | | October 31, 2004 |
| Increase (Decrease) in Net Assets | | | | | | | | |
| Operations | | | | | | | | |
| Net investment income (loss) | | $ | | 84,570 | | $ | | (477) |
| Net realized gain (loss) | | | | 58,159 | | | | (183,913) |
| Change in net unrealized appreciation (depreciation) . | | | | 3,425,349 | | | | 269,881 |
| Net increase (decrease) in net assets resulting | | | | | | | | |
| from operations | | | | 3,568,078 | | | | 85,491 |
| Share transactions -- net increase (decrease) | | | | 20,919,617 | | | | 4,331,666 |
| Redemption fees | | | | 8,417 | | | | 1,928 |
| Total increase (decrease) in net assets | | | | 24,496,112 | | | | 4,419,085 |
| |
| Net Assets | | | | | | | | |
| Beginning of period | | | | 4,419,085 | | | | — |
| End of period (including undistributed net investment | | | | | | | | |
| income of $81,262 and $0, respectively) | | $ | | 28,915,197 | | $ | | 4,419,085 |
See accompanying notes which are an integral part of the financial statements.
23 Annual Report
| Financial Highlights — Class A | | | | | | | | |
| Years ended October 31, | | | | 2005 | | | | 2004G |
| Selected Per-Share Data | | | | | | | | |
| Net asset value, beginning of period | | $ | | 9.87 | | $ | | 10.00 |
| Income from Investment Operations | | | | | | | | |
| Net investment income (loss)E | | | | 12 | | | | .02 |
| Net realized and unrealized gain (loss) | | | | 3.75 | | | | (.16)F |
| Total from investment operations | | | | 3.87 | | | | (.14) |
| Redemption fees added to paid in capitalE | | | | 01 | | | | .01 |
| Net asset value, end of period | | $ | | 13.75 | | $ | | 9.87 |
| Total ReturnB,C,D | | | | 39.31% | | | | (1.30)% |
| Ratios to Average Net AssetsH | | | | | | | | |
| Expenses before expense reductions | | | | 3.15% | | | | 10.75%A |
| Expenses net of voluntary waivers, if any | | | | 1.63% | | | | 2.00%A |
| Expenses net of all reductions | | | | 1.52% | | | | 1.91%A |
| Net investment income (loss) | | | | 95% | | | | .28%A |
| Supplemental Data | | | | | | | | |
| Net assets, end of period (000 omitted) | | $ | | 9,617 | | $ | | 1,178 |
| Portfolio turnover rate | | | | 54% | | | | 101%A |
A Annualized
B Total returns for periods of less than one year are not annualized.
C Total returns would have been lower had certain expenses not been reduced during the periods shown. D Total returns do not include the effect of the sales charges.
E Calculated based on average shares outstanding during the period.
F The amount shown for a share outstanding does not correspond with the aggregate net gain (loss) on investments for the period due to the timing of sales and repurchases of shares in relation to fluctuating market values of the investments of the fund.
G For the period March 29, 2004 (commencement of operations) to October 31, 2004.
H Expense ratios reflect operating expenses of the class. Expenses before reductions do not reflect amounts reimbursed by the investment adviser or reductions from brokerage service arrangements or other expense offset arrangements and do not represent the amount paid by the class during periods when reimbursements or reductions occur. Expense ratios before reductions for start up periods may not be representative of longer term operating periods. Expenses net of any voluntary waivers reflect expenses after reimbursement by the investment adviser but prior to reductions from brokerage service arrangements or other expense offset arrangements. Expenses net of all reductions represent the net expenses paid by the class.
See accompanying notes which are an integral part of the financial statements.
| Financial Highlights — Class T | | | | | | | | |
| Years ended October 31, | | | | 2005 | | | | 2004G |
| Selected Per-Share Data | | | | | | | | |
| Net asset value, beginning of period | | $ | | 9.86 | | $ | | 10.00 |
| Income from Investment Operations | | | | | | | | |
| Net investment income (loss)E | | | | 09 | | | | —I |
| Net realized and unrealized gain (loss) | | | | 3.73 | | | | (.15)F |
| Total from investment operations | | | | 3.82 | | | | (.15) |
| Redemption fees added to paid in capitalE | | | | 01 | | | | .01 |
| Net asset value, end of period | | $ | | 13.69 | | $ | | 9.86 |
| Total ReturnB,C,D | | | | 38.84% | | | | (1.40)% |
| Ratios to Average Net AssetsH | | | | | | | | |
| Expenses before expense reductions | | | | 3.53% | | | | 11.13%A |
| Expenses net of voluntary waivers, if any | | | | 1.89% | | | | 2.25%A |
| Expenses net of all reductions | | | | 1.77% | | | | 2.16%A |
| Net investment income (loss) | | | | 70% | | | | .03%A |
| Supplemental Data | | | | | | | | |
| Net assets, end of period (000 omitted) | | $ | | 6,801 | | $ | | 889 |
| Portfolio turnover rate | | | | 54% | | | | 101%A |
A Annualized
B Total returns for periods of less than one year are not annualized.
C Total returns would have been lower had certain expenses not been reduced during the periods shown. D Total returns do not include the effect of the sales charges.
E Calculated based on average shares outstanding during the period.
F The amount shown for a share outstanding does not correspond with the aggregate net gain (loss) on investments for the period due to the timing of sales and repurchases of shares in relation to fluctuating market values of the investments of the fund.
G For the period March 29, 2004 (commencement of operations) to October 31, 2004.
H Expense ratios reflect operating expenses of the class. Expenses before reductions do not reflect amounts reimbursed by the investment adviser or reductions from brokerage service arrangements or other expense offset arrangements and do not represent the amount paid by the class during periods when reimbursements or reductions occur. Expense ratios before reductions for start up periods may not be representative of longer term operating periods. Expenses net of any voluntary waivers reflect expenses after reimbursement by the investment adviser but prior to reductions from brokerage service arrangements or other expense offset arrangements. Expenses net of all reductions represent the net expenses paid by the class.
I Amount represents less than $.01 per share.
See accompanying notes which are an integral part of the financial statements.
25 Annual Report
| Financial Highlights — Class B | | | | | | | | |
| Years ended October 31, | | | | 2005 | | | | 2004G |
| Selected Per-Share Data | | | | | | | | |
| Net asset value, beginning of period | | $ | | 9.83 | | $ | | 10.00 |
| Income from Investment Operations | | | | | | | | |
| Net investment income (loss)E | | | | 02 | | | | (.03) |
| Net realized and unrealized gain (loss) | | | | 3.72 | | | | (.15)F |
| Total from investment operations | | | | 3.74 | | | | (.18) |
| Redemption fees added to paid in capitalE | | | | 01 | | | | .01 |
| Net asset value, end of period | | $ | | 13.58 | | $ | | 9.83 |
| Total ReturnB,C,D | | | | 38.15% | | | | (1.70)% |
| Ratios to Average Net AssetsH | | | | | | | | |
| Expenses before expense reductions | | | | 4.00% | | | | 11.49%A |
| Expenses net of voluntary waivers, if any | | | | 2.39% | | | | 2.75%A |
| Expenses net of all reductions | | | | 2.27% | | | | 2.67%A |
| Net investment income (loss) | | | | 20% | | | | (.47)%A |
| Supplemental Data | | | | | | | | |
| Net assets, end of period (000 omitted) | | $ | | 4,997 | | $ | | 719 |
| Portfolio turnover rate | | | | 54% | | | | 101%A |
A Annualized
B Total returns for periods of less than one year are not annualized.
C Total returns would have been lower had certain expenses not been reduced during the periods shown. D Total returns do not include the effect of the contingent deferred sales charge.
E Calculated based on average shares outstanding during the period.
F The amount shown for a share outstanding does not correspond with the aggregate net gain (loss) on investments for the period due to the timing of sales and repurchases of shares in relation to fluctuating market values of the investments of the fund.
G For the period March 29, 2004 (commencement of operations) to October 31, 2004.
H Expense ratios reflect operating expenses of the class. Expenses before reductions do not reflect amounts reimbursed by the investment adviser or reductions from brokerage service arrangements or other expense offset arrangements and do not represent the amount paid by the class during periods when reimbursements or reductions occur. Expense ratios before reductions for start up periods may not be representative of longer term operating periods. Expenses net of any voluntary waivers reflect expenses after reimbursement by the investment adviser but prior to reductions from brokerage service arrangements or other expense offset arrangements. Expenses net of all reductions represent the net expenses paid by the class.
See accompanying notes which are an integral part of the financial statements.
| Financial Highlights — Class C | | | | | | | | |
| Years ended October 31, | | | | 2005 | | | | 2004G |
| Selected Per-Share Data | | | | | | | | |
| Net asset value, beginning of period | | $ | | 9.83 | | $ | | 10.00 |
| Income from Investment Operations | | | | | | | | |
| Net investment income (loss)E | | | | 02 | | | | (.03) |
| Net realized and unrealized gain (loss) | | | | 3.73 | | | | (.15)F |
| Total from investment operations | | | | 3.75 | | | | (.18) |
| Redemption fees added to paid in capitalE | | | | 01 | | | | .01 |
| Net asset value, end of period | | $ | | 13.59 | | $ | | 9.83 |
| Total ReturnB,C,D | | | | 38.25% | | | | (1.70)% |
| Ratios to Average Net AssetsH | | | | | | | | |
| Expenses before expense reductions | | | | 4.09% | | | | 11.58%A |
| Expenses net of voluntary waivers, if any | | | | 2.39% | | | | 2.75%A |
| Expenses net of all reductions | | | | 2.28% | | | | 2.66%A |
| Net investment income (loss) | | | | 19% | | | | (.47)%A |
| Supplemental Data | | | | | | | | |
| Net assets, end of period (000 omitted) | | $ | | 5,890 | | $ | | 1,105 |
| Portfolio turnover rate | | | | 54% | | | | 101%A |
A Annualized
B Total returns for periods of less than one year are not annualized.
C Total returns would have been lower had certain expenses not been reduced during the periods shown. D Total returns do not include the effect of the contingent deferred sales charge.
E Calculated based on average shares outstanding during the period.
F The amount shown for a share outstanding does not correspond with the aggregate net gain (loss) on investments for the period due to the timing of sales and repurchases of shares in relation to fluctuating market values of the investments of the fund.
G For the period March 29, 2004 (commencement of operations) to October 31, 2004.
H Expense ratios reflect operating expenses of the class. Expenses before reductions do not reflect amounts reimbursed by the investment adviser or reductions from brokerage service arrangements or other expense offset arrangements and do not represent the amount paid by the class during periods when reimbursements or reductions occur. Expense ratios before reductions for start up periods may not be representative of longer term operating periods. Expenses net of any voluntary waivers reflect expenses after reimbursement by the investment adviser but prior to reductions from brokerage service arrangements or other expense offset arrangements. Expenses net of all reductions represent the net expenses paid by the class.
See accompanying notes which are an integral part of the financial statements.
27 Annual Report
| Financial Highlights — Institutional Class | | | | | | | | |
| Years ended October 31, | | | | 2005 | | | | 2004F |
| Selected Per-Share Data | | | | | | | | |
| Net asset value, beginning of period | | $ | | 9.89 | | $ | | 10.00 |
| Income from Investment Operations | | | | | | | | |
| Net investment income (loss)D | | | | 14 | | | | .03 |
| Net realized and unrealized gain (loss) | | | | 3.76 | | | | (.15)E |
| Total from investment operations | | | | 3.90 | | | | (.12) |
| Redemption fees added to paid in capitalD | | | | 01 | | | | .01 |
| Net asset value, end of period | | $ | | 13.80 | | $ | | 9.89 |
| Total ReturnB,C | | | | 39.53% | | | | (1.10)% |
| Ratios to Average Net AssetsG | | | | | | | | |
| Expenses before expense reductions | | | | 3.05% | | | | 10.37%A |
| Expenses net of voluntary waivers, if any | | | | 1.41% | | | | 1.75%A |
| Expenses net of all reductions | | | | 1.30% | | | | 1.66%A |
| Net investment income (loss) | | | | 1.17% | | | | .53%A |
| Supplemental Data | | | | | | | | |
| Net assets, end of period (000 omitted) | | $ | | 1,610 | | $ | | 529 |
| Portfolio turnover rate | | | | 54% | | | | 101%A |
A Annualized
B Total returns for periods of less than one year are not annualized.
C Total returns would have been lower had certain expenses not been reduced during the periods shown. D Calculated based on average shares outstanding during the period.
E The amount shown for a share outstanding does not correspond with the aggregate net gain (loss) on investments for the period due to the timing of sales and repurchases of shares in relation to fluctuating market values of the investments of the fund.
F For the period March 29, 2004 (commencement of operations) to October 31, 2004.
G Expense ratios reflect operating expenses of the class. Expenses before reductions do not reflect amounts reimbursed by the investment adviser or reductions from brokerage service arrangements or other expense offset arrangements and do not represent the amount paid by the class during periods when reimbursements or reductions occur. Expense ratios before reductions for start up periods may not be representative of longer term operating periods. Expenses net of any voluntary waivers reflect expenses after reimbursement by the investment adviser but prior to reductions from brokerage service arrangements or other expense offset arrangements. Expenses net of all reductions represent the net expenses paid by the class.
See accompanying notes which are an integral part of the financial statements.
Notes to Financial Statements
For the period ended October 31, 2005
|
1. Significant Accounting Policies.
Fidelity Advisor Emerging Markets Fund (the fund) is a non-diversified fund of Fidelity Advisor Series VIII (the trust) and is authorized to issue an unlimited number of shares. The trust is registered under the Investment Company Act of 1940, as amended (the 1940 Act), as an open-end management investment company organized as a Massachusetts business trust.
The fund offers Class A, Class T, Class B, Class C, and Institutional Class shares, each of which has equal rights as to assets and voting privileges. Each class has exclusive voting rights with respect to matters that affect that class. Class B shares will automatically convert to Class A shares after a holding period of seven years from the initial date of purchase. Investment income, realized and unrealized capital gains and losses, the common expenses of the fund, and certain fund-level expense reductions, if any, are allocated on a pro rata basis to each class based on the relative net assets of each class to the total net assets of the fund. Each class differs with respect to transfer agent and distribution and service plan fees incurred. Certain expense reductions also differ by class.
The fund’s investments in emerging markets can be subject to social, economic, regulatory, and political uncertainties and can be extremely volatile.
The fund may invest in affiliated money market central funds (Money Market Central Funds) which are open-end investment companies available to investment companies and other accounts managed by Fidelity Management & Research Company (FMR) and its affiliates. The financial statements have been prepared in conformity with accounting principles generally accepted in the United States of America, which require management to make certain estimates and assumptions at the date of the financial statements. The following summarizes the significant accounting policies of the fund:
Security Valuation. Investments are valued and net asset value (NAV) per share is calculated (NAV calculation) as of the close of business of the New York Stock Exchange (NYSE), normally 4:00 p.m. Eastern time. Wherever possible, the fund uses independent pricing services approved by the Board of Trustees to value its investments.
Equity securities, including restricted securities, for which market quotations are readily available, are valued at the last reported sale price or official closing price as reported by an independent pricing service on the primary market or exchange on which they are traded. In the event there were no sales during the day or closing prices are not available, securities are valued at the last quoted bid price. Investments in open-end mutual funds, are valued at their closing net asset value each business day. Short-term securities with remaining maturities of sixty days or less for which quotations are not readily available are valued at amortized cost, which approximates value.
29 Annual Report
Notes to Financial Statements - continued
1. Significant Accounting Policies - continued
Security Valuation - continued
When current market prices or quotations are not readily available or do not accurately reflect fair value, valuations may be determined in accordance with procedures adopted by the Board of Trustees. For example, when developments occur between the close of a market and the close of the NYSE that may materially affect the value of some or all of the securities, or when trading in a security is halted, those securities may be fair valued. Factors used in the determination of fair value may include monitoring news to identify significant market or security specific events such as changes in the value of U.S. securities market, reviewing developments in foreign markets and evaluating the performance of ADRs, futures contracts and exchange-traded funds. Because the fund’s utilization of fair value pricing depends on market activity, the frequency with which fair value pricing is used can not be predicted and may be utilized to a significant extent. The value of securities used for NAV calculation under fair value pricing may differ from published prices for the same securities.
Foreign Currency. The fund uses foreign currency contracts to facilitate transactions in foreign-denominated securities. Losses from these transactions may arise from changes in the value of the foreign currency or if the counterparties do not perform under the contracts’ terms.
Foreign-denominated assets, including investment securities, and liabilities are translated into U.S. dollars at the exchange rate at period end. Purchases and sales of investment securities, income and dividends received and expenses denominated in foreign currencies are translated into U.S. dollars at the exchange rate in effect on the transaction date.
The effects of exchange rate fluctuations on investments are included with the net realized and unrealized gain (loss) on investment securities. Other foreign currency transactions resulting in realized and unrealized gain (loss) are disclosed separately.
Investment Transactions and Income. Security transactions are accounted for as of trade date. Gains and losses on securities sold are determined on the basis of identified cost. Dividend income is recorded on the ex-dividend date, except for certain dividends from foreign securities where the ex-dividend date may have passed, which are recorded as soon as the fund is informed of the ex-dividend date. Non-cash dividends included in dividend income, if any, are recorded at the fair market value of the securities received. Interest income is accrued as earned. Interest income includes coupon interest and amortization of premium and accretion of discount on debt securities. Investment income is recorded net of foreign taxes withheld where recovery of such taxes is uncertain.
Expenses. Most expenses of the trust can be directly attributed to a fund. Expenses which cannot be directly attributed are apportioned among each fund in the trust.
1. Significant Accounting Policies - continued
Income Tax Information and Distributions to Shareholders. Each year, the fund intends to qualify as a regulated investment company by distributing all of its taxable income and realized gains under Subchapter M of the Internal Revenue Code. As a result, no provision for income taxes is required in the accompanying financial statements. Foreign taxes are provided for based on the fund’s understanding of the tax rules and rates that exist in the foreign markets in which it invests.
Distributions are recorded on the ex-dividend date. Income dividends and capital gain distributions are declared separately for each class. Income and capital gain distributions are determined in accordance with income tax regulations, which may differ from generally accepted accounting principles.
Capital accounts within the financial statements are adjusted for permanent book-tax differences. These adjustments have no impact on net assets or the results of operations. Temporary book-tax differences will reverse in a subsequent period.
Book-tax differences are primarily due to foreign currency transactions, certain foreign taxes, passive foreign investment companies (PFIC) and losses deferred due to wash sales.
The tax-basis components of distributable earnings and the federal tax cost as of period end were as follows:
| Unrealized appreciation | | $ | | 4,369,030 |
| Unrealized depreciation | | | | (703,873) |
| Net unrealized appreciation (depreciation) | | | | 3,665,157 |
| Undistributed ordinary income | | | | 81,262 |
| Capital loss carryforward | | | | (81,011) |
| |
| Cost for federal income tax purposes | | $ | | 25,490,824 |
Short-Term Trading (Redemption) Fees. Shares held in the fund less than 90 days are subject to a redemption fee equal to 1.50% of the proceeds of the redeemed shares. All redemption fees, including any estimated redemption fees paid by FMR, are retained by the fund and accounted for as an addition to paid in capital.
31 Annual Report
Notes to Financial Statements - continued
2. Operating Policies.
Repurchase Agreements. FMR has received an Exemptive Order from the Securities and Exchange Commission (the SEC) which permits the fund and other affiliated entities of FMR to transfer uninvested cash balances into joint trading accounts which are then invested in repurchase agreements. The fund may also invest directly with institutions in repurchase agreements. Repurchase agreements are collateralized by government or non-government securities. Collateral is held in segregated accounts with custodian banks and may be obtained in the event of a default of the counterparty. The fund monitors, on a daily basis, the value of the collateral to ensure it is at least equal to the principal amount of the repurchase agreement (including accrued interest). In the event of a default by the counterparty, realization of the collateral proceeds could be delayed, during which time the value of the collateral may decline.
Restricted Securities. The fund may invest in securities that are subject to legal or contractual restrictions on resale. These securities generally may be resold in transactions exempt from registration or to the public if the securities are registered. Disposal of these securities may involve time-consuming negotiations and expense, and prompt sale at an acceptable price may be difficult. Information regarding restricted securities is included at the end of the fund’s Schedule of Investments.
3. Purchases and Sales of Investments.
Purchases and sales of securities, other than short-term securities and U.S. government securities, aggregated $27,852,862 and $7,509,863, respectively.
4. Fees and Other Transactions with Affiliates.
Management Fee. FMR and its affiliates provide the fund with investment management related services for which the fund pays a monthly management fee. The management fee is the sum of an individual fund fee rate that is based on an annual rate of .55% of the fund’s average net assets and a group fee rate that averaged .27% during the period. The group fee rate is based upon the average net assets of all the mutual funds advised by FMR. The group fee rate decreases as assets under management increase and increases as assets under management decrease. For the period, the total annual management fee rate was .82% of the fund’s average net assets.
Distribution and Service Plan. In accordance with Rule 12b-1 of the 1940 Act, the fund has adopted separate Distribution and Service Plans for each class of shares. Certain classes pay Fidelity Distributors Corporation (FDC), an affiliate of FMR, separate Distribution and Service Fees, each of which is based on an annual percentage of each class’ average net assets. In addition, FDC may pay financial intermediaries for selling shares of the fund and providing shareholder support services. For the period, the
4. Fees and Other Transactions with Affiliates - continued
Distribution and Service Plan - continued
Distribution and Service Fee rates and the total amounts paid to and retained by FDC were as follows:
| | | Distribution | | Service | | | | Paid to | | | | Retained |
| | | Fee | | Fee | | | | FDC | | | | by FDC |
| Class A | | 0% | | .25% | | $ | | 10,252 | | $ | | 1,138 |
| Class T | | 25% | | .25% | | | | 16,208 | | | | 2,272 |
| Class B | | 75% | | .25% | | | | 26,713 | | | | 21,199 |
| Class C | | 75% | | .25% | | | | 30,627 | | | | 14,962 |
| | | | | | | $ | | 83,800 | | $ | | 39,571 |
Sales Load. FDC receives a front-end sales charge of up to 5.75% for selling Class A shares, and 3.50% for selling Class T shares, some of which is paid to financial intermediaries for selling shares of the fund. FDC receives the proceeds of contingent deferred sales charges levied on Class A, Class T, Class B, and Class C redemptions. These charges depend on the holding period. The deferred sales charges range from 5% to 1% for Class B, 1% for Class C, and .25% for certain purchases of Class A and Class T shares.
| For the period, sales charge amounts retained by FDC were as follows: | | | | |
| | | | | Retained |
| | | | | by FDC |
| Class A | | $ | | 27,121 |
| Class T | | | | 7,165 |
| Class B* | | | | 3,431 |
| Class C* | | | | 226 |
| | | $ | | 37,943 |
* When Class B and Class C shares are initially sold, FDC pays commissions from its own resources to financial intermediaries through which the sales are made.
Transfer Agent Fees. Fidelity Investments Institutional Operations Company, Inc. (FIIOC), an affiliate of FMR, is the transfer, dividend disbursing and shareholder servicing agent for each class of the fund. FIIOC receives account fees and asset-based fees that vary according to the account size and type of account of the shareholders of the
33 Annual Report
Notes to Financial Statements - continued
4. Fees and Other Transactions with Affiliates - continued
Transfer Agent Fees - continued
respective classes of the fund. FIIOC pays for typesetting, printing and mailing of shareholder reports, except proxy statements. For the period the total transfer agent fees paid by each class to FIIOC, were as follows:
| | | | | | | % of |
| | | | | | | Average |
| | | | | Amount | | Net Assets |
| Class A | | $ | | 17,586 | | .43 |
| Class T | | | | 14,604 | | .45 |
| Class B | | | | 11,641 | | .43 |
| Class C | | | | 13,384 | | .44 |
| Institutional Class | | | | 2,215 | | .23 |
| | | $ | | 59,430 | | |
Accounting Fees. Fidelity Service Company, Inc. (FSC), an affiliate of FMR, maintains the fund’s accounting records. The fee is based on the level of average net assets for the month.
Affiliated Central Funds. The fund may invest in Money Market Central Funds which seek preservation of capital and current income and are managed by Fidelity Investments Money Management, Inc. (FIMM), an affiliate of FMR.
The Money Market Central Funds do not pay a management fee. Income distributions earned by the fund are recorded as income in the accompanying financial statements and totaled $10,929 for the period.
Brokerage Commissions. The fund placed a portion of its portfolio transactions with brokerage firms which are affiliates of the investment adviser. The commissions paid to these affiliated firms were $62 for the period.
5. Committed Line of Credit.
|
The fund participates with other funds managed by FMR in a $4.2 billion credit facility (the “line of credit”) to be utilized for temporary or emergency purposes to fund shareholder redemptions or for other short-term liquidity purposes. The fund has agreed to pay commitment fees on its pro rata portion of the line of credit. During the period, there were no borrowings on this line of credit.
FMR voluntarily agreed to reimburse each class to the extent annual operating expenses exceeded certain levels of average net assets as noted in the table below. Some expenses, for example interest expense, are excluded from this reimbursement.
| The following classes were in reimbursement during the period: | | | | |
| | | Expense | | | | Reimbursement |
| | | Limitations | | | | from adviser |
| |
| Class A | | 2.00%--1.60%* | | $ | | 62,597 |
| Class T | | 2.25%--1.85%* | | | | 53,456 |
| Class B | | 2.75%--2.35%* | | | | 43,405 |
| Class C | | 2.75%--2.35%* | | | | 52,078 |
| Institutional Class | | 1.75%--1.35%* | | | | 15,841 |
| | | | | $ | | 227,377 |
| * Expense limitation in effect at period end. | | | | | | |
Many of the brokers with whom FMR places trades on behalf of the fund provided services to the fund in addition to trade execution. These services included payments of certain expenses on behalf of the fund totaling $16,331 for the period. In addition, through arrangements with the fund’s custodian, credits realized as a result of uninvested cash balances were used to reduce the fund’s expenses. During the period, these credits reduced the fund’s custody expenses by $17.
The fund’s organizational documents provide former and current trustees and officers with a limited indemnification against liabilities arising in connection with the performance of their duties to the fund. In the normal course of business, the fund may also enter into contracts that provide general indemnifications. The fund’s maximum exposure under these arrangements is unknown as this would be dependent on future claims that may be made against the fund. The risk of material loss from such claims is considered remote.
35 Annual Report
| Notes to Financial Statements - continued | | | | | | |
| |
| |
| 8. Share Transactions. | | | | | | | | | | |
| |
| Transactions for each class of shares were as follows: | | | | | | | | |
| |
| | | Shares | | | | | | Dollars | | |
| | | Years ended October 31, | | | | Years ended October 31, |
| | | 2005 | | 2004A | | | | 2005 | | | | 2004A |
| Class A | | | | | | | | | | | | |
| Shares sold | | 626,290 | | 121,174 | | $ | | 7,938,744 | | $ | | 1,156,378 |
| Shares redeemed | | (46,288) | | (1,831) | | | | (542,567) | | | | (16,319) |
| Net increase (decrease) . | | 580,002 | | 119,343 | | $ | | 7,396,177 | | $ | | 1,140,059 |
| Class T | | | | | | | | | | | | |
| Shares sold | | 460,358 | | 105,410 | | $ | | 5,753,778 | | $ | | 1,016,630 |
| Shares redeemed | | (53,845) | | (15,252) | | | | (661,780) | | | | (136,708) |
| Net increase (decrease) . | | 406,513 | | 90,158 | | $ | | 5,091,998 | | $ | | 879,922 |
| Class B | | | | | | | | | | | | |
| Shares sold | | 336,021 | | 76,467 | | $ | | 4,091,942 | | $ | | 742,578 |
| Shares redeemed | | (41,193) | | (3,332) | | | | (504,698) | | | | (29,257) |
| Net increase (decrease) . | | 294,828 | | 73,135 | | $ | | 3,587,244 | | $ | | 713,321 |
| Class C | | | | | | | | | | | | |
| Shares sold | | 386,910 | | 112,717 | | $ | | 4,844,275 | | $ | | 1,070,278 |
| Shares redeemed | | (65,733) | | (327) | | | | (821,834) | | | | (3,252) |
| Net increase (decrease) . | | 321,177 | | 112,390 | | $ | | 4,022,441 | | $ | | 1,067,026 |
| Institutional Class | | | | | | | | | | | | |
| Shares sold | | 77,612 | | 53,677 | | $ | | 997,482 | | $ | | 532,788 |
| Shares redeemed | | (14,515) | | (150) | | | | (175,725) | | | | (1,450) |
| Net increase (decrease) . | | 63,097 | | 53,527 | | $ | | 821,757 | | $ | | 531,338 |
| |
| A For the period March 29, 2004 (commencement of operations) to October 31, 2004. | | | | | | | | |
Report of Independent Registered Public Accounting Firm
To the Trustees of Fidelity Advisor Series VIII and Shareholders of Fidelity Advisor Emerging Markets Fund:
We have audited the accompanying statement of assets and liabilities of Fidelity Advisor Emerging Markets Fund (the Fund), a fund of Fidelity Advisor Series VIII, including the schedule of investments, as of October 31, 2005, and the related statement of operations for the year then ended, and the statement of changes in net assets and the financial highlights for the year ended October 31, 2005 and for the period from March 29, 2004 (commencement of operations) to October 31, 2004. These financial statements and financial highlights are the responsibility of the Fund’s management. Our responsibility is to express an opinion on these financial statements and financial highlights based on our audits.
We conducted our audits in accordance with standards of the Public Company Accounting Oversight Board (United States). Those standards require that we plan and perform the audit to obtain reasonable assurance about whether the financial statements and financial highlights are free of material misstatement. The Fund is not required to have, nor were we engaged to perform, an audit of its internal control over financial reporting. Our audits included consideration of internal control over financial reporting as a basis for designing audit procedures that are appropriate in the circumstances, but not for the purpose of expressing an opinion on the effectiveness of the Fund’s internal control over financial reporting. Accordingly, we express no such opinion. An audit also includes examining, on a test basis, evidence supporting the amounts and disclosures in the financial statements, assessing the accounting principles used and significant estimates made by management, as well as evaluating the overall financial statement presentation. Our procedures included confirmation of securities owned as of October 31, 2005, by correspondence with the custodians and brokers; where replies were not received from brokers, we performed other auditing procedures. We believe that our audits provide a reasonable basis for our opinion.
In our opinion, the financial statements and financial highlights referred to above present fairly, in all material respects, the financial position of Fidelity Advisor Emerging Markets Fund as of October 31, 2005, the results of its operations for the year then ended, the changes in its net assets, and the financial highlights for the year ended October 31, 2005 and for the period from March 29, 2004 (commencement of operations) to October 31, 2004, in conformity with accounting principles generally accepted in the United States of America.
/s/ Deloitte & Touche LLP
DELOITTE & TOUCHE LLP
|
37 Annual Report
Boston, Massachusetts December 19, 2005
Trustees and Officers
The Trustees, Members of the Advisory Board, and executive officers of the trust and fund, as applicable, are listed below. The Board of Trustees governs the fund and is responsible for protecting the interests of shareholders. The Trustees are experienced executives who meet periodically throughout the year to oversee the fund’s activities, review contractual arrangements with companies that provide services to the fund, and review the fund’s performance. Except for William O. McCoy, Stephen P. Jonas, and Kenneth L. Wolfe, each of the Trustees oversees 322 funds advised by FMR or an affiliate. Mr. McCoy oversees 324 funds advised by FMR or an affiliate. Mr. Jonas and Mr. Wolfe oversee 319 funds advised by FMR or an affiliate.
The Trustees hold office without limit in time except that (a) any Trustee may resign; (b) any Trustee may be removed by written instrument, signed by at least two-thirds of the number of Trustees prior to such removal; (c) any Trustee who requests to be retired or who has become incapacitated by illness or injury may be retired by written instrument signed by a majority of the other Trustees; and (d) any Trustee may be removed at any special meeting of shareholders by a two-thirds vote of the outstanding voting securities of the trust. Each Trustee who is not an interested person (as defined in the 1940 Act) (Independent Trustee), shall retire not later than the last day of the calendar year in which his or her 72nd birthday occurs. The Independent Trustees may waive this mandatory retirement age policy with respect to individual Trustees. The executive officers and Advisory Board Members hold office without limit in time, except that any officer and Advisory Board Member may resign or may be removed by a vote of a majority of the Trustees at any regular meeting or any special meeting of the Trustees. Except as indicated, each individual has held the office shown or other offices in the same company for the past five years.
The fund’s Statement of Additional Information (SAI) includes more information about the Trustees. To request a free copy, call Fidelity at 1-877-208-0098.
Interested Trustees*:
Correspondence intended for each Trustee who is an interested person may be sent to Fidelity Investments, 82 Devonshire Street, Boston, Massachusetts 02109.
| Name, Age; Principal Occupation |
| |
| Edward C. Johnson 3d (75)** |
| |
| Year of Election or Appointment: 1983 |
| Mr. Johnson is Chairman of the Board of Trustees. Mr. Johnson serves as |
| Chief Executive Officer, Chairman, and a Director of FMR Corp.; a Di- |
| rector and Chairman of the Board and of the Executive Committee of |
| FMR; Chairman and a Director of Fidelity Management & Research (Far |
| East) Inc.; Chairman and a Director of Fidelity Investments Money Man- |
| agement, Inc.; and Chairman (2001-present) and a Director |
| (2000-present) of FMR Co., Inc. |
39 Annual Report
Trustees and Officers - continued
| Name, Age; Principal Occupation |
| |
| Abigail P. Johnson (43)** |
| |
| Year of Election or Appointment: 2001 |
| Ms. Johnson serves as President of Fidelity Employer Services Company |
| (FESCO) (2005-present). She is President and a Director of Fidelity In- |
| vestments Money Management, Inc. (2001-present), FMR Co., Inc. |
| (2001-present), and a Director of FMR Corp. Previously, Ms. Johnson |
| served as President and a Director of FMR (2001-2005), Senior Vice |
| President of the Fidelity funds (2001-2005), and managed a number of |
| Fidelity funds. |
| |
| Stephen P. Jonas (52) |
| |
| Year of Election or Appointment: 2005 |
| Mr. Jonas is Senior Vice President of Advisor Emerging Markets |
| (2005-present). He also serves as Senior Vice President of other Fidelity |
| funds (2005-present). Mr. Jonas is Executive Director of FMR |
| (2005-present). Previously, Mr. Jonas served as President of Fidelity En- |
| terprise Operations and Risk Services (2004-2005), Chief Administra- |
| tive Officer (2002-2004), and Chief Financial Officer of FMR Co. |
| (1998-2000). Mr. Jonas has been with Fidelity Investments since 1987 |
| and has held various financial and management positions including |
| Chief Financial Officer of FMR. In addition, he serves on the Boards of |
| Boston Ballet (2003-present) and Simmons College (2003-present). |
| |
| Robert L. Reynolds (53) |
| |
| Year of Election or Appointment: 2003 |
| Mr. Reynolds is a Director (2003-present) and Chief Operating Officer |
| (2002-present) of FMR Corp. He also serves on the Board at Fidelity |
| Investments Canada, Ltd. (2000-present). Previously, Mr. Reynolds |
| served as President of Fidelity Investments Institutional Retirement Group |
| (1996-2000). |
* Trustees have been determined to be “Interested Trustees” by virtue of, among other things, their affiliation with the trust or various entities under common control with FMR.
** Edward C. Johnson 3d, Trustee, is Abigail P. Johnson’s father.
Annual Report 40
Independent Trustees:
Correspondence intended for each Independent Trustee (that is, the Trustees other than the Interested Trustees) may be sent to Fidelity Investments, P.O. Box 55235, Boston, Massachusetts 02205-5235.
| Name, Age; Principal Occupation |
| |
| Dennis J. Dirks (57) |
| |
| Year of Election or Appointment: 2005 |
| Prior to his retirement in May 2003, Mr. Dirks was Chief Operating |
| Officer and a member of the Board of The Depository Trust & Clearing |
| Corporation (DTCC) (1999-2003). He also served as President, Chief |
| Operating Officer, and Board member of The Depository Trust |
| Company (DTC) (1999-2003) and President and Board member of the |
| National Securities Clearing Corporation (NSCC) (1999-2003). In addi- |
| tion, Mr. Dirks served as Chief Executive Officer and Board member of |
| the Government Securities Clearing Corporation (2001-2003) and Chief |
| Executive Officer and Board member of the Mortgage-Backed Securities |
| Clearing Corporation (2001-2003). Mr. Dirks also serves as a Trustee of |
| Manhattan College (2005-present). |
| |
| Robert M. Gates (62) |
| |
| Year of Election or Appointment: 1997 |
| Dr. Gates is Vice Chairman of the Independent Trustees (2005-present). |
| Dr. Gates is President of Texas A&M University (2002-present). He was |
| Director of the Central Intelligence Agency (CIA) from 1991 to 1993. |
| From 1989 to 1991, Dr. Gates served as Assistant to the President of |
| the United States and Deputy National Security Advisor. Dr. Gates is a |
| Director of NACCO Industries, Inc. (mining and manufacturing), Parker |
| Drilling Co., Inc. (drilling and rental tools for the energy industry, |
| 2001-present), and Brinker International (restaurant management, |
| 2003-present). Previously, Dr. Gates served as a Director of LucasVarity |
| PLC (automotive components and diesel engines), a Director of TRW Inc. |
| (automotive, space, defense, and information technology), and Dean of |
| the George Bush School of Government and Public Service at Texas |
| A&M University (1999-2001). Dr. Gates also is a Trustee of the Forum |
| for International Policy. |
41 Annual Report
Trustees and Officers - continued
| Name, Age; Principal Occupation |
| |
| George H. Heilmeier (69) |
| |
| Year of Election or Appointment: 2004 |
| Dr. Heilmeier is Chairman Emeritus of Telcordia Technologies (commu- |
| nication software and systems), where prior to his retirement, he served |
| as company Chairman and Chief Executive Officer. He currently serves |
| on the Boards of Directors of The Mitre Corporation (systems engineer- |
| ing and information technology support for the government), and HRL |
| Laboratories (private research and development, 2004-present). He is |
| Chairman of the General Motors Science & Technology Advisory Board |
| and a Life Fellow of the Institute of Electrical and Electronics Engineers |
| (IEEE) (2000-present). Dr. Heilmeier is a member of the Defense Science |
| Board and the National Security Agency Advisory Board. He is also a |
| member of the National Academy of Engineering, the American |
| Academy of Arts and Sciences, and the Board of Overseers of the |
| School of Engineering and Applied Science of the University of Pennsyl- |
| vania. Previously, Dr. Heilmeier served as a Director of TRW Inc. (auto- |
| motive, space, defense, and information technology, 1992-2002), |
| Compaq (1994-2002), Automatic Data Processing, Inc. (ADP) |
| (technology-based business outsourcing, 1995-2002), INET Technolo- |
| gies Inc. (telecommunications network surveillance, 2001-2004), and |
| Teletech Holdings (customer management services). He is the recipient of |
| the 2005 Kyoto Prize in Advanced Technology for his invention of the |
| liquid display. |
| |
| Marie L. Knowles (59) |
| |
| Year of Election or Appointment: 2001 |
| Prior to Ms. Knowles’ retirement in June 2000, she served as Executive |
| Vice President and Chief Financial Officer of Atlantic Richfield Company |
| (ARCO) (diversified energy, 1996-2000). From 1993 to 1996, she was |
| a Senior Vice President of ARCO and President of ARCO Transportation |
| Company. She served as a Director of ARCO from 1996 to 1998. She |
| currently serves as a Director of Phelps Dodge Corporation (copper |
| mining and manufacturing) and McKesson Corporation (healthcare ser- |
| vice, 2002-present). Ms. Knowles is a Trustee of the Brookings Institution |
| and the Catalina Island Conservancy and also serves as a member of |
| the Advisory Board for the School of Engineering of the University of |
| Southern California. |
Annual Report 42
| Name, Age; Principal Occupation |
| |
| Ned C. Lautenbach (61) |
| |
| Year of Election or Appointment: 2000 |
| Mr. Lautenbach has been a partner of Clayton, Dubilier & Rice, Inc. |
| (private equity investment firm) since September 1998. Previously, Mr. |
| Lautenbach was with the International Business Machines Corporation |
| (IBM) from 1968 until his retirement in 1998. Mr. Lautenbach serves as |
| a Director of Italtel Holding S.p.A. (telecommunications (Milan, Italy), |
| 2004-present) and Eaton Corporation (diversified industrial) as well as |
| the Philharmonic Center for the Arts in Naples, Florida. He also is a |
| member of the Board of Trustees of Fairfield University (2005-present), |
| as well as a member of the Council on Foreign Relations. |
| |
| Marvin L. Mann (72) |
| |
| Year of Election or Appointment: 1993 |
| Mr. Mann is Chairman of the Independent Trustees (2001-present). He is |
| Chairman Emeritus of Lexmark International, Inc. (computer |
| peripherals), where he served as CEO until April 1998, retired as |
| Chairman May 1999, and remains a member of the Board. Prior to |
| 1991, he held the positions of Vice President of International Business |
| Machines Corporation (IBM) and President and General Manager of |
| various IBM divisions and subsidiaries. He is a member of the Executive |
| Committee of the Independent Director’s Council of the Investment Com- |
| pany Institute. In addition, Mr. Mann is a member of the President’s |
| Cabinet at the University of Alabama and the Board of Visitors of the |
| Culverhouse College of Commerce and Business Administration at the |
| University of Alabama. |
| |
| William O. McCoy (72) |
| |
| Year of Election or Appointment: 1997 |
| Prior to his retirement in December 1994, Mr. McCoy was Vice Chair- |
| man of the Board of BellSouth Corporation (telecommunications) and |
| President of BellSouth Enterprises. He is currently a Director of Liberty |
| Corporation (holding company), Duke Realty Corporation (real estate), |
| and Progress Energy, Inc. (electric utility). He is also a partner of Frank- |
| lin Street Partners (private investment management firm) and a member |
| of the Research Triangle Foundation Board. In addition, Mr. McCoy |
| served as the Interim Chancellor (1999-2000) and a member of the |
| Board of Visitors for the University of North Carolina at Chapel Hill and |
| currently serves on the Board of Directors of the University of North |
| Carolina Health Care System and the Board of Visitors of the Kenan- |
| Flagler Business School (University of North Carolina at Chapel Hill). He |
| also served as Vice President of Finance for the University of North Car- |
| olina (16-school system). |
43 Annual Report
Trustees and Officers - continued
| Name, Age; Principal Occupation |
| |
| Cornelia M. Small (61) |
| |
| Year of Election or Appointment: 2005 |
| Ms. Small is a member (2000-present) and Chairperson (2002-present) |
| of the Investment Committee, and a member (2002-present) of the |
| Board of Trustees of Smith College. Previously, she served as Chief In- |
| vestment Officer (1999-2000), Director of Global Equity Investments |
| (1996-1999), and a member of the Board of Directors of Scudder, Ste- |
| vens & Clark (1990-1997) and Scudder Kemper Investments |
| (1997-1998). In addition, Ms. Small served as Co-Chair (2000-2003) |
| of the Annual Fund for the Fletcher School of Law and Diplomacy. |
| |
| William S. Stavropoulos (66) |
| |
| Year of Election or Appointment: 2001 |
| Mr. Stavropoulos is Chairman of the Board (2000-present) and a Mem- |
| ber of the Board of Directors of The Dow Chemical Company. Since |
| joining The Dow Chemical Company in 1967, Mr. Stavropoulos served |
| in numerous senior management positions, including President |
| (1993-2000; 2002-2003), CEO (1995-2000; 2002-2004), and Chair- |
| man of the Executive Committee (2000-2004). Currently, he is a Direc- |
| tor of NCR Corporation (data warehousing and technology solutions), |
| BellSouth Corporation (telecommunications), Chemical Financial Corpo- |
| ration, Maersk Inc. (industrial conglomerate, 2002-present), and Metal- |
| mark Capital (private equity investment firm, 2005-present). He also |
| serves as a member of the Board of Trustees of the American Enterprise |
| Institute for Public Policy Research. In addition, Mr. Stavropoulos is a |
| member of The Business Council, J.P. Morgan International Council and |
| �� the University of Notre Dame Advisory Council for the College of |
| Science. |
| |
| Kenneth L. Wolfe (66) |
| |
| Year of Election or Appointment: 2005 |
| Mr. Wolfe also serves as a Trustee (2005-present) or Member of the |
| Advisory Board (2004-present) of other investment companies advised |
| by FMR. Prior to his retirement in 2001, Mr. Wolfe was Chairman and |
| Chief Executive Officer of Hershey Foods Corporation (1993-2001). He |
| currently serves as a member of the boards of Adelphia Communica- |
| tions Corporation (2003-present), Bausch & Lomb, Inc., and Revlon Inc. |
| (2004-present). |
Annual Report 44
Advisory Board Members and Executive Officers:
Correspondence intended for Mr. Gamper may be sent to Fidelity Investments, P.O. Box 55235, Boston, Massachusetts 02205-5235. Correspondence intended for each executive officer and Mr. Lynch may be sent to Fidelity Investments, 82 Devonshire Street, Boston, Massachusetts 02109.
| Name, Age; Principal Occupation |
| |
| Albert R. Gamper, Jr. (63) |
| |
| Year of Election or Appointment: 2005 |
| Member of the Advisory Board of Fidelity Advisor Series VIII. Prior to his |
| retirement in December 2004, Mr. Gamper served as Chairman of the |
| Board of CIT Group Inc. (commercial finance). During his tenure with |
| CIT Group Inc. Mr. Gamper served in numerous senior management |
| positions, including Chairman (1987-1989; 1999-2001; 2002-2004), |
| Chief Executive Officer (1987-2004), and President (1989-2002). He |
| currently serves as a member of the Board of Directors of Public Service |
| Enterprise Group (utilities, 2001-present), Chairman of the Board of |
| Governors, Rutgers University (2004-present), and Chairman of the |
| Board of Saint Barnabas Health Care System. |
| |
| Peter S. Lynch (61) |
| |
| Year of Election or Appointment: 2003 |
| Member of the Advisory Board of Fidelity Advisor Series VIII. Vice |
| Chairman and a Director of FMR, and Vice Chairman (2001-present) |
| and a Director (2000-present) of FMR Co., Inc. Previously, Mr. Lynch |
| served as a Trustee of the Fidelity funds (1990-2003). In addition, he |
| serves as a Trustee of Boston College, Massachusetts Eye & Ear |
| Infirmary, Historic Deerfield, John F. Kennedy Library, and the Museum |
| of Fine Arts of Boston. |
| |
| Dwight D. Churchill (51) |
| |
| Year of Election or Appointment: 2005 |
| Vice President of Advisor Emerging Markets. Mr. Churchill also serves |
| as Vice President of certain Equity Funds (2005-present) and certain |
| High Income Funds (2005-present). Previously, he served as Head of |
| Fidelity’s Fixed-Income Division (2000-2005), Vice President of Fidelity’s |
| Money Market Funds (2000-2005), Vice President of Fidelity’s Bond |
| Funds, and Senior Vice President of FIMM (2000) and FMR. Mr. Chur- |
| chill joined Fidelity in 1993 as Vice President and Group Leader of Tax- |
| able Fixed-Income Investments. |
45 Annual Report
Trustees and Officers - continued
| Name, Age; Principal Occupation |
| |
| Robert von Rekowsky (39) |
| |
| Year of Election or Appointment: 2005 |
| Vice President of Advisor Emerging Markets. Mr. von Rekowsky also |
| serves as Vice President of other funds advised by FMR. Prior to his cur- |
| rent responsibilities, Mr. von Rekowsky has worked as a research ana- |
| lyst and manager. |
| |
| Eric D. Roiter (56) |
| |
| Year of Election or Appointment: 2004 |
| Secretary of Advisor Emerging Markets. He also serves as Secretary of |
| other Fidelity funds; Vice President, General Counsel, and Secretary of |
| FMR Co., Inc. (2001-present) and FMR; Assistant Secretary of Fidelity |
| Management & Research (U.K.) Inc. (2001-present), Fidelity Manage- |
| ment & Research (Far East) Inc. (2001-present), and Fidelity Investments |
| Money Management, Inc. (2001-present). Mr. Roiter is an Adjunct |
| Member, Faculty of Law, at Boston College Law School (2003-present). |
| Previously, Mr. Roiter served as Vice President and Secretary of Fidelity |
| Distributors Corporation (FDC) (1998-2005). |
| |
| Stuart Fross (46) |
| |
| Year of Election or Appointment: 2004 |
| Assistant Secretary of Advisor Emerging Markets. Mr. Fross also serves |
| as Assistant Secretary of other Fidelity funds (2003-present), Vice Presi- |
| dent and Secretary of FDC (2005-present), and is an employee of FMR. |
| |
| Christine Reynolds (47) |
| |
| Year of Election or Appointment: 2004 |
| President, Treasurer, and Anti-Money Laundering (AML) officer of Advi- |
| sor Emerging Markets. Ms. Reynolds also serves as President, Treasurer, |
| and AML officer of other Fidelity funds (2004) and is a Vice President |
| (2003) and an employee (2002) of FMR. Before joining Fidelity Invest- |
| ments, Ms. Reynolds worked at PricewaterhouseCoopers LLP (PwC) |
| (1980-2002), where she was most recently an audit partner with PwC’s |
| investment management practice. |
| |
| Paul M. Murphy (58) |
| |
| Year of Election or Appointment: 2005 |
| Chief Financial Officer of Advisor Emerging Markets. Mr. Murphy also |
| serves as Chief Financial Officer of other Fidelity funds (2005-present). |
| He also serves as Senior Vice President of Fidelity Pricing and Cash |
| Management Services Group (FPCMS). |
Annual Report 46
| Name, Age; Principal Occupation |
| |
| Kenneth A. Rathgeber (58) |
| |
| Year of Election or Appointment: 2004 |
| Chief Compliance Officer of Advisor Emerging Markets. Mr. Rathgeber |
| also serves as Chief Compliance Officer of other Fidelity funds (2004) |
| and Executive Vice President of Risk Oversight for Fidelity Investments |
| (2002). Previously, he served as Executive Vice President and Chief Op- |
| erating Officer for Fidelity Investments Institutional Services Company, |
| Inc. (1998-2002). |
| |
| John R. Hebble (47) |
| |
| Year of Election or Appointment: 2004 |
| Deputy Treasurer of Advisor Emerging Markets. Mr. Hebble also serves |
| as Deputy Treasurer of other Fidelity funds (2003), and is an employee |
| of FMR. Before joining Fidelity Investments, Mr. Hebble worked at |
| Deutsche Asset Management where he served as Director of Fund Ac- |
| counting (2002-2003) and Assistant Treasurer of the Scudder Funds |
| (1998-2003). |
| |
| Bryan A. Mehrmann (44) |
| |
| Year of Election or Appointment: 2005 |
| Deputy Treasurer of Advisor Emerging Markets. Mr. Mehrmann also |
| serves as Deputy Treasurer of other Fidelity funds (2005-present) and is |
| an employee of FMR. Previously, Mr. Mehrmann served as Vice Presi- |
| dent of Fidelity Investments Institutional Services Group (FIIS)/Fidelity |
| Investments Institutional Operations Corporation, Inc. (FIIOC) Client |
| Services (1998-2004). |
| |
| Kimberley H. Monasterio (41) |
| |
| Year of Election or Appointment: 2004 |
| Deputy Treasurer of Advisor Emerging Markets. Ms. Monasterio also |
| serves as Deputy Treasurer of other Fidelity funds (2004) and is an em- |
| ployee of FMR (2004). Before joining Fidelity Investments, Ms. Monas- |
| terio served as Treasurer (2000-2004) and Chief Financial Officer |
| (2002-2004) of the Franklin Templeton Funds and Senior Vice President |
| of Franklin Templeton Services, LLC (2000-2004). |
| |
| Kenneth B. Robins (36) |
| |
| Year of Election or Appointment:2005 |
| Deputy Treasurer of Advisor Emerging Markets. Mr. Robins also serves |
| as Deputy Treasurer of other Fidelity funds (2005-present) and is an |
| employee of FMR (2004-present). Before joining Fidelity Investments, |
| Mr. Robins worked at KPMG LLP, where he was a partner in KPMG’s |
| department of professional practice (2002-2004) and a Senior Manag- |
| er (1999-2000). In addition, Mr. Robins served as Assistant Chief Ac- |
| countant, United States Securities and Exchange Commission |
| (2000-2002). |
47 Annual Report
Trustees and Officers - continued
| Name, Age; Principal Occupation |
| |
| Robert G. Byrnes (38) |
| |
| Year of Election or Appointment: 2005 |
| Assistant Treasurer of Advisor Emerging Markets. Mr. Byrnes also serves |
| as Assistant Treasurer of other Fidelity funds (2005-present) and is an |
| employee of FMR (2005-present). Previously, Mr. Byrnes served as Vice |
| President of FPCMS (2003-2005). Before joining Fidelity Investments, |
| Mr. Byrnes worked at Deutsche Asset Management where he served as |
| Vice President of the Investment Operations Group (2000-2003). |
| |
| John H. Costello (59) |
| |
| Year of Election or Appointment: 2004 |
| Assistant Treasurer of Advisor Emerging Markets. Mr. Costello also |
| serves as Assistant Treasurer of other Fidelity funds and is an employee |
| of FMR. |
| |
| Peter L. Lydecker (51) |
| |
| Year of Election or Appointment: 2004 |
| Assistant Treasurer of Advisor Emerging Markets. Mr. Lydecker also |
| serves as Assistant Treasurer of other Fidelity funds (2004) and is an |
| employee of FMR. |
| |
| Mark Osterheld (50) |
| |
| Year of Election or Appointment: 2004 |
| Assistant Treasurer of Advisor Emerging Markets. Mr. Osterheld also |
| serves as Assistant Treasurer of other Fidelity funds (2002) and is an |
| employee of FMR. |
| |
| Gary W. Ryan (47) |
| |
| Year of Election or Appointment: 2005 |
| Assistant Treasurer of Advisor Emerging Markets. Mr. Ryan also serves |
| as Assistant Treasurer of other Fidelity funds (2005-present) and is an |
| employee of FMR (2005-present). Previously, Mr. Ryan served as Vice |
| President of Fund Reporting in FPCMS (1999-2005). |
| |
| Salvatore Schiavone (39) |
| |
| Year of Election or Appointment: 2005 |
| Assistant Treasurer of Advisor Emerging Markets. Mr. Schiavone also |
| serves as Assistant Treasurer of other Fidelity funds (2005-present) and |
| is an employee of FMR (2005-present). Before joining Fidelity Invest- |
| ments, Mr. Schiavone worked at Deutsche Asset Management, where he |
| most recently served as Assistant Treasurer (2003-2005) of the Scudder |
| Funds and Vice President and Head of Fund Reporting (1996-2003). |
Annual Report 48
Board Approval of Investment Advisory Contracts and Management Fees
Advisor Emerging Markets Fund
Each year, typically in July, the Board of Trustees, including the independent Trustees (together, the Board), votes on the renewal of the management contract and sub-advisory agreements (together, the Advisory Contracts) for the fund. The Board, assisted by the advice of fund counsel and independent Trustees’ counsel, requests and considers a broad range of information throughout the year.
The Board meets regularly each month except August and takes into account throughout the year matters bearing on Advisory Contracts. The Board, acting directly and through its separate committees, considers at each of its meetings factors that are relevant to the annual renewal of the fund’s Advisory Contracts, including the services and support provided to the fund and its shareholders by Fidelity. At the time of the renewal, the Board had 11 standing committees, each composed of independent Trustees with varying backgrounds, to which the Board has assigned specific subject matter responsibilities in order to enhance effective decision-making by the Board. Each committee has adopted a written charter outlining the structure and purposes of the committee. One such committee, the Equity Contract Committee, meets periodically during the first six months of each year and as necessary to consider matters specifically related to the annual renewal of Advisory Contracts. The committee requests and receives information on, and makes recommendations to the independent Trustees concerning, the approval and annual review of the Advisory Contracts.
At its July 2005 meeting, the Board of Trustees, including the independent Trustees, unanimously determined to renew the Advisory Contracts for the fund. In reaching its determination, the Board considered all factors it believed relevant, including (1) the nature, extent, and quality of the services to be provided to the fund and its shareholders by Fidelity (including the investment performance of the fund); (2) the competitiveness of the management fee and total expenses of the fund; (3) the total costs of the services to be provided by and the profits to be realized by the investment adviser and its affiliates from the relationship with the fund; (4) the extent to which economies of scale would be realized as the fund grows; and (5) whether fee levels reflect these economies of scale, if any, for the benefit of fund shareholders.
In determining whether to renew the Advisory Contracts for the fund, the Board ultimately reached a determination, with the assistance of fund counsel and independent Trustees’ counsel, that the renewal of the Advisory Contracts and the compensation to be received by Fidelity under the management contract is consistent with Fidelity’s fiduciary duty under applicable law. In addition to evaluating the specific factors noted above, the Board, in reaching its determination, is aware that shareholders in the fund have a broad range of investment choices available to them, including a wide choice among mutual funds offered by competitors to Fidelity, and that the fund’s shareholders, with the opportunity to review and weigh the disclosure provided by the fund in its
49 Annual Report
Board Approval of Investment Advisory Contracts and Management Fees - continued
prospectus and other public disclosures, have chosen to invest in this fund, managed by Fidelity.
Nature, Extent, and Quality of Services Provided by Fidelity. The Board considered staffing within the investment adviser, FMR, and the sub-advisers (together, the Investment Advisers), including the background of the fund’s portfolio manager and the fund’s investment objective and discipline. The independent Trustees also had discussions with senior management of Fidelity’s investment operations and investment groups. The Board considered the structure of the portfolio manager compensation program and whether this structure provides appropriate incentives.
Fidelity Resources Dedicated to Investment Management and Support Services. The Board reviewed the size, education, and experience of the Investment Advisers’ investment staff, their use of technology, and the Investment Advisers’ approach to recruiting, training, and retaining portfolio managers and other research, advisory, and management personnel. The Board considered Fidelity’s extensive global research capabilities that enable the Investment Advisers to aggregate data from various sources in an effort to produce positive investment results. The Board noted that Fidelity’s analysts have access to a variety of technological tools that enable them to perform both fundamental and quantitative analysis and to specialize in various disciplines. The Board also considered that Fidelity’s portfolio managers and analysts have access to daily portfolio attribution that allows for monitoring of a fund’s portfolio, as well as an electronic communication system that provides immediate real-time access to research concerning issuers and credit enhancers.
Shareholder and Administrative Services. The Board considered the nature, extent, quality, and cost of administrative, distribution, and shareholder services performed by the Investment Advisers and their affiliates under the Advisory Contracts and under separate agreements covering transfer agency, pricing and bookkeeping, and securities lending services for the fund. The Board also considered the nature and extent of the Investment Advisers’ supervision of third party service providers, principally custodians and subcustodians. The Board reviewed the allocation of fund brokerage, including allocations to brokers affiliated with the Investment Advisers, the use of brokerage commissions to pay fund expenses, and the use of “soft” commission dollars to pay for research services. The Board also considered that Fidelity voluntarily decided in 2004 to stop using “soft” commission dollars to pay for market data and, instead, to pay for that data out of its own resources. The Board also considered the resources devoted to, and the record of compliance with, the fund’s compliance policies and procedures.
The Board noted that the growth of fund assets across the complex allows Fidelity to reinvest in the development of services designed to enhance the value or convenience of the Fidelity funds as investment vehicles. These services include 24-hour access to
account information and market information through phone representatives and over the Internet, and investor education materials and asset allocation tools.
Investment in a Large Fund Family. The Board considered the benefits to shareholders of investing in a Fidelity fund, including the benefits of investing in a fund that is part of a large family of funds offering a variety of investment disciplines and providing for a large variety of mutual fund investor services. For example, fund shareholders are offered the privilege of exchanging shares of the fund for shares of other Fidelity funds, as set forth in the fund’s prospectus, without paying an additional sales charge. The Board noted that, since July 2004, Fidelity has taken a number of actions that benefited particular funds, including (i) voluntarily deciding in 2004 to stop using “soft” commission dollars to pay for market data and, instead, to pay for that data out of its own resources, (ii) contractually agreeing to impose management fee reductions and expense limitations on its five Spartan stock index funds and its stock index fund available through variable insurance products, (iii) contractually agreeing to eliminate the management fees on the Fidelity Freedom Funds and the Fidelity Advisor Freedom Funds, (iv) contractually agreeing to reduce the management fees on most of its investment-grade taxable bond funds, and (v) contractually agreeing to impose expense limitations on its retail and Spartan investment-grade taxable bond funds.
Investment Performance and Compliance. The Board considered whether the fund has operated within its investment objective, as well as its record of compliance with its investment restrictions. The Board noted that it is not possible to evaluate performance in any comprehensive fashion because the fund had been in operation for less than one calendar year. Once the fund has been in operation for at least one calendar year, the Board will review the fund’s absolute investment performance for each class, as well as the fund’s relative investment performance for each class measured against (i) a broad-based securities market index and (ii) a peer group of mutual funds deemed appropriate by the Board.
The Board has had thorough discussions with FMR throughout the year about the Board’s and FMR’s concerns about equity research, equity fund performance, and compliance with internal policies governing gifts and entertainment. FMR has taken steps that it believes will refocus and strengthen equity research and equity portfolio management and compliance. The Board noted with favor FMR’s recent reorganization of its senior management team and FMR’s plans to dedicate additional resources to investment research, and participated in the process that led to those changes.
Based on its review, and giving particular weight to the nature and quality of the resources dedicated by the Investment Advisers to maintain and improve relative performance, the Board concluded that the nature, extent, and quality of the services provided by Fidelity will benefit the fund’s shareholders, particularly in light of the
51 Annual Report
Board Approval of Investment Advisory Contracts and Management Fees - continued
Board’s view that the fund’s shareholders benefit from investing in a fund that is part of a large family of funds offering a variety of investment disciplines and services.
Competitiveness of Management Fee and Total Fund Expenses. The Board considered the fund’s management fee and total expenses compared to “mapped groups” of competitive funds and classes. Fidelity creates “mapped groups” by combining similar Lipper investment objective categories that have comparable management fee characteristics. Combining Lipper investment objective categories aids the Board’s management fee and total expense comparisons by broadening the competitive group used for comparison and by reducing the number of universes to which various Fidelity funds are compared.
The Board considered two proprietary management fee comparisons for the period of the fund’s operations shown in the chart below. The group of Lipper funds used by the Board for management fee comparisons is referred to below as the “Total Mapped Group” and, for the reasons explained above, is broader than the Lipper peer group used by the Board for performance comparisons. The Total Mapped Group comparison focuses on a fund’s standing relative to the total universe of comparable funds available to investors, in terms of gross management fees before expense reimbursements or caps. “TMG %” represents the percentage of funds in the Total Mapped Group that had management fees that were lower than the fund’s. For example, a TMG % of 28% means that 72% of the funds in the Total Mapped Group had higher management fees than the fund. The “Asset-Size Peer Group” (ASPG) comparison focuses on a fund’s standing relative to non-Fidelity funds similar in size to the fund within the Total Mapped Group. The ASPG represents at least 15% of the funds in the Total Mapped Group with comparable asset size and management fee characteristics, subject to a minimum of 50 funds (or all funds in the Total Mapped Group if fewer than 50). Additional information, such as the ASPG quartile (“quadrant”) in which the fund’s management fee ranked, is also included in the chart and considered by the Board.

The Board noted that the fund’s management fee ranked below the median of its Total Mapped Group and below the median of its ASPG for the period.
Based on its review, the Board concluded that the fund’s management fee was fair and reasonable in light of the services that the fund receives and the other factors considered.
In its review of each class’s total expenses, the Board considered the fund’s management fee as well as other fund or class expenses, as applicable, such as transfer agent fees, pricing and bookkeeping fees, fund-paid 12b-1 fees, and custodial, legal, and audit fees. The Board also noted the effects of any waivers and reimbursements on fees and expenses. As part of its review, the Board also considered current and historical total expenses of each class of the fund compared to competitive fund median expenses. Each class of the fund is compared to those funds and classes in the Total Mapped Group (used by the Board for management fee comparisons) that have a similar sales load structure.
The Board noted that the total expenses of Class A ranked below its competitive median for the period, the total expenses of each of Class B and Class C ranked equal to its competitive median for the period, and the total expenses of each of Class T and Institutional Class ranked above its competitive median for the period. The Board noted that the fund offers multiple classes, each of which has a different sales load and 12b-1 fee structure, and that the multiple structures are intended to offer a range of pricing options for the intermediary market. The Board also noted that the total expenses of the classes vary primarily by the level of their 12b-1 fees, although differences in transfer agent fees may also cause expenses to vary from class to class.
53 Annual Report
Board Approval of Investment Advisory Contracts and Management Fees - continued
Furthermore, the Board considered that on December 16, 2004, it had approved changes (effective January 1, 2005) in the transfer agent and service agreements for the fund that established maximum transfer agent fees and eliminated the minimum pricing and bookkeeping fee to prevent small funds or funds with small average account sizes from having relatively high fees in basis points (the “small-fund fee reductions”). The Board considered that, if the small-fund fee reductions had been in effect in 2004, the total expenses of each of Class T and Institutional Class would have ranked below the median.
In its review of total expenses, the Board also considered Fidelity fee structures and other information on clients that FMR and its affiliates service in other competitive markets, such as other mutual funds advised or subadvised by FMR or its affiliates, pension plan clients, and other institutional clients.
Based on its review, the Board concluded that the total expenses for each class of the fund were reasonable, although in some cases above the median of the universe presented for comparison, in light of the services that the fund and its shareholders receive and the other factors considered.
Costs of the Services and Profitability. The Board considered the revenues earned and the expenses incurred by Fidelity in conducting the business of developing, marketing, distributing, managing, administering and servicing the fund and its shareholders. The Board also considered the level of Fidelity’s profits in respect of all the Fidelity funds.
On an annual basis, FMR presents to the Board Fidelity’s profitability for the fund. Fidelity calculates the profitability for each fund, as well as aggregate profitability for groups of Fidelity funds and all Fidelity funds, using a series of detailed revenue and cost allocation methodologies which originate with the audited books and records of Fidelity. The Audit Committee of the Board reviews any significant changes from the prior year’s methodologies.
PricewaterhouseCoopers LLP (PwC), independent registered accounting firm and auditor to Fidelity and certain Fidelity funds, has been engaged annually by the Board as part of the Board’s assessment of the results of Fidelity’s profitability analysis. PwC’s engagement includes the review and assessment of Fidelity’s methodologies used in determining the revenues and expenses attributable to Fidelity’s mutual fund business, and completion of agreed-upon procedures surrounding the mathematical accuracy of fund profitability and its conformity to allocation methodologies. After considering PwC’s reports issued under the engagement and information provided by Fidelity, the Board believes that while other allocation methods may also be reasonable, Fidelity’s profitability methodologies are reasonable in all material respects.
The Board has also reviewed Fidelity’s non-fund businesses and any fall-out benefits related to the mutual fund business as well as cases where Fidelity’s affiliates may
benefit from or be related to the fund’s business. In addition, a special committee of the Board reviewed services provided to Fidelity by its affiliates and determined that the fees that Fidelity paid for such services were reasonable.
The Board considered the costs of the services provided by and the profits realized by Fidelity in connection with the operation of the fund and determined that the amount of profit is a fair entrepreneurial profit for the management of the fund.
Economies of Scale. The Board considered whether there have been economies of scale in respect of the management of the Fidelity funds, whether the Fidelity funds (including the fund) have appropriately benefited from any such economies of scale, and whether there is potential for realization of any further economies of scale. The Board considered the extent to which the fund will benefit from economies of scale through increased services to the fund, through waivers or reimbursements, or through fee or expense reductions, including reductions that occur through operation of the transfer agent agreement. The transfer agent fee varies in part based on the number of accounts in the fund. If the number of accounts decreases or the average account size increases, the overall transfer agent fee rate decreases.
The Board recognized that the fund’s management contract incorporates a “group fee” structure, which provides for lower fee rates as total fund assets under FMR’s management increase, and for higher fee rates as total fund assets under FMR’s management decrease. The Board considered that the group fee is designed to deliver the benefits of economies of scale to fund shareholders when total fund assets increase, even if assets of any particular fund are unchanged or have declined, because some portion of Fidelity’s costs are attributable to services provided to all Fidelity funds, and all funds benefit if those costs can be allocated among more assets. The Board concluded that, given the group fee structure, fund shareholders will achieve a certain level of economies of scale as assets under FMR’s management increase at the fund complex level, regardless of whether Fidelity achieves any such economies of scale.
The Board further concluded that any potential economies of scale are being shared between fund shareholders and Fidelity in an appropriate manner.
Additional Information Requested by the Board. In order to develop fully the factual basis for consideration of the Advisory Contracts, the Board requested additional information regarding (i) equity fund transfer agency fees; (ii) Fidelity’s fund profitability methodology and the impact of various changes in the methodology over time; (iii) benefits to shareholders from economies of scale; (iv) composition and characteristics of various fund and industry data used in comparisons; and (v) compensation of portfolio managers and research analysts.
Based on its evaluation of all of the conclusions noted above, and after considering all material factors, the Board ultimately concluded that the existing advisory fee structures are fair and reasonable, and that the fund’s existing Advisory Contracts should be renewed.
55 Annual Report
Investment Adviser
Fidelity Management & Research Company
Boston, MA
Investment Sub-Advisers
FMR Co., Inc.
Fidelity Management & Research
(U.K.) Inc.
Fidelity Management & Research
(Far East) Inc.
Fidelity International
Investment Advisors
Fidelity Investments Japan Limited
Fidelity International Investment
Advisors (U.K.) Limited
General Distributor
Fidelity Distributors Corporation
Boston, MA
Transfer and Service Agent
Fidelity Investments Institutional
Operations Company, Inc.
Boston, MA
Custodian
JPMorgan Chase Bank
New York, NY
|


Fidelity® Advisor
Emerging Markets
Fund - Institutional Class
Annual Report October 31, 2005

| Contents | | | | |
| |
| Chairman’s Message | | 4 | | Ned Johnson’s message to shareholders. |
| Performance | | 6 | | How the fund has done over time. |
| Management’s Discussion | | 7 | | The manager’s review of fund |
| | | | | performance, strategy and outlook. |
| Shareholder Expense | | 8 | | An example of shareholder expenses. |
| Example | | | | |
| Investment Changes | | 10 | | A summary of major shifts in the fund’s |
| | | | | investments over the past six months. |
| Investments | | 11 | | A complete list of the fund’s investments |
| | | | | with their market values. |
| Financial Statements | | 19 | | Statements of assets and liabilities, |
| | | | | operations, and changes in net assets, |
| | | | | as well as financial highlights. |
| Notes | | 28 | | Notes to the financial statements. |
| Report of Independent | | 36 | | |
| Registered Public | | | | |
| Accounting Firm | | | | |
| Trustees and Officers | | 38 | | |
| Board Approval of | | 48 | | |
| Investment Advisory | | | | |
| Contracts and | | | | |
| Management Fees | | | | |
To view a fund’s proxy voting guidelines and proxy voting record for the 12-month period ended June 30, visit www.fidelity.com/proxyvotingresults or visit the Securities and Exchange Commission’s (SEC) web site at www.sec.gov. You may also call 1-877-208-0098 to request a free copy of the proxy voting guidelines.
Standard & Poor’s, S&P and S&P 500 are registered service marks of The McGraw-Hill Companies, Inc. and have been licensed for use by Fidelity Distributors Corporation.
Other third party marks appearing herein are the property of their respective owners.
All other marks appearing herein are registered or unregistered trademarks or service marks of FMR Corp. or an affiliated company.
This report and the financial statements contained herein are submitted for the general information of the shareholders of the fund. This report is not authorized for distribution to prospective investors in the fund unless preceded or accompanied by an effective prospectus.
A fund files its complete schedule of portfolio holdings with the SEC for the first and third quarters of each fiscal year on Form N-Q. Forms N-Q are available on the SEC’s web site at http://www.sec.gov. A fund’s Forms N-Q may be reviewed and copied at the SEC’s Public Reference Room in Washington, DC. Information regarding the operation of the SEC’s Public Reference Room may be obtained by calling 1-800-SEC-0330. For a complete list of a fund’s portfolio holdings, view the most recent quarterly holdings report, semiannual report, or annual report on Fidelity’s web site at http://www.advisor.fidelity.com.
NOT FDIC INSURED · MAY LOSE VALUE · NO BANK GUARANTEE
Neither the fund nor Fidelity Distributors Corporation is a bank.
3 Annual Report
Chairman’s Message
(Photograph of Edward C. Johnson 3d)
Dear Shareholder:
During the past year or so, much has been reported about the mutual fund industry, and much of it has been more critical than I believe is warranted. Allegations that some companies have been less than forthright with their shareholders have cast a shadow on the entire industry. I continue to find these reports disturbing, and assert that they do not create an accurate picture of the industry overall. Therefore, I would like to remind everyone where Fidelity stands on these issues. I will say two things specifically regarding allegations that some mutual fund companies were in violation of the Securities and Exchange Commission’s forward pricing rules or were involved in so-called “market timing” activities.
First, Fidelity has no agreements that permit customers who buy fund shares after 4 p.m. to obtain the 4 p.m. price. This is not a new policy. This is not to say that someone could not deceive the company through fraudulent acts. However, we are extremely diligent in preventing fraud from occurring in this manner — and in every other. But I underscore again that Fidelity has no so-called “agreements” that sanction illegal practices.
Second, Fidelity continues to stand on record, as we have for years, in opposition to predatory short-term trading that adversely affects shareholders in a mutual fund. Back in the 1980s, we initiated a fee — which is returned to the fund and, therefore, to investors — to discourage this activity. Further, we took the lead several years ago in developing a Fair Value Pricing Policy to prevent market timing on foreign securities in our funds. I am confident we will find other ways to make it more difficult for predatory traders to operate. However, this will only be achieved through close cooperation among regulators, legislators and the industry.
Yes, there have been unfortunate instances of unethical and illegal activity within the mutual fund industry from time to time. That is true of any industry. When this occurs, confessed or convicted offenders should be dealt with appropriately. But we are still concerned about the risk of over-regulation and the quick application of simplistic solutions to intricate problems. Every system can be improved, and we support and applaud well thought out improvements by regulators, legislators and industry representatives that achieve the common goal of building and protecting the value of investors’ holdings.
For nearly 60 years, Fidelity has worked very hard to improve its products and service to justify your trust. When our family founded this company in 1946, we had only a few hundred customers. Today, we serve more than 18 million customers including individual investors and participants in retirement plans across America.
Annual Report 4
Let me close by saying that we do not take your trust in us for granted, and we realize that we must always work to improve all aspects of our service to you. In turn, we urge you to continue your active participation with your financial matters, so that your interests can be well served.
Best regards,
/s/Edward C. Johnson 3d
5 Annual Report
Performance: The Bottom Line
Average annual total return reflects the change in the value of an investment, assuming reinvestment of the class’ dividend income and capital gains (the profits earned upon the sale of securities that have grown in value) and assuming a constant rate of performance each year. The $10,000 table and the fund’s returns do not reflect the deduction of taxes that a shareholder would pay on fund distributions or the redemption of fund shares. During periods of reimbursement by Fidelity, a fund’s total return will be greater than it would be had the reimbursement not occurred. How a fund did yesterday is no guarantee of how it will do tomorrow.
| Average Annual Total Returns | | | | |
| Periods ended October 31, 2005 | | Past 1 | | Life of |
| | | year | | FundA |
| Fidelity Advisor Emerging Markets | | | | |
| Institutional ClassA | | 39.53% | | 22.42% |
| A From March 29, 2004. | | | | |
$10,000 Over Life of Fund
Let’s say hypothetically that $10,000 was invested in Fidelityr Advisor Emerging Markets Fund — Institutional Class on March 29, 2004, when the fund started. The chart shows how the value of your investment would have changed, and also shows how the Morgan Stanley Capital InternationalSM Emerging Markets Index performed over the same period.

Annual Report 6
Management’s Discussion of Fund Performance
Comments from Robert von Rekowsky, Portfolio Manager of Fidelity® Advisor Emerging Markets Fund
Emerging-markets stocks posted strong gains for the year ending October 31, 2005, as the Morgan Stanley Capital InternationalSM Emerging Markets Index soared 34.34% . The lofty return was largely driven by the skyrocketing prices of oil and other commodities. Many emerging markets are commodity exporters — particularly in Latin America — which helped the economies and fiscal health of these countries. As such, the Latin American region generally outperformed other emerging markets. Still, neither of the top two performers were in the Western Hemisphere. Egypt and Jordan topped the index, despite making up less than 1.00% of the index combined on average during the period. Stocks in the Far East posted strong absolute returns, but mostly trailed other emerging markets because they are primarily exporters of technology, which saw diminished demand. South Korea, the largest component of the index during the past year, rose more than 46%. However, Taiwan, the second-largest constituent, was a significant drag, gaining only 4%. Brazil, the largest Latin American component, was up more than 75%.
During the past year, the fund’s Institutional Class shares gained 39.53%, outpacing the MSCIr Emerging Markets index and the LipperSM Emerging Markets Funds Average, which returned 32.14% . Despite increasing oil prices, concerns about rising U.S. interest rates and uncertainty regarding global growth, emerging-markets equities performed quite well. Good stock picking and the resulting country weightings fueled the fund’s outperformance versus the index. In terms of individual holdings, Samsung — by far the largest position in the fund — was a strong contributor in absolute terms. Samsung is the low-cost leader in most of its businesses and has made great strides in building its brand name. America Movil, a mobile phone company headquartered in Mexico, was another contributor — both on an absolute basis and relative to the index. The company benefited from subscriber additions in South and Central America, where mobile phone penetration was low. Egyptian mobile phone company Orascom Telecom, and Brazilian bank Banco Bradesco, also boosted returns. On a less favorable note, profitability concerns hurt Harmony Gold, a South African mining company. China International Marine Containers — the world’s largest manufacturer of shipping containers — was another notable detractor. Investor concerns about weakening global shipping demand put pressure on its shares.
The views expressed in this statement reflect those of the portfolio manager only through the end of the period of the report as stated on the cover and do not necessarily represent the views of Fidelity or any other person in the Fidelity organization. Any such views are subject to change at any time based upon market or other conditions and Fidelity disclaims any responsibility to update such views. These views may not be relied on as investment advice and, because investment decisions for a Fidelity fund are based on numerous factors, may not be relied on as an indication of trading intent on behalf of any Fidelity fund.
Shareholder Expense Example
As a shareholder of the Fund, you incur two types of costs: (1) transaction costs, including sales charges (loads) on purchase payments or redemption proceeds, redemption fees, and (2) ongoing costs, including management fees, distribution and/or service (12b-1) fees and other Fund expenses. This Example is intended to help you understand your ongoing costs (in dollars) of investing in the Fund and to compare these costs with the ongoing costs of investing in other mutual funds.
The Example is based on an investment of $1,000 invested at the beginning of the period and held for the entire period (May 1, 2005 to October 31, 2005).
The first line of the table below for each class of the Fund provides information about actual account values and actual expenses. You may use the information in this line, together with the amount you invested, to estimate the expenses that you paid over the period. Simply divide your account value by $1,000.00 (for example, an $8,600 account value divided by $1,000.00 = 8.6), then multiply the result by the number in the first line for a class of the Fund under the heading entitled “Expenses Paid During Period” to estimate the expenses you paid on your account during this period.
Hypothetical Example for Comparison Purposes
The second line of the table below for each class of the Fund provides information about hypothetical account values and hypothetical expenses based on a Class’ actual expense ratio and an assumed rate of return of 5% per year before expenses, which is not the Class’ actual return. The hypothetical account values and expenses may not be used to estimate the actual ending account balance or expenses you paid for the period. You may use this information to compare the ongoing costs of investing in the Fund and other funds. To do so, compare this 5% hypothetical example with the 5% hypothetical examples that appear in the shareholder reports of the other funds.
Please note that the expenses shown in the table are meant to highlight your ongoing costs only and do not reflect any transaction costs. Therefore, the second line of the table is useful in comparing ongoing costs only, and will not help you determine the relative total costs of owning different funds. In addition, if these transactional costs were included, your costs would have been higher.
| | | | | | | | | | | | | Expenses Paid |
| | | | | Beginning | | | | Ending | | | | During Period* |
| | | | | Account Value | | | | Account Value | | | | May 1, 2005 |
| | | | | May 1, 2005 | | | | October 31, 2005 | | to October 31, 2005 |
| Class A | | | | | | | | | | | | |
| Actual | | $ | | 1,000.00 | | $ | | 1,212.50 | | $ | | 8.92 |
| HypotheticalA | | $ | | 1,000.00 | | $ | | 1,017.14 | | $ | | 8.13 |
| Class T | | | | | | | | | | | | |
| Actual | | $ | | 1,000.00 | | $ | | 1,210.40 | | $ | | 10.31 |
| HypotheticalA | | $ | | 1,000.00 | | $ | | 1,015.88 | | $ | | 9.40 |
| Class B | | | | | | | | | | | | |
| Actual | | $ | | 1,000.00 | | $ | | 1,207.10 | | $ | | 13.07 |
| HypotheticalA | | $ | | 1,000.00 | | $ | | 1,013.36 | | $ | | 11.93 |
Annual Report 8
| | | | | | | | | | | | | Expenses Paid |
| | | | | Beginning | | | | Ending | | | | During Period* |
| | | | | Account Value | | | | Account Value | | | | May 1, 2005 |
| | | | | May 1, 2005 | | | | October 31, 2005 | | to October 31, 2005 |
| Class C | | | | | | | | | | | | |
| Actual | | $ | | 1,000.00 | | $ | | 1,208.00 | | $ | | 13.08 |
| HypotheticalA | | $ | | 1,000.00 | | $ | | 1,013.36 | | $ | | 11.93 |
| Institutional Class | | | | | | | | | | | | |
| Actual | | $ | | 1,000.00 | | $ | | 1,213.70 | | $ | | 7.53 |
| HypotheticalA | | $ | | 1,000.00 | | $ | | 1,018.40 | | $ | | 6.87 |
| |
| A 5% return per year before expenses | | | | | | | | |
* Expenses are equal to each Class’ annualized expense ratio (shown in the table below); multiplied by the average account value over the period, multiplied by 184/365 (to reflect the one-half year period).
| | | Annualized |
| | | Expense Ratio |
| Class A | | 1.60% |
| Class T | | 1.85% |
| Class B | | 2.35% |
| Class C | | 2.35% |
| Institutional Class | | 1.35% |
9 Annual Report
Investment Changes
| Top Five Stocks as of October 31, 2005 | | | | |
| | | % of fund’s | | % of fund’s net assets |
| | | net assets | | 6 months ago |
| Samsung Electronics Co. Ltd. (Korea (South), | | | | |
| Semiconductors & Semiconductor Equipment) | | 5.6 | | 6.6 |
| America Movil SA de CV Series L sponsored | | | | |
| ADR (Mexico, Wireless Telecommunication | | | | |
| Services) | | 3.1 | | 2.4 |
| Lukoil Oil Co. sponsored ADR (Russia, Oil, Gas | | | | |
| & Consumable Fuels) | | 2.8 | | 1.5 |
| Petroleo Brasileiro SA Petrobas (Brazil, Oil, Gas | | | | |
| & Consumable Fuels) | | 2.5 | | 1.9 |
| China Mobile (Hong Kong) Ltd. (Hong Kong, | | | | |
| Wireless Telecommunication Services) | | 1.9 | | 0.0 |
| | | 15.9 | | |
| Top Five Market Sectors as of October 31, 2005 | | |
| | | % of fund’s | | % of fund’s net assets |
| | | net assets | | 6 months ago |
| Financials | | 20.2 | | 19.9 |
| Information Technology | | 17.1 | | 16.0 |
| Energy | | 14.3 | | 10.7 |
| Telecommunication Services | | 11.0 | | 11.0 |
| Materials | | 10.5 | | 10.3 |
| Top Five Countries as of October 31, 2005 | | |
| (excluding cash equivalents) | | % of fund’s | | % of fund’s net assets |
| | | net assets | | 6 months ago |
| Korea (South) | | 21.9 | | 23.2 |
| Brazil | | 13.5 | | 9.1 |
| South Africa | | 9.8 | | 11.4 |
| Taiwan | | 8.8 | | 8.9 |
| Russia | | 7.2 | | 5.3 |
| Percentages are adjusted for the effect of open futures contracts, if applicable. | | |
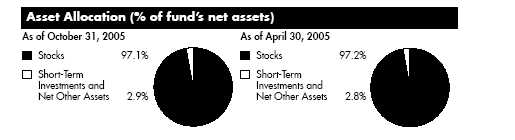
Annual Report 10
| Investments October 31, 2005 | | | | | | |
| Showing Percentage of Net Assets | | | | | | |
| |
| Common Stocks — 96.8% | | | | | | |
| | | Shares | | Value (Note 1) |
| |
| Argentina – 0.3% | | | | | | |
| Inversiones y Representaciones SA sponsored GDR (a) | | 5,600 | | $ | | 64,792 |
| Nortel Inversora SA (PN-B) sponsored ADR (a) | | 2,000 | | | | 20,020 |
| TOTAL ARGENTINA | | | | | | 84,812 |
| |
| Austria – 0.7% | | | | | | |
| Raiffeisen International Bank Holding AG | | 3,300 | | | | 207,683 |
| Bermuda – 0.8% | | | | | | |
| Aquarius Platinum Ltd. (Australia) | | 10,500 | | | | 78,514 |
| Central European Media Enterprises Ltd. Class A (a) | | 2,800 | | | | 130,172 |
| Sinochem Hong Kong Holding Ltd. (a) | | 195,200 | | | | 31,475 |
| TOTAL BERMUDA | | | | | | 240,161 |
| |
| Brazil – 13.5% | | | | | | |
| AES Tiete SA (PN) | | 4,793,600 | | | | 105,375 |
| Banco Bradesco SA: | | | | | | |
| (PN) | | 9,000 | | | | 463,229 |
| (PN) sponsored ADR (non-vtg.) | | 1,100 | | | | 57,079 |
| Banco Itau Holding Financeira SA (PN) | | 14,470 | | | | 345,139 |
| Banco Nossa Caixa SA | | 700 | | | | 11,595 |
| Companhia Energetica de Minas Gerais (CEMIG) (PN) | | | | | | |
| sponsored ADR (non-vtg.) | | 6,200 | | | | 225,680 |
| Companhia Vale do Rio Doce: | | | | | | |
| (PN-A) sponsored ADR (non-vtg.) (a) | | 14,500 | | | | 535,050 |
| sponsored ADR (non-vtg.) | | 4,900 | | | | 202,517 |
| Diagnosticos da America SA | | 6,200 | | | | 101,048 |
| Itausa Investimentos Itau SA (PN) | | 42,800 | | | | 128,107 |
| Lojas Renner SA | | 4,500 | | | | 119,904 |
| Natura Cosmeticos SA | | 2,200 | | | | 88,897 |
| NET Servicos de Communicacao SA sponsored ADR | | 23,900 | | | | 95,839 |
| Petroleo Brasileiro SA Petrobras: | | | | | | |
| (PN) | | 25,900 | | | | 368,061 |
| (PN) sponsored ADR (non-vtg.) | | 6,300 | | | | 361,431 |
| sponsored ADR (non-vtg.) | | 4,800 | | | | 306,720 |
| Telesp Celular Participacoes SA (PN) (a) | | 4,800 | | | | 16,861 |
| Uniao de Bancos Brasileiros SA (Unibanco): | | | | | | |
| unit | | 9,600 | | | | 100,698 |
| GDR | | 2,500 | | | | 130,750 |
| Usinas Siderurgicas de Minas Gerais SA (Usiminas) (PN-A) | | 6,400 | | | | 129,035 |
| TOTAL BRAZIL | | | | | | 3,893,015 |
| |
| British Virgin Islands – 0.1% | | | | | | |
| Titanium Resources Group Ltd. | | 22,300 | | | | 21,517 |
See accompanying notes which are an integral part of the financial statements.
11 Annual Report
| Investments - continued | | | | | | |
| |
| |
| Common Stocks – continued | | | | | | |
| | | Shares | | Value (Note 1) |
| |
| Cayman Islands – 0.5% | | | | | | |
| Foxconn International Holdings Ltd. | | 131,000 | | $ | | 140,259 |
| China – 2.2% | | | | | | |
| Anhui Expressway Co. Ltd. (H Shares) | | 60,000 | | | | 30,379 |
| Beijing Capital International Airport Co. Ltd. (H Shares) | | 92,000 | | | | 37,087 |
| China Construction Bank Corp. (H Shares) | | 373,300 | | | | 113,164 |
| China International Marine Containers Co. Ltd. (B Shares) | | 54,200 | | | | 45,096 |
| China Petroleum & Chemical Corp. (H Shares) | | 550,800 | | | | 221,697 |
| China Shenhua Energy Co. Ltd. (H Shares) | | 80,400 | | | | 88,157 |
| Xinao Gas Holdings Ltd. | | 122,000 | | | | 92,852 |
| TOTAL CHINA | | | | | | 628,432 |
| |
| Czech Republic – 0.6% | | | | | | |
| Ceske Energeticke Zavody AS | | 6,800 | | | | 178,514 |
| Egypt – 1.6% | | | | | | |
| Commercial International Bank Ltd. sponsored GDR | | 7,200 | | | | 67,680 |
| Eastern Tobacco Co. | | 2,400 | | | | 95,475 |
| Misr International Bank Sae GDR | | 3,550 | | | | 13,313 |
| Orascom Construction Industries SAE GDR | | 1,720 | | | | 118,164 |
| Orascom Telecom SAE GDR | | 3,192 | | | | 156,568 |
| TOTAL EGYPT | | | | | | 451,200 |
| |
| Hong Kong – 2.9% | | | | | | |
| Chaoda Modern Agriculture (Holdings) Ltd. | | 240,700 | | | | 90,820 |
| China Mobile (Hong Kong) Ltd. | | 121,700 | | | | 546,433 |
| China Overseas Land & Investment Ltd. | | 269,700 | | | | 82,628 |
| Kerry Properties Ltd. | | 44,000 | | | | 110,112 |
| TOTAL HONG KONG | | | | | | 829,993 |
| |
| Hungary – 0.8% | | | | | | |
| OTP Bank Rt. | | 6,700 | | | | 239,503 |
| India – 3.0% | | | | | | |
| Apollo Hospitals Enterprise Ltd. GDR (a)(c) | | 2,500 | | | | 23,868 |
| Bharat Forge Ltd. | | 5,717 | | | | 40,832 |
| Bharti Televentures Ltd. (a) | | 6,191 | | | | 44,489 |
| Crompton Greaves Ltd. | | 4,835 | | | | 66,019 |
| Gujarat Ambuja Cement Ltd. | | 37,659 | | | | 58,030 |
| Jaiprakash Associates Ltd. | | 6,078 | | | | 37,726 |
| Larsen & Toubro Ltd. | | 3,375 | | | | 104,743 |
| Oil & Natural Gas Corp. Ltd. | | 6,585 | | | | 135,740 |
| Reliance Industries Ltd. | | 12,599 | | | | 213,152 |
See accompanying notes which are an integral part of the financial statements.
| Common Stocks – continued | | | | | | |
| | | Shares | | Value (Note 1) |
| |
| India – continued | | | | | | |
| State Bank of India | | 6,649 | | $ | | 137,881 |
| Suzlon Energy Ltd. (a) | | 300 | | | | 4,757 |
| TOTAL INDIA | | | | | | 867,237 |
| |
| Indonesia – 0.7% | | | | | | |
| PT Aneka Tambang Tbk | | 330,000 | | | | 83,947 |
| PT Bank Central Asia Tbk | | 360,800 | | | | 114,950 |
| TOTAL INDONESIA | | | | | | 198,897 |
| |
| Israel – 4.5% | | | | | | |
| Bank Hapoalim BM (Reg.) | | 36,528 | | | | 139,907 |
| ECI Telecom Ltd. (a) | | 5,300 | | | | 40,280 |
| Israel Chemicals Ltd. | | 40,800 | | | | 154,863 |
| Ituran Location & Control Ltd. | | 3,300 | | | | 42,900 |
| M-Systems Flash Disk Pioneers Ltd. (a) | | 4,000 | | | | 126,760 |
| Nice Systems Ltd. sponsored ADR (a) | | 1,600 | | | | 69,872 |
| Orckit Communications Ltd. (a) | | 7,800 | | | | 166,842 |
| Partner Communications Co. Ltd. ADR | | 9,300 | | | | 75,702 |
| RADWARE Ltd. (a) | | 4,300 | | | | 79,163 |
| Teva Pharmaceutical Industries Ltd. sponsored ADR | | 10,800 | | | | 411,696 |
| TOTAL ISRAEL | | | | | | 1,307,985 |
| |
| Korea (South) – 21.6% | | | | | | |
| Asiana Airlines, Inc. (a) | | 9,318 | | | | 39,137 |
| CJ Home Shopping | | 1,199 | | | | 106,233 |
| Core Logic, Inc. | | 1,400 | | | | 49,013 |
| Daegu Bank Co. Ltd. | | 16,870 | | | | 201,180 |
| Daelim Industrial Co. | | 3,220 | | | | 187,525 |
| Daewoo Shipbuilding & Marine Engineering Co. Ltd. | | 9,370 | | | | 186,682 |
| Dongbu Insurance Co. Ltd. | | 7,070 | | | | 88,375 |
| Hanil Cement Co. Ltd. | | 1,530 | | | | 99,362 |
| Hanwha Corp. | | 3,770 | | | | 70,417 |
| Hynix Semiconductor, Inc. (a) | | 2,430 | | | | 44,341 |
| Hyundai Department Store Co. Ltd. | | 1,850 | | | | 122,802 |
| Hyundai Heavy Industries Co. Ltd. | | 830 | | | | 53,982 |
| Hyundai Mipo Dockyard Co. Ltd. | | 1,970 | | | | 121,710 |
| Hyundai Motor Co. | | 5,940 | | | | 435,827 |
| Hyundai Securities Co. Ltd. (a) | | 9,580 | | | | 88,184 |
| Industrial Bank of Korea | | 10,590 | | | | 125,782 |
| Kia Motors Corp. | | 8,190 | | | | 147,090 |
| Korea Exchange Bank (a) | | 3,390 | | | | 37,342 |
| Korea Gas Corp. | | 3,700 | | | | 127,586 |
| Korea Investment Holdings Co. Ltd. | | 4,300 | | | | 110,383 |
See accompanying notes which are an integral part of the financial statements.
13 Annual Report
| Investments - continued | | | | | | |
| |
| |
| Common Stocks – continued | | | | | | |
| | | Shares | | Value (Note 1) |
| |
| Korea (South) – continued | | | | | | |
| Korean Air Co. Ltd. | | 3,060 | | $ | | 57,155 |
| Kumho Tire Co., Inc. | | 1,820 | | | | 26,934 |
| Kyeryong Construction Industrial Co. Ltd. | | 2,370 | | | | 58,228 |
| LG Electronics, Inc. | | 3,120 | | | | 202,322 |
| LG Engineering & Construction Co. Ltd. | | 4,210 | | | | 180,457 |
| MegaStudy Co. Ltd. | | 1,979 | | | | 78,383 |
| NHN Corp. (a) | | 914 | | | | 151,896 |
| POSCO | | 1,170 | | | | 237,026 |
| Pusan Bank | | 8,280 | | | | 86,052 |
| Pyung Hwa Industrial Co. Ltd. | | 12,167 | | | | 75,869 |
| Samchully Co. Ltd. | | 1,000 | | | | 108,238 |
| Samsung Electronics Co. Ltd. | | 3,076 | | | | 1,626,384 |
| Samsung Heavy Industries Ltd. | | 10,390 | | | | 131,865 |
| Shinhan Financial Group Co. Ltd. | | 7,200 | | | | 240,000 |
| SK Corp. | | 4,440 | | | | 227,529 |
| Ssangyong Motor Co. (a) | | 9,500 | | | | 73,889 |
| Woongjin Coway Co. Ltd. | | 2,200 | | | | 37,931 |
| Wooree Lighting Co. Ltd. | | 13,100 | | | | 69,139 |
| Woori Finance Holdings Co. Ltd. | | 8,610 | | | | 132,366 |
| TOTAL KOREA (SOUTH) | | | | | | 6,244,616 |
| |
| Lebanon – 0.2% | | | | | | |
| Solidere GDR (a) | | 4,600 | | | | 64,400 |
| Luxembourg – 1.1% | | | | | | |
| Evraz Group SA GDR | | 4,300 | | | | 73,100 |
| Orco Property Group | | 1,000 | | | | 63,654 |
| Tenaris SA sponsored ADR | | 1,700 | | | | 186,745 |
| TOTAL LUXEMBOURG | | | | | | 323,499 |
| |
| Mexico – 7.2% | | | | | | |
| America Movil SA de CV Series L sponsored ADR | | 34,000 | | | | 892,500 |
| Cemex SA de CV sponsored ADR | | 8,400 | | | | 437,388 |
| Grupo Financiero Banorte SA de CV Series O | | 13,189 | | | | 112,448 |
| Grupo Mexico SA de CV Series B | | 88,849 | | | | 171,421 |
| Sare Holding SA de CV Series B (a) | | 39,200 | | | | 40,341 |
| Urbi, Desarrollos Urbanos, SA de CV (a) | | 23,800 | | | | 152,253 |
| Wal-Mart de Mexico SA de CV Series V | | 54,852 | | | | 267,852 |
| TOTAL MEXICO | | | | | | 2,074,203 |
| |
| Oman – 0.2% | | | | | | |
| BankMuscat SAOG sponsored GDR (a)(c) | | 2,500 | | | | 62,500 |
See accompanying notes which are an integral part of the financial statements.
| Common Stocks – continued | | | | | | |
| | | Shares | | Value (Note 1) |
| |
| Philippines – 0.5% | | | | | | |
| Philippine Long Distance Telephone Co. | | 4,990 | | $ | | 152,190 |
| Poland – 0.3% | | | | | | |
| Globe Trade Centre SA (a) | | 1,100 | | | | 46,580 |
| Grupa Lotos SA | | 3,900 | | | | 47,775 |
| TOTAL POLAND | | | | | | 94,355 |
| |
| Russia – 7.2% | | | | | | |
| Lukoil Oil Co. sponsored ADR | | 14,638 | | | | 817,532 |
| Mobile TeleSystems OJSC sponsored ADR | | 5,400 | | | | 199,746 |
| Novatek JSC GDR (a)(c) | | 6,300 | | | | 141,624 |
| OAO Gazprom sponsored ADR | | 4,634 | | | | 276,882 |
| RBC Information Systems Jsc (a) | | 6,100 | | | | 33,123 |
| Sberbank RF GDR (a) | | 1,500 | | | | 133,394 |
| Seventh Continent (a) | | 3,300 | | | | 70,125 |
| Sibneft sponsored ADR (a) | | 2,288 | | | | 41,184 |
| Sistema JSFC sponsored: | | | | | | |
| GDR (c) | | 3,900 | | | | 87,360 |
| GDR | | 5,000 | | | | 112,000 |
| Vimpel Communications sponsored ADR (a) | | 2,800 | | | | 112,000 |
| VSMPO-Avisma Corp. (a) | | 400 | | | | 62,600 |
| TOTAL RUSSIA | | | | | | 2,087,570 |
| |
| Singapore – 0.2% | | | | | | |
| Boustead Singapore Ltd. | | 92,000 | | | | 52,142 |
| South Africa – 9.8% | | | | | | |
| Absa Group Ltd. | | 8,710 | | | | 115,528 |
| Aflease Gold & Uranium Resources Ltd. (a) | | 36,213 | | | | 26,175 |
| African Bank Investments Ltd. | | 66,347 | | | | 197,854 |
| Aspen Pharmacare Holdings PLC | | 6,000 | | | | 27,720 |
| Aveng Ltd. | | 31,888 | | | | 80,076 |
| Edgars Consolidated Stores Ltd. | | 37,630 | | | | 167,120 |
| Foschini Ltd. | | 11,100 | | | | 70,719 |
| Impala Platinum Holdings Ltd. | | 2,008 | | | | 219,967 |
| JD Group Ltd. | | 13,800 | | | | 147,563 |
| Lewis Group Ltd. | | 8,422 | | | | 50,394 |
| Massmart Holdings Ltd. | | 9,100 | | | | 70,250 |
| MTN Group Ltd. | | 56,300 | | | | 419,523 |
| Naspers Ltd. Class N sponsored ADR | | 11,100 | | | | 161,394 |
| Sasol Ltd. | | 15,170 | | | | 479,291 |
| Standard Bank Group Ltd. | | 30,900 | | | | 318,671 |
| Steinhoff International Holdings Ltd. | | 50,900 | | | | 133,205 |
See accompanying notes which are an integral part of the financial statements.
15 Annual Report
| Investments - continued | | | | | | |
| |
| |
| Common Stocks – continued | | | | | | |
| | | Shares | | Value (Note 1) |
| |
| South Africa – continued | | | | | | |
| Sun International Ltd. | | 5,500 | | $ | | 62,295 |
| Telkom SA Ltd. | | 3,996 | | | | 75,483 |
| TOTAL SOUTH AFRICA | | | | | | 2,823,228 |
| |
| Taiwan – 8.8% | | | | | | |
| Acer, Inc. | | 67,460 | | | | 136,522 |
| ASUSTeK Computer, Inc. | | 20,000 | | | | 52,337 |
| China Motor Co. Ltd. | | 42,340 | | | | 39,562 |
| Chinatrust Financial Holding Co. Ltd. | | 187,962 | | | | 145,937 |
| Chipbond Technology Corp. | | 90,710 | | | | 117,607 |
| Compal Electronics, Inc. | | 131,000 | | | | 115,572 |
| Delta Electronics, Inc. | | 62,984 | | | | 106,064 |
| Far EasTone Telecommunications Co. Ltd. | | 108,100 | | | | 125,655 |
| First Financial Holding Co. Ltd. | | 137,900 | | | | 92,477 |
| High Tech Computer Corp. | | 18,200 | | | | 193,112 |
| Hon Hai Precision Industry Co. Ltd. (Foxconn) | | 85,010 | | | | 367,389 |
| MediaTek, Inc. | | 20,900 | | | | 180,336 |
| Motech Industries, Inc. | | 3,185 | | | | 34,744 |
| Novatek Microelectronics Corp. | | 34,754 | | | | 151,751 |
| Siliconware Precision Industries Co. Ltd. | | 145,000 | | | | 130,084 |
| Taiwan Semiconductor Manufacturing Co. Ltd. | | 279,631 | | | | 433,388 |
| United Microelectronics Corp. | | 198,291 | | | | 105,199 |
| XAC Automation Corp. | | 7,350 | | | | 5,729 |
| TOTAL TAIWAN | | | | | | 2,533,465 |
| |
| Thailand – 1.0% | | | | | | |
| Minor International PCL (For. Reg.) | | 72,100 | | | | 9,901 |
| Siam Cement PCL (For. Reg.) | | 29,200 | | | | 164,689 |
| Siam Commercial Bank PCL (For. Reg.) | | 109,000 | | | | 126,294 |
| TOTAL THAILAND | | | | | | 300,884 |
| |
| Turkey – 4.4% | | | | | | |
| Acibadem Saglik Hizmetleri AS | | 9,000 | | | | 59,933 |
| Akbank T. A. S. | | 35,400 | | | | 220,022 |
| Alarko Gayrimenkul Yatirim Ortakligi AS (a) | | 1,800 | | | | 82,575 |
| Arcelik AS | | 8,600 | | | | 51,225 |
| Aygaz AS | | 11,000 | | | | 31,905 |
| Boyner Buyuk Magazacilik AS (a) | | 12,600 | | | | 35,987 |
| Denizbank AS | | 13,800 | | | | 77,092 |
| Dogan Yayin Holding AS | | 39,312 | | | | 99,480 |
| Dogus Otomotiv Servis ve Ticaret AS | | 9,400 | | | | 34,359 |
| Enka Insaat ve Sanayi AS | | 6,500 | | | | 71,661 |
| Eregli Demir ve Celik Fabrikalari TAS | | 2,000 | | | | 10,803 |
See accompanying notes which are an integral part of the financial statements.
| Common Stocks – continued | | | | | | |
| | | Shares | | Value (Note 1) |
| |
| Turkey – continued | | | | | | |
| Finansbank AS | | 52,076 | | $ | | 157,981 |
| Tupras-Turkiye Petrol Rafinerileri AS | | 6,800 | | | | 116,226 |
| Turk Traktor ve Ziraat Makinalari AS | | 7,800 | | | | 41,265 |
| Turkiye Is Bankasi AS Series C unit | | 18,998 | | | | 131,433 |
| Yapi ve Kredi Bankasi AS (a) | | 16,864 | | | | 62,889 |
| TOTAL TURKEY | | | | | | 1,284,836 |
| |
| Ukraine – 0.3% | | | | | | |
| Stirol sponsored ADR (a) | | 480 | | | | 62,143 |
| Ukrnafta Open JSC sponsored ADR (a) | | 185 | | | | 39,109 |
| TOTAL UKRAINE | | | | | | 101,252 |
| |
| United Arab Emirates – 0.3% | | | | | | |
| Investcom LLC GDR | | 6,300 | | | | 85,113 |
| United Kingdom – 0.5% | | | | | | |
| Kazakhmys PLC | | 8,100 | | | | 77,439 |
| Oxus Gold PLC (a) | | 51,200 | | | | 56,201 |
| TOTAL UNITED KINGDOM | | | | | | 133,640 |
| |
| United States of America – 1.0% | | | | | | |
| Central European Distribution Corp. (a) | | 3,336 | | | | 132,806 |
| CTC Media, Inc. (d) | | 799 | | | | 11,998 |
| DSP Group, Inc. (a) | | 3,100 | | | | 76,198 |
| Zoran Corp. (a) | | 3,700 | | | | 54,316 |
| TOTAL UNITED STATES OF AMERICA | | | | | | 275,318 |
| |
| TOTAL COMMON STOCKS | | | | | | |
| (Cost $24,291,086) | | | | 27,982,419 |
| |
| Nonconvertible Preferred Stocks — 0.3% | | | | | | |
| |
| Korea (South) – 0.3% | | | | | | |
| Samsung Electronics Co. Ltd. | | | | | | |
| (Cost $70,695) | | 220 | | | | 89,559 |
See accompanying notes which are an integral part of the financial statements.
17 Annual Report
Investments - continued
| Money Market Funds — 3.7% | | | | | | |
| | | Shares | | | | Value (Note 1) |
| Fidelity Cash Central Fund, 3.92% (b) | | | | | | |
| (Cost $1,084,003) | | 1,084,003 | | $ | | 1,084,003 |
| TOTAL INVESTMENT PORTFOLIO – 100.8% | | | | | | |
| (Cost $25,445,784) | | | | | | 29,155,981 |
| |
| NET OTHER ASSETS – (0.8)% | | | | | | (240,784) |
| NET ASSETS – 100% | | | | $ | | 28,915,197 |
Legend
(a) Non-income producing
(b) Affiliated fund that is available only to investment companies and other accounts managed by Fidelity Investments. The rate quoted is the annualized seven-day yield of the fund at period end. A complete unaudited listing of the fund’s holdings as of its most recent quarter end is available upon request.
(c) Security exempt from registration under Rule 144A of the Securities Act of 1933. These securities may be resold in transactions exempt from registration, normally to qualified institutional buyers. At the period end, the value of these securities amounted to $315,352 or 1.1% of net assets.
(d) Restricted securities – Investment in securities not registered under the Securities Act of 1933 (excluding 144A issues). At the end of the period, the value of restricted securities (excluding 144A issues) amounted to $11,998 or 0.0% of net assets.
Additional information on each holding is as follows:
| Security | | Acquisition Date | | | | Acquisition Cost |
| CTC Media, Inc. | | 1/26/05 | | $ | | 11,998 |
Income Tax Information
At October 31, 2005, the fund had a capital loss carryforward of approximately $81,011 all of which will expire on October 31, 2012.
See accompanying notes which are an integral part of the financial statements.
Annual Report 18
| Financial Statements | | | | | | | | |
| |
| |
| Statement of Assets and Liabilities | | | | | | | | |
| | | | | | | | | October 31, 2005 |
| |
| Assets | | | | | | | | |
| Investment in securities, at value (cost $25,445,784) — | | | | | | | | |
| See accompanying schedule | | | | | | $ | | 29,155,981 |
| Receivable for investments sold | | | | | | | | 173,248 |
| Receivable for fund shares sold | | | | | | | | 403,511 |
| Dividends receivable | | | | | | | | 33,414 |
| Interest receivable | | | | | | | | 4,026 |
| Receivable from investment adviser for expense | | | | | | | | |
| reductions | | | | | | | | 52,372 |
| Other affiliated receivables | | | | | | | | 797 |
| Other receivables | | | | | | | | 3,976 |
| Total assets | | | | | | | | 29,827,325 |
| |
| Liabilities | | | | | | | | |
| Payable to custodian bank | | $ | | 39,516 | | | | |
| Payable for investments purchased | | | | 740,784 | | | | |
| Payable for fund shares redeemed | | | | 11,538 | | | | |
| Accrued management fee | | | | 18,555 | | | | |
| Distribution fees payable | | | | 13,043 | | | | |
| Other affiliated payables | | | | 9,637 | | | | |
| Other payables and accrued expenses | | | | 79,055 | | | | |
| Total liabilities | | | | | | | | 912,128 |
| |
| Net Assets | | | | | | $ | | 28,915,197 |
| Net Assets consist of: | | | | | | | | |
| Paid in capital | | | | | | $ | | 25,256,132 |
| Undistributed net investment income | | | | | | | | 81,262 |
| Accumulated undistributed net realized gain (loss) on | | | | | | | | |
| investments and foreign currency transactions | | | | | | | | (117,427) |
| Net unrealized appreciation (depreciation) on | | | | | | | | |
| investments and assets and liabilities in foreign | | | | | | | | |
| currencies | | | | | | | | 3,695,230 |
| Net Assets | | | | | | $ | | 28,915,197 |
See accompanying notes which are an integral part of the financial statements.
19 Annual Report
| Financial Statements - continued | | | | |
| |
| |
| Statement of Assets and Liabilities - continued | | | | |
| | | October 31, 2005 |
| |
| Calculation of Maximum Offering Price | | | | |
| Class A: | | | | |
| Net Asset Value and redemption price per share | | | | |
| ($9,616,852 ÷ 699,345 shares) | | $ | | 13.75 |
| Maximum offering price per share (100/94.25 of | | | | |
| $13.75) | | $ | | 14.59 |
| Class T: | | | | |
| Net Asset Value and redemption price per share | | | | |
| ($6,800,914 ÷ 496,671 shares) | | $ | | 13.69 |
| Maximum offering price per share (100/96.50 of | | | | |
| $13.69) | | $ | | 14.19 |
| Class B: | | | | |
| Net Asset Value and offering price per share | | | | |
| ($4,997,022 ÷ 367,963 shares)A | | $ | | 13.58 |
| Class C: | | | | |
| Net Asset Value and offering price per share | | | | |
| ($5,890,497 ÷ 433,567 shares)A | | $ | | 13.59 |
| Institutional Class: | | | | |
| Net Asset Value, offering price and redemption | | | | |
| price per share ($1,609,912 ÷ 116,624 | | | | |
| shares) | | $ | | 13.80 |
| A Redemption price per share is equal to net asset value less any applicable contingent deferred sales charge. | | | | |
See accompanying notes which are an integral part of the financial statements.
Annual Report 20
| Statement of Operations | | | | | | |
| | | | | Year ended October 31, 2005 |
| |
| Investment Income | | | | | | |
| Dividends | | | | $ | | 372,944 |
| Interest | | | | | | 17,149 |
| | | | | | | 390,093 |
| Less foreign taxes withheld | | | | | | (41,932) |
| Total income | | | | | | 348,161 |
| |
| Expenses | | | | | | |
| Management fee | | $ | | 115,315 | | |
| Transfer agent fees | | | | 59,430 | | |
| Distribution fees | | | | 83,800 | | |
| Accounting fees and expenses | | | | 12,972 | | |
| Independent trustees’ compensation | | | | 54 | | |
| Custodian fees and expenses | | | | 94,604 | | |
| Registration fees | | | | 89,862 | | |
| Audit | | | | 49,903 | | |
| Legal | | | | 1,285 | | |
| Miscellaneous | | | | 91 | | |
| Total expenses before reductions | | | | 507,316 | | |
| Expense reductions | | | | (243,725) | | 263,591 |
| |
| Net investment income (loss) | | | | | | 84,570 |
| Realized and Unrealized Gain (Loss) | | | | | | |
| Net realized gain (loss) on: | | | | | | |
| Investment securities (net of foreign taxes of $1,975) . | | 75,734 | | |
| Foreign currency transactions | | | | (17,575) | | |
| Total net realized gain (loss) | | | | | | 58,159 |
| Change in net unrealized appreciation (depreciation) on: | | | | |
| Investment securities (net of increase in deferred for- | | | | |
| eign taxes of $14,460) | | | | 3,426,080 | | |
| Assets and liabilities in foreign currencies | | | | (731) | | |
| Total change in net unrealized appreciation | | | | | | |
| (depreciation) | | | | | | 3,425,349 |
| Net gain (loss) | | | | | | 3,483,508 |
| Net increase (decrease) in net assets resulting from | | | | | | |
| operations | | | | $ | | 3,568,078 |
See accompanying notes which are an integral part of the financial statements.
21 Annual Report
| Financial Statements - continued | | | | | | | | |
| |
| |
| Statement of Changes in Net Assets | | | | | | | | |
| | | | | | | | | March 29, 2004 |
| | | | | Year ended | | (commencement of |
| | | | | October 31, | | | | operations) to |
| | | | | 2005 | | October 31, 2004 |
| Increase (Decrease) in Net Assets | | | | | | | | |
| Operations | | | | | | | | |
| Net investment income (loss) | | $ | | 84,570 | | $ | | (477) |
| Net realized gain (loss) | | | | 58,159 | | | | (183,913) |
| Change in net unrealized appreciation (depreciation) . | | | | 3,425,349 | | | | 269,881 |
| Net increase (decrease) in net assets resulting | | | | | | | | |
| from operations | | | | 3,568,078 | | | | 85,491 |
| Share transactions -- net increase (decrease) | | | | 20,919,617 | | | | 4,331,666 |
| Redemption fees | | | | 8,417 | | | | 1,928 |
| Total increase (decrease) in net assets | | | | 24,496,112 | | | | 4,419,085 |
| |
| Net Assets | | | | | | | | |
| Beginning of period | | | | 4,419,085 | | | | — |
| End of period (including undistributed net investment | | | | | | | | |
| income of $81,262 and $0, respectively) | | $ | | 28,915,197 | | $ | | 4,419,085 |
See accompanying notes which are an integral part of the financial statements.
| Financial Highlights — Class A | | | | | | | | |
| Years ended October 31, | | | | 2005 | | | | 2004G |
| Selected Per-Share Data | | | | | | | | |
| Net asset value, beginning of period | | $ | | 9.87 | | $ | | 10.00 |
| Income from Investment Operations | | | | | | | | |
| Net investment income (loss)E | | | | 12 | | | | .02 |
| Net realized and unrealized gain (loss) | | | | 3.75 | | | | (.16)F |
| Total from investment operations | | | | 3.87 | | | | (.14) |
| Redemption fees added to paid in capitalE | | | | 01 | | | | .01 |
| Net asset value, end of period | | $ | | 13.75 | | $ | | 9.87 |
| Total ReturnB,C,D | | | | 39.31% | | | | (1.30)% |
| Ratios to Average Net AssetsH | | | | | | | | |
| Expenses before expense reductions | | | | 3.15% | | | | 10.75%A |
| Expenses net of voluntary waivers, if any | | | | 1.63% | | | | 2.00%A |
| Expenses net of all reductions | | | | 1.52% | | | | 1.91%A |
| Net investment income (loss) | | | | 95% | | | | .28%A |
| Supplemental Data | | | | | | | | |
| Net assets, end of period (000 omitted) | | $ | | 9,617 | | $ | | 1,178 |
| Portfolio turnover rate | | | | 54% | | | | 101%A |
A Annualized
B Total returns for periods of less than one year are not annualized.
C Total returns would have been lower had certain expenses not been reduced during the periods shown. D Total returns do not include the effect of the sales charges.
E Calculated based on average shares outstanding during the period.
F The amount shown for a share outstanding does not correspond with the aggregate net gain (loss) on investments for the period due to the timing of sales and repurchases of shares in relation to fluctuating market values of the investments of the fund.
G For the period March 29, 2004 (commencement of operations) to October 31, 2004.
H Expense ratios reflect operating expenses of the class. Expenses before reductions do not reflect amounts reimbursed by the investment adviser or reductions from brokerage service arrangements or other expense offset arrangements and do not represent the amount paid by the class during periods when reimbursements or reductions occur. Expense ratios before reductions for start up periods may not be representative of longer term operating periods. Expenses net of any voluntary waivers reflect expenses after reimbursement by the investment adviser but prior to reductions from brokerage service arrangements or other expense offset arrangements. Expenses net of all reductions represent the net expenses paid by the class.
See accompanying notes which are an integral part of the financial statements.
23 Annual Report
| Financial Highlights — Class T | | | | | | | | |
| Years ended October 31, | | | | 2005 | | | | 2004G |
| Selected Per-Share Data | | | | | | | | |
| Net asset value, beginning of period | | $ | | 9.86 | | $ | | 10.00 |
| Income from Investment Operations | | | | | | | | |
| Net investment income (loss)E | | | | 09 | | | | —I |
| Net realized and unrealized gain (loss) | | | | 3.73 | | | | (.15)F |
| Total from investment operations | | | | 3.82 | | | | (.15) |
| Redemption fees added to paid in capitalE | | | | 01 | | | | .01 |
| Net asset value, end of period | | $ | | 13.69 | | $ | | 9.86 |
| Total ReturnB,C,D | | | | 38.84% | | | | (1.40)% |
| Ratios to Average Net AssetsH | | | | | | | | |
| Expenses before expense reductions | | | | 3.53% | | | | 11.13%A |
| Expenses net of voluntary waivers, if any | | | | 1.89% | | | | 2.25%A |
| Expenses net of all reductions | | | | 1.77% | | | | 2.16%A |
| Net investment income (loss) | | | | 70% | | | | .03%A |
| Supplemental Data | | | | | | | | |
| Net assets, end of period (000 omitted) | | $ | | 6,801 | | $ | | 889 |
| Portfolio turnover rate | | | | 54% | | | | 101%A |
A Annualized
B Total returns for periods of less than one year are not annualized.
C Total returns would have been lower had certain expenses not been reduced during the periods shown. D Total returns do not include the effect of the sales charges.
E Calculated based on average shares outstanding during the period.
F The amount shown for a share outstanding does not correspond with the aggregate net gain (loss) on investments for the period due to the timing of sales and repurchases of shares in relation to fluctuating market values of the investments of the fund.
G For the period March 29, 2004 (commencement of operations) to October 31, 2004.
H Expense ratios reflect operating expenses of the class. Expenses before reductions do not reflect amounts reimbursed by the investment adviser or reductions from brokerage service arrangements or other expense offset arrangements and do not represent the amount paid by the class during periods when reimbursements or reductions occur. Expense ratios before reductions for start up periods may not be representative of longer term operating periods. Expenses net of any voluntary waivers reflect expenses after reimbursement by the investment adviser but prior to reductions from brokerage service arrangements or other expense offset arrangements. Expenses net of all reductions represent the net expenses paid by the class.
I Amount represents less than $.01 per share.
See accompanying notes which are an integral part of the financial statements.
| Financial Highlights — Class B | | | | | | | | |
| Years ended October 31, | | | | 2005 | | | | 2004G |
| Selected Per-Share Data | | | | | | | | |
| Net asset value, beginning of period | | $ | | 9.83 | | $ | | 10.00 |
| Income from Investment Operations | | | | | | | | |
| Net investment income (loss)E | | | | 02 | | | | (.03) |
| Net realized and unrealized gain (loss) | | | | 3.72 | | | | (.15)F |
| Total from investment operations | | | | 3.74 | | | | (.18) |
| Redemption fees added to paid in capitalE | | | | 01 | | | | .01 |
| Net asset value, end of period | | $ | | 13.58 | | $ | | 9.83 |
| Total ReturnB,C,D | | | | 38.15% | | | | (1.70)% |
| Ratios to Average Net AssetsH | | | | | | | | |
| Expenses before expense reductions | | | | 4.00% | | | | 11.49%A |
| Expenses net of voluntary waivers, if any | | | | 2.39% | | | | 2.75%A |
| Expenses net of all reductions | | | | 2.27% | | | | 2.67%A |
| Net investment income (loss) | | | | 20% | | | | (.47)%A |
| Supplemental Data | | | | | | | | |
| Net assets, end of period (000 omitted) | | $ | | 4,997 | | $ | | 719 |
| Portfolio turnover rate | | | | 54% | | | | 101%A |
A Annualized
B Total returns for periods of less than one year are not annualized.
C Total returns would have been lower had certain expenses not been reduced during the periods shown. D Total returns do not include the effect of the contingent deferred sales charge.
E Calculated based on average shares outstanding during the period.
F The amount shown for a share outstanding does not correspond with the aggregate net gain (loss) on investments for the period due to the timing of sales and repurchases of shares in relation to fluctuating market values of the investments of the fund.
G For the period March 29, 2004 (commencement of operations) to October 31, 2004.
H Expense ratios reflect operating expenses of the class. Expenses before reductions do not reflect amounts reimbursed by the investment adviser or reductions from brokerage service arrangements or other expense offset arrangements and do not represent the amount paid by the class during periods when reimbursements or reductions occur. Expense ratios before reductions for start up periods may not be representative of longer term operating periods. Expenses net of any voluntary waivers reflect expenses after reimbursement by the investment adviser but prior to reductions from brokerage service arrangements or other expense offset arrangements. Expenses net of all reductions represent the net expenses paid by the class.
See accompanying notes which are an integral part of the financial statements.
25 Annual Report
| Financial Highlights — Class C | | | | | | | | |
| Years ended October 31, | | | | 2005 | | | | 2004G |
| Selected Per-Share Data | | | | | | | | |
| Net asset value, beginning of period | | $ | | 9.83 | | $ | | 10.00 |
| Income from Investment Operations | | | | | | | | |
| Net investment income (loss)E | | | | 02 | | | | (.03) |
| Net realized and unrealized gain (loss) | | | | 3.73 | | | | (.15)F |
| Total from investment operations | | | | 3.75 | | | | (.18) |
| Redemption fees added to paid in capitalE | | | | 01 | | | | .01 |
| Net asset value, end of period | | $ | | 13.59 | | $ | | 9.83 |
| Total ReturnB,C,D | | | | 38.25% | | | | (1.70)% |
| Ratios to Average Net AssetsH | | | | | | | | |
| Expenses before expense reductions | | | | 4.09% | | | | 11.58%A |
| Expenses net of voluntary waivers, if any | | | | 2.39% | | | | 2.75%A |
| Expenses net of all reductions | | | | 2.28% | | | | 2.66%A |
| Net investment income (loss) | | | | 19% | | | | (.47)%A |
| Supplemental Data | | | | | | | | |
| Net assets, end of period (000 omitted) | | $ | | 5,890 | | $ | | 1,105 |
| Portfolio turnover rate | | | | 54% | | | | 101%A |
A Annualized
B Total returns for periods of less than one year are not annualized.
C Total returns would have been lower had certain expenses not been reduced during the periods shown. D Total returns do not include the effect of the contingent deferred sales charge.
E Calculated based on average shares outstanding during the period.
F The amount shown for a share outstanding does not correspond with the aggregate net gain (loss) on investments for the period due to the timing of sales and repurchases of shares in relation to fluctuating market values of the investments of the fund.
G For the period March 29, 2004 (commencement of operations) to October 31, 2004.
H Expense ratios reflect operating expenses of the class. Expenses before reductions do not reflect amounts reimbursed by the investment adviser or reductions from brokerage service arrangements or other expense offset arrangements and do not represent the amount paid by the class during periods when reimbursements or reductions occur. Expense ratios before reductions for start up periods may not be representative of longer term operating periods. Expenses net of any voluntary waivers reflect expenses after reimbursement by the investment adviser but prior to reductions from brokerage service arrangements or other expense offset arrangements. Expenses net of all reductions represent the net expenses paid by the class.
See accompanying notes which are an integral part of the financial statements.
| Financial Highlights — Institutional Class | | | | | | | | |
| Years ended October 31, | | | | 2005 | | | | 2004F |
| Selected Per-Share Data | | | | | | | | |
| Net asset value, beginning of period | | $ | | 9.89 | | $ | | 10.00 |
| Income from Investment Operations | | | | | | | | |
| Net investment income (loss)D | | | | 14 | | | | .03 |
| Net realized and unrealized gain (loss) | | | | 3.76 | | | | (.15)E |
| Total from investment operations | | | | 3.90 | | | | (.12) |
| Redemption fees added to paid in capitalD | | | | 01 | | | | .01 |
| Net asset value, end of period | | $ | | 13.80 | | $ | | 9.89 |
| Total ReturnB,C | | | | 39.53% | | | | (1.10)% |
| Ratios to Average Net AssetsG | | | | | | | | |
| Expenses before expense reductions | | | | 3.05% | | | | 10.37%A |
| Expenses net of voluntary waivers, if any | | | | 1.41% | | | | 1.75%A |
| Expenses net of all reductions | | | | 1.30% | | | | 1.66%A |
| Net investment income (loss) | | | | 1.17% | | | | .53%A |
| Supplemental Data | | | | | | | | |
| Net assets, end of period (000 omitted) | | $ | | 1,610 | | $ | | 529 |
| Portfolio turnover rate | | | | 54% | | | | 101%A |
A Annualized
B Total returns for periods of less than one year are not annualized.
C Total returns would have been lower had certain expenses not been reduced during the periods shown. D Calculated based on average shares outstanding during the period.
E The amount shown for a share outstanding does not correspond with the aggregate net gain (loss) on investments for the period due to the timing of sales and repurchases of shares in relation to fluctuating market values of the investments of the fund.
F For the period March 29, 2004 (commencement of operations) to October 31, 2004.
G Expense ratios reflect operating expenses of the class. Expenses before reductions do not reflect amounts reimbursed by the investment adviser or reductions from brokerage service arrangements or other expense offset arrangements and do not represent the amount paid by the class during periods when reimbursements or reductions occur. Expense ratios before reductions for start up periods may not be representative of longer term operating periods. Expenses net of any voluntary waivers reflect expenses after reimbursement by the investment adviser but prior to reductions from brokerage service arrangements or other expense offset arrangements. Expenses net of all reductions represent the net expenses paid by the class.
See accompanying notes which are an integral part of the financial statements.
27 Annual Report
Notes to Financial Statements
For the period ended October 31, 2005
|
1. Significant Accounting Policies.
Fidelity Advisor Emerging Markets Fund (the fund) is a non-diversified fund of Fidelity Advisor Series VIII (the trust) and is authorized to issue an unlimited number of shares. The trust is registered under the Investment Company Act of 1940, as amended (the 1940 Act), as an open-end management investment company organized as a Massachusetts business trust.
The fund offers Class A, Class T, Class B, Class C, and Institutional Class shares, each of which has equal rights as to assets and voting privileges. Each class has exclusive voting rights with respect to matters that affect that class. Class B shares will automatically convert to Class A shares after a holding period of seven years from the initial date of purchase. Investment income, realized and unrealized capital gains and losses, the common expenses of the fund, and certain fund-level expense reductions, if any, are allocated on a pro rata basis to each class based on the relative net assets of each class to the total net assets of the fund. Each class differs with respect to transfer agent and distribution and service plan fees incurred. Certain expense reductions also differ by class.
The fund’s investments in emerging markets can be subject to social, economic, regulatory, and political uncertainties and can be extremely volatile.
The fund may invest in affiliated money market central funds (Money Market Central Funds) which are open-end investment companies available to investment companies and other accounts managed by Fidelity Management & Research Company (FMR) and its affiliates. The financial statements have been prepared in conformity with accounting principles generally accepted in the United States of America, which require management to make certain estimates and assumptions at the date of the financial statements. The following summarizes the significant accounting policies of the fund:
Security Valuation. Investments are valued and net asset value (NAV) per share is calculated (NAV calculation) as of the close of business of the New York Stock Exchange (NYSE), normally 4:00 p.m. Eastern time. Wherever possible, the fund uses independent pricing services approved by the Board of Trustees to value its investments.
Equity securities, including restricted securities, for which market quotations are readily available, are valued at the last reported sale price or official closing price as reported by an independent pricing service on the primary market or exchange on which they are traded. In the event there were no sales during the day or closing prices are not available, securities are valued at the last quoted bid price. Investments in open-end mutual funds, are valued at their closing net asset value each business day. Short-term securities with remaining maturities of sixty days or less for which quotations are not readily available are valued at amortized cost, which approximates value.
1. Significant Accounting Policies - continued
Security Valuation - continued
When current market prices or quotations are not readily available or do not accurately reflect fair value, valuations may be determined in accordance with procedures adopted by the Board of Trustees. For example, when developments occur between the close of a market and the close of the NYSE that may materially affect the value of some or all of the securities, or when trading in a security is halted, those securities may be fair valued. Factors used in the determination of fair value may include monitoring news to identify significant market or security specific events such as changes in the value of U.S. securities market, reviewing developments in foreign markets and evaluating the performance of ADRs, futures contracts and exchange-traded funds. Because the fund’s utilization of fair value pricing depends on market activity, the frequency with which fair value pricing is used can not be predicted and may be utilized to a significant extent. The value of securities used for NAV calculation under fair value pricing may differ from published prices for the same securities.
Foreign Currency. The fund uses foreign currency contracts to facilitate transactions in foreign-denominated securities. Losses from these transactions may arise from changes in the value of the foreign currency or if the counterparties do not perform under the contracts’ terms.
Foreign-denominated assets, including investment securities, and liabilities are translated into U.S. dollars at the exchange rate at period end. Purchases and sales of investment securities, income and dividends received and expenses denominated in foreign currencies are translated into U.S. dollars at the exchange rate in effect on the transaction date.
The effects of exchange rate fluctuations on investments are included with the net realized and unrealized gain (loss) on investment securities. Other foreign currency transactions resulting in realized and unrealized gain (loss) are disclosed separately.
Investment Transactions and Income. Security transactions are accounted for as of trade date. Gains and losses on securities sold are determined on the basis of identified cost. Dividend income is recorded on the ex-dividend date, except for certain dividends from foreign securities where the ex-dividend date may have passed, which are recorded as soon as the fund is informed of the ex-dividend date. Non-cash dividends included in dividend income, if any, are recorded at the fair market value of the securities received. Interest income is accrued as earned. Interest income includes coupon interest and amortization of premium and accretion of discount on debt securities. Investment income is recorded net of foreign taxes withheld where recovery of such taxes is uncertain.
Expenses. Most expenses of the trust can be directly attributed to a fund. Expenses which cannot be directly attributed are apportioned among each fund in the trust.
29 Annual Report
Notes to Financial Statements - continued
1. Significant Accounting Policies - continued
Income Tax Information and Distributions to Shareholders. Each year, the fund intends to qualify as a regulated investment company by distributing all of its taxable income and realized gains under Subchapter M of the Internal Revenue Code. As a result, no provision for income taxes is required in the accompanying financial statements. Foreign taxes are provided for based on the fund’s understanding of the tax rules and rates that exist in the foreign markets in which it invests.
Distributions are recorded on the ex-dividend date. Income dividends and capital gain distributions are declared separately for each class. Income and capital gain distributions are determined in accordance with income tax regulations, which may differ from generally accepted accounting principles.
Capital accounts within the financial statements are adjusted for permanent book-tax differences. These adjustments have no impact on net assets or the results of operations. Temporary book-tax differences will reverse in a subsequent period.
Book-tax differences are primarily due to foreign currency transactions, certain foreign taxes, passive foreign investment companies (PFIC) and losses deferred due to wash sales.
The tax-basis components of distributable earnings and the federal tax cost as of period end were as follows:
| Unrealized appreciation | | $ | | 4,369,030 |
| Unrealized depreciation | | | | (703,873) |
| Net unrealized appreciation (depreciation) | | | | 3,665,157 |
| Undistributed ordinary income | | | | 81,262 |
| Capital loss carryforward | | | | (81,011) |
| |
| Cost for federal income tax purposes | | $ | | 25,490,824 |
Short-Term Trading (Redemption) Fees. Shares held in the fund less than 90 days are subject to a redemption fee equal to 1.50% of the proceeds of the redeemed shares. All redemption fees, including any estimated redemption fees paid by FMR, are retained by the fund and accounted for as an addition to paid in capital.
Repurchase Agreements. FMR has received an Exemptive Order from the Securities and Exchange Commission (the SEC) which permits the fund and other affiliated entities of FMR to transfer uninvested cash balances into joint trading accounts which are then invested in repurchase agreements. The fund may also invest directly with institutions in repurchase agreements. Repurchase agreements are collateralized by government or non-government securities. Collateral is held in segregated accounts with custodian banks and may be obtained in the event of a default of the counterparty. The fund monitors, on a daily basis, the value of the collateral to ensure it is at least equal to the principal amount of the repurchase agreement (including accrued interest). In the event of a default by the counterparty, realization of the collateral proceeds could be delayed, during which time the value of the collateral may decline.
Restricted Securities. The fund may invest in securities that are subject to legal or contractual restrictions on resale. These securities generally may be resold in transactions exempt from registration or to the public if the securities are registered. Disposal of these securities may involve time-consuming negotiations and expense, and prompt sale at an acceptable price may be difficult. Information regarding restricted securities is included at the end of the fund’s Schedule of Investments.
3. Purchases and Sales of Investments.
Purchases and sales of securities, other than short-term securities and U.S. government securities, aggregated $27,852,862 and $7,509,863, respectively.
4. Fees and Other Transactions with Affiliates.
Management Fee. FMR and its affiliates provide the fund with investment management related services for which the fund pays a monthly management fee. The management fee is the sum of an individual fund fee rate that is based on an annual rate of .55% of the fund’s average net assets and a group fee rate that averaged .27% during the period. The group fee rate is based upon the average net assets of all the mutual funds advised by FMR. The group fee rate decreases as assets under management increase and increases as assets under management decrease. For the period, the total annual management fee rate was .82% of the fund’s average net assets.
Distribution and Service Plan. In accordance with Rule 12b-1 of the 1940 Act, the fund has adopted separate Distribution and Service Plans for each class of shares. Certain classes pay Fidelity Distributors Corporation (FDC), an affiliate of FMR, separate Distribution and Service Fees, each of which is based on an annual percentage of each class’ average net assets. In addition, FDC may pay financial intermediaries for selling shares of the fund and providing shareholder support services. For the period, the
31 Annual Report
Notes to Financial Statements - continued
4. Fees and Other Transactions with Affiliates - continued
Distribution and Service Plan - continued
Distribution and Service Fee rates and the total amounts paid to and retained by FDC were as follows:
| | | Distribution | | Service | | | | Paid to | | | | Retained |
| | | Fee | | Fee | | | | FDC | | | | by FDC |
| Class A | | 0% | | .25% | | $ | | 10,252 | | $ | | 1,138 |
| Class T | | 25% | | .25% | | | | 16,208 | | | | 2,272 |
| Class B | | 75% | | .25% | | | | 26,713 | | | | 21,199 |
| Class C | | 75% | | .25% | | | | 30,627 | | | | 14,962 |
| | | | | | | $ | | 83,800 | | $ | | 39,571 |
Sales Load. FDC receives a front-end sales charge of up to 5.75% for selling Class A shares, and 3.50% for selling Class T shares, some of which is paid to financial intermediaries for selling shares of the fund. FDC receives the proceeds of contingent deferred sales charges levied on Class A, Class T, Class B, and Class C redemptions. These charges depend on the holding period. The deferred sales charges range from 5% to 1% for Class B, 1% for Class C, and .25% for certain purchases of Class A and Class T shares.
| For the period, sales charge amounts retained by FDC were as follows: | | | | |
| | | | | Retained |
| | | | | by FDC |
| Class A | | $ | | 27,121 |
| Class T | | | | 7,165 |
| Class B* | | | | 3,431 |
| Class C* | | | | 226 |
| | | $ | | 37,943 |
* When Class B and Class C shares are initially sold, FDC pays commissions from its own resources to financial intermediaries through which the sales are made.
Transfer Agent Fees. Fidelity Investments Institutional Operations Company, Inc. (FIIOC), an affiliate of FMR, is the transfer, dividend disbursing and shareholder servicing agent for each class of the fund. FIIOC receives account fees and asset-based fees that vary according to the account size and type of account of the shareholders of the
4. Fees and Other Transactions with Affiliates - continued
Transfer Agent Fees - continued
respective classes of the fund. FIIOC pays for typesetting, printing and mailing of shareholder reports, except proxy statements. For the period the total transfer agent fees paid by each class to FIIOC, were as follows:
| | | | | | | % of |
| | | | | | | Average |
| | | | | Amount | | Net Assets |
| Class A | | $ | | 17,586 | | .43 |
| Class T | | | | 14,604 | | .45 |
| Class B | | | | 11,641 | | .43 |
| Class C | | | | 13,384 | | .44 |
| Institutional Class | | | | 2,215 | | .23 |
| | | $ | | 59,430 | | |
Accounting Fees. Fidelity Service Company, Inc. (FSC), an affiliate of FMR, maintains the fund’s accounting records. The fee is based on the level of average net assets for the month.
Affiliated Central Funds. The fund may invest in Money Market Central Funds which seek preservation of capital and current income and are managed by Fidelity Investments Money Management, Inc. (FIMM), an affiliate of FMR.
The Money Market Central Funds do not pay a management fee. Income distributions earned by the fund are recorded as income in the accompanying financial statements and totaled $10,929 for the period.
Brokerage Commissions. The fund placed a portion of its portfolio transactions with brokerage firms which are affiliates of the investment adviser. The commissions paid to these affiliated firms were $62 for the period.
5. Committed Line of Credit.
|
The fund participates with other funds managed by FMR in a $4.2 billion credit facility (the “line of credit”) to be utilized for temporary or emergency purposes to fund shareholder redemptions or for other short-term liquidity purposes. The fund has agreed to pay commitment fees on its pro rata portion of the line of credit. During the period, there were no borrowings on this line of credit.
33 Annual Report
Notes to Financial Statements - continued
6. Expense Reductions.
FMR voluntarily agreed to reimburse each class to the extent annual operating expenses exceeded certain levels of average net assets as noted in the table below. Some expenses, for example interest expense, are excluded from this reimbursement.
| The following classes were in reimbursement during the period: | | | | |
| | | Expense | | | | Reimbursement |
| | | Limitations | | | | from adviser |
| |
| Class A | | 2.00%--1.60%* | | $ | | 62,597 |
| Class T | | 2.25%--1.85%* | | | | 53,456 |
| Class B | | 2.75%--2.35%* | | | | 43,405 |
| Class C | | 2.75%--2.35%* | | | | 52,078 |
| Institutional Class | | 1.75%--1.35%* | | | | 15,841 |
| | | | | $ | | 227,377 |
| * Expense limitation in effect at period end. | | | | | | |
Many of the brokers with whom FMR places trades on behalf of the fund provided services to the fund in addition to trade execution. These services included payments of certain expenses on behalf of the fund totaling $16,331 for the period. In addition, through arrangements with the fund’s custodian, credits realized as a result of uninvested cash balances were used to reduce the fund’s expenses. During the period, these credits reduced the fund’s custody expenses by $17.
The fund’s organizational documents provide former and current trustees and officers with a limited indemnification against liabilities arising in connection with the performance of their duties to the fund. In the normal course of business, the fund may also enter into contracts that provide general indemnifications. The fund’s maximum exposure under these arrangements is unknown as this would be dependent on future claims that may be made against the fund. The risk of material loss from such claims is considered remote.
| 8. Share Transactions. | | | | | | | | | | |
| |
| Transactions for each class of shares were as follows: | | | | | | | | |
| |
| | | Shares | | | | | | Dollars | | |
| | | Years ended October 31, | | | | Years ended October 31, |
| | | 2005 | | 2004A | | | | 2005 | | | | 2004A |
| Class A | | | | | | | | | | | | |
| Shares sold | | 626,290 | | 121,174 | | $ | | 7,938,744 | | $ | | 1,156,378 |
| Shares redeemed | | (46,288) | | (1,831) | | | | (542,567) | | | | (16,319) |
| Net increase (decrease) . | | 580,002 | | 119,343 | | $ | | 7,396,177 | | $ | | 1,140,059 |
| Class T | | | | | | | | | | | | |
| Shares sold | | 460,358 | | 105,410 | | $ | | 5,753,778 | | $ | | 1,016,630 |
| Shares redeemed | | (53,845) | | (15,252) | | | | (661,780) | | | | (136,708) |
| Net increase (decrease) . | | 406,513 | | 90,158 | | $ | | 5,091,998 | | $ | | 879,922 |
| Class B | | | | | | | | | | | | |
| Shares sold | | 336,021 | | 76,467 | | $ | | 4,091,942 | | $ | | 742,578 |
| Shares redeemed | | (41,193) | | (3,332) | | | | (504,698) | | | | (29,257) |
| Net increase (decrease) . | | 294,828 | | 73,135 | | $ | | 3,587,244 | | $ | | 713,321 |
| Class C | | | | | | | | | | | | |
| Shares sold | | 386,910 | | 112,717 | | $ | | 4,844,275 | | $ | | 1,070,278 |
| Shares redeemed | | (65,733) | | (327) | | | | (821,834) | | | | (3,252) |
| Net increase (decrease) . | | 321,177 | | 112,390 | | $ | | 4,022,441 | | $ | | 1,067,026 |
| Institutional Class | | | | | | | | | | | | |
| Shares sold | | 77,612 | | 53,677 | | $ | | 997,482 | | $ | | 532,788 |
| Shares redeemed | | (14,515) | | (150) | | | | (175,725) | | | | (1,450) |
| Net increase (decrease) . | | 63,097 | | 53,527 | | $ | | 821,757 | | $ | | 531,338 |
| |
| A For the period March 29, 2004 (commencement of operations) to October 31, 2004. | | | | | | | | |
35 Annual Report
Report of Independent Registered Public Accounting Firm
To the Trustees of Fidelity Advisor Series VIII and Shareholders of Fidelity Advisor Emerging Markets Fund:
We have audited the accompanying statement of assets and liabilities of Fidelity Advisor Emerging Markets Fund (the Fund), a fund of Fidelity Advisor Series VIII, including the schedule of investments, as of October 31, 2005, and the related statement of operations for the year then ended, and the statement of changes in net assets and the financial highlights for the year ended October 31, 2005 and for the period from March 29, 2004 (commencement of operations) to October 31, 2004. These financial statements and financial highlights are the responsibility of the Fund’s management. Our responsibility is to express an opinion on these financial statements and financial highlights based on our audits.
We conducted our audits in accordance with standards of the Public Company Accounting Oversight Board (United States). Those standards require that we plan and perform the audit to obtain reasonable assurance about whether the financial statements and financial highlights are free of material misstatement. The Fund is not required to have, nor were we engaged to perform, an audit of its internal control over financial reporting. Our audits included consideration of internal control over financial reporting as a basis for designing audit procedures that are appropriate in the circumstances, but not for the purpose of expressing an opinion on the effectiveness of the Fund’s internal control over financial reporting. Accordingly, we express no such opinion. An audit also includes examining, on a test basis, evidence supporting the amounts and disclosures in the financial statements, assessing the accounting principles used and significant estimates made by management, as well as evaluating the overall financial statement presentation. Our procedures included confirmation of securities owned as of October 31, 2005, by correspondence with the custodians and brokers; where replies were not received from brokers, we performed other auditing procedures. We believe that our audits provide a reasonable basis for our opinion.
In our opinion, the financial statements and financial highlights referred to above present fairly, in all material respects, the financial position of Fidelity Advisor Emerging Markets Fund as of October 31, 2005, the results of its operations for the year then ended, the changes in its net assets, and the financial highlights for the year ended October 31, 2005 and for the period from March 29, 2004 (commencement of operations) to October 31, 2004, in conformity with accounting principles generally accepted in the United States of America.
| /s/ Deloitte & Touche LLP | | |
| DELOITTE & TOUCHE LLP | | |
| Annual Report | | 36 |
Boston, Massachusetts Distributions
December 19, 2005
|
37 Annual Report
Trustees and Officers
The Trustees, Members of the Advisory Board, and executive officers of the trust and fund, as applicable, are listed below. The Board of Trustees governs the fund and is responsible for protecting the interests of shareholders. The Trustees are experienced executives who meet periodically throughout the year to oversee the fund’s activities, review contractual arrangements with companies that provide services to the fund, and review the fund’s performance. Except for William O. McCoy, Stephen P. Jonas, and Kenneth L. Wolfe, each of the Trustees oversees 322 funds advised by FMR or an affiliate. Mr. McCoy oversees 324 funds advised by FMR or an affiliate. Mr. Jonas and Mr. Wolfe oversee 319 funds advised by FMR or an affiliate.
The Trustees hold office without limit in time except that (a) any Trustee may resign; (b) any Trustee may be removed by written instrument, signed by at least two-thirds of the number of Trustees prior to such removal; (c) any Trustee who requests to be retired or who has become incapacitated by illness or injury may be retired by written instrument signed by a majority of the other Trustees; and (d) any Trustee may be removed at any special meeting of shareholders by a two-thirds vote of the outstanding voting securities of the trust. Each Trustee who is not an interested person (as defined in the 1940 Act) (Independent Trustee), shall retire not later than the last day of the calendar year in which his or her 72nd birthday occurs. The Independent Trustees may waive this mandatory retirement age policy with respect to individual Trustees. The executive officers and Advisory Board Members hold office without limit in time, except that any officer and Advisory Board Member may resign or may be removed by a vote of a majority of the Trustees at any regular meeting or any special meeting of the Trustees. Except as indicated, each individual has held the office shown or other offices in the same company for the past five years.
The fund’s Statement of Additional Information (SAI) includes more information about the Trustees. To request a free copy, call Fidelity at 1-877-208-0098.
Interested Trustees*:
Correspondence intended for each Trustee who is an interested person may be sent to Fidelity Investments, 82 Devonshire Street, Boston, Massachusetts 02109.
| Name, Age; Principal Occupation |
| |
| Edward C. Johnson 3d (75)** |
| |
| Year of Election or Appointment: 1983 |
| Mr. Johnson is Chairman of the Board of Trustees. Mr. Johnson serves as |
| Chief Executive Officer, Chairman, and a Director of FMR Corp.; a Di- |
| rector and Chairman of the Board and of the Executive Committee of |
| FMR; Chairman and a Director of Fidelity Management & Research (Far |
| East) Inc.; Chairman and a Director of Fidelity Investments Money Man- |
| agement, Inc.; and Chairman (2001-present) and a Director |
| (2000-present) of FMR Co., Inc. |
Annual Report 38
| Name, Age; Principal Occupation |
| |
| Abigail P. Johnson (43)** |
| |
| Year of Election or Appointment: 2001 |
| Ms. Johnson serves as President of Fidelity Employer Services Company |
| (FESCO) (2005-present). She is President and a Director of Fidelity In- |
| vestments Money Management, Inc. (2001-present), FMR Co., Inc. |
| (2001-present), and a Director of FMR Corp. Previously, Ms. Johnson |
| served as President and a Director of FMR (2001-2005), Senior Vice |
| President of the Fidelity funds (2001-2005), and managed a number of |
| Fidelity funds. |
| |
| Stephen P. Jonas (52) |
| |
| Year of Election or Appointment: 2005 |
| Mr. Jonas is Senior Vice President of Advisor Emerging Markets |
| (2005-present). He also serves as Senior Vice President of other Fidelity |
| funds (2005-present). Mr. Jonas is Executive Director of FMR |
| (2005-present). Previously, Mr. Jonas served as President of Fidelity En- |
| terprise Operations and Risk Services (2004-2005), Chief Administra- |
| tive Officer (2002-2004), and Chief Financial Officer of FMR Co. |
| (1998-2000). Mr. Jonas has been with Fidelity Investments since 1987 |
| and has held various financial and management positions including |
| Chief Financial Officer of FMR. In addition, he serves on the Boards of |
| Boston Ballet (2003-present) and Simmons College (2003-present). |
| |
| Robert L. Reynolds (53) |
| |
| Year of Election or Appointment: 2003 |
| Mr. Reynolds is a Director (2003-present) and Chief Operating Officer |
| (2002-present) of FMR Corp. He also serves on the Board at Fidelity |
| Investments Canada, Ltd. (2000-present). Previously, Mr. Reynolds |
| served as President of Fidelity Investments Institutional Retirement Group |
| (1996-2000). |
* Trustees have been determined to be “Interested Trustees” by virtue of, among other things, their affiliation with the trust or various entities under common control with FMR.
** Edward C. Johnson 3d, Trustee, is Abigail P. Johnson’s father.
39 Annual Report
Trustees and Officers - continued
Independent Trustees:
Correspondence intended for each Independent Trustee (that is, the Trustees other than the Interested Trustees) may be sent to Fidelity Investments, P.O. Box 55235, Boston, Massachusetts 02205-5235.
| Name, Age; Principal Occupation |
| |
| Dennis J. Dirks (57) |
| |
| Year of Election or Appointment: 2005 |
| Prior to his retirement in May 2003, Mr. Dirks was Chief Operating |
| Officer and a member of the Board of The Depository Trust & Clearing |
| Corporation (DTCC) (1999-2003). He also served as President, Chief |
| Operating Officer, and Board member of The Depository Trust |
| Company (DTC) (1999-2003) and President and Board member of the |
| National Securities Clearing Corporation (NSCC) (1999-2003). In addi- |
| tion, Mr. Dirks served as Chief Executive Officer and Board member of |
| the Government Securities Clearing Corporation (2001-2003) and Chief |
| Executive Officer and Board member of the Mortgage-Backed Securities |
| Clearing Corporation (2001-2003). Mr. Dirks also serves as a Trustee of |
| Manhattan College (2005-present). |
| |
| Robert M. Gates (62) |
| |
| Year of Election or Appointment: 1997 |
| Dr. Gates is Vice Chairman of the Independent Trustees (2005-present). |
| Dr. Gates is President of Texas A&M University (2002-present). He was |
| Director of the Central Intelligence Agency (CIA) from 1991 to 1993. |
| From 1989 to 1991, Dr. Gates served as Assistant to the President of |
| the United States and Deputy National Security Advisor. Dr. Gates is a |
| Director of NACCO Industries, Inc. (mining and manufacturing), Parker |
| Drilling Co., Inc. (drilling and rental tools for the energy industry, |
| 2001-present), and Brinker International (restaurant management, |
| 2003-present). Previously, Dr. Gates served as a Director of LucasVarity |
| PLC (automotive components and diesel engines), a Director of TRW Inc. |
| (automotive, space, defense, and information technology), and Dean of |
| the George Bush School of Government and Public Service at Texas |
| A&M University (1999-2001). Dr. Gates also is a Trustee of the Forum |
| for International Policy. |
Annual Report 40
| Name, Age; Principal Occupation |
| |
| George H. Heilmeier (69) |
| |
| Year of Election or Appointment: 2004 |
| Dr. Heilmeier is Chairman Emeritus of Telcordia Technologies (commu- |
| nication software and systems), where prior to his retirement, he served |
| as company Chairman and Chief Executive Officer. He currently serves |
| on the Boards of Directors of The Mitre Corporation (systems engineer- |
| ing and information technology support for the government), and HRL |
| Laboratories (private research and development, 2004-present). He is |
| Chairman of the General Motors Science & Technology Advisory Board |
| and a Life Fellow of the Institute of Electrical and Electronics Engineers |
| (IEEE) (2000-present). Dr. Heilmeier is a member of the Defense Science |
| Board and the National Security Agency Advisory Board. He is also a |
| member of the National Academy of Engineering, the American |
| Academy of Arts and Sciences, and the Board of Overseers of the |
| School of Engineering and Applied Science of the University of Pennsyl- |
| vania. Previously, Dr. Heilmeier served as a Director of TRW Inc. (auto- |
| motive, space, defense, and information technology, 1992-2002), |
| Compaq (1994-2002), Automatic Data Processing, Inc. (ADP) |
| (technology-based business outsourcing, 1995-2002), INET Technolo- |
| gies Inc. (telecommunications network surveillance, 2001-2004), and |
| Teletech Holdings (customer management services). He is the recipient of |
| the 2005 Kyoto Prize in Advanced Technology for his invention of the |
| liquid display. |
| |
| Marie L. Knowles (59) |
| |
| Year of Election or Appointment: 2001 |
| Prior to Ms. Knowles’ retirement in June 2000, she served as Executive |
| Vice President and Chief Financial Officer of Atlantic Richfield Company |
| (ARCO) (diversified energy, 1996-2000). From 1993 to 1996, she was |
| a Senior Vice President of ARCO and President of ARCO Transportation |
| Company. She served as a Director of ARCO from 1996 to 1998. She |
| currently serves as a Director of Phelps Dodge Corporation (copper |
| mining and manufacturing) and McKesson Corporation (healthcare ser- |
| vice, 2002-present). Ms. Knowles is a Trustee of the Brookings Institution |
| and the Catalina Island Conservancy and also serves as a member of |
| the Advisory Board for the School of Engineering of the University of |
| Southern California. |
41 Annual Report
Trustees and Officers - continued
| Name, Age; Principal Occupation |
| |
| Ned C. Lautenbach (61) |
| |
| Year of Election or Appointment: 2000 |
| Mr. Lautenbach has been a partner of Clayton, Dubilier & Rice, Inc. |
| (private equity investment firm) since September 1998. Previously, Mr. |
| Lautenbach was with the International Business Machines Corporation |
| (IBM) from 1968 until his retirement in 1998. Mr. Lautenbach serves as |
| a Director of Italtel Holding S.p.A. (telecommunications (Milan, Italy), |
| 2004-present) and Eaton Corporation (diversified industrial) as well as |
| the Philharmonic Center for the Arts in Naples, Florida. He also is a |
| member of the Board of Trustees of Fairfield University (2005-present), |
| as well as a member of the Council on Foreign Relations. |
| |
| Marvin L. Mann (72) |
| |
| Year of Election or Appointment: 1993 |
| Mr. Mann is Chairman of the Independent Trustees (2001-present). He is |
| Chairman Emeritus of Lexmark International, Inc. (computer |
| peripherals), where he served as CEO until April 1998, retired as |
| Chairman May 1999, and remains a member of the Board. Prior to |
| 1991, he held the positions of Vice President of International Business |
| Machines Corporation (IBM) and President and General Manager of |
| various IBM divisions and subsidiaries. He is a member of the Executive |
| Committee of the Independent Director’s Council of the Investment Com- |
| pany Institute. In addition, Mr. Mann is a member of the President’s |
| Cabinet at the University of Alabama and the Board of Visitors of the |
| Culverhouse College of Commerce and Business Administration at the |
| University of Alabama. |
| |
| William O. McCoy (72) |
| |
| Year of Election or Appointment: 1997 |
| Prior to his retirement in December 1994, Mr. McCoy was Vice Chair- |
| man of the Board of BellSouth Corporation (telecommunications) and |
| President of BellSouth Enterprises. He is currently a Director of Liberty |
| Corporation (holding company), Duke Realty Corporation (real estate), |
| and Progress Energy, Inc. (electric utility). He is also a partner of Frank- |
| lin Street Partners (private investment management firm) and a member |
| of the Research Triangle Foundation Board. In addition, Mr. McCoy |
| served as the Interim Chancellor (1999-2000) and a member of the |
| Board of Visitors for the University of North Carolina at Chapel Hill and |
| currently serves on the Board of Directors of the University of North |
| Carolina Health Care System and the Board of Visitors of the Kenan- |
| Flagler Business School (University of North Carolina at Chapel Hill). He |
| also served as Vice President of Finance for the University of North Car- |
| olina (16-school system). |
Annual Report 42
| Name, Age; Principal Occupation |
| |
| Cornelia M. Small (61) |
| |
| Year of Election or Appointment: 2005 |
| Ms. Small is a member (2000-present) and Chairperson (2002-present) |
| of the Investment Committee, and a member (2002-present) of the |
| Board of Trustees of Smith College. Previously, she served as Chief In- |
| vestment Officer (1999-2000), Director of Global Equity Investments |
| (1996-1999), and a member of the Board of Directors of Scudder, Ste- |
| vens & Clark (1990-1997) and Scudder Kemper Investments |
| (1997-1998). In addition, Ms. Small served as Co-Chair (2000-2003) |
| of the Annual Fund for the Fletcher School of Law and Diplomacy. |
| |
| William S. Stavropoulos (66) |
| |
| Year of Election or Appointment: 2001 |
| Mr. Stavropoulos is Chairman of the Board (2000-present) and a Mem- |
| ber of the Board of Directors of The Dow Chemical Company. Since |
| joining The Dow Chemical Company in 1967, Mr. Stavropoulos served |
| in numerous senior management positions, including President |
| (1993-2000; 2002-2003), CEO (1995-2000; 2002-2004), and Chair- |
| man of the Executive Committee (2000-2004). Currently, he is a Direc- |
| tor of NCR Corporation (data warehousing and technology solutions), |
| BellSouth Corporation (telecommunications), Chemical Financial Corpo- |
| ration, Maersk Inc. (industrial conglomerate, 2002-present), and Metal- |
| mark Capital (private equity investment firm, 2005-present). He also |
| serves as a member of the Board of Trustees of the American Enterprise |
| Institute for Public Policy Research. In addition, Mr. Stavropoulos is a |
| member of The Business Council, J.P. Morgan International Council and |
| the University of Notre Dame Advisory Council for the College of |
| Science. |
| |
| Kenneth L. Wolfe (66) |
| |
| Year of Election or Appointment: 2005 |
| Mr. Wolfe also serves as a Trustee (2005-present) or Member of the |
| Advisory Board (2004-present) of other investment companies advised |
| by FMR. Prior to his retirement in 2001, Mr. Wolfe was Chairman and |
| Chief Executive Officer of Hershey Foods Corporation (1993-2001). He |
| currently serves as a member of the boards of Adelphia Communica- |
| tions Corporation (2003-present), Bausch & Lomb, Inc., and Revlon Inc. |
| (2004-present). |
43 Annual Report
Trustees and Officers - continued
Advisory Board Members and Executive Officers:
Correspondence intended for Mr. Gamper may be sent to Fidelity Investments, P.O. Box 55235, Boston, Massachusetts 02205-5235. Correspondence intended for each executive officer and Mr. Lynch may be sent to Fidelity Investments, 82 Devonshire Street, Boston, Massachusetts 02109.
| Name, Age; Principal Occupation |
| |
| Albert R. Gamper, Jr. (63) |
| |
| Year of Election or Appointment: 2005 |
| Member of the Advisory Board of Fidelity Advisor Series VIII. Prior to his |
| retirement in December 2004, Mr. Gamper served as Chairman of the |
| Board of CIT Group Inc. (commercial finance). During his tenure with |
| CIT Group Inc. Mr. Gamper served in numerous senior management |
| positions, including Chairman (1987-1989; 1999-2001; 2002-2004), |
| Chief Executive Officer (1987-2004), and President (1989-2002). He |
| currently serves as a member of the Board of Directors of Public Service |
| Enterprise Group (utilities, 2001-present), Chairman of the Board of |
| Governors, Rutgers University (2004-present), and Chairman of the |
| Board of Saint Barnabas Health Care System. |
| |
| Peter S. Lynch (61) |
| |
| Year of Election or Appointment: 2003 |
| Member of the Advisory Board of Fidelity Advisor Series VIII. Vice |
| Chairman and a Director of FMR, and Vice Chairman (2001-present) |
| and a Director (2000-present) of FMR Co., Inc. Previously, Mr. Lynch |
| served as a Trustee of the Fidelity funds (1990-2003). In addition, he |
| serves as a Trustee of Boston College, Massachusetts Eye & Ear |
| Infirmary, Historic Deerfield, John F. Kennedy Library, and the Museum |
| of Fine Arts of Boston. |
| |
| Dwight D. Churchill (51) |
| |
| Year of Election or Appointment: 2005 |
| Vice President of Advisor Emerging Markets. Mr. Churchill also serves |
| as Vice President of certain Equity Funds (2005-present) and certain |
| High Income Funds (2005-present). Previously, he served as Head of |
| Fidelity’s Fixed-Income Division (2000-2005), Vice President of Fidelity’s |
| Money Market Funds (2000-2005), Vice President of Fidelity’s Bond |
| Funds, and Senior Vice President of FIMM (2000) and FMR. Mr. Chur- |
| chill joined Fidelity in 1993 as Vice President and Group Leader of Tax- |
| able Fixed-Income Investments. |
Annual Report 44
| Name, Age; Principal Occupation |
| |
| Robert von Rekowsky (39) |
| |
| Year of Election or Appointment: 2005 |
| Vice President of Advisor Emerging Markets. Mr. von Rekowsky also |
| serves as Vice President of other funds advised by FMR. Prior to his cur- |
| rent responsibilities, Mr. von Rekowsky has worked as a research ana- |
| lyst and manager. |
| |
| Eric D. Roiter (56) |
| |
| Year of Election or Appointment: 2004 |
| Secretary of Advisor Emerging Markets. He also serves as Secretary of |
| other Fidelity funds; Vice President, General Counsel, and Secretary of |
| FMR Co., Inc. (2001-present) and FMR; Assistant Secretary of Fidelity |
| Management & Research (U.K.) Inc. (2001-present), Fidelity Manage- |
| ment & Research (Far East) Inc. (2001-present), and Fidelity Investments |
| Money Management, Inc. (2001-present). Mr. Roiter is an Adjunct |
| Member, Faculty of Law, at Boston College Law School (2003-present). |
| Previously, Mr. Roiter served as Vice President and Secretary of Fidelity |
| Distributors Corporation (FDC) (1998-2005). |
| |
| Stuart Fross (46) |
| |
| Year of Election or Appointment: 2004 |
| Assistant Secretary of Advisor Emerging Markets. Mr. Fross also serves |
| as Assistant Secretary of other Fidelity funds (2003-present), Vice Presi- |
| dent and Secretary of FDC (2005-present), and is an employee of FMR. |
| |
| Christine Reynolds (47) |
| |
| Year of Election or Appointment: 2004 |
| President, Treasurer, and Anti-Money Laundering (AML) officer of Advi- |
| sor Emerging Markets. Ms. Reynolds also serves as President, Treasurer, |
| and AML officer of other Fidelity funds (2004) and is a Vice President |
| (2003) and an employee (2002) of FMR. Before joining Fidelity Invest- |
| ments, Ms. Reynolds worked at PricewaterhouseCoopers LLP (PwC) |
| (1980-2002), where she was most recently an audit partner with PwC’s |
| investment management practice. |
| |
| Paul M. Murphy (58) |
| |
| Year of Election or Appointment: 2005 |
| Chief Financial Officer of Advisor Emerging Markets. Mr. Murphy also |
| serves as Chief Financial Officer of other Fidelity funds (2005-present). |
| He also serves as Senior Vice President of Fidelity Pricing and Cash |
| Management Services Group (FPCMS). |
45 Annual Report
Trustees and Officers - continued
| Name, Age; Principal Occupation |
| |
| Kenneth A. Rathgeber (58) |
| |
| Year of Election or Appointment: 2004 |
| Chief Compliance Officer of Advisor Emerging Markets. Mr. Rathgeber |
| also serves as Chief Compliance Officer of other Fidelity funds (2004) |
| and Executive Vice President of Risk Oversight for Fidelity Investments |
| (2002). Previously, he served as Executive Vice President and Chief Op- |
| erating Officer for Fidelity Investments Institutional Services Company, |
| Inc. (1998-2002). |
| |
| John R. Hebble (47) |
| |
| Year of Election or Appointment: 2004 |
| Deputy Treasurer of Advisor Emerging Markets. Mr. Hebble also serves |
| as Deputy Treasurer of other Fidelity funds (2003), and is an employee |
| of FMR. Before joining Fidelity Investments, Mr. Hebble worked at |
| Deutsche Asset Management where he served as Director of Fund Ac- |
| counting (2002-2003) and Assistant Treasurer of the Scudder Funds |
| (1998-2003). |
| |
| Bryan A. Mehrmann (44) |
| |
| Year of Election or Appointment: 2005 |
| Deputy Treasurer of Advisor Emerging Markets. Mr. Mehrmann also |
| serves as Deputy Treasurer of other Fidelity funds (2005-present) and is |
| an employee of FMR. Previously, Mr. Mehrmann served as Vice Presi- |
| dent of Fidelity Investments Institutional Services Group (FIIS)/Fidelity |
| Investments Institutional Operations Corporation, Inc. (FIIOC) Client |
| Services (1998-2004). |
| |
| Kimberley H. Monasterio (41) |
| |
| Year of Election or Appointment: 2004 |
| Deputy Treasurer of Advisor Emerging Markets. Ms. Monasterio also |
| serves as Deputy Treasurer of other Fidelity funds (2004) and is an em- |
| ployee of FMR (2004). Before joining Fidelity Investments, Ms. Monas- |
| terio served as Treasurer (2000-2004) and Chief Financial Officer |
| (2002-2004) of the Franklin Templeton Funds and Senior Vice President |
| of Franklin Templeton Services, LLC (2000-2004). |
| |
| Kenneth B. Robins (36) |
| |
| Year of Election or Appointment:2005 |
| Deputy Treasurer of Advisor Emerging Markets. Mr. Robins also serves |
| as Deputy Treasurer of other Fidelity funds (2005-present) and is an |
| employee of FMR (2004-present). Before joining Fidelity Investments, |
| Mr. Robins worked at KPMG LLP, where he was a partner in KPMG’s |
| department of professional practice (2002-2004) and a Senior Manag- |
| er (1999-2000). In addition, Mr. Robins served as Assistant Chief Ac- |
| countant, United States Securities and Exchange Commission |
| (2000-2002). |
Annual Report 46
| Name, Age; Principal Occupation |
| |
| Robert G. Byrnes (38) |
| |
| Year of Election or Appointment: 2005 |
| Assistant Treasurer of Advisor Emerging Markets. Mr. Byrnes also serves |
| as Assistant Treasurer of other Fidelity funds (2005-present) and is an |
| employee of FMR (2005-present). Previously, Mr. Byrnes served as Vice |
| President of FPCMS (2003-2005). Before joining Fidelity Investments, |
| Mr. Byrnes worked at Deutsche Asset Management where he served as |
| Vice President of the Investment Operations Group (2000-2003). |
| |
| John H. Costello (59) |
| |
| Year of Election or Appointment: 2004 |
| Assistant Treasurer of Advisor Emerging Markets. Mr. Costello also |
| serves as Assistant Treasurer of other Fidelity funds and is an employee |
| of FMR. |
| |
| Peter L. Lydecker (51) |
| |
| Year of Election or Appointment: 2004 |
| Assistant Treasurer of Advisor Emerging Markets. Mr. Lydecker also |
| serves as Assistant Treasurer of other Fidelity funds (2004) and is an |
| employee of FMR. |
| |
| Mark Osterheld (50) |
| |
| Year of Election or Appointment: 2004 |
| Assistant Treasurer of Advisor Emerging Markets. Mr. Osterheld also |
| serves as Assistant Treasurer of other Fidelity funds (2002) and is an |
| employee of FMR. |
| |
| Gary W. Ryan (47) |
| |
| Year of Election or Appointment: 2005 |
| Assistant Treasurer of Advisor Emerging Markets. Mr. Ryan also serves |
| as Assistant Treasurer of other Fidelity funds (2005-present) and is an |
| employee of FMR (2005-present). Previously, Mr. Ryan served as Vice |
| President of Fund Reporting in FPCMS (1999-2005). |
| |
| Salvatore Schiavone (39) |
| |
| Year of Election or Appointment: 2005 |
| Assistant Treasurer of Advisor Emerging Markets. Mr. Schiavone also |
| serves as Assistant Treasurer of other Fidelity funds (2005-present) and |
| is an employee of FMR (2005-present). Before joining Fidelity Invest- |
| ments, Mr. Schiavone worked at Deutsche Asset Management, where he |
| most recently served as Assistant Treasurer (2003-2005) of the Scudder |
| Funds and Vice President and Head of Fund Reporting (1996-2003). |
47 Annual Report
Board Approval of Investment Advisory Contracts and Management Fees
Advisor Emerging Markets Fund
Each year, typically in July, the Board of Trustees, including the independent Trustees (together, the Board), votes on the renewal of the management contract and sub-advisory agreements (together, the Advisory Contracts) for the fund. The Board, assisted by the advice of fund counsel and independent Trustees’ counsel, requests and considers a broad range of information throughout the year.
The Board meets regularly each month except August and takes into account throughout the year matters bearing on Advisory Contracts. The Board, acting directly and through its separate committees, considers at each of its meetings factors that are relevant to the annual renewal of the fund’s Advisory Contracts, including the services and support provided to the fund and its shareholders by Fidelity. At the time of the renewal, the Board had 11 standing committees, each composed of independent Trustees with varying backgrounds, to which the Board has assigned specific subject matter responsibilities in order to enhance effective decision-making by the Board. Each committee has adopted a written charter outlining the structure and purposes of the committee. One such committee, the Equity Contract Committee, meets periodically during the first six months of each year and as necessary to consider matters specifically related to the annual renewal of Advisory Contracts. The committee requests and receives information on, and makes recommendations to the independent Trustees concerning, the approval and annual review of the Advisory Contracts.
At its July 2005 meeting, the Board of Trustees, including the independent Trustees, unanimously determined to renew the Advisory Contracts for the fund. In reaching its determination, the Board considered all factors it believed relevant, including (1) the nature, extent, and quality of the services to be provided to the fund and its shareholders by Fidelity (including the investment performance of the fund); (2) the competitiveness of the management fee and total expenses of the fund; (3) the total costs of the services to be provided by and the profits to be realized by the investment adviser and its affiliates from the relationship with the fund; (4) the extent to which economies of scale would be realized as the fund grows; and (5) whether fee levels reflect these economies of scale, if any, for the benefit of fund shareholders.
In determining whether to renew the Advisory Contracts for the fund, the Board ultimately reached a determination, with the assistance of fund counsel and independent Trustees’ counsel, that the renewal of the Advisory Contracts and the compensation to be received by Fidelity under the management contract is consistent with Fidelity’s fiduciary duty under applicable law. In addition to evaluating the specific factors noted above, the Board, in reaching its determination, is aware that shareholders in the fund have a broad range of investment choices available to them, including a wide choice among mutual funds offered by competitors to Fidelity, and that the fund’s shareholders, with the opportunity to review and weigh the disclosure provided by the fund in its
prospectus and other public disclosures, have chosen to invest in this fund, managed by Fidelity.
Nature, Extent, and Quality of Services Provided by Fidelity. The Board considered staffing within the investment adviser, FMR, and the sub-advisers (together, the Investment Advisers), including the background of the fund’s portfolio manager and the fund’s investment objective and discipline. The independent Trustees also had discussions with senior management of Fidelity’s investment operations and investment groups. The Board considered the structure of the portfolio manager compensation program and whether this structure provides appropriate incentives.
Fidelity Resources Dedicated to Investment Management and Support Services. The Board reviewed the size, education, and experience of the Investment Advisers’ investment staff, their use of technology, and the Investment Advisers’ approach to recruiting, training, and retaining portfolio managers and other research, advisory, and management personnel. The Board considered Fidelity’s extensive global research capabilities that enable the Investment Advisers to aggregate data from various sources in an effort to produce positive investment results. The Board noted that Fidelity’s analysts have access to a variety of technological tools that enable them to perform both fundamental and quantitative analysis and to specialize in various disciplines. The Board also considered that Fidelity’s portfolio managers and analysts have access to daily portfolio attribution that allows for monitoring of a fund’s portfolio, as well as an electronic communication system that provides immediate real-time access to research concerning issuers and credit enhancers.
Shareholder and Administrative Services. The Board considered the nature, extent, quality, and cost of administrative, distribution, and shareholder services performed by the Investment Advisers and their affiliates under the Advisory Contracts and under separate agreements covering transfer agency, pricing and bookkeeping, and securities lending services for the fund. The Board also considered the nature and extent of the Investment Advisers’ supervision of third party service providers, principally custodians and subcustodians. The Board reviewed the allocation of fund brokerage, including allocations to brokers affiliated with the Investment Advisers, the use of brokerage commissions to pay fund expenses, and the use of “soft” commission dollars to pay for research services. The Board also considered that Fidelity voluntarily decided in 2004 to stop using “soft” commission dollars to pay for market data and, instead, to pay for that data out of its own resources. The Board also considered the resources devoted to, and the record of compliance with, the fund’s compliance policies and procedures.
The Board noted that the growth of fund assets across the complex allows Fidelity to reinvest in the development of services designed to enhance the value or convenience of the Fidelity funds as investment vehicles. These services include 24-hour access to
49 Annual Report
Board Approval of Investment Advisory Contracts and Management Fees - continued
account information and market information through phone representatives and over the Internet, and investor education materials and asset allocation tools.
Investment in a Large Fund Family. The Board considered the benefits to shareholders of investing in a Fidelity fund, including the benefits of investing in a fund that is part of a large family of funds offering a variety of investment disciplines and providing for a large variety of mutual fund investor services. For example, fund shareholders are offered the privilege of exchanging shares of the fund for shares of other Fidelity funds, as set forth in the fund’s prospectus, without paying an additional sales charge. The Board noted that, since July 2004, Fidelity has taken a number of actions that benefited particular funds, including (i) voluntarily deciding in 2004 to stop using “soft” commission dollars to pay for market data and, instead, to pay for that data out of its own resources, (ii) contractually agreeing to impose management fee reductions and expense limitations on its five Spartan stock index funds and its stock index fund available through variable insurance products, (iii) contractually agreeing to eliminate the management fees on the Fidelity Freedom Funds and the Fidelity Advisor Freedom Funds, (iv) contractually agreeing to reduce the management fees on most of its investment-grade taxable bond funds, and (v) contractually agreeing to impose expense limitations on its retail and Spartan investment-grade taxable bond funds.
Investment Performance and Compliance. The Board considered whether the fund has operated within its investment objective, as well as its record of compliance with its investment restrictions. The Board noted that it is not possible to evaluate performance in any comprehensive fashion because the fund had been in operation for less than one calendar year. Once the fund has been in operation for at least one calendar year, the Board will review the fund’s absolute investment performance for each class, as well as the fund’s relative investment performance for each class measured against (i) a broad-based securities market index and (ii) a peer group of mutual funds deemed appropriate by the Board.
The Board has had thorough discussions with FMR throughout the year about the Board’s and FMR’s concerns about equity research, equity fund performance, and compliance with internal policies governing gifts and entertainment. FMR has taken steps that it believes will refocus and strengthen equity research and equity portfolio management and compliance. The Board noted with favor FMR’s recent reorganization of its senior management team and FMR’s plans to dedicate additional resources to investment research, and participated in the process that led to those changes.
Based on its review, and giving particular weight to the nature and quality of the resources dedicated by the Investment Advisers to maintain and improve relative performance, the Board concluded that the nature, extent, and quality of the services provided by Fidelity will benefit the fund’s shareholders, particularly in light of the
Board’s view that the fund’s shareholders benefit from investing in a fund that is part of a large family of funds offering a variety of investment disciplines and services.
Competitiveness of Management Fee and Total Fund Expenses. The Board considered the fund’s management fee and total expenses compared to “mapped groups” of competitive funds and classes. Fidelity creates “mapped groups” by combining similar Lipper investment objective categories that have comparable management fee characteristics. Combining Lipper investment objective categories aids the Board’s management fee and total expense comparisons by broadening the competitive group used for comparison and by reducing the number of universes to which various Fidelity funds are compared.
The Board considered two proprietary management fee comparisons for the period of the fund’s operations shown in the chart below. The group of Lipper funds used by the Board for management fee comparisons is referred to below as the “Total Mapped Group” and, for the reasons explained above, is broader than the Lipper peer group used by the Board for performance comparisons. The Total Mapped Group comparison focuses on a fund’s standing relative to the total universe of comparable funds available to investors, in terms of gross management fees before expense reimbursements or caps. “TMG %” represents the percentage of funds in the Total Mapped Group that had management fees that were lower than the fund’s. For example, a TMG % of 28% means that 72% of the funds in the Total Mapped Group had higher management fees than the fund. The “Asset-Size Peer Group” (ASPG) comparison focuses on a fund’s standing relative to non-Fidelity funds similar in size to the fund within the Total Mapped Group. The ASPG represents at least 15% of the funds in the Total Mapped Group with comparable asset size and management fee characteristics, subject to a minimum of 50 funds (or all funds in the Total Mapped Group if fewer than 50). Additional information, such as the ASPG quartile (“quadrant”) in which the fund’s management fee ranked, is also included in the chart and considered by the Board.
51 Annual Report
Board Approval of Investment Advisory Contracts and Management Fees - continued
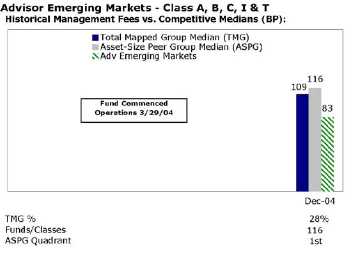
The Board noted that the fund’s management fee ranked below the median of its Total Mapped Group and below the median of its ASPG for the period.
Based on its review, the Board concluded that the fund’s management fee was fair and reasonable in light of the services that the fund receives and the other factors considered.
In its review of each class’s total expenses, the Board considered the fund’s management fee as well as other fund or class expenses, as applicable, such as transfer agent fees, pricing and bookkeeping fees, fund-paid 12b-1 fees, and custodial, legal, and audit fees. The Board also noted the effects of any waivers and reimbursements on fees and expenses. As part of its review, the Board also considered current and historical total expenses of each class of the fund compared to competitive fund median expenses. Each class of the fund is compared to those funds and classes in the Total Mapped Group (used by the Board for management fee comparisons) that have a similar sales load structure.
The Board noted that the total expenses of Class A ranked below its competitive median for the period, the total expenses of each of Class B and Class C ranked equal to its competitive median for the period, and the total expenses of each of Class T and Institutional Class ranked above its competitive median for the period. The Board noted that the fund offers multiple classes, each of which has a different sales load and 12b-1 fee structure, and that the multiple structures are intended to offer a range of pricing options for the intermediary market. The Board also noted that the total expenses of the classes vary primarily by the level of their 12b-1 fees, although differences in transfer agent fees may also cause expenses to vary from class to class.
Furthermore, the Board considered that on December 16, 2004, it had approved changes (effective January 1, 2005) in the transfer agent and service agreements for the fund that established maximum transfer agent fees and eliminated the minimum pricing and bookkeeping fee to prevent small funds or funds with small average account sizes from having relatively high fees in basis points (the “small-fund fee reductions”). The Board considered that, if the small-fund fee reductions had been in effect in 2004, the total expenses of each of Class T and Institutional Class would have ranked below the median.
In its review of total expenses, the Board also considered Fidelity fee structures and other information on clients that FMR and its affiliates service in other competitive markets, such as other mutual funds advised or subadvised by FMR or its affiliates, pension plan clients, and other institutional clients.
Based on its review, the Board concluded that the total expenses for each class of the fund were reasonable, although in some cases above the median of the universe presented for comparison, in light of the services that the fund and its shareholders receive and the other factors considered.
Costs of the Services and Profitability. The Board considered the revenues earned and the expenses incurred by Fidelity in conducting the business of developing, marketing, distributing, managing, administering and servicing the fund and its shareholders. The Board also considered the level of Fidelity’s profits in respect of all the Fidelity funds.
On an annual basis, FMR presents to the Board Fidelity’s profitability for the fund. Fidelity calculates the profitability for each fund, as well as aggregate profitability for groups of Fidelity funds and all Fidelity funds, using a series of detailed revenue and cost allocation methodologies which originate with the audited books and records of Fidelity. The Audit Committee of the Board reviews any significant changes from the prior year’s methodologies.
PricewaterhouseCoopers LLP (PwC), independent registered accounting firm and auditor to Fidelity and certain Fidelity funds, has been engaged annually by the Board as part of the Board’s assessment of the results of Fidelity’s profitability analysis. PwC’s engagement includes the review and assessment of Fidelity’s methodologies used in determining the revenues and expenses attributable to Fidelity’s mutual fund business, and completion of agreed-upon procedures surrounding the mathematical accuracy of fund profitability and its conformity to allocation methodologies. After considering PwC’s reports issued under the engagement and information provided by Fidelity, the Board believes that while other allocation methods may also be reasonable, Fidelity’s profitability methodologies are reasonable in all material respects.
The Board has also reviewed Fidelity’s non-fund businesses and any fall-out benefits related to the mutual fund business as well as cases where Fidelity’s affiliates may
53 Annual Report
Board Approval of Investment Advisory Contracts and Management Fees - continued
benefit from or be related to the fund’s business. In addition, a special committee of the Board reviewed services provided to Fidelity by its affiliates and determined that the fees that Fidelity paid for such services were reasonable.
The Board considered the costs of the services provided by and the profits realized by Fidelity in connection with the operation of the fund and determined that the amount of profit is a fair entrepreneurial profit for the management of the fund.
Economies of Scale. The Board considered whether there have been economies of scale in respect of the management of the Fidelity funds, whether the Fidelity funds (including the fund) have appropriately benefited from any such economies of scale, and whether there is potential for realization of any further economies of scale. The Board considered the extent to which the fund will benefit from economies of scale through increased services to the fund, through waivers or reimbursements, or through fee or expense reductions, including reductions that occur through operation of the transfer agent agreement. The transfer agent fee varies in part based on the number of accounts in the fund. If the number of accounts decreases or the average account size increases, the overall transfer agent fee rate decreases.
The Board recognized that the fund’s management contract incorporates a “group fee” structure, which provides for lower fee rates as total fund assets under FMR’s management increase, and for higher fee rates as total fund assets under FMR’s management decrease. The Board considered that the group fee is designed to deliver the benefits of economies of scale to fund shareholders when total fund assets increase, even if assets of any particular fund are unchanged or have declined, because some portion of Fidelity’s costs are attributable to services provided to all Fidelity funds, and all funds benefit if those costs can be allocated among more assets. The Board concluded that, given the group fee structure, fund shareholders will achieve a certain level of economies of scale as assets under FMR’s management increase at the fund complex level, regardless of whether Fidelity achieves any such economies of scale.
The Board further concluded that any potential economies of scale are being shared between fund shareholders and Fidelity in an appropriate manner.
Additional Information Requested by the Board. In order to develop fully the factual basis for consideration of the Advisory Contracts, the Board requested additional information regarding (i) equity fund transfer agency fees; (ii) Fidelity’s fund profitability methodology and the impact of various changes in the methodology over time; (iii) benefits to shareholders from economies of scale; (iv) composition and characteristics of various fund and industry data used in comparisons; and (v) compensation of portfolio managers and research analysts.
Based on its evaluation of all of the conclusions noted above, and after considering all material factors, the Board ultimately concluded that the existing advisory fee structures are fair and reasonable, and that the fund’s existing Advisory Contracts should be renewed.
55 Annual Report
57 Annual Report
Investment Adviser
Fidelity Management & Research Company
Boston, MA
Investment Sub-Advisers
FMR Co., Inc.
Fidelity Management & Research
(U.K.) Inc.
Fidelity Management & Research
(Far East) Inc.
Fidelity International
Investment Advisors
Fidelity Investments Japan Limited
Fidelity International Investment
Advisors (U.K.) Limited
General Distributor
Fidelity Distributors Corporation
Boston, MA
Transfer and Service Agent
Fidelity Investments Institutional
Operations Company, Inc.
Boston, MA
Custodian
JPMorgan Chase Bank
New York, NY
|


Fidelity® Advisor
Europe Capital Appreciation
Fund - Class A, Class T, Class B and Class C
Annual Report October 31, 2005

| Contents | | | | |
| |
| Chairman’s Message | | 4 | | Ned Johnson’s message to shareholders. |
| Performance | | 6 | | How the fund has done over time. |
| Management’s Discussion | | 8 | | The manager’s review of fund |
| | | | | performance, strategy and outlook. |
| Shareholder Expense | | 9 | | An example of shareholder expenses. |
| Example | | | | |
| Investment Changes | | 11 | | A summary of major shifts in the fund’s |
| | | | | investments over the past six months. |
| Investments | | 12 | | A complete list of the fund’s investments |
| | | | | with their market values. |
| Financial Statements | | 16 | | Statements of assets and liabilities, |
| | | | | operations, and changes in net assets, |
| | | | | as well as financial highlights. |
| Notes | | 25 | | Notes to the financial statements. |
| Report of Independent | | 34 | | |
| Registered Public | | | | |
| Accounting Firm | | | | |
| Trustees and Officers | | 35 | | |
| Distributions | | 45 | | |
| Board Approval of | | 46 | | |
| Investment Advisory | | | | |
| Contracts and | | | | |
| Management Fees | | | | |
To view a fund’s proxy voting guidelines and proxy voting record for the 12-month period ended June 30, visit www.fidelity.com/proxyvotingresults or visit the Securities and Exchange Commission’s (SEC) web site at www.sec.gov. You may also call 1-877-208-0098 to request a free copy of the proxy voting guidelines.
Standard & Poor’s, S&P and S&P 500 are registered service marks of The McGraw-Hill Companies, Inc. and have been licensed for use by Fidelity Distributors Corporation.
Other third party marks appearing herein are the property of their respective owners.
All other marks appearing herein are registered or unregistered trademarks or service marks of FMR Corp. or an affiliated company.
The views expressed in the Management’s Discussion of Fund Performance reflect those of the portfolio manager only through the end of the period of the report as stated on the cover and do not necessarily represent the views of Fidelity or any other person in the Fidelity organization. Any such views are subject to change at any time based upon market or other conditions and Fidelity disclaims any responsibility to update such views. These views may not be relied on as investment advice and, because investment decisions for a Fidelity fund are based on numerous factors, may not be relied on as an indication of trading intent on behalf of any Fidelity fund.
This report and the financial statements contained herein are submitted for the general information of the shareholders of the fund. This report is not authorized for distribution to prospective investors in the fund unless preceded or accompanied by an effective prospectus.
A fund files its complete schedule of portfolio holdings with the SEC for the first and third quarters of each fiscal year on Form N-Q. Forms N-Q are available on the SEC’s web site at http://www.sec.gov. A fund’s Forms N-Q may be reviewed and copied at the SEC’s Public Reference Room in Washington, DC. Information regarding the operation of the SEC’s Public Reference Room may be obtained by calling 1-800-SEC-0330. For a complete list of a fund’s portfolio holdings, view the most recent quarterly holdings report, semiannual report, or annual report on Fidelity’s web site at http://www.advisor.fidelity.com.
NOT FDIC INSURED · MAY LOSE VALUE · NO BANK GUARANTEE
Neither the fund nor Fidelity Distributors Corporation is a bank.
3 Annual Report
Chairman’s Message
(Photograph of Edward C. Johnson 3d)
Dear Shareholder:
During the past year or so, much has been reported about the mutual fund industry, and much of it has been more critical than I believe is warranted. Allegations that some companies have been less than forthright with their shareholders have cast a shadow on the entire industry. I continue to find these reports disturbing, and assert that they do not create an accurate picture of the industry overall. Therefore, I would like to remind everyone where Fidelity stands on these issues. I will say two things specifically regarding allegations that some mutual fund companies were in violation of the Securities and Exchange Commission’s forward pricing rules or were involved in so-called “market timing” activities.
First, Fidelity has no agreements that permit customers who buy fund shares after 4 p.m. to obtain the 4 p.m. price. This is not a new policy. This is not to say that someone could not deceive the company through fraudulent acts. However, we are extremely diligent in preventing fraud from occurring in this manner — and in every other. But I underscore again that Fidelity has no so-called “agreements” that sanction illegal practices.
Second, Fidelity continues to stand on record, as we have for years, in opposition to predatory short-term trading that adversely affects shareholders in a mutual fund. Back in the 1980s, we initiated a fee — which is returned to the fund and, therefore, to investors — to discourage this activity. Further, we took the lead several years ago in developing a Fair Value Pricing Policy to prevent market timing on foreign securities in our funds. I am confident we will find other ways to make it more difficult for predatory traders to operate. However, this will only be achieved through close cooperation among regulators, legislators and the industry.
Yes, there have been unfortunate instances of unethical and illegal activity within the mutual fund industry from time to time. That is true of any industry. When this occurs, confessed or convicted offenders should be dealt with appropriately. But we are still concerned about the risk of over-regulation and the quick application of simplistic solutions to intricate problems. Every system can be improved, and we support and applaud well thought out improvements by regulators, legislators and industry representatives that achieve the common goal of building and protecting the value of investors’ holdings.
For nearly 60 years, Fidelity has worked very hard to improve its products and service to justify your trust. When our family founded this company in 1946, we had only a few hundred customers. Today, we serve more than 18 million customers including individual investors and participants in retirement plans across America.
Annual Report 4
Let me close by saying that we do not take your trust in us for granted, and we realize that we must always work to improve all aspects of our service to you. In turn, we urge you to continue your active participation with your financial matters, so that your interests can be well served.
Best regards,
/s/Edward C. Johnson 3d
5 Annual Report
Performance: The Bottom Line
Average annual total return reflects the change in the value of an investment, assuming reinvestment of the class’ dividend income and capital gains (the profits earned upon the sale of securities that have grown in value) and assuming a constant rate of performance each year. The $10,000 table and the fund’s returns do not reflect the deduction of taxes that a shareholder would pay on fund distributions or the redemption of fund shares. During periods of reimbursement by Fidelity, a fund’s total return will be greater than it would be had the reimbursement not occurred. How a fund did yesterday is no guarantee of how it will do tomorrow.
| Average Annual Total Returns | | | | | | |
| Periods ended October 31, 2005 | | Past 1 | | Past 5 | | Life of |
| | | year | | years | | fundA |
| Class A (incl. 5.75% sales charge) | | 12.35% | | 2.95% | | 3.78% |
| Class T (incl. 3.50% sales charge) | | 14.84% | | 3.22% | | 3.91% |
| Class B (incl. contingent deferred sales charge)B | | 13.32% | | 3.05% | | 3.88% |
| Class C (incl. contingent deferred sales charge)C | | 17.40% | | 3.40% | | 3.90% |
A From December 17, 1998.
B Class B shares’ contingent deferred sales charges included in the past one year, past five year, and life of fund total return figures are 5%, 2%, and 0%, respectively.
C Class C shares’ contingent deferred sales charges included in the past one year, past five year, and life of fund total return figures are 1%, 0%, and 0%, respectively.
Annual Report 6
| | $10,000 Over Life of Fund
|
Let’s say hypothetically that $10,000 was invested in Fidelity® Advisor Europe Capital Appreciation Fund — Class T on December 17, 1998, when the fund started, and the current 3.50% sales charge was paid. The chart shows how the value of your investment would have changed, and also shows how the MSCIr Europe Index performed over the same period.

Management’s Discussion of Fund Performance
Comments from Ian Hart, Portfolio Manager of Fidelity® Advisor Europe Capital Appreciation Fund
Foreign stock markets enjoyed broad-based advances during the 12-month period that ended October 31, 2005, encouraged by better-than-expected corporate earnings and markedly improved economies. For the 12 months overall, the Morgan Stanley Capital InternationalSM Europe, Australasia, Far East (MSCIr EAFE®) Index — a performance measure of developed stock markets outside the United States and Canada — gained 18.28% . The Japanese stock market climbed to its highest level in more than four years. Positive economic indicators and Prime Minister Koizumi’s decisive election victory attracted record inflows from overseas investors. In response, the Tokyo Stock Exchange Stock Price Index (TOPIX) soared 22.89% . Southeast Asian equities outside of Japan, particularly South Korea, also responded well to the better macroeconomic environment, illustrated by the 19.44% return for the MSCI All Country Far East ex Japan index. Euro-pean stock markets were up as well, despite investors’ concern about higher energy prices and potential downgrades to economic growth in the region. For the year overall, the MSCI Europe index rose 16.51% . Although robust, returns for U.S. investors in foreign markets were tempered somewhat by the strength of the dollar versus many major currencies.
During the past year, the fund’s Class A, Class T, Class B and Class C shares returned 19.20%, 19.00%, 18.32% and 18.40%, respectively, beating the MSCI Europe index and the LipperSM European Region Funds Average, which rose 18.34% . The fund’s outperformance versus the index was mainly attributable to astute security selection, with strong-performing picks even coming from generally weak market sectors. For example, the fund’s top contributor — both on an absolute and relative basis — was TANDBERG Television, a Norwegian technology company that provides infrastructure for the cable and TV industries, which performed well despite a lackluster environment for tech stocks. Similarly, within the lagging financials sector, several individual holdings did well, including Turkiye Garanti Bankasi, a Turkish bank; Banca Italease, an Italian leasing company; Amlin, a British specialty insurance underwriter; and Deutsche Boerse, the German stock exchange. Conversely, performance was held back by the fund’s big underweighting in index component Roche Holdings, the Swiss pharmaceutical company, which did well during the period, as well as by some smaller names — among them, Italian broadband company FASTWEB and Turkish electrical utility Akenerji — where stories in which I had conviction hadn’t yet materialized.
Note to shareholders:
Effective January 1, 2006, Darren Maupin has been named Portfolio Manager of Fidelity Advisor Europe Capital Appreciation Fund, succeeding Ian Hart.
The views expressed in this statement reflect those of the portfolio manager only through October 31, 2005. See page 3 for further discussion of this section of the report.
Annual Report 8
8
Shareholder Expense Example
As a shareholder of the Fund, you incur two types of costs: (1) transaction costs, including sales charges (loads) on purchase payments or redemption proceeds, redemption fees, and (2) ongoing costs, including management fees, distribution and/or service (12b-1) fees and other Fund expenses. This Example is intended to help you understand your ongoing costs (in dollars) of investing in the Fund and to compare these costs with the ongoing costs of investing in other mutual funds.
The Example is based on an investment of $1,000 invested at the beginning of the period and held for the entire period (May 1, 2005 to October 31, 2005).
The first line of the table below for each class of the Fund provides information about actual account values and actual expenses. You may use the information in this line, together with the amount you invested, to estimate the expenses that you paid over the period. Simply divide your account value by $1,000.00 (for example, an $8,600 account value divided by $1,000.00 = 8.6), then multiply the result by the number in the first line for a class of the Fund under the heading entitled “Expenses Paid During Period” to estimate the expenses you paid on your account during this period.
Hypothetical Example for Comparison Purposes
The second line of the table below for each class of the Fund provides information about hypothetical account values and hypothetical expenses based on a Class’ actual expense ratio and an assumed rate of return of 5% per year before expenses, which is not the Class’ actual return. The hypothetical account values and expenses may not be used to estimate the actual ending account balance or expenses you paid for the period. You may use this information to compare the ongoing costs of investing in the Fund and other funds. To do so, compare this 5% hypothetical example with the 5% hypothetical examples that appear in the shareholder reports of the other funds.
Please note that the expenses shown in the table are meant to highlight your ongoing costs only and do not reflect any transaction costs. Therefore, the second line of the table is useful in comparing ongoing costs only, and will not help you determine the relative total costs of owning different funds. In addition, if these transactional costs were included, your costs would have been higher.
| | | | | | | | | | | | | Expenses Paid |
| | | | | Beginning | | | | Ending | | | | During Period* |
| | | Account Value | | Account Value | | | | May 1, 2005 |
| | | | | May 1, 2005 | | October 31, 2005 | | to October 31, 2005 |
| Class A | | | | | | | | | | | | |
| Actual | | $ | | 1,000.00 | | $ | | 1,096.00 | | $ | | 7.92 |
| HypotheticalA | | $ | | 1,000.00 | | $ | | 1,017.64 | | $ | | 7.63 |
| Class T | | | | | | | | | | | | |
| Actual | | $ | | 1,000.00 | | $ | | 1,094.30 | | $ | | 9.24 |
| HypotheticalA | | $ | | 1,000.00 | | $ | | 1,016.38 | | $ | | 8.89 |
| Class B | | | | | | | | | | | | |
| Actual | | $ | | 1,000.00 | | $ | | 1,090.80 | | $ | | 11.86 |
| HypotheticalA | | $ | | 1,000.00 | | $ | | 1,013.86 | | $ | | 11.42 |
9 Annual Report
| Shareholder Expense Example - continued | | | | |
| |
| |
| | | | | | | | | | | | | Expenses Paid |
| | | | | Beginning | | | | Ending | | | | During Period* |
| | | Account Value | | Account Value | | | | May 1, 2005 |
| | | | | May 1, 2005 | | October 31, 2005 | | to October 31, 2005 |
| Class C | | | | | | | | | | | | |
| Actual | | $ | | 1,000.00 | | $ | | 1,091.50 | | $ | | 11.86 |
| HypotheticalA | | $ | | 1,000.00 | | $ | | 1,013.86 | | $ | | 11.42 |
| Institutional Class | | | | | | | | | | | | |
| Actual | | $ | | 1,000.00 | | $ | | 1,097.40 | | $ | | 6.61 |
| HypotheticalA | | $ | | 1,000.00 | | $ | | 1,018.90 | | $ | | 6.36 |
| |
| A 5% return per year before expenses | | | | | | | | |
* Expenses are equal to each Class’ annualized expense ratio (shown in the table below); multiplied by the average account value over the period, multiplied by 184/365 (to reflect the one-half year period).
| | | Annualized |
| | | Expense Ratio |
| Class A | | 1.50% |
| Class T | | 1.75% |
| Class B | | 2.25% |
| Class C | | 2.25% |
| Institutional Class | | 1.25% |
Investment Changes
| Top Five Stocks as of October 31, 2005 | | | | |
| | | % of fund’s | | % of fund’s net assets |
| | | net assets | | 6 months ago |
| Total SA sponsored ADR (France, Oil, Gas & | | | | |
| Consumable Fuels) | | 5.0 | | 4.4 |
| ENI Spa (Italy, Oil, Gas & Consumable Fuels) | | 3.6 | | 2.6 |
| Novartis AG (Reg.) (Switzerland, | | | | |
| Pharmaceuticals) | | 3.4 | | 2.9 |
| BASF AG (Germany, Chemicals) | | 3.4 | | 1.5 |
| Vodafone Group PLC (United Kingdom, | | | | |
| Telecommunication Services) | | 3.0 | | 4.2 |
| | | 18.4 | | |
| Top Five Market Sectors as of October 31, 2005 | | |
| | | % of fund’s | | % of fund’s net assets |
| | | net assets | | 6 months ago |
| Financials | | 20.1 | | 21.7 |
| Energy | | 18.4 | | 16.0 |
| Consumer Discretionary | | 11.1 | | 10.2 |
| Telecommunication Services | | 10.7 | | 13.4 |
| Health Care | | 10.6 | | 11.3 |
| Top Five Countries as of October 31, 2005 | | |
| (excluding cash equivalents) | | % of fund’s | | % of fund’s net assets |
| | | net assets | | 6 months ago |
| United Kingdom | | 23.4 | | 22.0 |
| Germany | | 12.5 | | 12.5 |
| France | | 10.8 | | 11.9 |
| Italy | | 8.4 | | 5.3 |
| Switzerland | | 7.7 | | 10.1 |
| Percentages are adjusted for the effect of open futures contracts, if applicable. | | |

11 Annual Report
| Investments October 31, 2005 | | | | | | | | |
| Showing Percentage of Net Assets | | | | | | | | |
| |
| Common Stocks — 91.5% | | | | | | | | |
| | | | | Shares | | Value (Note 1) |
| |
| Austria – 1.0% | | | | | | | | |
| OMV AG | | | | 4,800 | | $ | | 258,930 |
| Canada – 0.9% | | | | | | | | |
| Eldorado Gold Corp. (a) | | | | 44,700 | | | | 136,636 |
| Hydrogenics Corp. (a) | | | | 31,000 | | | | 94,759 |
| TOTAL CANADA | | | | | | | | 231,395 |
| |
| Finland – 1.2% | | | | | | | | |
| Metso Corp. | | | | 11,500 | | | | 299,148 |
| France – 10.8% | | | | | | | | |
| AXA SA | | | | 7,700 | | | | 222,992 |
| Lagardere S.C.A. (Reg.) | | | | 3,400 | | | | 233,744 |
| Pernod Ricard SA | | | | 2,925 | | | | 511,576 |
| Renault SA | | | | 2,500 | | | | 216,524 |
| Sanofi-Aventis sponsored ADR | | | | 6,527 | | | | 261,863 |
| Total SA sponsored ADR | | | | 10,000 | | | | 1,260,196 |
| TOTAL FRANCE | | | | | | | | 2,706,895 |
| |
| Germany – 11.9% | | | | | | | | |
| Allianz AG (Reg.) | | | | 2,400 | | | | 339,360 |
| BASF AG | | | | 11,700 | | | | 842,400 |
| Bayer AG | | | | 14,000 | | | | 487,200 |
| Bilfinger & Berger Bau AG | | | | 2,721 | | | | 117,751 |
| DAB Bank AG | | | | 11,581 | | | | 87,322 |
| Deutsche Boerse AG | | | | 1,755 | | | | 165,149 |
| E.ON AG | | | | 5,100 | | | | 462,213 |
| MAN AG | | | | 5,100 | | | | 236,781 |
| SAP AG | | | | 1,300 | | | | 223,288 |
| TOTAL GERMANY | | | | | | | | 2,961,464 |
| |
| Greece – 0.5% | | | | | | | | |
| Greek Organization of Football Prognostics SA | | | | 4,700 | | | | 135,670 |
| Ireland – 0.8% | | | | | | | | |
| C&C Group PLC | | | | 32,600 | | | | 201,258 |
| Israel – 0.2% | | | | | | | | |
| Emblaze Ltd. (a) | | | | 18,400 | | | | 39,336 |
| Italy – 8.4% | | | | | | | | |
| Banca Intesa Spa | | | | 47,705 | | | | 222,627 |
| Banca Italease Spa | | | | 15,500 | | | | 327,929 |
| ENI Spa | | | | 31,500 | | | | 842,625 |
| ENI Spa sponsored ADR | | | | 400 | | | | 53,500 |
See accompanying notes which are an integral part of the financial statements.
| Common Stocks – continued | | | | | | |
| | | Shares | | Value (Note 1) |
| |
| Italy – continued | | | | | | |
| FASTWEB Spa (a) | | 6,527 | | $ | | 296,930 |
| Unicredito Italiano Spa | | 61,600 | | | | 343,961 |
| TOTAL ITALY | | | | | | 2,087,572 |
| |
| Luxembourg – 1.1% | | | | | | |
| Millicom International Cellular SA unit (a) | | 14,876 | | | | 284,943 |
| Netherlands – 3.1% | | | | | | |
| Completel Europe NV (a) | | 4,694 | | | | 218,606 |
| ING Groep NV (Certificaten Van Aandelen) | | 9,630 | | | | 277,922 |
| Koninklijke Philips Electronics NV (NY Shares) | | 11,031 | | | | 288,571 |
| TOTAL NETHERLANDS | | | | | | 785,099 |
| |
| Norway – 5.6% | | | | | | |
| Ocean RIG ASA (a) | | 18,200 | | | | 202,813 |
| Petroleum Geo-Services ASA (a) | | 15,200 | | | | 385,490 |
| Statoil ASA | | 22,200 | | | | 496,480 |
| TANDBERG ASA | | 9,100 | | | | 89,517 |
| TANDBERG Television ASA (a) | | 17,200 | | | | 214,141 |
| TOTAL NORWAY | | | | | | 1,388,441 |
| |
| Poland – 2.1% | | | | | | |
| Polski Koncern Naftowy Orlen SA | | 18,899 | | | | 335,548 |
| Powszechna Kasa Oszczednosci Bank SA | | 23,900 | | | | 200,965 |
| TOTAL POLAND | | | | | | 536,513 |
| |
| Russia – 0.8% | | | | | | |
| Mobile TeleSystems OJSC sponsored ADR | | 5,300 | | | | 196,047 |
| South Africa – 1.9% | | | | | | |
| Steinhoff International Holdings Ltd. | | 178,531 | | | | 467,214 |
| Spain – 1.9% | | | | | | |
| Banco Bilbao Vizcaya Argentaria SA | | 5,500 | | | | 96,965 |
| Telefonica SA sponsored ADR | | 7,908 | | | | 379,189 |
| TOTAL SPAIN | | | | | | 476,154 |
| |
| Sweden – 1.9% | | | | | | |
| Modern Times Group AB (MTG) (B Shares) (a) | | 3,000 | | | | 114,739 |
| OMX AB (a) | | 10,400 | | | | 127,036 |
| Skandia Foersaekrings AB | | 45,300 | | | | 225,887 |
| TOTAL SWEDEN | | | | | | 467,662 |
| |
| Switzerland – 7.7% | | | | | | |
| Actelion Ltd. (Reg.) (a) | | 1,097 | | | | 123,388 |
See accompanying notes which are an integral part of the financial statements.
13 Annual Report
13
| Investments - continued | | | | | | |
| |
| |
| Common Stocks – continued | | | | | | |
| | | Shares | | Value (Note 1) |
| |
| Switzerland – continued | | | | | | |
| Baloise Holdings AG (Reg.) | | 1,978 | | $ | | 100,806 |
| Credit Suisse Group (Reg.) | | 6,639 | | | | 294,174 |
| Novartis AG: | | | | | | |
| (Reg.) | | 13,558 | | | | 729,692 |
| sponsored ADR | | 2,400 | | | | 129,168 |
| Phonak Holding AG | | 4,118 | | | | 171,696 |
| Syngenta AG (Switzerland) | | 3,486 | | | | 373,708 |
| TOTAL SWITZERLAND | | | | | | 1,922,632 |
| |
| Turkey – 4.3% | | | | | | |
| Akenerji Elektrik Uretimi Otoproduktor Grubu AS (a) | | 55,997 | | | | 215,453 |
| Turkcell Iletisim Hizmet AS sponsored ADR | | 22,743 | | | | 299,753 |
| Turkiye Garanti Bankasi AS | | 52,463 | | | | 156,050 |
| Yapi ve Kredi Bankasi AS (a) | | 107,800 | | | | 402,007 |
| TOTAL TURKEY | | | | | | 1,073,263 |
| |
| United Kingdom – 23.4% | | | | | | |
| Amlin PLC | | 54,278 | | | | 213,094 |
| AstraZeneca PLC sponsored ADR | | 10,000 | | | | 449,000 |
| Axis Shield PLC (a) | | 19,200 | | | | 107,757 |
| BAE Systems PLC | | 90,300 | | | | 528,376 |
| Barratt Developments PLC | | 7,500 | | | | 100,451 |
| BG Group PLC | | 44,103 | | | | 387,287 |
| BowLeven PLC | | 7,950 | | | | 51,726 |
| British Land Co. PLC | | 15,478 | | | | 243,887 |
| BT Group PLC | | 65,900 | | | | 249,168 |
| Chaucer Holdings PLC | | 307,100 | | | | 289,523 |
| Expro International Group PLC | | 8,400 | | | | 72,500 |
| George Wimpey PLC | | 27,800 | | | | 201,304 |
| GlaxoSmithKline PLC | | 17,600 | | | | 457,512 |
| GlaxoSmithKline PLC sponsored ADR | | 4,500 | | | | 233,955 |
| Hilton Group PLC | | 36,100 | | | | 216,826 |
| ITV PLC | | 155,000 | | | | 285,397 |
| Prudential PLC | | 28,800 | | | | 241,688 |
| Standard Chartered PLC (United Kingdom) | | 18,800 | | | | 394,754 |
| Vodafone Group PLC | | 159,900 | | | | 419,898 |
| Vodafone Group PLC sponsored ADR | | 12,400 | | | | 325,624 |
| William Hill PLC | | 28,300 | | | | 267,804 |
| Wilson Bowden PLC | | 5,252 | | | | 104,514 |
| TOTAL UNITED KINGDOM | | | | | | 5,842,045 |
See accompanying notes which are an integral part of the financial statements.
| Common Stocks – continued | | | | |
| | | Shares | | Value (Note |
| United States of America – 2.0% | | | | |
| AES Corp. (a) | | 12,700 | | $ 201,803 |
| Forest Oil Corp. (a) | | 6,600 | | 288,288 |
| TOTAL UNITED STATES OF AMERICA | | | | 490,091 |
| |
| TOTAL COMMON STOCKS | | | | |
| (Cost $21,177,681) | | | | 22,851,772 |
| Nonconvertible Preferred Stocks — 0.6% | | | | |
| |
| Germany – 0.6% | | | | |
| Porsche AG (non-vtg.) | | | | |
| (Cost $138,400) | | 230 | | 165,841 |
| Money Market Funds — 9.2% | | | | |
| Fidelity Cash Central Fund, 3.92% (b) | | | | |
| (Cost $2,303,729) | | 2,303,729 | | 2,303,729 |
| TOTAL INVESTMENT PORTFOLIO – 101.3% | | | | |
| (Cost $23,619,810) | | | | 25,321,342 |
| |
| NET OTHER ASSETS – (1.3)% | | | | (337,265) |
| NET ASSETS – 100% | | $ | | 24,984,077 |
(a) Non-income producing
(b) Affiliated fund that is available only to investment companies and other accounts managed by Fidelity Investments. The rate quoted is the annualized seven-day yield of the fund at period end. A complete unaudited listing of the fund’s holdings as of its most recent quarter end is available upon request.
See accompanying notes which are an integral part of the financial statements.
15 Annual Report
15
| Financial Statements | | | | | | | | |
| |
| |
| Statement of Assets and Liabilities | | | | | | | | |
| | | | | | | October 31, 2005 |
| |
| Assets | | | | | | | | |
| Investment in securities, at value (cost $23,619,810) — | | | | | | | | |
| See accompanying schedule | | | | | | $ | | 25,321,342 |
| Receivable for investments sold | | | | | | | | 80,036 |
| Receivable for fund shares sold | | | | | | | | 58,025 |
| Dividends receivable | | | | | | | | 44,563 |
| Interest receivable | | | | | | | | 4,423 |
| Receivable from investment adviser for expense | | | | | | | | |
| reductions | | | | | | | | 8,897 |
| Other receivables | | | | | | | | 3,333 |
| Total assets | | | | | | | | 25,520,619 |
| |
| Liabilities | | | | | | | | |
| Payable for investments purchased | | $ | | 407,881 | | | | |
| Payable for fund shares redeemed | | | | 43,806 | | | | |
| Accrued management fee | | | | 15,015 | | | | |
| Distribution fees payable | | | | 13,888 | | | | |
| Other affiliated payables | | | | 9,546 | | | | |
| Other payables and accrued expenses | | | | 46,406 | | | | |
| Total liabilities | | | | | | | | 536,542 |
| |
| Net Assets | | | | | | $ | | 24,984,077 |
| Net Assets consist of: | | | | | | | | |
| Paid in capital | | | | | | $ | | 22,783,334 |
| Undistributed net investment income | | | | | | | | 111,189 |
| Accumulated undistributed net realized gain (loss) on | | | | | | | | |
| investments and foreign currency transactions | | | | | | | | 388,383 |
| Net unrealized appreciation (depreciation) on | | | | | | | | |
| investments and assets and liabilities in foreign | | | | | | | | |
| currencies | | | | | | | | 1,701,171 |
| Net Assets | | | | | | $ | | 24,984,077 |
See accompanying notes which are an integral part of the financial statements.
| Statement of Assets and Liabilities — continued | | | | |
| | | October 31, 2005 |
| |
| Calculation of Maximum Offering Price | | | | |
| Class A: | | | | |
| Net Asset Value and redemption price per share | | | | |
| ($4,543,672 ÷337,377 shares) | | $ | | 13.47 |
| Maximum offering price per share (100/94.25 of | | | | |
| $13.47) | | $ | | 14.29 |
| Class T: | | | | |
| Net Asset Value and redemption price per share | | | | |
| ($8,893,172 ÷666,631 shares) | | $ | | 13.34 |
| Maximum offering price per share (100/96.50 of | | | | |
| $13.34) | | $ | | 13.82 |
| Class B: | | | | |
| Net Asset Value and offering price per share | | | | |
| ($6,415,069 ÷494,099 shares)A | | $ | | 12.98 |
| Class C: | | | | |
| Net Asset Value and offering price per share | | | | |
| ($4,565,985 ÷351,297 shares)A | | $ | | 13.00 |
| Institutional Class: | | | | |
| Net Asset Value, offering price and redemption price | | | | |
| per share ($566,179 ÷41,525 shares) | | $ | | 13.63 |
| |
| A Redemption price per share is equal to net asset value less any applicable contingent deferred sales charge. | | | | |
See accompanying notes which are an integral part of the financial statements.
17 Annual Report
| Financial Statements - continued | | | | | | |
| |
| |
| Statement of Operations | | | | | | |
| | | | | Year ended October 31, 2005 |
| |
| Investment Income | | | | | | |
| Dividends | | | | $ | | 603,768 |
| Interest | | | | | | 27,140 |
| Security lending | | | | | | 4,473 |
| | | | | | | 635,381 |
| Less foreign taxes withheld | | | | | | (60,240) |
| Total income | | | | | | 575,141 |
| |
| Expenses | | | | | | |
| Management fee | | $ | | 173,211 | | |
| Transfer agent fees | | | | 100,560 | | |
| Distribution fees | | | | 162,646 | | |
| Accounting and security lending fees | | | | 17,084 | | |
| Independent trustees’ compensation | | | | 111 | | |
| Custodian fees and expenses | | | | 71,160 | | |
| Registration fees | | | | 53,418 | | |
| Audit | | | | 45,131 | | |
| Legal | | | | 641 | | |
| Miscellaneous | | | | 226 | | |
| Total expenses before reductions | | | | 624,188 | | |
| Expense reductions | | | | (173,992) | | 450,196 |
| |
| Net investment income (loss) | | | | | | 124,945 |
| Realized and Unrealized Gain (Loss) | | | | | | |
| Net realized gain (loss) on: | | | | | | |
| Investment securities | | | | 4,341,381 | | |
| Foreign currency transactions | | | | (14,394) | | |
| Total net realized gain (loss) | | | | | | 4,326,987 |
| Change in net unrealized appreciation (depreciation) | | | | | | |
| on: | | | | | | |
| Investment securities | | | | (570,459) | | |
| Assets and liabilities in foreign currencies | | | | (3,466) | | |
| Total change in net unrealized appreciation | | | | | | |
| (depreciation) | | | | | | (573,925) |
| Net gain (loss) | | | | | | 3,753,062 |
| Net increase (decrease) in net assets resulting from | | | | | | |
| operations | | | | $ | | 3,878,007 |
See accompanying notes which are an integral part of the financial statements.
| Statement of Changes in Net Assets | | | | | | | | |
| | | | | Year ended | | | | Year ended |
| | | | | October 31, | | | | October 31, |
| | | | | 2005 | | | | 2004 |
| Increase (Decrease) in Net Assets | | | | | | | | |
| Operations | | | | | | | | |
| Net investment income (loss) | | $ | | 124,945 | | $ | | (77,210) |
| Net realized gain (loss) | | | | 4,326,987 | | | | 3,220,062 |
| Change in net unrealized appreciation | | | | | | | | |
| (depreciation) | | | | (573,925) | | | | (582,905) |
| Net increase (decrease) in net assets resulting | | | | | | | | |
| from operations | | | | 3,878,007 | | | | 2,559,947 |
| Distributions to shareholders from net investment | | | | | | | | |
| income | | | | — | | | | (86,506) |
| Share transactions — net increase (decrease) | | | | 118,782 | | | | (1,503,949) |
| Redemption fees | | | | 568 | | | | 50 |
| Total increase (decrease) in net assets | | | | 3,997,357 | | | | 969,542 |
| |
| Net Assets | | | | | | | | |
| Beginning of period | | | | 20,986,720 | | | | 20,017,178 |
| End of period (including undistributed net invest- | | | | | | | | |
| ment income of $111,189 and accumulated net | | | | | | | | |
| investment loss of $2,363, respectively) | | $ | | 24,984,077 | | $ | | 20,986,720 |
See accompanying notes which are an integral part of the financial statements.
19 Annual Report
| Financial Highlights — Class A | | | | | | | | | | |
| Years ended October 31, | | 2005 | | 2004 | | 2003 | | | | 2002 | | | | 2001 |
| Selected Per-Share Data | | | | | | | | | | | | | | |
| Net asset value, | | | | | | | | | | | | | | |
| beginning of period | | $ 11.30 | | $ 10.00 | | $ 8.03 | | $ | | 9.00 | | $ | | 11.13 |
| Income from Investment | | | | | | | | | | | | | | |
| Operations | | | | | | | | | | | | | | |
| Net investment income | | | | | | | | | | | | | | |
| (loss)C | | 12 | | .01 | | .04 | | | | .05 | | | | .01 |
| Net realized and unre- | | | | | | | | | | | | | | |
| alized gain (loss) | | 2.05 | | 1.37 | | 1.98 | | | | (1.02) | | | | (2.14) |
| Total from investment | | | | | | | | | | | | | | |
| operations | | 2.17 | | 1.38 | | 2.02 | | | | (.97) | | | | (2.13) |
| Distributions from net | | | | | | | | | | | | | | |
| investment income | | — | | (.08) | | (.05) | | | | — | | | | — |
| Redemption fees added to | | | | | | | | | | | | | | |
| paid in capitalC | | —E | | —E | | — | | | | — | | | | — |
| Net asset value, end of | | | | | | | | | | | | | | |
| period | | $ 13.47 | | $ 11.30 | | $ 10.00 | | $ | | 8.03 | | $ | | 9.00 |
| Total ReturnA,B | | 19.20% | | 13.87% | | 25.30% | | | | (10.78)% | | | | (19.14)% |
| Ratios to Average Net AssetsD | | | | | | | | | | | | |
| Expenses before ex- | | | | | | | | | | | | | | |
| pense reductions | | 2.16% | | 2.41%F | | 3.07% | | | | 2.57% | | | | 2.16% |
| Expenses net of volun- | | | | | | | | | | | | | | |
| tary waivers, if any | | 1.55% | | 1.75% | | 1.75% | | | | 1.96% | | | | 2.00% |
| Expenses net of all | | | | | | | | | | | | | | |
| reductions | | 1.44% | | 1.68% | | 1.69% | | | | 1.91% | | | | 1.95% |
| Net investment income | | | | | | | | | | | | | | |
| (loss) | | 95% | | .07% | | .49% | | | | .48% | | | | .14% |
| Supplemental Data | | | | | | | | | | | | | | |
| Net assets, end of | | | | | | | | | | | | | | |
| period (000 omitted) | | $ 4,544 | | $ 2,905 | | $ 3,346 | | $ 2,071 | | $ | | 2,577 |
| Portfolio turnover rate | | 135% | | 123% | | 199% | | | | 137% | | | | 85% |
A Total returns would have been lower had certain expenses not been reduced during the periods shown.
B Total returns do not include the effect of the sales charges.
C Calculated based on average shares outstanding during the period.
D Expense ratios reflect operating expenses of the class. Expenses before reductions do not reflect amounts reimbursed by the investment adviser or reductions from brokerage service arrangements or other expense offset arrangements and do not represent the amount paid by the class during periods when reimbursements or reductions occur. Expenses net of any voluntary waivers reflect expenses after reimbursement by the investment adviser but prior to reductions from brokerage service arrangements or other expense offset arrangements. Expenses net of all reductions repre sent the net expenses paid by the class.
E Amount represents less than $.01 per share.
F As a result of an overaccrual of expenses for the year ended October 31, 2004, the ratio previously reported has been revised from 2.74% to 2.41% . The change had no impact on net investment income, total net assets or total return of the class.
See accompanying notes which are an integral part of the financial statements.
Annual Report 20
| Financial Highlights — Class T | | | | | | | | | | | | | | |
| Years ended October 31, | | 2005 | | 2004 | | | | 2003 | | | | 2002 | | | | 2001 |
| Selected Per-Share Data | | | | | | | | | | | | | | | | |
| Net asset value, | | | | | | | | | | | | | | | | |
| beginning of period | | $ 11.21 | | $ 9.93 | | $ | | 7.98 | | $ | | 8.95 | | $ | | 11.09 |
| Income from Investment | | | | | | | | | | | | | | | | |
| Operations | | | | | | | | | | | | | | | | |
| Net investment income | | | | | | | | | | | | | | | | |
| (loss)C | | 09 | | (.02) | | | | .02 | | | | .02 | | | | (.01) |
| Net realized and unre- | | | | | | | | | | | | | | | | |
| alized gain (loss) | | 2.04 | | 1.36 | | | | 1.96 | | | | (.99) | | | | (2.13) |
| Total from investment | | | | | | | | | | | | | | | | |
| operations | | 2.13 | | 1.34 | | | | 1.98 | | | | (.97) | | | | (2.14) |
| Distributions from net | | | | | | | | | | | | | | | | |
| investment income | | — | | (.06) | | | | (.03) | | | | — | | | | — |
| Redemption fees added to | | | | | | | | | | | | | | | | |
| paid in capitalC | | —E | | —E | | | | — | | | | — | | | | — |
| Net asset value, end of | | | | | | | | | | | | | | | | |
| period | | $ 13.34 | | $ 11.21 | | $ | | 9.93 | | $ | | 7.98 | | $ | | 8.95 |
| Total ReturnA,B | | 19.00% | | 13.54% | | | | 24.90% | | | | (10.84)% | | | | (19.30)% |
| Ratios to Average Net AssetsD | | | | | | | | | | | | | | |
| Expenses before ex- | | | | | | | | | | | | | | | | |
| pense reductions | | 2.45% | | 2.70%F | | | | 3.34% | | | | 2.80% | | | | 2.40% |
| Expenses net of volun- | | | | | | | | | | | | | | | | |
| tary waivers, if any | | 1.81% | | 2.00% | | | | 2.00% | | | | 2.20% | | | | 2.25% |
| Expenses net of all | | | | | | | | | | | | | | | | |
| reductions | | 1.70% | | 1.93% | | | | 1.94% | | | | 2.16% | | | | 2.19% |
| Net investment income | | | | | | | | | | | | | | | | |
| (loss) | | 70% | | (.18)% | | | | .24% | | | | .24% | | | | (.10)% |
| Supplemental Data | | | | | | | | | | | | | | | | |
| Net assets, end of | | | | | | | | | | | | | | | | |
| period (000 omitted) | | $ 8,893 | | $ 8,102 | | $ | | 7,628 | | $ 7,079 | | $ | | 9,749 |
| Portfolio turnover rate | | 135% | | 123% | | | | 199% | | | | 137% | | | | 85% |
A Total returns would have been lower had certain expenses not been reduced during the periods shown.
B Total returns do not include the effect of the sales charges.
C Calculated based on average shares outstanding during the period.
D Expense ratios reflect operating expenses of the class. Expenses before reductions do not reflect amounts reimbursed by the investment adviser or reductions from brokerage service arrangements or other expense offset arrangements and do not represent the amount paid by the class during periods when reimbursements or reductions occur. Expenses net of any voluntary waivers reflect expenses after reimbursement by the investment adviser but prior to reductions from brokerage service arrangements or other expense offset arrangements. Expenses net of all reductions repre sent the net expenses paid by the class.
E Amount represents less than $.01 per share.
F As a result of an overaccrual of expenses for the year ended October 31, 2004, the ratio previously reported has been revised from 3.03% to 2.70% . The change had no impact on net investment income, total net assets or total return of the class.
See accompanying notes which are an integral part of the financial statements.
21 Annual Report
| Financial Highlights — Class B | | | | | | | | | | | | | | |
| Years ended October 31, | | 2005 | | 2004 | | | | 2003 | | | | 2002 | | | | 2001 |
| Selected Per-Share Data | | | | | | | | | | | | | | | | |
| Net asset value, | | | | | | | | | | | | | | | | |
| beginning of period | | $ 10.97 | | $ 9.72 | | $ | | 7.82 | | $ | | 8.82 | | $ | | 10.99 |
| Income from Investment | | | | | | | | | | | | | | | | |
| Operations | | | | | | | | | | | | | | | | |
| Net investment income | | | | | | | | | | | | | | | | |
| (loss)C | | 02 | | (.07) | | | | (.02) | | | | (.02) | | | | (.06) |
| Net realized and unre- | | | | | | | | | | | | | | | | |
| alized gain (loss) | | 1.99 | | 1.33 | | | | 1.92 | | | | (.98) | | | | (2.11) |
| Total from investment | | | | | | | | | | | | | | | | |
| operations | | 2.01 | | 1.26 | | | | 1.90 | | | | (1.00) | | | | (2.17) |
| Distributions from net | | | | | | | | | | | | | | | | |
| investment income | | — | | (.01) | | | | — | | | | — | | | | — |
| Redemption fees added to | | | | | | | | | | | | | | | | |
| paid in capitalC | | —E | | —E | | | | — | | | | — | | | | — |
| Net asset value, end of | | | | | | | | | | | | | | | | |
| period | | $ 12.98 | | $ 10.97 | | $ | | 9.72 | | $ | | 7.82 | | $ | | 8.82 |
| Total ReturnA,B | | 18.32% | | 12.97% | | | | 24.30% | | | | (11.34)% | | | | (19.75)% |
| Ratios to Average Net AssetsD | | | | | | | | | | | | | | |
| Expenses before ex- | | | | | | | | | | | | | | | | |
| pense reductions | | 2.94% | | 3.20%F | | | | 3.87% | | | | 3.33% | | | | 2.95% |
| Expenses net of volun- | | | | | | | | | | | | | | | | |
| tary waivers, if any | | 2.32% | | 2.50% | | | | 2.50% | | | | 2.70% | | | | 2.75% |
| Expenses net of all | | | | | | | | | | | | | | | | |
| reductions | | 2.20% | | 2.43% | | | | 2.44% | | | | 2.65% | | | | 2.70% |
| Net investment income | | | | | | | | | | | | | | | | |
| (loss) | | 19% | | (.68)% | | | | (.26)% | | | | (.26)% | | | | (.61)% |
| Supplemental Data | | | | | | | | | | | | | | | | |
| Net assets, end of | | | | | | | | | | | | | | | | |
| period (000 omitted) | | $ 6,415 | | $ 6,288 | | $ | | 5,596 | | $ 5,717 | | $ | | 6,507 |
| Portfolio turnover rate | | 135% | | 123% | | | | 199% | | | | 137% | | | | 85% |
A Total returns would have been lower had certain expenses not been reduced during the periods shown.
B Total returns do not include the effect of the contingent deferred sales charge.
C Calculated based on average shares outstanding during the period.
D Expense ratios reflect operating expenses of the class. Expenses before reductions do not reflect amounts reimbursed by the investment adviser or reductions from brokerage service arrangements or other expense offset arrangements and do not represent the amount paid by the class during periods when reimbursements or reductions occur. Expenses net of any voluntary waivers reflect expenses after reimbursement by the investment adviser but prior to reductions from brokerage service arrangements or other expense offset arrangements. Expenses net of all reductions repre sent the net expenses paid by the class.
E Amount represents less than $.01 per share.
F As a result of an overaccrual of expenses for the year ended October 31, 2004, the ratio previously reported has been revised from 3.54% to 3.20% . The change had no impact on net investment income, total net assets or total return of the class.
See accompanying notes which are an integral part of the financial statements.
Annual Report 22
| Financial Highlights — Class C | | | | | | | | | | | | | | |
| Years ended October 31, | | 2005 | | 2004 | | | | 2003 | | | | 2002 | | | | 2001 |
| Selected Per-Share Data | | | | | | | | | | | | | | | | |
| Net asset value, | | | | | | | | | | | | | | | | |
| beginning of period | | $ 10.98 | | $ 9.73 | | $ | | 7.83 | | $ | | 8.84 | | $ | | 11.01 |
| Income from Investment | | | | | | | | | | | | | | | | |
| Operations | | | | | | | | | | | | | | | | |
| Net investment income | | | | | | | | | | | | | | | | |
| (loss)C | | 03 | | (.07) | | | | (.02) | | | | (.02) | | | | (.06) |
| Net realized and unre- | | | | | | | | | | | | | | | | |
| alized gain (loss) | | 1.99 | | 1.33 | | | | 1.92 | | | | (.99) | | | | (2.11) |
| Total from investment | | | | | | | | | | | | | | | | |
| operations | | 2.02 | | 1.26 | | | | 1.90 | | | | (1.01) | | | | (2.17) |
| Distributions from net | | | | | | | | | | | | | | | | |
| investment income | | — | | (.01) | | | | — | | | | — | | | | — |
| Redemption fees added to | | | | | | | | | | | | | | | | |
| paid in capitalC | | —E | | —E | | | | — | | | | — | | | | — |
| Net asset value, end of | | | | | | | | | | | | | | | | |
| period | | $ 13.00 | | $ 10.98 | | $ | | 9.73 | | $ | | 7.83 | | $ | | 8.84 |
| Total ReturnA,B | | 18.40% | | 12.96% | | | | 24.27% | | | �� | (11.43)% | | | | (19.71)% |
| Ratios to Average Net AssetsD | | | | | | | | | | | | | | |
| Expenses before ex- | | | | | | | | | | | | | | | | |
| pense reductions | | 2.86% | | 3.08%F | | | | 3.74% | | | | 3.22% | | | | 2.80% |
| Expenses net of volun- | | | | | | | | | | | | | | | | |
| tary waivers, if any | | 2.30% | | 2.50% | | | | 2.50% | | | | 2.71% | | | | 2.75% |
| Expenses net of all | | | | | | | | | | | | | | | | |
| reductions | | 2.19% | | 2.43% | | | | 2.44% | | | | 2.66% | | | | 2.70% |
| Net investment income | | | | | | | | | | | | | | | | |
| (loss) | | 20% | | (.68)% | | | | (.26)% | | | | (.27)% | | | | (.61)% |
| Supplemental Data | | | | | | | | | | | | | | | | |
| Net assets, end of | | | | | | | | | | | | | | | | |
| period (000 omitted) | | $ 4,566 | | $ 3,234 | | $ | | 3,076 | | $ 2,876 | | $ | | 4,393 |
| Portfolio turnover rate | | 135% | | 123% | | | | 199% | | | | 137% | | | | 85% |
A Total returns would have been lower had certain expenses not been reduced during the periods shown.
B Total returns do not include the effect of the contingent deferred sales charge.
C Calculated based on average shares outstanding during the period.
D Expense ratios reflect operating expenses of the class. Expenses before reductions do not reflect amounts reimbursed by the investment adviser or reductions from brokerage service arrangements or other expense offset arrangements and do not represent the amount paid by the class during periods when reimbursements or reductions occur. Expenses net of any voluntary waivers reflect expenses after reimbursement by the investment adviser but prior to reductions from brokerage service arrangements or other expense offset arrangements. Expenses net of all reductions repre sent the net expenses paid by the class.
E Amount represents less than $.01 per share.
F As a result of an overaccrual of expenses for the year ended October 31, 2004, the ratio previously reported has been revised from 3.41% to 3.08% . The change had no impact on net investment income, total net assets or total return of the class.
See accompanying notes which are an integral part of the financial statements.
23 Annual Report
| Financial Highlights — Institutional Class | | | | | | | | |
| Years ended October 31, | | 2005 | | 2004 | | 2003 | | | | 2002 | | | | 2001 |
| Selected Per-Share Data | | | | | | | | | | | | | | |
| Net asset value, | | | | | | | | | | | | | | |
| beginning of period | | $ 11.40 | | $ 10.07 | | $ 8.10 | | $ | | 9.05 | | $ 11.16 |
| Income from Investment | | | | | | | | | | | | | | |
| Operations | | | | | | | | | | | | | | |
| Net investment income | | | | | | | | | | | | | | |
| (loss)B | | 16 | | .04 | | .06 | | | | .07 | | | | .04 |
| Net realized and unre- | | | | | | | | | | | | | | |
| alized gain (loss) | | 2.07 | | 1.37 | | 1.98 | | | | (1.02) | | | | (2.15) |
| Total from investment | | | | | | | | | | | | | | |
| operations | | 2.23 | | 1.41 | | 2.04 | | | | (.95) | | | | (2.11) |
| Distributions from net | | | | | | | | | | | | | | |
| investment income | | — | | (.08) | | (.07) | | | | — | | | | — |
| Redemption fees added to | | | | | | | | | | | | | | |
| paid in capitalB | | —D | | —D | | — | | | | — | | | | — |
| Net asset value, end of | | | | | | | | | | | | | | |
| period | | $ 13.63 | | $ 11.40 | | $ 10.07 | | $ | | 8.10 | | $ | | 9.05 |
| Total ReturnA | | 19.56% | | 14.07% | | 25.39% | | | | (10.50)% | | | | (18.91)% |
| Ratios to Average Net AssetsC | | | | | | | | | | | | |
| Expenses before ex- | | | | | | | | | | | | | | |
| pense reductions | | 1.73% | | 1.95%E | | 2.56% | | | | 2.07% | | | | 1.75% |
| Expenses net of volun- | | | | | | | | | | | | | | |
| tary waivers, if any | | 1.31% | | 1.50% | | 1.50% | | | | 1.71% | | | | 1.75% |
| Expenses net of all | | | | | | | | | | | | | | |
| reductions | | 1.20% | | 1.43% | | 1.44% | | | | 1.66% | | | | 1.69% |
| Net investment income | | | | | | | | | | | | | | |
| (loss) | | 1.20% | | .32% | | .73% | | | | .74% | | | | .40% |
| Supplemental Data | | | | | | | | | | | | | | |
| Net assets, end of | | | | | | | | | | | | | | |
| period (000 omitted) | | $ 566 | | $ 457 | | $ 371 | | $ | | 681 | | $ | | 820 |
| Portfolio turnover rate | | 135% | | 123% | | 199% | | | | 137% | | | | 85% |
A Total returns would have been lower had certain expenses not been reduced during the periods shown.
B Calculated based on average shares outstanding during the period.
C Expense ratios reflect operating expenses of the class. Expenses before reductions do not reflect amounts reimbursed by the investment adviser or reductions from brokerage service arrangements or other expense offset arrangements and do not represent the amount paid by the class during periods when reimbursements or reductions occur. Expenses net of any voluntary waivers reflect expenses after reimbursement by the investment adviser but prior to reductions from brokerage service arrangements or other expense offset arrangements. Expenses net of all reductions repre sent the net expenses paid by the class.
D Amount represents less than $.01 per share.
E As a result of an overaccrual of expenses for the year ended October 31, 2004, the ratio previously reported has been revised from 2.29% to 1.95% . The change had no impact on net investment income, total net assets or total return of the class.
See accompanying notes which are an integral part of the financial statements.
Annual Report 24
Notes to Financial Statements
For the period ended October 31, 2005
|
1. Significant Accounting Policies.
Fidelity Advisor Europe Capital Appreciation Fund (the fund) is a fund of Fidelity Advisor Series VIII (the trust) and is authorized to issue an unlimited number of shares. The trust is registered under the Investment Company Act of 1940, as amended (the 1940 Act), as an open-end management investment company organized as a Massachusetts business trust.
The fund offers Class A, Class T, Class B, Class C, and Institutional Class shares, each of which has equal rights as to assets and voting privileges. Each class has exclusive voting rights with respect to matters that affect that class. Class B shares will automatically convert to Class A shares after a holding period of seven years from the initial date of purchase. Investment income, realized and unrealized capital gains and losses, the common expenses of the fund, and certain fund-level expense reductions, if any, are allocated on a pro rata basis to each class based on the relative net assets of each class to the total net assets of the fund. Each class differs with respect to transfer agent and distribution and service plan fees incurred. Certain expense reductions also differ by class.
The fund may invest in affiliated money market central funds (Money Market Central Funds) which are open-end investment companies available to investment companies and other accounts managed by Fidelity Management & Research Company (FMR) and its affiliates. The financial statements have been prepared in conformity with accounting principles generally accepted in the United States of America, which require management to make certain estimates and assumptions at the date of the financial statements. The following summarizes the significant accounting policies of the fund:
Security Valuation. Investments are valued and net asset value (NAV) per share is calculated (NAV calculation) as of the close of business of the New York Stock Exchange (NYSE), normally 4:00 p.m. Eastern time. Wherever possible, the fund uses independent pricing services approved by the Board of Trustees to value its investments.
Equity securities, including restricted securities, for which market quotations are readily available, are valued at the last reported sale price or official closing price as reported by an independent pricing service on the primary market or exchange on which they are traded. In the event there were no sales during the day or closing prices are not available, securities are valued at the last quoted bid price. Investments in open-end mutual funds, are valued at their closing net asset value each business day. Short-term securities with remaining maturities of sixty days or less for which quotations are not readily available are valued at amortized cost, which approximates value.
When current market prices or quotations are not readily available or do not accurately reflect fair value, valuations may be determined in accordance with procedures adopted by the Board of Trustees. For example, when developments occur between the close of a
25 Annual Report
Notes to Financial Statements - continued
1. Significant Accounting Policies - continued
Security Valuation - continued
market and the close of the NYSE that may materially affect the value of some or all of the securities, or when trading in a security is halted, those securities may be fair valued. Factors used in the determination of fair value may include monitoring news to identify significant market or security specific events such as changes in the value of U.S. securities market, reviewing developments in foreign markets and evaluating the performance of ADRs, futures contracts and exchange-traded funds. Because the fund’s utilization of fair value pricing depends on market activity, the frequency with which fair value pricing is used can not be predicted and may be utilized to a significant extent. The value of securities used for NAV calculation under fair value pricing may differ from published prices for the same securities.
Foreign Currency. The fund uses foreign currency contracts to facilitate transactions in foreign-denominated securities. Losses from these transactions may arise from changes in the value of the foreign currency or if the counterparties do not perform under the contracts’ terms.
Foreign-denominated assets, including investment securities, and liabilities are translated into U.S. dollars at the exchange rate at period end. Purchases and sales of investment securities, income and dividends received and expenses denominated in foreign currencies are translated into U.S. dollars at the exchange rate in effect on the transaction date.
The effects of exchange rate fluctuations on investments are included with the net realized and unrealized gain (loss) on investment securities. Other foreign currency transactions resulting in realized and unrealized gain (loss) are disclosed separately.
Investment Transactions and Income. Security transactions are accounted for as of trade date. Gains and losses on securities sold are determined on the basis of identified cost. Dividend income is recorded on the ex-dividend date, except for certain dividends from foreign securities where the ex-dividend date may have passed, which are recorded as soon as the fund is informed of the ex-dividend date. Non-cash dividends included in dividend income, if any, are recorded at the fair market value of the securities received. Interest income is accrued as earned. Interest income includes coupon interest and amortization of premium and accretion of discount on debt securities. Investment income is recorded net of foreign taxes withheld where recovery of such taxes is uncertain.
Expenses. Most expenses of the trust can be directly attributed to a fund. Expenses which cannot be directly attributed are apportioned among each fund in the trust.
1. Significant Accounting Policies - continued
Income Tax Information and Distributions to Shareholders. Each year, the fund intends to qualify as a regulated investment company by distributing all of its taxable income and realized gains under Subchapter M of the Internal Revenue Code. As a result, no provision for income taxes is required in the accompanying financial statements. Foreign taxes are provided for based on the fund’s understanding of the tax rules and rates that exist in the foreign markets in which it invests.
Distributions are recorded on the ex-dividend date. Income dividends and capital gain distributions are declared separately for each class. Income and capital gain distributions are determined in accordance with income tax regulations, which may differ from generally accepted accounting principles. In addition, the fund will claim a portion of the payment made to redeeming shareholders as a distribution for income tax purposes.
Capital accounts within the financial statements are adjusted for permanent book-tax differences. These adjustments have no impact on net assets or the results of operations. Temporary book-tax differences will reverse in a subsequent period.
Book-tax differences are primarily due to foreign currency transactions, passive foreign investment companies (PFIC), capital loss carryforwards and losses deferred due to wash sales.
The tax-basis components of distributable earnings and the federal tax cost as of period end were as follows:
| Unrealized appreciation | | $ | | 2,410,526 | | | | |
| Unrealized depreciation | | | | (740,156) | | | | |
| Net unrealized appreciation (depreciation) . | | | | 1,670,370 | | | | |
| Undistributed ordinary income | | | | 110,905 | | | | |
| Undistributed long-term capital gain | | | | 418,112 | | | | |
| |
| Cost for federal income tax purposes | | $ | | 23,650,972 | | | | |
| |
| The tax character of distributions paid was as follows: | | | | |
| | | | | October 31, 2005 | | | | October 31, 2004 |
| Ordinary Income | | $ | | — | | $ | | 86,506 |
Short-Term Trading (Redemption) Fees. Shares held in the fund less than 30 days are subject to a redemption fee equal to 1.00% of the proceeds of the redeemed shares. All redemption fees, including any estimated redemption fees paid by FMR, are retained by the fund and accounted for as an addition to paid in capital.
27 Annual Report
Notes to Financial Statements - continued
2. Operating Policies.
Repurchase Agreements. FMR has received an Exemptive Order from the Securities and Exchange Commission (the SEC) which permits the fund and other affiliated entities of FMR to transfer uninvested cash balances into joint trading accounts which are then invested in repurchase agreements. The fund may also invest directly with institutions in repurchase agreements. Repurchase agreements are collateralized by government or non-government securities. Collateral is held in segregated accounts with custodian banks and may be obtained in the event of a default of the counterparty. The fund monitors, on a daily basis, the value of the collateral to ensure it is at least equal to the principal amount of the repurchase agreement (including accrued interest). In the event of a default by the counterparty, realization of the collateral proceeds could be delayed, during which time the value of the collateral may decline.
3. Purchases and Sales of Investments.
Purchases and sales of securities, other than short-term securities and U.S. government securities, aggregated $30,849,970 and $31,058,872, respectively.
4. Fees and Other Transactions with Affiliates.
Management Fee. FMR and its affiliates provide the fund with investment management related services for which the fund pays a monthly management fee. The management fee is the sum of an individual fund fee rate that is based on an annual rate of .45% of the fund’s average net assets and a group fee rate that averaged .27% during the period. The group fee rate is based upon the average net assets of all the mutual funds advised by FMR. The group fee rate decreases as assets under management increase and increases as assets under management decrease. For the period, the total annual management fee rate was .72% of the fund’s average net assets.
Distribution and Service Plan. In accordance with Rule 12b-1 of the 1940 Act, the fund has adopted separate Distribution and Service Plans for each class of shares. Certain classes pay Fidelity Distributors Corporation (FDC), an affiliate of FMR, separate Distribution and Service Fees, each of which is based on an annual percentage of each class’ average net assets. In addition, FDC may pay financial intermediaries for selling shares of the fund and providing shareholder support services.
4. Fees and Other Transactions with Affiliates - continued
Distribution and Service Plan - continued
For the period, the Distribution and Service Fee rates and the total amounts paid to and retained by FDC were as follows:
| | | Distribution | | Service | | | | Paid to | | | | Retained |
| | | Fee | | Fee | | | | FDC | | | | by FDC |
| Class A | | 0% | | .25% | | $ | | 9,215 | | $ | | 6 |
| Class T | | 25% | | .25% | | | | 44,396 | | | | 36 |
| Class B | | 75% | | .25% | | | | 66,850 | | | | 50,151 |
| Class C | | 75% | | .25% | | | | 42,185 | | | | 6,301 |
| | | | | | | $ | | 162,646 | | $ | | 56,494 |
Sales Load. FDC receives a front-end sales charge of up to 5.75% for selling Class A shares, and 3.50% for selling Class T shares, some of which is paid to financial intermediaries for selling shares of the fund. FDC receives the proceeds of contingent deferred sales charges levied on Class A, Class T, Class B, and Class C redemptions. These charges depend on the holding period. The deferred sales charges range from 5% to 1% for Class B, 1% for Class C, and .25% for certain purchases of Class A and Class T shares.
| For the period, sales charge amounts retained by FDC were as follows: | | | | |
| | | | | Retained |
| | | | | by FDC |
| Class A | | $ | | 5,182 |
| Class T | | | | 2,431 |
| Class B* | | | | 14,338 |
| Class C* | | | | 1,365 |
| | | $ | | 23,316 |
* When Class B and Class C shares are initially sold, FDC pays commissions from its own resources to financial intermediaries through which the sales are made.
Transfer Agent Fees. Fidelity Investments Institutional Operations Company, Inc. (FIIOC), an affiliate of FMR, is the transfer, dividend disbursing and shareholder servicing agent for each class of the fund. FIIOC receives account fees and asset-based fees that vary according to the account size and type of account of the shareholders of the
29 Annual Report
Notes to Financial Statements - continued
4. Fees and Other Transactions with Affiliates - continued
Transfer Agent Fees - continued
respective classes of the fund. FIIOC pays for typesetting, printing and mailing of shareholder reports, except proxy statements. For the period the total transfer agent fees paid by each class to FIIOC, were as follows:
| | | | | | | % of |
| | | | | | | Average |
| | | | | Amount | | Net Assets |
| Class A | | $ | | 15,648 | | .42 |
| Class T | | | | 39,437 | | .44 |
| Class B | | | | 28,121 | | .42 |
| Class C | | | | 16,115 | | .38 |
| Institutional Class | | | | 1,239 | | .23 |
| | | $ | | 100,560 | | |
Accounting and Security Lending Fees. Fidelity Service Company, Inc. (FSC), an affiliate of FMR, maintains the fund’s accounting records. The accounting fee is based on the level of average net assets for the month. Under a separate contract, FSC administers the security lending program. The security lending fee is based on the number and duration of lending transactions.
Affiliated Central Funds. The fund may invest in Money Market Central Funds which seek preservation of capital and current income and are managed by Fidelity Investments Money Management, Inc. (FIMM), an affiliate of FMR.
The Money Market Central Funds do not pay a management fee. Income distributions earned by the fund are recorded as income in the accompanying financial statements and totaled $31,174 for the period.
Brokerage Commissions. The fund placed a portion of its portfolio transactions with brokerage firms which are affiliates of the investment adviser. The commissions paid to these affiliated firms were $317 for the period.
5. Committed Line of Credit.
|
The fund participates with other funds managed by FMR in a $4.2 billion credit facility (the “line of credit”) to be utilized for temporary or emergency purposes to fund shareholder redemptions or for other short-term liquidity purposes. The fund has agreed to pay commitment fees on its pro rata portion of the line of credit. During the period, there were no borrowings on this line of credit.
The fund lends portfolio securities from time to time in order to earn additional income. The fund receives collateral (in the form of U.S. Treasury obligations, letters of credit and/or cash) against the loaned securities and maintains collateral in an amount not less than 100% of the market value of the loaned securities during the period of the loan. The market value of the loaned securities is determined at the close of business of the fund and any additional required collateral is delivered to the fund on the next business day. If the borrower defaults on its obligation to return the securities loaned because of insolvency or other reasons, a fund could experience delays and costs in recovering the securities loaned or in gaining access to the collateral. Cash collateral is invested in the Fidelity Securities Lending Cash Central Fund. At period end there were no security loans outstanding. Security lending income represents the income earned on investing cash collateral, less fees and expenses associated with the loan, plus any premium payments that may be received on the loan of certain types of securities.
FMR voluntarily agreed to reimburse each class to the extent annual operating expenses exceeded certain levels of average net assets as noted in the table below. Some expenses, for example interest expense, are excluded from this reimbursement.
| The following classes were in reimbursement during the period | | | | |
| | | Expense | | | | Reimbursement |
| | | Limitations | | | | from adviser |
| Class A | | 1.75%--1.50%* | | $ | | 22,236 |
| Class T | | 2.00%--1.75%* | | | | 57,047 |
| Class B | | 2.50%--2.25%* | | | | 41,774 |
| Class C | | 2.50%--2.25%* | | | | 23,584 |
| Institutional Class | | 1.50%--1.25%* | | | | 2,626 |
| | | | | $ | | 147,267 |
| |
| * Expense limitation in effect at period end. | | | | | | |
Many of the brokers with whom FMR places trades on behalf of the fund provided services to the fund in addition to trade execution. These services included payments of certain expenses on behalf of the fund totaling $26,725 for the period.
31 Annual Report
Notes to Financial Statements - continued
8. Other.
The fund’s organizational documents provide former and current trustees and officers with a limited indemnification against liabilities arising in connection with the performance of their duties to the fund. In the normal course of business, the fund may also enter into contracts that provide general indemnifications. The fund’s maximum exposure under these arrangements is unknown as this would be dependent on future claims that may be made against the fund. The risk of material loss from such claims is considered remote.
| 9. Distributions to Shareholders. | | | | | | |
| |
| Distributions to shareholders of each class were as follows: | | | | | | |
| Years ended October 31, | | 2005 | | | | | | 2004 |
| From net investment income | | | | | | | | |
| Class A | | $ | | — | | $ | | 28,050 |
| Class T | | | | — | | | | 46,077 |
| Class B | | | | — | | | | 5,801 |
| Class C | | | | — | | | | 3,213 |
| Institutional Class | | | | — | | | | 3,365 |
| Total | | $ | | — | | $ | | 86,506 |
| 10. Share Transactions. | | | | | | | | | | |
| |
| Transactions for each class of shares were as follows: | | | | | | | | |
| | | Shares | | | | | | Dollars | | |
| Years ended October 31, | | 2005 | | 2004 | | | | 2005 | | | | 2004 |
| Class A | | | | | | | | | | | | |
| Shares sold | | 142,065 | | 337,527 | | $ | | 1,846,794 | | $ | | 3,769,229 |
| Reinvestment of | | | | | | | | | | | | |
| distributions | | — | | 2,412 | | | | — | | | | 25,135 |
| Shares redeemed | | (61,807) | | (417,543) | | | | (785,579) | | | | (4,586,475) |
| Net increase (decrease) . | | 80,258 | | (77,604) | | $ | | 1,061,215 | | $ | | (792,111) |
| Class T | | | | | | | | | | | | |
| Shares sold | | 181,461 | | 135,665 | | $ | | 2,307,799 | | $ | | 1,489,738 |
| Reinvestment of | | | | | | | | | | | | |
| distributions | | — | | 4,315 | | | | — | | | | 44,751 |
| Shares redeemed | | (237,354) | | (185,482) | | | | (3,017,826) | | | | (2,011,588) |
| Net increase (decrease) . | | (55,893) | | (45,502) | | $ | | (710,027) | | $ | | (477,099) |
| Class B | | | | | | | | | | | | |
| Shares sold | | 100,137 | | 121,537 | | $ | | 1,230,979 | | $ | | 1,299,582 |
| Reinvestment of | | | | | | | | | | | | |
| distributions | | — | | 522 | | | | — | | | | 5,324 |
| Shares redeemed | | (179,115) | | (124,715) | | | | (2,234,526) | | | | (1,346,950) |
| Net increase (decrease) . | | (78,978) | | (2,656) | | $ | | (1,003,547) | | $ | | (42,044) |
| Class C | | | | | | | | | | | | |
| Shares sold | | 158,915 | | 74,022 | | $ | | 2,022,824 | | $ | | 796,896 |
| Reinvestment of | | | | | | | | | | | | |
| distributions | | — | | 244 | | | | — | | | | 2,495 |
| Shares redeemed | | (102,054) | | (95,858) | | | | (1,269,222) | | | | (1,022,292) |
| Net increase (decrease) . | | 56,861 | | (21,592) | | $ | | 753,602 | | $ | | (222,901) |
| Institutional Class | | | | | | | | | | | | |
| Shares sold | | 6,137 | | 37,290 | | $ | | 77,208 | | $ | | 413,160 |
| Reinvestment of | | | | | | | | | | | | |
| distributions | | — | | 287 | | | | — | | | | 3,019 |
| Shares redeemed | | (4,745) | | (34,275) | | | | (59,669) | | | | (385,973) |
| Net increase (decrease) . | | 1,392 | | 3,302 | | $ | | 17,539 | | $ | | 30,206 |
33 Annual Report
Report of Independent Registered Public Accounting Firm
To the Trustees of Fidelity Advisor Series VIII and Shareholders of Fidelity Advisor Europe Capital Appreciation Fund:
We have audited the accompanying statement of assets and liabilities of Fidelity Advisor Europe Capital Appreciation Fund (the Fund), a fund of Fidelity Advisor Series VIII, including the schedule of investments, as of October 31, 2005, and the related statement of operations for the year then ended, the statement of changes in net assets for each of the two years in the period then ended, and the financial highlights for each of the five years in the period then ended. These financial statements and financial highlights are the responsibility of the Fund’s management. Our responsibility is to express an opinion on these financial statements and financial highlights based on our audits.
We conducted our audits in accordance with standards of the Public Company Accounting Oversight Board (United States). Those standards require that we plan and perform the audit to obtain reasonable assurance about whether the financial statements and financial highlights are free of material misstatement. The Fund is not required to have, nor were we engaged to perform, an audit of its internal control over financial reporting. Our audits included consideration of internal control over financial reporting as a basis for designing audit procedures that are appropriate in the circumstances, but not for the purpose of expressing an opinion on the effectiveness of the Fund’s internal control over financial reporting. Accordingly, we express no such opinion. An audit also includes examining, on a test basis, evidence supporting the amounts and disclosures in the financial statements, assessing the accounting principles used and significant estimates made by management, as well as evaluating the overall financial statement presentation. Our procedures included confirmation of securities owned as of October 31, 2005, by correspondence with the custodians and brokers; where replies were not received from brokers, we performed other auditing procedures. We believe that our audits provide a reasonable basis for our opinion.
In our opinion, the financial statements and financial highlights referred to above present fairly, in all material respects, the financial position of Fidelity Advisor Europe Capital Appreciation Fund as of October 31, 2005, the results of its operations for the year then ended, the changes in its net assets for each of the two years in the period then ended, and its financial highlights for each of the five years in the period then ended, in conformity with accounting principles generally accepted in the United States of America.
DELOITTE & TOUCHE LLP Boston, Massachusetts December 22, 2005
Trustees and Officers
The Trustees, Members of the Advisory Board, and executive officers of the trust and fund, as applicable, are listed below. The Board of Trustees governs the fund and is responsible for protecting the interests of shareholders. The Trustees are experienced executives who meet periodically throughout the year to oversee the fund’s activities, review contractual arrangements with companies that provide services to the fund, and review the fund’s performance. Except for William O. McCoy, Stephen P. Jonas, and Kenneth L. Wolfe, each of the Trustees oversees 322 funds advised by FMR or an affiliate. Mr. McCoy oversees 324 funds advised by FMR or an affiliate. Mr. Jonas and Mr. Wolfe oversee 319 funds advised by FMR or an affiliate.
The Trustees hold office without limit in time except that (a) any Trustee may resign; (b) any Trustee may be removed by written instrument, signed by at least two-thirds of the number of Trustees prior to such removal; (c) any Trustee who requests to be retired or who has become incapacitated by illness or injury may be retired by written instrument signed by a majority of the other Trustees; and (d) any Trustee may be removed at any special meeting of shareholders by a two-thirds vote of the outstanding voting securities of the trust. Each Trustee who is not an interested person (as defined in the 1940 Act) (Independent Trustee), shall retire not later than the last day of the calendar year in which his or her 72nd birthday occurs. The Independent Trustees may waive this mandatory retirement age policy with respect to individual Trustees. The executive officers and Advisory Board Members hold office without limit in time, except that any officer and Advisory Board Member may resign or may be removed by a vote of a majority of the Trustees at any regular meeting or any special meeting of the Trustees. Except as indicated, each individual has held the office shown or other offices in the same company for the past five years.
The fund’s Statement of Additional Information (SAI) includes more information about the Trustees. To request a free copy, call Fidelity at 1-877-208-0098.
Interested Trustees*:
Correspondence intended for each Trustee who is an interested person may be sent to Fidelity Investments, 82 Devonshire Street, Boston, Massachusetts 02109.
| Name, Age; Principal Occupation |
| |
| Edward C. Johnson 3d (75)** |
| |
| Year of Election or Appointment: 1983 |
| Mr. Johnson is Chairman of the Board of Trustees. Mr. Johnson serves as |
| Chief Executive Officer, Chairman, and a Director of FMR Corp.; a Di- |
| rector and Chairman of the Board and of the Executive Committee of |
| FMR; Chairman and a Director of Fidelity Management & Research (Far |
| East) Inc.; Chairman and a Director of Fidelity Investments Money Man- |
| agement, Inc.; and Chairman (2001-present) and a Director |
| (2000-present) of FMR Co., Inc. |
35 Annual Report
Trustees and Officers - continued
| Name, Age; Principal Occupation |
| |
| Abigail P. Johnson (43)** |
| |
| Year of Election or Appointment: 2001 |
| Ms. Johnson serves as President of Fidelity Employer Services Company |
| (FESCO) (2005-present). She is President and a Director of Fidelity In- |
| vestments Money Management, Inc. (2001-present), FMR Co., Inc. |
| (2001-present), and a Director of FMR Corp. Previously, Ms. Johnson |
| served as President and a Director of FMR (2001-2005), Senior Vice |
| President of the Fidelity funds (2001-2005), and managed a number of |
| Fidelity funds. |
| |
| Stephen P. Jonas (52) |
| |
| Year of Election or Appointment: 2005 |
| Mr. Jonas is Senior Vice President of Advisor Europe Capital Appreci- |
| ation (2005-present). He also serves as Senior Vice President of other |
| Fidelity funds (2005-present). Mr. Jonas is Executive Director of FMR |
| (2005-present). Previously, Mr. Jonas served as President of Fidelity En- |
| terprise Operations and Risk Services (2004-2005), Chief Administra- |
| tive Officer (2002-2004), and Chief Financial Officer of FMR Co. |
| (1998-2000). Mr. Jonas has been with Fidelity Investments since 1987 |
| and has held various financial and management positions including |
| Chief Financial Officer of FMR. In addition, he serves on the Boards of |
| Boston Ballet (2003-present) and Simmons College (2003-present). |
| |
| Robert L. Reynolds (53) |
| |
| Year of Election or Appointment: 2003 |
| Mr. Reynolds is a Director (2003-present) and Chief Operating Officer |
| (2002-present) of FMR Corp. He also serves on the Board at Fidelity |
| Investments Canada, Ltd. (2000-present). Previously, Mr. Reynolds |
| served as President of Fidelity Investments Institutional Retirement Group |
| (1996-2000). |
* Trustees have been determined to be “Interested Trustees” by virtue of, among other things, their affiliation with the trust or various entities under common control with FMR.
** Edward C. Johnson 3d, Trustee, is Abigail P. Johnson’s father.
Annual Report 36
Independent Trustees:
Correspondence intended for each Independent Trustee (that is, the Trustees other than the Interested Trustees) may be sent to Fidelity Investments, P.O. Box 55235, Boston, Massachusetts 02205-5235.
| Name, Age; Principal Occupation |
| |
| Dennis J. Dirks (57) |
| |
| Year of Election or Appointment: 2005 |
| Prior to his retirement in May 2003, Mr. Dirks was Chief Operating |
| Officer and a member of the Board of The Depository Trust & Clearing |
| Corporation (DTCC) (1999-2003). He also served as President, Chief |
| Operating Officer, and Board member of The Depository Trust Com- |
| pany (DTC) (1999-2003) and President and Board member of the |
| National Securities Clearing Corporation (NSCC) (1999-2003). In addi- |
| tion, Mr. Dirks served as Chief Executive Officer and Board member of |
| the Government Securities Clearing Corporation (2001-2003) and Chief |
| Executive Officer and Board member of the Mortgage-Backed Securities |
| Clearing Corporation (2001-2003). Mr. Dirks also serves as a Trustee of |
| Manhattan College (2005-present). |
| |
| Robert M. Gates (62) |
| |
| Year of Election or Appointment: 1997 |
| Dr. Gates is Vice Chairman of the Independent Trustees (2005-present). |
| Dr. Gates is President of Texas A&M University (2002-present). He was |
| Director of the Central Intelligence Agency (CIA) from 1991 to 1993. |
| From 1989 to 1991, Dr. Gates served as Assistant to the President of |
| the United States and Deputy National Security Advisor. Dr. Gates is a |
| Director of NACCO Industries, Inc. (mining and manufacturing), Parker |
| Drilling Co., Inc. (drilling and rental tools for the energy industry, |
| 2001-present), and Brinker International (restaurant management, |
| 2003-present). Previously, Dr. Gates served as a Director of LucasVarity |
| PLC (automotive components and diesel engines), a Director of TRW Inc. |
| (automotive, space, defense, and information technology), and Dean of |
| the George Bush School of Government and Public Service at Texas |
| A&M University (1999-2001). Dr. Gates also is a Trustee of the Forum |
| for International Policy. |
37 Annual Report
Trustees and Officers - continued
| Name, Age; Principal Occupation |
| |
| George H. Heilmeier (69) |
| |
| Year of Election or Appointment: 2004 |
| Dr. Heilmeier is Chairman Emeritus of Telcordia Technologies (commu- |
| nication software and systems), where prior to his retirement, he served |
| as company Chairman and Chief Executive Officer. He currently serves |
| on the Boards of Directors of The Mitre Corporation (systems engineer- |
| ing and information technology support for the government), and HRL |
| Laboratories (private research and development, 2004-present). He is |
| Chairman of the General Motors Science & Technology Advisory Board |
| and a Life Fellow of the Institute of Electrical and Electronics Engineers |
| (IEEE) (2000-present). Dr. Heilmeier is a member of the Defense Science |
| Board and the National Security Agency Advisory Board. He is also a |
| member of the National Academy of Engineering, the American |
| Academy of Arts and Sciences, and the Board of Overseers of the |
| School of Engineering and Applied Science of the University of Pennsyl- |
| vania. Previously, Dr. Heilmeier served as a Director of TRW Inc. (auto- |
| motive, space, defense, and information technology, 1992-2002), |
| Compaq (1994-2002), Automatic Data Processing, Inc. (ADP) |
| (technology-based business outsourcing, 1995-2002), INET Technolo- |
| gies Inc. (telecommunications network surveillance, 2001-2004), and |
| Teletech Holdings (customer management services). He is the recipient of |
| the 2005 Kyoto Prize in Advanced Technology for his invention of the |
| liquid display. |
| |
| Marie L. Knowles (59) |
| |
| Year of Election or Appointment: 2001 |
| Prior to Ms. Knowles’ retirement in June 2000, she served as Executive |
| Vice President and Chief Financial Officer of Atlantic Richfield Company |
| (ARCO) (diversified energy, 1996-2000). From 1993 to 1996, she was |
| a Senior Vice President of ARCO and President of ARCO Transportation |
| Company. She served as a Director of ARCO from 1996 to 1998. She |
| currently serves as a Director of Phelps Dodge Corporation (copper |
| mining and manufacturing) and McKesson Corporation (healthcare ser- |
| vice, 2002-present). Ms. Knowles is a Trustee of the Brookings Institution |
| and the Catalina Island Conservancy and also serves as a member of |
| the Advisory Board for the School of Engineering of the University of |
| Southern California. |
Annual Report 38
| Name, Age; Principal Occupation |
| |
| Ned C. Lautenbach (61) |
| |
| Year of Election or Appointment: 2000 |
| Mr. Lautenbach has been a partner of Clayton, Dubilier & Rice, Inc. |
| (private equity investment firm) since September 1998. Previously, Mr. |
| Lautenbach was with the International Business Machines Corporation |
| (IBM) from 1968 until his retirement in 1998. Mr. Lautenbach serves as |
| a Director of Italtel Holding S.p.A. (telecommunications (Milan, Italy), |
| 2004-present) and Eaton Corporation (diversified industrial) as well as |
| the Philharmonic Center for the Arts in Naples, Florida. He also is a |
| member of the Board of Trustees of Fairfield University (2005-present), |
| as well as a member of the Council on Foreign Relations. |
| |
| Marvin L. Mann (72) |
| |
| Year of Election or Appointment: 1993 |
| Mr. Mann is Chairman of the Independent Trustees (2001-present). He is |
| Chairman Emeritus of Lexmark International, Inc. (computer |
| peripherals), where he served as CEO until April 1998, retired as |
| Chairman May 1999, and remains a member of the Board. Prior to |
| 1991, he held the positions of Vice President of International Business |
| Machines Corporation (IBM) and President and General Manager of |
| various IBM divisions and subsidiaries. He is a member of the Executive |
| Committee of the Independent Director’s Council of the Investment Com- |
| pany Institute. In addition, Mr. Mann is a member of the President’s |
| Cabinet at the University of Alabama and the Board of Visitors of the |
| Culverhouse College of Commerce and Business Administration at the |
| University of Alabama. |
| |
| William O. McCoy (72) |
| |
| Year of Election or Appointment: 1997 |
| Prior to his retirement in December 1994, Mr. McCoy was Vice Chair- |
| man of the Board of BellSouth Corporation (telecommunications) and |
| President of BellSouth Enterprises. He is currently a Director of Liberty |
| Corporation (holding company), Duke Realty Corporation (real estate), |
| and Progress Energy, Inc. (electric utility). He is also a partner of Frank- |
| lin Street Partners (private investment management firm) and a member |
| of the Research Triangle Foundation Board. In addition, Mr. McCoy |
| served as the Interim Chancellor (1999-2000) and a member of the |
| Board of Visitors for the University of North Carolina at Chapel Hill and |
| currently serves on the Board of Directors of the University of North |
| Carolina Health Care System and the Board of Visitors of the Kenan- |
| Flagler Business School (University of North Carolina at Chapel Hill). He |
| also served as Vice President of Finance for the University of North Car- |
| olina (16-school system). |
39 Annual Report
Trustees and Officers - continued
| Name, Age; Principal Occupation |
| |
| Cornelia M. Small (61) |
| |
| Year of Election or Appointment: 2005 |
| Ms. Small is a member (2000-present) and Chairperson (2002-present) |
| of the Investment Committee, and a member (2002-present) of the |
| Board of Trustees of Smith College. Previously, she served as Chief In- |
| vestment Officer (1999-2000), Director of Global Equity Investments |
| (1996-1999), and a member of the Board of Directors of Scudder, |
| Stevens & Clark (1990-1997) and Scudder Kemper Investments |
| (1997-1998). In addition, Ms. Small served as Co-Chair (2000-2003) |
| of the Annual Fund for the Fletcher School of Law and Diplomacy. |
| |
| William S. Stavropoulos (66) |
| |
| Year of Election or Appointment: 2001 |
| Mr. Stavropoulos is Chairman of the Board (2000-present) and a Mem- |
| ber of the Board of Directors of The Dow Chemical Company. Since |
| joining The Dow Chemical Company in 1967, Mr. Stavropoulos served |
| in numerous senior management positions, including President |
| (1993-2000; 2002-2003), CEO (1995-2000; 2002-2004), and Chair- |
| man of the Executive Committee (2000-2004). Currently, he is a Direc- |
| tor of NCR Corporation (data warehousing and technology solutions), |
| BellSouth Corporation (telecommunications), Chemical Financial Corpo- |
| ration, Maersk Inc. (industrial conglomerate, 2002-present), and Metal- |
| mark Capital (private equity investment firm, 2005-present). He also |
| serves as a member of the Board of Trustees of the American Enterprise |
| Institute for Public Policy Research. In addition, Mr. Stavropoulos is a |
| member of The Business Council, J.P. Morgan International Council and |
| the University of Notre Dame Advisory Council for the College of |
| Science. |
| |
| Kenneth L. Wolfe (66) |
| |
| Year of Election or Appointment: 2005 |
| Mr. Wolfe also serves as a Trustee (2005-present) or Member of the |
| Advisory Board (2004-present) of other investment companies advised |
| by FMR. Prior to his retirement in 2001, Mr. Wolfe was Chairman and |
| Chief Executive Officer of Hershey Foods Corporation (1993-2001). He |
| currently serves as a member of the boards of Adelphia Communica- |
| tions Corporation (2003-present), Bausch & Lomb, Inc., and Revlon Inc. |
| (2004-present). |
Annual Report 40
Advisory Board Members and Executive Officers:
Correspondence intended for Mr. Gamper may be sent to Fidelity Investments, P.O. Box 55235, Boston, Massachusetts 02205-5235. Correspondence intended for each executive officer and Mr. Lynch may be sent to Fidelity Investments, 82 Devonshire Street, Boston, Massachusetts 02109.
| Name, Age; Principal Occupation |
| |
| Albert R. Gamper, Jr. (63) |
| |
| Year of Election or Appointment: 2005 |
| Member of the Advisory Board of Fidelity Advisor Series VIII. Prior to his |
| retirement in December 2004, Mr. Gamper served as Chairman of the |
| Board of CIT Group Inc. (commercial finance). During his tenure with |
| CIT Group Inc. Mr. Gamper served in numerous senior management |
| positions, including Chairman (1987-1989; 1999-2001; 2002-2004), |
| Chief Executive Officer (1987-2004), and President (1989-2002). He |
| currently serves as a member of the Board of Directors of Public Service |
| Enterprise Group (utilities, 2001-present), Chairman of the Board of |
| Governors, Rutgers University (2004-present), and Chairman of the |
| Board of Saint Barnabas Health Care System. |
| |
| Peter S. Lynch (61) |
| |
| Year of Election or Appointment: 2003 |
| Member of the Advisory Board of Fidelity Advisor Series VIII. Vice |
| Chairman and a Director of FMR, and Vice Chairman (2001-present) |
| and a Director (2000-present) of FMR Co., Inc. Previously, Mr. Lynch |
| served as a Trustee of the Fidelity funds (1990-2003). In addition, he |
| serves as a Trustee of Boston College, Massachusetts Eye & Ear |
| Infirmary, Historic Deerfield, John F. Kennedy Library, and the Museum |
| of Fine Arts of Boston. |
| |
| Dwight D. Churchill (51) |
| |
| Year of Election or Appointment: 2005 |
| Vice President of Advisor Europe Capital Appreciation. Mr. Churchill |
| also serves as Vice President of certain Equity Funds (2005-present) and |
| certain High Income Funds (2005-present). Previously, he served as |
| Head of Fidelity’s Fixed-Income Division (2000-2005), Vice President of |
| Fidelity’s Money Market Funds (2000-2005), Vice President of Fidelity’s |
| Bond Funds, and Senior Vice President of FIMM (2000) and FMR. Mr. |
| Churchill joined Fidelity in 1993 as Vice President and Group Leader of |
| Taxable Fixed-Income Investments. |
41 Annual Report
Trustees and Officers - continued
| Name, Age; Principal Occupation |
| |
| Ian R. Hart (38) |
| |
| Year of Election or Appointment: 2001 |
| Vice President of Advisor Europe Capital Appreciation. Mr. Hart serves |
| as Vice President of other funds advised by FMR. Prior to assuming his |
| current responsibilities, Mr. Hart managed a variety of Fidelity funds. |
| Mr. Hart also serves as Vice President of FMR (2002) and FMR Co., Inc. |
| (2002). |
| |
| Eric D. Roiter (56) |
| |
| Year of Election or Appointment: 1998 |
| Secretary of Advisor Europe Capital Appreciation. He also serves as |
| Secretary of other Fidelity funds; Vice President, General Counsel, and |
| Secretary of FMR Co., Inc. (2001-present) and FMR; Assistant Secretary |
| of Fidelity Management & Research (U.K.) Inc. (2001-present), Fidelity |
| Management & Research (Far East) Inc. (2001-present), and Fidelity |
| Investments Money Management, Inc. (2001-present). Mr. Roiter is an |
| Adjunct Member, Faculty of Law, at Boston College Law School |
| (2003-present). Previously, Mr. Roiter served as Vice President and |
| Secretary of Fidelity Distributors Corporation (FDC) (1998-2005). |
| |
| Stuart Fross (46) |
| |
| Year of Election or Appointment: 2003 |
| Assistant Secretary of Advisor Europe Capital Appreciation. Mr. Fross |
| also serves as Assistant Secretary of other Fidelity funds (2003-present), |
| Vice President and Secretary of FDC (2005-present), and is an em- |
| ployee of FMR. |
| |
| Christine Reynolds (47) |
| |
| Year of Election or Appointment: 2004 |
| President, Treasurer, and Anti-Money Laundering (AML) officer of Advi- |
| sor Europe Capital Appreciation. Ms. Reynolds also serves as President, |
| Treasurer, and AML officer of other Fidelity funds (2004) and is a Vice |
| President (2003) and an employee (2002) of FMR. Before joining |
| Fidelity Investments, Ms. Reynolds worked at PricewaterhouseCoopers |
| LLP (PwC) (1980-2002), where she was most recently an audit partner |
| with PwC’s investment management practice. |
| |
| Paul M. Murphy (58) |
| |
| Year of Election or Appointment: 2005 |
| Chief Financial Officer of Advisor Europe Capital Appreciation. Mr. |
| Murphy also serves as Chief Financial Officer of other Fidelity funds |
| (2005-present). He also serves as Senior Vice President of Fidelity Pric- |
| ing and Cash Management Services Group (FPCMS). |
Annual Report 42
| Name, Age; Principal Occupation |
| |
| Kenneth A. Rathgeber (58) |
| |
| Year of Election or Appointment: 2004 |
| Chief Compliance Officer of Advisor Europe Capital Appreciation. Mr. |
| Rathgeber also serves as Chief Compliance Officer of other Fidelity |
| funds (2004) and Executive Vice President of Risk Oversight for Fidelity |
| Investments (2002). Previously, he served as Executive Vice President |
| and Chief Operating Officer for Fidelity Investments Institutional Services |
| Company, Inc. (1998-2002). |
| |
| John R. Hebble (47) |
| |
| Year of Election or Appointment: 2003 |
| Deputy Treasurer of Advisor Europe Capital Appreciation. Mr. Hebble |
| also serves as Deputy Treasurer of other Fidelity funds (2003), and is an |
| employee of FMR. Before joining Fidelity Investments, Mr. Hebble |
| worked at Deutsche Asset Management where he served as Director of |
| Fund Accounting (2002-2003) and Assistant Treasurer of the Scudder |
| Funds (1998-2003). |
| |
| Bryan A. Mehrmann (44) |
| |
| Year of Election or Appointment: 2005 |
| Deputy Treasurer of Advisor Europe Capital Appreciation. Mr. Mehr- |
| mann also serves as Deputy Treasurer of other Fidelity funds |
| (2005-present) and is an employee of FMR. Previously, Mr. Mehrmann |
| served as Vice President of Fidelity Investments Institutional Services |
| Group (FIIS)/Fidelity Investments Institutional Operations Corporation, |
| Inc. (FIIOC) Client Services (1998-2004). |
| |
| Kimberley H. Monasterio (41) |
| |
| Year of Election or Appointment: 2004 |
| Deputy Treasurer of Advisor Europe Capital Appreciation. Ms. Monas- |
| terio also serves as Deputy Treasurer of other Fidelity funds (2004) and |
| is an employee of FMR (2004). Before joining Fidelity Investments, Ms. |
| Monasterio served as Treasurer (2000-2004) and Chief Financial Offi- |
| cer (2002-2004) of the Franklin Templeton Funds and Senior Vice Presi- |
| dent of Franklin Templeton Services, LLC (2000-2004). |
| |
| Kenneth B. Robins (36) |
| |
| Year of Election or Appointment: 2005 |
| Deputy Treasurer of Advisor Europe Capital Appreciation. Mr. Robins |
| also serves as Deputy Treasurer of other Fidelity funds (2005-present) |
| and is an employee of FMR (2004-present). Before joining Fidelity In- |
| vestments, Mr. Robins worked at KPMG LLP, where he was a partner in |
| KPMG’s department of professional practice (2002-2004) and a Senior |
| Manager (1999-2000). In addition, Mr. Robins served as Assistant |
| Chief Accountant, United States Securities and Exchange Commission |
| (2000-2002). |
43 Annual Report
Trustees and Officers - continued
| Name, Age; Principal Occupation |
| |
| Robert G. Byrnes (38) |
| |
| Year of Election or Appointment: 2005 |
| Assistant Treasurer of Advisor Europe Capital Appreciation. Mr. Byrnes |
| also serves as Assistant Treasurer of other Fidelity funds (2005-present) |
| and is an employee of FMR (2005-present). Previously, Mr. Byrnes |
| served as Vice President of FPCMS (2003-2005). Before joining Fidelity |
| Investments, Mr. Byrnes worked at Deutsche Asset Management where |
| he served as Vice President of the Investment Operations Group |
| (2000-2003). |
| |
| John H. Costello (59) |
| |
| Year of Election or Appointment: 1986 |
| Assistant Treasurer of Advisor Europe Capital Appreciation. Mr. Costello |
| also serves as Assistant Treasurer of other Fidelity funds and is an em- |
| ployee of FMR. |
| |
| Peter L. Lydecker (51) |
| |
| Year of Election or Appointment: 2004 |
| Assistant Treasurer of Advisor Europe Capital Appreciation. Mr. |
| Lydecker also serves as Assistant Treasurer of other Fidelity funds (2004) |
| and is an employee of FMR. |
| |
| Mark Osterheld (50) |
| |
| Year of Election or Appointment: 2002 |
| Assistant Treasurer of Advisor Europe Capital Appreciation. Mr. Oster- |
| held also serves as Assistant Treasurer of other Fidelity funds (2002) and |
| is an employee of FMR. |
| |
| Gary W. Ryan (47) |
| |
| Year of Election or Appointment: 2005 |
| Assistant Treasurer of Advisor Europe Capital Appreciation. Mr. Ryan |
| also serves as Assistant Treasurer of other Fidelity funds (2005-present) |
| and is an employee of FMR (2005-present). Previously, Mr. Ryan served |
| as Vice President of Fund Reporting in FPCMS (1999-2005). |
| |
| Salvatore Schiavone (39) |
| |
| Year of Election or Appointment: 2005 |
| Assistant Treasurer of Advisor Europe Capital Appreciation. Mr. Schia- |
| vone also serves as Assistant Treasurer of other Fidelity funds |
| (2005-present) and is an employee of FMR (2005-present). Before join- |
| ing Fidelity Investments, Mr. Schiavone worked at Deutsche Asset Man- |
| agement, where he most recently served as Assistant Treasurer |
| (2003-2005) of the Scudder Funds and Vice President and Head of |
| Fund Reporting (1996-2003). |
Annual Report 44
The Board of Trustees of Advisor Europe Capital Appreciation fund voted to pay to shareholders of record at the opening of business on record date, the following distributions per share derived from capital gains realized from sales of portfolio securities, and dividends derived from net investment income:
| Fund | | Pay Date | | Record Date | | Dividends | | Capital Gains |
| Class A | | 12/05/05 | | 12/02/05 | | $.131 | | $.22 |
| Class T | | 12/05/05 | | 12/02/05 | | $.083 | | $.22 |
| Class B | | 12/05/05 | | 12/02/05 | | $.006 | | $.22 |
| Class C | | 12/05/05 | | 12/02/05 | | $.019 | | $.22 |
The fund hereby designates as capital gain dividends: For dividends with respect to the taxable year ended October 31, 2005, $419,182, or, if subsequently determined to be different, the net capital gain of such year, and for dividends with respect to the taxable year ended October 31, 2004, $0, or, if subsequently determined to be different, the excess of: (a) the net capital gain of such year, over (b) amounts previously designated as capital gain dividends with respect to such year.
45 Annual Report
Board Approval of Investment Advisory Contracts and Management Fees
Advisor Europe Capital Appreciation Fund
Each year, typically in July, the Board of Trustees, including the independent Trustees (together, the Board), votes on the renewal of the management contract and sub-advisory agreements (together, the Advisory Contracts) for the fund. The Board, assisted by the advice of fund counsel and independent Trustees’ counsel, requests and considers a broad range of information throughout the year.
The Board meets regularly each month except August and takes into account throughout the year matters bearing on Advisory Contracts. The Board, acting directly and through its separate committees, considers at each of its meetings factors that are relevant to the annual renewal of the fund’s Advisory Contracts, including the services and support provided to the fund and its shareholders by Fidelity. At the time of the renewal, the Board had 11 standing committees, each composed of independent Trustees with varying backgrounds, to which the Board has assigned specific subject matter responsibilities in order to enhance effective decision-making by the Board. Each committee has adopted a written charter outlining the structure and purposes of the committee. One such committee, the Equity Contract Committee, meets periodically during the first six months of each year and as necessary to consider matters specifically related to the annual renewal of Advisory Contracts. The committee requests and receives information on, and makes recommendations to the independent Trustees concerning, the approval and annual review of the Advisory Contracts.
At its July 2005 meeting, the Board of Trustees, including the independent Trustees, unanimously determined to renew the Advisory Contracts for the fund. In reaching its determination, the Board considered all factors it believed relevant, including (1) the nature, extent, and quality of the services to be provided to the fund and its shareholders by Fidelity (including the investment performance of the fund); (2) the competitiveness of the management fee and total expenses of the fund; (3) the total costs of the services to be provided by and the profits to be realized by the investment adviser and its affiliates from the relationship with the fund; (4) the extent to which economies of scale would be realized as the fund grows; and (5) whether fee levels reflect these economies of scale, if any, for the benefit of fund shareholders.
In determining whether to renew the Advisory Contracts for the fund, the Board ultimately reached a determination, with the assistance of fund counsel and independent Trustees’ counsel, that the renewal of the Advisory Contracts and the compensation to be received by Fidelity under the management contract is consistent with Fidelity’s fiduciary duty under applicable law. In addition to evaluating the specific factors noted above, the Board, in reaching its determination, is aware that shareholders in the fund have a broad range of investment choices available to them, including a wide choice among mutual funds offered by competitors to Fidelity, and that the fund’s shareholders, with the opportunity to review and weigh the disclosure provided by the fund in its
prospectus and other public disclosures, have chosen to invest in this fund, managed by Fidelity.
Nature, Extent, and Quality of Services Provided by Fidelity. The Board considered staffing within the investment adviser, FMR, and the sub-advisers (together, the Investment Advisers), including the background of the fund’s portfolio manager and the fund’s investment objective and discipline. The independent Trustees also had discussions with senior management of Fidelity’s investment operations and investment groups. The Board considered the structure of the portfolio manager compensation program and whether this structure provides appropriate incentives.
Fidelity Resources Dedicated to Investment Management and Support Services. The Board reviewed the size, education, and experience of the Investment Advisers’ investment staff, their use of technology, and the Investment Advisers’ approach to recruiting, training, and retaining portfolio managers and other research, advisory, and management personnel. The Board considered Fidelity’s extensive global research capabilities that enable the Investment Advisers to aggregate data from various sources in an effort to produce positive investment results. The Board noted that Fidelity’s analysts have access to a variety of technological tools that enable them to perform both fundamental and quantitative analysis and to specialize in various disciplines. The Board also considered that Fidelity’s portfolio managers and analysts have access to daily portfolio attribution that allows for monitoring of a fund’s portfolio, as well as an electronic communication system that provides immediate real-time access to research concerning issuers and credit enhancers.
Shareholder and Administrative Services. The Board considered the nature, extent, quality, and cost of administrative, distribution, and shareholder services performed by the Investment Advisers and their affiliates under the Advisory Contracts and under separate agreements covering transfer agency, pricing and bookkeeping, and securities lending services for the fund. The Board also considered the nature and extent of the Investment Advisers’ supervision of third party service providers, principally custodians and subcustodians. The Board reviewed the allocation of fund brokerage, including allocations to brokers affiliated with the Investment Advisers, the use of brokerage commissions to pay fund expenses, and the use of “soft” commission dollars to pay for research services. The Board also considered that Fidelity voluntarily decided in 2004 to stop using “soft” commission dollars to pay for market data and, instead, to pay for that data out of its own resources. The Board also considered the resources devoted to, and the record of compliance with, the fund’s compliance policies and procedures.
The Board noted that the growth of fund assets across the complex allows Fidelity to reinvest in the development of services designed to enhance the value or convenience of the Fidelity funds as investment vehicles. These services include 24-hour access to account information and market information through phone representatives and over the Internet, and investor education materials and asset allocation tools.
47 Annual Report
Board Approval of Investment Advisory Contracts and Management Fees - continued
Investment in a Large Fund Family. The Board considered the benefits to shareholders of investing in a Fidelity fund, including the benefits of investing in a fund that is part of a large family of funds offering a variety of investment disciplines and providing for a large variety of mutual fund investor services. For example, fund shareholders are offered the privilege of exchanging shares of the fund for shares of other Fidelity funds, as set forth in the fund’s prospectus, without paying an additional sales charge. The Board noted that, since the last Advisory Contract renewals in July 2004, Fidelity has taken a number of actions that benefited particular funds, including (i) voluntarily deciding in 2004 to stop using “soft” commission dollars to pay for market data and, instead, to pay for that data out of its own resources, (ii) contractually agreeing to impose management fee reductions and expense limitations on its five Spartan stock index funds and its stock index fund available through variable insurance products, (iii) contractually agreeing to eliminate the management fees on the Fidelity Freedom Funds and the Fidelity Advisor Freedom Funds, (iv) contractually agreeing to reduce the management fees on most of its investment-grade taxable bond funds, and (v) contractually agreeing to impose expense limitations on its retail and Spartan investment-grade taxable bond funds.
Investment Performance and Compliance. The Board considered whether the fund has operated within its investment objective, as well as its record of compliance with its investment restrictions. It also reviewed the fund’s absolute investment performance for each class, as well as the fund’s relative investment performance for each class measured against (i) a broad-based securities market index, and (ii) a peer group of mutual funds deemed appropriate by the Board over multiple periods. The following charts considered by the Board show, over the one-, three-, and five-year periods ended December 31, 2004, the returns of Class C and Institutional Class of the fund, the returns of a broad-based securities market index (“benchmark”), and a range of returns of a peer group of mutual funds identified by Lipper Inc. as having an investment objective similar to that of the fund. The returns of Class C and Institutional Class represent the performance of classes with the highest and lowest 12b-1 fees, respectively (not necessarily with the highest and lowest total expenses). The box within each chart shows the 25th percentile return (bottom of box) and the 75th percentile return (top of box) of the Lipper peer group. Returns shown above the box are in the first quartile and returns shown below the box are in the fourth quartile. The percentage beaten numbers noted below each chart correspond to the percentile box and represent the percentage of funds in the Lipper peer group whose performance was equal to or lower than that of the class indicated.
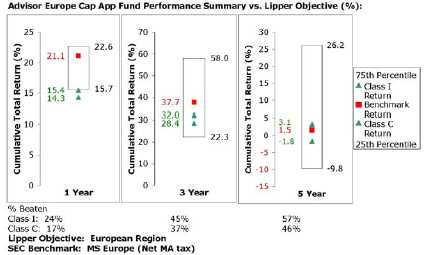
The Board reviewed the fund’s relative investment performance against its Lipper peer group and stated that the performance of Institutional Class of the fund was in the fourth quartile for the one-year period, the third quartile for the three-year period, and the second quartile for the five-year period. The Board also stated that the relative investment performance of the fund was lower than its benchmark for certain periods, although the five-year cumulative total return of Institutional Class of the fund was higher than its benchmark. The Board considered that the variations in performance among the fund’s classes reflect the variations in class expenses, which result in lower performance for higher expense classes. The Board discussed with FMR actions to be taken by FMR to improve the fund’s more recent disappointing performance.
The Board has had thorough discussions with FMR throughout the year about the Board’s and FMR’s concerns about equity research, equity fund performance, and compliance with internal policies governing gifts and entertainment. FMR has taken steps that it believes will refocus and strengthen equity research and equity portfolio management and compliance. The Board noted with favor FMR’s recent reorganization of its senior management team and FMR’s plans to dedicate additional resources to investment research, and participated in the process that led to those changes.
Based on its review, and giving particular weight to the nature and quality of the resources dedicated by the Investment Advisers to maintain and improve relative performance, the Board concluded that the nature, extent, and quality of the services provided by Fidelity will benefit the fund’s shareholders, particularly in light of the Board’s view that the fund’s shareholders benefit from investing in a fund that is part of a large family of funds offering a variety of investment disciplines and services.
49 Annual Report
Board Approval of Investment Advisory Contracts and Management Fees - continued
Competitiveness of Management Fee and Total Fund Expenses. The Board considered the fund’s management fee and total expenses compared to “mapped groups” of competitive funds and classes. Fidelity creates “mapped groups” by combining similar Lipper investment objective categories that have comparable management fee characteristics. Combining Lipper investment objective categories aids the Board’s management fee and total expense comparisons by broadening the competitive group used for comparison and by reducing the number of universes to which various Fidelity funds are compared.
The Board considered two proprietary management fee comparisons for the 12-month periods shown in the chart below. The group of Lipper funds used by the Board for management fee comparisons is referred to below as the “Total Mapped Group” and, for the reasons explained above, is broader than the Lipper peer group used by the Board for performance comparisons. The Total Mapped Group comparison focuses on a fund’s standing relative to the total universe of comparable funds available to investors, in terms of gross management fees before expense reimbursements or caps. “TMG %” represents the percentage of funds in the Total Mapped Group that had management fees that were lower than the fund’s. For example, a TMG % of 24% means that 76% of the funds in the Total Mapped Group had higher management fees than the fund. The “Asset-Size Peer Group” (ASPG) comparison focuses on a fund’s standing relative to non-Fidelity funds similar in size to the fund within the Total Mapped Group. The ASPG represents at least 15% of the funds in the Total Mapped Group with comparable asset size and management fee characteristics, subject to a minimum of 50 funds (or all funds in the Total Mapped Group if fewer than 50). Additional information, such as the ASPG quartile (“quadrant”) in which the fund’s management fee ranked, is also included in the chart and considered by the Board.
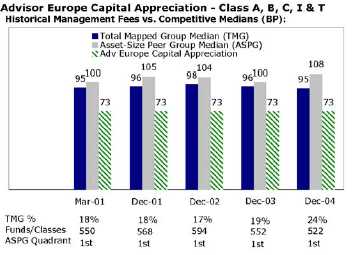
The Board noted that the fund’s management fee ranked below the median of its Total Mapped Group and below the median of its ASPG for 2004.
Based on its review, the Board concluded that the fund’s management fee was fair and reasonable in light of the services that the fund receives and the other factors considered.
In its review of each class’s total expenses, the Board considered the fund’s management fee as well as other fund or class expenses, as applicable, such as transfer agent fees, pricing and bookkeeping fees, fund-paid 12b-1 fees, and custodial, legal, and audit fees. The Board also noted the effects of any waivers and reimbursements on fees and expenses. As part of its review, the Board also considered current and historical total expenses of each class of the fund compared to competitive fund median expenses. Each class of the fund is compared to those funds and classes in the Total Mapped Group (used by the Board for management fee comparisons) that have a similar sales load structure.
The Board noted that the total expenses of each class ranked above its competitive median for 2004. The Board noted that the fund offers multiple classes, each of which has a different sales load and 12b-1 fee structure, and that the multiple structures are intended to offer a range of pricing options for the intermediary market. The Board also noted that the total expenses of the classes vary primarily by the level of their 12b-1 fees, although differences in transfer agent fees may also cause expenses to vary from class to class.
Furthermore, the Board considered that on December 16, 2004, it had approved changes (effective January 1, 2005) in the transfer agent and service agreements for the fund that
51 Annual Report
Board Approval of Investment Advisory Contracts and Management Fees - continued
established maximum transfer agent fees and eliminated the minimum pricing and bookkeeping fee to prevent small funds or funds with small average account sizes from having relatively high fees in basis points (the “small-fund fee reductions”). The Board considered that, if the small-fund fee reductions had been in effect in 2004, the total expenses of each of Class A, Class B, and Class C would have ranked below the median.
In its review of total expenses, the Board also considered Fidelity fee structures and other information on clients that FMR and its affiliates service in other competitive markets, such as other mutual funds advised or subadvised by FMR or its affiliates, pension plan clients, and other institutional clients.
Based on its review, the Board concluded that the total expenses for each class of the fund were reasonable, although in all cases above the median of the universe presented for comparison, in light of the services that the fund and its shareholders receive and the other factors considered.
Costs of the Services and Profitability. The Board considered the revenues earned and the expenses incurred by Fidelity in conducting the business of developing, marketing, distributing, managing, administering and servicing the fund and its shareholders. The Board also considered the level of Fidelity’s profits in respect of all the Fidelity funds.
On an annual basis, FMR presents to the Board Fidelity’s profitability for the fund. Fidelity calculates the profitability for each fund, as well as aggregate profitability for groups of Fidelity funds and all Fidelity funds, using a series of detailed revenue and cost allocation methodologies which originate with the audited books and records of Fidelity. The Audit Committee of the Board reviews any significant changes from the prior year’s methodologies.
PricewaterhouseCoopers LLP (PwC), independent registered accounting firm and auditor to Fidelity and certain Fidelity funds, has been engaged annually by the Board as part of the Board’s assessment of the results of Fidelity’s profitability analysis. PwC’s engagement includes the review and assessment of Fidelity’s methodologies used in determining the revenues and expenses attributable to Fidelity’s mutual fund business, and completion of agreed-upon procedures surrounding the mathematical accuracy of fund profitability and its conformity to allocation methodologies. After considering PwC’s reports issued under the engagement and information provided by Fidelity, the Board believes that while other allocation methods may also be reasonable, Fidelity’s profitability methodologies are reasonable in all material respects.
The Board has also reviewed Fidelity’s non-fund businesses and any fall-out benefits related to the mutual fund business as well as cases where Fidelity’s affiliates may benefit from or be related to the fund’s business. In addition, a special committee of the Board reviewed services provided to Fidelity by its affiliates and determined that the fees that Fidelity paid for such services were reasonable.
The Board considered the costs of the services provided by and the profits realized by Fidelity in connection with the operation of the fund and determined that the amount of profit is a fair entrepreneurial profit for the management of the fund.
Economies of Scale. The Board considered whether there have been economies of scale in respect of the management of the Fidelity funds, whether the Fidelity funds (including the fund) have appropriately benefited from any such economies of scale, and whether there is potential for realization of any further economies of scale. The Board considered the extent to which the fund will benefit from economies of scale through increased services to the fund, through waivers or reimbursements, or through fee or expense reductions, including reductions that occur through operation of the transfer agent agreement. The transfer agent fee varies in part based on the number of accounts in the fund. If the number of accounts decreases or the average account size increases, the overall transfer agent fee rate decreases.
The Board recognized that the fund’s management contract incorporates a “group fee” structure, which provides for lower fee rates as total fund assets under FMR’s management increase, and for higher fee rates as total fund assets under FMR’s management decrease. The Board considered that the group fee is designed to deliver the benefits of economies of scale to fund shareholders when total fund assets increase, even if assets of any particular fund are unchanged or have declined, because some portion of Fidelity’s costs are attributable to services provided to all Fidelity funds, and all funds benefit if those costs can be allocated among more assets. The Board concluded that, given the group fee structure, fund shareholders will achieve a certain level of economies of scale as assets under FMR’s management increase at the fund complex level, regardless of whether Fidelity achieves any such economies of scale.
The Board further concluded that any potential economies of scale are being shared between fund shareholders and Fidelity in an appropriate manner.
Additional Information Requested by the Board. In order to develop fully the factual basis for consideration of the Advisory Contracts, the Board requested additional information regarding (i) equity fund transfer agency fees; (ii) Fidelity’s fund profitability methodology and the impact of various changes in the methodology over time; (iii) benefits to shareholders from economies of scale; (iv) composition and characteristics of various fund and industry data used in comparisons; and (v) compensation of portfolio managers and research analysts.
Based on its evaluation of all of the conclusions noted above, and after considering all material factors, the Board ultimately concluded that the existing advisory fee structures are fair and reasonable, and that the fund’s existing Advisory Contracts should be renewed.
53 Annual Report
Investment Adviser
Fidelity Management & Research Company
Boston, MA
Investment Sub-Advisers
FMR Co., Inc.
Fidelity Management & Research
(U.K.) Inc.
Fidelity Management & Research
(Far East) Inc.
Fidelity International
Investment Advisors
Fidelity Investments Japan Limited
Fidelity International Investment
Advisors (U.K.) Limited
General Distributor
Fidelity Distributors Corporation
Boston, MA
Transfer and Service Agents
Fidelity Investments Institutional
Operations Company, Inc.
Boston, MA
Fidelity Service Company, Inc.
Boston, MA
Custodian
State Street Bank and Trust Company
Quincy, MA
|


Fidelity® Advisor
Europe Capital Appreciation
Fund - Institutional Class
Annual Report October 31, 2005

| Contents | | | | |
| |
| Chairman’s Message | | 4 | | Ned Johnson’s message to shareholders. |
| Performance | | 6 | | How the fund has done over time. |
| Management’s Discussion | | 7 | | The manager’s review of fund |
| | | | | performance, strategy and outlook. |
| Shareholder Expense | | 8 | | An example of shareholder expenses. |
| Example | | | | |
| Investment Changes | | 10 | | A summary of major shifts in the fund’s |
| | | | | investments over the past six months. |
| Investments | | 11 | | A complete list of the fund’s investments |
| | | | | with their market values. |
| Financial Statements | | 15 | | Statements of assets and liabilities, |
| | | | | operations, and changes in net assets, |
| | | | | as well as financial highlights. |
| Notes | | 24 | | Notes to the financial statements. |
| Report of Independent | | 33 | | |
| Registered Public | | | | |
| Accounting Firm | | | | |
| Trustees and Officers | | 34 | | |
| Distributions | | 44 | | |
| Board Approval of | | 45 | | |
| Investment Advisory | | | | |
| Contracts and | | | | |
| Management Fees | | | | |
To view a fund’s proxy voting guidelines and proxy voting record for the 12-month period ended June 30, visit www.fidelity.com/proxyvotingresults or visit the Securities and Exchange Commission’s (SEC) web site at www.sec.gov. You may also call 1-877-208-0098 to request a free copy of the proxy voting guidelines.
Standard & Poor’s, S&P and S&P 500 are registered service marks of The McGraw-Hill Companies, Inc. and have been licensed for use by Fidelity Distributors Corporation.
Other third party marks appearing herein are the property of their respective owners.
All other marks appearing herein are registered or unregistered trademarks or service marks of FMR Corp. or an affiliated company.
The views expressed in the Management’s Discussion of Fund Performance reflect those of the portfolio manager only through the end of the period of the report as stated on the cover and do not necessarily represent the views of Fidelity or any other person in the Fidelity organization. Any such views are subject to change at any time based upon market or other conditions and Fidelity disclaims any responsibility to update such views. These views may not be relied on as investment advice and, because investment decisions for a Fidelity fund are based on numerous factors, may not be relied on as an indication of trading intent on behalf of any Fidelity fund.
This report and the financial statements contained herein are submitted for the general information of the shareholders of the fund. This report is not authorized for distribution to prospective investors in the fund unless preceded or accompanied by an effective prospectus.
A fund files its complete schedule of portfolio holdings with the SEC for the first and third quarters of each fiscal year on Form N-Q. Forms N-Q are available on the SEC’s web site at http://www.sec.gov. A fund’s Forms N-Q may be reviewed and copied at the SEC’s Public Reference Room in Washington, DC. Information regarding the operation of the SEC’s Public Reference Room may be obtained by calling 1-800-SEC-0330. For a complete list of a fund’s portfolio holdings, view the most recent quarterly holdings report, semiannual report, or annual report on Fidelity’s web site at http://www.advisor.fidelity.com.
NOT FDIC INSURED · MAY LOSE VALUE · NO BANK GUARANTEE
Neither the fund nor Fidelity Distributors Corporation is a bank.
3 Annual Report
Chairman’s Message
(Photograph of Edward C. Johnson 3d)
Dear Shareholder:
During the past year or so, much has been reported about the mutual fund industry, and much of it has been more critical than I believe is warranted. Allegations that some companies have been less than forthright with their shareholders have cast a shadow on the entire industry. I continue to find these reports disturbing, and assert that they do not create an accurate picture of the industry overall. Therefore, I would like to remind everyone where Fidelity stands on these issues. I will say two things specifically regarding allegations that some mutual fund companies were in violation of the Securities and Exchange Commission’s forward pricing rules or were involved in so-called “market timing” activities.
First, Fidelity has no agreements that permit customers who buy fund shares after 4 p.m. to obtain the 4 p.m. price. This is not a new policy. This is not to say that someone could not deceive the company through fraudulent acts. However, we are extremely diligent in preventing fraud from occurring in this manner — and in every other. But I underscore again that Fidelity has no so-called “agreements” that sanction illegal practices.
Second, Fidelity continues to stand on record, as we have for years, in opposition to predatory short-term trading that adversely affects shareholders in a mutual fund. Back in the 1980s, we initiated a fee — which is returned to the fund and, therefore, to investors — to discourage this activity. Further, we took the lead several years ago in developing a Fair Value Pricing Policy to prevent market timing on foreign securities in our funds. I am confident we will find other ways to make it more difficult for predatory traders to operate. However, this will only be achieved through close cooperation among regulators, legislators and the industry.
Yes, there have been unfortunate instances of unethical and illegal activity within the mutual fund industry from time to time. That is true of any industry. When this occurs, confessed or convicted offenders should be dealt with appropriately. But we are still concerned about the risk of over-regulation and the quick application of simplistic solutions to intricate problems. Every system can be improved, and we support and applaud well thought out improvements by regulators, legislators and industry representatives that achieve the common goal of building and protecting the value of investors’ holdings.
For nearly 60 years, Fidelity has worked very hard to improve its products and service to justify your trust. When our family founded this company in 1946, we had only a few hundred customers. Today, we serve more than 18 million customers including individual investors and participants in retirement plans across America.
Annual Report 4
Let me close by saying that we do not take your trust in us for granted, and we realize that we must always work to improve all aspects of our service to you. In turn, we urge you to continue your active participation with your financial matters, so that your interests can be well served.
Best regards,
/s/Edward C. Johnson 3d
5 Annual Report
Performance: The Bottom Line
Average annual total return reflects the change in the value of an investment, assuming reinvestment of the class’ dividend income and capital gains (the profits earned upon the sale of securities that have grown in value) and assuming a constant rate of performance each year. The $10,000 table and the fund’s returns do not reflect the deduction of taxes that a shareholder would pay on fund distributions or the redemption of fund shares. During periods of reimbursement by Fidelity, a fund’s total return will be greater than it would be had the reimbursement not occurred. How a fund did yesterday is no guarantee of how it will do tomorrow.
| Average Annual Total Returns | | | | | | |
| Periods ended October 31, 2005 | | Past 1 | | Past 5 | | Life of |
| | | year | | years | | fundA |
| Institutional Class | | 19.56% | | 4.42% | | 4.92% |
| A From December 17, 1998. | | | | | | |
$10,000 Over Life of Fund
Let’s say hypothetically that $10,000 was invested in Fidelityr Advisor Europe Capital Appreciation Fund — Institutional Class on December 17, 1998, when the fund started. The chart shows how the value of your investment would have changed, and also shows how the MSCIr Europe Index performed over the same period.
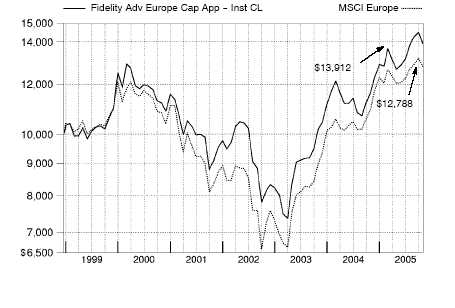
Annual Report 6
Management’s Discussion of Fund Performance
Comments from Ian Hart, Portfolio Manager of Fidelity® Advisor Europe Capital Appreciation Fund
Foreign stock markets enjoyed broad-based advances during the 12-month period that ended October 31, 2005, encouraged by better-than-expected corporate earnings and markedly improved economies. For the 12 months overall, the Morgan Stanley Capital InternationalSM Europe, Australasia, Far East (MSCIr EAFE®) Index — a performance measure of developed stock markets outside the United States and Canada — gained 18.28% . The Japanese stock market climbed to its highest level in more than four years. Positive economic indicators and Prime Minister Koizumi’s decisive election victory attracted record inflows from overseas investors. In response, the Tokyo Stock Exchange Stock Price Index (TOPIX) soared 22.89% . Southeast Asian equities outside of Japan, particularly South Korea, also responded well to the better macroeconomic environment, illustrated by the 19.44% return for the MSCI All Country Far East ex Japan index. Euro-pean stock markets were up as well, despite investors’ concern about higher energy prices and potential downgrades to economic growth in the region. For the year overall, the MSCI Europe index rose 16.51% . Although robust, returns for U.S. investors in foreign markets were tempered somewhat by the strength of the dollar versus many major currencies.
During the past year, the fund’s Institutional Class shares returned 19.56%, beating the MSCI Europe Index and the LipperSM European Region Funds Average, which rose 18.34% . The fund’s outperformance versus the index was mainly attributable to astute security selection, with strong-performing picks even coming from generally weak market sectors. For example, the fund’s top contributor — both on an absolute and relative basis — was TANDBERG Television, a Norwegian technology company that provides infrastructure for the cable and TV industries, which performed well despite a lackluster environment for tech stocks. Similarly, within the lagging financials sector, several individual holdings did well, including Turkiye Garanti Bankasi, a Turkish Bank; Banca Italease, an Italian leasing company; Amlin, a British specialty insurance underwriter; and Deutsche Boerse, the German stock exchange. Conversely, performance was held back by the fund’s big underweighting in index component Roche Holdings, the Swiss pharmaceutical company, which did well during the period, as well as by some smaller names — among them, Italian broadband company FASTWEB and Turkish electrical utility Akenerji — where stories in which I had conviction hadn’t yet materialized.
Note to shareholders:
Effective January 1, 2006, Darren Maupin has been named Portfolio Manager of Fidelity Advisor Europe Capital Appreciation Fund, succeeding Ian Hart.
The views expressed in this statement reflect those of the portfolio manager only through October 31, 2005. See page 3 for further discussion of this section of the report.
7 Annual Report
7
Shareholder Expense Example
As a shareholder of the Fund, you incur two types of costs: (1) transaction costs, including sales charges (loads) on purchase payments or redemption proceeds, redemption fees, and (2) ongoing costs, including management fees, distribution and/or service (12b-1) fees and other Fund expenses. This Example is intended to help you understand your ongoing costs (in dollars) of investing in the Fund and to compare these costs with the ongoing costs of investing in other mutual funds.
The Example is based on an investment of $1,000 invested at the beginning of the period and held for the entire period (May 1, 2005 to October 31, 2005).
The first line of the table below for each class of the Fund provides information about actual account values and actual expenses. You may use the information in this line, together with the amount you invested, to estimate the expenses that you paid over the period. Simply divide your account value by $1,000.00 (for example, an $8,600 account value divided by $1,000.00 = 8.6), then multiply the result by the number in the first line for a class of the Fund under the heading entitled “Expenses Paid During Period” to estimate the expenses you paid on your account during this period.
Hypothetical Example for Comparison Purposes
The second line of the table below for each class of the Fund provides information about hypothetical account values and hypothetical expenses based on a Class’ actual expense ratio and an assumed rate of return of 5% per year before expenses, which is not the Class’ actual return. The hypothetical account values and expenses may not be used to estimate the actual ending account balance or expenses you paid for the period. You may use this information to compare the ongoing costs of investing in the Fund and other funds. To do so, compare this 5% hypothetical example with the 5% hypothetical examples that appear in the shareholder reports of the other funds.
Please note that the expenses shown in the table are meant to highlight your ongoing costs only and do not reflect any transaction costs. Therefore, the second line of the table is useful in comparing ongoing costs only, and will not help you determine the relative total costs of owning different funds. In addition, if these transactional costs were included, your costs would have been higher.
| | | | | | | | | | | | | Expenses Paid |
| | | | | Beginning | | | | Ending | | | | During Period* |
| | | Account Value | | Account Value | | | | May 1, 2005 |
| | | | | May 1, 2005 | | October 31, 2005 | | to October 31, 2005 |
| Class A | | | | | | | | | | | | |
| Actual | | $ | | 1,000.00 | | $ | | 1,096.00 | | $ | | 7.92 |
| HypotheticalA | | $ | | 1,000.00 | | $ | | 1,017.64 | | $ | | 7.63 |
| Class T | | | | | | | | | | | | |
| Actual | | $ | | 1,000.00 | | $ | | 1,094.30 | | $ | | 9.24 |
| HypotheticalA | | $ | | 1,000.00 | | $ | | 1,016.38 | | $ | | 8.89 |
| Class B | | | | | | | | | | | | |
| Actual | | $ | | 1,000.00 | | $ | | 1,090.80 | | $ | | 11.86 |
| HypotheticalA | | $ | | 1,000.00 | | $ | | 1,013.86 | | $ | | 11.42 |
Annual Report 8
| | | | | | | | | | | | | Expenses Paid |
| | | | | Beginning | | | | Ending | | | | During Period* |
| | | Account Value | | Account Value | | | | May 1, 2005 |
| | | | | May 1, 2005 | | October 31, 2005 | | to October 31, 2005 |
| Class C | | | | | | | | | | | | |
| Actual | | $ | | 1,000.00 | | $ | | 1,091.50 | | $ | | 11.86 |
| HypotheticalA | | $ | | 1,000.00 | | $ | | 1,013.86 | | $ | | 11.42 |
| Institutional Class | | | | | | | | | | | | |
| Actual | | $ | | 1,000.00 | | $ | | 1,097.40 | | $ | | 6.61 |
| HypotheticalA | | $ | | 1,000.00 | | $ | | 1,018.90 | | $ | | 6.36 |
| |
| A 5% return per year before expenses | | | | | | | | |
* Expenses are equal to each Class’ annualized expense ratio (shown in the table below); multiplied by the average account value over the period, multiplied by 184/365 (to reflect the one-half year period).
| | | Annualized |
| | | Expense Ratio |
| Class A | | 1.50% |
| Class T | | 1.75% |
| Class B | | 2.25% |
| Class C | | 2.25% |
| Institutional Class | | 1.25% |
9 Annual Report
Investment Changes
| Top Five Stocks as of October 31, 2005 | | | | |
| | | % of fund’s | | % of fund’s net assets |
| | | net assets | | 6 months ago |
| Total SA sponsored ADR (France, Oil, Gas & | | | | |
| Consumable Fuels) | | 5.0 | | 4.4 |
| ENI Spa (Italy, Oil, Gas & Consumable Fuels) | | 3.6 | | 2.6 |
| Novartis AG (Reg.) (Switzerland, | | | | |
| Pharmaceuticals) | | 3.4 | | 2.9 |
| BASF AG (Germany, Chemicals) | | 3.4 | | 1.5 |
| Vodafone Group PLC (United Kingdom, | | | | |
| Telecommunication Services) | | 3.0 | | 4.2 |
| | | 18.4 | | |
| Top Five Market Sectors as of October 31, 2005 | | |
| �� | | % of fund’s | | % of fund’s net assets |
| | | net assets | | 6 months ago |
| Financials | | 20.1 | | 21.7 |
| Energy | | 18.4 | | 16.0 |
| Consumer Discretionary | | 11.1 | | 10.2 |
| Telecommunication Services | | 10.7 | | 13.4 |
| Health Care | | 10.6 | | 11.3 |
| Top Five Countries as of October 31, 2005 | | |
| (excluding cash equivalents) | | % of fund’s | | % of fund’s net assets |
| | | net assets | | 6 months ago |
| United Kingdom | | 23.4 | | 22.0 |
| Germany | | 12.5 | | 12.5 |
| France | | 10.8 | | 11.9 |
| Italy | | 8.4 | | 5.3 |
| Switzerland | | 7.7 | | 10.1 |
| Percentages are adjusted for the effect of open futures contracts, if applicable. | | |

Annual Report 10
| Investments October 31, 2005 | | | | | | | | |
| Showing Percentage of Net Assets | | | | | | | | |
| |
| Common Stocks — 91.5% | | | | | | | | |
| | | | | Shares | | Value (Note 1) |
| |
| Austria – 1.0% | | | | | | | | |
| OMV AG | | | | 4,800 | | $ | | 258,930 |
| Canada – 0.9% | | | | | | | | |
| Eldorado Gold Corp. (a) | | | | 44,700 | | | | 136,636 |
| Hydrogenics Corp. (a) | | | | 31,000 | | | | 94,759 |
| TOTAL CANADA | | | | | | | | 231,395 |
| |
| Finland – 1.2% | | | | | | | | |
| Metso Corp. | | | | 11,500 | | | | 299,148 |
| France – 10.8% | | | | | | | | |
| AXA SA | | | | 7,700 | | | | 222,992 |
| Lagardere S.C.A. (Reg.) | | | | 3,400 | | | | 233,744 |
| Pernod Ricard SA | | | | 2,925 | | | | 511,576 |
| Renault SA | | | | 2,500 | | | | 216,524 |
| Sanofi-Aventis sponsored ADR | | | | 6,527 | | | | 261,863 |
| Total SA sponsored ADR | | | | 10,000 | | | | 1,260,196 |
| TOTAL FRANCE | | | | | | | | 2,706,895 |
| |
| Germany – 11.9% | | | | | | | | |
| Allianz AG (Reg.) | | | | 2,400 | | | | 339,360 |
| BASF AG | | | | 11,700 | | | | 842,400 |
| Bayer AG | | | | 14,000 | | | | 487,200 |
| Bilfinger & Berger Bau AG | | | | 2,721 | | | | 117,751 |
| DAB Bank AG | | | | 11,581 | | | | 87,322 |
| Deutsche Boerse AG | | | | 1,755 | | | | 165,149 |
| E.ON AG | | | | 5,100 | | | | 462,213 |
| MAN AG | | | | 5,100 | | | | 236,781 |
| SAP AG | | | | 1,300 | | | | 223,288 |
| TOTAL GERMANY | | | | | | | | 2,961,464 |
| |
| Greece – 0.5% | | | | | | | | |
| Greek Organization of Football Prognostics SA | | | | 4,700 | | | | 135,670 |
| Ireland – 0.8% | | | | | | | | |
| C&C Group PLC | | | | 32,600 | | | | 201,258 |
| Israel – 0.2% | | | | | | | | |
| Emblaze Ltd. (a) | | | | 18,400 | | | | 39,336 |
| Italy – 8.4% | | | | | | | | |
| Banca Intesa Spa | | | | 47,705 | | | | 222,627 |
| Banca Italease Spa | | | | 15,500 | | | | 327,929 |
| ENI Spa | | | | 31,500 | | | | 842,625 |
| ENI Spa sponsored ADR | | | | 400 | | | | 53,500 |
See accompanying notes which are an integral part of the financial statements.
11 Annual Report
11
| Investments - continued | | | | | | |
| |
| |
| Common Stocks – continued | | | | | | |
| | | Shares | | Value (Note 1) |
| |
| Italy – continued | | | | | | |
| FASTWEB Spa (a) | | 6,527 | | $ | | 296,930 |
| Unicredito Italiano Spa | | 61,600 | | | | 343,961 |
| TOTAL ITALY | | | | | | 2,087,572 |
| |
| Luxembourg – 1.1% | | | | | | |
| Millicom International Cellular SA unit (a) | | 14,876 | | | | 284,943 |
| Netherlands – 3.1% | | | | | | |
| Completel Europe NV (a) | | 4,694 | | | | 218,606 |
| ING Groep NV (Certificaten Van Aandelen) | | 9,630 | | | | 277,922 |
| Koninklijke Philips Electronics NV (NY Shares) | | 11,031 | | | | 288,571 |
| TOTAL NETHERLANDS | | | | | | 785,099 |
| |
| Norway – 5.6% | | | | | | |
| Ocean RIG ASA (a) | | 18,200 | | | | 202,813 |
| Petroleum Geo-Services ASA (a) | | 15,200 | | | | 385,490 |
| Statoil ASA | | 22,200 | | | | 496,480 |
| TANDBERG ASA | | 9,100 | | | | 89,517 |
| TANDBERG Television ASA (a) | | 17,200 | | | | 214,141 |
| TOTAL NORWAY | | | | | | 1,388,441 |
| |
| Poland – 2.1% | | | | | | |
| Polski Koncern Naftowy Orlen SA | | 18,899 | | | | 335,548 |
| Powszechna Kasa Oszczednosci Bank SA | | 23,900 | | | | 200,965 |
| TOTAL POLAND | | | | | | 536,513 |
| |
| Russia – 0.8% | | | | | | |
| Mobile TeleSystems OJSC sponsored ADR | | 5,300 | | | | 196,047 |
| South Africa – 1.9% | | | | | | |
| Steinhoff International Holdings Ltd. | | 178,531 | | | | 467,214 |
| Spain – 1.9% | | | | | | |
| Banco Bilbao Vizcaya Argentaria SA | | 5,500 | | | | 96,965 |
| Telefonica SA sponsored ADR | | 7,908 | | | | 379,189 |
| TOTAL SPAIN | | | | | | 476,154 |
| |
| Sweden – 1.9% | | | | | | |
| Modern Times Group AB (MTG) (B Shares) (a) | | 3,000 | | | | 114,739 |
| OMX AB (a) | | 10,400 | | | | 127,036 |
| Skandia Foersaekrings AB | | 45,300 | | | | 225,887 |
| TOTAL SWEDEN | | | | | | 467,662 |
| |
| Switzerland – 7.7% | | | | | | |
| Actelion Ltd. (Reg.) (a) | | 1,097 | | | | 123,388 |
See accompanying notes which are an integral part of the financial statements.
| Common Stocks – continued | | | | | | |
| | | Shares | | Value (Note 1) |
| |
| Switzerland – continued | | | | | | |
| Baloise Holdings AG (Reg.) | | 1,978 | | $ | | 100,806 |
| Credit Suisse Group (Reg.) | | 6,639 | | | | 294,174 |
| Novartis AG: | | | | | | |
| (Reg.) | | 13,558 | | | | 729,692 |
| sponsored ADR | | 2,400 | | | | 129,168 |
| Phonak Holding AG | | 4,118 | | | | 171,696 |
| Syngenta AG (Switzerland) | | 3,486 | | | | 373,708 |
| TOTAL SWITZERLAND | | | | | | 1,922,632 |
| |
| Turkey – 4.3% | | | | | | |
| Akenerji Elektrik Uretimi Otoproduktor Grubu AS (a) | | 55,997 | | | | 215,453 |
| Turkcell Iletisim Hizmet AS sponsored ADR | | 22,743 | | | | 299,753 |
| Turkiye Garanti Bankasi AS | | 52,463 | | | | 156,050 |
| Yapi ve Kredi Bankasi AS (a) | | 107,800 | | | | 402,007 |
| TOTAL TURKEY | | | | | | 1,073,263 |
| |
| United Kingdom – 23.4% | | | | | | |
| Amlin PLC | | 54,278 | | | | 213,094 |
| AstraZeneca PLC sponsored ADR | | 10,000 | | | | 449,000 |
| Axis Shield PLC (a) | | 19,200 | | | | 107,757 |
| BAE Systems PLC | | 90,300 | | | | 528,376 |
| Barratt Developments PLC | | 7,500 | | | | 100,451 |
| BG Group PLC | | 44,103 | | | | 387,287 |
| BowLeven PLC | | 7,950 | | | | 51,726 |
| British Land Co. PLC | | 15,478 | | | | 243,887 |
| BT Group PLC | | 65,900 | | | | 249,168 |
| Chaucer Holdings PLC | | 307,100 | | | | 289,523 |
| Expro International Group PLC | | 8,400 | | | | 72,500 |
| George Wimpey PLC | | 27,800 | | | | 201,304 |
| GlaxoSmithKline PLC | | 17,600 | | | | 457,512 |
| GlaxoSmithKline PLC sponsored ADR | | 4,500 | | | | 233,955 |
| Hilton Group PLC | | 36,100 | | | | 216,826 |
| ITV PLC | | 155,000 | | | | 285,397 |
| Prudential PLC | | 28,800 | | | | 241,688 |
| Standard Chartered PLC (United Kingdom) | | 18,800 | | | | 394,754 |
| Vodafone Group PLC | | 159,900 | | | | 419,898 |
| Vodafone Group PLC sponsored ADR | | 12,400 | | | | 325,624 |
| William Hill PLC | | 28,300 | | | | 267,804 |
| Wilson Bowden PLC | | 5,252 | | | | 104,514 |
| TOTAL UNITED KINGDOM | | | | | | 5,842,045 |
See accompanying notes which are an integral part of the financial statements.
13 Annual Report
13
| Investments - continued | | | | |
| |
| Common Stocks – continued | | | | |
| | | Shares | | Value (Note 1) |
| United States of America – 2.0% | | | | |
| AES Corp. (a) | | 12,700 | | $ 201,803 |
| Forest Oil Corp. (a) | | 6,600 | | 288,288 |
| TOTAL UNITED STATES OF AMERICA | | | | 490,091 |
| |
| TOTAL COMMON STOCKS | | | | |
| (Cost $21,177,681) | | | | 22,851,772 |
| Nonconvertible Preferred Stocks — 0.6% | | | | |
| |
| Germany – 0.6% | | | | |
| Porsche AG (non-vtg.) | | | | |
| (Cost $138,400) | | 230 | | 165,841 |
| Money Market Funds — 9.2% | | | | |
| Fidelity Cash Central Fund, 3.92% (b) | | | | |
| (Cost $2,303,729) | | 2,303,729 | | 2,303,729 |
| TOTAL INVESTMENT PORTFOLIO – 101.3% | | | | |
| (Cost $23,619,810) | | | | 25,321,342 |
| |
| NET OTHER ASSETS – (1.3)% | | | | (337,265) |
| NET ASSETS – 100% | | $ | | 24,984,077 |
(a) Non-income producing
(b) Affiliated fund that is available only to investment companies and other accounts managed by Fidelity Investments. The rate quoted is the annualized seven-day yield of the fund at period end. A complete unaudited listing of the fund’s holdings as of its most recent quarter end is available upon request.
See accompanying notes which are an integral part of the financial statements.
| Financial Statements | | | | | | | | |
| |
| |
| Statement of Assets and Liabilities | | | | | | | | |
| | | | | | | October 31, 2005 |
| |
| Assets | | | | | | | | |
| Investment in securities, at value (cost $23,619,810) — | | | | | | | | |
| See accompanying schedule | | | | | | $ | | 25,321,342 |
| Receivable for investments sold | | | | | | | | 80,036 |
| Receivable for fund shares sold | | | | | | | | 58,025 |
| Dividends receivable | | | | | | | | 44,563 |
| Interest receivable | | | | | | | | 4,423 |
| Receivable from investment adviser for expense | | | | | | | | |
| reductions | | | | | | | | 8,897 |
| Other receivables | | | | | | | | 3,333 |
| Total assets | | | | | | | | 25,520,619 |
| |
| Liabilities | | | | | | | | |
| Payable for investments purchased | | $ | | 407,881 | | | | |
| Payable for fund shares redeemed | | | | 43,806 | | | | |
| Accrued management fee | | | | 15,015 | | | | |
| Distribution fees payable | | | | 13,888 | | | | |
| Other affiliated payables | | | | 9,546 | | | | |
| Other payables and accrued expenses | | | | 46,406 | | | | |
| Total liabilities | | | | | | | | 536,542 |
| |
| Net Assets | | | | | | $ | | 24,984,077 |
| Net Assets consist of: | | | | | | | | |
| Paid in capital | | | | | | $ | | 22,783,334 |
| Undistributed net investment income | | | | | | | | 111,189 |
| Accumulated undistributed net realized gain (loss) on | | | | | | | | |
| investments and foreign currency transactions | | | | | | | | 388,383 |
| Net unrealized appreciation (depreciation) on | | | | | | | | |
| investments and assets and liabilities in foreign | | | | | | | | |
| currencies | | | | | | | | 1,701,171 |
| Net Assets | | | | | | $ | | 24,984,077 |
See accompanying notes which are an integral part of the financial statements.
15 Annual Report
| Financial Statements - continued | | | | |
| |
| |
| Statement of Assets and Liabilities — continued | | | | |
| | | October 31, 2005 |
| |
| Calculation of Maximum Offering Price | | | | |
| Class A: | | | | |
| Net Asset Value and redemption price per share | | | | |
| ($4,543,672 ÷337,377 shares) | | $ | | 13.47 |
| Maximum offering price per share (100/94.25 of | | | | |
| $13.47) | | $ | | 14.29 |
| Class T: | | | | |
| Net Asset Value and redemption price per share | | | | |
| ($8,893,172 ÷666,631 shares) | | $ | | 13.34 |
| Maximum offering price per share (100/96.50 of | | | | |
| $13.34) | | $ | | 13.82 |
| Class B: | | | | |
| Net Asset Value and offering price per share | | | | |
| ($6,415,069 ÷494,099 shares)A | | $ | | 12.98 |
| Class C: | | | | |
| Net Asset Value and offering price per share | | | | |
| ($4,565,985 ÷351,297 shares)A | | $ | | 13.00 |
| Institutional Class: | | | | |
| Net Asset Value, offering price and redemption price | | | | |
| per share ($566,179 ÷41,525 shares) | | $ | | 13.63 |
| A Redemption price per share is equal to net asset value less any applicable contingent deferred sales charge. | | | | |
See accompanying notes which are an integral part of the financial statements.
Annual Report 16
| Statement of Operations | | | | | | |
| | | | | Year ended October 31, 2005 |
| |
| Investment Income | | | | | | |
| Dividends | | | | $ | | 603,768 |
| Interest | | | | | | 27,140 |
| Security lending | | | | | | 4,473 |
| | | | | | | 635,381 |
| Less foreign taxes withheld | | | | | | (60,240) |
| Total income | | | | | | 575,141 |
| |
| Expenses | | | | | | |
| Management fee | | $ | | 173,211 | | |
| Transfer agent fees | | | | 100,560 | | |
| Distribution fees | | | | 162,646 | | |
| Accounting and security lending fees | | | | 17,084 | | |
| Independent trustees’ compensation | | | | 111 | | |
| Custodian fees and expenses | | | | 71,160 | | |
| Registration fees | | | | 53,418 | | |
| Audit | | | | 45,131 | | |
| Legal | | | | 641 | | |
| Miscellaneous | | | | 226 | | |
| Total expenses before reductions | | | | 624,188 | | |
| Expense reductions | | | | (173,992) | | 450,196 |
| |
| Net investment income (loss) | | | | | | 124,945 |
| Realized and Unrealized Gain (Loss) | | | | | | |
| Net realized gain (loss) on: | | | | | | |
| Investment securities | | | | 4,341,381 | | |
| Foreign currency transactions | | | | (14,394) | | |
| Total net realized gain (loss) | | | | | | 4,326,987 |
| Change in net unrealized appreciation (depreciation) | | | | | | |
| on: | | | | | | |
| Investment securities | | | | (570,459) | | |
| Assets and liabilities in foreign currencies | | | | (3,466) | | |
| Total change in net unrealized appreciation | | | | | | |
| (depreciation) | | | | | | (573,925) |
| Net gain (loss) | | | | | | 3,753,062 |
| Net increase (decrease) in net assets resulting from | | | | | | |
| operations | | | | $ | | 3,878,007 |
See accompanying notes which are an integral part of the financial statements.
17 Annual Report
| Financial Statements - continued | | | | | | | | |
| |
| |
| Statement of Changes in Net Assets | | | | | | | | |
| | | | | Year ended | | | | Year ended |
| | | | | October 31, | | | | October 31, |
| | | | | 2005 | | | | 2004 |
| Increase (Decrease) in Net Assets | | | | | | | | |
| Operations | | | | | | | | |
| Net investment income (loss) | | $ | | 124,945 | | $ | | (77,210) |
| Net realized gain (loss) | | | | 4,326,987 | | | | 3,220,062 |
| Change in net unrealized appreciation | | | | | | | | |
| (depreciation) | | | | (573,925) | | | | (582,905) |
| Net increase (decrease) in net assets resulting | | | | | | | | |
| from operations | | | | 3,878,007 | | | | 2,559,947 |
| Distributions to shareholders from net investment | | | | | | | | |
| income | | | | — | | | | (86,506) |
| Share transactions — net increase (decrease) | | | | 118,782 | | | | (1,503,949) |
| Redemption fees | | | | 568 | | | | 50 |
| Total increase (decrease) in net assets | | | | 3,997,357 | | | | 969,542 |
| |
| Net Assets | | | | | | | | |
| Beginning of period | | | | 20,986,720 | | | | 20,017,178 |
| End of period (including undistributed net invest- | | | | | | | | |
| ment income of $111,189 and accumulated net | | | | | | | | |
| investment loss of $2,363, respectively) | | $ | | 24,984,077 | | $ | | 20,986,720 |
See accompanying notes which are an integral part of the financial statements.
| Financial Highlights — Class A | | | | | | | | | | |
| Years ended October 31, | | 2005 | | 2004 | | 2003 | | | | 2002 | | | | 2001 |
| Selected Per-Share Data | | | | | | | | | | | | | | |
| Net asset value, | | | | | | | | | | | | | | |
| beginning of period | | $ 11.30 | | $ 10.00 | | $ 8.03 | | $ | | 9.00 | | $ | | 11.13 |
| Income from Investment | | | | | | | | | | | | | | |
| Operations | | | | | | | | | | | | | | |
| Net investment income | | | | | | | | | | | | | | |
| (loss)C | | 12 | | .01 | | .04 | | | | .05 | | | | .01 |
| Net realized and unre- | | | | | | | | | | | | | | |
| alized gain (loss) | | 2.05 | | 1.37 | | 1.98 | | | | (1.02) | | | | (2.14) |
| Total from investment | | | | | | | | | | | | | | |
| operations | | 2.17 | | 1.38 | | 2.02 | | | | (.97) | | | | (2.13) |
| Distributions from net | | | | | | | | | | | | | | |
| investment income | | — | | (.08) | | (.05) | | | | — | | | | — |
| Redemption fees added to | | | | | | | | | | | | | | |
| paid in capitalC | | —E | | —E | | — | | | | — | | | | — |
| Net asset value, end of | | | | | | | | | | | | | | |
| period | | $ 13.47 | | $ 11.30 | | $ 10.00 | | $ | | 8.03 | | $ | | 9.00 |
| Total ReturnA,B | | 19.20% | | 13.87% | | 25.30% | | | | (10.78)% | | | | (19.14)% |
| Ratios to Average Net AssetsD | | | | | | | | | | | | |
| Expenses before ex- | | | | | | | | | | | | | | |
| pense reductions | | 2.16% | | 2.41%F | | 3.07% | | | | 2.57% | | | | 2.16% |
| Expenses net of volun- | | | | | | | | | | | | | | |
| tary waivers, if any | | 1.55% | | 1.75% | | 1.75% | | | | 1.96% | | | | 2.00% |
| Expenses net of all | | | | | | | | | | | | | | |
| reductions | | 1.44% | | 1.68% | | 1.69% | | | | 1.91% | | | | 1.95% |
| Net investment income | | | | | | | | | | | | | | |
| (loss) | | 95% | | .07% | | .49% | | | | .48% | | | | .14% |
| Supplemental Data | | | | | | | | | | | | | | |
| Net assets, end of | | | | | | | | | | | | | | |
| period (000 omitted) | | $ 4,544 | | $ 2,905 | | $ 3,346 | | $ 2,071 | | $ | | 2,577 |
| Portfolio turnover rate | | 135% | | 123% | | 199% | | | | 137% | | | | 85% |
A Total returns would have been lower had certain expenses not been reduced during the periods shown.
B Total returns do not include the effect of the sales charges.
C Calculated based on average shares outstanding during the period.
D Expense ratios reflect operating expenses of the class. Expenses before reductions do not reflect amounts reimbursed by the investment adviser or reductions from brokerage service arrangements or other expense offset arrangements and do not represent the amount paid by the class during periods when reimbursements or reductions occur. Expenses net of any voluntary waivers reflect expenses after reimbursement by the investment adviser but prior to reductions from brokerage service arrangements or other expense offset arrangements. Expenses net of all reductions repre sent the net expenses paid by the class.
E Amount represents less than $.01 per share.
F As a result of an overaccrual of expenses for the year ended October 31, 2004, the ratio previously reported has been revised from 2.74% to 2.41% . The change had no impact on net investment income, total net assets or total return of the class.
See accompanying notes which are an integral part of the financial statements.
19 Annual Report
| Financial Highlights — Class T | | | | | | | | | | | | | | |
| Years ended October 31, | | 2005 | | 2004 | | | | 2003 | | | | 2002 | | | | 2001 |
| Selected Per-Share Data | | | | | | | | | | | | | | | | |
| Net asset value, | | | | | | | | | | | | | | | | |
| beginning of period | | $ 11.21 | | $ 9.93 | | $ | | 7.98 | | $ | | 8.95 | | $ | | 11.09 |
| Income from Investment | | | | | | | | | | | | | | | | |
| Operations | | | | | | | | | | | | | | | | |
| Net investment income | | | | | | | | | | | | | | | | |
| (loss)C | | 09 | | (.02) | | | | .02 | | | | .02 | | | | (.01) |
| Net realized and unre- | | | | | | | | | | | | | | | | |
| alized gain (loss) | | 2.04 | | 1.36 | | | | 1.96 | | | | (.99) | | | | (2.13) |
| Total from investment | | | | | | | | | | | | | | | | |
| operations | | 2.13 | | 1.34 | | | | 1.98 | | | | (.97) | | | | (2.14) |
| Distributions from net | | | | | | | | | | | | | | | | |
| investment income | | — | | (.06) | | | | (.03) | | | | — | | | | — |
| Redemption fees added to | | | | | | | | | | | | | | | | |
| paid in capitalC | | —E | | —E | | | | — | | | | — | | | | — |
| Net asset value, end of | | | | | | | | | | | | | | | | |
| period | | $ 13.34 | | $ 11.21 | | $ | | 9.93 | | $ | | 7.98 | | $ | | 8.95 |
| Total ReturnA,B | | 19.00% | | 13.54% | | | | 24.90% | | | | (10.84)% | | | | (19.30)% |
| Ratios to Average Net AssetsD | | | | | | | | | | | | | | |
| Expenses before ex- | | | | | | | | | | | | | | | | |
| pense reductions | | 2.45% | | 2.70%F | | | | 3.34% | | | | 2.80% | | | | 2.40% |
| Expenses net of volun- | | | | | | | | | | | | | | | | |
| tary waivers, if any | | 1.81% | | 2.00% | | | | 2.00% | | | | 2.20% | | | | 2.25% |
| Expenses net of all | | | | | | | | | | | | | | | | |
| reductions | | 1.70% | | 1.93% | | | | 1.94% | | | | 2.16% | | | | 2.19% |
| Net investment income | | | | | | | | | | | | | | | | |
| (loss) | | 70% | | (.18)% | | | | .24% | | | | .24% | | | | (.10)% |
| Supplemental Data | | | | | | | | | | | | | | | | |
| Net assets, end of | | | | | | | | | | | | | | | | |
| period (000 omitted) | | $ 8,893 | | $ 8,102 | | $ | | 7,628 | | $ 7,079 | | $ | | 9,749 |
| Portfolio turnover rate | | 135% | | 123% | | | | 199% | | | | 137% | | | | 85% |
A Total returns would have been lower had certain expenses not been reduced during the periods shown.
B Total returns do not include the effect of the sales charges.
C Calculated based on average shares outstanding during the period.
D Expense ratios reflect operating expenses of the class. Expenses before reductions do not reflect amounts reimbursed by the investment adviser or reductions from brokerage service arrangements or other expense offset arrangements and do not represent the amount paid by the class during periods when reimbursements or reductions occur. Expenses net of any voluntary waivers reflect expenses after reimbursement by the investment adviser but prior to reductions from brokerage service arrangements or other expense offset arrangements. Expenses net of all reductions repre sent the net expenses paid by the class.
E Amount represents less than $.01 per share.
F As a result of an overaccrual of expenses for the year ended October 31, 2004, the ratio previously reported has been revised from 3.03% to 2.70% . The change had no impact on net investment income, total net assets or total return of the class.
See accompanying notes which are an integral part of the financial statements.
Annual Report 20
| Financial Highlights — Class B | | | | | | | | | | | | | | |
| Years ended October 31, | | 2005 | | 2004 | | | | 2003 | | | | 2002 | | | | 2001 |
| Selected Per-Share Data | | | | | | | | | | | | | | | | |
| Net asset value, | | | | | | | | | | | | | | | | |
| beginning of period | | $ 10.97 | | $ 9.72 | | $ | | 7.82 | | $ | | 8.82 | | $ | | 10.99 |
| Income from Investment | | | | | | | | | | | | | | | | |
| Operations | | | | | | | | | | | | | | | | |
| Net investment income | | | | | | | | | | | | | | | | |
| (loss)C | | 02 | | (.07) | | | | (.02) | | | | (.02) | | | | (.06) |
| Net realized and unre- | | | | | | | | | | | | | | | | |
| alized gain (loss) | | 1.99 | | 1.33 | | | | 1.92 | | | | (.98) | | | | (2.11) |
| Total from investment | | | | | | | | | | | | | | | | |
| operations | | 2.01 | | 1.26 | | | | 1.90 | | | | (1.00) | | | | (2.17) |
| Distributions from net | | | | | | | | | | | | | | | | |
| investment income | | — | | (.01) | | | | — | | | | — | | | | — |
| Redemption fees added to | | | | | | | | | | | | | | | | |
| paid in capitalC | | —E | | —E | | | | — | | | | — | | | | — |
| Net asset value, end of | | | | | | | | | | | | | | | | |
| period | | $ 12.98 | | $ 10.97 | | $ | | 9.72 | | $ | | 7.82 | | $ | | 8.82 |
| Total ReturnA,B | | 18.32% | | 12.97% | | | | 24.30% | | | | (11.34)% | | | | (19.75)% |
| Ratios to Average Net AssetsD | | | | | | | | | | | | | | |
| Expenses before ex- | | | | | | | | | | | | | | | | |
| pense reductions | | 2.94% | | 3.20%F | | | | 3.87% | | | | 3.33% | | | | 2.95% |
| Expenses net of volun- | | | | | | | | | | | | | | | | |
| tary waivers, if any | | 2.32% | | 2.50% | | | | 2.50% | | | | 2.70% | | | | 2.75% |
| Expenses net of all | | | | | | | | | | | | | | | | |
| reductions | | 2.20% | | 2.43% | | | | 2.44% | | | | 2.65% | | | | 2.70% |
| Net investment income | | | | | | | | | | | | | | | | |
| (loss) | | 19% | | (.68)% | | | | (.26)% | | | | (.26)% | | | | (.61)% |
| Supplemental Data | | | | | | | | | | | | | | | | |
| Net assets, end of | | | | | | | | | | | | | | | | |
| period (000 omitted) | | $ 6,415 | | $ 6,288 | | $ | | 5,596 | | $ 5,717 | | $ | | 6,507 |
| Portfolio turnover rate | | 135% | | 123% | | | | 199% | | | | 137% | | | | 85% |
A Total returns would have been lower had certain expenses not been reduced during the periods shown.
B Total returns do not include the effect of the contingent deferred sales charge.
C Calculated based on average shares outstanding during the period.
D Expense ratios reflect operating expenses of the class. Expenses before reductions do not reflect amounts reimbursed by the investment adviser or reductions from brokerage service arrangements or other expense offset arrangements and do not represent the amount paid by the class during periods when reimbursements or reductions occur. Expenses net of any voluntary waivers reflect expenses after reimbursement by the investment adviser but prior to reductions from brokerage service arrangements or other expense offset arrangements. Expenses net of all reductions repre sent the net expenses paid by the class.
E Amount represents less than $.01 per share.
F As a result of an overaccrual of expenses for the year ended October 31, 2004, the ratio previously reported has been revised from 3.54% to 3.20% . The change had no impact on net investment income, total net assets or total return of the class.
See accompanying notes which are an integral part of the financial statements.
21 Annual Report
| Financial Highlights — Class C | | | | | | | | | | | | | | |
| Years ended October 31, | | 2005 | | 2004 | | | | 2003 | | | | 2002 | | | | 2001 |
| Selected Per-Share Data | | | | | | | | | | | | | | | | |
| Net asset value, | | | | | | | | | | | | | | | | |
| beginning of period | | $ 10.98 | | $ 9.73 | | $ | | 7.83 | | $ | | 8.84 | | $ | | 11.01 |
| Income from Investment | | | | | | | | | | | | | | | | |
| Operations | | | | | | | | | | | | | | | | |
| Net investment income | | | | | | | | | | | | | | | | |
| (loss)C | | 03 | | (.07) | | | | (.02) | | | | (.02) | | | | (.06) |
| Net realized and unre- | | | | | | | | | | | | | | | | |
| alized gain (loss) | | 1.99 | | 1.33 | | | | 1.92 | | | | (.99) | | | | (2.11) |
| Total from investment | | | | | | | | | | | | | | | | |
| operations | | 2.02 | | 1.26 | | | | 1.90 | | | | (1.01) | | | | (2.17) |
| Distributions from net | | | | | | | | | | | | | | | | |
| investment income | | — | | (.01) | | | | — | | | | — | | | | — |
| Redemption fees added to | | | | | | | | | | | | | | | | |
| paid in capitalC | | —E | | —E | | | | — | | | | — | | | | — |
| Net asset value, end of | | | | | | | | | | | | | | | | |
| period | | $ 13.00 | | $ 10.98 | | $ | | 9.73 | | $ | | 7.83 | | $ | | 8.84 |
| Total ReturnA,B | | 18.40% | | 12.96% | | | | 24.27% | | | | (11.43)% | | | | (19.71)% |
| Ratios to Average Net AssetsD | | | | | | | | | | | | | | |
| Expenses before ex- | | | | | | | | | | | | | | | | |
| pense reductions | | 2.86% | | 3.08%F | | | | 3.74% | | | | 3.22% | | | | 2.80% |
| Expenses net of volun- | | | | | | | | | | | | | | | | |
| tary waivers, if any | | 2.30% | | 2.50% | | | | 2.50% | | | | 2.71% | | | | 2.75% |
| Expenses net of all | | | | | | | | | | | | | | | | |
| reductions | | 2.19% | | 2.43% | | | | 2.44% | | | | 2.66% | | | | 2.70% |
| Net investment income | | | | | | | | | | | | | | | | |
| (loss) | | 20% | | (.68)% | | | | (.26)% | | | | (.27)% | | | | (.61)% |
| Supplemental Data | | | | | | | | | | | | | | | | |
| Net assets, end of | | | | | | | | | | | | | | | | |
| period (000 omitted) | | $ 4,566 | | $ 3,234 | | $ | | 3,076 | | $ 2,876 | | $ | | 4,393 |
| Portfolio turnover rate | | 135% | | 123% | | | | 199% | | | | 137% | | | | 85% |
A Total returns would have been lower had certain expenses not been reduced during the periods shown.
B Total returns do not include the effect of the contingent deferred sales charge.
C Calculated based on average shares outstanding during the period.
D Expense ratios reflect operating expenses of the class. Expenses before reductions do not reflect amounts reimbursed by the investment adviser or reductions from brokerage service arrangements or other expense offset arrangements and do not represent the amount paid by the class during periods when reimbursements or reductions occur. Expenses net of any voluntary waivers reflect expenses after reimbursement by the investment adviser but prior to reductions from brokerage service arrangements or other expense offset arrangements. Expenses net of all reductions repre sent the net expenses paid by the class.
E Amount represents less than $.01 per share.
F As a result of an overaccrual of expenses for the year ended October 31, 2004, the ratio previously reported has been revised from 3.41% to 3.08% . The change had no impact on net investment income, total net assets or total return of the class.
See accompanying notes which are an integral part of the financial statements.
Annual Report 22
| Financial Highlights — Institutional Class | | | | | | | | |
| Years ended October 31, | | 2005 | | 2004 | | 2003 | | | | 2002 | | | | 2001 |
| Selected Per-Share Data | | | | | | | | | | | | | | |
| Net asset value, | | | | | | | | | | | | | | |
| beginning of period | | $ 11.40 | | $ 10.07 | | $ 8.10 | | $ | | 9.05 | | $ 11.16 |
| Income from Investment | | | | | | | | | | | | | | |
| Operations | | | | | | | | | | | | | | |
| Net investment income | | | | | | | | | | | | | | |
| (loss)B | | 16 | | .04 | | .06 | | | | .07 | | | | .04 |
| Net realized and unre- | | | | | | | | | | | | | | |
| alized gain (loss) | | 2.07 | | 1.37 | | 1.98 | | | | (1.02) | | | | (2.15) |
| Total from investment | | | | | | | | | | | | | | |
| operations | | 2.23 | | 1.41 | | 2.04 | | | | (.95) | | | | (2.11) |
| Distributions from net | | | | | | | | | | | | | | |
| investment income | | — | | (.08) | | (.07) | | | | — | | | | — |
| Redemption fees added to | | | | | | | | | | | | | | |
| paid in capitalB | | —D | | —D | | — | | | | — | | | | — |
| Net asset value, end of | | | | | | | | | | | | | | |
| period | | $ 13.63 | | $ 11.40 | | $ 10.07 | | $ | | 8.10 | | $ | | 9.05 |
| Total ReturnA | | 19.56% | | 14.07% | | 25.39% | | | | (10.50)% | | | | (18.91)% |
| Ratios to Average Net AssetsC | | | | | | | | | | | | |
| Expenses before ex- | | | | | | | | | | | | | | |
| pense reductions | | 1.73% | | 1.95%E | | 2.56% | | | | 2.07% | | | | 1.75% |
| Expenses net of volun- | | | | | | | | | | | | | | |
| tary waivers, if any | | 1.31% | | 1.50% | | 1.50% | | | | 1.71% | | | | 1.75% |
| Expenses net of all | | | | | | | | | | | | | | |
| reductions | | 1.20% | | 1.43% | | 1.44% | | | | 1.66% | | | | 1.69% |
| Net investment income | | | | | | | | | | | | | | |
| (loss) | | 1.20% | | .32% | | .73% | | | | .74% | | | | .40% |
| Supplemental Data | | | | | | | | | | | | | | |
| Net assets, end of | | | | | | | | | | | | | | |
| period (000 omitted) | | $ 566 | | $ 457 | | $ 371 | | $ | | 681 | | $ | | 820 |
| Portfolio turnover rate | | 135% | | 123% | | 199% | | | | 137% | | | | 85% |
A Total returns would have been lower had certain expenses not been reduced during the periods shown.
B Calculated based on average shares outstanding during the period.
C Expense ratios reflect operating expenses of the class. Expenses before reductions do not reflect amounts reimbursed by the investment adviser or reductions from brokerage service arrangements or other expense offset arrangements and do not represent the amount paid by the class during periods when reimbursements or reductions occur. Expenses net of any voluntary waivers reflect expenses after reimbursement by the investment adviser but prior to reductions from brokerage service arrangements or other expense offset arrangements. Expenses net of all reductions repre sent the net expenses paid by the class.
D Amount represents less than $.01 per share.
E As a result of an overaccrual of expenses for the year ended October 31, 2004, the ratio previously reported has been revised from 2.29% to 1.95% . The change had no impact on net investment income, total net assets or total return of the class.
See accompanying notes which are an integral part of the financial statements.
23 Annual Report
Notes to Financial Statements
For the period ended October 31, 2005
|
1. Significant Accounting Policies.
Fidelity Advisor Europe Capital Appreciation Fund (the fund) is a fund of Fidelity Advisor Series VIII (the trust) and is authorized to issue an unlimited number of shares. The trust is registered under the Investment Company Act of 1940, as amended (the 1940 Act), as an open-end management investment company organized as a Massachusetts business trust.
The fund offers Class A, Class T, Class B, Class C, and Institutional Class shares, each of which has equal rights as to assets and voting privileges. Each class has exclusive voting rights with respect to matters that affect that class. Class B shares will automatically convert to Class A shares after a holding period of seven years from the initial date of purchase. Investment income, realized and unrealized capital gains and losses, the common expenses of the fund, and certain fund-level expense reductions, if any, are allocated on a pro rata basis to each class based on the relative net assets of each class to the total net assets of the fund. Each class differs with respect to transfer agent and distribution and service plan fees incurred. Certain expense reductions also differ by class.
The fund may invest in affiliated money market central funds (Money Market Central Funds) which are open-end investment companies available to investment companies and other accounts managed by Fidelity Management & Research Company (FMR) and its affiliates. The financial statements have been prepared in conformity with accounting principles generally accepted in the United States of America, which require management to make certain estimates and assumptions at the date of the financial statements. The following summarizes the significant accounting policies of the fund:
Security Valuation. Investments are valued and net asset value (NAV) per share is calculated (NAV calculation) as of the close of business of the New York Stock Exchange (NYSE), normally 4:00 p.m. Eastern time. Wherever possible, the fund uses independent pricing services approved by the Board of Trustees to value its investments.
Equity securities, including restricted securities, for which market quotations are readily available, are valued at the last reported sale price or official closing price as reported by an independent pricing service on the primary market or exchange on which they are traded. In the event there were no sales during the day or closing prices are not available, securities are valued at the last quoted bid price. Investments in open-end mutual funds, are valued at their closing net asset value each business day. Short-term securities with remaining maturities of sixty days or less for which quotations are not readily available are valued at amortized cost, which approximates value.
When current market prices or quotations are not readily available or do not accurately reflect fair value, valuations may be determined in accordance with procedures adopted by the Board of Trustees. For example, when developments occur between the close of a
1. Significant Accounting Policies - continued
Security Valuation - continued
market and the close of the NYSE that may materially affect the value of some or all of the securities, or when trading in a security is halted, those securities may be fair valued. Factors used in the determination of fair value may include monitoring news to identify significant market or security specific events such as changes in the value of U.S. securities market, reviewing developments in foreign markets and evaluating the performance of ADRs, futures contracts and exchange-traded funds. Because the fund’s utilization of fair value pricing depends on market activity, the frequency with which fair value pricing is used can not be predicted and may be utilized to a significant extent. The value of securities used for NAV calculation under fair value pricing may differ from published prices for the same securities.
Foreign Currency. The fund uses foreign currency contracts to facilitate transactions in foreign-denominated securities. Losses from these transactions may arise from changes in the value of the foreign currency or if the counterparties do not perform under the contracts’ terms.
Foreign-denominated assets, including investment securities, and liabilities are translated into U.S. dollars at the exchange rate at period end. Purchases and sales of investment securities, income and dividends received and expenses denominated in foreign currencies are translated into U.S. dollars at the exchange rate in effect on the transaction date.
The effects of exchange rate fluctuations on investments are included with the net realized and unrealized gain (loss) on investment securities. Other foreign currency transactions resulting in realized and unrealized gain (loss) are disclosed separately.
Investment Transactions and Income. Security transactions are accounted for as of trade date. Gains and losses on securities sold are determined on the basis of identified cost. Dividend income is recorded on the ex-dividend date, except for certain dividends from foreign securities where the ex-dividend date may have passed, which are recorded as soon as the fund is informed of the ex-dividend date. Non-cash dividends included in dividend income, if any, are recorded at the fair market value of the securities received. Interest income is accrued as earned. Interest income includes coupon interest and amortization of premium and accretion of discount on debt securities. Investment income is recorded net of foreign taxes withheld where recovery of such taxes is uncertain.
Expenses. Most expenses of the trust can be directly attributed to a fund. Expenses which cannot be directly attributed are apportioned among each fund in the trust.
25 Annual Report
Notes to Financial Statements - continued
1. Significant Accounting Policies - continued
Income Tax Information and Distributions to Shareholders. Each year, the fund intends to qualify as a regulated investment company by distributing all of its taxable income and realized gains under Subchapter M of the Internal Revenue Code. As a result, no provision for income taxes is required in the accompanying financial statements. Foreign taxes are provided for based on the fund’s understanding of the tax rules and rates that exist in the foreign markets in which it invests.
Distributions are recorded on the ex-dividend date. Income dividends and capital gain distributions are declared separately for each class. Income and capital gain distributions are determined in accordance with income tax regulations, which may differ from generally accepted accounting principles. In addition, the fund will claim a portion of the payment made to redeeming shareholders as a distribution for income tax purposes.
Capital accounts within the financial statements are adjusted for permanent book-tax differences. These adjustments have no impact on net assets or the results of operations. Temporary book-tax differences will reverse in a subsequent period.
Book-tax differences are primarily due to foreign currency transactions, passive foreign investment companies (PFIC), capital loss carryforwards and losses deferred due to wash sales.
The tax-basis components of distributable earnings and the federal tax cost as of period end were as follows:
| Unrealized appreciation | | $ | | 2,410,526 | | | | |
| Unrealized depreciation | | | | (740,156) | | | | |
| Net unrealized appreciation (depreciation) . | | | | 1,670,370 | | | | |
| Undistributed ordinary income | | | | 110,905 | | | | |
| Undistributed long-term capital gain | | | | 418,112 | | | | |
| |
| Cost for federal income tax purposes | | $ | | 23,650,972 | | | | |
| |
| The tax character of distributions paid was as follows: | | | | |
| | | | | October 31, 2005 | | | | October 31, 2004 |
| Ordinary Income | | $ | | — | | $ | | 86,506 |
Short-Term Trading (Redemption) Fees. Shares held in the fund less than 30 days are subject to a redemption fee equal to 1.00% of the proceeds of the redeemed shares. All redemption fees, including any estimated redemption fees paid by FMR, are retained by the fund and accounted for as an addition to paid in capital.
Repurchase Agreements. FMR has received an Exemptive Order from the Securities and Exchange Commission (the SEC) which permits the fund and other affiliated entities of FMR to transfer uninvested cash balances into joint trading accounts which are then invested in repurchase agreements. The fund may also invest directly with institutions in repurchase agreements. Repurchase agreements are collateralized by government or non-government securities. Collateral is held in segregated accounts with custodian banks and may be obtained in the event of a default of the counterparty. The fund monitors, on a daily basis, the value of the collateral to ensure it is at least equal to the principal amount of the repurchase agreement (including accrued interest). In the event of a default by the counterparty, realization of the collateral proceeds could be delayed, during which time the value of the collateral may decline.
3. Purchases and Sales of Investments.
Purchases and sales of securities, other than short-term securities and U.S. government securities, aggregated $30,849,970 and $31,058,872, respectively.
4. Fees and Other Transactions with Affiliates.
Management Fee. FMR and its affiliates provide the fund with investment management related services for which the fund pays a monthly management fee. The management fee is the sum of an individual fund fee rate that is based on an annual rate of .45% of the fund’s average net assets and a group fee rate that averaged .27% during the period. The group fee rate is based upon the average net assets of all the mutual funds advised by FMR. The group fee rate decreases as assets under management increase and increases as assets under management decrease. For the period, the total annual management fee rate was .72% of the fund’s average net assets.
Distribution and Service Plan. In accordance with Rule 12b-1 of the 1940 Act, the fund has adopted separate Distribution and Service Plans for each class of shares. Certain classes pay Fidelity Distributors Corporation (FDC), an affiliate of FMR, separate Distribution and Service Fees, each of which is based on an annual percentage of each class’ average net assets. In addition, FDC may pay financial intermediaries for selling shares of the fund and providing shareholder support services.
27 Annual Report
Notes to Financial Statements - continued
4. Fees and Other Transactions with Affiliates - continued
Distribution and Service Plan - continued
For the period, the Distribution and Service Fee rates and the total amounts paid to and retained by FDC were as follows:
| | | Distribution | | Service | | | | Paid to | | | | Retained |
| | | Fee | | Fee | | | | FDC | | | | by FDC |
| Class A | | 0% | | .25% | | $ | | 9,215 | | $ | | 6 |
| Class T | | 25% | | .25% | | | | 44,396 | | | | 36 |
| Class B | | 75% | | .25% | | | | 66,850 | | | | 50,151 |
| Class C | | 75% | | .25% | | | | 42,185 | | | | 6,301 |
| | | | | | | $ | | 162,646 | | $ | | 56,494 |
Sales Load. FDC receives a front-end sales charge of up to 5.75% for selling Class A shares, and 3.50% for selling Class T shares, some of which is paid to financial intermediaries for selling shares of the fund. FDC receives the proceeds of contingent deferred sales charges levied on Class A, Class T, Class B, and Class C redemptions. These charges depend on the holding period. The deferred sales charges range from 5% to 1% for Class B, 1% for Class C, and .25% for certain purchases of Class A and Class T shares.
| For the period, sales charge amounts retained by FDC were as follows: | | | | |
| | | | | Retained |
| | | | | by FDC |
| Class A | | $ | | 5,182 |
| Class T | | | | 2,431 |
| Class B* | | | | 14,338 |
| Class C* | | | | 1,365 |
| | | $ | | 23,316 |
* When Class B and Class C shares are initially sold, FDC pays commissions from its own resources to financial intermediaries through which the sales are made.
Transfer Agent Fees. Fidelity Investments Institutional Operations Company, Inc. (FIIOC), an affiliate of FMR, is the transfer, dividend disbursing and shareholder servicing agent for each class of the fund. FIIOC receives account fees and asset-based fees that vary according to the account size and type of account of the shareholders of the
4. Fees and Other Transactions with Affiliates - continued
Transfer Agent Fees - continued
respective classes of the fund. FIIOC pays for typesetting, printing and mailing of shareholder reports, except proxy statements. For the period the total transfer agent fees paid by each class to FIIOC, were as follows:
| | | | | | | % of |
| | | | | | | Average |
| | | | | Amount | | Net Assets |
| Class A | | $ | | 15,648 | | .42 |
| Class T | | | | 39,437 | | .44 |
| Class B | | | | 28,121 | | .42 |
| Class C | | | | 16,115 | | .38 |
| Institutional Class | | | | 1,239 | | .23 |
| | | $ | | 100,560 | | |
Accounting and Security Lending Fees. Fidelity Service Company, Inc. (FSC), an affiliate of FMR, maintains the fund’s accounting records. The accounting fee is based on the level of average net assets for the month. Under a separate contract, FSC administers the security lending program. The security lending fee is based on the number and duration of lending transactions.
Affiliated Central Funds. The fund may invest in Money Market Central Funds which seek preservation of capital and current income and are managed by Fidelity Investments Money Management, Inc. (FIMM), an affiliate of FMR.
The Money Market Central Funds do not pay a management fee. Income distributions earned by the fund are recorded as income in the accompanying financial statements and totaled $31,174 for the period.
Brokerage Commissions. The fund placed a portion of its portfolio transactions with brokerage firms which are affiliates of the investment adviser. The commissions paid to these affiliated firms were $317 for the period.
5. Committed Line of Credit.
|
The fund participates with other funds managed by FMR in a $4.2 billion credit facility (the “line of credit”) to be utilized for temporary or emergency purposes to fund shareholder redemptions or for other short-term liquidity purposes. The fund has agreed to pay commitment fees on its pro rata portion of the line of credit. During the period, there were no borrowings on this line of credit.
29 Annual Report
Notes to Financial Statements - continued
6. Security Lending.
The fund lends portfolio securities from time to time in order to earn additional income. The fund receives collateral (in the form of U.S. Treasury obligations, letters of credit and/or cash) against the loaned securities and maintains collateral in an amount not less than 100% of the market value of the loaned securities during the period of the loan. The market value of the loaned securities is determined at the close of business of the fund and any additional required collateral is delivered to the fund on the next business day. If the borrower defaults on its obligation to return the securities loaned because of insolvency or other reasons, a fund could experience delays and costs in recovering the securities loaned or in gaining access to the collateral. Cash collateral is invested in the Fidelity Securities Lending Cash Central Fund. At period end there were no security loans outstanding. Security lending income represents the income earned on investing cash collateral, less fees and expenses associated with the loan, plus any premium payments that may be received on the loan of certain types of securities.
FMR voluntarily agreed to reimburse each class to the extent annual operating expenses exceeded certain levels of average net assets as noted in the table below. Some expenses, for example interest expense, are excluded from this reimbursement.
| The following classes were in reimbursement during the period | | | | |
| | | Expense | | | | Reimbursement |
| | | Limitations | | | | from adviser |
| Class A | | 1.75%--1.50%* | | $ | | 22,236 |
| Class T | | 2.00%--1.75%* | | | | 57,047 |
| Class B | | 2.50%--2.25%* | | | | 41,774 |
| Class C | | 2.50%--2.25%* | | | | 23,584 |
| Institutional Class | | 1.50%--1.25%* | | | | 2,626 |
| | | | | $ | | 147,267 |
| |
| * Expense limitation in effect at period end. | | | | | | |
Many of the brokers with whom FMR places trades on behalf of the fund provided services to the fund in addition to trade execution. These services included payments of certain expenses on behalf of the fund totaling $26,725 for the period.
The fund’s organizational documents provide former and current trustees and officers with a limited indemnification against liabilities arising in connection with the performance of their duties to the fund. In the normal course of business, the fund may also enter into contracts that provide general indemnifications. The fund’s maximum exposure under these arrangements is unknown as this would be dependent on future claims that may be made against the fund. The risk of material loss from such claims is considered remote.
| 9. Distributions to Shareholders. | | | | | | |
| |
| Distributions to shareholders of each class were as follows: | | | | | | |
| Years ended October 31, | | 2005 | | | | | | 2004 |
| From net investment income | | | | | | | | |
| Class A | | $ | | — | | $ | | 28,050 |
| Class T | | | | — | | | | 46,077 |
| Class B | | | | — | | | | 5,801 |
| Class C | | | | — | | | | 3,213 |
| Institutional Class | | | | — | | | | 3,365 |
| Total | | $ | | — | | $ | | 86,506 |
31 Annual Report
| Notes to Financial Statements - continued | | | | | | |
| |
| |
| 10. Share Transactions. | | | | | | | | | | |
| |
| Transactions for each class of shares were as follows: | | | | | | | | |
| | | Shares | | | | | | Dollars | | |
| Years ended October 31, | | 2005 | | 2004 | | | | 2005 | | | | 2004 |
| Class A | | | | | | | | | | | | |
| Shares sold | | 142,065 | | 337,527 | | $ | | 1,846,794 | | $ | | 3,769,229 |
| Reinvestment of | | | | | | | | | | | | |
| distributions | | — | | 2,412 | | | | — | | | | 25,135 |
| Shares redeemed | | (61,807) | | (417,543) | | | | (785,579) | | | | (4,586,475) |
| Net increase (decrease) . | | 80,258 | | (77,604) | | $ | | 1,061,215 | | $ | | (792,111) |
| Class T | | | | | | | | | | | | |
| Shares sold | | 181,461 | | 135,665 | | $ | | 2,307,799 | | $ | | 1,489,738 |
| Reinvestment of | | | | | | | | | | | | |
| distributions | | — | | 4,315 | | | | — | | | | 44,751 |
| Shares redeemed | | (237,354) | | (185,482) | | | | (3,017,826) | | | | (2,011,588) |
| Net increase (decrease) . | | (55,893) | | (45,502) | | $ | | (710,027) | | $ | | (477,099) |
| Class B | | | | | | | | | | | | |
| Shares sold | | 100,137 | | 121,537 | | $ | | 1,230,979 | | $ | | 1,299,582 |
| Reinvestment of | | | | | | | | | | | | |
| distributions | | — | | 522 | | | | — | | | | 5,324 |
| Shares redeemed | | (179,115) | | (124,715) | | | | (2,234,526) | | | | (1,346,950) |
| Net increase (decrease) . | | (78,978) | | (2,656) | | $ | | (1,003,547) | | $ | | (42,044) |
| Class C | | | | | | | | | | | | |
| Shares sold | | 158,915 | | 74,022 | | $ | | 2,022,824 | | $ | | 796,896 |
| Reinvestment of | | | | | | | | | | | | |
| distributions | | — | | 244 | | | | — | | | | 2,495 |
| Shares redeemed | | (102,054) | | (95,858) | | | | (1,269,222) | | | | (1,022,292) |
| Net increase (decrease) . | | 56,861 | | (21,592) | | $ | | 753,602 | | $ | | (222,901) |
| Institutional Class | | | | | | | | | | | | |
| Shares sold | | 6,137 | | 37,290 | | $ | | 77,208 | | $ | | 413,160 |
| Reinvestment of | | | | | | | | | | | | |
| distributions | | — | | 287 | | | | — | | | | 3,019 |
| Shares redeemed | | (4,745) | | (34,275) | | | | (59,669) | | | | (385,973) |
| Net increase (decrease) . | | 1,392 | | 3,302 | | $ | | 17,539 | | $ | | 30,206 |
Report of Independent Registered Public Accounting Firm
To the Trustees of Fidelity Advisor Series VIII and Shareholders of Fidelity Advisor Europe Capital Appreciation Fund:
We have audited the accompanying statement of assets and liabilities of Fidelity Advisor Europe Capital Appreciation Fund (the Fund), a fund of Fidelity Advisor Series VIII, including the schedule of investments, as of October 31, 2005, and the related statement of operations for the year then ended, the statement of changes in net assets for each of the two years in the period then ended, and the financial highlights for each of the five years in the period then ended. These financial statements and financial highlights are the responsibility of the Fund’s management. Our responsibility is to express an opinion on these financial statements and financial highlights based on our audits.
We conducted our audits in accordance with standards of the Public Company Accounting Oversight Board (United States). Those standards require that we plan and perform the audit to obtain reasonable assurance about whether the financial statements and financial highlights are free of material misstatement. The Fund is not required to have, nor were we engaged to perform, an audit of its internal control over financial reporting. Our audits included consideration of internal control over financial reporting as a basis for designing audit procedures that are appropriate in the circumstances, but not for the purpose of expressing an opinion on the effectiveness of the Fund’s internal control over financial reporting. Accordingly, we express no such opinion. An audit also includes examining, on a test basis, evidence supporting the amounts and disclosures in the financial statements, assessing the accounting principles used and significant estimates made by management, as well as evaluating the overall financial statement presentation. Our procedures included confirmation of securities owned as of October 31, 2005, by correspondence with the custodians and brokers; where replies were not received from brokers, we performed other auditing procedures. We believe that our audits provide a reasonable basis for our opinion.
In our opinion, the financial statements and financial highlights referred to above present fairly, in all material respects, the financial position of Fidelity Advisor Europe Capital Appreciation Fund as of October 31, 2005, the results of its operations for the year then ended, the changes in its net assets for each of the two years in the period then ended, and its financial highlights for each of the five years in the period then ended, in conformity with accounting principles generally accepted in the United States of America.
DELOITTE & TOUCHE LLP Boston, Massachusetts December 22, 2005
33 Annual Report
Trustees and Officers
The Trustees, Members of the Advisory Board, and executive officers of the trust and fund, as applicable, are listed below. The Board of Trustees governs the fund and is responsible for protecting the interests of shareholders. The Trustees are experienced executives who meet periodically throughout the year to oversee the fund’s activities, review contractual arrangements with companies that provide services to the fund, and review the fund’s performance. Except for William O. McCoy, Stephen P. Jonas, and Kenneth L. Wolfe, each of the Trustees oversees 322 funds advised by FMR or an affiliate. Mr. McCoy oversees 324 funds advised by FMR or an affiliate. Mr. Jonas and Mr. Wolfe oversee 319 funds advised by FMR or an affiliate.
The Trustees hold office without limit in time except that (a) any Trustee may resign; (b) any Trustee may be removed by written instrument, signed by at least two-thirds of the number of Trustees prior to such removal; (c) any Trustee who requests to be retired or who has become incapacitated by illness or injury may be retired by written instrument signed by a majority of the other Trustees; and (d) any Trustee may be removed at any special meeting of shareholders by a two-thirds vote of the outstanding voting securities of the trust. Each Trustee who is not an interested person (as defined in the 1940 Act) (Independent Trustee), shall retire not later than the last day of the calendar year in which his or her 72nd birthday occurs. The Independent Trustees may waive this mandatory retirement age policy with respect to individual Trustees. The executive officers and Advisory Board Members hold office without limit in time, except that any officer and Advisory Board Member may resign or may be removed by a vote of a majority of the Trustees at any regular meeting or any special meeting of the Trustees. Except as indicated, each individual has held the office shown or other offices in the same company for the past five years.
The fund’s Statement of Additional Information (SAI) includes more information about the Trustees. To request a free copy, call Fidelity at 1-877-208-0098.
Interested Trustees*:
Correspondence intended for each Trustee who is an interested person may be sent to Fidelity Investments, 82 Devonshire Street, Boston, Massachusetts 02109.
| Name, Age; Principal Occupation |
| |
| Edward C. Johnson 3d (75)** |
| |
| Year of Election or Appointment: 1983 |
| Mr. Johnson is Chairman of the Board of Trustees. Mr. Johnson serves as |
| Chief Executive Officer, Chairman, and a Director of FMR Corp.; a Di- |
| rector and Chairman of the Board and of the Executive Committee of |
| FMR; Chairman and a Director of Fidelity Management & Research (Far |
| East) Inc.; Chairman and a Director of Fidelity Investments Money Man- |
| agement, Inc.; and Chairman (2001-present) and a Director |
| (2000-present) of FMR Co., Inc. |
Annual Report 34
| Name, Age; Principal Occupation |
| |
| Abigail P. Johnson (43)** |
| |
| Year of Election or Appointment: 2001 |
| Ms. Johnson serves as President of Fidelity Employer Services Company |
| (FESCO) (2005-present). She is President and a Director of Fidelity In- |
| vestments Money Management, Inc. (2001-present), FMR Co., Inc. |
| (2001-present), and a Director of FMR Corp. Previously, Ms. Johnson |
| served as President and a Director of FMR (2001-2005), Senior Vice |
| President of the Fidelity funds (2001-2005), and managed a number of |
| Fidelity funds. |
| |
| Stephen P. Jonas (52) |
| |
| Year of Election or Appointment: 2005 |
| Mr. Jonas is Senior Vice President of Advisor Europe Capital Appreci- |
| ation (2005-present). He also serves as Senior Vice President of other |
| Fidelity funds (2005-present). Mr. Jonas is Executive Director of FMR |
| (2005-present). Previously, Mr. Jonas served as President of Fidelity En- |
| terprise Operations and Risk Services (2004-2005), Chief Administra- |
| tive Officer (2002-2004), and Chief Financial Officer of FMR Co. |
| (1998-2000). Mr. Jonas has been with Fidelity Investments since 1987 |
| and has held various financial and management positions including |
| Chief Financial Officer of FMR. In addition, he serves on the Boards of |
| Boston Ballet (2003-present) and Simmons College (2003-present). |
| |
| Robert L. Reynolds (53) |
| |
| Year of Election or Appointment: 2003 |
| Mr. Reynolds is a Director (2003-present) and Chief Operating Officer |
| (2002-present) of FMR Corp. He also serves on the Board at Fidelity |
| Investments Canada, Ltd. (2000-present). Previously, Mr. Reynolds |
| served as President of Fidelity Investments Institutional Retirement Group |
| (1996-2000). |
* Trustees have been determined to be “Interested Trustees” by virtue of, among other things, their affiliation with the trust or various entities under common control with FMR.
** Edward C. Johnson 3d, Trustee, is Abigail P. Johnson’s father.
35 Annual Report
Trustees and Officers - continued
Independent Trustees:
Correspondence intended for each Independent Trustee (that is, the Trustees other than the Interested Trustees) may be sent to Fidelity Investments, P.O. Box 55235, Boston, Massachusetts 02205-5235.
| Name, Age; Principal Occupation |
| |
| Dennis J. Dirks (57) |
| |
| Year of Election or Appointment: 2005 |
| Prior to his retirement in May 2003, Mr. Dirks was Chief Operating |
| Officer and a member of the Board of The Depository Trust & Clearing |
| Corporation (DTCC) (1999-2003). He also served as President, Chief |
| Operating Officer, and Board member of The Depository Trust Com- |
| pany (DTC) (1999-2003) and President and Board member of the |
| National Securities Clearing Corporation (NSCC) (1999-2003). In addi- |
| tion, Mr. Dirks served as Chief Executive Officer and Board member of |
| the Government Securities Clearing Corporation (2001-2003) and Chief |
| Executive Officer and Board member of the Mortgage-Backed Securities |
| Clearing Corporation (2001-2003). Mr. Dirks also serves as a Trustee of |
| Manhattan College (2005-present). |
| |
| Robert M. Gates (62) |
| |
| Year of Election or Appointment: 1997 |
| Dr. Gates is Vice Chairman of the Independent Trustees (2005-present). |
| Dr. Gates is President of Texas A&M University (2002-present). He was |
| Director of the Central Intelligence Agency (CIA) from 1991 to 1993. |
| From 1989 to 1991, Dr. Gates served as Assistant to the President of |
| the United States and Deputy National Security Advisor. Dr. Gates is a |
| Director of NACCO Industries, Inc. (mining and manufacturing), Parker |
| Drilling Co., Inc. (drilling and rental tools for the energy industry, |
| 2001-present), and Brinker International (restaurant management, |
| 2003-present). Previously, Dr. Gates served as a Director of LucasVarity |
| PLC (automotive components and diesel engines), a Director of TRW Inc. |
| (automotive, space, defense, and information technology), and Dean of |
| the George Bush School of Government and Public Service at Texas |
| A&M University (1999-2001). Dr. Gates also is a Trustee of the Forum |
| for International Policy. |
Annual Report 36
| Name, Age; Principal Occupation |
| |
| George H. Heilmeier (69) |
| |
| Year of Election or Appointment: 2004 |
| Dr. Heilmeier is Chairman Emeritus of Telcordia Technologies (commu- |
| nication software and systems), where prior to his retirement, he served |
| as company Chairman and Chief Executive Officer. He currently serves |
| on the Boards of Directors of The Mitre Corporation (systems engineer- |
| ing and information technology support for the government), and HRL |
| Laboratories (private research and development, 2004-present). He is |
| Chairman of the General Motors Science & Technology Advisory Board |
| and a Life Fellow of the Institute of Electrical and Electronics Engineers |
| (IEEE) (2000-present). Dr. Heilmeier is a member of the Defense Science |
| Board and the National Security Agency Advisory Board. He is also a |
| member of the National Academy of Engineering, the American |
| Academy of Arts and Sciences, and the Board of Overseers of the |
| School of Engineering and Applied Science of the University of Pennsyl- |
| vania. Previously, Dr. Heilmeier served as a Director of TRW Inc. (auto- |
| motive, space, defense, and information technology, 1992-2002), |
| Compaq (1994-2002), Automatic Data Processing, Inc. (ADP) |
| (technology-based business outsourcing, 1995-2002), INET Technolo- |
| gies Inc. (telecommunications network surveillance, 2001-2004), and |
| Teletech Holdings (customer management services). He is the recipient of |
| the 2005 Kyoto Prize in Advanced Technology for his invention of the |
| liquid display. |
| |
| Marie L. Knowles (59) |
| |
| Year of Election or Appointment: 2001 |
| Prior to Ms. Knowles’ retirement in June 2000, she served as Executive |
| Vice President and Chief Financial Officer of Atlantic Richfield Company |
| (ARCO) (diversified energy, 1996-2000). From 1993 to 1996, she was |
| a Senior Vice President of ARCO and President of ARCO Transportation |
| Company. She served as a Director of ARCO from 1996 to 1998. She |
| currently serves as a Director of Phelps Dodge Corporation (copper |
| mining and manufacturing) and McKesson Corporation (healthcare ser- |
| vice, 2002-present). Ms. Knowles is a Trustee of the Brookings Institution |
| and the Catalina Island Conservancy and also serves as a member of |
| the Advisory Board for the School of Engineering of the University of |
| Southern California. |
37 Annual Report
Trustees and Officers - continued
| Name, Age; Principal Occupation |
| |
| Ned C. Lautenbach (61) |
| |
| Year of Election or Appointment: 2000 |
| Mr. Lautenbach has been a partner of Clayton, Dubilier & Rice, Inc. |
| (private equity investment firm) since September 1998. Previously, Mr. |
| Lautenbach was with the International Business Machines Corporation |
| (IBM) from 1968 until his retirement in 1998. Mr. Lautenbach serves as |
| a Director of Italtel Holding S.p.A. (telecommunications (Milan, Italy), |
| 2004-present) and Eaton Corporation (diversified industrial) as well as |
| the Philharmonic Center for the Arts in Naples, Florida. He also is a |
| member of the Board of Trustees of Fairfield University (2005-present), |
| as well as a member of the Council on Foreign Relations. |
| |
| Marvin L. Mann (72) |
| |
| Year of Election or Appointment: 1993 |
| Mr. Mann is Chairman of the Independent Trustees (2001-present). He is |
| Chairman Emeritus of Lexmark International, Inc. (computer |
| peripherals), where he served as CEO until April 1998, retired as |
| Chairman May 1999, and remains a member of the Board. Prior to |
| 1991, he held the positions of Vice President of International Business |
| Machines Corporation (IBM) and President and General Manager of |
| various IBM divisions and subsidiaries. He is a member of the Executive |
| Committee of the Independent Director’s Council of the Investment Com- |
| pany Institute. In addition, Mr. Mann is a member of the President’s |
| Cabinet at the University of Alabama and the Board of Visitors of the |
| Culverhouse College of Commerce and Business Administration at the |
| University of Alabama. |
| |
| William O. McCoy (72) |
| |
| Year of Election or Appointment: 1997 |
| Prior to his retirement in December 1994, Mr. McCoy was Vice Chair- |
| man of the Board of BellSouth Corporation (telecommunications) and |
| President of BellSouth Enterprises. He is currently a Director of Liberty |
| Corporation (holding company), Duke Realty Corporation (real estate), |
| and Progress Energy, Inc. (electric utility). He is also a partner of Frank- |
| lin Street Partners (private investment management firm) and a member |
| of the Research Triangle Foundation Board. In addition, Mr. McCoy |
| served as the Interim Chancellor (1999-2000) and a member of the |
| Board of Visitors for the University of North Carolina at Chapel Hill and |
| currently serves on the Board of Directors of the University of North |
| Carolina Health Care System and the Board of Visitors of the Kenan- |
| Flagler Business School (University of North Carolina at Chapel Hill). He |
| also served as Vice President of Finance for the University of North Car- |
| olina (16-school system). |
Annual Report 38
| Name, Age; Principal Occupation |
| |
| Cornelia M. Small (61) |
| |
| Year of Election or Appointment: 2005 |
| Ms. Small is a member (2000-present) and Chairperson (2002-present) |
| of the Investment Committee, and a member (2002-present) of the |
| Board of Trustees of Smith College. Previously, she served as Chief In- |
| vestment Officer (1999-2000), Director of Global Equity Investments |
| (1996-1999), and a member of the Board of Directors of Scudder, |
| Stevens & Clark (1990-1997) and Scudder Kemper Investments |
| (1997-1998). In addition, Ms. Small served as Co-Chair (2000-2003) |
| of the Annual Fund for the Fletcher School of Law and Diplomacy. |
| |
| William S. Stavropoulos (66) |
| |
| Year of Election or Appointment: 2001 |
| Mr. Stavropoulos is Chairman of the Board (2000-present) and a Mem- |
| ber of the Board of Directors of The Dow Chemical Company. Since |
| joining The Dow Chemical Company in 1967, Mr. Stavropoulos served |
| in numerous senior management positions, including President |
| (1993-2000; 2002-2003), CEO (1995-2000; 2002-2004), and Chair- |
| man of the Executive Committee (2000-2004). Currently, he is a Direc- |
| tor of NCR Corporation (data warehousing and technology solutions), |
| BellSouth Corporation (telecommunications), Chemical Financial Corpo- |
| ration, Maersk Inc. (industrial conglomerate, 2002-present), and Metal- |
| mark Capital (private equity investment firm, 2005-present). He also |
| serves as a member of the Board of Trustees of the American Enterprise |
| Institute for Public Policy Research. In addition, Mr. Stavropoulos is a |
| member of The Business Council, J.P. Morgan International Council and |
| the University of Notre Dame Advisory Council for the College of |
| Science. |
| |
| Kenneth L. Wolfe (66) |
| |
| Year of Election or Appointment: 2005 |
| Mr. Wolfe also serves as a Trustee (2005-present) or Member of the |
| Advisory Board (2004-present) of other investment companies advised |
| by FMR. Prior to his retirement in 2001, Mr. Wolfe was Chairman and |
| Chief Executive Officer of Hershey Foods Corporation (1993-2001). He |
| currently serves as a member of the boards of Adelphia Communica- |
| tions Corporation (2003-present), Bausch & Lomb, Inc., and Revlon Inc. |
| (2004-present). |
39 Annual Report
Trustees and Officers - continued
Advisory Board Members and Executive Officers:
Correspondence intended for Mr. Gamper may be sent to Fidelity Investments, P.O. Box 55235, Boston, Massachusetts 02205-5235. Correspondence intended for each executive officer and Mr. Lynch may be sent to Fidelity Investments, 82 Devonshire Street, Boston, Massachusetts 02109.
| Name, Age; Principal Occupation |
| |
| Albert R. Gamper, Jr. (63) |
| |
| Year of Election or Appointment: 2005 |
| Member of the Advisory Board of Fidelity Advisor Series VIII. Prior to his |
| retirement in December 2004, Mr. Gamper served as Chairman of the |
| Board of CIT Group Inc. (commercial finance). During his tenure with |
| CIT Group Inc. Mr. Gamper served in numerous senior management |
| positions, including Chairman (1987-1989; 1999-2001; 2002-2004), |
| Chief Executive Officer (1987-2004), and President (1989-2002). He |
| currently serves as a member of the Board of Directors of Public Service |
| Enterprise Group (utilities, 2001-present), Chairman of the Board of |
| Governors, Rutgers University (2004-present), and Chairman of the |
| Board of Saint Barnabas Health Care System. |
| |
| Peter S. Lynch (61) |
| |
| Year of Election or Appointment: 2003 |
| Member of the Advisory Board of Fidelity Advisor Series VIII. Vice |
| Chairman and a Director of FMR, and Vice Chairman (2001-present) |
| and a Director (2000-present) of FMR Co., Inc. Previously, Mr. Lynch |
| served as a Trustee of the Fidelity funds (1990-2003). In addition, he |
| serves as a Trustee of Boston College, Massachusetts Eye & Ear |
| Infirmary, Historic Deerfield, John F. Kennedy Library, and the Museum |
| of Fine Arts of Boston. |
| |
| Dwight D. Churchill (51) |
| |
| Year of Election or Appointment: 2005 |
| Vice President of Advisor Europe Capital Appreciation. Mr. Churchill |
| also serves as Vice President of certain Equity Funds (2005-present) and |
| certain High Income Funds (2005-present). Previously, he served as |
| Head of Fidelity’s Fixed-Income Division (2000-2005), Vice President of |
| Fidelity’s Money Market Funds (2000-2005), Vice President of Fidelity’s |
| Bond Funds, and Senior Vice President of FIMM (2000) and FMR. Mr. |
| Churchill joined Fidelity in 1993 as Vice President and Group Leader of |
| Taxable Fixed-Income Investments. |
Annual Report 40
| Name, Age; Principal Occupation |
| |
| Ian R. Hart (38) |
| |
| Year of Election or Appointment: 2001 |
| Vice President of Advisor Europe Capital Appreciation. Mr. Hart serves |
| as Vice President of other funds advised by FMR. Prior to assuming his |
| current responsibilities, Mr. Hart managed a variety of Fidelity funds. |
| Mr. Hart also serves as Vice President of FMR (2002) and FMR Co., Inc. |
| (2002). |
| |
| Eric D. Roiter (56) |
| |
| Year of Election or Appointment: 1998 |
| Secretary of Advisor Europe Capital Appreciation. He also serves as |
| Secretary of other Fidelity funds; Vice President, General Counsel, and |
| Secretary of FMR Co., Inc. (2001-present) and FMR; Assistant Secretary |
| of Fidelity Management & Research (U.K.) Inc. (2001-present), Fidelity |
| Management & Research (Far East) Inc. (2001-present), and Fidelity |
| Investments Money Management, Inc. (2001-present). Mr. Roiter is an |
| Adjunct Member, Faculty of Law, at Boston College Law School |
| (2003-present). Previously, Mr. Roiter served as Vice President and |
| Secretary of Fidelity Distributors Corporation (FDC) (1998-2005). |
| |
| Stuart Fross (46) |
| |
| Year of Election or Appointment: 2003 |
| Assistant Secretary of Advisor Europe Capital Appreciation. Mr. Fross |
| also serves as Assistant Secretary of other Fidelity funds (2003-present), |
| Vice President and Secretary of FDC (2005-present), and is an em- |
| ployee of FMR. |
| |
| Christine Reynolds (47) |
| |
| Year of Election or Appointment: 2004 |
| President, Treasurer, and Anti-Money Laundering (AML) officer of Advi- |
| sor Europe Capital Appreciation. Ms. Reynolds also serves as President, |
| Treasurer, and AML officer of other Fidelity funds (2004) and is a Vice |
| President (2003) and an employee (2002) of FMR. Before joining |
| Fidelity Investments, Ms. Reynolds worked at PricewaterhouseCoopers |
| LLP (PwC) (1980-2002), where she was most recently an audit partner |
| with PwC’s investment management practice. |
| |
| Paul M. Murphy (58) |
| |
| Year of Election or Appointment: 2005 |
| Chief Financial Officer of Advisor Europe Capital Appreciation. Mr. |
| Murphy also serves as Chief Financial Officer of other Fidelity funds |
| (2005-present). He also serves as Senior Vice President of Fidelity Pric- |
| ing and Cash Management Services Group (FPCMS). |
41 Annual Report
Trustees and Officers - continued
| Name, Age; Principal Occupation |
| |
| Kenneth A. Rathgeber (58) |
| |
| Year of Election or Appointment: 2004 |
| Chief Compliance Officer of Advisor Europe Capital Appreciation. Mr. |
| Rathgeber also serves as Chief Compliance Officer of other Fidelity |
| funds (2004) and Executive Vice President of Risk Oversight for Fidelity |
| Investments (2002). Previously, he served as Executive Vice President |
| and Chief Operating Officer for Fidelity Investments Institutional Services |
| Company, Inc. (1998-2002). |
| |
| John R. Hebble (47) |
| |
| Year of Election or Appointment: 2003 |
| Deputy Treasurer of Advisor Europe Capital Appreciation. Mr. Hebble |
| also serves as Deputy Treasurer of other Fidelity funds (2003), and is an |
| employee of FMR. Before joining Fidelity Investments, Mr. Hebble |
| worked at Deutsche Asset Management where he served as Director of |
| Fund Accounting (2002-2003) and Assistant Treasurer of the Scudder |
| Funds (1998-2003). |
| |
| Bryan A. Mehrmann (44) |
| |
| Year of Election or Appointment: 2005 |
| Deputy Treasurer of Advisor Europe Capital Appreciation. Mr. Mehr- |
| mann also serves as Deputy Treasurer of other Fidelity funds |
| (2005-present) and is an employee of FMR. Previously, Mr. Mehrmann |
| served as Vice President of Fidelity Investments Institutional Services |
| Group (FIIS)/Fidelity Investments Institutional Operations Corporation, |
| Inc. (FIIOC) Client Services (1998-2004). |
| |
| Kimberley H. Monasterio (41) |
| |
| Year of Election or Appointment: 2004 |
| Deputy Treasurer of Advisor Europe Capital Appreciation. Ms. Monas- |
| terio also serves as Deputy Treasurer of other Fidelity funds (2004) and |
| is an employee of FMR (2004). Before joining Fidelity Investments, Ms. |
| Monasterio served as Treasurer (2000-2004) and Chief Financial Offi- |
| cer (2002-2004) of the Franklin Templeton Funds and Senior Vice Presi- |
| dent of Franklin Templeton Services, LLC (2000-2004). |
| |
| Kenneth B. Robins (36) |
| |
| Year of Election or Appointment: 2005 |
| Deputy Treasurer of Advisor Europe Capital Appreciation. Mr. Robins |
| also serves as Deputy Treasurer of other Fidelity funds (2005-present) |
| and is an employee of FMR (2004-present). Before joining Fidelity In- |
| vestments, Mr. Robins worked at KPMG LLP, where he was a partner in |
| KPMG’s department of professional practice (2002-2004) and a Senior |
| Manager (1999-2000). In addition, Mr. Robins served as Assistant |
| Chief Accountant, United States Securities and Exchange Commission |
| (2000-2002). |
Annual Report 42
| Name, Age; Principal Occupation |
| |
| Robert G. Byrnes (38) |
| |
| Year of Election or Appointment: 2005 |
| Assistant Treasurer of Advisor Europe Capital Appreciation. Mr. Byrnes |
| also serves as Assistant Treasurer of other Fidelity funds (2005-present) |
| and is an employee of FMR (2005-present). Previously, Mr. Byrnes |
| served as Vice President of FPCMS (2003-2005). Before joining Fidelity |
| Investments, Mr. Byrnes worked at Deutsche Asset Management where |
| he served as Vice President of the Investment Operations Group |
| (2000-2003). |
| |
| John H. Costello (59) |
| |
| Year of Election or Appointment: 1986 |
| Assistant Treasurer of Advisor Europe Capital Appreciation. Mr. Costello |
| also serves as Assistant Treasurer of other Fidelity funds and is an em- |
| ployee of FMR. |
| |
| Peter L. Lydecker (51) |
| |
| Year of Election or Appointment: 2004 |
| Assistant Treasurer of Advisor Europe Capital Appreciation. Mr. |
| Lydecker also serves as Assistant Treasurer of other Fidelity funds (2004) |
| and is an employee of FMR. |
| |
| Mark Osterheld (50) |
| |
| Year of Election or Appointment: 2002 |
| Assistant Treasurer of Advisor Europe Capital Appreciation. Mr. Oster- |
| held also serves as Assistant Treasurer of other Fidelity funds (2002) and |
| �� is an employee of FMR. |
| |
| Gary W. Ryan (47) |
| |
| Year of Election or Appointment: 2005 |
| Assistant Treasurer of Advisor Europe Capital Appreciation. Mr. Ryan |
| also serves as Assistant Treasurer of other Fidelity funds (2005-present) |
| and is an employee of FMR (2005-present). Previously, Mr. Ryan served |
| as Vice President of Fund Reporting in FPCMS (1999-2005). |
| |
| Salvatore Schiavone (39) |
| |
| Year of Election or Appointment: 2005 |
| Assistant Treasurer of Advisor Europe Capital Appreciation. Mr. Schia- |
| vone also serves as Assistant Treasurer of other Fidelity funds |
| (2005-present) and is an employee of FMR (2005-present). Before join- |
| ing Fidelity Investments, Mr. Schiavone worked at Deutsche Asset Man- |
| agement, where he most recently served as Assistant Treasurer |
| (2003-2005) of the Scudder Funds and Vice President and Head of |
| Fund Reporting (1996-2003). |
43 Annual Report
The Board of Trustees of Advisor Europe Capital Appreciation fund voted to pay to shareholders of record at the opening of business on record date, the following distributions per share derived from capital gains realized from sales of portfolio securities, and dividends derived from net investment income:
| Fund | | Pay Date | | Record Date | | Dividends | | Capital Gains |
| Institutional Class | | 12/05/05 | | 12/02/05 | | $.171 | | $.22 |
The fund hereby designates as capital gain dividends: For dividends with respect to the taxable year ended October 31, 2005, $419,182, or, if subsequently determined to be different, the net capital gain of such year, and for dividends with respect to the taxable year ended October 31, 2004, $0, or, if subsequently determined to be different, the excess of: (a) the net capital gain of such year, over (b) amounts previously designated as capital gain dividends with respect to such year.
Board Approval of Investment Advisory Contracts and Management Fees
Advisor Europe Capital Appreciation Fund
Each year, typically in July, the Board of Trustees, including the independent Trustees (together, the Board), votes on the renewal of the management contract and sub-advisory agreements (together, the Advisory Contracts) for the fund. The Board, assisted by the advice of fund counsel and independent Trustees’ counsel, requests and considers a broad range of information throughout the year.
The Board meets regularly each month except August and takes into account throughout the year matters bearing on Advisory Contracts. The Board, acting directly and through its separate committees, considers at each of its meetings factors that are relevant to the annual renewal of the fund’s Advisory Contracts, including the services and support provided to the fund and its shareholders by Fidelity. At the time of the renewal, the Board had 11 standing committees, each composed of independent Trustees with varying backgrounds, to which the Board has assigned specific subject matter responsibilities in order to enhance effective decision-making by the Board. Each committee has adopted a written charter outlining the structure and purposes of the committee. One such committee, the Equity Contract Committee, meets periodically during the first six months of each year and as necessary to consider matters specifically related to the annual renewal of Advisory Contracts. The committee requests and receives information on, and makes recommendations to the independent Trustees concerning, the approval and annual review of the Advisory Contracts.
At its July 2005 meeting, the Board of Trustees, including the independent Trustees, unanimously determined to renew the Advisory Contracts for the fund. In reaching its determination, the Board considered all factors it believed relevant, including (1) the nature, extent, and quality of the services to be provided to the fund and its shareholders by Fidelity (including the investment performance of the fund); (2) the competitiveness of the management fee and total expenses of the fund; (3) the total costs of the services to be provided by and the profits to be realized by the investment adviser and its affiliates from the relationship with the fund; (4) the extent to which economies of scale would be realized as the fund grows; and (5) whether fee levels reflect these economies of scale, if any, for the benefit of fund shareholders.
In determining whether to renew the Advisory Contracts for the fund, the Board ultimately reached a determination, with the assistance of fund counsel and independent Trustees’ counsel, that the renewal of the Advisory Contracts and the compensation to be received by Fidelity under the management contract is consistent with Fidelity’s fiduciary duty under applicable law. In addition to evaluating the specific factors noted above, the Board, in reaching its determination, is aware that shareholders in the fund have a broad range of investment choices available to them, including a wide choice among mutual funds offered by competitors to Fidelity, and that the fund’s shareholders, with the opportunity to review and weigh the disclosure provided by the fund in its
45 Annual Report
Board Approval of Investment Advisory Contracts and Management Fees - continued
prospectus and other public disclosures, have chosen to invest in this fund, managed by Fidelity.
Nature, Extent, and Quality of Services Provided by Fidelity. The Board considered staffing within the investment adviser, FMR, and the sub-advisers (together, the Investment Advisers), including the background of the fund’s portfolio manager and the fund’s investment objective and discipline. The independent Trustees also had discussions with senior management of Fidelity’s investment operations and investment groups. The Board considered the structure of the portfolio manager compensation program and whether this structure provides appropriate incentives.
Fidelity Resources Dedicated to Investment Management and Support Services. The Board reviewed the size, education, and experience of the Investment Advisers’ investment staff, their use of technology, and the Investment Advisers’ approach to recruiting, training, and retaining portfolio managers and other research, advisory, and management personnel. The Board considered Fidelity’s extensive global research capabilities that enable the Investment Advisers to aggregate data from various sources in an effort to produce positive investment results. The Board noted that Fidelity’s analysts have access to a variety of technological tools that enable them to perform both fundamental and quantitative analysis and to specialize in various disciplines. The Board also considered that Fidelity’s portfolio managers and analysts have access to daily portfolio attribution that allows for monitoring of a fund’s portfolio, as well as an electronic communication system that provides immediate real-time access to research concerning issuers and credit enhancers.
Shareholder and Administrative Services. The Board considered the nature, extent, quality, and cost of administrative, distribution, and shareholder services performed by the Investment Advisers and their affiliates under the Advisory Contracts and under separate agreements covering transfer agency, pricing and bookkeeping, and securities lending services for the fund. The Board also considered the nature and extent of the Investment Advisers’ supervision of third party service providers, principally custodians and subcustodians. The Board reviewed the allocation of fund brokerage, including allocations to brokers affiliated with the Investment Advisers, the use of brokerage commissions to pay fund expenses, and the use of “soft” commission dollars to pay for research services. The Board also considered that Fidelity voluntarily decided in 2004 to stop using “soft” commission dollars to pay for market data and, instead, to pay for that data out of its own resources. The Board also considered the resources devoted to, and the record of compliance with, the fund’s compliance policies and procedures.
The Board noted that the growth of fund assets across the complex allows Fidelity to reinvest in the development of services designed to enhance the value or convenience of the Fidelity funds as investment vehicles. These services include 24-hour access to account information and market information through phone representatives and over the Internet, and investor education materials and asset allocation tools.
Investment in a Large Fund Family. The Board considered the benefits to shareholders of investing in a Fidelity fund, including the benefits of investing in a fund that is part of a large family of funds offering a variety of investment disciplines and providing for a large variety of mutual fund investor services. For example, fund shareholders are offered the privilege of exchanging shares of the fund for shares of other Fidelity funds, as set forth in the fund’s prospectus, without paying an additional sales charge. The Board noted that, since the last Advisory Contract renewals in July 2004, Fidelity has taken a number of actions that benefited particular funds, including (i) voluntarily deciding in 2004 to stop using “soft” commission dollars to pay for market data and, instead, to pay for that data out of its own resources, (ii) contractually agreeing to impose management fee reductions and expense limitations on its five Spartan stock index funds and its stock index fund available through variable insurance products, (iii) contractually agreeing to eliminate the management fees on the Fidelity Freedom Funds and the Fidelity Advisor Freedom Funds, (iv) contractually agreeing to reduce the management fees on most of its investment-grade taxable bond funds, and (v) contractually agreeing to impose expense limitations on its retail and Spartan investment-grade taxable bond funds.
Investment Performance and Compliance. The Board considered whether the fund has operated within its investment objective, as well as its record of compliance with its investment restrictions. It also reviewed the fund’s absolute investment performance for each class, as well as the fund’s relative investment performance for each class measured against (i) a broad-based securities market index, and (ii) a peer group of mutual funds deemed appropriate by the Board over multiple periods. The following charts considered by the Board show, over the one-, three-, and five-year periods ended December 31, 2004, the returns of Class C and Institutional Class of the fund, the returns of a broad-based securities market index (“benchmark”), and a range of returns of a peer group of mutual funds identified by Lipper Inc. as having an investment objective similar to that of the fund. The returns of Class C and Institutional Class represent the performance of classes with the highest and lowest 12b-1 fees, respectively (not necessarily with the highest and lowest total expenses). The box within each chart shows the 25th percentile return (bottom of box) and the 75th percentile return (top of box) of the Lipper peer group. Returns shown above the box are in the first quartile and returns shown below the box are in the fourth quartile. The percentage beaten numbers noted below each chart correspond to the percentile box and represent the percentage of funds in the Lipper peer group whose performance was equal to or lower than that of the class indicated.
47 Annual Report
Board Approval of Investment Advisory Contracts and Management Fees - continued

The Board reviewed the fund’s relative investment performance against its Lipper peer group and stated that the performance of Institutional Class of the fund was in the fourth quartile for the one-year period, the third quartile for the three-year period, and the second quartile for the five-year period. The Board also stated that the relative investment performance of the fund was lower than its benchmark for certain periods, although the five-year cumulative total return of Institutional Class of the fund was higher than its benchmark. The Board considered that the variations in performance among the fund’s classes reflect the variations in class expenses, which result in lower performance for higher expense classes. The Board discussed with FMR actions to be taken by FMR to improve the fund’s more recent disappointing performance.
The Board has had thorough discussions with FMR throughout the year about the Board’s and FMR’s concerns about equity research, equity fund performance, and compliance with internal policies governing gifts and entertainment. FMR has taken steps that it believes will refocus and strengthen equity research and equity portfolio management and compliance. The Board noted with favor FMR’s recent reorganization of its senior management team and FMR’s plans to dedicate additional resources to investment research, and participated in the process that led to those changes.
Based on its review, and giving particular weight to the nature and quality of the resources dedicated by the Investment Advisers to maintain and improve relative performance, the Board concluded that the nature, extent, and quality of the services provided by Fidelity will benefit the fund’s shareholders, particularly in light of the Board’s view that the fund’s shareholders benefit from investing in a fund that is part of a large family of funds offering a variety of investment disciplines and services.
Competitiveness of Management Fee and Total Fund Expenses. The Board considered the fund’s management fee and total expenses compared to “mapped groups” of competitive funds and classes. Fidelity creates “mapped groups” by combining similar Lipper investment objective categories that have comparable management fee characteristics. Combining Lipper investment objective categories aids the Board’s management fee and total expense comparisons by broadening the competitive group used for comparison and by reducing the number of universes to which various Fidelity funds are compared.
The Board considered two proprietary management fee comparisons for the 12-month periods shown in the chart below. The group of Lipper funds used by the Board for management fee comparisons is referred to below as the “Total Mapped Group” and, for the reasons explained above, is broader than the Lipper peer group used by the Board for performance comparisons. The Total Mapped Group comparison focuses on a fund’s standing relative to the total universe of comparable funds available to investors, in terms of gross management fees before expense reimbursements or caps. “TMG %” represents the percentage of funds in the Total Mapped Group that had management fees that were lower than the fund’s. For example, a TMG % of 24% means that 76% of the funds in the Total Mapped Group had higher management fees than the fund. The “Asset-Size Peer Group” (ASPG) comparison focuses on a fund’s standing relative to non-Fidelity funds similar in size to the fund within the Total Mapped Group. The ASPG represents at least 15% of the funds in the Total Mapped Group with comparable asset size and management fee characteristics, subject to a minimum of 50 funds (or all funds in the Total Mapped Group if fewer than 50). Additional information, such as the ASPG quartile (“quadrant”) in which the fund’s management fee ranked, is also included in the chart and considered by the Board.
49 Annual Report
Board Approval of Investment Advisory Contracts and Management Fees - continued

The Board noted that the fund’s management fee ranked below the median of its Total Mapped Group and below the median of its ASPG for 2004.
Based on its review, the Board concluded that the fund’s management fee was fair and reasonable in light of the services that the fund receives and the other factors considered.
In its review of each class’s total expenses, the Board considered the fund’s management fee as well as other fund or class expenses, as applicable, such as transfer agent fees, pricing and bookkeeping fees, fund-paid 12b-1 fees, and custodial, legal, and audit fees. The Board also noted the effects of any waivers and reimbursements on fees and expenses. As part of its review, the Board also considered current and historical total expenses of each class of the fund compared to competitive fund median expenses. Each class of the fund is compared to those funds and classes in the Total Mapped Group (used by the Board for management fee comparisons) that have a similar sales load structure.
The Board noted that the total expenses of each class ranked above its competitive median for 2004. The Board noted that the fund offers multiple classes, each of which has a different sales load and 12b-1 fee structure, and that the multiple structures are intended to offer a range of pricing options for the intermediary market. The Board also noted that the total expenses of the classes vary primarily by the level of their 12b-1 fees, although differences in transfer agent fees may also cause expenses to vary from class to class.
Furthermore, the Board considered that on December 16, 2004, it had approved changes (effective January 1, 2005) in the transfer agent and service agreements for the fund that
established maximum transfer agent fees and eliminated the minimum pricing and bookkeeping fee to prevent small funds or funds with small average account sizes from having relatively high fees in basis points (the “small-fund fee reductions”). The Board considered that, if the small-fund fee reductions had been in effect in 2004, the total expenses of each of Class A, Class B, and Class C would have ranked below the median.
In its review of total expenses, the Board also considered Fidelity fee structures and other information on clients that FMR and its affiliates service in other competitive markets, such as other mutual funds advised or subadvised by FMR or its affiliates, pension plan clients, and other institutional clients.
Based on its review, the Board concluded that the total expenses for each class of the fund were reasonable, although in all cases above the median of the universe presented for comparison, in light of the services that the fund and its shareholders receive and the other factors considered.
Costs of the Services and Profitability. The Board considered the revenues earned and the expenses incurred by Fidelity in conducting the business of developing, marketing, distributing, managing, administering and servicing the fund and its shareholders. The Board also considered the level of Fidelity’s profits in respect of all the Fidelity funds.
On an annual basis, FMR presents to the Board Fidelity’s profitability for the fund. Fidelity calculates the profitability for each fund, as well as aggregate profitability for groups of Fidelity funds and all Fidelity funds, using a series of detailed revenue and cost allocation methodologies which originate with the audited books and records of Fidelity. The Audit Committee of the Board reviews any significant changes from the prior year’s methodologies.
PricewaterhouseCoopers LLP (PwC), independent registered accounting firm and auditor to Fidelity and certain Fidelity funds, has been engaged annually by the Board as part of the Board’s assessment of the results of Fidelity’s profitability analysis. PwC’s engagement includes the review and assessment of Fidelity’s methodologies used in determining the revenues and expenses attributable to Fidelity’s mutual fund business, and completion of agreed-upon procedures surrounding the mathematical accuracy of fund profitability and its conformity to allocation methodologies. After considering PwC’s reports issued under the engagement and information provided by Fidelity, the Board believes that while other allocation methods may also be reasonable, Fidelity’s profitability methodologies are reasonable in all material respects.
The Board has also reviewed Fidelity’s non-fund businesses and any fall-out benefits related to the mutual fund business as well as cases where Fidelity’s affiliates may benefit from or be related to the fund’s business. In addition, a special committee of the Board reviewed services provided to Fidelity by its affiliates and determined that the fees that Fidelity paid for such services were reasonable.
51 Annual Report
Board Approval of Investment Advisory Contracts and Management Fees - continued
The Board considered the costs of the services provided by and the profits realized by Fidelity in connection with the operation of the fund and determined that the amount of profit is a fair entrepreneurial profit for the management of the fund.
Economies of Scale. The Board considered whether there have been economies of scale in respect of the management of the Fidelity funds, whether the Fidelity funds (including the fund) have appropriately benefited from any such economies of scale, and whether there is potential for realization of any further economies of scale. The Board considered the extent to which the fund will benefit from economies of scale through increased services to the fund, through waivers or reimbursements, or through fee or expense reductions, including reductions that occur through operation of the transfer agent agreement. The transfer agent fee varies in part based on the number of accounts in the fund. If the number of accounts decreases or the average account size increases, the overall transfer agent fee rate decreases.
The Board recognized that the fund’s management contract incorporates a “group fee” structure, which provides for lower fee rates as total fund assets under FMR’s management increase, and for higher fee rates as total fund assets under FMR’s management decrease. The Board considered that the group fee is designed to deliver the benefits of economies of scale to fund shareholders when total fund assets increase, even if assets of any particular fund are unchanged or have declined, because some portion of Fidelity’s costs are attributable to services provided to all Fidelity funds, and all funds benefit if those costs can be allocated among more assets. The Board concluded that, given the group fee structure, fund shareholders will achieve a certain level of economies of scale as assets under FMR’s management increase at the fund complex level, regardless of whether Fidelity achieves any such economies of scale.
The Board further concluded that any potential economies of scale are being shared between fund shareholders and Fidelity in an appropriate manner.
Additional Information Requested by the Board. In order to develop fully the factual basis for consideration of the Advisory Contracts, the Board requested additional information regarding (i) equity fund transfer agency fees; (ii) Fidelity’s fund profitability methodology and the impact of various changes in the methodology over time; (iii) benefits to shareholders from economies of scale; (iv) composition and characteristics of various fund and industry data used in comparisons; and (v) compensation of portfolio managers and research analysts.
Based on its evaluation of all of the conclusions noted above, and after considering all material factors, the Board ultimately concluded that the existing advisory fee structures are fair and reasonable, and that the fund’s existing Advisory Contracts should be renewed.
53 Annual Report
55 Annual Report
Investment Adviser
Fidelity Management & Research Company
Boston, MA
Investment Sub-Advisers
FMR Co., Inc.
Fidelity Management & Research
(U.K.) Inc.
Fidelity Management & Research
(Far East) Inc.
Fidelity International
Investment Advisors
Fidelity Investments Japan Limited
Fidelity International Investment
Advisors (U.K.) Limited
General Distributor
Fidelity Distributors Corporation
Boston, MA
Transfer and Service Agents
Fidelity Investments Institutional
Operations Company, Inc.
Boston, MA
Fidelity Service Company, Inc.
Boston, MA
Custodian
State Street Bank and Trust Company
Quincy, MA
|


Fidelity® Advisor
Global Equity
Fund - Class A, Class T, Class B and Class C
| Contents | | | | |
| |
| Chairman’s Message | | 4 | | Ned Johnson’s message to shareholders. |
| Performance | | 6 | | How the fund has done over time. |
| Management’s Discussion | | 8 | | The manager’s review of fund |
| | | | | performance, strategy and outlook. |
| Shareholder Expense | | 9 | | An example of shareholder expenses. |
| Example | | | | |
| Investment Changes | | 11 | | A summary of major shifts in the fund’s |
| | | | | investments over the past six months. |
| Investments | | 12 | | A complete list of the fund’s investments |
| | | | | with their market values. |
| Financial Statements | | 26 | | Statements of assets and liabilities, |
| | | | | operations, and changes in net assets, |
| | | | | as well as financial highlights. |
| Notes | | 35 | | Notes to the financial statements. |
| Report of Independent | | 43 | | |
| Registered Public | | | | |
| Accounting Firm | | | | |
| Trustees and Officers | | 44 | | |
| Distributions | | 54 | | |
| Board Approval of | | 55 | | |
| Investment Advisory | | | | |
| Contracts and | | | | |
| Management Fees | | | | |
To view a fund’s proxy voting guidelines and proxy voting record for the 12-month period ended June 30, visit www.fidelity.com/proxyvotingresults or visit the Securities and Exchange Commission’s (SEC) web site at www.sec.gov. You may also call 1-877-208-0098 to request a free copy of the proxy voting guidelines.
Standard & Poor’s, S&P and S&P 500 are registered service marks of The McGraw-Hill Companies, Inc. and have been licensed for use by Fidelity Distributors Corporation.
Other third party marks appearing herein are the property of their respective owners.
All other marks appearing herein are registered or unregistered trademarks or service marks of FMR Corp. or an affiliated company.
The views expressed in the Management’s Discussion of Fund Performance reflect those of the portfolio manager only through the end of the period of the report as stated on the cover and do not necessarily represent the views of Fidelity or any other person in the Fidelity organization. Any such views are subject to change at any time based upon market or other conditions and Fidelity disclaims any responsibility to update such views. These views may not be relied on as investment advice and, because investment decisions for a Fidelity fund are based on numerous factors, may not be relied on as an indication of trading intent on behalf of any Fidelity fund.
This report and the financial statements contained herein are submitted for the general information of the shareholders of the fund. This report is not authorized for distribution to prospective investors in the fund unless preceded or accompanied by an effective prospectus.
A fund files its complete schedule of portfolio holdings with the SEC for the first and third quarters of each fiscal year on Form N-Q. Forms N-Q are available on the SEC’s web site at http://www.sec.gov. A fund’s Forms N-Q may be reviewed and copied at the SEC’s Public Reference Room in Washington, DC. Information regarding the operation of the SEC’s Public Reference Room may be obtained by calling 1-800-SEC-0330. For a complete list of a fund’s portfolio holdings, view the most recent quarterly holdings report, semiannual report, or annual report on Fidelity’s web site at http://www.advisor.fidelity.com.
NOT FDIC INSURED · MAY LOSE VALUE · NO BANK GUARANTEE
Neither the fund nor Fidelity Distributors Corporation is a bank.
3 Annual Report
Chairman’s Message
(Photograph of Edward C. Johnson 3d)
Dear Shareholder:
During the past year or so, much has been reported about the mutual fund industry, and much of it has been more critical than I believe is warranted. Allegations that some companies have been less than forthright with their shareholders have cast a shadow on the entire industry. I continue to find these reports disturbing, and assert that they do not create an accurate picture of the industry overall. Therefore, I would like to remind everyone where Fidelity stands on these issues. I will say two things specifically regarding allegations that some mutual fund companies were in violation of the Securities and Exchange Commission’s forward pricing rules or were involved in so-called “market timing” activities.
First, Fidelity has no agreements that permit customers who buy fund shares after 4 p.m. to obtain the 4 p.m. price. This is not a new policy. This is not to say that someone could not deceive the company through fraudulent acts. However, we are extremely diligent in preventing fraud from occurring in this manner — and in every other. But I underscore again that Fidelity has no so-called “agreements” that sanction illegal practices.
Second, Fidelity continues to stand on record, as we have for years, in opposition to predatory short-term trading that adversely affects shareholders in a mutual fund. Back in the 1980s, we initiated a fee — which is returned to the fund and, therefore, to investors — to discourage this activity. Further, we took the lead several years ago in developing a Fair Value Pricing Policy to prevent market timing on foreign securities in our funds. I am confident we will find other ways to make it more difficult for predatory traders to operate. However, this will only be achieved through close cooperation among regulators, legislators and the industry.
Yes, there have been unfortunate instances of unethical and illegal activity within the mutual fund industry from time to time. That is true of any industry. When this occurs, confessed or convicted offenders should be dealt with appropriately. But we are still concerned about the risk of over-regulation and the quick application of simplistic solutions to intricate problems. Every system can be improved, and we support and applaud well thought out improvements by regulators, legislators and industry representatives that achieve the common goal of building and protecting the value of investors’ holdings.
For nearly 60 years, Fidelity has worked very hard to improve its products and service to justify your trust. When our family founded this company in 1946, we had only a few hundred customers. Today, we serve more than 18 million customers including individual investors and participants in retirement plans across America.
Annual Report 4
Let me close by saying that we do not take your trust in us for granted, and we realize that we must always work to improve all aspects of our service to you. In turn, we urge you to continue your active participation with your financial matters, so that your interests can be well served.
Best regards,
/s/Edward C. Johnson 3d
5 Annual Report
Performance: The Bottom Line
Average annual total return reflects the change in the value of an investment, assuming reinvestment of the class’ dividend income and capital gains (the profits earned upon the sale of securities that have grown in value) and assuming a constant rate of performance each year. The $10,000 table and the fund’s returns do not reflect the deduction of taxes that a shareholder would pay on fund distributions or the redemption of fund shares. During periods of reimbursement by Fidelity, a fund’s total return will be greater than it would be had the reimbursement not occurred. How a fund did yesterday is no guarantee of how it will do tomorrow.
| Average Annual Total Returns | | | | | | |
| Periods ended October 31, 2005 | | Past 1 | | Past 5 | | Life of |
| | | year | | years | | fundA |
| Class A (incl. 5.75% sales charge) | | 8.53% | | 0.43% | | 4.08% |
| Class T (incl. 3.50% sales charge) | | 10.92% | | 0.61% | | 4.17% |
| Class B (incl. contingent deferred sales charge)B | | 9.32% | | 0.45% | | 4.18% |
| Class C (incl. contingent deferred sales charge)C | | 13.31% | | 0.83% | | 4.19% |
A From December 17, 1998.
B Class B shares’ contingent deferred sales charges included in the past one year, past five year, and life
of fund total return figures are 5%, 2% and 0%, respectively.
C Class C shares’ contingent deferred sales charges included in the past one year, five year, and life of fund total return figures are 1%, 0% and 0%, respectively.
| | $10,000 Over Life of Fund
|
Let’s say hypothetically that $10,000 was invested in Fidelity® Advisor Global Equity Fund — Class T on December 17, 1998, when the fund started, and the current 3.50% sales charge was paid. The chart shows how the value of your investment would have changed, and also shows how the MSCIr World Index performed over the same period.

Management’s Discussion of Fund Performance
Comments from Richard Habermann, Lead Portfolio Manager of Fidelity® Advisor Global Equity Fund
Global equities generally had solid advances during the year ending October 31, 2005. Encouraged by strong corporate earnings and improved economies, the stocks of most developed nations moved sharply higher. The Morgan Stanley Capital InternationalSM (MSCI®) World Index — a performance measure of developed stock markets throughout the world — gained 13.66% . Japan was among the top-performers in the index. Positive economic indicators and Prime Minister Koizumi’s decisive election victory attracted record inflows from overseas investors, fueling robust returns for Japanese equities during the second half of the period. Asia-Pacific stocks outside of Japan, including Australia and Hong Kong, also responded well to the better macroeconomic environment. European equities rose as well, despite concerns about higher energy prices and potential downgrades to economic growth in the region. Still, European constituents generally were not hurt as badly by the dramatic increase in energy prices as were U.S. equities, which finished the year well behind the world market — the only major region to underperform. By contrast, Canada — the largest supplier of oil to the United States — was a beneficiary of high oil prices and enjoyed healthy gains.
During the past year, the fund’s Class A, Class T, Class B and Class C shares rose 15.15%, 14.94%, 14.32% and 14.31%, respectively, topping the MSCI World index and the LipperSM Global Funds Average, which returned 14.09% . Driven mainly by good stock selection, the fund outpaced the index in all major developed world markets, particularly in the United States during the second half of the period. On a regional basis, underweighting U.S. equities helped, as did overweightings in foreign markets — notably Japan — that outperformed. Country selection in Europe also bolstered returns. Most of our relative gains in the U.S. subportfolio came from within the energy, financials, materials and health care sectors. Biotechnology giant Genentech was our top individual contributor, followed by coal producer Peabody Energy and hard-disk drive maker Seagate Technology. Health care was a particular area of strength in Europe, led by German dialysis services provider Fresenius. Conversely, the fund’s aggressive positioning in the weak technology sector hurt. Our underexposure to surging utilities stocks also detracted, as did overweightings in several U.S. names that disappointed, among them biotech firm Biogen Idec and Spanish-language broadcaster Univision. Weak results in Singapore, mainly from electronics contract manufacturer Flextronics, dampened our returns in the Pacific region.
Note to shareholders:
Effective December 14, 2005, a portfolio management team led by Michael Jenkins and composed of William Bower, Penelope Dobkin, William Kennedy, Harry Lange, Brian Hogan and Peter Saperstone has been named to manage Fidelity Advisor Global Equity Fund, succeeding Richard Habermann.
The views expressed in this statement reflect those of the portfolio manager only through October 31, 2005. See page 3 for further discussion of this section of the report.
Annual Report 8
8
Shareholder Expense Example
As a shareholder of the Fund, you incur two types of costs: (1) transaction costs, including sales charges (loads) on purchase payments or redemption proceeds, redemption fees, and (2) ongoing costs, including management fees, distribution and/or service (12b-1) fees and other Fund expenses. This Example is intended to help you understand your ongoing costs (in dollars) of investing in the Fund and to compare these costs with the ongoing costs of investing in other mutual funds.
The Example is based on an investment of $1,000 invested at the beginning of the period and held for the entire period (May 1, 2005 to October 31, 2005).
The first line of the table below for each class of the Fund provides information about actual account values and actual expenses. You may use the information in this line, together with the amount you invested, to estimate the expenses that you paid over the period. Simply divide your account value by $1,000.00 (for example, an $8,600 account value divided by $1,000.00 = 8.6), then multiply the result by the number in the first line for a class of the Fund under the heading entitled “Expenses Paid During Period” to estimate the expenses you paid on your account during this period.
Hypothetical Example for Comparison Purposes
The second line of the table below for each class of the Fund provides information about hypothetical account values and hypothetical expenses based on a Class’ actual expense ratio and an assumed rate of return of 5% per year before expenses, which is not the Class’ actual return. The hypothetical account values and expenses may not be used to estimate the actual ending account balance or expenses you paid for the period. You may use this information to compare the ongoing costs of investing in the Fund and other funds. To do so, compare this 5% hypothetical example with the 5% hypothetical examples that appear in the shareholder reports of the other funds.
Please note that the expenses shown in the table are meant to highlight your ongoing costs only and do not reflect any transaction costs. Therefore, the second line of the table is useful in comparing ongoing costs only, and will not help you determine the relative total costs of owning different funds. In addition, if these transactional costs were included, your costs would have been higher.
| | | | | | | | | | | | | Expenses Paid |
| | | | | Beginning | | | | Ending | | | | During Period* |
| | | | | Account Value | | | | Account Value | | | | May 1, 2005 |
| | | | | May 1, 2005 | | | | October 31, 2005 | | to October 31, 2005 |
| Class A | | | | | | | | | | | | |
| Actual | | $ | | 1,000.00 | | $ | | 1,097.90 | | $ | | 7.93 |
| HypotheticalA | | $ | | 1,000.00 | | $ | | 1,017.64 | | $ | | 7.63 |
| Class T | | | | | | | | | | | | |
| Actual | | $ | | 1,000.00 | | $ | | 1,097.00 | | $ | | 9.25 |
| HypotheticalA | | $ | | 1,000.00 | | $ | | 1,016.38 | | $ | | 8.89 |
| Class B | | | | | | | | | | | | |
| Actual | | $ | | 1,000.00 | | $ | | 1,094.20 | | $ | | 11.88 |
| HypotheticalA | | $ | | 1,000.00 | | $ | | 1,013.86 | | $ | | 11.42 |
9 Annual Report
| Shareholder Expense Example - continued | | | | |
| |
| |
| | | | | | | | | | | | | Expenses Paid |
| | | | | Beginning | | | | Ending | | | | During Period* |
| | | | | Account Value | | | | Account Value | | | | May 1, 2005 |
| | | | | May 1, 2005 | | | | October 31, 2005 | | to October 31, 2005 |
| Class C | | | | | | | | | | | | |
| Actual | | $ | | 1,000.00 | | $ | | 1,093.20 | | $ | | 11.87 |
| HypotheticalA | | $ | | 1,000.00 | | $ | | 1,013.86 | | $ | | 11.42 |
| Institutional Class | | | | | | | | | | | | |
| Actual | | $ | | 1,000.00 | | $ | | 1,099.40 | | $ | | 6.61 |
| HypotheticalA | | $ | | 1,000.00 | | $ | | 1,018.90 | | $ | | 6.36 |
| |
| |
| A 5% return per year before expenses | | | | | | | | |
* Expenses are equal to each Class’ annualized expense ratio (shown in the table below); multiplied by the average account value over the period, multiplied by 184/365 (to reflect the one-half year period).
| | | Annualized |
| | | Expense Ratio |
| Class A | | 1.50% |
| Class T | | 1.75% |
| Class B | | 2.25% |
| Class C | | 2.25% |
| Institutional Class | | 1.25% |
Investment Changes
| Top Five Stocks as of October 31, 2005 | | | | |
| | | % of fund’s | | % of fund’s net assets |
| | | net assets | | 6 months ago |
| Genentech, Inc. (United States of America, | | | | |
| Biotechnology) | | 1.5 | | 1.9 |
| Peabody Energy Corp. (United States of | | | | |
| America, Oil, Gas & Consumable Fuels) | | 1.2 | | 0.8 |
| BP PLC (United Kingdom, Oil, Gas & | | | | |
| Consumable Fuels) | | 1.2 | | 1.1 |
| Goldman Sachs Group, Inc. (United States of | | | | |
| America, Capital Markets) | | 1.1 | | 0.7 |
| Total SA Series B (France, Oil, Gas & | | | | |
| Consumable Fuels) | | 1.1 | | 1.1 |
| | | 6.1 | | |
| Top Five Market Sectors as of October 31, 2005 | | |
| | | % of fund’s | | % of fund’s net assets |
| | | net assets | | 6 months ago |
| Financials | | 20.0 | | 19.4 |
| Energy | | 13.6 | | 10.9 |
| Information Technology | | 13.6 | | 14.6 |
| Consumer Discretionary | | 11.9 | | 12.4 |
| Health Care | | 9.7 | | 11.0 |
| Top Five Countries as of October 31, 2005 | | |
| (excluding cash equivalents) | | % of fund’s | | % of fund’s net assets |
| | | net assets | | 6 months ago |
| United States of America | | 38.6 | | 44.3 |
| Japan | | 12.2 | | 11.7 |
| United Kingdom | | 9.9 | | 10.2 |
| Canada | | 3.9 | | 2.9 |
| Switzerland | | 3.2 | | 3.8 |
| Percentages are adjusted for the effect of open futures contracts, if applicable. | | |

11 Annual Report
| Investments October 31, 2005 | | | | | | | | |
| Showing Percentage of Net Assets | | | | | | | | |
| |
| Common Stocks — 90.9% | | | | | | | | |
| | | | | Shares | | Value (Note 1) |
| |
| Australia – 2.4% | | | | | | | | |
| Alumina Ltd. | | | | 1,300 | | $ | | 5,628 |
| AMP Ltd. | | | | 13,700 | | | | 74,680 |
| Australia & New Zealand Banking Group Ltd. | | | | 7,509 | | | | 132,230 |
| Australian Gas Light Co. | | | | 1,053 | | | | 11,921 |
| Australian Stock Exchange Ltd. | | | | 1,000 | | | | 21,513 |
| AXA Asia Pacific Holdings Ltd. | | | | 3,400 | | | | 12,025 |
| BHP Billiton Ltd. | | | | 13,885 | | | | 215,565 |
| Billabong International Ltd. | | | | 3,500 | | | | 33,866 |
| Brambles Industries Ltd. | | | | 2,100 | | | | 13,269 |
| Coca-Cola Amatil Ltd. | | | | 2,742 | | | | 15,624 |
| Commonwealth Bank of Australia | | | | 3,200 | | | | 93,032 |
| CSL Ltd. | | | | 400 | | | | 11,216 |
| Fosters Group Ltd. | | | | 12,400 | | | | 53,778 |
| Lion Nathan Ltd. | | | | 4,100 | | | | 24,189 |
| Macquarie Airports unit | | | | 3,100 | | | | 6,954 |
| National Australia Bank Ltd. | | | | 1,000 | | | | 24,802 |
| Newcrest Mining Ltd. | | | | 3,300 | | | | 44,910 |
| Origin Energy Ltd. | | | | 2,387 | | | | 11,994 |
| Publishing & Broadcasting Ltd. | | | | 655 | | | | 7,895 |
| QBE Insurance Group Ltd. | | | | 3,208 | | | | 42,698 |
| Rinker Group Ltd. | | | | 784 | | | | 8,829 |
| Rio Tinto Ltd. | | | | 1,157 | | | | 48,716 |
| Seek Ltd. | | | | 13,100 | | | | 27,819 |
| Wesfarmers Ltd. | | | | 600 | | | | 16,017 |
| Westfield Group unit | | | | 7,500 | | | | 93,151 |
| Westpac Banking Corp. | | | | 7,500 | | | | 116,369 |
| Woodside Petroleum Ltd. | | | | 2,700 | | | | 63,798 |
| Woolworths Ltd. | | | | 3,147 | | | | 38,427 |
| WorleyParsons Ltd. | | | | 800 | | | | 5,862 |
| TOTAL AUSTRALIA | | | | | | | | 1,276,777 |
| |
| Austria – 0.2% | | | | | | | | |
| Erste Bank der Oesterreichischen Sparkassen AG | | | | 2,200 | | | | 114,457 |
| Belgium – 0.1% | | | | | | | | |
| Belgacom SA | | | | 1,300 | | | | 43,572 |
| Bermuda – 0.7% | | | | | | | | |
| Accenture Ltd. Class A | | | | 2,800 | | | | 73,668 |
| Aquarius Platinum Ltd. (Australia) | | | | 1,200 | | | | 8,973 |
| Marvell Technology Group Ltd. (a) | | | | 6,500 | | | | 301,665 |
| TOTAL BERMUDA | | | | | | | | 384,306 |
See accompanying notes which are an integral part of the financial statements.
| Common Stocks – continued | | | | | | |
| | | Shares | | Value (Note 1) |
| |
| Canada – 3.9% | | | | | | |
| Aeroplan Income Fund (a)(c) | | 1,080 | | $ | | 11,111 |
| Alimentation Couche-Tard, Inc. Class B (sub. vtg.) (a) | | 900 | | | | 16,308 |
| Alliance Atlantis Communications, Inc. Class B (non-vtg.) (a) | | 430 | | | | 10,741 |
| Astral Media, Inc. Class A (non-vtg.) | | 340 | | | | 9,054 |
| Bank of Nova Scotia | | 670 | | | | 24,389 |
| Brascan Corp. Class A (ltd. vtg.) | | 1,505 | | | | 68,649 |
| Brookfield Properties Corp. | | 860 | | | | 25,196 |
| Canadian Imperial Bank of Commerce | | 640 | | | | 39,126 |
| Canadian National Railway Co. | | 1,370 | | | | 99,183 |
| Canadian Natural Resources Ltd. | | 2,740 | | | | 112,036 |
| Canadian Oil Sands Trust unit | | 210 | | | | 19,738 |
| Canadian Pacific Railway Ltd. | | 420 | | | | 17,266 |
| Canadian Tire Corp. Ltd. Class A (non-vtg.) | | 440 | | | | 22,842 |
| Cathedral Energy Services Income Trust | | 2,570 | | | | 19,912 |
| CCS Income Trust | | 260 | | | | 6,492 |
| Chum Ltd. Class B (non-vtg.) | | 240 | | | | 6,097 |
| Cyries Energy, Inc. (a) | | 830 | | | | 10,415 |
| EnCana Corp. | | 2,998 | | | | 137,080 |
| FirstService Corp. (sub. vtg.) (a) | | 770 | | | | 17,930 |
| Fording Canadian Coal Trust | | 1,290 | | | | 43,779 |
| Garda World Security Corp. (a) | | 1,160 | | | | 13,849 |
| Gildan Activewear, Inc. Class A (a) | | 1,290 | | | | 45,112 |
| Great Canadian Gaming Corp. (a) | | 540 | | | | 6,356 |
| Husky Energy, Inc. | | 1,250 | | | | 57,684 |
| Imperial Oil Ltd. | | 770 | | | | 67,285 |
| ING Canada, Inc | | 1,710 | | | | 64,143 |
| IPSCO, Inc. | | 960 | | | | 68,403 |
| La Senza Corp. (sub. vtg.) | | 290 | | | | 4,457 |
| Manulife Financial Corp. | | 1,690 | | | | 87,963 |
| Melcor Developments Ltd. | | 80 | | | | 6,638 |
| Metro, Inc. Class A (sub. vtg.) | | 2,140 | | | | 59,616 |
| National Bank of Canada | | 1,070 | | | | 53,582 |
| Onex Corp. (sub. vtg.) | | 1,240 | | | | 20,978 |
| Petro-Canada | | 1,720 | | | | 59,945 |
| Potash Corp. of Saskatchewan | | 365 | | | | 29,923 |
| Real Resources, Inc. (a) | | 210 | | | | 4,072 |
| RioCan (REIT) | | 1,390 | | | | 23,775 |
| Rogers Communications, Inc. Class B (non-vtg.) | | 1,180 | | | | 46,561 |
| RONA, Inc. (a) | | 570 | | | | 10,589 |
| Rothmans, Inc. | | 210 | | | | 4,289 |
| Royal Bank of Canada | | 1,710 | | | | 120,656 |
| Savanna Energy Services Corp. (a) | | 860 | | | | 17,659 |
See accompanying notes which are an integral part of the financial statements.
13 Annual Report
| Investments - continued | | | | | | |
| |
| |
| Common Stocks – continued | | | | | | |
| | | Shares | | Value (Note 1) |
| |
| Canada – continued | | | | | | |
| Shore Gold, Inc. (a) | | 1,250 | | $ | | 7,599 |
| SNC-Lavalin Group, Inc. | | 540 | | | | 34,064 |
| Sun Life Financial, Inc. | | 1,010 | | | | 37,672 |
| Talisman Energy, Inc. | | 2,140 | | | | 94,787 |
| Teck Cominco Ltd. Class B (sub. vtg.) | | 340 | | | | 14,325 |
| TELUS Corp. | | 2,440 | | | | 93,798 |
| Toronto-Dominion Bank | | 1,800 | | | | 84,894 |
| Trican Well Service Ltd. (a) | | 940 | | | | 35,276 |
| TSX Group, Inc. | | 1,240 | | | | 38,092 |
| Wajax Income Fund | | 1,200 | | | | 24,386 |
| TOTAL CANADA | | | | | | 2,055,772 |
| |
| Cayman Islands – 1.5% | | | | | | |
| Ctrip.com International Ltd. sponsored ADR | | 300 | | | | 17,259 |
| Noble Corp. | | 5,960 | | | | 383,705 |
| Seagate Technology | | 25,420 | | | | 368,336 |
| TOTAL CAYMAN ISLANDS | | | | | | 769,300 |
| |
| China – 0.0% | | | | | | |
| ZTE Corp. (H Shares) | | 4,400 | | | | 12,998 |
| Denmark – 0.3% | | | | | | |
| Danske Bank AS | | 4,730 | | | | 148,341 |
| Finland – 0.4% | | | | | | |
| Fortum Oyj | | 7,240 | | | | 128,188 |
| Neste Oil Oyj | | 3,110 | | | | 96,372 |
| TOTAL FINLAND | | | | | | 224,560 |
| |
| France – 3.1% | | | | | | |
| AXA SA | | 6,374 | | | | 184,591 |
| BNP Paribas SA | | 3,892 | | | | 295,095 |
| Gaz de France | | 800 | | | | 24,598 |
| Groupe Danone | | 1,300 | | | | 132,618 |
| Societe Generale Series A | | 900 | | | | 102,763 |
| Total SA Series B | | 2,225 | | | | 560,789 |
| Vivendi Universal SA | | 9,900 | | | | 311,058 |
| TOTAL FRANCE | | | | | | 1,611,512 |
| |
| Germany – 2.7% | | | | | | |
| Allianz AG (Reg.) | | 1,100 | | | | 155,540 |
| Bilfinger & Berger Bau AG | | 1,600 | | | | 69,240 |
| Continental AG | | 2,200 | | | | 168,257 |
| Deutsche Boerse AG | | 3,077 | | | | 289,551 |
See accompanying notes which are an integral part of the financial statements.
| Common Stocks – continued | | | | | | |
| | | Shares | | Value (Note 1) |
| |
| Germany – continued | | | | | | |
| E.ON AG | | 4,100 | | $ | | 371,583 |
| Merck KGaA | | 1,100 | | | | 90,985 |
| SAP AG | | 1,700 | | | | 291,992 |
| TOTAL GERMANY | | | | | | 1,437,148 |
| |
| Greece – 0.6% | | | | | | |
| EFG Eurobank Ergasias SA | | 5,500 | | | | 165,487 |
| Greek Organization of Football Prognostics SA | | 5,200 | | | | 150,103 |
| TOTAL GREECE | | | | | | 315,590 |
| |
| Hong Kong – 0.8% | | | | | | |
| BOC Hong Kong Holdings Ltd. | | 5,500 | | | | 10,252 |
| Cafe de Coral Holdings Ltd. | | 6,000 | | | | 6,772 |
| Cheung Kong Holdings Ltd. | | 5,000 | | | | 52,018 |
| China Mobile (Hong Kong) Ltd. | | 12,000 | | | | 53,880 |
| CNOOC Ltd. | | 21,000 | | | | 13,797 |
| Henderson Land Development Co. Ltd. | | 1,000 | | | | 4,457 |
| Hong Kong & China Gas Co. Ltd. | | 17,400 | | | | 35,913 |
| Hutchison Whampoa Ltd. | | 6,000 | | | | 56,810 |
| JCG Holdings Ltd. | | 4,000 | | | | 3,973 |
| Li & Fung Ltd. | | 20,000 | | | | 42,698 |
| MTR Corp. Ltd. | | 6,000 | | | | 11,339 |
| Shanghai Industrial Holdings Ltd. Class H | | 3,000 | | | | 5,340 |
| Sun Hung Kai Properties Ltd. | | 4,000 | | | | 37,822 |
| Swire Pacific Ltd. (A Shares) | | 3,500 | | | | 31,379 |
| Television Broadcasts Ltd. | | 4,000 | | | | 22,213 |
| Wharf Holdings Ltd. | | 9,000 | | | | 30,708 |
| Wing Hang Bank Ltd. | | 2,000 | | | | 13,661 |
| TOTAL HONG KONG | | | | | | 433,032 |
| |
| Ireland – 0.3% | | | | | | |
| CRH PLC | | 6,927 | | | | 173,133 |
| Italy – 1.9% | | | | | | |
| Autostrade Spa | | 6,940 | | | | 158,641 |
| Banca Intesa Spa | | 15,509 | | | | 72,376 |
| Banco Popolare di Verona e Novara | | 8,790 | | | | 162,270 |
| ENI Spa | | 15,611 | | | | 417,594 |
| Lottomatica Spa New | | 2,700 | | | | 98,070 |
| Seat Pagine Gialle Spa | | 186,100 | | | | 86,446 |
| TOTAL ITALY | | | | | | 995,397 |
See accompanying notes which are an integral part of the financial statements.
15 Annual Report
| Investments - continued | | | | | | |
| |
| |
| Common Stocks – continued | | | | | | |
| | | Shares | | Value (Note 1) |
| |
| Japan – 12.2% | | | | | | |
| Advantest Corp. | | 600 | | $ | | 43,439 |
| Aeon Co. Ltd. | | 3,500 | | | | 72,745 |
| Aiful Corp. | | 200 | | | | 15,017 |
| Aisin Seiki Co. Ltd. | | 1,000 | | | | 30,137 |
| Arisawa Manufacturing Co. Ltd. | | 100 | | | | 1,639 |
| Asahi Glass Co. Ltd. | | 6,000 | | | | 65,159 |
| Astellas Pharma, Inc. | | 2,200 | | | | 79,067 |
| BSL Corp. warrants 12/15/05 (a) | | 1,300 | | | | 293 |
| Canon, Inc. | | 2,300 | | | | 122,061 |
| Citizen Watch Co. Ltd. | | 2,400 | | | | 18,290 |
| Cyber Agent Ltd. | | 10 | | | | 18,013 |
| Cyber Agent Ltd. New | | 18 | | | | 32,424 |
| Dai Nippon Printing Co. Ltd. | | 1,000 | | | | 16,446 |
| Dainippon Screen Manufacturing Co. Ltd. | | 5,000 | | | | 30,787 |
| Daiwa House Industry Co. Ltd. | | 1,000 | | | | 13,458 |
| Denki Kagaku Kogyo KK | | 9,000 | | | | 33,047 |
| Denso Corp. | | 1,500 | | | | 42,738 |
| Diamond Lease Co. Ltd. | | 400 | | | | 18,671 |
| Don Quijote Co. Ltd. | | 400 | | | | 28,960 |
| East Japan Railway Co | | 7 | | | | 41,829 |
| Fanuc Ltd. | | 900 | | | | 70,927 |
| Fuji Television Network, Inc. | | 14 | | | | 31,281 |
| Fujikura Ltd. | | 6,000 | | | | 38,867 |
| Fujitsu Ltd. | | 14,000 | | | | 92,629 |
| Hamamatsu Photonics KK | | 500 | | | | 11,626 |
| Hankyu Department Stores, Inc. | | 2,000 | | | | 16,021 |
| Haseko Corp. (a) | | 29,500 | | | | 102,190 |
| Hokuhoku Financial Group, Inc. | | 5,000 | | | | 20,741 |
| Honda Motor Co. Ltd. | | 2,600 | | | | 144,612 |
| Hoya Corp. New | | 300 | | | | 10,470 |
| Index Corp. New | | 11 | | | | 12,384 |
| Isetan Co. Ltd. | | 1,600 | | | | 28,821 |
| ITOCHU TECHNO-SCIENCE Corp. (CTC) | | 600 | | | | 22,967 |
| JAFCO Co. Ltd. | | 700 | | | | 42,192 |
| JFE Holdings, Inc. | | 1,500 | | | | 46,635 |
| JSR Corp. | | 3,900 | | | | 92,374 |
| Juroku Bank Ltd. | | 1,000 | | | | 8,348 |
| Kamigumi Co. Ltd. | | 4,000 | | | | 33,082 |
| Kurita Water Industries Ltd. | | 1,100 | | | | 18,500 |
| Kyocera Corp. | | 400 | | | | 25,984 |
| Leopalace21 Corp. | | 4,800 | | | | 124,706 |
| livedoor Co. Ltd. (a) | | 13,546 | | | | 49,857 |
See accompanying notes which are an integral part of the financial statements.
| Common Stocks – continued | | | | | | |
| | | Shares | | Value (Note 1) |
| |
| Japan – continued | | | | | | |
| Marui Co. Ltd. | | 1,500 | | $ | | 24,902 |
| Matsushita Electric Industrial Co. Ltd. | | 4,000 | | | | 73,600 |
| Meitec Corp. | | 700 | | | | 22,733 |
| Miraca Holdings, Inc. | | 1,100 | | | | 24,673 |
| Mitsubishi Corp. | | 5,300 | | | | 103,272 |
| Mitsubishi Electric Corp. | | 6,000 | | | | 36,009 |
| Mitsubishi Estate Co. Ltd. | | 3,000 | | | | 44,505 |
| Mitsubishi Heavy Industries Ltd. | | 9,000 | | | | 34,138 |
| Mitsubishi Logistics Corp. | | 1,000 | | | | 13,804 |
| Mitsubishi UFJ Financial Group, Inc. | | 11 | | | | 139,590 |
| Mitsubishi UFJ Securities Co. Ltd. | | 2,000 | | | | 22,880 |
| Mitsui & Co. Ltd. | | 9,000 | | | | 110,911 |
| Mitsui Fudosan Co. Ltd. | | 3,000 | | | | 49,233 |
| Mitsui Mining & Smelting Co. Ltd. | | 10,000 | | | | 57,157 |
| Mitsui O.S.K. Lines Ltd. | | 4,000 | | | | 28,267 |
| Mitsui Trust Holdings, Inc. | | 6,000 | | | | 72,434 |
| Mitsui-Soko Co. Ltd. | | 3,000 | | | | 16,757 |
| Mizuho Financial Group, Inc. | | 29 | | | | 193,884 |
| Murata Manufacturing Co. Ltd. | | 500 | | | | 24,985 |
| NGK Insulators Ltd. | | 5,000 | | | | 59,798 |
| NGK Spark Plug Co. Ltd. | | 4,000 | | | | 64,397 |
| Nichias Corp. | | 5,000 | | | | 28,925 |
| Nikko Cordial Corp. | | 5,500 | | | | 66,683 |
| Nippon Electric Glass Co. Ltd. | | 1,000 | | | | 19,182 |
| Nippon Mining Holdings, Inc. | | 9,500 | | | | 70,178 |
| Nippon Oil Corp. | | 14,000 | | | | 119,181 |
| Nippon Steel Corp. | | 17,000 | | | | 60,803 |
| Nippon Television Network Corp. | | 240 | | | | 39,116 |
| Nishimatsuya Chain Co. Ltd. | | 1,100 | | | | 41,915 |
| Nitto Denko Corp. | | 800 | | | | 48,566 |
| NOK Corp. | | 1,500 | | | | 45,336 |
| Nomura Holdings, Inc. | | 2,800 | | | | 43,372 |
| Nomura Research Institute Ltd. | | 600 | | | | 62,249 |
| NTT Data Corp. | | 13 | | | | 45,371 |
| NTT DoCoMo, Inc. | | 86 | | | | 148,780 |
| Oki Electric Industry Co. Ltd. | | 3,000 | | | | 9,353 |
| Onward Kashiyama Co. Ltd. | | 2,000 | | | | 32,043 |
| Opt, Inc. (a) | | 4 | | | | 15,277 |
| ORIX Corp. | | 200 | | | | 37,533 |
| Rakuten, Inc. | | 46 | | | | 30,037 |
| Resona Holdings, Inc. (a) | | 23 | | | | 66,727 |
| Ricoh Co. Ltd. | | 2,000 | | | | 31,852 |
See accompanying notes which are an integral part of the financial statements.
17 Annual Report
| Investments - continued | | | | | | |
| |
| |
| Common Stocks – continued | | | | | | |
| | | Shares | | Value (Note 1) |
| |
| Japan – continued | | | | | | |
| Rohm Co. Ltd. | | 700 | | $ | | 56,863 |
| Sankyo Co. Ltd. (Gunma) | | 200 | | | | 10,583 |
| SBI Holdings, Inc. | | 40 | | | | 19,988 |
| Sega Sammy Holdings, Inc. | | 200 | | | | 7,205 |
| Sega Sammy Holdings, Inc. New | | 400 | | | | 14,514 |
| Seven & I Holdings Co. Ltd. (a) | | 2,220 | | | | 73,057 |
| SFCG Co. Ltd. | | 90 | | | | 21,738 |
| Shin-Etsu Chemical Co. Ltd. | | 1,900 | | | | 91,157 |
| SMC Corp. | | 400 | | | | 53,381 |
| Softbank Corp. | | 700 | | | | 39,707 |
| Sompo Japan Insurance, Inc | | 8,000 | | | | 120,550 |
| Stanley Electric Co. Ltd. | | 1,800 | | | | 27,794 |
| Sumisho Computer Service Corp. | | 800 | | | | 14,480 |
| Sumitomo Chemical Co. Ltd. | | 6,000 | | | | 35,593 |
| Sumitomo Corp. | | 7,000 | | | | 78,201 |
| Sumitomo Electric Industries Ltd. | | 5,000 | | | | 65,904 |
| Sumitomo Heavy Industries Ltd. | | 9,000 | | | | 63,133 |
| Sumitomo Metal Industries Ltd. | | 13,000 | | | | 45,033 |
| Sumitomo Mitsui Financial Group, Inc. | | 30 | | | | 277,991 |
| Sumitomo Realty & Development Co. Ltd. | | 3,000 | | | | 48,584 |
| Suzuki Motor Corp. | | 1,400 | | | | 24,127 |
| T&D Holdings, Inc. | | 300 | | | | 18,940 |
| Taiheiyo Cement Corp. | | 9,000 | | | | 32,580 |
| Take & Give Needs Co. Ltd. (a) | | 14 | | | | 19,641 |
| Takeda Pharamaceutical Co. Ltd. | | 1,500 | | | | 82,618 |
| Takefuji Corp. | | 680 | | | | 47,759 |
| Teijin Ltd | | 8,000 | | | | 47,804 |
| The Sumitomo Warehouse Co. Ltd. | | 2,000 | | | | 15,554 |
| THK Co. Ltd. | | 1,900 | | | | 42,946 |
| TIS, Inc. | | 800 | | | | 18,914 |
| Tokai Tokyo Securities Co. Ltd. | | 5,000 | | | | 19,615 |
| Tokyo Broadcasting System, Inc. | | 400 | | | | 11,431 |
| Tokyo Electron Ltd. | | 600 | | | | 30,189 |
| Tokyo Steel Manufacturing Co. Ltd. | | 1,500 | | | | 19,550 |
| Tokyu Corp. | | 5,000 | | | | 27,366 |
| Tokyu Land Corp. | | 3,000 | | | | 23,876 |
| Toray Industries, Inc. | | 7,000 | | | | 39,040 |
| Toshiba Machine Co. Ltd. | | 8,000 | | | | 57,504 |
| Toyota Motor Corp. | | 7,200 | | | | 334,116 |
| Trans Cosmos, Inc. | | 400 | | | | 20,299 |
| Ushio, Inc. | | 1,000 | | | | 18,706 |
| Yahoo! Japan Corp | | 12 | | | | 12,782 |
See accompanying notes which are an integral part of the financial statements.
| Common Stocks – continued | | | | | | |
| | | Shares | | Value (Note 1) |
| |
| Japan – continued | | | | | | |
| Yahoo! Japan Corp. New | | 26 | | $ | | 28,146 |
| Yamaha Motor Co. Ltd. (a) | | 1,500 | | | | 32,281 |
| Yamato Transport Co. Ltd. | | 2,000 | | | | 33,065 |
| Yaskawa Electric Corp. (a) | | 11,000 | | | | 86,021 |
| Yokogawa Electric Corp. | | 2,200 | | | | 32,484 |
| TOTAL JAPAN | | | | | | 6,392,652 |
| |
| Liberia – 0.3% | | | | | | |
| Royal Caribbean Cruises Ltd. | | 3,400 | | | | 140,896 |
| Luxembourg – 0.2% | | | | | | |
| SES Global unit | | 5,100 | | | | 80,639 |
| Marshall Islands – 0.1% | | | | | | |
| Teekay Shipping Corp. | | 1,100 | | | | 43,384 |
| Netherlands – 1.6% | | | | | | |
| Euronext NV | | 2,200 | | | | 93,491 |
| ING Groep NV (Certificaten Van Aandelen) | | 4,310 | | | | 124,387 |
| James Hardie Industries NV | | 2,000 | | | | 12,697 |
| Koninklijke Numico NV (a) | | 8,100 | | | | 328,000 |
| Rodamco Europe NV | | 1,100 | | | | 87,557 |
| VNU NV | | 5,400 | | | | 171,735 |
| TOTAL NETHERLANDS | | | | | | 817,867 |
| |
| Netherlands Antilles – 0.5% | | | | | | |
| Schlumberger Ltd. (NY Shares) | | 2,900 | | | | 263,233 |
| New Zealand – 0.2% | | | | | | |
| Carter Holt Harvey Ltd. | | 12,000 | | | | 20,994 |
| Fisher & Paykel Healthcare Corp. | | 5,800 | | | | 14,084 |
| Sky City Entertainment Group Ltd. | | 5,105 | | | | 16,219 |
| Sky Network Television Ltd. New | | 1,668 | | | | 7,225 |
| Telecom Corp. of New Zealand Ltd. | | 7,217 | | | | 29,563 |
| Tenon Ltd. | | 575 | | | | 1,489 |
| TOTAL NEW ZEALAND | | | | | | 89,574 |
| |
| Norway – 0.7% | | | | | | |
| DnB NOR ASA | | 15,380 | | | | 157,204 |
| Statoil ASA | | 5,600 | | | | 125,238 |
| Yara International ASA | | 3,800 | | | | 62,642 |
| TOTAL NORWAY | | | | | | 345,084 |
See accompanying notes which are an integral part of the financial statements.
19 Annual Report
| Investments - continued | | | | | | |
| |
| |
| Common Stocks – continued | | | | | | |
| | | Shares | | Value (Note 1) |
| |
| Papua New Guinea – 0.0% | | | | | | |
| Lihir Gold Ltd. (a) | | 10,500 | | $ | | 13,740 |
| Oil Search Ltd. | | 4,500 | | | | 11,104 |
| TOTAL PAPUA NEW GUINEA | | | | | | 24,844 |
| |
| Singapore – 0.9% | | | | | | |
| City Developments Ltd. | | 4,000 | | | | 20,781 |
| City Developments Ltd. warrants 5/10/06 (a) | | 300 | | | | 1,116 |
| DBS Group Holdings Ltd. | | 3,000 | | | | 27,098 |
| Elec & Eltek International Co. Ltd. | | 3,600 | | | | 7,992 |
| Flextronics International Ltd. (a) | | 30,170 | | | | 280,279 |
| Fraser & Neave Ltd. | | 1,000 | | | | 9,918 |
| Keppel Corp. Ltd. | | 4,000 | | | | 27,393 |
| Olam International Ltd. | | 20,000 | | | | 15,114 |
| Parkway Holdings Ltd. | | 6,000 | | | | 7,014 |
| Singapore Exchange Ltd. | | 13,000 | | | | 20,722 |
| United Overseas Bank Ltd. | | 4,000 | | | | 32,588 |
| United Overseas Land Ltd. | | 400 | | | | 553 |
| TOTAL SINGAPORE | | | | | | 450,568 |
| |
| South Africa – 0.1% | | | | | | |
| Truworths International Ltd. | | 8,900 | | | | 25,201 |
| Spain – 1.8% | | | | | | |
| Actividades de Construccion y Servicios SA (ACS) | | 5,953 | | | | 170,197 |
| Altadis SA (Spain) | | 9,700 | | | | 411,627 |
| Banco Popular Espanol SA (Reg.) | | 6,300 | | | | 76,503 |
| Corporacion Mapfre SA (Reg.) | | 3,900 | | | | 68,304 |
| Telefonica SA | | 15,055 | | | | 240,629 |
| TOTAL SPAIN | | | | | | 967,260 |
| |
| Sweden – 1.7% | | | | | | |
| Hennes & Mauritz AB (H&M) (B Shares) | | 3,851 | | | | 125,036 |
| Skandia Foersaekrings AB | | 32,235 | | | | 160,739 |
| Svenska Handelsbanken AB (A Shares) | | 5,178 | | | | 118,043 |
| Telefonaktiebolaget LM Ericsson (B Shares) | | 155,148 | | | | 509,041 |
| TOTAL SWEDEN | | | | | | 912,859 |
| |
| Switzerland – 3.2% | | | | | | |
| ABB Ltd. (Reg.) (a) | | 20,196 | | | | 154,468 |
| Compagnie Financiere Richemont unit | | 4,201 | | | | 159,841 |
| Credit Suisse Group (Reg.) | | 5,905 | | | | 261,651 |
| Novartis AG (Reg.) | | 9,822 | | | | 528,620 |
See accompanying notes which are an integral part of the financial statements.
| Common Stocks – continued | | | | | | |
| | | Shares | | Value (Note 1) |
| |
| Switzerland – continued | | | | | | |
| Roche Holding AG (participation certificate) | | 2,977 | | $ | | 444,766 |
| UBS AG (Reg.) | | 1,735 | | | | 148,637 |
| TOTAL SWITZERLAND | | | | | | 1,697,983 |
| |
| United Kingdom – 9.9% | | | | | | |
| 3i Group PLC | | 19,783 | | | | 265,488 |
| AstraZeneca PLC (Sweden) | | 3,420 | | | | 153,355 |
| BAE Systems PLC | | 39,400 | | | | 230,543 |
| Barclays PLC | | 15,470 | | | | 153,230 |
| BG Group PLC | | 30,290 | | | | 265,990 |
| BHP Billiton PLC | | 12,800 | | | | 188,206 |
| BP PLC | | 58,400 | | | | 646,293 |
| British American Tobacco PLC | | 7,100 | | | | 156,449 |
| British Land Co. PLC | | 14,300 | | | | 225,325 |
| BT Group PLC | | 43,300 | | | | 163,718 |
| Capita Group PLC | | 9,300 | | | | 64,214 |
| Carnival PLC | | 1,700 | | | | 86,360 |
| GlaxoSmithKline PLC | | 19,431 | | | | 505,109 |
| HSBC Holdings PLC: | | | | | | |
| (Hong Kong) (Reg.) | | 3,444 | | | | 54,250 |
| (United Kingdom) (Reg.) | | 19,640 | | | | 309,369 |
| Kesa Electricals PLC | | 1,836 | | | | 7,801 |
| Old Mutual PLC | | 22,000 | | | | 51,316 |
| Prudential PLC | | 15,221 | | | | 127,734 |
| Reuters Group PLC | | 29,400 | | | | 186,994 |
| Royal Bank of Scotland Group PLC | | 3,300 | | | | 91,376 |
| Royal Dutch Shell PLC Class B | | 11,477 | | | | 375,355 |
| Scottish & Southern Energy PLC | | 11,700 | | | | 203,000 |
| Smiths Group PLC | | 3,800 | | | | 61,390 |
| Standard Chartered PLC (United Kingdom) | | 10,500 | | | | 220,474 |
| Tesco PLC | | 32,100 | | | | 170,921 |
| Vodafone Group PLC | | 95,664 | | | | 251,214 |
| TOTAL UNITED KINGDOM | | | | | | 5,215,474 |
| |
| United States of America – 38.6% | | | | | | |
| AFLAC, Inc. | | 6,430 | | | | 307,225 |
| Albany International Corp. Class A | | 4,980 | | | | 192,377 |
| Alcoa, Inc. | | 2,550 | | | | 61,940 |
| Altera Corp. (a) | | 15,200 | | | | 253,080 |
| American International Group, Inc. | | 2,920 | | | | 189,216 |
| Amphenol Corp. Class A | | 4,620 | | | | 184,661 |
| Analog Devices, Inc. | | 7,570 | | | | 263,285 |
See accompanying notes which are an integral part of the financial statements.
21 Annual Report
| Investments - continued | | | | | | |
| |
| |
| Common Stocks – continued | | | | | | |
| | | Shares | | Value (Note 1) |
| |
| United States of America – continued | | | | | | |
| Apache Corp. | | 2,740 | | $ | | 174,894 |
| Apollo Investment Corp. | | 9,654 | | | | 180,337 |
| Aramark Corp. Class B | | 3,910 | | | | 99,392 |
| Avon Products, Inc. | | 980 | | | | 26,450 |
| Baker Hughes, Inc. | | 3,800 | | | | 208,848 |
| Bank of America Corp. | | 4,746 | | | | 207,590 |
| Barr Pharmaceuticals, Inc. (a) | | 3,250 | | | | 186,713 |
| BEA Systems, Inc. (a) | | 490 | | | | 4,322 |
| Becton, Dickinson & Co. | | 4,300 | | | | 218,225 |
| Biomet, Inc. | | 780 | | | | 27,167 |
| BJ Services Co. | | 4,800 | | | | 166,800 |
| Burlington Northern Santa Fe Corp. | | 1,700 | | | | 105,502 |
| Caterpillar, Inc. | | 2,720 | | | | 143,045 |
| Cendant Corp. | | 8,420 | | | | 146,676 |
| Centex Corp. | | 4,280 | | | | 275,418 |
| Charles Schwab Corp. | | 7,710 | | | | 117,192 |
| Chevron Corp. | | 5,020 | | | | 286,491 |
| Clear Channel Communications, Inc. | | 4,154 | | | | 126,365 |
| ConocoPhillips | | 3,080 | | | | 201,370 |
| Danaher Corp. | | 6,280 | | | | 327,188 |
| Dean Foods Co. (a) | | 2,200 | | | | 79,530 |
| Dell, Inc. (a) | | 5,650 | | | | 180,122 |
| Dow Chemical Co. | | 5,820 | | | | 266,905 |
| E*TRADE Financial Corp. (a) | | 8,100 | | | | 150,255 |
| EMC Corp. (a) | | 16,420 | | | | 229,223 |
| ENSCO International, Inc. | | 4,270 | | | | 194,669 |
| Exxon Mobil Corp. | | 6,000 | | | | 336,840 |
| Fannie Mae | | 1,680 | | | | 79,834 |
| FedEx Corp. | | 2,450 | | | | 225,229 |
| FirstEnergy Corp. | | 1,890 | | | | 89,775 |
| Freeport-McMoRan Copper & Gold, Inc. Class B | | 7,330 | | | | 362,249 |
| Freescale Semiconductor, Inc. Class B (a) | | 1,470 | | | | 35,104 |
| Genentech, Inc. (a) | | 8,640 | | | | 782,780 |
| Golden West Financial Corp., Delaware | | 2,720 | | | | 159,746 |
| Goldman Sachs Group, Inc. | | 4,700 | | | | 593,939 |
| Hartford Financial Services Group, Inc. | | 4,200 | | | | 334,950 |
| Herman Miller, Inc. | | 2,100 | | | | 57,561 |
| Home Depot, Inc. | | 1,990 | | | | 81,670 |
| Hudson Highland Group, Inc. (a) | | 414 | | | | 9,907 |
| Intel Corp. | | 6,940 | | | | 163,090 |
| Intersil Corp. Class A | | 1,240 | | | | 28,222 |
| Jabil Circuit, Inc. (a) | | 10,480 | | | | 312,828 |
See accompanying notes which are an integral part of the financial statements.
| Common Stocks – continued | | | | | | |
| | | Shares | | Value (Note 1) |
| |
| United States of America – continued | | | | | | |
| Johnson & Johnson | | 3,670 | | $ | | 229,815 |
| JPMorgan Chase & Co. | | 3,580 | | | | 131,100 |
| Juniper Networks, Inc. (a) | | 6,800 | | | | 158,644 |
| KB Home | | 1,240 | | | | 81,034 |
| KLA-Tencor Corp. | | 8,640 | | | | 399,946 |
| Lattice Semiconductor Corp. (a) | | 960 | | | | 4,205 |
| Lennar Corp.: | | | | | | |
| Class A | | 2,820 | | | | 156,736 |
| Class B | | 2,696 | | | | 139,248 |
| Liberty Global, Inc.: | | | | | | |
| Class A | | 2,284 | | | | 56,575 |
| Class C (a) | | 2,284 | | | | 54,176 |
| LSI Logic Corp. (a) | | 4,950 | | | | 40,145 |
| Lyondell Chemical Co. | | 10,555 | | | | 282,874 |
| Masco Corp. | | 1,910 | | | | 54,435 |
| McDonald’s Corp. | | 7,300 | | | | 230,680 |
| Medtronic, Inc. | | 4,490 | | | | 254,403 |
| Merrill Lynch & Co., Inc. | | 2,910 | | | | 188,393 |
| MetLife, Inc. | | 6,860 | | | | 338,953 |
| Mettler-Toledo International, Inc. (a) | | 3,450 | | | | 178,020 |
| Micron Technology, Inc. (a) | | 4,770 | | | | 61,962 |
| Microsoft Corp. | | 18,520 | | | | 475,964 |
| Monsanto Co. | | 1,400 | | | | 88,214 |
| Monster Worldwide, Inc. (a) | | 10,470 | | | | 343,521 |
| Motorola, Inc. | | 3,920 | | | | 86,867 |
| National Oilwell Varco, Inc. (a) | | 2,970 | | | | 185,536 |
| National Semiconductor Corp. | | 3,840 | | | | 86,899 |
| NIKE, Inc. Class B | | 1,360 | | | | 114,308 |
| Northrop Grumman Corp. | | 1,060 | | | | 56,869 |
| Peabody Energy Corp. | | 8,400 | | | | 656,544 |
| PepsiCo, Inc. | | 4,190 | | | | 247,545 |
| Perrigo Co. | | 4,580 | | | | 61,235 |
| Pfizer, Inc. | | 10,132 | | | | 220,270 |
| Phelps Dodge Corp. | | 1,730 | | | | 208,413 |
| PolyOne Corp. (a) | | 4,210 | | | | 24,292 |
| Pride International, Inc. (a) | | 3,430 | | | | 96,280 |
| Procter & Gamble Co. | | 5,586 | | | | 312,760 |
| Pulte Homes, Inc. | | 4,940 | | | | 186,683 |
| RealNetworks, Inc. (a) | | 3,190 | | | | 24,882 |
| SBC Communications, Inc. | | 5,600 | | | | 133,560 |
| Sprint Nextel Corp. | | 6,575 | | | | 153,263 |
| St. Jude Medical, Inc. (a) | | 3,380 | | | | 162,477 |
See accompanying notes which are an integral part of the financial statements.
23 Annual Report
| Investments - continued | | | | | | | | |
| |
| |
| Common Stocks – continued | | | | | | | | |
| | | | | Shares | | Value (Note 1) |
| |
| United States of America – continued | | | | | | | | |
| Stryker Corp. | | | | 1,660 | | $ | | 68,176 |
| Symantec Corp. (a) | | | | 17,969 | | | | 428,561 |
| Synthes, Inc. | | | | 1,506 | | | | 159,461 |
| Teradyne, Inc. (a) | | | | 17,620 | | | | 238,575 |
| Texas Instruments, Inc. | | | | 14,620 | | | | 417,401 |
| Time Warner, Inc. | | | | 16,020 | | | | 285,637 |
| Transocean, Inc. (a) | | | | 2,900 | | | | 166,721 |
| TreeHouse Foods, Inc. (a) | | | | 340 | | | | 8,786 |
| UnitedHealth Group, Inc. | | | | 6,120 | | | | 354,287 |
| Univision Communications, Inc. Class A (a) | | | | 20,570 | | | | 537,700 |
| Viacom, Inc. Class B (non-vtg.) | | | | 6,701 | | | | 207,530 |
| Wal-Mart Stores, Inc. | | | | 2,150 | | | | 101,717 |
| Waste Management, Inc. | | | | 6,510 | | | | 192,110 |
| Weatherford International Ltd. (a) | | | | 5,750 | | | | 359,950 |
| Wells Fargo & Co. | | | | 1,300 | | | | 78,260 |
| Whole Foods Market, Inc. | | | | 610 | | | | 87,919 |
| Wyeth | | | | 2,670 | | | | 118,975 |
| Xilinx, Inc. | | | | 1,010 | | | | 24,190 |
| Zimmer Holdings, Inc. (a) | | | | 680 | | | | 43,364 |
| TOTAL UNITED STATES OF AMERICA | | | | | | | | 20,283,243 |
| |
| TOTAL COMMON STOCKS | | | | | | | | |
| (Cost $39,566,335) | | | | | | 47,746,656 |
| |
| Nonconvertible Preferred Stocks — 0.6% | | | | | | | | |
| |
| Germany – 0.4% | | | | | | | | |
| Fresenius AG | | | | 1,400 | | | | 196,691 |
| Italy – 0.2% | | | | | | | | |
| Telecom Italia Spa (Risp) | | | | 38,770 | | | | 93,741 |
| TOTAL NONCONVERTIBLE PREFERRED STOCKS | | | | | | | | |
| (Cost $170,495) | | | | | | | | 290,432 |
| |
| Government Obligations — 0.3% | | | | | | | | |
| | | | | Principal | | | | |
| | | | | Amount | | | | |
| |
| United States of America – 0.3% | | | | | | | | |
| U.S. Treasury Bills, yield at date of purchase 3.4% to | | | | | | | | |
| 3.7% 12/8/05 to 1/12/06 (d) | | | | | | | | |
| (Cost $173,898) | | $ | | 175,000 | | | | 173,889 |
See accompanying notes which are an integral part of the financial statements.
| Money Market Funds — 8.1% | | | | | | |
| | | | | Shares | | | | Value (Note 1) |
| Fidelity Cash Central Fund, 3.92% (b) | | | | | | | | |
| (Cost $4,282,931) | | | | 4,282,931 | | $ | | 4,282,931 |
| TOTAL INVESTMENT PORTFOLIO – 99.9% | | | | | | |
| (Cost $44,193,659) | | | | | | | | 52,493,908 |
| |
| NET OTHER ASSETS – 0.1% | | | | | | | | 52,854 |
| NET ASSETS – 100% | | | | $ | | | | 52,546,762 |
| |
| Futures Contracts | | | | | | | | |
| | | Expiration | | Underlying | | | | Unrealized |
| | | Date | | Face Amount | | | | Appreciation/ |
| | | | | at Value | | | | (Depreciation) |
| Purchased | | | | | | | | |
| Equity Index Contracts | | | | | | | | |
| 47 S&P 500 E-Mini Index Contracts | | Dec. 2005 | | $ 2,843,030 | | $ | | (58,926) |
The face value of futures purchased as a percentage of net assets – 5.4%
Legend
(a) Non-income producing
(b) Affiliated fund that is available only to investment companies and other accounts managed by Fidelity Investments. The rate quoted is the annualized seven-day yield of the fund at period end. A complete unaudited listing of the fund’s holdings as of its most recent quarter end is available upon request.
(c) Security exempt from registration under Rule 144A of the Securities Act of 1933. These securities may be resold in transactions exempt from registration, normally to qualified institutional buyers. At the period end, the value of these securities amounted to $11,111 or 0.0% of net assets.
(d) Security or a portion of the security was pledged to cover margin requirements for futures contracts. At the period end, the value of securities pledged amounted to $173,889.
At October 31, 2005, the fund had a capital loss carryforward of approximately $307,610 all of which will expire on October 31, 2010.
See accompanying notes which are an integral part of the financial statements.
25 Annual Report
| Financial Statements | | | | | | | | |
| |
| |
| Statement of Assets and Liabilities | | | | | | | | |
| | | | | | | | | October 31, 2005 |
| |
| Assets | | | | | | | | |
| Investment in securities, at value (cost $44,193,659) — | | | | | | | | |
| See accompanying schedule | | | | | | $ | | 52,493,908 |
| Receivable for investments sold | | | | | | | | 235,996 |
| Receivable for fund shares sold | | | | | | | | 35,144 |
| Dividends receivable | | | | | | | | 55,616 |
| Interest receivable | | | | | | | | 13,532 |
| Receivable for daily variation on futures contracts | | | | | | | | 23,735 |
| Receivable from investment adviser for expense | | | | | | | | |
| reductions | | | | | | | | 15,456 |
| Other receivables | | | | | | | | 2,848 |
| Total assets | | | | | | | | 52,876,235 |
| |
| Liabilities | | | | | | | | |
| Payable for investments purchased | | $ | | 160,971 | | | | |
| Payable for fund shares redeemed | | | | 43,426 | | | | |
| Accrued management fee | | | | 31,306 | | | | |
| Transfer agent fee payable | | | | 16,754 | | | | |
| Distribution fees payable | | | | 23,824 | | | | |
| Other affiliated payables | | | | 2,392 | | | | |
| Other payables and accrued expenses | | | | 50,800 | | | | |
| Total liabilities | | | | | | | | 329,473 |
| |
| Net Assets | | | | | | $ | | 52,546,762 |
| Net Assets consist of: | | | | | | | | |
| Paid in capital | | | | | | $ | | 44,601,153 |
| Undistributed net investment income | | | | | | | | 43,510 |
| Accumulated undistributed net realized gain (loss) on | | | | | | | | |
| investments and foreign currency transactions | | | | | | | | (338,186) |
| Net unrealized appreciation (depreciation) on | | | | | | | | |
| investments and assets and liabilities in foreign | | | | | | | | |
| currencies | | | | | | | | 8,240,285 |
| Net Assets | | | | | | $ | | 52,546,762 |
See accompanying notes which are an integral part of the financial statements.
| Statement of Assets and Liabilities — continued | | | | |
| | | | | October 31, 2005 |
| |
| Calculation of Maximum Offering Price | | | | |
| Class A: | | | | |
| Net Asset Value and redemption price per share | | | | |
| ($10,100,894 ÷ 738,553 shares) | | $ | | 13.68 |
| Maximum offering price per share (100/94.25 of | | | | |
| $13.68) | | $ | | 14.51 |
| Class T: | | | | |
| Net Asset Value and redemption price per share | | | | |
| ($28,785,854 ÷ 2,139,303 shares) | | $ | | 13.46 |
| Maximum offering price per share (100/96.50 of | | | | |
| $13.46) | | $ | | 13.95 |
| Class B: | | | | |
| Net Asset Value and offering price per share | | | | |
| ($6,464,081 ÷ 497,020 shares)A | | $ | | 13.01 |
| Class C: | | | | |
| Net Asset Value and offering price per share | | | | |
| ($5,396,148 ÷ 414,353 shares)A | | $ | | 13.02 |
| Institutional Class: | | | | |
| Net Asset Value, offering price and redemption | | | | |
| price per share ($1,799,785 ÷ 129,244 | | | | |
| shares) | | $ | | 13.93 |
| |
| A Redemption price per share is equal to net asset value less any applicable contingent deferred sales charge. | | | | |
See accompanying notes which are an integral part of the financial statements.
27 Annual Report
| Financial Statements - continued | | | | | | |
| |
| |
| Statement of Operations | | | | | | |
| | | | | Year ended October 31, 2005 |
| |
| Investment Income | | | | | | |
| Dividends | | | | $ | | 900,566 |
| Interest | | | | | | 108,652 |
| | | | | | | 1,009,218 |
| Less foreign taxes withheld | | | | | | (63,605) |
| Total income | | | | | | 945,613 |
| |
| Expenses | | | | | | |
| Management fee | | $ | | 353,793 | | |
| Transfer agent fees | | | | 196,176 | | |
| Distribution fees | | | | 270,020 | | |
| Accounting fees and expenses | | | | 28,469 | | |
| Independent trustees’ compensation | | | | 224 | | |
| Custodian fees and expenses | | | | 100,487 | | |
| Registration fees | | | | 46,978 | | |
| Audit | | | | 40,605 | | |
| Legal | | | | 1,582 | | |
| Miscellaneous | | | | 1,745 | | |
| Total expenses before reductions | | | | 1,040,079 | | |
| Expense reductions | | | | (137,975) | | 902,104 |
| |
| Net investment income (loss) | | | | | | 43,509 |
| Realized and Unrealized Gain (Loss) | | | | | | |
| Net realized gain (loss) on: | | | | | | |
| Investment securities | | | | 1,998,304 | | |
| Foreign currency transactions | | | | (7,706) | | |
| Futures contracts | | | | 111,427 | | |
| Total net realized gain (loss) | | | | | | 2,102,025 |
| Change in net unrealized appreciation (depreciation) on: | | | | |
| Investment securities | | | | 4,318,885 | | |
| Assets and liabilities in foreign currencies | | | | (2,880) | | |
| Futures contracts | | | | (64,882) | | |
| Total change in net unrealized appreciation | | | | | | |
| (depreciation) | | | | | | 4,251,123 |
| Net gain (loss) | | | | | | 6,353,148 |
| Net increase (decrease) in net assets resulting from | | | | | | |
| operations | | | | $ | | 6,396,657 |
See accompanying notes which are an integral part of the financial statements.
| Statement of Changes in Net Assets | | | | | | | | |
| | | | | Year ended | | | | Year ended |
| | | | | October 31, | | | | October 31, |
| | | | | 2005 | | | | 2004 |
| Increase (Decrease) in Net Assets | | | | | | | | |
| Operations | | | | | | | | |
| Net investment income (loss) | | $ | | 43,509 | | $ | | (238,310) |
| Net realized gain (loss) | | | | 2,102,025 | | | | 2,766,719 |
| Change in net unrealized appreciation (depreciation) . | | | | 4,251,123 | | | | 779,756 |
| Net increase (decrease) in net assets resulting | | | | | | | | |
| from operations | | | | 6,396,657 | | | | 3,308,165 |
| Share transactions -- net increase (decrease) | | | | 6,010,544 | | | | 6,774,804 |
| Redemption fees | | | | 2,919 | | | | 1,085 |
| Total increase (decrease) in net assets | | | | 12,410,120 | | | | 10,084,054 |
| |
| Net Assets | | | | | | | | |
| Beginning of period | | | | 40,136,642 | | | | 30,052,588 |
| End of period (including undistributed net investment | | | | | | | | |
| income of $43,510 and accumulated net investment | | | | | | | | |
| loss of $40,373, respectively) | | $ | | 52,546,762 | | $ | | 40,136,642 |
See accompanying notes which are an integral part of the financial statements.
29 Annual Report
| Financial Highlights — Class A | | | | | | | | | | | | |
| |
| Years ended October 31, | | 2005 | | 2004 | | | | 2003 | | | | 2002 | | 2001 |
| Selected Per-Share Data | | | | | | | | | | | | | | |
| Net asset value, beginning of | | | | | | | | | | | | | | |
| period | | $ 11.88 | | $ 10.73 | | $ | | 8.62 | | $ | | 9.76 | | $ 12.62 |
| Income from Investment | | | | | | | | | | | | | | |
| Operations | | | | | | | | | | | | | | |
| Net investment income (loss)C | | 05 | | (.04) | | | | (.02) | | | | (.05) | | (.02)D |
| Net realized and unrealized | | | | | | | | | | | | | | |
| gain (loss) | | 1.75 | | 1.19 | | | | 2.13 | | | | (1.09) | | (2.84) |
| Total from investment operations | | 1.80 | | 1.15 | | | | 2.11 | | | | (1.14) | | (2.86) |
| Redemption fees added to paid in | | | | | | | | | | | | | | |
| capitalC | | —F | | —F | | | | — | | | | — | | — |
| Net asset value, end of period | | $ 13.68 | | $ 11.88 | | $ | | 10.73 | | $ | | 8.62 | | $ 9.76 |
| Total ReturnA,B | | 15.15% | | 10.72% | | | | 24.48% | | | | (11.68)% | | (22.66)% |
| Ratios to Average Net AssetsE | | | | | | | | | | | | | | |
| Expenses before expense | | | | | | | | | | | | | | |
| reductions | | 1.76% | | 1.97% | | | | 2.25% | | | | 2.38% | | 2.40% |
| Expenses net of voluntary | | | | | | | | | | | | | | |
| waivers, if any | | 1.56% | | 1.75% | | | | 1.76% | | | | 1.94% | | 2.00% |
| Expenses net of all reductions | | 1.54% | | 1.72% | | | | 1.73% | | | | 1.92% | | 1.96% |
| Net investment income (loss) | | 39% | | (.33)% | | | | (.27)% | | | | (.57)% | | (.17)% |
| Supplemental Data | | | | | | | | | | | | | | |
| Net assets, end of period (000 | | | | | | | | | | | | | | |
| omitted) | | $10,101 | | $ 8,450 | | $ | | 4,436 | | $ | | 3,343 | | $ 3,516 |
| Portfolio turnover rate | | 52% | | 59% | | | | 53% | | | | 76% | | 141% |
A Total returns would have been lower had certain expenses not been reduced during the periods shown.
B Total returns do not include the effect of the sales charges.
C Calculated based on average shares outstanding during the period.
D Investment income per share reflects a special dividend which amounted to $.04 per share.
E Expense ratios reflect operating expenses of the class. Expenses before reductions do not reflect amounts reimbursed by the investment adviser or reductions from brokerage service arrangements or other expense offset arrangements and do not represent the amount paid by the class during periods when reimbursements or reductions occur. Expenses net of any voluntary waivers reflect expenses after reimbursement by the investment adviser but prior to reductions from brokerage service arrangements or other expense offset arrangements. Expenses net of all reductions repre sent the net expenses paid by the class.
F Amount represents less than $.01 per share.
See accompanying notes which are an integral part of the financial statements.
| Financial Highlights — Class T | | | | | | | | | | | | |
| |
| Years ended October 31, | | 2005 | | 2004 | | | | 2003 | | | | 2002 | | 2001 |
| Selected Per-Share Data | | | | | | | | | | | | | | |
| Net asset value, beginning of | | | | | | | | | | | | | | |
| period | | $ 11.71 | | $ 10.61 | | $ | | 8.54 | | $ | | 9.70 | | $ 12.60 |
| Income from Investment | | | | | | | | | | | | | | |
| Operations | | | | | | | | | | | | | | |
| Net investment income (loss)C | | 02 | | (.07) | | | | (.05) | | | | (.08) | | (.05)D |
| Net realized and unrealized | | | | | | | | | | | | | | |
| gain (loss) | | 1.73 | | 1.17 | | | | 2.12 | | | | (1.08) | | (2.85) |
| Total from investment operations | | 1.75 | | 1.10 | | | | 2.07 | | | | (1.16) | | (2.90) |
| Redemption fees added to paid in | | | | | | | | | | | | | | |
| capitalC | | —F | | —F | | | | — | | | | — | | — |
| Net asset value, end of period | | $ 13.46 | | $ 11.71 | | $ | | 10.61 | | $ | | 8.54 | | $ 9.70 |
| Total ReturnA,B | | 14.94% | | 10.37% | | | | 24.24% | | | | (11.96)% | | (23.02)% |
| Ratios to Average Net AssetsE | | | | | | | | | | | | | | |
| Expenses before expense | | | | | | | | | | | | | | |
| reductions | | 2.09% | | 2.39% | | | | 2.65% | | | | 2.85% | | 2.88% |
| Expenses net of voluntary | | | | | | | | | | | | | | |
| waivers, if any | | 1.81% | | 2.00% | | | | 2.01% | | | | 2.19% | | 2.25% |
| Expenses net of all reductions | | 1.79% | | 1.97% | | | | 1.98% | | | | 2.16% | | 2.21% |
| Net investment income (loss) | | 14% | | (.58)% | | | | (.52)% | | | | (.81)% | | (.42)% |
| Supplemental Data | | | | | | | | | | | | | | |
| Net assets, end of period (000 | | | | | | | | | | | | | | |
| omitted) | | $28,786 | | $20,966 | | $17,334 | | $12,496 | | $ 7,642 |
| Portfolio turnover rate | | 52% | | 59% | | | | 53% | | | | 76% | | 141% |
A Total returns would have been lower had certain expenses not been reduced during the periods shown.
B Total returns do not include the effect of the sales charges.
C Calculated based on average shares outstanding during the period.
D Investment income per share reflects a special dividend which amounted to $.04 per share.
E Expense ratios reflect operating expenses of the class. Expenses before reductions do not reflect amounts reimbursed by the investment adviser or reductions from brokerage service arrangements or other expense offset arrangements and do not represent the amount paid by the class during periods when reimbursements or reductions occur. Expenses net of any voluntary waivers reflect expenses after reimbursement by the investment adviser but prior to reductions from brokerage service arrangements or other expense offset arrangements. Expenses net of all reductions repre sent the net expenses paid by the class.
F Amount represents less than $.01 per share.
See accompanying notes which are an integral part of the financial statements.
31 Annual Report
| Financial Highlights — Class B | | | | | | | | | | | | |
| |
| Years ended October 31, | | 2005 | | 2004 | | | | 2003 | | | | 2002 | | 2001 |
| Selected Per-Share Data | | | | | | | | | | | | | | |
| Net asset value, beginning of | | | | | | | | | | | | | | |
| period | | $ 11.38 | | $ 10.36 | | $ | | 8.38 | | $ | | 9.56 | | $ 12.48 |
| Income from Investment | | | | | | | | | | | | | | |
| Operations | | | | | | | | | | | | | | |
| Net investment income (loss)C | | (.04) | | (.12) | | | | (.09) | | | | (.12) | | (.10)D |
| Net realized and unrealized | | | | | | | | | | | | | | |
| gain (loss) | | 1.67 | | 1.14 | | | | 2.07 | | | | (1.06) | | (2.82) |
| Total from investment operations | | 1.63 | | 1.02 | | | | 1.98 | | | | (1.18) | | (2.92) |
| Redemption fees added to paid in | | | | | | | | | | | | | | |
| capitalC | | —F | | —F | | | | — | | | | — | | — |
| Net asset value, end of period | | $ 13.01 | | $ 11.38 | | $ | | 10.36 | | $ | | 8.38 | | $ 9.56 |
| Total ReturnA,B | | 14.32% | | 9.85% | | | | 23.63% | | | | (12.34)% | | (23.40)% |
| Ratios to Average Net AssetsE | | | | | | | | | | | | | | |
| Expenses before expense | | | | | | | | | | | | | | |
| reductions | | 2.61% | | 3.00% | | | | 3.25% | | | | 3.36% | | 3.30% |
| Expenses net of voluntary | | | | | | | | | | | | | | |
| waivers, if any | | 2.31% | | 2.50% | | | | 2.50% | | | | 2.69% | | 2.75% |
| Expenses net of all reductions | | 2.29% | | 2.47% | | | | 2.47% | | | | 2.66% | | 2.71% |
| Net investment income (loss) | | (.36)% | | (1.08)% | | | | (1.01)% | | | | (1.31)% | | (.92)% |
| Supplemental Data | | | | | | | | | | | | | | |
| Net assets, end of period (000 | | | | | | | | | | | | | | |
| omitted) | | $ 6,464 | | $ 5,575 | | $ | | 4,918 | | $ | | 3,848 | | $ 4,865 |
| Portfolio turnover rate | | 52% | | 59% | | | | 53% | | | | 76% | | 141% |
A Total returns would have been lower had certain expenses not been reduced during the periods shown.
B Total returns do not include the effect of the contingent deferred sales charge.
C Calculated based on average shares outstanding during the period.
D Investment income per share reflects a special dividend which amounted to $.04 per share.
E Expense ratios reflect operating expenses of the class. Expenses before reductions do not reflect amounts reimbursed by the investment adviser or reductions from brokerage service arrangements or other expense offset arrangements and do not represent the amount paid by the class during periods when reimbursements or reductions occur. Expenses net of any voluntary waivers reflect expenses after reimbursement by the investment adviser but prior to reductions from brokerage service arrangements or other expense offset arrangements. Expenses net of all reductions repre sent the net expenses paid by the class.
F Amount represents less than $.01 per share.
See accompanying notes which are an integral part of the financial statements.
| Financial Highlights — Class C | | | | | | | | | | | | |
| |
| Years ended October 31, | | 2005 | | 2004 | | | | 2003 | | | | 2002 | | 2001 |
| Selected Per-Share Data | | | | | | | | | | | | | | |
| Net asset value, beginning of | | | | | | | | | | | | | | |
| period | | $ 11.39 | | $ 10.38 | | $ | | 8.39 | | $ | | 9.58 | | $ 12.49 |
| Income from Investment | | | | | | | | | | | | | | |
| Operations | | | | | | | | | | | | | | |
| Net investment income (loss)C | | (.05) | | (.12) | | | | (.09) | | | | (.12) | | (.10)D |
| Net realized and unrealized | | | | | | | | | | | | | | |
| gain (loss) | | 1.68 | | 1.13 | | | | 2.08 | | | | (1.07) | | (2.81) |
| Total from investment operations | | 1.63 | | 1.01 | | | | 1.99 | | | | (1.19) | | (2.91) |
| Redemption fees added to paid in | | | | | | | | | | | | | | |
| capitalC | | —F | | —F | | | | — | | | | — | | — |
| Net asset value, end of period | | $ 13.02 | | $ 11.39 | | $ | | 10.38 | | $ | | 8.39 | | $ 9.58 |
| Total ReturnA,B | | 14.31% | | 9.73% | | | | 23.72% | | | | (12.42)% | | (23.30)% |
| Ratios to Average Net AssetsE | | | | | | | | | | | | | | |
| Expenses before expense | | | | | | | | | | | | | | |
| reductions | | 2.59% | | 2.87% | | | | 3.10% | | | | 3.18% | | 3.16% |
| Expenses net of voluntary | | | | | | | | | | | | | | |
| waivers, if any | | 2.31% | | 2.50% | | | | 2.50% | | | | 2.69% | | 2.75% |
| Expenses net of all reductions | | 2.29% | | 2.47% | | | | 2.47% | | | | 2.66% | | 2.71% |
| Net investment income (loss) | | (.36)% | | (1.08)% | | | | (1.01)% | | | | (1.31)% | | (.92)% |
| Supplemental Data | | | | | | | | | | | | | | |
| Net assets, end of period (000 | | | | | | | | | | | | | | |
| omitted) | | $ 5,396 | | $ 3,959 | | $ | | 3,190 | | $ | | 2,967 | | $ 3,750 |
| Portfolio turnover rate | | 52% | | 59% | | | | 53% | | | | 76% | | 141% |
A Total returns would have been lower had certain expenses not been reduced during the periods shown.
B Total returns do not include the effect of the contingent deferred sales charge.
C Calculated based on average shares outstanding during the period.
D Investment income per share reflects a special dividend which amounted to $.04 per share.
E Expense ratios reflect operating expenses of the class. Expenses before reductions do not reflect amounts reimbursed by the investment adviser or reductions from brokerage service arrangements or other expense offset arrangements and do not represent the amount paid by the class during periods when reimbursements or reductions occur. Expenses net of any voluntary waivers reflect expenses after reimbursement by the investment adviser but prior to reductions from brokerage service arrangements or other expense offset arrangements. Expenses net of all reductions repre sent the net expenses paid by the class.
F Amount represents less than $.01 per share.
See accompanying notes which are an integral part of the financial statements.
33 Annual Report
| Financial Highlights — Institutional Class | | | | | | | | | | | | |
| |
| Years ended October 31, | | 2005 | | 2004 | | | | 2003 | | | | 2002 | | | | 2001 |
| Selected Per-Share Data | | | | | | | | | | | | | | | | |
| Net asset value, beginning of | | | | | | | | | | | | | | | | |
| period | | $ 12.06 | | $ 10.88 | | $ | | 8.68 | | $ | | 9.81 | | $ | | 12.68 |
| Income from Investment | | | | | | | | | | | | | | | | |
| Operations | | | | | | | | | | | | | | | | |
| Net investment income (loss)B | | 09 | | (.01) | | | | —E | | | | (.03) | | | | .01C |
| Net realized and unrealized | | | | | | | | | | | | | | | | |
| gain (loss) | | 1.78 | | 1.19 | | | | 2.20 | | | | (1.10) | | | | (2.88) |
| Total from investment operations | | 1.87 | | 1.18 | | | | 2.20 | | | | (1.13) | | | | (2.87) |
| Redemption fees added to paid in | | | | | | | | | | | | | | | | |
| capitalB | | —E | | —E | | | | — | | | | — | | | | — |
| Net asset value, end of period | | $ 13.93 | | $ 12.06 | | $ | | 10.88 | | $ | | 8.68 | | $ | | 9.81 |
| Total ReturnA | | 15.51% | | 10.85% | | | | 25.35% | | | | (11.52)% | | | | (22.63)% |
| Ratios to Average Net AssetsD | | | | | | | | | | | | | | | | |
| Expenses before expense | | | | | | | | | | | | | | | | |
| reductions | | 1.42% | | 1.55% | | | | 1.87% | | | | 1.95% | | | | 2.02% |
| Expenses net of voluntary | | | | | | | | | | | | | | | | |
| waivers, if any | | 1.31% | | 1.50% | | | | 1.50% | | | | 1.70% | | | | 1.75% |
| Expenses net of all reductions | | 1.29% | | 1.47% | | | | 1.48% | | | | 1.67% | | | | 1.71% |
| Net investment income (loss) | | 64% | | (.08)% | | | | (.01)% | | | | (.32)% | | | | .08% |
| Supplemental Data | | | | | | | | | | | | | | | | |
| Net assets, end of period (000 | | | | | | | | | | | | | | | | |
| omitted) | | $ 1,800 | | $ 1,187 | | $ | | 175 | | $ | | 808 | | $ | | 909 |
| Portfolio turnover rate | | 52% | | 59% | | | | 53% | | | | 76% | | | | 141% |
A Total returns would have been lower had certain expenses not been reduced during the periods shown.
B Calculated based on average shares outstanding during the period.
C Investment income per share reflects a special dividend which amounted to $.04 per share.
D Expense ratios reflect operating expenses of the class. Expenses before reductions do not reflect amounts reimbursed by the investment adviser or reductions from brokerage service arrangements or other expense offset arrangements and do not represent the amount paid by the class during periods when reimbursements or reductions occur. Expenses net of any voluntary waivers reflect expenses after reimbursement by the investment adviser but prior to reductions from brokerage service arrangements or other expense offset arrangements. Expenses net of all reductions repre sent the net expenses paid by the class.
E Amount represents less than $.01 per share.
See accompanying notes which are an integral part of the financial statements.
Notes to Financial Statements
For the period ended October 31, 2005
|
1. Significant Accounting Policies.
Fidelity Advisor Global Equity Fund (the fund) is a fund of Fidelity Advisor Series VIII (the trust) and is authorized to issue an unlimited number of shares. The trust is registered under the Investment Company Act of 1940, as amended (the 1940 Act), as an open-end management investment company organized as a Massachusetts business trust.
The fund offers Class A, Class T, Class B, Class C, and Institutional Class shares, each of which has equal rights as to assets and voting privileges. Each class has exclusive voting rights with respect to matters that affect that class. Class B shares will automatically convert to Class A shares after a holding period of seven years from the initial date of purchase. Investment income, realized and unrealized capital gains and losses, the common expenses of the fund, and certain fund-level expense reductions, if any, are allocated on a pro rata basis to each class based on the relative net assets of each class to the total net assets of the fund. Each class differs with respect to transfer agent and distribution and service plan fees incurred. Certain expense reductions also differ by class.
The fund may invest in affiliated money market central funds (Money Market Central Funds) which are open-end investment companies available to investment companies and other accounts managed by Fidelity Management & Research Company (FMR) and its affiliates. The financial statements have been prepared in conformity with accounting principles generally accepted in the United States of America, which require management to make certain estimates and assumptions at the date of the financial statements. The following summarizes the significant accounting policies of the fund:
Security Valuation. Investments are valued and net asset value (NAV) per share is calculated (NAV calculation) as of the close of business of the New York Stock Exchange (NYSE), normally 4:00 p.m. Eastern time. Wherever possible, the fund uses independent pricing services approved by the Board of Trustees to value its investments.
Equity securities, including restricted securities, for which market quotations are readily available, are valued at the last reported sale price or official closing price as reported by an independent pricing service on the primary market or exchange on which they are traded. In the event there were no sales during the day or closing prices are not available, securities are valued at the last quoted bid price. Investments in open-end mutual funds are valued at their closing net asset value each business day. Short-term securities with remaining maturities of sixty days or less for which quotations are not readily available are valued at amortized cost, which approximates value.
When current market prices or quotations are not readily available or do not accurately reflect fair value, valuations may be determined in accordance with procedures adopted
35 Annual Report
Notes to Financial Statements - continued
1. Significant Accounting Policies - continued
Security Valuation - continued
by the Board of Trustees. For example, when developments occur between the close of a market and the close of the NYSE that may materially affect the value of some or all of the securities, or when trading in a security is halted, those securities may be fair valued. Factors used in the determination of fair value may include monitoring news to identify significant market or security specific events such as changes in the value of U.S. securities market, reviewing developments in foreign markets and evaluating the performance of ADRs, futures contracts and exchange-traded funds. Because the fund’s utilization of fair value pricing depends on market activity, the frequency with which fair value pricing is used can not be predicted and may be utilized to a significant extent. The value of securities used for NAV calculation under fair value pricing may differ from published prices for the same securities.
Foreign Currency. The fund uses foreign currency contracts to facilitate transactions in foreign-denominated securities. Losses from these transactions may arise from changes in the value of the foreign currency or if the counterparties do not perform under the contracts’ terms.
Foreign-denominated assets, including investment securities, and liabilities are translated into U.S. dollars at the exchange rate at period end. Purchases and sales of investment securities, income and dividends received and expenses denominated in foreign currencies are translated into U.S. dollars at the exchange rate in effect on the transaction date.
The effects of exchange rate fluctuations on investments are included with the net realized and unrealized gain (loss) on investment securities. Other foreign currency transactions resulting in realized and unrealized gain (loss) are disclosed separately.
Investment Transactions and Income. Security transactions are accounted for as of trade date. Gains and losses on securities sold are determined on the basis of identified cost and may include proceeds received from litigation. Dividend income is recorded on the ex-dividend date, except for certain dividends from foreign securities where the ex-dividend date may have passed, which are recorded as soon as the fund is informed of the ex-dividend date. Non-cash dividends included in dividend income, if any, are recorded at the fair market value of the securities received. Distributions received on securities that represent a return of capital or capital gain are recorded as a reduction of cost of investments and/or as a realized gain. The fund estimates the components of distributions received that may be considered return of capital distributions or capital gain distributions. Interest income is accrued as earned. Interest income includes coupon interest and amortization of premium and accretion of discount on debt securities. Investment income is recorded net of foreign taxes withheld where recovery of such taxes is uncertain.
1. Significant Accounting Policies - continued
Expenses. Most expenses of the trust can be directly attributed to a fund. Expenses which cannot be directly attributed are apportioned among each fund in the trust.
Income Tax Information and Distributions to Shareholders. Each year, the fund intends to qualify as a regulated investment company by distributing all of its taxable income and realized gains under Subchapter M of the Internal Revenue Code. As a result, no provision for income taxes is required in the accompanying financial statements. Foreign taxes are provided for based on the fund’s understanding of the tax rules and rates that exist in the foreign markets in which it invests.
Distributions are recorded on the ex-dividend date. Income dividends and capital gain distributions are declared separately for each class. Income and capital gain distributions are determined in accordance with income tax regulations, which may differ from generally accepted accounting principles.
Capital accounts within the financial statements are adjusted for permanent book-tax differences. These adjustments have no impact on net assets or the results of operations. Temporary book-tax differences will reverse in a subsequent period.
Book-tax differences are primarily due to futures transactions, foreign currency transactions, passive foreign investment companies (PFIC), capital loss carryforwards and losses deferred due to wash sales.
The tax-basis components of distributable earnings and the federal tax cost as of period end were as follows:
| Unrealized appreciation | | $ | | 9,851,393 |
| Unrealized depreciation | | | | (1,703,404) |
| Net unrealized appreciation (depreciation) | | | | 8,147,989 |
| Undistributed ordinary income | | | | 105,226 |
| Capital loss carryforward | | | | (307,610) |
| |
| Cost for federal income tax purposes | | $ | | 44,345,919 |
Short-Term Trading (Redemption) Fees. Shares held in the fund less than 30 days are subject to a redemption fee equal to 1.00% of the proceeds of the redeemed shares. All redemption fees, including any estimated redemption fees paid by FMR, are retained by the fund and accounted for as an addition to paid in capital.
37 Annual Report
Notes to Financial Statements - continued
2. Operating Policies.
Repurchase Agreements. FMR has received an Exemptive Order from the Securities and Exchange Commission (the SEC) which permits the fund and other affiliated entities of FMR to transfer uninvested cash balances into joint trading accounts which are then invested in repurchase agreements. The fund may also invest directly with institutions in repurchase agreements. Repurchase agreements are collateralized by government or non-government securities. Collateral is held in segregated accounts with custodian banks and may be obtained in the event of a default of the counterparty. The fund monitors, on a daily basis, the value of the collateral to ensure it is at least equal to the principal amount of the repurchase agreement (including accrued interest). In the event of a default by the counterparty, realization of the collateral proceeds could be delayed, during which time the value of the collateral may decline.
Futures Contracts. The fund may use futures contracts to manage its exposure to the stock market. Buying futures tends to increase a fund’s exposure to the underlying instrument, while selling futures tends to decrease a fund’s exposure to the underlying instrument or hedge other fund investments. Futures contracts involve, to varying degrees, risk of loss in excess of any futures variation margin reflected in the Statement of Assets and Liabilities. The underlying face amount at value of any open futures contracts at period end is shown in the Schedule of Investments under the caption ”Futures Contracts.” This amount reflects each contract’s exposure to the underlying instrument at period end. Losses may arise from changes in the value of the underlying instruments or if the counterparties do not perform under the contracts’ terms. Gains (losses) are realized upon the expiration or closing of the futures contracts. Futures contracts are valued at the settlement price established each day by the board of trade or exchange on which they are traded.
Restricted Securities. The fund may invest in securities that are subject to legal or contractual restrictions on resale. These securities generally may be resold in transactions exempt from registration or to the public if the securities are registered. Disposal of these securities may involve time-consuming negotiations and expense, and prompt sale at an acceptable price may be difficult. Information regarding restricted securities is included at the end of the fund’s Schedule of Investments.
3. Purchases and Sales of Investments.
Purchases and sales of securities, other than short-term securities and U.S. government securities, aggregated $26,988,282 and $23,282,043, respectively.
4. Fees and Other Transactions with Affiliates.
Management Fee. FMR and its affiliates provide the fund with investment management related services for which the fund pays a monthly management fee. The management fee is the sum of an individual fund fee rate that is based on an annual rate of .45% of the fund’s average net assets and a group fee rate that averaged .27% during the period. The group fee rate is based upon the average net assets of all the mutual funds advised by FMR. The group fee rate decreases as assets under management increase and increases as assets under management decrease. For the period, the total annual management fee rate was .72% of the fund’s average net assets.
Distribution and Service Plan. In accordance with Rule 12b-1 of the 1940 Act, the fund has adopted separate Distribution and Service Plans for each class of shares. Certain classes pay Fidelity Distributors Corporation (FDC), an affiliate of FMR, separate Distribution and Service Fees, each of which is based on an annual percentage of each class’ average net assets. In addition, FDC may pay financial intermediaries for selling shares of the fund and providing shareholder support services. For the period, the Distribution and Service Fee rates and the total amounts paid to and retained by FDC were as follows:
| | | Distribution | | Service | | | | Paid to | | | | Retained |
| | | Fee | | Fee | | | | FDC | | | | by FDC |
| Class A | | 0% | | .25% | | $ | | 23,985 | | $ | | 1,213 |
| Class T | | 25% | | .25% | | | | 133,714 | | | | — |
| Class B | | 75% | | .25% | | | | 63,098 | | | | 47,324 |
| Class C | | 75% | | .25% | | | | 49,223 | | | | 10,945 |
| | | | | | | $ | | 270,020 | | $ | | 59,482 |
Sales Load. FDC receives a front-end sales charge of up to 5.75% for selling Class A shares, and 3.50% for selling Class T shares, some of which is paid to financial intermediaries for selling shares of the fund. FDC receives the proceeds of contingent deferred sales charges levied on Class A, Class T, Class B, and Class C redemptions. These charges depend on the holding period. The deferred sales charges range from 5% to 1% for Class B, 1% for Class C, and .25% for certain purchases of Class A and Class T shares.
| For the period, sales charge amounts retained by FDC were as follows: | | |
| | | | | Retained |
| | | | | by FDC |
| Class A | | $ | | 6,209 |
| Class T | | | | 5,088 |
| Class B* | | | | 11,117 |
| Class C* | | | | 267 |
| | | $ | | 22,681 |
* When Class B and Class C shares are initially sold, FDC pays commissions from its own resources to financial intermediaries through which the are made.
39 Annual Report
Notes to Financial Statements - continued
4. Fees and Other Transactions with Affiliates - continued
Transfer Agent Fees. Fidelity Investments Institutional Operations Company, Inc. (FIIOC), an affiliate of FMR, is the transfer, dividend disbursing and shareholder servicing agent for each class of the fund. FIIOC receives account fees and asset-based fees that vary according to the account size and type of account of the shareholders of the respective classes of the fund. FIIOC pays for typesetting, printing and mailing of shareholder reports, except proxy statements. For the period the total transfer agent fees paid by each class to FIIOC, were as follows:
| | | | | | | % of |
| | | | | | | Average |
| | | | | Amount | | Net Assets |
| Class A | | $ | | 32,874 | | .34 |
| Class T | | | | 111,649 | | .42 |
| Class B | | | | 27,480 | | .44 |
| Class C | | | | 20,553 | | .42 |
| Institutional Class | | | | 3,620 | | .25 |
| | | $ | | 196,176 | | |
Accounting Fees. Fidelity Service Company, Inc. (FSC), an affiliate of FMR, maintains the fund’s accounting records. The fee is based on the level of average net assets for the month.
Affiliated Central Funds. The fund may invest in Money Market Central Funds which seek preservation of capital and current income and are managed by Fidelity Investments Money Management, Inc. (FIMM), an affiliate of FMR. The Money Market Central Funds do not pay a management fee. Income distributions earned by the fund are recorded as income in the accompanying financial statements and totaled $104,306 for the period.
Brokerage Commissions. The fund placed a portion of its portfolio transactions with brokerage firms which are affiliates of the investment adviser. The commissions paid to these affiliated firms were $215 for the period.
5. Committed Line of Credit.
|
The fund participates with other funds managed by FMR in a $4.2 billion credit facility (the “line of credit”) to be utilized for temporary or emergency purposes to fund shareholder redemptions or for other short-term liquidity purposes. The fund has agreed to pay commitment fees on its pro rata portion of the line of credit. During the period, there were no borrowings on this line of credit.
FMR voluntarily agreed to reimburse each class to the extent annual operating expenses exceeded certain levels of average net assets as noted in the table below. Some expenses, for example interest expense, are excluded from this reimbursement.
| The following classes were in reimbursement during the period: | | | | |
| | | Expense | | | | Reimbursement |
| | | Limitations | | | | from adviser |
| |
| Class A | | 1.75% | | -- | | 1.50%* | | $ | | 19,587 |
| Class T | | 2.00% | | -- | | 1.75%* | | | | 74,574 |
| Class B | | 2.50% | | -- | | 2.25%* | | | | 18,779 |
| Class C | | 2.50% | | -- | | 2.25%* | | | | 13,656 |
| Institutional Class | | 1.50% | | -- | | 1.25%* | | | | 1,646 |
| | | | | | | | | $ | | 128,242 |
| |
| * Expense limitation in effect at period end. | | | | | | | | | | |
Many of the brokers with whom FMR places trades on behalf of the fund provided services to the fund in addition to trade execution. These services included payments of certain expenses on behalf of the fund totaling $9,733 for the period.
The fund’s organizational documents provide former and current trustees and officers with a limited indemnification against liabilities arising in connection with the performance of their duties to the fund. In the normal course of business, the fund may also enter into contracts that provide general indemnifications. The fund’s maximum exposure under these arrangements is unknown as this would be dependent on future claims that may be made against the fund. The risk of material loss from such claims is considered remote.
41 Annual Report
Notes to Financial Statements - continued
8. Share Transactions.
Transactions for each class of shares were as follows:
Shares Dollars
| Years ended October 31, | | 2005 | | 2004 | | | | 2005 | | | | 2004 |
| Class A | | | | | | | | | | | | |
| Shares sold | | 192,761 | | 384,850 | | $ | | 2,508,793 | | $ | | 4,439,108 |
| Shares redeemed | | (165,658) | | (86,624) | | | | (2,170,770) | | | | (1,001,333) |
| Net increase (decrease) | | 27,103 | | 298,226 | | $ | | 338,023 | | $ | | 3,437,775 |
| Class T | | | | | | | | | | | | |
| Shares sold | | 817,905 | | 937,092 | | $ 10,377,931 | | $ 10,650,883 |
| Shares redeemed | | (468,349) | | (780,388) | | | | (6,008,601) | | | | (8,915,832) |
| Net increase (decrease) | | 349,556 | | 156,704 | | $ | | 4,369,330 | | $ | | 1,735,051 |
| Class B | | | | | | | | | | | | |
| Shares sold | | 139,393 | | 138,798 | | $ | | 1,701,739 | | $ | | 1,541,743 |
| Shares redeemed | | (132,283) | | (123,447) | | | | (1,634,038) | | | | (1,364,796) |
| Net increase (decrease) | | 7,110 | | 15,351 | | $ | | 67,701 | | $ | | 176,947 |
| Class C | | | | | | | | | | | | |
| Shares sold | | 139,662 | | 106,121 | | $ | | 1,733,371 | | $ | | 1,182,163 |
| Shares redeemed | | (72,801) | | (66,101) | | | | (917,263) | | | | (732,887) |
| Net increase (decrease) | | 66,861 | | 40,020 | | $ | | 816,108 | | $ | | 449,276 |
| Institutional Class | | | | | | | | | | | | |
| Shares sold | | 44,364 | | 122,911 | | $ | | 600,130 | | $ | | 1,457,480 |
| Shares redeemed | | (13,527) | | (40,611) | | | | (180,748) | | | | (481,725) |
| Net increase (decrease) | | 30,837 | | 82,300 | | $ | | 419,382 | | $ | | 975,755 |
Report of Independent Registered Public Accounting Firm
To the Trustees of Fidelity Advisor Series VIII and the Shareholders of Fidelity Advisor Global Equity Fund:
In our opinion, the accompanying statement of assets and liabilities, including the schedule of investments, and the related statements of operations and of changes in net assets and the financial highlights present fairly, in all material respects, the financial position of Fidelity Advisor Global Equity Fund (a fund of Fidelity Advisor Series VIII) at October 31, 2005 and the results of its operations, the changes in its net assets and the financial highlights for the periods indicated, in conformity with accounting principles generally accepted in the United States of America. These financial statements and financial highlights (hereafter referred to as “financial statements”) are the responsibility of the Fidelity Advisor Global Equity Fund’s management; our responsibility is to express an opinion on these financial statements based on our audits. We conducted our audits of these financial statements in accordance with the standards of the Public Company Accounting Oversight Board (United States). Those standards require that we plan and perform the audit to obtain reasonable assurance about whether the financial statements are free of material misstatement. An audit includes examining, on a test basis, evidence supporting the amounts and disclosures in the financial statements, assessing the accounting principles used and significant estimates made by management, and evaluating the overall financial statement presentation. We believe that our audits, which included confirmation of securities at October 31, 2005 by correspondence with the custodian and brokers, provide a reasonable basis for our opinion.
/s/ PricewaterhouseCoopers LLP
PricewaterhouseCoopers LLP
Boston, Massachusetts
December 19, 2005
|
43 Annual Report
Trustees and Officers
The Trustees, Members of the Advisory Board, and executive officers of the trust and fund, as applicable, are listed below. The Board of Trustees governs the fund and is responsible for protecting the interests of shareholders. The Trustees are experienced executives who meet periodically throughout the year to oversee the fund’s activities, review contractual arrangements with companies that provide services to the fund, and review the fund’s performance. Except for William O. McCoy, Stephen P. Jonas, and Kenneth L. Wolfe, each of the Trustees oversees 322 funds advised by FMR or an affiliate. Mr. McCoy oversees 324 funds advised by FMR or an affiliate. Mr. Jonas and Mr. Wolfe oversee 319 funds advised by FMR or an affiliate.
The Trustees hold office without limit in time except that (a) any Trustee may resign; (b) any Trustee may be removed by written instrument, signed by at least two-thirds of the number of Trustees prior to such removal; (c) any Trustee who requests to be retired or who has become incapacitated by illness or injury may be retired by written instrument signed by a majority of the other Trustees; and (d) any Trustee may be removed at any special meeting of shareholders by a two-thirds vote of the outstanding voting securities of the trust. Each Trustee who is not an interested person (as defined in the 1940 Act) (Independent Trustee), shall retire not later than the last day of the calendar year in which his or her 72nd birthday occurs. The Independent Trustees may waive this mandatory retirement age policy with respect to individual Trustees. The executive officers and Advisory Board Members hold office without limit in time, except that any officer and Advisory Board Member may resign or may be removed by a vote of a majority of the Trustees at any regular meeting or any special meeting of the Trustees. Except as indicated, each individual has held the office shown or other offices in the same company for the past five years.
The fund’s Statement of Additional Information (SAI) includes more information about the Trustees. To request a free copy, call Fidelity at 1-877-208-0098.
Interested Trustees*:
Correspondence intended for each Trustee who is an interested person may be sent to Fidelity Investments, 82 Devonshire Street, Boston, Massachusetts 02109.
| Name, Age; Principal Occupation |
| |
| Edward C. Johnson 3d (75)** |
| |
| Year of Election or Appointment: 1983 |
| Mr. Johnson is Chairman of the Board of Trustees. Mr. Johnson serves as |
| Chief Executive Officer, Chairman, and a Director of FMR Corp.; a Di- |
| rector and Chairman of the Board and of the Executive Committee of |
| FMR; Chairman and a Director of Fidelity Management & Research (Far |
| East) Inc.; Chairman and a Director of Fidelity Investments Money Man- |
| agement, Inc.; and Chairman (2001-present) and a Director |
| (2000-present) of FMR Co., Inc. |
Annual Report 44
| Name, Age; Principal Occupation |
| |
| Abigail P. Johnson (43)** |
| |
| Year of Election or Appointment: 2001 |
| Ms. Johnson serves as President of Fidelity Employer Services Company |
| (FESCO) (2005-present). She is President and a Director of Fidelity In- |
| vestments Money Management, Inc. (2001-present), FMR Co., Inc. |
| (2001-present), and a Director of FMR Corp. Previously, Ms. Johnson |
| served as President and a Director of FMR (2001-2005), Senior Vice |
| President of the Fidelity funds (2001-2005), and managed a number of |
| Fidelity funds. |
| |
| Stephen P. Jonas (52) |
| |
| Year of Election or Appointment: 2005 |
| Mr. Jonas is Senior Vice President of Advisor Global Equity. He also |
| serves as Senior Vice President of other Fidelity funds (2005-present). |
| Mr. Jonas is Executive Director of FMR (2005-present). Previously, Mr. |
| Jonas served as President of Fidelity Enterprise Operations and Risk |
| Services (2004-2005), Chief Administrative Officer (2002-2004), and |
| Chief Financial Officer of FMR Co. (1998-2000). Mr. Jonas has been |
| with Fidelity Investments since 1987 and has held various financial and |
| management positions including Chief Financial Officer of FMR. In addi- |
| tion, he serves on the Boards of Boston Ballet (2003-present) and Sim- |
| mons College (2003-present). |
| |
| Robert L. Reynolds (53) |
| |
| Year of Election or Appointment: 2003 |
| Mr. Reynolds is a Director (2003-present) and Chief Operating Officer |
| (2002-present) of FMR Corp. He also serves on the Board at Fidelity |
| Investments Canada, Ltd. (2000-present). Previously, Mr. Reynolds |
| served as President of Fidelity Investments Institutional Retirement Group |
| (1996-2000). |
* Trustees have been determined to be “Interested Trustees” by virtue of, among other things, their affiliation with the trust or various entities under common control with FMR.
** Edward C. Johnson 3d, Trustee, is Abigail P. Johnson’s father.
45 Annual Report
Trustees and Officers - continued
Independent Trustees:
Correspondence intended for each Independent Trustee (that is, the Trustees other than the Interested Trustees) may be sent to Fidelity Investments, P.O. Box 55235, Boston, Massachusetts 02205-5235.
| Name, Age; Principal Occupation |
| |
| Dennis J. Dirks (57) |
| |
| Year of Election or Appointment: 2005 |
| Prior to his retirement in May 2003, Mr. Dirks was Chief Operating |
| Officer and a member of the Board of The Depository Trust & Clearing |
| Corporation (DTCC) (1999-2003). He also served as President, Chief |
| Operating Officer, and Board member of The Depository Trust |
| Company (DTC) (1999-2003) and President and Board member of the |
| National Securities Clearing Corporation (NSCC) (1999-2003). In addi- |
| tion, Mr. Dirks served as Chief Executive Officer and Board member of |
| the Government Securities Clearing Corporation (2001-2003) and Chief |
| Executive Officer and Board member of the Mortgage-Backed Securities |
| Clearing Corporation (2001-2003). Mr. Dirks also serves as a Trustee of |
| Manhattan College (2005-present). |
| |
| Robert M. Gates (62) |
| |
| Year of Election or Appointment: 1997 |
| Dr. Gates is Vice Chairman of the Independent Trustees (2005-present). |
| Dr. Gates is President of Texas A&M University (2002-present). He was |
| Director of the Central Intelligence Agency (CIA) from 1991 to 1993. |
| From 1989 to 1991, Dr. Gates served as Assistant to the President of |
| the United States and Deputy National Security Advisor. Dr. Gates is a |
| Director of NACCO Industries, Inc. (mining and manufacturing), Parker |
| Drilling Co., Inc. (drilling and rental tools for the energy industry, |
| 2001-present), and Brinker International (restaurant management, |
| 2003-present). Previously, Dr. Gates served as a Director of LucasVarity |
| PLC (automotive components and diesel engines), a Director of TRW Inc. |
| (automotive, space, defense, and information technology), and Dean of |
| the George Bush School of Government and Public Service at Texas |
| A&M University (1999-2001). Dr. Gates also is a Trustee of the Forum |
| for International Policy. |
Annual Report 46
| Name, Age; Principal Occupation |
| |
| George H. Heilmeier (69) |
| |
| Year of Election or Appointment: 2004 |
| Dr. Heilmeier is Chairman Emeritus of Telcordia Technologies (commu- |
| nication software and systems), where prior to his retirement, he served |
| as company Chairman and Chief Executive Officer. He currently serves |
| on the Boards of Directors of The Mitre Corporation (systems engineer- |
| ing and information technology support for the government), and HRL |
| Laboratories (private research and development, 2004-present). He is |
| Chairman of the General Motors Science & Technology Advisory Board |
| and a Life Fellow of the Institute of Electrical and Electronics Engineers |
| (IEEE) (2000-present). Dr. Heilmeier is a member of the Defense Science |
| Board and the National Security Agency Advisory Board. He is also a |
| member of the National Academy of Engineering, the American Acad- |
| emy of Arts and Sciences, and the Board of Overseers of the School of |
| Engineering and Applied Science of the University of Pennsylvania. Pre- |
| viously, Dr. Heilmeier served as a Director of TRW Inc. (automotive, |
| space, defense, and information technology, 1992-2002), Compaq |
| (1994-2002), Automatic Data Processing, Inc. (ADP) (technology-based |
| business outsourcing, 1995-2002), INET Technologies Inc. (telecommu- |
| nications network surveillance, 2001-2004), and Teletech Holdings (cus- |
| tomer management services). He is the recipient of the 2005 Kyoto Prize |
| in Advanced Technology for his invention of the liquid display. |
| |
| Marie L. Knowles (59) |
| |
| Year of Election or Appointment: 2001 |
| Prior to Ms. Knowles’ retirement in June 2000, she served as Executive |
| Vice President and Chief Financial Officer of Atlantic Richfield Company |
| (ARCO) (diversified energy, 1996-2000). From 1993 to 1996, she was |
| a Senior Vice President of ARCO and President of ARCO Transportation |
| Company. She served as a Director of ARCO from 1996 to 1998. She |
| currently serves as a Director of Phelps Dodge Corporation (copper |
| mining and manufacturing) and McKesson Corporation (healthcare ser- |
| vice, 2002-present). Ms. Knowles is a Trustee of the Brookings Institution |
| and the Catalina Island Conservancy and also serves as a member of |
| the Advisory Board for the School of Engineering of the University of |
| Southern California. |
47 Annual Report
Trustees and Officers - continued
| Name, Age; Principal Occupation |
| |
| Ned C. Lautenbach (61) |
| |
| Year of Election or Appointment: 2000 |
| Mr. Lautenbach has been a partner of Clayton, Dubilier & Rice, Inc. |
| (private equity investment firm) since September 1998. Previously, Mr. |
| Lautenbach was with the International Business Machines Corporation |
| (IBM) from 1968 until his retirement in 1998. Mr. Lautenbach serves as |
| a Director of Italtel Holding S.p.A. (telecommunications (Milan, Italy), |
| 2004-present) and Eaton Corporation (diversified industrial) as well as |
| the Philharmonic Center for the Arts in Naples, Florida. He also is a |
| member of the Board of Trustees of Fairfield University (2005-present), |
| as well as a member of the Council on Foreign Relations. |
| |
| Marvin L. Mann (72) |
| |
| Year of Election or Appointment: 1993 |
| Mr. Mann is Chairman of the Independent Trustees (2001-present). He is |
| Chairman Emeritus of Lexmark International, Inc. (computer |
| peripherals), where he served as CEO until April 1998, retired as |
| Chairman May 1999, and remains a member of the Board. Prior to |
| 1991, he held the positions of Vice President of International Business |
| Machines Corporation (IBM) and President and General Manager of |
| various IBM divisions and subsidiaries. He is a member of the Executive |
| Committee of the Independent Director’s Council of the Investment Com- |
| pany Institute. In addition, Mr. Mann is a member of the President’s |
| Cabinet at the University of Alabama and the Board of Visitors of the |
| Culverhouse College of Commerce and Business Administration at the |
| University of Alabama. |
| |
| William O. McCoy (72) |
| |
| Year of Election or Appointment: 1997 |
| Prior to his retirement in December 1994, Mr. McCoy was Vice Chair- |
| man of the Board of BellSouth Corporation (telecommunications) and |
| President of BellSouth Enterprises. He is currently a Director of Liberty |
| Corporation (holding company), Duke Realty Corporation (real estate), |
| and Progress Energy, Inc. (electric utility). He is also a partner of Frank- |
| lin Street Partners (private investment management firm) and a member |
| of the Research Triangle Foundation Board. In addition, Mr. McCoy |
| served as the Interim Chancellor (1999-2000) and a member of the |
| Board of Visitors for the University of North Carolina at Chapel Hill and |
| currently serves on the Board of Directors of the University of North |
| Carolina Health Care System and the Board of Visitors of the Kenan- |
| Flagler Business School (University of North Carolina at Chapel Hill). He |
| also served as Vice President of Finance for the University of North Car- |
| olina (16-school system). |
Annual Report 48
| Name, Age; Principal Occupation |
| |
| Cornelia M. Small (61) |
| |
| Year of Election or Appointment: 2005 |
| Ms. Small is a member (2000-present) and Chairperson (2002-present) |
| of the Investment Committee, and a member (2002-present) of the |
| Board of Trustees of Smith College. Previously, she served as Chief In- |
| vestment Officer (1999-2000), Director of Global Equity Investments |
| (1996-1999), and a member of the Board of Directors of Scudder, |
| Stevens & Clark (1990-1997) and Scudder Kemper Investments |
| (1997-1998). In addition, Ms. Small served as Co-Chair (2000-2003) |
| of the Annual Fund for the Fletcher School of Law and Diplomacy. |
| |
| William S. Stavropoulos (66) |
| |
| Year of Election or Appointment: 2001 |
| Mr. Stavropoulos is Chairman of the Board (2000-present) and a Mem- |
| ber of the Board of Directors of The Dow Chemical Company. Since |
| joining The Dow Chemical Company in 1967, Mr. Stavropoulos served |
| in numerous senior management positions, including President |
| (1993-2000; 2002-2003), CEO (1995-2000; 2002-2004), and Chair- |
| man of the Executive Committee (2000-2004). Currently, he is a Direc- |
| tor of NCR Corporation (data warehousing and technology solutions), |
| BellSouth Corporation (telecommunications), Chemical Financial Corpo- |
| ration, Maersk Inc. (industrial conglomerate, 2002-present), and Metal- |
| mark Capital (private equity investment firm, 2005-present). He also |
| serves as a member of the Board of Trustees of the American Enterprise |
| Institute for Public Policy Research. In addition, Mr. Stavropoulos is a |
| member of The Business Council, J.P. Morgan International Council and |
| the University of Notre Dame Advisory Council for the College of |
| Science. |
| |
| Kenneth L. Wolfe (66) |
| |
| Year of Election or Appointment: 2005 |
| Mr. Wolfe also serves as a Trustee (2005-present) or Member of the |
| Advisory Board (2004-present) of other investment companies advised |
| by FMR. Prior to his retirement in 2001, Mr. Wolfe was Chairman and |
| Chief Executive Officer of Hershey Foods Corporation (1993-2001). He |
| currently serves as a member of the boards of Adelphia Communica- |
| tions Corporation (2003-present), Bausch & Lomb, Inc., and Revlon Inc. |
| (2004-present). |
49 Annual Report
Trustees and Officers - continued
Advisory Board Members and Executive Officers:
Correspondence intended for Mr. Gamper may be sent to Fidelity Investments, P.O. Box 55235, Boston, Massachusetts 02205-5235. Correspondence intended for each executive officer and Mr. Lynch may be sent to Fidelity Investments, 82 Devonshire Street, Boston, Massachusetts 02109.
| Name, Age; Principal Occupation |
| |
| Albert R. Gamper, Jr. (63) |
| |
| Year of Election or Appointment: 2005 |
| Member of the Advisory Board of Fidelity Advisor Series VIII. Prior to his |
| retirement in December 2004, Mr. Gamper served as Chairman of the |
| Board of CIT Group Inc. (commercial finance). During his tenure with |
| CIT Group Inc. Mr. Gamper served in numerous senior management |
| positions, including Chairman (1987-1989; 1999-2001; 2002-2004), |
| Chief Executive Officer (1987-2004), and President (1989-2002). He |
| currently serves as a member of the Board of Directors of Public Service |
| Enterprise Group (utilities, 2001-present), Chairman of the Board of |
| Governors, Rutgers University (2004-present), and Chairman of the |
| Board of Saint Barnabas Health Care System. |
| |
| Peter S. Lynch (61) |
| |
| Year of Election or Appointment: 2003 |
| Member of the Advisory Board of Fidelity Advisor Series VIII. Vice |
| Chairman and a Director of FMR, and Vice Chairman (2001-present) |
| and a Director (2000-present) of FMR Co., Inc. Previously, Mr. Lynch |
| served as a Trustee of the Fidelity funds (1990-2003). In addition, he |
| serves as a Trustee of Boston College, Massachusetts Eye & Ear |
| Infirmary, Historic Deerfield, John F. Kennedy Library, and the Museum |
| of Fine Arts of Boston. |
| |
| Dwight D. Churchill (51) |
| |
| Year of Election or Appointment: 2005 |
| Vice President of Advisor Global Equity. Mr. Churchill also serves as |
| Vice President of certain Equity Funds (2005-present) and certain High |
| Income Funds (2005-present). Previously, he served as Head of Fidelity’s |
| Fixed-Income Division (2000-2005), Vice President of Fidelity’s Money |
| Market Funds (2000-2005), Vice President of Fidelity’s Bond Funds, and |
| Senior Vice President of FIMM (2000) and FMR. Mr. Churchill joined |
| Fidelity in 1993 as Vice President and Group Leader of Taxable Fixed- |
| Income Investments. |
Annual Report 50
| Name, Age; Principal Occupation |
| |
| Eric D. Roiter (56) |
| |
| Year of Election or Appointment: 1998 |
| Secretary of Advisor Global Equity. He also serves as Secretary of other |
| Fidelity funds; Vice President, General Counsel, and Secretary of FMR |
| Co., Inc. (2001-present) and FMR; Assistant Secretary of Fidelity Man- |
| agement & Research (U.K.) Inc. (2001-present), Fidelity Management & |
| Research (Far East) Inc. (2001-present), and Fidelity Investments Money |
| Management, Inc. (2001-present). Mr. Roiter is an Adjunct Member, |
| Faculty of Law, at Boston College Law School (2003-present). Previously, |
| Mr. Roiter served as Vice President and Secretary of Fidelity Distributors |
| Corporation (FDC) (1998-2005). |
| |
| Stuart Fross (46) |
| |
| Year of Election or Appointment: 2003 |
| Assistant Secretary of Advisor Global Equity. Mr. Fross also serves as |
| Assistant Secretary of other Fidelity funds (2003-present), Vice President |
| and Secretary of FDC (2005-present), and is an employee of FMR. |
| |
| Christine Reynolds (47) |
| |
| Year of Election or Appointment: 2004 |
| President, Treasurer, and Anti-Money Laundering (AML) officer of Advi- |
| sor Global Equity. Ms. Reynolds also serves as President, Treasurer, and |
| AML officer of other Fidelity funds (2004) and is a Vice President (2003) |
| and an employee (2002) of FMR. Before joining Fidelity Investments, |
| Ms. Reynolds worked at PricewaterhouseCoopers LLP (PwC) |
| (1980-2002), where she was most recently an audit partner with PwC’s |
| investment management practice. |
| |
| Paul M. Murphy (58) |
| |
| Year of Election or Appointment: 2005 |
| Chief Financial Officer of Advisor Global Equity. Mr. Murphy also serves |
| as Chief Financial Officer of other Fidelity funds (2005-present). He also |
| serves as Senior Vice President of Fidelity Pricing and Cash Manage- |
| ment Services Group (FPCMS). |
| |
| Kenneth A. Rathgeber (58) |
| |
| Year of Election or Appointment: 2004 |
| Chief Compliance Officer of Advisor Global Equity. Mr. Rathgeber also |
| serves as Chief Compliance Officer of other Fidelity funds (2004) and |
| Executive Vice President of Risk Oversight for Fidelity Investments |
| (2002). Previously, he served as Executive Vice President and Chief Op- |
| erating Officer for Fidelity Investments Institutional Services Company, |
| Inc. (1998-2002). |
51 Annual Report
Trustees and Officers - continued
| Name, Age; Principal Occupation |
| |
| John R. Hebble (47) |
| |
| Year of Election or Appointment: 2003 |
| Deputy Treasurer of Advisor Global Equity. Mr. Hebble also serves as |
| Deputy Treasurer of other Fidelity funds (2003), and is an employee of |
| FMR. Before joining Fidelity Investments, Mr. Hebble worked at Deutsche |
| Asset Management where he served as Director of Fund Accounting |
| (2002-2003) and Assistant Treasurer of the Scudder Funds |
| (1998-2003). |
| |
| Bryan A. Mehrmann (44) |
| |
| Year of Election or Appointment: 2005 |
| Deputy Treasurer of Advisor Global Equity. Mr. Mehrmann also serves |
| as Deputy Treasurer of other Fidelity funds (2005-present) and is an |
| employee of FMR. Previously, Mr. Mehrmann served as Vice President of |
| Fidelity Investments Institutional Services Group (FIIS)/Fidelity Investments |
| Institutional Operations Corporation, Inc. (FIIOC) Client Services |
| (1998-2004). |
| |
| Kimberley H. Monasterio (41) |
| |
| Year of Election or Appointment: 2004 |
| Deputy Treasurer of Advisor Global Equity. Ms. Monasterio also serves |
| as Deputy Treasurer of other Fidelity funds (2004) and is an employee |
| of FMR (2004). Before joining Fidelity Investments, Ms. Monasterio |
| served as Treasurer (2000-2004) and Chief Financial Officer |
| (2002-2004) of the Franklin Templeton Funds and Senior Vice President |
| of Franklin Templeton Services, LLC (2000-2004). |
| |
| Kenneth B. Robins (36) |
| |
| Year of Election or Appointment: 2005 |
| Deputy Treasurer of Advisor Global Equity. Mr. Robins also serves as |
| Deputy Treasurer of other Fidelity funds (2005-present) and is an em- |
| ployee of FMR (2004-present). Before joining Fidelity Investments, Mr. |
| Robins worked at KPMG LLP, where he was a partner in KPMG’s de- |
| partment of professional practice (2002-2004) and a Senior Manager |
| (1999-2000). In addition, Mr. Robins served as Assistant Chief Accoun- |
| tant, United States Securities and Exchange Commission (2000-2002). |
| |
| Robert G. Byrnes (38) |
| |
| Year of Election or Appointment: 2005 |
| Assistant Treasurer of Advisor Global Equity. Mr. Byrnes also serves as |
| Assistant Treasurer of other Fidelity funds (2005-present) and is an em- |
| ployee of FMR (2005-present). Previously, Mr. Byrnes served as Vice |
| President of FPCMS (2003-2005). Before joining Fidelity Investments, |
| Mr. Byrnes worked at Deutsche Asset Management where he served as |
| Vice President of the Investment Operations Group (2000-2003). |
Annual Report 52
| Name, Age; Principal Occupation |
| |
| John H. Costello (59) |
| |
| Year of Election or Appointment: 1986 |
| Assistant Treasurer of Advisor Global Equity. Mr. Costello also serves as |
| Assistant Treasurer of other Fidelity funds and is an employee of FMR. |
| |
| Peter L. Lydecker (51) |
| |
| Year of Election or Appointment: 2004 |
| Assistant Treasurer of Advisor Global Equity. Mr. Lydecker also serves as |
| Assistant Treasurer of other Fidelity funds (2004) and is an employee of |
| FMR. |
| |
| Mark Osterheld (50) |
| |
| Year of Election or Appointment: 2002 |
| Assistant Treasurer of Advisor Global Equity. Mr. Osterheld also serves |
| as Assistant Treasurer of other Fidelity funds (2002) and is an employee |
| of FMR. |
| |
| Gary W. Ryan (47) |
| |
| Year of Election or Appointment: 2005 |
| Assistant Treasurer of Advisor Global Equity. Mr. Ryan also serves as |
| Assistant Treasurer of other Fidelity funds (2005-present) and is an em- |
| ployee of FMR (2005-present). Previously, Mr. Ryan served as Vice Pres- |
| ident of Fund Reporting in FPCMS (1999-2005). |
| |
| Salvatore Schiavone (39) |
| |
| Year of Election or Appointment: 2005 |
| Assistant Treasurer of Advisor Global Equity. Mr. Schiavone also serves |
| as Assistant Treasurer of other Fidelity funds (2005-present) and is an |
| employee of FMR (2005-present). Before joining Fidelity Investments, |
| Mr. Schiavone worked at Deutsche Asset Management, where he most |
| recently served as Assistant Treasurer (2003-2005) of the Scudder |
| Funds and Vice President and Head of Fund Reporting (1996-2003). |
53 Annual Report
The Board of Trustees of Fidelity Advisor Global Equity Fund voted to pay to shareholders of record at the opening of business on record date, the following distributions per share derived from capital gains realized from sales of portfolio securities, and dividends derived from net investment income:
| | | Pay Date | | Record Date | | Dividends | | Capital Gains |
| Class A | | 12/5/2005 | | 12/2/2005 | | $0.037 | | $0.023 |
| Class T | | 12/5/2005 | | 12/2/2005 | | $0.006 | | $0.023 |
The fund will notify shareholders in January 2006 of amounts for use in preparing 2005 income tax returns.
Board Approval of Investment Advisory Contracts and Management Fees
Advisor Global Equity Fund
Each year, typically in July, the Board of Trustees, including the independent Trustees (together, the Board), votes on the renewal of the management contract and sub-advisory agreements (together, the Advisory Contracts) for the fund. The Board, assisted by the advice of fund counsel and independent Trustees’ counsel, requests and considers a broad range of information throughout the year.
The Board meets regularly each month except August and takes into account throughout the year matters bearing on Advisory Contracts. The Board, acting directly and through its separate committees, considers at each of its meetings factors that are relevant to the annual renewal of the fund’s Advisory Contracts, including the services and support provided to the fund and its shareholders by Fidelity. At the time of the renewal, the Board had 11 standing committees, each composed of independent Trustees with varying backgrounds, to which the Board has assigned specific subject matter responsibilities in order to enhance effective decision-making by the Board. Each committee has adopted a written charter outlining the structure and purposes of the committee. One such committee, the Equity Contract Committee, meets periodically during the first six months of each year and as necessary to consider matters specifically related to the annual renewal of Advisory Contracts. The committee requests and receives information on, and makes recommendations to the independent Trustees concerning, the approval and annual review of the Advisory Contracts.
At its July 2005 meeting, the Board of Trustees, including the independent Trustees, unanimously determined to renew the Advisory Contracts for the fund. In reaching its determination, the Board considered all factors it believed relevant, including (1) the nature, extent, and quality of the services to be provided to the fund and its shareholders by Fidelity (including the investment performance of the fund); (2) the competitiveness of the management fee and total expenses of the fund; (3) the total costs of the services to be provided by and the profits to be realized by the investment adviser and its affiliates from the relationship with the fund; (4) the extent to which economies of scale would be realized as the fund grows; and (5) whether fee levels reflect these economies of scale, if any, for the benefit of fund shareholders.
In determining whether to renew the Advisory Contracts for the fund, the Board ultimately reached a determination, with the assistance of fund counsel and independent Trustees’ counsel, that the renewal of the Advisory Contracts and the compensation to be received by Fidelity under the management contract is consistent with Fidelity’s fiduciary duty under applicable law. In addition to evaluating the specific factors noted above, the Board, in reaching its determination, is aware that shareholders in the fund have a broad range of investment choices available to them, including a wide choice among mutual funds offered by competitors to Fidelity, and that the fund’s shareholders, with the opportunity to review and weigh the disclosure provided by the fund in its
55 Annual Report
Board Approval of Investment Advisory Contracts and Management Fees - continued
prospectus and other public disclosures, have chosen to invest in this fund, managed by Fidelity.
Nature, Extent, and Quality of Services Provided by Fidelity. The Board considered staffing within the investment adviser, FMR, and the sub-advisers (together, the Investment Advisers), including the backgrounds of the fund’s portfolio managers and the fund’s investment objective and discipline. The independent Trustees also had discussions with senior management of Fidelity’s investment operations and investment groups. The Board considered the structure of the portfolio manager compensation program and whether this structure provides appropriate incentives.
Fidelity Resources Dedicated to Investment Management and Support Services. The Board reviewed the size, education, and experience of the Investment Advisers’ investment staff, their use of technology, and the Investment Advisers’ approach to recruiting, training, and retaining portfolio managers and other research, advisory, and management personnel. The Board considered Fidelity’s extensive global research capabilities that enable the Investment Advisers to aggregate data from various sources in an effort to produce positive investment results. The Board noted that Fidelity’s analysts have access to a variety of technological tools that enable them to perform both fundamental and quantitative analysis and to specialize in various disciplines. The Board also considered that Fidelity’s portfolio managers and analysts have access to daily portfolio attribution that allows for monitoring of a fund’s portfolio, as well as an electronic communication system that provides immediate real-time access to research concerning issuers and credit enhancers.
Shareholder and Administrative Services. The Board considered the nature, extent, quality, and cost of administrative, distribution, and shareholder services performed by the Investment Advisers and their affiliates under the Advisory Contracts and under separate agreements covering transfer agency, pricing and bookkeeping, and securities lending services for the fund. The Board also considered the nature and extent of the Investment Advisers’ supervision of third party service providers, principally custodians and subcustodians. The Board reviewed the allocation of fund brokerage, including allocations to brokers affiliated with the Investment Advisers, the use of brokerage commissions to pay fund expenses, and the use of “soft” commission dollars to pay for research services. The Board also considered that Fidelity voluntarily decided in 2004 to stop using “soft” commission dollars to pay for market data and, instead, to pay for that data out of its own resources. The Board also considered the resources devoted to, and the record of compliance with, the fund’s compliance policies and procedures.
The Board noted that the growth of fund assets across the complex allows Fidelity to reinvest in the development of services designed to enhance the value or convenience of the Fidelity funds as investment vehicles. These services include 24-hour access to
account information and market information through phone representatives and over the Internet, and investor education materials and asset allocation tools.
Investment in a Large Fund Family. The Board considered the benefits to shareholders of investing in a Fidelity fund, including the benefits of investing in a fund that is part of a large family of funds offering a variety of investment disciplines and providing for a large variety of mutual fund investor services. For example, fund shareholders are offered the privilege of exchanging shares of the fund for shares of other Fidelity funds, as set forth in the fund’s prospectus, without paying an additional sales charge. The Board noted that, since the last Advisory Contract renewals in July 2004, Fidelity has taken a number of actions that benefited particular funds, including (i) voluntarily deciding in 2004 to stop using “soft” commission dollars to pay for market data and, instead, to pay for that data out of its own resources, (ii) contractually agreeing to impose management fee reductions and expense limitations on its five Spartan stock index funds and its stock index fund available through variable insurance products, (iii) contractually agreeing to eliminate the management fees on the Fidelity Freedom Funds and the Fidelity Advisor Freedom Funds, (iv) contractually agreeing to reduce the management fees on most of its investment-grade taxable bond funds, and (v) contractually agreeing to impose expense limitations on its retail and Spartan investment-grade taxable bond funds.
Investment Performance and Compliance. The Board considered whether the fund has operated within its investment objective, as well as its record of compliance with its investment restrictions. It also reviewed the fund’s absolute investment performance for each class, as well as the fund’s relative investment performance for each class measured against (i) a broad-based securities market index, and (ii) a peer group of mutual funds deemed appropriate by the Board over multiple periods. The following charts considered by the Board show, over the one-, three-, and five-year periods ended December 31, 2004, the returns of Class C and Institutional Class of the fund, the returns of a broad-based securities market index (“benchmark”), and a range of returns of a peer group of mutual funds identified by Lipper Inc. as having an investment objective similar to that of the fund. The returns of Class C and Institutional Class represent the performance of classes with the highest and lowest 12b-1 fees, respectively (not necessarily with the highest and lowest total expenses). The box within each chart shows the 25th percentile return (bottom of box) and the 75th percentile return (top of box) of the Lipper peer group. Returns shown above the box are in the first quartile and returns shown below the box are in the fourth quartile. The percentage beaten numbers noted below each chart correspond to the percentile box and represent the percentage of funds in the Lipper peer group whose performance was equal to or lower than that of the class indicated.
57 Annual Report
Board Approval of Investment Advisory Contracts and Management Fees - continued
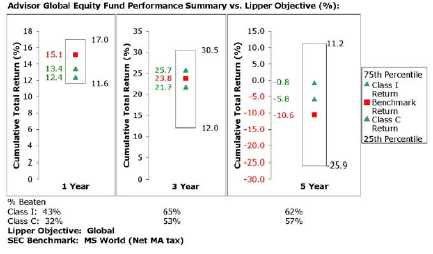
The Board reviewed the fund’s relative investment performance against its Lipper peer group and stated that the performance of Institutional Class of the fund was in the third quartile for the one-year period and the second quartile for the three- and five-year periods. The Board also stated that the relative investment performance of Institutional Class of the fund has compared favorably to its benchmark over time, although the fund’s one-year cumulative total return was lower than its benchmark. The Board considered that the variations in performance among the fund’s classes reflect the variations in class expenses, which result in lower performance for higher expense classes.
The Board has had thorough discussions with FMR throughout the year about the Board’s and FMR’s concerns about equity research, equity fund performance, and compliance with internal policies governing gifts and entertainment. FMR has taken steps that it believes will refocus and strengthen equity research and equity portfolio management and compliance. The Board noted with favor FMR’s recent reorganization of its senior management team and FMR’s plans to dedicate additional resources to investment research, and participated in the process that led to those changes.
Based on its review, and giving particular weight to the nature and quality of the resources dedicated by the Investment Advisers to maintain and improve relative performance, the Board concluded that the nature, extent, and quality of the services provided by Fidelity will benefit the fund’s shareholders, particularly in light of the Board’s view that the fund’s shareholders benefit from investing in a fund that is part of a large family of funds offering a variety of investment disciplines and services.
Competitiveness of Management Fee and Total Fund Expenses. The Board considered the fund’s management fee and total expenses compared to “mapped groups”
of competitive funds and classes. Fidelity creates “mapped groups” by combining similar Lipper investment objective categories that have comparable management fee characteristics. Combining Lipper investment objective categories aids the Board’s management fee and total expense comparisons by broadening the competitive group used for comparison and by reducing the number of universes to which various Fidelity funds are compared.
The Board considered two proprietary management fee comparisons for the 12-month periods shown in the chart below. The group of Lipper funds used by the Board for management fee comparisons is referred to below as the “Total Mapped Group” and, for the reasons explained above, is broader than the Lipper peer group used by the Board for performance comparisons. The Total Mapped Group comparison focuses on a fund’s standing relative to the total universe of comparable funds available to investors, in terms of gross management fees before expense reimbursements or caps. “TMG %” represents the percentage of funds in the Total Mapped Group that had management fees that were lower than the fund’s. For example, a TMG % of 21% means that 79% of the funds in the Total Mapped Group had higher management fees than the fund. The “Asset-Size Peer Group” (ASPG) comparison focuses on a fund’s standing relative to non-Fidelity funds similar in size to the fund within the Total Mapped Group. The ASPG represents at least 15% of the funds in the Total Mapped Group with comparable asset size and management fee characteristics, subject to a minimum of 50 funds (or all funds in the Total Mapped Group if fewer than 50). Additional information, such as the ASPG quartile (“quadrant”) in which the fund’s management fee ranked, is also included in the chart and considered by the Board.
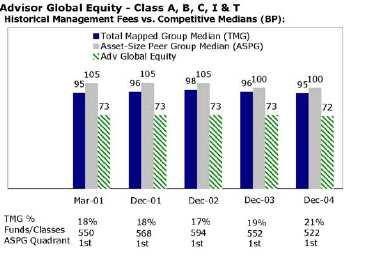
59 Annual Report
Board Approval of Investment Advisory Contracts and Management Fees - continued
The Board noted that the fund’s management fee ranked below the median of its Total Mapped Group and below the median of its ASPG for 2004.
Based on its review, the Board concluded that the fund’s management fee was fair and reasonable in light of the services that the fund receives and the other factors considered.
In its review of each class’s total expenses, the Board considered the fund’s management fee as well as other fund or class expenses, as applicable, such as transfer agent fees, pricing and bookkeeping fees, fund-paid 12b-1 fees, and custodial, legal, and audit fees. The Board also noted the effects of any waivers and reimbursements on fees and expenses. As part of its review, the Board also considered current and historical total expenses of each class of the fund compared to competitive fund median expenses. Each class of the fund is compared to those funds and classes in the Total Mapped Group (used by the Board for management fee comparisons) that have a similar sales load structure.
The Board noted that the total expenses of each class ranked above its competitive median for 2004. The Board noted that the fund offers multiple classes, each of which has a different sales load and 12b-1 fee structure, and that the multiple structures are intended to offer a range of pricing options for the intermediary market. The Board also noted that the total expenses of the classes vary primarily by the level of their 12b-1 fees, although differences in transfer agent fees may also cause expenses to vary from class to class.
Furthermore, the Board considered that on December 16, 2004, it had approved changes (effective January 1, 2005) in the transfer agent and service agreements for the fund that established maximum transfer agent fees and eliminated the minimum pricing and bookkeeping fee to prevent small funds or funds with small average account sizes from having relatively high fees in basis points (the “small-fund fee reductions”). The Board considered that, if the small-fund fee reductions had been in effect in 2004, the total expenses of each of Class A, Class B, and Class C would have ranked below the median.
In its review of total expenses, the Board also considered Fidelity fee structures and other information on clients that FMR and its affiliates service in other competitive markets, such as other mutual funds advised or subadvised by FMR or its affiliates, pension plan clients, and other institutional clients.
Based on its review, the Board concluded that the total expenses for each class of the fund were reasonable, although in all cases above the median of the universe presented for comparison, in light of the services that the fund and its shareholders receive and the other factors considered.
Costs of the Services and Profitability. The Board considered the revenues earned and the expenses incurred by Fidelity in conducting the business of developing,
marketing, distributing, managing, administering and servicing the fund and its shareholders. The Board also considered the level of Fidelity’s profits in respect of all the Fidelity funds.
On an annual basis, FMR presents to the Board Fidelity’s profitability for the fund. Fidelity calculates the profitability for each fund, as well as aggregate profitability for groups of Fidelity funds and all Fidelity funds, using a series of detailed revenue and cost allocation methodologies which originate with the audited books and records of Fidelity. The Audit Committee of the Board reviews any significant changes from the prior year’s methodologies.
PricewaterhouseCoopers LLP (PwC), independent registered accounting firm and auditor to Fidelity and certain Fidelity funds, has been engaged annually by the Board as part of the Board’s assessment of the results of Fidelity’s profitability analysis. PwC’s engagement includes the review and assessment of Fidelity’s methodologies used in determining the revenues and expenses attributable to Fidelity’s mutual fund business, and completion of agreed-upon procedures surrounding the mathematical accuracy of fund profitability and its conformity to allocation methodologies. After considering PwC’s reports issued under the engagement and information provided by Fidelity, the Board believes that while other allocation methods may also be reasonable, Fidelity’s profitability methodologies are reasonable in all material respects.
The Board has also reviewed Fidelity’s non-fund businesses and any fall-out benefits related to the mutual fund business as well as cases where Fidelity’s affiliates may benefit from or be related to the fund’s business. In addition, a special committee of the Board reviewed services provided to Fidelity by its affiliates and determined that the fees that Fidelity paid for such services were reasonable.
The Board considered the costs of the services provided by and the profits realized by Fidelity in connection with the operation of the fund and determined that the amount of profit is a fair entrepreneurial profit for the management of the fund.
Economies of Scale. The Board considered whether there have been economies of scale in respect of the management of the Fidelity funds, whether the Fidelity funds (including the fund) have appropriately benefited from any such economies of scale, and whether there is potential for realization of any further economies of scale. The Board considered the extent to which the fund will benefit from economies of scale through increased services to the fund, through waivers or reimbursements, or through fee or expense reductions, including reductions that occur through operation of the transfer agent agreement. The transfer agent fee varies in part based on the number of accounts in the fund. If the number of accounts decreases or the average account size increases, the overall transfer agent fee rate decreases.
61 Annual Report
Board Approval of Investment Advisory Contracts and Management Fees - continued
The Board recognized that the fund’s management contract incorporates a “group fee” structure, which provides for lower fee rates as total fund assets under FMR’s management increase, and for higher fee rates as total fund assets under FMR’s management decrease. The Board considered that the group fee is designed to deliver the benefits of economies of scale to fund shareholders when total fund assets increase, even if assets of any particular fund are unchanged or have declined, because some portion of Fidelity’s costs are attributable to services provided to all Fidelity funds, and all funds benefit if those costs can be allocated among more assets. The Board concluded that, given the group fee structure, fund shareholders will achieve a certain level of economies of scale as assets under FMR’s management increase at the fund complex level, regardless of whether Fidelity achieves any such economies of scale.
The Board further concluded that any potential economies of scale are being shared between fund shareholders and Fidelity in an appropriate manner.
Additional Information Requested by the Board. In order to develop fully the factual basis for consideration of the Advisory Contracts, the Board requested additional information regarding (i) equity fund transfer agency fees; (ii) Fidelity’s fund profitability methodology and the impact of various changes in the methodology over time; (iii) benefits to shareholders from economies of scale; (iv) composition and characteristics of various fund and industry data used in comparisons; and (v) compensation of portfolio managers and research analysts.
Based on its evaluation of all of the conclusions noted above, and after considering all material factors, the Board ultimately concluded that the existing advisory fee structures are fair and reasonable, and that the fund’s existing Advisory Contracts should be renewed.
Investment Adviser
Fidelity Management & Research Company
Boston, MA
Investment Sub-Advisers
FMR Co., Inc.
Fidelity Management & Research
(U.K.) Inc.
Fidelity Management & Research
(Far East) Inc.
Fidelity International
Investment Advisors
Fidelity Investments Japan Limited
Fidelity International Investment
Advisors (U.K.) Limited
General Distributor
Fidelity Distributors Corporation
Boston, MA
Transfer and Service Agents
Fidelity Investments Institutional
Operations Company, Inc.
Boston, MA
Fidelity Service Company, Inc.
Boston, MA
Custodian
State Street Bank and Trust Company
Quincy, MA
|


Fidelity® Advisor
Global Equity
Fund - Institutional Class
Annual Report October 31, 2005

| Contents | | | | |
| |
| Chairman’s Message | | 4 | | Ned Johnson’s message to shareholders. |
| Performance | | 6 | | How the fund has done over time. |
| Management’s Discussion | | 7 | | The manager’s review of fund |
| | | | | performance, strategy and outlook. |
| Shareholder Expense | | 8 | | An example of shareholder expenses. |
| Example | | | | |
| Investment Changes | | 10 | | A summary of major shifts in the fund’s |
| | | | | investments over the past six months. |
| Investments | | 11 | | A complete list of the fund’s investments |
| | | | | with their market values. |
| Financial Statements | | 25 | | Statements of assets and liabilities, |
| | | | | operations, and changes in net assets, |
| | | | | as well as financial highlights. |
| Notes | | 34 | | Notes to the financial statements. |
| Report of Independent | | 42 | | |
| Registered Public | | | | |
| Accounting Firm | | | | |
| Trustees and Officers | | 43 | | |
| Distributions | | 53 | | |
| Board Approval of | | 54 | | |
| Investment Advisory | | | | |
| Contracts and | | | | |
| Management Fees | | | | |
To view a fund’s proxy voting guidelines and proxy voting record for the 12-month period ended June 30, visit www.fidelity.com/proxyvotingresults or visit the Securities and Exchange Commission’s (SEC) web site at www.sec.gov. You may also call 1-877-208-0098 to request a free copy of the proxy voting guidelines.
Standard & Poor’s, S&P and S&P 500 are registered service marks of The McGraw-Hill Companies, Inc. and have been licensed for use by Fidelity Distributors Corporation.
Other third party marks appearing herein are the property of their respective owners.
All other marks appearing herein are registered or unregistered trademarks or service marks of FMR Corp. or an affiliated company.
The views expressed in the Management’s Discussion of Fund Performance reflect those of the portfolio manager only through the end of the period of the report as stated on the cover and do not necessarily represent the views of Fidelity or any other person in the Fidelity organization. Any such views are subject to change at any time based upon market or other conditions and Fidelity disclaims any responsibility to update such views. These views may not be relied on as investment advice and, because investment decisions for a Fidelity fund are based on numerous factors, may not be relied on as an indication of trading intent on behalf of any Fidelity fund.
This report and the financial statements contained herein are submitted for the general information of the shareholders of the fund. This report is not authorized for distribution to prospective investors in the fund unless preceded or accompanied by an effective prospectus.
A fund files its complete schedule of portfolio holdings with the SEC for the first and third quarters of each fiscal year on Form N-Q. Forms N-Q are available on the SEC’s web site at http://www.sec.gov. A fund’s Forms N-Q may be reviewed and copied at the SEC’s Public Reference Room in Washington, DC. Information regarding the operation of the SEC’s Public Reference Room may be obtained by calling 1-800-SEC-0330. For a complete list of a fund’s portfolio holdings, view the most recent quarterly holdings report, semiannual report, or annual report on Fidelity’s web site at http://www.advisor.fidelity.com.
NOT FDIC INSURED · MAY LOSE VALUE · NO BANK GUARANTEE
Neither the fund nor Fidelity Distributors Corporation is a bank.
3 Annual Report
Chairman’s Message
(Photograph of Edward C. Johnson 3d)
Dear Shareholder:
During the past year or so, much has been reported about the mutual fund industry, and much of it has been more critical than I believe is warranted. Allegations that some companies have been less than forthright with their shareholders have cast a shadow on the entire industry. I continue to find these reports disturbing, and assert that they do not create an accurate picture of the industry overall. Therefore, I would like to remind everyone where Fidelity stands on these issues. I will say two things specifically regarding allegations that some mutual fund companies were in violation of the Securities and Exchange Commission’s forward pricing rules or were involved in so-called “market timing” activities.
First, Fidelity has no agreements that permit customers who buy fund shares after 4 p.m. to obtain the 4 p.m. price. This is not a new policy. This is not to say that someone could not deceive the company through fraudulent acts. However, we are extremely diligent in preventing fraud from occurring in this manner — and in every other. But I underscore again that Fidelity has no so-called “agreements” that sanction illegal practices.
Second, Fidelity continues to stand on record, as we have for years, in opposition to predatory short-term trading that adversely affects shareholders in a mutual fund. Back in the 1980s, we initiated a fee — which is returned to the fund and, therefore, to investors — to discourage this activity. Further, we took the lead several years ago in developing a Fair Value Pricing Policy to prevent market timing on foreign securities in our funds. I am confident we will find other ways to make it more difficult for predatory traders to operate. However, this will only be achieved through close cooperation among regulators, legislators and the industry.
Yes, there have been unfortunate instances of unethical and illegal activity within the mutual fund industry from time to time. That is true of any industry. When this occurs, confessed or convicted offenders should be dealt with appropriately. But we are still concerned about the risk of over-regulation and the quick application of simplistic solutions to intricate problems. Every system can be improved, and we support and applaud well thought out improvements by regulators, legislators and industry representatives that achieve the common goal of building and protecting the value of investors’ holdings.
For nearly 60 years, Fidelity has worked very hard to improve its products and service to justify your trust. When our family founded this company in 1946, we had only a few hundred customers. Today, we serve more than 18 million customers including individual investors and participants in retirement plans across America.
Annual Report 4
Let me close by saying that we do not take your trust in us for granted, and we realize that we must always work to improve all aspects of our service to you. In turn, we urge you to continue your active participation with your financial matters, so that your interests can be well served.
Best regards,
/s/Edward C. Johnson 3d
5 Annual Report
Performance: The Bottom Line
Average annual total return reflects the change in the value of an investment, assuming reinvestment of the class’ dividend income and capital gains (the profits earned upon the sale of securities that have grown in value) and assuming a constant rate of performance each year. The $10,000 table and the fund’s returns do not reflect the deduction of taxes that a shareholder would pay on fund distributions or the redemption of fund shares. During periods of reimbursement by Fidelity, a fund’s total return will be greater than it would be had the reimbursement not occurred. How a fund did yesterday is no guarantee of how it will do tomorrow.
| Average Annual Total Returns | | | | | | |
| Periods ended October 31, 2005 | | Past 1 | | Past 5 | | Life of |
| | | year | | years | | fundA |
| Institutional Class | | 15.51% | | 1.90% | | 5.28% |
| A From December 17, 1998. | | | | | | |
| |
| $10,000 Over Life of Fund | | | | | | |
Let’s say hypothetically that $10,000 was invested in Fidelityr Advisor Global Equity Fund — Institutional Class on December 17, 1998, when the fund started. The chart shows how the value of your investment would have changed, and also shows how the MSCIr World Index performed over the same period.

Annual Report 6
Management’s Discussion of Fund Performance
Comments from Richard Habermann, Lead Portfolio Manager of Fidelity® Advisor Global Equity Fund
Global equities generally had solid advances during the year ending October 31, 2005. Encouraged by strong corporate earnings and improved economies, the stocks of most developed nations moved sharply higher. The Morgan Stanley Capital InternationalSM (MSCI®) World Index — a performance measure of developed stock markets throughout the world — gained 13.66% . Japan was among the top-performers in the index. Positive economic indicators and Prime Minister Koizumi’s decisive election victory attracted record inflows from overseas investors, fueling robust returns for Japanese equities during the second half of the period. Asia-Pacific stocks outside of Japan, including Australia and Hong Kong, also responded well to the better macroeconomic environment. European equities rose as well, despite concerns about higher energy prices and potential downgrades to economic growth in the region. Still, European constituents generally were not hurt as badly by the dramatic increase in energy prices as were U.S. equities, which finished the year well behind the world market — the only major region to underperform. By contrast, Canada — the largest supplier of oil to the United States — was a beneficiary of high oil prices and enjoyed healthy gains.
During the past year, the fund’s Institutional Class shares rose 15.51%, topping the MSCI World index and the LipperSM Global Funds Average, which returned 14.09% . Driven mainly by good stock selection, the fund outpaced the index in all major developed world markets, particularly in the United States during the second half of the period. On a regional basis, underweighting U.S. equities helped, as did overweightings in foreign markets — notably Japan — that outperformed. Country selection in Europe also bolstered returns. Most of our relative gains in the U.S. subportfolio came from within the energy, financials, materials and health care sectors. Biotechnology giant Genentech was our top individual contributor, followed by coal producer Peabody Energy and hard-disk drive maker Seagate Technology. Health care was a particular area of strength in Europe, led by German dialysis services provider Fresenius. Conversely, the fund’s aggressive positioning in the weak technology sector hurt. Our underexposure to surging utilities stocks also detracted, as did overweightings in several U.S. names that disappointed, among them biotech firm Biogen Idec and Spanish-language broadcaster Univision. Weak results in Singapore, mainly from electronics contract manufacturer Flextronics, dampened our returns in the Pacific region.
Note to shareholders:
Effective December 14, 2005, a portfolio management team led by Michael Jenkins and composed of William Bower, Penelope Dobkin, William Kennedy, Harry Lange, Brian Hogan and Peter Saperstone has been named to manage Fidelity Advisor Global Equity Fund, succeeding Richard Habermann.
The views expressed in this statement reflect those of the portfolio manager only through October 31, 2005. See page 3 for further discussion of this section of the report.
7 Annual Report
7
Shareholder Expense Example
As a shareholder of the Fund, you incur two types of costs: (1) transaction costs, including sales charges (loads) on purchase payments or redemption proceeds, redemption fees, and (2) ongoing costs, including management fees, distribution and/or service (12b-1) fees and other Fund expenses. This Example is intended to help you understand your ongoing costs (in dollars) of investing in the Fund and to compare these costs with the ongoing costs of investing in other mutual funds.
The Example is based on an investment of $1,000 invested at the beginning of the period and held for the entire period (May 1, 2005 to October 31, 2005).
The first line of the table below for each class of the Fund provides information about actual account values and actual expenses. You may use the information in this line, together with the amount you invested, to estimate the expenses that you paid over the period. Simply divide your account value by $1,000.00 (for example, an $8,600 account value divided by $1,000.00 = 8.6), then multiply the result by the number in the first line for a class of the Fund under the heading entitled “Expenses Paid During Period” to estimate the expenses you paid on your account during this period.
Hypothetical Example for Comparison Purposes
The second line of the table below for each class of the Fund provides information about hypothetical account values and hypothetical expenses based on a Class’ actual expense ratio and an assumed rate of return of 5% per year before expenses, which is not the Class’ actual return. The hypothetical account values and expenses may not be used to estimate the actual ending account balance or expenses you paid for the period. You may use this information to compare the ongoing costs of investing in the Fund and other funds. To do so, compare this 5% hypothetical example with the 5% hypothetical examples that appear in the shareholder reports of the other funds.
Please note that the expenses shown in the table are meant to highlight your ongoing costs only and do not reflect any transaction costs. Therefore, the second line of the table is useful in comparing ongoing costs only, and will not help you determine the relative total costs of owning different funds. In addition, if these transactional costs were included, your costs would have been higher.
| | | | | | | | | | | | | Expenses Paid |
| | | | | Beginning | | | | Ending | | | | During Period* |
| | | | | Account Value | | | | Account Value | | | | May 1, 2005 |
| | | | | May 1, 2005 | | | | October 31, 2005 | | to October 31, 2005 |
| Class A | | | | | | | | | | | | |
| Actual | | $ | | 1,000.00 | | $ | | 1,097.90 | | $ | | 7.93 |
| HypotheticalA | | $ | | 1,000.00 | | $ | | 1,017.64 | | $ | | 7.63 |
| Class T | | | | | | | | | | | | |
| Actual | | $ | | 1,000.00 | | $ | | 1,097.00 | | $ | | 9.25 |
| HypotheticalA | | $ | | 1,000.00 | | $ | | 1,016.38 | | $ | | 8.89 |
| Class B | | | | | | | | | | | | |
| Actual | | $ | | 1,000.00 | | $ | | 1,094.20 | | $ | | 11.88 |
| HypotheticalA | | $ | | 1,000.00 | | $ | | 1,013.86 | | $ | | 11.42 |
Annual Report 8
| | | | | | | | | | | | | Expenses Paid |
| | | | | Beginning | | | | Ending | | | | During Period* |
| | | | | Account Value | | | | Account Value | | | | May 1, 2005 |
| | | | | May 1, 2005 | | | | October 31, 2005 | | to October 31, 2005 |
| Class C | | | | | | | | | | | | |
| Actual | | $ | | 1,000.00 | | $ | | 1,093.20 | | $ | | 11.87 |
| HypotheticalA | | $ | | 1,000.00 | | $ | | 1,013.86 | | $ | | 11.42 |
| Institutional Class | | | | | | | | | | | | |
| Actual | | $ | | 1,000.00 | | $ | | 1,099.40 | | $ | | 6.61 |
| HypotheticalA | | $ | | 1,000.00 | | $ | | 1,018.90 | | $ | | 6.36 |
| |
| |
| A 5% return per year before expenses | | | | | | | | |
* Expenses are equal to each Class’ annualized expense ratio (shown in the table below); multiplied by the average account value over the period, multiplied by 184/365 (to reflect the one-half year period).
| | | Annualized |
| | | Expense Ratio |
| Class A | | 1.50% |
| Class T | | 1.75% |
| Class B | | 2.25% |
| Class C | | 2.25% |
| Institutional Class | | 1.25% |
9 Annual Report
Investment Changes
| Top Five Stocks as of October 31, 2005 | | | | |
| | | % of fund’s | | % of fund’s net assets |
| | | net assets | | 6 months ago |
| Genentech, Inc. (United States of America, | | | | |
| Biotechnology) | | 1.5 | | 1.9 |
| Peabody Energy Corp. (United States of | | | | |
| America, Oil, Gas & Consumable Fuels) | | 1.2 | | 0.8 |
| BP PLC (United Kingdom, Oil, Gas & | | | | |
| Consumable Fuels) | | 1.2 | | 1.1 |
| Goldman Sachs Group, Inc. (United States of | | | | |
| America, Capital Markets) | | 1.1 | | 0.7 |
| Total SA Series B (France, Oil, Gas & | | | | |
| Consumable Fuels) | | 1.1 | | 1.1 |
| | | 6.1 | | |
| Top Five Market Sectors as of October 31, 2005 | | |
| | | % of fund’s | | % of fund’s net assets |
| | | net assets | | 6 months ago |
| Financials | | 20.0 | | 19.4 |
| Energy | | 13.6 | | 10.9 |
| Information Technology | | 13.6 | | 14.6 |
| Consumer Discretionary | | 11.9 | | 12.4 |
| Health Care | | 9.7 | | 11.0 |
| Top Five Countries as of October 31, 2005 | | |
| (excluding cash equivalents) | | % of fund’s | | % of fund’s net assets |
| | | net assets | | 6 months ago |
| United States of America | | 38.6 | | 44.3 |
| Japan | | 12.2 | | 11.7 |
| United Kingdom | | 9.9 | | 10.2 |
| Canada | | 3.9 | | 2.9 |
| Switzerland | | 3.2 | | 3.8 |
| Percentages are adjusted for the effect of open futures contracts, if applicable. | | |
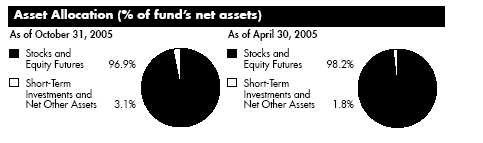
Annual Report 10
| Investments October 31, 2005 | | | | | | | | |
| Showing Percentage of Net Assets | | | | | | | | |
| |
| Common Stocks — 90.9% | | | | | | | | |
| | | | | Shares | | Value (Note 1) |
| |
| Australia – 2.4% | | | | | | | | |
| Alumina Ltd. | | | | 1,300 | | $ | | 5,628 |
| AMP Ltd. | | | | 13,700 | | | | 74,680 |
| Australia & New Zealand Banking Group Ltd. | | | | 7,509 | | | | 132,230 |
| Australian Gas Light Co. | | | | 1,053 | | | | 11,921 |
| Australian Stock Exchange Ltd. | | | | 1,000 | | | | 21,513 |
| AXA Asia Pacific Holdings Ltd. | | | | 3,400 | | | | 12,025 |
| BHP Billiton Ltd. | | | | 13,885 | | | | 215,565 |
| Billabong International Ltd. | | | | 3,500 | | | | 33,866 |
| Brambles Industries Ltd. | | | | 2,100 | | | | 13,269 |
| Coca-Cola Amatil Ltd. | | | | 2,742 | | | | 15,624 |
| Commonwealth Bank of Australia | | | | 3,200 | | | | 93,032 |
| CSL Ltd. | | | | 400 | | | | 11,216 |
| Fosters Group Ltd. | | | | 12,400 | | | | 53,778 |
| Lion Nathan Ltd. | | | | 4,100 | | | | 24,189 |
| Macquarie Airports unit | | | | 3,100 | | | | 6,954 |
| National Australia Bank Ltd. | | | | 1,000 | | | | 24,802 |
| Newcrest Mining Ltd. | | | | 3,300 | | | | 44,910 |
| Origin Energy Ltd. | | | | 2,387 | | | | 11,994 |
| Publishing & Broadcasting Ltd. | | | | 655 | | | | 7,895 |
| QBE Insurance Group Ltd. | | | | 3,208 | | | | 42,698 |
| Rinker Group Ltd. | | | | 784 | | | | 8,829 |
| Rio Tinto Ltd. | | | | 1,157 | | | | 48,716 |
| Seek Ltd. | | | | 13,100 | | | | 27,819 |
| Wesfarmers Ltd. | | | | 600 | | | | 16,017 |
| Westfield Group unit | | | | 7,500 | | | | 93,151 |
| Westpac Banking Corp. | | | | 7,500 | | | | 116,369 |
| Woodside Petroleum Ltd. | | | | 2,700 | | | | 63,798 |
| Woolworths Ltd. | | | | 3,147 | | | | 38,427 |
| WorleyParsons Ltd. | | | | 800 | | | | 5,862 |
| TOTAL AUSTRALIA | | | | | | | | 1,276,777 |
| |
| Austria – 0.2% | | | | | | | | |
| Erste Bank der Oesterreichischen Sparkassen AG | | | | 2,200 | | | | 114,457 |
| Belgium – 0.1% | | | | | | | | |
| Belgacom SA | | | | 1,300 | | | | 43,572 |
| Bermuda – 0.7% | | | | | | | | |
| Accenture Ltd. Class A | | | | 2,800 | | | | 73,668 |
| Aquarius Platinum Ltd. (Australia) | | | | 1,200 | | | | 8,973 |
| Marvell Technology Group Ltd. (a) | | | | 6,500 | | | | 301,665 |
| TOTAL BERMUDA | | | | | | | | 384,306 |
See accompanying notes which are an integral part of the financial statements.
11 Annual Report
| Investments - continued | | | | | | |
| |
| |
| Common Stocks – continued | | | | | | |
| | | Shares | | Value (Note 1) |
| |
| Canada – 3.9% | | | | | | |
| Aeroplan Income Fund (a)(c) | | 1,080 | | $ | | 11,111 |
| Alimentation Couche-Tard, Inc. Class B (sub. vtg.) (a) | | 900 | | | | 16,308 |
| Alliance Atlantis Communications, Inc. Class B (non-vtg.) (a) | | 430 | | | | 10,741 |
| Astral Media, Inc. Class A (non-vtg.) | | 340 | | | | 9,054 |
| Bank of Nova Scotia | | 670 | | | | 24,389 |
| Brascan Corp. Class A (ltd. vtg.) | | 1,505 | | | | 68,649 |
| Brookfield Properties Corp. | | 860 | | | | 25,196 |
| Canadian Imperial Bank of Commerce | | 640 | | | | 39,126 |
| Canadian National Railway Co. | | 1,370 | | | | 99,183 |
| Canadian Natural Resources Ltd. | | 2,740 | | | | 112,036 |
| Canadian Oil Sands Trust unit | | 210 | | | | 19,738 |
| Canadian Pacific Railway Ltd. | | 420 | | | | 17,266 |
| Canadian Tire Corp. Ltd. Class A (non-vtg.) | | 440 | | | | 22,842 |
| Cathedral Energy Services Income Trust | | 2,570 | | | | 19,912 |
| CCS Income Trust | | 260 | | | | 6,492 |
| Chum Ltd. Class B (non-vtg.) | | 240 | | | | 6,097 |
| Cyries Energy, Inc. (a) | | 830 | | | | 10,415 |
| EnCana Corp. | | 2,998 | | | | 137,080 |
| FirstService Corp. (sub. vtg.) (a) | | 770 | | | | 17,930 |
| Fording Canadian Coal Trust | | 1,290 | | | | 43,779 |
| Garda World Security Corp. (a) | | 1,160 | | | | 13,849 |
| Gildan Activewear, Inc. Class A (a) | | 1,290 | | | | 45,112 |
| Great Canadian Gaming Corp. (a) | | 540 | | | | 6,356 |
| Husky Energy, Inc. | | 1,250 | | | | 57,684 |
| Imperial Oil Ltd. | | 770 | | | | 67,285 |
| ING Canada, Inc | | 1,710 | | | | 64,143 |
| IPSCO, Inc. | | 960 | | | | 68,403 |
| La Senza Corp. (sub. vtg.) | | 290 | | | | 4,457 |
| Manulife Financial Corp. | | 1,690 | | | | 87,963 |
| Melcor Developments Ltd. | | 80 | | | | 6,638 |
| Metro, Inc. Class A (sub. vtg.) | | 2,140 | | | | 59,616 |
| National Bank of Canada | | 1,070 | | | | 53,582 |
| Onex Corp. (sub. vtg.) | | 1,240 | | | | 20,978 |
| Petro-Canada | | 1,720 | | | | 59,945 |
| Potash Corp. of Saskatchewan | | 365 | | | | 29,923 |
| Real Resources, Inc. (a) | | 210 | | | | 4,072 |
| RioCan (REIT) | | 1,390 | | | | 23,775 |
| Rogers Communications, Inc. Class B (non-vtg.) | | 1,180 | | | | 46,561 |
| RONA, Inc. (a) | | 570 | | | | 10,589 |
| Rothmans, Inc. | | 210 | | | | 4,289 |
| Royal Bank of Canada | | 1,710 | | | | 120,656 |
| Savanna Energy Services Corp. (a) | | 860 | | | | 17,659 |
See accompanying notes which are an integral part of the financial statements.
| Common Stocks – continued | | | | | | |
| | | Shares | | Value (Note 1) |
| |
| Canada – continued | | | | | | |
| Shore Gold, Inc. (a) | | 1,250 | | $ | | 7,599 |
| SNC-Lavalin Group, Inc. | | 540 | | | | 34,064 |
| Sun Life Financial, Inc. | | 1,010 | | | | 37,672 |
| Talisman Energy, Inc. | | 2,140 | | | | 94,787 |
| Teck Cominco Ltd. Class B (sub. vtg.) | | 340 | | | | 14,325 |
| TELUS Corp. | | 2,440 | | | | 93,798 |
| Toronto-Dominion Bank | | 1,800 | | | | 84,894 |
| Trican Well Service Ltd. (a) | | 940 | | | | 35,276 |
| TSX Group, Inc. | | 1,240 | | | | 38,092 |
| Wajax Income Fund | | 1,200 | | | | 24,386 |
| TOTAL CANADA | | | | | | 2,055,772 |
| |
| Cayman Islands – 1.5% | | | | | | |
| Ctrip.com International Ltd. sponsored ADR | | 300 | | | | 17,259 |
| Noble Corp. | | 5,960 | | | | 383,705 |
| Seagate Technology | | 25,420 | | | | 368,336 |
| TOTAL CAYMAN ISLANDS | | | | | | 769,300 |
| |
| China – 0.0% | | | | | | |
| ZTE Corp. (H Shares) | | 4,400 | | | | 12,998 |
| Denmark – 0.3% | | | | | | |
| Danske Bank AS | | 4,730 | | | | 148,341 |
| Finland – 0.4% | | | | | | |
| Fortum Oyj | | 7,240 | | | | 128,188 |
| Neste Oil Oyj | | 3,110 | | | | 96,372 |
| TOTAL FINLAND | | | | | | 224,560 |
| |
| France – 3.1% | | | | | | |
| AXA SA | | 6,374 | | | | 184,591 |
| BNP Paribas SA | | 3,892 | | | | 295,095 |
| Gaz de France | | 800 | | | | 24,598 |
| Groupe Danone | | 1,300 | | | | 132,618 |
| Societe Generale Series A | | 900 | | | | 102,763 |
| Total SA Series B | | 2,225 | | | | 560,789 |
| Vivendi Universal SA | | 9,900 | | | | 311,058 |
| TOTAL FRANCE | | | | | | 1,611,512 |
| |
| Germany – 2.7% | | | | | | |
| Allianz AG (Reg.) | | 1,100 | | | | 155,540 |
| Bilfinger & Berger Bau AG | | 1,600 | | | | 69,240 |
| Continental AG | | 2,200 | | | | 168,257 |
| Deutsche Boerse AG | | 3,077 | | | | 289,551 |
See accompanying notes which are an integral part of the financial statements.
13 Annual Report
| Investments - continued | | | | | | |
| |
| |
| Common Stocks – continued | | | | | | |
| | | Shares | | Value (Note 1) |
| |
| Germany – continued | | | | | | |
| E.ON AG | | 4,100 | | $ | | 371,583 |
| Merck KGaA | | 1,100 | | | | 90,985 |
| SAP AG | | 1,700 | | | | 291,992 |
| TOTAL GERMANY | | | | | | 1,437,148 |
| |
| Greece – 0.6% | | | | | | |
| EFG Eurobank Ergasias SA | | 5,500 | | | | 165,487 |
| Greek Organization of Football Prognostics SA | | 5,200 | | | | 150,103 |
| TOTAL GREECE | | | | | | 315,590 |
| |
| Hong Kong – 0.8% | | | | | | |
| BOC Hong Kong Holdings Ltd. | | 5,500 | | | | 10,252 |
| Cafe de Coral Holdings Ltd. | | 6,000 | | | | 6,772 |
| Cheung Kong Holdings Ltd. | | 5,000 | | | | 52,018 |
| China Mobile (Hong Kong) Ltd. | | 12,000 | | | | 53,880 |
| CNOOC Ltd. | | 21,000 | | | | 13,797 |
| Henderson Land Development Co. Ltd. | | 1,000 | | | | 4,457 |
| Hong Kong & China Gas Co. Ltd. | | 17,400 | | | | 35,913 |
| Hutchison Whampoa Ltd. | | 6,000 | | | | 56,810 |
| JCG Holdings Ltd. | | 4,000 | | | | 3,973 |
| Li & Fung Ltd. | | 20,000 | | | | 42,698 |
| MTR Corp. Ltd. | | 6,000 | | | | 11,339 |
| Shanghai Industrial Holdings Ltd. Class H | | 3,000 | | | | 5,340 |
| Sun Hung Kai Properties Ltd. | | 4,000 | | | | 37,822 |
| Swire Pacific Ltd. (A Shares) | | 3,500 | | | | 31,379 |
| Television Broadcasts Ltd. | | 4,000 | | | | 22,213 |
| Wharf Holdings Ltd. | | 9,000 | | | | 30,708 |
| Wing Hang Bank Ltd. | | 2,000 | | | | 13,661 |
| TOTAL HONG KONG | | | | | | 433,032 |
| |
| Ireland – 0.3% | | | | | | |
| CRH PLC | | 6,927 | | | | 173,133 |
| Italy – 1.9% | | | | | | |
| Autostrade Spa | | 6,940 | | | | 158,641 |
| Banca Intesa Spa | | 15,509 | | | | 72,376 |
| Banco Popolare di Verona e Novara | | 8,790 | | | | 162,270 |
| ENI Spa | | 15,611 | | | | 417,594 |
| Lottomatica Spa New | | 2,700 | | | | 98,070 |
| Seat Pagine Gialle Spa | | 186,100 | | | | 86,446 |
| TOTAL ITALY | | | | | | 995,397 |
See accompanying notes which are an integral part of the financial statements.
| Common Stocks – continued | | | | | | |
| | | Shares | | Value (Note 1) |
| |
| Japan – 12.2% | | | | | | |
| Advantest Corp. | | 600 | | $ | | 43,439 |
| Aeon Co. Ltd. | | 3,500 | | | | 72,745 |
| Aiful Corp. | | 200 | | | | 15,017 |
| Aisin Seiki Co. Ltd. | | 1,000 | | | | 30,137 |
| Arisawa Manufacturing Co. Ltd. | | 100 | | | | 1,639 |
| Asahi Glass Co. Ltd. | | 6,000 | | | | 65,159 |
| Astellas Pharma, Inc. | | 2,200 | | | | 79,067 |
| BSL Corp. warrants 12/15/05 (a) | | 1,300 | | | | 293 |
| Canon, Inc. | | 2,300 | | | | 122,061 |
| Citizen Watch Co. Ltd. | | 2,400 | | | | 18,290 |
| Cyber Agent Ltd. | | 10 | | | | 18,013 |
| Cyber Agent Ltd. New | | 18 | | | | 32,424 |
| Dai Nippon Printing Co. Ltd. | | 1,000 | | | | 16,446 |
| Dainippon Screen Manufacturing Co. Ltd. | | 5,000 | | | | 30,787 |
| Daiwa House Industry Co. Ltd. | | 1,000 | | | | 13,458 |
| Denki Kagaku Kogyo KK | | 9,000 | | | | 33,047 |
| Denso Corp. | | 1,500 | | | | 42,738 |
| Diamond Lease Co. Ltd. | | 400 | | | | 18,671 |
| Don Quijote Co. Ltd. | | 400 | | | | 28,960 |
| East Japan Railway Co | | 7 | | | | 41,829 |
| Fanuc Ltd. | | 900 | | | | 70,927 |
| Fuji Television Network, Inc. | | 14 | | | | 31,281 |
| Fujikura Ltd. | | 6,000 | | | | 38,867 |
| Fujitsu Ltd. | | 14,000 | | | | 92,629 |
| Hamamatsu Photonics KK | | 500 | | | | 11,626 |
| Hankyu Department Stores, Inc. | | 2,000 | | | | 16,021 |
| Haseko Corp. (a) | | 29,500 | | | | 102,190 |
| Hokuhoku Financial Group, Inc. | | 5,000 | | | | 20,741 |
| Honda Motor Co. Ltd. | | 2,600 | | | | 144,612 |
| Hoya Corp. New | | 300 | | | | 10,470 |
| Index Corp. New | | 11 | | | | 12,384 |
| Isetan Co. Ltd. | | 1,600 | | | | 28,821 |
| ITOCHU TECHNO-SCIENCE Corp. (CTC) | | 600 | | | | 22,967 |
| JAFCO Co. Ltd. | | 700 | | | | 42,192 |
| JFE Holdings, Inc. | | 1,500 | | | | 46,635 |
| JSR Corp. | | 3,900 | | | | 92,374 |
| Juroku Bank Ltd. | | 1,000 | | | | 8,348 |
| Kamigumi Co. Ltd. | | 4,000 | | | | 33,082 |
| Kurita Water Industries Ltd. | | 1,100 | | | | 18,500 |
| Kyocera Corp. | | 400 | | | | 25,984 |
| Leopalace21 Corp. | | 4,800 | | | | 124,706 |
| livedoor Co. Ltd. (a) | | 13,546 | | | | 49,857 |
See accompanying notes which are an integral part of the financial statements.
15 Annual Report
| Investments - continued | | | | | | |
| |
| |
| Common Stocks – continued | | | | | | |
| | | Shares | | Value (Note 1) |
| |
| Japan – continued | | | | | | |
| Marui Co. Ltd. | | 1,500 | | $ | | 24,902 |
| Matsushita Electric Industrial Co. Ltd. | | 4,000 | | | | 73,600 |
| Meitec Corp. | | 700 | | | | 22,733 |
| Miraca Holdings, Inc. | | 1,100 | | | | 24,673 |
| Mitsubishi Corp. | | 5,300 | | | | 103,272 |
| Mitsubishi Electric Corp. | | 6,000 | | | | 36,009 |
| Mitsubishi Estate Co. Ltd. | | 3,000 | | | | 44,505 |
| Mitsubishi Heavy Industries Ltd. | | 9,000 | | | | 34,138 |
| Mitsubishi Logistics Corp. | | 1,000 | | | | 13,804 |
| Mitsubishi UFJ Financial Group, Inc. | | 11 | | | | 139,590 |
| Mitsubishi UFJ Securities Co. Ltd. | | 2,000 | | | | 22,880 |
| Mitsui & Co. Ltd. | | 9,000 | | | | 110,911 |
| Mitsui Fudosan Co. Ltd. | | 3,000 | | | | 49,233 |
| Mitsui Mining & Smelting Co. Ltd. | | 10,000 | | | | 57,157 |
| Mitsui O.S.K. Lines Ltd. | | 4,000 | | | | 28,267 |
| Mitsui Trust Holdings, Inc. | | 6,000 | | | | 72,434 |
| Mitsui-Soko Co. Ltd. | | 3,000 | | | | 16,757 |
| Mizuho Financial Group, Inc. | | 29 | | | | 193,884 |
| Murata Manufacturing Co. Ltd. | | 500 | | | | 24,985 |
| NGK Insulators Ltd. | | 5,000 | | | | 59,798 |
| NGK Spark Plug Co. Ltd. | | 4,000 | | | | 64,397 |
| Nichias Corp. | | 5,000 | | | | 28,925 |
| Nikko Cordial Corp. | | 5,500 | | | | 66,683 |
| Nippon Electric Glass Co. Ltd. | | 1,000 | | | | 19,182 |
| Nippon Mining Holdings, Inc. | | 9,500 | | | | 70,178 |
| Nippon Oil Corp. | | 14,000 | | | | 119,181 |
| Nippon Steel Corp. | | 17,000 | | | | 60,803 |
| Nippon Television Network Corp. | | 240 | | | | 39,116 |
| Nishimatsuya Chain Co. Ltd. | | 1,100 | | | | 41,915 |
| Nitto Denko Corp. | | 800 | | | | 48,566 |
| NOK Corp. | | 1,500 | | | | 45,336 |
| Nomura Holdings, Inc. | | 2,800 | | | | 43,372 |
| Nomura Research Institute Ltd. | | 600 | | | | 62,249 |
| NTT Data Corp. | | 13 | | | | 45,371 |
| NTT DoCoMo, Inc. | | 86 | | | | 148,780 |
| Oki Electric Industry Co. Ltd. | | 3,000 | | | | 9,353 |
| Onward Kashiyama Co. Ltd. | | 2,000 | | | | 32,043 |
| Opt, Inc. (a) | | 4 | | | | 15,277 |
| ORIX Corp. | | 200 | | | | 37,533 |
| Rakuten, Inc. | | 46 | | | | 30,037 |
| Resona Holdings, Inc. (a) | | 23 | | | | 66,727 |
| Ricoh Co. Ltd. | | 2,000 | | | | 31,852 |
See accompanying notes which are an integral part of the financial statements.
| Common Stocks – continued | | | | | | |
| | | Shares | | Value (Note 1) |
| |
| Japan – continued | | | | | | |
| Rohm Co. Ltd. | | 700 | | $ | | 56,863 |
| Sankyo Co. Ltd. (Gunma) | | 200 | | | | 10,583 |
| SBI Holdings, Inc. | | 40 | | | | 19,988 |
| Sega Sammy Holdings, Inc. | | 200 | | | | 7,205 |
| Sega Sammy Holdings, Inc. New | | 400 | | | | 14,514 |
| Seven & I Holdings Co. Ltd. (a) | | 2,220 | | | | 73,057 |
| SFCG Co. Ltd. | | 90 | | | | 21,738 |
| Shin-Etsu Chemical Co. Ltd. | | 1,900 | | | | 91,157 |
| SMC Corp. | | 400 | | | | 53,381 |
| Softbank Corp. | | 700 | | | | 39,707 |
| Sompo Japan Insurance, Inc | | 8,000 | | | | 120,550 |
| Stanley Electric Co. Ltd. | | 1,800 | | | | 27,794 |
| Sumisho Computer Service Corp. | | 800 | | | | 14,480 |
| Sumitomo Chemical Co. Ltd. | | 6,000 | | | | 35,593 |
| Sumitomo Corp. | | 7,000 | | | | 78,201 |
| Sumitomo Electric Industries Ltd. | | 5,000 | | | | 65,904 |
| Sumitomo Heavy Industries Ltd. | | 9,000 | | | | 63,133 |
| Sumitomo Metal Industries Ltd. | | 13,000 | | | | 45,033 |
| Sumitomo Mitsui Financial Group, Inc. | | 30 | | | | 277,991 |
| Sumitomo Realty & Development Co. Ltd. | | 3,000 | | | | 48,584 |
| Suzuki Motor Corp. | | 1,400 | | | | 24,127 |
| T&D Holdings, Inc. | | 300 | | | | 18,940 |
| Taiheiyo Cement Corp. | | 9,000 | | | | 32,580 |
| Take & Give Needs Co. Ltd. (a) | | 14 | | | | 19,641 |
| Takeda Pharamaceutical Co. Ltd. | | 1,500 | | | | 82,618 |
| Takefuji Corp. | | 680 | | | | 47,759 |
| Teijin Ltd | | 8,000 | | | | 47,804 |
| The Sumitomo Warehouse Co. Ltd. | | 2,000 | | | | 15,554 |
| THK Co. Ltd. | | 1,900 | | | | 42,946 |
| TIS, Inc. | | 800 | | | | 18,914 |
| Tokai Tokyo Securities Co. Ltd. | | 5,000 | | | | 19,615 |
| Tokyo Broadcasting System, Inc. | | 400 | | | | 11,431 |
| Tokyo Electron Ltd. | | 600 | | | | 30,189 |
| Tokyo Steel Manufacturing Co. Ltd. | | 1,500 | | | | 19,550 |
| Tokyu Corp. | | 5,000 | | | | 27,366 |
| Tokyu Land Corp. | | 3,000 | | | | 23,876 |
| Toray Industries, Inc. | | 7,000 | | | | 39,040 |
| Toshiba Machine Co. Ltd. | | 8,000 | | | | 57,504 |
| Toyota Motor Corp. | | 7,200 | | | | 334,116 |
| Trans Cosmos, Inc. | | 400 | | | | 20,299 |
| Ushio, Inc. | | 1,000 | | | | 18,706 |
| Yahoo! Japan Corp | | 12 | | | | 12,782 |
See accompanying notes which are an integral part of the financial statements.
17 Annual Report
| Investments - continued | | | | | | |
| |
| |
| Common Stocks – continued | | | | | | |
| | | Shares | | Value (Note 1) |
| |
| Japan – continued | | | | | | |
| Yahoo! Japan Corp. New | | 26 | | $ | | 28,146 |
| Yamaha Motor Co. Ltd. (a) | | 1,500 | | | | 32,281 |
| Yamato Transport Co. Ltd. | | 2,000 | | | | 33,065 |
| Yaskawa Electric Corp. (a) | | 11,000 | | | | 86,021 |
| Yokogawa Electric Corp. | | 2,200 | | | | 32,484 |
| TOTAL JAPAN | | | | | | 6,392,652 |
| |
| Liberia – 0.3% | | | | | | |
| Royal Caribbean Cruises Ltd. | | 3,400 | | | | 140,896 |
| Luxembourg – 0.2% | | | | | | |
| SES Global unit | | 5,100 | | | | 80,639 |
| Marshall Islands – 0.1% | | | | | | |
| Teekay Shipping Corp. | | 1,100 | | | | 43,384 |
| Netherlands – 1.6% | | | | | | |
| Euronext NV | | 2,200 | | | | 93,491 |
| ING Groep NV (Certificaten Van Aandelen) | | 4,310 | | | | 124,387 |
| James Hardie Industries NV | | 2,000 | | | | 12,697 |
| Koninklijke Numico NV (a) | | 8,100 | | | | 328,000 |
| Rodamco Europe NV | | 1,100 | | | | 87,557 |
| VNU NV | | 5,400 | | | | 171,735 |
| TOTAL NETHERLANDS | | | | | | 817,867 |
| |
| Netherlands Antilles – 0.5% | | | | | | |
| Schlumberger Ltd. (NY Shares) | | 2,900 | | | | 263,233 |
| New Zealand – 0.2% | | | | | | |
| Carter Holt Harvey Ltd. | | 12,000 | | | | 20,994 |
| Fisher & Paykel Healthcare Corp. | | 5,800 | | | | 14,084 |
| Sky City Entertainment Group Ltd. | | 5,105 | | | | 16,219 |
| Sky Network Television Ltd. New | | 1,668 | | | | 7,225 |
| Telecom Corp. of New Zealand Ltd. | | 7,217 | | | | 29,563 |
| Tenon Ltd. | | 575 | | | | 1,489 |
| TOTAL NEW ZEALAND | | | | | | 89,574 |
| |
| Norway – 0.7% | | | | | | |
| DnB NOR ASA | | 15,380 | | | | 157,204 |
| Statoil ASA | | 5,600 | | | | 125,238 |
| Yara International ASA | | 3,800 | | | | 62,642 |
| TOTAL NORWAY | | | | | | 345,084 |
See accompanying notes which are an integral part of the financial statements.
| Common Stocks – continued | | | | | | |
| | | Shares | | Value (Note 1) |
| |
| Papua New Guinea – 0.0% | | | | | | |
| Lihir Gold Ltd. (a) | | 10,500 | | $ | | 13,740 |
| Oil Search Ltd. | | 4,500 | | | | 11,104 |
| TOTAL PAPUA NEW GUINEA | | | | | | 24,844 |
| |
| Singapore – 0.9% | | | | | | |
| City Developments Ltd. | | 4,000 | | | | 20,781 |
| City Developments Ltd. warrants 5/10/06 (a) | | 300 | | | | 1,116 |
| DBS Group Holdings Ltd. | | 3,000 | | | | 27,098 |
| Elec & Eltek International Co. Ltd. | | 3,600 | | | | 7,992 |
| Flextronics International Ltd. (a) | | 30,170 | | | | 280,279 |
| Fraser & Neave Ltd. | | 1,000 | | | | 9,918 |
| Keppel Corp. Ltd. | | 4,000 | | | | 27,393 |
| Olam International Ltd. | | 20,000 | | | | 15,114 |
| Parkway Holdings Ltd. | | 6,000 | | | | 7,014 |
| Singapore Exchange Ltd. | | 13,000 | | | | 20,722 |
| United Overseas Bank Ltd. | | 4,000 | | | | 32,588 |
| United Overseas Land Ltd. | | 400 | | | | 553 |
| TOTAL SINGAPORE | | | | | | 450,568 |
| |
| South Africa – 0.1% | | | | | | |
| Truworths International Ltd. | | 8,900 | | | | 25,201 |
| Spain – 1.8% | | | | | | |
| Actividades de Construccion y Servicios SA (ACS) | | 5,953 | | | | 170,197 |
| Altadis SA (Spain) | | 9,700 | | | | 411,627 |
| Banco Popular Espanol SA (Reg.) | | 6,300 | | | | 76,503 |
| Corporacion Mapfre SA (Reg.) | | 3,900 | | | | 68,304 |
| Telefonica SA | | 15,055 | | | | 240,629 |
| TOTAL SPAIN | | | | | | 967,260 |
| |
| Sweden – 1.7% | | | | | | |
| Hennes & Mauritz AB (H&M) (B Shares) | | 3,851 | | | | 125,036 |
| Skandia Foersaekrings AB | | 32,235 | | | | 160,739 |
| Svenska Handelsbanken AB (A Shares) | | 5,178 | | | | 118,043 |
| Telefonaktiebolaget LM Ericsson (B Shares) | | 155,148 | | | | 509,041 |
| TOTAL SWEDEN | | | | | | 912,859 |
| |
| Switzerland – 3.2% | | | | | | |
| ABB Ltd. (Reg.) (a) | | 20,196 | | | | 154,468 |
| Compagnie Financiere Richemont unit | | 4,201 | | | | 159,841 |
| Credit Suisse Group (Reg.) | | 5,905 | | | | 261,651 |
| Novartis AG (Reg.) | | 9,822 | | | | 528,620 |
See accompanying notes which are an integral part of the financial statements.
19 Annual Report
| Investments - continued | | | | | | |
| |
| |
| Common Stocks – continued | | | | | | |
| | | Shares | | Value (Note 1) |
| |
| Switzerland – continued | | | | | | |
| Roche Holding AG (participation certificate) | | 2,977 | | $ | | 444,766 |
| UBS AG (Reg.) | | 1,735 | | | | 148,637 |
| TOTAL SWITZERLAND | | | | | | 1,697,983 |
| |
| United Kingdom – 9.9% | | | | | | |
| 3i Group PLC | | 19,783 | | | | 265,488 |
| AstraZeneca PLC (Sweden) | | 3,420 | | | | 153,355 |
| BAE Systems PLC | | 39,400 | | | | 230,543 |
| Barclays PLC | | 15,470 | | | | 153,230 |
| BG Group PLC | | 30,290 | | | | 265,990 |
| BHP Billiton PLC | | 12,800 | | | | 188,206 |
| BP PLC | | 58,400 | | | | 646,293 |
| British American Tobacco PLC | | 7,100 | | | | 156,449 |
| British Land Co. PLC | | 14,300 | | | | 225,325 |
| BT Group PLC | | 43,300 | | | | 163,718 |
| Capita Group PLC | | 9,300 | | | | 64,214 |
| Carnival PLC | | 1,700 | | | | 86,360 |
| GlaxoSmithKline PLC | | 19,431 | | | | 505,109 |
| HSBC Holdings PLC: | | | | | | |
| (Hong Kong) (Reg.) | | 3,444 | | | | 54,250 |
| (United Kingdom) (Reg.) | | 19,640 | | | | 309,369 |
| Kesa Electricals PLC | | 1,836 | | | | 7,801 |
| Old Mutual PLC | | 22,000 | | | | 51,316 |
| Prudential PLC | | 15,221 | | | | 127,734 |
| Reuters Group PLC | | 29,400 | | | | 186,994 |
| Royal Bank of Scotland Group PLC | | 3,300 | | | | 91,376 |
| Royal Dutch Shell PLC Class B | | 11,477 | | | | 375,355 |
| Scottish & Southern Energy PLC | | 11,700 | | | | 203,000 |
| Smiths Group PLC | | 3,800 | | | | 61,390 |
| Standard Chartered PLC (United Kingdom) | | 10,500 | | | | 220,474 |
| Tesco PLC | | 32,100 | | | | 170,921 |
| Vodafone Group PLC | | 95,664 | | | | 251,214 |
| TOTAL UNITED KINGDOM | | | | | | 5,215,474 |
| |
| United States of America – 38.6% | | | | | | |
| AFLAC, Inc. | | 6,430 | | | | 307,225 |
| Albany International Corp. Class A | | 4,980 | | | | 192,377 |
| Alcoa, Inc. | | 2,550 | | | | 61,940 |
| Altera Corp. (a) | | 15,200 | | | | 253,080 |
| American International Group, Inc. | | 2,920 | | | | 189,216 |
| Amphenol Corp. Class A | | 4,620 | | | | 184,661 |
| Analog Devices, Inc. | | 7,570 | | | | 263,285 |
See accompanying notes which are an integral part of the financial statements.
| Common Stocks – continued | | | | | | |
| | | Shares | | Value (Note 1) |
| |
| United States of America – continued | | | | | | |
| Apache Corp. | | 2,740 | | $ | | 174,894 |
| Apollo Investment Corp. | | 9,654 | | | | 180,337 |
| Aramark Corp. Class B | | 3,910 | | | | 99,392 |
| Avon Products, Inc. | | 980 | | | | 26,450 |
| Baker Hughes, Inc. | | 3,800 | | | | 208,848 |
| Bank of America Corp. | | 4,746 | | | | 207,590 |
| Barr Pharmaceuticals, Inc. (a) | | 3,250 | | | | 186,713 |
| BEA Systems, Inc. (a) | | 490 | | | | 4,322 |
| Becton, Dickinson & Co. | | 4,300 | | | | 218,225 |
| Biomet, Inc. | | 780 | | | | 27,167 |
| BJ Services Co. | | 4,800 | | | | 166,800 |
| Burlington Northern Santa Fe Corp. | | 1,700 | | | | 105,502 |
| Caterpillar, Inc. | | 2,720 | | | | 143,045 |
| Cendant Corp. | | 8,420 | | | | 146,676 |
| Centex Corp. | | 4,280 | | | | 275,418 |
| Charles Schwab Corp. | | 7,710 | | | | 117,192 |
| Chevron Corp. | | 5,020 | | | | 286,491 |
| Clear Channel Communications, Inc. | | 4,154 | | | | 126,365 |
| ConocoPhillips | | 3,080 | | | | 201,370 |
| Danaher Corp. | | 6,280 | | | | 327,188 |
| Dean Foods Co. (a) | | 2,200 | | | | 79,530 |
| Dell, Inc. (a) | | 5,650 | | | | 180,122 |
| Dow Chemical Co. | | 5,820 | | | | 266,905 |
| E*TRADE Financial Corp. (a) | | 8,100 | | | | 150,255 |
| EMC Corp. (a) | | 16,420 | | | | 229,223 |
| ENSCO International, Inc. | | 4,270 | | | | 194,669 |
| Exxon Mobil Corp. | | 6,000 | | | | 336,840 |
| Fannie Mae | | 1,680 | | | | 79,834 |
| FedEx Corp. | | 2,450 | | | | 225,229 |
| FirstEnergy Corp. | | 1,890 | | | | 89,775 |
| Freeport-McMoRan Copper & Gold, Inc. Class B | | 7,330 | | | | 362,249 |
| Freescale Semiconductor, Inc. Class B (a) | | 1,470 | | | | 35,104 |
| Genentech, Inc. (a) | | 8,640 | | | | 782,780 |
| Golden West Financial Corp., Delaware | | 2,720 | | | | 159,746 |
| Goldman Sachs Group, Inc. | | 4,700 | | | | 593,939 |
| Hartford Financial Services Group, Inc. | | 4,200 | | | | 334,950 |
| Herman Miller, Inc. | | 2,100 | | | | 57,561 |
| Home Depot, Inc. | | 1,990 | | | | 81,670 |
| Hudson Highland Group, Inc. (a) | | 414 | | | | 9,907 |
| Intel Corp. | | 6,940 | | | | 163,090 |
| Intersil Corp. Class A | | 1,240 | | | | 28,222 |
| Jabil Circuit, Inc. (a) | | 10,480 | | | | 312,828 |
See accompanying notes which are an integral part of the financial statements.
21 Annual Report
| Investments - continued | | | | | | |
| |
| |
| Common Stocks – continued | | | | | | |
| | | Shares | | Value (Note 1) |
| |
| United States of America – continued | | | | | | |
| Johnson & Johnson | | 3,670 | | $ | | 229,815 |
| JPMorgan Chase & Co. | | 3,580 | | | | 131,100 |
| Juniper Networks, Inc. (a) | | 6,800 | | | | 158,644 |
| KB Home | | 1,240 | | | | 81,034 |
| KLA-Tencor Corp. | | 8,640 | | | | 399,946 |
| Lattice Semiconductor Corp. (a) | | 960 | | | | 4,205 |
| Lennar Corp.: | | | | | | |
| Class A | | 2,820 | | | | 156,736 |
| Class B | | 2,696 | | | | 139,248 |
| Liberty Global, Inc.: | | | | | | |
| Class A | | 2,284 | | | | 56,575 |
| Class C (a) | | 2,284 | | | | 54,176 |
| LSI Logic Corp. (a) | | 4,950 | | | | 40,145 |
| Lyondell Chemical Co. | | 10,555 | | | | 282,874 |
| Masco Corp. | | 1,910 | | | | 54,435 |
| McDonald’s Corp. | | 7,300 | | | | 230,680 |
| Medtronic, Inc. | | 4,490 | | | | 254,403 |
| Merrill Lynch & Co., Inc. | | 2,910 | | | | 188,393 |
| MetLife, Inc. | | 6,860 | | | | 338,953 |
| Mettler-Toledo International, Inc. (a) | | 3,450 | | | | 178,020 |
| Micron Technology, Inc. (a) | | 4,770 | | | | 61,962 |
| Microsoft Corp. | | 18,520 | | | | 475,964 |
| Monsanto Co. | | 1,400 | | | | 88,214 |
| Monster Worldwide, Inc. (a) | | 10,470 | | | | 343,521 |
| Motorola, Inc. | | 3,920 | | | | 86,867 |
| National Oilwell Varco, Inc. (a) | | 2,970 | | | | 185,536 |
| National Semiconductor Corp. | | 3,840 | | | | 86,899 |
| NIKE, Inc. Class B | | 1,360 | | | | 114,308 |
| Northrop Grumman Corp. | | 1,060 | | | | 56,869 |
| Peabody Energy Corp. | | 8,400 | | | | 656,544 |
| PepsiCo, Inc. | | 4,190 | | | | 247,545 |
| Perrigo Co. | | 4,580 | | | | 61,235 |
| Pfizer, Inc. | | 10,132 | | | | 220,270 |
| Phelps Dodge Corp. | | 1,730 | | | | 208,413 |
| PolyOne Corp. (a) | | 4,210 | | | | 24,292 |
| Pride International, Inc. (a) | | 3,430 | | | | 96,280 |
| Procter & Gamble Co. | | 5,586 | | | | 312,760 |
| Pulte Homes, Inc. | | 4,940 | | | | 186,683 |
| RealNetworks, Inc. (a) | | 3,190 | | | | 24,882 |
| SBC Communications, Inc. | | 5,600 | | | | 133,560 |
| Sprint Nextel Corp. | | 6,575 | | | | 153,263 |
| St. Jude Medical, Inc. (a) | | 3,380 | | | | 162,477 |
See accompanying notes which are an integral part of the financial statements.
| Common Stocks – continued | | | | | | | | |
| | | | | Shares | | Value (Note 1) |
| |
| United States of America – continued | | | | | | | | |
| Stryker Corp. | | | | 1,660 | | $ | | 68,176 |
| Symantec Corp. (a) | | | | 17,969 | | | | 428,561 |
| Synthes, Inc. | | | | 1,506 | | | | 159,461 |
| Teradyne, Inc. (a) | | | | 17,620 | | | | 238,575 |
| Texas Instruments, Inc. | | | | 14,620 | | | | 417,401 |
| Time Warner, Inc. | | | | 16,020 | | | | 285,637 |
| Transocean, Inc. (a) | | | | 2,900 | | | | 166,721 |
| TreeHouse Foods, Inc. (a) | | | | 340 | | | | 8,786 |
| UnitedHealth Group, Inc. | | | | 6,120 | | | | 354,287 |
| Univision Communications, Inc. Class A (a) | | | | 20,570 | | | | 537,700 |
| Viacom, Inc. Class B (non-vtg.) | | | | 6,701 | | | | 207,530 |
| Wal-Mart Stores, Inc. | | | | 2,150 | | | | 101,717 |
| Waste Management, Inc. | | | | 6,510 | | | | 192,110 |
| Weatherford International Ltd. (a) | | | | 5,750 | | | | 359,950 |
| Wells Fargo & Co. | | | | 1,300 | | | | 78,260 |
| Whole Foods Market, Inc. | | | | 610 | | | | 87,919 |
| Wyeth | | | | 2,670 | | | | 118,975 |
| Xilinx, Inc. | | | | 1,010 | | | | 24,190 |
| Zimmer Holdings, Inc. (a) | | | | 680 | | | | 43,364 |
| TOTAL UNITED STATES OF AMERICA | | | | | | | | 20,283,243 |
| |
| TOTAL COMMON STOCKS | | | | | | | | |
| (Cost $39,566,335) | | | | | | 47,746,656 |
| |
| Nonconvertible Preferred Stocks — 0.6% | | | | | | | | |
| |
| Germany – 0.4% | | | | | | | | |
| Fresenius AG | | | | 1,400 | | | | 196,691 |
| Italy – 0.2% | | | | | | | | |
| Telecom Italia Spa (Risp) | | | | 38,770 | | | | 93,741 |
| TOTAL NONCONVERTIBLE PREFERRED STOCKS | | | | | | | | |
| (Cost $170,495) | | | | | | | | 290,432 |
| |
| Government Obligations — 0.3% | | | | | | | | |
| | | | | Principal | | | | |
| | | | | Amount | | | | |
| |
| United States of America – 0.3% | | | | | | | | |
| U.S. Treasury Bills, yield at date of purchase 3.4% to | | | | | | | | |
| 3.7% 12/8/05 to 1/12/06 (d) | | | | | | | | |
| (Cost $173,898) | | $ | | 175,000 | | | | 173,889 |
See accompanying notes which are an integral part of the financial statements.
23 Annual Report
| Investments - continued | | | | | | | | |
| |
| Money Market Funds — 8.1% | | | | | | |
| | | | | Shares | | | | Value (Note 1) |
| Fidelity Cash Central Fund, 3.92% (b) | | | | | | | | |
| (Cost $4,282,931) | | | | 4,282,931 | | $ | | 4,282,931 |
| TOTAL INVESTMENT PORTFOLIO – 99.9% | | | | | | |
| (Cost $44,193,659) | | | | | | | | 52,493,908 |
| |
| NET OTHER ASSETS – 0.1% | | | | | | | | 52,854 |
| NET ASSETS – 100% | | | | $ | | | | 52,546,762 |
| |
| Futures Contracts | | | | | | | | |
| | | Expiration | | Underlying | | | | Unrealized |
| | | Date | | Face Amount | | | | Appreciation/ |
| | | | | at Value | | | | (Depreciation) |
| Purchased | | | | | | | | |
| Equity Index Contracts | | | | | | | | |
| 47 S&P 500 E-Mini Index Contracts | | Dec. 2005 | | $ 2,843,030 | | $ | | (58,926) |
The face value of futures purchased as a percentage of net assets – 5.4%
Legend
| (a) | | Non-income producing |
| (b) | | Affiliated fund that is available only to investment companies and other accounts managed |
| | | by Fidelity Investments. The rate quoted is the annualized seven-day yield of the fund at |
| | | period end. A complete unaudited listing of the fund’s holdings as of its most recent quarter |
| | | end is available upon request. |
| (c) | | Security exempt from registration under Rule 144A of the Securities Act of 1933. These |
| | | securities may be resold in transactions exempt from registration, normally to qualified |
| | | institutional buyers. At the period end, the value of these securities amounted to $11,111 or |
| | | 0.0% of net assets. |
| (d) | | Security or a portion of the security was pledged to cover margin requirements for futures |
| | | contracts. At the period end, the value of securities pledged amounted to $173,889. |
At October 31, 2005, the fund had a capital loss carryforward of approximately $307,610 all of which will expire on October 31, 2010.
See accompanying notes which are an integral part of the financial statements.
| Financial Statements | | | | | | | | |
| |
| |
| Statement of Assets and Liabilities | | | | | | | | |
| | | | | | | | | October 31, 2005 |
| |
| Assets | | | | | | | | |
| Investment in securities, at value (cost $44,193,659) — | | | | | | | | |
| See accompanying schedule | | | | | | $ | | 52,493,908 |
| Receivable for investments sold | | | | | | | | 235,996 |
| Receivable for fund shares sold | | | | | | | | 35,144 |
| Dividends receivable | | | | | | | | 55,616 |
| Interest receivable | | | | | | | | 13,532 |
| Receivable for daily variation on futures contracts | | | | | | | | 23,735 |
| Receivable from investment adviser for expense | | | | | | | | |
| reductions | | | | | | | | 15,456 |
| Other receivables | | | | | | | | 2,848 |
| Total assets | | | | | | | | 52,876,235 |
| |
| Liabilities | | | | | | | | |
| Payable for investments purchased | | $ | | 160,971 | | | | |
| Payable for fund shares redeemed | | | | 43,426 | | | | |
| Accrued management fee | | | | 31,306 | | | | |
| Transfer agent fee payable | | | | 16,754 | | | | |
| Distribution fees payable | | | | 23,824 | | | | |
| Other affiliated payables | | | | 2,392 | | | | |
| Other payables and accrued expenses | | | | 50,800 | | | | |
| Total liabilities | | | | | | | | 329,473 |
| |
| Net Assets | | | | | | $ | | 52,546,762 |
| Net Assets consist of: | | | | | | | | |
| Paid in capital | | | | | | $ | | 44,601,153 |
| Undistributed net investment income | | | | | | | | 43,510 |
| Accumulated undistributed net realized gain (loss) on | | | | | | | | |
| investments and foreign currency transactions | | | | | | | | (338,186) |
| Net unrealized appreciation (depreciation) on | | | | | | | | |
| investments and assets and liabilities in foreign | | | | | | | | |
| currencies | | | | | | | | 8,240,285 |
| Net Assets | | | | | | $ | | 52,546,762 |
See accompanying notes which are an integral part of the financial statements.
25 Annual Report
| Financial Statements - continued | | | | |
| |
| |
| |
| Statement of Assets and Liabilities — continued | | | | |
| | | | | October 31, 2005 |
| |
| Calculation of Maximum Offering Price | | | | |
| Class A: | | | | |
| Net Asset Value and redemption price per share | | | | |
| ($10,100,894 ÷ 738,553 shares) | | $ | | 13.68 |
| Maximum offering price per share (100/94.25 of | | | | |
| $13.68) | | $ | | 14.51 |
| Class T: | | | | |
| Net Asset Value and redemption price per share | | | | |
| ($28,785,854 ÷ 2,139,303 shares) | | $ | | 13.46 |
| Maximum offering price per share (100/96.50 of | | | | |
| $13.46) | | $ | | 13.95 |
| Class B: | | | | |
| Net Asset Value and offering price per share | | | | |
| ($6,464,081 ÷ 497,020 shares)A | | $ | | 13.01 |
| Class C: | | | | |
| Net Asset Value and offering price per share | | | | |
| ($5,396,148 ÷ 414,353 shares)A | | $ | | 13.02 |
| Institutional Class: | | | | |
| Net Asset Value, offering price and redemption | | | | |
| price per share ($1,799,785 ÷ 129,244 | | | | |
| shares) | | $ | | 13.93 |
| |
| A Redemption price per share is equal to net asset value less any applicable contingent deferred sales charge. | | | | |
See accompanying notes which are an integral part of the financial statements.
Annual Report 26
| Statement of Operations | | | | | | |
| | | | | Year ended October 31, 2005 |
| |
| Investment Income | | | | | | |
| Dividends | | | | $ | | 900,566 |
| Interest | | | | | | 108,652 |
| | | | | | | 1,009,218 |
| Less foreign taxes withheld | | | | | | (63,605) |
| Total income | | | | | | 945,613 |
| |
| Expenses | | | | | | |
| Management fee | | $ | | 353,793 | | |
| Transfer agent fees | | | | 196,176 | | |
| Distribution fees | | | | 270,020 | | |
| Accounting fees and expenses | | | | 28,469 | | |
| Independent trustees’ compensation | | | | 224 | | |
| Custodian fees and expenses | | | | 100,487 | | |
| Registration fees | | | | 46,978 | | |
| Audit | | | | 40,605 | | |
| Legal | | | | 1,582 | | |
| Miscellaneous | | | | 1,745 | | |
| Total expenses before reductions | | | | 1,040,079 | | |
| Expense reductions | | | | (137,975) | | 902,104 |
| |
| Net investment income (loss) | | | | | | 43,509 |
| Realized and Unrealized Gain (Loss) | | | | | | |
| Net realized gain (loss) on: | | | | | | |
| Investment securities | | | | 1,998,304 | | |
| Foreign currency transactions | | | | (7,706) | | |
| Futures contracts | | | | 111,427 | | |
| Total net realized gain (loss) | | | | | | 2,102,025 |
| Change in net unrealized appreciation (depreciation) on: | | | | |
| Investment securities | | | | 4,318,885 | | |
| Assets and liabilities in foreign currencies | | | | (2,880) | | |
| Futures contracts | | | | (64,882) | | |
| Total change in net unrealized appreciation | | | | | | |
| (depreciation) | | | | | | 4,251,123 |
| Net gain (loss) | | | | | | 6,353,148 |
| Net increase (decrease) in net assets resulting from | | | | | | |
| operations | | | | $ | | 6,396,657 |
See accompanying notes which are an integral part of the financial statements.
27 Annual Report
| Financial Statements - continued | | | | | | | | |
| |
| |
| Statement of Changes in Net Assets | | | | | | | | |
| | | | | Year ended | | | | Year ended |
| | | | | October 31, | | | | October 31, |
| | | | | 2005 | | | | 2004 |
| Increase (Decrease) in Net Assets | | | | | | | | |
| Operations | | | | | | | | |
| Net investment income (loss) | | $ | | 43,509 | | $ | | (238,310) |
| Net realized gain (loss) | | | | 2,102,025 | | | | 2,766,719 |
| Change in net unrealized appreciation (depreciation) . | | | | 4,251,123 | | | | 779,756 |
| Net increase (decrease) in net assets resulting | | | | | | | | |
| from operations | | | | 6,396,657 | | | | 3,308,165 |
| Share transactions -- net increase (decrease) | | | | 6,010,544 | | | | 6,774,804 |
| Redemption fees | | | | 2,919 | | | | 1,085 |
| Total increase (decrease) in net assets | | | | 12,410,120 | | | | 10,084,054 |
| |
| Net Assets | | | | | | | | |
| Beginning of period | | | | 40,136,642 | | | | 30,052,588 |
| End of period (including undistributed net investment | | | | | | | | |
| income of $43,510 and accumulated net investment | | | | | | | | |
| loss of $40,373, respectively) | | $ | | 52,546,762 | | $ | | 40,136,642 |
See accompanying notes which are an integral part of the financial statements.
| Financial Highlights — Class A | | | | | | | | | | | | |
| |
| Years ended October 31, | | 2005 | | 2004 | | | | 2003 | | | | 2002 | | 2001 |
| Selected Per-Share Data | | | | | | | | | | | | | | |
| Net asset value, beginning of | | | | | | | | | | | | | | |
| period | | $ 11.88 | | $ 10.73 | | $ | | 8.62 | | $ | | 9.76 | | $ 12.62 |
| Income from Investment | | | | | | | | | | | | | | |
| Operations | | | | | | | | | | | | | | |
| Net investment income (loss)C | | 05 | | (.04) | | | | (.02) | | | | (.05) | | (.02)D |
| Net realized and unrealized | | | | | | | | | | | | | | |
| gain (loss) | | 1.75 | | 1.19 | | | | 2.13 | | | | (1.09) | | (2.84) |
| Total from investment operations | | 1.80 | | 1.15 | | | | 2.11 | | | | (1.14) | | (2.86) |
| Redemption fees added to paid in | | | | | | | | | | | | | | |
| capitalC | | —F | | —F | | | | — | | | | — | | — |
| Net asset value, end of period | | $ 13.68 | | $ 11.88 | | $ | | 10.73 | | $ | | 8.62 | | $ 9.76 |
| Total ReturnA,B | | 15.15% | | 10.72% | | | | 24.48% | | | | (11.68)% | | (22.66)% |
| Ratios to Average Net AssetsE | | | | | | | | | | | | | | |
| Expenses before expense | | | | | | | | | | | | | | |
| reductions | | 1.76% | | 1.97% | | | | 2.25% | | | | 2.38% | | 2.40% |
| Expenses net of voluntary | | | | | | | | | | | | | | |
| waivers, if any | | 1.56% | | 1.75% | | | | 1.76% | | | | 1.94% | | 2.00% |
| Expenses net of all reductions | | 1.54% | | 1.72% | | | | 1.73% | | | | 1.92% | | 1.96% |
| Net investment income (loss) | | 39% | | (.33)% | | | | (.27)% | | | | (.57)% | | (.17)% |
| Supplemental Data | | | | | | | | | | | | | | |
| Net assets, end of period (000 | | | | | | | | | | | | | | |
| omitted) | | $10,101 | | $ 8,450 | | $ | | 4,436 | | $ | | 3,343 | | $ 3,516 |
| Portfolio turnover rate | | 52% | | 59% | | | | 53% | | | | 76% | | 141% |
| A Total returns would have been lower had certain expenses not been reduced during the periods shown. |
| B Total returns do not include the effect of the sales charges. |
| C Calculated based on average shares outstanding during the period. |
| D Investment income per share reflects a special dividend which amounted to $.04 per share. |
| E Expense ratios reflect operating expenses of the class. Expenses before reductions do not reflect amounts reimbursed by the investment adviser or |
| reductions from brokerage service arrangements or other expense offset arrangements and do not represent the amount paid by the class during |
| periods when reimbursements or reductions occur. Expenses net of any voluntary waivers reflect expenses after reimbursement by the investment |
| adviser but prior to reductions from brokerage service arrangements or other expense offset arrangements. Expenses net of all reductions repre |
| sent the net expenses paid by the class. |
| F Amount represents less than $.01 per share. |
See accompanying notes which are an integral part of the financial statements.
29 Annual Report
| Financial Highlights — Class T | | | | | | | | | | | | |
| |
| Years ended October 31, | | 2005 | | 2004 | | | | 2003 | | | | 2002 | | 2001 |
| Selected Per-Share Data | | | | | | | | | | | | | | |
| Net asset value, beginning of | | | | | | | | | | | | | | |
| period | | $ 11.71 | | $ 10.61 | | $ | | 8.54 | | $ | | 9.70 | | $ 12.60 |
| Income from Investment | | | | | | | | | | | | | | |
| Operations | | | | | | | | | | | | | | |
| Net investment income (loss)C | | 02 | | (.07) | | | | (.05) | | | | (.08) | | (.05)D |
| Net realized and unrealized | | | | | | | | | | | | | | |
| gain (loss) | | 1.73 | | 1.17 | | | | 2.12 | | | | (1.08) | | (2.85) |
| Total from investment operations | | 1.75 | | 1.10 | | | | 2.07 | | | | (1.16) | | (2.90) |
| Redemption fees added to paid in | | | | | | | | | | | | | | |
| capitalC | | —F | | —F | | | | — | | | | — | | — |
| Net asset value, end of period | | $ 13.46 | | $ 11.71 | | $ | | 10.61 | | $ | | 8.54 | | $ 9.70 |
| Total ReturnA,B | | 14.94% | | 10.37% | | | | 24.24% | | | | (11.96)% | | (23.02)% |
| Ratios to Average Net AssetsE | | | | | | | | | | | | | | |
| Expenses before expense | | | | | | | | | | | | | | |
| reductions | | 2.09% | | 2.39% | | | | 2.65% | | | | 2.85% | | 2.88% |
| Expenses net of voluntary | | | | | | | | | | | | | | |
| waivers, if any | | 1.81% | | 2.00% | | | | 2.01% | | | | 2.19% | | 2.25% |
| Expenses net of all reductions | | 1.79% | | 1.97% | | | | 1.98% | | | | 2.16% | | 2.21% |
| Net investment income (loss) | | 14% | | (.58)% | | | | (.52)% | | | | (.81)% | | (.42)% |
| Supplemental Data | | | | | | | | | | | | | | |
| Net assets, end of period (000 | | | | | | | | | | | | | | |
| omitted) | | $28,786 | | $20,966 | | $17,334 | | $12,496 | | $ 7,642 |
| Portfolio turnover rate | | 52% | | 59% | | | | 53% | | | | 76% | | 141% |
| A Total returns would have been lower had certain expenses not been reduced during the periods shown. |
| B Total returns do not include the effect of the sales charges. |
| C Calculated based on average shares outstanding during the period. |
| D Investment income per share reflects a special dividend which amounted to $.04 per share. |
| E Expense ratios reflect operating expenses of the class. Expenses before reductions do not reflect amounts reimbursed by the investment adviser or |
| reductions from brokerage service arrangements or other expense offset arrangements and do not represent the amount paid by the class during |
| periods when reimbursements or reductions occur. Expenses net of any voluntary waivers reflect expenses after reimbursement by the investment |
| adviser but prior to reductions from brokerage service arrangements or other expense offset arrangements. Expenses net of all reductions repre |
| sent the net expenses paid by the class. |
| F Amount represents less than $.01 per share. |
See accompanying notes which are an integral part of the financial statements.
| Financial Highlights — Class B | | | | | | | | | | | | |
| |
| Years ended October 31, | | 2005 | | 2004 | | | | 2003 | | | | 2002 | | 2001 |
| Selected Per-Share Data | | | | | | | | | | | | | | |
| Net asset value, beginning of | | | | | | | | | | | | | | |
| period | | $ 11.38 | | $ 10.36 | | $ | | 8.38 | | $ | | 9.56 | | $ 12.48 |
| Income from Investment | | | | | | | | | | | | | | |
| Operations | | | | | | | | | | | | | | |
| Net investment income (loss)C | | (.04) | | (.12) | | | | (.09) | | | | (.12) | | (.10)D |
| Net realized and unrealized | | | | | | | | | | | | | | |
| gain (loss) | | 1.67 | | 1.14 | | | | 2.07 | | | | (1.06) | | (2.82) |
| Total from investment operations | | 1.63 | | 1.02 | | | | 1.98 | | | | (1.18) | | (2.92) |
| Redemption fees added to paid in | | | | | | | | | | | | | | |
| capitalC | | —F | | —F | | | | — | | | | — | | — |
| Net asset value, end of period | | $ 13.01 | | $ 11.38 | | $ | | 10.36 | | $ | | 8.38 | | $ 9.56 |
| Total ReturnA,B | | 14.32% | | 9.85% | | | | 23.63% | | | | (12.34)% | | (23.40)% |
| Ratios to Average Net AssetsE | | | | | | | | | | | | | | |
| Expenses before expense | | | | | | | | | | | | | | |
| reductions | | 2.61% | | 3.00% | | | | 3.25% | | | | 3.36% | | 3.30% |
| Expenses net of voluntary | | | | | | | | | | | | | | |
| waivers, if any | | 2.31% | | 2.50% | | | | 2.50% | | | | 2.69% | | 2.75% |
| Expenses net of all reductions | | 2.29% | | 2.47% | | | | 2.47% | | | | 2.66% | | 2.71% |
| Net investment income (loss) | | (.36)% | | (1.08)% | | | | (1.01)% | | | | (1.31)% | | (.92)% |
| Supplemental Data | | | | | | | | | | | | | | |
| Net assets, end of period (000 | | | | | | | | | | | | | | |
| omitted) | | $ 6,464 | | $ 5,575 | | $ | | 4,918 | | $ | | 3,848 | | $ 4,865 |
| Portfolio turnover rate | | 52% | | 59% | | | | 53% | | | | 76% | | 141% |
| A Total returns would have been lower had certain expenses not been reduced during the periods shown. |
| B Total returns do not include the effect of the contingent deferred sales charge. |
| C Calculated based on average shares outstanding during the period. |
| D Investment income per share reflects a special dividend which amounted to $.04 per share. |
| E Expense ratios reflect operating expenses of the class. Expenses before reductions do not reflect amounts reimbursed by the investment adviser or |
| reductions from brokerage service arrangements or other expense offset arrangements and do not represent the amount paid by the class during |
| periods when reimbursements or reductions occur. Expenses net of any voluntary waivers reflect expenses after reimbursement by the investment |
| adviser but prior to reductions from brokerage service arrangements or other expense offset arrangements. Expenses net of all reductions repre |
| sent the net expenses paid by the class. |
| F Amount represents less than $.01 per share. |
See accompanying notes which are an integral part of the financial statements.
31 Annual Report
| Financial Highlights — Class C | | | | | | | | | | | | |
| |
| Years ended October 31, | | 2005 | | 2004 | | | | 2003 | | | | 2002 | | 2001 |
| Selected Per-Share Data | | | | | | | | | | | | | | |
| Net asset value, beginning of | | | | | | | | | | | | | | |
| period | | $ 11.39 | | $ 10.38 | | $ | | 8.39 | | $ | | 9.58 | | $ 12.49 |
| Income from Investment | | | | | | | | | | | | | | |
| Operations | | | | | | | | | | | | | | |
| Net investment income (loss)C | | (.05) | | (.12) | | | | (.09) | | | | (.12) | | (.10)D |
| Net realized and unrealized | | | | | | | | | | | | | | |
| gain (loss) | | 1.68 | | 1.13 | | | | 2.08 | | | | (1.07) | | (2.81) |
| Total from investment operations | | 1.63 | | 1.01 | | | | 1.99 | | | | (1.19) | | (2.91) |
| Redemption fees added to paid in | | | | | | | | | | | | | | |
| capitalC | | —F | | —F | | | | — | | | | — | | — |
| Net asset value, end of period | | $ 13.02 | | $ 11.39 | | $ | | 10.38 | | $ | | 8.39 | | $ 9.58 |
| Total ReturnA,B | | 14.31% | | 9.73% | | | | 23.72% | | | | (12.42)% | | (23.30)% |
| Ratios to Average Net AssetsE | | | | | | | | | | | | | | |
| Expenses before expense | | | | | | | | | | | | | | |
| reductions | | 2.59% | | 2.87% | | | | 3.10% | | | | 3.18% | | 3.16% |
| Expenses net of voluntary | | | | | | | | | | | | | | |
| waivers, if any | | 2.31% | | 2.50% | | | | 2.50% | | | | 2.69% | | 2.75% |
| Expenses net of all reductions | | 2.29% | | 2.47% | | | | 2.47% | | | | 2.66% | | 2.71% |
| Net investment income (loss) | | (.36)% | | (1.08)% | | | | (1.01)% | | | | (1.31)% | | (.92)% |
| Supplemental Data | | | | | | | | | | | | | | |
| Net assets, end of period (000 | | | | | | | | | | | | | | |
| omitted) | | $ 5,396 | | $ 3,959 | | $ | | 3,190 | | $ | | 2,967 | | $ 3,750 |
| Portfolio turnover rate | | 52% | | 59% | | | | 53% | | | | 76% | | 141% |
| A Total returns would have been lower had certain expenses not been reduced during the periods shown. |
| B Total returns do not include the effect of the contingent deferred sales charge. |
| C Calculated based on average shares outstanding during the period. |
| D Investment income per share reflects a special dividend which amounted to $.04 per share. |
| E Expense ratios reflect operating expenses of the class. Expenses before reductions do not reflect amounts reimbursed by the investment adviser or |
| reductions from brokerage service arrangements or other expense offset arrangements and do not represent the amount paid by the class during |
| periods when reimbursements or reductions occur. Expenses net of any voluntary waivers reflect expenses after reimbursement by the investment |
| adviser but prior to reductions from brokerage service arrangements or other expense offset arrangements. Expenses net of all reductions repre |
| sent the net expenses paid by the class. |
| F Amount represents less than $.01 per share. |
See accompanying notes which are an integral part of the financial statements.
| Financial Highlights — Institutional Class | | | | | | | | | | | | |
| |
| Years ended October 31, | | 2005 | | 2004 | | | | 2003 | | | | 2002 | | | | 2001 |
| Selected Per-Share Data | | | | | | | | | | | | | | | | |
| Net asset value, beginning of | | | | | | | | | | | | | | | | |
| period | | $ 12.06 | | $ 10.88 | | $ | | 8.68 | | $ | | 9.81 | | $ | | 12.68 |
| Income from Investment | | | | | | | | | | | | | | | | |
| Operations | | | | | | | | | | | | | | | | |
| Net investment income (loss)B | | 09 | | (.01) | | | | —E | | | | (.03) | | | | .01C |
| Net realized and unrealized | | | | | | | | | | | | | | | | |
| gain (loss) | | 1.78 | | 1.19 | | | | 2.20 | | | | (1.10) | | | | (2.88) |
| Total from investment operations | | 1.87 | | 1.18 | | | | 2.20 | | | | (1.13) | | | | (2.87) |
| Redemption fees added to paid in | | | | | | | | | | | | | | | | |
| capitalB | | —E | | —E | | | | — | | | | — | | | | — |
| Net asset value, end of period | | $ 13.93 | | $ 12.06 | | $ | | 10.88 | | $ | | 8.68 | | $ | | 9.81 |
| Total ReturnA | | 15.51% | | 10.85% | | | | 25.35% | | | | (11.52)% | | | | (22.63)% |
| Ratios to Average Net AssetsD | | | | | | | | | | | | | | | | |
| Expenses before expense | | | | | | | | | | | | | | | | |
| reductions | | 1.42% | | 1.55% | | | | 1.87% | | | | 1.95% | | | | 2.02% |
| Expenses net of voluntary | | | | | | | | | | | | | | | | |
| waivers, if any | | 1.31% | | 1.50% | | | | 1.50% | | | | �� 1.70% | | | | 1.75% |
| Expenses net of all reductions | | 1.29% | | 1.47% | | | | 1.48% | | | | 1.67% | | | | 1.71% |
| Net investment income (loss) | | 64% | | (.08)% | | | | (.01)% | | | | (.32)% | | | | .08% |
| Supplemental Data | | | | | | | | | | | | | | | | |
| Net assets, end of period (000 | | | | | | | | | | | | | | | | |
| omitted) | | $ 1,800 | | $ 1,187 | | $ | | 175 | | $ | | 808 | | $ | | 909 |
| Portfolio turnover rate | | 52% | | 59% | | | | 53% | | | | 76% | | | | 141% |
| A Total returns would have been lower had certain expenses not been reduced during the periods shown. |
| B Calculated based on average shares outstanding during the period. |
| C Investment income per share reflects a special dividend which amounted to $.04 per share. |
| D Expense ratios reflect operating expenses of the class. Expenses before reductions do not reflect amounts reimbursed by the investment adviser or |
| reductions from brokerage service arrangements or other expense offset arrangements and do not represent the amount paid by the class during |
| periods when reimbursements or reductions occur. Expenses net of any voluntary waivers reflect expenses after reimbursement by the investment |
| adviser but prior to reductions from brokerage service arrangements or other expense offset arrangements. Expenses net of all reductions repre |
| sent the net expenses paid by the class. |
| E Amount represents less than $.01 per share. |
See accompanying notes which are an integral part of the financial statements.
33 Annual Report
Notes to Financial Statements
For the period ended October 31, 2005
|
1. Significant Accounting Policies.
Fidelity Advisor Global Equity Fund (the fund) is a fund of Fidelity Advisor Series VIII (the trust) and is authorized to issue an unlimited number of shares. The trust is registered under the Investment Company Act of 1940, as amended (the 1940 Act), as an open-end management investment company organized as a Massachusetts business trust.
The fund offers Class A, Class T, Class B, Class C, and Institutional Class shares, each of which has equal rights as to assets and voting privileges. Each class has exclusive voting rights with respect to matters that affect that class. Class B shares will automatically convert to Class A shares after a holding period of seven years from the initial date of purchase. Investment income, realized and unrealized capital gains and losses, the common expenses of the fund, and certain fund-level expense reductions, if any, are allocated on a pro rata basis to each class based on the relative net assets of each class to the total net assets of the fund. Each class differs with respect to transfer agent and distribution and service plan fees incurred. Certain expense reductions also differ by class.
The fund may invest in affiliated money market central funds (Money Market Central Funds) which are open-end investment companies available to investment companies and other accounts managed by Fidelity Management & Research Company (FMR) and its affiliates. The financial statements have been prepared in conformity with accounting principles generally accepted in the United States of America, which require management to make certain estimates and assumptions at the date of the financial statements. The following summarizes the significant accounting policies of the fund:
Security Valuation. Investments are valued and net asset value (NAV) per share is calculated (NAV calculation) as of the close of business of the New York Stock Exchange (NYSE), normally 4:00 p.m. Eastern time. Wherever possible, the fund uses independent pricing services approved by the Board of Trustees to value its investments.
Equity securities, including restricted securities, for which market quotations are readily available, are valued at the last reported sale price or official closing price as reported by an independent pricing service on the primary market or exchange on which they are traded. In the event there were no sales during the day or closing prices are not available, securities are valued at the last quoted bid price. Investments in open-end mutual funds are valued at their closing net asset value each business day. Short-term securities with remaining maturities of sixty days or less for which quotations are not readily available are valued at amortized cost, which approximates value.
When current market prices or quotations are not readily available or do not accurately reflect fair value, valuations may be determined in accordance with procedures adopted
1. Significant Accounting Policies - continued
Security Valuation - continued
by the Board of Trustees. For example, when developments occur between the close of a market and the close of the NYSE that may materially affect the value of some or all of the securities, or when trading in a security is halted, those securities may be fair valued. Factors used in the determination of fair value may include monitoring news to identify significant market or security specific events such as changes in the value of U.S. securities market, reviewing developments in foreign markets and evaluating the performance of ADRs, futures contracts and exchange-traded funds. Because the fund’s utilization of fair value pricing depends on market activity, the frequency with which fair value pricing is used can not be predicted and may be utilized to a significant extent. The value of securities used for NAV calculation under fair value pricing may differ from published prices for the same securities.
Foreign Currency. The fund uses foreign currency contracts to facilitate transactions in foreign-denominated securities. Losses from these transactions may arise from changes in the value of the foreign currency or if the counterparties do not perform under the contracts’ terms.
Foreign-denominated assets, including investment securities, and liabilities are translated into U.S. dollars at the exchange rate at period end. Purchases and sales of investment securities, income and dividends received and expenses denominated in foreign currencies are translated into U.S. dollars at the exchange rate in effect on the transaction date.
The effects of exchange rate fluctuations on investments are included with the net realized and unrealized gain (loss) on investment securities. Other foreign currency transactions resulting in realized and unrealized gain (loss) are disclosed separately.
Investment Transactions and Income. Security transactions are accounted for as of trade date. Gains and losses on securities sold are determined on the basis of identified cost and may include proceeds received from litigation. Dividend income is recorded on the ex-dividend date, except for certain dividends from foreign securities where the ex-dividend date may have passed, which are recorded as soon as the fund is informed of the ex-dividend date. Non-cash dividends included in dividend income, if any, are recorded at the fair market value of the securities received. Distributions received on securities that represent a return of capital or capital gain are recorded as a reduction of cost of investments and/or as a realized gain. The fund estimates the components of distributions received that may be considered return of capital distributions or capital gain distributions. Interest income is accrued as earned. Interest income includes coupon interest and amortization of premium and accretion of discount on debt securities. Investment income is recorded net of foreign taxes withheld where recovery of such taxes is uncertain.
35 Annual Report
Notes to Financial Statements - continued
1. Significant Accounting Policies - continued
Expenses. Most expenses of the trust can be directly attributed to a fund. Expenses which cannot be directly attributed are apportioned among each fund in the trust.
Income Tax Information and Distributions to Shareholders. Each year, the fund intends to qualify as a regulated investment company by distributing all of its taxable income and realized gains under Subchapter M of the Internal Revenue Code. As a result, no provision for income taxes is required in the accompanying financial statements. Foreign taxes are provided for based on the fund’s understanding of the tax rules and rates that exist in the foreign markets in which it invests.
Distributions are recorded on the ex-dividend date. Income dividends and capital gain distributions are declared separately for each class. Income and capital gain distributions are determined in accordance with income tax regulations, which may differ from generally accepted accounting principles.
Capital accounts within the financial statements are adjusted for permanent book-tax differences. These adjustments have no impact on net assets or the results of operations. Temporary book-tax differences will reverse in a subsequent period.
Book-tax differences are primarily due to futures transactions, foreign currency transactions, passive foreign investment companies (PFIC), capital loss carryforwards and losses deferred due to wash sales.
The tax-basis components of distributable earnings and the federal tax cost as of period end were as follows:
| Unrealized appreciation | | $ | | 9,851,393 |
| Unrealized depreciation | | | | (1,703,404) |
| Net unrealized appreciation (depreciation) | | | | 8,147,989 |
| Undistributed ordinary income | | | | 105,226 |
| Capital loss carryforward | | | | (307,610) |
| |
| Cost for federal income tax purposes | | $ | | 44,345,919 |
Short-Term Trading (Redemption) Fees. Shares held in the fund less than 30 days are subject to a redemption fee equal to 1.00% of the proceeds of the redeemed shares. All redemption fees, including any estimated redemption fees paid by FMR, are retained by the fund and accounted for as an addition to paid in capital.
Repurchase Agreements. FMR has received an Exemptive Order from the Securities and Exchange Commission (the SEC) which permits the fund and other affiliated entities of FMR to transfer uninvested cash balances into joint trading accounts which are then invested in repurchase agreements. The fund may also invest directly with institutions in repurchase agreements. Repurchase agreements are collateralized by government or non-government securities. Collateral is held in segregated accounts with custodian banks and may be obtained in the event of a default of the counterparty. The fund monitors, on a daily basis, the value of the collateral to ensure it is at least equal to the principal amount of the repurchase agreement (including accrued interest). In the event of a default by the counterparty, realization of the collateral proceeds could be delayed, during which time the value of the collateral may decline.
Futures Contracts. The fund may use futures contracts to manage its exposure to the stock market. Buying futures tends to increase a fund’s exposure to the underlying instrument, while selling futures tends to decrease a fund’s exposure to the underlying instrument or hedge other fund investments. Futures contracts involve, to varying degrees, risk of loss in excess of any futures variation margin reflected in the Statement of Assets and Liabilities. The underlying face amount at value of any open futures contracts at period end is shown in the Schedule of Investments under the caption ”Futures Contracts.” This amount reflects each contract’s exposure to the underlying instrument at period end. Losses may arise from changes in the value of the underlying instruments or if the counterparties do not perform under the contracts’ terms. Gains (losses) are realized upon the expiration or closing of the futures contracts. Futures contracts are valued at the settlement price established each day by the board of trade or exchange on which they are traded.
Restricted Securities. The fund may invest in securities that are subject to legal or contractual restrictions on resale. These securities generally may be resold in transactions exempt from registration or to the public if the securities are registered. Disposal of these securities may involve time-consuming negotiations and expense, and prompt sale at an acceptable price may be difficult. Information regarding restricted securities is included at the end of the fund’s Schedule of Investments.
3. Purchases and Sales of Investments.
Purchases and sales of securities, other than short-term securities and U.S. government securities, aggregated $26,988,282 and $23,282,043, respectively.
37 Annual Report
Notes to Financial Statements - continued
4. Fees and Other Transactions with Affiliates.
Management Fee. FMR and its affiliates provide the fund with investment management related services for which the fund pays a monthly management fee. The management fee is the sum of an individual fund fee rate that is based on an annual rate of .45% of the fund’s average net assets and a group fee rate that averaged .27% during the period. The group fee rate is based upon the average net assets of all the mutual funds advised by FMR. The group fee rate decreases as assets under management increase and increases as assets under management decrease. For the period, the total annual management fee rate was .72% of the fund’s average net assets.
Distribution and Service Plan. In accordance with Rule 12b-1 of the 1940 Act, the fund has adopted separate Distribution and Service Plans for each class of shares. Certain classes pay Fidelity Distributors Corporation (FDC), an affiliate of FMR, separate Distribution and Service Fees, each of which is based on an annual percentage of each class’ average net assets. In addition, FDC may pay financial intermediaries for selling shares of the fund and providing shareholder support services. For the period, the Distribution and Service Fee rates and the total amounts paid to and retained by FDC were as follows:
| | | Distribution | | Service | | | | Paid to | | | | Retained |
| | | Fee | | Fee | | | | FDC | | | | by FDC |
| Class A | | 0% | | .25% | | $ | | 23,985 | | $ | | 1,213 |
| Class T | | 25% | | .25% | | | | 133,714 | | | | — |
| Class B | | 75% | | .25% | | | | 63,098 | | | | 47,324 |
| Class C | | 75% | | .25% | | | | 49,223 | | | | 10,945 |
| | | | | | | $ | | 270,020 | | $ | | 59,482 |
Sales Load. FDC receives a front-end sales charge of up to 5.75% for selling Class A shares, and 3.50% for selling Class T shares, some of which is paid to financial intermediaries for selling shares of the fund. FDC receives the proceeds of contingent deferred sales charges levied on Class A, Class T, Class B, and Class C redemptions. These charges depend on the holding period. The deferred sales charges range from 5% to 1% for Class B, 1% for Class C, and .25% for certain purchases of Class A and Class T shares.
| For the period, sales charge amounts retained by FDC were as follows: | | |
| | | | | Retained |
| | | | | by FDC |
| Class A | | $ | | 6,209 |
| Class T | | | | 5,088 |
| Class B* | | | | 11,117 |
| Class C* | | | | 267 |
| | | $ | | 22,681 |
* When Class B and Class C shares are initially sold, FDC pays commissions from its own resources to financial intermediaries through which the sales are made.
4. Fees and Other Transactions with Affiliates - continued
Transfer Agent Fees. Fidelity Investments Institutional Operations Company, Inc. (FIIOC), an affiliate of FMR, is the transfer, dividend disbursing and shareholder servicing agent for each class of the fund. FIIOC receives account fees and asset-based fees that vary according to the account size and type of account of the shareholders of the respective classes of the fund. FIIOC pays for typesetting, printing and mailing of shareholder reports, except proxy statements. For the period the total transfer agent fees paid by each class to FIIOC, were as follows:
| | | | | | | % of |
| | | | | | | Average |
| | | | | Amount | | Net Assets |
| Class A | | $ | | 32,874 | | .34 |
| Class T | | | | 111,649 | | .42 |
| Class B | | | | 27,480 | | .44 |
| Class C | | | | 20,553 | | .42 |
| Institutional Class | | | | 3,620 | | .25 |
| | | $ | | 196,176 | | |
Accounting Fees. Fidelity Service Company, Inc. (FSC), an affiliate of FMR, maintains the fund’s accounting records. The fee is based on the level of average net assets for the month.
Affiliated Central Funds. The fund may invest in Money Market Central Funds which seek preservation of capital and current income and are managed by Fidelity Investments Money Management, Inc. (FIMM), an affiliate of FMR. The Money Market Central Funds do not pay a management fee. Income distributions earned by the fund are recorded as income in the accompanying financial statements and totaled $104,306 for the period.
Brokerage Commissions. The fund placed a portion of its portfolio transactions with brokerage firms which are affiliates of the investment adviser. The commissions paid to these affiliated firms were $215 for the period.
5. Committed Line of Credit.
|
The fund participates with other funds managed by FMR in a $4.2 billion credit facility (the “line of credit”) to be utilized for temporary or emergency purposes to fund shareholder redemptions or for other short-term liquidity purposes. The fund has agreed to pay commitment fees on its pro rata portion of the line of credit. During the period, there were no borrowings on this line of credit.
39 Annual Report
Notes to Financial Statements - continued
6. Expense Reductions.
FMR voluntarily agreed to reimburse each class to the extent annual operating expenses exceeded certain levels of average net assets as noted in the table below. Some expenses, for example interest expense, are excluded from this reimbursement.
| The following classes were in reimbursement during the period: | | | | |
| | | Expense | | | | Reimbursement |
| | | Limitations | | | | from adviser |
| |
| Class A | | 1.75% | | -- | | 1.50%* | | $ | | 19,587 |
| Class T | | 2.00% | | -- | | 1.75%* | | | | 74,574 |
| Class B | | 2.50% | | -- | | 2.25%* | | | | 18,779 |
| Class C | | 2.50% | | -- | | 2.25%* | | | | 13,656 |
| Institutional Class | | 1.50% | | -- | | 1.25%* | | | | 1,646 |
| | | | | | | | | $ | | 128,242 |
| |
| * Expense limitation in effect at period end. | | | | | | | | | | |
Many of the brokers with whom FMR places trades on behalf of the fund provided services to the fund in addition to trade execution. These services included payments of certain expenses on behalf of the fund totaling $9,733 for the period.
The fund’s organizational documents provide former and current trustees and officers with a limited indemnification against liabilities arising in connection with the performance of their duties to the fund. In the normal course of business, the fund may also enter into contracts that provide general indemnifications. The fund’s maximum exposure under these arrangements is unknown as this would be dependent on future claims that may be made against the fund. The risk of material loss from such claims is considered remote.
| 8. Share Transactions. | | | | | | | | | | |
| |
| Transactions for each class of shares were as follows: | | | | | | | | |
| |
| | | Shares | | | | | | Dollars |
| Years ended October 31, | | 2005 | | 2004 | | | | 2005 | | | | 2004 |
| Class A | | | | | | | | | | | | |
| Shares sold | | 192,761 | | 384,850 | | $ | | 2,508,793 | | $ | | 4,439,108 |
| Shares redeemed | | (165,658) | | (86,624) | | | | (2,170,770) | | | | (1,001,333) |
| Net increase (decrease) | | 27,103 | | 298,226 | | $ | | 338,023 | | $ | | 3,437,775 |
| Class T | | | | | | | | | | | | |
| Shares sold | | 817,905 | | 937,092 | | $ 10,377,931 | | $ 10,650,883 |
| Shares redeemed | | (468,349) | | (780,388) | | | | (6,008,601) | | | | (8,915,832) |
| Net increase (decrease) | | 349,556 | | 156,704 | | $ | | 4,369,330 | | $ | | 1,735,051 |
| Class B | | | | | | | | | | | | |
| Shares sold | | 139,393 | | 138,798 | | $ | | 1,701,739 | | $ | | 1,541,743 |
| Shares redeemed | | (132,283) | | (123,447) | | | | (1,634,038) | | | | (1,364,796) |
| Net increase (decrease) | | 7,110 | | 15,351 | | $ | | 67,701 | | $ | | 176,947 |
| Class C | | | | | | | | | | | | |
| Shares sold | | 139,662 | | 106,121 | | $ | | 1,733,371 | | $ | | 1,182,163 |
| Shares redeemed | | (72,801) | | (66,101) | | | | (917,263) | | | | (732,887) |
| Net increase (decrease) | | 66,861 | | 40,020 | | $ | | 816,108 | | $ | | 449,276 |
| Institutional Class | | | | | | | | | | | | |
| Shares sold | | 44,364 | �� | 122,911 | | $ | | 600,130 | | $ | | 1,457,480 |
| Shares redeemed | | (13,527) | | (40,611) | | | | (180,748) | | | | (481,725) |
| Net increase (decrease) | | 30,837 | | 82,300 | | $ | | 419,382 | | $ | | 975,755 |
41 Annual Report
Report of Independent Registered Public Accounting Firm
To the Trustees of Fidelity Advisor Series VIII and the Shareholders of Fidelity Advisor Global Equity Fund:
In our opinion, the accompanying statement of assets and liabilities, including the schedule of investments, and the related statements of operations and of changes in net assets and the financial highlights present fairly, in all material respects, the financial position of Fidelity Advisor Global Equity Fund (a fund of Fidelity Advisor Series VIII) at October 31, 2005 and the results of its operations, the changes in its net assets and the financial highlights for the periods indicated, in conformity with accounting principles generally accepted in the United States of America. These financial statements and financial highlights (hereafter referred to as “financial statements”) are the responsibility of the Fidelity Advisor Global Equity Fund’s management; our responsibility is to express an opinion on these financial statements based on our audits. We conducted our audits of these financial statements in accordance with the standards of the Public Company Accounting Oversight Board (United States). Those standards require that we plan and perform the audit to obtain reasonable assurance about whether the financial statements are free of material misstatement. An audit includes examining, on a test basis, evidence supporting the amounts and disclosures in the financial statements, assessing the accounting principles used and significant estimates made by management, and evaluating the overall financial statement presentation. We believe that our audits, which included confirmation of securities at October 31, 2005 by correspondence with the custodian and brokers, provide a reasonable basis for our opinion.
/s/ PricewaterhouseCoopers LLP
PricewaterhouseCoopers LLP
Boston, Massachusetts
December 19, 2005
|
Trustees and Officers
The Trustees, Members of the Advisory Board, and executive officers of the trust and fund, as applicable, are listed below. The Board of Trustees governs the fund and is responsible for protecting the interests of shareholders. The Trustees are experienced executives who meet periodically throughout the year to oversee the fund’s activities, review contractual arrangements with companies that provide services to the fund, and review the fund’s performance. Except for William O. McCoy, Stephen P. Jonas, and Kenneth L. Wolfe, each of the Trustees oversees 322 funds advised by FMR or an affiliate. Mr. McCoy oversees 324 funds advised by FMR or an affiliate. Mr. Jonas and Mr. Wolfe oversee 319 funds advised by FMR or an affiliate.
The Trustees hold office without limit in time except that (a) any Trustee may resign; (b) any Trustee may be removed by written instrument, signed by at least two-thirds of the number of Trustees prior to such removal; (c) any Trustee who requests to be retired or who has become incapacitated by illness or injury may be retired by written instrument signed by a majority of the other Trustees; and (d) any Trustee may be removed at any special meeting of shareholders by a two-thirds vote of the outstanding voting securities of the trust. Each Trustee who is not an interested person (as defined in the 1940 Act) (Independent Trustee), shall retire not later than the last day of the calendar year in which his or her 72nd birthday occurs. The Independent Trustees may waive this mandatory retirement age policy with respect to individual Trustees. The executive officers and Advisory Board Members hold office without limit in time, except that any officer and Advisory Board Member may resign or may be removed by a vote of a majority of the Trustees at any regular meeting or any special meeting of the Trustees. Except as indicated, each individual has held the office shown or other offices in the same company for the past five years.
The fund’s Statement of Additional Information (SAI) includes more information about the Trustees. To request a free copy, call Fidelity at 1-877-208-0098.
Interested Trustees*:
Correspondence intended for each Trustee who is an interested person may be sent to Fidelity Investments, 82 Devonshire Street, Boston, Massachusetts 02109.
| Name, Age; Principal Occupation |
| |
| Edward C. Johnson 3d (75)** |
| |
| Year of Election or Appointment: 1983 |
| Mr. Johnson is Chairman of the Board of Trustees. Mr. Johnson serves as |
| Chief Executive Officer, Chairman, and a Director of FMR Corp.; a Di- |
| rector and Chairman of the Board and of the Executive Committee of |
| FMR; Chairman and a Director of Fidelity Management & Research (Far |
| East) Inc.; Chairman and a Director of Fidelity Investments Money Man- |
| agement, Inc.; and Chairman (2001-present) and a Director |
| (2000-present) of FMR Co., Inc. |
43 Annual Report
Trustees and Officers - continued
| Name, Age; Principal Occupation |
| |
| Abigail P. Johnson (43)** |
| |
| Year of Election or Appointment: 2001 |
| Ms. Johnson serves as President of Fidelity Employer Services Company |
| (FESCO) (2005-present). She is President and a Director of Fidelity In- |
| vestments Money Management, Inc. (2001-present), FMR Co., Inc. |
| (2001-present), and a Director of FMR Corp. Previously, Ms. Johnson |
| served as President and a Director of FMR (2001-2005), Senior Vice |
| President of the Fidelity funds (2001-2005), and managed a number of |
| Fidelity funds. |
| |
| Stephen P. Jonas (52) |
| |
| Year of Election or Appointment: 2005 |
| Mr. Jonas is Senior Vice President of Advisor Global Equity. He also |
| serves as Senior Vice President of other Fidelity funds (2005-present). |
| Mr. Jonas is Executive Director of FMR (2005-present). Previously, Mr. |
| Jonas served as President of Fidelity Enterprise Operations and Risk |
| Services (2004-2005), Chief Administrative Officer (2002-2004), and |
| Chief Financial Officer of FMR Co. (1998-2000). Mr. Jonas has been |
| with Fidelity Investments since 1987 and has held various financial and |
| management positions including Chief Financial Officer of FMR. In addi- |
| tion, he serves on the Boards of Boston Ballet (2003-present) and Sim- |
| mons College (2003-present). |
| |
| Robert L. Reynolds (53) |
| |
| Year of Election or Appointment: 2003 |
| Mr. Reynolds is a Director (2003-present) and Chief Operating Officer |
| (2002-present) of FMR Corp. He also serves on the Board at Fidelity |
| Investments Canada, Ltd. (2000-present). Previously, Mr. Reynolds |
| served as President of Fidelity Investments Institutional Retirement Group |
| (1996-2000). |
| * | | Trustees have been determined to be “Interested Trustees” by virtue of, among |
| | | other things, their affiliation with the trust or various entities under common |
| | | control with FMR. |
| ** | | Edward C. Johnson 3d, Trustee, is Abigail P. Johnson’s father. |
Annual Report 44
Independent Trustees:
Correspondence intended for each Independent Trustee (that is, the Trustees other than the Interested Trustees) may be sent to Fidelity Investments, P.O. Box 55235, Boston, Massachusetts 02205-5235.
| Name, Age; Principal Occupation |
| |
| Dennis J. Dirks (57) |
| |
| Year of Election or Appointment: 2005 |
| Prior to his retirement in May 2003, Mr. Dirks was Chief Operating |
| Officer and a member of the Board of The Depository Trust & Clearing |
| Corporation (DTCC) (1999-2003). He also served as President, Chief |
| Operating Officer, and Board member of The Depository Trust |
| Company (DTC) (1999-2003) and President and Board member of the |
| National Securities Clearing Corporation (NSCC) (1999-2003). In addi- |
| tion, Mr. Dirks served as Chief Executive Officer and Board member of |
| the Government Securities Clearing Corporation (2001-2003) and Chief |
| Executive Officer and Board member of the Mortgage-Backed Securities |
| Clearing Corporation (2001-2003). Mr. Dirks also serves as a Trustee of |
| Manhattan College (2005-present). |
| |
| Robert M. Gates (62) |
| |
| �� Year of Election or Appointment: 1997 |
| Dr. Gates is Vice Chairman of the Independent Trustees (2005-present). |
| Dr. Gates is President of Texas A&M University (2002-present). He was |
| Director of the Central Intelligence Agency (CIA) from 1991 to 1993. |
| From 1989 to 1991, Dr. Gates served as Assistant to the President of |
| the United States and Deputy National Security Advisor. Dr. Gates is a |
| Director of NACCO Industries, Inc. (mining and manufacturing), Parker |
| Drilling Co., Inc. (drilling and rental tools for the energy industry, |
| 2001-present), and Brinker International (restaurant management, |
| 2003-present). Previously, Dr. Gates served as a Director of LucasVarity |
| PLC (automotive components and diesel engines), a Director of TRW Inc. |
| (automotive, space, defense, and information technology), and Dean of |
| the George Bush School of Government and Public Service at Texas |
| A&M University (1999-2001). Dr. Gates also is a Trustee of the Forum |
| for International Policy. |
45 Annual Report
Trustees and Officers - continued
| Name, Age; Principal Occupation |
| |
| George H. Heilmeier (69) |
| |
| Year of Election or Appointment: 2004 |
| Dr. Heilmeier is Chairman Emeritus of Telcordia Technologies (commu- |
| nication software and systems), where prior to his retirement, he served |
| as company Chairman and Chief Executive Officer. He currently serves |
| on the Boards of Directors of The Mitre Corporation (systems engineer- |
| ing and information technology support for the government), and HRL |
| Laboratories (private research and development, 2004-present). He is |
| Chairman of the General Motors Science & Technology Advisory Board |
| and a Life Fellow of the Institute of Electrical and Electronics Engineers |
| (IEEE) (2000-present). Dr. Heilmeier is a member of the Defense Science |
| Board and the National Security Agency Advisory Board. He is also a |
| member of the National Academy of Engineering, the American Acad- |
| emy of Arts and Sciences, and the Board of Overseers of the School of |
| Engineering and Applied Science of the University of Pennsylvania. Pre- |
| viously, Dr. Heilmeier served as a Director of TRW Inc. (automotive, |
| space, defense, and information technology, 1992-2002), Compaq |
| (1994-2002), Automatic Data Processing, Inc. (ADP) (technology-based |
| business outsourcing, 1995-2002), INET Technologies Inc. (telecommu- |
| nications network surveillance, 2001-2004), and Teletech Holdings (cus- |
| tomer management services). He is the recipient of the 2005 Kyoto Prize |
| in Advanced Technology for his invention of the liquid display. |
| |
| Marie L. Knowles (59) |
| |
| Year of Election or Appointment: 2001 |
| Prior to Ms. Knowles’ retirement in June 2000, she served as Executive |
| Vice President and Chief Financial Officer of Atlantic Richfield Company |
| (ARCO) (diversified energy, 1996-2000). From 1993 to 1996, she was |
| a Senior Vice President of ARCO and President of ARCO Transportation |
| Company. She served as a Director of ARCO from 1996 to 1998. She |
| currently serves as a Director of Phelps Dodge Corporation (copper |
| mining and manufacturing) and McKesson Corporation (healthcare ser- |
| vice, 2002-present). Ms. Knowles is a Trustee of the Brookings Institution |
| and the Catalina Island Conservancy and also serves as a member of |
| the Advisory Board for the School of Engineering of the University of |
| Southern California. |
Annual Report 46
| Name, Age; Principal Occupation |
| |
| Ned C. Lautenbach (61) |
| |
| Year of Election or Appointment: 2000 |
| Mr. Lautenbach has been a partner of Clayton, Dubilier & Rice, Inc. |
| (private equity investment firm) since September 1998. Previously, Mr. |
| Lautenbach was with the International Business Machines Corporation |
| (IBM) from 1968 until his retirement in 1998. Mr. Lautenbach serves as |
| a Director of Italtel Holding S.p.A. (telecommunications (Milan, Italy), |
| 2004-present) and Eaton Corporation (diversified industrial) as well as |
| the Philharmonic Center for the Arts in Naples, Florida. He also is a |
| member of the Board of Trustees of Fairfield University (2005-present), |
| as well as a member of the Council on Foreign Relations. |
| |
| Marvin L. Mann (72) |
| |
| Year of Election or Appointment: 1993 |
| Mr. Mann is Chairman of the Independent Trustees (2001-present). He is |
| Chairman Emeritus of Lexmark International, Inc. (computer |
| peripherals), where he served as CEO until April 1998, retired as |
| Chairman May 1999, and remains a member of the Board. Prior to |
| 1991, he held the positions of Vice President of International Business |
| Machines Corporation (IBM) and President and General Manager of |
| various IBM divisions and subsidiaries. He is a member of the Executive |
| Committee of the Independent Director’s Council of the Investment Com- |
| pany Institute. In addition, Mr. Mann is a member of the President’s |
| Cabinet at the University of Alabama and the Board of Visitors of the |
| Culverhouse College of Commerce and Business Administration at the |
| University of Alabama. |
| |
| William O. McCoy (72) |
| |
| Year of Election or Appointment: 1997 |
| Prior to his retirement in December 1994, Mr. McCoy was Vice Chair- |
| man of the Board of BellSouth Corporation (telecommunications) and |
| President of BellSouth Enterprises. He is currently a Director of Liberty |
| Corporation (holding company), Duke Realty Corporation (real estate), |
| and Progress Energy, Inc. (electric utility). He is also a partner of Frank- |
| lin Street Partners (private investment management firm) and a member |
| of the Research Triangle Foundation Board. In addition, Mr. McCoy |
| served as the Interim Chancellor (1999-2000) and a member of the |
| Board of Visitors for the University of North Carolina at Chapel Hill and |
| currently serves on the Board of Directors of the University of North |
| Carolina Health Care System and the Board of Visitors of the Kenan- |
| Flagler Business School (University of North Carolina at Chapel Hill). He |
| also served as Vice President of Finance for the University of North Car- |
| olina (16-school system). |
47 Annual Report
Trustees and Officers - continued
| Name, Age; Principal Occupation |
| |
| Cornelia M. Small (61) |
| |
| Year of Election or Appointment: 2005 |
| Ms. Small is a member (2000-present) and Chairperson (2002-present) |
| of the Investment Committee, and a member (2002-present) of the |
| Board of Trustees of Smith College. Previously, she served as Chief In- |
| vestment Officer (1999-2000), Director of Global Equity Investments |
| (1996-1999), and a member of the Board of Directors of Scudder, |
| Stevens & Clark (1990-1997) and Scudder Kemper Investments |
| (1997-1998). In addition, Ms. Small served as Co-Chair (2000-2003) |
| of the Annual Fund for the Fletcher School of Law and Diplomacy. |
| |
| William S. Stavropoulos (66) |
| |
| Year of Election or Appointment: 2001 |
| Mr. Stavropoulos is Chairman of the Board (2000-present) and a Mem- |
| ber of the Board of Directors of The Dow Chemical Company. Since |
| joining The Dow Chemical Company in 1967, Mr. Stavropoulos served |
| in numerous senior management positions, including President |
| (1993-2000; 2002-2003), CEO (1995-2000; 2002-2004), and Chair- |
| man of the Executive Committee (2000-2004). Currently, he is a Direc- |
| tor of NCR Corporation (data warehousing and technology solutions), |
| BellSouth Corporation (telecommunications), Chemical Financial Corpo- |
| ration, Maersk Inc. (industrial conglomerate, 2002-present), and Metal- |
| mark Capital (private equity investment firm, 2005-present). He also |
| serves as a member of the Board of Trustees of the American Enterprise |
| Institute for Public Policy Research. In addition, Mr. Stavropoulos is a |
| member of The Business Council, J.P. Morgan International Council and |
| the University of Notre Dame Advisory Council for the College of |
| Science. |
| |
| Kenneth L. Wolfe (66) |
| |
| Year of Election or Appointment: 2005 |
| Mr. Wolfe also serves as a Trustee (2005-present) or Member of the |
| Advisory Board (2004-present) of other investment companies advised |
| by FMR. Prior to his retirement in 2001, Mr. Wolfe was Chairman and |
| Chief Executive Officer of Hershey Foods Corporation (1993-2001). He |
| currently serves as a member of the boards of Adelphia Communica- |
| tions Corporation (2003-present), Bausch & Lomb, Inc., and Revlon Inc. |
| (2004-present). |
Annual Report 48
Advisory Board Members and Executive Officers:
Correspondence intended for Mr. Gamper may be sent to Fidelity Investments, P.O. Box 55235, Boston, Massachusetts 02205-5235. Correspondence intended for each executive officer and Mr. Lynch may be sent to Fidelity Investments, 82 Devonshire Street, Boston, Massachusetts 02109.
| Name, Age; Principal Occupation |
| |
| Albert R. Gamper, Jr. (63) |
| |
| Year of Election or Appointment: 2005 |
| Member of the Advisory Board of Fidelity Advisor Series VIII. Prior to his |
| retirement in December 2004, Mr. Gamper served as Chairman of the |
| Board of CIT Group Inc. (commercial finance). During his tenure with |
| CIT Group Inc. Mr. Gamper served in numerous senior management |
| positions, including Chairman (1987-1989; 1999-2001; 2002-2004), |
| Chief Executive Officer (1987-2004), and President (1989-2002). He |
| currently serves as a member of the Board of Directors of Public Service |
| Enterprise Group (utilities, 2001-present), Chairman of the Board of |
| Governors, Rutgers University (2004-present), and Chairman of the |
| Board of Saint Barnabas Health Care System. |
| |
| Peter S. Lynch (61) |
| |
| Year of Election or Appointment: 2003 |
| Member of the Advisory Board of Fidelity Advisor Series VIII. Vice |
| Chairman and a Director of FMR, and Vice Chairman (2001-present) |
| and a Director (2000-present) of FMR Co., Inc. Previously, Mr. Lynch |
| served as a Trustee of the Fidelity funds (1990-2003). In addition, he |
| serves as a Trustee of Boston College, Massachusetts Eye & Ear |
| Infirmary, Historic Deerfield, John F. Kennedy Library, and the Museum |
| of Fine Arts of Boston. |
| |
| Dwight D. Churchill (51) |
| |
| Year of Election or Appointment: 2005 |
| Vice President of Advisor Global Equity. Mr. Churchill also serves as |
| Vice President of certain Equity Funds (2005-present) and certain High |
| Income Funds (2005-present). Previously, he served as Head of Fidelity’s |
| Fixed-Income Division (2000-2005), Vice President of Fidelity’s Money |
| Market Funds (2000-2005), Vice President of Fidelity’s Bond Funds, and |
| Senior Vice President of FIMM (2000) and FMR. Mr. Churchill joined |
| Fidelity in 1993 as Vice President and Group Leader of Taxable Fixed- |
| Income Investments. |
49 Annual Report
Trustees and Officers - continued
| Name, Age; Principal Occupation |
| |
| Eric D. Roiter (56) |
| |
| Year of Election or Appointment: 1998 |
| Secretary of Advisor Global Equity. He also serves as Secretary of other |
| Fidelity funds; Vice President, General Counsel, and Secretary of FMR |
| Co., Inc. (2001-present) and FMR; Assistant Secretary of Fidelity Man- |
| agement & Research (U.K.) Inc. (2001-present), Fidelity Management & |
| Research (Far East) Inc. (2001-present), and Fidelity Investments Money |
| Management, Inc. (2001-present). Mr. Roiter is an Adjunct Member, |
| Faculty of Law, at Boston College Law School (2003-present). Previously, |
| Mr. Roiter served as Vice President and Secretary of Fidelity Distributors |
| Corporation (FDC) (1998-2005). |
| |
| Stuart Fross (46) |
| |
| Year of Election or Appointment: 2003 |
| Assistant Secretary of Advisor Global Equity. Mr. Fross also serves as |
| Assistant Secretary of other Fidelity funds (2003-present), Vice President |
| and Secretary of FDC (2005-present), and is an employee of FMR. |
| |
| Christine Reynolds (47) |
| |
| Year of Election or Appointment: 2004 |
| President, Treasurer, and Anti-Money Laundering (AML) officer of Advi- |
| sor Global Equity. Ms. Reynolds also serves as President, Treasurer, and |
| AML officer of other Fidelity funds (2004) and is a Vice President (2003) |
| and an employee (2002) of FMR. Before joining Fidelity Investments, |
| Ms. Reynolds worked at PricewaterhouseCoopers LLP (PwC) |
| (1980-2002), where she was most recently an audit partner with PwC’s |
| investment management practice. |
| |
| Paul M. Murphy (58) |
| |
| Year of Election or Appointment: 2005 |
| Chief Financial Officer of Advisor Global Equity. Mr. Murphy also serves |
| as Chief Financial Officer of other Fidelity funds (2005-present). He also |
| serves as Senior Vice President of Fidelity Pricing and Cash Manage- |
| ment Services Group (FPCMS). |
| |
| Kenneth A. Rathgeber (58) |
| |
| Year of Election or Appointment: 2004 |
| Chief Compliance Officer of Advisor Global Equity. Mr. Rathgeber also |
| serves as Chief Compliance Officer of other Fidelity funds (2004) and |
| �� Executive Vice President of Risk Oversight for Fidelity Investments |
| (2002). Previously, he served as Executive Vice President and Chief Op- |
| erating Officer for Fidelity Investments Institutional Services Company, |
| Inc. (1998-2002). |
Annual Report 50
| Name, Age; Principal Occupation |
| |
| John R. Hebble (47) |
| |
| Year of Election or Appointment: 2003 |
| Deputy Treasurer of Advisor Global Equity. Mr. Hebble also serves as |
| Deputy Treasurer of other Fidelity funds (2003), and is an employee of |
| FMR. Before joining Fidelity Investments, Mr. Hebble worked at Deutsche |
| Asset Management where he served as Director of Fund Accounting |
| (2002-2003) and Assistant Treasurer of the Scudder Funds |
| (1998-2003). |
| |
| Bryan A. Mehrmann (44) |
| |
| Year of Election or Appointment: 2005 |
| Deputy Treasurer of Advisor Global Equity. Mr. Mehrmann also serves |
| as Deputy Treasurer of other Fidelity funds (2005-present) and is an |
| employee of FMR. Previously, Mr. Mehrmann served as Vice President of |
| Fidelity Investments Institutional Services Group (FIIS)/Fidelity Investments |
| Institutional Operations Corporation, Inc. (FIIOC) Client Services |
| (1998-2004). |
| |
| Kimberley H. Monasterio (41) |
| |
| Year of Election or Appointment: 2004 |
| Deputy Treasurer of Advisor Global Equity. Ms. Monasterio also serves |
| as Deputy Treasurer of other Fidelity funds (2004) and is an employee |
| of FMR (2004). Before joining Fidelity Investments, Ms. Monasterio |
| served as Treasurer (2000-2004) and Chief Financial Officer |
| (2002-2004) of the Franklin Templeton Funds and Senior Vice President |
| of Franklin Templeton Services, LLC (2000-2004). |
| |
| Kenneth B. Robins (36) |
| |
| Year of Election or Appointment: 2005 |
| Deputy Treasurer of Advisor Global Equity. Mr. Robins also serves as |
| Deputy Treasurer of other Fidelity funds (2005-present) and is an em- |
| ployee of FMR (2004-present). Before joining Fidelity Investments, Mr. |
| Robins worked at KPMG LLP, where he was a partner in KPMG’s de- |
| partment of professional practice (2002-2004) and a Senior Manager |
| (1999-2000). In addition, Mr. Robins served as Assistant Chief Accoun- |
| tant, United States Securities and Exchange Commission (2000-2002). |
| |
| Robert G. Byrnes (38) |
| |
| Year of Election or Appointment: 2005 |
| Assistant Treasurer of Advisor Global Equity. Mr. Byrnes also serves as |
| Assistant Treasurer of other Fidelity funds (2005-present) and is an em- |
| ployee of FMR (2005-present). Previously, Mr. Byrnes served as Vice |
| President of FPCMS (2003-2005). Before joining Fidelity Investments, |
| Mr. Byrnes worked at Deutsche Asset Management where he served as |
| Vice President of the Investment Operations Group (2000-2003). |
51 Annual Report
Trustees and Officers - continued
| Name, Age; Principal Occupation |
| |
| John H. Costello (59) |
| |
| Year of Election or Appointment: 1986 |
| Assistant Treasurer of Advisor Global Equity. Mr. Costello also serves as |
| Assistant Treasurer of other Fidelity funds and is an employee of FMR. |
| |
| Peter L. Lydecker (51) |
| |
| Year of Election or Appointment: 2004 |
| Assistant Treasurer of Advisor Global Equity. Mr. Lydecker also serves as |
| Assistant Treasurer of other Fidelity funds (2004) and is an employee of |
| FMR. |
| |
| Mark Osterheld (50) |
| |
| Year of Election or Appointment: 2002 |
| Assistant Treasurer of Advisor Global Equity. Mr. Osterheld also serves |
| as Assistant Treasurer of other Fidelity funds (2002) and is an employee |
| of FMR. |
| |
| Gary W. Ryan (47) |
| |
| Year of Election or Appointment: 2005 |
| Assistant Treasurer of Advisor Global Equity. Mr. Ryan also serves as |
| Assistant Treasurer of other Fidelity funds (2005-present) and is an em- |
| ployee of FMR (2005-present). Previously, Mr. Ryan served as Vice Pres- |
| ident of Fund Reporting in FPCMS (1999-2005). |
| |
| Salvatore Schiavone (39) |
| |
| Year of Election or Appointment: 2005 |
| Assistant Treasurer of Advisor Global Equity. Mr. Schiavone also serves |
| as Assistant Treasurer of other Fidelity funds (2005-present) and is an |
| employee of FMR (2005-present). Before joining Fidelity Investments, |
| Mr. Schiavone worked at Deutsche Asset Management, where he most |
| recently served as Assistant Treasurer (2003-2005) of the Scudder |
| Funds and Vice President and Head of Fund Reporting (1996-2003). |
Annual Report 52
The Board of Trustees of Fidelity Advisor Global Equity Fund voted to pay to shareholders of record at the opening of business on record date, the following distributions per share derived from capital gains realized from sales of portfolio securities, and dividends derived from net investment income:
| | | Pay Date | | Record Date | | Dividends | | Capital Gains |
| Institutional Class | | 12/5/2005 | | 12/2/2005 | | $0.069 | | $0.023 |
The fund will notify shareholders in January 2006 of amounts for use in preparing 2005 income tax returns.
53 Annual Report
Board Approval of Investment Advisory Contracts and Management Fees
Advisor Global Equity Fund
Each year, typically in July, the Board of Trustees, including the independent Trustees (together, the Board), votes on the renewal of the management contract and sub-advisory agreements (together, the Advisory Contracts) for the fund. The Board, assisted by the advice of fund counsel and independent Trustees’ counsel, requests and considers a broad range of information throughout the year.
The Board meets regularly each month except August and takes into account throughout the year matters bearing on Advisory Contracts. The Board, acting directly and through its separate committees, considers at each of its meetings factors that are relevant to the annual renewal of the fund’s Advisory Contracts, including the services and support provided to the fund and its shareholders by Fidelity. At the time of the renewal, the Board had 11 standing committees, each composed of independent Trustees with varying backgrounds, to which the Board has assigned specific subject matter responsibilities in order to enhance effective decision-making by the Board. Each committee has adopted a written charter outlining the structure and purposes of the committee. One such committee, the Equity Contract Committee, meets periodically during the first six months of each year and as necessary to consider matters specifically related to the annual renewal of Advisory Contracts. The committee requests and receives information on, and makes recommendations to the independent Trustees concerning, the approval and annual review of the Advisory Contracts.
At its July 2005 meeting, the Board of Trustees, including the independent Trustees, unanimously determined to renew the Advisory Contracts for the fund. In reaching its determination, the Board considered all factors it believed relevant, including (1) the nature, extent, and quality of the services to be provided to the fund and its shareholders by Fidelity (including the investment performance of the fund); (2) the competitiveness of the management fee and total expenses of the fund; (3) the total costs of the services to be provided by and the profits to be realized by the investment adviser and its affiliates from the relationship with the fund; (4) the extent to which economies of scale would be realized as the fund grows; and (5) whether fee levels reflect these economies of scale, if any, for the benefit of fund shareholders.
In determining whether to renew the Advisory Contracts for the fund, the Board ultimately reached a determination, with the assistance of fund counsel and independent Trustees’ counsel, that the renewal of the Advisory Contracts and the compensation to be received by Fidelity under the management contract is consistent with Fidelity’s fiduciary duty under applicable law. In addition to evaluating the specific factors noted above, the Board, in reaching its determination, is aware that shareholders in the fund have a broad range of investment choices available to them, including a wide choice among mutual funds offered by competitors to Fidelity, and that the fund’s shareholders, with the opportunity to review and weigh the disclosure provided by the fund in its
prospectus and other public disclosures, have chosen to invest in this fund, managed by Fidelity.
Nature, Extent, and Quality of Services Provided by Fidelity. The Board considered staffing within the investment adviser, FMR, and the sub-advisers (together, the Investment Advisers), including the backgrounds of the fund’s portfolio managers and the fund’s investment objective and discipline. The independent Trustees also had discussions with senior management of Fidelity’s investment operations and investment groups. The Board considered the structure of the portfolio manager compensation program and whether this structure provides appropriate incentives.
Fidelity Resources Dedicated to Investment Management and Support Services. The Board reviewed the size, education, and experience of the Investment Advisers’ investment staff, their use of technology, and the Investment Advisers’ approach to recruiting, training, and retaining portfolio managers and other research, advisory, and management personnel. The Board considered Fidelity’s extensive global research capabilities that enable the Investment Advisers to aggregate data from various sources in an effort to produce positive investment results. The Board noted that Fidelity’s analysts have access to a variety of technological tools that enable them to perform both fundamental and quantitative analysis and to specialize in various disciplines. The Board also considered that Fidelity’s portfolio managers and analysts have access to daily portfolio attribution that allows for monitoring of a fund’s portfolio, as well as an electronic communication system that provides immediate real-time access to research concerning issuers and credit enhancers.
Shareholder and Administrative Services. The Board considered the nature, extent, quality, and cost of administrative, distribution, and shareholder services performed by the Investment Advisers and their affiliates under the Advisory Contracts and under separate agreements covering transfer agency, pricing and bookkeeping, and securities lending services for the fund. The Board also considered the nature and extent of the Investment Advisers’ supervision of third party service providers, principally custodians and subcustodians. The Board reviewed the allocation of fund brokerage, including allocations to brokers affiliated with the Investment Advisers, the use of brokerage commissions to pay fund expenses, and the use of “soft” commission dollars to pay for research services. The Board also considered that Fidelity voluntarily decided in 2004 to stop using “soft” commission dollars to pay for market data and, instead, to pay for that data out of its own resources. The Board also considered the resources devoted to, and the record of compliance with, the fund’s compliance policies and procedures.
The Board noted that the growth of fund assets across the complex allows Fidelity to reinvest in the development of services designed to enhance the value or convenience of the Fidelity funds as investment vehicles. These services include 24-hour access to
55 Annual Report
Board Approval of Investment Advisory Contracts and Management Fees - continued
account information and market information through phone representatives and over the Internet, and investor education materials and asset allocation tools.
Investment in a Large Fund Family. The Board considered the benefits to shareholders of investing in a Fidelity fund, including the benefits of investing in a fund that is part of a large family of funds offering a variety of investment disciplines and providing for a large variety of mutual fund investor services. For example, fund shareholders are offered the privilege of exchanging shares of the fund for shares of other Fidelity funds, as set forth in the fund’s prospectus, without paying an additional sales charge. The Board noted that, since the last Advisory Contract renewals in July 2004, Fidelity has taken a number of actions that benefited particular funds, including (i) voluntarily deciding in 2004 to stop using “soft” commission dollars to pay for market data and, instead, to pay for that data out of its own resources, (ii) contractually agreeing to impose management fee reductions and expense limitations on its five Spartan stock index funds and its stock index fund available through variable insurance products, (iii) contractually agreeing to eliminate the management fees on the Fidelity Freedom Funds and the Fidelity Advisor Freedom Funds, (iv) contractually agreeing to reduce the management fees on most of its investment-grade taxable bond funds, and (v) contractually agreeing to impose expense limitations on its retail and Spartan investment-grade taxable bond funds.
Investment Performance and Compliance. The Board considered whether the fund has operated within its investment objective, as well as its record of compliance with its investment restrictions. It also reviewed the fund’s absolute investment performance for each class, as well as the fund’s relative investment performance for each class measured against (i) a broad-based securities market index, and (ii) a peer group of mutual funds deemed appropriate by the Board over multiple periods. The following charts considered by the Board show, over the one-, three-, and five-year periods ended December 31, 2004, the returns of Class C and Institutional Class of the fund, the returns of a broad-based securities market index (“benchmark”), and a range of returns of a peer group of mutual funds identified by Lipper Inc. as having an investment objective similar to that of the fund. The returns of Class C and Institutional Class represent the performance of classes with the highest and lowest 12b-1 fees, respectively (not necessarily with the highest and lowest total expenses). The box within each chart shows the 25th percentile return (bottom of box) and the 75th percentile return (top of box) of the Lipper peer group. Returns shown above the box are in the first quartile and returns shown below the box are in the fourth quartile. The percentage beaten numbers noted below each chart correspond to the percentile box and represent the percentage of funds in the Lipper peer group whose performance was equal to or lower than that of the class indicated.

The Board reviewed the fund’s relative investment performance against its Lipper peer group and stated that the performance of Institutional Class of the fund was in the third quartile for the one-year period and the second quartile for the three- and five-year periods. The Board also stated that the relative investment performance of Institutional Class of the fund has compared favorably to its benchmark over time, although the fund’s one-year cumulative total return was lower than its benchmark. The Board considered that the variations in performance among the fund’s classes reflect the variations in class expenses, which result in lower performance for higher expense classes.
The Board has had thorough discussions with FMR throughout the year about the Board’s and FMR’s concerns about equity research, equity fund performance, and compliance with internal policies governing gifts and entertainment. FMR has taken steps that it believes will refocus and strengthen equity research and equity portfolio management and compliance. The Board noted with favor FMR’s recent reorganization of its senior management team and FMR’s plans to dedicate additional resources to investment research, and participated in the process that led to those changes.
Based on its review, and giving particular weight to the nature and quality of the resources dedicated by the Investment Advisers to maintain and improve relative performance, the Board concluded that the nature, extent, and quality of the services provided by Fidelity will benefit the fund’s shareholders, particularly in light of the Board’s view that the fund’s shareholders benefit from investing in a fund that is part of a large family of funds offering a variety of investment disciplines and services.
Competitiveness of Management Fee and Total Fund Expenses. The Board considered the fund’s management fee and total expenses compared to “mapped groups”
57 Annual Report
Board Approval of Investment Advisory Contracts and Management Fees - continued
of competitive funds and classes. Fidelity creates “mapped groups” by combining similar Lipper investment objective categories that have comparable management fee characteristics. Combining Lipper investment objective categories aids the Board’s management fee and total expense comparisons by broadening the competitive group used for comparison and by reducing the number of universes to which various Fidelity funds are compared.
The Board considered two proprietary management fee comparisons for the 12-month periods shown in the chart below. The group of Lipper funds used by the Board for management fee comparisons is referred to below as the “Total Mapped Group” and, for the reasons explained above, is broader than the Lipper peer group used by the Board for performance comparisons. The Total Mapped Group comparison focuses on a fund’s standing relative to the total universe of comparable funds available to investors, in terms of gross management fees before expense reimbursements or caps. “TMG %” represents the percentage of funds in the Total Mapped Group that had management fees that were lower than the fund’s. For example, a TMG % of 21% means that 79% of the funds in the Total Mapped Group had higher management fees than the fund. The “Asset-Size Peer Group” (ASPG) comparison focuses on a fund’s standing relative to non-Fidelity funds similar in size to the fund within the Total Mapped Group. The ASPG represents at least 15% of the funds in the Total Mapped Group with comparable asset size and management fee characteristics, subject to a minimum of 50 funds (or all funds in the Total Mapped Group if fewer than 50). Additional information, such as the ASPG quartile (“quadrant”) in which the fund’s management fee ranked, is also included in the chart and considered by the Board.
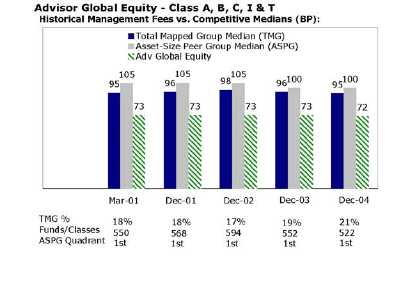
Annual Report 58
The Board noted that the fund’s management fee ranked below the median of its Total Mapped Group and below the median of its ASPG for 2004.
Based on its review, the Board concluded that the fund’s management fee was fair and reasonable in light of the services that the fund receives and the other factors considered.
In its review of each class’s total expenses, the Board considered the fund’s management fee as well as other fund or class expenses, as applicable, such as transfer agent fees, pricing and bookkeeping fees, fund-paid 12b-1 fees, and custodial, legal, and audit fees. The Board also noted the effects of any waivers and reimbursements on fees and expenses. As part of its review, the Board also considered current and historical total expenses of each class of the fund compared to competitive fund median expenses. Each class of the fund is compared to those funds and classes in the Total Mapped Group (used by the Board for management fee comparisons) that have a similar sales load structure.
The Board noted that the total expenses of each class ranked above its competitive median for 2004. The Board noted that the fund offers multiple classes, each of which has a different sales load and 12b-1 fee structure, and that the multiple structures are intended to offer a range of pricing options for the intermediary market. The Board also noted that the total expenses of the classes vary primarily by the level of their 12b-1 fees, although differences in transfer agent fees may also cause expenses to vary from class to class.
Furthermore, the Board considered that on December 16, 2004, it had approved changes (effective January 1, 2005) in the transfer agent and service agreements for the fund that established maximum transfer agent fees and eliminated the minimum pricing and bookkeeping fee to prevent small funds or funds with small average account sizes from having relatively high fees in basis points (the “small-fund fee reductions”). The Board considered that, if the small-fund fee reductions had been in effect in 2004, the total expenses of each of Class A, Class B, and Class C would have ranked below the median.
In its review of total expenses, the Board also considered Fidelity fee structures and other information on clients that FMR and its affiliates service in other competitive markets, such as other mutual funds advised or subadvised by FMR or its affiliates, pension plan clients, and other institutional clients.
Based on its review, the Board concluded that the total expenses for each class of the fund were reasonable, although in all cases above the median of the universe presented for comparison, in light of the services that the fund and its shareholders receive and the other factors considered.
Costs of the Services and Profitability. The Board considered the revenues earned and the expenses incurred by Fidelity in conducting the business of developing,
59 Annual Report
Board Approval of Investment Advisory Contracts and Management Fees - continued
marketing, distributing, managing, administering and servicing the fund and its shareholders. The Board also considered the level of Fidelity’s profits in respect of all the Fidelity funds.
On an annual basis, FMR presents to the Board Fidelity’s profitability for the fund. Fidelity calculates the profitability for each fund, as well as aggregate profitability for groups of Fidelity funds and all Fidelity funds, using a series of detailed revenue and cost allocation methodologies which originate with the audited books and records of Fidelity. The Audit Committee of the Board reviews any significant changes from the prior year’s methodologies.
PricewaterhouseCoopers LLP (PwC), independent registered accounting firm and auditor to Fidelity and certain Fidelity funds, has been engaged annually by the Board as part of the Board’s assessment of the results of Fidelity’s profitability analysis. PwC’s engagement includes the review and assessment of Fidelity’s methodologies used in determining the revenues and expenses attributable to Fidelity’s mutual fund business, and completion of agreed-upon procedures surrounding the mathematical accuracy of fund profitability and its conformity to allocation methodologies. After considering PwC’s reports issued under the engagement and information provided by Fidelity, the Board believes that while other allocation methods may also be reasonable, Fidelity’s profitability methodologies are reasonable in all material respects.
The Board has also reviewed Fidelity’s non-fund businesses and any fall-out benefits related to the mutual fund business as well as cases where Fidelity’s affiliates may benefit from or be related to the fund’s business. In addition, a special committee of the Board reviewed services provided to Fidelity by its affiliates and determined that the fees that Fidelity paid for such services were reasonable.
The Board considered the costs of the services provided by and the profits realized by Fidelity in connection with the operation of the fund and determined that the amount of profit is a fair entrepreneurial profit for the management of the fund.
Economies of Scale. The Board considered whether there have been economies of scale in respect of the management of the Fidelity funds, whether the Fidelity funds (including the fund) have appropriately benefited from any such economies of scale, and whether there is potential for realization of any further economies of scale. The Board considered the extent to which the fund will benefit from economies of scale through increased services to the fund, through waivers or reimbursements, or through fee or expense reductions, including reductions that occur through operation of the transfer agent agreement. The transfer agent fee varies in part based on the number of accounts in the fund. If the number of accounts decreases or the average account size increases, the overall transfer agent fee rate decreases.
The Board recognized that the fund’s management contract incorporates a “group fee” structure, which provides for lower fee rates as total fund assets under FMR’s management increase, and for higher fee rates as total fund assets under FMR’s management decrease. The Board considered that the group fee is designed to deliver the benefits of economies of scale to fund shareholders when total fund assets increase, even if assets of any particular fund are unchanged or have declined, because some portion of Fidelity’s costs are attributable to services provided to all Fidelity funds, and all funds benefit if those costs can be allocated among more assets. The Board concluded that, given the group fee structure, fund shareholders will achieve a certain level of economies of scale as assets under FMR’s management increase at the fund complex level, regardless of whether Fidelity achieves any such economies of scale.
The Board further concluded that any potential economies of scale are being shared between fund shareholders and Fidelity in an appropriate manner.
Additional Information Requested by the Board. In order to develop fully the factual basis for consideration of the Advisory Contracts, the Board requested additional information regarding (i) equity fund transfer agency fees; (ii) Fidelity’s fund profitability methodology and the impact of various changes in the methodology over time; (iii) benefits to shareholders from economies of scale; (iv) composition and characteristics of various fund and industry data used in comparisons; and (v) compensation of portfolio managers and research analysts.
Based on its evaluation of all of the conclusions noted above, and after considering all material factors, the Board ultimately concluded that the existing advisory fee structures are fair and reasonable, and that the fund’s existing Advisory Contracts should be renewed.
61 Annual Report
63 Annual Report
Investment Adviser
Fidelity Management & Research Company
Boston, MA
Investment Sub-Advisers
FMR Co., Inc.
Fidelity Management & Research
(U.K.) Inc.
Fidelity Management & Research
(Far East) Inc.
Fidelity International
Investment Advisors
Fidelity Investments Japan Limited
Fidelity International Investment
Advisors (U.K.) Limited
General Distributor
Fidelity Distributors Corporation
Boston, MA
Transfer and Service Agents
Fidelity Investments Institutional
Operations Company, Inc.
Boston, MA
Fidelity Service Company, Inc.
Boston, MA
Custodian
State Street Bank and Trust Company
Quincy, MA
|


Fidelity® Advisor
International Capital Appreciation
Fund - Class A, Class T, Class B and Class C
Annual Report October 31, 2005

| Contents | | | | |
| |
| Chairman’s Message | | 4 | | Ned Johnson’s message to shareholders. |
| Performance | | 6 | | How the fund has done over time. |
| Management’s Discussion | | 8 | | The manager’s review of fund |
| | | | | performance, strategy and outlook. |
| Shareholder Expense | | 9 | | An example of shareholder expenses. |
| Example | | | | |
| Investment Changes | | 11 | | A summary of major shifts in the fund’s |
| | | | | investments over the past six months. |
| Investments | | 12 | | A complete list of the fund’s investments |
| | | | | with their market values. |
| Financial Statements | | 15 | | Statements of assets and liabilities, |
| | | | | operations, and changes in net assets, |
| | | | | as well as financial highlights. |
| Notes | | 24 | | Notes to the financial statements. |
| Report of Independent | | 32 | | |
| Registered Public | | | | |
| Accounting Firm | | | | |
| Trustees and Officers | | 33 | | |
| Distributions | | 43 | | |
| Board Approval of | | 44 | | |
| Investment Advisory | | | | |
| Contracts and | | | | |
| Management Fees | | | | |
To view a fund’s proxy voting guidelines and proxy voting record for the 12-month period ended June 30, visit www.fidelity.com/proxyvotingresults or visit the Securities and Exchange Commission’s (SEC) web site at www.sec.gov. You may also call 1-877-208-0098 to request a free copy of the proxy voting guidelines.
Standard & Poor’s, S&P and S&P 500 are registered service marks of The McGraw-Hill Companies, Inc. and have been licensed for use by Fidelity Distributors Corporation.
Other third party marks appearing herein are the property of their respective owners.
All other marks appearing herein are registered or unregistered trademarks or service marks of FMR Corp. or an affiliated company.
The views expressed in the Management’s Discussion of Fund Performance reflect those of the portfolio manager only through the end of the period of the report as stated on the cover and do not necessarily represent the views of Fidelity or any other person in the Fidelity organization. Any such views are subject to change at any time based upon market or other conditions and Fidelity disclaims any responsibility to update such views. These views may not be relied on as investment advice and, because investment decisions for a Fidelity fund are based on numerous factors, may not be relied on as an indication of trading intent on behalf of any Fidelity fund.
This report and the financial statements contained herein are submitted for the general information of the shareholders of the fund. This report is not authorized for distribution to prospective investors in the fund unless preceded or accompanied by an effective prospectus.
A fund files its complete schedule of portfolio holdings with the SEC for the first and third quarters of each fiscal year on Form N-Q. Forms N-Q are available on the SEC’s web site at http://www.sec.gov. A fund’s Forms N-Q may be reviewed and copied at the SEC’s Public Reference Room in Washington, DC. Information regarding the operation of the SEC’s Public Reference Room may be obtained by calling 1-800-SEC-0330. For a complete list of a fund’s portfolio holdings, view the most recent quarterly holdings report, semiannual report, or annual report on Fidelity’s web site at http://www.advisor.fidelity.com.
NOT FDIC INSURED · MAY LOSE VALUE · NO BANK GUARANTEE
Neither the fund nor Fidelity Distributors Corporation is a bank.
3 Annual Report
Chairman’s Message
(Photograph of Edward C. Johnson 3d)
Dear Shareholder:
During the past year or so, much has been reported about the mutual fund industry, and much of it has been more critical than I believe is warranted. Allegations that some companies have been less than forthright with their shareholders have cast a shadow on the entire industry. I continue to find these reports disturbing, and assert that they do not create an accurate picture of the industry overall. Therefore, I would like to remind everyone where Fidelity stands on these issues. I will say two things specifically regarding allegations that some mutual fund companies were in violation of the Securities and Exchange Commission’s forward pricing rules or were involved in so-called “market timing” activities.
First, Fidelity has no agreements that permit customers who buy fund shares after 4 p.m. to obtain the 4 p.m. price. This is not a new policy. This is not to say that someone could not deceive the company through fraudulent acts. However, we are extremely diligent in preventing fraud from occurring in this manner — and in every other. But I underscore again that Fidelity has no so-called “agreements” that sanction illegal practices.
Second, Fidelity continues to stand on record, as we have for years, in opposition to predatory short-term trading that adversely affects shareholders in a mutual fund. Back in the 1980s, we initiated a fee — which is returned to the fund and, therefore, to investors — to discourage this activity. Further, we took the lead several years ago in developing a Fair Value Pricing Policy to prevent market timing on foreign securities in our funds. I am confident we will find other ways to make it more difficult for predatory traders to operate. However, this will only be achieved through close cooperation among regulators, legislators and the industry.
Yes, there have been unfortunate instances of unethical and illegal activity within the mutual fund industry from time to time. That is true of any industry. When this occurs, confessed or convicted offenders should be dealt with appropriately. But we are still concerned about the risk of over-regulation and the quick application of simplistic solutions to intricate problems. Every system can be improved, and we support and applaud well thought out improvements by regulators, legislators and industry representatives that achieve the common goal of building and protecting the value of investors’ holdings.
For nearly 60 years, Fidelity has worked very hard to improve its products and service to justify your trust. When our family founded this company in 1946, we had only a few hundred customers. Today, we serve more than 18 million customers including individual investors and participants in retirement plans across America.
Annual Report 4
Let me close by saying that we do not take your trust in us for granted, and we realize that we must always work to improve all aspects of our service to you. In turn, we urge you to continue your active participation with your financial matters, so that your interests can be well served.
Best regards,
/s/Edward C. Johnson 3d
5 Annual Report
Performance: The Bottom Line
Average annual total return reflects the change in the value of an investment, assuming reinvestment of the class’ dividend income and capital gains (the profits earned upon the sale of securities that have grown in value) and assuming a constant rate of performance each year. The $10,000 table and the fund’s returns do not reflect the deduction of taxes that a shareholder would pay on fund distributions or the redemption of fund shares. During periods of reimbursement by Fidelity, a fund’s total return will be greater than it would be had the reimbursement not occurred. How a fund did yesterday is no guarantee of how it will do tomorrow. Returns may reflect the conversion of Class B shares to Class A shares after a maximum of seven years.
| Average Annual Total Returns | | | | | | |
| Periods ended October 31, 2005 | | Past 1 | | Past 5 | | Life of |
| | | year | | years | | fundA |
| Class A (incl. 5.75% sales charge) | | 6.37% | | 2.04% | | 7.28% |
| Class T (incl. 3.50% sales charge) | | 8.64% | | 2.30% | | 7.40% |
| Class B (incl. contingent deferred | | | | | | |
| sales charge)B | | 6.97% | | 2.06% | | 7.33% |
| Class C (incl. contingent deferred | | | | | | |
| sales charge)C | | 11.08% | | 2.53% | | 7.31% |
A From November 3, 1997.
B Class B shares’ contingent deferred sales charges included in the past one year, past five year,
and life of fund total return figures are 5%, 2%, and 0%, respectively.
C Class C shares’ contingent deferred sales charge included in the past one year, past five year, and life of fund total return figures are 1%, 0%, and 0%, respectively.
| | $10,000 Over Life of Fund
|
Let’s say hypothetically that $10,000 was invested in Fidelity® Advisor International Capital Appreciation Fund — Class T on November 3, 1997, when the fund started, and the current 3.50% sales charge was paid. The chart shows how the value of your investment would have changed, and also shows how the Morgan Stanley Capital InternationalSM All Country World ex USA Index performed over the same period.

Management’s Discussion of Fund Performance
Comments from Richard Mace, Portfolio Manager of Fidelity® Advisor International Capital Appreciation Fund
Foreign stock markets enjoyed broad-based advances during the 12-month period that ended October 31, 2005, encouraged by better-than-expected corporate earnings and markedly improved economies. For the 12 months overall, the Morgan Stanley Capital InternationalSM Europe, Australasia, Far East (MSCIr EAFE®) Index — a performance measure of developed stock markets outside the United States and Canada — gained 18.28% . The Japanese stock market climbed to its highest level in more than four years. Positive economic indicators and Prime Minister Koizumi’s decisive election victory attracted record inflows from overseas investors. In response, the Tokyo Stock Exchange Stock Price Index (TOPIX) soared 22.89% . Southeast Asian equities outside of Japan, particularly South Korea, also responded well to the better macroeconomic environment, illustrated by the 19.44% return for the MSCI All Country Far East ex Japan index. Euro-pean stock markets were up as well, despite investors’ concern about higher energy prices and potential downgrades to economic growth in the region. For the year overall, the MSCI Europe index rose 16.51% .
For the 12 months ending October 31, 2005, the fund’s Class A, Class T, Class B and Class shares returned 12.86%, 12.58%, 11.97% and 12.08%, respectively. By comparison, the Morgan Stanley Capital International All Country World (MSCI ACWI) ex USA Index rose 20.24% and the LipperSM International Funds Average gained 17.75% . A heavy overweight ing in information technology — largely concentrated within the lagging semiconductor industry — plus unfavorable stock picking within that group were responsible for a large portion of the shortfall versus the index. Taiwanese chip maker United Microelectronics and equipment maker Tokyo Electron were two of the biggest detractors in this group. Inopportune stock selection also hurt in a variety of other areas, including technology hardware and equipment, where Alcatel, the French telecommunications equipment maker, disappointed. On the plus side of the ledger, the fund reclaimed some ground through particularly strong stock picking in the banking group — notably State Bank of India — as well as in the booming energy arena, with such names as Canadian Natural Resources. Some of the stocks mentioned in this report were no longer held at period end
Note to shareholders: Effective January 1, 2006, an interim portfolio management team led by Michael Jenkins and composed of William Bower, Penelope Dobkin and William Kennedy has been named to manage Fidelity Advisor International Capital Appreciation Fund while the fund’s Portfolio Manager, Richard Mace, is on a leave of absence from the firm.
The views expressed in this statement reflect those of the portfolio manager only through October 31, 2005. See page 3 for further discussion of this section of the report.
Shareholder Expense Example
As a shareholder of the Fund, you incur two types of costs: (1) transaction costs, including sales charges (loads) on purchase payments or redemption proceeds, redemption fees, and (2) ongoing costs, including management fees, distribution and/or service (12b-1) fees and other Fund expenses. This Example is intended to help you understand your ongoing costs (in dollars) of investing in the Fund and to compare these costs with the ongoing costs of investing in other mutual funds.
The Example is based on an investment of $1,000 invested at the beginning of the period and held for the entire period (May 1, 2005 to October 31, 2005).
The first line of the table below for each class of the Fund provides information about actual account values and actual expenses. You may use the information in this line, together with the amount you invested, to estimate the expenses that you paid over the period. Simply divide your account value by $1,000.00 (for example, an $8,600 account value divided by $1,000.00 = 8.6), then multiply the result by the number in the first line for a class of the Fund under the heading entitled “Expenses Paid During Period” to estimate the expenses you paid on your account during this period.
Hypothetical Example for Comparison Purposes
The second line of the table below for each class of the Fund provides information about hypothetical account values and hypothetical expenses based on a Class’ actual expense ratio and an assumed rate of return of 5% per year before expenses, which is not the Class’ actual return. The hypothetical account values and expenses may not be used to estimate the actual ending account balance or expenses you paid for the period. You may use this information to compare the ongoing costs of investing in the Fund and other funds. To do so, compare this 5% hypothetical example with the 5% hypothetical examples that appear in the shareholder reports of the other funds.
Please note that the expenses shown in the table are meant to highlight your ongoing costs only and do not reflect any transaction costs. Therefore, the second line of the table is useful in comparing ongoing costs only, and will not help you determine the relative total costs of owning different funds. In addition, if these transactional costs were included, your costs would have been higher.
| | | | | | | | | | | | | Expenses Paid |
| | | | | Beginning | | | | Ending | | | | During Period* |
| | | | | Account Value | | | | Account Value | | | | May 1, 2005 |
| | | | | May 1, 2005 | | | | October 31, 2005 | | to October 31, 2005 |
| Class A | | | | | | | | | | | | |
| Actual | | $ | | 1,000.00 | | $ | | 1,076.80 | | $ | | 7.59 |
| HypotheticalA | | $ | | 1,000.00 | | $ | | 1,017.90 | | $ | | 7.38 |
| Class T | | | | | | | | | | | | |
| Actual | | $ | | 1,000.00 | | $ | | 1,075.80 | | $ | | 8.74 |
| HypotheticalA | | $ | | 1,000.00 | | $ | | 1,016.79 | | $ | | 8.49 |
| Class B | | | | | | | | | | | | |
| Actual | | $ | | 1,000.00 | | $ | | 1,073.00 | | $ | | 11.76 |
| HypotheticalA | | $ | | 1,000.00 | | $ | | 1,013.86 | | $ | | 11.42 |
9 Annual Report
| Shareholder Expense Example - continued | | | | |
| |
| |
| | | | | | | | | | | | | Expenses Paid |
| | | | | Beginning | | | | Ending | | | | During Period* |
| | | | | Account Value | | | | Account Value | | | | May 1, 2005 |
| | | | | May 1, 2005 | | | | October 31, 2005 | | to October 31, 2005 |
| Class C | | | | | | | | | | | | |
| Actual | | $ | | 1,000.00 | | $ | | 1,072.70 | | $ | | 11.44 |
| HypotheticalA | | $ | | 1,000.00 | | $ | | 1,014.17 | | $ | | 11.12 |
| Institutional Class | | | | | | | | | | | | |
| Actual | | $ | | 1,000.00 | | $ | | 1,078.00 | | $ | | 6.55 |
| HypotheticalA | | $ | | 1,000.00 | | $ | | 1,018.90 | | $ | | 6.36 |
| |
| A 5% return per year before expenses | | | | | | | | |
* Expenses are equal to each Class’ annualized expense ratio (shown in the table below); multiplied by the average account value over the period, multiplied by 184/365 (to reflect the one-half year period).
| | | Annualized |
| | | Expense Ratio |
| Class A | | 1.45% |
| Class T | | 1.67% |
| Class B | | 2.25% |
| Class C | | 2.19% |
| Institutional Class | | 1.25% |
Investment Changes
| Top Five Stocks as of October 31, 2005 | | | | |
| | | % of fund’s | | % of fund’s net assets |
| | | net assets | | 6 months ago |
| Pernod Ricard SA (France, Beverages) | | 5.0 | | 1.1 |
| Total SA Series B (France, Oil, Gas & | | | | |
| Consumable Fuels) | | 4.6 | | 2.6 |
| Sumitomo Mitsui Financial Group, Inc. (Japan, | | | | |
| Commercial Banks) | | 4.5 | | 2.9 |
| Credit Suisse Group (Reg.) (Switzerland, Capital | | | | |
| Markets) | | 4.4 | | 2.8 |
| Tokyo Electron Ltd. (Japan, Semiconductors & | | | | |
| Semiconductor Equipment) | | 4.3 | | 0.0 |
| | | 22.8 | | |
| Top Five Market Sectors as of October 31, 2005 | | |
| | | % of fund’s | | % of fund’s net assets |
| | | net assets | | 6 months ago |
| Financials | | 24.4 | | 23.7 |
| Information Technology | | 22.5 | | 10.6 |
| Energy | | 16.4 | | 10.4 |
| Health Care | | 9.4 | | 10.1 |
| Industrials | | 5.5 | | 8.1 |
| Top Five Countries as of October 31, 2005 | | |
| (excluding cash equivalents) | | % of fund’s | | % of fund’s net assets |
| | | net assets | | 6 months ago |
| Japan | | 18.1 | | 14.5 |
| Switzerland | | 12.8 | | 14.7 |
| France | | 11.1 | | 10.8 |
| Germany | | 8.2 | | 2.7 |
| United Kingdom | | 7.3 | | 11.2 |
| Percentages are adjusted for the effect of open futures contracts, if applicable. | | |

11 Annual Report
| Investments October 31, 2005 | | | | | | |
| Showing Percentage of Net Assets | | | | | | |
| |
| Common Stocks — 96.2% | | | | | | |
| | | | | Shares | | Value (Note 1) |
| |
| Australia – 1.6% | | | | | | |
| BHP Billiton Ltd. sponsored ADR | | | | 338,700 | | $ 10,516,635 |
| Austria – 0.9% | | | | | | |
| OMV AG | | | | 111,300 | | 6,003,939 |
| Canada – 6.3% | | | | | | |
| EnCana Corp. | | | | 561,400 | | 25,669,433 |
| Research In Motion Ltd. (a) | | | | 135,200 | | 8,313,484 |
| Talisman Energy, Inc. | | | | 179,700 | | 7,959,447 |
| TOTAL CANADA | | | | | | 41,942,364 |
| |
| China – 0.5% | | | | | | |
| Weichai Power Co. Ltd. (H Shares) | | | | 1,905,000 | | 3,636,950 |
| Finland – 0.8% | | | | | | |
| Nokia Corp. sponsored ADR | | | | 302,200 | | 5,083,004 |
| France – 11.1% | | | | | | |
| BNP Paribas SA | | | | 134,200 | | 10,175,170 |
| Pernod Ricard SA | | | | 187,971 | | 32,875,677 |
| Total SA Series B | | | | 121,957 | | 30,738,043 |
| TOTAL FRANCE | | | | | | 73,788,890 |
| |
| Germany – 8.2% | | | | | | |
| Allianz AG (Reg.) | | | | 173,200 | | 24,490,479 |
| Deutsche Telekom AG (Reg.) | | | | 344,700 | | 6,101,190 |
| E.ON AG | | | | 266,600 | | 24,161,957 |
| TOTAL GERMANY | | | | | | 54,753,626 |
| |
| India – 3.3% | | | | | | |
| Cipla Ltd. | | | | 449,282 | | 3,592,163 |
| Satyam Computer Services Ltd. | | | | 774,491 | | 10,362,061 |
| State Bank of India | | | | 383,070 | | 7,943,752 |
| TOTAL INDIA | | | | | | 21,897,976 |
| |
| Ireland – 1.7% | | | | | | |
| Ryanair Holdings PLC sponsored ADR (a) | | | | 224,900 | | 11,148,293 |
| Italy – 0.8% | | | | | | |
| Banca Intesa Spa | | | | 1,072,200 | | 5,003,672 |
| Japan – 18.1% | | | | | | |
| Credit Saison Co. Ltd. | | | | 223,500 | | 10,161,622 |
| Nikko Cordial Corp. | | | | 2,204,000 | | 26,721,807 |
| Nitto Denko Corp. | | | | 140,800 | | 8,547,653 |
| Sumitomo Mitsui Financial Group, Inc. | | | | 3,234 | | 29,967,463 |
| Tokyo Electron Ltd. | | | | 563,900 | | 28,372,945 |
See accompanying notes which are an integral part of the financial statements.
| Common Stocks – continued | | | | |
| | | Shares | | Value (Note 1) |
| |
| Japan – continued | | | | |
| Yahoo! Japan Corp | | 7,790 | | $ 8,297,911 |
| Yahoo! Japan Corp. New | | 7,790 | | 8,432,836 |
| TOTAL JAPAN | | | | 120,502,237 |
| |
| Korea (South) – 1.2% | | | | |
| Shinhan Financial Group Co. Ltd. | | 232,500 | | 7,749,997 |
| Netherlands – 5.4% | | | | |
| ASML Holding NV (NY Shares) (a) | | 1,512,436 | | 25,681,163 |
| ING Groep NV (Certificaten Van Aandelen) | | 364,100 | | 10,507,927 |
| TOTAL NETHERLANDS | | | | 36,189,090 |
| |
| Norway – 0.8% | | | | |
| Statoil ASA | | 242,400 | | 5,421,027 |
| Singapore – 1.1% | | | | |
| STATS ChipPAC Ltd. sponsored ADR (a)(d) | | 1,305,700 | | 7,324,977 |
| Switzerland – 12.8% | | | | |
| ABB Ltd. sponsored ADR (a) | | 837,000 | | 6,520,230 |
| Credit Suisse Group (Reg.) | | 658,174 | | 29,163,692 |
| Novartis AG (Reg.) | | 479,785 | | 25,822,028 |
| Roche Holding AG (participation certificate) | | 156,739 | | 23,416,927 |
| TOTAL SWITZERLAND | | | | 84,922,877 |
| |
| Taiwan – 7.2% | | | | |
| Advanced Semiconductor Engineering, Inc. | | 24,431,000 | | 14,890,957 |
| AU Optronics Corp. sponsored ADR | | 1,238,342 | | 15,788,861 |
| United Microelectronics Corp. sponsored ADR (d) | | 5,893,636 | | 17,209,417 |
| TOTAL TAIWAN | | | | 47,889,235 |
| |
| United Kingdom – 7.3% | | | | |
| BP PLC | | 1,318,800 | | 14,594,709 |
| Prudential PLC | | 9,257 | | 77,684 |
| Smiths Group PLC | | 932,900 | | 15,071,332 |
| Vodafone Group PLC | | 7,188,300 | | 18,876,492 |
| TOTAL UNITED KINGDOM | | | | 48,620,217 |
| |
| United States of America – 7.1% | | | | |
| Halliburton Co. | | 317,900 | | 18,787,890 |
| Lyondell Chemical Co. | | 457,900 | | 12,271,720 |
See accompanying notes which are an integral part of the financial statements.
13 Annual Report
| Investments - continued | | | | |
| |
| |
| Common Stocks – continued | | | | |
| | | Shares | | Value (Note 1) |
| United States of America – continued | | | | |
| NTL, Inc. (a) | | 96,900 | | $ 5,941,908 |
| Synthes, Inc. | | 93,856 | | 9,937,823 |
| TOTAL UNITED STATES OF AMERICA | | | | 46,939,341 |
| |
| TOTAL COMMON STOCKS | | | | |
| (Cost $607,423,666) | | | | 639,334,347 |
| Money Market Funds — 4.6% | | | | |
| Fidelity Cash Central Fund, 3.92% (b) | | 25,387,772 | | 25,387,772 |
| Fidelity Securities Lending Cash Central Fund, | | | | |
| 3.94% (b)(c) | | 4,855,300 | | 4,855,300 |
| TOTAL MONEY MARKET FUNDS | | | | |
| (Cost $30,243,072) | | | | 30,243,072 |
| TOTAL INVESTMENT PORTFOLIO – 100.8% | | | | |
| (Cost $637,666,738) | | | | 669,577,419 |
| |
| NET OTHER ASSETS – (0.8)% | | | | (5,176,084) |
| NET ASSETS – 100% | | $ | | 664,401,335 |
(a) Non-income producing
(b) Affiliated fund that is available only to investment companies and other accounts managed by Fidelity Investments. The rate quoted is the annualized seven-day yield of the fund at period end. A complete unaudited listing of the fund’s holdings as of its most recent quarter end is available upon request.
(c) Investment made with cash collateral received from securities on loan.
(d) Security or a portion of the security is on loan at period end.
See accompanying notes which are an integral part of the financial statements.
| Financial Statements | | | | | | | | |
| |
| |
| Statement of Assets and Liabilities | | | | | | | | |
| | | | | | | | | October 31, 2005 |
| |
| Assets | | | | | | | | |
| Investment in securities, at value (including securities | | | | | | | | |
| loaned of $4,729,980) (cost $637,666,738) — See | | | | | | | | |
| accompanying schedule | | | | | | $ | | 669,577,419 |
| Cash | | | | | | | | 1,901,257 |
| Receivable for investments sold | | | | | | | | 1,449,094 |
| Receivable for fund shares sold | | | | | | | | 750,961 |
| Dividends receivable | | | | | | | | 910,624 |
| Interest receivable | | | | | | | | 56,959 |
| Other receivables | | | | | | | | 460,618 |
| Total assets | | | | | | | | 675,106,932 |
| |
| Liabilities | | | | | | | | |
| Payable for investments purchased | | $ | | 3,755,380 | | | | |
| Payable for fund shares redeemed | | | | 1,128,953 | | | | |
| Accrued management fee | | | | 399,170 | | | | |
| Distribution fees payable | | | | 218,583 | | | | |
| Other affiliated payables | | | | 224,045 | | | | |
| Other payables and accrued expenses | | | | 124,166 | | | | |
| Collateral on securities loaned, at value | | | | 4,855,300 | | | | |
| Total liabilities | | | | | | | | 10,705,597 |
| |
| Net Assets | | | | | | $ | | 664,401,335 |
| Net Assets consist of: | | | | | | | | |
| Paid in capital | | | | | | $ | | 560,690,068 |
| Undistributed net investment income | | | | | | | | 3,764,091 |
| Accumulated undistributed net realized gain (loss) on | | | | | | | | |
| investments and foreign currency transactions | | | | | | | | 68,053,870 |
| Net unrealized appreciation (depreciation) on | | | | | | | | |
| investments and assets and liabilities in foreign | | | | | | | | |
| currencies | | | | | | | | 31,893,306 |
| Net Assets | | | | | | $ | | 664,401,335 |
See accompanying notes which are an integral part of the financial statements.
15 Annual Report
| Financial Statements - continued | | | | |
| |
| |
| Statement of Assets and Liabilities — continued | | |
| | | October 31, 2005 |
| |
| Calculation of Maximum Offering Price | | | | |
| Class A: | | | | |
| Net Asset Value and redemption price per share | | | | |
| ($113,809,447 ÷ 6,547,241 shares) | | $ | | 17.38 |
| Maximum offering price per share | | | | |
| (100/94.25 of $17.38) | | $ | | 18.44 |
| Class T: | | | | |
| Net Asset Value and redemption price per share | | | | |
| ($216,718,022 ÷ 12,612,033 shares) | | $ | | 17.18 |
| Maximum offering price per share | | | | |
| (100/96.50 of $17.18) | | $ | | 17.80 |
| Class B: | | | | |
| Net Asset Value and offering price per share | | | | |
| ($57,167,629 ÷ 3,473,760 shares)A | | $ | | 16.46 |
| Class C: | | | | |
| Net Asset Value and offering price per share | | | | |
| ($67,428,603 ÷ 4,081,225 shares)A | | $ | | 16.52 |
| Institutional Class: | | | | |
| Net Asset Value, offering price and redemption price | | |
| per share ($209,277,634 ÷ 11,823,732 shares) | | $ | | 17.70 |
| A Redemption price per share is equal to net asset value less any applicable contingent deferred sales charge. | | |
See accompanying notes which are an integral part of the financial statements
Annual Report 16
| Statement of Operations | | | | | | |
| | | | | Year ended October 31, 2005 |
| |
| Investment Income | | | | | | |
| Dividends | | | | | | $ 14,273,837 |
| Interest | | | | | | 807,712 |
| Security lending | | | | | | 528,125 |
| | | | | | | 15,609,674 |
| Less foreign taxes withheld | | | | | | (1,748,408) |
| Total income | | | | | | 13,861,266 |
| |
| Expenses | | | | | | |
| Management fee | | $ | | 4,979,462 | | |
| Transfer agent fees | | | | 2,329,324 | | |
| Distribution fees | | | | 2,748,747 | | |
| Accounting and security lending fees | | | | 364,419 | | |
| Independent trustees’ compensation | | | | 3,246 | | |
| Custodian fees and expenses | | | | 384,860 | | |
| Registration fees | | | | 89,674 | | |
| Audit | | | | 80,541 | | |
| Legal | | | | 4,799 | | |
| Interest | | | | 8,077 | | |
| Miscellaneous | | | | 32,104 | | |
| Total expenses before reductions | | | | 11,025,253 | | |
| Expense reductions | | | | (928,077) | | 10,097,176 |
| |
| Net investment income (loss) | | | | | | 3,764,090 |
| Realized and Unrealized Gain (Loss) | | | | | | |
| Net realized gain (loss) on: | | | | | | |
| Investment securities | | | | 110,918,480 | | |
| Foreign currency transactions | | | | (251,907) | | |
| Futures contracts | | | | 179,560 | | |
| Total net realized gain (loss) | | | | | | 110,846,133 |
| Change in net unrealized appreciation (depreciation) on: | | | | | | |
| Investment securities | | | | (32,677,370) | | |
| Assets and liabilities in foreign currencies | | | | (48,254) | | |
| Total change in net unrealized appreciation | | | | | | |
| (depreciation) | | | | | | (32,725,624) |
| Net gain (loss) | | | | | | 78,120,509 |
| Net increase (decrease) in net assets resulting from | | | | | | |
| operations | | | | | | $ 81,884,599 |
See accompanying notes which are an integral part of the financial statements.
17 Annual Report
| Financial Statements - continued | | | | | | | | |
| |
| |
| Statement of Changes in Net Assets | | | | | | | | |
| | | | | Year ended | | | | Year ended |
| | | | | October 31, | | | | October 31, |
| | | | | 2005 | | | | 2004 |
| Increase (Decrease) in Net Assets | | | | | | | | |
| Operations | | | | | | | | |
| Net investment income (loss) | | $ | | 3,764,090 | | $ | | (436,853) |
| Net realized gain (loss) | | | | 110,846,133 | | | | 34,181,956 |
| Change in net unrealized appreciation (depreciation) . | | | | (32,725,624) | | | | (3,598,614) |
| Net increase (decrease) in net assets resulting | | | | | | | | |
| from operations | | | | 81,884,599 | | | | 30,146,489 |
| Distributions to shareholders from net investment income . | | | | — | | | | (685,316) |
| Share transactions -- net increase (decrease) | | | | (84,263,684) | | | | 90,343,050 |
| Redemption fees | | | | 29,871 | | | | 23,611 |
| Total increase (decrease) in net assets | | | | (2,349,214) | | | | 119,827,834 |
| |
| Net Assets | | | | | | | | |
| Beginning of period | | | | 666,750,549 | | | | 546,922,715 |
| End of period (including undistributed net investment | | | | | | | | |
| income of $3,764,091 and accumulated net invest- | | | | | | | | |
| ment loss of $29,120, respectively) | | $ | | 664,401,335 | | $ | | 666,750,549 |
See accompanying notes which are an integral part of the financial statements.
| Financial Highlights — Class A | | | | | | | | |
| Years ended October 31, | | 2005 | | 2004 | | 2003 | | 2002 | | 2001 |
| Selected Per-Share Data | | | | | | | | | | |
| Net asset value, beginning of | | | | | | | | | | |
| period | | $ 15.40 | | $ 14.47 | | $ 10.93 | | $ 11.08 | | $ 15.26 |
| Income from Investment | | | | | | | | | | |
| Operations | | | | | | | | | | |
| Net investment income (loss)C | | 12 | | .01 | | —E | | —E | | (.01) |
| Net realized and unrealized | | | | | | | | | | |
| gain (loss) | | 1.86 | | .92 | | 3.54 | | (.15) | | (3.73) |
| Total from investment operations | | 1.98 | | .93 | | 3.54 | | (.15) | | (3.74) |
| Distributions from net investment | | | | | | | | | | |
| income | | — | | — | | — | | — | | (.44) |
| Redemption fees added to paid in | | | | | | | | | | |
| capitalC | | —E | | —E | | — | | — | | — |
| Net asset value, end of period | | $ 17.38 | | $ 15.40 | | $ 14.47 | | $ 10.93 | | $ 11.08 |
| Total ReturnA,B | | 12.86% | | 6.43% | | 32.39% | | (1.35)% | | (25.17)% |
| Ratios to Average Net AssetsD | | | | | | | | | | |
| Expenses before expense | | | | | | | | | | |
| reductions | | 1.44% | | 1.48% | | 1.59% | | 1.67% | | 1.71% |
| Expenses net of voluntary waiv- | | | | | | | | | | |
| ers, if any | | 1.44% | | 1.48% | | 1.59% | | 1.67% | | 1.70% |
| Expenses net of all reductions | | 1.30% | | 1.40% | | 1.54% | | 1.57% | | 1.57% |
| Net investment income (loss) | | 71% | | .06% | | .01% | | (.02)% | | (.05)% |
| Supplemental Data | | | | | | | | | | |
| Net assets, end of period (000 | | | | | | | | | | |
| omitted) | | $113,809 | | $103,606 | | $41,867 | | $16,879 | | $12,070 |
| Portfolio turnover rate | | 176% | | 170% | | 205% | | 193% | | 270% |
A Total returns would have been lower had certain expenses not been reduced during the periods shown.
B Total returns do not include the effect of the sales charges.
C Calculated based on average shares outstanding during the period.
D Expense ratios reflect operating expenses of the class. Expenses before reductions do not reflect amounts reimbursed by the investment adviser or reductions from brokerage service arrangements or other expense offset arrangements and do not represent the amount paid by the class during periods when reimbursements or reductions occur. Expenses net of any voluntary waivers reflect expenses after reimbursement by the investment adviser but prior to reductions from brokerage service arrangements or other expense offset arrangements. Expenses net of all reductions repre sent the net expenses paid by the class.
E Amount represents less than $.01 per share.
See accompanying notes which are an integral part of the financial statements.
19 Annual Report
| Financial Highlights — Class T | | | | | | | | |
| Years ended October 31, | | 2005 | | 2004 | | 2003 | | 2002 | | 2001 |
| Selected Per-Share Data | | | | | | | | | | |
| Net asset value, beginning of | | | | | | | | | | |
| period | | $ 15.26 | | $ 14.38 | | $ 10.88 | | $ 11.05 | | $ 15.21 |
| Income from Investment | | | | | | | | | | |
| Operations | | | | | | | | | | |
| Net investment income (loss)C | | 08 | | (.03) | | (.03) | | (.03) | | (.03) |
| Net realized and unrealized | | | | | | | | | | |
| gain (loss) | | 1.84 | | .91 | | 3.53 | | (.14) | | (3.73) |
| Total from investment operations | | 1.92 | | .88 | | 3.50 | | (.17) | | (3.76) |
| Distributions from net investment | | | | | | | | | | |
| income | | — | | — | | — | | — | | (.40) |
| Redemption fees added to paid in | | | | | | | | | | |
| capitalC | | —E | | —E | | — | | — | | — |
| Net asset value, end of period | | $ 17.18 | | $ 15.26 | | $ 14.38 | | $ 10.88 | | $ 11.05 |
| Total ReturnA,B | | 12.58% | | 6.12% | | 32.17% | | (1.54)% | | (25.32)% |
| Ratios to Average Net AssetsD | | | | | | | | | | |
| Expenses before expense | | | | | | | | | | |
| reductions | | 1.67% | | 1.74% | | 1.85% | | 1.86% | | 1.87% |
| Expenses net of voluntary waiv- | | | | | | | | | | |
| ers, if any | | 1.67% | | 1.74% | | 1.85% | | 1.86% | | 1.87% |
| Expenses net of all reductions | | 1.53% | | 1.66% | | 1.79% | | 1.76% | | 1.73% |
| Net investment income (loss) | | 47% | | (.20)% | | (.24)% | | (.21)% | | (.22)% |
| Supplemental Data | | | | | | | | | | |
| Net assets, end of period (000 | | | | | | | | | | |
| omitted) | | $216,717 | | $216,588 | | $149,514 | | $98,148 | | $88,818 |
| Portfolio turnover rate | | 176% | | 170% | | 205% | | 193% | | 270% |
A Total returns would have been lower had certain expenses not been reduced during the periods shown.
B Total returns do not include the effect of the sales charges.
C Calculated based on average shares outstanding during the period.
D Expense ratios reflect operating expenses of the class. Expenses before reductions do not reflect amounts reimbursed by the investment adviser or reductions from brokerage service arrangements or other expense offset arrangements and do not represent the amount paid by the class during periods when reimbursements or reductions occur. Expenses net of any voluntary waivers reflect expenses after reimbursement by the investment adviser but prior to reductions from brokerage service arrangements or other expense offset arrangements. Expenses net of all reductions repre sent the net expenses paid by the class.
E Amount represents less than $.01 per share.
See accompanying notes which are an integral part of the financial statements.
| Financial Highlights — Class B | | | | | | | | |
| Years ended October 31, | | 2005 | | 2004 | | 2003 | | 2002 | | 2001 |
| Selected Per-Share Data | | | | | | | | | | |
| Net asset value, beginning of | | | | | | | | | | |
| period | | $ 14.70 | | $ 13.94 | | $ 10.61 | | $ 10.84 | | $ 14.96 |
| Income from Investment | | | | | | | | | | |
| Operations | | | | | | | | | | |
| Net investment income (loss)C | | (.02) | | (.12) | | (.09) | | (.09) | | (.10) |
| Net realized and unrealized | | | | | | | | | | |
| gain (loss) | | 1.78 | | .88 | | 3.42 | | (.14) | | (3.67) |
| Total from investment operations | | 1.76 | | .76 | | 3.33 | | (.23) | | (3.77) |
| Distributions from net investment | | | | | | | | | | |
| income | | — | | — | | — | | — | | (.35) |
| Redemption fees added to paid in | | | | | | | | | | |
| capitalC | | —E | | —E | | — | | — | | — |
| Net asset value, end of period | | $ 16.46 | | $ 14.70 | | $ 13.94 | | $ 10.61 | | $ 10.84 |
| Total ReturnA,B | | 11.97% | | 5.45% | | 31.39% | | (2.12)% | | (25.75)% |
| Ratios to Average Net AssetsD | | | | | | | | | | |
| Expenses before expense | | | | | | | | | | |
| reductions | | 2.27% | | 2.35% | | 2.42% | | 2.44% | | 2.47% |
| Expenses net of voluntary waiv- | | | | | | | | | | |
| ers, if any | | 2.27% | | 2.35% | | 2.42% | | 2.44% | | 2.45% |
| Expenses net of all reductions | | 2.13% | | 2.27% | | 2.37% | | 2.34% | | 2.32% |
| Net investment income (loss) | | (.13)% | | (.80)% | | (.82)% | | (.79)% | | (.80)% |
| Supplemental Data | | | | | | | | | | |
| Net assets, end of period (000 | | | | | | | | | | |
| omitted) | | $57,168 | | $59,985 | | $50,358 | | $36,981 | | $36,593 |
| Portfolio turnover rate | | 176% | | 170% | | 205% | | 193% | | 270% |
A Total returns would have been lower had certain expenses not been reduced during the periods shown.
B Total returns do not include the effect of the contingent deferred sales charge.
C Calculated based on average shares outstanding during the period.
D Expense ratios reflect operating expenses of the class. Expenses before reductions do not reflect amounts reimbursed by the investment adviser or reductions from brokerage service arrangements or other expense offset arrangements and do not represent the amount paid by the class during periods when reimbursements or reductions occur. Expenses net of any voluntary waivers reflect expenses after reimbursement by the investment adviser but prior to reductions from brokerage service arrangements or other expense offset arrangements. Expenses net of all reductions repre sent the net expenses paid by the class.
E Amount represents less than $.01 per share.
See accompanying notes which are an integral part of the financial statements.
21 Annual Report
| Financial Highlights — Class C | | | | | | | | |
| Years ended October 31, | | 2005 | | 2004 | | 2003 | | 2002 | | 2001 |
| Selected Per-Share Data | | | | | | | | | | |
| Net asset value, beginning of | | | | | | | | | | |
| period | | $ 14.74 | | $ 13.96 | | $ 10.62 | | $ 10.83 | | $ 14.96 |
| Income from Investment | | | | | | | | | | |
| Operations | | | | | | | | | | |
| Net investment income (loss)C | | —E | | (.10) | | (.08) | | (.08) | | (.09) |
| Net realized and unrealized | | | | | | | | | | |
| gain (loss) | | 1.78 | | .88 | | 3.42 | | (.13) | | (3.67) |
| Total from investment operations | | 1.78 | | .78 | | 3.34 | | (.21) | | (3.76) |
| Distributions from net investment | | | | | | | | | | |
| income | | — | | — | | — | | — | | (.37) |
| Redemption fees added to paid in | | | | | | | | | | |
| capitalC | | —E | | —E | | — | | — | | — |
| Net asset value, end of period | | $ 16.52 | | $ 14.74 | | $ 13.96 | | $ 10.62 | | $ 10.83 |
| Total ReturnA,B | | 12.08% | | 5.59% | | 31.45% | | (1.94)% | | (25.71)% |
| Ratios to Average Net AssetsD | | | | | | | | | | |
| Expenses before expense | | | | | | | | | | |
| reductions | | 2.17% | | 2.21% | | 2.33% | | 2.34% | | 2.38% |
| Expenses net of voluntary waiv- | | | | | | | | | | |
| ers, if any | | 2.17% | | 2.21% | | 2.33% | | 2.34% | | 2.38% |
| Expenses net of all reductions | | 2.04% | | 2.12% | | 2.28% | | 2.24% | | 2.24% |
| Net investment income (loss) | | (.03)% | | (.66)% | | (.73)% | | (.69)% | | (.73)% |
| Supplemental Data | | | | | | | | | | |
| Net assets, end of period (000 | | | | | | | | | | |
| omitted) | | $67,429 | | $76,412 | | $58,560 | | $37,514 | | $33,118 |
| Portfolio turnover rate | | 176% | | 170% | | 205% | | 193% | | 270% |
A Total returns would have been lower had certain expenses not been reduced during the periods shown.
B Total returns do not include the effect of the contingent deferred sales charge.
C Calculated based on average shares outstanding during the period.
D Expense ratios reflect operating expenses of the class. Expenses before reductions do not reflect amounts reimbursed by the investment adviser or reductions from brokerage service arrangements or other expense offset arrangements and do not represent the amount paid by the class during periods when reimbursements or reductions occur. Expenses net of any voluntary waivers reflect expenses after reimbursement by the investment adviser but prior to reductions from brokerage service arrangements or other expense offset arrangements. Expenses net of all reductions repre sent the net expenses paid by the class.
E Amount represents less than $.01 per share.
See accompanying notes which are an integral part of the financial statements.
| Financial Highlights — Institutional Class | | | | | | |
| Years ended October 31, | | 2005 | | 2004 | | 2003 | | 2002 | | 2001 |
| Selected Per-Share Data | | | | | | | | | | |
| Net asset value, beginning of | | | | | | | | | | |
| period | | $ 15.65 | | $ 14.70 | | $ 11.08 | | $ 11.17 | | $ 15.35 |
| Income from Investment | | | | | | | | | | |
| Operations | | | | | | | | | | |
| Net investment income (loss)B | | 16 | | .05 | | .04 | | .06 | | .06 |
| Net realized and unrealized | | | | | | | | | | |
| gain (loss) | | 1.89 | | .94 | | 3.58 | | (.15) | | (3.75) |
| Total from investment operations | | 2.05 | | .99 | | 3.62 | | (.09) | | (3.69) |
| Distributions from net investment | | | | | | | | | | |
| income | | — | | (.04) | | — | | — | | (.49) |
| Redemption fees added to paid in | | | | | | | | | | |
| capitalB | | —D | | —D | | — | | — | | — |
| Net asset value, end of period | | $ 17.70 | | $ 15.65 | | $ 14.70 | | $ 11.08 | | $ 11.17 |
| Total ReturnA | | 13.10% | | 6.75% | | 32.67% | | (.81)% | | (24.75)% |
| Ratios to Average Net AssetsC | | | | | | | | | | |
| Expenses before expense | | | | | | | | | | |
| reductions | | 1.23% | | 1.21% | | 1.28% | | 1.15% | | 1.19% |
| Expenses net of voluntary waiv- | | | | | | | | | | |
| ers, if any | | 1.23% | | 1.21% | | 1.28% | | 1.15% | | 1.19% |
| Expenses net of all reductions | | 1.09% | | 1.13% | | 1.22% | | 1.06% | | 1.05% |
| Net investment income (loss) | | 92% | | .34% | | .33% | | .50% | | .46% |
| Supplemental Data | | | | | | | | | | |
| Net assets, end of period (000 | | | | | | | | | | |
| omitted) | | $209,278 | | $210,160 | | $246,623 | | $10,577 | | $ 6,432 |
| Portfolio turnover rate | | 176% | | 170% | | 205% | | 193% | | 270% |
A Total returns would have been lower had certain expenses not been reduced during the periods shown.
B Calculated based on average shares outstanding during the period.
C Expense ratios reflect operating expenses of the class. Expenses before reductions do not reflect amounts reimbursed by the investment adviser or reductions from brokerage service arrangements or other expense offset arrangements and do not represent the amount paid by the class during periods when reimbursements or reductions occur. Expenses net of any voluntary waivers reflect expenses after reimbursement by the investment adviser but prior to reductions from brokerage service arrangements or other expense offset arrangements. Expenses net of all reductions repre sent the net expenses paid by the class.
D Amount represents less than $.01 per share.
See accompanying notes which are an integral part of the financial statements.
23 Annual Report
Notes to Financial Statements
For the period ended October 31, 2005
|
1. Significant Accounting Policies.
Fidelity Advisor International Capital Appreciation Fund (the fund) is a fund of Fidelity Advisor Series VIII (the trust) and is authorized to issue an unlimited number of shares. The trust is registered under the Investment Company Act of 1940, as amended (the 1940 Act), as an open-end management investment company organized as a Massachusetts business trust.
The fund offers Class A, Class T, Class B, Class C, and Institutional Class shares, each of which has equal rights as to assets and voting privileges. Each class has exclusive voting rights with respect to matters that affect that class. Class B shares will automatically convert to Class A shares after a holding period of seven years from the initial date of purchase. Investment income, realized and unrealized capital gains and losses, the common expenses of the fund, and certain fund-level expense reductions, if any, are allocated on a pro rata basis to each class based on the relative net assets of each class to the total net assets of the fund. Each class differs with respect to transfer agent and distribution and service plan fees incurred. Certain expense reductions also differ by class.
The fund’s investments in emerging markets can be subject to social, economic, regulatory, and political uncertainties and can be extremely volatile.
The fund may invest in affiliated money market central funds (Money Market Central Funds), collectively referred to as Central Funds, which are open-end investment companies available to investment companies and other accounts managed by Fidelity Management & Research Company (FMR) and its affiliates. The financial statements have been prepared in conformity with accounting principles generally accepted in the United States of America, which require management to make certain estimates and assumptions at the date of the financial statements. The following summarizes the significant accounting policies of the fund:
Security Valuation. Investments are valued and net asset value (NAV) per share is calculated (NAV calculation) as of the close of business of the New York Stock Exchange (NYSE), normally 4:00 p.m. Eastern time. Wherever possible, the fund uses independent pricing services approved by the Board of Trustees to value its investments.
Equity securities, including restricted securities, for which market quotations are readily available, are valued at the last reported sale price or official closing price as reported by an independent pricing service on the primary market or exchange on which they are traded. In the event there were no sales during the day or closing prices are not available, securities are valued at the last quoted bid price. Investments in open-end mutual funds, are valued at their closing net asset value each business day. Short-term securities with remaining maturities of sixty days or less for which quotations are not readily available are valued at amortized cost, which approximates value.
1. Significant Accounting Policies - continued
Security Valuation - continued
When current market prices or quotations are not readily available or do not accurately reflect fair value, valuations may be determined in accordance with procedures adopted by the Board of Trustees. For example, when developments occur between the close of a market and the close of the NYSE that may materially affect the value of some or all of the securities, or when trading in a security is halted, those securities may be fair valued. Factors used in the determination of fair value may include monitoring news to identify significant market or security specific events such as changes in the value of U.S. securities market, reviewing developments in foreign markets and evaluating the performance of ADRs, futures contracts and exchange-traded funds. Because the fund’s utilization of fair value pricing depends on market activity, the frequency with which fair value pricing is used can not be predicted and may be utilized to a significant extent. The value of securities used for NAV calculation under fair value pricing may differ from published prices for the same securities.
Foreign Currency. The fund uses foreign currency contracts to facilitate transactions in foreign-denominated securities. Losses from these transactions may arise from changes in the value of the foreign currency or if the counterparties do not perform under the contracts’ terms.
Foreign-denominated assets, including investment securities, and liabilities are translated into U.S. dollars at the exchange rate at period end. Purchases and sales of investment securities, income and dividends received and expenses denominated in foreign currencies are translated into U.S. dollars at the exchange rate in effect on the transaction date.
The effects of exchange rate fluctuations on investments are included with the net realized and unrealized gain (loss) on investment securities. Other foreign currency transactions resulting in realized and unrealized gain (loss) are disclosed separately.
Investment Transactions and Income. Security transactions are accounted for as of trade date. Gains and losses on securities sold are determined on the basis of identified cost. Dividend income is recorded on the ex-dividend date, except for certain dividends from foreign securities where the ex-dividend date may have passed, which are recorded as soon as the fund is informed of the ex-dividend date. Non-cash dividends included in dividend income, if any, are recorded at the fair market value of the securities received. Interest income is accrued as earned. Interest income includes coupon interest and amortization of premium and accretion of discount on debt securities. Investment income is recorded net of foreign taxes withheld where recovery of such taxes is uncertain.
25 Annual Report
Notes to Financial Statements - continued
1. Significant Accounting Policies - continued
Expenses. Most expenses of the trust can be directly attributed to a fund. Expenses which cannot be directly attributed are apportioned among each fund in the trust.
Income Tax Information and Distributions to Shareholders. Each year, the fund intends to qualify as a regulated investment company by distributing all of its taxable income and realized gains under Subchapter M of the Internal Revenue Code. As a result, no provision for income taxes is required in the accompanying financial statements. Foreign taxes are provided for based on the fund’s understanding of the tax rules and rates that exist in the foreign markets in which it invests.
Distributions are recorded on the ex-dividend date. Income dividends and capital gain distributions are declared separately for each class. Income and capital gain distributions are determined in accordance with income tax regulations, which may differ from generally accepted accounting principles. In addition, the fund will claim a portion of the payment made to redeeming shareholders as a distribution for income tax purposes.
Capital accounts within the financial statements are adjusted for permanent book-tax differences. These adjustments have no impact on net assets or the results of operations. Temporary book-tax differences will reverse in a subsequent period.
Book-tax differences are primarily due to futures transactions, foreign currency transactions, passive foreign investment companies (PFIC), capital loss carryforwards, and losses deferred due to wash sales.
The tax-basis components of distributable earnings and the federal tax cost as of period end were as follows:
| Unrealized appreciation | | $ | | 58,769,282 | | | | |
| Unrealized depreciation | | | | (27,174,204) | | | | |
| Net unrealized appreciation (depreciation) | | | | 31,595,078 | | | | |
| Undistributed ordinary income | | | | 3,533,555 | | | | |
| Undistributed long-term capital gain | | | | 64,165,782 | | | | |
| |
| Cost for federal income tax purposes | | $ | | 637,982,341 | | | | |
| |
| The tax character of distributions paid was as follows: | | | | |
| | | | | October 31, 2005 | | | | October 31, 2004 |
| Ordinary Income | | $ | | — | | $ | | 685,316 |
Short-Term Trading (Redemption) Fees. Shares held in the fund less than 30 days are subject to a redemption fee equal to 1.00% of the proceeds of the redeemed shares. All redemption fees, including any estimated redemption fees paid by FMR, are retained by the fund and accounted for as an addition to paid in capital.
Repurchase Agreements. FMR has received an Exemptive Order from the Securities and Exchange Commission (the SEC) which permits the fund and other affiliated entities of FMR to transfer uninvested cash balances into joint trading accounts which are then invested in repurchase agreements. The fund may also invest directly with institutions in repurchase agreements. Repurchase agreements are collateralized by government or non-government securities. Collateral is held in segregated accounts with custodian banks and may be obtained in the event of a default of the counterparty. The fund monitors, on a daily basis, the value of the collateral to ensure it is at least equal to the principal amount of the repurchase agreement (including accrued interest). In the event of a default by the counterparty, realization of the collateral proceeds could be delayed, during which time the value of the collateral may decline.
Futures Contracts. The fund may use futures contracts to manage its exposure to the stock market. Buying futures tends to increase a fund’s exposure to the underlying instrument, while selling futures tends to decrease a fund’s exposure to the underlying instrument or hedge other fund investments. Losses may arise from changes in the value of the underlying instruments or if the counterparties do not perform under the contracts’ terms. Gains (losses) are realized upon the expiration or closing of the futures contracts. Futures contracts are valued at the settlement price established each day by the board of trade or exchange on which they are traded.
3. Purchases and Sales of Investments.
Purchases and sales of securities, other than short-term securities and U.S. government securities, aggregated $1,159,090,370 and $1,226,136,513, respectively.
4. Fees and Other Transactions with Affiliates.
Management Fee. FMR and its affiliates provide the fund with investment management related services for which the fund pays a monthly management fee. The management fee is the sum of an individual fund fee rate that is based on an annual rate of .45% of the fund’s average net assets and a group fee rate that averaged .27% during the period. The group fee rate is based upon the average net assets of all the mutual funds advised by FMR. The group fee rate decreases as assets under management increase and increases as assets under management decrease. For the period, the total annual management fee rate was .72% of the fund’s average net assets.
27 Annual Report
Notes to Financial Statements - continued
4. Fees and Other Transactions with Affiliates - continued
Distribution and Service Plan. In accordance with Rule 12b-1 of the 1940 Act, the fund has adopted separate Distribution and Service Plans for each class of shares. Certain classes pay Fidelity Distributors Corporation (FDC), an affiliate of FMR, separate Distribution and Service Fees, each of which is based on an annual percentage of each class’ average net assets. In addition, FDC may pay financial intermediaries for selling shares of the fund and providing shareholder support services. For the period, the Distribution and Service Fee rates and the total amounts paid to and retained by FDC were as follows:
| | | Distribution | | Service | | | | Paid to | | | | Retained |
| | | Fee | | Fee | | | | FDC | | | | by FDC |
| Class A | | 0% | | .25% | | $ | | 284,587 | | $ | | 590 |
| Class T | | 25% | | .25% | | | | 1,128,660 | | | | 8,598 |
| Class B | | 75% | | .25% | | | | 609,458 | | | | 457,288 |
| Class C | | 75% | | .25% | | | | 726,042 | | | | 144,254 |
| | | | | | | $ | | 2,748,747 | | $ | | 610,730 |
Sales Load. FDC receives a front-end sales charge of up to 5.75% for selling Class A shares, and 3.50% for selling Class T shares, some of which is paid to financial intermediaries for selling shares of the fund. FDC receives the proceeds of contingent deferred sales charges levied on Class A, Class T, Class B, and Class C redemptions. These charges depend on the holding period. The deferred sales charges range from 5% to 1% for Class B, 1% for Class C, and .25% for certain purchases of Class A and Class T shares.
| For the period, sales charge amounts retained by FDC were as follows: | | |
| | | | | Retained |
| | | | | by FDC |
| Class A | | $ | | 44,600 |
| Class T | | | | 17,578 |
| Class B* | | | | 120,592 |
| Class C* | | | | 10,998 |
| | | $ | | 193,768 |
* When Class B and Class C shares are initially sold, FDC pays commissions from its own resources to financial intermediaries through which the sales are made.
Transfer Agent Fees. Fidelity Investments Institutional Operations Company, Inc. (FIIOC), an affiliate of FMR, is the transfer, dividend disbursing and shareholder servicing agent for each class of the fund. FIIOC receives account fees and asset-based fees that vary according to the account size and type of account of the shareholders of the respective classes of the fund. FIIOC pays for typesetting, printing and mailing of
4. Fees and Other Transactions with Affiliates - continued
Transfer Agent Fees - continued
shareholder reports, except proxy statements. For the period the total transfer agent fees paid by each class to FIIOC, were as follows:
| | | | | | | % of |
| | | | | | | Average |
| | | | | Amount | | Net Assets |
| Class A | | $ | | 369,631 | | .32 |
| Class T | | | | 692,894 | | .31 |
| Class B | | | | 247,896 | | .41 |
| Class C | | | | 225,747 | | .31 |
| Institutional Class | | | | 793,156 | | .37 |
| | | $ | | 2,329,324 | | |
Accounting and Security Lending Fees. Fidelity Service Company, Inc. (FSC), an affiliate of FMR, maintains the fund’s accounting records. The accounting fee is based on the level of average net assets for the month. Under a separate contract, FSC administers the security lending program. The security lending fee is based on the number and duration of lending transactions.
Affiliated Central Funds. The fund may invest in Money Market Central Funds which seek preservation of capital and current income and are managed by Fidelity Investments Money Management, Inc. (FIMM).
The Money Market Central Funds do not pay a management fee. Income distributions earned by the fund are recorded as income in the accompanying financial statements and totaled $1,493,623 for the period.
Brokerage Commissions. The fund placed a portion of its portfolio transactions with brokerage firms which are affiliates of the investment adviser. The commissions paid to these affiliated firms were $1,463 for the period.
Interfund Lending Program. Pursuant to an Exemptive Order issued by the SEC, the fund, along with other registered investment companies having management contracts with FMR, may participate in an interfund lending program. This program provides an alternative credit facility allowing the funds to borrow from, or lend money to, other participating affiliated funds. At period end, there were no interfund loans outstanding. The fund’s activity in this program during the period for which loans were outstanding was as follows:
| | | | | | | | | Interest Earned | | | | |
| Borrower | | | | Average Daily | | Weighted Average | | (included in | | | | |
| or Lender | | | | Loan Balance | | Interest Rate | | interest income) | | | | Interest Expense |
| Borrower | | $ | | 9,882,250 | | 3.68% | | — | | $ | | 8,077 |
29 Annual Report
Notes to Financial Statements - continued
5. Committed Line of Credit.
The fund participates with other funds managed by FMR in a $4.2 billion credit facility (the “line of credit”) to be utilized for temporary or emergency purposes to fund shareholder redemptions or for other short-term liquidity purposes. The fund has agreed to pay commitment fees on its pro rata portion of the line of credit. During the period, there were no borrowings on this line of credit.
6. Security Lending.
The fund lends portfolio securities from time to time in order to earn additional income. The fund receives collateral (in the form of U.S. Treasury obligations, letters of credit and/or cash) against the loaned securities and maintains collateral in an amount not less than 100% of the market value of the loaned securities during the period of the loan. The market value of the loaned securities is determined at the close of business of the fund and any additional required collateral is delivered to the fund on the next business day. If the borrower defaults on its obligation to return the securities loaned because of insolvency or other reasons, a fund could experience delays and costs in recovering the securities loaned or in gaining access to the collateral. Cash collateral is invested in the Fidelity Securities Lending Cash Central Fund. The value of loaned securities and cash collateral at period end are disclosed on the fund’s Statement of Assets and Liabilities. Security lending income represents the income earned on investing cash collateral, less fees and expenses associated with the loan, plus any premium payments that may be received on the loan of certain types of securities.
7. Expense Reductions.
Many of the brokers with whom FMR places trades on behalf of the fund provided services to the fund in addition to trade execution. These services included payments of certain expenses on behalf of the fund totaling $925,392 for the period. In addition, through arrangements with the fund’s custodian and each class’ transfer agent, credits realized as a result of uninvested cash balances were used to reduce the fund’s expenses. During the period, these credits reduced the fund’s custody expenses by $1,620. During the period, credits reduced each class’ transfer agent expense as noted in the table below.
| | | | | Transfer Agent |
| | | | | expense reduction |
| Class A | | $ | | 1,065 |
Annual Report 30
The fund’s organizational documents provide former and current trustees and officers with a limited indemnification against liabilities arising in connection with the performance of their duties to the fund. In the normal course of business, the fund may also enter into contracts that provide general indemnifications. The fund’s maximum exposure under these arrangements is unknown as this would be dependent on future claims that may be made against the fund. The risk of material loss from such claims is considered remote.
| 9. Distributions to Shareholders. | | | | |
| |
| Distributions to shareholders of each class were as follows: | | |
| Years ended October 31, | | | | 2005 | | 2004 |
| From net investment income | | | | | | | | |
| Institutional Class | | | | $ | | — $ | | 685,316 |
| |
| |
| 10. Share Transactions. | | | | | | |
| |
| Transactions for each class of shares were as follows: | | | | |
| | | Shares | | Dollars |
| |
| Years ended October 31, | | 2005 | | 2004 | | 2005 | | 2004 |
| Class A | | | | | | | | |
| Shares sold | | 2,413,647 | | 5,249,748 | | $ 40,570,088 | | $ 80,046,295 |
| Shares redeemed | | (2,595,681) | | (1,414,042) | | (44,108,820) | | (21,259,668) |
| Net increase (decrease) . | | (182,034) | | 3,835,706 | | $ (3,538,732) | | $ 58,786,627 |
| Class T | | | | | | | | |
| Shares sold | | 3,577,874 | | 8,003,545 | | $ 59,209,564 | | $120,756,817 |
| Shares redeemed | | (5,161,647) | | (4,207,826) | | (85,999,758) | | (62,846,915) |
| Net increase (decrease) . | | (1,583,773) | | 3,795,719 | | $(26,790,194) | | $ 57,909,902 |
| Class B | | | | | | | | |
| Shares sold | | 402,612 | | 1,312,192 | | $ 6,401,315 | | $ 19,341,976 |
| Shares redeemed | | (1,009,638) | | (845,208) | | (16,178,942) | | (12,224,749) |
| Net increase (decrease) . | | (607,026) | | 466,984 | | $ (9,777,627) | | $ 7,117,227 |
| Class C | | | | | | | | |
| Shares sold | | 752,388 | | 2,272,253 | | $ 12,070,200 | | $ 33,251,399 |
| Shares redeemed | | (1,854,211) | | (1,285,361) | | (29,608,554) | | (18,413,064) |
| Net increase (decrease) . | | (1,101,823) | | 986,892 | | $(17,538,354) | | $ 14,838,335 |
| Institutional Class | | | | | | | | |
| Shares sold | | 3,829,749 | | 5,209,049 | | $ 65,566,743 | | $ 80,240,442 |
| Reinvestment of | | | | | | | | |
| distributions | | — | | 44,895 | | — | | 666,234 |
| Shares redeemed | | (5,438,810) | | (8,593,689) | | (92,185,520) | | (129,215,717) |
| Net increase (decrease) . | | (1,609,061) | | (3,339,745) | | $(26,618,777) | | $(48,309,041) |
31 Annual Report
Report of Independent Registered Public Accounting Firm
To the Trustees of Fidelity Advisor Series VIII and Shareholders of Fidelity Advisor International Capital Appreciation Fund:
We have audited the accompanying statement of assets and liabilities of Fidelity Advisor International Capital Appreciation Fund (the Fund), a fund of Fidelity Advisor Series VIII, including the schedule of investments, as of October 31, 2005, and the related statement of operations for the year then ended, the statement of changes in net assets for each of the two years in the period then ended, and the financial highlights for each of the five years in the period then ended. These financial statements and financial highlights are the responsibility of the Fund’s management. Our responsibility is to express an opinion on these financial statements and financial highlights based on our audits.
We conducted our audits in accordance with standards of the Public Company Accounting Oversight Board (United States). Those standards require that we plan and perform the audit to obtain reasonable assurance about whether the financial statements and financial highlights are free of material misstatement. The Fund is not required to have, nor were we engaged to perform, an audit of its internal control over financial reporting. Our audits included consideration of internal control over financial reporting as a basis for designing audit procedures that are appropriate in the circumstances, but not for the purpose of expressing an opinion on the effectiveness of the Fund’s internal control over financial reporting. Accordingly, we express no such opinion. An audit also includes examining, on a test basis, evidence supporting the amounts and disclosures in the financial statements, assessing the accounting principles used and significant estimates made by management, as well as evaluating the overall financial statement presentation. Our procedures included confirmation of securities owned as of October 31, 2005, by correspondence with the custodians and brokers; where replies were not received from brokers, we performed other auditing procedures. We believe that our audits provide a reasonable basis for our opinion.
In our opinion, the financial statements and financial highlights referred to above present fairly, in all material respects, the financial position of Fidelity Advisor International Capital Appreciation Fund as of October 31, 2005, the results of its operations for the year then ended, the changes in its net assets for each of the two years in the period then ended, and its financial highlights for each of the five years in the period then ended, in conformity with accounting principles generally accepted in the United States of America.
| /s/ Deloitte & Touche LLP |
| |
| DELOITTE & TOUCHE LLP |
| Boston, Massachusetts |
| December 19, 2005 |
Annual Report 32
Trustees and Officers
The Trustees, Members of the Advisory Board, and executive officers of the trust and fund, as applicable, are listed below. The Board of Trustees governs the fund and is responsible for protecting the interests of shareholders. The Trustees are experienced executives who meet periodically throughout the year to oversee the fund’s activities, review contractual arrangements with companies that provide services to the fund, and review the fund’s performance. Except for William O. McCoy, Stephen P. Jonas, and Kenneth L. Wolfe, each of the Trustees oversees 322 funds advised by FMR or an affiliate. Mr. McCoy oversees 324 funds advised by FMR or an affiliate. Mr. Jonas and Mr. Wolfe oversee 319 funds advised by FMR or an affiliate.
The Trustees hold office without limit in time except that (a) any Trustee may resign; (b) any Trustee may be removed by written instrument, signed by at least two-thirds of the number of Trustees prior to such removal; (c) any Trustee who requests to be retired or who has become incapacitated by illness or injury may be retired by written instrument signed by a majority of the other Trustees; and (d) any Trustee may be removed at any special meeting of shareholders by a two-thirds vote of the outstanding voting securities of the trust. Each Trustee who is not an interested person (as defined in the 1940 Act) (Independent Trustee), shall retire not later than the last day of the calendar year in which his or her 72nd birthday occurs. The Independent Trustees may waive this mandatory retirement age policy with respect to individual Trustees. The executive officers and Advisory Board Members hold office without limit in time, except that any officer and Advisory Board Member may resign or may be removed by a vote of a majority of the Trustees at any regular meeting or any special meeting of the Trustees. Except as indicated, each individual has held the office shown or other offices in the same company for the past five years.
The fund’s Statement of Additional Information (SAI) includes more information about the Trustees. To request a free copy, call Fidelity at 1-877-208-0098.
Interested Trustees*:
Correspondence intended for each Trustee who is an interested person may be sent to Fidelity Investments, 82 Devonshire Street, Boston, Massachusetts 02109.
| Name, Age; Principal Occupation |
| |
| Edward C. Johnson 3d (75)** |
| |
| Year of Election or Appointment: 1983 |
| Mr. Johnson is Chairman of the Board of Trustees. Mr. Johnson serves as |
| Chief Executive Officer, Chairman, and a Director of FMR Corp.; a Di- |
| rector and Chairman of the Board and of the Executive Committee of |
| FMR; Chairman and a Director of Fidelity Management & Research (Far |
| East) Inc.; Chairman and a Director of Fidelity Investments Money Man- |
| agement, Inc.; and Chairman (2001-present) and a Director |
| (2000-present) of FMR Co., Inc. |
33 Annual Report
Trustees and Officers - continued
| Name, Age; Principal Occupation |
| |
| Abigail P. Johnson (43)** |
| |
| Year of Election or Appointment: 2001 |
| Ms. Johnson serves as President of Fidelity Employer Services Company |
| (FESCO) (2005-present). She is President and a Director of Fidelity In- |
| vestments Money Management, Inc. (2001-present), FMR Co., Inc. |
| (2001-present), and a Director of FMR Corp. Previously, Ms. Johnson |
| served as President and a Director of FMR (2001-2005), Senior Vice |
| President of the Fidelity funds (2001-2005), and managed a number of |
| Fidelity funds. |
| |
| Stephen P. Jonas (52) |
| |
| Year of Election or Appointment: 2005 |
| Mr. Jonas is Senior Vice President of Advisor International Capital Ap- |
| preciation (2005-present). He also serves as Senior Vice President of |
| other Fidelity funds (2005-present). Mr. Jonas is Executive Director of |
| FMR (2005-present). Previously, Mr. Jonas served as President of Fidelity |
| Enterprise Operations and Risk Services (2004-2005), Chief Adminis- |
| trative Officer (2002-2004), and Chief Financial Officer of FMR Co. |
| (1998-2000). Mr. Jonas has been with Fidelity Investments since 1987 |
| and has held various financial and management positions including |
| Chief Financial Officer of FMR. In addition, he serves on the Boards of |
| Boston Ballet (2003-present) and Simmons College (2003-present). |
| |
| Robert L. Reynolds (53) |
| |
| Year of Election or Appointment: 2003 |
| Mr. Reynolds is a Director (2003-present) and Chief Operating Officer |
| (2002-present) of FMR Corp. He also serves on the Board at Fidelity |
| Investments Canada, Ltd. (2000-present). Previously, Mr. Reynolds |
| served as President of Fidelity Investments Institutional Retirement Group |
| (1996-2000). |
* Trustees have been determined to be “Interested Trustees” by virtue of, among other things, their affiliation with the trust or various entities under common control with FMR.
** Edward C. Johnson 3d, Trustee, is Abigail P. Johnson’s father.
Annual Report 34
Independent Trustees:
Correspondence intended for each Independent Trustee (that is, the Trustees other than the Interested Trustees) may be sent to Fidelity Investments, P.O. Box 55235, Boston, Massachusetts 02205-5235.
| Name, Age; Principal Occupation |
| |
| Dennis J. Dirks (57) |
| |
| Year of Election or Appointment: 2005 |
| Prior to his retirement in May 2003, Mr. Dirks was Chief Operating |
| Officer and a member of the Board of The Depository Trust & Clearing |
| Corporation (DTCC) (1999-2003). He also served as President, Chief |
| Operating Officer, and Board member of The Depository Trust |
| Company (DTC) (1999-2003) and President and Board member of the |
| National Securities Clearing Corporation (NSCC) (1999-2003). In addi- |
| tion, Mr. Dirks served as Chief Executive Officer and Board member of |
| the Government Securities Clearing Corporation (2001-2003) and Chief |
| Executive Officer and Board member of the Mortgage-Backed Securities |
| Clearing Corporation (2001-2003). Mr. Dirks also serves as a Trustee of |
| Manhattan College (2005-present). |
| |
| Robert M. Gates (62) |
| |
| Year of Election or Appointment: 1997 |
| Dr. Gates is Vice Chairman of the Independent Trustees (2005-present). |
| Dr. Gates is President of Texas A&M University (2002-present). He was |
| Director of the Central Intelligence Agency (CIA) from 1991 to 1993. |
| From 1989 to 1991, Dr. Gates served as Assistant to the President of |
| the United States and Deputy National Security Advisor. Dr. Gates is a |
| Director of NACCO Industries, Inc. (mining and manufacturing), Parker |
| Drilling Co., Inc. (drilling and rental tools for the energy industry, |
| 2001-present), and Brinker International (restaurant management, |
| 2003-present). Previously, Dr. Gates served as a Director of LucasVarity |
| PLC (automotive components and diesel engines), a Director of TRW Inc. |
| (automotive, space, defense, and information technology), and Dean of |
| the George Bush School of Government and Public Service at Texas |
| A&M University (1999-2001). Dr. Gates also is a Trustee of the Forum |
| for International Policy. |
35 Annual Report
Trustees and Officers - continued
| Name, Age; Principal Occupation |
| |
| George H. Heilmeier (69) |
| |
| Year of Election or Appointment: 2004 |
| Dr. Heilmeier is Chairman Emeritus of Telcordia Technologies (commu- |
| nication software and systems), where prior to his retirement, he served |
| as company Chairman and Chief Executive Officer. He currently serves |
| on the Boards of Directors of The Mitre Corporation (systems engineer- |
| ing and information technology support for the government), and HRL |
| Laboratories (private research and development, 2004-present). He is |
| Chairman of the General Motors Science & Technology Advisory Board |
| and a Life Fellow of the Institute of Electrical and Electronics Engineers |
| (IEEE) (2000-present). Dr. Heilmeier is a member of the Defense Science |
| Board and the National Security Agency Advisory Board. He is also a |
| member of the National Academy of Engineering, the American |
| Academy of Arts and Sciences, and the Board of Overseers of the |
| School of Engineering and Applied Science of the University of Pennsyl- |
| vania. Previously, Dr. Heilmeier served as a Director of TRW Inc. (auto- |
| motive, space, defense, and information technology, 1992-2002), |
| Compaq (1994-2002), Automatic Data Processing, Inc. (ADP) |
| (technology-based business outsourcing, 1995-2002), INET Technolo- |
| gies Inc. (telecommunications network surveillance, 2001-2004), and |
| Teletech Holdings (customer management services). He is the recipient of |
| the 2005 Kyoto Prize in Advanced Technology for his invention of the |
| liquid display. |
| |
| Marie L. Knowles (59) |
| |
| Year of Election or Appointment: 2001 |
| Prior to Ms. Knowles’ retirement in June 2000, she served as Executive |
| Vice President and Chief Financial Officer of Atlantic Richfield Company |
| (ARCO) (diversified energy, 1996-2000). From 1993 to 1996, she was |
| a Senior Vice President of ARCO and President of ARCO Transportation |
| Company. She served as a Director of ARCO from 1996 to 1998. She |
| currently serves as a Director of Phelps Dodge Corporation (copper |
| mining and manufacturing) and McKesson Corporation (healthcare ser- |
| vice, 2002-present). Ms. Knowles is a Trustee of the Brookings Institution |
| and the Catalina Island Conservancy and also serves as a member of |
| the Advisory Board for the School of Engineering of the University of |
| Southern California. |
Annual Report 36
| Name, Age; Principal Occupation |
| |
| Ned C. Lautenbach (61) |
| |
| Year of Election or Appointment: 2000 |
| Mr. Lautenbach has been a partner of Clayton, Dubilier & Rice, Inc. |
| (private equity investment firm) since September 1998. Previously, Mr. |
| Lautenbach was with the International Business Machines Corporation |
| (IBM) from 1968 until his retirement in 1998. Mr. Lautenbach serves as |
| a Director of Italtel Holding S.p.A. (telecommunications (Milan, Italy), |
| 2004-present) and Eaton Corporation (diversified industrial) as well as |
| the Philharmonic Center for the Arts in Naples, Florida. He also is a |
| member of the Board of Trustees of Fairfield University (2005-present), |
| as well as a member of the Council on Foreign Relations. |
| |
| Marvin L. Mann (72) |
| |
| Year of Election or Appointment: 1993 |
| Mr. Mann is Chairman of the Independent Trustees (2001-present). He is |
| Chairman Emeritus of Lexmark International, Inc. (computer |
| peripherals), where he served as CEO until April 1998, retired as |
| Chairman May 1999, and remains a member of the Board. Prior to |
| 1991, he held the positions of Vice President of International Business |
| Machines Corporation (IBM) and President and General Manager of |
| various IBM divisions and subsidiaries. He is a member of the Executive |
| Committee of the Independent Director’s Council of the Investment Com- |
| pany Institute. In addition, Mr. Mann is a member of the President’s |
| Cabinet at the University of Alabama and the Board of Visitors of the |
| Culverhouse College of Commerce and Business Administration at the |
| University of Alabama. |
| |
| William O. McCoy (72) |
| |
| Year of Election or Appointment: 1997 |
| Prior to his retirement in December 1994, Mr. McCoy was Vice Chair- |
| man of the Board of BellSouth Corporation (telecommunications) and |
| President of BellSouth Enterprises. He is currently a Director of Liberty |
| Corporation (holding company), Duke Realty Corporation (real estate), |
| and Progress Energy, Inc. (electric utility). He is also a partner of Frank- |
| lin Street Partners (private investment management firm) and a member |
| of the Research Triangle Foundation Board. In addition, Mr. McCoy |
| served as the Interim Chancellor (1999-2000) and a member of the |
| Board of Visitors for the University of North Carolina at Chapel Hill and |
| currently serves on the Board of Directors of the University of North |
| Carolina Health Care System and the Board of Visitors of the Kenan- |
| Flagler Business School (University of North Carolina at Chapel Hill). He |
| also served as Vice President of Finance for the University of North Car- |
| olina (16-school system). |
37 Annual Report
Trustees and Officers - continued
| Name, Age; Principal Occupation |
| |
| Cornelia M. Small (61) |
| |
| Year of Election or Appointment: 2005 |
| Ms. Small is a member (2000-present) and Chairperson (2002-present) |
| of the Investment Committee, and a member (2002-present) of the |
| Board of Trustees of Smith College. Previously, she served as Chief In- |
| vestment Officer (1999-2000), Director of Global Equity Investments |
| (1996-1999), and a member of the Board of Directors of Scudder, |
| Stevens & Clark (1990-1997) and Scudder Kemper Investments |
| (1997-1998). In addition, Ms. Small served as Co-Chair (2000-2003) |
| of the Annual Fund for the Fletcher School of Law and Diplomacy. |
| |
| William S. Stavropoulos (66) |
| |
| Year of Election or Appointment: 2002 |
| Mr. Stavropoulos is Chairman of the Board (2000-present) and a Mem- |
| ber of the Board of Directors of The Dow Chemical Company. Since |
| joining The Dow Chemical Company in 1967, Mr. Stavropoulos served |
| in numerous senior management positions, including President |
| (1993-2000; 2002-2003), CEO (1995-2000; 2002-2004), and Chair- |
| man of the Executive Committee (2000-2004). Currently, he is a Direc- |
| tor of NCR Corporation (data warehousing and technology solutions), |
| BellSouth Corporation (telecommunications), Chemical Financial Corpo- |
| ration, Maersk Inc. (industrial conglomerate, 2002-present), and Metal- |
| mark Capital (private equity investment firm, 2005-present). He also |
| serves as a member of the Board of Trustees of the American Enterprise |
| Institute for Public Policy Research. In addition, Mr. Stavropoulos is a |
| member of The Business Council, J.P. Morgan International Council and |
| the University of Notre Dame Advisory Council for the College of |
| Science. |
| |
| Kenneth L. Wolfe (66) |
| |
| Year of Election or Appointment: 2005 |
| Mr. Wolfe also serves as a Trustee (2005-present) or Member of the |
| Advisory Board (2004-present) of other investment companies advised |
| by FMR. Prior to his retirement in 2001, Mr. Wolfe was Chairman and |
| Chief Executive Officer of Hershey Foods Corporation (1993-2001). He |
| currently serves as a member of the boards of Adelphia Communica- |
| tions Corporation (2003-present), Bausch & Lomb, Inc., and Revlon Inc. |
| (2004-present). |
Annual Report 38
Advisory Board Members and Executive Officers:
Correspondence intended for Mr. Gamper may be sent to Fidelity Investments, P.O. Box 55235, Boston, Massachusetts 02205-5235. Correspondence intended for each executive officer and Mr. Lynch may be sent to Fidelity Investments, 82 Devonshire Street, Boston, Massachusetts 02109.
| Name, Age; Principal Occupation |
| |
| Albert R. Gamper, Jr. (63) |
| |
| Year of Election or Appointment: 2005 |
| Member of the Advisory Board of Fidelity Advisor Series VIII. Prior to his |
| retirement in December 2004, Mr. Gamper served as Chairman of the |
| Board of CIT Group Inc. (commercial finance). During his tenure with |
| CIT Group Inc. Mr. Gamper served in numerous senior management |
| positions, including Chairman (1987-1989; 1999-2001; 2002-2004), |
| Chief Executive Officer (1987-2004), and President (1989-2002). He |
| currently serves as a member of the Board of Directors of Public Service |
| Enterprise Group (utilities, 2001-present), Chairman of the Board of |
| Governors, Rutgers University (2004-present), and Chairman of the |
| Board of Saint Barnabas Health Care System. |
| |
| Peter S. Lynch (61) |
| |
| Year of Election or Appointment: 2003 |
| Member of the Advisory Board of Fidelity Advisor Series VIII. Vice |
| Chairman and a Director of FMR, and Vice Chairman (2001-present) |
| and a Director (2000-present) of FMR Co., Inc. Previously, Mr. Lynch |
| served as a Trustee of the Fidelity funds (1990-2003). In addition, he |
| serves as a Trustee of Boston College, Massachusetts Eye & Ear |
| Infirmary, Historic Deerfield, John F. Kennedy Library, and the Museum |
| of Fine Arts of Boston. |
| |
| Dwight D. Churchill (51) |
| |
| Year of Election or Appointment: 2005 |
| Vice President of Advisor International Capital Appreciation. Mr. Chur- |
| chill also serves as Vice President of certain Equity Funds (2005-present) |
| and certain High Income Funds (2005-present). Previously, he served as |
| Head of Fidelity’s Fixed-Income Division (2000-2005), Vice President of |
| Fidelity’s Money Market Funds (2000-2005), Vice President of Fidelity’s |
| Bond Funds, and Senior Vice President of FIMM (2000) and FMR. Mr. |
| Churchill joined Fidelity in 1993 as Vice President and Group Leader of |
| Taxable Fixed-Income Investments. |
39 Annual Report
Trustees and Officers - continued
| Name, Age; Principal Occupation |
| |
| Richard Mace (43) |
| |
| Year of Election or Appointment: 2005 |
| Vice President of Advisor International Capital Appreciation. Mr. Mace |
| serves as Vice President of other funds advised by FMR. Mr. Mace also |
| serves as Senior Vice President of FMR (2001) and FMR Co., Inc. |
| (2001). |
| |
| Eric D. Roiter (56) |
| |
| Year of Election or Appointment: 1998 |
| Secretary of Advisor International Capital Appreciation. He also serves |
| as Secretary of other Fidelity funds; Vice President, General Counsel, |
| and Secretary of FMR Co., Inc. (2001-present) and FMR; Assistant Sec- |
| retary of Fidelity Management & Research (U.K.) Inc. (2001-present), |
| Fidelity Management & Research (Far East) Inc. (2001-present), and |
| Fidelity Investments Money Management, Inc. (2001-present). Mr. Roiter |
| is an Adjunct Member, Faculty of Law, at Boston College Law School |
| (2003-present). Previously, Mr. Roiter served as Vice President and Sec- |
| retary of Fidelity Distributors Corporation (FDC) (1998-2005). |
| |
| Stuart Fross (46) |
| |
| Year of Election or Appointment: 2003 |
| Assistant Secretary of Advisor International Capital Appreciation. Mr. |
| Fross also serves as Assistant Secretary of other Fidelity funds |
| (2003-present), Vice President and Secretary of FDC (2005-present), |
| and is an employee of FMR. |
| |
| Christine Reynolds (47) |
| |
| Year of Election or Appointment: 2004 |
| President, Treasurer, and Anti-Money Laundering (AML) officer of Advi- |
| sor International Capital Appreciation. Ms. Reynolds also serves as Pres- |
| ident, Treasurer, and AML officer of other Fidelity funds (2004) and is a |
| Vice President (2003) and an employee (2002) of FMR. Before joining |
| Fidelity Investments, Ms. Reynolds worked at PricewaterhouseCoopers |
| LLP (PwC) (1980-2002), where she was most recently an audit partner |
| with PwC’s investment management practice. |
| |
| Paul M. Murphy (58) |
| |
| Year of Election or Appointment: 2005 |
| Chief Financial Officer of Advisor International Capital Appreciation. |
| Mr. Murphy also serves as Chief Financial Officer of other Fidelity funds |
| (2005-present). He also serves as Senior Vice President of Fidelity Pric- |
| ing and Cash Management Services Group (FPCMS). |
Annual Report 40
| Name, Age; Principal Occupation |
| |
| Kenneth A. Rathgeber (58) |
| |
| Year of Election or Appointment: 2004 |
| Chief Compliance Officer of Advisor International Capital Appreciation. |
| Mr. Rathgeber also serves as Chief Compliance Officer of other Fidelity |
| funds (2004) and Executive Vice President of Risk Oversight for Fidelity |
| Investments (2002). Previously, he served as Executive Vice President |
| and Chief Operating Officer for Fidelity Investments Institutional Services |
| Company, Inc. (1998-2002). |
| |
| John R. Hebble (47) |
| |
| Year of Election or Appointment: 2003 |
| Deputy Treasurer of Advisor International Capital Appreciation Mr. |
| Hebble also serves as Deputy Treasurer of other Fidelity funds (2003), |
| and is an employee of FMR. Before joining Fidelity Investments, Mr. |
| Hebble worked at Deutsche Asset Management where he served as |
| Director of Fund Accounting (2002-2003) and Assistant Treasurer of the |
| Scudder Funds (1998-2003). |
| |
| Bryan A. Mehrmann (44) |
| |
| Year of Election or Appointment: 2005 |
| Deputy Treasurer of Advisor International Capital Appreciation. Mr. |
| Mehrmann also serves as Deputy Treasurer of other Fidelity funds |
| (2005-present) and is an employee of FMR. Previously, Mr. Mehrmann |
| served as Vice President of Fidelity Investments Institutional Services |
| Group (FIIS)/Fidelity Investments Institutional Operations Corporation, |
| Inc. (FIIOC) Client Services (1998-2004). |
| |
| Kimberley H. Monasterio (41) |
| |
| Year of Election or Appointment: 2004 |
| Deputy Treasurer of Advisor International Capital Appreciation. Ms. |
| Monasterio also serves as Deputy Treasurer of other Fidelity funds |
| (2004) and is an employee of FMR (2004). Before joining Fidelity In- |
| vestments, Ms. Monasterio served as Treasurer (2000-2004) and Chief |
| Financial Officer (2002-2004) of the Franklin Templeton Funds and |
| Senior Vice President of Franklin Templeton Services, LLC (2000-2004). |
| |
| Kenneth B. Robins (36) |
| |
| Year of Election or Appointment: 2005 |
| Deputy Treasurer of Advisor International Capital Appreciation. Mr. |
| Robins also serves as Deputy Treasurer of other Fidelity funds |
| (2005-present) and is an employee of FMR (2004-present). Before join- |
| ing Fidelity Investments, Mr. Robins worked at KPMG LLP, where he was |
| a partner in KPMG’s department of professional practice (2002-2004) |
| and a Senior Manager (1999-2000). In addition, Mr. Robins served as |
| Assistant Chief Accountant, United States Securities and Exchange Com- |
| mission (2000-2002). |
41 Annual Report
Trustees and Officers - continued
| Name, Age; Principal Occupation |
| |
| Robert G. Byrnes (38) |
| |
| Year of Election or Appointment: 2005 |
| Assistant Treasurer of Advisor International Capital Appreciation. Mr. |
| Byrnes also serves as Assistant Treasurer of other Fidelity funds |
| (2005-present) and is an employee of FMR (2005-present). Previously, |
| Mr. Byrnes served as Vice President of FPCMS (2003-2005). Before |
| joining Fidelity Investments, Mr. Byrnes worked at Deutsche Asset Man- |
| agement where he served as Vice President of the Investment Opera- |
| tions Group (2000-2003). |
| |
| John H. Costello (59) |
| |
| Year of Election or Appointment: 1997 |
| Assistant Treasurer of Advisor International Capital Appreciation. Mr. |
| Costello also serves as Assistant Treasurer of other Fidelity funds and is |
| an employee of FMR. |
| |
| Peter L. Lydecker (51) |
| |
| Year of Election or Appointment: 2004 |
| Assistant Treasurer of Advisor International Capital Appreciation. Mr. |
| Lydecker also serves as Assistant Treasurer of other Fidelity funds (2004) |
| and is an employee of FMR. |
| |
| Mark Osterheld (50) |
| |
| Year of Election or Appointment: 2002 |
| Assistant Treasurer of Advisor International Capital Appreciation. Mr. |
| Osterheld also serves as Assistant Treasurer of other Fidelity funds |
| (2002) and is an employee of FMR. |
| |
| Gary W. Ryan (47) |
| |
| Year of Election or Appointment: 2005 |
| Assistant Treasurer of Advisor International Capital Appreciation. Mr. |
| Ryan also serves as Assistant Treasurer of other Fidelity funds |
| (2005-present) and is an employee of FMR (2005-present). Previously, |
| Mr. Ryan served as Vice President of Fund Reporting in FPCMS |
| (1999-2005). |
| |
| Salvatore Schiavone (39) |
| |
| Year of Election or Appointment: 2005 |
| Assistant Treasurer of Advisor International Capital Appreciation. Mr. |
| Schiavone also serves as Assistant Treasurer of other Fidelity funds |
| (2005-present) and is an employee of FMR (2005-present). Before join- |
| ing Fidelity Investments, Mr. Schiavone worked at Deutsche Asset Man- |
| agement, where he most recently served as Assistant Treasurer |
| (2003-2005) of the Scudder Funds and Vice President and Head of |
| Fund Reporting (1996-2003). |
Annual Report 42
The Board of Trustees of Fidelity Advisor International Capital Appreciation Fund voted to pay to shareholders of record at the opening of business on record date, the following distributions per share derived from capital gains realized from sales of portfolio securities, and dividends derived from net investment income:
| | | Pay Date | | Record Date | | Dividends | | Capital Gains |
| Class A | | 12/12/05 | | 12/09/05 | | $.202 | | $2.24 |
| Class T | | 12/12/05 | | 12/09/05 | | $.153 | | $2.24 |
| Class B | | 12/12/05 | | 12/09/05 | | $.051 | | $2.24 |
| Class C | | 12/12/05 | | 12/09/05 | | $.065 | | $2.24 |
The fund hereby designates as capital gain dividends: For dividends with respect to the taxable year ended October 31, 2005, $64,633,600, or, if subsequently determined to be different, the net capital gain of such year, and for dividends with respect to the taxable year ended October 31, 2004, $0, or, if subsequently determined to be different, the excess of: (a) the net capital gain of such year, over (b) amounts previously designated as capital gain dividends with respect to such year.
The fund will notify shareholders in January 2006 of amounts for use in preparing 2005 income tax returns.
43 Annual Report
Board Approval of Investment Advisory Contracts and Management Fees
Advisor International Capital Appreciation Fund
Each year, typically in July, the Board of Trustees, including the independent Trustees (together, the Board), votes on the renewal of the management contract and sub-advisory agreements (together, the Advisory Contracts) for the fund. The Board, assisted by the advice of fund counsel and independent Trustees’ counsel, requests and considers a broad range of information throughout the year.
The Board meets regularly each month except August and takes into account throughout the year matters bearing on Advisory Contracts. The Board, acting directly and through its separate committees, considers at each of its meetings factors that are relevant to the annual renewal of the fund’s Advisory Contracts, including the services and support provided to the fund and its shareholders by Fidelity. At the time of the renewal, the Board had 11 standing committees, each composed of independent Trustees with varying backgrounds, to which the Board has assigned specific subject matter responsibilities in order to enhance effective decision-making by the Board. Each committee has adopted a written charter outlining the structure and purposes of the committee. One such committee, the Equity Contract Committee, meets periodically during the first six months of each year and as necessary to consider matters specifically related to the annual renewal of Advisory Contracts. The committee requests and receives information on, and makes recommendations to the independent Trustees concerning, the approval and annual review of the Advisory Contracts.
At its July 2005 meeting, the Board of Trustees, including the independent Trustees, unanimously determined to renew the Advisory Contracts for the fund. In reaching its determination, the Board considered all factors it believed relevant, including (1) the nature, extent, and quality of the services to be provided to the fund and its shareholders by Fidelity (including the investment performance of the fund); (2) the competitiveness of the management fee and total expenses of the fund; (3) the total costs of the services to be provided by and the profits to be realized by the investment adviser and its affiliates from the relationship with the fund; (4) the extent to which economies of scale would be realized as the fund grows; and (5) whether fee levels reflect these economies of scale, if any, for the benefit of fund shareholders.
In determining whether to renew the Advisory Contracts for the fund, the Board ultimately reached a determination, with the assistance of fund counsel and independent Trustees’ counsel, that the renewal of the Advisory Contracts and the compensation to be received by Fidelity under the management contract is consistent with Fidelity’s fiduciary duty under applicable law. In addition to evaluating the specific factors noted above, the Board, in reaching its determination, is aware that shareholders in the fund have a broad range of investment choices available to them, including a wide choice among mutual funds offered by competitors to Fidelity, and that the fund’s shareholders, with the opportunity to review and weigh the disclosure provided by the fund in its
prospectus and other public disclosures, have chosen to invest in this fund, managed by Fidelity.
Nature, Extent, and Quality of Services Provided by Fidelity. The Board considered staffing within the investment adviser, FMR, and the sub-advisers (together, the Investment Advisers), including the background of the fund’s portfolio manager and the fund’s investment objective and discipline. The independent Trustees also had discussions with senior management of Fidelity’s investment operations and investment groups. The Board considered the structure of the portfolio manager compensation program and whether this structure provides appropriate incentives.
Fidelity Resources Dedicated to Investment Management and Support Services. The Board reviewed the size, education, and experience of the Investment Advisers’ investment staff, their use of technology, and the Investment Advisers’ approach to recruiting, training, and retaining portfolio managers and other research, advisory, and management personnel. The Board considered Fidelity’s extensive global research capabilities that enable the Investment Advisers to aggregate data from various sources in an effort to produce positive investment results. The Board noted that Fidelity’s analysts have access to a variety of technological tools that enable them to perform both fundamental and quantitative analysis and to specialize in various disciplines. The Board also considered that Fidelity’s portfolio managers and analysts have access to daily portfolio attribution that allows for monitoring of a fund’s portfolio, as well as an electronic communication system that provides immediate real-time access to research concerning issuers and credit enhancers.
Shareholder and Administrative Services. The Board considered the nature, extent, quality, and cost of administrative, distribution, and shareholder services performed by the Investment Advisers and their affiliates under the Advisory Contracts and under separate agreements covering transfer agency, pricing and bookkeeping, and securities lending services for the fund. The Board also considered the nature and extent of the Investment Advisers’ supervision of third party service providers, principally custodians and subcustodians. The Board reviewed the allocation of fund brokerage, including allocations to brokers affiliated with the Investment Advisers, the use of brokerage commissions to pay fund expenses, and the use of “soft” commission dollars to pay for research services. The Board also considered that Fidelity voluntarily decided in 2004 to stop using “soft” commission dollars to pay for market data and, instead, to pay for that data out of its own resources. The Board also considered the resources devoted to, and the record of compliance with, the fund’s compliance policies and procedures.
The Board noted that the growth of fund assets across the complex allows Fidelity to reinvest in the development of services designed to enhance the value or convenience of the Fidelity funds as investment vehicles. These services include 24-hour access to
45 Annual Report
Board Approval of Investment Advisory Contracts and Management Fees - continued
account information and market information through phone representatives and over the Internet, and investor education materials and asset allocation tools.
Investment in a Large Fund Family. The Board considered the benefits to shareholders of investing in a Fidelity fund, including the benefits of investing in a fund that is part of a large family of funds offering a variety of investment disciplines and providing for a large variety of mutual fund investor services. For example, fund shareholders are offered the privilege of exchanging shares of the fund for shares of other Fidelity funds, as set forth in the fund’s prospectus, without paying an additional sales charge. The Board noted that, since the last Advisory Contract renewals in July 2004, Fidelity has taken a number of actions that benefited particular funds, including (i) voluntarily deciding in 2004 to stop using “soft” commission dollars to pay for market data and, instead, to pay for that data out of its own resources, (ii) contractually agreeing to impose management fee reductions and expense limitations on its five Spartan stock index funds and its stock index fund available through variable insurance products, (iii) contractually agreeing to eliminate the management fees on the Fidelity Freedom Funds and the Fidelity Advisor Freedom Funds, (iv) contractually agreeing to reduce the management fees on most of its investment-grade taxable bond funds, and (v) contractually agreeing to impose expense limitations on its retail and Spartan investment-grade taxable bond funds.
Investment Performance and Compliance. The Board considered whether the fund has operated within its investment objective, as well as its record of compliance with its investment restrictions. It also reviewed the fund’s absolute investment performance for each class, as well as the fund’s relative investment performance for each class measured against (i) a broad-based securities market index, and (ii) a peer group of mutual funds deemed appropriate by the Board over multiple periods. The following charts considered by the Board show, over the one-, three-, and five-year periods ended December 31, 2004, the returns of Class C and Institutional Class of the fund, the returns of a broad-based securities market index (“benchmark”), and a range of returns of a peer group of mutual funds identified by Lipper Inc. as having an investment objective similar to that of the fund. The returns of Class C and Institutional Class represent the performance of classes with the highest and lowest 12b-1 fees, respectively (not necessarily with the highest and lowest total expenses). The box within each chart shows the 25th percentile return (bottom of box) and the 75th percentile return (top of box) of the Lipper peer group. Returns shown above the box are in the first quartile and returns shown below the box are in the fourth quartile. The percentage beaten numbers noted below each chart correspond to the percentile box and represent the percentage of funds in the Lipper peer group whose performance was equal to or lower than that of the class indicated.

The Board reviewed the fund’s relative investment performance against its Lipper peer group and stated that the performance of Institutional Class of the fund was in the fourth quartile for the one-year period and the second quartile for the three- and five-year periods. The Board also stated that the relative investment performance of the fund was lower than its benchmark over time. The Board considered that the variations in performance among the fund’s classes reflect the variations in class expenses, which result in lower performance for higher expense classes.
The Board has had thorough discussions with FMR throughout the year about the Board’s and FMR’s concerns about equity research, equity fund performance, and compliance with internal policies governing gifts and entertainment. FMR has taken steps that it believes will refocus and strengthen equity research and equity portfolio management and compliance. The Board noted with favor FMR’s recent reorganization of its senior management team and FMR’s plans to dedicate additional resources to investment research, and participated in the process that led to those changes.
Based on its review, and giving particular weight to the nature and quality of the resources dedicated by the Investment Advisers to maintain and improve relative performance, the Board concluded that the nature, extent, and quality of the services provided by Fidelity will benefit the fund’s shareholders, particularly in light of the Board’s view that the fund’s shareholders benefit from investing in a fund that is part of a large family of funds offering a variety of investment disciplines and services.
Competitiveness of Management Fee and Total Fund Expenses. The Board considered the fund’s management fee and total expenses compared to “mapped groups” of competitive funds and classes. Fidelity creates “mapped groups” by combining similar
47 Annual Report
Board Approval of Investment Advisory Contracts and Management Fees - continued
Lipper investment objective categories that have comparable management fee characteristics. Combining Lipper investment objective categories aids the Board’s management fee and total expense comparisons by broadening the competitive group used for comparison and by reducing the number of universes to which various Fidelity funds are compared.
The Board considered two proprietary management fee comparisons for the 12-month periods shown in the chart below. The group of Lipper funds used by the Board for management fee comparisons is referred to below as the “Total Mapped Group” and, for the reasons explained above, is broader than the Lipper peer group used by the Board for performance comparisons. The Total Mapped Group comparison focuses on a fund’s standing relative to the total universe of comparable funds available to investors, in terms of gross management fees before expense reimbursements or caps. “TMG %” represents the percentage of funds in the Total Mapped Group that had management fees that were lower than the fund’s. For example, a TMG % of 24% means that 76% of the funds in the Total Mapped Group had higher management fees than the fund. The “Asset-Size Peer Group” (ASPG) comparison focuses on a fund’s standing relative to non-Fidelity funds similar in size to the fund within the Total Mapped Group. The ASPG represents at least 15% of the funds in the Total Mapped Group with comparable asset size and management fee characteristics, subject to a minimum of 50 funds (or all funds in the Total Mapped Group if fewer than 50). Additional information, such as the ASPG quartile (“quadrant”) in which the fund’s management fee ranked, is also included in the chart and considered by the Board.
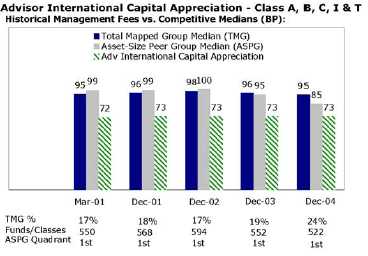
The Board noted that the fund’s management fee ranked below the median of its Total Mapped Group and below the median of its ASPG for 2004.
Based on its review, the Board concluded that the fund’s management fee was fair and reasonable in light of the services that the fund receives and the other factors considered.
In its review of each class’s total expenses, the Board considered the fund’s management fee as well as other fund or class expenses, as applicable, such as transfer agent fees, pricing and bookkeeping fees, fund-paid 12b-1 fees, and custodial, legal, and audit fees. The Board also noted the effects of any waivers and reimbursements on fees and expenses. As part of its review, the Board also considered current and historical total expenses of each class of the fund compared to competitive fund median expenses. Each class of the fund is compared to those funds and classes in the Total Mapped Group (used by the Board for management fee comparisons) that have a similar sales load structure.
The Board noted that the total expenses of each of Class A, Class B and Class C ranked below its competitive median for 2004, and the total expenses of each of Class T and Institutional Class ranked above its competitive median for 2004. The Board noted that the fund offers multiple classes, each of which has a different sales load and 12b-1 fee structure, and that the multiple structures are intended to offer a range of pricing options for the intermediary market. The Board also noted that the total expenses of the classes vary primarily by the level of their 12b-1 fees, although differences in transfer agent fees may also cause expenses to vary from class to class.
Furthermore, the Board considered that on December 16, 2004, it had approved changes (effective January 1, 2005) in the transfer agent and service agreements for the fund that established maximum transfer agent fees and eliminated the minimum pricing and bookkeeping fee to prevent small funds or funds with small average account sizes from having relatively high fees in basis points (the “small-fund fee reductions”). The Board considered that, if the small-fund fee reductions had been in effect in 2004, the total expenses of Institutional Class would have ranked below the median.
In its review of total expenses, the Board also considered Fidelity fee structures and other information on clients that FMR and its affiliates service in other competitive markets, such as other mutual funds advised or subadvised by FMR or its affiliates, pension plan clients, and other institutional clients.
Based on its review, the Board concluded that the total expenses for each class of the fund were reasonable, although in some cases above the median of the universe presented for comparison, in light of the services that the fund and its shareholders receive and the other factors considered.
Costs of the Services and Profitability. The Board considered the revenues earned and the expenses incurred by Fidelity in conducting the business of developing, marketing, distributing, managing, administering and servicing the fund and its shareholders.
49 Annual Report
Board Approval of Investment Advisory Contracts and Management Fees - continued
The Board also considered the level of Fidelity’s profits in respect of all the Fidelity funds.
On an annual basis, FMR presents to the Board Fidelity’s profitability for the fund. Fidelity calculates the profitability for each fund, as well as aggregate profitability for groups of Fidelity funds and all Fidelity funds, using a series of detailed revenue and cost allocation methodologies which originate with the audited books and records of Fidelity. The Audit Committee of the Board reviews any significant changes from the prior year’s methodologies.
PricewaterhouseCoopers LLP (PwC), independent registered accounting firm and auditor to Fidelity and certain Fidelity funds, has been engaged annually by the Board as part of the Board’s assessment of the results of Fidelity’s profitability analysis. PwC’s engagement includes the review and assessment of Fidelity’s methodologies used in determining the revenues and expenses attributable to Fidelity’s mutual fund business, and completion of agreed-upon procedures surrounding the mathematical accuracy of fund profitability and its conformity to allocation methodologies. After considering PwC’s reports issued under the engagement and information provided by Fidelity, the Board believes that while other allocation methods may also be reasonable, Fidelity’s profitability methodologies are reasonable in all material respects.
The Board has also reviewed Fidelity’s non-fund businesses and any fall-out benefits related to the mutual fund business as well as cases where Fidelity’s affiliates may benefit from or be related to the fund’s business. In addition, a special committee of the Board reviewed services provided to Fidelity by its affiliates and determined that the fees that Fidelity paid for such services were reasonable.
The Board considered the costs of the services provided by and the profits realized by Fidelity in connection with the operation of the fund and determined that the amount of profit is a fair entrepreneurial profit for the management of the fund.
Economies of Scale. The Board considered whether there have been economies of scale in respect of the management of the Fidelity funds, whether the Fidelity funds (including the fund) have appropriately benefited from any such economies of scale, and whether there is potential for realization of any further economies of scale. The Board considered the extent to which the fund will benefit from economies of scale through increased services to the fund, through waivers or reimbursements, or through fee or expense reductions, including reductions that occur through operation of the transfer agent agreement. The transfer agent fee varies in part based on the number of accounts in the fund. If the number of accounts decreases or the average account size increases, the overall transfer agent fee rate decreases.
The Board recognized that the fund’s management contract incorporates a “group fee” structure, which provides for lower fee rates as total fund assets under FMR’s
management increase, and for higher fee rates as total fund assets under FMR’s management decrease. The Board considered that the group fee is designed to deliver the benefits of economies of scale to fund shareholders when total fund assets increase, even if assets of any particular fund are unchanged or have declined, because some portion of Fidelity’s costs are attributable to services provided to all Fidelity funds, and all funds benefit if those costs can be allocated among more assets. The Board concluded that, given the group fee structure, fund shareholders will achieve a certain level of economies of scale as assets under FMR’s management increase at the fund complex level, regardless of whether Fidelity achieves any such economies of scale.
The Board further concluded that any potential economies of scale are being shared between fund shareholders and Fidelity in an appropriate manner.
Additional Information Requested by the Board. In order to develop fully the factual basis for consideration of the Advisory Contracts, the Board requested additional information regarding (i) equity fund transfer agency fees; (ii) Fidelity’s fund profitability methodology and the impact of various changes in the methodology over time; (iii) benefits to shareholders from economies of scale; (iv) composition and characteristics of various fund and industry data used in comparisons; and (v) compensation of portfolio managers and research analysts.
Based on its evaluation of all of the conclusions noted above, and after considering all material factors, the Board ultimately concluded that the existing advisory fee structures are fair and reasonable, and that the fund’s existing Advisory Contracts should be renewed.
51 Annual Report
53 Annual Report
Investment Adviser
Fidelity Management & Research Company
Boston, MA
Investment Sub-Advisers
FMR Co., Inc.
Fidelity Management & Research
(U.K.) Inc.
Fidelity Management & Research
(Far East) Inc.
Fidelity International
Investment Advisors
Fidelity Investments Japan Limited
Fidelity International Investment
Advisors (U.K.) Limited
General Distributor
Fidelity Distributors Corporation
Boston, MA
Transfer and Service Agents
Fidelity Investments Institutional
Operations Company, Inc.
Boston, MA
Fidelity Service Company, Inc.
Boston, MA
Custodian
Brown Brothers Harriman & Co.
Boston, MA
|

Fidelity® Advisor
International Capital Appreciation
Fund - Institutional Class
Annual Report October 31, 2005

| Contents | | | | |
| |
| Chairman’s Message | | 4 | | Ned Johnson’s message to shareholders. |
| Performance | | 6 | | How the fund has done over time. |
| Management’s Discussion | | 7 | | The manager’s review of fund |
| | | | | performance, strategy and outlook. |
| Shareholder Expense | | 8 | | An example of shareholder expenses. |
| Example | | | | |
| Investment Changes | | 10 | | A summary of major shifts in the fund’s |
| | | | | investments over the past six months. |
| Investments | | 11 | | A complete list of the fund’s investments |
| | | | | with their market values. |
| Financial Statements | | 14 | | Statements of assets and liabilities, |
| | | | | operations, and changes in net assets, |
| | | | | as well as financial highlights. |
| Notes | | 23 | | Notes to the financial statements. |
| Report of Independent | | 31 | | |
| Registered Public | | | | |
| Accounting Firm | | | | |
| Trustees and Officers | | 32 | | |
| Distributions | | 42 | | |
| Board Approval of | | 43 | | |
| Investment Advisory | | | | |
| Contracts and | | | | |
| Management Fees | | | | |
To view a fund’s proxy voting guidelines and proxy voting record for the 12-month period ended June 30, visit www.fidelity.com/proxyvotingresults or visit the Securities and Exchange Commission’s (SEC) web site at www.sec.gov. You may also call 1-877-208-0098 to request a free copy of the proxy voting guidelines.
Standard & Poor’s, S&P and S&P 500 are registered service marks of The McGraw-Hill Companies, Inc. and have been licensed for use by Fidelity Distributors Corporation.
Other third party marks appearing herein are the property of their respective owners.
All other marks appearing herein are registered or unregistered trademarks or service marks of FMR Corp. or an affiliated company.
The views expressed in the Management’s Discussion of Fund Performance reflect those of the portfolio manager only through the end of the period of the report as stated on the cover and do not necessarily represent the views of Fidelity or any other person in the Fidelity organization. Any such views are subject to change at any time based upon market or other conditions and Fidelity disclaims any responsibility to update such views. These views may not be relied on as investment advice and, because investment decisions for a Fidelity fund are based on numerous factors, may not be relied on as an indication of trading intent on behalf of any Fidelity fund.
This report and the financial statements contained herein are submitted for the general information of the shareholders of the fund. This report is not authorized for distribution to prospective investors in the fund unless preceded or accompanied by an effective prospectus.
A fund files its complete schedule of portfolio holdings with the SEC for the first and third quarters of each fiscal year on Form N-Q. Forms N-Q are available on the SEC’s web site at http://www.sec.gov. A fund’s Forms N-Q may be reviewed and copied at the SEC’s Public Reference Room in Washington, DC. Information regarding the operation of the SEC’s Public Reference Room may be obtained by calling 1-800-SEC-0330. For a complete list of a fund’s portfolio holdings, view the most recent quarterly holdings report, semiannual report, or annual report on Fidelity’s web site at http://www.advisor.fidelity.com.
NOT FDIC INSURED · MAY LOSE VALUE · NO BANK GUARANTEE
Neither the fund nor Fidelity Distributors Corporation is a bank.
3 Annual Report
Chairman’s Message
(Photograph of Edward C. Johnson 3d)
Dear Shareholder:
During the past year or so, much has been reported about the mutual fund industry, and much of it has been more critical than I believe is warranted. Allegations that some companies have been less than forthright with their shareholders have cast a shadow on the entire industry. I continue to find these reports disturbing, and assert that they do not create an accurate picture of the industry overall. Therefore, I would like to remind everyone where Fidelity stands on these issues. I will say two things specifically regarding allegations that some mutual fund companies were in violation of the Securities and Exchange Commission’s forward pricing rules or were involved in so-called “market timing” activities.
First, Fidelity has no agreements that permit customers who buy fund shares after 4 p.m. to obtain the 4 p.m. price. This is not a new policy. This is not to say that someone could not deceive the company through fraudulent acts. However, we are extremely diligent in preventing fraud from occurring in this manner — and in every other. But I underscore again that Fidelity has no so-called “agreements” that sanction illegal practices.
Second, Fidelity continues to stand on record, as we have for years, in opposition to predatory short-term trading that adversely affects shareholders in a mutual fund. Back in the 1980s, we initiated a fee — which is returned to the fund and, therefore, to investors — to discourage this activity. Further, we took the lead several years ago in developing a Fair Value Pricing Policy to prevent market timing on foreign securities in our funds. I am confident we will find other ways to make it more difficult for predatory traders to operate. However, this will only be achieved through close cooperation among regulators, legislators and the industry.
Yes, there have been unfortunate instances of unethical and illegal activity within the mutual fund industry from time to time. That is true of any industry. When this occurs, confessed or convicted offenders should be dealt with appropriately. But we are still concerned about the risk of over-regulation and the quick application of simplistic solutions to intricate problems. Every system can be improved, and we support and applaud well thought out improvements by regulators, legislators and industry representatives that achieve the common goal of building and protecting the value of investors’ holdings.
For nearly 60 years, Fidelity has worked very hard to improve its products and service to justify your trust. When our family founded this company in 1946, we had only a few hundred customers. Today, we serve more than 18 million customers including individual investors and participants in retirement plans across America.
Annual Report 4
Let me close by saying that we do not take your trust in us for granted, and we realize that we must always work to improve all aspects of our service to you. In turn, we urge you to continue your active participation with your financial matters, so that your interests can be well served.
Best regards,
/s/Edward C. Johnson 3d
5 Annual Report
Performance: The Bottom Line
Average annual total return reflects the change in the value of an investment, assuming reinvestment of the class’ dividend income and capital gains (the profits earned upon the sale of securities that have grown in value) and assuming a constant rate of performance each year. The $10,000 table and the fund’s returns do not reflect the deduction of taxes that a shareholder would pay on fund distributions or the redemption of fund shares. During periods of reimbursement by Fidelity, a fund’s total return will be greater than it would be had the reimbursement not occurred. How a fund did yesterday is no guarantee of how it will do tomorrow.
| Average Annual Total Returns | | | | | | |
| Periods ended October 31, 2005 | | Past 1 | | Past 5 | | Life of |
| | | year | | years | | fundA |
| Institutional Class | | 13.10% | | 3.64% | | 8.42% |
| A From November 3, 1997. | | | | | | |
$10,000 Over Life of Fund
Let’s say hypothetically that $10,000 was invested in Fidelityr Advisor International Capital Appreciation Fund — Institutional Class on November 3, 1997, when the fund started. The chart shows how the value of your investment would have changed, and also shows how the Morgan Stanley Capital InternationalSM All Country World ex USA Index performed over the same period.

Annual Report 6
Management’s Discussion of Fund Performance
Comments from Richard Mace, Portfolio Manager of Fidelity® Advisor International Capital Appreciation Fund
Foreign stock markets enjoyed broad-based advances during the 12-month period that ended October 31, 2005, encouraged by better-than-expected corporate earnings and markedly improved economies. For the 12 months overall, the Morgan Stanley Capital InternationalSM Europe, Australasia, Far East (MSCIr EAFE®) Index — a performance measure of developed stock markets outside the United States and Canada — gained 18.28% . The Japanese stock market climbed to its highest level in more than four years. Positive economic indicators and Prime Minister Koizumi’s decisive election victory attracted record inflows from overseas investors. In response, the Tokyo Stock Exchange Stock Price Index (TOPIX) soared 22.89% . Southeast Asian equities outside of Japan, particularly South Korea, also responded well to the better macroeconomic environment, illustrated by the 19.44% return for the MSCI All Country Far East ex Japan index. Euro-pean stock markets were up as well, despite investors’ concern about higher energy prices and potential downgrades to economic growth in the region. For the year overall, the MSCI Europe index rose 16.51% .
For the 12 months ending October 31, 2005, the fund’s Institutional Class shares returned 13.10%, while the Morgan Stanley Capital InternationalSM All Country World (MSCI ACWI) ex USA Index rose 20.24% and the Lipper International Funds Average gained 17.75% . A heavy overweighting in information technology — largely concentrated within the lagging semiconductor industry — plus unfavorable stock picking within that group were responsible for a large portion of the shortfall versus the index. Taiwanese chip maker United Microelectronics and equipment maker Tokyo Electron were two of the biggest detractors in this group. Inopportune stock selection also hurt in a variety of other areas, including technology hardware and equipment, where Alcatel, the French telecommunications equipment maker, disappointed. On the plus side of the ledger, the fund reclaimed some ground through particularly strong stock picking in the banking group — notably State Bank of India — as well as in the booming energy arena, with such names as Canadian Natural Resources. Some of the stocks mentioned in this report were no longer held at period end.
Note to shareholders: Effective January 1, 2006, an interim portfolio management team led by Michael Jenkins and composed of William Bower, Penelope Dobkin and William Kennedy has been named to manage Fidelity Advisor International Capital Appreciation Fund while the fund’s Portfolio Manager, Richard Mace, is on a leave of absence from the firm.
The views expressed in this statement reflect those of the portfolio manager only through October 31, 2005. See page 3 for further discussion of this section of the report.
Shareholder Expense Example
As a shareholder of the Fund, you incur two types of costs: (1) transaction costs, including sales charges (loads) on purchase payments or redemption proceeds, redemption fees, and (2) ongoing costs, including management fees, distribution and/or service (12b-1) fees and other Fund expenses. This Example is intended to help you understand your ongoing costs (in dollars) of investing in the Fund and to compare these costs with the ongoing costs of investing in other mutual funds.
The Example is based on an investment of $1,000 invested at the beginning of the period and held for the entire period (May 1, 2005 to October 31, 2005).
The first line of the table below for each class of the Fund provides information about actual account values and actual expenses. You may use the information in this line, together with the amount you invested, to estimate the expenses that you paid over the period. Simply divide your account value by $1,000.00 (for example, an $8,600 account value divided by $1,000.00 = 8.6), then multiply the result by the number in the first line for a class of the Fund under the heading entitled “Expenses Paid During Period” to estimate the expenses you paid on your account during this period.
Hypothetical Example for Comparison Purposes
The second line of the table below for each class of the Fund provides information about hypothetical account values and hypothetical expenses based on a Class’ actual expense ratio and an assumed rate of return of 5% per year before expenses, which is not the Class’ actual return. The hypothetical account values and expenses may not be used to estimate the actual ending account balance or expenses you paid for the period. You may use this information to compare the ongoing costs of investing in the Fund and other funds. To do so, compare this 5% hypothetical example with the 5% hypothetical examples that appear in the shareholder reports of the other funds.
Please note that the expenses shown in the table are meant to highlight your ongoing costs only and do not reflect any transaction costs. Therefore, the second line of the table is useful in comparing ongoing costs only, and will not help you determine the relative total costs of owning different funds. In addition, if these transactional costs were included, your costs would have been higher.
| | | | | | | | | | | | | Expenses Paid |
| | | | | Beginning | | | | Ending | | | | During Period* |
| | | | | Account Value | | | | Account Value | | | | May 1, 2005 |
| | | | | May 1, 2005 | | | | October 31, 2005 | | to October 31, 2005 |
| Class A | | | | | | | | | | | | |
| Actual | | $ | | 1,000.00 | | $ | | 1,076.80 | | $ | | 7.59 |
| HypotheticalA | | $ | | 1,000.00 | | $ | | 1,017.90 | | $ | | 7.38 |
| Class T | | | | | | | | | | | | |
| Actual | | $ | | 1,000.00 | | $ | | 1,075.80 | | $ | | 8.74 |
| HypotheticalA | | $ | | 1,000.00 | | $ | | 1,016.79 | | $ | | 8.49 |
| Class B | | | | | | | | | | | | |
| Actual | | $ | | 1,000.00 | | $ | | 1,073.00 | | $ | | 11.76 |
| HypotheticalA | | $ | | 1,000.00 | | $ | | 1,013.86 | | $ | | 11.42 |
Annual Report 8
| | | | | | | | | | | | | Expenses Paid |
| | | | | Beginning | | | | Ending | | | | During Period* |
| | | | | Account Value | | | | Account Value | | | | May 1, 2005 |
| | | | | May 1, 2005 | | | | October 31, 2005 | | to October 31, 2005 |
| Class C | | | | | | | | | | | | |
| Actual | | $ | | 1,000.00 | | $ | | 1,072.70 | | $ | | 11.44 |
| HypotheticalA | | $ | | 1,000.00 | | $ | | 1,014.17 | | $ | | 11.12 |
| Institutional Class | | | | | | | | | | | | |
| Actual | | $ | | 1,000.00 | | $ | | 1,078.00 | | $ | | 6.55 |
| HypotheticalA | | $ | | 1,000.00 | | $ | | 1,018.90 | | $ | | 6.36 |
| |
| A 5% return per year before expenses | | | | | | | | |
* Expenses are equal to each Class’ annualized expense ratio (shown in the table below); multiplied by the average account value over the period, multiplied by 184/365 (to reflect the one-half year period).
| | | Annualized |
| | | Expense Ratio |
| Class A | | 1.45% |
| Class T | | 1.67% |
| Class B | | 2.25% |
| Class C | | 2.19% |
| Institutional Class | | 1.25% |
9 Annual Report
Investment Changes
| Top Five Stocks as of October 31, 2005 | | | | |
| | | % of fund’s | | % of fund’s net assets |
| | | net assets | | 6 months ago |
| Pernod Ricard SA (France, Beverages) | | 5.0 | | 1.1 |
| Total SA Series B (France, Oil, Gas & | | | | |
| Consumable Fuels) | | 4.6 | | 2.6 |
| Sumitomo Mitsui Financial Group, Inc. (Japan, | | | | |
| Commercial Banks) | | 4.5 | | 2.9 |
| Credit Suisse Group (Reg.) (Switzerland, Capital | | | | |
| Markets) | | 4.4 | | 2.8 |
| Tokyo Electron Ltd. (Japan, Semiconductors & | | | | |
| Semiconductor Equipment) | | 4.3 | | 0.0 |
| | | 22.8 | | |
| Top Five Market Sectors as of October 31, 2005 | | |
| | | % of fund’s | | % of fund’s net assets |
| | | net assets | | 6 months ago |
| Financials | | 24.4 | | 23.7 |
| Information Technology | | 22.5 | | 10.6 |
| Energy | | 16.4 | | 10.4 |
| Health Care | | 9.4 | | 10.1 |
| Industrials | | 5.5 | | 8.1 |
| Top Five Countries as of October 31, 2005 | | |
| (excluding cash equivalents) | | % of fund’s | | % of fund’s net assets |
| | | net assets | | 6 months ago |
| Japan | | 18.1 | | 14.5 |
| Switzerland | | 12.8 | | 14.7 |
| France | | 11.1 | | 10.8 |
| Germany | | 8.2 | | 2.7 |
| United Kingdom | | 7.3 | | 11.2 |
| Percentages are adjusted for the effect of open futures contracts, if applicable. | | |

Annual Report 10
| Investments October 31, 2005 | | | | | | |
| Showing Percentage of Net Assets | | | | | | |
| |
| Common Stocks — 96.2% | | | | | | |
| | | | | Shares | | Value (Note 1) |
| |
| Australia – 1.6% | | | | | | |
| BHP Billiton Ltd. sponsored ADR | | | | 338,700 | | $ 10,516,635 |
| Austria – 0.9% | | | | | | |
| OMV AG | | | | 111,300 | | 6,003,939 |
| Canada – 6.3% | | | | | | |
| EnCana Corp. | | | | 561,400 | | 25,669,433 |
| Research In Motion Ltd. (a) | | | | 135,200 | | 8,313,484 |
| Talisman Energy, Inc. | | | | 179,700 | | 7,959,447 |
| TOTAL CANADA | | | | | | 41,942,364 |
| |
| China – 0.5% | | | | | | |
| Weichai Power Co. Ltd. (H Shares) | | | | 1,905,000 | | 3,636,950 |
| Finland – 0.8% | | | | | | |
| Nokia Corp. sponsored ADR | | | | 302,200 | | 5,083,004 |
| France – 11.1% | | | | | | |
| BNP Paribas SA | | | | 134,200 | | 10,175,170 |
| Pernod Ricard SA | | | | 187,971 | | 32,875,677 |
| Total SA Series B | | | | 121,957 | | 30,738,043 |
| TOTAL FRANCE | | | | | | 73,788,890 |
| |
| Germany – 8.2% | | | | | | |
| Allianz AG (Reg.) | | | | 173,200 | | 24,490,479 |
| Deutsche Telekom AG (Reg.) | | | | 344,700 | | 6,101,190 |
| E.ON AG | | | | 266,600 | | 24,161,957 |
| TOTAL GERMANY | | | | | | 54,753,626 |
| |
| India – 3.3% | | | | | | |
| Cipla Ltd. | | | | 449,282 | | 3,592,163 |
| Satyam Computer Services Ltd. | | | | 774,491 | | 10,362,061 |
| State Bank of India | | | | 383,070 | | 7,943,752 |
| TOTAL INDIA | | | | | | 21,897,976 |
| |
| Ireland – 1.7% | | | | | | |
| Ryanair Holdings PLC sponsored ADR (a) | | | | 224,900 | | 11,148,293 |
| Italy – 0.8% | | | | | | |
| Banca Intesa Spa | | | | 1,072,200 | | 5,003,672 |
| Japan – 18.1% | | | | | | |
| Credit Saison Co. Ltd. | | | | 223,500 | | 10,161,622 |
| Nikko Cordial Corp. | | | | 2,204,000 | | 26,721,807 |
| Nitto Denko Corp. | | | | 140,800 | | 8,547,653 |
| Sumitomo Mitsui Financial Group, Inc. | | | | 3,234 | | 29,967,463 |
| Tokyo Electron Ltd. | | | | 563,900 | | 28,372,945 |
2005See accompanying notes which are an integral part of the financial statements.
11 Annual Report
| Investments - continued | | | | |
| |
| |
| Common Stocks – continued | | | | |
| | | Shares | | Value (Note 1) |
| |
| Japan – continued | | | | |
| Yahoo! Japan Corp | | 7,790 | | $ 8,297,911 |
| Yahoo! Japan Corp. New | | 7,790 | | 8,432,836 |
| TOTAL JAPAN | | | | 120,502,237 |
| |
| Korea (South) – 1.2% | | | | |
| Shinhan Financial Group Co. Ltd. | | 232,500 | | 7,749,997 |
| Netherlands – 5.4% | | | | |
| ASML Holding NV (NY Shares) (a) | | 1,512,436 | | 25,681,163 |
| ING Groep NV (Certificaten Van Aandelen) | | 364,100 | | 10,507,927 |
| TOTAL NETHERLANDS | | | | 36,189,090 |
| |
| Norway – 0.8% | | | | |
| Statoil ASA | | 242,400 | | 5,421,027 |
| Singapore – 1.1% | | | | |
| STATS ChipPAC Ltd. sponsored ADR (a)(d) | | 1,305,700 | | 7,324,977 |
| Switzerland – 12.8% | | | | |
| ABB Ltd. sponsored ADR (a) | | 837,000 | | 6,520,230 |
| Credit Suisse Group (Reg.) | | 658,174 | | 29,163,692 |
| Novartis AG (Reg.) | | 479,785 | | 25,822,028 |
| Roche Holding AG (participation certificate) | | 156,739 | | 23,416,927 |
| TOTAL SWITZERLAND | | | | 84,922,877 |
| |
| Taiwan – 7.2% | | | | |
| Advanced Semiconductor Engineering, Inc. | | 24,431,000 | | 14,890,957 |
| AU Optronics Corp. sponsored ADR | | 1,238,342 | | 15,788,861 |
| United Microelectronics Corp. sponsored ADR (d) | | 5,893,636 | | 17,209,417 |
| TOTAL TAIWAN | | | | 47,889,235 |
| |
| United Kingdom – 7.3% | | | | |
| BP PLC | | 1,318,800 | | 14,594,709 |
| Prudential PLC | | 9,257 | | 77,684 |
| Smiths Group PLC | | 932,900 | | 15,071,332 |
| Vodafone Group PLC | | 7,188,300 | | 18,876,492 |
| TOTAL UNITED KINGDOM | | | | 48,620,217 |
| |
| United States of America – 7.1% | | | | |
| Halliburton Co. | | 317,900 | | 18,787,890 |
| Lyondell Chemical Co. | | 457,900 | | 12,271,720 |
See accompanying notes which are an integral part of the financial statements.
| Common Stocks – continued | | | | |
| | | Shares | | Value (Note 1) |
| United States of America – continued | | | | |
| NTL, Inc. (a) | | 96,900 | | $ 5,941,908 |
| Synthes, Inc. | | 93,856 | | 9,937,823 |
| TOTAL UNITED STATES OF AMERICA | | | | 46,939,341 |
| |
| TOTAL COMMON STOCKS | | | | |
| (Cost $607,423,666) | | | | 639,334,347 |
| Money Market Funds — 4.6% | | | | |
| Fidelity Cash Central Fund, 3.92% (b) | | 25,387,772 | | 25,387,772 |
| Fidelity Securities Lending Cash Central Fund, | | | | |
| 3.94% (b)(c) | | 4,855,300 | | 4,855,300 |
| TOTAL MONEY MARKET FUNDS | | | | |
| (Cost $30,243,072) | | | | 30,243,072 |
| TOTAL INVESTMENT PORTFOLIO – 100.8% | | | | |
| (Cost $637,666,738) | | | | 669,577,419 |
| |
| NET OTHER ASSETS – (0.8)% | | | | (5,176,084) |
| NET ASSETS – 100% | | $ | | 664,401,335 |
(a) Non-income producing
(b) Affiliated fund that is available only to investment companies and other accounts managed by Fidelity Investments. The rate quoted is the annualized seven-day yield of the fund at period end. A complete unaudited listing of the fund’s holdings as of its most recent quarter end is available upon request.
(c) Investment made with cash collateral received from securities on loan.
(d) Security or a portion of the security is on loan at period end.
See accompanying notes which are an integral part of the financial statements.
13 Annual Report
| Financial Statements | | | | | | | | |
| |
| |
| Statement of Assets and Liabilities | | | | | | | | |
| | | | | | | | | October 31, 2005 |
| |
| Assets | | | | | | | | |
| Investment in securities, at value (including securities | | | | | | | | |
| loaned of $4,729,980) (cost $637,666,738) — See | | | | | | | | |
| accompanying schedule | | | | | | $ | | 669,577,419 |
| Cash | | | | | | | | 1,901,257 |
| Receivable for investments sold | | | | | | | | 1,449,094 |
| Receivable for fund shares sold | | | | | | | | 750,961 |
| Dividends receivable | | | | | | | | 910,624 |
| Interest receivable | | | | | | | | 56,959 |
| Other receivables | | | | | | | | 460,618 |
| Total assets | | | | | | | | 675,106,932 |
| |
| Liabilities | | | | | | | | |
| Payable for investments purchased | | $ | | 3,755,380 | | | | |
| Payable for fund shares redeemed | | | | 1,128,953 | | | | |
| Accrued management fee | | | | 399,170 | | | | |
| Distribution fees payable | | | | 218,583 | | | | |
| Other affiliated payables | | | | 224,045 | | | | |
| Other payables and accrued expenses | | | | 124,166 | | | | |
| Collateral on securities loaned, at value | | | | 4,855,300 | | | | |
| Total liabilities | | | | | | | | 10,705,597 |
| |
| Net Assets | | | | | | $ | | 664,401,335 |
| Net Assets consist of: | | | | | | | | |
| Paid in capital | | | | | | $ | | 560,690,068 |
| Undistributed net investment income | | | | | | | | 3,764,091 |
| Accumulated undistributed net realized gain (loss) on | | | | | | | | |
| investments and foreign currency transactions | | | | | | | | 68,053,870 |
| Net unrealized appreciation (depreciation) on | | | | | | | | |
| investments and assets and liabilities in foreign | | | | | | | | |
| currencies | | | | | | | | 31,893,306 |
| Net Assets | | | | | | $ | | 664,401,335 |
See accompanying notes which are an integral part of the financial statements.
| Statement of Assets and Liabilities — continued | | |
| | | October 31, 2005 |
| |
| Calculation of Maximum Offering Price | | | | |
| Class A: | | | | |
| Net Asset Value and redemption price per share | | | | |
| ($113,809,447 ÷ 6,547,241 shares) | | $ | | 17.38 |
| Maximum offering price per share | | | | |
| (100/94.25 of $17.38) | | $ | | 18.44 |
| Class T: | | | | |
| Net Asset Value and redemption price per share | | | | |
| ($216,718,022 ÷ 12,612,033 shares) | | $ | | 17.18 |
| Maximum offering price per share | | | | |
| (100/96.50 of $17.18) | | $ | | 17.80 |
| Class B: | | | | |
| Net Asset Value and offering price per share | | | | |
| ($57,167,629 ÷ 3,473,760 shares)A | | $ | | 16.46 |
| Class C: | | | | |
| Net Asset Value and offering price per share | | | | |
| ($67,428,603 ÷ 4,081,225 shares)A | | $ | | 16.52 |
| Institutional Class: | | | | |
| Net Asset Value, offering price and redemption price | | |
| per share ($209,277,634 ÷ 11,823,732 shares) | | $ | | 17.70 |
| A Redemption price per share is equal to net asset value less any applicable contingent deferred sales charge. | | |
See accompanying notes which are an integral part of the financial statements.
15 Annual Report
| Financial Statements - continued | | | | | | |
| |
| |
| Statement of Operations | | | | | | |
| | | | | Year ended October 31, 2005 |
| |
| Investment Income | | | | | | |
| Dividends | | | | | | $ 14,273,837 |
| Interest | | | | | | 807,712 |
| Security lending | | | | | | 528,125 |
| | | | | | | 15,609,674 |
| Less foreign taxes withheld | | | | | | (1,748,408) |
| Total income | | | | | | 13,861,266 |
| |
| Expenses | | | | | | |
| Management fee | | $ | | 4,979,462 | | |
| Transfer agent fees | | | | 2,329,324 | | |
| Distribution fees | | | | 2,748,747 | | |
| Accounting and security lending fees | | | | 364,419 | | |
| Independent trustees’ compensation | | | | 3,246 | | |
| Custodian fees and expenses | | | | 384,860 | | |
| Registration fees | | | | 89,674 | | |
| Audit | | | | 80,541 | | |
| Legal | | | | 4,799 | | |
| Interest | | | | 8,077 | | |
| Miscellaneous | | | | 32,104 | | |
| Total expenses before reductions | | | | 11,025,253 | | |
| Expense reductions | | | | (928,077) | | 10,097,176 |
| |
| Net investment income (loss) | | | | | | 3,764,090 |
| Realized and Unrealized Gain (Loss) | | | | | | |
| Net realized gain (loss) on: | | | | | | |
| Investment securities | | | | 110,918,480 | | |
| Foreign currency transactions | | | | (251,907) | | |
| Futures contracts | | | | 179,560 | | |
| Total net realized gain (loss) | | | | | | 110,846,133 |
| Change in net unrealized appreciation (depreciation) on: | | | | | | |
| Investment securities | | | | (32,677,370) | | |
| Assets and liabilities in foreign currencies | | | | (48,254) | | |
| Total change in net unrealized appreciation | | | | | | |
| (depreciation) | | | | | | (32,725,624) |
| Net gain (loss) | | | | | | 78,120,509 |
| Net increase (decrease) in net assets resulting from | | | | | | |
| operations | | | | | | $ 81,884,599 |
See accompanying notes which are an integral part of the financial statements.
| Statement of Changes in Net Assets | | | | | | | | |
| | | | | Year ended | | | | Year ended |
| | | | | October 31, | | | | October 31, |
| | | | | 2005 | | | | 2004 |
| Increase (Decrease) in Net Assets | | | | | | | | |
| Operations | | | | | | | | |
| Net investment income (loss) | | $ | | 3,764,090 | | $ | | (436,853) |
| Net realized gain (loss) | | | | 110,846,133 | | | | 34,181,956 |
| Change in net unrealized appreciation (depreciation) . | | | | (32,725,624) | | | | (3,598,614) |
| Net increase (decrease) in net assets resulting | | | | | | | | |
| from operations | | | | 81,884,599 | | | | 30,146,489 |
| Distributions to shareholders from net investment income . | | | | — | | | | (685,316) |
| Share transactions -- net increase (decrease) | | | | (84,263,684) | | | | 90,343,050 |
| Redemption fees | | | | 29,871 | | | | 23,611 |
| Total increase (decrease) in net assets | | | | (2,349,214) | | | | 119,827,834 |
| |
| Net Assets | | | | | | | | |
| Beginning of period | | | | 666,750,549 | | | | 546,922,715 |
| End of period (including undistributed net investment | | | | | | | | |
| income of $3,764,091 and accumulated net invest- | | | | | | | | |
| ment loss of $29,120, respectively) | | $ | | 664,401,335 | | $ | | 666,750,549 |
See accompanying notes which are an integral part of the financial statements.
17 Annual Report
| Financial Highlights — Class A | | | | | | | | |
| Years ended October 31, | | 2005 | | 2004 | | 2003 | | 2002 | | 2001 |
| Selected Per-Share Data | | | | | | | | | | |
| Net asset value, beginning of | | | | | | | | | | |
| period | | $ 15.40 | | $ 14.47 | | $ 10.93 | | $ 11.08 | | $ 15.26 |
| Income from Investment | | | | | | | | | | |
| Operations | | | | | | | | | | |
| Net investment income (loss)C | | 12 | | .01 | | —E | | —E | | (.01) |
| Net realized and unrealized | | | | | | | | | | |
| gain (loss) | | 1.86 | | .92 | | 3.54 | | (.15) | | (3.73) |
| Total from investment operations | | 1.98 | | .93 | | 3.54 | | (.15) | | (3.74) |
| Distributions from net investment | | | | | | | | | | |
| income | | — | | — | | — | | — | | (.44) |
| Redemption fees added to paid in | | | | | | | | | | |
| capitalC | | —E | | —E | | — | | — | | — |
| Net asset value, end of period | | $ 17.38 | | $ 15.40 | | $ 14.47 | | $ 10.93 | | $ 11.08 |
| Total ReturnA,B | | 12.86% | | 6.43% | | 32.39% | | (1.35)% | | (25.17)% |
| Ratios to Average Net AssetsD | | | | | | | | | | |
| Expenses before expense | | | | | | | | | | |
| reductions | | 1.44% | | 1.48% | | 1.59% | | 1.67% | | 1.71% |
| Expenses net of voluntary waiv- | | | | | | | | | | |
| ers, if any | | 1.44% | | 1.48% | | 1.59% | | 1.67% | | 1.70% |
| Expenses net of all reductions | | 1.30% | | 1.40% | | 1.54% | | 1.57% | | 1.57% |
| Net investment income (loss) | | 71% | | .06% | | .01% | | (.02)% | | (.05)% |
| Supplemental Data | | | | | | | | | | |
| Net assets, end of period (000 | | | | | | | | | | |
| omitted) | | $113,809 | | $103,606 | | $41,867 | | $16,879 | | $12,070 |
| Portfolio turnover rate | | 176% | | 170% | | 205% | | 193% | | 270% |
A Total returns would have been lower had certain expenses not been reduced during the periods shown.
B Total returns do not include the effect of the sales charges.
C Calculated based on average shares outstanding during the period.
D Expense ratios reflect operating expenses of the class. Expenses before reductions do not reflect amounts reimbursed by the investment adviser or reductions from brokerage service arrangements or other expense offset arrangements and do not represent the amount paid by the class during periods when reimbursements or reductions occur. Expenses net of any voluntary waivers reflect expenses after reimbursement by the investment adviser but prior to reductions from brokerage service arrangements or other expense offset arrangements. Expenses net of all reductions repre sent the net expenses paid by the class.
E Amount represents less than $.01 per share.
See accompanying notes which are an integral part of the financial statements.
| Financial Highlights — Class T | | | | | | | | |
| Years ended October 31, | | 2005 | | 2004 | | 2003 | | 2002 | | 2001 |
| Selected Per-Share Data | | | | | | | | | | |
| Net asset value, beginning of | | | | | | | | | | |
| period | | $ 15.26 | | $ 14.38 | | $ 10.88 | | $ 11.05 | | $ 15.21 |
| Income from Investment | | | | | | | | | | |
| Operations | | | | | | | | | | |
| Net investment income (loss)C | | 08 | | (.03) | | (.03) | | (.03) | | (.03) |
| Net realized and unrealized | | | | | | | | | | |
| gain (loss) | | 1.84 | | .91 | | 3.53 | | (.14) | | (3.73) |
| Total from investment operations | | 1.92 | | .88 | | 3.50 | | (.17) | | (3.76) |
| Distributions from net investment | | | | | | | | | | |
| income | | — | | — | | — | | — | | (.40) |
| Redemption fees added to paid in | | | | | | | | | | |
| capitalC | | —E | | —E | | — | | — | | — |
| Net asset value, end of period | | $ 17.18 | | $ 15.26 | | $ 14.38 | | $ 10.88 | | $ 11.05 |
| Total ReturnA,B | | 12.58% | | 6.12% | | 32.17% | | (1.54)% | | (25.32)% |
| Ratios to Average Net AssetsD | | | | | | | | | | |
| Expenses before expense | | | | | | | | | | |
| reductions | | 1.67% | | 1.74% | | 1.85% | | 1.86% | | 1.87% |
| Expenses net of voluntary waiv- | | | | | | | | | | |
| ers, if any | | 1.67% | | 1.74% | | 1.85% | | 1.86% | | 1.87% |
| Expenses net of all reductions | | 1.53% | | 1.66% | | 1.79% | | 1.76% | | 1.73% |
| Net investment income (loss) | | 47% | | (.20)% | | (.24)% | | (.21)% | | (.22)% |
| Supplemental Data | | | | | | | | | | |
| Net assets, end of period (000 | | | | | | | | | | |
| omitted) | | $216,717 | | $216,588 | | $149,514 | | $98,148 | | $88,818 |
| Portfolio turnover rate | | 176% | | 170% | | 205% | | 193% | | 270% |
A Total returns would have been lower had certain expenses not been reduced during the periods shown.
B Total returns do not include the effect of the sales charges.
C Calculated based on average shares outstanding during the period.
D Expense ratios reflect operating expenses of the class. Expenses before reductions do not reflect amounts reimbursed by the investment adviser or reductions from brokerage service arrangements or other expense offset arrangements and do not represent the amount paid by the class during periods when reimbursements or reductions occur. Expenses net of any voluntary waivers reflect expenses after reimbursement by the investment adviser but prior to reductions from brokerage service arrangements or other expense offset arrangements. Expenses net of all reductions repre sent the net expenses paid by the class.
E Amount represents less than $.01 per share.
See accompanying notes which are an integral part of the financial statements.
19 Annual Report
| Financial Highlights — Class B | | | | | | | | |
| Years ended October 31, | | 2005 | | 2004 | | 2003 | | 2002 | | 2001 |
| Selected Per-Share Data | | | | | | | | | | |
| Net asset value, beginning of | | | | | | | | | | |
| period | | $ 14.70 | | $ 13.94 | | $ 10.61 | | $ 10.84 | | $ 14.96 |
| Income from Investment | | | | | | | | | | |
| Operations | | | | | | | | | | |
| Net investment income (loss)C | | (.02) | | (.12) | | (.09) | | (.09) | | (.10) |
| Net realized and unrealized | | | | | | | | | | |
| gain (loss) | | 1.78 | | .88 | | 3.42 | | (.14) | | (3.67) |
| Total from investment operations | | 1.76 | | .76 | | 3.33 | | (.23) | | (3.77) |
| Distributions from net investment | | | | | | | | | | |
| income | | — | | — | | — | | — | | (.35) |
| Redemption fees added to paid in | | | | | | | | | | |
| capitalC | | —E | | —E | | — | | — | | — |
| Net asset value, end of period | | $ 16.46 | | $ 14.70 | | $ 13.94 | | $ 10.61 | | $ 10.84 |
| Total ReturnA,B | | 11.97% | | 5.45% | | 31.39% | | (2.12)% | | (25.75)% |
| Ratios to Average Net AssetsD | | | | | | | | | | |
| Expenses before expense | | | | | | | | | | |
| reductions | | 2.27% | | 2.35% | | 2.42% | | 2.44% | | 2.47% |
| Expenses net of voluntary waiv- | | | | | | | | | | |
| ers, if any | | 2.27% | | 2.35% | | 2.42% | | 2.44% | | 2.45% |
| Expenses net of all reductions | | 2.13% | | 2.27% | | 2.37% | | 2.34% | | 2.32% |
| Net investment income (loss) | | (.13)% | | (.80)% | | (.82)% | | (.79)% | | (.80)% |
| Supplemental Data | | | | | | | | | | |
| Net assets, end of period (000 | | | | | | | | | | |
| omitted) | | $57,168 | | $59,985 | | $50,358 | | $36,981 | | $36,593 |
| Portfolio turnover rate | | 176% | | 170% | | 205% | | 193% | | 270% |
A Total returns would have been lower had certain expenses not been reduced during the periods shown.
B Total returns do not include the effect of the contingent deferred sales charge.
C Calculated based on average shares outstanding during the period.
D Expense ratios reflect operating expenses of the class. Expenses before reductions do not reflect amounts reimbursed by the investment adviser or reductions from brokerage service arrangements or other expense offset arrangements and do not represent the amount paid by the class during periods when reimbursements or reductions occur. Expenses net of any voluntary waivers reflect expenses after reimbursement by the investment adviser but prior to reductions from brokerage service arrangements or other expense offset arrangements. Expenses net of all reductions repre sent the net expenses paid by the class.
E Amount represents less than $.01 per share.
See accompanying notes which are an integral part of the financial statements.
| Financial Highlights — Class C | | | | | | | | |
| Years ended October 31, | | 2005 | | 2004 | | 2003 | | 2002 | | 2001 |
| Selected Per-Share Data | | | | | | | | | | |
| Net asset value, beginning of | | | | | | | | | | |
| period | | $ 14.74 | | $ 13.96 | | $ 10.62 | | $ 10.83 | | $ 14.96 |
| Income from Investment | | | | | | | | | | |
| Operations | | | | | | | | | | |
| Net investment income (loss)C | | —E | | (.10) | | (.08) | | (.08) | | (.09) |
| Net realized and unrealized | | | | | | | | | | |
| gain (loss) | | 1.78 | | .88 | | 3.42 | | (.13) | | (3.67) |
| Total from investment operations | | 1.78 | | .78 | | 3.34 | | (.21) | | (3.76) |
| Distributions from net investment | | | | | | | | | | |
| income | | — | | — | | — | | — | | (.37) |
| Redemption fees added to paid in | | | | | | | | | | |
| capitalC | | —E | | —E | | — | | — | | — |
| Net asset value, end of period | | $ 16.52 | | $ 14.74 | | $ 13.96 | | $ 10.62 | | $ 10.83 |
| Total ReturnA,B | | 12.08% | | 5.59% | | 31.45% | | (1.94)% | | (25.71)% |
| Ratios to Average Net AssetsD | | | | | | | | | | |
| Expenses before expense | | | | | | | | | | |
| reductions | | 2.17% | | 2.21% | | 2.33% | | 2.34% | | 2.38% |
| Expenses net of voluntary waiv- | | | | | | | | | | |
| ers, if any | | 2.17% | | 2.21% | | 2.33% | | 2.34% | | 2.38% |
| Expenses net of all reductions | | 2.04% | | 2.12% | | 2.28% | | 2.24% | | 2.24% |
| Net investment income (loss) | | (.03)% | | (.66)% | | (.73)% | | (.69)% | | (.73)% |
| Supplemental Data | | | | | | | | | | |
| Net assets, end of period (000 | | | | | | | | | | |
| omitted) | | $67,429 | | $76,412 | | $58,560 | | $37,514 | | $33,118 |
| Portfolio turnover rate | | 176% | | 170% | | 205% | | 193% | | 270% |
A Total returns would have been lower had certain expenses not been reduced during the periods shown.
B Total returns do not include the effect of the contingent deferred sales charge.
C Calculated based on average shares outstanding during the period.
D Expense ratios reflect operating expenses of the class. Expenses before reductions do not reflect amounts reimbursed by the investment adviser or reductions from brokerage service arrangements or other expense offset arrangements and do not represent the amount paid by the class during periods when reimbursements or reductions occur. Expenses net of any voluntary waivers reflect expenses after reimbursement by the investment adviser but prior to reductions from brokerage service arrangements or other expense offset arrangements. Expenses net of all reductions repre sent the net expenses paid by the class.
E Amount represents less than $.01 per share.
See accompanying notes which are an integral part of the financial statements.
21 Annual Report
| Financial Highlights — Institutional Class | | | | | | |
| Years ended October 31, | | 2005 | | 2004 | | 2003 | | 2002 | | 2001 |
| Selected Per-Share Data | | | | | | | | | | |
| Net asset value, beginning of | | | | | | | | | | |
| period | | $ 15.65 | | $ 14.70 | | $ 11.08 | | $ 11.17 | | $ 15.35 |
| Income from Investment | | | | | | | | | | |
| Operations | | | | | | | | | | |
| Net investment income (loss)B | | 16 | | .05 | | .04 | | .06 | | .06 |
| Net realized and unrealized | | | | | | | | | | |
| gain (loss) | | 1.89 | | .94 | | 3.58 | | (.15) | | (3.75) |
| Total from investment operations | | 2.05 | | .99 | | 3.62 | | (.09) | | (3.69) |
| Distributions from net investment | | | | | | | | | | |
| income | | — | | (.04) | | — | | — | | (.49) |
| Redemption fees added to paid in | | | | | | | | | | |
| capitalB | | —D | | —D | | — | | — | | — |
| Net asset value, end of period | | $ 17.70 | | $ 15.65 | | $ 14.70 | | $ 11.08 | | $ 11.17 |
| Total ReturnA | | 13.10% | | 6.75% | | 32.67% | | (.81)% | | (24.75)% |
| Ratios to Average Net AssetsC | | | | | | | | | | |
| Expenses before expense | | | | | | | | | | |
| reductions | | 1.23% | | 1.21% | | 1.28% | | 1.15% | | 1.19% |
| Expenses net of voluntary waiv- | | | | | | | | | | |
| ers, if any | | 1.23% | | 1.21% | | 1.28% | | 1.15% | | 1.19% |
| Expenses net of all reductions | | 1.09% | | 1.13% | | 1.22% | | 1.06% | | 1.05% |
| Net investment income (loss) | | 92% | | .34% | | .33% | | .50% | | .46% |
| Supplemental Data | | | | | | | | | | |
| Net assets, end of period (000 | | | | | | | | | | |
| omitted) | | $209,278 | | $210,160 | | $246,623 | | $10,577 | | $ 6,432 |
| Portfolio turnover rate | | 176% | | 170% | | 205% | | 193% | | 270% |
A Total returns would have been lower had certain expenses not been reduced during the periods shown.
B Calculated based on average shares outstanding during the period.
C Expense ratios reflect operating expenses of the class. Expenses before reductions do not reflect amounts reimbursed by the investment adviser or reductions from brokerage service arrangements or other expense offset arrangements and do not represent the amount paid by the class during periods when reimbursements or reductions occur. Expenses net of any voluntary waivers reflect expenses after reimbursement by the investment adviser but prior to reductions from brokerage service arrangements or other expense offset arrangements. Expenses net of all reductions repre sent the net expenses paid by the class.
D Amount represents less than $.01 per share.
See accompanying notes which are an integral part of the financial statements.
Notes to Financial Statements
For the period ended October 31, 2005
|
1. Significant Accounting Policies.
Fidelity Advisor International Capital Appreciation Fund (the fund) is a fund of Fidelity Advisor Series VIII (the trust) and is authorized to issue an unlimited number of shares. The trust is registered under the Investment Company Act of 1940, as amended (the 1940 Act), as an open-end management investment company organized as a Massachusetts business trust.
The fund offers Class A, Class T, Class B, Class C, and Institutional Class shares, each of which has equal rights as to assets and voting privileges. Each class has exclusive voting rights with respect to matters that affect that class. Class B shares will automatically convert to Class A shares after a holding period of seven years from the initial date of purchase. Investment income, realized and unrealized capital gains and losses, the common expenses of the fund, and certain fund-level expense reductions, if any, are allocated on a pro rata basis to each class based on the relative net assets of each class to the total net assets of the fund. Each class differs with respect to transfer agent and distribution and service plan fees incurred. Certain expense reductions also differ by class.
The fund’s investments in emerging markets can be subject to social, economic, regulatory, and political uncertainties and can be extremely volatile.
The fund may invest in affiliated money market central funds (Money Market Central Funds), collectively referred to as Central Funds, which are open-end investment companies available to investment companies and other accounts managed by Fidelity Management & Research Company (FMR) and its affiliates. The financial statements have been prepared in conformity with accounting principles generally accepted in the United States of America, which require management to make certain estimates and assumptions at the date of the financial statements. The following summarizes the significant accounting policies of the fund:
Security Valuation. Investments are valued and net asset value (NAV) per share is calculated (NAV calculation) as of the close of business of the New York Stock Exchange (NYSE), normally 4:00 p.m. Eastern time. Wherever possible, the fund uses independent pricing services approved by the Board of Trustees to value its investments.
Equity securities, including restricted securities, for which market quotations are readily available, are valued at the last reported sale price or official closing price as reported by an independent pricing service on the primary market or exchange on which they are traded. In the event there were no sales during the day or closing prices are not available, securities are valued at the last quoted bid price. Investments in open-end mutual funds, are valued at their closing net asset value each business day. Short-term securities with remaining maturities of sixty days or less for which quotations are not readily available are valued at amortized cost, which approximates value.
23 Annual Report
Notes to Financial Statements - continued
1. Significant Accounting Policies - continued
Security Valuation - continued
When current market prices or quotations are not readily available or do not accurately reflect fair value, valuations may be determined in accordance with procedures adopted by the Board of Trustees. For example, when developments occur between the close of a market and the close of the NYSE that may materially affect the value of some or all of the securities, or when trading in a security is halted, those securities may be fair valued. Factors used in the determination of fair value may include monitoring news to identify significant market or security specific events such as changes in the value of U.S. securities market, reviewing developments in foreign markets and evaluating the performance of ADRs, futures contracts and exchange-traded funds. Because the fund’s utilization of fair value pricing depends on market activity, the frequency with which fair value pricing is used can not be predicted and may be utilized to a significant extent. The value of securities used for NAV calculation under fair value pricing may differ from published prices for the same securities.
Foreign Currency. The fund uses foreign currency contracts to facilitate transactions in foreign-denominated securities. Losses from these transactions may arise from changes in the value of the foreign currency or if the counterparties do not perform under the contracts’ terms.
Foreign-denominated assets, including investment securities, and liabilities are translated into U.S. dollars at the exchange rate at period end. Purchases and sales of investment securities, income and dividends received and expenses denominated in foreign currencies are translated into U.S. dollars at the exchange rate in effect on the transaction date.
The effects of exchange rate fluctuations on investments are included with the net realized and unrealized gain (loss) on investment securities. Other foreign currency transactions resulting in realized and unrealized gain (loss) are disclosed separately.
Investment Transactions and Income. Security transactions are accounted for as of trade date. Gains and losses on securities sold are determined on the basis of identified cost. Dividend income is recorded on the ex-dividend date, except for certain dividends from foreign securities where the ex-dividend date may have passed, which are recorded as soon as the fund is informed of the ex-dividend date. Non-cash dividends included in dividend income, if any, are recorded at the fair market value of the securities received. Interest income is accrued as earned. Interest income includes coupon interest and amortization of premium and accretion of discount on debt securities. Investment income is recorded net of foreign taxes withheld where recovery of such taxes is uncertain.
1. Significant Accounting Policies - continued
Expenses. Most expenses of the trust can be directly attributed to a fund. Expenses which cannot be directly attributed are apportioned among each fund in the trust.
Income Tax Information and Distributions to Shareholders. Each year, the fund intends to qualify as a regulated investment company by distributing all of its taxable income and realized gains under Subchapter M of the Internal Revenue Code. As a result, no provision for income taxes is required in the accompanying financial statements. Foreign taxes are provided for based on the fund’s understanding of the tax rules and rates that exist in the foreign markets in which it invests.
Distributions are recorded on the ex-dividend date. Income dividends and capital gain distributions are declared separately for each class. Income and capital gain distributions are determined in accordance with income tax regulations, which may differ from generally accepted accounting principles. In addition, the fund will claim a portion of the payment made to redeeming shareholders as a distribution for income tax purposes.
Capital accounts within the financial statements are adjusted for permanent book-tax differences. These adjustments have no impact on net assets or the results of operations. Temporary book-tax differences will reverse in a subsequent period.
Book-tax differences are primarily due to futures transactions, foreign currency transactions, passive foreign investment companies (PFIC), capital loss carryforwards, and losses deferred due to wash sales.
The tax-basis components of distributable earnings and the federal tax cost as of period end were as follows:
| Unrealized appreciation | | $ | | 58,769,282 | | | | |
| Unrealized depreciation | | | | (27,174,204) | | | | |
| Net unrealized appreciation (depreciation) | | | | 31,595,078 | | | | |
| Undistributed ordinary income | | | | 3,533,555 | | | | |
| Undistributed long-term capital gain | | | | 64,165,782 | | | | |
| |
| Cost for federal income tax purposes | | $ | | 637,982,341 | | | | |
| |
| The tax character of distributions paid was as follows: | | | | |
| | | | | October 31, 2005 | | | | October 31, 2004 |
| Ordinary Income | | $ | | — | | $ | | 685,316 |
Short-Term Trading (Redemption) Fees. Shares held in the fund less than 30 days are subject to a redemption fee equal to 1.00% of the proceeds of the redeemed shares. All redemption fees, including any estimated redemption fees paid by FMR, are retained by the fund and accounted for as an addition to paid in capital.
25 Annual Report
Notes to Financial Statements - continued
2. Operating Policies.
Repurchase Agreements. FMR has received an Exemptive Order from the Securities and Exchange Commission (the SEC) which permits the fund and other affiliated entities of FMR to transfer uninvested cash balances into joint trading accounts which are then invested in repurchase agreements. The fund may also invest directly with institutions in repurchase agreements. Repurchase agreements are collateralized by government or non-government securities. Collateral is held in segregated accounts with custodian banks and may be obtained in the event of a default of the counterparty. The fund monitors, on a daily basis, the value of the collateral to ensure it is at least equal to the principal amount of the repurchase agreement (including accrued interest). In the event of a default by the counterparty, realization of the collateral proceeds could be delayed, during which time the value of the collateral may decline.
Futures Contracts. The fund may use futures contracts to manage its exposure to the stock market. Buying futures tends to increase a fund’s exposure to the underlying instrument, while selling futures tends to decrease a fund’s exposure to the underlying instrument or hedge other fund investments. Losses may arise from changes in the value of the underlying instruments or if the counterparties do not perform under the contracts’ terms. Gains (losses) are realized upon the expiration or closing of the futures contracts. Futures contracts are valued at the settlement price established each day by the board of trade or exchange on which they are traded.
3. Purchases and Sales of Investments.
Purchases and sales of securities, other than short-term securities and U.S. government securities, aggregated $1,159,090,370 and $1,226,136,513, respectively.
4. Fees and Other Transactions with Affiliates.
Management Fee. FMR and its affiliates provide the fund with investment management related services for which the fund pays a monthly management fee. The management fee is the sum of an individual fund fee rate that is based on an annual rate of .45% of the fund’s average net assets and a group fee rate that averaged .27% during the period. The group fee rate is based upon the average net assets of all the mutual funds advised by FMR. The group fee rate decreases as assets under management increase and increases as assets under management decrease. For the period, the total annual management fee rate was .72% of the fund’s average net assets.
4. Fees and Other Transactions with Affiliates - continued
Distribution and Service Plan. In accordance with Rule 12b-1 of the 1940 Act, the fund has adopted separate Distribution and Service Plans for each class of shares. Certain classes pay Fidelity Distributors Corporation (FDC), an affiliate of FMR, separate Distribution and Service Fees, each of which is based on an annual percentage of each class’ average net assets. In addition, FDC may pay financial intermediaries for selling shares of the fund and providing shareholder support services. For the period, the Distribution and Service Fee rates and the total amounts paid to and retained by FDC were as follows:
| | | Distribution | | Service | | | | Paid to | | | | Retained |
| | | Fee | | Fee | | | | FDC | | | | by FDC |
| Class A | | 0% | | .25% | | $ | | 284,587 | | $ | | 590 |
| Class T | | 25% | | .25% | | | | 1,128,660 | | | | 8,598 |
| Class B | | 75% | | .25% | | | | 609,458 | | | | 457,288 |
| Class C | | 75% | | .25% | | | | 726,042 | | | | 144,254 |
| | | | | | | $ | | 2,748,747 | | $ | | 610,730 |
Sales Load. FDC receives a front-end sales charge of up to 5.75% for selling Class A shares, and 3.50% for selling Class T shares, some of which is paid to financial intermediaries for selling shares of the fund. FDC receives the proceeds of contingent deferred sales charges levied on Class A, Class T, Class B, and Class C redemptions. These charges depend on the holding period. The deferred sales charges range from 5% to 1% for Class B, 1% for Class C, and .25% for certain purchases of Class A and Class T shares.
| For the period, sales charge amounts retained by FDC were as follows: | | |
| | | | | Retained |
| | | | | by FDC |
| Class A | | $ | | 44,600 |
| Class T | | | | 17,578 |
| Class B* | | | | 120,592 |
| Class C* | | | | 10,998 |
| | | $ | | 193,768 |
* When Class B and Class C shares are initially sold, FDC pays commissions from its own resources to financial intermediaries through which the sales are made.
Transfer Agent Fees. Fidelity Investments Institutional Operations Company, Inc. (FIIOC), an affiliate of FMR, is the transfer, dividend disbursing and shareholder servicing agent for each class of the fund. FIIOC receives account fees and asset-based fees that vary according to the account size and type of account of the shareholders of the respective classes of the fund. FIIOC pays for typesetting, printing and mailing of
27 Annual Report
Notes to Financial Statements - continued
4. Fees and Other Transactions with Affiliates - continued
Transfer Agent Fees - continued
shareholder reports, except proxy statements. For the period the total transfer agent fees paid by each class to FIIOC, were as follows:
| | | | | | | % of |
| | | | | | | Average |
| | | | | Amount | | Net Assets |
| Class A | | $ | | 369,631 | | .32 |
| Class T | | | | 692,894 | | .31 |
| Class B | | | | 247,896 | | .41 |
| Class C | | | | 225,747 | | .31 |
| Institutional Class | | | | 793,156 | | .37 |
| | | $ | | 2,329,324 | | |
Accounting and Security Lending Fees. Fidelity Service Company, Inc. (FSC), an affiliate of FMR, maintains the fund’s accounting records. The accounting fee is based on the level of average net assets for the month. Under a separate contract, FSC administers the security lending program. The security lending fee is based on the number and duration of lending transactions.
Affiliated Central Funds. The fund may invest in Money Market Central Funds which seek preservation of capital and current income and are managed by Fidelity Investments Money Management, Inc. (FIMM).
The Money Market Central Funds do not pay a management fee. Income distributions earned by the fund are recorded as income in the accompanying financial statements and totaled $1,493,623 for the period.
Brokerage Commissions. The fund placed a portion of its portfolio transactions with brokerage firms which are affiliates of the investment adviser. The commissions paid to these affiliated firms were $1,463 for the period.
Interfund Lending Program. Pursuant to an Exemptive Order issued by the SEC, the fund, along with other registered investment companies having management contracts with FMR, may participate in an interfund lending program. This program provides an alternative credit facility allowing the funds to borrow from, or lend money to, other participating affiliated funds. At period end, there were no interfund loans outstanding. The fund’s activity in this program during the period for which loans were outstanding was as follows:
| | | | | | | | | Interest Earned | | | | |
| Borrower | | | | Average Daily | | Weighted Average | | (included in | | | | |
| or Lender | | | | Loan Balance | | Interest Rate | | interest income) | | | | Interest Expense |
| Borrower | | $ | | 9,882,250 | | 3.68% | | — | | $ | | 8,077 |
Annual Report 28
5. Committed Line of Credit.
The fund participates with other funds managed by FMR in a $4.2 billion credit facility (the “line of credit”) to be utilized for temporary or emergency purposes to fund shareholder redemptions or for other short-term liquidity purposes. The fund has agreed to pay commitment fees on its pro rata portion of the line of credit. During the period, there were no borrowings on this line of credit.
6. Security Lending.
The fund lends portfolio securities from time to time in order to earn additional income. The fund receives collateral (in the form of U.S. Treasury obligations, letters of credit and/or cash) against the loaned securities and maintains collateral in an amount not less than 100% of the market value of the loaned securities during the period of the loan. The market value of the loaned securities is determined at the close of business of the fund and any additional required collateral is delivered to the fund on the next business day. If the borrower defaults on its obligation to return the securities loaned because of insolvency or other reasons, a fund could experience delays and costs in recovering the securities loaned or in gaining access to the collateral. Cash collateral is invested in the Fidelity Securities Lending Cash Central Fund. The value of loaned securities and cash collateral at period end are disclosed on the fund’s Statement of Assets and Liabilities. Security lending income represents the income earned on investing cash collateral, less fees and expenses associated with the loan, plus any premium payments that may be received on the loan of certain types of securities.
7. Expense Reductions.
Many of the brokers with whom FMR places trades on behalf of the fund provided services to the fund in addition to trade execution. These services included payments of certain expenses on behalf of the fund totaling $925,392 for the period. In addition, through arrangements with the fund’s custodian and each class’ transfer agent, credits realized as a result of uninvested cash balances were used to reduce the fund’s expenses. During the period, these credits reduced the fund’s custody expenses by $1,620. During the period, credits reduced each class’ transfer agent expense as noted in the table below.
| | | | | Transfer Agent |
| | | | | expense reduction |
| Class A | | $ | | 1,065 |
29 Annual Report
Notes to Financial Statements - continued
8. Other.
The fund’s organizational documents provide former and current trustees and officers with a limited indemnification against liabilities arising in connection with the performance of their duties to the fund. In the normal course of business, the fund may also enter into contracts that provide general indemnifications. The fund’s maximum exposure under these arrangements is unknown as this would be dependent on future claims that may be made against the fund. The risk of material loss from such claims is considered remote.
| 9. Distributions to Shareholders. | | | | |
| |
| Distributions to shareholders of each class were as follows: | | |
| Years ended October 31, | | | | 2005 | | 2004 |
| From net investment income | | | | | | | | |
| Institutional Class | | | | $ | | — $ | | 685,316 |
| |
| |
| 10. Share Transactions. | | | | | | |
| |
| Transactions for each class of shares were as follows: | | | | |
| | | Shares | | Dollars |
| |
| Years ended October 31, | | 2005 | | 2004 | | 2005 | | 2004 |
| Class A | | | | | | | | |
| Shares sold | | 2,413,647 | | 5,249,748 | | $ 40,570,088 | | $ 80,046,295 |
| Shares redeemed | | (2,595,681) | | (1,414,042) | | (44,108,820) | | (21,259,668) |
| Net increase (decrease) . | | (182,034) | | 3,835,706 | | $ (3,538,732) | | $ 58,786,627 |
| Class T | | | | | | | | |
| Shares sold | | 3,577,874 | | 8,003,545 | | $ 59,209,564 | | $120,756,817 |
| Shares redeemed | | (5,161,647) | | (4,207,826) | | (85,999,758) | | (62,846,915) |
| Net increase (decrease) . | | (1,583,773) | | 3,795,719 | | $(26,790,194) | | $ 57,909,902 |
| Class B | | | | | | | | |
| Shares sold | | 402,612 | | 1,312,192 | | $ 6,401,315 | | $ 19,341,976 |
| Shares redeemed | | (1,009,638) | | (845,208) | | (16,178,942) | | (12,224,749) |
| Net increase (decrease) . | | (607,026) | | 466,984 | | $ (9,777,627) | | $ 7,117,227 |
| Class C | | | | | | | | |
| Shares sold | | 752,388 | | 2,272,253 | | $ 12,070,200 | | $ 33,251,399 |
| Shares redeemed | | (1,854,211) | | (1,285,361) | | (29,608,554) | | (18,413,064) |
| Net increase (decrease) . | | (1,101,823) | | 986,892 | | $(17,538,354) | | $ 14,838,335 |
| Institutional Class | | | | | | | | |
| Shares sold | | 3,829,749 | | 5,209,049 | | $ 65,566,743 | | $ 80,240,442 |
| Reinvestment of | | | | | | | | |
| distributions | | — | | 44,895 | | — | | 666,234 |
| Shares redeemed | | (5,438,810) | | (8,593,689) | | (92,185,520) | | (129,215,717) |
| Net increase (decrease) . | | (1,609,061) | | (3,339,745) | | $(26,618,777) | | $(48,309,041) |
Annual Report 30
Report of Independent Registered Public Accounting Firm
To the Trustees of Fidelity Advisor Series VIII and Shareholders of Fidelity Advisor International Capital Appreciation Fund:
We have audited the accompanying statement of assets and liabilities of Fidelity Advisor International Capital Appreciation Fund (the Fund), a fund of Fidelity Advisor Series VIII, including the schedule of investments, as of October 31, 2005, and the related statement of operations for the year then ended, the statement of changes in net assets for each of the two years in the period then ended, and the financial highlights for each of the five years in the period then ended. These financial statements and financial highlights are the responsibility of the Fund’s management. Our responsibility is to express an opinion on these financial statements and financial highlights based on our audits.
We conducted our audits in accordance with standards of the Public Company Accounting Oversight Board (United States). Those standards require that we plan and perform the audit to obtain reasonable assurance about whether the financial statements and financial highlights are free of material misstatement. The Fund is not required to have, nor were we engaged to perform, an audit of its internal control over financial reporting. Our audits included consideration of internal control over financial reporting as a basis for designing audit procedures that are appropriate in the circumstances, but not for the purpose of expressing an opinion on the effectiveness of the Fund’s internal control over financial reporting. Accordingly, we express no such opinion. An audit also includes examining, on a test basis, evidence supporting the amounts and disclosures in the financial statements, assessing the accounting principles used and significant estimates made by management, as well as evaluating the overall financial statement presentation. Our procedures included confirmation of securities owned as of October 31, 2005, by correspondence with the custodians and brokers; where replies were not received from brokers, we performed other auditing procedures. We believe that our audits provide a reasonable basis for our opinion.
In our opinion, the financial statements and financial highlights referred to above present fairly, in all material respects, the financial position of Fidelity Advisor International Capital Appreciation Fund as of October 31, 2005, the results of its operations for the year then ended, the changes in its net assets for each of the two years in the period then ended, and its financial highlights for each of the five years in the period then ended, in conformity with accounting principles generally accepted in the United States of America.
/s/ Deloitte & Touche LLP
DELOITTE & TOUCHE LLP
Boston, Massachusetts
December 19, 2005
|
31 Annual Report
Trustees and Officers
The Trustees, Members of the Advisory Board, and executive officers of the trust and fund, as applicable, are listed below. The Board of Trustees governs the fund and is responsible for protecting the interests of shareholders. The Trustees are experienced executives who meet periodically throughout the year to oversee the fund’s activities, review contractual arrangements with companies that provide services to the fund, and review the fund’s performance. Except for William O. McCoy, Stephen P. Jonas, and Kenneth L. Wolfe, each of the Trustees oversees 322 funds advised by FMR or an affiliate. Mr. McCoy oversees 324 funds advised by FMR or an affiliate. Mr. Jonas and Mr. Wolfe oversee 319 funds advised by FMR or an affiliate.
The Trustees hold office without limit in time except that (a) any Trustee may resign; (b) any Trustee may be removed by written instrument, signed by at least two-thirds of the number of Trustees prior to such removal; (c) any Trustee who requests to be retired or who has become incapacitated by illness or injury may be retired by written instrument signed by a majority of the other Trustees; and (d) any Trustee may be removed at any special meeting of shareholders by a two-thirds vote of the outstanding voting securities of the trust. Each Trustee who is not an interested person (as defined in the 1940 Act) (Independent Trustee), shall retire not later than the last day of the calendar year in which his or her 72nd birthday occurs. The Independent Trustees may waive this mandatory retirement age policy with respect to individual Trustees. The executive officers and Advisory Board Members hold office without limit in time, except that any officer and Advisory Board Member may resign or may be removed by a vote of a majority of the Trustees at any regular meeting or any special meeting of the Trustees. Except as indicated, each individual has held the office shown or other offices in the same company for the past five years.
The fund’s Statement of Additional Information (SAI) includes more information about the Trustees. To request a free copy, call Fidelity at 1-877-208-0098.
Interested Trustees*:
Correspondence intended for each Trustee who is an interested person may be sent to Fidelity Investments, 82 Devonshire Street, Boston, Massachusetts 02109.
| Name, Age; Principal Occupation |
| |
| Edward C. Johnson 3d (75)** |
| |
| Year of Election or Appointment: 1983 |
| Mr. Johnson is Chairman of the Board of Trustees. Mr. Johnson serves as |
| Chief Executive Officer, Chairman, and a Director of FMR Corp.; a Di- |
| rector and Chairman of the Board and of the Executive Committee of |
| FMR; Chairman and a Director of Fidelity Management & Research (Far |
| East) Inc.; Chairman and a Director of Fidelity Investments Money Man- |
| agement, Inc.; and Chairman (2001-present) and a Director |
| (2000-present) of FMR Co., Inc. |
Annual Report 32
| Name, Age; Principal Occupation |
| |
| Abigail P. Johnson (43)** |
| |
| Year of Election or Appointment: 2001 |
| Ms. Johnson serves as President of Fidelity Employer Services Company |
| (FESCO) (2005-present). She is President and a Director of Fidelity In- |
| vestments Money Management, Inc. (2001-present), FMR Co., Inc. |
| (2001-present), and a Director of FMR Corp. Previously, Ms. Johnson |
| served as President and a Director of FMR (2001-2005), Senior Vice |
| President of the Fidelity funds (2001-2005), and managed a number of |
| Fidelity funds. |
| |
| Stephen P. Jonas (52) |
| |
| Year of Election or Appointment: 2005 |
| Mr. Jonas is Senior Vice President of Advisor International Capital Ap- |
| preciation (2005-present). He also serves as Senior Vice President of |
| other Fidelity funds (2005-present). Mr. Jonas is Executive Director of |
| FMR (2005-present). Previously, Mr. Jonas served as President of Fidelity |
| Enterprise Operations and Risk Services (2004-2005), Chief Adminis- |
| trative Officer (2002-2004), and Chief Financial Officer of FMR Co. |
| (1998-2000). Mr. Jonas has been with Fidelity Investments since 1987 |
| and has held various financial and management positions including |
| Chief Financial Officer of FMR. In addition, he serves on the Boards of |
| Boston Ballet (2003-present) and Simmons College (2003-present). |
| |
| Robert L. Reynolds (53) |
| |
| Year of Election or Appointment: 2003 |
| Mr. Reynolds is a Director (2003-present) and Chief Operating Officer |
| (2002-present) of FMR Corp. He also serves on the Board at Fidelity |
| Investments Canada, Ltd. (2000-present). Previously, Mr. Reynolds |
| served as President of Fidelity Investments Institutional Retirement Group |
| (1996-2000). |
* Trustees have been determined to be “Interested Trustees” by virtue of, among other things, their affiliation with the trust or various entities under common control with FMR.
** Edward C. Johnson 3d, Trustee, is Abigail P. Johnson’s father.
33 Annual Report
Trustees and Officers - continued
Independent Trustees:
Correspondence intended for each Independent Trustee (that is, the Trustees other than the Interested Trustees) may be sent to Fidelity Investments, P.O. Box 55235, Boston, Massachusetts 02205-5235.
| Name, Age; Principal Occupation |
| |
| Dennis J. Dirks (57) |
| |
| Year of Election or Appointment: 2005 |
| Prior to his retirement in May 2003, Mr. Dirks was Chief Operating |
| Officer and a member of the Board of The Depository Trust & Clearing |
| Corporation (DTCC) (1999-2003). He also served as President, Chief |
| Operating Officer, and Board member of The Depository Trust |
| Company (DTC) (1999-2003) and President and Board member of the |
| National Securities Clearing Corporation (NSCC) (1999-2003). In addi- |
| tion, Mr. Dirks served as Chief Executive Officer and Board member of |
| the Government Securities Clearing Corporation (2001-2003) and Chief |
| Executive Officer and Board member of the Mortgage-Backed Securities |
| Clearing Corporation (2001-2003). Mr. Dirks also serves as a Trustee of |
| Manhattan College (2005-present). |
| |
| Robert M. Gates (62) |
| |
| Year of Election or Appointment: 1997 |
| Dr. Gates is Vice Chairman of the Independent Trustees (2005-present). |
| Dr. Gates is President of Texas A&M University (2002-present). He was |
| Director of the Central Intelligence Agency (CIA) from 1991 to 1993. |
| From 1989 to 1991, Dr. Gates served as Assistant to the President of |
| the United States and Deputy National Security Advisor. Dr. Gates is a |
| Director of NACCO Industries, Inc. (mining and manufacturing), Parker |
| Drilling Co., Inc. (drilling and rental tools for the energy industry, |
| 2001-present), and Brinker International (restaurant management, |
| 2003-present). Previously, Dr. Gates served as a Director of LucasVarity |
| PLC (automotive components and diesel engines), a Director of TRW Inc. |
| (automotive, space, defense, and information technology), and Dean of |
| the George Bush School of Government and Public Service at Texas |
| A&M University (1999-2001). Dr. Gates also is a Trustee of the Forum |
| for International Policy. |
Annual Report 34
| Name, Age; Principal Occupation |
| |
| George H. Heilmeier (69) |
| |
| Year of Election or Appointment: 2004 |
| Dr. Heilmeier is Chairman Emeritus of Telcordia Technologies (commu- |
| nication software and systems), where prior to his retirement, he served |
| as company Chairman and Chief Executive Officer. He currently serves |
| on the Boards of Directors of The Mitre Corporation (systems engineer- |
| ing and information technology support for the government), and HRL |
| Laboratories (private research and development, 2004-present). He is |
| Chairman of the General Motors Science & Technology Advisory Board |
| and a Life Fellow of the Institute of Electrical and Electronics Engineers |
| (IEEE) (2000-present). Dr. Heilmeier is a member of the Defense Science |
| Board and the National Security Agency Advisory Board. He is also a |
| member of the National Academy of Engineering, the American |
| Academy of Arts and Sciences, and the Board of Overseers of the |
| School of Engineering and Applied Science of the University of Pennsyl- |
| vania. Previously, Dr. Heilmeier served as a Director of TRW Inc. (auto- |
| motive, space, defense, and information technology, 1992-2002), |
| Compaq (1994-2002), Automatic Data Processing, Inc. (ADP) |
| (technology-based business outsourcing, 1995-2002), INET Technolo- |
| gies Inc. (telecommunications network surveillance, 2001-2004), and |
| Teletech Holdings (customer management services). He is the recipient of |
| the 2005 Kyoto Prize in Advanced Technology for his invention of the |
| liquid display. |
| |
| Marie L. Knowles (59) |
| |
| Year of Election or Appointment: 2001 |
| Prior to Ms. Knowles’ retirement in June 2000, she served as Executive |
| Vice President and Chief Financial Officer of Atlantic Richfield Company |
| (ARCO) (diversified energy, 1996-2000). From 1993 to 1996, she was |
| a Senior Vice President of ARCO and President of ARCO Transportation |
| Company. She served as a Director of ARCO from 1996 to 1998. She |
| currently serves as a Director of Phelps Dodge Corporation (copper |
| mining and manufacturing) and McKesson Corporation (healthcare ser- |
| vice, 2002-present). Ms. Knowles is a Trustee of the Brookings Institution |
| and the Catalina Island Conservancy and also serves as a member of |
| the Advisory Board for the School of Engineering of the University of |
| Southern California. |
35 Annual Report
Trustees and Officers - continued
| Name, Age; Principal Occupation |
| |
| Ned C. Lautenbach (61) |
| |
| Year of Election or Appointment: 2000 |
| Mr. Lautenbach has been a partner of Clayton, Dubilier & Rice, Inc. |
| (private equity investment firm) since September 1998. Previously, Mr. |
| Lautenbach was with the International Business Machines Corporation |
| (IBM) from 1968 until his retirement in 1998. Mr. Lautenbach serves as |
| a Director of Italtel Holding S.p.A. (telecommunications (Milan, Italy), |
| 2004-present) and Eaton Corporation (diversified industrial) as well as |
| the Philharmonic Center for the Arts in Naples, Florida. He also is a |
| member of the Board of Trustees of Fairfield University (2005-present), |
| as well as a member of the Council on Foreign Relations. |
| |
| Marvin L. Mann (72) |
| |
| Year of Election or Appointment: 1993 |
| Mr. Mann is Chairman of the Independent Trustees (2001-present). He is |
| Chairman Emeritus of Lexmark International, Inc. (computer |
| peripherals), where he served as CEO until April 1998, retired as |
| Chairman May 1999, and remains a member of the Board. Prior to |
| 1991, he held the positions of Vice President of International Business |
| Machines Corporation (IBM) and President and General Manager of |
| various IBM divisions and subsidiaries. He is a member of the Executive |
| Committee of the Independent Director’s Council of the Investment Com- |
| pany Institute. In addition, Mr. Mann is a member of the President’s |
| Cabinet at the University of Alabama and the Board of Visitors of the |
| Culverhouse College of Commerce and Business Administration at the |
| University of Alabama. |
| |
| William O. McCoy (72) |
| |
| Year of Election or Appointment: 1997 |
| Prior to his retirement in December 1994, Mr. McCoy was Vice Chair- |
| man of the Board of BellSouth Corporation (telecommunications) and |
| President of BellSouth Enterprises. He is currently a Director of Liberty |
| Corporation (holding company), Duke Realty Corporation (real estate), |
| and Progress Energy, Inc. (electric utility). He is also a partner of Frank- |
| lin Street Partners (private investment management firm) and a member |
| of the Research Triangle Foundation Board. In addition, Mr. McCoy |
| served as the Interim Chancellor (1999-2000) and a member of the |
| Board of Visitors for the University of North Carolina at Chapel Hill and |
| currently serves on the Board of Directors of the University of North |
| Carolina Health Care System and the Board of Visitors of the Kenan- |
| Flagler Business School (University of North Carolina at Chapel Hill). He |
| also served as Vice President of Finance for the University of North Car- |
| olina (16-school system). |
Annual Report 36
| Name, Age; Principal Occupation |
| |
| Cornelia M. Small (61) |
| |
| Year of Election or Appointment: 2005 |
| Ms. Small is a member (2000-present) and Chairperson (2002-present) |
| of the Investment Committee, and a member (2002-present) of the |
| Board of Trustees of Smith College. Previously, she served as Chief In- |
| vestment Officer (1999-2000), Director of Global Equity Investments |
| (1996-1999), and a member of the Board of Directors of Scudder, |
| Stevens & Clark (1990-1997) and Scudder Kemper Investments |
| (1997-1998). In addition, Ms. Small served as Co-Chair (2000-2003) |
| of the Annual Fund for the Fletcher School of Law and Diplomacy. |
| |
| William S. Stavropoulos (66) |
| |
| Year of Election or Appointment: 2002 |
| Mr. Stavropoulos is Chairman of the Board (2000-present) and a Mem- |
| ber of the Board of Directors of The Dow Chemical Company. Since |
| joining The Dow Chemical Company in 1967, Mr. Stavropoulos served |
| in numerous senior management positions, including President |
| (1993-2000; 2002-2003), CEO (1995-2000; 2002-2004), and Chair- |
| man of the Executive Committee (2000-2004). Currently, he is a Direc- |
| tor of NCR Corporation (data warehousing and technology solutions), |
| BellSouth Corporation (telecommunications), Chemical Financial Corpo- |
| ration, Maersk Inc. (industrial conglomerate, 2002-present), and Metal- |
| mark Capital (private equity investment firm, 2005-present). He also |
| serves as a member of the Board of Trustees of the American Enterprise |
| Institute for Public Policy Research. In addition, Mr. Stavropoulos is a |
| member of The Business Council, J.P. Morgan International Council and |
| the University of Notre Dame Advisory Council for the College of |
| Science. |
| |
| Kenneth L. Wolfe (66) |
| |
| Year of Election or Appointment: 2005 |
| Mr. Wolfe also serves as a Trustee (2005-present) or Member of the |
| Advisory Board (2004-present) of other investment companies advised |
| by FMR. Prior to his retirement in 2001, Mr. Wolfe was Chairman and |
| Chief Executive Officer of Hershey Foods Corporation (1993-2001). He |
| currently serves as a member of the boards of Adelphia Communica- |
| tions Corporation (2003-present), Bausch & Lomb, Inc., and Revlon Inc. |
| (2004-present). |
37 Annual Report
Trustees and Officers - continued
Advisory Board Members and Executive Officers:
Correspondence intended for Mr. Gamper may be sent to Fidelity Investments, P.O. Box 55235, Boston, Massachusetts 02205-5235. Correspondence intended for each executive officer and Mr. Lynch may be sent to Fidelity Investments, 82 Devonshire Street, Boston, Massachusetts 02109.
| Name, Age; Principal Occupation |
| |
| Albert R. Gamper, Jr. (63) |
| |
| Year of Election or Appointment: 2005 |
| Member of the Advisory Board of Fidelity Advisor Series VIII. Prior to his |
| retirement in December 2004, Mr. Gamper served as Chairman of the |
| Board of CIT Group Inc. (commercial finance). During his tenure with |
| CIT Group Inc. Mr. Gamper served in numerous senior management |
| positions, including Chairman (1987-1989; 1999-2001; 2002-2004), |
| Chief Executive Officer (1987-2004), and President (1989-2002). He |
| currently serves as a member of the Board of Directors of Public Service |
| Enterprise Group (utilities, 2001-present), Chairman of the Board of |
| Governors, Rutgers University (2004-present), and Chairman of the |
| Board of Saint Barnabas Health Care System. |
| |
| Peter S. Lynch (61) |
| |
| Year of Election or Appointment: 2003 |
| Member of the Advisory Board of Fidelity Advisor Series VIII. Vice |
| Chairman and a Director of FMR, and Vice Chairman (2001-present) |
| and a Director (2000-present) of FMR Co., Inc. Previously, Mr. Lynch |
| served as a Trustee of the Fidelity funds (1990-2003). In addition, he |
| serves as a Trustee of Boston College, Massachusetts Eye & Ear |
| Infirmary, Historic Deerfield, John F. Kennedy Library, and the Museum |
| of Fine Arts of Boston. |
| |
| Dwight D. Churchill (51) |
| |
| Year of Election or Appointment: 2005 |
| Vice President of Advisor International Capital Appreciation. Mr. Chur- |
| chill also serves as Vice President of certain Equity Funds (2005-present) |
| and certain High Income Funds (2005-present). Previously, he served as |
| Head of Fidelity’s Fixed-Income Division (2000-2005), Vice President of |
| Fidelity’s Money Market Funds (2000-2005), Vice President of Fidelity’s |
| Bond Funds, and Senior Vice President of FIMM (2000) and FMR. Mr. |
| Churchill joined Fidelity in 1993 as Vice President and Group Leader of |
| Taxable Fixed-Income Investments. |
Annual Report 38
| Name, Age; Principal Occupation |
| |
| Richard Mace (43) |
| |
| Year of Election or Appointment: 2005 |
| Vice President of Advisor International Capital Appreciation. Mr. Mace |
| serves as Vice President of other funds advised by FMR. Mr. Mace also |
| serves as Senior Vice President of FMR (2001) and FMR Co., Inc. |
| (2001). |
| |
| Eric D. Roiter (56) |
| |
| Year of Election or Appointment: 1998 |
| Secretary of Advisor International Capital Appreciation. He also serves |
| as Secretary of other Fidelity funds; Vice President, General Counsel, |
| and Secretary of FMR Co., Inc. (2001-present) and FMR; Assistant Sec- |
| retary of Fidelity Management & Research (U.K.) Inc. (2001-present), |
| Fidelity Management & Research (Far East) Inc. (2001-present), and |
| Fidelity Investments Money Management, Inc. (2001-present). Mr. Roiter |
| is an Adjunct Member, Faculty of Law, at Boston College Law School |
| (2003-present). Previously, Mr. Roiter served as Vice President and Sec- |
| retary of Fidelity Distributors Corporation (FDC) (1998-2005). |
| |
| Stuart Fross (46) |
| |
| Year of Election or Appointment: 2003 |
| Assistant Secretary of Advisor International Capital Appreciation. Mr. |
| Fross also serves as Assistant Secretary of other Fidelity funds |
| (2003-present), Vice President and Secretary of FDC (2005-present), |
| and is an employee of FMR. |
| |
| Christine Reynolds (47) |
| |
| Year of Election or Appointment: 2004 |
| President, Treasurer, and Anti-Money Laundering (AML) officer of Advi- |
| sor International Capital Appreciation. Ms. Reynolds also serves as Pres- |
| ident, Treasurer, and AML officer of other Fidelity funds (2004) and is a |
| Vice President (2003) and an employee (2002) of FMR. Before joining |
| Fidelity Investments, Ms. Reynolds worked at PricewaterhouseCoopers |
| LLP (PwC) (1980-2002), where she was most recently an audit partner |
| with PwC’s investment management practice. |
| |
| Paul M. Murphy (58) |
| |
| Year of Election or Appointment: 2005 |
| Chief Financial Officer of Advisor International Capital Appreciation. |
| Mr. Murphy also serves as Chief Financial Officer of other Fidelity funds |
| (2005-present). He also serves as Senior Vice President of Fidelity Pric- |
| ing and Cash Management Services Group (FPCMS). |
39 Annual Report
Trustees and Officers - continued
| Name, Age; Principal Occupation |
| |
| Kenneth A. Rathgeber (58) |
| |
| Year of Election or Appointment: 2004 |
| Chief Compliance Officer of Advisor International Capital Appreciation. |
| Mr. Rathgeber also serves as Chief Compliance Officer of other Fidelity |
| funds (2004) and Executive Vice President of Risk Oversight for Fidelity |
| Investments (2002). Previously, he served as Executive Vice President |
| and Chief Operating Officer for Fidelity Investments Institutional Services |
| Company, Inc. (1998-2002). |
| |
| John R. Hebble (47) |
| |
| Year of Election or Appointment: 2003 |
| Deputy Treasurer of Advisor International Capital Appreciation Mr. |
| Hebble also serves as Deputy Treasurer of other Fidelity funds (2003), |
| and is an employee of FMR. Before joining Fidelity Investments, Mr. |
| Hebble worked at Deutsche Asset Management where he served as |
| Director of Fund Accounting (2002-2003) and Assistant Treasurer of the |
| Scudder Funds (1998-2003). |
| |
| Bryan A. Mehrmann (44) |
| |
| Year of Election or Appointment: 2005 |
| Deputy Treasurer of Advisor International Capital Appreciation. Mr. |
| Mehrmann also serves as Deputy Treasurer of other Fidelity funds |
| (2005-present) and is an employee of FMR. Previously, Mr. Mehrmann |
| served as Vice President of Fidelity Investments Institutional Services |
| Group (FIIS)/Fidelity Investments Institutional Operations Corporation, |
| Inc. (FIIOC) Client Services (1998-2004). |
| |
| Kimberley H. Monasterio (41) |
| |
| Year of Election or Appointment: 2004 |
| Deputy Treasurer of Advisor International Capital Appreciation. Ms. |
| Monasterio also serves as Deputy Treasurer of other Fidelity funds |
| (2004) and is an employee of FMR (2004). Before joining Fidelity In- |
| vestments, Ms. Monasterio served as Treasurer (2000-2004) and Chief |
| Financial Officer (2002-2004) of the Franklin Templeton Funds and |
| Senior Vice President of Franklin Templeton Services, LLC (2000-2004). |
| |
| Kenneth B. Robins (36) |
| |
| Year of Election or Appointment: 2005 |
| Deputy Treasurer of Advisor International Capital Appreciation. Mr. |
| Robins also serves as Deputy Treasurer of other Fidelity funds |
| (2005-present) and is an employee of FMR (2004-present). Before join- |
| ing Fidelity Investments, Mr. Robins worked at KPMG LLP, where he was |
| a partner in KPMG’s department of professional practice (2002-2004) |
| and a Senior Manager (1999-2000). In addition, Mr. Robins served as |
| Assistant Chief Accountant, United States Securities and Exchange Com- |
| mission (2000-2002). |
Annual Report 40
| Name, Age; Principal Occupation |
| |
| Robert G. Byrnes (38) |
| |
| Year of Election or Appointment: 2005 |
| Assistant Treasurer of Advisor International Capital Appreciation. Mr. |
| Byrnes also serves as Assistant Treasurer of other Fidelity funds |
| (2005-present) and is an employee of FMR (2005-present). Previously, |
| Mr. Byrnes served as Vice President of FPCMS (2003-2005). Before |
| joining Fidelity Investments, Mr. Byrnes worked at Deutsche Asset Man- |
| agement where he served as Vice President of the Investment Opera- |
| tions Group (2000-2003). |
| |
| John H. Costello (59) |
| |
| Year of Election or Appointment: 1997 |
| Assistant Treasurer of Advisor International Capital Appreciation. Mr. |
| Costello also serves as Assistant Treasurer of other Fidelity funds and is |
| an employee of FMR. |
| |
| Peter L. Lydecker (51) |
| |
| Year of Election or Appointment: 2004 |
| Assistant Treasurer of Advisor International Capital Appreciation. Mr. |
| Lydecker also serves as Assistant Treasurer of other Fidelity funds (2004) |
| and is an employee of FMR. |
| |
| Mark Osterheld (50) |
| |
| Year of Election or Appointment: 2002 |
| Assistant Treasurer of Advisor International Capital Appreciation. Mr. |
| Osterheld also serves as Assistant Treasurer of other Fidelity funds |
| (2002) and is an employee of FMR. |
| |
| Gary W. Ryan (47) |
| |
| Year of Election or Appointment: 2005 |
| Assistant Treasurer of Advisor International Capital Appreciation. Mr. |
| Ryan also serves as Assistant Treasurer of other Fidelity funds |
| (2005-present) and is an employee of FMR (2005-present). Previously, |
| Mr. Ryan served as Vice President of Fund Reporting in FPCMS |
| (1999-2005). |
| |
| Salvatore Schiavone (39) |
| |
| Year of Election or Appointment: 2005 |
| Assistant Treasurer of Advisor International Capital Appreciation. Mr. |
| Schiavone also serves as Assistant Treasurer of other Fidelity funds |
| (2005-present) and is an employee of FMR (2005-present). Before join- |
| ing Fidelity Investments, Mr. Schiavone worked at Deutsche Asset Man- |
| agement, where he most recently served as Assistant Treasurer |
| (2003-2005) of the Scudder Funds and Vice President and Head of |
| Fund Reporting (1996-2003). |
41 Annual Report
The Board of Trustees of Fidelity Advisor International Capital Appreciation Fund voted to pay to shareholders of record at the opening of business on record date, the following distributions per share derived from capital gains realized from sales of portfolio securities, and dividends derived from net investment income:
| | | Pay Date | | Record Date | | Dividends | | Capital Gains |
| Institutional Class | | 12/12/05 | | 12/09/05 | | $— | | $2.24 |
The fund hereby designates as capital gain dividends: For dividends with respect to the taxable year ended October 31, 2005, $64,633,600, or, if subsequently determined to be different, the net capital gain of such year, and for dividends with respect to the taxable year ended October 31, 2004, $0, or, if subsequently determined to be different, the excess of: (a) the net capital gain of such year, over (b) amounts previously designated as capital gain dividends with respect to such year.
The fund will notify shareholders in January 2006 of amounts for use in preparing 2005 income tax returns.
Board Approval of Investment Advisory Contracts and Management Fees
Advisor International Capital Appreciation Fund
Each year, typically in July, the Board of Trustees, including the independent Trustees (together, the Board), votes on the renewal of the management contract and sub-advisory agreements (together, the Advisory Contracts) for the fund. The Board, assisted by the advice of fund counsel and independent Trustees’ counsel, requests and considers a broad range of information throughout the year.
The Board meets regularly each month except August and takes into account throughout the year matters bearing on Advisory Contracts. The Board, acting directly and through its separate committees, considers at each of its meetings factors that are relevant to the annual renewal of the fund’s Advisory Contracts, including the services and support provided to the fund and its shareholders by Fidelity. At the time of the renewal, the Board had 11 standing committees, each composed of independent Trustees with varying backgrounds, to which the Board has assigned specific subject matter responsibilities in order to enhance effective decision-making by the Board. Each committee has adopted a written charter outlining the structure and purposes of the committee. One such committee, the Equity Contract Committee, meets periodically during the first six months of each year and as necessary to consider matters specifically related to the annual renewal of Advisory Contracts. The committee requests and receives information on, and makes recommendations to the independent Trustees concerning, the approval and annual review of the Advisory Contracts.
At its July 2005 meeting, the Board of Trustees, including the independent Trustees, unanimously determined to renew the Advisory Contracts for the fund. In reaching its determination, the Board considered all factors it believed relevant, including (1) the nature, extent, and quality of the services to be provided to the fund and its shareholders by Fidelity (including the investment performance of the fund); (2) the competitiveness of the management fee and total expenses of the fund; (3) the total costs of the services to be provided by and the profits to be realized by the investment adviser and its affiliates from the relationship with the fund; (4) the extent to which economies of scale would be realized as the fund grows; and (5) whether fee levels reflect these economies of scale, if any, for the benefit of fund shareholders.
In determining whether to renew the Advisory Contracts for the fund, the Board ultimately reached a determination, with the assistance of fund counsel and independent Trustees’ counsel, that the renewal of the Advisory Contracts and the compensation to be received by Fidelity under the management contract is consistent with Fidelity’s fiduciary duty under applicable law. In addition to evaluating the specific factors noted above, the Board, in reaching its determination, is aware that shareholders in the fund have a broad range of investment choices available to them, including a wide choice among mutual funds offered by competitors to Fidelity, and that the fund’s shareholders, with the opportunity to review and weigh the disclosure provided by the fund in its
43 Annual Report
Board Approval of Investment Advisory Contracts and Management Fees - continued
prospectus and other public disclosures, have chosen to invest in this fund, managed by Fidelity.
Nature, Extent, and Quality of Services Provided by Fidelity. The Board considered staffing within the investment adviser, FMR, and the sub-advisers (together, the Investment Advisers), including the background of the fund’s portfolio manager and the fund’s investment objective and discipline. The independent Trustees also had discussions with senior management of Fidelity’s investment operations and investment groups. The Board considered the structure of the portfolio manager compensation program and whether this structure provides appropriate incentives.
Fidelity Resources Dedicated to Investment Management and Support Services. The Board reviewed the size, education, and experience of the Investment Advisers’ investment staff, their use of technology, and the Investment Advisers’ approach to recruiting, training, and retaining portfolio managers and other research, advisory, and management personnel. The Board considered Fidelity’s extensive global research capabilities that enable the Investment Advisers to aggregate data from various sources in an effort to produce positive investment results. The Board noted that Fidelity’s analysts have access to a variety of technological tools that enable them to perform both fundamental and quantitative analysis and to specialize in various disciplines. The Board also considered that Fidelity’s portfolio managers and analysts have access to daily portfolio attribution that allows for monitoring of a fund’s portfolio, as well as an electronic communication system that provides immediate real-time access to research concerning issuers and credit enhancers.
Shareholder and Administrative Services. The Board considered the nature, extent, quality, and cost of administrative, distribution, and shareholder services performed by the Investment Advisers and their affiliates under the Advisory Contracts and under separate agreements covering transfer agency, pricing and bookkeeping, and securities lending services for the fund. The Board also considered the nature and extent of the Investment Advisers’ supervision of third party service providers, principally custodians and subcustodians. The Board reviewed the allocation of fund brokerage, including allocations to brokers affiliated with the Investment Advisers, the use of brokerage commissions to pay fund expenses, and the use of “soft” commission dollars to pay for research services. The Board also considered that Fidelity voluntarily decided in 2004 to stop using “soft” commission dollars to pay for market data and, instead, to pay for that data out of its own resources. The Board also considered the resources devoted to, and the record of compliance with, the fund’s compliance policies and procedures.
The Board noted that the growth of fund assets across the complex allows Fidelity to reinvest in the development of services designed to enhance the value or convenience of the Fidelity funds as investment vehicles. These services include 24-hour access to
account information and market information through phone representatives and over the Internet, and investor education materials and asset allocation tools.
Investment in a Large Fund Family. The Board considered the benefits to shareholders of investing in a Fidelity fund, including the benefits of investing in a fund that is part of a large family of funds offering a variety of investment disciplines and providing for a large variety of mutual fund investor services. For example, fund shareholders are offered the privilege of exchanging shares of the fund for shares of other Fidelity funds, as set forth in the fund’s prospectus, without paying an additional sales charge. The Board noted that, since the last Advisory Contract renewals in July 2004, Fidelity has taken a number of actions that benefited particular funds, including (i) voluntarily deciding in 2004 to stop using “soft” commission dollars to pay for market data and, instead, to pay for that data out of its own resources, (ii) contractually agreeing to impose management fee reductions and expense limitations on its five Spartan stock index funds and its stock index fund available through variable insurance products, (iii) contractually agreeing to eliminate the management fees on the Fidelity Freedom Funds and the Fidelity Advisor Freedom Funds, (iv) contractually agreeing to reduce the management fees on most of its investment-grade taxable bond funds, and (v) contractually agreeing to impose expense limitations on its retail and Spartan investment-grade taxable bond funds.
Investment Performance and Compliance. The Board considered whether the fund has operated within its investment objective, as well as its record of compliance with its investment restrictions. It also reviewed the fund’s absolute investment performance for each class, as well as the fund’s relative investment performance for each class measured against (i) a broad-based securities market index, and (ii) a peer group of mutual funds deemed appropriate by the Board over multiple periods. The following charts considered by the Board show, over the one-, three-, and five-year periods ended December 31, 2004, the returns of Class C and Institutional Class of the fund, the returns of a broad-based securities market index (“benchmark”), and a range of returns of a peer group of mutual funds identified by Lipper Inc. as having an investment objective similar to that of the fund. The returns of Class C and Institutional Class represent the performance of classes with the highest and lowest 12b-1 fees, respectively (not necessarily with the highest and lowest total expenses). The box within each chart shows the 25th percentile return (bottom of box) and the 75th percentile return (top of box) of the Lipper peer group. Returns shown above the box are in the first quartile and returns shown below the box are in the fourth quartile. The percentage beaten numbers noted below each chart correspond to the percentile box and represent the percentage of funds in the Lipper peer group whose performance was equal to or lower than that of the class indicated.
45 Annual Report
Board Approval of Investment Advisory Contracts and Management Fees - continued
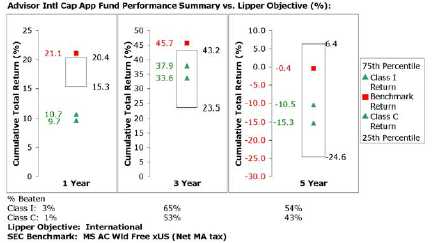
The Board reviewed the fund’s relative investment performance against its Lipper peer group and stated that the performance of Institutional Class of the fund was in the fourth quartile for the one-year period and the second quartile for the three- and five-year periods. The Board also stated that the relative investment performance of the fund was lower than its benchmark over time. The Board considered that the variations in performance among the fund’s classes reflect the variations in class expenses, which result in lower performance for higher expense classes.
The Board has had thorough discussions with FMR throughout the year about the Board’s and FMR’s concerns about equity research, equity fund performance, and compliance with internal policies governing gifts and entertainment. FMR has taken steps that it believes will refocus and strengthen equity research and equity portfolio management and compliance. The Board noted with favor FMR’s recent reorganization of its senior management team and FMR’s plans to dedicate additional resources to investment research, and participated in the process that led to those changes.
Based on its review, and giving particular weight to the nature and quality of the resources dedicated by the Investment Advisers to maintain and improve relative performance, the Board concluded that the nature, extent, and quality of the services provided by Fidelity will benefit the fund’s shareholders, particularly in light of the Board’s view that the fund’s shareholders benefit from investing in a fund that is part of a large family of funds offering a variety of investment disciplines and services.
Competitiveness of Management Fee and Total Fund Expenses. The Board considered the fund’s management fee and total expenses compared to “mapped groups” of competitive funds and classes. Fidelity creates “mapped groups” by combining similar
Lipper investment objective categories that have comparable management fee characteristics. Combining Lipper investment objective categories aids the Board’s management fee and total expense comparisons by broadening the competitive group used for comparison and by reducing the number of universes to which various Fidelity funds are compared.
The Board considered two proprietary management fee comparisons for the 12-month periods shown in the chart below. The group of Lipper funds used by the Board for management fee comparisons is referred to below as the “Total Mapped Group” and, for the reasons explained above, is broader than the Lipper peer group used by the Board for performance comparisons. The Total Mapped Group comparison focuses on a fund’s standing relative to the total universe of comparable funds available to investors, in terms of gross management fees before expense reimbursements or caps. “TMG %” represents the percentage of funds in the Total Mapped Group that had management fees that were lower than the fund’s. For example, a TMG % of 24% means that 76% of the funds in the Total Mapped Group had higher management fees than the fund. The “Asset-Size Peer Group” (ASPG) comparison focuses on a fund’s standing relative to non-Fidelity funds similar in size to the fund within the Total Mapped Group. The ASPG represents at least 15% of the funds in the Total Mapped Group with comparable asset size and management fee characteristics, subject to a minimum of 50 funds (or all funds in the Total Mapped Group if fewer than 50). Additional information, such as the ASPG quartile (“quadrant”) in which the fund’s management fee ranked, is also included in the chart and considered by the Board.

The Board noted that the fund’s management fee ranked below the median of its Total Mapped Group and below the median of its ASPG for 2004.
47 Annual Report
Board Approval of Investment Advisory Contracts and Management Fees - continued
Based on its review, the Board concluded that the fund’s management fee was fair and reasonable in light of the services that the fund receives and the other factors considered.
In its review of each class’s total expenses, the Board considered the fund’s management fee as well as other fund or class expenses, as applicable, such as transfer agent fees, pricing and bookkeeping fees, fund-paid 12b-1 fees, and custodial, legal, and audit fees. The Board also noted the effects of any waivers and reimbursements on fees and expenses. As part of its review, the Board also considered current and historical total expenses of each class of the fund compared to competitive fund median expenses. Each class of the fund is compared to those funds and classes in the Total Mapped Group (used by the Board for management fee comparisons) that have a similar sales load structure.
The Board noted that the total expenses of each of Class A, Class B and Class C ranked below its competitive median for 2004, and the total expenses of each of Class T and Institutional Class ranked above its competitive median for 2004. The Board noted that the fund offers multiple classes, each of which has a different sales load and 12b-1 fee structure, and that the multiple structures are intended to offer a range of pricing options for the intermediary market. The Board also noted that the total expenses of the classes vary primarily by the level of their 12b-1 fees, although differences in transfer agent fees may also cause expenses to vary from class to class.
Furthermore, the Board considered that on December 16, 2004, it had approved changes (effective January 1, 2005) in the transfer agent and service agreements for the fund that established maximum transfer agent fees and eliminated the minimum pricing and bookkeeping fee to prevent small funds or funds with small average account sizes from having relatively high fees in basis points (the “small-fund fee reductions”). The Board considered that, if the small-fund fee reductions had been in effect in 2004, the total expenses of Institutional Class would have ranked below the median.
In its review of total expenses, the Board also considered Fidelity fee structures and other information on clients that FMR and its affiliates service in other competitive markets, such as other mutual funds advised or subadvised by FMR or its affiliates, pension plan clients, and other institutional clients.
Based on its review, the Board concluded that the total expenses for each class of the fund were reasonable, although in some cases above the median of the universe presented for comparison, in light of the services that the fund and its shareholders receive and the other factors considered.
Costs of the Services and Profitability. The Board considered the revenues earned and the expenses incurred by Fidelity in conducting the business of developing, marketing, distributing, managing, administering and servicing the fund and its shareholders.
The Board also considered the level of Fidelity’s profits in respect of all the Fidelity funds.
On an annual basis, FMR presents to the Board Fidelity’s profitability for the fund. Fidelity calculates the profitability for each fund, as well as aggregate profitability for groups of Fidelity funds and all Fidelity funds, using a series of detailed revenue and cost allocation methodologies which originate with the audited books and records of Fidelity. The Audit Committee of the Board reviews any significant changes from the prior year’s methodologies.
PricewaterhouseCoopers LLP (PwC), independent registered accounting firm and auditor to Fidelity and certain Fidelity funds, has been engaged annually by the Board as part of the Board’s assessment of the results of Fidelity’s profitability analysis. PwC’s engagement includes the review and assessment of Fidelity’s methodologies used in determining the revenues and expenses attributable to Fidelity’s mutual fund business, and completion of agreed-upon procedures surrounding the mathematical accuracy of fund profitability and its conformity to allocation methodologies. After considering PwC’s reports issued under the engagement and information provided by Fidelity, the Board believes that while other allocation methods may also be reasonable, Fidelity’s profitability methodologies are reasonable in all material respects.
The Board has also reviewed Fidelity’s non-fund businesses and any fall-out benefits related to the mutual fund business as well as cases where Fidelity’s affiliates may benefit from or be related to the fund’s business. In addition, a special committee of the Board reviewed services provided to Fidelity by its affiliates and determined that the fees that Fidelity paid for such services were reasonable.
The Board considered the costs of the services provided by and the profits realized by Fidelity in connection with the operation of the fund and determined that the amount of profit is a fair entrepreneurial profit for the management of the fund.
Economies of Scale. The Board considered whether there have been economies of scale in respect of the management of the Fidelity funds, whether the Fidelity funds (including the fund) have appropriately benefited from any such economies of scale, and whether there is potential for realization of any further economies of scale. The Board considered the extent to which the fund will benefit from economies of scale through increased services to the fund, through waivers or reimbursements, or through fee or expense reductions, including reductions that occur through operation of the transfer agent agreement. The transfer agent fee varies in part based on the number of accounts in the fund. If the number of accounts decreases or the average account size increases, the overall transfer agent fee rate decreases.
The Board recognized that the fund’s management contract incorporates a “group fee” structure, which provides for lower fee rates as total fund assets under FMR’s
49 Annual Report
Board Approval of Investment Advisory Contracts and Management Fees - continued
management increase, and for higher fee rates as total fund assets under FMR’s management decrease. The Board considered that the group fee is designed to deliver the benefits of economies of scale to fund shareholders when total fund assets increase, even if assets of any particular fund are unchanged or have declined, because some portion of Fidelity’s costs are attributable to services provided to all Fidelity funds, and all funds benefit if those costs can be allocated among more assets. The Board concluded that, given the group fee structure, fund shareholders will achieve a certain level of economies of scale as assets under FMR’s management increase at the fund complex level, regardless of whether Fidelity achieves any such economies of scale.
The Board further concluded that any potential economies of scale are being shared between fund shareholders and Fidelity in an appropriate manner.
Additional Information Requested by the Board. In order to develop fully the factual basis for consideration of the Advisory Contracts, the Board requested additional information regarding (i) equity fund transfer agency fees; (ii) Fidelity’s fund profitability methodology and the impact of various changes in the methodology over time; (iii) benefits to shareholders from economies of scale; (iv) composition and characteristics of various fund and industry data used in comparisons; and (v) compensation of portfolio managers and research analysts.
Based on its evaluation of all of the conclusions noted above, and after considering all material factors, the Board ultimately concluded that the existing advisory fee structures are fair and reasonable, and that the fund’s existing Advisory Contracts should be renewed.
51 Annual Report
53 Annual Report
55 Annual Report
Investment Adviser
Fidelity Management & Research Company
Boston, MA
Investment Sub-Advisers
FMR Co., Inc.
Fidelity Management & Research
(U.K.) Inc.
Fidelity Management & Research
(Far East) Inc.
Fidelity International
Investment Advisors
Fidelity Investments Japan Limited
Fidelity International Investment
Advisors (U.K.) Limited
General Distributor
Fidelity Distributors Corporation
Boston, MA
Transfer and Service Agents
Fidelity Investments Institutional
Operations Company, Inc.
Boston, MA
Fidelity Service Company, Inc.
Boston, MA
Custodian
Brown Brothers Harriman & Co.
Boston, MA
|


Fidelity® Advisor
Japan
Fund - Class A, Class T, Class B and Class C
Annual Report October 31, 2005

| Contents | | | | |
| |
| Chairman’s Message | | 4 | | Ned Johnson’s message to shareholders. |
| Performance | | 6 | | How the fund has done over time. |
| Management’s Discussion | | 8 | | The manager’s review of fund |
| | | | | performance, strategy and outlook. |
| Shareholder Expense | | 9 | | An example of shareholder expenses. |
| Example | | | | |
| Investment Changes | | 11 | | A summary of major shifts in the fund’s |
| | | | | investments over the past six months. |
| Investments | | 12 | | A complete list of the fund’s investments |
| | | | | with their market values. |
| Financial Statements | | 20 | | Statements of assets and liabilities, |
| | | | | operations, and changes in net assets, |
| | | | | as well as financial highlights. |
| Notes | | 29 | | Notes to the financial statements. |
| Report of Independent | | 37 | | |
| Registered Public | | | | |
| Accounting Firm | | | | |
| Trustees and Officers | | 38 | | |
| Board Approval of | | 48 | | |
| Investment Advisory | | | | |
| Contracts and | | | | |
| Management Fees | | | | |
To view a fund’s proxy voting guidelines and proxy voting record for the 12-month period ended June 30, visit www.fidelity.com/proxyvotingresults or visit the Securities and Exchange Commission’s (SEC) web site at www.sec.gov. You may also call 1-877-208-0098 to request a free copy of the proxy voting guidelines.
Standard & Poor’s, S&P and S&P 500 are registered service marks of The McGraw-Hill Companies, Inc. and have been licensed for use by Fidelity Distributors Corporation.
Other third party marks appearing herein are the property of their respective owners.
All other marks appearing herein are registered or unregistered trademarks or service marks of FMR Corp. or an affiliated company.
This report and the financial statements contained herein are submitted for the general information of the shareholders of the fund. This report is not authorized for distribution to prospective investors in the fund unless preceded or accompanied by an effective prospectus.
A fund files its complete schedule of portfolio holdings with the SEC for the first and third quarters of each fiscal year on Form N-Q. Forms N-Q are available on the SEC’s web site at http://www.sec.gov. A fund’s Forms N-Q may be reviewed and copied at the SEC’s Public Reference Room in Washington, DC. Information regarding the operation of the SEC’s Public Reference Room may be obtained by calling 1-800-SEC-0330. For a complete list of a fund’s portfolio holdings, view the most recent quarterly holdings report, semiannual report, or annual report on Fidelity’s web site at http://www.advisor.fidelity.com.
NOT FDIC INSURED · MAY LOSE VALUE · NO BANK GUARANTEE
Neither the fund nor Fidelity Distributors Corporation is a bank.
3 Annual Report
Chairman’s Message
(Photograph of Edward C. Johnson 3d)
Dear Shareholder:
During the past year or so, much has been reported about the mutual fund industry, and much of it has been more critical than I believe is warranted. Allegations that some companies have been less than forthright with their shareholders have cast a shadow on the entire industry. I continue to find these reports disturbing, and assert that they do not create an accurate picture of the industry overall. Therefore, I would like to remind everyone where Fidelity stands on these issues. I will say two things specifically regarding allegations that some mutual fund companies were in violation of the Securities and Exchange Commission’s forward pricing rules or were involved in so-called “market timing” activities.
First, Fidelity has no agreements that permit customers who buy fund shares after 4 p.m. to obtain the 4 p.m. price. This is not a new policy. This is not to say that someone could not deceive the company through fraudulent acts. However, we are extremely diligent in preventing fraud from occurring in this manner — and in every other. But I underscore again that Fidelity has no so-called “agreements” that sanction illegal practices.
Second, Fidelity continues to stand on record, as we have for years, in opposition to predatory short-term trading that adversely affects shareholders in a mutual fund. Back in the 1980s, we initiated a fee — which is returned to the fund and, therefore, to investors — to discourage this activity. Further, we took the lead several years ago in developing a Fair Value Pricing Policy to prevent market timing on foreign securities in our funds. I am confident we will find other ways to make it more difficult for predatory traders to operate. However, this will only be achieved through close cooperation among regulators, legislators and the industry.
Yes, there have been unfortunate instances of unethical and illegal activity within the mutual fund industry from time to time. That is true of any industry. When this occurs, confessed or convicted offenders should be dealt with appropriately. But we are still concerned about the risk of over-regulation and the quick application of simplistic solutions to intricate problems. Every system can be improved, and we support and applaud well thought out improvements by regulators, legislators and industry representatives that achieve the common goal of building and protecting the value of investors’ holdings.
For nearly 60 years, Fidelity has worked very hard to improve its products and service to justify your trust. When our family founded this company in 1946, we had only a few hundred customers. Today, we serve more than 18 million customers including individual investors and participants in retirement plans across America.
Annual Report 4
Let me close by saying that we do not take your trust in us for granted, and we realize that we must always work to improve all aspects of our service to you. In turn, we urge you to continue your active participation with your financial matters, so that your interests can be well served.
Best regards,
/s/Edward C. Johnson 3d
5 Annual Report
Performance: The Bottom Line
Average annual total return reflects the change in the value of an investment, assuming reinvestment of the class’ dividend income and capital gains (the profits earned upon the sale of securities that have grown in value) and assuming a constant rate of performance each year. The $10,000 table and the fund’s returns do not reflect the deduction of taxes that a shareholder would pay on fund distributions or the redemption of fund shares. During periods of reimbursement by Fidelity, a fund’s total return will be greater than it would be had the reimbursement not occurred. How a fund did yesterday is no guarantee of how it will do tomorrow. Returns may reflect the conversion of Class B shares to Class A shares after a maximum of seven years.
| Average Annual Total Returns | | | | | | |
| Periods ended October 31, 2005 | | Past 1 | | Past 5 | | Life of |
| | | year | | years | | fundA |
| Class A (incl. 5.75% sales charge) | | 16.40% | | --2.14% | | 7.29% |
| Class T (incl. 3.50% sales charge) | | 18.87% | | --1.99% | | 7.35% |
| Class B (incl. contingent deferred sales | | | | | | |
| charge)B | | 17.52% | | --2.14% | | 7.36% |
| Class C (incl. contingent deferred sales | | | | | | |
| charge)C | | 21.56% | | --1.72% | | 7.43% |
A From December 17, 1998.
B Class B shares’ contingent deferred sales charges included in the past one year, past five years,
and life of fund total return figures are 5%, 2% and 0%, respectively.
C Class C shares’ contingent deferred sales charge included in the past one year, past five years, and life of fund total return figures are 1%, 0%, and 0%, respectively.
| | $10,000 Over Life of Fund
|
Let’s say hypothetically that $10,000 was invested in Fidelity® Advisor Japan Fund —Class T on December 17, 1998, when the fund started, and the current 3.50% sales charge was paid. The chart shows how the value of your investment would have changed, and also shows how the Tokyo Stock Exchange Stock Price (TOPIX) Index performed over the same period.

Management’s Discussion of Fund Performance
Comments from Dale Nicholls, Portfolio Manager of Fidelity® Advisor Japan Fund
Foreign stock markets enjoyed broad-based advances during the 12-month period that ended October 31, 2005, encouraged by better-than-expected corporate earnings and markedly improved economies. For the 12 months overall, the Morgan Stanley Capital InternationalSM Europe, Australasia, Far East (MSCIr EAFE®) Index — a performance measure of developed stock markets outside the United States and Canada — gained 18.28% . The Japanese stock market climbed to its highest level in more than four years. Positive economic indicators and Prime Minister Koizumi’s decisive election victory attracted record inflows from overseas investors. In response, the Tokyo Stock Exchange Stock Price Index (TOPIX) soared 22.89% . Southeast Asian equities outside of Japan, particularly South Korea, also responded well to the better macroeconomic environment, illustrated by the 19.44% return for the MSCI All Country Far East ex Japan index. Euro-pean stock markets were up as well, despite investors’ concern about higher energy prices and potential downgrades to economic growth in the region. For the year overall, the MSCI Europe index rose 16.51% .
For the 12 months ending October 31, 2005, the fund’s Class A, Class T, Class B and Class C shares returned 23.50%, 23.18%, 22.52% and 22.56%, respectively, about in line with the TOPIX, but trailing the 25.18% gain posted by the LipperSM Japanese Funds Average. On a sector basis, information technology added the most to performance versus the index —primarily through effective stock selection. Opt, Inc., an emerging leader in online advertising, was the top contributor to relative performance. The stock had a great run, and I sold the position to lock in profits. The top contributor on an absolute basis was Intelligent Wave. The company provides software that helps companies protect their electronically stored information. Demand for such a product grew with the increasing frequency of scandals regarding personal information leakage, and the company had what seemed to be a very strong product. On the downside, the consumer discretionary sector had the biggest negative impact. Among individual securities, not owning index component Mitsubishi Tokyo Financial Group held back performance the most. Konica Minolta Holdings also was a significant detractor. The company struggled in both the digital camera and laser printer markets, but I thought investors overreacted to these negatives and stuck with the position. Lastly, the fund’s absolute performance was limited by the depreciation of the Japa-nese yen versus the U.S. dollar during the period.
The views expressed in this statement reflect those of the portfolio manager only through the end of the period of the report as stated on the cover and do not necessarily represent the views of Fidelity or any other person in the Fidelity organization. Any such views are subject to change at any time based upon market or other conditions and Fidelity disclaims any responsibility to update such views. These views may not be relied on as investment advice and, because investment decisions for a Fidelity fund are based on numerous factors, may not be relied on as an indication of trading intent on behalf of any Fidelity fund.
Shareholder Expense Example
As a shareholder of the Fund, you incur two types of costs: (1) transaction costs, including sales charges (loads) on purchase payments or redemption proceeds, redemption fees, and (2) ongoing costs, including management fees, distribution and/or service (12b-1) fees and other Fund expenses. This Example is intended to help you understand your ongoing costs (in dollars) of investing in the Fund and to compare these costs with the ongoing costs of investing in other mutual funds.
The Example is based on an investment of $1,000 invested at the beginning of the period and held for the entire period (May 1, 2005 to October 31, 2005).
The first line of the table below for each class of the Fund provides information about actual account values and actual expenses. You may use the information in this line, together with the amount you invested, to estimate the expenses that you paid over the period. Simply divide your account value by $1,000.00 (for example, an $8,600 account value divided by $1,000.00 = 8.6), then multiply the result by the number in the first line for a class of the Fund under the heading entitled “Expenses Paid During Period” to estimate the expenses you paid on your account during this period.
Hypothetical Example for Comparison Purposes
The second line of the table below for each class of the Fund provides information about hypothetical account values and hypothetical expenses based on a Class’ actual expense ratio and an assumed rate of return of 5% per year before expenses, which is not the Class’ actual return. The hypothetical account values and expenses may not be used to estimate the actual ending account balance or expenses you paid for the period. You may use this information to compare the ongoing costs of investing in the Fund and other funds. To do so, compare this 5% hypothetical example with the 5% hypothetical examples that appear in the shareholder reports of the other funds.
Please note that the expenses shown in the table are meant to highlight your ongoing costs only and do not reflect any transaction costs. Therefore, the second line of the table is useful in comparing ongoing costs only, and will not help you determine the relative total costs of owning different funds. In addition, if these transactional costs were included, your costs would have been higher.
| | | | | | | | | | | | | Expenses Paid |
| | | | | Beginning | | | | Ending | | | | During Period* |
| | | | | Account Value | | | | Account Value | | | | May 1, 2005 |
| | | | | May 1, 2005 | | | | October 31, 2005 | | to October 31, 2005 |
| Class A | | | | | | | | | | | | |
| Actual | | $ | | 1,000.00 | | $ | | 1,132.00 | | $ | | 8.06 |
| HypotheticalA | | $ | | 1,000.00 | | $ | | 1,017.64 | | $ | | 7.63 |
| Class T | | | | | | | | | | | | |
| Actual | | $ | | 1,000.00 | | $ | | 1,130.60 | | $ | | 9.40 |
| HypotheticalA | | $ | | 1,000.00 | | $ | | 1,016.38 | | $ | | 8.89 |
| Class B | | | | | | | | | | | | |
| Actual | | $ | | 1,000.00 | | $ | | 1,127.40 | | $ | | 12.06 |
| HypotheticalA | | $ | | 1,000.00 | | $ | | 1,013.86 | | $ | | 11.42 |
9 Annual Report
| Shareholder Expense Example - continued | | | | |
| |
| |
| | | | | | | | | | | | | Expenses Paid |
| | | | | Beginning | | | | Ending | | | | During Period* |
| | | | | Account Value | | | | Account Value | | | | May 1, 2005 |
| | | | | May 1, 2005 | | | | October 31, 2005 | | to October 31, 2005 |
| Class C | | | | | | | | | | | | |
| Actual | | $ | | 1,000.00 | | $ | | 1,127.30 | | $ | | 11.80 |
| HypotheticalA | | $ | | 1,000.00 | | $ | | 1,014.12 | | $ | | 11.17 |
| Institutional Class | | | | | | | | | | | | |
| Actual | | $ | | 1,000.00 | | $ | | 1,133.30 | | $ | | 6.02 |
| HypotheticalA | | $ | | 1,000.00 | | $ | | 1,019.56 | | $ | | 5.70 |
| |
| A 5% return per year before expenses | | | | | | | | |
* Expenses are equal to each Class’ annualized expense ratio (shown in the table below); multiplied by the average account value over the period, multiplied by 184/365 (to reflect the one-half year period).
| | | Annualized |
| | | Expense Ratio |
| Class A | | 1.50% |
| Class T | | 1.75% |
| Class B | | 2.25% |
| Class C | | 2.20% |
| Institutional Class | | 1.12% |
Investment Changes
| Top Ten Stocks as of October 31, 2005 | | | | |
| | | % of fund’s | | % of fund’s net assets |
| | | net assets | | 6 months ago |
| Toyota Motor Corp. | | 3.3 | | 3.3 |
| Sumitomo Mitsui Financial Group, Inc. | | 2.7 | | 1.6 |
| Intelligent Wave, Inc. | | 2.4 | | 2.1 |
| Hamakyorex Co. Ltd. | | 2.3 | | 1.8 |
| Mizuho Financial Group, Inc. | | 2.0 | | 1.1 |
| Nippon Electric Glass Co. Ltd. | | 1.7 | | 2.7 |
| Stanley Electric Co. Ltd. | | 1.6 | | 1.8 |
| Softbank Corp. | | 1.5 | | 1.1 |
| Sompo Japan Insurance, Inc. | | 1.4 | | 0.0 |
| Matsushita Electric Industrial Co. Ltd. | | 1.4 | | 0.0 |
| | | 20.3 | | |
| Top Five Market Sectors as of October 31, 2005 | | |
| | | % of fund’s | | % of fund’s net assets |
| | | net assets | | 6 months ago |
| Financials | | 24.3 | | 15.3 |
| Consumer Discretionary | | 23.1 | | 30.6 |
| Information Technology | | 17.5 | | 17.9 |
| Industrials | | 15.1 | | 16.7 |
| Consumer Staples | | 6.3 | | 3.7 |

11 Annual Report
| Investments October 31, 2005 | | | | | | | | |
| Showing Percentage of Net Assets | | | | | | | | |
| |
| Common Stocks — 98.4% | | | | | | | | |
| | | | | Shares | | Value (Note 1) |
| |
| CONSUMER DISCRETIONARY – 23.1% | | | | | | | | |
| Auto Components – 3.0% | | | | | | | | |
| Aisin Seiki Co. Ltd. | | | | 21,200 | | $ | | 638,912 |
| NOK Corp. | | | | 26,500 | | | | 800,935 |
| Stanley Electric Co. Ltd. | | | | 106,800 | | | | 1,649,107 |
| | | | | | | | | 3,088,954 |
| Automobiles – 3.3% | | | | | | | | |
| Toyota Motor Corp. | | | | 74,000 | | | | 3,433,969 |
| Distributors – 0.6% | | | | | | | | |
| Doshisha Co. Ltd. | | | | 12,050 | | | | 213,928 |
| Ohashi Technica, Inc. | | | | 17,200 | | | | 358,981 |
| | | | | | | | | 572,909 |
| Diversified Consumer Services – 0.5% | | | | | | | | |
| Take & Give Needs Co. Ltd. (a) | | | | 388 | | | | 544,343 |
| Hotels, Restaurants & Leisure – 0.9% | | | | | | | | |
| Aeon Fantasy Co. Ltd. | | | | 13,200 | | | | 328,082 |
| Saint Marc Co. Ltd. | | | | 10,700 | | | | 542,083 |
| | | | | | | | | 870,165 |
| Household Durables – 4.4% | | | | | | | | |
| Casio Computer Co. Ltd. | | | | 30,000 | | | | 454,659 |
| First Juken Co. Ltd. | | | | 14,700 | | | | 143,472 |
| Haseko Corp. (a) | | | | 142,500 | | | | 493,629 |
| Hitachi Koki Co. Ltd. | | | | 62,000 | | | | 845,665 |
| Matsushita Electric Industrial Co. Ltd. | | | | 76,000 | | | | 1,398,400 |
| Sony Corp. | | | | 12,200 | | | | 400,160 |
| Sumitomo Forestry Co. Ltd. | | | | 64,000 | | | | 593,602 |
| Tenma Corp. | | | | 11,900 | | | | 201,990 |
| | | | | | | | | 4,531,577 |
| Leisure Equipment & Products – 2.6% | | | | | | | | |
| Aruze Corp. | | | | 36,500 | | | | 663,802 |
| Mars Engineering Corp. | | | | 13,700 | | | | 422,374 |
| Sankyo Co. Ltd. (Gunma) | | | | 8,200 | | | | 433,892 |
| Sega Sammy Holdings, Inc. | | | | 15,800 | | | | 569,215 |
| Sega Sammy Holdings, Inc. New | | | | 15,800 | | | | 573,320 |
| | | | | | | | | 2,662,603 |
| Media – 2.4% | | | | | | | | |
| Bandai Visual Co. Ltd. | | | | 150 | | | | 504,022 |
| Cyber Agent Ltd. | | | | 139 | | | | 250,383 |
| Cyber Agent Ltd. New | | | | 139 | | | | 250,383 |
| cyber communications, Inc. (a) | | | | 120 | | | | 305,531 |
| Fuji Television Network, Inc. | | | | 277 | | | | 618,907 |
See accompanying notes which are an integral part of the financial statements.
| Common Stocks – continued | | | | | | |
| | | Shares | | Value (Note 1) |
| |
| CONSUMER DISCRETIONARY – continued | | | | | | |
| Media – continued | | | | | | |
| livedoor MARKETING Co. Ltd. (a) | | 8,836 | | $ | | 359,650 |
| Oricon, Inc. | | 179 | | | | 232,525 |
| | | | | | | 2,521,401 |
| Multiline Retail – 0.6% | | | | | | |
| Parco Co. Ltd. | | 67,000 | | | | 653,920 |
| Specialty Retail – 3.4% | | | | | | |
| Hikari Tsushin, Inc. | | 5,800 | | | | 373,201 |
| Honeys Co. Ltd. | | 11,300 | | | | 590,095 |
| Jeans Mate Corp. | | 10,600 | | | | 140,634 |
| Mac House Co. Ltd. | | 16,700 | | | | 346,376 |
| Point, Inc. | | 9,700 | | | | 602,306 |
| Tsutsumi Jewelry Co. Ltd. | | 18,100 | | | | 542,352 |
| USS Co. Ltd. | | 5,290 | | | | 364,666 |
| Xebio Co. Ltd. | | 12,300 | | | | 530,470 |
| | | | | | | 3,490,100 |
| Textiles, Apparel & Luxury Goods – 1.4% | | | | | | |
| Asics Corp. | | 72,000 | | | | 621,038 |
| Renown D’urban Holdings, Inc. (a) | | 39,900 | | | | 414,649 |
| Workman Co. Ltd. | | 14,100 | | | | 427,379 |
| | | | | | | 1,463,066 |
| |
| TOTAL CONSUMER DISCRETIONARY | | | | | | 23,833,007 |
| |
| CONSUMER STAPLES – 6.3% | | | | | | |
| Beverages – 1.6% | | | | | | |
| Asahi Breweries Ltd. | | 33,300 | | | | 417,291 |
| Kirin Beverage Corp. | | 16,700 | | | | 352,161 |
| Oenon Holdings, Inc. | | 176,000 | | | | 592,910 |
| Takara Holdings, Inc. | | 52,000 | | | | 308,475 |
| | | | | | | 1,670,837 |
| Food & Staples Retailing – 3.2% | | | | | | |
| Aeon Co. Ltd. | | 15,100 | | | | 313,844 |
| Create SD Co. Ltd. | | 6,300 | | | | 228,057 |
| Daikokutenbussan Co. Ltd. | | 18,100 | | | | 815,095 |
| Itochushokuhin Co. Ltd. | | 13,800 | | | | 470,871 |
| Kura Corp. Ltd. | | 75 | | | | 481,289 |
| Valor Co. Ltd. (d) | | 32,360 | | | | 980,850 |
| | | | | | | 3,290,006 |
See accompanying notes which are an integral part of the financial statements.
13 Annual Report
| Investments - continued | | | | | | |
| |
| |
| Common Stocks – continued | | | | | | |
| | | Shares | | Value (Note 1) |
| |
| CONSUMER STAPLES – continued | | | | | | |
| Food Products – 0.7% | | | | | | |
| Hokuto Corp. | | 15,200 | | $ | | 246,683 |
| Kibun Food Chemifa Co. Ltd. | | 14,700 | | | | 356,452 |
| Warabeya Nichiyo Co. Ltd. | | 11,700 | | | | 168,603 |
| | | | | | | 771,738 |
| Household Products – 0.5% | | | | | | |
| Uni-Charm Corp. | | 10,300 | | | | 468,298 |
| Personal Products – 0.3% | | | | | | |
| Fancl Corp. | | 6,700 | | | | 329,571 |
| |
| TOTAL CONSUMER STAPLES | | | | | | 6,530,450 |
| |
| ENERGY – 2.0% | | | | | | |
| Oil, Gas & Consumable Fuels – 2.0% | | | | | | |
| AOC Holdings, Inc. | | 21,400 | | | | 394,748 |
| Cosmo Oil Co. Ltd. | | 167,000 | | | | 812,791 |
| Nippon Mining Holdings, Inc. | | 113,000 | | | | 834,745 |
| | | | | | | 2,042,284 |
| |
| FINANCIALS – 24.3% | | | | | | |
| Capital Markets – 2.5% | | | | | | |
| E*TRADE Securities Co. Ltd. | | 128 | | | | 672,860 |
| Japan Asia Investment Co. Ltd | | 138,000 | | | | 776,817 |
| Monex Beans Holdings, Inc. (d) | | 427 | | | | 451,143 |
| Nikko Cordial Corp. | | 57,000 | | | | 691,081 |
| | | | | | | 2,591,901 |
| Commercial Banks – 10.2% | | | | | | |
| Hokuhoku Financial Group, Inc. | | 321,000 | | | | 1,331,578 |
| Juroku Bank Ltd. | | 49,000 | | | | 409,072 |
| Mitsui Trust Holdings, Inc. | | 115,000 | | | | 1,388,311 |
| Mizuho Financial Group, Inc. | | 302 | | | | 2,019,066 |
| Nishi-Nippon City Bank Ltd. | | 156,000 | | | | 910,564 |
| Sumitomo Mitsui Financial Group, Inc. | | 297 | | | | 2,752,114 |
| The Keiyo Bank Ltd. | | 110,000 | | | | 827,825 |
| Tokyo Tomin Bank Ltd. | | 23,900 | | | | 879,656 |
| | | | | | | 10,518,186 |
| Consumer Finance – 4.6% | | | | | | |
| Credit Saison Co. Ltd. | | 19,200 | | | | 872,945 |
| Lopro Corp. (d) | | 75,100 | | | | 433,152 |
| Nissin Co. Ltd. | | 335,000 | | | | 487,394 |
| Nissin Co. Ltd. New | | 335,000 | | | | 481,592 |
See accompanying notes which are an integral part of the financial statements.
| Common Stocks – continued | | | | | | |
| | | Shares | | Value (Note 1) |
| |
| FINANCIALS – continued | | | | | | |
| Consumer Finance – continued | | | | | | |
| OMC Card, Inc. | | 22,000 | | $ | | 370,187 |
| ORIX Corp. | | 5,200 | | | | 975,862 |
| SFCG Co. Ltd. | | 3,870 | | | | 934,729 |
| UCS Co. Ltd. | | 6,500 | | | | 247,681 |
| | | | | | | 4,803,542 |
| Insurance – 2.7% | | | | | | |
| Sompo Japan Insurance, Inc | | 96,000 | | | | 1,446,594 |
| T&D Holdings, Inc. | | 21,350 | | | | 1,347,881 |
| | | | | | | 2,794,475 |
| Real Estate – 4.3% | | | | | | |
| IDU Co. (a) | | 153 | | | | 549,877 |
| Japan Logistics Fund, Inc | | 95 | | | | 596,469 |
| Keihanshin Real Estate Co. Ltd. | | 89,000 | | | | 641,268 |
| KK daVinci Advisors (a) | | 128 | | | | 604,133 |
| Sumitomo Realty & Development Co. Ltd. | | 70,000 | | | | 1,133,616 |
| Toc Co. Ltd. | | 14,000 | | | | 81,232 |
| Urban Corp. (d) | | 12,700 | | | | 789,686 |
| | | | | | | 4,396,281 |
| |
| TOTAL FINANCIALS | | | | | | 25,104,385 |
| |
| HEALTH CARE – 5.6% | | | | | | |
| Biotechnology – 0.4% | | | | | | |
| Shin Nippon Biomedical Laboratories Ltd. | | 17,200 | | | | 255,904 |
| Shin Nippon Biomedical Laboratories Ltd. New | | 7,900 | | | | 117,538 |
| | | | | | | 373,442 |
| Health Care Equipment & Supplies – 2.5% | | | | | | |
| Hogy Medical Co. | | 15,700 | | | | 860,656 |
| Miraca Holdings, Inc. | | 29,500 | | | | 661,680 |
| Sysmex Corp. | | 5,300 | | | | 211,135 |
| Sysmex Corp. New | | 5,300 | | | | 211,135 |
| Terumo Corp. | | 22,100 | | | | 671,778 |
| | | | | | | 2,616,384 |
| Pharmaceuticals – 2.7% | | | | | | |
| Astellas Pharma, Inc. | | 22,100 | | | | 794,267 |
See accompanying notes which are an integral part of the financial statements.
15 Annual Report
| Investments - continued | | | | | | |
| |
| |
| Common Stocks – continued | | | | | | |
| | | Shares | | Value (Note 1) |
| |
| HEALTH CARE – continued | | | | | | |
| Pharmaceuticals – continued | | | | | | |
| Eisai Co. Ltd. | | 16,900 | | $ | | 664,460 |
| Takeda Pharamaceutical Co. Ltd. | | 23,600 | | | | 1,299,856 |
| | | | | | | 2,758,583 |
| |
| TOTAL HEALTH CARE | | | | | | 5,748,409 |
| |
| INDUSTRIALS – 15.1% | | | | | | |
| Building Products – 0.5% | | | | | | |
| Daikin Industries Ltd. | | 19,100 | | | | 499,536 |
| Commercial Services & Supplies – 0.3% | | | | | | |
| Teraoka Seisakusho Co. Ltd. | | 37,500 | | | | 324,107 |
| Construction & Engineering – 1.3% | | | | | | |
| Chiyoda Corp. | | 38,000 | | | | 656,527 |
| Commuture Corp. | | 81,000 | | | | 722,518 |
| | | | | | | 1,379,045 |
| Electrical Equipment – 1.0% | | | | | | |
| Furukawa Electric Co. Ltd. (a) | | 80,000 | | | | 380,354 |
| Sumitomo Electric Industries Ltd. | | 51,400 | | | | 677,492 |
| | | | | | | 1,057,846 |
| Machinery – 4.4% | | | | | | |
| Daifuku Co. Ltd. | | 33,500 | | | | 441,846 |
| Ishikawajima-Harima Heavy Industries Co. Ltd. (a) | | 300,000 | | | | 698,875 |
| Kitz Corp. | | 173,000 | | | | 1,032,266 |
| Koyo Seiko Co. Ltd. | | 41,000 | | | | 659,714 |
| Kubota Corp. | | 84,000 | | | | 611,789 |
| Nabtesco Corp. | | 78,000 | | | | 657,255 |
| Nittoku Engineering Co. Ltd. | | 51,000 | | | | 430,627 |
| | | | | | | 4,532,372 |
| Marine – 0.8% | | | | | | |
| Iino Kaiun Kaisha Ltd. | | 79,000 | | | | 774,461 |
| Road & Rail – 3.2% | | | | | | |
| East Japan Railway Co | | 159 | | | | 950,107 |
| Hamakyorex Co. Ltd. | | 64,400 | | | | 2,331,247 |
| | | | | | | 3,281,354 |
| Trading Companies & Distributors – 2.9% | | | | | | |
| BSL Corp. (d) | | 173,000 | | | | 368,559 |
| BSL Corp. warrants 12/15/05 (a) | | 17,300 | | | | 3,895 |
See accompanying notes which are an integral part of the financial statements.
| Common Stocks – continued | | | | |
| | | Shares | | Value (Note 1) |
| |
| INDUSTRIALS – continued | | | | |
| Trading Companies & Distributors – continued | | | | |
| Mitsubishi Corp. | | 69,900 | | $ 1,362,028 |
| Mitsui & Co. Ltd. | | 103,000 | | 1,269,312 |
| | | | | 3,003,794 |
| Transportation Infrastructure – 0.7% | | | | |
| Kamigumi Co. Ltd. | | 55,000 | | 454,875 |
| The Sumitomo Warehouse Co. Ltd. | | 39,000 | | 303,296 |
| | | | | 758,171 |
| |
| TOTAL INDUSTRIALS | | | | 15,610,686 |
| |
| INFORMATION TECHNOLOGY – 17.5% | | | | |
| Computers & Peripherals – 1.0% | | | | |
| Fujitsu Ltd. | | 110,000 | | 727,800 |
| Meiko Electronics Co. Ltd. | | 7,100 | | 305,591 |
| | | | | 1,033,391 |
| Electronic Equipment & Instruments – 5.0% | | | | |
| Forval Corp. | | 29,500 | | 314,745 |
| Hoya Corp. | | 4,800 | | 168,769 |
| Hoya Corp. New | | 14,400 | | 502,567 |
| Nidec Corp. | | 6,600 | | 388,097 |
| Nidec Corp. New | | 5,700 | | 335,174 |
| Nippon Chemi-con Corp. | | 46,000 | | 280,052 |
| Nippon Electric Glass Co. Ltd. | | 93,000 | | 1,783,951 |
| Omron Corp. | | 19,800 | | 468,974 |
| SFA Engineering Corp. | | 16,000 | | 381,609 |
| Yaskawa Electric Corp. (a) | | 68,000 | | 531,769 |
| | | | | 5,155,707 |
| Internet Software & Services – 5.0% | | | | |
| Dip Corp. (a) | | 176 | | 274,354 |
| Index Corp. New (d) | | 300 | | 337,746 |
| livedoor Co. Ltd. (a) | | 182,410 | | 671,373 |
| Sammy NetWorks Co. Ltd. | | 28 | | 351,603 |
| Softbank Corp. | | 27,000 | | 1,531,550 |
| Telewave, Inc. | | 131 | | 765,775 |
| Yahoo! Japan Corp | | 789 | | 840,443 |
| Yahoo! Japan Corp. New | | 331 | | 358,314 |
| | | | | 5,131,158 |
| IT Services – 1.1% | | | | |
| NTT Data Corp. | | 107 | | 373,435 |
See accompanying notes which are an integral part of the financial statements.
17 Annual Report
| Investments - continued | | | | | | |
| |
| |
| Common Stocks – continued | | | | | | |
| | | Shares | | Value (Note 1) |
| |
| INFORMATION TECHNOLOGY – continued | | | | | | |
| IT Services – continued | | | | | | |
| Otsuka Corp. | | 6,700 | | $ | | 592,996 |
| Software Research Association (SRA) | | 11,400 | | | | 192,022 |
| | | | | | | 1,158,453 |
| Office Electronics – 1.3% | | | | | | |
| Canon, Inc. | | 17,300 | | | | 918,111 |
| Konica Minolta Holdings, Inc. | | 44,500 | | | | 370,348 |
| | | | | | | 1,288,459 |
| Semiconductors & Semiconductor Equipment – 1.0% | | | | | | |
| Nihon Inter Electronics Corp. | | 36,000 | | | | 240,372 |
| Phoenix PDE Co. Ltd. | | 43,595 | | | | 209,623 |
| Sanken Electric Co. Ltd. | | 47,000 | | | | 543,382 |
| | | | | | | 993,377 |
| Software – 3.1% | | | | | | |
| Intelligent Wave, Inc. | | 752 | | | | 2,494,266 |
| KOEI Co. Ltd. | | 11,500 | | | | 348,572 |
| Trend Micro, Inc. | | 13,000 | | | | 406,422 |
| | | | | | | 3,249,260 |
| |
| TOTAL INFORMATION TECHNOLOGY | | | | | | 18,009,805 |
| |
| MATERIALS – 4.5% | | | | | | |
| Chemicals – 4.0% | | | | | | |
| Ise Chemical Corp. | | 136,000 | | | | 698,425 |
| JSR Corp. | | 41,600 | | | | 985,319 |
| Nissan Chemical Industries Co. Ltd. | | 32,000 | | | | 373,288 |
| Nitto Denko Corp. | | 16,700 | | | | 1,013,820 |
| Soken Chemical & Engineer Co. Ltd. | | 7,700 | | | | 228,724 |
| Teijin Ltd | | 140,000 | | | | 836,572 |
| | | | | | | 4,136,148 |
| Metals & Mining – 0.5% | | | | | | |
| Hitachi Metals Ltd. | | 9,000 | | | | 92,672 |
| Sumitomo Metal Mining Co. Ltd. | | 49,000 | | | | 447,263 |
| | | | | | | 539,935 |
| |
| TOTAL MATERIALS | | | | | | 4,676,083 |
| |
| TOTAL COMMON STOCKS | | | | | | |
| (Cost $87,992,863) | | | | 101,555,109 |
See accompanying notes which are an integral part of the financial statements.
| Money Market Funds — 4.5% | | | | | | |
| | | Shares | | | | Value (Note 1) |
| Fidelity Cash Central Fund, 3.92% (b) | | 3,032,901 | | $ | | 3,032,901 |
| Fidelity Securities Lending Cash Central Fund, | | | | | | |
| 3.94% (b)(c) | | 1,622,691 | | | | 1,622,691 |
| TOTAL MONEY MARKET FUNDS | | | | | | |
| (Cost $4,655,592) | | | | | | 4,655,592 |
| TOTAL INVESTMENT PORTFOLIO – 102.9% | | | | | | |
| (Cost $92,648,455) | | | | | | 106,210,701 |
| |
| NET OTHER ASSETS – (2.9)% | | | | | | (2,972,366) |
| NET ASSETS – 100% | | | | $ | | 103,238,335 |
(a) Non-income producing
(b) Affiliated fund that is available only to investment companies and other accounts managed by Fidelity Investments. The rate quoted is the annualized seven-day yield of the fund at period end. A complete unaudited listing of the fund’s holdings as of its most recent quarter end is available upon request.
(c) Investment made with cash collateral received from securities on loan.
(d) Security or a portion of the security is on loan at period end.
At October 31, 2005, the fund had a capital loss carryforward of approximately $20,478,737 of which $10,494,841 and $9,983,896 will expire on October 31, 2009 and 2010, respectively.
See accompanying notes which are an integral part of the financial statements.
19 Annual Report
| Financial Statements | | | | | | | | |
| |
| |
| Statement of Assets and Liabilities | | | | | | | | |
| | | | | | | | | October 31, 2005 |
| |
| Assets | | | | | | | | |
| Investment in securities, at value (including securities | | | | | | | | |
| loaned of $1,531,918) (cost $92,648,455) — See | | | | | | | | |
| accompanying schedule | | | | | | $ | | 106,210,701 |
| Receivable for investments sold | | | | | | | | 1,434,826 |
| Receivable for fund shares sold | | | | | | | | 831,646 |
| Dividends receivable | | | | | | | | 213,483 |
| Interest receivable | | | | | | | | 10,750 |
| Receivable from investment adviser for expense | | | | | | | | |
| reductions | | | | | | | | 5,463 |
| Other affiliated receivables | | | | | | | | 1,634 |
| Other receivables | | | | | | | | 5,720 |
| Total assets | | | | | | | | 108,714,223 |
| |
| Liabilities | | | | | | | | |
| Payable for investments purchased | | $ | | 3,500,375 | | | | |
| Payable for fund shares redeemed | | | | 171,825 | | | | |
| Accrued management fee | | | | 57,079 | | | | |
| Distribution fees payable | | | | 51,868 | | | | |
| Other affiliated payables | | | | 27,333 | | | | |
| Other payables and accrued expenses | | | | 44,717 | | | | |
| Collateral on securities loaned, at value | | | | 1,622,691 | | | | |
| Total liabilities | | | | | | | | 5,475,888 |
| |
| Net Assets | | | | | | $ | | 103,238,335 |
| Net Assets consist of: | | | | | | | | |
| Paid in capital | | | | | | $ | | 111,218,918 |
| Accumulated undistributed net realized gain (loss) on | | | | | | | | |
| investments and foreign currency transactions | | | | | | | | (21,528,842) |
| Net unrealized appreciation (depreciation) on | | | | | | | | |
| investments and assets and liabilities in foreign | | | | | | | | |
| currencies | | | | | | | | 13,548,259 |
| Net Assets | | | | | | $ | | 103,238,335 |
See accompanying notes which are an integral part of the financial statements.
| Statement of Assets and Liabilities — continued | | | | |
| | | October 31, 2005 |
| |
| Calculation of Maximum Offering Price | | | | |
| Class A: | | | | |
| Net Asset Value and redemption price per share | | | | |
| ($26,168,783 ÷ 1,676,736 shares) | | $ | | 15.61 |
| Maximum offering price per share (100/94.25 of | | | | |
| $15.61) | | $ | | 16.56 |
| Class T: | | | | |
| Net Asset Value and redemption price per share | | | | |
| ($15,610,346 ÷ 1,013,288 shares) | | $ | | 15.41 |
| Maximum offering price per share (100/96.50 of | | | | |
| $15.41) | | $ | | 15.97 |
| Class B: | | | | |
| Net Asset Value and offering price per share | | | | |
| ($18,916,158 ÷ 1,264,134 shares)A | | $ | | 14.96 |
| Class C: | | | | |
| Net Asset Value and offering price per share | | | | |
| ($34,144,483 ÷ 2,268,539 shares)A | | $ | | 15.05 |
| Institutional Class: | | | | |
| Net Asset Value, offering price and redemption | | | | |
| price per share ($8,398,565 ÷ 528,080 | | | | |
| shares) | | $ | | 15.90 |
| |
| A Redemption price per share is equal to net asset value less any applicable contingent deferred sales charge. | | | | |
See accompanying notes which are an integral part of the financial statements.
21 Annual Report
| Financial Statements - continued | | | | | | |
| |
| |
| Statement of Operations | | | | | | |
| | | | | Year ended October 31, 2005 |
| |
| Investment Income | | | | | | |
| Dividends | | | | $ | | 729,602 |
| Interest | | | | | | 50,482 |
| Security lending | | | | | | 57,496 |
| | | | | | | 837,580 |
| Less foreign taxes withheld | | | | | | (50,780) |
| Total income | | | | | | 786,800 |
| |
| Expenses | | | | | | |
| Management fee | | $ | | 564,484 | | |
| Transfer agent fees | | | | 259,586 | | |
| Distribution fees | | | | 526,980 | | |
| Accounting and security lending fees | | | | 56,634 | | |
| Independent trustees’ compensation | | | | 360 | | |
| Custodian fees and expenses | | | | 88,366 | | |
| Registration fees | | | | 48,640 | | |
| Audit | | | | 40,752 | | |
| Legal | | | | 810 | | |
| Miscellaneous | | | | 2,774 | | |
| Total expenses before reductions | | | | 1,589,386 | | |
| Expense reductions | | | | (61,308) | | 1,528,078 |
| |
| Net investment income (loss) | | | | | | (741,278) |
| Realized and Unrealized Gain (Loss) | | | | | | |
| Net realized gain (loss) on: | | | | | | |
| Investment securities | | | | 5,548,774 | | |
| Foreign currency transactions | | | | (24,038) | | |
| Total net realized gain (loss) | | | | | | 5,524,736 |
| Change in net unrealized appreciation (depreciation) on: | | | | |
| Investment securities | | | | 11,388,402 | | |
| Assets and liabilities in foreign currencies | | | | (21,644) | | |
| Total change in net unrealized appreciation | | | | | | |
| (depreciation) | | | | | | 11,366,758 |
| Net gain (loss) | | | | | | 16,891,494 |
| Net increase (decrease) in net assets resulting from | | | | | | |
| operations | | | | $ | | 16,150,216 |
See accompanying notes which are an integral part of the financial statements.
| Statement of Changes in Net Assets | | | | | | | | |
| | | | | Year ended | | | | Year ended |
| | | | | October 31, | | | | October 31, |
| | | | | 2005 | | | | 2004 |
| Increase (Decrease) in Net Assets | | | | | | | | |
| Operations | | | | | | | | |
| Net investment income (loss) | | $ | | (741,278) | | $ | | (818,124) |
| Net realized gain (loss) | | | | 5,524,736 | | | | 4,854,592 |
| Change in net unrealized appreciation (depreciation) . | | | | 11,366,758 | | | | (3,148,734) |
| Net increase (decrease) in net assets resulting | | | | | | | | |
| from operations | | | | 16,150,216 | | | | 887,734 |
| Share transactions -- net increase (decrease) | | | | 13,972,644 | | | | 22,543,746 |
| Redemption fees | | | | 38,032 | | | | 88,428 |
| Total increase (decrease) in net assets | | | | 30,160,892 | | | | 23,519,908 |
| |
| Net Assets | | | | | | | | |
| Beginning of period | | | | 73,077,443 | | | | 49,557,535 |
| End of period (including accumulated net investment | | | | | | | | |
| income of $0 and accumulated net investment loss of | | | | | | | | |
| $645,663, respectively) | | $ | | 103,238,335 | | $ | | 73,077,443 |
See accompanying notes which are an integral part of the financial statements.
23 Annual Report
| Financial Highlights — Class A | | | | | | | | | | |
| Years ended October 31, | | 2005 | | 2004 | | | | 2003 | | 2002 | | 2001 |
| Selected Per-Share Data | | | | | | | | | | | | |
| Net asset value, beginning of | | | | | | | | | | | | |
| period | | $ 12.64 | | $ 11.78 | | $ | | 8.74 | | $ 10.18 | | $ 17.78 |
| Income from Investment | | | | | | | | | | | | |
| Operations | | | | | | | | | | | | |
| Net investment income (loss)C | | (.08) | | (.11) | | | | (.07) | | (.13) | | (.15) |
| Net realized and unrealized | | | | | | | | | | | | |
| gain (loss) | | 3.04 | | .95 | | | | 3.11 | | (1.31) | | (6.13) |
| Total from investment operations | | 2.96 | | .84 | | | | 3.04 | | (1.44) | | (6.28) |
| Distributions from net investment | | | | | | | | | | | | |
| income | | — | | — | | | | — | | — | | (1.32) |
| Redemption fees added to paid in | | | | | | | | | | | | |
| capitalC | | 01 | | .02 | | | | — | | — | | — |
| Net asset value, end of period | | $ 15.61 | | $ 12.64 | | $ | | 11.78 | | $ 8.74 | | $ 10.18 |
| Total ReturnA,B | | 23.50% | | 7.30% | | | | 34.78% | | (14.15)% | | (37.89)% |
| Ratios to Average Net AssetsD | | | | | | | | | | | | |
| Expenses before expense | | | | | | | | | | | | |
| reductions | | 1.62% | | 1.80% | | | | 2.20% | | 2.13% | | 1.88% |
| Expenses net of voluntary waiv- | | | | | | | | | | | | |
| ers, if any | | 1.56% | | 1.75% | | | | 1.75% | | 1.94% | | 1.88% |
| Expenses net of all reductions | | 1.55% | | 1.75% | | | | 1.75% | | 1.94% | | 1.84% |
| Net investment income (loss) | | (.54)% | | (.89)% | | | | (.76)% | | (1.27)% | | (1.10)% |
| Supplemental Data | | | | | | | | | | | | |
| Net assets, end of period (000 | | | | | | | | | | | | |
| omitted) | | $26,169 | | $17,884 | | $ | | 8,695 | | $ 3,380 | | $ 4,204 |
| Portfolio turnover rate | | 89% | | 83% | | | | 99% | | 128% | | 123% |
A Total returns would have been lower had certain expenses not been reduced during the periods shown.
B Total returns do not include the effect of the sales charges.
C Calculated based on average shares outstanding during the period.
D Expense ratios reflect operating expenses of the class. Expenses before reductions do not reflect amounts reimbursed by the investment adviser or reductions from brokerage service arrangements or other expense offset arrangements and do not represent the amount paid by the class during periods when reimbursements or reductions occur. Expenses net of any voluntary waivers reflect expenses after reimbursement by the investment adviser but prior to reductions from brokerage service arrangements or other expense offset arrangements. Expenses net of all reductions repre sent the net expenses paid by the class.
See accompanying notes which are an integral part of the financial statements.
| Financial Highlights — Class T | | | | | | | | |
| Years ended October 31, | | 2005 | | 2004 | | 2003 | | 2002 | | 2001 |
| Selected Per-Share Data | | | | | | | | | | |
| Net asset value, beginning of | | | | | | | | | | |
| period | | $ 12.51 | | $ 11.68 | | $ 8.69 | | $ 10.17 | | $ 17.72 |
| Income from Investment | | | | | | | | | | |
| Operations | | | | | | | | | | |
| Net investment income (loss)C | | (.11) | | (.14) | | (.09) | | (.15) | | (.20) |
| Net realized and unrealized | | | | | | | | | | |
| gain (loss) | | 3.00 | | .95 | | 3.08 | | (1.33) | | (6.14) |
| Total from investment operations | | 2.89 | | .81 | | 2.99 | | (1.48) | | (6.34) |
| Distributions from net investment | | | | | | | | | | |
| income | | — | | — | | — | | — | | (1.21) |
| Redemption fees added to paid in | | | | | | | | | | |
| capitalC | | 01 | | .02 | | — | | — | | — |
| Net asset value, end of period | | $ 15.41 | | $ 12.51 | | $ 11.68 | | $ 8.69 | | $ 10.17 |
| Total ReturnA,B | | 23.18% | | 7.11% | | 34.41% | | (14.55)% | | (38.16)% |
| Ratios to Average Net AssetsD | | | | | | | | | | |
| Expenses before expense | | | | | | | | | | |
| reductions | | 1.97% | | 2.19% | | 2.57% | | 2.45% | | 2.25% |
| Expenses net of voluntary waiv- | | | | | | | | | | |
| ers, if any | | 1.81% | | 2.00% | | 2.00% | | 2.19% | | 2.25% |
| Expenses net of all reductions | | 1.80% | | 2.00% | | 2.00% | | 2.18% | | 2.21% |
| Net investment income (loss) | | (.79)% | | (1.14)% | | (1.01)% | | (1.52)% | | (1.48)% |
| Supplemental Data | | | | | | | | | | |
| Net assets, end of period (000 | | | | | | | | | | |
| omitted) | | $15,610 | | $11,493 | | $11,823 | | $ 7,731 | | $10,363 |
| Portfolio turnover rate | | 89% | | 83% | | 99% | | 128% | | 123% |
A Total returns would have been lower had certain expenses not been reduced during the periods shown.
B Total returns do not include the effect of the sales charges.
C Calculated based on average shares outstanding during the period.
D Expense ratios reflect operating expenses of the class. Expenses before reductions do not reflect amounts reimbursed by the investment adviser or reductions from brokerage service arrangements or other expense offset arrangements and do not represent the amount paid by the class during periods when reimbursements or reductions occur. Expenses net of any voluntary waivers reflect expenses after reimbursement by the investment adviser but prior to reductions from brokerage service arrangements or other expense offset arrangements. Expenses net of all reductions repre sent the net expenses paid by the class.
See accompanying notes which are an integral part of the financial statements.
25 Annual Report
| Financial Highlights — Class B | | | | | | | | |
| Years ended October 31, | | 2005 | | 2004 | | 2003 | | 2002 | | 2001 |
| Selected Per-Share Data | | | | | | | | | | |
| Net asset value, beginning of | | | | | | | | | | |
| period | | $ 12.21 | | $ 11.46 | | $ 8.57 | | $ 10.07 | | $ 17.55 |
| Income from Investment | | | | | | | | | | |
| Operations | | | | | | | | | | |
| Net investment income (loss)C | | (.17) | | (.20) | | (.14) | | (.20) | | (.26) |
| Net realized and unrealized | | | | | | | | | | |
| gain (loss) | | 2.91 | | .93 | | 3.03 | | (1.30) | | (6.09) |
| Total from investment operations | | 2.74 | | .73 | | 2.89 | | (1.50) | | (6.35) |
| Distributions from net investment | | | | | | | | | | |
| income | | — | | — | | — | | — | | (1.13) |
| Redemption fees added to paid in | | | | | | | | | | |
| capitalC | | 01 | | .02 | | — | | — | | — |
| Net asset value, end of period | | $ 14.96 | | $ 12.21 | | $ 11.46 | | $ 8.57 | | $ 10.07 |
| Total ReturnA,B | | 22.52% | | 6.54% | | 33.72% | | (14.90)% | | (38.44)% |
| Ratios to Average Net AssetsD | | | | | | | | | | |
| Expenses before expense | | | | | | | | | | |
| reductions | | 2.43% | | 2.62% | | 3.03% | | 2.90% | | 2.74% |
| Expenses net of voluntary waiv- | | | | | | | | | | |
| ers, if any | | 2.31% | | 2.50% | | 2.50% | | 2.69% | | 2.74% |
| Expenses net of all reductions | | 2.30% | | 2.50% | | 2.50% | | 2.68% | | 2.71% |
| Net investment income (loss) | | (1.30)% | | (1.64)% | | (1.51)% | | (2.02)% | | (1.97)% |
| Supplemental Data | | | | | | | | | | |
| Net assets, end of period (000 | | | | | | | | | | |
| omitted) | | $18,916 | | $18,218 | | $14,761 | | $10,229 | | $13,523 |
| Portfolio turnover rate | | 89% | | 83% | | 99% | | 128% | | 123% |
A Total returns would have been lower had certain expenses not been reduced during the periods shown.
B Total returns do not include the effect of the contingent deferred sales charge.
C Calculated based on average shares outstanding during the period.
D Expense ratios reflect operating expenses of the class. Expenses before reductions do not reflect amounts reimbursed by the investment adviser or reductions from brokerage service arrangements or other expense offset arrangements and do not represent the amount paid by the class during periods when reimbursements or reductions occur. Expenses net of any voluntary waivers reflect expenses after reimbursement by the investment adviser but prior to reductions from brokerage service arrangements or other expense offset arrangements. Expenses net of all reductions repre sent the net expenses paid by the class.
See accompanying notes which are an integral part of the financial statements.
| Financial Highlights — Class C | | | | | | | | |
| Years ended October 31, | | 2005 | | 2004 | | 2003 | | 2002 | | 2001 |
| Selected Per-Share Data | | | | | | | | | | |
| Net asset value, beginning of | | | | | | | | | | |
| period | | $ 12.28 | | $ 11.52 | | $ 8.61 | | $ 10.13 | | $ 17.58 |
| Income from Investment | | | | | | | | | | |
| Operations | | | | | | | | | | |
| Net investment income (loss)C | | (.17) | | (.19) | | (.14) | | (.20) | | (.24) |
| Net realized and unrealized | | | | | | | | | | |
| gain (loss) | | 2.93 | | .93 | | 3.05 | | (1.32) | | (6.10) |
| Total from investment operations | | 2.76 | | .74 | | 2.91 | | (1.52) | | (6.34) |
| Distributions from net investment | | | | | | | | | | |
| income | | — | | — | | — | | — | | (1.11) |
| Redemption fees added to paid in | | | | | | | | | | |
| capitalC | | 01 | | .02 | | — | | — | | — |
| Net asset value, end of period | | $ 15.05 | | $ 12.28 | | $ 11.52 | | $ 8.61 | | $ 10.13 |
| Total ReturnA,B | | 22.56% | | 6.60% | | 33.80% | | (15.00)% | | (38.27)% |
| Ratios to Average Net AssetsD | | | | | | | | | | |
| Expenses before expense | | | | | | | | | | |
| reductions | | 2.27% | | 2.44% | | 2.82% | | 2.72% | | 2.59% |
| Expenses net of voluntary waiv- | | | | | | | | | | |
| ers, if any | | 2.27% | | 2.44% | | 2.50% | | 2.67% | | 2.59% |
| Expenses net of all reductions | | 2.26% | | 2.44% | | 2.49% | | 2.67% | | 2.55% |
| Net investment income (loss) | | (1.25)% | | (1.58)% | | (1.51)% | | (2.00)% | | (1.81)% |
| Supplemental Data | | | | | | | | | | |
| Net assets, end of period (000 | | | | | | | | | | |
| omitted) | | $34,144 | | $21,564 | | $10,374 | | $ 6,497 | | $ 8,170 |
| Portfolio turnover rate | | 89% | | 83% | | 99% | | 128% | | 123% |
A Total returns would have been lower had certain expenses not been reduced during the periods shown.
B Total returns do not include the effect of the contingent deferred sales charge.
C Calculated based on average shares outstanding during the period.
D Expense ratios reflect operating expenses of the class. Expenses before reductions do not reflect amounts reimbursed by the investment adviser or reductions from brokerage service arrangements or other expense offset arrangements and do not represent the amount paid by the class during periods when reimbursements or reductions occur. Expenses net of any voluntary waivers reflect expenses after reimbursement by the investment adviser but prior to reductions from brokerage service arrangements or other expense offset arrangements. Expenses net of all reductions repre sent the net expenses paid by the class.
See accompanying notes which are an integral part of the financial statements.
27 Annual Report
| Financial Highlights — Institutional Class | | | | | | | | | | |
| Years ended October 31, | | 2005 | | 2004 | | | | 2003 | | 2002 | | | | 2001 |
| Selected Per-Share Data | | | | | | | | | | | | | | |
| Net asset value, beginning of | | | | | | | | | | | | | | |
| period | | $ 12.83 | | $ 11.91 | | $ | | 8.82 | | $ 10.25 | | $ | | 17.88 |
| Income from Investment | | | | | | | | | | | | | | |
| Operations | | | | | | | | | | | | | | |
| Net investment income (loss)B | | (.02) | | (.06) | | | | (.05) | | (.08) | | | | (.10) |
| Net realized and unrealized | | | | | | | | | | | | | | |
| gain (loss) | | 3.08 | | .96 | | | | 3.14 | | (1.35) | | | | (6.16) |
| Total from investment operations | | 3.06 | | .90 | | | | 3.09 | | (1.43) | | | | (6.26) |
| Distributions from net investment | | | | | | | | | | | | | | |
| income | | — | | — | | | | — | | — | | | | (1.37) |
| Redemption fees added to paid in | | | | | | | | | | | | | | |
| capitalB | | 01 | | .02 | | | | — | | — | | | | — |
| Net asset value, end of period | | $ 15.90 | | $ 12.83 | | $ | | 11.91 | | $ 8.82 | | $ | | 10.25 |
| Total ReturnA | | 23.93% | | 7.72% | | | | 35.03% | | (13.95)% | | | | (37.64)% |
| Ratios to Average Net AssetsC | | | | | | | | | | | | | | |
| Expenses before expense | | | | | | | | | | | | | | |
| reductions | | 1.19% | | 1.36% | | | | 1.67% | | 1.52% | | | | 1.48% |
| Expenses net of voluntary waiv- | | | | | | | | | | | | | | |
| ers, if any | | 1.19% | | 1.36% | | | | 1.50% | | 1.51% | | | | 1.48% |
| Expenses net of all reductions | | 1.17% | | 1.36% | | | | 1.49% | | 1.51% | | | | 1.44% |
| Net investment income (loss) | | (.17)% | | (.50)% | | | | (.51)% | | (.84)% | | | | (.70)% |
| Supplemental Data | | | | | | | | | | | | | | |
| Net assets, end of period (000 | | | | | | | | | | | | | | |
| omitted) | | $ 8,399 | | $ 3,919 | | $ | | 3,905 | | $ 5,612 | | $ | | 795 |
| Portfolio turnover rate | | 89% | | 83% | | | | 99% | | 128% | | | | 123% |
A Total returns would have been lower had certain expenses not been reduced during the periods shown.
B Calculated based on average shares outstanding during the period.
C Expense ratios reflect operating expenses of the class. Expenses before reductions do not reflect amounts reimbursed by the investment adviser or reductions from brokerage service arrangements or other expense offset arrangements and do not represent the amount paid by the class during periods when reimbursements or reductions occur. Expenses net of any voluntary waivers reflect expenses after reimbursement by the investment adviser but prior to reductions from brokerage service arrangements or other expense offset arrangements. Expenses net of all reductions repre sent the net expenses paid by the class.
See accompanying notes which are an integral part of the financial statements.
Notes to Financial Statements
For the period ended October 31, 2005
|
1. Significant Accounting Policies.
Fidelity Advisor Japan Fund (the fund) is a fund of Fidelity Advisor Series VIII (the trust) and is authorized to issue an unlimited number of shares. The trust is registered under the Investment Company Act of 1940, as amended (the 1940 Act), as an open-end management investment company organized as a Massachusetts business trust.
The fund offers Class A, Class T, Class B, Class C and Institutional Class shares, each of which has equal rights as to assets and voting privileges. Each class has exclusive voting rights with respect to matters that affect that class. Class B shares will automatically convert to Class A shares after a holding period of seven years from the initial date of purchase. Investment income, realized and unrealized capital gains and losses, the common expenses of the fund, and certain fund-level expense reductions, if any, are allocated on a pro rata basis to each class based on the relative net assets of each class to the total net assets of the fund. Each class differs with respect to transfer agent and distribution and service plan fees incurred. Certain expense reductions also differ by class.
The fund may invest in affiliated money market central funds (Money Market Central Funds) which are open-end investment companies available to investment companies and other accounts managed by Fidelity Management & Research Company (FMR) and its affiliates. The financial statements have been prepared in conformity with accounting principles generally accepted in the United States of America, which require management to make certain estimates and assumptions at the date of the financial statements. The following summarizes the significant accounting policies of the fund:
Security Valuation. Investments are valued and net asset value (NAV) per share is calculated (NAV calculation) as of the close of business of the New York Stock Exchange (NYSE), normally 4:00 p.m. Eastern time. Wherever possible, the fund uses independent pricing services approved by the Board of Trustees to value its investments.
Equity securities, including restricted securities, for which market quotations are readily available, are valued at the last reported sale price or official closing price as reported by an independent pricing service on the primary market or exchange on which they are traded. In the event there were no sales during the day or closing prices are not available, securities are valued at the last quoted bid price. Investments in open-end mutual funds, are valued at their closing net asset value each business day. Short-term securities with remaining maturities of sixty days or less for which quotations are not readily available are valued at amortized cost, which approximates value.
When current market prices or quotations are not readily available or do not accurately reflect fair value, valuations may be determined in accordance with procedures adopted by the Board of Trustees. For example, when developments occur between the close of a market and the close of the NYSE that may materially affect the value of some or all of
29 Annual Report
Notes to Financial Statements - continued
1. Significant Accounting Policies - continued
Security Valuation - continued
the securities, or when trading in a security is halted, those securities may be fair valued. Factors used in the determination of fair value may include monitoring news to identify significant market or security specific events such as changes in the value of U.S. securities market, reviewing developments in foreign markets and evaluating the performance of ADRs, futures contracts and exchange-traded funds. Because the fund’s utilization of fair value pricing depends on market activity, the frequency with which fair value pricing is used can not be predicted and may be utilized to a significant extent. The value of securities used for NAV calculation under fair value pricing may differ from published prices for the same securities.
Foreign Currency. The fund uses foreign currency contracts to facilitate transactions in foreign-denominated securities. Losses from these transactions may arise from changes in the value of the foreign currency or if the counterparties do not perform under the contracts’ terms.
Foreign-denominated assets, including investment securities, and liabilities are translated into U.S. dollars at the exchange rate at period end. Purchases and sales of investment securities, income and dividends received and expenses denominated in foreign currencies are translated into U.S. dollars at the exchange rate in effect on the transaction date.
The effects of exchange rate fluctuations on investments are included with the net realized and unrealized gain (loss) on investment securities. Other foreign currency transactions resulting in realized and unrealized gain (loss) are disclosed separately.
Investment Transactions and Income. Security transactions are accounted for as of trade date. Gains and losses on securities sold are determined on the basis of identified cost. Dividend income is recorded on the ex-dividend date, except for certain dividends from foreign securities where the ex-dividend date may have passed, which are recorded as soon as the fund is informed of the ex-dividend date. Non-cash dividends included in dividend income, if any, are recorded at the fair market value of the securities received. Interest income is accrued as earned. Interest income includes coupon interest and amortization of premium and accretion of discount on debt securities. Investment income is recorded net of foreign taxes withheld where recovery of such taxes is uncertain.
Expenses. Most expenses of the trust can be directly attributed to a fund. Expenses which cannot be directly attributed are apportioned among each fund in the trust.
1. Significant Accounting Policies - continued
Income Tax Information and Distributions to Shareholders. Each year, the fund intends to qualify as a regulated investment company by distributing all of its taxable income and realized gains under Subchapter M of the Internal Revenue Code. As a result, no provision for income taxes is required in the accompanying financial statements. Foreign taxes are provided for based on the fund’s understanding of the tax rules and rates that exist in the foreign markets in which it invests.
Distributions are recorded on the ex-dividend date. Income dividends and capital gain distributions are declared separately for each class. Income and capital gain distributions are determined in accordance with income tax regulations, which may differ from generally accepted accounting principles.
Capital accounts within the financial statements are adjusted for permanent book-tax differences. These adjustments have no impact on net assets or the results of operations. Temporary book-tax differences will reverse in a subsequent period.
Book-tax differences are primarily due to foreign currency transactions, passive foreign investment companies (PFIC), net operating losses, capital loss carryforwards and losses deferred due to wash sales.
The tax-basis components of distributable earnings and the federal tax cost as of period end were as follows:
| Unrealized appreciation | | $ | | 16,258,916 |
| Unrealized depreciation | | | | (3,760,739) |
| Net unrealized appreciation (depreciation) | | | | 12,498,177 |
| Capital loss carryforward | | | | (20,478,737) |
| |
| Cost for federal income tax purposes | | $ | | 93,712,524 |
Short-Term Trading (Redemption) Fees. Shares held in the fund less than 90 days are subject to a redemption fee equal to 1.50% of the proceeds of the redeemed shares. All redemption fees, including any estimated redemption fees paid by FMR, are retained by the fund and accounted for as an addition to paid in capital.
Repurchase Agreements. FMR has received an Exemptive Order from the Securities and Exchange Commission (the SEC) which permits the fund and other affiliated entities of FMR to transfer uninvested cash balances into joint trading accounts which are then invested in repurchase agreements. The fund may also invest directly with institutions in repurchase agreements. Repurchase agreements are collateralized by government or non-government securities. Collateral is held in segregated accounts with custodian banks and may be obtained in the event of a default of the counterparty. The
31 Annual Report
Notes to Financial Statements - continued
2. Operating Policies - continued
Repurchase Agreements - continued
fund monitors, on a daily basis, the value of the collateral to ensure it is at least equal to the principal amount of the repurchase agreement (including accrued interest). In the event of a default by the counterparty, realization of the collateral proceeds could be delayed, during which time the value of the collateral may decline.
3. Purchases and Sales of Investments.
Purchases and sales of securities, other than short-term securities and U.S. government securities, aggregated $82,866,479 and $69,717,621, respectively.
4. Fees and Other Transactions with Affiliates.
Management Fee. FMR and its affiliates provide the fund with investment management related services for which the fund pays a monthly management fee. The management fee is the sum of an individual fund fee rate that is based on an annual rate of .45% of the fund’s average net assets and a group fee rate that averaged 0.27% during the period. The group fee rate is based upon the average net assets of all the mutual funds advised by FMR. The group fee rate decreases as assets under management increase and increases as assets under management decrease. For the period, the total annual management fee rate was .72% of the fund’s average net assets.
Distribution and Service Plan. In accordance with Rule 12b-1 of the 1940 Act, the fund has adopted separate Distribution and Service Plans for each class of shares. Certain classes pay Fidelity Distributors Corporation (FDC), an affiliate of FMR, separate Distribution and Service Fees, each of which is based on an annual percentage of each class’ average net assets. In addition, FDC may pay financial intermediaries for selling shares of the fund and providing shareholder support services. For the period, the Distribution and Service Fee rates and the total amounts paid to and retained by FDC were as follows:
| | | Distribution | | Service | | | | Paid to | | | | Retained |
| | | Fee | | Fee | | | | FDC | | | | by FDC |
| Class A | | 0% | | .25% | | $ | | 45,952 | | $ | | 91 |
| Class T | | 25% | | .25% | | | | 65,664 | | | | 50 |
| Class B | | 75% | | .25% | | | | 177,308 | | | | 133,164 |
| Class C | | 75% | | .25% | | | | 238,056 | | | | 99,944 |
| |
| | | | | | | $ | | 526,980 | | $ | | 233,249 |
Sales Load. FDC receives a front-end sales charge of up to 5.75% for selling Class A shares, and 3.50% for selling Class T shares, some of which is paid to financial intermediaries for selling shares of the fund. FDC receives the proceeds of contingent deferred sales charges levied on Class A, Class T, Class B, and Class C redemptions. These charges
4. Fees and Other Transactions with Affiliates - continued
Sales Load - continued
depend on the holding period. The deferred sales charges range from 5% to 1% for Class B, 1% for Class C, and .25% for certain purchases of Class A and Class T shares.
| For the period, sales charge amounts retained by FDC were as follows: | | |
| | | | | Retained |
| | | | | by FDC |
| Class A | | $ | | 33,354 |
| Class T | | | | 9,974 |
| Class B* | | | | 61,598 |
| Class C* | | | | 7,850 |
| | | $ | | 112,776 |
* When Class B and Class C shares are initially sold, FDC pays commissions from its own resources to financial intermediaries through which the sales are made.
Transfer Agent Fees. Fidelity Investments Institutional Operations Company, Inc. (FIIOC), an affiliate of FMR, is the transfer, dividend disbursing and shareholder servicing agent for each class of the fund. FIIOC receives account fees and asset-based fees that vary according to the account size and type of account of the shareholders of the respective classes of the fund. FIIOC pays for typesetting, printing and mailing of shareholder reports, except proxy statements. For the period the total transfer agent fees paid by each class to FIIOC, were as follows:
| | | | | | | % of |
| | | | | | | Average |
| | | | | Amount | | Net Assets |
| Class A | | $ | | 63,363 | | .34 |
| Class T | | | | 57,771 | | .44 |
| Class B | | | | 72,037 | | .41 |
| Class C | | | | 58,205 | | .24 |
| Institutional Class | | | | 8,210 | | .16 |
| | | $ | | 259,586 | | |
Accounting and Security Lending Fees. Fidelity Service Company, Inc. (FSC), an affiliate of FMR, maintains the fund’s accounting records. The accounting fee is based on the level of average net assets for the month. Under a separate contract, FSC administers the security lending program. The security lending fee is based on the number and duration of lending transactions.
33 Annual Report
Notes to Financial Statements - continued
4. Fees and Other Transactions with Affiliates - continued
Affiliated Central Funds. The fund may invest in Money Market Central Funds which seek preservation of capital and current income and are managed by Fidelity Investments Money Management, Inc. (FIMM), an affiliate of FMR.
The Money Market Central Funds do not pay a management fee. Income distributions earned by the fund are recorded as income in the accompanying financial statements and totaled $74,776 for the period.
5. Committed Line of Credit.
|
The fund participates with other funds managed by FMR in a $4.2 billion credit facility (the “line of credit”) to be utilized for temporary or emergency purposes to fund shareholder redemptions or for other short-term liquidity purposes. The fund has agreed to pay commitment fees on its pro rata portion of the line of credit. During the period, there were no borrowings on this line of credit.
The fund lends portfolio securities from time to time in order to earn additional income. The fund receives collateral (in the form of U.S. Treasury obligations, letters of credit and/or cash) against the loaned securities and maintains collateral in an amount not less than 100% of the market value of the loaned securities during the period of the loan. The market value of the loaned securities is determined at the close of business of the fund and any additional required collateral is delivered to the fund on the next business day. If the borrower defaults on its obligation to return the securities loaned because of insolvency or other reasons, a fund could experience delays and costs in recovering the securities loaned or in gaining access to the collateral. Cash collateral is invested in the Fidelity Securities Lending Cash Central Fund. The value of loaned securities and cash collateral at period end are disclosed on the fund’s Statement of Assets and Liabilities. Security lending income represents the income earned on investing cash collateral, less fees and expenses associated with the loan, plus any premium payments that may be received on the loan of certain types of securities.
FMR voluntarily agreed to reimburse each class to the extent annual operating expenses exceeded certain levels of average net assets as noted in the table below. Some expenses, for example interest expense, are excluded from this reimbursement.
| The following classes were in reimbursement during the period: | | | | |
| | | Expense | | | | Reimbursement |
| | | Limitations | | | | from adviser |
| Class A | | 1.75% | | -- | | 1.50%* | | $ | | 11,103 |
| Class T | | 2.00% | | -- | | 1.75%* | | | | 20,451 |
| Class B | | 2.50% | | -- | | 2.25%* | | | | 21,499 |
| Class C | | 2.50% | | -- | | 2.25%* | | | | — |
| Institutional Class | | 1.50% | | -- | | 1.25%* | | | | — |
| | | | | | | | | $ | | 53,053 |
| * Expense limitation in effect at period end. | | | | | | | | | | |
Many of the brokers with whom FMR places trades on behalf of the fund provided services to the fund in addition to trade execution. These services included payments of certain expenses on behalf of the fund totaling $8,255 for the period.
The fund’s organizational documents provide former and current trustees and officers with a limited indemnification against liabilities arising in connection with the performance of their duties to the fund. In the normal course of business, the fund may also enter into contracts that provide general indemnifications. The fund’s maximum exposure under these arrangements is unknown as this would be dependent on future claims that may be made against the fund. The risk of material loss from such claims is considered remote.
35 Annual Report
Notes to Financial Statements - continued
9. Share Transactions.
Transactions for each class of shares were as follows:
Shares Dollars
| Years ended October 31, | | 2005 | | 2004 | | | | 2005 | | | | 2004 |
| Class A | | | | | | | | | | | | |
| Shares sold | | 1,120,934 | | 2,153,586 | | $ 16,117,987 | | $ 28,186,518 |
| Shares redeemed | | (859,010) | | (1,477,090) | | (11,688,765) | | (18,736,827) |
| Net increase (decrease) | | 261,924 | | 676,496 | | $ | | 4,429,222 | | $ | | 9,449,691 |
| Class T | | | | | | | | | | | | |
| Shares sold | | 430,689 | | 593,692 | | $ | | 6,034,540 | | $ | | 7,826,011 |
| Shares redeemed | | (336,350) | | (686,792) | | | | (4,607,590) | | | | (8,546,610) |
| Net increase (decrease) | | 94,339 | | (93,100) | | $ | | 1,426,950 | | $ | | (720,599) |
| Class B | | | | | | | | | | | | |
| Shares sold | | 255,973 | | 565,247 | | $ | | 3,480,072 | | $ | | 7,156,870 |
| Shares redeemed | | (483,966) | | (361,283) | | | | (6,366,382) | | | | (4,393,797) |
| Net increase (decrease) | | (227,993) | | 203,964 | | $ | | (2,886,310) | | $ | | 2,763,073 |
| Class C | | | | | | | | | | | | |
| Shares sold | | 1,191,024 | | 1,188,114 | | $ 16,663,352 | | $ 15,297,584 |
| Shares redeemed | | (679,047) | | (332,125) | | | | (9,010,210) | | | | (4,109,703) |
| Net increase (decrease) | | 511,977 | | 855,989 | | $ | | 7,653,142 | | $ 11,187,881 |
| Institutional Class | | | | | | | | | | | | |
| Shares sold | | 316,545 | | 172,730 | | $ | | 4,655,271 | | $ | | 2,327,308 |
| Shares redeemed | | (93,863) | | (195,170) | | | | (1,305,631) | | | | (2,463,608) |
| Net increase (decrease) | | 222,682 | | (22,440) | | $ | | 3,349,640 | | $ | | (136,300) |
Report of Independent Registered Public Accounting Firm
To the Trustees of Fidelity Advisor Series VIII and the Shareholders of Fidelity Advisor Japan Fund:
In our opinion, the accompanying statement of assets and liabilities, including the schedule of investments, and the related statements of operations and of changes in net assets and the financial highlights present fairly, in all material respects, the financial position of Fidelity Advisor Japan Fund (a fund of Fidelity Advisor Series VIII) at October 31, 2005 and the results of its operations, the changes in its net assets and the financial highlights for the periods indicated, in conformity with accounting principles generally accepted in the United States of America. These financial statements and financial highlights (hereafter referred to as “financial statements”) are the responsibility of the Fidelity Advisor Japan Fund’s management; our responsibility is to express an opinion on these financial statements based on our audits. We conducted our audits of these financial statements in accordance with the standards of the Public Company Accounting Oversight Board (United States). Those standards require that we plan and perform the audit to obtain reasonable assurance about whether the financial statements are free of material misstatement. An audit includes examining, on a test basis, evidence supporting the amounts and disclosures in the financial statements, assessing the accounting principles used and significant estimates made by management, and evaluating the overall financial statement presentation. We believe that our audits, which included confirmation of securities at October 31, 2005 by correspondence with the custodian and brokers, provide a reasonable basis for our opinion.
/s/ PricewaterhouseCoopers LLP
PricewaterhouseCoopers LLP
Boston, Massachusetts
December 19, 2005
|
37 Annual Report
Trustees and Officers
The Trustees, Members of the Advisory Board, and executive officers of the trust and fund, as applicable, are listed below. The Board of Trustees governs the fund and is responsible for protecting the interests of shareholders. The Trustees are experienced executives who meet periodically throughout the year to oversee the fund’s activities, review contractual arrangements with companies that provide services to the fund, and review the fund’s performance. Except for William O. McCoy, Stephen P. Jonas, and Kenneth L. Wolfe, each of the Trustees oversees 322 funds advised by FMR or an affiliate. Mr. McCoy oversees 324 funds advised by FMR or an affiliate. Mr. Jonas and Mr. Wolfe oversee 319 funds advised by FMR or an affiliate.
The Trustees hold office without limit in time except that (a) any Trustee may resign; (b) any Trustee may be removed by written instrument, signed by at least two-thirds of the number of Trustees prior to such removal; (c) any Trustee who requests to be retired or who has become incapacitated by illness or injury may be retired by written instrument signed by a majority of the other Trustees; and (d) any Trustee may be removed at any special meeting of shareholders by a two-thirds vote of the outstanding voting securities of the trust. Each Trustee who is not an interested person (as defined in the 1940 Act) (Independent Trustee), shall retire not later than the last day of the calendar year in which his or her 72nd birthday occurs. The Independent Trustees may waive this mandatory retirement age policy with respect to individual Trustees. The executive officers and Advisory Board Members hold office without limit in time, except that any officer and Advisory Board Member may resign or may be removed by a vote of a majority of the Trustees at any regular meeting or any special meeting of the Trustees. Except as indicated, each individual has held the office shown or other offices in the same company for the past five years.
The fund’s Statement of Additional Information (SAI) includes more information about the Trustees. To request a free copy, call Fidelity at 1-877-208-0098.
Interested Trustees*:
Correspondence intended for each Trustee who is an interested person may be sent to Fidelity Investments, 82 Devonshire Street, Boston, Massachusetts 02109.
| Name, Age; Principal Occupation |
| |
| Edward C. Johnson 3d (75)** |
| |
| Year of Election or Appointment: 1983 |
| Mr. Johnson is Chairman of the Board of Trustees. Mr. Johnson serves as |
| Chief Executive Officer, Chairman, and a Director of FMR Corp.; a Di- |
| rector and Chairman of the Board and of the Executive Committee of |
| FMR; Chairman and a Director of Fidelity Management & Research (Far |
| East) Inc.; Chairman and a Director of Fidelity Investments Money Man- |
| agement, Inc.; and Chairman (2001-present) and a Director |
| (2000-present) of FMR Co., Inc. |
Annual Report 38
| Name, Age; Principal Occupation |
| |
| Abigail P. Johnson (43)** |
| |
| Year of Election or Appointment: 2001 |
| Ms. Johnson serves as President of Fidelity Employer Services Company |
| (FESCO) (2005-present). She is President and a Director of Fidelity In- |
| vestments Money Management, Inc. (2001-present), FMR Co., Inc. |
| (2001-present), and a Director of FMR Corp. Previously, Ms. Johnson |
| served as President and a Director of FMR (2001-2005), Senior Vice |
| President of the Fidelity funds (2001-2005), and managed a number of |
| Fidelity funds. |
| |
| Stephen P. Jonas (52) |
| |
| Year of Election or Appointment: 2005 |
| Mr. Jonas is Senior Vice President of Advisor Japan. He also serves as |
| Senior Vice President of other Fidelity funds (2005-present). Mr. Jonas is |
| Executive Director of FMR (2005-present). Previously, Mr. Jonas served |
| as President of Fidelity Enterprise Operations and Risk Services |
| (2004-2005), Chief Administrative Officer (2002-2004), and Chief |
| Financial Officer of FMR Co. (1998-2000). Mr. Jonas has been with |
| Fidelity Investments since 1987 and has held various financial and man- |
| agement positions including Chief Financial Officer of FMR. In addition, |
| he serves on the Boards of Boston Ballet (2003-present) and Simmons |
| College (2003-present). |
| |
| Robert L. Reynolds (53) |
| |
| Year of Election or Appointment: 2003 |
| Mr. Reynolds is a Director (2003-present) and Chief Operating Officer |
| (2002-present) of FMR Corp. He also serves on the Board at Fidelity |
| Investments Canada, Ltd. (2000-present). Previously, Mr. Reynolds |
| served as President of Fidelity Investments Institutional Retirement Group |
| (1996-2000). |
* Trustees have been determined to be “Interested Trustees” by virtue of, among other things, their affiliation with the trust or various entities under common control with FMR.
** Edward C. Johnson 3d, Trustee, is Abigail P. Johnson’s father.
39 Annual Report
Trustees and Officers - continued
Independent Trustees:
Correspondence intended for each Independent Trustee (that is, the Trustees other than the Interested Trustees) may be sent to Fidelity Investments, P.O. Box 55235, Boston, Massachusetts 02205-5235.
| Name, Age; Principal Occupation |
| |
| Dennis J. Dirks (57) |
| |
| Year of Election or Appointment: 2005 |
| Prior to his retirement in May 2003, Mr. Dirks was Chief Operating |
| Officer and a member of the Board of The Depository Trust & Clearing |
| Corporation (DTCC) (1999-2003). He also served as President, Chief |
| Operating Officer, and Board member of The Depository Trust |
| Company (DTC) (1999-2003) and President and Board member of the |
| National Securities Clearing Corporation (NSCC) (1999-2003). In addi- |
| tion, Mr. Dirks served as Chief Executive Officer and Board member of |
| the Government Securities Clearing Corporation (2001-2003) and Chief |
| Executive Officer and Board member of the Mortgage-Backed Securities |
| Clearing Corporation (2001-2003). Mr. Dirks also serves as a Trustee of |
| Manhattan College (2005-present). |
| |
| Robert M. Gates (62) |
| |
| Year of Election or Appointment: 1997 |
| Dr. Gates is Vice Chairman of the Independent Trustees (2005-present). |
| Dr. Gates is President of Texas A&M University (2002-present). He was |
| Director of the Central Intelligence Agency (CIA) from 1991 to 1993. |
| From 1989 to 1991, Dr. Gates served as Assistant to the President of |
| the United States and Deputy National Security Advisor. Dr. Gates is a |
| Director of NACCO Industries, Inc. (mining and manufacturing), Parker |
| Drilling Co., Inc. (drilling and rental tools for the energy industry, |
| 2001-present), and Brinker International (restaurant management, |
| 2003-present). Previously, Dr. Gates served as a Director of LucasVarity |
| PLC (automotive components and diesel engines), a Director of TRW Inc. |
| (automotive, space, defense, and information technology), and Dean of |
| the George Bush School of Government and Public Service at Texas |
| A&M University (1999-2001). Dr. Gates also is a Trustee of the Forum |
| for International Policy. |
Annual Report 40
| Name, Age; Principal Occupation |
| |
| George H. Heilmeier (69) |
| |
| Year of Election or Appointment: 2004 |
| Dr. Heilmeier is Chairman Emeritus of Telcordia Technologies (commu- |
| nication software and systems), where prior to his retirement, he served |
| as company Chairman and Chief Executive Officer. He currently serves |
| on the Boards of Directors of The Mitre Corporation (systems engineer- |
| ing and information technology support for the government), and HRL |
| Laboratories (private research and development, 2004-present). He is |
| Chairman of the General Motors Science & Technology Advisory Board |
| and a Life Fellow of the Institute of Electrical and Electronics Engineers |
| (IEEE) (2000-present). Dr. Heilmeier is a member of the Defense Science |
| Board and the National Security Agency Advisory Board. He is also a |
| member of the National Academy of Engineering, the American |
| Academy of Arts and Sciences, and the Board of Overseers of the |
| School of Engineering and Applied Science of the University of Pennsyl- |
| vania. Previously, Dr. Heilmeier served as a Director of TRW Inc. (auto- |
| motive, space, defense, and information technology, 1992-2002), |
| Compaq (1994-2002), Automatic Data Processing, Inc. (ADP) |
| (technology-based business outsourcing, 1995-2002), INET Technolo- |
| gies Inc. (telecommunications network surveillance, 2001-2004), and |
| Teletech Holdings (customer management services). He is the recipient of |
| the 2005 Kyoto Prize in Advanced Technology for his invention of the |
| liquid display. |
| |
| Marie L. Knowles (59) |
| |
| Year of Election or Appointment: 2001 |
| Prior to Ms. Knowles’ retirement in June 2000, she served as Executive |
| Vice President and Chief Financial Officer of Atlantic Richfield Company |
| (ARCO) (diversified energy, 1996-2000). From 1993 to 1996, she was |
| a Senior Vice President of ARCO and President of ARCO Transportation |
| Company. She served as a Director of ARCO from 1996 to 1998. She |
| currently serves as a Director of Phelps Dodge Corporation (copper |
| mining and manufacturing) and McKesson Corporation (healthcare ser- |
| vice, 2002-present). Ms. Knowles is a Trustee of the Brookings Institution |
| and the Catalina Island Conservancy and also serves as a member of |
| the Advisory Board for the School of Engineering of the University of |
| Southern California. |
41 Annual Report
Trustees and Officers - continued
| Name, Age; Principal Occupation |
| |
| Ned C. Lautenbach (61) |
| |
| Year of Election or Appointment: 2000 |
| Mr. Lautenbach has been a partner of Clayton, Dubilier & Rice, Inc. |
| (private equity investment firm) since September 1998. Previously, Mr. |
| Lautenbach was with the International Business Machines Corporation |
| (IBM) from 1968 until his retirement in 1998. Mr. Lautenbach serves as |
| a Director of Italtel Holding S.p.A. (telecommunications (Milan, Italy), |
| 2004-present) and Eaton Corporation (diversified industrial) as well as |
| the Philharmonic Center for the Arts in Naples, Florida. He also is a |
| member of the Board of Trustees of Fairfield University (2005-present), |
| as well as a member of the Council on Foreign Relations. |
| |
| Marvin L. Mann (72) |
| |
| Year of Election or Appointment: 1993 |
| Mr. Mann is Chairman of the Independent Trustees (2001-present). He is |
| Chairman Emeritus of Lexmark International, Inc. (computer |
| peripherals), where he served as CEO until April 1998, retired as |
| Chairman May 1999, and remains a member of the Board. Prior to |
| 1991, he held the positions of Vice President of International Business |
| Machines Corporation (IBM) and President and General Manager of |
| various IBM divisions and subsidiaries. He is a member of the Executive |
| Committee of the Independent Director’s Council of the Investment Com- |
| pany Institute. In addition, Mr. Mann is a member of the President’s |
| Cabinet at the University of Alabama and the Board of Visitors of the |
| Culverhouse College of Commerce and Business Administration at the |
| University of Alabama. |
| |
| William O. McCoy (72) |
| |
| Year of Election or Appointment: 1997 |
| Prior to his retirement in December 1994, Mr. McCoy was Vice Chair- |
| man of the Board of BellSouth Corporation (telecommunications) and |
| President of BellSouth Enterprises. He is currently a Director of Liberty |
| Corporation (holding company), Duke Realty Corporation (real estate), |
| and Progress Energy, Inc. (electric utility). He is also a partner of Frank- |
| lin Street Partners (private investment management firm) and a member |
| of the Research Triangle Foundation Board. In addition, Mr. McCoy |
| served as the Interim Chancellor (1999-2000) and a member of the |
| Board of Visitors for the University of North Carolina at Chapel Hill and |
| currently serves on the Board of Directors of the University of North |
| Carolina Health Care System and the Board of Visitors of the Kenan- |
| Flagler Business School (University of North Carolina at Chapel Hill). He |
| also served as Vice President of Finance for the University of North Car- |
| olina (16-school system). |
Annual Report 42
| Name, Age; Principal Occupation |
| |
| Cornelia M. Small (61) |
| |
| Year of Election or Appointment: 2005 |
| Ms. Small is a member (2000-present) and Chairperson (2002-present) |
| of the Investment Committee, and a member (2002-present) of the |
| Board of Trustees of Smith College. Previously, she served as Chief In- |
| vestment Officer (1999-2000), Director of Global Equity Investments |
| (1996-1999), and a member of the Board of Directors of Scudder, |
| Stevens & Clark (1990-1997) and Scudder Kemper Investments |
| (1997-1998). In addition, Ms. Small served as Co-Chair (2000-2003) |
| of the Annual Fund for the Fletcher School of Law and Diplomacy. |
| |
| William S. Stavropoulos (66) |
| |
| Year of Election or Appointment: 2001 |
| Mr. Stavropoulos is Chairman of the Board (2000-present) and a Mem- |
| ber of the Board of Directors of The Dow Chemical Company. Since |
| joining The Dow Chemical Company in 1967, Mr. Stavropoulos served |
| in numerous senior management positions, including President |
| (1993-2000; 2002-2003), CEO (1995-2000; 2002-2004), and Chair- |
| man of the Executive Committee (2000-2004). Currently, he is a Direc- |
| tor of NCR Corporation (data warehousing and technology solutions), |
| BellSouth Corporation (telecommunications), Chemical Financial Corpo- |
| ration, Maersk Inc. (industrial conglomerate, 2002-present), and Metal- |
| mark Capital (private equity investment firm, 2005-present). He also |
| serves as a member of the Board of Trustees of the American Enterprise |
| Institute for Public Policy Research. In addition, Mr. Stavropoulos is a |
| member of The Business Council, J.P. Morgan International Council and |
| the University of Notre Dame Advisory Council for the College of |
| Science. |
| |
| Kenneth L. Wolfe (66) |
| |
| Year of Election or Appointment: 2005 |
| Mr. Wolfe also serves as a Trustee (2005-present) or Member of the |
| Advisory Board (2004-present) of other investment companies advised |
| by FMR. Prior to his retirement in 2001, Mr. Wolfe was Chairman and |
| Chief Executive Officer of Hershey Foods Corporation (1993-2001). He |
| currently serves as a member of the boards of Adelphia Communica- |
| tions Corporation (2003-present), Bausch & Lomb, Inc., and Revlon Inc. |
| (2004-present). |
43 Annual Report
Trustees and Officers - continued
Advisory Board Members and Executive Officers:
Correspondence intended for Mr. Gamper may be sent to Fidelity Investments, P.O. Box 55235, Boston, Massachusetts 02205-5235. Correspondence intended for each executive officer and Mr. Lynch may be sent to Fidelity Investments, 82 Devonshire Street, Boston, Massachusetts 02109.
| Name, Age; Principal Occupation |
| |
| Albert R. Gamper, Jr. (63) |
| |
| Year of Election or Appointment: 2005 |
| Member of the Advisory Board of Fidelity Advisor Series VIII. Prior to his |
| retirement in December 2004, Mr. Gamper served as Chairman of the |
| Board of CIT Group Inc. (commercial finance). During his tenure with |
| CIT Group Inc. Mr. Gamper served in numerous senior management |
| positions, including Chairman (1987-1989; 1999-2001; 2002-2004), |
| Chief Executive Officer (1987-2004), and President (1989-2002). He |
| currently serves as a member of the Board of Directors of Public Service |
| Enterprise Group (utilities, 2001-present), Chairman of the Board of |
| Governors, Rutgers University (2004-present), and Chairman of the |
| Board of Saint Barnabas Health Care System. |
| |
| Peter S. Lynch (61) |
| |
| Year of Election or Appointment: 2003 |
| Member of the Advisory Board of Fidelity Advisor Series VIII. Vice |
| Chairman and a Director of FMR, and Vice Chairman (2001-present) |
| and a Director (2000-present) of FMR Co., Inc. Previously, Mr. Lynch |
| served as a Trustee of the Fidelity funds (1990-2003). In addition, he |
| serves as a Trustee of Boston College, Massachusetts Eye & Ear |
| Infirmary, Historic Deerfield, John F. Kennedy Library, and the Museum |
| of Fine Arts of Boston. |
| |
| Dwight D. Churchill (51) |
| |
| Year of Election or Appointment: 2005 |
| Vice President of Advisor Japan. Mr. Churchill also serves as Vice Presi- |
| dent of certain Equity Funds (2005-present) and certain High Income |
| Funds (2005-present). Previously, he served as Head of Fidelity’s Fixed- |
| Income Division (2000-2005), Vice President of Fidelity’s Money Market |
| Funds (2000-2005), Vice President of Fidelity’s Bond Funds, and Senior |
| Vice President of FIMM (2000) and FMR. Mr. Churchill joined Fidelity in |
| 1993 as Vice President and Group Leader of Taxable Fixed-Income |
| Investments. |
Annual Report 44
| Name, Age; Principal Occupation |
| |
| Eric D. Roiter (56) |
| |
| Year of Election or Appointment: 1998 |
| Secretary of Advisor Japan. He also serves as Secretary of other Fidelity |
| funds; Vice President, General Counsel, and Secretary of FMR Co., Inc. |
| (2001-present) and FMR; Assistant Secretary of Fidelity Management & |
| Research (U.K.) Inc. (2001-present), Fidelity Management & Research |
| (Far East) Inc. (2001-present), and Fidelity Investments Money Manage- |
| ment, Inc. (2001-present). Mr. Roiter is an Adjunct Member, Faculty of |
| Law, at Boston College Law School (2003-present). Previously, Mr. Roiter |
| served as Vice President and Secretary of Fidelity Distributors Corpora- |
| tion (FDC) (1998-2005). |
| |
| Stuart Fross (46) |
| |
| Year of Election or Appointment: 2003 |
| Assistant Secretary of Advisor Japan. Mr. Fross also serves as Assistant |
| Secretary of other Fidelity funds (2003-present), Vice President and Sec- |
| retary of FDC (2005-present), and is an employee of FMR. |
| |
| Christine Reynolds (47) |
| |
| Year of Election or Appointment: 2004 |
| President, Treasurer, and Anti-Money Laundering (AML) officer of Advi- |
| sor Japan. Ms. Reynolds also serves as President, Treasurer, and AML |
| officer of other Fidelity funds (2004) and is a Vice President (2003) and |
| an employee (2002) of FMR. Before joining Fidelity Investments, Ms. |
| Reynolds worked at PricewaterhouseCoopers LLP (PwC) (1980-2002), |
| where she was most recently an audit partner with PwC’s investment |
| management practice. |
| |
| Paul M. Murphy (58) |
| |
| Year of Election or Appointment: 2005 |
| Chief Financial Officer of Advisor Japan. Mr. Murphy also serves as |
| Chief Financial Officer of other Fidelity funds (2005-present). He also |
| served as Senior Vice President of Fidelity Pricing and Cash Manage- |
| ment Services Group (FPCMS). |
| |
| Kenneth A. Rathgeber (58) |
| |
| Year of Election or Appointment: 2004 |
| Chief Compliance Officer of Advisor Japan. Mr. Rathgeber also serves |
| as Chief Compliance Officer of other Fidelity funds (2004) and Execu- |
| tive Vice President of Risk Oversight for Fidelity Investments (2002). Pre- |
| viously, he served as Executive Vice President and Chief Operating |
| Officer for Fidelity Investments Institutional Services Company, Inc. |
| (1998-2002). |
45 Annual Report
Trustees and Officers - continued
| Name, Age; Principal Occupation |
| |
| John R. Hebble (47) |
| |
| Year of Election or Appointment: 2003 |
| Deputy Treasurer of Advisor Japan. Mr. Hebble also serves as Deputy |
| Treasurer of other Fidelity funds (2003), and is an employee of FMR. |
| Before joining Fidelity Investments, Mr. Hebble worked at Deutsche Asset |
| Management where he served as Director of Fund Accounting |
| (2002-2003) and Assistant Treasurer of the Scudder Funds |
| (1998-2003). |
| |
| Bryan A. Mehrmann (44) |
| |
| Year of Election or Appointment: 2005 |
| Deputy Treasurer of Advisor Japan. Mr. Mehrmann also serves as |
| Deputy Treasurer of other Fidelity funds (2005-present) and is an em- |
| ployee of FMR. Previously, Mr. Mehrmann served as Vice President of |
| Fidelity Investments Institutional Services Group (FIIS)/Fidelity Investments |
| Institutional Operations Corporation, Inc. (FIIOC) Client Services |
| (1998-2004). |
| |
| Kimberley H. Monasterio (41) |
| |
| Year of Election or Appointment: 2004 |
| Deputy Treasurer of Advisor Japan. Ms. Monasterio also serves as Dep- |
| uty Treasurer of other Fidelity funds (2004) and is an employee of FMR |
| (2004). Before joining Fidelity Investments, Ms. Monasterio served as |
| Treasurer (2000-2004) and Chief Financial Officer (2002-2004) of the |
| Franklin Templeton Funds and Senior Vice President of Franklin Temple- |
| ton Services, LLC (2000-2004). |
| |
| Kenneth B. Robins (36) |
| |
| Year of Election or Appointment: 2005 |
| Deputy Treasurer of Advisor Japan. Mr. Robins also serves as Deputy |
| Treasurer of other Fidelity funds (2005-present) and is an employee of |
| FMR (2004-present). Before joining Fidelity Investments, Mr. Robins |
| worked at KPMG LLP, where he was a partner in KPMG’s department of |
| professional practice (2002-2004) and a Senior Manager |
| (1999-2000). In addition, Mr. Robins served as Assistant Chief Accoun- |
| tant, United States Securities and Exchange Commission (2000-2002). |
| |
| Robert G. Byrnes (38) |
| |
| Year of Election or Appointment: 2005 |
| Assistant Treasurer of Advisor Japan. Mr. Byrnes also serves as Assistant |
| Treasurer of other Fidelity funds (2005-present) and is an employee of |
| FMR (2005-present). Previously, Mr. Byrnes served as Vice President of |
| FPCMS (2003-2005). Before joining Fidelity Investments, Mr. Byrnes |
| worked at Deutsche Asset Management where he served as Vice Presi- |
| dent of the Investment Operations Group (2000-2003). |
Annual Report 46
| Name, Age; Principal Occupation |
| |
| John H. Costello (59) |
| |
| Year of Election or Appointment: 1998 |
| Assistant Treasurer of Advisor Japan. Mr. Costello also serves as Assis- |
| tant Treasurer of other Fidelity funds and is an employee of FMR. |
| |
| Peter L. Lydecker (51) |
| |
| Year of Election or Appointment: 2004 |
| Assistant Treasurer of Advisor Japan. Mr. Lydecker also serves as Assis- |
| tant Treasurer of other Fidelity funds (2004) and is an employee of FMR. |
| |
| Mark Osterheld (50) |
| |
| Year of Election or Appointment: 2002 |
| Assistant Treasurer of Advisor Japan. Mr. Osterheld also serves as Assis- |
| tant Treasurer of other Fidelity funds (2002) and is an employee of FMR. |
| |
| Gary W. Ryan (47) |
| |
| Year of Election or Appointment: 2005 |
| Assistant Treasurer of Advisor Japan. Mr. Ryan also serves as Assistant |
| Treasurer of other Fidelity funds (2005-present) and is an employee of |
| FMR (2005-present). Previously, Mr. Ryan served as Vice President of |
| Fund Reporting in FPCMS (1999-2005). |
| |
| Salvatore Schiavone (39) |
| |
| Year of Election or Appointment: 2005 |
| Assistant Treasurer of Advisor Japan. Mr. Schiavone also serves as |
| Assistant Treasurer of other Fidelity funds (2005-present) and is an em- |
| ployee of FMR (2005-present). Before joining Fidelity Investments, Mr. |
| Schiavone worked at Deutsche Asset Management, where he most re- |
| cently served as Assistant Treasurer (2003-2005) of the Scudder Funds |
| and Vice President and Head of Fund Reporting (1996-2003). |
47 Annual Report
Board Approval of Investment Advisory Contracts and Management Fees
Advisor Japan Fund
Each year, typically in July, the Board of Trustees, including the independent Trustees (together, the Board), votes on the renewal of the management contract and sub-advisory agreements (together, the Advisory Contracts) for the fund. The Board, assisted by the advice of fund counsel and independent Trustees’ counsel, requests and considers a broad range of information throughout the year.
The Board meets regularly each month except August and takes into account throughout the year matters bearing on Advisory Contracts. The Board, acting directly and through its separate committees, considers at each of its meetings factors that are relevant to the annual renewal of the fund’s Advisory Contracts, including the services and support provided to the fund and its shareholders by Fidelity. At the time of the renewal, the Board had 11 standing committees, each composed of independent Trustees with varying backgrounds, to which the Board has assigned specific subject matter responsibilities in order to enhance effective decision-making by the Board. Each committee has adopted a written charter outlining the structure and purposes of the committee. One such committee, the Equity Contract Committee, meets periodically during the first six months of each year and as necessary to consider matters specifically related to the annual renewal of Advisory Contracts. The committee requests and receives information on, and makes recommendations to the independent Trustees concerning, the approval and annual review of the Advisory Contracts.
At its July 2005 meeting, the Board of Trustees, including the independent Trustees, unanimously determined to renew the Advisory Contracts for the fund. In reaching its determination, the Board considered all factors it believed relevant, including (1) the nature, extent, and quality of the services to be provided to the fund and its shareholders by Fidelity (including the investment performance of the fund); (2) the competitiveness of the management fee and total expenses of the fund; (3) the total costs of the services to be provided by and the profits to be realized by the investment adviser and its affiliates from the relationship with the fund; (4) the extent to which economies of scale would be realized as the fund grows; and (5) whether fee levels reflect these economies of scale, if any, for the benefit of fund shareholders.
In determining whether to renew the Advisory Contracts for the fund, the Board ultimately reached a determination, with the assistance of fund counsel and independent Trustees’ counsel, that the renewal of the Advisory Contracts and the compensation to be received by Fidelity under the management contract is consistent with Fidelity’s fiduciary duty under applicable law. In addition to evaluating the specific factors noted above, the Board, in reaching its determination, is aware that shareholders in the fund have a broad range of investment choices available to them, including a wide choice among mutual funds offered by competitors to Fidelity, and that the fund’s shareholders, with the opportunity to review and weigh the disclosure provided by the fund in its
prospectus and other public disclosures, have chosen to invest in this fund, managed by Fidelity.
Nature, Extent, and Quality of Services Provided by Fidelity. The Board considered staffing within the investment adviser, FMR, and the sub-advisers (together, the Investment Advisers), including the background of the fund’s portfolio manager and the fund’s investment objective and discipline. The independent Trustees also had discussions with senior management of Fidelity’s investment operations and investment groups. The Board considered the structure of the portfolio manager compensation program and whether this structure provides appropriate incentives.
Fidelity Resources Dedicated to Investment Management and Support Services. The Board reviewed the size, education, and experience of the Investment Advisers’ investment staff, their use of technology, and the Investment Advisers’ approach to recruiting, training, and retaining portfolio managers and other research, advisory, and management personnel. The Board considered Fidelity’s extensive global research capabilities that enable the Investment Advisers to aggregate data from various sources in an effort to produce positive investment results. The Board noted that Fidelity’s analysts have access to a variety of technological tools that enable them to perform both fundamental and quantitative analysis and to specialize in various disciplines. The Board also considered that Fidelity’s portfolio managers and analysts have access to daily portfolio attribution that allows for monitoring of a fund’s portfolio, as well as an electronic communication system that provides immediate real-time access to research concerning issuers and credit enhancers.
Shareholder and Administrative Services. The Board considered the nature, extent, quality, and cost of administrative, distribution, and shareholder services performed by the Investment Advisers and their affiliates under the Advisory Contracts and under separate agreements covering transfer agency, pricing and bookkeeping, and securities lending services for the fund. The Board also considered the nature and extent of the Investment Advisers’ supervision of third party service providers, principally custodians and subcustodians. The Board reviewed the allocation of fund brokerage, including allocations to brokers affiliated with the Investment Advisers, the use of brokerage commissions to pay fund expenses, and the use of “soft” commission dollars to pay for research services. The Board also considered that Fidelity voluntarily decided in 2004 to stop using “soft” commission dollars to pay for market data and, instead, to pay for that data out of its own resources. The Board also considered the resources devoted to, and the record of compliance with, the fund’s compliance policies and procedures.
The Board noted that the growth of fund assets across the complex allows Fidelity to reinvest in the development of services designed to enhance the value or convenience of the Fidelity funds as investment vehicles. These services include 24-hour access to
49 Annual Report
Board Approval of Investment Advisory Contracts and Management Fees - continued
account information and market information through phone representatives and over the Internet, and investor education materials and asset allocation tools.
Investment in a Large Fund Family. The Board considered the benefits to shareholders of investing in a Fidelity fund, including the benefits of investing in a fund that is part of a large family of funds offering a variety of investment disciplines and providing for a large variety of mutual fund investor services. For example, fund shareholders are offered the privilege of exchanging shares of the fund for shares of other Fidelity funds, as set forth in the fund’s prospectus, without paying an additional sales charge. The Board noted that, since the last Advisory Contract renewals in July 2004, Fidelity has taken a number of actions that benefited particular funds, including (i) voluntarily deciding in 2004 to stop using “soft” commission dollars to pay for market data and, instead, to pay for that data out of its own resources, (ii) contractually agreeing to impose management fee reductions and expense limitations on its five Spartan stock index funds and its stock index fund available through variable insurance products, (iii) contractually agreeing to eliminate the management fees on the Fidelity Freedom Funds and the Fidelity Advisor Freedom Funds, (iv) contractually agreeing to reduce the management fees on most of its investment-grade taxable bond funds, and (v) contractually agreeing to impose expense limitations on its retail and Spartan investment-grade taxable bond funds.
Investment Performance and Compliance. The Board considered whether the fund has operated within its investment objective, as well as its record of compliance with its investment restrictions. It also reviewed the fund’s absolute investment performance for each class, as well as the fund’s relative investment performance for each class measured against (i) a broad-based securities market index, and (ii) a peer group of mutual funds deemed appropriate by the Board over multiple periods. The following charts considered by the Board show, over the one-, three-, and five-year periods ended December 31, 2004, the returns of Class C and Institutional Class of the fund, the returns of a broad-based securities market index (“benchmark”), and a range of returns of a peer group of mutual funds identified by Lipper Inc. as having an investment objective similar to that of the fund. The returns of Class C and Institutional Class represent the performance of classes with the highest and lowest 12b-1 fees, respectively (not necessarily with the highest and lowest total expenses). The box within each chart shows the 25th percentile return (bottom of box) and the 75th percentile return (top of box) of the Lipper peer group. Returns shown above the box are in the first quartile and returns shown below the box are in the fourth quartile. The percentage beaten numbers noted below each chart correspond to the percentile box and represent the percentage of funds in the Lipper peer group whose performance was equal to or lower than that of the class indicated.
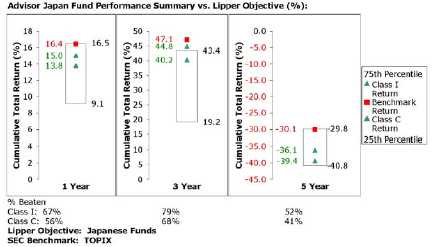
The Board reviewed the fund’s relative investment performance against its Lipper peer group and stated that the performance of Institutional Class of the fund was in the second quartile for the one- and five-year periods and the first quartile for the three-year period. The Board also stated that the relative investment performance of the fund was lower than its benchmark over time. The Board considered that the variations in performance among the fund’s classes reflect the variations in class expenses, which result in lower performance for higher expense classes.
The Board has had thorough discussions with FMR throughout the year about the Board’s and FMR’s concerns about equity research, equity fund performance, and compliance with internal policies governing gifts and entertainment. FMR has taken steps that it believes will refocus and strengthen equity research and equity portfolio management and compliance. The Board noted with favor FMR’s recent reorganization of its senior management team and FMR’s plans to dedicate additional resources to investment research, and participated in the process that led to those changes.
Based on its review, and giving particular weight to the nature and quality of the resources dedicated by the Investment Advisers to maintain and improve relative performance, the Board concluded that the nature, extent, and quality of the services provided by Fidelity will benefit the fund’s shareholders, particularly in light of the Board’s view that the fund’s shareholders benefit from investing in a fund that is part of a large family of funds offering a variety of investment disciplines and services.
Competitiveness of Management Fee and Total Fund Expenses. The Board considered the fund’s management fee and total expenses compared to “mapped groups” of competitive funds and classes. Fidelity creates “mapped groups” by combining similar
51 Annual Report
Board Approval of Investment Advisory Contracts and Management Fees - continued
Lipper investment objective categories that have comparable management fee characteristics. Combining Lipper investment objective categories aids the Board’s management fee and total expense comparisons by broadening the competitive group used for comparison and by reducing the number of universes to which various Fidelity funds are compared.
The Board considered two proprietary management fee comparisons for the 12-month periods shown in the chart below. The group of Lipper funds used by the Board for management fee comparisons is referred to below as the “Total Mapped Group” and, for the reasons explained above, is broader than the Lipper peer group used by the Board for performance comparisons. The Total Mapped Group comparison focuses on a fund’s standing relative to the total universe of comparable funds available to investors, in terms of gross management fees before expense reimbursements or caps. “TMG %” represents the percentage of funds in the Total Mapped Group that had management fees that were lower than the fund’s. For example, a TMG % of 21% means that 79% of the funds in the Total Mapped Group had higher management fees than the fund. The “Asset-Size Peer Group” (ASPG) comparison focuses on a fund’s standing relative to non-Fidelity funds similar in size to the fund within the Total Mapped Group. The ASPG represents at least 15% of the funds in the Total Mapped Group with comparable asset size and management fee characteristics, subject to a minimum of 50 funds (or all funds in the Total Mapped Group if fewer than 50). Additional information, such as the ASPG quartile (“quadrant”) in which the fund’s management fee ranked, is also included in the chart and considered by the Board.
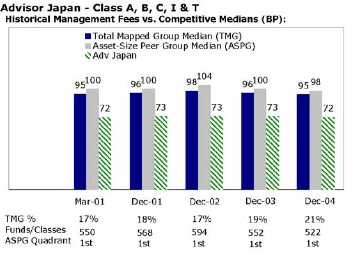
The Board noted that the fund’s management fee ranked below the median of its Total Mapped Group and below the median of its ASPG for 2004.
Based on its review, the Board concluded that the fund’s management fee was fair and reasonable in light of the services that the fund receives and the other factors considered.
In its review of each class’s total expenses, the Board considered the fund’s management fee as well as other fund or class expenses, as applicable, such as transfer agent fees, pricing and bookkeeping fees, fund-paid 12b-1 fees, and custodial, legal, and audit fees. The Board also noted the effects of any waivers and reimbursements on fees and expenses. As part of its review, the Board also considered current and historical total expenses of each class of the fund compared to competitive fund median expenses. Each class of the fund is compared to those funds and classes in the Total Mapped Group (used by the Board for management fee comparisons) that have a similar sales load structure.
The Board noted that the total expenses of each class ranked above its competitive median for 2004. The Board noted that the fund offers multiple classes, each of which has a different sales load and 12b-1 fee structure, and that the multiple structures are intended to offer a range of pricing options for the intermediary market. The Board also noted that the total expenses of the classes vary primarily by the level of their 12b-1 fees, although differences in transfer agent fees may also cause expenses to vary from class to class.
Furthermore, the Board considered that on December 16, 2004, it had approved changes (effective January 1, 2005) in the transfer agent and service agreements for the fund that established maximum transfer agent fees and eliminated the minimum pricing and bookkeeping fee to prevent small funds or funds with small average account sizes from having relatively high fees in basis points (the “small-fund fee reductions”). The Board considered that, if the small-fund fee reductions had been in effect in 2004, the total expenses of each of Class A, Class B, Class C and Institutional Class would have ranked below the median.
In its review of total expenses, the Board also considered Fidelity fee structures and other information on clients that FMR and its affiliates service in other competitive markets, such as other mutual funds advised or subadvised by FMR or its affiliates, pension plan clients, and other institutional clients.
Based on its review, the Board concluded that the total expenses for each class of the fund were reasonable, although in all cases above the median of the universe presented for comparison, in light of the services that the fund and its shareholders receive and the other factors considered.
Costs of the Services and Profitability. The Board considered the revenues earned and the expenses incurred by Fidelity in conducting the business of developing, marketing, distributing, managing, administering and servicing the fund and its shareholders.
53 Annual Report
Board Approval of Investment Advisory Contracts and Management Fees - continued
The Board also considered the level of Fidelity’s profits in respect of all the Fidelity funds.
On an annual basis, FMR presents to the Board Fidelity’s profitability for the fund. Fidelity calculates the profitability for each fund, as well as aggregate profitability for groups of Fidelity funds and all Fidelity funds, using a series of detailed revenue and cost allocation methodologies which originate with the audited books and records of Fidelity. The Audit Committee of the Board reviews any significant changes from the prior year’s methodologies.
PricewaterhouseCoopers LLP (PwC), independent registered accounting firm and auditor to Fidelity and certain Fidelity funds, has been engaged annually by the Board as part of the Board’s assessment of the results of Fidelity’s profitability analysis. PwC’s engagement includes the review and assessment of Fidelity’s methodologies used in determining the revenues and expenses attributable to Fidelity’s mutual fund business, and completion of agreed-upon procedures surrounding the mathematical accuracy of fund profitability and its conformity to allocation methodologies. After considering PwC’s reports issued under the engagement and information provided by Fidelity, the Board believes that while other allocation methods may also be reasonable, Fidelity’s profitability methodologies are reasonable in all material respects.
The Board has also reviewed Fidelity’s non-fund businesses and any fall-out benefits related to the mutual fund business as well as cases where Fidelity’s affiliates may benefit from or be related to the fund’s business. In addition, a special committee of the Board reviewed services provided to Fidelity by its affiliates and determined that the fees that Fidelity paid for such services were reasonable.
The Board considered the costs of the services provided by and the profits realized by Fidelity in connection with the operation of the fund and determined that the amount of profit is a fair entrepreneurial profit for the management of the fund.
Economies of Scale. The Board considered whether there have been economies of scale in respect of the management of the Fidelity funds, whether the Fidelity funds (including the fund) have appropriately benefited from any such economies of scale, and whether there is potential for realization of any further economies of scale. The Board considered the extent to which the fund will benefit from economies of scale through increased services to the fund, through waivers or reimbursements, or through fee or expense reductions, including reductions that occur through operation of the transfer agent agreement. The transfer agent fee varies in part based on the number of accounts in the fund. If the number of accounts decreases or the average account size increases, the overall transfer agent fee rate decreases.
The Board recognized that the fund’s management contract incorporates a “group fee” structure, which provides for lower fee rates as total fund assets under FMR’s
management increase, and for higher fee rates as total fund assets under FMR’s management decrease. The Board considered that the group fee is designed to deliver the benefits of economies of scale to fund shareholders when total fund assets increase, even if assets of any particular fund are unchanged or have declined, because some portion of Fidelity’s costs are attributable to services provided to all Fidelity funds, and all funds benefit if those costs can be allocated among more assets. The Board concluded that, given the group fee structure, fund shareholders will achieve a certain level of economies of scale as assets under FMR’s management increase at the fund complex level, regardless of whether Fidelity achieves any such economies of scale.
The Board further concluded that any potential economies of scale are being shared between fund shareholders and Fidelity in an appropriate manner.
Additional Information Requested by the Board. In order to develop fully the factual basis for consideration of the Advisory Contracts, the Board requested additional information regarding (i) equity fund transfer agency fees; (ii) Fidelity’s fund profitability methodology and the impact of various changes in the methodology over time; (iii) benefits to shareholders from economies of scale; (iv) composition and characteristics of various fund and industry data used in comparisons; and (v) compensation of portfolio managers and research analysts.
Based on its evaluation of all of the conclusions noted above, and after considering all material factors, the Board ultimately concluded that the existing advisory fee structures are fair and reasonable, and that the fund’s existing Advisory Contracts should be renewed.
55 Annual Report
57 Annual Report
59 Annual Report
61 Annual Report
Investment Adviser
Fidelity Management & Research Company
Boston, MA
Investment Sub-Advisers
FMR Co., Inc.
Fidelity Management & Research
(U.K.) Inc.
Fidelity Management & Research
(Far East) Inc.
Fidelity International
Investment Advisors
Fidelity Investments Japan Limited
Fidelity International Investment
Advisors (U.K.) Limited
General Distributor
Fidelity Distributors Corporation
Boston, MA
Transfer and Service Agents
Fidelity Investments Institutional
Operations Company, Inc.
Boston, MA
Fidelity Service Company, Inc.
Boston, MA
Custodian
State Street Bank and Trust Company
Quincy, MA
|


Fidelity® Advisor
Japan
Fund - Institutional Class
Annual Report October 31, 2005

| Contents | | | | |
| |
| Chairman’s Message | | 4 | | Ned Johnson’s message to shareholders. |
| Performance | | 6 | | How the fund has done over time. |
| Management’s Discussion | | 7 | | The manager’s review of fund |
| | | | | performance, strategy and outlook. |
| Shareholder Expense | | 8 | | An example of shareholder expenses. |
| Example | | | | |
| Investment Changes | | 10 | | A summary of major shifts in the fund’s |
| | | | | investments over the past six months. |
| Investments | | 11 | | A complete list of the fund’s investments |
| | | | | with their market values. |
| Financial Statements | | 19 | | Statements of assets and liabilities, |
| | | | | operations, and changes in net assets, |
| | | | | as well as financial highlights. |
| Notes | | 28 | | Notes to the financial statements. |
| Report of Independent | | 36 | | |
| Registered Public | | | | |
| Accounting Firm | | | | |
| Trustees and Officers | | 37 | | |
| Board Approval of | | 47 | | |
| Investment Advisory | | | | |
| Contracts and | | | | |
| Management Fees | | | | |
To view a fund’s proxy voting guidelines and proxy voting record for the 12-month period ended June 30, visit www.fidelity.com/proxyvotingresults or visit the Securities and Exchange Commission’s (SEC) web site at www.sec.gov. You may also call 1-877-208-0098 to request a free copy of the proxy voting guidelines.
Standard & Poor’s, S&P and S&P 500 are registered service marks of The McGraw-Hill Companies, Inc. and have been licensed for use by Fidelity Distributors Corporation.
Other third party marks appearing herein are the property of their respective owners.
All other marks appearing herein are registered or unregistered trademarks or service marks of FMR Corp. or an affiliated company.
This report and the financial statements contained herein are submitted for the general information of the shareholders of the fund. This report is not authorized for distribution to prospective investors in the fund unless preceded or accompanied by an effective prospectus.
A fund files its complete schedule of portfolio holdings with the SEC for the first and third quarters of each fiscal year on Form N-Q. Forms N-Q are available on the SEC’s web site at http://www.sec.gov. A fund’s Forms N-Q may be reviewed and copied at the SEC’s Public Reference Room in Washington, DC. Information regarding the operation of the SEC’s Public Reference Room may be obtained by calling 1-800-SEC-0330. For a complete list of a fund’s portfolio holdings, view the most recent quarterly holdings report, semiannual report, or annual report on Fidelity’s web site at http://www.advisor.fidelity.com.
NOT FDIC INSURED · MAY LOSE VALUE · NO BANK GUARANTEE
Neither the fund nor Fidelity Distributors Corporation is a bank.
3 Annual Report
Chairman’s Message
(Photograph of Edward C. Johnson 3d)
Dear Shareholder:
During the past year or so, much has been reported about the mutual fund industry, and much of it has been more critical than I believe is warranted. Allegations that some companies have been less than forthright with their shareholders have cast a shadow on the entire industry. I continue to find these reports disturbing, and assert that they do not create an accurate picture of the industry overall. Therefore, I would like to remind everyone where Fidelity stands on these issues. I will say two things specifically regarding allegations that some mutual fund companies were in violation of the Securities and Exchange Commission’s forward pricing rules or were involved in so-called “market timing” activities.
First, Fidelity has no agreements that permit customers who buy fund shares after 4 p.m. to obtain the 4 p.m. price. This is not a new policy. This is not to say that someone could not deceive the company through fraudulent acts. However, we are extremely diligent in preventing fraud from occurring in this manner — and in every other. But I underscore again that Fidelity has no so-called “agreements” that sanction illegal practices.
Second, Fidelity continues to stand on record, as we have for years, in opposition to predatory short-term trading that adversely affects shareholders in a mutual fund. Back in the 1980s, we initiated a fee — which is returned to the fund and, therefore, to investors — to discourage this activity. Further, we took the lead several years ago in developing a Fair Value Pricing Policy to prevent market timing on foreign securities in our funds. I am confident we will find other ways to make it more difficult for predatory traders to operate. However, this will only be achieved through close cooperation among regulators, legislators and the industry.
Yes, there have been unfortunate instances of unethical and illegal activity within the mutual fund industry from time to time. That is true of any industry. When this occurs, confessed or convicted offenders should be dealt with appropriately. But we are still concerned about the risk of over-regulation and the quick application of simplistic solutions to intricate problems. Every system can be improved, and we support and applaud well thought out improvements by regulators, legislators and industry representatives that achieve the common goal of building and protecting the value of investors’ holdings.
For nearly 60 years, Fidelity has worked very hard to improve its products and service to justify your trust. When our family founded this company in 1946, we had only a few hundred customers. Today, we serve more than 18 million customers including individual investors and participants in retirement plans across America.
Annual Report 4
Let me close by saying that we do not take your trust in us for granted, and we realize that we must always work to improve all aspects of our service to you. In turn, we urge you to continue your active participation with your financial matters, so that your interests can be well served.
Best regards,
/s/Edward C. Johnson 3d
5 Annual Report
Performance: The Bottom Line
Average annual total return reflects the change in the value of an investment, assuming reinvestment of the class’ dividend income and capital gains (the profits earned upon the sale of securities that have grown in value) and assuming a constant rate of performance each year. The $10,000 table and the fund’s returns do not reflect the deduction of taxes that a shareholder would pay on fund distributions or the redemption of fund shares. During periods of reimbursement by Fidelity, a fund’s total return will be greater than it would be had the reimbursement not occurred. How a fund did yesterday is no guarantee of how it will do tomorrow.
| Average Annual Total Returns | | | | | | |
| Periods ended October 31, 2005 | | Past 1 | | Past 5 | | Life of |
| | | year | | years | | fundA |
| Institutional Class | | 23.93% | | --0.66% | | 8.56% |
| A From December 17, 1998. | | | | | | |
$10,000 Over Life of Fund
Let’s say hypothetically that $10,000 was invested in Fidelityr Advisor Japan Fund —Institutional Class on December 17, 1998, when the fund started. The chart shows how the value of your investment would have changed and also shows how the Tokyo Stock Exchange Stock Price (TOPIX) Index performed over the same period.

Annual Report 6
Management’s Discussion of Fund Performance
Comments from Dale Nicholls, Portfolio Manager of Fidelity® Advisor Japan Fund
Foreign stock markets enjoyed broad-based advances during the 12-month period that ended October 31, 2005, encouraged by better-than-expected corporate earnings and markedly improved economies. For the 12 months overall, the Morgan Stanley Capital InternationalSM Europe, Australasia, Far East (MSCIr EAFE®) Index — a performance measure of developed stock markets outside the United States and Canada — gained 18.28% . The Japanese stock market climbed to its highest level in more than four years. Positive economic indicators and Prime Minister Koizumi’s decisive election victory attracted record inflows from overseas investors. In response, the Tokyo Stock Exchange Stock Price Index (TOPIX) soared 22.89% . Southeast Asian equities outside of Japan, particularly South Korea, also responded well to the better macroeconomic environment, illustrated by the 19.44% return for the MSCI All Country Far East ex Japan index. Euro-pean stock markets were up as well, despite investors’ concern about higher energy prices and potential downgrades to economic growth in the region. For the year overall, the MSCI Europe index rose 16.51% .
For the 12 months ending October 31, 2005, the fund’s Institutional Class shares returned 23.93%, beating the TOPIX, but trailing the 25.18% gain posted by the LipperSM Japanese Funds Average. On a sector basis, information technology added the most to performance versus the index — primarily through effective stock selection. Opt, Inc., an emerging leader in online advertising, was the top contributor to relative performance. The stock had a great run, and I sold the position to lock in profits. The top contributor on an absolute basis was Intelligent Wave. The company provides software that helps companies protect their electronically stored information. Demand for such a product grew with the increasing frequency of scandals regarding personal information leakage, and the company had what seemed to be a very strong product. On the downside, the consumer discretionary sector had the biggest negative impact. Among individual securities, not owning index component Mitsubishi Tokyo Financial Group held back performance the most. Konica Minolta Holdings also was a significant detractor. The company struggled in both the digital camera and laser printer markets, but I thought investors overreacted to these negatives and stuck with the position. Lastly, the fund’s absolute performance was limited by the depreciation of the Japanese yen versus the U.S. dollar during the period.
The views expressed in this statement reflect those of the portfolio manager only through the end of the period of the report as stated on the cover and do not necessarily represent the views of Fidelity or any other person in the Fidelity organization. Any such views are subject to change at any time based upon market or other conditions and Fidelity disclaims any responsibility to update such views. These views may not be relied on as investment advice and, because investment decisions for a Fidelity fund are based on numerous factors, may not be relied on as an indication of trading intent on behalf of any Fidelity fund.
Shareholder Expense Example
As a shareholder of the Fund, you incur two types of costs: (1) transaction costs, including sales charges (loads) on purchase payments or redemption proceeds, redemption fees, and (2) ongoing costs, including management fees, distribution and/or service (12b-1) fees and other Fund expenses. This Example is intended to help you understand your ongoing costs (in dollars) of investing in the Fund and to compare these costs with the ongoing costs of investing in other mutual funds.
The Example is based on an investment of $1,000 invested at the beginning of the period and held for the entire period (May 1, 2005 to October 31, 2005).
The first line of the table below for each class of the Fund provides information about actual account values and actual expenses. You may use the information in this line, together with the amount you invested, to estimate the expenses that you paid over the period. Simply divide your account value by $1,000.00 (for example, an $8,600 account value divided by $1,000.00 = 8.6), then multiply the result by the number in the first line for a class of the Fund under the heading entitled “Expenses Paid During Period” to estimate the expenses you paid on your account during this period.
Hypothetical Example for Comparison Purposes
The second line of the table below for each class of the Fund provides information about hypothetical account values and hypothetical expenses based on a Class’ actual expense ratio and an assumed rate of return of 5% per year before expenses, which is not the Class’ actual return. The hypothetical account values and expenses may not be used to estimate the actual ending account balance or expenses you paid for the period. You may use this information to compare the ongoing costs of investing in the Fund and other funds. To do so, compare this 5% hypothetical example with the 5% hypothetical examples that appear in the shareholder reports of the other funds.
Please note that the expenses shown in the table are meant to highlight your ongoing costs only and do not reflect any transaction costs. Therefore, the second line of the table is useful in comparing ongoing costs only, and will not help you determine the relative total costs of owning different funds. In addition, if these transactional costs were included, your costs would have been higher.
| | | | | | | | | | | | | Expenses Paid |
| | | | | Beginning | | | | Ending | | | | During Period* |
| | | | | Account Value | | | | Account Value | | | | May 1, 2005 |
| | | | | May 1, 2005 | | | | October 31, 2005 | | to October 31, 2005 |
| Class A | | | | | | | | | | | | |
| Actual | | $ | | 1,000.00 | | $ | | 1,132.00 | | $ | | 8.06 |
| HypotheticalA | | $ | | 1,000.00 | | $ | | 1,017.64 | | $ | | 7.63 |
| Class T | | | | | | | | | | | | |
| Actual | | $ | | 1,000.00 | | $ | | 1,130.60 | | $ | | 9.40 |
| HypotheticalA | | $ | | 1,000.00 | | $ | | 1,016.38 | | $ | | 8.89 |
| Class B | | | | | | | | | | | | |
| Actual | | $ | | 1,000.00 | | $ | | 1,127.40 | | $ | | 12.06 |
| HypotheticalA | | $ | | 1,000.00 | | $ | | 1,013.86 | | $ | | 11.42 |
Annual Report 8
| | | | | | | | | | | | | Expenses Paid |
| | | | | Beginning | | | | Ending | | | | During Period* |
| | | | | Account Value | | | | Account Value | | | | May 1, 2005 |
| | | | | May 1, 2005 | | | | October 31, 2005 | | to October 31, 2005 |
| Class C | | | | | | | | | | | | |
| Actual | | $ | | 1,000.00 | | $ | | 1,127.30 | | $ | | 11.80 |
| HypotheticalA | | $ | | 1,000.00 | | $ | | 1,014.12 | | $ | | 11.17 |
| Institutional Class | | | | | | | | | | | | |
| Actual | | $ | | 1,000.00 | | $ | | 1,133.30 | | $ | | 6.02 |
| HypotheticalA | | $ | | 1,000.00 | | $ | | 1,019.56 | | $ | | 5.70 |
| |
| A 5% return per year before expenses | | | | | | | | |
* Expenses are equal to each Class’ annualized expense ratio (shown in the table below); multiplied by the average account value over the period, multiplied by 184/365 (to reflect the one-half year period).
| | | Annualized |
| | | Expense Ratio |
| Class A | | 1.50% |
| Class T | | 1.75% |
| Class B | | 2.25% |
| Class C | | 2.20% |
| Institutional Class | | 1.12% |
9 Annual Report
Investment Changes
| Top Ten Stocks as of October 31, 2005 | | | | |
| | | % of fund’s | | % of fund’s net assets |
| | | net assets | | 6 months ago |
| Toyota Motor Corp. | | 3.3 | | 3.3 |
| Sumitomo Mitsui Financial Group, Inc. | | 2.7 | | 1.6 |
| Intelligent Wave, Inc. | | 2.4 | | 2.1 |
| Hamakyorex Co. Ltd. | | 2.3 | | 1.8 |
| Mizuho Financial Group, Inc. | | 2.0 | | 1.1 |
| Nippon Electric Glass Co. Ltd. | | 1.7 | | 2.7 |
| Stanley Electric Co. Ltd. | | 1.6 | | 1.8 |
| Softbank Corp. | | 1.5 | | 1.1 |
| Sompo Japan Insurance, Inc. | | 1.4 | | 0.0 |
| Matsushita Electric Industrial Co. Ltd. | | 1.4 | | 0.0 |
| | | 20.3 | | |
| Top Five Market Sectors as of October 31, 2005 | | |
| | | % of fund’s | | % of fund’s net assets |
| | | net assets | | 6 months ago |
| Financials | | 24.3 | | 15.3 |
| Consumer Discretionary | | 23.1 | | 30.6 |
| Information Technology | | 17.5 | | 17.9 |
| Industrials | | 15.1 | | 16.7 |
| Consumer Staples | | 6.3 | | 3.7 |
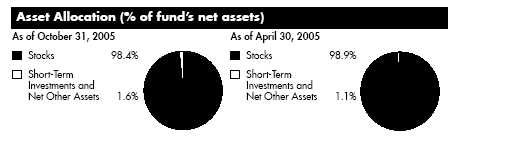
Annual Report 10
| Investments October 31, 2005 | | | | | | | | |
| Showing Percentage of Net Assets | | | | | | | | |
| |
| Common Stocks — 98.4% | | | | | | | | |
| | | | | Shares | | Value (Note 1) |
| |
| CONSUMER DISCRETIONARY – 23.1% | | | | | | | | |
| Auto Components – 3.0% | | | | | | | | |
| Aisin Seiki Co. Ltd. | | | | 21,200 | | $ | | 638,912 |
| NOK Corp. | | | | 26,500 | | | | 800,935 |
| Stanley Electric Co. Ltd. | | | | 106,800 | | | | 1,649,107 |
| | | | | | | | | 3,088,954 |
| Automobiles – 3.3% | | | | | | | | |
| Toyota Motor Corp. | | | | 74,000 | | | | 3,433,969 |
| Distributors – 0.6% | | | | | | | | |
| Doshisha Co. Ltd. | | | | 12,050 | | | | 213,928 |
| Ohashi Technica, Inc. | | | | 17,200 | | | | 358,981 |
| | | | | | | | | 572,909 |
| Diversified Consumer Services – 0.5% | | | | | | | | |
| Take & Give Needs Co. Ltd. (a) | | | | 388 | | | | 544,343 |
| Hotels, Restaurants & Leisure – 0.9% | | | | | | | | |
| Aeon Fantasy Co. Ltd. | | | | 13,200 | | | | 328,082 |
| Saint Marc Co. Ltd. | | | | 10,700 | | | | 542,083 |
| | | | | | | | | 870,165 |
| Household Durables – 4.4% | | | | | | | | |
| Casio Computer Co. Ltd. | | | | 30,000 | | | | 454,659 |
| First Juken Co. Ltd. | | | | 14,700 | | | | 143,472 |
| Haseko Corp. (a) | | | | 142,500 | | | | 493,629 |
| Hitachi Koki Co. Ltd. | | | | 62,000 | | | | 845,665 |
| Matsushita Electric Industrial Co. Ltd. | | | | 76,000 | | | | 1,398,400 |
| Sony Corp. | | | | 12,200 | | | | 400,160 |
| Sumitomo Forestry Co. Ltd. | | | | 64,000 | | | | 593,602 |
| Tenma Corp. | | | | 11,900 | | | | 201,990 |
| | | | | | | | | 4,531,577 |
| Leisure Equipment & Products – 2.6% | | | | | | | | |
| Aruze Corp. | | | | 36,500 | | | | 663,802 |
| Mars Engineering Corp. | | | | 13,700 | | | | 422,374 |
| Sankyo Co. Ltd. (Gunma) | | | | 8,200 | | | | 433,892 |
| Sega Sammy Holdings, Inc. | | | | 15,800 | | | | 569,215 |
| Sega Sammy Holdings, Inc. New | | | | 15,800 | | | | 573,320 |
| | | | | | | | | 2,662,603 |
| Media – 2.4% | | | | | | | | |
| Bandai Visual Co. Ltd. | | | | 150 | | | | 504,022 |
| Cyber Agent Ltd. | | | | 139 | | | | 250,383 |
| Cyber Agent Ltd. New | | | | 139 | | | | 250,383 |
| cyber communications, Inc. (a) | | | | 120 | | | | 305,531 |
| Fuji Television Network, Inc. | | | | 277 | | | | 618,907 |
See accompanying notes which are an integral part of the financial statements.
11 Annual Report
| Investments - continued | | | | | | |
| |
| |
| Common Stocks – continued | | | | | | |
| | | Shares | | Value (Note 1) |
| |
| CONSUMER DISCRETIONARY – continued | | | | | | |
| Media – continued | | | | | | |
| livedoor MARKETING Co. Ltd. (a) | | 8,836 | | $ | | 359,650 |
| Oricon, Inc. | | 179 | | | | 232,525 |
| | | | | | | 2,521,401 |
| Multiline Retail – 0.6% | | | | | | |
| Parco Co. Ltd. | | 67,000 | | | | 653,920 |
| Specialty Retail – 3.4% | | | | | | |
| Hikari Tsushin, Inc. | | 5,800 | | | | 373,201 |
| Honeys Co. Ltd. | | 11,300 | | | | 590,095 |
| Jeans Mate Corp. | | 10,600 | | | | 140,634 |
| Mac House Co. Ltd. | | 16,700 | | | | 346,376 |
| Point, Inc. | | 9,700 | | | | 602,306 |
| Tsutsumi Jewelry Co. Ltd. | | 18,100 | | | | 542,352 |
| USS Co. Ltd. | | 5,290 | | | | 364,666 |
| Xebio Co. Ltd. | | 12,300 | | | | 530,470 |
| | | | | | | 3,490,100 |
| Textiles, Apparel & Luxury Goods – 1.4% | | | | | | |
| Asics Corp. | | 72,000 | | | | 621,038 |
| Renown D’urban Holdings, Inc. (a) | | 39,900 | | | | 414,649 |
| Workman Co. Ltd. | | 14,100 | | | | 427,379 |
| | | | | | | 1,463,066 |
| |
| TOTAL CONSUMER DISCRETIONARY | | | | | | 23,833,007 |
| |
| CONSUMER STAPLES – 6.3% | | | | | | |
| Beverages – 1.6% | | | | | | |
| Asahi Breweries Ltd. | | 33,300 | | | | 417,291 |
| Kirin Beverage Corp. | | 16,700 | | | | 352,161 |
| Oenon Holdings, Inc. | | 176,000 | | | | 592,910 |
| Takara Holdings, Inc. | | 52,000 | | | | 308,475 |
| | | | | | | 1,670,837 |
| Food & Staples Retailing – 3.2% | | | | | | |
| Aeon Co. Ltd. | | 15,100 | | | | 313,844 |
| Create SD Co. Ltd. | | 6,300 | | | | 228,057 |
| Daikokutenbussan Co. Ltd. | | 18,100 | | | | 815,095 |
| Itochushokuhin Co. Ltd. | | 13,800 | | | | 470,871 |
| Kura Corp. Ltd. | | 75 | | | | 481,289 |
| Valor Co. Ltd. (d) | | 32,360 | | | | 980,850 |
| | | | | | | 3,290,006 |
See accompanying notes which are an integral part of the financial statements.
| Common Stocks – continued | | | | | | |
| | | Shares | | Value (Note 1) |
| |
| CONSUMER STAPLES – continued | | | | | | |
| Food Products – 0.7% | | | | | | |
| Hokuto Corp. | | 15,200 | | $ | | 246,683 |
| Kibun Food Chemifa Co. Ltd. | | 14,700 | | | | 356,452 |
| Warabeya Nichiyo Co. Ltd. | | 11,700 | | | | 168,603 |
| | | | | | | 771,738 |
| Household Products – 0.5% | | | | | | |
| Uni-Charm Corp. | | 10,300 | | | | 468,298 |
| Personal Products – 0.3% | | | | | | |
| Fancl Corp. | | 6,700 | | | | 329,571 |
| |
| TOTAL CONSUMER STAPLES | | | | | | 6,530,450 |
| |
| ENERGY – 2.0% | | | | | | |
| Oil, Gas & Consumable Fuels – 2.0% | | | | | | |
| AOC Holdings, Inc. | | 21,400 | | | | 394,748 |
| Cosmo Oil Co. Ltd. | | 167,000 | | | | 812,791 |
| Nippon Mining Holdings, Inc. | | 113,000 | | | | 834,745 |
| | | | | | | 2,042,284 |
| |
| FINANCIALS – 24.3% | | | | | | |
| Capital Markets – 2.5% | | | | | | |
| E*TRADE Securities Co. Ltd. | | 128 | | | | 672,860 |
| Japan Asia Investment Co. Ltd | | 138,000 | | | | 776,817 |
| Monex Beans Holdings, Inc. (d) | | 427 | | | | 451,143 |
| Nikko Cordial Corp. | | 57,000 | | | | 691,081 |
| | | | | | | 2,591,901 |
| Commercial Banks – 10.2% | | | | | | |
| Hokuhoku Financial Group, Inc. | | 321,000 | | | | 1,331,578 |
| Juroku Bank Ltd. | | 49,000 | | | | 409,072 |
| Mitsui Trust Holdings, Inc. | | 115,000 | | | | 1,388,311 |
| Mizuho Financial Group, Inc. | | 302 | | | | 2,019,066 |
| Nishi-Nippon City Bank Ltd. | | 156,000 | | | | 910,564 |
| Sumitomo Mitsui Financial Group, Inc. | | 297 | | | | 2,752,114 |
| The Keiyo Bank Ltd. | | 110,000 | | | | 827,825 |
| Tokyo Tomin Bank Ltd. | | 23,900 | | | | 879,656 |
| | | | | | | 10,518,186 |
| Consumer Finance – 4.6% | | | | | | |
| Credit Saison Co. Ltd. | | 19,200 | | | | 872,945 |
| Lopro Corp. (d) | | 75,100 | | | | 433,152 |
| Nissin Co. Ltd. | | 335,000 | | | | 487,394 |
| Nissin Co. Ltd. New | | 335,000 | | | | 481,592 |
See accompanying notes which are an integral part of the financial statements.
13 Annual Report
| Investments - continued | | | | | | |
| |
| |
| Common Stocks – continued | | | | | | |
| | | Shares | | Value (Note 1) |
| |
| FINANCIALS – continued | | | | | | |
| Consumer Finance – continued | | | | | | |
| OMC Card, Inc. | | 22,000 | | $ | | 370,187 |
| ORIX Corp. | | 5,200 | | | | 975,862 |
| SFCG Co. Ltd. | | 3,870 | | | | 934,729 |
| UCS Co. Ltd. | | 6,500 | | | | 247,681 |
| | | | | | | 4,803,542 |
| Insurance – 2.7% | | | | | | |
| Sompo Japan Insurance, Inc | | 96,000 | | | | 1,446,594 |
| T&D Holdings, Inc. | | 21,350 | | | | 1,347,881 |
| | | | | | | 2,794,475 |
| Real Estate – 4.3% | | | | | | |
| IDU Co. (a) | | 153 | | | | 549,877 |
| Japan Logistics Fund, Inc | | 95 | | | | 596,469 |
| Keihanshin Real Estate Co. Ltd. | | 89,000 | | | | 641,268 |
| KK daVinci Advisors (a) | | 128 | | | | 604,133 |
| Sumitomo Realty & Development Co. Ltd. | | 70,000 | | | | 1,133,616 |
| Toc Co. Ltd. | | 14,000 | | | | 81,232 |
| Urban Corp. (d) | | 12,700 | | | | 789,686 |
| | | | | | | 4,396,281 |
| |
| TOTAL FINANCIALS | | | | | | 25,104,385 |
| |
| HEALTH CARE – 5.6% | | | | | | |
| Biotechnology – 0.4% | | | | | | |
| Shin Nippon Biomedical Laboratories Ltd. | | 17,200 | | | | 255,904 |
| Shin Nippon Biomedical Laboratories Ltd. New | | 7,900 | | | | 117,538 |
| | | | | | | 373,442 |
| Health Care Equipment & Supplies – 2.5% | | | | | | |
| Hogy Medical Co. | | 15,700 | | | | 860,656 |
| Miraca Holdings, Inc. | | 29,500 | | | | 661,680 |
| Sysmex Corp. | | 5,300 | | | | 211,135 |
| Sysmex Corp. New | | 5,300 | | | | 211,135 |
| Terumo Corp. | | 22,100 | | | | 671,778 |
| | | | | | | 2,616,384 |
| Pharmaceuticals – 2.7% | | | | | | |
| Astellas Pharma, Inc. | | 22,100 | | | | 794,267 |
See accompanying notes which are an integral part of the financial statements.
| Common Stocks – continued | | | | | | |
| | | Shares | | Value (Note 1) |
| |
| HEALTH CARE – continued | | | | | | |
| Pharmaceuticals – continued | | | | | | |
| Eisai Co. Ltd. | | 16,900 | | $ | | 664,460 |
| Takeda Pharamaceutical Co. Ltd. | | 23,600 | | | | 1,299,856 |
| | | | | | | 2,758,583 |
| |
| TOTAL HEALTH CARE | | | | | | 5,748,409 |
| |
| INDUSTRIALS – 15.1% | | | | | | |
| Building Products – 0.5% | | | | | | |
| Daikin Industries Ltd. | | 19,100 | | | | 499,536 |
| Commercial Services & Supplies – 0.3% | | | | | | |
| Teraoka Seisakusho Co. Ltd. | | 37,500 | | | | 324,107 |
| Construction & Engineering – 1.3% | | | | | | |
| Chiyoda Corp. | | 38,000 | | | | 656,527 |
| Commuture Corp. | | 81,000 | | | | 722,518 |
| | | | | | | 1,379,045 |
| Electrical Equipment – 1.0% | | | | | | |
| Furukawa Electric Co. Ltd. (a) | | 80,000 | | | | 380,354 |
| Sumitomo Electric Industries Ltd. | | 51,400 | | | | 677,492 |
| | | | | | | 1,057,846 |
| Machinery – 4.4% | | | | | | |
| Daifuku Co. Ltd. | | 33,500 | | | | 441,846 |
| Ishikawajima-Harima Heavy Industries Co. Ltd. (a) | | 300,000 | | | | 698,875 |
| Kitz Corp. | | 173,000 | | | | 1,032,266 |
| Koyo Seiko Co. Ltd. | | 41,000 | | | | 659,714 |
| Kubota Corp. | | 84,000 | | | | 611,789 |
| Nabtesco Corp. | | 78,000 | | | | 657,255 |
| Nittoku Engineering Co. Ltd. | | 51,000 | | | | 430,627 |
| | | | | | | 4,532,372 |
| Marine – 0.8% | | | | | | |
| Iino Kaiun Kaisha Ltd. | | 79,000 | | | | 774,461 |
| Road & Rail – 3.2% | | | | | | |
| East Japan Railway Co | | 159 | | | | 950,107 |
| Hamakyorex Co. Ltd. | | 64,400 | | | | 2,331,247 |
| | | | | | | 3,281,354 |
| Trading Companies & Distributors – 2.9% | | | | | | |
| BSL Corp. (d) | | 173,000 | | | | 368,559 |
| BSL Corp. warrants 12/15/05 (a) | | 17,300 | | | | 3,895 |
See accompanying notes which are an integral part of the financial statements.
15 Annual Report
| Investments - continued | | | | |
| |
| |
| Common Stocks – continued | | | | |
| | | Shares | | Value (Note 1) |
| |
| INDUSTRIALS – continued | | | | |
| Trading Companies & Distributors – continued | | | | |
| Mitsubishi Corp. | | 69,900 | | $ 1,362,028 |
| Mitsui & Co. Ltd. | | 103,000 | | 1,269,312 |
| | | | | 3,003,794 |
| Transportation Infrastructure – 0.7% | | | | |
| Kamigumi Co. Ltd. | | 55,000 | | 454,875 |
| The Sumitomo Warehouse Co. Ltd. | | 39,000 | | 303,296 |
| | | | | 758,171 |
| |
| TOTAL INDUSTRIALS | | | | 15,610,686 |
| |
| INFORMATION TECHNOLOGY – 17.5% | | | | |
| Computers & Peripherals – 1.0% | | | | |
| Fujitsu Ltd. | | 110,000 | | 727,800 |
| Meiko Electronics Co. Ltd. | | 7,100 | | 305,591 |
| | | | | 1,033,391 |
| Electronic Equipment & Instruments – 5.0% | | | | |
| Forval Corp. | | 29,500 | | 314,745 |
| Hoya Corp. | | 4,800 | | 168,769 |
| Hoya Corp. New | | 14,400 | | 502,567 |
| Nidec Corp. | | 6,600 | | 388,097 |
| Nidec Corp. New | | 5,700 | | 335,174 |
| Nippon Chemi-con Corp. | | 46,000 | | 280,052 |
| Nippon Electric Glass Co. Ltd. | | 93,000 | | 1,783,951 |
| Omron Corp. | | 19,800 | | 468,974 |
| SFA Engineering Corp. | | 16,000 | | 381,609 |
| Yaskawa Electric Corp. (a) | | 68,000 | | 531,769 |
| | | | | 5,155,707 |
| Internet Software & Services – 5.0% | | | | |
| Dip Corp. (a) | | 176 | | 274,354 |
| Index Corp. New (d) | | 300 | | 337,746 |
| livedoor Co. Ltd. (a) | | 182,410 | | 671,373 |
| Sammy NetWorks Co. Ltd. | | 28 | | 351,603 |
| Softbank Corp. | | 27,000 | | 1,531,550 |
| Telewave, Inc. | | 131 | | 765,775 |
| Yahoo! Japan Corp | | 789 | | 840,443 |
| Yahoo! Japan Corp. New | | 331 | | 358,314 |
| | | | | 5,131,158 |
| IT Services – 1.1% | | | | |
| NTT Data Corp. | | 107 | | 373,435 |
See accompanying notes which are an integral part of the financial statements.
| Common Stocks – continued | | | | | | |
| | | Shares | | Value (Note 1) |
| |
| INFORMATION TECHNOLOGY – continued | | | | | | |
| IT Services – continued | | | | | | |
| Otsuka Corp. | | 6,700 | | $ | | 592,996 |
| Software Research Association (SRA) | | 11,400 | | | | 192,022 |
| | | | | | | 1,158,453 |
| Office Electronics – 1.3% | | | | | | |
| Canon, Inc. | | 17,300 | | | | 918,111 |
| Konica Minolta Holdings, Inc. | | 44,500 | | | | 370,348 |
| | | | | | | 1,288,459 |
| Semiconductors & Semiconductor Equipment – 1.0% | | | | | | |
| Nihon Inter Electronics Corp. | | 36,000 | | | | 240,372 |
| Phoenix PDE Co. Ltd. | | 43,595 | | | | 209,623 |
| Sanken Electric Co. Ltd. | | 47,000 | | | | 543,382 |
| | | | | | | 993,377 |
| Software – 3.1% | | | | | | |
| Intelligent Wave, Inc. | | 752 | | | | 2,494,266 |
| KOEI Co. Ltd. | | 11,500 | | | | 348,572 |
| Trend Micro, Inc. | | 13,000 | | | | 406,422 |
| | | | | | | 3,249,260 |
| |
| TOTAL INFORMATION TECHNOLOGY | | | | | | 18,009,805 |
| |
| MATERIALS – 4.5% | | | | | | |
| Chemicals – 4.0% | | | | | | |
| Ise Chemical Corp. | | 136,000 | | | | 698,425 |
| JSR Corp. | | 41,600 | | | | 985,319 |
| Nissan Chemical Industries Co. Ltd. | | 32,000 | | | | 373,288 |
| Nitto Denko Corp. | | 16,700 | | | | 1,013,820 |
| Soken Chemical & Engineer Co. Ltd. | | 7,700 | | | | 228,724 |
| Teijin Ltd | | 140,000 | | | | 836,572 |
| | | | | | | 4,136,148 |
| Metals & Mining – 0.5% | | | | | | |
| Hitachi Metals Ltd. | | 9,000 | | | | 92,672 |
| Sumitomo Metal Mining Co. Ltd. | | 49,000 | | | | 447,263 |
| | | | | | | 539,935 |
| |
| TOTAL MATERIALS | | | | | | 4,676,083 |
| |
| TOTAL COMMON STOCKS | | | | | | |
| (Cost $87,992,863) | | | | 101,555,109 |
See accompanying notes which are an integral part of the financial statements.
17 Annual Report
Investments - continued
| Money Market Funds — 4.5% | | | | | | |
| | | Shares | | | | Value (Note 1) |
| Fidelity Cash Central Fund, 3.92% (b) | | 3,032,901 | | $ | | 3,032,901 |
| Fidelity Securities Lending Cash Central Fund, | | | | | | |
| 3.94% (b)(c) | | 1,622,691 | | | | 1,622,691 |
| TOTAL MONEY MARKET FUNDS | | | | | | |
| (Cost $4,655,592) | | | | | | 4,655,592 |
| TOTAL INVESTMENT PORTFOLIO – 102.9% | | | | | | |
| (Cost $92,648,455) | | | | | | 106,210,701 |
| |
| NET OTHER ASSETS – (2.9)% | | | | | | (2,972,366) |
| NET ASSETS – 100% | | | | $ | | 103,238,335 |
(a) Non-income producing
(b) Affiliated fund that is available only to investment companies and other accounts managed by Fidelity Investments. The rate quoted is the annualized seven-day yield of the fund at period end. A complete unaudited listing of the fund’s holdings as of its most recent quarter end is available upon request.
(c) Investment made with cash collateral received from securities on loan.
(d) Security or a portion of the security is on loan at period end.
At October 31, 2005, the fund had a capital loss carryforward of approximately $20,478,737 of which $10,494,841 and $9,983,896 will expire on October 31, 2009 and 2010, respectively.
See accompanying notes which are an integral part of the financial statements.
| Financial Statements | | | | | | | | |
| |
| |
| Statement of Assets and Liabilities | | | | | | | | |
| | | | | | | | | October 31, 2005 |
| |
| Assets | | | | | | | | |
| Investment in securities, at value (including securities | | | | | | | | |
| loaned of $1,531,918) (cost $92,648,455) — See | | | | | | | | |
| accompanying schedule | | | | | | $ | | 106,210,701 |
| Receivable for investments sold | | | | | | | | 1,434,826 |
| Receivable for fund shares sold | | | | | | | | 831,646 |
| Dividends receivable | | | | | | | | 213,483 |
| Interest receivable | | | | | | | | 10,750 |
| Receivable from investment adviser for expense | | | | | | | | |
| reductions | | | | | | | | 5,463 |
| Other affiliated receivables | | | | | | | | 1,634 |
| Other receivables | | | | | | | | 5,720 |
| Total assets | | | | | | | | 108,714,223 |
| |
| Liabilities | | | | | | | | |
| Payable for investments purchased | | $ | | 3,500,375 | | | | |
| Payable for fund shares redeemed | | | | 171,825 | | | | |
| Accrued management fee | | | | 57,079 | | | | |
| Distribution fees payable | | | | 51,868 | | | | |
| Other affiliated payables | | | | 27,333 | | | | |
| Other payables and accrued expenses | | | | 44,717 | | | | |
| Collateral on securities loaned, at value | | | | 1,622,691 | | | | |
| Total liabilities | | | | | | | | 5,475,888 |
| |
| Net Assets | | | | | | $ | | 103,238,335 |
| Net Assets consist of: | | | | | | | | |
| Paid in capital | | | | | | $ | | 111,218,918 |
| Accumulated undistributed net realized gain (loss) on | | | | | | | | |
| investments and foreign currency transactions | | | | | | | | (21,528,842) |
| Net unrealized appreciation (depreciation) on | | | | | | | | |
| investments and assets and liabilities in foreign | | | | | | | | |
| currencies | | | | | | | | 13,548,259 |
| Net Assets | | | | | | $ | | 103,238,335 |
See accompanying notes which are an integral part of the financial statements.
19 Annual Report
| Financial Statements - continued | | | | |
| |
| |
| |
| Statement of Assets and Liabilities — continued | | | | |
| | | October 31, 2005 |
| |
| Calculation of Maximum Offering Price | | | | |
| Class A: | | | | |
| Net Asset Value and redemption price per share | | | | |
| ($26,168,783 ÷ 1,676,736 shares) | | $ | | 15.61 |
| Maximum offering price per share (100/94.25 of | | | | |
| $15.61) | | $ | | 16.56 |
| Class T: | | | | |
| Net Asset Value and redemption price per share | | | | |
| ($15,610,346 ÷ 1,013,288 shares) | | $ | | 15.41 |
| Maximum offering price per share (100/96.50 of | | | | |
| $15.41) | | $ | | 15.97 |
| Class B: | | | | |
| Net Asset Value and offering price per share | | | | |
| ($18,916,158 ÷ 1,264,134 shares)A | | $ | | 14.96 |
| Class C: | | | | |
| Net Asset Value and offering price per share | | | | |
| ($34,144,483 ÷ 2,268,539 shares)A | | $ | | 15.05 |
| Institutional Class: | | | | |
| Net Asset Value, offering price and redemption | | | | |
| price per share ($8,398,565 ÷ 528,080 | | | | |
| shares) | | $ | | 15.90 |
| |
| A Redemption price per share is equal to net asset value less any applicable contingent deferred sales charge. | | | | |
See accompanying notes which are an integral part of the financial statements.
Annual Report 20
| Statement of Operations | | | | | | |
| | | | | Year ended October 31, 2005 |
| |
| Investment Income | | | | | | |
| Dividends | | | | $ | | 729,602 |
| Interest | | | | | | 50,482 |
| Security lending | | | | | | 57,496 |
| | | | | | | 837,580 |
| Less foreign taxes withheld | | | | | | (50,780) |
| Total income | | | | | | 786,800 |
| |
| Expenses | | | | | | |
| Management fee | | $ | | 564,484 | | |
| Transfer agent fees | | | | 259,586 | | |
| Distribution fees | | | | 526,980 | | |
| Accounting and security lending fees | | | | 56,634 | | |
| Independent trustees’ compensation | | | | 360 | | |
| Custodian fees and expenses | | | | 88,366 | | |
| Registration fees | | | | 48,640 | | |
| Audit | | | | 40,752 | | |
| Legal | | | | 810 | | |
| Miscellaneous | | | | 2,774 | | |
| Total expenses before reductions | | | | 1,589,386 | | |
| Expense reductions | | | | (61,308) | | 1,528,078 |
| |
| Net investment income (loss) | | | | | | (741,278) |
| Realized and Unrealized Gain (Loss) | | | | | | |
| Net realized gain (loss) on: | | | | | | |
| Investment securities | | | | 5,548,774 | | |
| Foreign currency transactions | | | | (24,038) | | |
| Total net realized gain (loss) | | | | | | 5,524,736 |
| Change in net unrealized appreciation (depreciation) on: | | | | |
| Investment securities | | | | 11,388,402 | | |
| Assets and liabilities in foreign currencies | | | | (21,644) | | |
| Total change in net unrealized appreciation | | | | | | |
| (depreciation) | | | | | | 11,366,758 |
| Net gain (loss) | | | | | | 16,891,494 |
| Net increase (decrease) in net assets resulting from | | | | | | |
| operations | | | | $ | | 16,150,216 |
See accompanying notes which are an integral part of the financial statements.
21 Annual Report
| Financial Statements - continued | | | | | | | | |
| |
| |
| Statement of Changes in Net Assets | | | | | | | | |
| | | | | Year ended | | | | Year ended |
| | | | | October 31, | | | | October 31, |
| | | | | 2005 | | | | 2004 |
| Increase (Decrease) in Net Assets | | | | | | | | |
| Operations | | | | | | | | |
| Net investment income (loss) | | $ | | (741,278) | | $ | | (818,124) |
| Net realized gain (loss) | | | | 5,524,736 | | | | 4,854,592 |
| Change in net unrealized appreciation (depreciation) . | | | | 11,366,758 | | | | (3,148,734) |
| Net increase (decrease) in net assets resulting | | | | | | | | |
| from operations | | | | 16,150,216 | | | | 887,734 |
| Share transactions -- net increase (decrease) | | | | 13,972,644 | | | | 22,543,746 |
| Redemption fees | | | | 38,032 | | | | 88,428 |
| Total increase (decrease) in net assets | | | | 30,160,892 | | | | 23,519,908 |
| |
| Net Assets | | | | | | | | |
| Beginning of period | | | | 73,077,443 | | | | 49,557,535 |
| End of period (including accumulated net investment | | | | | | | | |
| income of $0 and accumulated net investment loss of | | | | | | | | |
| $645,663, respectively) | | $ | | 103,238,335 | | $ | | 73,077,443 |
See accompanying notes which are an integral part of the financial statements.
| Financial Highlights — Class A | | | | | | | | | | |
| Years ended October 31, | | 2005 | | 2004 | | | | 2003 | | 2002 | | 2001 |
| Selected Per-Share Data | | | | | | | | | | | | |
| Net asset value, beginning of | | | | | | | | | | | | |
| period | | $ 12.64 | | $ 11.78 | | $ | | 8.74 | | $ 10.18 | | $ 17.78 |
| Income from Investment | | | | | | | | | | | | |
| Operations | | | | | | | | | | | | |
| Net investment income (loss)C | | (.08) | | (.11) | | | | (.07) | | (.13) | | (.15) |
| Net realized and unrealized | | | | | | | | | | | | |
| gain (loss) | | 3.04 | | .95 | | | | 3.11 | | (1.31) | | (6.13) |
| Total from investment operations | | 2.96 | | .84 | | | | 3.04 | | (1.44) | | (6.28) |
| Distributions from net investment | | | | | | | | | | | | |
| income | | — | | — | | | | — | | — | | (1.32) |
| Redemption fees added to paid in | | | | | | | | | | | | |
| capitalC | | 01 | | .02 | | | | — | | — | | — |
| Net asset value, end of period | | $ 15.61 | | $ 12.64 | | $ | | 11.78 | | $ 8.74 | | $ 10.18 |
| Total ReturnA,B | | 23.50% | | 7.30% | | | | 34.78% | | (14.15)% | | (37.89)% |
| Ratios to Average Net AssetsD | | | | | | | | | | | | |
| Expenses before expense | | | | | | | | | | | | |
| reductions | | 1.62% | | 1.80% | | | | 2.20% | | 2.13% | | 1.88% |
| Expenses net of voluntary waiv- | | | | | | | | | | | | |
| ers, if any | | 1.56% | | 1.75% | | | | 1.75% | | 1.94% | | 1.88% |
| Expenses net of all reductions | | 1.55% | | 1.75% | | | | 1.75% | | 1.94% | | 1.84% |
| Net investment income (loss) | | (.54)% | | (.89)% | | | | (.76)% | | (1.27)% | | (1.10)% |
| Supplemental Data | | | | | | | | | | | | |
| Net assets, end of period (000 | | | | | | | | | | | | |
| omitted) | | $26,169 | | $17,884 | | $ | | 8,695 | | $ 3,380 | | $ 4,204 |
| Portfolio turnover rate | | 89% | | 83% | | | | 99% | | 128% | | 123% |
A Total returns would have been lower had certain expenses not been reduced during the periods shown.
B Total returns do not include the effect of the sales charges.
C Calculated based on average shares outstanding during the period.
D Expense ratios reflect operating expenses of the class. Expenses before reductions do not reflect amounts reimbursed by the investment adviser or reductions from brokerage service arrangements or other expense offset arrangements and do not represent the amount paid by the class during periods when reimbursements or reductions occur. Expenses net of any voluntary waivers reflect expenses after reimbursement by the investment adviser but prior to reductions from brokerage service arrangements or other expense offset arrangements. Expenses net of all reductions repre sent the net expenses paid by the class.
See accompanying notes which are an integral part of the financial statements.
23 Annual Report
| Financial Highlights — Class T | | | | | | | | |
| Years ended October 31, | | 2005 | | 2004 | | 2003 | | 2002 | | 2001 |
| Selected Per-Share Data | | | | | | | | | | |
| Net asset value, beginning of | | | | | | | | | | |
| period | | $ 12.51 | | $ 11.68 | | $ 8.69 | | $ 10.17 | | $ 17.72 |
| Income from Investment | | | | | | | | | | |
| Operations | | | | | | | | | | |
| Net investment income (loss)C | | (.11) | | (.14) | | (.09) | | (.15) | | (.20) |
| Net realized and unrealized | | | | | | | | | | |
| gain (loss) | | 3.00 | | .95 | | 3.08 | | (1.33) | | (6.14) |
| Total from investment operations | | 2.89 | | .81 | | 2.99 | | (1.48) | | (6.34) |
| Distributions from net investment | | | | | | | | | | |
| income | | — | | — | | — | | — | | (1.21) |
| Redemption fees added to paid in | | | | | | | | | | |
| capitalC | | 01 | | .02 | | — | | — | | — |
| Net asset value, end of period | | $ 15.41 | | $ 12.51 | | $ 11.68 | | $ 8.69 | | $ 10.17 |
| Total ReturnA,B | | 23.18% | | 7.11% | | 34.41% | | (14.55)% | | (38.16)% |
| Ratios to Average Net AssetsD | | | | | | | | | | |
| Expenses before expense | | | | | | | | | | |
| reductions | | 1.97% | | 2.19% | | 2.57% | | 2.45% | | 2.25% |
| Expenses net of voluntary waiv- | | | | | | | | | | |
| ers, if any | | 1.81% | | 2.00% | | 2.00% | | 2.19% | | 2.25% |
| Expenses net of all reductions | | 1.80% | | 2.00% | | 2.00% | | 2.18% | | 2.21% |
| Net investment income (loss) | | (.79)% | | (1.14)% | | (1.01)% | | (1.52)% | | (1.48)% |
| Supplemental Data | | | | | | | | | | |
| Net assets, end of period (000 | | | | | | | | | | |
| omitted) | | $15,610 | | $11,493 | | $11,823 | | $ 7,731 | | $10,363 |
| Portfolio turnover rate | | 89% | | 83% | | 99% | | 128% | | 123% |
A Total returns would have been lower had certain expenses not been reduced during the periods shown.
B Total returns do not include the effect of the sales charges.
C Calculated based on average shares outstanding during the period.
D Expense ratios reflect operating expenses of the class. Expenses before reductions do not reflect amounts reimbursed by the investment adviser or reductions from brokerage service arrangements or other expense offset arrangements and do not represent the amount paid by the class during periods when reimbursements or reductions occur. Expenses net of any voluntary waivers reflect expenses after reimbursement by the investment adviser but prior to reductions from brokerage service arrangements or other expense offset arrangements. Expenses net of all reductions repre sent the net expenses paid by the class.
See accompanying notes which are an integral part of the financial statements.
| Financial Highlights — Class B | | | | | | | | |
| Years ended October 31, | | 2005 | | 2004 | | 2003 | | 2002 | | 2001 |
| Selected Per-Share Data | | | | | | | | | | |
| Net asset value, beginning of | | | | | | | | | | |
| period | | $ 12.21 | | $ 11.46 | | $ 8.57 | | $ 10.07 | | $ 17.55 |
| Income from Investment | | | | | | | | | | |
| Operations | | | | | | | | | | |
| Net investment income (loss)C | | (.17) | | (.20) | | (.14) | | (.20) | | (.26) |
| Net realized and unrealized | | | | | | | | | | |
| gain (loss) | | 2.91 | | .93 | | 3.03 | | (1.30) | | (6.09) |
| Total from investment operations | | 2.74 | | .73 | | 2.89 | | (1.50) | | (6.35) |
| Distributions from net investment | | | | | | | | | | |
| income | | — | | — | | — | | — | | (1.13) |
| Redemption fees added to paid in | | | | | | | | | | |
| capitalC | | 01 | | .02 | | — | | — | | — |
| Net asset value, end of period | | $ 14.96 | | $ 12.21 | | $ 11.46 | | $ 8.57 | | $ 10.07 |
| Total ReturnA,B | | 22.52% | | 6.54% | | 33.72% | | (14.90)% | | (38.44)% |
| Ratios to Average Net AssetsD | | | | | | | | | | |
| Expenses before expense | | | | | | | | | | |
| reductions | | 2.43% | | 2.62% | | 3.03% | | 2.90% | | 2.74% |
| Expenses net of voluntary waiv- | | | | | | | | | | |
| ers, if any | | 2.31% | | 2.50% | | 2.50% | | 2.69% | | 2.74% |
| Expenses net of all reductions | | 2.30% | | 2.50% | | 2.50% | | 2.68% | | 2.71% |
| Net investment income (loss) | | (1.30)% | | (1.64)% | | (1.51)% | | (2.02)% | | (1.97)% |
| Supplemental Data | | | | | | | | | | |
| Net assets, end of period (000 | | | | | | | | | | |
| omitted) | | $18,916 | | $18,218 | | $14,761 | | $10,229 | | $13,523 |
| Portfolio turnover rate | | 89% | | 83% | | 99% | | 128% | | 123% |
A Total returns would have been lower had certain expenses not been reduced during the periods shown.
B Total returns do not include the effect of the contingent deferred sales charge.
C Calculated based on average shares outstanding during the period.
D Expense ratios reflect operating expenses of the class. Expenses before reductions do not reflect amounts reimbursed by the investment adviser or reductions from brokerage service arrangements or other expense offset arrangements and do not represent the amount paid by the class during periods when reimbursements or reductions occur. Expenses net of any voluntary waivers reflect expenses after reimbursement by the investment adviser but prior to reductions from brokerage service arrangements or other expense offset arrangements. Expenses net of all reductions repre sent the net expenses paid by the class.
See accompanying notes which are an integral part of the financial statements.
25 Annual Report
| Financial Highlights — Class C | | | | | | | | |
| Years ended October 31, | | 2005 | | 2004 | | 2003 | | 2002 | | 2001 |
| Selected Per-Share Data | | | | | | | | | | |
| Net asset value, beginning of | | | | | | | | | | |
| period | | $ 12.28 | | $ 11.52 | | $ 8.61 | | $ 10.13 | | $ 17.58 |
| Income from Investment | | | | | | | | | | |
| Operations | | | | | | | | | | |
| Net investment income (loss)C | | (.17) | | (.19) | | (.14) | | (.20) | | (.24) |
| Net realized and unrealized | | | | | | | | | | |
| gain (loss) | | 2.93 | | .93 | | 3.05 | | (1.32) | | (6.10) |
| Total from investment operations | | 2.76 | | .74 | | 2.91 | | (1.52) | | (6.34) |
| Distributions from net investment | | | | | | | | | | |
| income | | — | | — | | — | | — | | (1.11) |
| Redemption fees added to paid in | | | | | | | | | | |
| capitalC | | 01 | | .02 | | — | | — | | — |
| Net asset value, end of period | | $ 15.05 | | $ 12.28 | | $ 11.52 | | $ 8.61 | | $ 10.13 |
| Total ReturnA,B | | 22.56% | | 6.60% | | 33.80% | | (15.00)% | | (38.27)% |
| Ratios to Average Net AssetsD | | | | | | | | | | |
| Expenses before expense | | | | | | | | | | |
| reductions | | 2.27% | | 2.44% | | 2.82% | | 2.72% | | 2.59% |
| Expenses net of voluntary waiv- | | | | | | | | | | |
| ers, if any | | 2.27% | | 2.44% | | 2.50% | | 2.67% | | 2.59% |
| Expenses net of all reductions | | 2.26% | | 2.44% | | 2.49% | | 2.67% | | 2.55% |
| Net investment income (loss) | | (1.25)% | | (1.58)% | | (1.51)% | | (2.00)% | | (1.81)% |
| Supplemental Data | | | | | | | | | | |
| Net assets, end of period (000 | | | | | | | | | | |
| omitted) | | $34,144 | | $21,564 | | $10,374 | | $ 6,497 | | $ 8,170 |
| Portfolio turnover rate | | 89% | | 83% | | 99% | | 128% | | 123% |
A Total returns would have been lower had certain expenses not been reduced during the periods shown.
B Total returns do not include the effect of the contingent deferred sales charge.
C Calculated based on average shares outstanding during the period.
D Expense ratios reflect operating expenses of the class. Expenses before reductions do not reflect amounts reimbursed by the investment adviser or reductions from brokerage service arrangements or other expense offset arrangements and do not represent the amount paid by the class during periods when reimbursements or reductions occur. Expenses net of any voluntary waivers reflect expenses after reimbursement by the investment adviser but prior to reductions from brokerage service arrangements or other expense offset arrangements. Expenses net of all reductions repre sent the net expenses paid by the class.
See accompanying notes which are an integral part of the financial statements.
| Financial Highlights — Institutional Class | | | | | | | | | | |
| Years ended October 31, | | 2005 | | 2004 | | | | 2003 | | 2002 | | | | 2001 |
| Selected Per-Share Data | | | | | | | | | | | | | | |
| Net asset value, beginning of | | | | | | | | | | | | | | |
| period | | $ 12.83 | | $ 11.91 | | $ | | 8.82 | | $ 10.25 | | $ | | 17.88 |
| Income from Investment | | | | | | | | | | | | | | |
| Operations | | | | | | | | | | | | | | |
| Net investment income (loss)B | | (.02) | | (.06) | | | | (.05) | | (.08) | | | | (.10) |
| Net realized and unrealized | | | | | | | | | | | | | | |
| gain (loss) | | 3.08 | | .96 | | | | 3.14 | | (1.35) | | | | (6.16) |
| Total from investment operations | | 3.06 | | .90 | | | | 3.09 | | (1.43) | | | | (6.26) |
| Distributions from net investment | | | | | | | | | | | | | | |
| income | | — | | — | | | | — | | — | | | | (1.37) |
| Redemption fees added to paid in | | | | | | | | | | | | | | |
| capitalB | | 01 | | .02 | | | | — | | — | | | | — |
| Net asset value, end of period | | $ 15.90 | | $ 12.83 | | $ | | 11.91 | | $ 8.82 | | $ | | 10.25 |
| Total ReturnA | | 23.93% | | 7.72% | | | | 35.03% | | (13.95)% | | | | (37.64)% |
| Ratios to Average Net AssetsC | | | | | | | | | | | | | | |
| Expenses before expense | | | | | | | | | | | | | | |
| reductions | | 1.19% | | 1.36% | | | | 1.67% | | 1.52% | | | | 1.48% |
| Expenses net of voluntary waiv- | | | | | | | | | | | | | | |
| ers, if any | | 1.19% | | 1.36% | | | | 1.50% | | 1.51% | | | | 1.48% |
| Expenses net of all reductions | | 1.17% | | 1.36% | | | | 1.49% | | 1.51% | | | | 1.44% |
| Net investment income (loss) | | (.17)% | | (.50)% | | | | (.51)% | | (.84)% | | | | (.70)% |
| Supplemental Data | | | | | | | | | | | | | | |
| Net assets, end of period (000 | | | | | | | | | | | | | | |
| omitted) | | $ 8,399 | | $ 3,919 | | $ | | 3,905 | | $ 5,612 | | $ | | 795 |
| Portfolio turnover rate | | 89% | | 83% | | | | 99% | | 128% | | | | 123% |
A Total returns would have been lower had certain expenses not been reduced during the periods shown.
B Calculated based on average shares outstanding during the period.
C Expense ratios reflect operating expenses of the class. Expenses before reductions do not reflect amounts reimbursed by the investment adviser or reductions from brokerage service arrangements or other expense offset arrangements and do not represent the amount paid by the class during periods when reimbursements or reductions occur. Expenses net of any voluntary waivers reflect expenses after reimbursement by the investment adviser but prior to reductions from brokerage service arrangements or other expense offset arrangements. Expenses net of all reductions repre sent the net expenses paid by the class.
See accompanying notes which are an integral part of the financial statements.
27 Annual Report
Notes to Financial Statements
For the period ended October 31, 2005
|
1. Significant Accounting Policies.
Fidelity Advisor Japan Fund (the fund) is a fund of Fidelity Advisor Series VIII (the trust) and is authorized to issue an unlimited number of shares. The trust is registered under the Investment Company Act of 1940, as amended (the 1940 Act), as an open-end management investment company organized as a Massachusetts business trust.
The fund offers Class A, Class T, Class B, Class C and Institutional Class shares, each of which has equal rights as to assets and voting privileges. Each class has exclusive voting rights with respect to matters that affect that class. Class B shares will automatically convert to Class A shares after a holding period of seven years from the initial date of purchase. Investment income, realized and unrealized capital gains and losses, the common expenses of the fund, and certain fund-level expense reductions, if any, are allocated on a pro rata basis to each class based on the relative net assets of each class to the total net assets of the fund. Each class differs with respect to transfer agent and distribution and service plan fees incurred. Certain expense reductions also differ by class.
The fund may invest in affiliated money market central funds (Money Market Central Funds) which are open-end investment companies available to investment companies and other accounts managed by Fidelity Management & Research Company (FMR) and its affiliates. The financial statements have been prepared in conformity with accounting principles generally accepted in the United States of America, which require management to make certain estimates and assumptions at the date of the financial statements. The following summarizes the significant accounting policies of the fund:
Security Valuation. Investments are valued and net asset value (NAV) per share is calculated (NAV calculation) as of the close of business of the New York Stock Exchange (NYSE), normally 4:00 p.m. Eastern time. Wherever possible, the fund uses independent pricing services approved by the Board of Trustees to value its investments.
Equity securities, including restricted securities, for which market quotations are readily available, are valued at the last reported sale price or official closing price as reported by an independent pricing service on the primary market or exchange on which they are traded. In the event there were no sales during the day or closing prices are not available, securities are valued at the last quoted bid price. Investments in open-end mutual funds, are valued at their closing net asset value each business day. Short-term securities with remaining maturities of sixty days or less for which quotations are not readily available are valued at amortized cost, which approximates value.
When current market prices or quotations are not readily available or do not accurately reflect fair value, valuations may be determined in accordance with procedures adopted by the Board of Trustees. For example, when developments occur between the close of a market and the close of the NYSE that may materially affect the value of some or all of
1. Significant Accounting Policies - continued
Security Valuation - continued
the securities, or when trading in a security is halted, those securities may be fair valued. Factors used in the determination of fair value may include monitoring news to identify significant market or security specific events such as changes in the value of U.S. securities market, reviewing developments in foreign markets and evaluating the performance of ADRs, futures contracts and exchange-traded funds. Because the fund’s utilization of fair value pricing depends on market activity, the frequency with which fair value pricing is used can not be predicted and may be utilized to a significant extent. The value of securities used for NAV calculation under fair value pricing may differ from published prices for the same securities.
Foreign Currency. The fund uses foreign currency contracts to facilitate transactions in foreign-denominated securities. Losses from these transactions may arise from changes in the value of the foreign currency or if the counterparties do not perform under the contracts’ terms.
Foreign-denominated assets, including investment securities, and liabilities are translated into U.S. dollars at the exchange rate at period end. Purchases and sales of investment securities, income and dividends received and expenses denominated in foreign currencies are translated into U.S. dollars at the exchange rate in effect on the transaction date.
The effects of exchange rate fluctuations on investments are included with the net realized and unrealized gain (loss) on investment securities. Other foreign currency transactions resulting in realized and unrealized gain (loss) are disclosed separately.
Investment Transactions and Income. Security transactions are accounted for as of trade date. Gains and losses on securities sold are determined on the basis of identified cost. Dividend income is recorded on the ex-dividend date, except for certain dividends from foreign securities where the ex-dividend date may have passed, which are recorded as soon as the fund is informed of the ex-dividend date. Non-cash dividends included in dividend income, if any, are recorded at the fair market value of the securities received. Interest income is accrued as earned. Interest income includes coupon interest and amortization of premium and accretion of discount on debt securities. Investment income is recorded net of foreign taxes withheld where recovery of such taxes is uncertain.
Expenses. Most expenses of the trust can be directly attributed to a fund. Expenses which cannot be directly attributed are apportioned among each fund in the trust.
29 Annual Report
Notes to Financial Statements - continued
1. Significant Accounting Policies - continued
Income Tax Information and Distributions to Shareholders. Each year, the fund intends to qualify as a regulated investment company by distributing all of its taxable income and realized gains under Subchapter M of the Internal Revenue Code. As a result, no provision for income taxes is required in the accompanying financial statements. Foreign taxes are provided for based on the fund’s understanding of the tax rules and rates that exist in the foreign markets in which it invests.
Distributions are recorded on the ex-dividend date. Income dividends and capital gain distributions are declared separately for each class. Income and capital gain distributions are determined in accordance with income tax regulations, which may differ from generally accepted accounting principles.
Capital accounts within the financial statements are adjusted for permanent book-tax differences. These adjustments have no impact on net assets or the results of operations. Temporary book-tax differences will reverse in a subsequent period.
Book-tax differences are primarily due to foreign currency transactions, passive foreign investment companies (PFIC), net operating losses, capital loss carryforwards and losses deferred due to wash sales.
The tax-basis components of distributable earnings and the federal tax cost as of period end were as follows:
| Unrealized appreciation | | $ | | 16,258,916 |
| Unrealized depreciation | | | | (3,760,739) |
| Net unrealized appreciation (depreciation) | | | | 12,498,177 |
| Capital loss carryforward | | | | (20,478,737) |
| |
| Cost for federal income tax purposes | | $ | | 93,712,524 |
Short-Term Trading (Redemption) Fees. Shares held in the fund less than 90 days are subject to a redemption fee equal to 1.50% of the proceeds of the redeemed shares. All redemption fees, including any estimated redemption fees paid by FMR, are retained by the fund and accounted for as an addition to paid in capital.
Repurchase Agreements. FMR has received an Exemptive Order from the Securities and Exchange Commission (the SEC) which permits the fund and other affiliated entities of FMR to transfer uninvested cash balances into joint trading accounts which are then invested in repurchase agreements. The fund may also invest directly with institutions in repurchase agreements. Repurchase agreements are collateralized by government or non-government securities. Collateral is held in segregated accounts with custodian banks and may be obtained in the event of a default of the counterparty. The
2. Operating Policies - continued
Repurchase Agreements - continued
fund monitors, on a daily basis, the value of the collateral to ensure it is at least equal to the principal amount of the repurchase agreement (including accrued interest). In the event of a default by the counterparty, realization of the collateral proceeds could be delayed, during which time the value of the collateral may decline.
3. Purchases and Sales of Investments.
Purchases and sales of securities, other than short-term securities and U.S. government securities, aggregated $82,866,479 and $69,717,621, respectively.
4. Fees and Other Transactions with Affiliates.
Management Fee. FMR and its affiliates provide the fund with investment management related services for which the fund pays a monthly management fee. The management fee is the sum of an individual fund fee rate that is based on an annual rate of .45% of the fund’s average net assets and a group fee rate that averaged 0.27% during the period. The group fee rate is based upon the average net assets of all the mutual funds advised by FMR. The group fee rate decreases as assets under management increase and increases as assets under management decrease. For the period, the total annual management fee rate was .72% of the fund’s average net assets.
Distribution and Service Plan. In accordance with Rule 12b-1 of the 1940 Act, the fund has adopted separate Distribution and Service Plans for each class of shares. Certain classes pay Fidelity Distributors Corporation (FDC), an affiliate of FMR, separate Distribution and Service Fees, each of which is based on an annual percentage of each class’ average net assets. In addition, FDC may pay financial intermediaries for selling shares of the fund and providing shareholder support services. For the period, the Distribution and Service Fee rates and the total amounts paid to and retained by FDC were as follows:
| | | Distribution | | Service | | | | Paid to | | | | Retained |
| | | Fee | | Fee | | | | FDC | | | | by FDC |
| Class A | | 0% | | .25% | | $ | | 45,952 | | $ | | 91 |
| Class T | | 25% | | .25% | | | | 65,664 | | | | 50 |
| Class B | | 75% | | .25% | | | | 177,308 | | | | 133,164 |
| Class C | | 75% | | .25% | | | | 238,056 | | | | 99,944 |
| |
| | | | | | | $ | | 526,980 | | $ | | 233,249 |
Sales Load. FDC receives a front-end sales charge of up to 5.75% for selling Class A shares, and 3.50% for selling Class T shares, some of which is paid to financial intermediaries for selling shares of the fund. FDC receives the proceeds of contingent deferred sales charges levied on Class A, Class T, Class B, and Class C redemptions. These charges
31 Annual Report
Notes to Financial Statements - continued
4. Fees and Other Transactions with Affiliates - continued
Sales Load - continued
depend on the holding period. The deferred sales charges range from 5% to 1% for Class B, 1% for Class C, and .25% for certain purchases of Class A and Class T shares.
| For the period, sales charge amounts retained by FDC were as follows: | | |
| | | | | Retained |
| | | | | by FDC |
| Class A | | $ | | 33,354 |
| Class T | | | | 9,974 |
| Class B* | | | | 61,598 |
| Class C* | | | | 7,850 |
| | | $ | | 112,776 |
* When Class B and Class C shares are initially sold, FDC pays commissions from its own resources to financial intermediaries through which the sales are made.
Transfer Agent Fees. Fidelity Investments Institutional Operations Company, Inc. (FIIOC), an affiliate of FMR, is the transfer, dividend disbursing and shareholder servicing agent for each class of the fund. FIIOC receives account fees and asset-based fees that vary according to the account size and type of account of the shareholders of the respective classes of the fund. FIIOC pays for typesetting, printing and mailing of shareholder reports, except proxy statements. For the period the total transfer agent fees paid by each class to FIIOC, were as follows:
| | | | | | | % of |
| | | | | | | Average |
| | | | | Amount | | Net Assets |
| Class A | | $ | | 63,363 | | .34 |
| Class T | | | | 57,771 | | .44 |
| Class B | | | | 72,037 | | .41 |
| Class C | | | | 58,205 | | .24 |
| Institutional Class | | | | 8,210 | | .16 |
| | | $ | | 259,586 | | |
Accounting and Security Lending Fees. Fidelity Service Company, Inc. (FSC), an affiliate of FMR, maintains the fund’s accounting records. The accounting fee is based on the level of average net assets for the month. Under a separate contract, FSC administers the security lending program. The security lending fee is based on the number and duration of lending transactions.
4. Fees and Other Transactions with Affiliates - continued
Affiliated Central Funds. The fund may invest in Money Market Central Funds which seek preservation of capital and current income and are managed by Fidelity Investments Money Management, Inc. (FIMM), an affiliate of FMR.
The Money Market Central Funds do not pay a management fee. Income distributions earned by the fund are recorded as income in the accompanying financial statements and totaled $74,776 for the period.
5. Committed Line of Credit.
|
The fund participates with other funds managed by FMR in a $4.2 billion credit facility (the “line of credit”) to be utilized for temporary or emergency purposes to fund shareholder redemptions or for other short-term liquidity purposes. The fund has agreed to pay commitment fees on its pro rata portion of the line of credit. During the period, there were no borrowings on this line of credit.
The fund lends portfolio securities from time to time in order to earn additional income. The fund receives collateral (in the form of U.S. Treasury obligations, letters of credit and/or cash) against the loaned securities and maintains collateral in an amount not less than 100% of the market value of the loaned securities during the period of the loan. The market value of the loaned securities is determined at the close of business of the fund and any additional required collateral is delivered to the fund on the next business day. If the borrower defaults on its obligation to return the securities loaned because of insolvency or other reasons, a fund could experience delays and costs in recovering the securities loaned or in gaining access to the collateral. Cash collateral is invested in the Fidelity Securities Lending Cash Central Fund. The value of loaned securities and cash collateral at period end are disclosed on the fund’s Statement of Assets and Liabilities. Security lending income represents the income earned on investing cash collateral, less fees and expenses associated with the loan, plus any premium payments that may be received on the loan of certain types of securities.
33 Annual Report
Notes to Financial Statements - continued
7. Expense Reductions.
FMR voluntarily agreed to reimburse each class to the extent annual operating expenses exceeded certain levels of average net assets as noted in the table below. Some expenses, for example interest expense, are excluded from this reimbursement.
| The following classes were in reimbursement during the period: | | | | |
| | | Expense | | | | Reimbursement |
| | | Limitations | | | | from adviser |
| Class A | | 1.75% | | -- | | 1.50%* | | $ | | 11,103 |
| Class T | | 2.00% | | -- | | 1.75%* | | | | 20,451 |
| Class B | | 2.50% | | -- | | 2.25%* | | | | 21,499 |
| Class C | | 2.50% | | -- | | 2.25%* | | | | — |
| Institutional Class | | 1.50% | | -- | | 1.25%* | | | | — |
| | | | | | | | | $ | | 53,053 |
| * Expense limitation in effect at period end. | | | | | | | | | | |
Many of the brokers with whom FMR places trades on behalf of the fund provided services to the fund in addition to trade execution. These services included payments of certain expenses on behalf of the fund totaling $8,255 for the period.
The fund’s organizational documents provide former and current trustees and officers with a limited indemnification against liabilities arising in connection with the performance of their duties to the fund. In the normal course of business, the fund may also enter into contracts that provide general indemnifications. The fund’s maximum exposure under these arrangements is unknown as this would be dependent on future claims that may be made against the fund. The risk of material loss from such claims is considered remote.
| 9. Share Transactions. | | | | | | | | | | |
| |
| Transactions for each class of shares were as follows: | | | | | | | | |
| |
| | | Shares | | | | Dollars |
| Years ended October 31, | | 2005 | | 2004 | | | | 2005 | | | | 2004 |
| Class A | | | | | | | | | | | | |
| Shares sold | | 1,120,934 | | 2,153,586 | | $ 16,117,987 | | $ 28,186,518 |
| Shares redeemed | | (859,010) | | (1,477,090) | | (11,688,765) | | (18,736,827) |
| Net increase (decrease) | | 261,924 | | 676,496 | | $ | | 4,429,222 | | $ | | 9,449,691 |
| Class T | | | | | | | | | | | | |
| Shares sold | | 430,689 | | 593,692 | | $ | | 6,034,540 | | $ | | 7,826,011 |
| Shares redeemed | | (336,350) | | (686,792) | | | | (4,607,590) | | | | (8,546,610) |
| Net increase (decrease) | | 94,339 | | (93,100) | | $ | | 1,426,950 | | $ | | (720,599) |
| Class B | | | | | | | | | | | | |
| Shares sold | | 255,973 | | 565,247 | | $ | | 3,480,072 | | $ | | 7,156,870 |
| Shares redeemed | | (483,966) | | (361,283) | | | | (6,366,382) | | | | (4,393,797) |
| Net increase (decrease) | | (227,993) | | 203,964 | | $ | | (2,886,310) | | $ | | 2,763,073 |
| Class C | | | | | | | | | | | | |
| Shares sold | | 1,191,024 | | 1,188,114 | | $ 16,663,352 | | $ 15,297,584 |
| Shares redeemed | | (679,047) | | (332,125) | | | | (9,010,210) | | | | (4,109,703) |
| Net increase (decrease) | | 511,977 | | 855,989 | | $ | | 7,653,142 | | $ 11,187,881 |
| Institutional Class | | | | | | | | | | | | |
| Shares sold | | 316,545 | | 172,730 | | $ | | 4,655,271 | | $ | | 2,327,308 |
| Shares redeemed | | (93,863) | | (195,170) | | | | (1,305,631) | | | | (2,463,608) |
| Net increase (decrease) | | 222,682 | | (22,440) | | $ | | 3,349,640 | | $ | | (136,300) |
35 Annual Report
Report of Independent Registered Public Accounting Firm
To the Trustees of Fidelity Advisor Series VIII and the Shareholders of Fidelity Advisor Japan Fund:
In our opinion, the accompanying statement of assets and liabilities, including the schedule of investments, and the related statements of operations and of changes in net assets and the financial highlights present fairly, in all material respects, the financial position of Fidelity Advisor Japan Fund (a fund of Fidelity Advisor Series VIII) at October 31, 2005 and the results of its operations, the changes in its net assets and the financial highlights for the periods indicated, in conformity with accounting principles generally accepted in the United States of America. These financial statements and financial highlights (hereafter referred to as “financial statements”) are the responsibility of the Fidelity Advisor Japan Fund’s management; our responsibility is to express an opinion on these financial statements based on our audits. We conducted our audits of these financial statements in accordance with the standards of the Public Company Accounting Oversight Board (United States). Those standards require that we plan and perform the audit to obtain reasonable assurance about whether the financial statements are free of material misstatement. An audit includes examining, on a test basis, evidence supporting the amounts and disclosures in the financial statements, assessing the accounting principles used and significant estimates made by management, and evaluating the overall financial statement presentation. We believe that our audits, which included confirmation of securities at October 31, 2005 by correspondence with the custodian and brokers, provide a reasonable basis for our opinion.
/s/ PricewaterhouseCoopers LLP
PricewaterhouseCoopers LLP
Boston, Massachusetts
December 19, 2005
|
Trustees and Officers
The Trustees, Members of the Advisory Board, and executive officers of the trust and fund, as applicable, are listed below. The Board of Trustees governs the fund and is responsible for protecting the interests of shareholders. The Trustees are experienced executives who meet periodically throughout the year to oversee the fund’s activities, review contractual arrangements with companies that provide services to the fund, and review the fund’s performance. Except for William O. McCoy, Stephen P. Jonas, and Kenneth L. Wolfe, each of the Trustees oversees 322 funds advised by FMR or an affiliate. Mr. McCoy oversees 324 funds advised by FMR or an affiliate. Mr. Jonas and Mr. Wolfe oversee 319 funds advised by FMR or an affiliate.
The Trustees hold office without limit in time except that (a) any Trustee may resign; (b) any Trustee may be removed by written instrument, signed by at least two-thirds of the number of Trustees prior to such removal; (c) any Trustee who requests to be retired or who has become incapacitated by illness or injury may be retired by written instrument signed by a majority of the other Trustees; and (d) any Trustee may be removed at any special meeting of shareholders by a two-thirds vote of the outstanding voting securities of the trust. Each Trustee who is not an interested person (as defined in the 1940 Act) (Independent Trustee), shall retire not later than the last day of the calendar year in which his or her 72nd birthday occurs. The Independent Trustees may waive this mandatory retirement age policy with respect to individual Trustees. The executive officers and Advisory Board Members hold office without limit in time, except that any officer and Advisory Board Member may resign or may be removed by a vote of a majority of the Trustees at any regular meeting or any special meeting of the Trustees. Except as indicated, each individual has held the office shown or other offices in the same company for the past five years.
The fund’s Statement of Additional Information (SAI) includes more information about the Trustees. To request a free copy, call Fidelity at 1-877-208-0098.
Interested Trustees*:
Correspondence intended for each Trustee who is an interested person may be sent to Fidelity Investments, 82 Devonshire Street, Boston, Massachusetts 02109.
| Name, Age; Principal Occupation |
| |
| Edward C. Johnson 3d (75)** |
| |
| Year of Election or Appointment: 1983 |
| Mr. Johnson is Chairman of the Board of Trustees. Mr. Johnson serves as |
| Chief Executive Officer, Chairman, and a Director of FMR Corp.; a Di- |
| rector and Chairman of the Board and of the Executive Committee of |
| FMR; Chairman and a Director of Fidelity Management & Research (Far |
| East) Inc.; Chairman and a Director of Fidelity Investments Money Man- |
| agement, Inc.; and Chairman (2001-present) and a Director |
| (2000-present) of FMR Co., Inc. |
37 Annual Report
Trustees and Officers - continued
| Name, Age; Principal Occupation |
| |
| Abigail P. Johnson (43)** |
| |
| Year of Election or Appointment: 2001 |
| Ms. Johnson serves as President of Fidelity Employer Services Company |
| (FESCO) (2005-present). She is President and a Director of Fidelity In- |
| vestments Money Management, Inc. (2001-present), FMR Co., Inc. |
| (2001-present), and a Director of FMR Corp. Previously, Ms. Johnson |
| served as President and a Director of FMR (2001-2005), Senior Vice |
| President of the Fidelity funds (2001-2005), and managed a number of |
| Fidelity funds. |
| |
| Stephen P. Jonas (52) |
| |
| Year of Election or Appointment: 2005 |
| Mr. Jonas is Senior Vice President of Advisor Japan. He also serves as |
| Senior Vice President of other Fidelity funds (2005-present). Mr. Jonas is |
| Executive Director of FMR (2005-present). Previously, Mr. Jonas served |
| as President of Fidelity Enterprise Operations and Risk Services |
| (2004-2005), Chief Administrative Officer (2002-2004), and Chief |
| Financial Officer of FMR Co. (1998-2000). Mr. Jonas has been with |
| Fidelity Investments since 1987 and has held various financial and man- |
| agement positions including Chief Financial Officer of FMR. In addition, |
| he serves on the Boards of Boston Ballet (2003-present) and Simmons |
| College (2003-present). |
| |
| Robert L. Reynolds (53) |
| |
| Year of Election or Appointment: 2003 |
| Mr. Reynolds is a Director (2003-present) and Chief Operating Officer |
| (2002-present) of FMR Corp. He also serves on the Board at Fidelity |
| Investments Canada, Ltd. (2000-present). Previously, Mr. Reynolds |
| served as President of Fidelity Investments Institutional Retirement Group |
| (1996-2000). |
* Trustees have been determined to be “Interested Trustees” by virtue of, among other things, their affiliation with the trust or various entities under common control with FMR.
** Edward C. Johnson 3d, Trustee, is Abigail P. Johnson’s father.
Annual Report 38
Independent Trustees:
Correspondence intended for each Independent Trustee (that is, the Trustees other than the Interested Trustees) may be sent to Fidelity Investments, P.O. Box 55235, Boston, Massachusetts 02205-5235.
| Name, Age; Principal Occupation |
| |
| Dennis J. Dirks (57) |
| |
| Year of Election or Appointment: 2005 |
| Prior to his retirement in May 2003, Mr. Dirks was Chief Operating |
| Officer and a member of the Board of The Depository Trust & Clearing |
| Corporation (DTCC) (1999-2003). He also served as President, Chief |
| Operating Officer, and Board member of The Depository Trust |
| Company (DTC) (1999-2003) and President and Board member of the |
| National Securities Clearing Corporation (NSCC) (1999-2003). In addi- |
| tion, Mr. Dirks served as Chief Executive Officer and Board member of |
| the Government Securities Clearing Corporation (2001-2003) and Chief |
| Executive Officer and Board member of the Mortgage-Backed Securities |
| Clearing Corporation (2001-2003). Mr. Dirks also serves as a Trustee of |
| Manhattan College (2005-present). |
| |
| Robert M. Gates (62) |
| |
| Year of Election or Appointment: 1997 |
| Dr. Gates is Vice Chairman of the Independent Trustees (2005-present). |
| Dr. Gates is President of Texas A&M University (2002-present). He was |
| Director of the Central Intelligence Agency (CIA) from 1991 to 1993. |
| From 1989 to 1991, Dr. Gates served as Assistant to the President of |
| the United States and Deputy National Security Advisor. Dr. Gates is a |
| Director of NACCO Industries, Inc. (mining and manufacturing), Parker |
| Drilling Co., Inc. (drilling and rental tools for the energy industry, |
| 2001-present), and Brinker International (restaurant management, |
| 2003-present). Previously, Dr. Gates served as a Director of LucasVarity |
| PLC (automotive components and diesel engines), a Director of TRW Inc. |
| (automotive, space, defense, and information technology), and Dean of |
| the George Bush School of Government and Public Service at Texas |
| A&M University (1999-2001). Dr. Gates also is a Trustee of the Forum |
| for International Policy. |
39 Annual Report
Trustees and Officers - continued
| Name, Age; Principal Occupation |
| |
| George H. Heilmeier (69) |
| |
| Year of Election or Appointment: 2004 |
| Dr. Heilmeier is Chairman Emeritus of Telcordia Technologies (commu- |
| nication software and systems), where prior to his retirement, he served |
| as company Chairman and Chief Executive Officer. He currently serves |
| on the Boards of Directors of The Mitre Corporation (systems engineer- |
| ing and information technology support for the government), and HRL |
| Laboratories (private research and development, 2004-present). He is |
| Chairman of the General Motors Science & Technology Advisory Board |
| and a Life Fellow of the Institute of Electrical and Electronics Engineers |
| (IEEE) (2000-present). Dr. Heilmeier is a member of the Defense Science |
| Board and the National Security Agency Advisory Board. He is also a |
| member of the National Academy of Engineering, the American |
| Academy of Arts and Sciences, and the Board of Overseers of the |
| School of Engineering and Applied Science of the University of Pennsyl- |
| vania. Previously, Dr. Heilmeier served as a Director of TRW Inc. (auto- |
| motive, space, defense, and information technology, 1992-2002), |
| Compaq (1994-2002), Automatic Data Processing, Inc. (ADP) |
| (technology-based business outsourcing, 1995-2002), INET Technolo- |
| gies Inc. (telecommunications network surveillance, 2001-2004), and |
| Teletech Holdings (customer management services). He is the recipient of |
| the 2005 Kyoto Prize in Advanced Technology for his invention of the |
| liquid display. |
| |
| Marie L. Knowles (59) |
| |
| Year of Election or Appointment: 2001 |
| Prior to Ms. Knowles’ retirement in June 2000, she served as Executive |
| Vice President and Chief Financial Officer of Atlantic Richfield Company |
| (ARCO) (diversified energy, 1996-2000). From 1993 to 1996, she was |
| a Senior Vice President of ARCO and President of ARCO Transportation |
| Company. She served as a Director of ARCO from 1996 to 1998. She |
| currently serves as a Director of Phelps Dodge Corporation (copper |
| mining and manufacturing) and McKesson Corporation (healthcare ser- |
| vice, 2002-present). Ms. Knowles is a Trustee of the Brookings Institution |
| and the Catalina Island Conservancy and also serves as a member of |
| the Advisory Board for the School of Engineering of the University of |
| Southern California. |
Annual Report 40
| Name, Age; Principal Occupation |
| |
| Ned C. Lautenbach (61) |
| |
| Year of Election or Appointment: 2000 |
| Mr. Lautenbach has been a partner of Clayton, Dubilier & Rice, Inc. |
| (private equity investment firm) since September 1998. Previously, Mr. |
| Lautenbach was with the International Business Machines Corporation |
| (IBM) from 1968 until his retirement in 1998. Mr. Lautenbach serves as |
| a Director of Italtel Holding S.p.A. (telecommunications (Milan, Italy), |
| 2004-present) and Eaton Corporation (diversified industrial) as well as |
| the Philharmonic Center for the Arts in Naples, Florida. He also is a |
| member of the Board of Trustees of Fairfield University (2005-present), |
| as well as a member of the Council on Foreign Relations. |
| |
| Marvin L. Mann (72) |
| |
| Year of Election or Appointment: 1993 |
| Mr. Mann is Chairman of the Independent Trustees (2001-present). He is |
| Chairman Emeritus of Lexmark International, Inc. (computer |
| peripherals), where he served as CEO until April 1998, retired as |
| Chairman May 1999, and remains a member of the Board. Prior to |
| 1991, he held the positions of Vice President of International Business |
| Machines Corporation (IBM) and President and General Manager of |
| various IBM divisions and subsidiaries. He is a member of the Executive |
| Committee of the Independent Director’s Council of the Investment Com- |
| pany Institute. In addition, Mr. Mann is a member of the President’s |
| Cabinet at the University of Alabama and the Board of Visitors of the |
| Culverhouse College of Commerce and Business Administration at the |
| University of Alabama. |
| |
| William O. McCoy (72) |
| |
| Year of Election or Appointment: 1997 |
| Prior to his retirement in December 1994, Mr. McCoy was Vice Chair- |
| man of the Board of BellSouth Corporation (telecommunications) and |
| President of BellSouth Enterprises. He is currently a Director of Liberty |
| Corporation (holding company), Duke Realty Corporation (real estate), |
| and Progress Energy, Inc. (electric utility). He is also a partner of Frank- |
| lin Street Partners (private investment management firm) and a member |
| of the Research Triangle Foundation Board. In addition, Mr. McCoy |
| served as the Interim Chancellor (1999-2000) and a member of the |
| Board of Visitors for the University of North Carolina at Chapel Hill and |
| currently serves on the Board of Directors of the University of North |
| Carolina Health Care System and the Board of Visitors of the Kenan- |
| Flagler Business School (University of North Carolina at Chapel Hill). He |
| also served as Vice President of Finance for the University of North Car- |
| olina (16-school system). |
41 Annual Report
Trustees and Officers - continued
| Name, Age; Principal Occupation |
| |
| Cornelia M. Small (61) |
| |
| Year of Election or Appointment: 2005 |
| Ms. Small is a member (2000-present) and Chairperson (2002-present) |
| of the Investment Committee, and a member (2002-present) of the |
| Board of Trustees of Smith College. Previously, she served as Chief In- |
| vestment Officer (1999-2000), Director of Global Equity Investments |
| (1996-1999), and a member of the Board of Directors of Scudder, |
| Stevens & Clark (1990-1997) and Scudder Kemper Investments |
| (1997-1998). In addition, Ms. Small served as Co-Chair (2000-2003) |
| of the Annual Fund for the Fletcher School of Law and Diplomacy. |
| |
| William S. Stavropoulos (66) |
| |
| Year of Election or Appointment: 2001 |
| Mr. Stavropoulos is Chairman of the Board (2000-present) and a Mem- |
| ber of the Board of Directors of The Dow Chemical Company. Since |
| joining The Dow Chemical Company in 1967, Mr. Stavropoulos served |
| in numerous senior management positions, including President |
| (1993-2000; 2002-2003), CEO (1995-2000; 2002-2004), and Chair- |
| man of the Executive Committee (2000-2004). Currently, he is a Direc- |
| tor of NCR Corporation (data warehousing and technology solutions), |
| BellSouth Corporation (telecommunications), Chemical Financial Corpo- |
| ration, Maersk Inc. (industrial conglomerate, 2002-present), and Metal- |
| mark Capital (private equity investment firm, 2005-present). He also |
| serves as a member of the Board of Trustees of the American Enterprise |
| Institute for Public Policy Research. In addition, Mr. Stavropoulos is a |
| member of The Business Council, J.P. Morgan International Council and |
| the University of Notre Dame Advisory Council for the College of |
| Science. |
| |
| Kenneth L. Wolfe (66) |
| |
| Year of Election or Appointment: 2005 |
| Mr. Wolfe also serves as a Trustee (2005-present) or Member of the |
| Advisory Board (2004-present) of other investment companies advised |
| by FMR. Prior to his retirement in 2001, Mr. Wolfe was Chairman and |
| Chief Executive Officer of Hershey Foods Corporation (1993-2001). He |
| currently serves as a member of the boards of Adelphia Communica- |
| tions Corporation (2003-present), Bausch & Lomb, Inc., and Revlon Inc. |
| (2004-present).�� |
Annual Report 42
Advisory Board Members and Executive Officers:
Correspondence intended for Mr. Gamper may be sent to Fidelity Investments, P.O. Box 55235, Boston, Massachusetts 02205-5235. Correspondence intended for each executive officer and Mr. Lynch may be sent to Fidelity Investments, 82 Devonshire Street, Boston, Massachusetts 02109.
| Name, Age; Principal Occupation |
| |
| Albert R. Gamper, Jr. (63) |
| |
| Year of Election or Appointment: 2005 |
| Member of the Advisory Board of Fidelity Advisor Series VIII. Prior to his |
| retirement in December 2004, Mr. Gamper served as Chairman of the |
| Board of CIT Group Inc. (commercial finance). During his tenure with |
| CIT Group Inc. Mr. Gamper served in numerous senior management |
| positions, including Chairman (1987-1989; 1999-2001; 2002-2004), |
| Chief Executive Officer (1987-2004), and President (1989-2002). He |
| currently serves as a member of the Board of Directors of Public Service |
| Enterprise Group (utilities, 2001-present), Chairman of the Board of |
| Governors, Rutgers University (2004-present), and Chairman of the |
| Board of Saint Barnabas Health Care System. |
| |
| Peter S. Lynch (61) |
| |
| Year of Election or Appointment: 2003 |
| Member of the Advisory Board of Fidelity Advisor Series VIII. Vice |
| Chairman and a Director of FMR, and Vice Chairman (2001-present) |
| and a Director (2000-present) of FMR Co., Inc. Previously, Mr. Lynch |
| served as a Trustee of the Fidelity funds (1990-2003). In addition, he |
| serves as a Trustee of Boston College, Massachusetts Eye & Ear |
| Infirmary, Historic Deerfield, John F. Kennedy Library, and the Museum |
| of Fine Arts of Boston. |
| |
| Dwight D. Churchill (51) |
| |
| Year of Election or Appointment: 2005 |
| Vice President of Advisor Japan. Mr. Churchill also serves as Vice Presi- |
| dent of certain Equity Funds (2005-present) and certain High Income |
| Funds (2005-present). Previously, he served as Head of Fidelity’s Fixed- |
| Income Division (2000-2005), Vice President of Fidelity’s Money Market |
| Funds (2000-2005), Vice President of Fidelity’s Bond Funds, and Senior |
| Vice President of FIMM (2000) and FMR. Mr. Churchill joined Fidelity in |
| 1993 as Vice President and Group Leader of Taxable Fixed-Income |
| Investments. |
43 Annual Report
Trustees and Officers - continued
| Name, Age; Principal Occupation |
| |
| Eric D. Roiter (56) |
| |
| Year of Election or Appointment: 1998 |
| Secretary of Advisor Japan. He also serves as Secretary of other Fidelity |
| funds; Vice President, General Counsel, and Secretary of FMR Co., Inc. |
| (2001-present) and FMR; Assistant Secretary of Fidelity Management & |
| Research (U.K.) Inc. (2001-present), Fidelity Management & Research |
| (Far East) Inc. (2001-present), and Fidelity Investments Money Manage- |
| ment, Inc. (2001-present). Mr. Roiter is an Adjunct Member, Faculty of |
| Law, at Boston College Law School (2003-present). Previously, Mr. Roiter |
| served as Vice President and Secretary of Fidelity Distributors Corpora- |
| tion (FDC) (1998-2005). |
| |
| Stuart Fross (46) |
| |
| Year of Election or Appointment: 2003 |
| Assistant Secretary of Advisor Japan. Mr. Fross also serves as Assistant |
| Secretary of other Fidelity funds (2003-present), Vice President and Sec- |
| retary of FDC (2005-present), and is an employee of FMR. |
| |
| Christine Reynolds (47) |
| |
| Year of Election or Appointment: 2004 |
| President, Treasurer, and Anti-Money Laundering (AML) officer of Advi- |
| sor Japan. Ms. Reynolds also serves as President, Treasurer, and AML |
| officer of other Fidelity funds (2004) and is a Vice President (2003) and |
| an employee (2002) of FMR. Before joining Fidelity Investments, Ms. |
| Reynolds worked at PricewaterhouseCoopers LLP (PwC) (1980-2002), |
| where she was most recently an audit partner with PwC’s investment |
| management practice. |
| |
| Paul M. Murphy (58) |
| |
| Year of Election or Appointment: 2005 |
| Chief Financial Officer of Advisor Japan. Mr. Murphy also serves as |
| Chief Financial Officer of other Fidelity funds (2005-present). He also |
| served as Senior Vice President of Fidelity Pricing and Cash Manage- |
| ment Services Group (FPCMS). |
| |
| Kenneth A. Rathgeber (58) |
| |
| Year of Election or Appointment: 2004 |
| Chief Compliance Officer of Advisor Japan. Mr. Rathgeber also serves |
| as Chief Compliance Officer of other Fidelity funds (2004) and Execu- |
| tive Vice President of Risk Oversight for Fidelity Investments (2002). Pre- |
| viously, he served as Executive Vice President and Chief Operating |
| Officer for Fidelity Investments Institutional Services Company, Inc. |
| (1998-2002). |
Annual Report 44
| Name, Age; Principal Occupation |
| |
| John R. Hebble (47) |
| |
| Year of Election or Appointment: 2003 |
| Deputy Treasurer of Advisor Japan. Mr. Hebble also serves as Deputy |
| Treasurer of other Fidelity funds (2003), and is an employee of FMR. |
| Before joining Fidelity Investments, Mr. Hebble worked at Deutsche Asset |
| Management where he served as Director of Fund Accounting |
| (2002-2003) and Assistant Treasurer of the Scudder Funds |
| (1998-2003). |
| |
| Bryan A. Mehrmann (44) |
| |
| Year of Election or Appointment: 2005 |
| Deputy Treasurer of Advisor Japan. Mr. Mehrmann also serves as |
| Deputy Treasurer of other Fidelity funds (2005-present) and is an em- |
| ployee of FMR. Previously, Mr. Mehrmann served as Vice President of |
| Fidelity Investments Institutional Services Group (FIIS)/Fidelity Investments |
| Institutional Operations Corporation, Inc. (FIIOC) Client Services |
| (1998-2004). |
| |
| Kimberley H. Monasterio (41) |
| |
| Year of Election or Appointment: 2004 |
| Deputy Treasurer of Advisor Japan. Ms. Monasterio also serves as Dep- |
| uty Treasurer of other Fidelity funds (2004) and is an employee of FMR |
| (2004). Before joining Fidelity Investments, Ms. Monasterio served as |
| Treasurer (2000-2004) and Chief Financial Officer (2002-2004) of the |
| Franklin Templeton Funds and Senior Vice President of Franklin Temple- |
| ton Services, LLC (2000-2004). |
| |
| Kenneth B. Robins (36) |
| |
| Year of Election or Appointment: 2005 |
| Deputy Treasurer of Advisor Japan. Mr. Robins also serves as Deputy |
| Treasurer of other Fidelity funds (2005-present) and is an employee of |
| FMR (2004-present). Before joining Fidelity Investments, Mr. Robins |
| worked at KPMG LLP, where he was a partner in KPMG’s department of |
| professional practice (2002-2004) and a Senior Manager |
| (1999-2000). In addition, Mr. Robins served as Assistant Chief Accoun- |
| tant, United States Securities and Exchange Commission (2000-2002). |
| |
| Robert G. Byrnes (38) |
| |
| Year of Election or Appointment: 2005 |
| Assistant Treasurer of Advisor Japan. Mr. Byrnes also serves as Assistant |
| Treasurer of other Fidelity funds (2005-present) and is an employee of |
| FMR (2005-present). Previously, Mr. Byrnes served as Vice President of |
| FPCMS (2003-2005). Before joining Fidelity Investments, Mr. Byrnes |
| worked at Deutsche Asset Management where he served as Vice Presi- |
| dent of the Investment Operations Group (2000-2003). |
45 Annual Report
Trustees and Officers - continued
| Name, Age; Principal Occupation |
| |
| John H. Costello (59) |
| |
| Year of Election or Appointment: 1998 |
| Assistant Treasurer of Advisor Japan. Mr. Costello also serves as Assis- |
| tant Treasurer of other Fidelity funds and is an employee of FMR. |
| |
| Peter L. Lydecker (51) |
| |
| Year of Election or Appointment: 2004 |
| Assistant Treasurer of Advisor Japan. Mr. Lydecker also serves as Assis- |
| tant Treasurer of other Fidelity funds (2004) and is an employee of FMR. |
| |
| Mark Osterheld (50) |
| |
| Year of Election or Appointment: 2002 |
| Assistant Treasurer of Advisor Japan. Mr. Osterheld also serves as Assis- |
| tant Treasurer of other Fidelity funds (2002) and is an employee of FMR. |
| |
| Gary W. Ryan (47) |
| |
| Year of Election or Appointment: 2005 |
| Assistant Treasurer of Advisor Japan. Mr. Ryan also serves as Assistant |
| Treasurer of other Fidelity funds (2005-present) and is an employee of |
| FMR (2005-present). Previously, Mr. Ryan served as Vice President of |
| Fund Reporting in FPCMS (1999-2005). |
| |
| Salvatore Schiavone (39) |
| |
| Year of Election or Appointment: 2005 |
| Assistant Treasurer of Advisor Japan. Mr. Schiavone also serves as |
| Assistant Treasurer of other Fidelity funds (2005-present) and is an em- |
| ployee of FMR (2005-present). Before joining Fidelity Investments, Mr. |
| Schiavone worked at Deutsche Asset Management, where he most re- |
| cently served as Assistant Treasurer (2003-2005) of the Scudder Funds |
| and Vice President and Head of Fund Reporting (1996-2003). |
Annual Report 46
Board Approval of Investment Advisory Contracts and Management Fees
Advisor Japan Fund
Each year, typically in July, the Board of Trustees, including the independent Trustees (together, the Board), votes on the renewal of the management contract and sub-advisory agreements (together, the Advisory Contracts) for the fund. The Board, assisted by the advice of fund counsel and independent Trustees’ counsel, requests and considers a broad range of information throughout the year.
The Board meets regularly each month except August and takes into account throughout the year matters bearing on Advisory Contracts. The Board, acting directly and through its separate committees, considers at each of its meetings factors that are relevant to the annual renewal of the fund’s Advisory Contracts, including the services and support provided to the fund and its shareholders by Fidelity. At the time of the renewal, the Board had 11 standing committees, each composed of independent Trustees with varying backgrounds, to which the Board has assigned specific subject matter responsibilities in order to enhance effective decision-making by the Board. Each committee has adopted a written charter outlining the structure and purposes of the committee. One such committee, the Equity Contract Committee, meets periodically during the first six months of each year and as necessary to consider matters specifically related to the annual renewal of Advisory Contracts. The committee requests and receives information on, and makes recommendations to the independent Trustees concerning, the approval and annual review of the Advisory Contracts.
At its July 2005 meeting, the Board of Trustees, including the independent Trustees, unanimously determined to renew the Advisory Contracts for the fund. In reaching its determination, the Board considered all factors it believed relevant, including (1) the nature, extent, and quality of the services to be provided to the fund and its shareholders by Fidelity (including the investment performance of the fund); (2) the competitiveness of the management fee and total expenses of the fund; (3) the total costs of the services to be provided by and the profits to be realized by the investment adviser and its affiliates from the relationship with the fund; (4) the extent to which economies of scale would be realized as the fund grows; and (5) whether fee levels reflect these economies of scale, if any, for the benefit of fund shareholders.
In determining whether to renew the Advisory Contracts for the fund, the Board ultimately reached a determination, with the assistance of fund counsel and independent Trustees’ counsel, that the renewal of the Advisory Contracts and the compensation to be received by Fidelity under the management contract is consistent with Fidelity’s fiduciary duty under applicable law. In addition to evaluating the specific factors noted above, the Board, in reaching its determination, is aware that shareholders in the fund have a broad range of investment choices available to them, including a wide choice among mutual funds offered by competitors to Fidelity, and that the fund’s shareholders, with the opportunity to review and weigh the disclosure provided by the fund in its
47 Annual Report
Board Approval of Investment Advisory Contracts and Management Fees - continued
prospectus and other public disclosures, have chosen to invest in this fund, managed by Fidelity.
Nature, Extent, and Quality of Services Provided by Fidelity. The Board considered staffing within the investment adviser, FMR, and the sub-advisers (together, the Investment Advisers), including the background of the fund’s portfolio manager and the fund’s investment objective and discipline. The independent Trustees also had discussions with senior management of Fidelity’s investment operations and investment groups. The Board considered the structure of the portfolio manager compensation program and whether this structure provides appropriate incentives.
Fidelity Resources Dedicated to Investment Management and Support Services. The Board reviewed the size, education, and experience of the Investment Advisers’ investment staff, their use of technology, and the Investment Advisers’ approach to recruiting, training, and retaining portfolio managers and other research, advisory, and management personnel. The Board considered Fidelity’s extensive global research capabilities that enable the Investment Advisers to aggregate data from various sources in an effort to produce positive investment results. The Board noted that Fidelity’s analysts have access to a variety of technological tools that enable them to perform both fundamental and quantitative analysis and to specialize in various disciplines. The Board also considered that Fidelity’s portfolio managers and analysts have access to daily portfolio attribution that allows for monitoring of a fund’s portfolio, as well as an electronic communication system that provides immediate real-time access to research concerning issuers and credit enhancers.
Shareholder and Administrative Services. The Board considered the nature, extent, quality, and cost of administrative, distribution, and shareholder services performed by the Investment Advisers and their affiliates under the Advisory Contracts and under separate agreements covering transfer agency, pricing and bookkeeping, and securities lending services for the fund. The Board also considered the nature and extent of the Investment Advisers’ supervision of third party service providers, principally custodians and subcustodians. The Board reviewed the allocation of fund brokerage, including allocations to brokers affiliated with the Investment Advisers, the use of brokerage commissions to pay fund expenses, and the use of “soft” commission dollars to pay for research services. The Board also considered that Fidelity voluntarily decided in 2004 to stop using “soft” commission dollars to pay for market data and, instead, to pay for that data out of its own resources. The Board also considered the resources devoted to, and the record of compliance with, the fund’s compliance policies and procedures.
The Board noted that the growth of fund assets across the complex allows Fidelity to reinvest in the development of services designed to enhance the value or convenience of the Fidelity funds as investment vehicles. These services include 24-hour access to
account information and market information through phone representatives and over the Internet, and investor education materials and asset allocation tools.
Investment in a Large Fund Family. The Board considered the benefits to shareholders of investing in a Fidelity fund, including the benefits of investing in a fund that is part of a large family of funds offering a variety of investment disciplines and providing for a large variety of mutual fund investor services. For example, fund shareholders are offered the privilege of exchanging shares of the fund for shares of other Fidelity funds, as set forth in the fund’s prospectus, without paying an additional sales charge. The Board noted that, since the last Advisory Contract renewals in July 2004, Fidelity has taken a number of actions that benefited particular funds, including (i) voluntarily deciding in 2004 to stop using “soft” commission dollars to pay for market data and, instead, to pay for that data out of its own resources, (ii) contractually agreeing to impose management fee reductions and expense limitations on its five Spartan stock index funds and its stock index fund available through variable insurance products, (iii) contractually agreeing to eliminate the management fees on the Fidelity Freedom Funds and the Fidelity Advisor Freedom Funds, (iv) contractually agreeing to reduce the management fees on most of its investment-grade taxable bond funds, and (v) contractually agreeing to impose expense limitations on its retail and Spartan investment-grade taxable bond funds.
Investment Performance and Compliance. The Board considered whether the fund has operated within its investment objective, as well as its record of compliance with its investment restrictions. It also reviewed the fund’s absolute investment performance for each class, as well as the fund’s relative investment performance for each class measured against (i) a broad-based securities market index, and (ii) a peer group of mutual funds deemed appropriate by the Board over multiple periods. The following charts considered by the Board show, over the one-, three-, and five-year periods ended December 31, 2004, the returns of Class C and Institutional Class of the fund, the returns of a broad-based securities market index (“benchmark”), and a range of returns of a peer group of mutual funds identified by Lipper Inc. as having an investment objective similar to that of the fund. The returns of Class C and Institutional Class represent the performance of classes with the highest and lowest 12b-1 fees, respectively (not necessarily with the highest and lowest total expenses). The box within each chart shows the 25th percentile return (bottom of box) and the 75th percentile return (top of box) of the Lipper peer group. Returns shown above the box are in the first quartile and returns shown below the box are in the fourth quartile. The percentage beaten numbers noted below each chart correspond to the percentile box and represent the percentage of funds in the Lipper peer group whose performance was equal to or lower than that of the class indicated.
49 Annual Report
Board Approval of Investment Advisory Contracts and Management Fees - continued

The Board reviewed the fund’s relative investment performance against its Lipper peer group and stated that the performance of Institutional Class of the fund was in the second quartile for the one- and five-year periods and the first quartile for the three-year period. The Board also stated that the relative investment performance of the fund was lower than its benchmark over time. The Board considered that the variations in performance among the fund’s classes reflect the variations in class expenses, which result in lower performance for higher expense classes.
The Board has had thorough discussions with FMR throughout the year about the Board’s and FMR’s concerns about equity research, equity fund performance, and compliance with internal policies governing gifts and entertainment. FMR has taken steps that it believes will refocus and strengthen equity research and equity portfolio management and compliance. The Board noted with favor FMR’s recent reorganization of its senior management team and FMR’s plans to dedicate additional resources to investment research, and participated in the process that led to those changes.
Based on its review, and giving particular weight to the nature and quality of the resources dedicated by the Investment Advisers to maintain and improve relative performance, the Board concluded that the nature, extent, and quality of the services provided by Fidelity will benefit the fund’s shareholders, particularly in light of the Board’s view that the fund’s shareholders benefit from investing in a fund that is part of a large family of funds offering a variety of investment disciplines and services.
Competitiveness of Management Fee and Total Fund Expenses. The Board considered the fund’s management fee and total expenses compared to “mapped groups” of competitive funds and classes. Fidelity creates “mapped groups” by combining similar
Lipper investment objective categories that have comparable management fee characteristics. Combining Lipper investment objective categories aids the Board’s management fee and total expense comparisons by broadening the competitive group used for comparison and by reducing the number of universes to which various Fidelity funds are compared.
The Board considered two proprietary management fee comparisons for the 12-month periods shown in the chart below. The group of Lipper funds used by the Board for management fee comparisons is referred to below as the “Total Mapped Group” and, for the reasons explained above, is broader than the Lipper peer group used by the Board for performance comparisons. The Total Mapped Group comparison focuses on a fund’s standing relative to the total universe of comparable funds available to investors, in terms of gross management fees before expense reimbursements or caps. “TMG %” represents the percentage of funds in the Total Mapped Group that had management fees that were lower than the fund’s. For example, a TMG % of 21% means that 79% of the funds in the Total Mapped Group had higher management fees than the fund. The “Asset-Size Peer Group” (ASPG) comparison focuses on a fund’s standing relative to non-Fidelity funds similar in size to the fund within the Total Mapped Group. The ASPG represents at least 15% of the funds in the Total Mapped Group with comparable asset size and management fee characteristics, subject to a minimum of 50 funds (or all funds in the Total Mapped Group if fewer than 50). Additional information, such as the ASPG quartile (“quadrant”) in which the fund’s management fee ranked, is also included in the chart and considered by the Board.

The Board noted that the fund’s management fee ranked below the median of its Total Mapped Group and below the median of its ASPG for 2004.
51 Annual Report
Board Approval of Investment Advisory Contracts and Management Fees - continued
Based on its review, the Board concluded that the fund’s management fee was fair and reasonable in light of the services that the fund receives and the other factors considered.
In its review of each class’s total expenses, the Board considered the fund’s management fee as well as other fund or class expenses, as applicable, such as transfer agent fees, pricing and bookkeeping fees, fund-paid 12b-1 fees, and custodial, legal, and audit fees. The Board also noted the effects of any waivers and reimbursements on fees and expenses. As part of its review, the Board also considered current and historical total expenses of each class of the fund compared to competitive fund median expenses. Each class of the fund is compared to those funds and classes in the Total Mapped Group (used by the Board for management fee comparisons) that have a similar sales load structure.
The Board noted that the total expenses of each class ranked above its competitive median for 2004. The Board noted that the fund offers multiple classes, each of which has a different sales load and 12b-1 fee structure, and that the multiple structures are intended to offer a range of pricing options for the intermediary market. The Board also noted that the total expenses of the classes vary primarily by the level of their 12b-1 fees, although differences in transfer agent fees may also cause expenses to vary from class to class.
Furthermore, the Board considered that on December 16, 2004, it had approved changes (effective January 1, 2005) in the transfer agent and service agreements for the fund that established maximum transfer agent fees and eliminated the minimum pricing and bookkeeping fee to prevent small funds or funds with small average account sizes from having relatively high fees in basis points (the “small-fund fee reductions”). The Board considered that, if the small-fund fee reductions had been in effect in 2004, the total expenses of each of Class A, Class B, Class C and Institutional Class would have ranked below the median.
In its review of total expenses, the Board also considered Fidelity fee structures and other information on clients that FMR and its affiliates service in other competitive markets, such as other mutual funds advised or subadvised by FMR or its affiliates, pension plan clients, and other institutional clients.
Based on its review, the Board concluded that the total expenses for each class of the fund were reasonable, although in all cases above the median of the universe presented for comparison, in light of the services that the fund and its shareholders receive and the other factors considered.
Costs of the Services and Profitability. The Board considered the revenues earned and the expenses incurred by Fidelity in conducting the business of developing, marketing, distributing, managing, administering and servicing the fund and its shareholders.
The Board also considered the level of Fidelity’s profits in respect of all the Fidelity funds.
On an annual basis, FMR presents to the Board Fidelity’s profitability for the fund. Fidelity calculates the profitability for each fund, as well as aggregate profitability for groups of Fidelity funds and all Fidelity funds, using a series of detailed revenue and cost allocation methodologies which originate with the audited books and records of Fidelity. The Audit Committee of the Board reviews any significant changes from the prior year’s methodologies.
PricewaterhouseCoopers LLP (PwC), independent registered accounting firm and auditor to Fidelity and certain Fidelity funds, has been engaged annually by the Board as part of the Board’s assessment of the results of Fidelity’s profitability analysis. PwC’s engagement includes the review and assessment of Fidelity’s methodologies used in determining the revenues and expenses attributable to Fidelity’s mutual fund business, and completion of agreed-upon procedures surrounding the mathematical accuracy of fund profitability and its conformity to allocation methodologies. After considering PwC’s reports issued under the engagement and information provided by Fidelity, the Board believes that while other allocation methods may also be reasonable, Fidelity’s profitability methodologies are reasonable in all material respects.
The Board has also reviewed Fidelity’s non-fund businesses and any fall-out benefits related to the mutual fund business as well as cases where Fidelity’s affiliates may benefit from or be related to the fund’s business. In addition, a special committee of the Board reviewed services provided to Fidelity by its affiliates and determined that the fees that Fidelity paid for such services were reasonable.
The Board considered the costs of the services provided by and the profits realized by Fidelity in connection with the operation of the fund and determined that the amount of profit is a fair entrepreneurial profit for the management of the fund.
Economies of Scale. The Board considered whether there have been economies of scale in respect of the management of the Fidelity funds, whether the Fidelity funds (including the fund) have appropriately benefited from any such economies of scale, and whether there is potential for realization of any further economies of scale. The Board considered the extent to which the fund will benefit from economies of scale through increased services to the fund, through waivers or reimbursements, or through fee or expense reductions, including reductions that occur through operation of the transfer agent agreement. The transfer agent fee varies in part based on the number of accounts in the fund. If the number of accounts decreases or the average account size increases, the overall transfer agent fee rate decreases.
The Board recognized that the fund’s management contract incorporates a “group fee” structure, which provides for lower fee rates as total fund assets under FMR’s
53 Annual Report
Board Approval of Investment Advisory Contracts and Management Fees - continued
management increase, and for higher fee rates as total fund assets under FMR’s management decrease. The Board considered that the group fee is designed to deliver the benefits of economies of scale to fund shareholders when total fund assets increase, even if assets of any particular fund are unchanged or have declined, because some portion of Fidelity’s costs are attributable to services provided to all Fidelity funds, and all funds benefit if those costs can be allocated among more assets. The Board concluded that, given the group fee structure, fund shareholders will achieve a certain level of economies of scale as assets under FMR’s management increase at the fund complex level, regardless of whether Fidelity achieves any such economies of scale.
The Board further concluded that any potential economies of scale are being shared between fund shareholders and Fidelity in an appropriate manner.
Additional Information Requested by the Board. In order to develop fully the factual basis for consideration of the Advisory Contracts, the Board requested additional information regarding (i) equity fund transfer agency fees; (ii) Fidelity’s fund profitability methodology and the impact of various changes in the methodology over time; (iii) benefits to shareholders from economies of scale; (iv) composition and characteristics of various fund and industry data used in comparisons; and (v) compensation of portfolio managers and research analysts.
Based on its evaluation of all of the conclusions noted above, and after considering all material factors, the Board ultimately concluded that the existing advisory fee structures are fair and reasonable, and that the fund’s existing Advisory Contracts should be renewed.
55 Annual Report
Investment Adviser
Fidelity Management & Research Company
Boston, MA
Investment Sub-Advisers
FMR Co., Inc.
Fidelity Management & Research
(U.K.) Inc.
Fidelity Management & Research
(Far East) Inc.
Fidelity International
Investment Advisors
Fidelity Investments Japan Limited
Fidelity International Investment
Advisors (U.K.) Limited
General Distributor
Fidelity Distributors Corporation
Boston, MA
Transfer and Service Agents
Fidelity Investments Institutional
Operations Company, Inc.
Boston, MA
Fidelity Service Company, Inc.
Boston, MA
Custodian
State Street Bank and Trust Company
Quincy, MA
|


Fidelity® Advisor
Korea
Fund - Class A, Class T, Class B and Class C
Annual Report October 31, 2005

| Contents | | | | |
| |
| Chairman’s Message | | 4 | | Ned Johnson’s message to shareholders. |
| Performance | | 6 | | How the fund has done over time. |
| Management’s Discussion | | 8 | | The manager’s review of fund |
| | | | | performance, strategy and outlook. |
| Shareholder Expense | | 9 | | An example of shareholder expenses. |
| Example | | | | |
| Investment Changes | | 11 | | A summary of major shifts in the fund’s |
| | | | | investments over the past six months. |
| Investments | | 12 | | A complete list of the fund’s investments |
| | | | | with their market values. |
| Financial Statements | | 17 | | Statements of assets and liabilities, |
| | | | | operations, and changes in net assets, |
| | | | | as well as financial highlights. |
| Notes | | 26 | | Notes to the financial statements. |
| Report of Independent | | 33 | | |
| Registered Public | | | | |
| Accounting Firm | | | | |
| Trustees and Officers | | 34 | | |
| Distributions | | 44 | | |
| Board Approval of | | 45 | | |
| Investment Advisory | | | | |
| Contracts and | | | | |
| Management Fees | | | | |
To view a fund’s proxy voting guidelines and proxy voting record for the 12-month period ended June 30, visit www.fidelity.com/proxyvotingresults or visit the Securities and Exchange Commission’s (SEC) web site at www.sec.gov. You may also call 1-877-208-0098 to request a free copy of the proxy voting guidelines.
Standard & Poor’s, S&P and S&P 500 are registered service marks of The McGraw-Hill Companies, Inc. and have been licensed for use by Fidelity Distributors Corporation.
Other third party marks appearing herein are the property of their respective owners.
All other marks appearing herein are registered or unregistered trademarks or service marks of FMR Corp. or an affiliated company.
This report and the financial statements contained herein are submitted for the general information of the shareholders of the fund. This report is not authorized for distribution to prospective investors in the fund unless preceded or accompanied by an effective prospectus.
A fund files its complete schedule of portfolio holdings with the SEC for the first and third quarters of each fiscal year on Form N-Q. Forms N-Q are available on the SEC’s web site at http://www.sec.gov. A fund’s Forms N-Q may be reviewed and copied at the SEC’s Public Reference Room in Washington, DC. Information regarding the operation of the SEC’s Public Reference Room may be obtained by calling 1-800-SEC-0330. For a complete list of a fund’s portfolio holdings, view the most recent quarterly holdings report, semiannual report, or annual report on Fidelity’s web site at http://www.advisor.fidelity.com.
NOT FDIC INSURED · MAY LOSE VALUE · NO BANK GUARANTEE
Neither the fund nor Fidelity Distributors Corporation is a bank.
3 Annual Report
Chairman’s Message
(Photograph of Edward C. Johnson 3d)
Dear Shareholder:
During the past year or so, much has been reported about the mutual fund industry, and much of it has been more critical than I believe is warranted. Allegations that some companies have been less than forthright with their shareholders have cast a shadow on the entire industry. I continue to find these reports disturbing, and assert that they do not create an accurate picture of the industry overall. Therefore, I would like to remind everyone where Fidelity stands on these issues. I will say two things specifically regarding allegations that some mutual fund companies were in violation of the Securities and Exchange Commission’s forward pricing rules or were involved in so-called “market timing” activities.
First, Fidelity has no agreements that permit customers who buy fund shares after 4 p.m. to obtain the 4 p.m. price. This is not a new policy. This is not to say that someone could not deceive the company through fraudulent acts. However, we are extremely diligent in preventing fraud from occurring in this manner — and in every other. But I underscore again that Fidelity has no so-called “agreements” that sanction illegal practices.
Second, Fidelity continues to stand on record, as we have for years, in opposition to predatory short-term trading that adversely affects shareholders in a mutual fund. Back in the 1980s, we initiated a fee — which is returned to the fund and, therefore, to investors — to discourage this activity. Further, we took the lead several years ago in developing a Fair Value Pricing Policy to prevent market timing on foreign securities in our funds. I am confident we will find other ways to make it more difficult for predatory traders to operate. However, this will only be achieved through close cooperation among regulators, legislators and the industry.
Yes, there have been unfortunate instances of unethical and illegal activity within the mutual fund industry from time to time. That is true of any industry. When this occurs, confessed or convicted offenders should be dealt with appropriately. But we are still concerned about the risk of over-regulation and the quick application of simplistic solutions to intricate problems. Every system can be improved, and we support and applaud well thought out improvements by regulators, legislators and industry representatives that achieve the common goal of building and protecting the value of investors’ holdings.
For nearly 60 years, Fidelity has worked very hard to improve its products and service to justify your trust. When our family founded this company in 1946, we had only a few hundred customers. Today, we serve more than 18 million customers including individual investors and participants in retirement plans across America.
Annual Report 4
Let me close by saying that we do not take your trust in us for granted, and we realize that we must always work to improve all aspects of our service to you. In turn, we urge you to continue your active participation with your financial matters, so that your interests can be well served.
Best regards,
/s/Edward C. Johnson 3d
5 Annual Report
Performance: The Bottom Line
Average annual total return reflects the change in the value of an investment, assuming reinvestment of the class’ dividend income and capital gains (the profits earned upon the sale of securities that have grown in value) and assuming a constant rate of performance each year. The $10,000 table and the fund’s returns do not reflect the deduction of taxes that a shareholder would pay on fund distributions or the redemption of fund shares. During periods of reimbursement by Fidelity, a fund’s total return will be greater than it would be had the reimbursement not occurred. How a fund did yesterday is no guarantee of how it will do tomorrow. Returns may reflect the conversion of Class B shares to Class A shares after a maximum of seven years.
| Average Annual Total Returns | | | | | | |
| Periods ended October 31, 2005 | | Past 1 | | Past 5 | | Past 10 |
| | | year | | years | | years |
| Class A (incl. 5.75% sales | | | | | | |
| charge)A | | 37.46% | | 17.32% | | 3.13% |
| Class T (incl. 3.50% sales | | | | | | |
| charge)B | | 40.49% | | 17.56% | | 3.22% |
| Class B (incl. contingent | | | | | | |
| deferred sales charge)C | | 39.75% | | 17.58% | | 3.31% |
| Class C (incl. contingent | | | | | | |
| deferred sales charge)D | | 43.93% | | 17.82% | | 3.32% |
A Class A’s 12b-1 fee may have ranged over time between 0.25% and 0.35%, as an equivalent amount of brokerage commissions of up to 0.10% of the class’s average net assets may have been used to promote the sale of class shares. This practice has been discontinued and no commissions incurred after June 30, 2003 have been used to pay distribution expenses. Class A’s 12b-1 plan currently authorizes a 0.25% 12b-1 fee. The initial offering of Class A shares took place on July 3, 2000. Returns between October 31, 1995 and June 30, 2000 are those of Fidelity Advisor Korea Fund, Inc., (the Closed-End Fund). At the close of business on June 30, 2000, the Closed-End Fund reorganized as an open-end fund through a transfer of all its assets and liabilities to Fidelity Advisor Korea Fund (the fund). Shareholders of the Closed-End Fund received Class A shares of the fund in exchange for their shares of the Closed-End Fund. If Class A shares’ total expenses had been reflected in the Closed-End Fund’s performance, Class A’s returns prior to July 3, 2000 may have been lower.
B Class T’s 12b-1 fee may have ranged over time between 0.50% and 0.60%, as an equivalent amount of brokerage commissions of up to 0.10% of the class’s average net assets may have been used to promote the sale of class shares. This practice has been discontinued and no commissions incurred after June 30, 2003 have been used to pay distribution expenses. Class T’s 12b-1 plan currently authorizes a 0.50% 12b-1 fee. The initial offering of Class T shares took place on July 3, 2000. Returns between October 31, 1995 and June 30, 2000 are those of Fidelity Advisor Korea Fund, Inc., (the Closed-End Fund). At the close of business on June 30, 2000, the Closed-End Fund reorganized as an open-end fund through a transfer of all of its assets and liabilities to the fund. Shareholders of the Closed-End Fund received Class A shares of the fund in exchange for their shares of the Closed-End Fund. If Class T shares’ total expenses had been reflected in the Closed-End Fund’s performance, Class T’s returns prior to July 3, 2000 may have been lower.
C Class B shares bear a 1.00% 12b-1 fee that is reflected in returns after June 30, 2000. The initial offering of Class B shares took place on July 3, 2000. Returns between October 31, 1995 and June 30, 2000 are those of Fidelity Advisor Korea Fund, Inc., (the Closed-End Fund). At the close of business on June 30, 2000, the Closed-End Fund reorganized as an open-end fund through a transfer of all of its assets and liabilities to the fund. Shareholders of the Closed-End Fund received Class A shares of the fund in exchange for their shares of the Closed-End Fund. If Class B shares’ total expenses, including its 1.00% 12b-1 fee, had been reflected in the Closed-End Fund’s performance, Class B’s returns, prior to July 3, 2000 may have been lower. Class B shares’ contingent deferred sales charges included in the past one year, past five year, and past ten year total return figures are 5%, 2%, and 0%, respectively.
D Class C shares bear a 1.00% 12b-1 fee that is reflected in returns after June 30, 2000. The initial offering of Class C shares took place on July 3, 2000. Returns between October 31, 1995 and June 30, 2000 are those of Fidelity Advisor Korea Fund, Inc., (the Closed-End Fund). At the close of business on June 30, 2000, the Closed-End Fund reorganized as an open-end fund through a transfer of all of its assets and liabilities to the fund. Shareholders of the Closed-End Fund received Class A shares of the fund in exchange for their shares of the Closed-End Fund. If Class C shares’ total expenses, including its 1.00% 12b-1 fee, had been reflected in the Closed-End Fund’s performance, Class C’s returns, prior to July 3, 2000 may have been lower. Class C shares’ contingent deferred sales charge included in the past one year, past five year, and past ten year total return figures are 1%, 0%, and 0%, respectively.
$10,000 Over 10 Years
Let’s say hypothetically that $10,000 was invested in Fidelity® Advisor Korea Fund —Class T on October 31, 1995, and the current 3.50% sales charge was paid. The chart shows how the value of your investment would have changed, and also shows how the Korea Composite Stock Price Index performed over the same period.
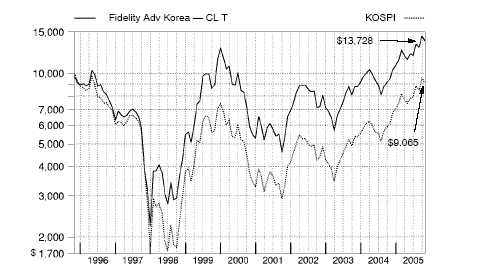
7 Annual Report
7
Management’s Discussion of Fund Performance
Comments from Wilson Wong, who became Portfolio Manager of Fidelity® Advisor Korea Fund on July 1, 2005
Against the backdrop of a firming South Korean economy, the Korean Composite Stock Price Index (KOSPI) finished the period with a gain of 49.33% . Of note during the year was the return of the domestic investor to the stock market through growth in the popularity of self-funded retirement and annuity plans. The Korean stock market also proved attractive because of low domestic interest rates, which resulted in acceptance of greater risk in search of higher returns. Meanwhile, structural and political risks were partially mitigated following Korea’s improved national credit rating and the progression of negotiations on North Korean nuclear issues. On the macroeconomic side, initial third-quarter gross domestic product (GDP) estimates announced by the Bank of Korea revealed the highest growth in four quarters. Returns for U.S. investors in this market were further enhanced by the appreciation of the won — Korea’s currency — versus the U.S. dollar.
During the past year, the fund’s Class A, Class T, Class B and Class C shares returned 45.85%, 45.59%, 44.75% and 44.93%, respectively, trailing the KOSPI but handily beating the 25.23% gain of the LipperSM Pacific Region ex Japan Funds Average. On an industry basis, bank stocks helped performance the most, as they benefited from improving asset quality and expectations for accelerating loan growth. For example, one strong performer was the stock of Shinhan Financial Group, the second-largest financial institution in Korea. The company broadened its distribution platform to include a more diverse customer base through its 2003 acquisition of Chohung Bank. Also aiding fund performance was its position in Hyundai Department Store, Korea’s second-largest department store operator. Conversely, the biggest detractor was NCsoft, the largest developer of multi-player, online role-playing games in Korea. The stock underperformed the index, particularly in the first half of the period, after reporting lackluster 2004 earnings. Another disappointment was Jahwa Electronics, which manufactures vibration motors for mobile handsets. The company’s profit margins suffered due the sharp appreciation of Korea’s currency — the won —versus the U.S. dollar early in the period.
Note to shareholders: Fidelity Advisor Korea Fund may invest up to 35% of its total assets in any industry that represents more than 20% of the Korean market. As of October 31, 2005, the fund did not have more than 25% of its total assets invested in any one industry.
The views expressed in this statement reflect those of the portfolio manager only through the end of the period of the report as stated on the cover and do not necessarily represent the views of Fidelity or any other person in the Fidelity organization. Any such views are subject to change at any time based upon market or other conditions and Fidelity disclaims any responsibility to update such views. These views may not be relied on as investment advice and, because investment decisions for a Fidelity fund are based on numerous factors, may not be relied on as an indication of trading intent on behalf of any Fidelity fund.
Shareholder Expense Example
As a shareholder of the Fund, you incur two types of costs: (1) transaction costs, including sales charges (loads) on purchase payments or redemption proceeds, redemption fees, and (2) ongoing costs, including management fees, distribution and/or service (12b-1) fees and other Fund expenses. This Example is intended to help you understand your ongoing costs (in dollars) of investing in the Fund and to compare these costs with the ongoing costs of investing in other mutual funds.
The Example is based on an investment of $1,000 invested at the beginning of the period and held for the entire period (May 1, 2005 to October 31, 2005).
The first line of the table on the next page for each class of the Fund provides information about actual account values and actual expenses. You may use the information in this line, together with the amount you invested, to estimate the expenses that you paid over the period. Simply divide your account value by $1,000.00 (for example, an $8,600 account value divided by $1,000.00 = 8.6), then multiply the result by the number in the first line for a class of the Fund under the heading entitled “Expenses Paid During Period” to estimate the expenses you paid on your account during this period.
Hypothetical Example for Comparison Purposes
The second line of the table on the next page for each class of the Fund provides information about hypothetical account values and hypothetical expenses based on a Class’ actual expense ratio and an assumed rate of return of 5% per year before expenses, which is not the Class’ actual return. The hypothetical account values and expenses may not be used to estimate the actual ending account balance or expenses you paid for the period. You may use this information to compare the ongoing costs of investing in the Fund and other funds. To do so, compare this 5% hypothetical example with the 5% hypothetical examples that appear in the shareholder reports of the other funds.
Please note that the expenses shown in the table are meant to highlight your ongoing costs only and do not reflect any transaction costs. Therefore, the second line of the table is useful in comparing ongoing costs only, and will not help you determine the relative total costs of owning different funds. In addition, if these transactional costs were included, your costs would have been higher.
9 Annual Report
| Shareholder Expense Example - continued | | | | |
| |
| |
| | | | | | | | | | | | | Expenses Paid |
| | | | | Beginning | | | | Ending | | | | During Period* |
| | | | | Account Value | | | | Account Value | | | | May 1, 2005 |
| | | | | May 1, 2005 | | | | October 31, 2005 | | to October 31, 2005 |
| Class A | | | | | | | | | | | | |
| Actual | | $ | | 1,000.00 | | $ | | 1,196.70 | | $ | | 8.86 |
| HypotheticalA | | $ | | 1,000.00 | | $ | | 1,017.14 | | $ | | 8.13 |
| Class T | | | | | | | | | | | | |
| Actual | | $ | | 1,000.00 | | $ | | 1,196.00 | | $ | | 10.24 |
| HypotheticalA | | $ | | 1,000.00 | | $ | | 1,015.88 | | $ | | 9.40 |
| Class B | | | | | | | | | | | | |
| Actual | | $ | | 1,000.00 | | $ | | 1,192.10 | | $ | | 12.98 |
| HypotheticalA | | $ | | 1,000.00 | | $ | | 1,013.36 | | $ | | 11.93 |
| Class C | | | | | | | | | | | | |
| Actual | | $ | | 1,000.00 | | $ | | 1,192.70 | | $ | | 12.99 |
| HypotheticalA | | $ | | 1,000.00 | | $ | | 1,013.36 | | $ | | 11.93 |
| Institutional Class | | | | | | | | | | | | |
| Actual | | $ | | 1,000.00 | | $ | | 1,199.00 | | $ | | 7.48 |
| HypotheticalA | | $ | | 1,000.00 | | $ | | 1,018.40 | | $ | | 6.87 |
| |
| A 5% return per year before expenses | | | | | | | | |
* Expenses are equal to each Class’ annualized expense ratio (shown in the table below); multiplied by the average account value over the period, multiplied by 184/365 (to reflect the one-half year period).
| | | Annualized |
| | | Expense Ratio |
| Class A | | 1.60% |
| Class T | | 1.85% |
| Class B | | 2.35% |
| Class C | | 2.35% |
| Institutional Class | | 1.35% |
Investment Changes
| Top Ten Stocks as of October 31, 2005 | | | | |
| | | % of fund’s | | % of fund’s net assets |
| | | net assets | | 6 months ago |
| Samsung Electronics Co. Ltd. | | 11.9 | | 12.3 |
| Hyundai Motor Co. | | 5.5 | | 3.6 |
| NHN Corp. | | 4.7 | | 0.0 |
| Kookmin Bank | | 4.4 | | 3.5 |
| LG Household & Health Care Ltd. | | 3.0 | | 0.0 |
| Hyundai Mobis | | 3.0 | | 3.2 |
| Orion Corp. | | 2.5 | | 0.0 |
| Shinhan Financial Group Co. Ltd. | | 2.4 | | 4.3 |
| Kia Motors Corp. | | 2.4 | | 1.8 |
| Doosan Heavy Industries & Construction Co. Ltd. | | 2.4 | | 0.0 |
| | | 42.2 | | |
| Market Sectors as of October 31, 2005 | | | | |
| | | % of fund’s | | % of fund’s net assets |
| | | net assets | | 6 months ago |
| Information Technology | | 22.5 | | 25.0 |
| Financials | | 22.2 | | 16.8 |
| Consumer Discretionary | | 17.5 | | 19.9 |
| Industrials | | 16.2 | | 10.7 |
| Consumer Staples | | 8.9 | | 8.1 |
| Telecommunication Services | | 4.2 | | 7.3 |
| Energy | | 3.4 | | 4.1 |
| Materials | | 3.1 | | 4.5 |
| Health Care | | 1.7 | | 0.0 |
| Utilities | | 0.2 | | 2.0 |

11 Annual Report
| Investments October 31, 2005 | | | | | | | | |
| Showing Percentage of Net Assets | | | | | | | | |
| |
| Common Stocks — 99.9% | | | | | | | | |
| | | | | Shares | | Value (Note 1) |
| |
| CONSUMER DISCRETIONARY – 17.5% | | | | | | | | |
| Auto Components – 3.3% | | | | | | | | |
| Hankook Tire Co. Ltd. | | | | 8,390 | | $ | | 100,053 |
| Hyundai Mobis | | | | 10,490 | | | | 833,975 |
| | | | | | | | | 934,028 |
| Automobiles – 8.0% | | | | | | | | |
| Hyundai Motor Co. | | | | 21,100 | | | | 1,548,141 |
| Kia Motors Corp. | | | | 38,070 | | | | 683,728 |
| | | | | | | | | 2,231,869 |
| Diversified Consumer Services – 1.5% | | | | | | | | |
| YBM Sisa.com, Inc. | | | | 21,717 | | | | 407,714 |
| Hotels, Restaurants & Leisure – 2.0% | | | | | | | | |
| Hana Tour Service, Inc. | | | | 10,434 | | | | 327,811 |
| Modetour Network, Inc. | | | | 12,092 | | | | 242,072 |
| | | | | | | | | 569,883 |
| Household Durables – 0.6% | | | | | | | | |
| LG Electronics, Inc. | | | | 2,610 | | | | 169,250 |
| Internet & Catalog Retail – 0.4% | | | | | | | | |
| CJ Home Shopping | | | | 1,111 | | | | 98,436 |
| Multiline Retail – 1.7% | | | | | | | | |
| Hyundai Department Store Co. Ltd. | | | | 7,370 | | | | 489,215 |
| |
| TOTAL CONSUMER DISCRETIONARY | | | | | | | | 4,900,395 |
| |
| CONSUMER STAPLES – 8.9% | | | | | | | | |
| Food & Staples Retailing – 2.1% | | | | | | | | |
| Shinsegae Co. Ltd. | | | | 1,640 | | | | 587,509 |
| Food Products – 3.4% | | | | | | | | |
| Binggrea Co. Ltd. | | | | 5,950 | | | | 246,777 |
| Orion Corp. | | | | 3,670 | | | | 711,853 |
| | | | | | | | | 958,630 |
| Household Products – 3.0% | | | | | | | | |
| LG Household & Health Care Ltd. | | | | 15,310 | | | | 835,890 |
| Personal Products – 0.4% | | | | | | | | |
| AmorePacific Corp. | | | | 410 | | | | 122,136 |
| |
| TOTAL CONSUMER STAPLES | | | | | | | | 2,504,165 |
| |
| ENERGY – 3.4% | | | | | | | | |
| Oil, Gas & Consumable Fuels – 3.4% | | | | | | | | |
| GS Holdings Corp. | | | | 7,770 | | | | 177,876 |
See accompanying notes which are an integral part of the financial statements.
| Common Stocks – continued | | | | | | |
| | | Shares | | Value (Note 1) |
| |
| ENERGY – continued | | | | | | |
| Oil, Gas & Consumable Fuels – continued | | | | | | |
| S-Oil Corp. | | 6,560 | | $ | | 490,743 |
| SK Corp. | | 5,440 | | | | 278,774 |
| | | | | | | 947,393 |
| |
| FINANCIALS – 22.2% | | | | | | |
| Capital Markets – 4.8% | | | | | | |
| Daewoo Securities Co. Ltd. (a) | | 41,830 | | | | 450,754 |
| Hyundai Securities Co. Ltd. (a) | | 12,490 | | | | 114,970 |
| kiwoom.com Securities Co. Ltd. | | 15,206 | | | | 289,846 |
| Korea Investment Holdings Co. Ltd. | | 15,470 | | | | 397,122 |
| LG Investment & Securities Co. Ltd. | | 6,970 | | | | 91,798 |
| | | | | | | 1,344,490 |
| Commercial Banks – 10.3% | | | | | | |
| Industrial Bank of Korea | | 33,340 | | | | 395,992 |
| Kookmin Bank | | 22,310 | | | | 1,224,485 |
| Shinhan Financial Group Co. Ltd. | | 20,692 | | | | 689,733 |
| Woori Finance Holdings Co. Ltd. | | 37,860 | | | | 582,043 |
| | | | | | | 2,892,253 |
| Consumer Finance – 1.4% | | | | | | |
| LG Card Co. Ltd. (a) | | 10,710 | | | | 386,750 |
| Insurance – 5.7% | | | | | | |
| Dongbu Insurance Co. Ltd. | | 24,340 | | | | 304,250 |
| Korean Reinsurance Co. | | 60,590 | | | | 528,131 |
| LG Insurance Co. Ltd. | | 11,190 | | | | 138,267 |
| Samsung Fire & Marine Insurance Co. Ltd. | | 6,630 | | | | 628,707 |
| | | | | | | 1,599,355 |
| |
| TOTAL FINANCIALS | | | | | | 6,222,848 |
| |
| HEALTH CARE – 1.7% | | | | | | |
| Pharmaceuticals – 1.7% | | | | | | |
| Hanmi Pharm Co. Ltd. | | 4,860 | | | | 493,448 |
| |
| INDUSTRIALS – 16.2% | | | | | | |
| Building Products – 0.3% | | | | | | |
| KCC Corp. | | 501 | | | | 96,457 |
| Construction & Engineering – 9.5% | | | | | | |
| Daelim Industrial Co. | | 4,470 | | | | 260,322 |
| Daewoo Engineering & Construction Co. Ltd. | | 18,910 | | | | 187,470 |
| Doosan Heavy Industries & Construction Co. Ltd. | | 31,440 | | | | 680,597 |
See accompanying notes which are an integral part of the financial statements.
13 Annual Report
| Investments - continued | | | | | | |
| |
| |
| Common Stocks – continued | | | | | | |
| | | Shares | | Value (Note 1) |
| |
| INDUSTRIALS – continued | | | | | | |
| Construction & Engineering – continued | | | | | | |
| Halla Engineering & Construction Corp. | | 3,610 | | $ | | 96,820 |
| Hyundai Engineering & Construction Co. Ltd. (a) | | 20,180 | | | | 627,242 |
| Hyundai Industrial Development & Construction Co. | | 4,160 | | | | 151,418 |
| Keangnam Enterprises (a) | | 7,830 | | | | 75,000 |
| LG Engineering & Construction Co. Ltd. | | 11,390 | | | | 488,221 |
| Sambu Construction Co. Ltd. | | 3,330 | | | | 91,862 |
| | | | | | | 2,658,952 |
| Electrical Equipment – 0.5% | | | | | | |
| LS Industrial Systems Ltd. | | 5,370 | | | | 145,052 |
| Industrial Conglomerates – 0.2% | | | | | | |
| LG Corp. | | 2,470 | | | | 60,567 |
| Machinery – 5.7% | | | | | | |
| Daewoo Heavy Industries & Machinery Ltd. | | 27,260 | | | | 338,139 |
| Daewoo Shipbuilding & Marine Engineering Co. Ltd. | | 11,900 | | | | 237,088 |
| Hyundai Heavy Industries Co. Ltd. | | 7,010 | | | | 455,918 |
| Hyundai Mipo Dockyard Co. Ltd. | | 8,980 | | | | 554,799 |
| | | | | | | 1,585,944 |
| |
| TOTAL INDUSTRIALS | | | | | | 4,546,972 |
| |
| INFORMATION TECHNOLOGY – 22.5% | | | | | | |
| Electronic Equipment & Instruments – 3.2% | | | | | | |
| KH Vatec Co. Ltd. | | 5,657 | | | | 124,627 |
| LG.Philips LCD Co. Ltd. (a) | | 15,110 | | | | 558,665 |
| Samsung SDI Co. Ltd. | | 2,160 | | | | 212,069 |
| | | | | | | 895,361 |
| Internet Software & Services – 4.7% | | | | | | |
| NHN Corp. (a) | | 8,019 | | | | 1,332,659 |
| IT Services – 0.7% | | | | | | |
| CDNetworks Co. Ltd. | | 11,212 | | | | 187,941 |
| Semiconductors & Semiconductor Equipment – 13.6% | | | | | | |
| Hynix Semiconductor, Inc. (a) | | 23,320 | | | | 425,523 |
| Samsung Electronics Co. Ltd. | | 6,300 | | | | 3,331,031 |
| Samsung Techwin Industries | | 3,080 | | | | 44,695 |
| | | | | | | 3,801,249 |
| Software – 0.3% | | | | | | |
| NCsoft Corp. (a) | | 910 | | | | 84,986 |
| |
| TOTAL INFORMATION TECHNOLOGY | | | | | | 6,302,196 |
See accompanying notes which are an integral part of the financial statements.
| Common Stocks – continued | | | | | | |
| | | Shares | | Value (Note 1) |
| |
| MATERIALS – 3.1% | | | | | | |
| Chemicals – 0.7% | | | | | | |
| FINETEC Corp. | | 2,336 | | $ | | 24,054 |
| Hanwha Corp. | | 9,680 | | | | 180,805 |
| | | | | | | 204,859 |
| Metals & Mining – 2.4% | | | | | | |
| POSCO | | 3,300 | | | | 668,534 |
| |
| TOTAL MATERIALS | | | | | | 873,393 |
| |
| TELECOMMUNICATION SERVICES – 4.2% | | | | | | |
| Diversified Telecommunication Services – 0.8% | | | | | | |
| KT Corp. | | 5,660 | | | | 227,159 |
| Wireless Telecommunication Services – 3.4% | | | | | | |
| KT Freetel Co. Ltd. | | 8,400 | | | | 180,230 |
| LG Telecom Ltd. (a) | | 28,603 | | | | 141,097 |
| SK Telecom Co. Ltd. | | 3,500 | | | | 628,592 |
| | | | | | | 949,919 |
| |
| TOTAL TELECOMMUNICATION SERVICES | | | | | | 1,177,078 |
| |
| UTILITIES – 0.2% | | | | | | |
| Electric Utilities – 0.0% | | | | | | |
| Korea Electric Power Corp. | | 130 | | | | 4,227 |
| Gas Utilities – 0.2% | | | | | | |
| E1 Corp. | | 1,460 | | | | 61,113 |
| |
| TOTAL UTILITIES | | | | | | 65,340 |
| |
| TOTAL COMMON STOCKS | | | | | | |
| (Cost $20,990,380) | | | | 28,033,228 |
See accompanying notes which are an integral part of the financial statements.
15 Annual Report
| Investments - continued | | | | | | |
| |
| Money Market Funds — 1.0% | | | | | | |
| | | Shares | | | | Value (Note 1) |
| Fidelity Cash Central Fund, 3.92% (b) | | | | | | |
| (Cost $274,315) | | 274,315 | | $ | | 274,315 |
| TOTAL INVESTMENT PORTFOLIO – 100.9% | | | | | | |
| (Cost $21,264,695) | | | | | | 28,307,543 |
| |
| NET OTHER ASSETS – (0.9)% | | | | | | (255,631) |
| NET ASSETS – 100% | | | | $ | | 28,051,912 |
(a) Non-income producing
(b) Affiliated fund that is available only to investment companies and other accounts managed by Fidelity Investments. The rate quoted is the annualized seven-day yield of the fund at period end. A complete unaudited listing of the fund’s holdings as of its most recent quarter end is available upon request.
At October 31, 2005, the fund had a capital loss carryforward of approximately $6,981,779 of which $5,467,666 and $1,514,113 will expire on October 31, 2006 and 2009, respectively.
See accompanying notes which are an integral part of the financial statements.
| Financial Statements | | | | | | | | |
| |
| |
| Statement of Assets and Liabilities | | | | | | | | |
| | | | | | | | | October 31, 2005 |
| |
| Assets | | | | | | | | |
| Investment in securities, at value (cost $21,264,695) — | | | | | | |
| See accompanying schedule | | | | | | $ | | 28,307,543 |
| Cash | | | | | | | | 14,078 |
| Receivable for investments sold | | | | | | | | 166,151 |
| Receivable for fund shares sold | | | | | | | | 86,372 |
| Dividends receivable | | | | | | | | 3,673 |
| Interest receivable | | | | | | | | 2,105 |
| Receivable from investment adviser for expense reductions | | | | | | 7,381 |
| Other affiliated receivables | | | | | | | | 76 |
| Other receivables | | | | | | | | 1,428 |
| Total assets | | | | | | | | 28,588,807 |
| |
| Liabilities | | | | | | | | |
| Payable for investments purchased | | $ | | 354,056 | | | | |
| Payable for fund shares redeemed | | | | 64,861 | | | | |
| Accrued management fee | | | | 18,951 | | | | |
| Distribution fees payable | | | | 11,285 | | | | |
| Other affiliated payables | | | | 8,261 | | | | |
| Other payables and accrued expenses | | | | 79,481 | | | | |
| Total liabilities | | | | | | | | 536,895 |
| |
| Net Assets | | | | | | $ | | 28,051,912 |
| Net Assets consist of: | | | | | | | | |
| Paid in capital | | | | | | $ | | 28,059,193 |
| Undistributed net investment income | | | | | | | | 18,689 |
| Accumulated undistributed net realized gain (loss) on | | | | | | | | |
| investments and foreign currency transactions | | | | | | | | (7,068,565) |
| Net unrealized appreciation (depreciation) on | | | | | | | | |
| investments and assets and liabilities in foreign | | | | | | | | |
| currencies | | | | | | | | 7,042,595 |
| Net Assets | | | | | | $ | | 28,051,912 |
See accompanying notes which are an integral part of the financial statements.
17 Annual Report
| Financial Statements - continued | | | | | | |
| |
| |
| |
| Statement of Assets and Liabilities — continued | | | | |
| | | | | October 31, 2005 |
| |
| Calculation of Maximum Offering Price | | | | | | |
| Class A: | | | | | | |
| Net Asset Value and redemption price per share | | | | | | |
| ($15,565,901 ÷ 894,499 shares) | | | | $ | | 17.40 |
| Maximum offering price per share (100/94.25 of $17.40) | | . | | $ | | 18.46 |
| Class T: | | | | | | |
| Net Asset Value and redemption price per share | | | | | | |
| ($3,407,398 ÷ 198,663 shares) | | | | $ | | 17.15 |
| Maximum offering price per share (100/96.50 of $17.15) | | . | | $ | | 17.77 |
| Class B: | | | | | | |
| Net Asset Value and offering price per share ($4,383,697 | | | | |
| ÷ 262,612 shares)A | | | | $ | | 16.69 |
| Class C: | | | | | | |
| Net Asset Value and offering price per share ($3,994,172 | | | | |
| ÷ 239,093 shares)A | | | | $ | | 16.71 |
| Institutional Class: | | | | | | |
| Net Asset Value, offering price and redemption price per | | | | | | |
| share ($700,744 ÷ 39,709 shares) | | | | $ | | 17.65 |
| |
| A Redemption price per share is equal to net asset value less any applicable contingent deferred sales charge. | | | | |
See accompanying notes which are an integral part of the financial statements.
Annual Report 18
| Statement of Operations | | | | | | |
| | | | | Year ended October 31, 2005 |
| |
| Investment Income | | | | | | |
| Dividends | | | | $ | | 472,214 |
| Interest | | | | | | 14,545 |
| | | | | | | 486,759 |
| Less foreign taxes withheld | | | | | | (77,915) |
| Total income | | | | | | 408,844 |
| |
| Expenses | | | | | | |
| Management fee | | $ | | 174,355 | | |
| Transfer agent fees | | | | 73,252 | | |
| Distribution fees | | | | 95,370 | | |
| Accounting fees and expenses | | | | 15,543 | | |
| Independent trustees’ compensation | | | | 95 | | |
| Custodian fees and expenses | | | | 34,585 | | |
| Registration fees | | | | 47,983 | | |
| Audit | | | | 83,477 | | |
| Legal | | | | 1,686 | | |
| Miscellaneous | | | | 188 | | |
| Total expenses before reductions | | | | 526,534 | | |
| Expense reductions | | | | (136,378) | | 390,156 |
| |
| Net investment income (loss) | | | | | | 18,688 |
| Realized and Unrealized Gain (Loss) | | | | | | |
| Net realized gain (loss) on: | | | | | | |
| Investment securities | | | | 4,751,527 | | |
| Foreign currency transactions | | | | (62,658) | | |
| Total net realized gain (loss) | | | | | | 4,688,869 |
| Change in net unrealized appreciation (depreciation) on: | | | | |
| Investment securities | | | | 2,369,920 | | |
| Assets and liabilities in foreign currencies | | | | 35 | | |
| Total change in net unrealized appreciation | | | | | | |
| (depreciation) | | | | | | 2,369,955 |
| Net gain (loss) | | | | | | 7,058,824 |
| Net increase (decrease) in net assets resulting from | | | | | | |
| operations | | | | $ | | 7,077,512 |
See accompanying notes which are an integral part of the financial statements.
19 Annual Report
| Financial Statements - continued | | | | | | | | |
| |
| |
| Statement of Changes in Net Assets | | | | | | | | |
| | | | | Year ended | | | | Year ended |
| | | | | October 31, | | | | October 31, |
| | | | | 2005 | | | | 2004 |
| Increase (Decrease) in Net Assets | | | | | | | | |
| Operations | | | | | | | | |
| Net investment income (loss) | | $ | | 18,688 | | $ | | (107,570) |
| Net realized gain (loss) | | | | 4,688,869 | | | | 1,986,022 |
| Change in net unrealized appreciation (depreciation) . | | | | 2,369,955 | | | | (859,552) |
| Net increase (decrease) in net assets resulting | | | | | | | | |
| from operations | | | | 7,077,512 | | | | 1,018,900 |
| Share transactions — net increase (decrease) | | | | 3,922,676 | | | | 715,711 |
| Redemption fees | | | | 12,538 | | | | 10,827 |
| Total increase (decrease) in net assets | | | | 11,012,726 | | | | 1,745,438 |
| |
| Net Assets | | | | | | | | |
| Beginning of period | | | | 17,039,186 | | | | 15,293,748 |
| End of period (including undistributed net investment | | | | | | | | |
| income of $18,689 and $0, respectively) | | $ | | 28,051,912 | | $ | | 17,039,186 |
See accompanying notes which are an integral part of the financial statements.
| Financial Highlights — Class A | | | | | | | | | | | | | | |
| |
| Years ended October 31, | | 2005 | | 2004 | | | | 2003 | | | | 2002 | | | | 2001 |
| Selected Per-Share Data | | | | | | | | | | | | | | | | |
| Net asset value, beginning of | | | | | | | | | | | | | | | | |
| period | | $ 11.93 | | $ 11.07 | | $ | | 9.05 | | $ | | 6.70 | | $ | | 7.38 |
| Income from Investment | | | | | | | | | | | | | | | | |
| Operations | | | | | | | | | | | | | | | | |
| Net investment income (loss)C | | 04 | | (.06) | | | | .01 | | | | (.11) | | | | —E |
| Net realized and unrealized | | | | | | | | | | | | | | | | |
| gain (loss) | | 5.42 | | .91 | | | | 2.01 | | | | 2.46 | | | | (.69) |
| Total from investment operations | | 5.46 | | .85 | | | | 2.02 | | | | 2.35 | | | | (.69) |
| Redemption fees added to paid in | | | | | | | | | | | | | | | | |
| capitalC | | 01 | | .01 | | | | — | | | | — | | | | .01 |
| Net asset value, end of period | | $ 17.40 | | $ 11.93 | | $ | | 11.07 | | $ | | 9.05 | | $ | | 6.70 |
| Total ReturnA,B | | 45.85% | | 7.77% | | | | 22.32% | | | | 35.07% | | | | (9.21)% |
| Ratios to Average Net AssetsD | | | | | | | | | | | | | | | | |
| Expenses before expense | | | | | | | | | | | | | | | | |
| reductions | | 2.25% | | 2.76% | | | | 2.85% | | | | 2.48% | | | | 3.31% |
| Expenses net of voluntary | | | | | | | | | | | | | | | | |
| waivers, if any | | 1.69% | | 2.00% | | | | 2.00% | | | | 2.08% | | | | 2.10% |
| Expenses net of all reductions | | 1.65% | | 2.00% | | | | 2.00% | | | | 2.06% | | | | 2.08% |
| Net investment income (loss) | | 28% | | (.50)% | | | | .12% | | | | (1.10)% | | | | (.04)% |
| Supplemental Data | | | | | | | | | | | | | | | | |
| Net assets, end of period (000 | | | | | | | | | | | | | | | | |
| omitted) | | $15,566 | | $12,309 | | $12,187 | | $11,946 | | $11,747 |
| Portfolio turnover rate | | 97% | | 77% | | | | 127% | | | | 60% | | | | 36% |
A Total returns would have been lower had certain expenses not been reduced during the periods shown.
B Total returns do not include the effect of the sales charges.
C Calculated based on average shares outstanding during the period.
D Expense ratios reflect operating expenses of the class. Expenses before reductions do not reflect amounts reimbursed by the investment adviser or reductions from brokerage service arrangements or other expense offset arrangements and do not represent the amount paid by the class during periods when reimbursements or reductions occur. Expenses net of any voluntary waivers reflect expenses after reimbursement by the investment adviser but prior to reductions from brokerage service arrangements or other expense offset arrangements. Expenses net of all reductions repre sent the net expenses paid by the class.
E Amount represents less than $.01 per share.
See accompanying notes which are an integral part of the financial statements.
21 Annual Report
| Financial Highlights — Class T | | | | | | | | | | | | | | |
| |
| Years ended October 31, | | 2005 | | 2004 | | | | 2003 | | | | 2002 | | | | 2001 |
| Selected Per-Share Data | | | | | | | | | | | | | | | | |
| Net asset value, beginning of | | | | | | | | | | | | | | | | |
| period | | $ 11.78 | | $ 10.96 | | $ | | 8.99 | | $ | | 6.67 | | $ | | 7.37 |
| Income from Investment | | | | | | | | | | | | | | | | |
| Operations | | | | | | | | | | | | | | | | |
| Net investment income (loss)C | | 01 | | (.09) | | | | (.01) | | | | (.14) | | | | (.02) |
| Net realized and unrealized | | | | | | | | | | | | | | | | |
| gain (loss) | | 5.35 | | .90 | | | | 1.98 | | | | 2.46 | | | | (.69) |
| Total from investment operations | | 5.36 | | .81 | | | | 1.97 | | | | 2.32 | | | | (.71) |
| Redemption fees added to paid in | | | | | | | | | | | | | | | | |
| capitalC | | 01 | | .01 | | | | — | | | | — | | | | .01 |
| Net asset value, end of period | | $ 17.15 | | $ 11.78 | | $ | | 10.96 | | $ | | 8.99 | | $ | | 6.67 |
| Total ReturnA,B | | 45.59% | | 7.48% | | | | 21.91% | | | | 34.78% | | | | (9.50)% |
| Ratios to Average Net AssetsD | | | | | | | | | | | | | | | | |
| Expenses before expense | | | | | | | | | | | | | | | | |
| reductions | | 2.67% | | 3.54% | | | | 3.74% | | | | 3.02% | | | | 4.22% |
| Expenses net of voluntary | | | | | | | | | | | | | | | | |
| waivers, if any | | 1.91% | | 2.25% | | | | 2.25% | | | | 2.33% | | | | 2.35% |
| Expenses net of all reductions | | 1.87% | | 2.25% | | | | 2.25% | | | | 2.31% | | | | 2.33% |
| Net investment income (loss) | | 06% | | (.75)% | | | | (.13)% | | | | (1.35)% | | | | (.29)% |
| Supplemental Data | | | | | | | | | | | | | | | | |
| Net assets, end of period (000 | | | | | | | | | | | | | | | | |
| omitted) | | $ 3,407 | | $ 1,383 | | $ | | 1,223 | | $ | | 2,718 | | $ | | 343 |
| Portfolio turnover rate | | 97% | | 77% | | | | 127% | | | | 60% | | | | 36% |
A Total returns would have been lower had certain expenses not been reduced during the periods shown.
B Total returns do not include the effect of the sales charges.
C Calculated based on average shares outstanding during the period.
D Expense ratios reflect operating expenses of the class. Expenses before reductions do not reflect amounts reimbursed by the investment adviser or reductions from brokerage service arrangements or other expense offset arrangements and do not represent the amount paid by the class during periods when reimbursements or reductions occur. Expenses net of any voluntary waivers reflect expenses after reimbursement by the investment adviser but prior to reductions from brokerage service arrangements or other expense offset arrangements. Expenses net of all reductions repre sent the net expenses paid by the class.
See accompanying notes which are an integral part of the financial statements.
| Financial Highlights — Class B | | | | | | | | | | | | | | |
| |
| Years ended October 31, | | 2005 | | 2004 | | | | 2003 | | | | 2002 | | | | 2001 |
| Selected Per-Share Data | | | | | | | | | | | | | | | | |
| Net asset value, beginning of | | | | | | | | | | | | | | | | |
| period | | $ 11.53 | | $ 10.78 | | $ | | 8.88 | | $ | | 6.62 | | $ | | 7.36 |
| Income from Investment | | | | | | | | | | | | | | | | |
| Operations | | | | | | | | | | | | | | | | |
| Net investment income (loss)C | | (.07) | | (.14) | | | | (.06) | | | | (.19) | | | | (.05) |
| Net realized and unrealized | | | | | | | | | | | | | | | | |
| gain (loss) | | 5.22 | | .88 | | | | 1.96 | | | | 2.45 | | | | (.69) |
| Total from investment operations | | 5.15 | | .74 | | | | 1.90 | | | | 2.26 | | | | (.74) |
| Redemption fees added to paid in | | | | | | | | | | | | | | | | |
| capitalC | | 01 | | .01 | | | | — | | | | — | | | | —E |
| Net asset value, end of period | | $ 16.69 | | $ 11.53 | | $ | | 10.78 | | $ | | 8.88 | | $ | | 6.62 |
| Total ReturnA,B | | 44.75% | | 6.96% | | | | 21.40% | | | | 34.14% | | | | (10.05)% |
| Ratios to Average Net AssetsD | | | | | | | | | | | | | | | | |
| Expenses before expense | | | | | | | | | | | | | | | | |
| reductions | | 3.06% | | 3.63% | | | | 4.08% | | | | 3.48% | | | | 4.66% |
| Expenses net of voluntary | | | | | | | | | | | | | | | | |
| waivers, if any | | 2.42% | | 2.75% | | | | 2.75% | | | | 2.83% | | | | 2.85% |
| Expenses net of all reductions | | 2.38% | | 2.75% | | | | 2.75% | | | | 2.81% | | | | 2.83% |
| Net investment income (loss) | | (.45)% | | (1.25)% | | | | (.63)% | | | | (1.85)% | | | | (.79)% |
| Supplemental Data | | | | | | | | | | | | | | | | |
| Net assets, end of period (000 | | | | | | | | | | | | | | | | |
| omitted) | | $ 4,384 | | $ 2,279 | | $ | | 1,175 | | $ | | 1,313 | | $ | | 282 |
| Portfolio turnover rate | | 97% | | 77% | | | | 127% | | | | 60% | | | | 36% |
A Total returns would have been lower had certain expenses not been reduced during the periods shown.
B Total returns do not include the effect of the contingent deferred sales charge.
C Calculated based on average shares outstanding during the period.
D Expense ratios reflect operating expenses of the class. Expenses before reductions do not reflect amounts reimbursed by the investment adviser or reductions from brokerage service arrangements or other expense offset arrangements and do not represent the amount paid by the class during periods when reimbursements or reductions occur. Expenses net of any voluntary waivers reflect expenses after reimbursement by the investment adviser but prior to reductions from brokerage service arrangements or other expense offset arrangements. Expenses net of all reductions repre sent the net expenses paid by the class.
E Amount represents less than $.01 per share.
See accompanying notes which are an integral part of the financial statements.
23 Annual Report
| Financial Highlights — Class C | | | | | | | | | | | | | | | | |
| |
| Years ended October 31, | | 2005 | | | | 2004 | | | | 2003 | | | | 2002 | | | | 2001 |
| Selected Per-Share Data | | | | | | | | | | | | | | | | | | |
| Net asset value, beginning of | | | | | | | | | | | | | | | | | | |
| period | | $ 11.53 | | $ | | 10.79 | | $ | | 8.89 | | $ | | 6.62 | | $ | | 7.36 |
| Income from Investment | | | | | | | | | | | | | | | | | | |
| Operations | | | | | | | | | | | | | | | | | | |
| Net investment income (loss)C | | (.06) | | | | (.14) | | | | (.06) | | | | (.19) | | | | (.06) |
| Net realized and unrealized | | | | | | | | | | | | | | | | | | |
| gain (loss) | | 5.23 | | | | .87 | | | | 1.96 | | | | 2.46 | | | | (.69) |
| Total from investment operations | | 5.17 | | | | .73 | | | | 1.90 | | | | 2.27 | | | | (.75) |
| Redemption fees added to paid in | | | | | | | | | | | | | | | | | | |
| capitalC | | 01 | | | | .01 | | | | — | | | | — | | | | .01 |
| Net asset value, end of period | | $ 16.71 | | $ | | 11.53 | | $ | | 10.79 | | $ | | 8.89 | | $ | | 6.62 |
| Total ReturnA,B | | 44.93% | | | | 6.86% | | | | 21.37% | | | | 34.29% | | | | (10.05)% |
| Ratios to Average Net AssetsD | | | | | | | | | | | | | | | | | | |
| Expenses before expense | | | | | | | | | | | | | | | | | | |
| reductions | | 3.00% | | | | 3.63% | | | | 3.82% | | | | 3.35% | | | | 4.41% |
| Expenses net of voluntary | | | | | | | | | | | | | | | | | | |
| waivers, if any | | 2.39% | | | | 2.75% | | | | 2.75% | | | | 2.83% | | | | 2.85% |
| Expenses net of all reductions | | 2.35% | | | | 2.75% | | | | 2.75% | | | | 2.81% | | | | 2.83% |
| Net investment income (loss) | | (.42)% | | | | (1.25)% | | | | (.63)% | | | | (1.85)% | | | | (.79)% |
| Supplemental Data | | | | | | | | | | | | | | | | | | |
| Net assets, end of period (000 | | | | | | | | | | | | | | | | | | |
| omitted) | | $ 3,994 | | $ | | 759 | | $ | | 531 | | $ | | 804 | | $ | | 127 |
| Portfolio turnover rate | | 97% | | | | 77% | | | | 127% | | | | 60% | | | | 36% |
A Total returns would have been lower had certain expenses not been reduced during the periods shown.
B Total returns do not include the effect of the contingent deferred sales charge.
C Calculated based on average shares outstanding during the period.
D Expense ratios reflect operating expenses of the class. Expenses before reductions do not reflect amounts reimbursed by the investment adviser or reductions from brokerage service arrangements or other expense offset arrangements and do not represent the amount paid by the class during periods when reimbursements or reductions occur. Expenses net of any voluntary waivers reflect expenses after reimbursement by the investment adviser but prior to reductions from brokerage service arrangements or other expense offset arrangements. Expenses net of all reductions repre sent the net expenses paid by the class.
See accompanying notes which are an integral part of the financial statements.
| Financial Highlights — Institutional Class | | | | | | | | | | | | |
| |
| Years ended October 31, | | | | 2005 | | | | 2004 | | | | 2003 | | | | 2002 | | | | 2001 |
| Selected Per-Share Data | | | | | | | | | | | | | | | | | | | | |
| Net asset value, beginning of | | | | | | | | | | | | | | | | | | | | |
| period | | $ | | 12.06 | | $ | | 11.16 | | $ | | 9.11 | | $ | | 6.72 | | $ | | 7.39 |
| Income from Investment | | | | | | | | | | | | | | | | | | | | |
| Operations | | | | | | | | | | | | | | | | | | | | |
| Net investment income (loss)B | | | | 09 | | | | (.03) | | | | .04 | | | | (.08) | | | | .01 |
| Net realized and unrealized | | | | | | | | | | | | | | | | | | | | |
| gain (loss) | | | | 5.49 | | | | .92 | | | | 2.01 | | | | 2.47 | | | | (.69) |
| Total from investment operations | | | | 5.58 | | | | .89 | | | | 2.05 | | | | 2.39 | | | | (.68) |
| Redemption fees added to paid in | | | | | | | | | | | | | | | | | | | | |
| capitalB | | | | 01 | | | | .01 | | | | — | | | | — | | | | .01 |
| Net asset value, end of period | | $ | | 17.65 | | $ | | 12.06 | | $ | | 11.16 | | $ | | 9.11 | | $ | | 6.72 |
| Total ReturnA | | | | 46.35% | | | | 8.06% | | | | 22.50% | | | | 35.57% | | | | (9.07)% |
| Ratios to Average Net AssetsC | | | | | | | | | | | | | | | | | | | | |
| Expenses before expense | | | | | | | | | | | | | | | | | | | | |
| reductions | | | | 1.93% | | | | 2.74% | | | | 3.11% | | | | 2.22% | | | | 3.08% |
| Expenses net of voluntary | | | | | | | | | | | | | | | | | | | | |
| waivers, if any | | | | 1.42% | | | | 1.75% | | | | 1.75% | | | | 1.81% | | | | 1.85% |
| Expenses net of all reductions | | | | 1.37% | | | | 1.75% | | | | 1.75% | | | | 1.80% | | | | 1.83% |
| Net investment income (loss) | | | | 55% | | | | (.25)% | | | | .38% | | | | (.84)% | | | | .21% |
| Supplemental Data | | | | | | | | | | | | | | | | | | | | |
| Net assets, end of period (000 | | | | | | | | | | | | | | | | | | | | |
| omitted) | | $ | | 701 | | $ | | 309 | | $ | | 177 | | $ | | 2,127 | | $ | | 53 |
| Portfolio turnover rate | | | | 97% | | | | 77% | | | | 127% | | | | 60% | | | | 36% |
A Total returns would have been lower had certain expenses not been reduced during the periods shown.
B Calculated based on average shares outstanding during the period.
C Expense ratios reflect operating expenses of the class. Expenses before reductions do not reflect amounts reimbursed by the investment adviser or reductions from brokerage service arrangements or other expense offset arrangements and do not represent the amount paid by the class during periods when reimbursements or reductions occur. Expenses net of any voluntary waivers reflect expenses after reimbursement by the investment adviser but prior to reductions from brokerage service arrangements or other expense offset arrangements. Expenses net of all reductions repre sent the net expenses paid by the class.
See accompanying notes which are an integral part of the financial statements.
25 Annual Report
Notes to Financial Statements
For the period ended October 31, 2005
|
1. Significant Accounting Policies.
Fidelity Advisor Korea Fund (the fund) is a fund of Fidelity Advisor Series VIII (the trust) and is authorized to issue an unlimited number of shares. The trust is registered under the Investment Company Act of 1940, as amended (the 1940 Act), as an open-end management investment company organized as a Massachusetts business trust.
The fund offers Class A, Class T, Class B, Class C, and Institutional Class shares, each of which has equal rights as to assets and voting privileges. Each class has exclusive voting rights with respect to matters that affect that class. Class B shares will automatically convert to Class A shares after a holding period of seven years from the initial date of purchase. Investment income, realized and unrealized capital gains and losses, the common expenses of the fund, and certain fund-level expense reductions, if any, are allocated on a pro rata basis to each class based on the relative net assets of each class to the total net assets of the fund. Each class differs with respect to transfer agent and distribution and service plan fees incurred. Certain expense reductions also differ by class.
The fund’s investments in emerging markets can be subject to social, economic, regulatory, and political uncertainties and can be extremely volatile.
The fund may invest in affiliated money market central funds (Money Market Central Funds) which are open-end investment companies available to investment companies and other accounts managed by Fidelity Management & Research Company (FMR) and its affiliates.
The financial statements have been prepared in conformity with accounting principles generally accepted in the United States of America, which require management to make certain estimates and assumptions at the date of the financial statements. The following summarizes the significant accounting policies of the fund:
Security Valuation. Investments are valued and net asset value (NAV) per share is calculated (NAV calculation) as of the close of business of the New York Stock Exchange (NYSE), normally 4:00 p.m. Eastern time. Wherever possible,the fund uses independent pricing services approved by the Board of Trustees to value its investments.
Equity securities, including restricted securities, for which market quotations are readily available, are valued at the last reported sale price or official closing price as reported by an independent pricing service on the primary market or exchange on which they are traded. In the event there were no sales during the day or closing prices are not available, securities are valued at the last quoted bid price. Investments in open-end mutual funds, are valued at their closing net asset value each business day. Short-term securities with remaining maturities of sixty days or less for which quotations are not readily available are valued at amortized cost, which approximates value.
1. Significant Accounting Policies - continued
Security Valuation - continued
When current market prices or quotations are not readily available or do not accurately reflect fair value, valuations may be determined in accordance with procedures adopted by the Board of Trustees. For example, when developments occur between the close of a market and the close of the NYSE that may materially affect the value of some or all of the securities, or when trading in a security is halted, those securities may be fair valued.
Factors used in the determination of fair value may include monitoring news to identify significant market or security specific events such as changes in the value of U.S. securities market, reviewing developments in foreign markets and evaluating the performance of ADRs, futures contracts and exchange-traded funds. Because the fund’s utilization of fair value pricing depends on market activity, the frequency with which fair value pricing is used can not be predicted and may be utilized to a significant extent. The value of securities used for NAV calculation under fair value pricing may differ from published prices for the same securities.
Foreign Currency. The fund uses foreign currency contracts to facilitate transactions in foreign-denominated securities. Losses from these transactions may arise from changes in the value of the foreign currency or if the counterparties do not perform under the contracts’ terms.
Foreign-denominated assets, including investment securities, and liabilities are translated into U.S. dollars at the exchange rate at period end. Purchases and sales of investment securities, income and dividends received and expenses denominated in foreign currencies are translated into U.S. dollars at the exchange rate in effect on the transaction date.
The effects of exchange rate fluctuations on investments are included with the net realized and unrealized gain (loss) on investment securities. Other foreign currency transactions resulting in realized and unrealized gain (loss) are disclosed separately.
Investment Transactions and Income. Security transactions are accounted for as of trade date. Gains and losses on securities sold are determined on the basis of identified cost. Dividend income is recorded on the ex-dividend date, except for certain dividends from foreign securities where the ex-dividend date may have passed, which are recorded as soon as the fund is informed of the ex-dividend date. Non-cash dividends included in dividend income, if any, are recorded at the fair market value of the securities received. Interest income is accrued as earned. Interest income includes coupon interest and amortization of premium and accretion of discount on debt securities. Investment income is recorded net of foreign taxes withheld where recovery of such taxes is uncertain.
27 Annual Report
Notes to Financial Statements - continued
1. Significant Accounting Policies - continued
Expenses. Most expenses of the trust can be directly attributed to a fund. Expenses which cannot be directly attributed are apportioned among each fund in the trust.
Income Tax Information and Distributions to Shareholders. Each year, the fund intends to qualify as a regulated investment company by distributing all of its taxable income and realized gains under Subchapter M of the Internal Revenue Code. As a result, no provision for income taxes is required in the accompanying financial statements. Foreign taxes are provided for based on the fund’s understanding of the tax rules and rates that exist in the foreign markets in which it invests.
Distributions are recorded on the ex-dividend date. Income dividends and capital gain distributions are declared separately for each class. Income and capital gain distributions are determined in accordance with income tax regulations, which may differ from generally accepted accounting principles. In addition, the fund will claim a portion of the payment made to redeeming shareholders as a distribution for income tax purposes.
Capital accounts within the financial statements are adjusted for permanent book-tax differences. These adjustments have no impact on net assets or the results of operations. Temporary book-tax differences will reverse in a subsequent period.
Book-tax differences are primarily due to foreign currency transactions, passive foreign investment companies(PFIC), capital loss carryforwards and losses deferred due to wash sales.
The tax-basis components of distributable earnings and the federal tax cost as of period end were as follows:
| Unrealized appreciation | | $ | | 7,546,867 |
| Unrealized depreciation | | | | (623,784) |
| Net unrealized appreciation (depreciation) | | | | 6,923,083 |
| Undistributed ordinary income | | | | 51,418 |
| Capital loss carryforward | | | | (6,981,779) |
| Cost for federal income tax purposes | | $ | | 21,384,460 |
Short-Term Trading (Redemption) Fees. Shares held in the fund less than 90 days are subject to a redemption fee equal to 1.50% of the proceeds of the redeemed shares. All redemption fees, including any estimated redemption fees paid by FMR, are retained by the fund and accounted for as an addition to paid in capital.
Repurchase Agreements. FMR has received an Exemptive Order from the Securities and Exchange Commission (the SEC) which permits the fund and other affiliated entities of FMR to transfer uninvested cash balances into joint trading accounts which
2. Operating Policies - continued
Repurchase Agreements - continued
are then invested in repurchase agreements. The fund may also invest directly with institutions in repurchase agreements. Repurchase agreements are collateralized by government or non-government securities. Collateral is held in segregated accounts with custodian banks and may be obtained in the event of a default of the counterparty. The fund monitors, on a daily basis, the value of the collateral to ensure it is at least equal to the principal amount of the repurchase agreement (including accrued interest). In the event of a default by the counterparty, realization of the collateral proceeds could be delayed, during which time the value of the collateral may decline.
3. Purchases and Sales of Investments.
Purchases and sales of securities, other than short-term securities and U.S. government securities, aggregated $23,957,959 and $20,384,225, respectively.
4. Fees and Other Transactions with Affiliates.
Management Fee. FMR and its affiliates provide the fund with investment management related services for which the fund pays a monthly management fee. The management fee is the sum of an individual fund fee rate that is based on an annual rate of .55% of the fund’s average net assets and a group fee rate that averaged .27% during the period. The group fee rate is based upon the average net assets of all the mutual funds advised by FMR. The group fee rate decreases as assets under management increase and increases as assets under management decrease. For the period, the total annual management fee rate was .82% of the fund’s average net assets.
Distribution and Service Plan. In accordance with Rule 12b-1 of the 1940 Act, the fund has adopted separate Distribution and Service Plans for each class of shares. Certain classes pay Fidelity Distributors Corporation (FDC), an affiliate of FMR, separate Distribution and Service Fees, each of which is based on an annual percentage of each class’ average net assets. In addition, FDC may pay financial intermediaries for selling shares of the fund and providing shareholder support services. For the period, the Distribution and Service Fee rates and the total amounts paid to and retained by FDC were as follows:
| | | Distribution | | Service | | | | Paid to | | | | Retained |
| | | Fee | | Fee | | | | FDC | | | | by FDC |
| Class A | | 0% | | .25% | | $ | | 33,611 | | $ | | 6,967 |
| Class T | | 25% | | .25% | | | | 11,316 | | | | 8 |
| Class B | | 75% | | .25% | | | | 33,020 | | | | 24,802 |
| Class C | | 75% | | .25% | | | | 17,423 | | | | 8,312 |
| | | | | | | $ | | 95,370 | | $ | | 40,089 |
29 Annual Report
Notes to Financial Statements - continued
4. Fees and Other Transactions with Affiliates - continued
Sales Load. FDC receives a front-end sales charge of up to 5.75% for selling Class A shares, and 3.50% for selling Class T shares, some of which is paid to financial intermediaries for selling shares of the fund. FDC receives the proceeds of contingent deferred sales charges levied on Class A, Class T, Class B, and Class C redemptions. These charges depend on the holding period. The deferred sales charges range from 5% to 1% for Class B, 1% for Class C, and .25% for certain purchases of Class A and Class T shares.
| For the period, sales charge amounts retained by FDC were as follows: | | |
| | | | | Retained |
| | | | | by FDC |
| Class A | | $ | | 13,144 |
| Class T | | | | 2,507 |
| Class B* | | | | 2,771 |
| Class C* | | | | 1,909 |
| | | $ | | 20,331 |
* When Class B and Class C shares are initially sold, FDC pays commissions from its own resources to financial intermediaries through which the sales are made.
Transfer Agent Fees. Fidelity Investments Institutional Operations Company, Inc. (FIIOC), an affiliate of FMR, is the transfer, dividend disbursing and shareholder servicing agent for each class of the fund. FIIOC receives account fees and asset-based fees that vary according to the account size and type of account of the shareholders of the respective classes of the fund. FIIOC pays for typesetting, printing and mailing of shareholder reports, except proxy statements. For the period the total transfer agent fees paid by each class to FIIOC, were as follows:
| | | | | | | % of |
| | | | | | | Average |
| | | | | Amount | | Net Assets |
| Class A | | $ | | 41,094 | | .31 |
| Class T | | | | 11,662 | | .51 |
| Class B | | | | 12,645 | | .38 |
| Class C | | | | 6,582 | | .38 |
| Institutional Class | | | | 1,269 | | .27 |
| | | $ | | 73,252 | | |
Accounting Fees. Fidelity Service Company, Inc. (FSC), an affiliate of FMR, maintains the fund’s accounting records. The fee is based on the level of average net assets for the month. Affiliated Central Funds. The fund may invest in Money Market Central Funds which seek preservation of capital and current income and are managed by Fidelity Investments Money Management, Inc. (FIMM), an affiliate of FMR.
The Money Market Central Funds do not pay a management fee. Income distributions earned by the fund are recorded as income in the accompanying financial statements and totaled $14,397 for the period.
5. Committed Line of Credit.
|
The fund participates with other funds managed by FMR in a $4.2 billion credit facility (the “line of credit”) to be utilized for temporary or emergency purposes to fund shareholder redemptions or for other short-term liquidity purposes. The fund has agreed to pay commitment fees on its pro rata portion of the line of credit. During the period, there were no borrowings on this line of credit.
FMR voluntarily agreed to reimburse each class to the extent annual operating expenses exceeded certain levels of average net assets as noted in the table below. Some expenses, for example interest expense, are excluded from this reimbursement.
| The following classes were in reimbursement during the period: | | | | |
| | | Expense | | | | Reimbursement |
| | | Limitations | | | | from adviser |
| Class A | | 2.00%—1.60%* | | $ | | 75,394 |
| Class T | | 2.25%—1.85%* | | | | 17,166 |
| Class B | | 2.75%—2.35%* | | | | 20,972 |
| Class C | | 2.75%—2.35%* | | | | 10,631 |
| Institutional Class | | 1.75%—1.35%* | | | | 2,447 |
| | | | | $ | | 126,610 |
| * Expense limitation in effect at period end. | | | | | | |
Many of the brokers with whom FMR places trades on behalf of the fund provided services to the fund in addition to trade execution. These services included payments of certain expenses on behalf of the fund totaling $9,768 for the period.
The fund’s organizational documents provide former and current trustees and officers with a limited indemnification against liabilities arising in connection with the performance of their duties to the fund. In the normal course of business, the fund may also enter into contracts that provide general indemnifications. The fund’s maximum exposure under these arrangements is unknown as this would be dependent on future claims that may be made against the fund. The risk of material loss from such claims is considered remote.
31 Annual Report
Notes to Financial Statements - continued
8. Share Transactions.
Transactions for each class of shares were as follows:
| | | Shares | | | | | | Dollars |
| Years ended October 31, | | 2005 | | 2004 | | | | 2005 | | | | 2004 |
| Class A | | | | | | | | | | | | |
| Shares sold | | 315,971 | | 243,925 | | $ | | 5,103,008 | | $ | | 2,838,470 |
| Shares redeemed | | (453,614) | | (312,852) | | | | (6,594,615) | | | | (3,676,474) |
| Net increase (decrease) | | (137,643) | | (68,927) | | $ | | (1,491,607) | | $ | | (838,004) |
| Class T | | | | | | | | | | | | |
| Shares sold | | 121,022 | | 94,135 | | $ | | 1,916,252 | | $ | | 1,118,099 |
| Shares redeemed | | (39,702) | | (88,346) | | | | (581,562) | | | | (1,003,940) |
| Net increase (decrease) | | 81,320 | | 5,789 | | $ | | 1,334,690 | | $ | | 114,159 |
| Class B | | | | | | | | | | | | |
| Shares sold | | 104,588 | | 143,403 | | $ | | 1,605,843 | | $ | | 1,688,670 |
| Shares redeemed | | (39,679) | | (54,732) | | | | (574,572) | | | | (613,318) |
| Net increase (decrease) | | 64,909 | | 88,671 | | $ | | 1,031,271 | | $ | | 1,075,352 |
| Class C | | | | | | | | | | | | |
| Shares sold | | 216,863 | | 77,081 | | $ | | 3,448,329 | | $ | | 912,390 |
| Shares redeemed | | (43,585) | | (60,516) | | | | (665,109) | | | | (669,935) |
| Net increase (decrease) | | 173,278 | | 16,565 | | $ | | 2,783,220 | | $ | | 242,455 |
| Institutional Class | | | | | | | | | | | | |
| Shares sold | | 43,042 | | 62,223 | | $ | | 703,285 | | $ | | 765,799 |
| Shares redeemed | | (28,985) | | (52,454) | | | | (438,183) | | | | (644,050) |
| Net increase (decrease) | | 14,057 | | 9,769 | | $ | | 265,102 | | $ | | 121,749 |
Report of Independent Registered Public Accounting Firm
To the Trustees of Fidelity Advisor Series VIII and the Shareholders of Fidelity Advisor Korea Fund:
In our opinion, the accompanying statement of assets and liabilities, including the schedule of investments, and the related statements of operations and of changes in net assets and the financial highlights present fairly, in all material respects, the financial position of Fidelity Advisor Korea Fund (a fund of Fidelity Advisor Series VIII) at October 31, 2005 and the results of its operations, the changes in its net assets and the financial highlights for the periods indicated, in conformity with accounting principles generally accepted in the United States of America. These financial statements and financial highlights (hereafter referred to as “financial statements”) are the responsibility of the Fidelity Advisor Korea Fund’s management; our responsibility is to express an opinion on these financial statements based on our audits. We conducted our audits of these financial statements in accordance with the standards of the Public Company Accounting Oversight Board (United States). Those standards require that we plan and perform the audit to obtain reasonable assurance about whether the financial statements are free of material misstatement. An audit includes examining, on a test basis, evidence supporting the amounts and disclosures in the financial statements, assessing the accounting principles used and significant estimates made by management, and evaluating the overall financial statement presentation. We believe that our audits, which included confirmation of securities at October 31, 2005 by correspondence with the custodian and brokers, provide a reasonable basis for our opinion.
/s/ PricewaterhouseCoopers LLP
PricewaterhouseCoopers LLP
Boston, Massachusetts
December 19, 2005
|
33 Annual Report
Trustees and Officers
The Trustees, Members of the Advisory Board, and executive officers of the trust and fund, as applicable, are listed below. The Board of Trustees governs the fund and is responsible for protecting the interests of shareholders. The Trustees are experienced executives who meet periodically throughout the year to oversee the fund’s activities, review contractual arrangements with companies that provide services to the fund, and review the fund’s performance. Except for William O. McCoy, Stephen P. Jonas, and Kenneth L. Wolfe, each of the Trustees oversees 322 funds advised by FMR or an affiliate. Mr. McCoy oversees 324 funds advised by FMR or an affiliate. Mr. Jonas and Mr. Wolfe oversee 319 funds advised by FMR or an affiliate.
The Trustees hold office without limit in time except that (a) any Trustee may resign; (b) any Trustee may be removed by written instrument, signed by at least two-thirds of the number of Trustees prior to such removal; (c) any Trustee who requests to be retired or who has become incapacitated by illness or injury may be retired by written instrument signed by a majority of the other Trustees; and (d) any Trustee may be removed at any special meeting of shareholders by a two-thirds vote of the outstanding voting securities of the trust. Each Trustee who is not an interested person (as defined in the 1940 Act) (Independent Trustee), shall retire not later than the last day of the calendar year in which his or her 72nd birthday occurs. The Independent Trustees may waive this mandatory retirement age policy with respect to individual Trustees. The executive officers and Advisory Board Members hold office without limit in time, except that any officer and Advisory Board Member may resign or may be removed by a vote of a majority of the Trustees at any regular meeting or any special meeting of the Trustees. Except as indicated, each individual has held the office shown or other offices in the same company for the past five years.
The fund’s Statement of Additional Information (SAI) includes more information about the Trustees. To request a free copy, call Fidelity at 1-877-208-0098.
Interested Trustees*:
Correspondence intended for each Trustee who is an interested person may be sent to Fidelity Investments, 82 Devonshire Street, Boston, Massachusetts 02109.
| Name, Age; Principal Occupation |
| |
| Edward C. Johnson 3d (75)** |
| |
| Year of Election or Appointment: 1983 |
| Mr. Johnson is Chairman of the Board of Trustees. Mr. Johnson serves as |
| Chief Executive Officer, Chairman, and a Director of FMR Corp.; a |
| Director and Chairman of the Board and of the Executive Committee of |
| FMR; Chairman and a Director of Fidelity Management & Research (Far |
| East) Inc.; Chairman and a Director of Fidelity Investments Money Man- |
| agement, Inc.; and Chairman (2001-present) and a Director |
| (2000-present) of FMR Co., Inc. |
Annual Report 34
| Name, Age; Principal Occupation |
| |
| Abigail P. Johnson (43)** |
| |
| Year of Election or Appointment: 2001 |
| Ms. Johnson serves as President of Fidelity Employer Services Company |
| (FESCO) (2005-present). She is President and a Director of Fidelity In- |
| vestments Money Management, Inc. (2001-present), FMR Co., Inc. |
| (2001-present), and a Director of FMR Corp. Previously, Ms. Johnson |
| served as President and a Director of FMR (2001-2005), Senior Vice |
| President of the Fidelity funds (2001-2005), and managed a number of |
| Fidelity funds. |
| |
| Stephen P. Jonas (52) |
| |
| Year of Election or Appointment: 2005 |
| Mr. Jonas is Senior Vice President of Advisor Korea. He also serves as |
| Senior Vice President of other Fidelity funds (2005-present). Mr. Jonas is |
| Executive Director of FMR (2005-present). Previously, Mr. Jonas served |
| as President of Fidelity Enterprise Operations and Risk Services |
| (2004-2005), Chief Administrative Officer (2002-2004), and Chief |
| Financial Officer of FMR Co. (1998-2000). Mr. Jonas has been with |
| Fidelity Investments since 1987 and has held various financial and man- |
| agement positions including Chief Financial Officer of FMR. In addition, |
| he serves on the Boards of Boston Ballet (2003-present) and Simmons |
| College (2003-present). |
| |
| Robert L. Reynolds (53) |
| |
| Year of Election or Appointment: 2003 |
| Mr. Reynolds is a Director (2003-present) and Chief Operating Officer |
| (2002-present) of FMR Corp. He also serves on the Board at Fidelity |
| Investments Canada, Ltd. (2000-present). Previously, Mr. Reynolds |
| served as President of Fidelity Investments Institutional Retirement Group |
| (1996-2000). |
* Trustees have been determined to be “Interested Trustees” by virtue of, among other things, their affiliation with the trust or various entities under common control with FMR.
** Edward C. Johnson 3d, Trustee, is Abigail P. Johnson’s father.
35 Annual Report
Trustees and Officers - continued
Independent Trustees:
Correspondence intended for each Independent Trustee (that is, the Trustees other than the Interested Trustees) may be sent to Fidelity Investments, P.O. Box 55235, Boston, Massachusetts 02205-5235.
| Name, Age; Principal Occupation |
| |
| Dennis J. Dirks (57) |
| |
| Year of Election or Appointment: 2005 |
| Prior to his retirement in May 2003, Mr. Dirks was Chief Operating |
| Officer and a member of the Board of The Depository Trust & Clearing |
| Corporation (DTCC) (1999-2003). He also served as President, Chief |
| Operating Officer, and Board member of The Depository Trust |
| Company (DTC) (1999-2003) and President and Board member of the |
| National Securities Clearing Corporation (NSCC) (1999-2003). In addi- |
| tion, Mr. Dirks served as Chief Executive Officer and Board member of |
| the Government Securities Clearing Corporation (2001-2003) and Chief |
| Executive Officer and Board member of the Mortgage-Backed Securities |
| Clearing Corporation (2001-2003). Mr. Dirks also serves as a Trustee of |
| Manhattan College (2005-present). |
| |
| Robert M. Gates (62) |
| |
| Year of Election or Appointment: 1997 |
| Dr. Gates is Vice Chairman of the Independent Trustees (2005-present). |
| Dr. Gates is President of Texas A&M University (2002-present). He was |
| Director of the Central Intelligence Agency (CIA) from 1991 to 1993. |
| From 1989 to 1991, Dr. Gates served as Assistant to the President of |
| the United States and Deputy National Security Advisor. Dr. Gates is a |
| Director of NACCO Industries, Inc. (mining and manufacturing), Parker |
| Drilling Co., Inc. (drilling and rental tools for the energy industry, |
| 2001-present), and Brinker International (restaurant management, |
| 2003-present). Previously, Dr. Gates served as a Director of LucasVarity |
| PLC (automotive components and diesel engines), a Director of TRW Inc. |
| (automotive, space, defense, and information technology), and Dean of |
| the George Bush School of Government and Public Service at Texas |
| A&M University (1999-2001). Dr. Gates also is a Trustee of the Forum |
| for International Policy. |
Annual Report 36
| Name, Age; Principal Occupation |
| |
| George H. Heilmeier (69) |
| |
| Year of Election or Appointment: 2004 |
| Dr. Heilmeier is Chairman Emeritus of Telcordia Technologies (commu- |
| nication software and systems), where prior to his retirement, he served |
| as company Chairman and Chief Executive Officer. He currently serves |
| on the Boards of Directors of The Mitre Corporation (systems engineer- |
| ing and information technology support for the government), and HRL |
| Laboratories (private research and development, 2004-present). He is |
| Chairman of the General Motors Science & Technology Advisory Board |
| and a Life Fellow of the Institute of Electrical and Electronics Engineers |
| (IEEE) (2000-present). Dr. Heilmeier is a member of the Defense Science |
| Board and the National Security Agency Advisory Board. He is also a |
| member of the National Academy of Engineering, the American Aca- |
| demy of Arts and Sciences, and the Board of Overseers of the School of |
| Engineering and Applied Science of the University of Pennsylvania. Pre- |
| viously, Dr. Heilmeier served as a Director of TRW Inc. (automotive, |
| space, defense, and information technology, 1992-2002), Compaq |
| (1994-2002), Automatic Data Processing, Inc. (ADP) (technology-based |
| business outsourcing, 1995-2002), INET Technologies Inc. (telecommu- |
| nications network surveillance, 2001-2004), and Teletech Holdings (cus- |
| tomer management services). He is the recipient of the 2005 Kyoto Prize |
| in Advanced Technology for his invention of the liquid display. |
| |
| Marie L. Knowles (59) |
| |
| Year of Election or Appointment: 2001 |
| Prior to Ms. Knowles’ retirement in June 2000, she served as Executive |
| Vice President and Chief Financial Officer of Atlantic Richfield Company |
| (ARCO) (diversified energy, 1996-2000). From 1993 to 1996, she was |
| a Senior Vice President of ARCO and President of ARCO Transportation |
| Company. She served as a Director of ARCO from 1996 to 1998. She |
| currently serves as a Director of Phelps Dodge Corporation (copper |
| mining and manufacturing) and McKesson Corporation (healthcare ser- |
| vice, 2002-present). Ms. Knowles is a Trustee of the Brookings Institution |
| and the Catalina Island Conservancy and also serves as a member of |
| the Advisory Board for the School of Engineering of the University of |
| Southern California. |
37 Annual Report
Trustees and Officers - continued
| Name, Age; Principal Occupation |
| |
| Ned C. Lautenbach (61) |
| |
| Year of Election or Appointment: 2000 |
| Mr. Lautenbach has been a partner of Clayton, Dubilier & Rice, Inc. |
| (private equity investment firm) since September 1998. Previously, Mr. |
| Lautenbach was with the International Business Machines Corporation |
| (IBM) from 1968 until his retirement in 1998. Mr. Lautenbach serves as |
| a Director of Italtel Holding S.p.A. (telecommunications (Milan, Italy), |
| 2004-present) and Eaton Corporation (diversified industrial) as well as |
| the Philharmonic Center for the Arts in Naples, Florida. He also is a |
| member of the Board of Trustees of Fairfield University (2005-present), |
| as well as a member of the Council on Foreign Relations. |
| |
| Marvin L. Mann (72) |
| |
| Year of Election or Appointment: 1993 |
| Mr. Mann is Chairman of the Independent Trustees (2001-present). He is |
| Chairman Emeritus of Lexmark International, Inc. (computer |
| peripherals), where he served as CEO until April 1998, retired as |
| Chairman May 1999, and remains a member of the Board. Prior to |
| 1991, he held the positions of Vice President of International Business |
| Machines Corporation (IBM) and President and General Manager of |
| various IBM divisions and subsidiaries. He is a member of the Executive |
| Committee of the Independent Director’s Council of the Investment Com- |
| pany Institute. In addition, Mr. Mann is a member of the President’s |
| Cabinet at the University of Alabama and the Board of Visitors of the |
| Culverhouse College of Commerce and Business Administration at the |
| University of Alabama. |
| |
| William O. McCoy (72) |
| |
| Year of Election or Appointment: 1997 |
| Prior to his retirement in December 1994, Mr. McCoy was Vice Chair- |
| man of the Board of BellSouth Corporation (telecommunications) and |
| President of BellSouth Enterprises. He is currently a Director of Liberty |
| Corporation (holding company), Duke Realty Corporation (real estate), |
| and Progress Energy, Inc. (electric utility). He is also a partner of Frank- |
| lin Street Partners (private investment management firm) and a member |
| of the Research Triangle Foundation Board. In addition, Mr. McCoy |
| served as the Interim Chancellor (1999-2000) and a member of the |
| Board of Visitors for the University of North Carolina at Chapel Hill and |
| currently serves on the Board of Directors of the University of North |
| Carolina Health Care System and the Board of Visitors of the Kenan- |
| Flagler Business School (University of North Carolina at Chapel Hill). He |
| also served as Vice President of Finance for the University of North |
| Carolina (16-school system). |
Annual Report 38
| Name, Age; Principal Occupation |
| |
| Cornelia M. Small (61) |
| |
| Year of Election or Appointment: 2005 |
| Ms. Small is a member (2000-present) and Chairperson (2002-present) |
| of the Investment Committee, and a member (2002-present) of the |
| Board of Trustees of Smith College. Previously, she served as Chief In- |
| vestment Officer (1999-2000), Director of Global Equity Investments |
| (1996-1999), and a member of the Board of Directors of Scudder, |
| Stevens & Clark (1990-1997) and Scudder Kemper Investments |
| (1997-1998). In addition, Ms. Small served as Co-Chair (2000-2003) |
| of the Annual Fund for the Fletcher School of Law and Diplomacy. |
| |
| William S. Stavropoulos (66) |
| |
| Year of Election or Appointment: 2002 |
| Mr. Stavropoulos is Chairman of the Board (2000-present) and a Mem- |
| ber of the Board of Directors of The Dow Chemical Company. Since |
| joining The Dow Chemical Company in 1967, Mr. Stavropoulos served |
| in numerous senior management positions, including President |
| (1993-2000; 2002-2003), CEO (1995-2000; 2002-2004), and Chair- |
| man of the Executive Committee (2000-2004). Currently, he is a Direc- |
| tor of NCR Corporation (data warehousing and technology solutions), |
| BellSouth Corporation (telecommunications), Chemical Financial Corpo- |
| ration, Maersk Inc. (industrial conglomerate, 2002-present), and Metal- |
| mark Capital (private equity investment firm, 2005-present). He also |
| serves as a member of the Board of Trustees of the American Enterprise |
| Institute for Public Policy Research. In addition, Mr. Stavropoulos is a |
| member of The Business Council, J.P. Morgan International Council and |
| the University of Notre Dame Advisory Council for the College of |
| Science. |
| |
| Kenneth L. Wolfe (66) |
| |
| Year of Election or Appointment: 2005 |
| Mr. Wolfe also serves as a Trustee (2005-present) or Member of the |
| Advisory Board (2004-present) of other investment companies advised |
| by FMR. Prior to his retirement in 2001, Mr. Wolfe was Chairman and |
| Chief Executive Officer of Hershey Foods Corporation (1993-2001). He |
| currently serves as a member of the boards of Adelphia Communica- |
| tions Corporation (2003-present), Bausch & Lomb, Inc., and Revlon Inc. |
| (2004-present). |
39 Annual Report
Trustees and Officers - continued
Advisory Board Members and Executive Officers:
Correspondence intended for Mr. Gamper may be sent to Fidelity Investments, P.O. Box 55235, Boston, Massachusetts 02205-5235. Correspondence intended for each executive officer and Mr. Lynch may be sent to Fidelity Investments, 82 Devonshire Street, Boston, Massachusetts 02109.
| Name, Age; Principal Occupation |
| |
| Albert R. Gamper, Jr. (63) |
| |
| Year of Election or Appointment: 2005 |
| Member of the Advisory Board of Fidelity Advisor Series VIII. Prior to his |
| retirement in December 2004, Mr. Gamper served as Chairman of the |
| Board of CIT Group Inc. (commercial finance). During his tenure with |
| CIT Group Inc. Mr. Gamper served in numerous senior management |
| positions, including Chairman (1987-1989; 1999-2001; 2002-2004), |
| Chief Executive Officer (1987-2004), and President (1989-2002). He |
| currently serves as a member of the Board of Directors of Public Service |
| Enterprise Group (utilities, 2001-present), Chairman of the Board of |
| Governors, Rutgers University (2004-present), and Chairman of the |
| Board of Saint Barnabas Health Care System. |
| |
| Peter S. Lynch (61) |
| |
| Year of Election or Appointment: 2003 |
| Member of the Advisory Board of Fidelity Advisor Series VIII. Vice |
| Chairman and a Director of FMR, and Vice Chairman (2001-present) |
| and a Director (2000-present) of FMR Co., Inc. Previously, Mr. Lynch |
| served as a Trustee of the Fidelity funds (1990-2003). In addition, he |
| serves as a Trustee of Boston College, Massachusetts Eye & Ear |
| Infirmary, Historic Deerfield, John F. Kennedy Library, and the Museum |
| of Fine Arts of Boston. |
| |
| Dwight D. Churchill (51) |
| |
| Year of Election or Appointment: 2005 |
| Vice President of Advisor Korea. Mr. Churchill also serves as Vice Presi- |
| dent of certain Equity Funds (2005-present) and certain High Income |
| Funds (2005-present). Previously, he served as Head of Fidelity’s Fixed- |
| Income Division (2000-2005), Vice President of Fidelity’s Money Market |
| Funds (2000-2005), Vice President of Fidelity’s Bond Funds, and Senior |
| Vice President of FIMM (2000) and FMR. Mr. Churchill joined Fidelity in |
| 1993 as Vice President and Group Leader of Taxable Fixed-Income |
| Investments. |
Annual Report 40
| Name, Age; Principal Occupation |
| |
| Eric D. Roiter (56) |
| |
| Year of Election or Appointment: 1998 |
| Secretary of Advisor Korea. He also serves as Secretary of other Fidelity |
| funds; Vice President, General Counsel, and Secretary of FMR Co., Inc. |
| (2001-present) and FMR; Assistant Secretary of Fidelity Management & |
| Research (U.K.) Inc. (2001-present), Fidelity Management & Research |
| (Far East) Inc. (2001-present), and Fidelity Investments Money Manage- |
| ment, Inc. (2001-present). Mr. Roiter is an Adjunct Member, Faculty of |
| Law, at Boston College Law School (2003-present). Previously, Mr. Roiter |
| served as Vice President and Secretary of Fidelity Distributors Corpora- |
| tion (FDC) (1998-2005). |
| |
| Stuart Fross (46) |
| |
| Year of Election or Appointment: 2003 |
| Assistant Secretary of Advisor Korea. Mr. Fross also serves as Assistant |
| Secretary of other Fidelity funds (2003-present), Vice President and Sec- |
| retary of FDC (2005-present), and is an employee of FMR. |
| |
| Christine Reynolds (47) |
| |
| Year of Election or Appointment: 2004 |
| President, Treasurer, and Anti-Money Laundering (AML) officer of Advi- |
| sor Korea. Ms. Reynolds also serves as President, Treasurer, and AML |
| officer of other Fidelity funds (2004) and is a Vice President (2003) and |
| an employee (2002) of FMR. Before joining Fidelity Investments, Ms. |
| Reynolds worked at PricewaterhouseCoopers LLP (PwC) (1980-2002), |
| where she was most recently an audit partner with PwC’s investment |
| management practice. |
| |
| Paul M. Murphy (58) |
| |
| Year of Election or Appointment: 2005 |
| Chief Financial Officer of Advisor Korea. Mr. Murphy also serves as |
| Chief Financial Officer of other Fidelity funds (2005-present). He also |
| serves as Senior Vice President of Fidelity Pricing and Cash Manage- |
| ment Services Group (FPCMS). |
| |
| Kenneth A. Rathgeber (58) |
| |
| Year of Election or Appointment: 2004 |
| Chief Compliance Officer of Advisor Korea. Mr. Rathgeber also serves |
| as Chief Compliance Officer of other Fidelity funds (2004) and Execu- |
| tive Vice President of Risk Oversight for Fidelity Investments (2002). |
| Previously, he served as Executive Vice President and Chief Operating |
| Officer for Fidelity Investments Institutional Services Company, Inc. |
| (1998-2002). |
41 Annual Report
Trustees and Officers - continued
| Name, Age; Principal Occupation |
| |
| John R. Hebble (47) |
| |
| Year of Election or Appointment: 2003 |
| Deputy Treasurer of Advisor Korea. Mr. Hebble also serves as Deputy |
| Treasurer of other Fidelity funds (2003), and is an employee of FMR. |
| Before joining Fidelity Investments, Mr. Hebble worked at Deutsche Asset |
| Management where he served as Director of Fund Accounting |
| (2002-2003) and Assistant Treasurer of the Scudder Funds |
| (1998-2003). |
| |
| Bryan A. Mehrmann (44) |
| |
| Year of Election or Appointment: 2005 |
| Deputy Treasurer of Advisor Korea. Mr. Mehrmann also serves as |
| Deputy Treasurer of other Fidelity funds (2005-present) and is an em- |
| ployee of FMR. Previously, Mr. Mehrmann served as Vice President of |
| Fidelity Investments Institutional Services Group (FIIS)/Fidelity Investments |
| Institutional Operations Corporation, Inc. (FIIOC) Client Services |
| (1998-2004). |
| |
| Kimberley H. Monasterio (41) |
| |
| Year of Election or Appointment: 2004 |
| Deputy Treasurer of Advisor Korea. Ms. Monasterio also serves as Dep- |
| uty Treasurer of other Fidelity funds (2004) and is an employee of FMR |
| (2004). Before joining Fidelity Investments, Ms. Monasterio served as |
| Treasurer (2000-2004) and Chief Financial Officer (2002-2004) of the |
| Franklin Templeton Funds and Senior Vice President of Franklin Temple- |
| ton Services, LLC (2000-2004). |
| |
| Kenneth B. Robins (36) |
| |
| Year of Election or Appointment:2005 |
| Deputy Treasurer of Advisor Korea. Mr. Robins also serves as Deputy |
| Treasurer of other Fidelity funds (2005-present) and is an employee of |
| FMR (2004-present). Before joining Fidelity Investments, Mr. Robins |
| worked at KPMG LLP, where he was a partner in KPMG’s department of |
| professional practice (2002-2004) and a Senior Manager |
| (1999-2000). In addition, Mr. Robins served as Assistant Chief Accoun- |
| tant, United States Securities and Exchange Commission (2000-2002). |
| |
| Robert G. Byrnes (38) |
| |
| Year of Election or Appointment: 2005 |
| Assistant Treasurer of Advisor Korea. Mr. Byrnes also serves as Assistant |
| Treasurer of other Fidelity funds (2005-present) and is an employee of |
| FMR (2005-present). Previously, Mr. Byrnes served as Vice President of |
| FPCMS (2003-2005). Before joining Fidelity Investments, Mr. Byrnes |
| worked at Deutsche Asset Management where he served as Vice Presi- |
| dent of the Investment Operations Group (2000-2003). |
Annual Report 42
| Name, Age; Principal Occupation |
| |
| John H. Costello (59) |
| |
| Year of Election or Appointment: 1986 |
| Assistant Treasurer of Advisor Korea. Mr. Costello also serves as Assis- |
| tant Treasurer of other Fidelity funds and is an employee of FMR. |
| |
| Peter L. Lydecker (51) |
| |
| Year of Election or Appointment: 2004 |
| Assistant Treasurer of Advisor Korea. Mr. Lydecker also serves as Assis- |
| tant Treasurer of other Fidelity funds (2004) and is an employee of FMR. |
| |
| Mark Osterheld (50) |
| |
| Year of Election or Appointment: 2002 |
| Assistant Treasurer of Advisor Korea. Mr. Osterheld also serves as Assis- |
| tant Treasurer of other Fidelity funds (2002) and is an employee of FMR. |
| |
| Gary W. Ryan (47) |
| |
| Year of Election or Appointment: 2005 |
| Assistant Treasurer of Advisor Korea. Mr. Ryan also serves as Assistant |
| Treasurer of other Fidelity funds (2005-present) and is an employee of |
| FMR (2005-present). Previously, Mr. Ryan served as Vice President of |
| Fund Reporting in FPCMS (1999-2005). |
| |
| Salvatore Schiavone (39) |
| |
| Year of Election or Appointment: 2005 |
| Assistant Treasurer of Advisor Korea. Mr. Schiavone also serves as As- |
| sistant Treasurer of other Fidelity funds (2005-present) and is an em- |
| ployee of FMR (2005-present). Before joining Fidelity Investments, Mr. |
| Schiavone worked at Deutsche Asset Management, where he most re- |
| cently served as Assistant Treasurer (2003-2005) of the Scudder Funds |
| and Vice President and Head of Fund Reporting (1996-2003). |
43 Annual Report
The Board of Trustees of Advisor Korea Fund voted to pay to shareholders of record at the opening of business on record date, the following distributions per share derived from capital gains realized from sales of portfolio securities, and dividends derived from net investment income:
| | | Pay Date | | Record Date | | Dividends | | Capital Gains |
| Class A | | 12/5/05 | | 12/2/05 | | $.02 | | $.03 |
| Class T | | 12/5/05 | | 12/2/05 | | $— | | $.022 |
| Class C | | 12/5/05 | | 12/2/05 | | $— | | $.005 |
The fund will notify shareholders in January 2006 of amounts for use in preparing 2005 income tax returns.
Board Approval of Investment Advisory Contracts and Management Fees
Advisor Korea Fund
Each year, typically in July, the Board of Trustees, including the independent Trustees (together, the Board), votes on the renewal of the management contract and sub-advisory agreements (together, the Advisory Contracts) for the fund. The Board, assisted by the advice of fund counsel and independent Trustees’ counsel, requests and considers a broad range of information throughout the year.
The Board meets regularly each month except August and takes into account throughout the year matters bearing on Advisory Contracts. The Board, acting directly and through its separate committees, considers at each of its meetings factors that are relevant to the annual renewal of the fund’s Advisory Contracts, including the services and support provided to the fund and its shareholders by Fidelity. At the time of the renewal, the Board had 11 standing committees, each composed of independent Trustees with varying backgrounds, to which the Board has assigned specific subject matter responsibilities in order to enhance effective decision-making by the Board. Each committee has adopted a written charter outlining the structure and purposes of the committee. One such committee, the Equity Contract Committee, meets periodically during the first six months of each year and as necessary to consider matters specifically related to the annual renewal of Advisory Contracts. The committee requests and receives information on, and makes recommendations to the independent Trustees concerning, the approval and annual review of the Advisory Contracts.
At its July 2005 meeting, the Board of Trustees, including the independent Trustees, unanimously determined to renew the Advisory Contracts for the fund. In reaching its determination, the Board considered all factors it believed relevant, including (1) the nature, extent, and quality of the services to be provided to the fund and its shareholders by Fidelity (including the investment performance of the fund); (2) the competitiveness of the management fee and total expenses of the fund; (3) the total costs of the services to be provided by and the profits to be realized by the investment adviser and its affiliates from the relationship with the fund; (4) the extent to which economies of scale would be realized as the fund grows; and (5) whether fee levels reflect these economies of scale, if any, for the benefit of fund shareholders.
In determining whether to renew the Advisory Contracts for the fund, the Board ultimately reached a determination, with the assistance of fund counsel and independent Trustees’ counsel, that the renewal of the Advisory Contracts and the compensation to be received by Fidelity under the management contract is consistent with Fidelity’s fiduciary duty under applicable law. In addition to evaluating the specific factors noted above, the Board, in reaching its determination, is aware that shareholders in the fund have a broad range of investment choices available to them, including a wide choice among mutual funds offered by competitors to Fidelity, and that the fund’s shareholders, with the opportunity to review and weigh the disclosure provided by the fund in its
45 Annual Report
Board Approval of Investment Advisory Contracts and Management Fees - continued
prospectus and other public disclosures, have chosen to invest in this fund, managed by Fidelity.
Nature, Extent, and Quality of Services Provided by Fidelity. The Board considered staffing within the investment adviser, FMR, and the sub-advisers (together, the Investment Advisers), including the background of the fund’s portfolio manager and the fund’s investment objective and discipline. The independent Trustees also had discussions with senior management of Fidelity’s investment operations and investment groups. The Board considered the structure of the portfolio manager compensation program and whether this structure provides appropriate incentives.
Fidelity Resources Dedicated to Investment Management and Support Services. The Board reviewed the size, education, and experience of the Investment Advisers’ investment staff, their use of technology, and the Investment Advisers’ approach to recruiting, training, and retaining portfolio managers and other research, advisory, and management personnel. The Board considered Fidelity’s extensive global research capabilities that enable the Investment Advisers to aggregate data from various sources in an effort to produce positive investment results. The Board noted that Fidelity’s analysts have access to a variety of technological tools that enable them to perform both fundamental and quantitative analysis and to specialize in various disciplines. The Board also considered that Fidelity’s portfolio managers and analysts have access to daily portfolio attribution that allows for monitoring of a fund’s portfolio, as well as an electronic communication system that provides immediate real-time access to research concerning issuers and credit enhancers.
Shareholder and Administrative Services. The Board considered the nature, extent, quality, and cost of administrative, distribution, and shareholder services performed by the Investment Advisers and their affiliates under the Advisory Contracts and under separate agreements covering transfer agency, pricing and bookkeeping, and securities lending services for the fund. The Board also considered the nature and extent of the Investment Advisers’ supervision of third party service providers, principally custodians and subcustodians. The Board reviewed the allocation of fund brokerage, including allocations to brokers affiliated with the Investment Advisers, the use of brokerage commissions to pay fund expenses, and the use of “soft” commission dollars to pay for research services. The Board also considered that Fidelity voluntarily decided in 2004 to stop using “soft” commission dollars to pay for market data and, instead, to pay for that data out of its own resources. The Board also considered the resources devoted to, and the record of compliance with, the fund’s compliance policies and procedures.
The Board noted that the growth of fund assets across the complex allows Fidelity to reinvest in the development of services designed to enhance the value or convenience of the Fidelity funds as investment vehicles. These services include 24-hour access to
account information and market information through phone representatives and over the Internet, and investor education materials and asset allocation tools.
Investment in a Large Fund Family. The Board considered the benefits to shareholders of investing in a Fidelity fund, including the benefits of investing in a fund that is part of a large family of funds offering a variety of investment disciplines and providing for a large variety of mutual fund investor services. For example, fund shareholders are offered the privilege of exchanging shares of the fund for shares of other Fidelity funds, as set forth in the fund’s prospectus, without paying an additional sales charge. The Board noted that, since the last Advisory Contract renewals in July 2004, Fidelity has taken a number of actions that benefited particular funds, including (i) voluntarily deciding in 2004 to stop using “soft” commission dollars to pay for market data and, instead, to pay for that data out of its own resources, (ii) contractually agreeing to impose management fee reductions and expense limitations on its five Spartan stock index funds and its stock index fund available through variable insurance products, (iii) contractually agreeing to eliminate the management fees on the Fidelity Freedom Funds and the Fidelity Advisor Freedom Funds, (iv) contractually agreeing to reduce the management fees on most of its investment-grade taxable bond funds, and (v) contractually agreeing to impose expense limitations on its retail and Spartan investment-grade taxable bond funds.
Investment Performance and Compliance. The Board considered whether the fund has operated within its investment objective, as well as its record of compliance with its investment restrictions. It also reviewed the fund’s absolute investment performance for each class, as well as the fund’s relative investment performance for each class measured against (i) a broad-based securities market index, and (ii) a peer group of mutual funds over multiple periods. Because the fund had been in existence less than five calendar years, the following charts considered by the Board show, over the one- and three-year periods ended December 31, 2004, the returns of Class C and Institutional Class of the fund, the returns of a broad-based securities market index (“benchmark”), and a range of returns of a peer group of mutual funds identified by Lipper Inc. as having an investment objective similar to that of the fund. The returns of Class C and Institutional Class represent the performance of classes with the highest and lowest 12b-1 fees, respectively (not necessarily with the highest and lowest total expenses). The box within each chart shows the 25th percentile return (bottom of box) and the 75th percentile return (top of box) of the Lipper peer group. Returns shown above the box are in the first quartile and returns shown below the box are in the fourth quartile. The percentage beaten numbers noted below each chart correspond to the percentile box and represent the percentage of funds in the Lipper peer group whose performance was equal to or lower than that of the class indicated.
47 Annual Report
Board Approval of Investment Advisory Contracts and Management Fees - continued
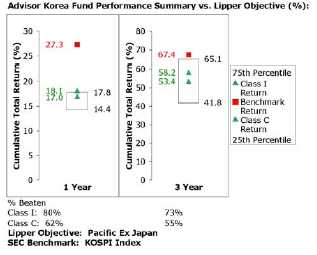
The Board reviewed the fund’s relative investment performance against its Lipper peer group and stated that the performance of Institutional Class of the fund was in the first quartile for the one-year period and the second quartile for the three-year period. The Board noted that FMR does not consider that Lipper peer group to be a meaningful comparison for the fund, however, because unlike many of its Lipper peers, the fund focuses its investments on securities of Korean issuers. The Board also stated that the relative investment performance of the fund was lower than its benchmark over time. The Board considered that the variations in performance among the fund’s classes reflect the variations in class expenses, which result in lower performance for higher expense classes.
The Board has had thorough discussions with FMR throughout the year about the Board’s and FMR’s concerns about equity research, equity fund performance, and compliance with internal policies governing gifts and entertainment. FMR has taken steps that it believes will refocus and strengthen equity research and equity portfolio management and compliance. The Board noted with favor FMR’s recent reorganization of its senior management team and FMR’s plans to dedicate additional resources to investment research, and participated in the process that led to those changes.
Based on its review, and giving particular weight to the nature and quality of the resources dedicated by the Investment Advisers to maintain and improve relative performance, the Board concluded that the nature, extent, and quality of the services provided by Fidelity will benefit the fund’s shareholders, particularly in light of the Board’s view that the fund’s shareholders benefit from investing in a fund that is part of a large family of funds offering a variety of investment disciplines and services.
Competitiveness of Management Fee and Total Fund Expenses. The Board considered the fund’s management fee and total expenses compared to “mapped groups” of competitive funds and classes. Fidelity creates “mapped groups” by combining similar Lipper investment objective categories that have comparable management fee characteristics. Combining Lipper investment objective categories aids the Board’s management fee and total expense comparisons by broadening the competitive group used for comparison and by reducing the number of universes to which various Fidelity funds are compared.
The Board considered two proprietary management fee comparisons for the 12-month periods shown in the chart below. The group of Lipper funds used by the Board for management fee comparisons is referred to below as the “Total Mapped Group” and, for the reasons explained above, is broader than the Lipper peer group used by the Board for performance comparisons. The Total Mapped Group comparison focuses on a fund’s standing relative to the total universe of comparable funds available to investors, in terms of gross management fees before expense reimbursements or caps. “TMG %” represents the percentage of funds in the Total Mapped Group that had management fees that were lower than the fund’s. For example, a TMG % of 25% means that 75% of the funds in the Total Mapped Group had higher management fees than the fund. The “Asset-Size Peer Group” (ASPG) comparison focuses on a fund’s standing relative to non-Fidelity funds similar in size to the fund within the Total Mapped Group. The ASPG represents at least 15% of the funds in the Total Mapped Group with comparable asset size and management fee characteristics, subject to a minimum of 50 funds (or all funds in the Total Mapped Group if fewer than 50). Additional information, such as the ASPG quartile (“quadrant”) in which the fund’s management fee ranked, is also included in the chart and considered by the Board.
49 Annual Report
Board Approval of Investment Advisory Contracts and Management Fees - continued
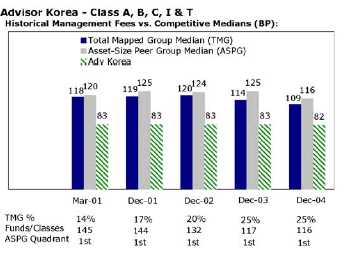
The Board noted that the fund’s management fee ranked below the median of its Total Mapped Group and below the median of its ASPG for 2004.
Based on its review, the Board concluded that the fund’s management fee was fair and reasonable in light of the services that the fund receives and the other factors considered.
In its review of each class’s total expenses, the Board considered the fund’s management fee as well as other fund or class expenses, as applicable, such as transfer agent fees, pricing and bookkeeping fees, fund-paid 12b-1 fees, and custodial, legal, and audit fees. The Board also noted the effects of any waivers and reimbursements on fees and expenses. As part of its review, the Board also considered current and historical total expenses of each class of the fund compared to competitive fund median expenses. Each class of the fund is compared to those funds and classes in the Total Mapped Group (used by the Board for management fee comparisons) that have a similar sales load structure.
The Board noted that the total expenses of Class A ranked below its competitive median for 2004, the total expenses of each of Class B and Class C ranked equal to its competitive median for 2004, and the total expenses of each of Class T and Institutional Class ranked above its competitive median for 2004. The Board noted that the fund offers multiple classes, each of which has a different sales load and 12b-1 fee structure, and that the multiple structures are intended to offer a range of pricing options for the intermediary market. The Board also noted that the total expenses of the classes vary primarily by the level of their 12b-1 fees, although differences in transfer agent fees may also cause expenses to vary from class to class.
Furthermore, the Board considered that on December 16, 2004, it had approved changes (effective January 1, 2005) in the transfer agent and service agreements for the fund that established maximum transfer agent fees and eliminated the minimum pricing and bookkeeping fee to prevent small funds or funds with small average account sizes from having relatively high fees in basis points (the “small-fund fee reductions”). The Board considered that, if the small-fund fee reductions had been in effect in 2004, the total expenses of each of Class T and Institutional Class would have ranked below the median.
In its review of total expenses, the Board also considered Fidelity fee structures and other information on clients that FMR and its affiliates service in other competitive markets, such as other mutual funds advised or subadvised by FMR or its affiliates, pension plan clients, and other institutional clients.
Based on its review, the Board concluded that the total expenses for each class of the fund were reasonable, although in some cases above the median of the universe presented for comparison, in light of the services that the fund and its shareholders receive and the other factors considered.
Costs of the Services and Profitability. The Board considered the revenues earned and the expenses incurred by Fidelity in conducting the business of developing, marketing, distributing, managing, administering and servicing the fund and its shareholders. The Board also considered the level of Fidelity’s profits in respect of all the Fidelity funds.
On an annual basis, FMR presents to the Board Fidelity’s profitability for the fund. Fidelity calculates the profitability for each fund, as well as aggregate profitability for groups of Fidelity funds and all Fidelity funds, using a series of detailed revenue and cost allocation methodologies which originate with the audited books and records of Fidelity. The Audit Committee of the Board reviews any significant changes from the prior year’s methodologies.
PricewaterhouseCoopers LLP (PwC), independent registered accounting firm and auditor to Fidelity and certain Fidelity funds, has been engaged annually by the Board as part of the Board’s assessment of the results of Fidelity’s profitability analysis. PwC’s engagement includes the review and assessment of Fidelity’s methodologies used in determining the revenues and expenses attributable to Fidelity’s mutual fund business, and completion of agreed-upon procedures surrounding the mathematical accuracy of fund profitability and its conformity to allocation methodologies. After considering PwC’s reports issued under the engagement and information provided by Fidelity, the Board believes that while other allocation methods may also be reasonable, Fidelity’s profitability methodologies are reasonable in all material respects.
The Board has also reviewed Fidelity’s non-fund businesses and any fall-out benefits related to the mutual fund business as well as cases where Fidelity’s affiliates may
51 Annual Report
Board Approval of Investment Advisory Contracts and Management Fees - continued
benefit from or be related to the fund’s business. In addition, a special committee of the Board reviewed services provided to Fidelity by its affiliates and determined that the fees that Fidelity paid for such services were reasonable.
The Board considered the costs of the services provided by and the profits realized by Fidelity in connection with the operation of the fund and determined that the amount of profit is a fair entrepreneurial profit for the management of the fund.
Economies of Scale. The Board considered whether there have been economies of scale in respect of the management of the Fidelity funds, whether the Fidelity funds (including the fund) have appropriately benefited from any such economies of scale, and whether there is potential for realization of any further economies of scale. The Board considered the extent to which the fund will benefit from economies of scale through increased services to the fund, through waivers or reimbursements, or through fee or expense reductions, including reductions that occur through operation of the transfer agent agreement. The transfer agent fee varies in part based on the number of accounts in the fund. If the number of accounts decreases or the average account size increases, the overall transfer agent fee rate decreases.
The Board recognized that the fund’s management contract incorporates a “group fee” structure, which provides for lower fee rates as total fund assets under FMR’s management increase, and for higher fee rates as total fund assets under FMR’s management decrease. The Board considered that the group fee is designed to deliver the benefits of economies of scale to fund shareholders when total fund assets increase, even if assets of any particular fund are unchanged or have declined, because some portion of Fidelity’s costs are attributable to services provided to all Fidelity funds, and all funds benefit if those costs can be allocated among more assets. The Board concluded that, given the group fee structure, fund shareholders will achieve a certain level of economies of scale as assets under FMR’s management increase at the fund complex level, regardless of whether Fidelity achieves any such economies of scale.
The Board further concluded that any potential economies of scale are being shared between fund shareholders and Fidelity in an appropriate manner.
Additional Information Requested by the Board. In order to develop fully the factual basis for consideration of the Advisory Contracts, the Board requested additional information regarding (i) equity fund transfer agency fees; (ii) Fidelity’s fund profitability methodology and the impact of various changes in the methodology over time; (iii) benefits to shareholders from economies of scale; (iv) composition and characteristics of various fund and industry data used in comparisons; and (v) compensation of portfolio managers and research analysts.
Based on its evaluation of all of the conclusions noted above, and after considering all material factors, the Board ultimately concluded that the existing advisory fee structures are fair and reasonable, and that the fund’s existing Advisory Contracts should be renewed.
53 Annual Report
Investment Adviser
Fidelity Management & Research Company
Boston, MA
Investment Sub-Advisers
FMR Co., Inc.
Fidelity Management & Research
(U.K.) Inc.
Fidelity Management & Research
(Far East) Inc.
Fidelity International
Investment Advisors
Fidelity Investments Japan Limited
Fidelity International Investment
Advisors (U.K.) Limited
General Distributor
Fidelity Distributors Corporation
Boston, MA
Transfer and Service Agents
Fidelity Investments Institutional
Operations Company, Inc.
Boston, MA
Fidelity Service Company, Inc.
Boston, MA
Custodian
JPMorgan Chase Bank
New York, NY
|

Fidelity® Advisor
Korea
Fund - Institutional Class
Annual Report October 31, 2005

| Contents | | | | |
| |
| Chairman’s Message | | 4 | | Ned Johnson’s message to shareholders. |
| Performance | | 6 | | How the fund has done over time. |
| Management’s Discussion | | 7 | | The manager’s review of fund |
| | | | | performance, strategy and outlook. |
| Shareholder Expense | | 8 | | An example of shareholder expenses. |
| Example | | | | |
| Investment Changes | | 10 | | A summary of major shifts in the fund’s |
| | | | | investments over the past six months. |
| Investments | | 11 | | A complete list of the fund’s investments |
| | | | | with their market values. |
| Financial Statements | | 16 | | Statements of assets and liabilities, |
| | | | | operations, and changes in net assets, |
| | | | | as well as financial highlights. |
| Notes | | 25 | | Notes to the financial statements. |
| Report of Independent | | 32 | | |
| Registered Public | | | | |
| Accounting Firm | | | | |
| Trustees and Officers | | 33 | | |
| Distributions | | 43 | | |
| Board Approval of | | 44 | | |
| Investment Advisory | | | | |
| Contracts and | | | | |
| Management Fees | | | | |
To view a fund’s proxy voting guidelines and proxy voting record for the 12-month period ended June 30, visit www.fidelity.com/proxyvotingresults or visit the Securities and Exchange Commission’s (SEC) web site at www.sec.gov. You may also call 1-877-208-0098 to request a free copy of the proxy voting guidelines.
Standard & Poor’s, S&P and S&P 500 are registered service marks of The McGraw-Hill Companies, Inc. and have been licensed for use by Fidelity Distributors Corporation.
Other third party marks appearing herein are the property of their respective owners.
All other marks appearing herein are registered or unregistered trademarks or service marks of FMR Corp. or an affiliated company.
This report and the financial statements contained herein are submitted for the general information of the shareholders of the fund. This report is not authorized for distribution to prospective investors in the fund unless preceded or accompanied by an effective prospectus.
A fund files its complete schedule of portfolio holdings with the SEC for the first and third quarters of each fiscal year on Form N-Q. Forms N-Q are available on the SEC’s web site at http://www.sec.gov. A fund’s Forms N-Q may be reviewed and copied at the SEC’s Public Reference Room in Washington, DC. Information regarding the operation of the SEC’s Public Reference Room may be obtained by calling 1-800-SEC-0330. For a complete list of a fund’s portfolio holdings, view the most recent quarterly holdings report, semiannual report, or annual report on Fidelity’s web site at http://www.advisor.fidelity.com.
NOT FDIC INSURED · MAY LOSE VALUE · NO BANK GUARANTEE
Neither the fund nor Fidelity Distributors Corporation is a bank.
3 Annual Report
Chairman’s Message
(Photograph of Edward C. Johnson 3d)
Dear Shareholder:
During the past year or so, much has been reported about the mutual fund industry, and much of it has been more critical than I believe is warranted. Allegations that some companies have been less than forthright with their shareholders have cast a shadow on the entire industry. I continue to find these reports disturbing, and assert that they do not create an accurate picture of the industry overall. Therefore, I would like to remind everyone where Fidelity stands on these issues. I will say two things specifically regarding allegations that some mutual fund companies were in violation of the Securities and Exchange Commission’s forward pricing rules or were involved in so-called “market timing” activities.
First, Fidelity has no agreements that permit customers who buy fund shares after 4 p.m. to obtain the 4 p.m. price. This is not a new policy. This is not to say that someone could not deceive the company through fraudulent acts. However, we are extremely diligent in preventing fraud from occurring in this manner — and in every other. But I underscore again that Fidelity has no so-called “agreements” that sanction illegal practices.
Second, Fidelity continues to stand on record, as we have for years, in opposition to predatory short-term trading that adversely affects shareholders in a mutual fund. Back in the 1980s, we initiated a fee — which is returned to the fund and, therefore, to investors — to discourage this activity. Further, we took the lead several years ago in developing a Fair Value Pricing Policy to prevent market timing on foreign securities in our funds. I am confident we will find other ways to make it more difficult for predatory traders to operate. However, this will only be achieved through close cooperation among regulators, legislators and the industry.
Yes, there have been unfortunate instances of unethical and illegal activity within the mutual fund industry from time to time. That is true of any industry. When this occurs, confessed or convicted offenders should be dealt with appropriately. But we are still concerned about the risk of over-regulation and the quick application of simplistic solutions to intricate problems. Every system can be improved, and we support and applaud well thought out improvements by regulators, legislators and industry representatives that achieve the common goal of building and protecting the value of investors’ holdings.
For nearly 60 years, Fidelity has worked very hard to improve its products and service to justify your trust. When our family founded this company in 1946, we had only a few hundred customers. Today, we serve more than 18 million customers including individual investors and participants in retirement plans across America.
Annual Report 4
Let me close by saying that we do not take your trust in us for granted, and we realize that we must always work to improve all aspects of our service to you. In turn, we urge you to continue your active participation with your financial matters, so that your interests can be well served.
Best regards,
/s/Edward C. Johnson 3d
5 Annual Report
Performance: The Bottom Line
Average annual total return reflects the change in the value of an investment, assuming reinvestment of the class’ dividend income and capital gains (the profits earned upon the sale of securities that have grown in value) and assuming a constant rate of performance each year. The $10,000 table and the fund’s returns do not reflect the deduction of taxes that a shareholder would pay on fund distributions or the redemption of fund shares. During periods of reimbursement by Fidelity, a fund’s total return will be greater than it would be had the reimbursement not occurred. How a fund did yesterday is no guarantee of how it will do tomorrow.
| Average Annual Total Returns | | | | | | |
| Periods ended October 31, 2005 | | Past 1 | | Past 5 | | Past 10 |
| | | year | | years | | years |
| Institutional ClassA | | 46.35% | | 19.02% | | 3.89% |
A Institutional Class shares are sold to eligible investors without a sales load or 12b-1 fee. The initial offering of Institutional Class shares took place on July 3, 2000. Returns between October 31, 1995 and June 30, 2000 are those of Fidelity Advisor Korea Fund, Inc., (the Closed-End Fund). At the close of business on June 30, 2000, the Closed-End Fund reorganized as an open-end fund through a transfer of all of its assets and liabilities to Fidelity Advisor Korea Fund (the fund). Shareholders of the Closed-End Fund received Class A shares of the fund in exchange for their shares of the Closed-End fund. If the effect of Institutional Class expenses was reflected, returns may be lower than shown because Institutional Class shares of the fund may have higher total expenses than the Closed-End Fund.
Let’s say hypothetically that $10,000 was invested in Fidelityr Advisor Korea Fund —Institutional Class on October 31, 1995. The chart shows how the value of your investment would have changed, and also shows how the Korea Composite Stock Price Index performed over the same period.
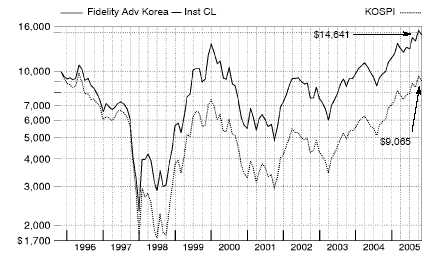
Annual Report 6
Management’s Discussion of Fund Performance
Comments from Wilson Wong, who became Portfolio Manager of Fidelity® Advisor Korea Fund on July 1, 2005
Against the backdrop of a firming South Korean economy, the Korean Composite Stock Price Index (KOSPI) finished the period with a gain of 49.33% . Of note during the year the return of the domestic investor to the stock market through growth in the popularity self-funded retirement and annuity plans. The Korean stock market also proved attractive because of low domestic interest rates, which resulted in acceptance of greater risk in search of higher returns. Meanwhile, structural and political risks were partially mitigated following Korea’s improved national credit rating and the progression of negotiations on North Korean nuclear issues. On the macroeconomic side, initial third-quarter gross domestic product (GDP) estimates announced by the Bank of Korea revealed the highest growth in four quarters. Returns for U.S. investors in this market were further enhanced the appreciation of the won — Korea’s currency — versus the U.S. dollar.
During the past year, the fund’s Institutional Class shares returned 46.35%, trailing the KOSPI but handily beating the 25.23% gain of the LipperSM Pacific Region ex Japan Funds Average. On an industry basis, bank stocks helped performance the most, as they benefited from improving asset quality and expectations for accelerating loan growth. For example, one strong performer was the stock of Shinhan Financial Group, the second-largest financial institution in Korea. The company broadened its distribution platform to include more diverse customer base through its 2003 acquisition of Chohung Bank. Also aiding fund performance was its position in Hyundai Department Store, Korea’s second-largest department store operator. Conversely, the biggest detractor was NCsoft, the largest developer of multi-player, online role-playing games in Korea. The stock underperformed the index, particularly in the first half of the period, after reporting lackluster 2004 earn ings. Another disappointment was Jahwa Electronics, which manufactures vibration motors for mobile handsets. The company’s profit margins suffered due the sharp appreciation Korea’s currency — the won — versus the U.S. dollar early in the period.
Note to shareholders: Fidelity Advisor Korea Fund may invest up to 35% of its total assets in any industry that represents more than 20% of the Korean market. As of October 31, 2005, the fund did not have more than 25% of its total assets invested in any one industry.
The views expressed in this statement reflect those of the portfolio manager only through the end of the period of the report as stated on the cover and do not necessarily represent the views of Fidelity or any other person in the Fidelity organization. Any such views are subject to change at any time based upon market or other conditions and Fidelity disclaims any responsibility to update such views. These views may not be relied on as investment advice and, because investment decisions for a Fidelity fund are based on numerous factors, may not be relied on as an indication of trading intent on behalf of any Fidelity fund.
Shareholder Expense Example
As a shareholder of the Fund, you incur two types of costs: (1) transaction costs, including sales charges (loads) on purchase payments or redemption proceeds, redemption fees, and (2) ongoing costs, including management fees, distribution and/or service (12b-1) fees and other Fund expenses. This Example is intended to help you understand your ongoing costs (in dollars) of investing in the Fund and to compare these costs with the ongoing costs of investing in other mutual funds.
The Example is based on an investment of $1,000 invested at the beginning of the period and held for the entire period (May 1, 2005 to October 31, 2005).
The first line of the table on the next page for each class of the Fund provides information about actual account values and actual expenses. You may use the information in this line, together with the amount you invested, to estimate the expenses that you paid over the period. Simply divide your account value by $1,000.00 (for example, an $8,600 account value divided by $1,000.00 = 8.6), then multiply the result by the number in the first line for a class of the Fund under the heading entitled “Expenses Paid During Period” to estimate the expenses you paid on your account during this period.
Hypothetical Example for Comparison Purposes
The second line of the table on the next page for each class of the Fund provides information about hypothetical account values and hypothetical expenses based on a Class’ actual expense ratio and an assumed rate of return of 5% per year before expenses, which is not the Class’ actual return. The hypothetical account values and expenses may not be used to estimate the actual ending account balance or expenses you paid for the period. You may use this information to compare the ongoing costs of investing in the Fund and other funds. To do so, compare this 5% hypothetical example with the 5% hypothetical examples that appear in the shareholder reports of the other funds.
Please note that the expenses shown in the table are meant to highlight your ongoing costs only and do not reflect any transaction costs. Therefore, the second line of the table is useful in comparing ongoing costs only, and will not help you determine the relative total costs of owning different funds. In addition, if these transactional costs were included, your costs would have been higher.
| | | | | | | | | | | | | Expenses Paid |
| | | | | Beginning | | | | Ending | | | | During Period* |
| | | | | Account Value | | | | Account Value | | | | May 1, 2005 |
| | | | | May 1, 2005 | | | | October 31, 2005 | | to October 31, 2005 |
| Class A | | | | | | | | | | | | |
| Actual | | $ | | 1,000.00 | | $ | | 1,196.70 | | $ | | 8.86 |
| HypotheticalA | | $ | | 1,000.00 | | $ | | 1,017.14 | | $ | | 8.13 |
| Class T | | | | | | | | | | | | |
| Actual | | $ | | 1,000.00 | | $ | | 1,196.00 | | $ | | 10.24 |
| HypotheticalA | | $ | | 1,000.00 | | $ | | 1,015.88 | | $ | | 9.40 |
| Class B | | | | | | | | | | | | |
| Actual | | $ | | 1,000.00 | | $ | | 1,192.10 | | $ | | 12.98 |
| HypotheticalA | | $ | | 1,000.00 | | $ | | 1,013.36 | | $ | | 11.93 |
| Class C | | | | | | | | | | | | |
| Actual | | $ | | 1,000.00 | | $ | | 1,192.70 | | $ | | 12.99 |
| HypotheticalA | | $ | | 1,000.00 | | $ | | 1,013.36 | | $ | | 11.93 |
| Institutional Class | | | | | | | | | | | | |
| Actual | | $ | | 1,000.00 | | $ | | 1,199.00 | | $ | | 7.48 |
| HypotheticalA | | $ | | 1,000.00 | | $ | | 1,018.40 | | $ | | 6.87 |
| |
| A 5% return per year before expenses | | | | | | | | |
* Expenses are equal to each Class’ annualized expense ratio (shown in the table below); multiplied by the average account value over the period, multiplied by 184/365 (to reflect the one-half year period).
| | | Annualized |
| | | Expense Ratio |
| Class A | | 1.60% |
| Class T | | 1.85% |
| Class B | | 2.35% |
| Class C | | 2.35% |
| Institutional Class | | 1.35% |
9 Annual Report
Investment Changes
| Top Ten Stocks as of October 31, 2005 | | | | |
| | | % of fund’s | | % of fund’s net assets |
| | | net assets | | 6 months ago |
| Samsung Electronics Co. Ltd. | | 11.9 | | 12.3 |
| Hyundai Motor Co. | | 5.5 | | 3.6 |
| NHN Corp. | | 4.7 | | 0.0 |
| Kookmin Bank | | 4.4 | | 3.5 |
| LG Household & Health Care Ltd. | | 3.0 | | 0.0 |
| Hyundai Mobis | | 3.0 | | 3.2 |
| Orion Corp. | | 2.5 | | 0.0 |
| Shinhan Financial Group Co. Ltd. | | 2.4 | | 4.3 |
| Kia Motors Corp. | | 2.4 | | 1.8 |
| Doosan Heavy Industries & Construction Co. Ltd. | | 2.4 | | 0.0 |
| | | 42.2 | | |
| Market Sectors as of October 31, 2005 | | | | |
| | | % of fund’s | | % of fund’s net assets |
| | | net assets | | 6 months ago |
| Information Technology | | 22.5 | | 25.0 |
| Financials | | 22.2 | | 16.8 |
| Consumer Discretionary | | 17.5 | | 19.9 |
| Industrials | | 16.2 | | 10.7 |
| Consumer Staples | | 8.9 | | 8.1 |
| Telecommunication Services | | 4.2 | | 7.3 |
| Energy | | 3.4 | | 4.1 |
| Materials | | 3.1 | | 4.5 |
| Health Care | | 1.7 | | 0.0 |
| Utilities | | 0.2 | | 2.0 |

Annual Report 10
| Investments October 31, 2005 | | | | | | | | |
| Showing Percentage of Net Assets | | | | | | | | |
| |
| Common Stocks — 99.9% | | | | | | | | |
| | | | | Shares | | Value (Note 1) |
| |
| CONSUMER DISCRETIONARY – 17.5% | | | | | | | | |
| Auto Components – 3.3% | | | | | | | | |
| Hankook Tire Co. Ltd. | | | | 8,390 | | $ | | 100,053 |
| Hyundai Mobis | | | | 10,490 | | | | 833,975 |
| | | | | | | | | 934,028 |
| Automobiles – 8.0% | | | | | | | | |
| Hyundai Motor Co. | | | | 21,100 | | | | 1,548,141 |
| Kia Motors Corp. | | | | 38,070 | | | | 683,728 |
| | | | | | | | | 2,231,869 |
| Diversified Consumer Services – 1.5% | | | | | | | | |
| YBM Sisa.com, Inc. | | | | 21,717 | | | | 407,714 |
| Hotels, Restaurants & Leisure – 2.0% | | | | | | | | |
| Hana Tour Service, Inc. | | | | 10,434 | | | | 327,811 |
| Modetour Network, Inc. | | | | 12,092 | | | | 242,072 |
| | | | | | | | | 569,883 |
| Household Durables – 0.6% | | | | | | | | |
| LG Electronics, Inc. | | | | 2,610 | | | | 169,250 |
| Internet & Catalog Retail – 0.4% | | | | | | | | |
| CJ Home Shopping | | | | 1,111 | | | | 98,436 |
| Multiline Retail – 1.7% | | | | | | | | |
| Hyundai Department Store Co. Ltd. | | | | 7,370 | | | | 489,215 |
| |
| TOTAL CONSUMER DISCRETIONARY | | | | | | | | 4,900,395 |
| |
| CONSUMER STAPLES – 8.9% | | | | | | | | |
| Food & Staples Retailing – 2.1% | | | | | | | | |
| Shinsegae Co. Ltd. | | | | 1,640 | | | | 587,509 |
| Food Products – 3.4% | | | | | | | | |
| Binggrea Co. Ltd. | | | | 5,950 | | | | 246,777 |
| Orion Corp. | | | | 3,670 | | | | 711,853 |
| | | | | | | | | 958,630 |
| Household Products – 3.0% | | | | | | | | |
| LG Household & Health Care Ltd. | | | | 15,310 | | | | 835,890 |
| Personal Products – 0.4% | | | | | | | | |
| AmorePacific Corp. | | | | 410 | | | | 122,136 |
| |
| TOTAL CONSUMER STAPLES | | | | | | | | 2,504,165 |
| |
| ENERGY – 3.4% | | | | | | | | |
| Oil, Gas & Consumable Fuels – 3.4% | | | | | | | | |
| GS Holdings Corp. | | | | 7,770 | | | | 177,876 |
See accompanying notes which are an integral part of the financial statements.
11 Annual Report
| Investments - continued | | | | | | |
| |
| |
| Common Stocks – continued | | | | | | |
| | | Shares | | Value (Note 1) |
| |
| ENERGY – continued | | | | | | |
| Oil, Gas & Consumable Fuels – continued | | | | | | |
| S-Oil Corp. | | 6,560 | | $ | | 490,743 |
| SK Corp. | | 5,440 | | | | 278,774 |
| | | | | | | 947,393 |
| |
| FINANCIALS – 22.2% | | | | | | |
| Capital Markets – 4.8% | | | | | | |
| Daewoo Securities Co. Ltd. (a) | | 41,830 | | | | 450,754 |
| Hyundai Securities Co. Ltd. (a) | | 12,490 | | | | 114,970 |
| kiwoom.com Securities Co. Ltd. | | 15,206 | | | | 289,846 |
| Korea Investment Holdings Co. Ltd. | | 15,470 | | | | 397,122 |
| LG Investment & Securities Co. Ltd. | | 6,970 | | | | 91,798 |
| | | | | | | 1,344,490 |
| Commercial Banks – 10.3% | | | | | | |
| Industrial Bank of Korea | | 33,340 | | | | 395,992 |
| Kookmin Bank | | 22,310 | | | | 1,224,485 |
| Shinhan Financial Group Co. Ltd. | | 20,692 | | | | 689,733 |
| Woori Finance Holdings Co. Ltd. | | 37,860 | | | | 582,043 |
| | | | | | | 2,892,253 |
| Consumer Finance – 1.4% | | | | | | |
| LG Card Co. Ltd. (a) | | 10,710 | | | | 386,750 |
| Insurance – 5.7% | | | | | | |
| Dongbu Insurance Co. Ltd. | | 24,340 | | | | 304,250 |
| Korean Reinsurance Co. | | 60,590 | | | | 528,131 |
| LG Insurance Co. Ltd. | | 11,190 | | | | 138,267 |
| Samsung Fire & Marine Insurance Co. Ltd. | | 6,630 | | | | 628,707 |
| | | | | | | 1,599,355 |
| |
| TOTAL FINANCIALS | | | | | | 6,222,848 |
| |
| HEALTH CARE – 1.7% | | | | | | |
| Pharmaceuticals – 1.7% | | | | | | |
| Hanmi Pharm Co. Ltd. | | 4,860 | | | | 493,448 |
| |
| INDUSTRIALS – 16.2% | | | | | | |
| Building Products – 0.3% | | | | | | |
| KCC Corp. | | 501 | | | | 96,457 |
| Construction & Engineering – 9.5% | | | | | | |
| Daelim Industrial Co. | | 4,470 | | | | 260,322 |
| Daewoo Engineering & Construction Co. Ltd. | | 18,910 | | | | 187,470 |
| Doosan Heavy Industries & Construction Co. Ltd. | | 31,440 | | | | 680,597 |
See accompanying notes which are an integral part of the financial statements.
| Common Stocks – continued | | | | | | |
| | | Shares | | Value (Note 1) |
| |
| INDUSTRIALS – continued | | | | | | |
| Construction & Engineering – continued | | | | | | |
| Halla Engineering & Construction Corp. | | 3,610 | | $ | | 96,820 |
| Hyundai Engineering & Construction Co. Ltd. (a) | | 20,180 | | | | 627,242 |
| Hyundai Industrial Development & Construction Co. | | 4,160 | | | | 151,418 |
| Keangnam Enterprises (a) | | 7,830 | | | | 75,000 |
| LG Engineering & Construction Co. Ltd. | | 11,390 | | | | 488,221 |
| Sambu Construction Co. Ltd. | | 3,330 | | | | 91,862 |
| | | | | | | 2,658,952 |
| Electrical Equipment – 0.5% | | | | | | |
| LS Industrial Systems Ltd. | | 5,370 | | | | 145,052 |
| Industrial Conglomerates – 0.2% | | | | | | |
| LG Corp. | | 2,470 | | | | 60,567 |
| Machinery – 5.7% | | | | | | |
| Daewoo Heavy Industries & Machinery Ltd. | | 27,260 | | | | 338,139 |
| Daewoo Shipbuilding & Marine Engineering Co. Ltd. | | 11,900 | | | | 237,088 |
| Hyundai Heavy Industries Co. Ltd. | | 7,010 | | | | 455,918 |
| Hyundai Mipo Dockyard Co. Ltd. | | 8,980 | | | | 554,799 |
| | | | | | | 1,585,944 |
| |
| TOTAL INDUSTRIALS | | | | | | 4,546,972 |
| |
| INFORMATION TECHNOLOGY – 22.5% | | | | | | |
| Electronic Equipment & Instruments – 3.2% | | | | | | |
| KH Vatec Co. Ltd. | | 5,657 | | | | 124,627 |
| LG.Philips LCD Co. Ltd. (a) | | 15,110 | | | | 558,665 |
| Samsung SDI Co. Ltd. | | 2,160 | | | | 212,069 |
| | | | | | | 895,361 |
| Internet Software & Services – 4.7% | | | | | | |
| NHN Corp. (a) | | 8,019 | | | | 1,332,659 |
| IT Services – 0.7% | | | | | | |
| CDNetworks Co. Ltd. | | 11,212 | | | | 187,941 |
| Semiconductors & Semiconductor Equipment – 13.6% | | | | | | |
| Hynix Semiconductor, Inc. (a) | | 23,320 | | | | 425,523 |
| Samsung Electronics Co. Ltd. | | 6,300 | | | | 3,331,031 |
| Samsung Techwin Industries | | 3,080 | | | | 44,695 |
| | | | | | | 3,801,249 |
| Software – 0.3% | | | | | | |
| NCsoft Corp. (a) | | 910 | | | | 84,986 |
| |
| TOTAL INFORMATION TECHNOLOGY | | | | | | 6,302,196 |
See accompanying notes which are an integral part of the financial statements.
13 Annual Report
| Investments - continued | | | | | | |
| |
| |
| Common Stocks – continued | | | | | | |
| | | Shares | | Value (Note 1) |
| |
| MATERIALS – 3.1% | | | | | | |
| Chemicals – 0.7% | | | | | | |
| FINETEC Corp. | | 2,336 | | $ | | 24,054 |
| Hanwha Corp. | | 9,680 | | | | 180,805 |
| | | | | | | 204,859 |
| Metals & Mining – 2.4% | | | | | | |
| POSCO | | 3,300 | | | | 668,534 |
| |
| TOTAL MATERIALS | | | | | | 873,393 |
| |
| TELECOMMUNICATION SERVICES – 4.2% | | | | | | |
| Diversified Telecommunication Services – 0.8% | | | | | | |
| KT Corp. | | 5,660 | | | | 227,159 |
| Wireless Telecommunication Services – 3.4% | | | | | | |
| KT Freetel Co. Ltd. | | 8,400 | | | | 180,230 |
| LG Telecom Ltd. (a) | | 28,603 | | | | 141,097 |
| SK Telecom Co. Ltd. | | 3,500 | | | | 628,592 |
| | | | | | | 949,919 |
| |
| TOTAL TELECOMMUNICATION SERVICES | | | | | | 1,177,078 |
| |
| UTILITIES – 0.2% | | | | | | |
| Electric Utilities – 0.0% | | | | | | |
| Korea Electric Power Corp. | | 130 | | | | 4,227 |
| Gas Utilities – 0.2% | | | | | | |
| E1 Corp. | | 1,460 | | | | 61,113 |
| |
| TOTAL UTILITIES | | | | | | 65,340 |
| |
| TOTAL COMMON STOCKS | | | | | | |
| (Cost $20,990,380) | | | | 28,033,228 |
See accompanying notes which are an integral part of the financial statements.
| Money Market Funds — 1.0% | | | | | | |
| | | Shares | | | | Value (Note 1) |
| Fidelity Cash Central Fund, 3.92% (b) | | | | | | |
| (Cost $274,315) | | 274,315 | | $ | | 274,315 |
| TOTAL INVESTMENT PORTFOLIO – 100.9% | | | | | | |
| (Cost $21,264,695) | | | | | | 28,307,543 |
| |
| NET OTHER ASSETS – (0.9)% | | | | | | (255,631) |
| NET ASSETS – 100% | | | | $ | | 28,051,912 |
(a) Non-income producing
(b) Affiliated fund that is available only to investment companies and other accounts managed by Fidelity Investments. The rate quoted is the annualized seven-day yield of the fund at period end. A complete unaudited listing of the fund’s holdings as of its most recent quarter end is available upon request.
At October 31, 2005, the fund had a capital loss carryforward of approximately $6,981,779 of which $5,467,666 and $1,514,113 will expire on October 31, 2006 and 2009, respectively.
See accompanying notes which are an integral part of the financial statements.
15 Annual Report
| Financial Statements | | | | | | | | |
| |
| |
| Statement of Assets and Liabilities | | | | | | | | |
| | | | | | | | | October 31, 2005 |
| |
| Assets | | | | | | | | |
| Investment in securities, at value (cost $21,264,695) — | | | | | | |
| See accompanying schedule | | | | | | $ | | 28,307,543 |
| Cash | | | | | | | | 14,078 |
| Receivable for investments sold | | | | | | | | 166,151 |
| Receivable for fund shares sold | | | | | | | | 86,372 |
| Dividends receivable | | | | | | | | 3,673 |
| Interest receivable | | | | | | | | 2,105 |
| Receivable from investment adviser for expense reductions | | | | | | 7,381 |
| Other affiliated receivables | | | | | | | | 76 |
| Other receivables | | | | | | | | 1,428 |
| Total assets | | | | | | | | 28,588,807 |
| |
| Liabilities | | | | | | | | |
| Payable for investments purchased | | $ | | 354,056 | | | | |
| Payable for fund shares redeemed | | | | 64,861 | | | | |
| Accrued management fee | | | | 18,951 | | | | |
| Distribution fees payable | | | | 11,285 | | | | |
| Other affiliated payables | | | | 8,261 | | | | |
| Other payables and accrued expenses | | | | 79,481 | | | | |
| Total liabilities | | | | | | | | 536,895 |
| |
| Net Assets | | | | | | $ | | 28,051,912 |
| Net Assets consist of: | | | | | | | | |
| Paid in capital | | | | | | $ | | 28,059,193 |
| Undistributed net investment income | | | | | | | | 18,689 |
| Accumulated undistributed net realized gain (loss) on | | | | | | | | |
| investments and foreign currency transactions | | | | | | | | (7,068,565) |
| Net unrealized appreciation (depreciation) on | | | | | | | | |
| investments and assets and liabilities in foreign | | | | | | | | |
| currencies | | | | | | | | 7,042,595 |
| Net Assets | | | | | | $ | | 28,051,912 |
See accompanying notes which are an integral part of the financial statements.
| Statement of Assets and Liabilities — continued | | | | |
| | | | | October 31, 2005 |
| |
| Calculation of Maximum Offering Price | | | | | | |
| Class A: | | | | | | |
| Net Asset Value and redemption price per share | | | | | | |
| ($15,565,901 ÷ 894,499 shares) | | | | $ | | 17.40 |
| |
| Maximum offering price per share (100/94.25 of $17.40) | | . | | $ | | 18.46 |
| Class T: | | | | | | |
| Net Asset Value and redemption price per share | | | | | | |
| ($3,407,398 ÷ 198,663 shares) | | | | $ | | 17.15 |
| |
| Maximum offering price per share (100/96.50 of $17.15) | | . | | $ | | 17.77 |
| Class B: | | | | | | |
| Net Asset Value and offering price per share ($4,383,697 | | | | |
| ÷ 262,612 shares)A | | | | $ | | 16.69 |
| |
| Class C: | | | | | | |
| Net Asset Value and offering price per share ($3,994,172 | | | | |
| ÷ 239,093 shares)A | | | | $ | | 16.71 |
| |
| Institutional Class: | | | | | | |
| Net Asset Value, offering price and redemption price per | | | | | | |
| share ($700,744 ÷ 39,709 shares) | | | | $ | | 17.65 |
| |
| A Redemption price per share is equal to net asset value less any applicable contingent deferred sales charge. | | | | |
See accompanying notes which are an integral part of the financial statements.
17 Annual Report
| Financial Statements - continued | | | | | | |
| |
| |
| Statement of Operations | | | | | | |
| | | | | Year ended October 31, 2005 |
| |
| Investment Income | | | | | | |
| Dividends | | | | $ | | 472,214 |
| Interest | | | | | | 14,545 |
| | | | | | | 486,759 |
| Less foreign taxes withheld | | | | | | (77,915) |
| Total income | | | | | | 408,844 |
| |
| Expenses | | | | | | |
| Management fee | | $ | | 174,355 | | |
| Transfer agent fees | | | | 73,252 | | |
| Distribution fees | | | | 95,370 | | |
| Accounting fees and expenses | | | | 15,543 | | |
| Independent trustees’ compensation | | | | 95 | | |
| Custodian fees and expenses | | | | 34,585 | | |
| Registration fees | | | | 47,983 | | |
| Audit | | | | 83,477 | | |
| Legal | | | | 1,686 | | |
| Miscellaneous | | | | 188 | | |
| Total expenses before reductions | | | | 526,534 | | |
| Expense reductions | | | | (136,378) | | 390,156 |
| |
| Net investment income (loss) | | | | | | 18,688 |
| Realized and Unrealized Gain (Loss) | | | | | | |
| Net realized gain (loss) on: | | | | | | |
| Investment securities | | | | 4,751,527 | | |
| Foreign currency transactions | | | | (62,658) | | |
| Total net realized gain (loss) | | | | | | 4,688,869 |
| Change in net unrealized appreciation (depreciation) on: | | | | |
| Investment securities | | | | 2,369,920 | | |
| Assets and liabilities in foreign currencies | | | | 35 | | |
| Total change in net unrealized appreciation | | | | | | |
| (depreciation) | | | | | | 2,369,955 |
| Net gain (loss) | | | | | | 7,058,824 |
| Net increase (decrease) in net assets resulting from | | | | | | |
| operations | | | | $ | | 7,077,512 |
See accompanying notes which are an integral part of the financial statements.
| Statement of Changes in Net Assets | | | | | | | | |
| | | | | Year ended | | | | Year ended |
| | | | | October 31, | | | | October 31, |
| | | | | 2005 | | | | 2004 |
| Increase (Decrease) in Net Assets | | | | | | | | |
| Operations | | | | | | | | |
| Net investment income (loss) | | $ | | 18,688 | | $ | | (107,570) |
| Net realized gain (loss) | | | | 4,688,869 | | | | 1,986,022 |
| Change in net unrealized appreciation (depreciation) . | | | | 2,369,955 | | | | (859,552) |
| Net increase (decrease) in net assets resulting | | | | | | | | |
| from operations | | | | 7,077,512 | | | | 1,018,900 |
| Share transactions — net increase (decrease) | | | | 3,922,676 | | | | 715,711 |
| Redemption fees | | | | 12,538 | | | | 10,827 |
| Total increase (decrease) in net assets | | | | 11,012,726 | | | | 1,745,438 |
| |
| Net Assets | | | | | | | | |
| Beginning of period | | | | 17,039,186 | | | | 15,293,748 |
| End of period (including undistributed net investment | | | | | | | | |
| income of $18,689 and $0, respectively) | | $ | | 28,051,912 | | $ | | 17,039,186 |
See accompanying notes which are an integral part of the financial statements.
19 Annual Report
| Financial Highlights — Class A | | | | | | | | | | | | | | |
| |
| Years ended October 31, | | 2005 | | 2004 | | | | 2003 | | | | 2002 | | | | 2001 |
| Selected Per-Share Data | | | | | | | | | | | | | | | | |
| Net asset value, beginning of | | | | | | | | | | | | | | | | |
| period | | $ 11.93 | | $ 11.07 | | $ | | 9.05 | | $ | | 6.70 | | $ | | 7.38 |
| Income from Investment | | | | | | | | | | | | | | | | |
| Operations | | | | | | | | | | | | | | | | |
| Net investment income (loss)C | | 04 | | (.06) | | | | .01 | | | | (.11) | | | | —E |
| Net realized and unrealized | | | | | | | | | | | | | | | | |
| gain (loss) | | 5.42 | | .91 | | | | 2.01 | | | | 2.46 | | | | (.69) |
| Total from investment operations | | 5.46 | | .85 | | | | 2.02 | | | | 2.35 | | | | (.69) |
| Redemption fees added to paid in | | | | | | | | | | | | | | | | |
| capitalC | | 01 | | .01 | | | | — | | | | — | | | | .01 |
| Net asset value, end of period | | $ 17.40 | | $ 11.93 | | $ | | 11.07 | | $ | | 9.05 | | $ | | 6.70 |
| Total ReturnA,B | | 45.85% | | 7.77% | | | | 22.32% | | | | 35.07% | | | | (9.21)% |
| Ratios to Average Net AssetsD | | | | | | | | | | | | | | | | |
| Expenses before expense | | | | | | | | | | | | | | | | |
| reductions | | 2.25% | | 2.76% | | | | 2.85% | | | | 2.48% | | | | 3.31% |
| Expenses net of voluntary | | | | | | | | | | | | | | | | |
| waivers, if any | | 1.69% | | 2.00% | | | | 2.00% | | | | 2.08% | | | | 2.10% |
| Expenses net of all reductions | | 1.65% | | 2.00% | | | | 2.00% | | | | 2.06% | | | | 2.08% |
| Net investment income (loss) | | 28% | | (.50)% | | | | .12% | | | | (1.10)% | | | | (.04)% |
| Supplemental Data | | | | | | | | | | | | | | | | |
| Net assets, end of period (000 | | | | | | | | | | | | | | | | |
| omitted) | | $15,566 | | $12,309 | | $12,187 | | $11,946 | | $11,747 |
| Portfolio turnover rate | | 97% | | 77% | | | | 127% | | | | 60% | | | | 36% |
A Total returns would have been lower had certain expenses not been reduced during the periods shown.
B Total returns do not include the effect of the sales charges.
C Calculated based on average shares outstanding during the period.
D Expense ratios reflect operating expenses of the class. Expenses before reductions do not reflect amounts reimbursed by the investment adviser or reductions from brokerage service arrangements or other expense offset arrangements and do not represent the amount paid by the class during periods when reimbursements or reductions occur. Expenses net of any voluntary waivers reflect expenses after reimbursement by the investment adviser but prior to reductions from brokerage service arrangements or other expense offset arrangements. Expenses net of all reductions repre sent the net expenses paid by the class.
E Amount represents less than $.01 per share.
See accompanying notes which are an integral part of the financial statements.
| Financial Highlights — Class T | | | | | | | | | | | | | | |
| |
| Years ended October 31, | | 2005 | | 2004 | | | | 2003 | | | | 2002 | | | | 2001 |
| Selected Per-Share Data | | | | | | | | | | | | | | | | |
| Net asset value, beginning of | | | | | | | | | | | | | | | | |
| period | | $ 11.78 | | $ 10.96 | | $ | | 8.99 | | $ | | 6.67 | | $ | | 7.37 |
| Income from Investment | | | | | | | | | | | | | | | | |
| Operations | | | | | | | | | | | | | | | | |
| Net investment income (loss)C | | 01 | | (.09) | | | | (.01) | | | | (.14) | | | | (.02) |
| Net realized and unrealized | | | | | | | | | | | | | | | | |
| gain (loss) | | 5.35 | | .90 | | | | 1.98 | | | | 2.46 | | | | (.69) |
| Total from investment operations | | 5.36 | | .81 | | | | 1.97 | | | | 2.32 | | | | (.71) |
| Redemption fees added to paid in | | | | | | | | | | | | | | | | |
| capitalC | | 01 | | .01 | | | | — | | | | — | | | | .01 |
| Net asset value, end of period | | $ 17.15 | | $ 11.78 | | $ | | 10.96 | | $ | | 8.99 | | $ | | 6.67 |
| Total ReturnA,B | | 45.59% | | 7.48% | | | | 21.91% | | | | 34.78% | | | | (9.50)% |
| Ratios to Average Net AssetsD | | | | | | | | | | | | | | | | |
| Expenses before expense | | | | | | | | | | | | | | | | |
| reductions | | 2.67% | | 3.54% | | | | 3.74% | | | | 3.02% | | | | 4.22% |
| Expenses net of voluntary | | | | | | | | | | | | | | | | |
| waivers, if any | | 1.91% | | 2.25% | | | | 2.25% | | | | 2.33% | | | | 2.35% |
| Expenses net of all reductions | | 1.87% | | 2.25% | | | | 2.25% | | | | 2.31% | | | | 2.33% |
| Net investment income (loss) | | 06% | | (.75)% | | | | (.13)% | | | | (1.35)% | | | | (.29)% |
| Supplemental Data | | | | | | | | | | | | | | | | |
| Net assets, end of period (000 | | | | | | | | | | | | | | | | |
| omitted) | | $ 3,407 | | $ 1,383 | | $ | | 1,223 | | $ | | 2,718 | | $ | | 343 |
| Portfolio turnover rate | | 97% | | 77% | | | | 127% | | | | 60% | | | | 36% |
A Total returns would have been lower had certain expenses not been reduced during the periods shown.
B Total returns do not include the effect of the sales charges.
C Calculated based on average shares outstanding during the period.
D Expense ratios reflect operating expenses of the class. Expenses before reductions do not reflect amounts reimbursed by the investment adviser or reductions from brokerage service arrangements or other expense offset arrangements and do not represent the amount paid by the class during periods when reimbursements or reductions occur. Expenses net of any voluntary waivers reflect expenses after reimbursement by the investment adviser but prior to reductions from brokerage service arrangements or other expense offset arrangements. Expenses net of all reductions repre sent the net expenses paid by the class.
See accompanying notes which are an integral part of the financial statements.
21 Annual Report
| Financial Highlights — Class B | | | | | | | | | | | | | | |
| |
| Years ended October 31, | | 2005 | | 2004 | | | | 2003 | | | | 2002 | | | | 2001 |
| Selected Per-Share Data | | | | | | | | | | | | | | | | |
| Net asset value, beginning of | | | | | | | | | | | | | | | | |
| period | | $ 11.53 | | $ 10.78 | | $ | | 8.88 | | $ | | 6.62 | | $ | | 7.36 |
| Income from Investment | | | | | | | | | | | | | | | | |
| Operations | | | | | | | | | | | | | | | | |
| Net investment income (loss)C | | (.07) | | (.14) | | | | (.06) | | | | (.19) | | | | (.05) |
| Net realized and unrealized | | | | | | | | | | | | | | | | |
| gain (loss) | | 5.22 | | .88 | | | | 1.96 | | | | 2.45 | | | | (.69) |
| Total from investment operations | | 5.15 | | .74 | | | | 1.90 | | | | 2.26 | | | | (.74) |
| Redemption fees added to paid in | | | | | | | | | | | | | | | | |
| capitalC | | 01 | | .01 | | | | — | | | | — | | | | —E |
| Net asset value, end of period | | $ 16.69 | | $ 11.53 | | $ | | 10.78 | | $ | | 8.88 | | $ | | 6.62 |
| Total ReturnA,B | | 44.75% | | 6.96% | | | | 21.40% | | | | 34.14% | | | | (10.05)% |
| Ratios to Average Net AssetsD | | | | | | | | | | | | | | | | |
| Expenses before expense | | | | | | | | | | | | | | | | |
| reductions | | 3.06% | | 3.63% | | | | 4.08% | | | | 3.48% | | | | 4.66% |
| Expenses net of voluntary | | | | | | | | | | | | | | | | |
| waivers, if any | | 2.42% | | 2.75% | | | | 2.75% | | | | 2.83% | | | | 2.85% |
| Expenses net of all reductions | | 2.38% | | 2.75% | | | | 2.75% | | | | 2.81% | | | | 2.83% |
| Net investment income (loss) | | (.45)% | | (1.25)% | | | | (.63)% | | | | (1.85)% | | | | (.79)% |
| Supplemental Data | | | | | | | | | | | | | | | | |
| Net assets, end of period (000 | | | | | | | | | | | | | | | | |
| omitted) | | $ 4,384 | | $ 2,279 | | $ | | 1,175 | | $ | | 1,313 | | $ | | 282 |
| Portfolio turnover rate | | 97% | | 77% | | | | 127% | | | | 60% | | | | 36% |
A Total returns would have been lower had certain expenses not been reduced during the periods shown.
B Total returns do not include the effect of the contingent deferred sales charge.
C Calculated based on average shares outstanding during the period.
D Expense ratios reflect operating expenses of the class. Expenses before reductions do not reflect amounts reimbursed by the investment adviser or reductions from brokerage service arrangements or other expense offset arrangements and do not represent the amount paid by the class during periods when reimbursements or reductions occur. Expenses net of any voluntary waivers reflect expenses after reimbursement by the investment adviser but prior to reductions from brokerage service arrangements or other expense offset arrangements. Expenses net of all reductions repre sent the net expenses paid by the class.
E Amount represents less than $.01 per share.
See accompanying notes which are an integral part of the financial statements.
| Financial Highlights — Class C | | | | | | | | | | | | | | | | |
| |
| Years ended October 31, | | 2005 | | | | 2004 | | | | 2003 | | | | 2002 | | | | 2001 |
| Selected Per-Share Data | | | | | | | | | | | | | | | | | | |
| Net asset value, beginning of | | | | | | | | | | | | | | | | | | |
| period | | $ 11.53 | | $ | | 10.79 | | $ | | 8.89 | | $ | | 6.62 | | $ | | 7.36 |
| Income from Investment | | | | | | | | | | | | | | | | | | |
| Operations | | | | | | | | | | | | | | | | | | |
| Net investment income (loss)C | | (.06) | | | | (.14) | | | | (.06) | | | | (.19) | | | | (.06) |
| Net realized and unrealized | | | | | | | | | | | | | | | | | | |
| gain (loss) | | 5.23 | | | | .87 | | | | 1.96 | | | | 2.46 | | | | (.69) |
| Total from investment operations | | 5.17 | | | | .73 | | | | 1.90 | | | | 2.27 | | | | (.75) |
| Redemption fees added to paid in | | | | | | | | | | | | | | | | | | |
| capitalC | | 01 | | | | .01 | | | | — | | | | — | | | | .01 |
| Net asset value, end of period | | $ 16.71 | | $ | | 11.53 | | $ | | 10.79 | | $ | | 8.89 | | $ | | 6.62 |
| Total ReturnA,B | | 44.93% | | | | 6.86% | | | | 21.37% | | | | 34.29% | | | | (10.05)% |
| Ratios to Average Net AssetsD | | | | | | | | | | | | | | | | | | |
| Expenses before expense | | | | | | | | | | | | | | | | | | |
| reductions | | 3.00% | | | | 3.63% | | | | 3.82% | | | | 3.35% | | | | 4.41% |
| Expenses net of voluntary | | | | | | | | | | | | | | | | | | |
| waivers, if any | | 2.39% | | | | 2.75% | | | | 2.75% | | | | 2.83% | | | | 2.85% |
| Expenses net of all reductions | | 2.35% | | | | 2.75% | | | | 2.75% | | | | 2.81% | | | | 2.83% |
| Net investment income (loss) | | (.42)% | | | | (1.25)% | | | | (.63)% | | | | (1.85)% | | | | (.79)% |
| Supplemental Data | | | | | | | | | | | | | | | | | | |
| Net assets, end of period (000 | | | | | | | | | | | | | | | | | | |
| omitted) | | $ 3,994 | | $ | | 759 | | $ | | 531 | | $ | | 804 | | $ | | 127 |
| Portfolio turnover rate | | 97% | | | | 77% | | | | 127% | | | | 60% | | | | 36% |
A Total returns would have been lower had certain expenses not been reduced during the periods shown.
B Total returns do not include the effect of the contingent deferred sales charge.
C Calculated based on average shares outstanding during the period.
D Expense ratios reflect operating expenses of the class. Expenses before reductions do not reflect amounts reimbursed by the investment adviser or reductions from brokerage service arrangements or other expense offset arrangements and do not represent the amount paid by the class during periods when reimbursements or reductions occur. Expenses net of any voluntary waivers reflect expenses after reimbursement by the investment adviser but prior to reductions from brokerage service arrangements or other expense offset arrangements. Expenses net of all reductions repre sent the net expenses paid by the class.
See accompanying notes which are an integral part of the financial statements.
23 Annual Report
| Financial Highlights — Institutional Class | | | | | | | | | | | | |
| |
| Years ended October 31, | | | | 2005 | | | | 2004 | | | | 2003 | | | | 2002 | | | | 2001 |
| Selected Per-Share Data | | | | | | | | | | | | | | | | | | | | |
| Net asset value, beginning of | | | | | | | | | | | | | | | | | | | | |
| period | | $ | | 12.06 | | $ | | 11.16 | | $ | | 9.11 | | $ | | 6.72 | | $ | | 7.39 |
| Income from Investment | | | | | | | | | | | | | | | | | | | | |
| Operations | | | | | | | | | | | | | | | | | | | | |
| Net investment income (loss)B | | | | 09 | | | | (.03) | | | | .04 | | | | (.08) | | | | .01 |
| Net realized and unrealized | | | | | | | | | | | | | | | | | | | | |
| gain (loss) | | | | 5.49 | | | | .92 | | | | 2.01 | | | | 2.47 | | | | (.69) |
| Total from investment operations | | | | 5.58 | | | | .89 | | | | 2.05 | | | | 2.39 | | | | (.68) |
| Redemption fees added to paid in | | | | | | | | | | | | | | | | | | | | |
| capitalB | | | | 01 | | | | .01 | | | | — | | | | — | | | | .01 |
| Net asset value, end of period | | $ | | 17.65 | | $ | | 12.06 | | $ | | 11.16 | | $ | | 9.11 | | $ | | 6.72 |
| Total ReturnA | | | | 46.35% | | | | 8.06% | | | | 22.50% | | | | 35.57% | | | | (9.07)% |
| Ratios to Average Net AssetsC | | | | | | | | | | | | | | | | | | | | |
| Expenses before expense | | | | | | | | | | | | | | | | | | | | |
| reductions | | | | 1.93% | | | | 2.74% | | | | 3.11% | | | | 2.22% | | | | 3.08% |
| Expenses net of voluntary | | | | | | | | | | | | | | | | | | | | |
| waivers, if any | | | | 1.42% | | | | 1.75% | | | | 1.75% | | | | 1.81% | | | | 1.85% |
| Expenses net of all reductions | | | | 1.37% | | | | 1.75% | | | | 1.75% | | | | 1.80% | | | | 1.83% |
| Net investment income (loss) | | | | 55% | | | | (.25)% | | | | .38% | | | | (.84)% | | | | .21% |
| Supplemental Data | | | | | | | | | | | | | | | | | | | | |
| Net assets, end of period (000 | | | | | | | | | | | | | | | | | | | | |
| omitted) | | $ | | 701 | | $ | | 309 | | $ | | 177 | | $ | | 2,127 | | $ | | 53 |
| Portfolio turnover rate | | | | 97% | | | | 77% | | | | 127% | | | | 60% | | | | 36% |
A Total returns would have been lower had certain expenses not been reduced during the periods shown.
B Calculated based on average shares outstanding during the period.
C Expense ratios reflect operating expenses of the class. Expenses before reductions do not reflect amounts reimbursed by the investment adviser or reductions from brokerage service arrangements or other expense offset arrangements and do not represent the amount paid by the class during periods when reimbursements or reductions occur. Expenses net of any voluntary waivers reflect expenses after reimbursement by the investment adviser but prior to reductions from brokerage service arrangements or other expense offset arrangements. Expenses net of all reductions repre sent the net expenses paid by the class.
See accompanying notes which are an integral part of the financial statements.
Notes to Financial Statements
For the period ended October 31, 2005
|
1. Significant Accounting Policies.
Fidelity Advisor Korea Fund (the fund) is a fund of Fidelity Advisor Series VIII (the trust) and is authorized to issue an unlimited number of shares. The trust is registered under the Investment Company Act of 1940, as amended (the 1940 Act), as an open-end management investment company organized as a Massachusetts business trust.
The fund offers Class A, Class T, Class B, Class C, and Institutional Class shares, each of which has equal rights as to assets and voting privileges. Each class has exclusive voting rights with respect to matters that affect that class. Class B shares will automatically convert to Class A shares after a holding period of seven years from the initial date of purchase. Investment income, realized and unrealized capital gains and losses, the common expenses of the fund, and certain fund-level expense reductions, if any, are allocated on a pro rata basis to each class based on the relative net assets of each class to the total net assets of the fund. Each class differs with respect to transfer agent and distribution and service plan fees incurred. Certain expense reductions also differ by class.
The fund’s investments in emerging markets can be subject to social, economic, regulatory, and political uncertainties and can be extremely volatile.
The fund may invest in affiliated money market central funds (Money Market Central Funds) which are open-end investment companies available to investment companies and other accounts managed by Fidelity Management & Research Company (FMR) and its affiliates.
The financial statements have been prepared in conformity with accounting principles generally accepted in the United States of America, which require management to make certain estimates and assumptions at the date of the financial statements. The following summarizes the significant accounting policies of the fund:
Security Valuation. Investments are valued and net asset value (NAV) per share is calculated (NAV calculation) as of the close of business of the New York Stock Exchange (NYSE), normally 4:00 p.m. Eastern time. Wherever possible,the fund uses independent pricing services approved by the Board of Trustees to value its investments.
Equity securities, including restricted securities, for which market quotations are readily available, are valued at the last reported sale price or official closing price as reported by an independent pricing service on the primary market or exchange on which they are traded. In the event there were no sales during the day or closing prices are not available, securities are valued at the last quoted bid price. Investments in open-end mutual funds, are valued at their closing net asset value each business day. Short-term securities with remaining maturities of sixty days or less for which quotations are not readily available are valued at amortized cost, which approximates value.
25 Annual Report
Notes to Financial Statements - continued
1. Significant Accounting Policies - continued
Security Valuation - continued
When current market prices or quotations are not readily available or do not accurately reflect fair value, valuations may be determined in accordance with procedures adopted by the Board of Trustees. For example, when developments occur between the close of a market and the close of the NYSE that may materially affect the value of some or all of the securities, or when trading in a security is halted, those securities may be fair valued.
Factors used in the determination of fair value may include monitoring news to identify significant market or security specific events such as changes in the value of U.S. securities market, reviewing developments in foreign markets and evaluating the performance of ADRs, futures contracts and exchange-traded funds. Because the fund’s utilization of fair value pricing depends on market activity, the frequency with which fair value pricing is used can not be predicted and may be utilized to a significant extent. The value of securities used for NAV calculation under fair value pricing may differ from published prices for the same securities.
Foreign Currency. The fund uses foreign currency contracts to facilitate transactions in foreign-denominated securities. Losses from these transactions may arise from changes in the value of the foreign currency or if the counterparties do not perform under the contracts’ terms.
Foreign-denominated assets, including investment securities, and liabilities are translated into U.S. dollars at the exchange rate at period end. Purchases and sales of investment securities, income and dividends received and expenses denominated in foreign currencies are translated into U.S. dollars at the exchange rate in effect on the transaction date.
The effects of exchange rate fluctuations on investments are included with the net realized and unrealized gain (loss) on investment securities. Other foreign currency transactions resulting in realized and unrealized gain (loss) are disclosed separately.
Investment Transactions and Income. Security transactions are accounted for as of trade date. Gains and losses on securities sold are determined on the basis of identified cost. Dividend income is recorded on the ex-dividend date, except for certain dividends from foreign securities where the ex-dividend date may have passed, which are recorded as soon as the fund is informed of the ex-dividend date. Non-cash dividends included in dividend income, if any, are recorded at the fair market value of the securities received. Interest income is accrued as earned. Interest income includes coupon interest and amortization of premium and accretion of discount on debt securities. Investment income is recorded net of foreign taxes withheld where recovery of such taxes is uncertain.
1. Significant Accounting Policies - continued
Expenses. Most expenses of the trust can be directly attributed to a fund. Expenses which cannot be directly attributed are apportioned among each fund in the trust.
Income Tax Information and Distributions to Shareholders. Each year, the fund intends to qualify as a regulated investment company by distributing all of its taxable income and realized gains under Subchapter M of the Internal Revenue Code. As a result, no provision for income taxes is required in the accompanying financial statements. Foreign taxes are provided for based on the fund’s understanding of the tax rules and rates that exist in the foreign markets in which it invests.
Distributions are recorded on the ex-dividend date. Income dividends and capital gain distributions are declared separately for each class. Income and capital gain distributions are determined in accordance with income tax regulations, which may differ from generally accepted accounting principles. In addition, the fund will claim a portion of the payment made to redeeming shareholders as a distribution for income tax purposes.
Capital accounts within the financial statements are adjusted for permanent book-tax differences. These adjustments have no impact on net assets or the results of operations. Temporary book-tax differences will reverse in a subsequent period.
Book-tax differences are primarily due to foreign currency transactions, passive foreign investment companies(PFIC), capital loss carryforwards and losses deferred due to wash sales.
The tax-basis components of distributable earnings and the federal tax cost as of period end were as follows:
| Unrealized appreciation | | $ | | 7,546,867 |
| Unrealized depreciation | | | | (623,784) |
| Net unrealized appreciation (depreciation) | | | | 6,923,083 |
| Undistributed ordinary income | | | | 51,418 |
| Capital loss carryforward | | | | (6,981,779) |
| Cost for federal income tax purposes | | $ | | 21,384,460 |
Short-Term Trading (Redemption) Fees. Shares held in the fund less than 90 days are subject to a redemption fee equal to 1.50% of the proceeds of the redeemed shares. All redemption fees, including any estimated redemption fees paid by FMR, are retained by the fund and accounted for as an addition to paid in capital.
Repurchase Agreements. FMR has received an Exemptive Order from the Securities and Exchange Commission (the SEC) which permits the fund and other affiliated entities of FMR to transfer uninvested cash balances into joint trading accounts which
27 Annual Report
Notes to Financial Statements - continued
2. Operating Policies - continued
Repurchase Agreements - continued
are then invested in repurchase agreements. The fund may also invest directly with institutions in repurchase agreements. Repurchase agreements are collateralized by government or non-government securities. Collateral is held in segregated accounts with custodian banks and may be obtained in the event of a default of the counterparty. The fund monitors, on a daily basis, the value of the collateral to ensure it is at least equal to the principal amount of the repurchase agreement (including accrued interest). In the event of a default by the counterparty, realization of the collateral proceeds could be delayed, during which time the value of the collateral may decline.
3. Purchases and Sales of Investments.
Purchases and sales of securities, other than short-term securities and U.S. government securities, aggregated $23,957,959 and $20,384,225, respectively.
4. Fees and Other Transactions with Affiliates.
Management Fee. FMR and its affiliates provide the fund with investment management related services for which the fund pays a monthly management fee. The management fee is the sum of an individual fund fee rate that is based on an annual rate of .55% of the fund’s average net assets and a group fee rate that averaged .27% during the period. The group fee rate is based upon the average net assets of all the mutual funds advised by FMR. The group fee rate decreases as assets under management increase and increases as assets under management decrease. For the period, the total annual management fee rate was .82% of the fund’s average net assets.
Distribution and Service Plan. In accordance with Rule 12b-1 of the 1940 Act, the fund has adopted separate Distribution and Service Plans for each class of shares. Certain classes pay Fidelity Distributors Corporation (FDC), an affiliate of FMR, separate Distribution and Service Fees, each of which is based on an annual percentage of each class’ average net assets. In addition, FDC may pay financial intermediaries for selling shares of the fund and providing shareholder support services. For the period, the Distribution and Service Fee rates and the total amounts paid to and retained by FDC were as follows:
| | | Distribution | | Service | | | | Paid to | | | | Retained |
| | | Fee | | Fee | | | | FDC | | | | by FDC |
| Class A | | 0% | | .25% | | $ | | 33,611 | | $ | | 6,967 |
| Class T | | 25% | | .25% | | | | 11,316 | | | | 8 |
| Class B | | 75% | | .25% | | | | 33,020 | | | | 24,802 |
| Class C | | 75% | | .25% | | | | 17,423 | | | | 8,312 |
| | | | | | | $ | | 95,370 | | $ | | 40,089 |
Annual Report 28
4. Fees and Other Transactions with Affiliates - continued
Sales Load. FDC receives a front-end sales charge of up to 5.75% for selling Class A shares, and 3.50% for selling Class T shares, some of which is paid to financial intermediaries for selling shares of the fund. FDC receives the proceeds of contingent deferred sales charges levied on Class A, Class T, Class B, and Class C redemptions. These charges depend on the holding period. The deferred sales charges range from 5% to 1% for Class B, 1% for Class C, and .25% for certain purchases of Class A and Class T shares.
| For the period, sales charge amounts retained by FDC were as follows: | | |
| | | | | Retained |
| | | | | by FDC |
| Class A | | $ | | 13,144 |
| Class T | | | | 2,507 |
| Class B* | | | | 2,771 |
| Class C* | | | | 1,909 |
| | | $ | | 20,331 |
* When Class B and Class C shares are initially sold, FDC pays commissions from its own resources to financial intermediaries through which the sales are made.
Transfer Agent Fees. Fidelity Investments Institutional Operations Company, Inc. (FIIOC), an affiliate of FMR, is the transfer, dividend disbursing and shareholder servicing agent for each class of the fund. FIIOC receives account fees and asset-based fees that vary according to the account size and type of account of the shareholders of the respective classes of the fund. FIIOC pays for typesetting, printing and mailing of shareholder reports, except proxy statements. For the period the total transfer agent fees paid by each class to FIIOC, were as follows:
| | | | | | | % of |
| | | | | | | Average |
| | | | | Amount | | Net Assets |
| Class A | | $ | | 41,094 | | .31 |
| Class T | | | | 11,662 | | .51 |
| Class B | | | | 12,645 | | .38 |
| Class C | | | | 6,582 | | .38 |
| Institutional Class | | | | 1,269 | | .27 |
| | | $ | | 73,252 | | |
Accounting Fees. Fidelity Service Company, Inc. (FSC), an affiliate of FMR, maintains the fund’s accounting records. The fee is based on the level of average net assets for the month. Affiliated Central Funds. The fund may invest in Money Market Central Funds which seek preservation of capital and current income and are managed by Fidelity Investments Money Management, Inc. (FIMM), an affiliate of FMR.
The Money Market Central Funds do not pay a management fee. Income distributions earned by the fund are recorded as income in the accompanying financial statements and totaled $14,397 for the period.
29 Annual Report
Notes to Financial Statements - continued
5. Committed Line of Credit.
The fund participates with other funds managed by FMR in a $4.2 billion credit facility (the “line of credit”) to be utilized for temporary or emergency purposes to fund shareholder redemptions or for other short-term liquidity purposes. The fund has agreed to pay commitment fees on its pro rata portion of the line of credit. During the period, there were no borrowings on this line of credit.
FMR voluntarily agreed to reimburse each class to the extent annual operating expenses exceeded certain levels of average net assets as noted in the table below. Some expenses, for example interest expense, are excluded from this reimbursement.
| The following classes were in reimbursement during the period: | | | | |
| | | Expense | | | | Reimbursement |
| | | Limitations | | | | from adviser |
| Class A | | 2.00%—1.60%* | | $ | | 75,394 |
| Class T | | 2.25%—1.85%* | | | | 17,166 |
| Class B | | 2.75%—2.35%* | | | | 20,972 |
| Class C | | 2.75%—2.35%* | | | | 10,631 |
| Institutional Class | | 1.75%—1.35%* | | | | 2,447 |
| | | | | $ | | 126,610 |
| * Expense limitation in effect at period end. | | | | | | |
Many of the brokers with whom FMR places trades on behalf of the fund provided services to the fund in addition to trade execution. These services included payments of certain expenses on behalf of the fund totaling $9,768 for the period.
The fund’s organizational documents provide former and current trustees and officers with a limited indemnification against liabilities arising in connection with the performance of their duties to the fund. In the normal course of business, the fund may also enter into contracts that provide general indemnifications. The fund’s maximum exposure under these arrangements is unknown as this would be dependent on future claims that may be made against the fund. The risk of material loss from such claims is considered remote.
| 8. Share Transactions. | | | | | | | | | | | | |
| |
| Transactions for each class of shares were as follows: | | | | | | | | |
| | | Shares | | | | | | Dollars |
| Years ended October 31, | | 2005 | | 2004 | | | | 2005 | | | | 2004 |
| Class A | | | | | | | | | | | | |
| Shares sold | | 315,971 | | 243,925 | | $ | | 5,103,008 | | $ | | 2,838,470 |
| Shares redeemed | | (453,614) | | (312,852) | | | | (6,594,615) | | | | (3,676,474) |
| Net increase (decrease) | | (137,643) | | (68,927) | | $ | | (1,491,607) | | $ | | (838,004) |
| Class T | | | | | | | | | | | | |
| Shares sold | | 121,022 | | 94,135 | | $ | | 1,916,252 | | $ | | 1,118,099 |
| Shares redeemed | | (39,702) | | (88,346) | | | | (581,562) | | | | (1,003,940) |
| Net increase (decrease) | | 81,320 | | 5,789 | | $ | | 1,334,690 | | $ | | 114,159 |
| Class B | | | | | | | | | | | | |
| Shares sold | | 104,588 | | 143,403 | | $ | | 1,605,843 | | $ | | 1,688,670 |
| Shares redeemed | | (39,679) | | (54,732) | | | | (574,572) | | | | (613,318) |
| Net increase (decrease) | | 64,909 | | 88,671 | | $ | | 1,031,271 | | $ | | 1,075,352 |
| Class C | | | | | | | | | | | | |
| Shares sold | | 216,863 | | 77,081 | | $ | | 3,448,329 | | $ | | 912,390 |
| Shares redeemed | | (43,585) | | (60,516) | | | | (665,109) | | | | (669,935) |
| Net increase (decrease) | | 173,278 | | 16,565 | | $ | | 2,783,220 | | $ | | 242,455 |
| Institutional Class | | | | | | | | | | | | |
| Shares sold | | 43,042 | | 62,223 | | $ | | 703,285 | | $ | | 765,799 |
| Shares redeemed | | (28,985) | | (52,454) | | | | (438,183) | | | | (644,050) |
| Net increase (decrease) | | 14,057 | | 9,769 | | $ | | 265,102 | | $ | | 121,749 |
31 Annual Report
Report of Independent Registered Public Accounting Firm
To the Trustees of Fidelity Advisor Series VIII and the Shareholders of Fidelity Advisor Korea Fund:
In our opinion, the accompanying statement of assets and liabilities, including the schedule of investments, and the related statements of operations and of changes in net assets and the financial highlights present fairly, in all material respects, the financial position of Fidelity Advisor Korea Fund (a fund of Fidelity Advisor Series VIII) at October 31, 2005 and the results of its operations, the changes in its net assets and the financial highlights for the periods indicated, in conformity with accounting principles generally accepted in the United States of America. These financial statements and financial highlights (hereafter referred to as “financial statements”) are the responsibility of the Fidelity Advisor Korea Fund’s management; our responsibility is to express an opinion on these financial statements based on our audits. We conducted our audits of these financial statements in accordance with the standards of the Public Company Accounting Oversight Board (United States). Those standards require that we plan and perform the audit to obtain reasonable assurance about whether the financial statements are free of material misstatement. An audit includes examining, on a test basis, evidence supporting the amounts and disclosures in the financial statements, assessing the accounting principles used and significant estimates made by management, and evaluating the overall financial statement presentation. We believe that our audits, which included confirmation of securities at October 31, 2005 by correspondence with the custodian and brokers, provide a reasonable basis for our opinion.
/s/ PricewaterhouseCoopers LLP
PricewaterhouseCoopers LLP
Boston, Massachusetts
December 19, 2005
|
Trustees and Officers
The Trustees, Members of the Advisory Board, and executive officers of the trust and fund, as applicable, are listed below. The Board of Trustees governs the fund and is responsible for protecting the interests of shareholders. The Trustees are experienced executives who meet periodically throughout the year to oversee the fund’s activities, review contractual arrangements with companies that provide services to the fund, and review the fund’s performance. Except for William O. McCoy, Stephen P. Jonas, and Kenneth L. Wolfe, each of the Trustees oversees 322 funds advised by FMR or an affiliate. Mr. McCoy oversees 324 funds advised by FMR or an affiliate. Mr. Jonas and Mr. Wolfe oversee 319 funds advised by FMR or an affiliate.
The Trustees hold office without limit in time except that (a) any Trustee may resign; (b) any Trustee may be removed by written instrument, signed by at least two-thirds of the number of Trustees prior to such removal; (c) any Trustee who requests to be retired or who has become incapacitated by illness or injury may be retired by written instrument signed by a majority of the other Trustees; and (d) any Trustee may be removed at any special meeting of shareholders by a two-thirds vote of the outstanding voting securities of the trust. Each Trustee who is not an interested person (as defined in the 1940 Act) (Independent Trustee), shall retire not later than the last day of the calendar year in which his or her 72nd birthday occurs. The Independent Trustees may waive this mandatory retirement age policy with respect to individual Trustees. The executive officers and Advisory Board Members hold office without limit in time, except that any officer and Advisory Board Member may resign or may be removed by a vote of a majority of the Trustees at any regular meeting or any special meeting of the Trustees. Except as indicated, each individual has held the office shown or other offices in the same company for the past five years.
The fund’s Statement of Additional Information (SAI) includes more information about the Trustees. To request a free copy, call Fidelity at 1-877-208-0098.
Interested Trustees*:
Correspondence intended for each Trustee who is an interested person may be sent to Fidelity Investments, 82 Devonshire Street, Boston, Massachusetts 02109.
| Name, Age; Principal Occupation |
| |
| Edward C. Johnson 3d (75)** |
| |
| Year of Election or Appointment: 1983 |
| Mr. Johnson is Chairman of the Board of Trustees. Mr. Johnson serves as |
| Chief Executive Officer, Chairman, and a Director of FMR Corp.; a |
| Director and Chairman of the Board and of the Executive Committee of |
| FMR; Chairman and a Director of Fidelity Management & Research (Far |
| East) Inc.; Chairman and a Director of Fidelity Investments Money Man- |
| agement, Inc.; and Chairman (2001-present) and a Director |
| (2000-present) of FMR Co., Inc. |
33 Annual Report
Trustees and Officers - continued
| Name, Age; Principal Occupation |
| |
| Abigail P. Johnson (43)** |
| |
| Year of Election or Appointment: 2001 |
| Ms. Johnson serves as President of Fidelity Employer Services Company |
| (FESCO) (2005-present). She is President and a Director of Fidelity In- |
| vestments Money Management, Inc. (2001-present), FMR Co., Inc. |
| (2001-present), and a Director of FMR Corp. Previously, Ms. Johnson |
| served as President and a Director of FMR (2001-2005), Senior Vice |
| President of the Fidelity funds (2001-2005), and managed a number of |
| Fidelity funds. |
| |
| Stephen P. Jonas (52) |
| |
| Year of Election or Appointment: 2005 |
| Mr. Jonas is Senior Vice President of Advisor Korea. He also serves as |
| Senior Vice President of other Fidelity funds (2005-present). Mr. Jonas is |
| Executive Director of FMR (2005-present). Previously, Mr. Jonas served |
| as President of Fidelity Enterprise Operations and Risk Services |
| (2004-2005), Chief Administrative Officer (2002-2004), and Chief |
| Financial Officer of FMR Co. (1998-2000). Mr. Jonas has been with |
| Fidelity Investments since 1987 and has held various financial and man- |
| agement positions including Chief Financial Officer of FMR. In addition, |
| he serves on the Boards of Boston Ballet (2003-present) and Simmons |
| College (2003-present). |
| |
| Robert L. Reynolds (53) |
| |
| Year of Election or Appointment: 2003 |
| Mr. Reynolds is a Director (2003-present) and Chief Operating Officer |
| (2002-present) of FMR Corp. He also serves on the Board at Fidelity |
| Investments Canada, Ltd. (2000-present). Previously, Mr. Reynolds |
| served as President of Fidelity Investments Institutional Retirement Group |
| (1996-2000). |
* Trustees have been determined to be “Interested Trustees” by virtue of, among other things, their affiliation with the trust or various entities under common control with FMR.
** Edward C. Johnson 3d, Trustee, is Abigail P. Johnson’s father.
Annual Report 34
Independent Trustees:
Correspondence intended for each Independent Trustee (that is, the Trustees other than the Interested Trustees) may be sent to Fidelity Investments, P.O. Box 55235, Boston, Massachusetts 02205-5235.
| Name, Age; Principal Occupation |
| |
| Dennis J. Dirks (57) |
| |
| Year of Election or Appointment: 2005 |
| Prior to his retirement in May 2003, Mr. Dirks was Chief Operating |
| Officer and a member of the Board of The Depository Trust & Clearing |
| Corporation (DTCC) (1999-2003). He also served as President, Chief |
| Operating Officer, and Board member of The Depository Trust |
| Company (DTC) (1999-2003) and President and Board member of the |
| National Securities Clearing Corporation (NSCC) (1999-2003). In addi- |
| tion, Mr. Dirks served as Chief Executive Officer and Board member of |
| the Government Securities Clearing Corporation (2001-2003) and Chief |
| Executive Officer and Board member of the Mortgage-Backed Securities |
| Clearing Corporation (2001-2003). Mr. Dirks also serves as a Trustee of |
| Manhattan College (2005-present). |
| |
| Robert M. Gates (62) |
| |
| Year of Election or Appointment: 1997 |
| Dr. Gates is Vice Chairman of the Independent Trustees (2005-present). |
| Dr. Gates is President of Texas A&M University (2002-present). He was |
| Director of the Central Intelligence Agency (CIA) from 1991 to 1993. |
| From 1989 to 1991, Dr. Gates served as Assistant to the President of |
| the United States and Deputy National Security Advisor. Dr. Gates is a |
| Director of NACCO Industries, Inc. (mining and manufacturing), Parker |
| Drilling Co., Inc. (drilling and rental tools for the energy industry, |
| 2001-present), and Brinker International (restaurant management, |
| 2003-present). Previously, Dr. Gates served as a Director of LucasVarity |
| PLC (automotive components and diesel engines), a Director of TRW Inc. |
| (automotive, space, defense, and information technology), and Dean of |
| the George Bush School of Government and Public Service at Texas |
| A&M University (1999-2001). Dr. Gates also is a Trustee of the Forum |
| for International Policy. |
35 Annual Report
Trustees and Officers - continued
| Name, Age; Principal Occupation |
| |
| George H. Heilmeier (69) |
| |
| Year of Election or Appointment: 2004 |
| Dr. Heilmeier is Chairman Emeritus of Telcordia Technologies (commu- |
| nication software and systems), where prior to his retirement, he served |
| as company Chairman and Chief Executive Officer. He currently serves |
| on the Boards of Directors of The Mitre Corporation (systems engineer- |
| ing and information technology support for the government), and HRL |
| Laboratories (private research and development, 2004-present). He is |
| Chairman of the General Motors Science & Technology Advisory Board |
| and a Life Fellow of the Institute of Electrical and Electronics Engineers |
| (IEEE) (2000-present). Dr. Heilmeier is a member of the Defense Science |
| Board and the National Security Agency Advisory Board. He is also a |
| member of the National Academy of Engineering, the American Aca- |
| demy of Arts and Sciences, and the Board of Overseers of the School of |
| Engineering and Applied Science of the University of Pennsylvania. Pre- |
| viously, Dr. Heilmeier served as a Director of TRW Inc. (automotive, |
| space, defense, and information technology, 1992-2002), Compaq |
| (1994-2002), Automatic Data Processing, Inc. (ADP) (technology-based |
| business outsourcing, 1995-2002), INET Technologies Inc. (telecommu- |
| nications network surveillance, 2001-2004), and Teletech Holdings (cus- |
| tomer management services). He is the recipient of the 2005 Kyoto Prize |
| in Advanced Technology for his invention of the liquid display. |
| |
| Marie L. Knowles (59) |
| |
| Year of Election or Appointment: 2001 |
| Prior to Ms. Knowles’ retirement in June 2000, she served as Executive |
| Vice President and Chief Financial Officer of Atlantic Richfield Company |
| (ARCO) (diversified energy, 1996-2000). From 1993 to 1996, she was |
| a Senior Vice President of ARCO and President of ARCO Transportation |
| Company. She served as a Director of ARCO from 1996 to 1998. She |
| currently serves as a Director of Phelps Dodge Corporation (copper |
| mining and manufacturing) and McKesson Corporation (healthcare ser- |
| vice, 2002-present). Ms. Knowles is a Trustee of the Brookings Institution |
| and the Catalina Island Conservancy and also serves as a member of |
| the Advisory Board for the School of Engineering of the University of |
| Southern California. |
Annual Report 36
| Name, Age; Principal Occupation |
| |
| Ned C. Lautenbach (61) |
| |
| Year of Election or Appointment: 2000 |
| Mr. Lautenbach has been a partner of Clayton, Dubilier & Rice, Inc. |
| (private equity investment firm) since September 1998. Previously, Mr. |
| Lautenbach was with the International Business Machines Corporation |
| (IBM) from 1968 until his retirement in 1998. Mr. Lautenbach serves as |
| a Director of Italtel Holding S.p.A. (telecommunications (Milan, Italy), |
| 2004-present) and Eaton Corporation (diversified industrial) as well as |
| the Philharmonic Center for the Arts in Naples, Florida. He also is a |
| member of the Board of Trustees of Fairfield University (2005-present), |
| as well as a member of the Council on Foreign Relations. |
| |
| Marvin L. Mann (72) |
| |
| Year of Election or Appointment: 1993 |
| Mr. Mann is Chairman of the Independent Trustees (2001-present). He is |
| Chairman Emeritus of Lexmark International, Inc. (computer |
| peripherals), where he served as CEO until April 1998, retired as |
| Chairman May 1999, and remains a member of the Board. Prior to |
| 1991, he held the positions of Vice President of International Business |
| Machines Corporation (IBM) and President and General Manager of |
| various IBM divisions and subsidiaries. He is a member of the Executive |
| Committee of the Independent Director’s Council of the Investment Com- |
| pany Institute. In addition, Mr. Mann is a member of the President’s |
| Cabinet at the University of Alabama and the Board of Visitors of the |
| Culverhouse College of Commerce and Business Administration at the |
| University of Alabama. |
| |
| William O. McCoy (72) |
| |
| Year of Election or Appointment: 1997 |
| Prior to his retirement in December 1994, Mr. McCoy was Vice Chair- |
| man of the Board of BellSouth Corporation (telecommunications) and |
| President of BellSouth Enterprises. He is currently a Director of Liberty |
| Corporation (holding company), Duke Realty Corporation (real estate), |
| and Progress Energy, Inc. (electric utility). He is also a partner of Frank- |
| lin Street Partners (private investment management firm) and a member |
| of the Research Triangle Foundation Board. In addition, Mr. McCoy |
| served as the Interim Chancellor (1999-2000) and a member of the |
| Board of Visitors for the University of North Carolina at Chapel Hill and |
| currently serves on the Board of Directors of the University of North |
| Carolina Health Care System and the Board of Visitors of the Kenan- |
| Flagler Business School (University of North Carolina at Chapel Hill). He |
| also served as Vice President of Finance for the University of North |
| Carolina (16-school system). |
37 Annual Report
Trustees and Officers - continued
| Name, Age; Principal Occupation |
| |
| Cornelia M. Small (61) |
| |
| Year of Election or Appointment: 2005 |
| Ms. Small is a member (2000-present) and Chairperson (2002-present) |
| of the Investment Committee, and a member (2002-present) of the |
| Board of Trustees of Smith College. Previously, she served as Chief In- |
| vestment Officer (1999-2000), Director of Global Equity Investments |
| (1996-1999), and a member of the Board of Directors of Scudder, |
| Stevens & Clark (1990-1997) and Scudder Kemper Investments |
| (1997-1998). In addition, Ms. Small served as Co-Chair (2000-2003) |
| of the Annual Fund for the Fletcher School of Law and Diplomacy. |
| |
| William S. Stavropoulos (66) |
| |
| Year of Election or Appointment: 2002 |
| Mr. Stavropoulos is Chairman of the Board (2000-present) and a Mem- |
| ber of the Board of Directors of The Dow Chemical Company. Since |
| joining The Dow Chemical Company in 1967, Mr. Stavropoulos served |
| in numerous senior management positions, including President |
| (1993-2000; 2002-2003), CEO (1995-2000; 2002-2004), and Chair- |
| man of the Executive Committee (2000-2004). Currently, he is a Direc- |
| tor of NCR Corporation (data warehousing and technology solutions), |
| BellSouth Corporation (telecommunications), Chemical Financial Corpo- |
| ration, Maersk Inc. (industrial conglomerate, 2002-present), and Metal- |
| mark Capital (private equity investment firm, 2005-present). He also |
| serves as a member of the Board of Trustees of the American Enterprise |
| Institute for Public Policy Research. In addition, Mr. Stavropoulos is a |
| member of The Business Council, J.P. Morgan International Council and |
| the University of Notre Dame Advisory Council for the College of |
| Science. |
| |
| Kenneth L. Wolfe (66) |
| |
| Year of Election or Appointment: 2005 |
| Mr. Wolfe also serves as a Trustee (2005-present) or Member of the |
| Advisory Board (2004-present) of other investment companies advised |
| by FMR. Prior to his retirement in 2001, Mr. Wolfe was Chairman and |
| Chief Executive Officer of Hershey Foods Corporation (1993-2001). He |
| currently serves as a member of the boards of Adelphia Communica- |
| tions Corporation (2003-present), Bausch & Lomb, Inc., and Revlon Inc. |
| (2004-present). |
Annual Report 38
Advisory Board Members and Executive Officers:
Correspondence intended for Mr. Gamper may be sent to Fidelity Investments, P.O. Box 55235, Boston, Massachusetts 02205-5235. Correspondence intended for each executive officer and Mr. Lynch may be sent to Fidelity Investments, 82 Devonshire Street, Boston, Massachusetts 02109.
| Name, Age; Principal Occupation |
| |
| Albert R. Gamper, Jr. (63) |
| |
| Year of Election or Appointment: 2005 |
| Member of the Advisory Board of Fidelity Advisor Series VIII. Prior to his |
| retirement in December 2004, Mr. Gamper served as Chairman of the |
| Board of CIT Group Inc. (commercial finance). During his tenure with |
| CIT Group Inc. Mr. Gamper served in numerous senior management |
| positions, including Chairman (1987-1989; 1999-2001; 2002-2004), |
| Chief Executive Officer (1987-2004), and President (1989-2002). He |
| currently serves as a member of the Board of Directors of Public Service |
| Enterprise Group (utilities, 2001-present), Chairman of the Board of |
| Governors, Rutgers University (2004-present), and Chairman of the |
| Board of Saint Barnabas Health Care System. |
| |
| Peter S. Lynch (61) |
| |
| Year of Election or Appointment: 2003 |
| Member of the Advisory Board of Fidelity Advisor Series VIII. Vice |
| Chairman and a Director of FMR, and Vice Chairman (2001-present) |
| and a Director (2000-present) of FMR Co., Inc. Previously, Mr. Lynch |
| served as a Trustee of the Fidelity funds (1990-2003). In addition, he |
| serves as a Trustee of Boston College, Massachusetts Eye & Ear |
| Infirmary, Historic Deerfield, John F. Kennedy Library, and the Museum |
| of Fine Arts of Boston. |
| |
| Dwight D. Churchill (51) |
| |
| Year of Election or Appointment: 2005 |
| Vice President of Advisor Korea. Mr. Churchill also serves as Vice Presi- |
| dent of certain Equity Funds (2005-present) and certain High Income |
| Funds (2005-present). Previously, he served as Head of Fidelity’s Fixed- |
| Income Division (2000-2005), Vice President of Fidelity’s Money Market |
| Funds (2000-2005), Vice President of Fidelity’s Bond Funds, and Senior |
| Vice President of FIMM (2000) and FMR. Mr. Churchill joined Fidelity in |
| 1993 as Vice President and Group Leader of Taxable Fixed-Income |
| Investments. |
39 Annual Report
Trustees and Officers - continued
| Name, Age; Principal Occupation |
| |
| Eric D. Roiter (56) |
| |
| Year of Election or Appointment: 1998 |
| Secretary of Advisor Korea. He also serves as Secretary of other Fidelity |
| funds; Vice President, General Counsel, and Secretary of FMR Co., Inc. |
| (2001-present) and FMR; Assistant Secretary of Fidelity Management & |
| Research (U.K.) Inc. (2001-present), Fidelity Management & Research |
| (Far East) Inc. (2001-present), and Fidelity Investments Money Manage- |
| ment, Inc. (2001-present). Mr. Roiter is an Adjunct Member, Faculty of |
| Law, at Boston College Law School (2003-present). Previously, Mr. Roiter |
| served as Vice President and Secretary of Fidelity Distributors Corpora- |
| tion (FDC) (1998-2005). |
| |
| Stuart Fross (46) |
| |
| Year of Election or Appointment: 2003 |
| Assistant Secretary of Advisor Korea. Mr. Fross also serves as Assistant |
| Secretary of other Fidelity funds (2003-present), Vice President and Sec- |
| retary of FDC (2005-present), and is an employee of FMR. |
| |
| Christine Reynolds (47) |
| |
| Year of Election or Appointment: 2004 |
| President, Treasurer, and Anti-Money Laundering (AML) officer of Advi- |
| sor Korea. Ms. Reynolds also serves as President, Treasurer, and AML |
| officer of other Fidelity funds (2004) and is a Vice President (2003) and |
| an employee (2002) of FMR. Before joining Fidelity Investments, Ms. |
| Reynolds worked at PricewaterhouseCoopers LLP (PwC) (1980-2002), |
| where she was most recently an audit partner with PwC’s investment |
| management practice. |
| |
| Paul M. Murphy (58) |
| |
| Year of Election or Appointment: 2005 |
| Chief Financial Officer of Advisor Korea. Mr. Murphy also serves as |
| Chief Financial Officer of other Fidelity funds (2005-present). He also |
| serves as Senior Vice President of Fidelity Pricing and Cash Manage- |
| ment Services Group (FPCMS). |
| |
| Kenneth A. Rathgeber (58) |
| |
| Year of Election or Appointment: 2004 |
| Chief Compliance Officer of Advisor Korea. Mr. Rathgeber also serves |
| as Chief Compliance Officer of other Fidelity funds (2004) and Execu- |
| tive Vice President of Risk Oversight for Fidelity Investments (2002). |
| Previously, he served as Executive Vice President and Chief Operating |
| Officer for Fidelity Investments Institutional Services Company, Inc. |
| (1998-2002). |
Annual Report 40
| Name, Age; Principal Occupation |
| |
| John R. Hebble (47) |
| |
| Year of Election or Appointment: 2003 |
| Deputy Treasurer of Advisor Korea. Mr. Hebble also serves as Deputy |
| Treasurer of other Fidelity funds (2003), and is an employee of FMR. |
| Before joining Fidelity Investments, Mr. Hebble worked at Deutsche Asset |
| Management where he served as Director of Fund Accounting |
| (2002-2003) and Assistant Treasurer of the Scudder Funds |
| (1998-2003). |
| |
| Bryan A. Mehrmann (44) |
| |
| Year of Election or Appointment: 2005 |
| Deputy Treasurer of Advisor Korea. Mr. Mehrmann also serves as |
| Deputy Treasurer of other Fidelity funds (2005-present) and is an em- |
| ployee of FMR. Previously, Mr. Mehrmann served as Vice President of |
| Fidelity Investments Institutional Services Group (FIIS)/Fidelity Investments |
| Institutional Operations Corporation, Inc. (FIIOC) Client Services |
| (1998-2004). |
| |
| Kimberley H. Monasterio (41) |
| |
| Year of Election or Appointment: 2004 |
| Deputy Treasurer of Advisor Korea. Ms. Monasterio also serves as Dep- |
| uty Treasurer of other Fidelity funds (2004) and is an employee of FMR |
| (2004). Before joining Fidelity Investments, Ms. Monasterio served as |
| Treasurer (2000-2004) and Chief Financial Officer (2002-2004) of the |
| Franklin Templeton Funds and Senior Vice President of Franklin Temple- |
| ton Services, LLC (2000-2004). |
| |
| Kenneth B. Robins (36) |
| |
| Year of Election or Appointment:2005 |
| Deputy Treasurer of Advisor Korea. Mr. Robins also serves as Deputy |
| Treasurer of other Fidelity funds (2005-present) and is an employee of |
| FMR (2004-present). Before joining Fidelity Investments, Mr. Robins |
| worked at KPMG LLP, where he was a partner in KPMG’s department of |
| professional practice (2002-2004) and a Senior Manager |
| (1999-2000). In addition, Mr. Robins served as Assistant Chief Accoun- |
| tant, United States Securities and Exchange Commission (2000-2002). |
| |
| Robert G. Byrnes (38) |
| |
| Year of Election or Appointment: 2005 |
| Assistant Treasurer of Advisor Korea. Mr. Byrnes also serves as Assistant |
| Treasurer of other Fidelity funds (2005-present) and is an employee of |
| FMR (2005-present). Previously, Mr. Byrnes served as Vice President of |
| FPCMS (2003-2005). Before joining Fidelity Investments, Mr. Byrnes |
| worked at Deutsche Asset Management where he served as Vice Presi- |
| dent of the Investment Operations Group (2000-2003). |
41 Annual Report
Trustees and Officers - continued
| Name, Age; Principal Occupation |
| |
| John H. Costello (59) |
| |
| Year of Election or Appointment: 1986 |
| Assistant Treasurer of Advisor Korea. Mr. Costello also serves as Assis- |
| tant Treasurer of other Fidelity funds and is an employee of FMR. |
| |
| Peter L. Lydecker (51) |
| |
| Year of Election or Appointment: 2004 |
| Assistant Treasurer of Advisor Korea. Mr. Lydecker also serves as Assis- |
| tant Treasurer of other Fidelity funds (2004) and is an employee of FMR. |
| |
| Mark Osterheld (50) |
| |
| Year of Election or Appointment: 2002 |
| Assistant Treasurer of Advisor Korea. Mr. Osterheld also serves as Assis- |
| tant Treasurer of other Fidelity funds (2002) and is an employee of FMR. |
| |
| Gary W. Ryan (47) |
| |
| Year of Election or Appointment: 2005 |
| Assistant Treasurer of Advisor Korea. Mr. Ryan also serves as Assistant |
| Treasurer of other Fidelity funds (2005-present) and is an employee of |
| FMR (2005-present). Previously, Mr. Ryan served as Vice President of |
| Fund Reporting in FPCMS (1999-2005). |
| |
| Salvatore Schiavone (39) |
| |
| Year of Election or Appointment: 2005 |
| Assistant Treasurer of Advisor Korea. Mr. Schiavone also serves as As- |
| sistant Treasurer of other Fidelity funds (2005-present) and is an em- |
| ployee of FMR (2005-present). Before joining Fidelity Investments, Mr. |
| Schiavone worked at Deutsche Asset Management, where he most re- |
| cently served as Assistant Treasurer (2003-2005) of the Scudder Funds |
| and Vice President and Head of Fund Reporting (1996-2003). |
Annual Report 42
The Board of Trustees of Advisor Korea Fund voted to pay to shareholders of record at the opening of business on record date, the following distributions per share derived from capital gains realized from sales of portfolio securities, and dividends derived from net investment income:
| | | Pay Date | | Record Date | | Dividends | | Capital Gains |
| Institutional Class | | 12/5/05 | | 12/2/05 | | $.02 | | $.03 |
The fund will notify shareholders in January 2006 of amounts for use in preparing 2005 income tax returns.
43 Annual Report
Board Approval of Investment Advisory Contracts and Management Fees
Advisor Korea Fund
Each year, typically in July, the Board of Trustees, including the independent Trustees (together, the Board), votes on the renewal of the management contract and sub-advisory agreements (together, the Advisory Contracts) for the fund. The Board, assisted by the advice of fund counsel and independent Trustees’ counsel, requests and considers a broad range of information throughout the year.
The Board meets regularly each month except August and takes into account throughout the year matters bearing on Advisory Contracts. The Board, acting directly and through its separate committees, considers at each of its meetings factors that are relevant to the annual renewal of the fund’s Advisory Contracts, including the services and support provided to the fund and its shareholders by Fidelity. At the time of the renewal, the Board had 11 standing committees, each composed of independent Trustees with varying backgrounds, to which the Board has assigned specific subject matter responsibilities in order to enhance effective decision-making by the Board. Each committee has adopted a written charter outlining the structure and purposes of the committee. One such committee, the Equity Contract Committee, meets periodically during the first six months of each year and as necessary to consider matters specifically related to the annual renewal of Advisory Contracts. The committee requests and receives information on, and makes recommendations to the independent Trustees concerning, the approval and annual review of the Advisory Contracts.
At its July 2005 meeting, the Board of Trustees, including the independent Trustees, unanimously determined to renew the Advisory Contracts for the fund. In reaching its determination, the Board considered all factors it believed relevant, including (1) the nature, extent, and quality of the services to be provided to the fund and its shareholders by Fidelity (including the investment performance of the fund); (2) the competitiveness of the management fee and total expenses of the fund; (3) the total costs of the services to be provided by and the profits to be realized by the investment adviser and its affiliates from the relationship with the fund; (4) the extent to which economies of scale would be realized as the fund grows; and (5) whether fee levels reflect these economies of scale, if any, for the benefit of fund shareholders.
In determining whether to renew the Advisory Contracts for the fund, the Board ultimately reached a determination, with the assistance of fund counsel and independent Trustees’ counsel, that the renewal of the Advisory Contracts and the compensation to be received by Fidelity under the management contract is consistent with Fidelity’s fiduciary duty under applicable law. In addition to evaluating the specific factors noted above, the Board, in reaching its determination, is aware that shareholders in the fund have a broad range of investment choices available to them, including a wide choice among mutual funds offered by competitors to Fidelity, and that the fund’s shareholders, with the opportunity to review and weigh the disclosure provided by the fund in its
prospectus and other public disclosures, have chosen to invest in this fund, managed by Fidelity.
Nature, Extent, and Quality of Services Provided by Fidelity. The Board considered staffing within the investment adviser, FMR, and the sub-advisers (together, the Investment Advisers), including the background of the fund’s portfolio manager and the fund’s investment objective and discipline. The independent Trustees also had discussions with senior management of Fidelity’s investment operations and investment groups. The Board considered the structure of the portfolio manager compensation program and whether this structure provides appropriate incentives.
Fidelity Resources Dedicated to Investment Management and Support Services. The Board reviewed the size, education, and experience of the Investment Advisers’ investment staff, their use of technology, and the Investment Advisers’ approach to recruiting, training, and retaining portfolio managers and other research, advisory, and management personnel. The Board considered Fidelity’s extensive global research capabilities that enable the Investment Advisers to aggregate data from various sources in an effort to produce positive investment results. The Board noted that Fidelity’s analysts have access to a variety of technological tools that enable them to perform both fundamental and quantitative analysis and to specialize in various disciplines. The Board also considered that Fidelity’s portfolio managers and analysts have access to daily portfolio attribution that allows for monitoring of a fund’s portfolio, as well as an electronic communication system that provides immediate real-time access to research concerning issuers and credit enhancers.
Shareholder and Administrative Services. The Board considered the nature, extent, quality, and cost of administrative, distribution, and shareholder services performed by the Investment Advisers and their affiliates under the Advisory Contracts and under separate agreements covering transfer agency, pricing and bookkeeping, and securities lending services for the fund. The Board also considered the nature and extent of the Investment Advisers’ supervision of third party service providers, principally custodians and subcustodians. The Board reviewed the allocation of fund brokerage, including allocations to brokers affiliated with the Investment Advisers, the use of brokerage commissions to pay fund expenses, and the use of “soft” commission dollars to pay for research services. The Board also considered that Fidelity voluntarily decided in 2004 to stop using “soft” commission dollars to pay for market data and, instead, to pay for that data out of its own resources. The Board also considered the resources devoted to, and the record of compliance with, the fund’s compliance policies and procedures.
The Board noted that the growth of fund assets across the complex allows Fidelity to reinvest in the development of services designed to enhance the value or convenience of the Fidelity funds as investment vehicles. These services include 24-hour access to
45 Annual Report
Board Approval of Investment Advisory Contracts and Management Fees - continued
account information and market information through phone representatives and over the Internet, and investor education materials and asset allocation tools.
Investment in a Large Fund Family. The Board considered the benefits to shareholders of investing in a Fidelity fund, including the benefits of investing in a fund that is part of a large family of funds offering a variety of investment disciplines and providing for a large variety of mutual fund investor services. For example, fund shareholders are offered the privilege of exchanging shares of the fund for shares of other Fidelity funds, as set forth in the fund’s prospectus, without paying an additional sales charge. The Board noted that, since the last Advisory Contract renewals in July 2004, Fidelity has taken a number of actions that benefited particular funds, including (i) voluntarily deciding in 2004 to stop using “soft” commission dollars to pay for market data and, instead, to pay for that data out of its own resources, (ii) contractually agreeing to impose management fee reductions and expense limitations on its five Spartan stock index funds and its stock index fund available through variable insurance products, (iii) contractually agreeing to eliminate the management fees on the Fidelity Freedom Funds and the Fidelity Advisor Freedom Funds, (iv) contractually agreeing to reduce the management fees on most of its investment-grade taxable bond funds, and (v) contractually agreeing to impose expense limitations on its retail and Spartan investment-grade taxable bond funds.
Investment Performance and Compliance. The Board considered whether the fund has operated within its investment objective, as well as its record of compliance with its investment restrictions. It also reviewed the fund’s absolute investment performance for each class, as well as the fund’s relative investment performance for each class measured against (i) a broad-based securities market index, and (ii) a peer group of mutual funds over multiple periods. Because the fund had been in existence less than five calendar years, the following charts considered by the Board show, over the one- and three-year periods ended December 31, 2004, the returns of Class C and Institutional Class of the fund, the returns of a broad-based securities market index (“benchmark”), and a range of returns of a peer group of mutual funds identified by Lipper Inc. as having an investment objective similar to that of the fund. The returns of Class C and Institutional Class represent the performance of classes with the highest and lowest 12b-1 fees, respectively (not necessarily with the highest and lowest total expenses). The box within each chart shows the 25th percentile return (bottom of box) and the 75th percentile return (top of box) of the Lipper peer group. Returns shown above the box are in the first quartile and returns shown below the box are in the fourth quartile. The percentage beaten numbers noted below each chart correspond to the percentile box and represent the percentage of funds in the Lipper peer group whose performance was equal to or lower than that of the class indicated.

The Board reviewed the fund’s relative investment performance against its Lipper peer group and stated that the performance of Institutional Class of the fund was in the first quartile for the one-year period and the second quartile for the three-year period. The Board noted that FMR does not consider that Lipper peer group to be a meaningful comparison for the fund, however, because unlike many of its Lipper peers, the fund focuses its investments on securities of Korean issuers. The Board also stated that the relative investment performance of the fund was lower than its benchmark over time. The Board considered that the variations in performance among the fund’s classes reflect the variations in class expenses, which result in lower performance for higher expense classes.
The Board has had thorough discussions with FMR throughout the year about the Board’s and FMR’s concerns about equity research, equity fund performance, and compliance with internal policies governing gifts and entertainment. FMR has taken steps that it believes will refocus and strengthen equity research and equity portfolio management and compliance. The Board noted with favor FMR’s recent reorganization of its senior management team and FMR’s plans to dedicate additional resources to investment research, and participated in the process that led to those changes.
Based on its review, and giving particular weight to the nature and quality of the resources dedicated by the Investment Advisers to maintain and improve relative performance, the Board concluded that the nature, extent, and quality of the services provided by Fidelity will benefit the fund’s shareholders, particularly in light of the Board’s view that the fund’s shareholders benefit from investing in a fund that is part of a large family of funds offering a variety of investment disciplines and services.
47 Annual Report
Board Approval of Investment Advisory Contracts and Management Fees - continued
Competitiveness of Management Fee and Total Fund Expenses. The Board considered the fund’s management fee and total expenses compared to “mapped groups” of competitive funds and classes. Fidelity creates “mapped groups” by combining similar Lipper investment objective categories that have comparable management fee characteristics. Combining Lipper investment objective categories aids the Board’s management fee and total expense comparisons by broadening the competitive group used for comparison and by reducing the number of universes to which various Fidelity funds are compared.
The Board considered two proprietary management fee comparisons for the 12-month periods shown in the chart below. The group of Lipper funds used by the Board for management fee comparisons is referred to below as the “Total Mapped Group” and, for the reasons explained above, is broader than the Lipper peer group used by the Board for performance comparisons. The Total Mapped Group comparison focuses on a fund’s standing relative to the total universe of comparable funds available to investors, in terms of gross management fees before expense reimbursements or caps. “TMG %” represents the percentage of funds in the Total Mapped Group that had management fees that were lower than the fund’s. For example, a TMG % of 25% means that 75% of the funds in the Total Mapped Group had higher management fees than the fund. The “Asset-Size Peer Group” (ASPG) comparison focuses on a fund’s standing relative to non-Fidelity funds similar in size to the fund within the Total Mapped Group. The ASPG represents at least 15% of the funds in the Total Mapped Group with comparable asset size and management fee characteristics, subject to a minimum of 50 funds (or all funds in the Total Mapped Group if fewer than 50). Additional information, such as the ASPG quartile (“quadrant”) in which the fund’s management fee ranked, is also included in the chart and considered by the Board.

The Board noted that the fund’s management fee ranked below the median of its Total Mapped Group and below the median of its ASPG for 2004.
Based on its review, the Board concluded that the fund’s management fee was fair and reasonable in light of the services that the fund receives and the other factors considered.
In its review of each class’s total expenses, the Board considered the fund’s management fee as well as other fund or class expenses, as applicable, such as transfer agent fees, pricing and bookkeeping fees, fund-paid 12b-1 fees, and custodial, legal, and audit fees. The Board also noted the effects of any waivers and reimbursements on fees and expenses. As part of its review, the Board also considered current and historical total expenses of each class of the fund compared to competitive fund median expenses. Each class of the fund is compared to those funds and classes in the Total Mapped Group (used by the Board for management fee comparisons) that have a similar sales load structure.
The Board noted that the total expenses of Class A ranked below its competitive median for 2004, the total expenses of each of Class B and Class C ranked equal to its competitive median for 2004, and the total expenses of each of Class T and Institutional Class ranked above its competitive median for 2004. The Board noted that the fund offers multiple classes, each of which has a different sales load and 12b-1 fee structure, and that the multiple structures are intended to offer a range of pricing options for the intermediary market. The Board also noted that the total expenses of the classes vary primarily by the level of their 12b-1 fees, although differences in transfer agent fees may also cause expenses to vary from class to class.
49 Annual Report
Board Approval of Investment Advisory Contracts and Management Fees - continued
Furthermore, the Board considered that on December 16, 2004, it had approved changes (effective January 1, 2005) in the transfer agent and service agreements for the fund that established maximum transfer agent fees and eliminated the minimum pricing and bookkeeping fee to prevent small funds or funds with small average account sizes from having relatively high fees in basis points (the “small-fund fee reductions”). The Board considered that, if the small-fund fee reductions had been in effect in 2004, the total expenses of each of Class T and Institutional Class would have ranked below the median.
In its review of total expenses, the Board also considered Fidelity fee structures and other information on clients that FMR and its affiliates service in other competitive markets, such as other mutual funds advised or subadvised by FMR or its affiliates, pension plan clients, and other institutional clients.
Based on its review, the Board concluded that the total expenses for each class of the fund were reasonable, although in some cases above the median of the universe presented for comparison, in light of the services that the fund and its shareholders receive and the other factors considered.
Costs of the Services and Profitability. The Board considered the revenues earned and the expenses incurred by Fidelity in conducting the business of developing, marketing, distributing, managing, administering and servicing the fund and its shareholders. The Board also considered the level of Fidelity’s profits in respect of all the Fidelity funds.
On an annual basis, FMR presents to the Board Fidelity’s profitability for the fund. Fidelity calculates the profitability for each fund, as well as aggregate profitability for groups of Fidelity funds and all Fidelity funds, using a series of detailed revenue and cost allocation methodologies which originate with the audited books and records of Fidelity. The Audit Committee of the Board reviews any significant changes from the prior year’s methodologies.
PricewaterhouseCoopers LLP (PwC), independent registered accounting firm and auditor to Fidelity and certain Fidelity funds, has been engaged annually by the Board as part of the Board’s assessment of the results of Fidelity’s profitability analysis. PwC’s engagement includes the review and assessment of Fidelity’s methodologies used in determining the revenues and expenses attributable to Fidelity’s mutual fund business, and completion of agreed-upon procedures surrounding the mathematical accuracy of fund profitability and its conformity to allocation methodologies. After considering PwC’s reports issued under the engagement and information provided by Fidelity, the Board believes that while other allocation methods may also be reasonable, Fidelity’s profitability methodologies are reasonable in all material respects.
The Board has also reviewed Fidelity’s non-fund businesses and any fall-out benefits related to the mutual fund business as well as cases where Fidelity’s affiliates may
benefit from or be related to the fund’s business. In addition, a special committee of the Board reviewed services provided to Fidelity by its affiliates and determined that the fees that Fidelity paid for such services were reasonable.
The Board considered the costs of the services provided by and the profits realized by Fidelity in connection with the operation of the fund and determined that the amount of profit is a fair entrepreneurial profit for the management of the fund.
Economies of Scale. The Board considered whether there have been economies of scale in respect of the management of the Fidelity funds, whether the Fidelity funds (including the fund) have appropriately benefited from any such economies of scale, and whether there is potential for realization of any further economies of scale. The Board considered the extent to which the fund will benefit from economies of scale through increased services to the fund, through waivers or reimbursements, or through fee or expense reductions, including reductions that occur through operation of the transfer agent agreement. The transfer agent fee varies in part based on the number of accounts in the fund. If the number of accounts decreases or the average account size increases, the overall transfer agent fee rate decreases.
The Board recognized that the fund’s management contract incorporates a “group fee” structure, which provides for lower fee rates as total fund assets under FMR’s management increase, and for higher fee rates as total fund assets under FMR’s management decrease. The Board considered that the group fee is designed to deliver the benefits of economies of scale to fund shareholders when total fund assets increase, even if assets of any particular fund are unchanged or have declined, because some portion of Fidelity’s costs are attributable to services provided to all Fidelity funds, and all funds benefit if those costs can be allocated among more assets. The Board concluded that, given the group fee structure, fund shareholders will achieve a certain level of economies of scale as assets under FMR’s management increase at the fund complex level, regardless of whether Fidelity achieves any such economies of scale.
The Board further concluded that any potential economies of scale are being shared between fund shareholders and Fidelity in an appropriate manner.
Additional Information Requested by the Board. In order to develop fully the factual basis for consideration of the Advisory Contracts, the Board requested additional information regarding (i) equity fund transfer agency fees; (ii) Fidelity’s fund profitability methodology and the impact of various changes in the methodology over time; (iii) benefits to shareholders from economies of scale; (iv) composition and characteristics of various fund and industry data used in comparisons; and (v) compensation of portfolio managers and research analysts.
Based on its evaluation of all of the conclusions noted above, and after considering all material factors, the Board ultimately concluded that the existing advisory fee structures are fair and reasonable, and that the fund’s existing Advisory Contracts should be renewed.
51 Annual Report
53 Annual Report
55 Annual Report
Investment Adviser
Fidelity Management & Research Company
Boston, MA
Investment Sub-Advisers
FMR Co., Inc.
Fidelity Management & Research
(U.K.) Inc.
Fidelity Management & Research
(Far East) Inc.
Fidelity International
Investment Advisors
Fidelity Investments Japan Limited
Fidelity International Investment
Advisors (U.K.) Limited
General Distributor
Fidelity Distributors Corporation
Boston, MA
Transfer and Service Agents
Fidelity Investments Institutional
Operations Company, Inc.
Boston, MA
Fidelity Service Company, Inc.
Boston, MA
Custodian
JPMorgan Chase Bank
New York, NY
|


Fidelity® Advisor
Latin America
Fund - Class A, Class T, Class B and Class C
Annual Report October 31, 2005

| Contents | | | | |
| |
| Chairman’s Message | | 4 | | Ned Johnson’s message to shareholders. |
| Performance | | 6 | | How the fund has done over time. |
| Management’s Discussion | | 8 | | The managers’ review of fund |
| | | | | performance, strategy and outlook. |
| Shareholder Expense | | 9 | | An example of shareholder expenses. |
| Example | | | | |
| Investment Changes | | 11 | | A summary of major shifts in the fund’s |
| | | | | investments over the past six months. |
| Investments | | 12 | | A complete list of the fund’s investments |
| | | | | with their market values. |
| Financial Statements | | 16 | | Statements of assets and liabilities, |
| | | | | operations, and changes in net assets, |
| | | | | as well as financial highlights. |
| Notes | | 25 | | Notes to the financial statements. |
| Report of Independent | | 34 | | |
| Registered Public | | | | |
| Accounting Firm | | | | |
| Trustees and Officers | | 35 | | |
| Distributions | | 45 | | |
| Board Approval of | | 46 | | |
| Investment Advisory | | | | |
| Contracts and | | | | |
| Management Fees | | | | |
To view a fund’s proxy voting guidelines and proxy voting record for the 12-month period ended June 30, visit www.fidelity.com/proxyvotingresults or visit the Securities and Exchange Commission’s (SEC) web site at www.sec.gov. You may also call 1-877-208-0098 to request a free copy of the proxy voting guidelines.
Standard & Poor’s, S&P and S&P 500 are registered service marks of The McGraw-Hill Companies, Inc. and have been licensed for use by Fidelity Distributors Corporation.
Other third party marks appearing herein are the property of their respective owners.
All other marks appearing herein are registered or unregistered trademarks or service marks of FMR Corp. or an affiliated company.
The views expressed in this statement reflect those of the portfolio managers only through the end of the period of the report as stated on the cover and do not necessarily represent the views of Fidelity or any other person in the Fidelity organization. Any such views are subject to change at any time based upon market or other conditions and Fidelity disclaims any responsibility to update such views. These views may not be relied on as investment advice and, because investment decisions for a Fidelity fund are based on numerous factors, may not be relied on as an indication of trading intent on behalf of any Fidelity fund.
This report and the financial statements contained herein are submitted for the general information of the shareholders of the fund. This report is not authorized for distribution to prospective investors in the fund unless preceded or accompanied by an effective prospectus.
A fund files its complete schedule of portfolio holdings with the SEC for the first and third quarters of each fiscal year on Form N-Q. Forms N-Q are available on the SEC’s web site at http://www.sec.gov. A fund’s Forms N-Q may be reviewed and copied at the SEC’s Public Reference Room in Washington, DC. Information regarding the operation of the SEC’s Public Reference Room may be obtained by calling 1-800-SEC-0330. For a complete list of a fund’s portfolio holdings, view the most recent quarterly holdings report, semiannual report, or annual report on Fidelity’s web site at http://www.advisor.fidelity.com.
NOT FDIC INSURED · MAY LOSE VALUE · NO BANK GUARANTEE
Neither the fund nor Fidelity Distributors Corporation is a bank.
3 Annual Report
Chairman’s Message
(Photograph of Edward C. Johnson 3d)
Dear Shareholder:
During the past year or so, much has been reported about the mutual fund industry, and much of it has been more critical than I believe is warranted. Allegations that some companies have been less than forthright with their shareholders have cast a shadow on the entire industry. I continue to find these reports disturbing, and assert that they do not create an accurate picture of the industry overall. Therefore, I would like to remind everyone where Fidelity stands on these issues. I will say two things specifically regarding allegations that some mutual fund companies were in violation of the Securities and Exchange Commission’s forward pricing rules or were involved in so-called “market timing” activities.
First, Fidelity has no agreements that permit customers who buy fund shares after 4 p.m. to obtain the 4 p.m. price. This is not a new policy. This is not to say that someone could not deceive the company through fraudulent acts. However, we are extremely diligent in preventing fraud from occurring in this manner — and in every other. But I underscore again that Fidelity has no so-called “agreements” that sanction illegal practices.
Second, Fidelity continues to stand on record, as we have for years, in opposition to predatory short-term trading that adversely affects shareholders in a mutual fund. Back in the 1980s, we initiated a fee — which is returned to the fund and, therefore, to investors — to discourage this activity. Further, we took the lead several years ago in developing a Fair Value Pricing Policy to prevent market timing on foreign securities in our funds. I am confident we will find other ways to make it more difficult for predatory traders to operate. However, this will only be achieved through close cooperation among regulators, legislators and the industry.
Yes, there have been unfortunate instances of unethical and illegal activity within the mutual fund industry from time to time. That is true of any industry. When this occurs, confessed or convicted offenders should be dealt with appropriately. But we are still concerned about the risk of over-regulation and the quick application of simplistic solutions to intricate problems. Every system can be improved, and we support and applaud well thought out improvements by regulators, legislators and industry representatives that achieve the common goal of building and protecting the value of investors’ holdings.
For nearly 60 years, Fidelity has worked very hard to improve its products and service to justify your trust. When our family founded this company in 1946, we had only a few hundred customers. Today, we serve more than 18 million customers including individual investors and participants in retirement plans across America.
Annual Report 4
Let me close by saying that we do not take your trust in us for granted, and we realize that we must always work to improve all aspects of our service to you. In turn, we urge you to continue your active participation with your financial matters, so that your interests can be well served.
Best regards,
/s/Edward C. Johnson 3d
5 Annual Report
Performance: The Bottom Line
Average annual total return reflects the change in the value of an investment, assuming reinvestment of the class’ dividend income and capital gains (the profits earned upon the sale of securities that have grown in value) and assuming a constant rate of performance each year. The $10,000 table and the fund’s returns do not reflect the deduction of taxes that a shareholder would pay on fund distributions or the redemption of fund shares. During periods of reimbursement by Fidelity, a fund’s total return will be greater than it would be had the reimbursement not occurred. How a fund did yesterday is no guarantee of how it will do tomorrow. Returns may reflect the conversion of Class B shares to Class A shares after a maximum of seven years.
| Average Annual Total Returns | | | | | | |
| Periods ended October 31, 2005 | | Past 1 | | Past 5 | | Life of |
| | | year | | years | | fundA |
| Class A (incl. 5.75% sales charge) | | 54.52% | | 15.11% | | 15.44% |
| Class T (incl. 3.50% sales charge) | | 57.84% | | 15.38% | | 15.58% |
| Class B (incl. contingent deferred sales | | | | | | |
| charge)B | | 57.73% | | 15.46% | | 15.63% |
| Class C (incl. contingent deferred sales | | | | | | |
| charge)C | | 61.86% | | 15.67% | | 15.61% |
A From December 21, 1998.
B Class B shares’ contingent deferred sales charges included in the past one year, past five year,
and life of fund total return figures are 5%, 2%, and 0%, respectively.
C Class C shares’ contingent deferred sales charge included in the past one year, past five year, and life of fund total return figures are 1%, 0%, and 0%, respectively.
| | $10,000 Over Life of Fund
|
Let’s say hypothetically that $10,000 was invested in Fidelity® Advisor Latin America Fund — Class T on December 21, 1998, when the fund started, and the current 3.50% sales charge was paid. The chart shows how the value of your investment would have changed, and also shows how the MSCIr Emerging Markets — Latin America Index performed over the same period.
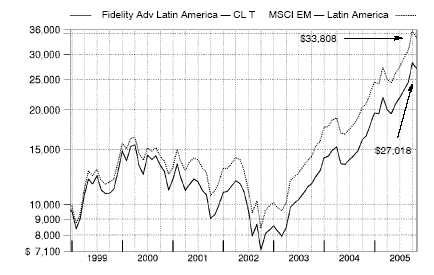
Management’s Discussion of Fund Performance
Comments from Adam Kutas and Brent Bottamini, Co-Portfolio Managers of Fidelity® Advisor Latin America Fund
Emerging-markets stocks posted strong gains for the 12 months ending October 31, 2005, as the Morgan Stanley Capital InternationalSM (MSCI®) Emerging Markets Index soared 34.34% . The lofty return was largely driven by the skyrocketing prices of oil and other commodities. Many emerging markets are commodity exporters — particularly in Latin America — which helped the economies and fiscal health of these countries. As such, the Latin American region generally outperformed other emerging markets. Still, neither of the top two performers were in the Western Hemisphere. Egypt and Jordan topped the index, despite making up less than 1.00% of the index combined on average during the period. Stocks in the Far East posted strong absolute returns, but mostly trailed other emerging markets because they are primarily exporters of technology, which saw diminished demand. South Korea, the largest component of the index during the past year, rose more than 46%. However, Taiwan, the second-largest constituent, was a significant drag, gaining only 4%. Brazil, the largest Latin American component, was up more than 75%.
During the past year, the fund’s Class A, Class T, Class B and Class C shares rose 63.94%, 63.57%, 62.73% and 62.86%, respectively, compared to 61.55% for the MSCI Emerging Markets - - Latin America index and 64.64% for the LipperSM Latin American Funds Average. Versus the index, the fund benefited primarily from security selection in telecommunication services, an overweighting and stock selection in financials, and an underweighting and stock selection in industrials. Our underweighting in Chile and overweighting in Mexico contributed as well. The fund lost ground due to stock selection in materials, and holding a modest stake in cash. The appreciation of local currencies versus the dollar bolstered the fund’s absolute return. The top performers in absolute terms included Mexican wireless company America Movil, Mexican cement producer Cemex, Brazilian energy giant Petrobras and Brazilian mining company Vale do Rio Doce. Several Brazilian bank holdings, such as Unibanco, helped relative to the index. Slight negative performance came from Chile’s Lan Airlines and Peruvian gold producer Buenaventura. Underweighting Vale do Rio Doce held back the fund’s relative performance.
Note to shareholders:
Fidelity Advisor Latin America Fund may invest up to 35% of its total assets in any industry that represents more than 20% of the Latin American market. As of October 31, 2005, the fund did not have more than 25% of its assets invested in any one industry.
The views expressed in this statement reflect those of the portfolio managers only through October 31, 2005. See page 3 for further discussion of this section of the report.
Shareholder Expense Example
As a shareholder of the Fund, you incur two types of costs: (1) transaction costs, including sales charges (loads) on purchase payments or redemption proceeds, redemption fees, and (2) ongoing costs, including management fees, distribution and/or service (12b-1) fees and other Fund expenses. This Example is intended to help you understand your ongoing costs (in dollars) of investing in the Fund and to compare these costs with the ongoing costs of investing in other mutual funds.
The Example is based on an investment of $1,000 invested at the beginning of the period and held for the entire period (May 1, 2005 to October 31, 2005).
The first line of the table below for each class of the Fund provides information about actual account values and actual expenses. You may use the information in this line, together with the amount you invested, to estimate the expenses that you paid over the period. Simply divide your account value by $1,000.00 (for example, an $8,600 account value divided by $1,000.00 = 8.6), then multiply the result by the number in the first line for a class of the Fund under the heading entitled “Expenses Paid During Period” to estimate the expenses you paid on your account during this period.
Hypothetical Example for Comparison Purposes
The second line of the table below for each class of the Fund provides information about hypothetical account values and hypothetical expenses based on a Class’ actual expense ratio and an assumed rate of return of 5% per year before expenses, which is not the Class’ actual return. The hypothetical account values and expenses may not be used to estimate the actual ending account balance or expenses you paid for the period. You may use this information to compare the ongoing costs of investing in the Fund and other funds. To do so, compare this 5% hypothetical example with the 5% hypothetical examples that appear in the shareholder reports of the other funds.
9 Annual Report
Shareholder Expense Example - continued
Please note that the expenses shown in the table are meant to highlight your ongoing costs only and do not reflect any transaction costs. Therefore, the second line of the table is useful in comparing ongoing costs only, and will not help you determine the relative total costs of owning different funds. In addition, if these transactional costs were included, your costs would have been higher.
| | | | | | | | | | | | | Expenses Paid |
| | | | | Beginning | | | | Ending | | | | During Period* |
| | | | | Account Value | | | | Account Value | | | | May 1, 2005 |
| | | | | May 1, 2005 | | | | October 31, 2005 | | to October 31, 2005 |
| Class A | | | | | | | | | | | | |
| Actual | | $ | | 1,000.00 | | $ | | 1,390.70 | | $ | | 9.04 |
| HypotheticalA | | $ | | 1,000.00 | | $ | | 1,017.64 | | $ | | 7.63 |
| Class T | | | | | | | | | | | | |
| Actual | | $ | | 1,000.00 | | $ | | 1,389.30 | | $ | | 10.54 |
| HypotheticalA | | $ | | 1,000.00 | | $ | | 1,016.38 | | $ | | 8.89 |
| Class B | | | | | | | | | | | | |
| Actual | | $ | | 1,000.00 | | $ | | 1,385.20 | | $ | | 13.53 |
| HypotheticalA | | $ | | 1,000.00 | | $ | | 1,013.86 | | $ | | 11.42 |
| Class C | | | | | | | | | | | | |
| Actual | | $ | | 1,000.00 | | $ | | 1,386.40 | | $ | | 13.53 |
| HypotheticalA | | $ | | 1,000.00 | | $ | | 1,013.86 | | $ | | 11.42 |
| Institutional Class | | | | | | | | | | | | |
| Actual | | $ | | 1,000.00 | | $ | | 1,392.40 | | $ | | 7.54 |
| HypotheticalA | | $ | | 1,000.00 | | $ | | 1,018.90 | | $ | | 6.36 |
| |
| A 5% return per year before expenses | | | | | | | | |
* Expenses are equal to each Class’ annualized expense ratio (shown in the table below); multiplied by the average account value over the period, multiplied by 184/365 (to reflect the one-half year period).
| | | Annualized |
| | | Expense Ratio |
| Class A | | 1.50% |
| Class T | | 1.75% |
| Class B | | 2.25% |
| Class C | | 2.25% |
| Institutional Class | | 1.25% |
Investment Changes
| Top Five Stocks as of October 31, 2005 | | | | |
| | | % of fund’s | | % of fund’s net assets |
| | | net assets | | 6 months ago |
| America Movil SA de CV Series L sponsored | | | | |
| ADR (Mexico, Wireless Telecommunication | | | | |
| Services) | | 8.9 | | 8.4 |
| Petroleo Brasileiro SA Petrobras (Brazil, Oil, Gas | | | | |
| & Consumable Fuels) | | 5.8 | | 8.0 |
| Cemex SA de CV sponsored ADR (Mexico, | | | | |
| Construction Materials) | | 5.5 | | 5.1 |
| Banco Bradesco SA (Brazil, Commercial Banks) | | 5.1 | | 3.6 |
| Banco Itau Holding Financeira SA (Brazil, | | | | |
| Commercial Banks) | | 4.9 | | 4.6 |
| | | 30.2 | | |
| Top Five Market Sectors as of October 31, 2005 | | |
| | | % of fund’s | | % of fund’s net assets |
| | | net assets | | 6 months ago |
| Materials | | 28.8 | | 25.1 |
| Telecommunication Services | | 16.5 | | 21.8 |
| Financials | | 13.8 | | 14.0 |
| Energy | | 10.7 | | 13.0 |
| Consumer Staples | | 9.3 | | 10.4 |
| Top Five Countries as of October 31, 2005 | | |
| (excluding cash equivalents) | | % of fund’s | | % of fund’s net assets |
| | | net assets | | 6 months ago |
| Brazil | | 52.1 | | 52.1 |
| Mexico | | 33.6 | | 37.1 |
| Chile | | 4.2 | | 4.5 |
| United States of America | | 2.3 | | 0.0 |
| Canada | | 1.6 | | 0.0 |
| Percentages are adjusted for the effect of open futures contracts, if applicable. | | |
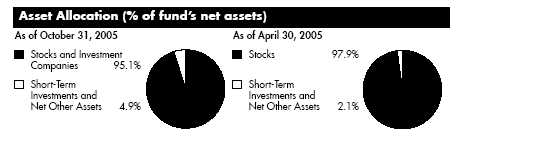
11 Annual Report
| Investments October 31, 2005 | | | | | | |
| Showing Percentage of Net Assets | | | | | | |
| |
| Common Stocks — 93.7% | | | | | | |
| | | Shares | | Value (Note 1) |
| |
| Argentina – 0.1% | | | | | | |
| Cresud S.A.C.I.F.y A. sponsored ADR | | 2,900 | | $ | | 31,871 |
| Brazil – 52.1% | | | | | | |
| AES Tiete SA (PN) | | 7,200,000 | | | | 158,273 |
| Aracruz Celulose SA (PN-B) sponsored ADR | | 8,704 | | | | 333,363 |
| Banco Bradesco SA: | | | | | | |
| (PN) | | 21,614 | | | | 1,112,471 |
| (PN) sponsored ADR (non-vtg.) | | 23,300 | | | | 1,209,037 |
| Banco Itau Holding Financeira SA: | | | | | | |
| (PN) | | 71,490 | | | | 1,705,182 |
| sponsored ADR (non-vtg.) | | 22,500 | | | | 539,100 |
| Banco Nossa Caixa SA | | 6,300 | | | | 104,357 |
| Braskem SA (PN-A) | | 24,300 | | | | 209,245 |
| Centrais Electricas Brasileiras SA (Electrobras) (PN-B) | | 26,859,800 | | | | 464,005 |
| Companhia de Bebidas das Americas (AmBev): | | | | | | |
| (PN) sponsored ADR | | 22,100 | | | | 784,550 |
| sponsored ADR | | 2,460 | | | | 68,708 |
| Companhia de Concessoes Rodoviarias | | 3,900 | | | | 103,900 |
| Companhia de Saneamento Basico do Estado de Sao Paulo | | | | | | |
| (SABESP) sponsored ADR (a) | | 9,000 | | | | 144,450 |
| Companhia Energetica de Minas Gerais (CEMIG) (PN) | | | | | | |
| sponsored ADR (non-vtg.) | | 7,700 | | | | 280,280 |
| Companhia Paranaense de Energia-Copel (PN-B) sponsored | | | | | | |
| ADR | | 9,100 | | | | 67,158 |
| Companhia Siderurgica de Tubarao (CST) (PN) | | 2,338,400 | | | | 144,460 |
| Companhia Siderurgica Nacional SA (CSN) sponsored ADR | | 54,000 | | | | 1,036,800 |
| Companhia Vale do Rio Doce: | | | | | | |
| (PN-A) | | 7,100 | | | | 260,409 |
| (PN-A) sponsored ADR (non-vtg.) (a) | | 39,300 | | | | 1,450,170 |
| sponsored ADR (non-vtg.) | | 39,300 | | | | 1,624,269 |
| Cyrela Brazil Realty SA | | 30,000 | | | | 237,810 |
| Diagnosticos da America SA | | 14,000 | | | | 228,173 |
| Embraer – Empresa Brasileira de Aeronautica SA sponsored | | | | | | |
| ADR | | 6,500 | | | | 252,135 |
| Embratel Participacoes SA sponsored ADR (a)(d) | | 37,100 | | | | 452,620 |
| Energias do Brasil SA | | 15,300 | | | | 154,848 |
| Gerdau SA | | 5,600 | | | | 58,293 |
| Gerdau SA sponsored ADR | | 48,035 | | | | 651,835 |
| Lojas Renner SA | | 11,700 | | | | 311,751 |
| Natura Cosmeticos SA | | 2,800 | | | | 113,141 |
| Petroleo Brasileiro SA Petrobras: | | | | | | |
| (PN) | | 72,800 | | | | 1,034,550 |
| (PN) sponsored ADR (non-vtg.) | | 28,100 | | | | 1,612,097 |
See accompanying notes which are an integral part of the financial statements.
| Common Stocks – continued | | | | |
| | | Shares | | Value (Note 1) |
| |
| Brazil – continued | | | | |
| Petroleo Brasileiro SA Petrobras: – continued | | | | |
| sponsored ADR (non-vtg.) | | 31,100 | | $ 1,987,290 |
| Tam SA (PN) (a) | | 40,200 | | 500,759 |
| Tele Norte Leste Participacoes SA | | 7,400 | | 177,064 |
| Tele Norte Leste Participacoes SA sponsored ADR (non-vtg.) | | 45,568 | | 806,554 |
| Uniao de Bancos Brasileiros SA (Unibanco): | | | | |
| unit | | 7,400 | | 77,621 |
| GDR | | 30,400 | | 1,589,920 |
| Usinas Siderurgicas de Minas Gerais SA (Usiminas) (PN-A) | | 63,700 | | 1,284,297 |
| Votorantim Celulose e Papel SA: | | | | |
| (PN) (non-vtg.) | | 3,180 | | 38,257 |
| sponsored ADR (non-vtg.) | | 45,750 | | 547,628 |
| TOTAL BRAZIL | | | | 23,916,830 |
| |
| Canada – 1.6% | | | | |
| Gerdau AmeriSteel Corp. | | 64,100 | | 304,489 |
| Glamis Gold Ltd. (a) | | 9,000 | | 188,078 |
| Meridian Gold, Inc. (a) | | 11,600 | | 217,561 |
| TOTAL CANADA | | | | 710,128 |
| |
| Cayman Islands – 0.1% | | | | |
| Apex Silver Mines Ltd. (a) | | 3,600 | | 55,152 |
| Chile – 4.2% | | | | |
| Compania Acero del Pacifico SA | | 37,314 | | 473,284 |
| Empresa Nacional de Electricidad SA sponsored ADR | | 15,400 | | 458,612 |
| Enersis SA sponsored ADR | | 36,825 | | 402,497 |
| Lan Airlines SA sponsored ADR | | 16,300 | | 525,186 |
| Vina Concha y Toro SA sponsored ADR | | 2,885 | | 80,722 |
| TOTAL CHILE | | | | 1,940,301 |
| |
| Luxembourg – 0.6% | | | | |
| Tenaris SA sponsored ADR | | 2,484 | | 272,867 |
| Mexico – 33.6% | | | | |
| Alsea SA de CV | | 36,200 | | 90,685 |
| America Movil SA de CV Series L sponsored ADR | | 156,200 | | 4,100,249 |
| Cemex SA de CV sponsored ADR | | 48,444 | | 2,522,479 |
| Consorcio ARA SA de CV | | 44,900 | | 165,721 |
| Corporacion Geo SA de CV Series B (a) | | 144,700 | | 447,542 |
| Fomento Economico Mexicano SA de CV sponsored ADR | | 17,621 | | 1,198,052 |
| Grupo Continental SA Series I | | 99,200 | | 164,168 |
| Grupo Mexico SA de CV Series B | | 454,587 | | 877,059 |
| Grupo Modelo SA de CV Series C | | 129,500 | | 397,529 |
See accompanying notes which are an integral part of the financial statements.
13 Annual Report
| Investments - continued | | | | |
| |
| |
| Common Stocks – continued | | | | |
| | | Shares | | Value (Note 1) |
| |
| Mexico – continued | | | | |
| Grupo Televisa SA de CV (CPO) sponsored ADR | | 17,739 | | $ 1,296,721 |
| Industrias Penoles SA de CV | | 61,200 | | 267,700 |
| Sare Holding SA de CV Series B (a) | | 162,300 | | 167,025 |
| Telefonos de Mexico SA de CV Series L sponsored ADR | | 101,402 | | 2,046,292 |
| Urbi, Desarrollos Urbanos, SA de CV (a) | | 42,600 | | 272,520 |
| Wal-Mart de Mexico SA de CV Series V | | 290,695 | | 1,419,517 |
| TOTAL MEXICO | | | | 15,433,259 |
| |
| Peru – 0.5% | | | | |
| Compania de Minas Buenaventura SA sponsored ADR | | 9,700 | | 249,969 |
| United States of America – 0.9% | | | | |
| Southern Copper Corp. | | 7,700 | | 424,578 |
| TOTAL COMMON STOCKS | | | | |
| (Cost $29,911,392) | | | | 43,034,955 |
| |
| Investment Companies — 1.4% | | | | |
| |
| United States of America – 1.4% | | | | |
| iShares S&P Latin America 40 Index Fund | | | | |
| (Cost $589,069) | | 5,700 | | 657,495 |
| |
| Money Market Funds — 4.8% | | | | |
| |
| Fidelity Cash Central Fund, 3.92% (b) | | 2,039,524 | | 2,039,524 |
| Fidelity Securities Lending Cash Central Fund, 3.94% (b)(c) | | 180,075 | | 180,075 |
| |
| TOTAL MONEY MARKET FUNDS | | | | |
| (Cost $2,219,599) | | | | 2,219,599 |
| |
| TOTAL INVESTMENT PORTFOLIO – 99.9% | | | | |
| (Cost $32,720,060) | | | | 45,912,049 |
| |
| NET OTHER ASSETS – 0.1% | | | | 27,892 |
| NET ASSETS – 100% | | $ | | 45,939,941 |
See accompanying notes which are an integral part of the financial statements.
(a) Non-income producing
(b) Affiliated fund that is available only to investment companies and other accounts managed by Fidelity Investments. The rate quoted is the annualized seven-day yield of the fund at period end. A complete unaudited listing of the fund’s holdings as of its most recent quarter end is available upon request.
(c) Investment made with cash collateral received from securites on loan.
(d) Security or a portion of the security is on loan at period end.
See accompanying notes which are an integral part of the financial statements.
15 Annual Report
| Financial Statements | | | | | | |
| |
| |
| Statement of Assets and Liabilities | | | | | | |
| | | | | | | October 31, 2005 |
| Assets | | | | | | |
| Investment in securities, at value (including securities loaned | | | | |
| of $179,340) (cost $32,720,060) — See accompanying | | | | |
| schedule | | | | $ | | 45,912,049 |
| Receivable for investments sold | | | | | | 483,807 |
| Receivable for fund shares sold | | | | | | 441,254 |
| Dividends receivable | | | | | | 135,133 |
| Interest receivable | | | | | | 2,795 |
| Receivable from investment adviser for expense reductions . | | | | 5,146 |
| Other affiliated receivables | | | | | | 2,420 |
| Other receivables | | | | | | 6,143 |
| Total assets | | | | | | 46,988,747 |
| Liabilities | | | | | | |
| Payable for investments purchased | | $ | | 669,050 | | |
| Payable for fund shares redeemed | | | | 96,812 | | |
| Accrued management fee | | | | 26,446 | | |
| Distribution fees payable | | | | 20,782 | | |
| Other affiliated payables | | | | 13,646 | | |
| Other payables and accrued expenses | | | | 41,995 | | |
| Collateral on securities loaned, at value | | | | 180,075 | | |
| Total liabilities | | | | | | 1,048,806 |
| Net Assets | | | | $ | | 45,939,941 |
| Net Assets consist of: | | | | | | |
| Paid in capital | | | | $ | | 31,225,497 |
| Undistributed net investment income | | | | | | 389,525 |
| Accumulated undistributed net realized gain (loss) on | | | | | | |
| investments and foreign currency transactions | | | | | | 1,131,846 |
| Net unrealized appreciation (depreciation) on investments | | | | |
| and assets and liabilities in foreign currencies | | | | | | 13,193,073 |
| Net Assets | | | | $ | | 45,939,941 |
See accompanying notes which are an integral part of the financial statements.
| Statement of Assets and Liabilities — continued | | | | |
| |
| | | | | October 31, 2005 |
| Calculation of Maximum Offering Price | | | | |
| Class A: | | | | |
| Net Asset Value and redemption price per share | | | | |
| ($13,736,253 ÷ 505,668 shares) | | $ | | 27.16 |
| Maximum offering price per share (100/94.25 of $27.16) | | $ | | 28.82 |
| Class T: | | | | |
| Net Asset Value and redemption price per share | | | | |
| ($9,143,518 ÷ 338,855 shares) | | $ | | 26.98 |
| Maximum offering price per share (100/96.50 of $26.98) | | $ | | 27.96 |
| |
| Class B: | | | | |
| Net Asset Value and offering price per share | | | | |
| ($8,998,326 ÷ 339,045 shares)A | | $ | | 26.54 |
| Class C: | | | | |
| Net Asset Value and offering price per share | | | | |
| ($9,251,592 ÷ 349,337 shares)A | | $ | | 26.48 |
| Institutional Class: | | | | |
| Net Asset Value, offering price and redemption price per | | | | |
| share ($4,810,252 ÷ 174,004 shares) | | $ | | 27.64 |
| A Redemption price per share is equal to net asset value less any applicable contingent deferred sales charge. | | | | |
See accompanying notes which are an integral part of the financial statements.
17 Annual Report
| Financial Statements - continued | | | | | | |
| |
| |
| Statement of Operations | | | | | | |
| | | | | Year ended October 31, 2005 |
| |
| Investment Income | | | | | | |
| Dividends | | | | $ | | 943,049 |
| Interest | | | | | | 24,319 |
| Security lending | | | | | | 300 |
| | | | | | | 967,668 |
| Less foreign taxes withheld | | | | | | (70,446) |
| Total income | | | | | | 897,222 |
| |
| Expenses | | | | | | |
| Management fee | | $ | | 190,972 | | |
| Transfer agent fees | | | | 94,220 | | |
| Distribution fees | | | | 146,190 | | |
| Accounting and security lending fees | | | | 18,633 | | |
| Independent trustees’ compensation | | | | 108 | | |
| Custodian fees and expenses | | | | 48,438 | | |
| Registration fees | | | | 56,552 | | |
| Audit | | | | 39,839 | | |
| Legal | | | | 1,454 | | |
| Miscellaneous | | | | 28 | | |
| Total expenses before reductions | | | | 596,434 | | |
| Expense reductions | | | | (112,048) | | 484,386 |
| |
| Net investment income (loss) | | | | | | 412,836 |
| Realized and Unrealized Gain (Loss) | | | | | | |
| Net realized gain (loss) on: | | | | | | |
| Investment securities | | | | 1,481,275 | | |
| Foreign currency transactions | | | | (22,215) | | |
| Total net realized gain (loss) | | | | | | 1,459,060 |
| Change in net unrealized appreciation (depreciation) on: | | | | |
| Investment securities | | | | 10,528,634 | | |
| Assets and liabilities in foreign currencies | | | | 530 | | |
| Total change in net unrealized appreciation | | | | | | |
| (depreciation) | | | | | | 10,529,164 |
| Net gain (loss) | | | | | | 11,988,224 |
| Net increase (decrease) in net assets resulting from | | | | | | |
| operations | | | | $ | | 12,401,060 |
See accompanying notes which are an integral part of the financial statements.
| Statement of Changes in Net Assets | | | | | | | | |
| | | | | Year ended | | | | Year ended |
| | | | | October 31, | | | | October 31, |
| | | | | 2005 | | | | 2004 |
| Increase (Decrease) in Net Assets | | | | | | | | |
| Operations | | | | | | | | |
| Net investment income (loss) | | $ | | 412,836 | | $ | | 155,744 |
| Net realized gain (loss) | | | | 1,459,060 | | | | 592,441 |
| Change in net unrealized appreciation (depreciation) . | | | | 10,529,164 | | | | 1,802,841 |
| Net increase (decrease) in net assets resulting | | | | | | | | |
| from operations | | | | 12,401,060 | | | | 2,551,026 |
| Distributions to shareholders from net investment income . | | | | (118,538) | | | | (34,709) |
| Share transactions -- net increase (decrease) | | | | 20,231,894 | | | | 5,776,559 |
| Redemption fees | | | | 57,593 | | | | 4,047 |
| Total increase (decrease) in net assets | | | | 32,572,009 | | | | 8,296,923 |
| |
| Net Assets | | | | | | | | |
| Beginning of period | | | | 13,367,932 | | | | 5,071,009 |
| End of period (including undistributed net investment | | | | | | | | |
| income of $389,525 and undistributed net invest- | | | | | | | | |
| ment income of $117,443, respectively) | | $ | | 45,939,941 | | $ | | 13,367,932 |
See accompanying notes which are an integral part of the financial statements.
19 Annual Report
| Financial Highlights — Class A | | | | | | | | | | | | | | |
| Years ended October 31, | | 2005 | | 2004 | | | | 2003 | | | | 2002 | | | | 2001 |
| Selected Per-Share Data | | | | | | | | | | | | | | | | |
| Net asset value, beginning of | | | | | | | | | | | | | | | | |
| period | | $ 16.72 | | $ 12.49 | | $ | | 8.29 | | $ | | 9.62 | | $ 13.26 |
| Income from Investment | | | | | | | | | | | | | | | | |
| Operations | | | | | | | | | | | | | | | | |
| Net investment income (loss)C | | 42 | | .24 | | | | .12 | | | | .09 | | | | .14D |
| Net realized and unrealized | | | | | | | | | | | | | | | | |
| gain (loss) | | 10.14 | | 4.09 | | | | 4.17 | | | | (1.30) | | | | (3.70) |
| Total from investment operations | | 10.56 | | 4.33 | | | | 4.29 | | | | (1.21) | | | | (3.56) |
| Distributions from net investment | | | | | | | | | | | | | | | | |
| income | | (.17) | | (.11) | | | | (.09) | | | | (.12) | | | | — |
| Distributions from net realized | | | | | | | | | | | | | | | | |
| gain | | — | | — | | | | — | | | | — | | | | (.08) |
| Total distributions | | (.17) | | (.11) | | | | (.09) | | | | (.12) | | | | (.08) |
| Redemption fees added to paid in | | | | | | | | | | | | | | | | |
| capitalC | | 05 | | .01 | | | | — | | | | — | | | | — |
| Net asset value, end of period | | $ 27.16 | | $ 16.72 | | $ | | 12.49 | | $ | | 8.29 | | $ | | 9.62 |
| Total ReturnA,B | | 63.94% | | 34.98% | | | | 52.29% | | | | (12.87)% | | | | (26.97)% |
| Ratios to Average Net AssetsE | | | | | | | | | | | | | | | | |
| Expenses before expense | | | | | | | | | | | | | | | | |
| reductions | | 1.93% | | 3.07% | | | | 5.92% | | | | 5.99% | | | | 4.96% |
| Expenses net of voluntary waiv- | | | | | | | | | | | | | | | | |
| ers, if any | | 1.56% | | 2.02% | | | | 2.02% | | | | 2.15% | | | | 2.11% |
| Expenses net of all reductions | | 1.50% | | 1.98% | | | | 2.02% | | | | 2.12% | | | | 2.05% |
| Net investment income (loss) | | 1.88% | | 1.63% | | | | 1.22% | | | | .86% | | | | 1.22% |
| Supplemental Data | | | | | | | | | | | | | | | | |
| Net assets, end of period (000 | | | | | | | | | | | | | | | | |
| omitted) | | $13,736 | | $ 1,954 | | $ | | 918 | | $ | | 428 | | $ | | 546 |
| Portfolio turnover rate | | 42% | | 71% | | | | 67% | | | | 132% | | | | 111% |
A Total returns would have been lower had certain expenses not been reduced during the periods shown.
B Total returns do not include the effect of the sales charges.
C Calculated based on average shares outstanding during the period.
D Investment income per share reflects a special dividend which amounted to $.06 per share.
E Expense ratios reflect operating expenses of the class. Expenses before reductions do not reflect amounts reimbursed by the investment adviser or reductions from brokerage service arrangements or other expense offset arrangements and do not represent the amount paid by the class during periods when reimbursements or reductions occur. Expenses net of any voluntary waivers reflect expenses after reimbursement by the investment adviser but prior to reductions from brokerage service arrangements or other expense offset arrangements. Expenses net of all reductions repre sent the net expenses paid by the class.
See accompanying notes which are an integral part of the financial statements.
| Financial Highlights — Class T | | | | | | | | | | | | |
| Years ended October 31, | | 2005 | | 2004 | | | | 2003 | | | | 2002 | | 2001 |
| Selected Per-Share Data | | | | | | | | | | | | | | |
| Net asset value, beginning of | | | | | | | | | | | | | | |
| period | | $ 16.63 | | $ 12.44 | | $ | | 8.24 | | $ | | 9.57 | | $ 13.21 |
| Income from Investment | | | | | | | | | | | | | | |
| Operations | | | | | | | | | | | | | | |
| Net investment income (loss)C | | 36 | | .20 | | | | .10 | | | | .06 | | .11D |
| Net realized and unrealized | | | | | | | | | | | | | | |
| gain (loss) | | 10.09 | | 4.07 | | | | 4.16 | | | | (1.30) | | (3.67) |
| Total from investment operations | | 10.45 | | 4.27 | | | | 4.26 | | | | (1.24) | | (3.56) |
| Distributions from net investment | | | | | | | | | | | | | | |
| income | | (.15) | | (.09) | | | | (.06) | | | | (.09) | | — |
| Distributions from net realized | | | | | | | | | | | | | | |
| gain | | — | | — | | | | — | | | | — | | (.08) |
| Total distributions | | (.15) | | (.09) | | | | (.06) | | | | (.09) | | (.08) |
| Redemption fees added to paid in | | | | | | | | | | | | | | |
| capitalC | | 05 | | .01 | | | | — | | | | — | | — |
| Net asset value, end of period | | $ 26.98 | | $ 16.63 | | $ | | 12.44 | | $ | | 8.24 | | $ 9.57 |
| Total ReturnA,B | | 63.57% | | 34.59% | | | | 52.06% | | | | (13.18)% | | (27.07)% |
| Ratios to Average Net AssetsE | | | | | | | | | | | | | | |
| Expenses before expense | | | | | | | | | | | | | | |
| reductions | | 2.26% | | 3.47% | | | | 6.58% | | | | 6.65% | | 5.48% |
| Expenses net of voluntary waiv- | | | | | | | | | | | | | | |
| ers, if any | | 1.82% | | 2.27% | | | | 2.27% | | | | 2.40% | | 2.36% |
| Expenses net of all reductions | | 1.77% | | 2.23% | | | | 2.27% | | | | 2.37% | | 2.30% |
| Net investment income (loss) | | 1.61% | | 1.38% | | | | .97% | | | | .61% | | .97% |
| Supplemental Data | | | | | | | | | | | | | | |
| Net assets, end of period (000 | | | | | | | | | | | | | | |
| omitted) | | $ 9,144 | | $ 2,585 | | $ | | 1,315 | | $ | | 836 | | $ 1,124 |
| Portfolio turnover rate | | 42% | | 71% | | | | 67% | | | | 132% | | 111% |
A Total returns would have been lower had certain expenses not been reduced during the periods shown.
B Total returns do not include the effect of the sales charges.
C Calculated based on average shares outstanding during the period.
D Investment income per share reflects a special dividend which amounted to $.06 per share.
E Expense ratios reflect operating expenses of the class. Expenses before reductions do not reflect amounts reimbursed by the investment adviser or reductions from brokerage service arrangements or other expense offset arrangements and do not represent the amount paid by the class during periods when reimbursements or reductions occur. Expenses net of any voluntary waivers reflect expenses after reimbursement by the investment adviser but prior to reductions from brokerage service arrangements or other expense offset arrangements. Expenses net of all reductions repre sent the net expenses paid by the class.
See accompanying notes which are an integral part of the financial statements.
21 Annual Report
| Financial Highlights — Class B | | | | | | | | | | | | |
| Years ended October 31, | | 2005 | | 2004 | | | | 2003 | | | | 2002 | | 2001 |
| Selected Per-Share Data | | | | | | | | | | | | | | |
| Net asset value, beginning of | | | | | | | | | | | | | | |
| period | | $ 16.40 | | $ 12.29 | | $ | | 8.13 | | $ | | 9.44 | | $ 13.08 |
| Income from Investment | | | | | | | | | | | | | | |
| Operations | | | | | | | | | | | | | | |
| Net investment income (loss)C | | 24 | | .13 | | | | .05 | | | | .01 | | .05D |
| Net realized and unrealized | | | | | | | | | | | | | | |
| gain (loss) | | 9.95 | | 4.02 | | | | 4.12 | | | | (1.28) | | (3.61) |
| Total from investment operations | | 10.19 | | 4.15 | | | | 4.17 | | | | (1.27) | | (3.56) |
| Distributions from net investment | | | | | | | | | | | | | | |
| income | | (.10) | | (.05) | | | | (.01) | | | | (.04) | | — |
| Distributions from net realized | | | | | | | | | | | | | | |
| gain | | — | | — | | | | — | | | | — | | (.08) |
| Total distributions | | (.10) | | (.05) | | | | (.01) | | | | (.04) | | (.08) |
| Redemption fees added to paid in | | | | | | | | | | | | | | |
| capitalC | | 05 | | .01 | | | | — | | | | — | | — |
| Net asset value, end of period | | $ 26.54 | | $ 16.40 | | $ | | 12.29 | | $ | | 8.13 | | $ 9.44 |
| Total ReturnA,B | | 62.73% | | 33.95% | | | | 51.35% | | | | (13.56)% | | (27.34)% |
| Ratios to Average Net AssetsE | | | | | | | | | | | | | | |
| Expenses before expense | | | | | | | | | | | | | | |
| reductions | | 2.73% | | 3.67% | | | | 6.80% | | | | 6.90% | | 5.81% |
| Expenses net of voluntary waiv- | | | | | | | | | | | | | | |
| ers, if any | | 2.34% | | 2.77% | | | | 2.77% | | | | 2.90% | | 2.86% |
| Expenses net of all reductions | | 2.28% | | 2.73% | | | | 2.77% | | | | 2.87% | | 2.80% |
| Net investment income (loss) | | 1.10% | | .88% | | | | .47% | | | | .11% | | .46% |
| Supplemental Data | | | | | | | | | | | | | | |
| Net assets, end of period (000 | | | | | | | | | | | | | | |
| omitted) | | $ 8,998 | | $ 3,222 | | $ | | 1,513 | | $ | | 814 | | $ 1,003 |
| Portfolio turnover rate | | 42% | | 71% | | | | 67% | | | | 132% | | 111% |
A Total returns would have been lower had certain expenses not been reduced during the periods shown.
B Total returns do not include the effect of the contingent deferred sales charge.
C Calculated based on average shares outstanding during the period.
D Investment income per share reflects a special dividend which amounted to $.06 per share.
E Expense ratios reflect operating expenses of the class. Expenses before reductions do not reflect amounts reimbursed by the investment adviser or reductions from brokerage service arrangements or other expense offset arrangements and do not represent the amount paid by the class during periods when reimbursements or reductions occur. Expenses net of any voluntary waivers reflect expenses after reimbursement by the investment adviser but prior to reductions from brokerage service arrangements or other expense offset arrangements. Expenses net of all reductions repre sent the net expenses paid by the class.
See accompanying notes which are an integral part of the financial statements.
| Financial Highlights — Class C | | | | | | | | | | | | | | |
| Years ended October 31, | | 2005 | | 2004 | | | | 2003 | | | | 2002 | | | | 2001 |
| Selected Per-Share Data | | | | | | | | | | | | | | | | |
| Net asset value, beginning of | | | | | | | | | | | | | | | | |
| period | | $ 16.35 | | $ 12.25 | | $ | | 8.11 | | $ | | 9.43 | | $ 13.07 |
| Income from Investment | | | | | | | | | | | | | | | | |
| Operations | | | | | | | | | | | | | | | | |
| Net investment income (loss)C | | 24 | | .13 | | | | .05 | | | | .01 | | | | .06D |
| Net realized and unrealized | | | | | | | | | | | | | | | | |
| gain (loss) | | 9.94 | | 4.01 | | | | 4.10 | | | | (1.28) | | | | (3.62) |
| Total from investment operations | | 10.18 | | 4.14 | | | | 4.15 | | | | (1.27) | | | | (3.56) |
| Distributions from net investment | | | | | | | | | | | | | | | | |
| income | | (.10) | | (.05) | | | | (.01) | | | | (.05) | | | | — |
| Distributions from net realized | | | | | | | | | | | | | | | | |
| gain | | — | | — | | | | — | | | | — | | | | (.08) |
| Total distributions | | (.10) | | (.05) | | | | (.01) | | | | (.05) | | | | (.08) |
| Redemption fees added to paid in | | | | | | | | | | | | | | | | |
| capitalC | | 05 | | .01 | | | | — | | | | — | | | | — |
| Net asset value, end of period | | $ 26.48 | | $ 16.35 | | $ | | 12.25 | | $ | | 8.11 | | $ | | 9.43 |
| Total ReturnA,B | | 62.86% | | 33.98% | | | | 51.23% | | | | (13.60)% | | | | (27.36)% |
| Ratios to Average Net AssetsE | | | | | | | | | | | | | | | | |
| Expenses before expense | | | | | | | | | | | | | | | | |
| reductions | | 2.69% | | 3.83% | | | | 6.85% | | | | 6.88% | | | | 5.82% |
| Expenses net of voluntary waiv- | | | | | | | | | | | | | | | | |
| ers, if any | | 2.32% | | 2.77% | | | | 2.77% | | | | 2.90% | | | | 2.86% |
| Expenses net of all reductions | | 2.26% | | 2.73% | | | | 2.77% | | | | 2.87% | | | | 2.79% |
| Net investment income (loss) | | 1.12% | | .88% | | | | .47% | | | | .11% | | | | .47% |
| Supplemental Data | | | | | | | | | | | | | | | | |
| Net assets, end of period (000 | | | | | | | | | | | | | | | | |
| omitted) | | $ 9,252 | | $ 2,167 | | $ | | 1,114 | | $ | | 686 | | $ | | 759 |
| Portfolio turnover rate | | 42% | | 71% | | | | 67% | | | | 132% | | | | 111% |
A Total returns would have been lower had certain expenses not been reduced during the periods shown.
B Total returns do not include the effect of the contingent deferred sales charge.
C Calculated based on average shares outstanding during the period.
D Investment income per share reflects a special dividend which amounted to $.06 per share.
E Expense ratios reflect operating expenses of the class. Expenses before reductions do not reflect amounts reimbursed by the investment adviser or reductions from brokerage service arrangements or other expense offset arrangements and do not represent the amount paid by the class during periods when reimbursements or reductions occur. Expenses net of any voluntary waivers reflect expenses after reimbursement by the investment adviser but prior to reductions from brokerage service arrangements or other expense offset arrangements. Expenses net of all reductions repre sent the net expenses paid by the class.
See accompanying notes which are an integral part of the financial statements.
23 Annual Report
| Financial Highlights — Institutional Class | | | | | | | | | | | | |
| Years ended October 31, | | 2005 | | 2004 | | | | 2003 | | | | 2002 | | | | 2001 |
| Selected Per-Share Data | | | | | | | | | | | | | | | | |
| Net asset value, beginning of | | | | | | | | | | | | | | | | |
| period | | $ 16.97 | | $ 12.64 | | $ | | 8.35 | | $ | | 9.69 | | $ 13.32 |
| Income from Investment | | | | | | | | | | | | | | | | |
| Operations | | | | | | | | | | | | | | | | |
| Net investment income (loss)B | | 46 | | .28 | | | | .14 | | | | .11 | | | | .17C |
| Net realized and unrealized | | | | | | | | | | | | | | | | |
| gain (loss) | | 10.33 | | 4.15 | | | | 4.24 | | | | (1.30) | | | | (3.72) |
| Total from investment operations | | 10.79 | | 4.43 | | | | 4.38 | | | | (1.19) | | | | (3.55) |
| Distributions from net investment | | | | | | | | | | | | | | | | |
| income | | (.17) | | (.11) | | | | (.09) | | | | (.15) | | | | — |
| Distributions from net realized | | | | | | | | | | | | | | | | |
| gain | | — | | — | | | | — | | | | — | | | | (.08) |
| Total distributions | | (.17) | | (.11) | | | | (.09) | | | | (.15) | | | | (.08) |
| Redemption fees added to paid in | | | | | | | | | | | | | | | | |
| capitalB | | 05 | | .01 | | | | — | | | | — | | | | — |
| Net asset value, end of period | | $ 27.64 | | $ 16.97 | | $ | | 12.64 | | $ | | 8.35 | | $ | | 9.69 |
| Total ReturnA | | 64.36% | | 35.36% | | | | 52.99% | | | | (12.65)% | | | | (26.77)% |
| Ratios to Average Net AssetsD | | | | | | | | | | | | | | | | |
| Expenses before expense | | | | | | | | | | | | | | | | |
| reductions | | 1.59% | | 2.14% | | | | 5.40% | | | | 5.49% | | | | 4.54% |
| Expenses net of voluntary waiv- | | | | | | | | | | | | | | | | |
| ers, if any | | 1.36% | | 1.77% | | | | 1.77% | | | | 1.90% | | | | 1.86% |
| Expenses net of all reductions | | 1.30% | | 1.73% | | | | 1.77% | | | | 1.87% | | | | 1.80% |
| Net investment income (loss) | | 2.08% | | 1.88% | | | | 1.47% | | | | 1.11% | | | | 1.46% |
| Supplemental Data | | | | | | | | | | | | | | | | |
| Net assets, end of period (000 | | | | | | | | | | | | | | | | |
| omitted) | | $ 4,810 | | $ 3,440 | | $ | | 210 | | $ | | 285 | | $ | | 344 |
| Portfolio turnover rate | | 42% | | 71% | | | | 67% | | | | 132% | | | | 111% |
A Total returns would have been lower had certain expenses not been reduced during the periods shown.
B Calculated based on average shares outstanding during the period.
C Investment income per share reflects a special dividend which amounted to $.06 per share.
D Expense ratios reflect operating expenses of the class. Expenses before reductions do not reflect amounts reimbursed by the investment adviser or reductions from brokerage service arrangements or other expense offset arrangements and do not represent the amount paid by the class during periods when reimbursements or reductions occur. Expenses net of any voluntary waivers reflect expenses after reimbursement by the investment adviser but prior to reductions from brokerage service arrangements or other expense offset arrangements. Expenses net of all reductions repre sent the net expenses paid by the class.
See accompanying notes which are an integral part of the financial statements.
Notes to Financial Statements
For the period ended October 31, 2005
|
1. Significant Accounting Policies.
Fidelity Advisor Latin America Fund (the fund) is a non-diversified fund of Fidelity Advisor Series VIII (the trust) and is authorized to issue an unlimited number of shares. The trust is registered under the Investment Company Act of 1940, as amended (the 1940 Act), as an open-end management investment company organized as a Massachusetts business trust.
The fund offers Class A, Class T, Class B, Class C, and Institutional Class shares, each of which has equal rights as to assets and voting privileges. Each class has exclusive voting rights with respect to matters that affect that class. Class B shares will automatically convert to Class A shares after a holding period of seven years from the initial date of purchase. Investment income, realized and unrealized capital gains and losses, the common expenses of the fund, and certain fund-level expense reductions, if any, are allocated on a pro rata basis to each class based on the relative net assets of each class to the total net assets of the fund. Each class differs with respect to transfer agent and distribution and service plan fees incurred. Certain expense reductions also differ by class.
The fund’s investments in emerging markets can be subject to social, economic, regulatory, and political uncertainties and can be extremely volatile. The fund may invest in affiliated money market central funds (Money Market Central Funds) which are open-end investment companies available to investment companies and other accounts managed by Fidelity Management & Research Company (FMR) and its affiliates. The financial statements have been prepared in conformity with accounting principles generally accepted in the United States of America, which require management to make certain estimates and assumptions at the date of the financial statements. The following summarizes the significant accounting policies of the fund:
Security Valuation. Investments are valued and net asset value (NAV) per share is calculated (NAV calculation) as of the close of business of the New York Stock Exchange (NYSE), normally 4:00 p.m. Eastern time. Wherever possible, the fund uses independent pricing services approved by the Board of Trustees to value its investments.
Equity securities, including restricted securities, for which market quotations are readily available, are valued at the last reported sale price or official closing price as reported by an independent pricing service on the primary market or exchange on which they are traded. In the event there were no sales during the day or closing prices are not available, securities are valued at the last quoted bid price.
Investments in open-end mutual funds, are valued at their closing net asset value each business day. Short-term securities with remaining maturities of sixty days or less for which quotations are not readily available are valued at amortized cost, which approximates value.
25 Annual Report
Notes to Financial Statements - continued
1. Significant Accounting Policies - continued
Security Valuation - continued
When current market prices or quotations are not readily available or do not accurately reflect fair value, valuations may be determined in accordance with procedures adopted by the Board of Trustees. For example, when developments occur between the close of a market and the close of the NYSE that may materially affect the value of some or all of the securities, or when trading in a security is halted, those securities may be fair valued. Factors used in the determination of fair value may include monitoring news to identify significant market or security specific events such as changes in the value of U.S. securities market, reviewing developments in foreign markets and evaluating the performance of ADRs, futures contracts and exchange-traded funds. Because the fund’s utilization of fair value pricing depends on market activity, the frequency with which fair value pricing is used can not be predicted and may be utilized to a significant extent. The value of securities used for NAV calculation under fair value pricing may differ from published prices for the same securities.
Foreign Currency. The fund uses foreign currency contracts to facilitate transactions in foreign-denominated securities. Losses from these transactions may arise from changes in the value of the foreign currency or if the counterparties do not perform under the contracts’ terms.
Foreign-denominated assets, including investment securities, and liabilities are translated into U.S. dollars at the exchange rate at period end. Purchases and sales of investment securities, income and dividends received and expenses denominated in foreign currencies are translated into U.S. dollars at the exchange rate in effect on the transaction date.
The effects of exchange rate fluctuations on investments are included with the net realized and unrealized gain (loss) on investment securities. Other foreign currency transactions resulting in realized and unrealized gain (loss) are disclosed separately.
Investment Transactions and Income. Security transactions are accounted for as of trade date. Gains and losses on securities sold are determined on the basis of identified cost. Dividend income is recorded on the ex-dividend date, except for certain dividends from foreign securities where the ex-dividend date may have passed, which are recorded as soon as the fund is informed of the ex-dividend date. Non-cash dividends included in dividend income, if any, are recorded at the fair market value of the securities received. Interest income is accrued as earned. Interest income includes coupon interest and amortization of premium and accretion of discount on debt securities. Investment income is recorded net of foreign taxes withheld where recovery of such taxes is uncertain.
1. Significant Accounting Policies - continued
Expenses. Most expenses of the trust can be directly attributed to a fund. Expenses which cannot be directly attributed are apportioned among each fund in the trust.
Income Tax Information and Distributions to Shareholders. Each year, the fund intends to qualify as a regulated investment company by distributing all of its taxable income and realized gains under Subchapter M of the Internal Revenue Code. As a result, no provision for income taxes is required in the accompanying financial statements. Foreign taxes are provided for based on the fund’s understanding of the tax rules and rates that exist in the foreign markets in which it invests.
Distributions are recorded on the ex-dividend date. Income dividends and capital gain distributions are declared separately for each class. Income and capital gain distributions are determined in accordance with income tax regulations, which may differ from generally accepted accounting principles. In addition, the fund will claim a portion of the payment made to redeeming shareholders as a distribution for income tax purposes.
Capital accounts within the financial statements are adjusted for permanent book-tax differences. These adjustments have no impact on net assets or the results of operations. Temporary book-tax differences will reverse in a subsequent period.
Book-tax differences are primarily due to foreign currency transactions, capital loss carryforwards and losses deferred due to wash sales.
The tax-basis components of distributable earnings and the federal tax cost as of period end were as follows:
| Unrealized appreciation | | $ | | 13,441,264 | | | | |
| Unrealized depreciation | | | | (353,467) | | | | |
| Net unrealized appreciation (depreciation) | | | | 13,087,797 | | | | |
| Undistributed ordinary income | | | | 343,753 | | | | |
| Undistributed long-term capital gain | | | | 1,066,983 | | | | |
| |
| Cost for federal income tax purposes | | $ | | 32,824,252 | | | | |
| |
| The tax character of distributions paid was as follows: | | | | |
| | | | | October 31, 2005 | | | | October 31, 2004 |
| Ordinary Income | | $ | | 118,538 | | $ | | 34,709 |
Short-Term Trading (Redemption) Fees. Shares held in the fund less than 90 days are subject to a redemption fee equal to 1.50% of the proceeds of the redeemed shares. All redemption fees, including any estimated redemption fees paid by FMR, are retained by the fund and accounted for as an addition to paid in capital.
27 Annual Report
Notes to Financial Statements - continued
2. Operating Policies.
Repurchase Agreements. FMR has received an Exemptive Order from the Securities and Exchange Commission (the SEC) which permits the fund and other affiliated entities of FMR to transfer uninvested cash balances into joint trading accounts which are then invested in repurchase agreements. The fund may also invest directly with institutions in repurchase agreements. Repurchase agreements are collateralized by government or non-government securities. Collateral is held in segregated accounts with custodian banks and may be obtained in the event of a default of the counterparty. The fund monitors, on a daily basis, the value of the collateral to ensure it is at least equal to the principal amount of the repurchase agreement (including accrued interest). In the event of a default by the counterparty, realization of the collateral proceeds could be delayed, during which time the value of the collateral may decline.
3. Purchases and Sales of Investments.
Purchases and sales of securities, other than short-term securities and U.S. government securities, aggregated $29,764,435 and $10,913,067, respectively.
4. Fees and Other Transactions with Affiliates.
Management Fee. FMR and its affiliates provide the fund with investment management related services for which the fund pays a monthly management fee. The management fee is the sum of an individual fund fee rate that is based on an annual rate of .45% of the fund’s average net assets and a group fee rate that averaged .27% during the period. The group fee rate is based upon the average net assets of all the mutual funds advised by FMR. The group fee rate decreases as assets under management increase and increases as assets under management decrease. For the period, the total annual management fee rate was .72% of the fund’s average net assets.
Distribution and Service Plan. In accordance with Rule 12b-1 of the 1940 Act, the fund has adopted separate Distribution and Service Plans for each class of shares. Certain classes pay Fidelity Distributors Corporation (FDC), an affiliate of FMR, separate Distribution and Service Fees, each of which is based on an annual percentage of each class’ average net assets. In addition, FDC may pay financial intermediaries for selling shares of the fund and providing shareholder support services. For the period, the
4. Fees and Other Transactions with Affiliates - continued
Distribution and Service Plan - continued
Distribution and Service Fee rates and the total amounts paid to and retained by FDC were as follows:
| | | Distribution | | Service | | | | Paid to | | | | Retained |
| | | Fee | | Fee | | | | FDC | | | | by FDC |
| Class A | | 0% | | .25% | | $ | | 14,113 | | $ | | 680 |
| Class T | | 25% | | .25% | | | | 27,600 | | | | 1,386 |
| Class B | | 75% | | .25% | | | | 58,492 | | | | 44,712 |
| Class C | | 75% | | .25% | | | | 45,985 | | | | 23,848 |
| |
| | | | | | | $ | | 146,190 | | $ | | 70,626 |
Sales Load. FDC receives a front-end sales charge of up to 5.75% for selling Class A shares, and 3.50% for selling Class T shares, some of which is paid to financial intermediaries for selling shares of the fund. FDC receives the proceeds of contingent deferred sales charges levied on Class A, Class T, Class B, and Class C redemptions. These charges depend on the holding period. The deferred sales charges range from 5% to 1% for Class B, 1% for Class C, and .25% for certain purchases of Class A and Class T shares.
| For the period, sales charge amounts retained by FDC were as follows: | | |
| | | | | Retained |
| | | | | by FDC |
| Class A | | $ | | 48,230 |
| Class T | | | | 6,142 |
| Class B* | | | | 5,012 |
| Class C* | | | | 8,625 |
| | | $ | | 68,009 |
* When Class B and Class C shares are initially sold, FDC pays commissions from its own resources to financial intermediaries through which the sales are made.
Transfer Agent Fees. Fidelity Investments Institutional Operations Company, Inc. (FIIOC), an affiliate of FMR, is the transfer, dividend disbursing and shareholder servicing agent for each class of the fund. FIIOC receives account fees and asset-based fees that vary according to the account size and type of account of the shareholders of the
29 Annual Report
Notes to Financial Statements - continued
4. Fees and Other Transactions with Affiliates - continued
Transfer Agent Fees - continued
respective classes of the fund. FIIOC pays for typesetting, printing and mailing of shareholder reports, except proxy statements. For the period the total transfer agent fees paid by each class to FIIOC, were as follows:
| | | | | | | % of |
| | | | | | | Average |
| | | | | Amount | | Net Assets |
| Class A | | $ | | 22,350 | | .39 |
| Class T | | | | 24,542 | | .44 |
| Class B | | | | 21,646 | | .37 |
| Class C | | | | 17,042 | | .37 |
| Institutional Class | | | | 8,640 | | .18 |
| | | $ | | 94,220 | | |
Accounting and Security Lending Fees. Fidelity Service Company, Inc. (FSC), an affiliate of FMR, maintains the fund’s accounting records. The accounting fee is based on the level of average net assets for the month. Under a separate contract, FSC administers the security lending program. The security lending fee is based on the number and duration of lending transactions.
Affiliated Central Funds. The fund may invest in Money Market Central Funds which seek preservation of capital and current income and are managed by Fidelity Investments Money Management, Inc. (FIMM), an affiliate of FMR.
The Money Market Central Funds do not pay a management fee. Income distributions earned by the fund are recorded as income in the accompanying financial statements and totaled $24,600 for the period.
Brokerage Commissions. The fund placed a portion of its portfolio transactions with brokerage firms which are affiliates of the investment adviser. The commissions paid to these affiliated firms were $1,306 for the period.
5. Committed Line of Credit.
|
The fund participates with other funds managed by FMR in a $4.2 billion credit facility (the “line of credit”) to be utilized for temporary or emergency purposes to fund shareholder redemptions or for other short-term liquidity purposes. The fund has agreed to pay commitment fees on its pro rata portion of the line of credit. During the period, there were no borrowings on this line of credit.
The fund lends portfolio securities from time to time in order to earn additional income. The fund receives collateral (in the form of U.S. Treasury obligations, letters of credit and/or cash) against the loaned securities and maintains collateral in an amount not less than 100% of the market value of the loaned securities during the period of the loan. The market value of the loaned securities is determined at the close of business of the fund and any additional required collateral is delivered to the fund on the next business day. If the borrower defaults on its obligation to return the securities loaned because of insolvency or other reasons, a fund could experience delays and costs in recovering the securities loaned or in gaining access to the collateral. Cash collateral is invested in the Fidelity Securities Lending Cash Central Fund. The value of loaned securities and cash collateral at period end are disclosed on the fund’s Statement of Assets and Liabilities. Security lending income represents the income earned on investing cash collateral, less fees and expenses associated with the loan, plus any premium payments that may be received on the loan of certain types of securities.
FMR voluntarily agreed to reimburse each class to the extent annual operating expenses exceeded certain levels of average net assets as noted in the table below. Some expenses, for example interest expense, are excluded from this reimbursement.
| The following classes were in reimbursement during the period: | | | | |
| | | Expense | | | | Reimbursement |
| | | Limitations | | | | from adviser |
| Class A | | 2.00% | | -- | | 1.50%* | | $ | | 21,338 |
| Class T | | 2.25% | | -- | | 1.75%* | | | | 24,221 |
| Class B | | 2.75% | | -- | | 2.25%* | | | | 23,322 |
| Class C | | 2.75% | | -- | | 2.25%* | | | | 17,286 |
| Institutional Class | | 1.75% | | -- | | 1.25%* | | | | 11,339 |
| | | | | | | | | $ | | 97,506 |
| * Expense limitation in effect at period end. | | | | | | | | | | |
Many of the brokers with whom FMR places trades on behalf of the fund provided services to the fund in addition to trade execution. These services included payments of certain expenses on behalf of the fund totaling $14,542 for the period.
31 Annual Report
Notes to Financial Statements - continued
8. Other.
The fund’s organizational documents provide former and current trustees and officers with a limited indemnification against liabilities arising in connection with the performance of their duties to the fund. In the normal course of business, the fund may also enter into contracts that provide general indemnifications. The fund’s maximum exposure under these arrangements is unknown as this would be dependent on future claims that may be made against the fund. The risk of material loss from such claims is considered remote.
| 9. Distributions to Shareholders. | | | | | | |
| |
| Distributions to shareholders of each class were as follows: | | | | |
| | | | | Years ended October 31, |
| | | | | 2005 | | | | 2004 |
| From net investment income | | | | | | | | |
| Class A | | $ | | 24,366 | | $ | | 10,215 |
| Class T | | | | 23,671 | | | | 10,212 |
| Class B | | | | 21,602 | | | | 7,001 |
| Class C | | | | 13,964 | | | | 5,151 |
| Institutional Class | | | | 34,935 | | | | 2,130 |
| Total | | $ | | 118,538 | | $ | | 34,709 |
| 10. Share Transactions. | | | | | | | | | | |
| |
| Transactions for each class of shares were as follows: | | | | | | | | |
| | | Shares | | | | | | Dollars |
| | | Years ended October 31, | | | | Years ended October 31, |
| | | 2005 | | 2004 | | | | 2005 | | | | 2004 |
| Class A | | | | | | | | | | | | |
| Shares sold | | 510,169 | | 276,925 | | $ 11,788,852 | | $ | | 4,006,837 |
| Reinvestment of distributions | | 1,263 | | 755 | | | | 23,193 | | | | 10,009 |
| Shares redeemed | | (122,643) | | (234,253) | | | | (2,635,879) | | | | (3,410,954) |
| Net increase (decrease) | | 388,789 | | 43,427 | | $ | | 9,176,166 | | $ | | 605,892 |
| Class T | | | | | | | | | | | | |
| Shares sold | | 375,209 | | 108,101 | | $ | | 8,423,891 | | $ | | 1,626,926 |
| Reinvestment of distributions | | 1,255 | | 741 | | | | 22,942 | | | | 9,793 |
| Shares redeemed | | (193,005) | | (59,194) | | | | (4,421,751) | | | | (847,801) |
| Net increase (decrease) | | 183,459 | | 49,648 | | $ | | 4,025,082 | | $ | | 788,918 |
| Class B | | | | | | | | | | | | |
| Shares sold | | 197,277 | | 125,045 | | $ | | 4,199,916 | | $ | | 1,827,579 |
| Reinvestment of distributions | | 1,091 | | 510 | | | | 19,707 | | | | 6,666 |
| Shares redeemed | | (55,807) | | (52,239) | | | | (1,185,949) | | | | (743,755) |
| Net increase (decrease) | | 142,561 | | 73,316 | | $ | | 3,033,674 | | $ | | 1,090,490 |
| Class C | | | | | | | | | | | | |
| Shares sold | | 307,309 | | 85,290 | | $ | | 6,947,916 | | $ | | 1,256,003 |
| Reinvestment of distributions | | 709 | | 363 | | | | 12,755 | | | | 4,728 |
| Shares redeemed | | (91,202) | | (44,079) | | | | (1,969,800) | | | | (631,163) |
| Net increase (decrease) | | 216,816 | | 41,574 | | $ | | 4,990,871 | | $ | | 629,568 |
| Institutional Class | | | | | | | | | | | | |
| Shares sold | | 58,199 | | 454,651 | | $ | | 1,308,916 | | $ | | 6,720,457 |
| Reinvestment of distributions | | 1,584 | | 131 | | | | 29,523 | | | | 1,760 |
| Shares redeemed | | (88,472) | | (268,729) | | | | (2,332,338) | | | | (4,060,526) |
| Net increase (decrease) | | (28,689) | | 186,053 | | $ | | (993,899) | | $ | | 2,661,691 |
33 Annual Report
Report of Independent Registered Public Accounting Firm
To the Trustees of Fidelity Advisor Series VIII and the Shareholders of Fidelity Advisor Latin America Fund:
In our opinion, the accompanying statement of assets and liabilities, including the schedule of investments, and the related statements of operations and of changes in net assets and the financial highlights present fairly, in all material respects, the financial position of Fidelity Advisor Latin America Fund (a fund of Fidelity Advisor Series VIII) at October 31, 2005 and the results of its operations, the changes in its net assets and the financial highlights for the periods indicated, in conformity with accounting principles generally accepted in the United States of America. These financial statements and financial highlights (hereafter referred to as “financial statements”) are the responsibility of the Fidelity Advisor Latin America Fund’s management; our responsibility is to express an opinion on these financial statements based on our audits. We conducted our audits of these financial statements in accordance with the standards of the Public Company Accounting Oversight Board (United States). Those standards require that we plan and perform the audit to obtain reasonable assurance about whether the financial statements are free of material misstatement. An audit includes examining, on a test basis, evidence supporting the amounts and disclosures in the financial statements, assessing the accounting principles used and significant estimates made by management, and evaluating the overall financial statement presentation. We believe that our audits, which included confirmation of securities at October 31, 2005 by correspondence with the custodian and brokers, provide a reasonable basis for our opinion.
/s/ PricewaterhouseCoopers LLP
PricewaterhouseCoopers LLP
Boston, Massachusetts
December 19, 2005
|
Trustees and Officers
The Trustees, Members of the Advisory Board, and executive officers of the trust and fund, as applicable, are listed below. The Board of Trustees governs the fund and is responsible for protecting the interests of shareholders. The Trustees are experienced executives who meet periodically throughout the year to oversee the fund’s activities, review contractual arrangements with companies that provide services to the fund, and review the fund’s performance. Except for William O. McCoy, Stephen P. Jonas, and Kenneth L. Wolfe, each of the Trustees oversees 322 funds advised by FMR or an affiliate. Mr. McCoy oversees 324 funds advised by FMR or an affiliate. Mr. Jonas and Mr. Wolfe oversee 319 funds advised by FMR or an affiliate.
The Trustees hold office without limit in time except that (a) any Trustee may resign; (b) any Trustee may be removed by written instrument, signed by at least two-thirds of the number of Trustees prior to such removal; (c) any Trustee who requests to be retired or who has become incapacitated by illness or injury may be retired by written instrument signed by a majority of the other Trustees; and (d) any Trustee may be removed at any special meeting of shareholders by a two-thirds vote of the outstanding voting securities of the trust. Each Trustee who is not an interested person (as defined in the 1940 Act) (Independent Trustee), shall retire not later than the last day of the calendar year in which his or her 72nd birthday occurs. The Independent Trustees may waive this mandatory retirement age policy with respect to individual Trustees. The executive officers and Advisory Board Members hold office without limit in time, except that any officer and Advisory Board Member may resign or may be removed by a vote of a majority of the Trustees at any regular meeting or any special meeting of the Trustees. Except as indicated, each individual has held the office shown or other offices in the same company for the past five years.
The fund’s Statement of Additional Information (SAI) includes more information about the Trustees. To request a free copy, call Fidelity at 1-877-208-0098.
| Correspondence intended for each Trustee who is an interested person may be sent to |
| Fidelity Investments, 82 Devonshire Street, Boston, Massachusetts 02109. |
| |
| |
| Name, Age; Principal Occupation |
| |
| Edward C. Johnson 3d (75)** |
| |
| Year of Election or Appointment: 1983 |
| Mr. Johnson is Chairman of the Board of Trustees. Mr. Johnson serves as |
| Chief Executive Officer, Chairman, and a Director of FMR Corp.; a Di- |
| rector and Chairman of the Board and of the Executive Committee of |
| FMR; Chairman and a Director of Fidelity Management & Research (Far |
| East) Inc.; Chairman and a Director of Fidelity Investments Money Man- |
| agement, Inc.; and Chairman (2001-present) and a Director |
| (2000-present) of FMR Co., Inc. |
35 Annual Report
Trustees and Officers - continued
| Name, Age; Principal Occupation |
| |
| Abigail P. Johnson (43)** |
| |
| Year of Election or Appointment: 2001 |
| Ms. Johnson serves as President of Fidelity Employer Services Company |
| (FESCO) (2005-present). She is President and a Director of Fidelity In- |
| vestments Money Management, Inc. (2001-present), FMR Co., Inc. |
| (2001-present), and a Director of FMR Corp. Previously, Ms. Johnson |
| served as President and a Director of FMR (2001-2005), Senior Vice |
| President of the Fidelity funds (2001-2005), and managed a number of |
| Fidelity funds. |
| |
| Stephen P. Jonas (52) |
| |
| Year of Election or Appointment: 2005 |
| Mr. Jonas is Senior Vice President of Advisor Latin America |
| (2005-present). He also serves as Senior Vice President of other Fidelity |
| funds (2005-present). Mr. Jonas is Executive Director of FMR |
| (2005-present). Previously, Mr. Jonas served as President of Fidelity En- |
| terprise Operations and Risk Services (2004-2005), Chief Administra- |
| tive Officer (2002-2004), and Chief Financial Officer of FMR Co. |
| (1998-2000). Mr. Jonas has been with Fidelity Investments since 1987 |
| and has held various financial and management positions including |
| Chief Financial Officer of FMR. In addition, he serves on the Boards of |
| Boston Ballet (2003-present) and Simmons College (2003-present). |
| |
| Robert L. Reynolds (53) |
| |
| Year of Election or Appointment: 2003 |
| Mr. Reynolds is a Director (2003-present) and Chief Operating Officer |
| (2002-present) of FMR Corp. He also serves on the Board at Fidelity |
| Investments Canada, Ltd. (2000-present). Previously, Mr. Reynolds |
| served as President of Fidelity Investments Institutional Retirement Group |
| (1996-2000). |
* Trustees have been determined to be “Interested Trustees” by virtue of, among other things, their affiliation with the trust or various entities under common control with FMR.
** Edward C. Johnson 3d, Trustee, is Abigail P. Johnson’s father.
Correspondence intended for each Independent Trustee (that is, the Trustees other than the Interested Trustees) may be sent to Fidelity Investments, P.O. Box 55235, Boston, Massachusetts 02205-5235.
| Name, Age; Principal Occupation |
| |
| Dennis J. Dirks (57) |
| |
| Year of Election or Appointment: 2005 |
| Prior to his retirement in May 2003, Mr. Dirks was Chief Operating |
| Officer and a member of the Board of The Depository Trust & Clearing |
| Corporation (DTCC) (1999-2003). He also served as President, Chief |
| Operating Officer, and Board member of The Depository Trust |
| Company (DTC) (1999-2003) and President and Board member of the |
| National Securities Clearing Corporation (NSCC) (1999-2003). In addi- |
| tion, Mr. Dirks served as Chief Executive Officer and Board member of |
| the Government Securities Clearing Corporation (2001-2003) and Chief |
| Executive Officer and Board member of the Mortgage-Backed Securities |
| Clearing Corporation (2001-2003). Mr. Dirks also serves as a Trustee of |
| Manhattan College (2005-present). |
| |
| Robert M. Gates (62) |
| |
| Year of Election or Appointment: 1997 |
| Dr. Gates is Vice Chairman of the Independent Trustees (2005-present). |
| Dr. Gates is President of Texas A&M University (2002-present). He was |
| Director of the Central Intelligence Agency (CIA) from 1991 to 1993. |
| From 1989 to 1991, Dr. Gates served as Assistant to the President of |
| the United States and Deputy National Security Advisor. Dr. Gates is a |
| Director of NACCO Industries, Inc. (mining and manufacturing), Parker |
| Drilling Co., Inc. (drilling and rental tools for the energy industry, |
| 2001-present), and Brinker International (restaurant management, |
| 2003-present). Previously, Dr. Gates served as a Director of LucasVarity |
| PLC (automotive components and diesel engines), a Director of TRW Inc. |
| (automotive, space, defense, and information technology), and Dean of |
| the George Bush School of Government and Public Service at Texas |
| A&M University (1999-2001). Dr. Gates also is a Trustee of the Forum |
| for International Policy. |
37 Annual Report
Trustees and Officers - continued
| Name, Age; Principal Occupation |
| |
| George H. Heilmeier (69) |
| |
| Year of Election or Appointment: 2004 |
| Dr. Heilmeier is Chairman Emeritus of Telcordia Technologies (commu- |
| nication software and systems), where prior to his retirement, he served |
| as company Chairman and Chief Executive Officer. He currently serves |
| on the Boards of Directors of The Mitre Corporation (systems engineer- |
| ing and information technology support for the government), and HRL |
| Laboratories (private research and development, 2004-present). He is |
| Chairman of the General Motors Science & Technology Advisory Board |
| and a Life Fellow of the Institute of Electrical and Electronics Engineers |
| (IEEE) (2000-present). Dr. Heilmeier is a member of the Defense Science |
| Board and the National Security Agency Advisory Board. He is also a |
| member of the National Academy of Engineering, the American |
| Academy of Arts and Sciences, and the Board of Overseers of the |
| School of Engineering and Applied Science of the University of Pennsyl- |
| vania. Previously, Dr. Heilmeier served as a Director of TRW Inc. (auto- |
| motive, space, defense, and information technology, 1992-2002), |
| Compaq (1994-2002), Automatic Data Processing, Inc. (ADP) |
| (technology-based business outsourcing, 1995-2002), INET Technolo- |
| gies Inc. (telecommunications network surveillance, 2001-2004), and |
| Teletech Holdings (customer management services). He is the recipient of |
| the 2005 Kyoto Prize in Advanced Technology for his invention of the |
| liquid display. |
| |
| Marie L. Knowles (59) |
| |
| Year of Election or Appointment: 2001 |
| Prior to Ms. Knowles’ retirement in June 2000, she served as Executive |
| Vice President and Chief Financial Officer of Atlantic Richfield Company |
| (ARCO) (diversified energy, 1996-2000). From 1993 to 1996, she was |
| a Senior Vice President of ARCO and President of ARCO Transportation |
| Company. She served as a Director of ARCO from 1996 to 1998. She |
| currently serves as a Director of Phelps Dodge Corporation (copper |
| mining and manufacturing) and McKesson Corporation (healthcare ser- |
| vice, 2002-present). Ms. Knowles is a Trustee of the Brookings Institution |
| and the Catalina Island Conservancy and also serves as a member of |
| the Advisory Board for the School of Engineering of the University of |
| Southern California. |
| Name, Age; Principal Occupation |
| |
| Ned C. Lautenbach (61) |
| |
| Year of Election or Appointment: 2000 |
| Mr. Lautenbach has been a partner of Clayton, Dubilier & Rice, Inc. |
| (private equity investment firm) since September 1998. Previously, Mr. |
| Lautenbach was with the International Business Machines Corporation |
| (IBM) from 1968 until his retirement in 1998. Mr. Lautenbach serves as |
| a Director of Italtel Holding S.p.A. (telecommunications (Milan, Italy), |
| 2004-present) and Eaton Corporation (diversified industrial) as well as |
| the Philharmonic Center for the Arts in Naples, Florida. He also is a |
| member of the Board of Trustees of Fairfield University (2005-present), |
| as well as a member of the Council on Foreign Relations. |
| |
| Marvin L. Mann (72) |
| |
| Year of Election or Appointment: 1993 |
| Mr. Mann is Chairman of the Independent Trustees (2001-present). He is |
| Chairman Emeritus of Lexmark International, Inc. (computer |
| peripherals), where he served as CEO until April 1998, retired as |
| Chairman May 1999, and remains a member of the Board. Prior to |
| 1991, he held the positions of Vice President of International Business |
| Machines Corporation (IBM) and President and General Manager of |
| various IBM divisions and subsidiaries. He is a member of the Executive |
| Committee of the Independent Director’s Council of the Investment Com- |
| pany Institute. In addition, Mr. Mann is a member of the President’s |
| Cabinet at the University of Alabama and the Board of Visitors of the |
| Culverhouse College of Commerce and Business Administration at the |
| University of Alabama. |
| |
| William O. McCoy (72) |
| |
| Year of Election or Appointment: 1997 |
| Prior to his retirement in December 1994, Mr. McCoy was Vice Chair- |
| man of the Board of BellSouth Corporation (telecommunications) and |
| President of BellSouth Enterprises. He is currently a Director of Liberty |
| Corporation (holding company), Duke Realty Corporation (real estate), |
| and Progress Energy, Inc. (electric utility). He is also a partner of Frank- |
| lin Street Partners (private investment management firm) and a member |
| of the Research Triangle Foundation Board. In addition, Mr. McCoy |
| served as the Interim Chancellor (1999-2000) and a member of the |
| Board of Visitors for the University of North Carolina at Chapel Hill and |
| currently serves on the Board of Directors of the University of North |
| Carolina Health Care System and the Board of Visitors of the Kenan- |
| Flagler Business School (University of North Carolina at Chapel Hill). He |
| also served as Vice President of Finance for the University of North Car- |
| olina (16-school system). |
39 Annual Report
Trustees and Officers - continued
| Name, Age; Principal Occupation |
| |
| Cornelia M. Small (61) |
| |
| Year of Election or Appointment: 2005 |
| Ms. Small is a member (2000-present) and Chairperson (2002-present) |
| of the Investment Committee, and a member (2002-present) of the |
| Board of Trustees of Smith College. Previously, she served as Chief In- |
| vestment Officer (1999-2000), Director of Global Equity Investments |
| (1996-1999), and a member of the Board of Directors of Scudder, |
| Stevens & Clark (1990-1997) and Scudder Kemper Investments |
| (1997-1998). In addition, Ms. Small served as Co-Chair (2000-2003) |
| of the Annual Fund for the Fletcher School of Law and Diplomacy. |
| |
| William S. Stavropoulos (66) |
| |
| Year of Election or Appointment: 2001 |
| Mr. Stavropoulos is Chairman of the Board (2000-present) and a Mem- |
| ber of the Board of Directors of The Dow Chemical Company. Since |
| joining The Dow Chemical Company in 1967, Mr. Stavropoulos served |
| in numerous senior management positions, including President |
| (1993-2000; 2002-2003), CEO (1995-2000; 2002-2004), and Chair- |
| man of the Executive Committee (2000-2004). Currently, he is a Direc- |
| tor of NCR Corporation (data warehousing and technology solutions), |
| BellSouth Corporation (telecommunications), Chemical Financial Corpo- |
| ration, Maersk Inc. (industrial conglomerate, 2002-present), and Metal- |
| mark Capital (private equity investment firm, 2005-present). He also |
| serves as a member of the Board of Trustees of the American Enterprise |
| Institute for Public Policy Research. In addition, Mr. Stavropoulos is a |
| member of The Business Council, J.P. Morgan International Council and |
| the University of Notre Dame Advisory Council for the College of |
| Science. |
| |
| Kenneth L. Wolfe (66) |
| |
| Year of Election or Appointment: 2005 |
| Mr. Wolfe also serves as a Trustee (2005-present) or Member of the |
| Advisory Board (2004-present) of other investment companies advised |
| by FMR. Prior to his retirement in 2001, Mr. Wolfe was Chairman and |
| Chief Executive Officer of Hershey Foods Corporation (1993-2001). He |
| currently serves as a member of the boards of Adelphia Communica- |
| tions Corporation (2003-present), Bausch & Lomb, Inc., and Revlon Inc. |
| (2004-present). |
Advisory Board Members and Executive Officers:
Correspondence intended for Mr. Gamper may be sent to Fidelity Investments, P.O. Box 55235, Boston, Massachusetts 02205-5235. Correspondence intended for each executive officer and Mr. Lynch may be sent to Fidelity Investments, 82 Devonshire Street, Boston, Massachusetts 02109.
| Name, Age; Principal Occupation |
| |
| Albert R. Gamper, Jr. (63) |
| |
| Year of Election or Appointment: 2005 |
| Member of the Advisory Board of Fidelity Advisor Series VIII. Prior to his |
| retirement in December 2004, Mr. Gamper served as Chairman of the |
| Board of CIT Group Inc. (commercial finance). During his tenure with |
| CIT Group Inc. Mr. Gamper served in numerous senior management |
| positions, including Chairman (1987-1989; 1999-2001; 2002-2004), |
| Chief Executive Officer (1987-2004), and President (1989-2002). He |
| currently serves as a member of the Board of Directors of Public Service |
| Enterprise Group (utilities, 2001-present), Chairman of the Board of |
| Governors, Rutgers University (2004-present), and Chairman of the |
| Board of Saint Barnabas Health Care System. |
| |
| Peter S. Lynch (61) |
| |
| Year of Election or Appointment: 2003 |
| Member of the Advisory Board of Fidelity Advisor Series VIII. Vice |
| Chairman and a Director of FMR, and Vice Chairman (2001-present) |
| and a Director (2000-present) of FMR Co., Inc. Previously, Mr. Lynch |
| served as a Trustee of the Fidelity funds (1990-2003). In addition, he |
| serves as a Trustee of Boston College, Massachusetts Eye & Ear |
| Infirmary, Historic Deerfield, John F. Kennedy Library, and the Museum |
| of Fine Arts of Boston. |
| |
| Dwight D. Churchill (51) |
| |
| Year of Election or Appointment: 2005 |
| Vice President of Advisor Latin America. Mr. Churchill also serves as |
| Vice President of certain Equity Funds (2005-present) and certain High |
| Income Funds (2005-present). Previously, he served as Head of Fidelity’s |
| Fixed-Income Division (2000-2005), Vice President of Fidelity’s Money |
| Market Funds (2000-2005), Vice President of Fidelity’s Bond Funds, and |
| Senior Vice President of FIMM (2000) and FMR. Mr. Churchill joined |
| Fidelity in 1993 as Vice President and Group Leader of Taxable Fixed- |
| Income Investments. |
41 Annual Report
Trustees and Officers - continued
| Name, Age; Principal Occupation |
| |
| Eric D. Roiter (56) |
| |
| Year of Election or Appointment: 1998 |
| Secretary of Advisor Latin America. He also serves as Secretary of other |
| Fidelity funds; Vice President, General Counsel, and Secretary of FMR |
| Co., Inc. (2001-present) and FMR; Assistant Secretary of Fidelity Man- |
| agement & Research (U.K.) Inc. (2001-present), Fidelity Management & |
| Research (Far East) Inc. (2001-present), and Fidelity Investments Money |
| Management, Inc. (2001-present). Mr. Roiter is an Adjunct Member, |
| Faculty of Law, at Boston College Law School (2003-present). Previously, |
| Mr. Roiter served as Vice President and Secretary of Fidelity Distributors |
| Corporation (FDC) (1998-2005). |
| |
| Stuart Fross (46) |
| |
| Year of Election or Appointment: 2003 |
| Assistant Secretary of Advisor Latin America. Mr. Fross also serves as |
| Assistant Secretary of other Fidelity funds (2003-present), Vice President |
| and Secretary of FDC (2005-present), and is an employee of FMR. |
| |
| Christine Reynolds (47) |
| |
| Year of Election or Appointment: 2004 |
| President, Treasurer, and Anti-Money Laundering (AML) officer of Advi- |
| sor Latin America. Ms. Reynolds also serves as President, Treasurer, and |
| AML officer of other Fidelity funds (2004) and is a Vice President (2003) |
| and an employee (2002) of FMR. Before joining Fidelity Investments, |
| Ms. Reynolds worked at PricewaterhouseCoopers LLP (PwC) |
| (1980-2002), where she was most recently an audit partner with PwC’s |
| investment management practice. |
| |
| Paul M. Murphy (58) |
| |
| Year of Election or Appointment: 2005 |
| Chief Financial Officer of Advisor Latin America. Mr. Murphy also serves as |
| Chief Financial Officer of other Fidelity funds (2005-present). He also |
| serves as Senior Vice President of Fidelity Pricing and Cash Management |
| Services Group (FPCMS). |
| |
| Kenneth A. Rathgeber (58) |
| |
| Year of Election or Appointment: 2004 |
| Chief Compliance Officer of Advisor Latin America. Mr. Rathgeber also |
| serves as Chief Compliance Officer of other Fidelity funds (2004) and |
| Executive Vice President of Risk Oversight for Fidelity Investments |
| (2002). Previously, he served as Executive Vice President and Chief Op- |
| erating Officer for Fidelity Investments Institutional Services Company, |
| Inc. (1998-2002). |
| Name, Age; Principal Occupation |
| |
| John R. Hebble (47) |
| |
| Year of Election or Appointment: 2003 |
| Deputy Treasurer of Advisor Latin America. Mr. Hebble also serves as |
| Deputy Treasurer of other Fidelity funds (2003), and is an employee of |
| FMR. Before joining Fidelity Investments, Mr. Hebble worked at Deutsche |
| Asset Management where he served as Director of Fund Accounting |
| (2002-2003) and Assistant Treasurer of the Scudder Funds |
| (1998-2003). |
| |
| Bryan A. Mehrmann (44) |
| |
| Year of Election or Appointment: 2005 |
| Deputy Treasurer of Advisor Latin America. Mr. Mehrmann also serves |
| as Deputy Treasurer of other Fidelity funds (2005-present) and is an |
| employee of FMR. Previously, Mr. Mehrmann served as Vice President of |
| Fidelity Investments Institutional Services Group (FIIS)/Fidelity Investments |
| Institutional Operations Corporation, Inc. (FIIOC) Client Services |
| (1998-2004). |
| |
| Kimberley H. Monasterio (41) |
| |
| Year of Election or Appointment: 2004 |
| Deputy Treasurer of Advisor Latin America. Ms. Monasterio also serves |
| as Deputy Treasurer of other Fidelity funds (2004) and is an employee |
| of FMR (2004). Before joining Fidelity Investments, Ms. Monasterio |
| served as Treasurer (2000-2004) and Chief Financial Officer |
| (2002-2004) of the Franklin Templeton Funds and Senior Vice President |
| of Franklin Templeton Services, LLC (2000-2004). |
| |
| Kenneth B. Robins (36) |
| |
| Year of Election or Appointment: 2005 |
| Deputy Treasurer of Advisor Latin America. Mr. Robins also serves as |
| Deputy Treasurer of other Fidelity funds (2005-present) and is an em- |
| ployee of FMR (2004-present). Before joining Fidelity Investments, Mr. |
| Robins worked at KPMG LLP, where he was a partner in KPMG’s de- |
| partment of professional practice (2002-2004) and a Senior Manager |
| (1999-2000). In addition, Mr. Robins served as Assistant Chief Accoun- |
| tant, United States Securities and Exchange Commission (2000-2002). |
| |
| Robert G. Byrnes (38) |
| |
| Year of Election or Appointment: 2005 |
| Assistant Treasurer of Advisor Latin America. Mr. Byrnes also serves as |
| Assistant Treasurer of other Fidelity funds (2005-present) and is an em- |
| ployee of FMR (2005-present). Previously, Mr. Byrnes served as Vice |
| President of FPCMS (2003-2005). Before joining Fidelity Investments, |
| Mr. Byrnes worked at Deutsche Asset Management where he served as |
| Vice President of the Investment Operations Group (2000-2003). |
43 Annual Report
Trustees and Officers - continued
| Name, Age; Principal Occupation |
| |
| John H. Costello (59) |
| |
| Year of Election or Appointment: 1998 |
| Assistant Treasurer of Advisor Latin America. Mr. Costello also serves as |
| Assistant Treasurer of other Fidelity funds and is an employee of FMR. |
| |
| Peter L. Lydecker (51) |
| |
| Year of Election or Appointment: 2004 |
| Assistant Treasurer of Advisor Latin America. Mr. Lydecker also serves |
| as Assistant Treasurer of other Fidelity funds (2004) and is an employee |
| of FMR. |
| |
| Mark Osterheld (50) |
| |
| Year of Election or Appointment: 2002 |
| Assistant Treasurer of Advisor Latin America. Mr. Osterheld also serves |
| as Assistant Treasurer of other Fidelity funds (2002) and is an employee |
| of FMR. |
| |
| Gary W. Ryan (47) |
| |
| Year of Election or Appointment: 2005 |
| Assistant Treasurer of Advisor Latin America. Mr. Ryan also serves as |
| Assistant Treasurer of other Fidelity funds (2005-present) and is an em- |
| ployee of FMR (2005-present). Previously, Mr. Ryan served as Vice Pres- |
| ident of Fund Reporting in FPCMS (1999-2005). |
| |
| Salvatore Schiavone (39) |
| |
| Year of Election or Appointment: 2005 |
| Assistant Treasurer of Advisor Latin America. Mr. Schiavone also serves |
| as Assistant Treasurer of other Fidelity funds (2005-present) and is an |
| employee of FMR (2005-present). Before joining Fidelity Investments, |
| Mr. Schiavone worked at Deutsche Asset Management, where he most |
| recently served as Assistant Treasurer (2003-2005) of the Scudder |
| Funds and Vice President and Head of Fund Reporting (1996-2003). |
The Board of Trustees of Advisor Latin America Fund voted to pay to shareholders of record at the opening of business on record date, the following distributions per share derived from capital gains realized from sales of portfolio securities, and dividends derived from net investment income:
| | | Pay Date | | Record Date | | Dividends | | Capital Gains |
| Class A | | 12/05/05 | | 12/02/05 | | $.259 | | $.55 |
| Class T | | 12/05/05 | | 12/02/05 | | $.196 | | $.55 |
| Class B | | 12/05/05 | | 12/02/05 | | $.091 | | $.55 |
| Class C | | 12/05/05 | | 12/02/05 | | $.129 | | $.55 |
The fund hereby designates as capital gain dividends: For dividends with respect to the taxable year ended October 31, 2005, $1,066,983, or if subsequently determined to be different, the net capital gain of such year.
Class A, Class T, Class B, and Class C designates 100% of the dividends distributed during the fiscal year as amounts which may be taken into account as a dividend for purposes of the maximum rate under section 1 (h) (11) of the Internal Revenue Code.
The amounts per share which represent income derived from sources within, and taxes paid to, foreign countries or possessions of the United States are as follows:
| | | Pay Date | | Income | | Taxes |
| Class A | | 12/06/04 | | $.216 | | $.046 |
| Class T | | 12/06/04 | | $.196 | | $.046 |
| Class B | | 12/06/04 | | $.146 | | $.046 |
| Class C | | 12/06/04 | | $.146 | | $.046 |
The fund will notify shareholders in January 2006 of amounts for use in preparing 2005 income tax returns.
45 Annual Report
Board Approval of Investment Advisory Contracts and Management Fees
Advisor Latin America Fund
Each year, typically in July, the Board of Trustees, including the independent Trustees (together, the Board), votes on the renewal of the management contract and sub-advisory agreements (together, the Advisory Contracts) for the fund. The Board, assisted by the advice of fund counsel and independent Trustees’ counsel, requests and considers a broad range of information throughout the year.
The Board meets regularly each month except August and takes into account throughout the year matters bearing on Advisory Contracts. The Board, acting directly and through its separate committees, considers at each of its meetings factors that are relevant to the annual renewal of the fund’s Advisory Contracts, including the services and support provided to the fund and its shareholders by Fidelity. At the time of the renewal, the Board had 11 standing committees, each composed of independent Trustees with varying backgrounds, to which the Board has assigned specific subject matter responsibilities in order to enhance effective decision-making by the Board. Each committee has adopted a written charter outlining the structure and purposes of the committee. One such committee, the Equity Contract Committee, meets periodically during the first six months of each year and as necessary to consider matters specifically related to the annual renewal of Advisory Contracts. The committee requests and receives information on, and makes recommendations to the independent Trustees concerning, the approval and annual review of the Advisory Contracts.
At its July 2005 meeting, the Board of Trustees, including the independent Trustees, unanimously determined to renew the Advisory Contracts for the fund. In reaching its determination, the Board considered all factors it believed relevant, including (1) the nature, extent, and quality of the services to be provided to the fund and its shareholders by Fidelity (including the investment performance of the fund); (2) the competitiveness of the management fee and total expenses of the fund; (3) the total costs of the services to be provided by and the profits to be realized by the investment adviser and its affiliates from the relationship with the fund; (4) the extent to which economies of scale would be realized as the fund grows; and (5) whether fee levels reflect these economies of scale, if any, for the benefit of fund shareholders.
In determining whether to renew the Advisory Contracts for the fund, the Board ultimately reached a determination, with the assistance of fund counsel and independent Trustees’ counsel, that the renewal of the Advisory Contracts and the compensation to be received by Fidelity under the management contract is consistent with Fidelity’s fiduciary duty under applicable law. In addition to evaluating the specific factors noted above, the Board, in reaching its determination, is aware that shareholders in the fund have a broad range of investment choices available to them, including a wide choice among mutual funds offered by competitors to Fidelity, and that the fund’s shareholders, with the opportunity to review and weigh the disclosure provided by the fund in its
prospectus and other public disclosures, have chosen to invest in this fund, managed by Fidelity.
Nature, Extent, and Quality of Services Provided by Fidelity. The Board considered staffing within the investment adviser, FMR, and the sub-advisers (together, the Investment Advisers), including the background of the fund’s portfolio manager and the fund’s investment objective and discipline. The independent Trustees also had discussions with senior management of Fidelity’s investment operations and investment groups. The Board considered the structure of the portfolio manager compensation program and whether this structure provides appropriate incentives.
Fidelity Resources Dedicated to Investment Management and Support Services. The Board reviewed the size, education, and experience of the Investment Advisers’ investment staff, their use of technology, and the Investment Advisers’ approach to recruiting, training, and retaining portfolio managers and other research, advisory, and management personnel. The Board considered Fidelity’s extensive global research capabilities that enable the Investment Advisers to aggregate data from various sources in an effort to produce positive investment results. The Board noted that Fidelity’s analysts have access to a variety of technological tools that enable them to perform both fundamental and quantitative analysis and to specialize in various disciplines. The Board also considered that Fidelity’s portfolio managers and analysts have access to daily portfolio attribution that allows for monitoring of a fund’s portfolio, as well as an electronic communication system that provides immediate real-time access to research concerning issuers and credit enhancers.
Shareholder and Administrative Services. The Board considered the nature, extent, quality, and cost of administrative, distribution, and shareholder services performed by the Investment Advisers and their affiliates under the Advisory Contracts and under separate agreements covering transfer agency, pricing and bookkeeping, and securities lending services for the fund. The Board also considered the nature and extent of the Investment Advisers’ supervision of third party service providers, principally custodians and subcustodians. The Board reviewed the allocation of fund brokerage, including allocations to brokers affiliated with the Investment Advisers, the use of brokerage commissions to pay fund expenses, and the use of “soft” commission dollars to pay for research services. The Board also considered that Fidelity voluntarily decided in 2004 to stop using “soft” commission dollars to pay for market data and, instead, to pay for that data out of its own resources. The Board also considered the resources devoted to, and the record of compliance with, the fund’s compliance policies and procedures.
The Board noted that the growth of fund assets across the complex allows Fidelity to reinvest in the development of services designed to enhance the value or convenience of the Fidelity funds as investment vehicles. These services include 24-hour access to
47 Annual Report
Board Approval of Investment Advisory Contracts and Management Fees - continued
account information and market information through phone representatives and over the Internet, and investor education materials and asset allocation tools.
Investment in a Large Fund Family. The Board considered the benefits to shareholders of investing in a Fidelity fund, including the benefits of investing in a fund that is part of a large family of funds offering a variety of investment disciplines and providing for a large variety of mutual fund investor services. For example, fund shareholders are offered the privilege of exchanging shares of the fund for shares of other Fidelity funds, as set forth in the fund’s prospectus, without paying an additional sales charge. The Board noted that, since the last Advisory Contract renewals in July 2004, Fidelity has taken a number of actions that benefited particular funds, including (i) voluntarily deciding in 2004 to stop using “soft” commission dollars to pay for market data and, instead, to pay for that data out of its own resources, (ii) contractually agreeing to impose management fee reductions and expense limitations on its five Spartan stock index funds and its stock index fund available through variable insurance products, (iii) contractually agreeing to eliminate the management fees on the Fidelity Freedom Funds and the Fidelity Advisor Freedom Funds, (iv) contractually agreeing to reduce the management fees on most of its investment-grade taxable bond funds, and (v) contractually agreeing to impose expense limitations on its retail and Spartan investment-grade taxable bond funds.
Investment Performance and Compliance. The Board considered whether the fund has operated within its investment objective, as well as its record of compliance with its investment restrictions. It also reviewed the fund’s absolute investment performance for each class, as well as the fund’s relative investment performance for each class measured against (i) a broad-based securities market index, and (ii) a peer group of mutual funds deemed appropriate by the Board over multiple periods. The following charts considered by the Board show, over the one-, three-, and five-year periods ended December 31, 2004, the returns of Class C and Institutional Class of the fund, the returns of a broad-based securities market index (“benchmark”), and a range of returns of a peer group of mutual funds identified by Lipper Inc. as having an investment objective similar to that of the fund. The returns of Class C and Institutional Class represent the performance of classes with the highest and lowest 12b-1 fees, respectively (not necessarily with the highest and lowest total expenses). The box within each chart shows the 25th percentile return (bottom of box) and the 75th percentile return (top of box) of the Lipper peer group. Returns shown above the box are in the first quartile and returns shown below the box are in the fourth quartile. The percentage beaten numbers noted below each chart correspond to the percentile box and represent the percentage of funds in the Lipper peer group whose performance was equal to or lower than that of the class indicated.

The Board reviewed the fund’s relative investment performance against its Lipper peer group and stated that the performance of Institutional Class of the fund was in the second quartile for the one- and three-year periods and the third quartile for the five-year period. The Board also stated that the relative investment performance of the fund was lower than its benchmark for certain periods, although the one-year cumulative total return of Institutional Class of the fund compared favorably to its benchmark. The Board considered that the variations in performance among the fund’s classes reflect the variations in class expenses, which result in lower performance for higher expense classes.
The Board has had thorough discussions with FMR throughout the year about the Board’s and FMR’s concerns about equity research, equity fund performance, and compliance with internal policies governing gifts and entertainment. FMR has taken steps that it believes will refocus and strengthen equity research and equity portfolio management and compliance. The Board noted with favor FMR’s recent reorganization of its senior management team and FMR’s plans to dedicate additional resources to investment research, and participated in the process that led to those changes.
Based on its review, and giving particular weight to the nature and quality of the resources dedicated by the Investment Advisers to maintain and improve relative performance, the Board concluded that the nature, extent, and quality of the services provided by Fidelity will benefit the fund’s shareholders, particularly in light of the Board’s view that the fund’s shareholders benefit from investing in a fund that is part of a large family of funds offering a variety of investment disciplines and services.
49 Annual Report
Board Approval of Investment Advisory Contracts and Management Fees - continued
Competitiveness of Management Fee and Total Fund Expenses. The Board considered the fund’s management fee and total expenses compared to “mapped groups” of competitive funds and classes. Fidelity creates “mapped groups” by combining similar Lipper investment objective categories that have comparable management fee characteristics. Combining Lipper investment objective categories aids the Board’s management fee and total expense comparisons by broadening the competitive group used for comparison and by reducing the number of universes to which various Fidelity funds are compared.
The Board considered two proprietary management fee comparisons for the 12-month periods shown in the chart below. The group of Lipper funds used by the Board for management fee comparisons is referred to below as the “Total Mapped Group” and, for the reasons explained above, is broader than the Lipper peer group used by the Board for performance comparisons. The Total Mapped Group comparison focuses on a fund’s standing relative to the total universe of comparable funds available to investors, in terms of gross management fees before expense reimbursements or caps. “TMG %” represents the percentage of funds in the Total Mapped Group that had management fees that were lower than the fund’s. For example, a TMG % of 12% means that 88% of the funds in the Total Mapped Group had higher management fees than the fund. The “Asset-Size Peer Group” (ASPG) comparison focuses on a fund’s standing relative to non-Fidelity funds similar in size to the fund within the Total Mapped Group. The ASPG represents at least 15% of the funds in the Total Mapped Group with comparable asset size and management fee characteristics, subject to a minimum of 50 funds (or all funds in the Total Mapped Group if fewer than 50). Additional information, such as the ASPG quartile (“quadrant”) in which the fund’s management fee ranked, is also included in the chart and considered by the Board.
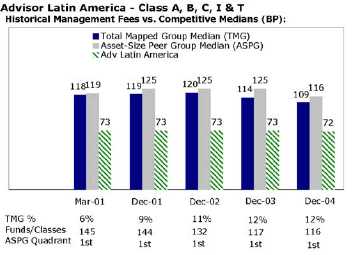
The Board noted that the fund’s management fee ranked below the median of its Total Mapped Group and below the median of its ASPG for 2004.
Based on its review, the Board concluded that the fund’s management fee was fair and reasonable in light of the services that the fund receives and the other factors considered.
In its review of each class’s total expenses, the Board considered the fund’s management fee as well as other fund or class expenses, as applicable, such as transfer agent fees, pricing and bookkeeping fees, fund-paid 12b-1 fees, and custodial, legal, and audit fees. The Board also noted the effects of any waivers and reimbursements on fees and expenses. As part of its review, the Board also considered current and historical total expenses of each class of the fund compared to competitive fund median expenses. Each class of the fund is compared to those funds and classes in the Total Mapped Group (used by the Board for management fee comparisons) that have a similar sales load structure.
The Board noted that the total expenses of Class A ranked below its competitive median for 2004, and the total expenses of each of Class B, Class C, Class T and Institutional Class ranked above its competitive median for 2004. The Board noted that the fund offers multiple classes, each of which has a different sales load and 12b-1 fee structure, and that the multiple structures are intended to offer a range of pricing options for the intermediary market. The Board also noted that the total expenses of the classes vary primarily by the level of their 12b-1 fees, although differences in transfer agent fees may also cause expenses to vary from class to class.
51 Annual Report
Board Approval of Investment Advisory Contracts and Management Fees - continued
Furthermore, the Board considered that on December 16, 2004, it had approved changes (effective January 1, 2005) in the transfer agent and service agreements for the fund that established maximum transfer agent fees and eliminated the minimum pricing and bookkeeping fee to prevent small funds or funds with small average account sizes from having relatively high fees in basis points (the “small-fund fee reductions”). The Board considered that, if the small-fund fee reductions had been in effect in 2004, the total expenses of each of Class B, Class C, Class T and Institutional Class would have ranked below the median.
In its review of total expenses, the Board also considered Fidelity fee structures and other information on clients that FMR and its affiliates service in other competitive markets, such as other mutual funds advised or subadvised by FMR or its affiliates, pension plan clients, and other institutional clients.
Based on its review, the Board concluded that the total expenses for each class of the fund were reasonable, although in some cases above the median of the universe presented for comparison, in light of the services that the fund and its shareholders receive and the other factors considered.
Costs of the Services and Profitability. The Board considered the revenues earned and the expenses incurred by Fidelity in conducting the business of developing, marketing, distributing, managing, administering and servicing the fund and its shareholders. The Board also considered the level of Fidelity’s profits in respect of all the Fidelity funds.
On an annual basis, FMR presents to the Board Fidelity’s profitability for the fund. Fidelity calculates the profitability for each fund, as well as aggregate profitability for groups of Fidelity funds and all Fidelity funds, using a series of detailed revenue and cost allocation methodologies which originate with the audited books and records of Fidelity. The Audit Committee of the Board reviews any significant changes from the prior year’s methodologies.
PricewaterhouseCoopers LLP (PwC), independent registered accounting firm and auditor to Fidelity and certain Fidelity funds, has been engaged annually by the Board as part of the Board’s assessment of the results of Fidelity’s profitability analysis. PwC’s engagement includes the review and assessment of Fidelity’s methodologies used in determining the revenues and expenses attributable to Fidelity’s mutual fund business, and completion of agreed-upon procedures surrounding the mathematical accuracy of fund profitability and its conformity to allocation methodologies. After considering PwC’s reports issued under the engagement and information provided by Fidelity, the Board believes that while other allocation methods may also be reasonable, Fidelity’s profitability methodologies are reasonable in all material respects.
The Board has also reviewed Fidelity’s non-fund businesses and any fall-out benefits related to the mutual fund business as well as cases where Fidelity’s affiliates may benefit from or be related to the fund’s business. In addition, a special committee of the Board reviewed services provided to Fidelity by its affiliates and determined that the fees that Fidelity paid for such services were reasonable.
The Board considered the costs of the services provided by and the profits realized by Fidelity in connection with the operation of the fund and determined that the amount of profit is a fair entrepreneurial profit for the management of the fund.
Economies of Scale. The Board considered whether there have been economies of scale in respect of the management of the Fidelity funds, whether the Fidelity funds (including the fund) have appropriately benefited from any such economies of scale, and whether there is potential for realization of any further economies of scale. The Board considered the extent to which the fund will benefit from economies of scale through increased services to the fund, through waivers or reimbursements, or through fee or expense reductions, including reductions that occur through operation of the transfer agent agreement. The transfer agent fee varies in part based on the number of accounts in the fund. If the number of accounts decreases or the average account size increases, the overall transfer agent fee rate decreases.
The Board recognized that the fund’s management contract incorporates a “group fee” structure, which provides for lower fee rates as total fund assets under FMR’s management increase, and for higher fee rates as total fund assets under FMR’s management decrease. The Board considered that the group fee is designed to deliver the benefits of economies of scale to fund shareholders when total fund assets increase, even if assets of any particular fund are unchanged or have declined, because some portion of Fidelity’s costs are attributable to services provided to all Fidelity funds, and all funds benefit if those costs can be allocated among more assets. The Board concluded that, given the group fee structure, fund shareholders will achieve a certain level of economies of scale as assets under FMR’s management increase at the fund complex level, regardless of whether Fidelity achieves any such economies of scale.
The Board further concluded that any potential economies of scale are being shared between fund shareholders and Fidelity in an appropriate manner.
Additional Information Requested by the Board. In order to develop fully the factual basis for consideration of the Advisory Contracts, the Board requested additional information regarding (i) equity fund transfer agency fees; (ii) Fidelity’s fund profitability methodology and the impact of various changes in the methodology over time; (iii) benefits to shareholders from economies of scale; (iv) composition and characteristics of various fund and industry data used in comparisons; and (v) compensation of portfolio managers and research analysts.
53 Annual Report
Board Approval of Investment Advisory Contracts and Management Fees - continued
Based on its evaluation of all of the conclusions noted above, and after considering all material factors, the Board ultimately concluded that the existing advisory fee structures are fair and reasonable, and that the fund’s existing Advisory Contracts should be renewed.
Investment Adviser
Fidelity Management & Research Company
Boston, MA
Investment Sub-Advisers
FMR Co., Inc.
Fidelity Management & Research
(U.K.) Inc.
Fidelity Management & Research
(Far East) Inc.
Fidelity International
Investment Advisors
Fidelity Investments Japan Limited
Fidelity International Investment
Advisors (U.K.) Limited
General Distributor
Fidelity Distributors Corporation
Boston, MA
Transfer and Service Agents
Fidelity Investments Institutional
Operations Company, Inc.
Boston, MA
Fidelity Service Company, Inc.
Boston, MA
Custodian
State Street Bank and Trust Company
Quincy, MA
|


Fidelity® Advisor
Latin America
Fund - Institutional Class
Annual Report October 31, 2005

| Contents | | | | |
| |
| Chairman’s Message | | 4 | | Ned Johnson’s message to shareholders. |
| Performance | | 6 | | How the fund has done over time. |
| Management’s Discussion | | 7 | | The managers’ review of fund |
| | | | | performance, strategy and outlook. |
| Shareholder Expense | | 8 | | An example of shareholder expenses. |
| Example | | | | |
| Investment Changes | | 10 | | A summary of major shifts in the fund’s |
| | | | | investments over the past six months. |
| Investments | | 11 | | A complete list of the fund’s investments |
| | | | | with their market values. |
| Financial Statements | | 15 | | Statements of assets and liabilities, |
| | | | | operations, and changes in net assets, |
| | | | | as well as financial highlights. |
| Notes | | 24 | | Notes to the financial statements. |
| Report of Independent | | 33 | | |
| Registered Public | | | | |
| Accounting Firm | | | | |
| Trustees and Officers | | 34 | | |
| Distributions | | 44 | | |
| Board Approval of | | 45 | | |
| Investment Advisory | | | | |
| Contracts and | | | | |
| Management Fees | | | | |
To view a fund’s proxy voting guidelines and proxy voting record for the 12-month period ended June 30, visit www.fidelity.com/proxyvotingresults or visit the Securities and Exchange Commission’s (SEC) web site at www.sec.gov. You may also call 1-877-208-0098 to request a free copy of the proxy voting guidelines.
Standard & Poor’s, S&P and S&P 500 are registered service marks of The McGraw-Hill Companies, Inc. and have been licensed for use by Fidelity Distributors Corporation.
Other third party marks appearing herein are the property of their respective owners.
All other marks appearing herein are registered or unregistered trademarks or service marks of FMR Corp. or an affiliated company.
The views expressed in this statement reflect those of the portfolio managers only through the end of the period of the report as stated on the cover and do not necessarily represent the views of Fidelity or any other person in the Fidelity organization. Any such views are subject to change at any time based upon market or other conditions and Fidelity disclaims any responsibility to update such views. These views may not be relied on as investment advice and, because investment decisions for a Fidelity fund are based on numerous factors, may not be relied on as an indication of trading intent on behalf of any Fidelity fund.
This report and the financial statements contained herein are submitted for the general information of the shareholders of the fund. This report is not authorized for distribution to prospective investors in the fund unless preceded or accompanied by an effective prospectus.
A fund files its complete schedule of portfolio holdings with the SEC for the first and third quarters of each fiscal year on Form N-Q. Forms N-Q are available on the SEC’s web site at http://www.sec.gov. A fund’s Forms N-Q may be reviewed and copied at the SEC’s Public Reference Room in Washington, DC. Information regarding the operation of the SEC’s Public Reference Room may be obtained by calling 1-800-SEC-0330. For a complete list of a fund’s portfolio holdings, view the most recent quarterly holdings report, semiannual report, or annual report on Fidelity’s web site at http://www.advisor.fidelity.com.
NOT FDIC INSURED · MAY LOSE VALUE · NO BANK GUARANTEE
Neither the fund nor Fidelity Distributors Corporation is a bank.
3 Annual Report
Chairman’s Message
(Photograph of Edward C. Johnson 3d)
Dear Shareholder:
During the past year or so, much has been reported about the mutual fund industry, and much of it has been more critical than I believe is warranted. Allegations that some companies have been less than forthright with their shareholders have cast a shadow on the entire industry. I continue to find these reports disturbing, and assert that they do not create an accurate picture of the industry overall. Therefore, I would like to remind everyone where Fidelity stands on these issues. I will say two things specifically regarding allegations that some mutual fund companies were in violation of the Securities and Exchange Commission’s forward pricing rules or were involved in so-called “market timing” activities.
First, Fidelity has no agreements that permit customers who buy fund shares after 4 p.m. to obtain the 4 p.m. price. This is not a new policy. This is not to say that someone could not deceive the company through fraudulent acts. However, we are extremely diligent in preventing fraud from occurring in this manner — and in every other. But I underscore again that Fidelity has no so-called “agreements” that sanction illegal practices.
Second, Fidelity continues to stand on record, as we have for years, in opposition to predatory short-term trading that adversely affects shareholders in a mutual fund. Back in the 1980s, we initiated a fee — which is returned to the fund and, therefore, to investors — to discourage this activity. Further, we took the lead several years ago in developing a Fair Value Pricing Policy to prevent market timing on foreign securities in our funds. I am confident we will find other ways to make it more difficult for predatory traders to operate. However, this will only be achieved through close cooperation among regulators, legislators and the industry.
Yes, there have been unfortunate instances of unethical and illegal activity within the mutual fund industry from time to time. That is true of any industry. When this occurs, confessed or convicted offenders should be dealt with appropriately. But we are still concerned about the risk of over-regulation and the quick application of simplistic solutions to intricate problems. Every system can be improved, and we support and applaud well thought out improvements by regulators, legislators and industry representatives that achieve the common goal of building and protecting the value of investors’ holdings.
For nearly 60 years, Fidelity has worked very hard to improve its products and service to justify your trust. When our family founded this company in 1946, we had only a few hundred customers. Today, we serve more than 18 million customers including individual investors and participants in retirement plans across America.
Annual Report 4
Let me close by saying that we do not take your trust in us for granted, and we realize that we must always work to improve all aspects of our service to you. In turn, we urge you to continue your active participation with your financial matters, so that your interests can be well served.
Best regards,
/s/Edward C. Johnson 3d
5 Annual Report
Performance: The Bottom Line
Average annual total return reflects the change in the value of an investment, assuming reinvestment of the class’ dividend income and capital gains (the profits earned upon the sale of securities that have grown in value) and assuming a constant rate of performance each year. The $10,000 table and the fund’s returns do not reflect the deduction of taxes that a shareholder would pay on fund distributions or the redemption of fund shares. During periods of reimbursement by Fidelity, a fund’s total return will be greater than it would be had the reimbursement not occurred. How a fund did yesterday is no guarantee of how it will do tomorrow.
| Average Annual Total Returns | | | | | | |
| Periods ended October 31, 2005 | | Past 1 | | Past 5 | | Life of |
| | | year | | years | | fundA |
| Institutional Class | | 64.36% | | 16.84% | | 16.77% |
| A From December 21, 1998. | | | | | | |
| |
| $10,000 Over Life of Fund | | | | | | |
Let’s say hypothetically that $10,000 was invested in Fidelityr Advisor Latin America Fund — Institutional Class on December 21, 1998, when the fund started. The chart shows how the value of your investment would have changed, and also shows how the MSCIr Emerging Markets — Latin America Index performed over the same period.
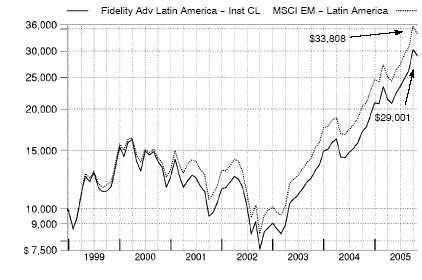
Annual Report 6
Management’s Discussion of Fund Performance
Comments from Adam Kutas and Brent Bottamini, Portfolio Manager of Fidelity® Advisor Latin America Fund
Emerging-markets stocks posted strong gains for the 12 months ending October 31, 2005, as the Morgan Stanley Capital InternationalSM (MSCI®) Emerging Markets Index soared 34.34% . The lofty return was largely driven by the skyrocketing prices of oil and other commodities. Many emerging markets are commodity exporters — particularly in Latin America — which helped the economies and fiscal health of these countries. As such, the Latin American region generally outperformed other emerging markets. Still, neither of the top two performers were in the Western Hemisphere. Egypt and Jordan topped the index, despite making up less than 1.00% of the index combined on average during the period. Stocks in the Far East posted strong absolute returns, but mostly trailed other emerging markets because they are primarily exporters of technology, which saw diminished demand. South Korea, the largest component of the index during the past year, rose more than 46%. However, Taiwan, the second-largest constituent, was a significant drag, gaining only 4%. Brazil, the largest Latin American component, was up more than 75%.
During the past year, the fund’s Institutional Class shares rose 64.36%, compared to 61.55% for the MSCI Emerging Markets — Latin America Index and 64.64% for the LipperSM Latin American Funds Average. Versus the Index, the fund benefited primarily from security selection in telecommunication services, an overweighting and stock selection in financials, and an underweighting and stock selection in industrials. Our underweighting in Chile and overweighting in Mexico contributed as well. The fund lost ground due to stock selection in materials, and holding a modest stake in cash. The appreciation of local currencies versus the dollar bolstered the fund’s absolute return. The top performers in absolute terms included Mexican wireless company America Movil, Mexican cement producer Cemex, Brazilian energy giant Petrobras and Brazilian mining company Vale do Rio Doce. Several Brazilian bank holdings, such as Unibanco, helped relative to the index. Slight negative performance came from Chile’s Lan Airlines and Peruvian gold producer Buenaventura. Underweighting Vale do Rio Doce held back the fund’s relative performance.
Fidelity Advisor Latin America Fund may invest up to 35% of its total assets in any industry that represents more than 20% of the Latin American market. As of October 31, 2005, the fund did not have more than 25% of its assets invested in any one industry.
The views expressed in this statement reflect those of the portfolio managers only through October 31, 2005. See page 3 for further discussion of this section of the report.
Shareholder Expense Example
As a shareholder of the Fund, you incur two types of costs: (1) transaction costs, including sales charges (loads) on purchase payments or redemption proceeds, redemption fees, and (2) ongoing costs, including management fees, distribution and/or service (12b-1) fees and other Fund expenses. This Example is intended to help you understand your ongoing costs (in dollars) of investing in the Fund and to compare these costs with the ongoing costs of investing in other mutual funds.
The Example is based on an investment of $1,000 invested at the beginning of the period and held for the entire period (May 1, 2005 to October 31, 2005).
The first line of the table below for each class of the Fund provides information about actual account values and actual expenses. You may use the information in this line, together with the amount you invested, to estimate the expenses that you paid over the period. Simply divide your account value by $1,000.00 (for example, an $8,600 account value divided by $1,000.00 = 8.6), then multiply the result by the number in the first line for a class of the Fund under the heading entitled “Expenses Paid During Period” to estimate the expenses you paid on your account during this period.
Hypothetical Example for Comparison Purposes
The second line of the table below for each class of the Fund provides information about hypothetical account values and hypothetical expenses based on a Class’ actual expense ratio and an assumed rate of return of 5% per year before expenses, which is not the Class’ actual return. The hypothetical account values and expenses may not be used to estimate the actual ending account balance or expenses you paid for the period. You may use this information to compare the ongoing costs of investing in the Fund and other funds. To do so, compare this 5% hypothetical example with the 5% hypothetical examples that appear in the shareholder reports of the other funds.
Please note that the expenses shown in the table are meant to highlight your ongoing costs only and do not reflect any transaction costs. Therefore, the second line of the table is useful in comparing ongoing costs only, and will not help you determine the relative total costs of owning different funds. In addition, if these transactional costs were included, your costs would have been higher.
| | | | | | | | | | | | | Expenses Paid |
| | | | | Beginning | �� | | | Ending | | | | During Period* |
| | | | | Account Value | | | | Account Value | | | | May 1, 2005 |
| | | | | May 1, 2005 | | | | October 31, 2005 | | to October 31, 2005 |
| Class A | | | | | | | | | | | | |
| Actual | | $ | | 1,000.00 | | $ | | 1,390.70 | | $ | | 9.04 |
| HypotheticalA | | $ | | 1,000.00 | | $ | | 1,017.64 | | $ | | 7.63 |
| Class T | | | | | | | | | | | | |
| Actual | | $ | | 1,000.00 | | $ | | 1,389.30 | | $ | | 10.54 |
| HypotheticalA | | $ | | 1,000.00 | | $ | | 1,016.38 | | $ | | 8.89 |
| Class B | | | | | | | | | | | | |
| Actual | | $ | | 1,000.00 | | $ | | 1,385.20 | | $ | | 13.53 |
| HypotheticalA | | $ | | 1,000.00 | | $ | | 1,013.86 | | $ | | 11.42 |
| Class C | | | | | | | | | | | | |
| Actual | | $ | | 1,000.00 | | $ | | 1,386.40 | | $ | | 13.53 |
| HypotheticalA | | $ | | 1,000.00 | | $ | | 1,013.86 | | $ | | 11.42 |
| Institutional Class | | | | | | | | | | | | |
| Actual | | $ | | 1,000.00 | | $ | | 1,392.40 | | $ | | 7.54 |
| HypotheticalA | | $ | | 1,000.00 | | $ | | 1,018.90 | | $ | | 6.36 |
| |
| A 5% return per year before expenses | | | | | | | | |
* Expenses are equal to each Class’ annualized expense ratio (shown in the table below); multiplied by the average account value over the period, multiplied by 184/365 (to reflect the one-half year period).
| | | Annualized |
| | | Expense Ratio |
| Class A | | 1.50% |
| Class T | | 1.75% |
| Class B | | 2.25% |
| Class C | | 2.25% |
| Institutional Class | | 1.25% |
9 Annual Report
Investment Changes
| Top Five Stocks as of October 31, 2005 | | | | |
| | | % of fund’s | | % of fund’s net assets |
| | | net assets | | 6 months ago |
| America Movil SA de CV Series L sponsored | | | | |
| ADR (Mexico, Wireless Telecommunication | | | | |
| Services) | | 8.9 | | 8.4 |
| Petroleo Brasileiro SA Petrobras (Brazil, Oil, Gas | | | | |
| & Consumable Fuels) | | 5.8 | | 8.0 |
| Cemex SA de CV sponsored ADR (Mexico, | | | | |
| Construction Materials) | | 5.5 | | 5.1 |
| Banco Bradesco SA (Brazil, Commercial Banks) | | 5.1 | | 3.6 |
| Banco Itau Holding Financeira SA (Brazil, | | | | |
| Commercial Banks) | | 4.9 | | 4.6 |
| | | 30.2 | | |
| Top Five Market Sectors as of October 31, 2005 | | |
| | | % of fund’s | | % of fund’s net assets |
| | | net assets | | 6 months ago |
| Materials | | 28.8 | | 25.1 |
| Telecommunication Services | | 16.5 | | 21.8 |
| Financials | | 13.8 | | 14.0 |
| Energy | | 10.7 | | 13.0 |
| Consumer Staples | | 9.3 | | 10.4 |
| Top Five Countries as of October 31, 2005 | | |
| (excluding cash equivalents) | | % of fund’s | | % of fund’s net assets |
| | | net assets | | 6 months ago |
| Brazil | | 52.1 | | 52.1 |
| Mexico | | 33.6 | | 37.1 |
| Chile | | 4.2 | | 4.5 |
| United States of America | | 2.3 | | 0.0 |
| Canada | | 1.6 | | 0.0 |
| Percentages are adjusted for the effect of open futures contracts, if applicable. | | |
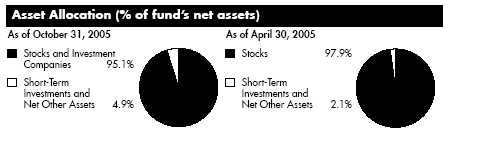
| Investments October 31, 2005 | | | | | | |
| Showing Percentage of Net Assets | | | | | | |
| |
| Common Stocks — 93.7% | | | | | | |
| | | Shares | | Value (Note 1) |
| |
| Argentina – 0.1% | | | | | | |
| Cresud S.A.C.I.F.y A. sponsored ADR | | 2,900 | | $ | | 31,871 |
| Brazil – 52.1% | | | | | | |
| AES Tiete SA (PN) | | 7,200,000 | | | | 158,273 |
| Aracruz Celulose SA (PN-B) sponsored ADR | | 8,704 | | | | 333,363 |
| Banco Bradesco SA: | | | | | | |
| (PN) | | 21,614 | | | | 1,112,471 |
| (PN) sponsored ADR (non-vtg.) | | 23,300 | | | | 1,209,037 |
| Banco Itau Holding Financeira SA: | | | | | | |
| (PN) | | 71,490 | | | | 1,705,182 |
| sponsored ADR (non-vtg.) | | 22,500 | | | | 539,100 |
| Banco Nossa Caixa SA | | 6,300 | | | | 104,357 |
| Braskem SA (PN-A) | | 24,300 | | | | 209,245 |
| Centrais Electricas Brasileiras SA (Electrobras) (PN-B) | | 26,859,800 | | | | 464,005 |
| Companhia de Bebidas das Americas (AmBev): | | | | | | |
| (PN) sponsored ADR | | 22,100 | | | | 784,550 |
| sponsored ADR | | 2,460 | | | | 68,708 |
| Companhia de Concessoes Rodoviarias | | 3,900 | | | | 103,900 |
| Companhia de Saneamento Basico do Estado de Sao Paulo | | | | | | |
| (SABESP) sponsored ADR (a) | | 9,000 | | | | 144,450 |
| Companhia Energetica de Minas Gerais (CEMIG) (PN) | | | | | | |
| sponsored ADR (non-vtg.) | | 7,700 | | | | 280,280 |
| Companhia Paranaense de Energia-Copel (PN-B) sponsored | | | | | | |
| ADR | | 9,100 | | | | 67,158 |
| Companhia Siderurgica de Tubarao (CST) (PN) | | 2,338,400 | | | | 144,460 |
| Companhia Siderurgica Nacional SA (CSN) sponsored ADR | | 54,000 | | | | 1,036,800 |
| Companhia Vale do Rio Doce: | | | | | | |
| (PN-A) | | 7,100 | | | | 260,409 |
| (PN-A) sponsored ADR (non-vtg.) (a) | | 39,300 | | | | 1,450,170 |
| sponsored ADR (non-vtg.) | | 39,300 | | | | 1,624,269 |
| Cyrela Brazil Realty SA | | 30,000 | | | | 237,810 |
| Diagnosticos da America SA | | 14,000 | | | | 228,173 |
| Embraer – Empresa Brasileira de Aeronautica SA sponsored | | | | | | |
| ADR | | 6,500 | | | | 252,135 |
| Embratel Participacoes SA sponsored ADR (a)(d) | | 37,100 | | | | 452,620 |
| Energias do Brasil SA | | 15,300 | | | | 154,848 |
| Gerdau SA | | 5,600 | | | | 58,293 |
| Gerdau SA sponsored ADR | | 48,035 | | | | 651,835 |
| Lojas Renner SA | | 11,700 | | | | 311,751 |
| Natura Cosmeticos SA | | 2,800 | | | | 113,141 |
| Petroleo Brasileiro SA Petrobras: | | | | | | |
| (PN) | | 72,800 | | | | 1,034,550 |
| (PN) sponsored ADR (non-vtg.) | | 28,100 | | | | 1,612,097 |
See accompanying notes which are an integral part of the financial statements.
11 Annual Report
| Investments - continued | | | | |
| |
| |
| Common Stocks – continued | | | | |
| | | Shares | | Value (Note 1) |
| |
| Brazil – continued | | | | |
| Petroleo Brasileiro SA Petrobras: – continued | | | | |
| sponsored ADR (non-vtg.) | | 31,100 | | $ 1,987,290 |
| Tam SA (PN) (a) | | 40,200 | | 500,759 |
| Tele Norte Leste Participacoes SA | | 7,400 | | 177,064 |
| Tele Norte Leste Participacoes SA sponsored ADR (non-vtg.) | | 45,568 | | 806,554 |
| Uniao de Bancos Brasileiros SA (Unibanco): | | | | |
| unit | | 7,400 | | 77,621 |
| GDR | | 30,400 | | 1,589,920 |
| Usinas Siderurgicas de Minas Gerais SA (Usiminas) (PN-A) | | 63,700 | | 1,284,297 |
| Votorantim Celulose e Papel SA: | | | | |
| (PN) (non-vtg.) | | 3,180 | | 38,257 |
| sponsored ADR (non-vtg.) | | 45,750 | | 547,628 |
| TOTAL BRAZIL | | | | 23,916,830 |
| |
| Canada – 1.6% | | | | |
| Gerdau AmeriSteel Corp. | | 64,100 | | 304,489 |
| Glamis Gold Ltd. (a) | | 9,000 | | 188,078 |
| Meridian Gold, Inc. (a) | | 11,600 | | 217,561 |
| TOTAL CANADA | | | | 710,128 |
| |
| Cayman Islands – 0.1% | | | | |
| Apex Silver Mines Ltd. (a) | | 3,600 | | 55,152 |
| Chile – 4.2% | | | | |
| Compania Acero del Pacifico SA | | 37,314 | | 473,284 |
| Empresa Nacional de Electricidad SA sponsored ADR | | 15,400 | | 458,612 |
| Enersis SA sponsored ADR | | 36,825 | | 402,497 |
| Lan Airlines SA sponsored ADR | | 16,300 | | 525,186 |
| Vina Concha y Toro SA sponsored ADR | | 2,885 | | 80,722 |
| TOTAL CHILE | | | | 1,940,301 |
| |
| Luxembourg – 0.6% | | | | |
| Tenaris SA sponsored ADR | | 2,484 | | 272,867 |
| Mexico – 33.6% | | | | |
| Alsea SA de CV | | 36,200 | | 90,685 |
| America Movil SA de CV Series L sponsored ADR | | 156,200 | | 4,100,249 |
| Cemex SA de CV sponsored ADR | | 48,444 | | 2,522,479 |
| Consorcio ARA SA de CV | | 44,900 | | 165,721 |
| Corporacion Geo SA de CV Series B (a) | | 144,700 | | 447,542 |
| Fomento Economico Mexicano SA de CV sponsored ADR | | 17,621 | | 1,198,052 |
| Grupo Continental SA Series I | | 99,200 | | 164,168 |
| Grupo Mexico SA de CV Series B | | 454,587 | | 877,059 |
| Grupo Modelo SA de CV Series C | | 129,500 | | 397,529 |
See accompanying notes which are an integral part of the financial statements.
| Common Stocks – continued | | | | |
| | | Shares | | Value (Note 1) |
| |
| Mexico – continued | | | | |
| Grupo Televisa SA de CV (CPO) sponsored ADR | | 17,739 | | $ 1,296,721 |
| Industrias Penoles SA de CV | | 61,200 | | 267,700 |
| Sare Holding SA de CV Series B (a) | | 162,300 | | 167,025 |
| Telefonos de Mexico SA de CV Series L sponsored ADR | | 101,402 | | 2,046,292 |
| Urbi, Desarrollos Urbanos, SA de CV (a) | | 42,600 | | 272,520 |
| Wal-Mart de Mexico SA de CV Series V | | 290,695 | | 1,419,517 |
| TOTAL MEXICO | | | | 15,433,259 |
| |
| Peru – 0.5% | | | | |
| Compania de Minas Buenaventura SA sponsored ADR | | 9,700 | | 249,969 |
| United States of America – 0.9% | | | | |
| Southern Copper Corp. | | 7,700 | | 424,578 |
| TOTAL COMMON STOCKS | | | | |
| (Cost $29,911,392) | | | | 43,034,955 |
| |
| Investment Companies — 1.4% | | | | |
| |
| United States of America – 1.4% | | | | |
| iShares S&P Latin America 40 Index Fund | | | | |
| (Cost $589,069) | | 5,700 | | 657,495 |
| |
| Money Market Funds — 4.8% | | | | |
| |
| Fidelity Cash Central Fund, 3.92% (b) | | 2,039,524 | | 2,039,524 |
| Fidelity Securities Lending Cash Central Fund, 3.94% (b)(c) | | 180,075 | | 180,075 |
| |
| TOTAL MONEY MARKET FUNDS | | | | |
| (Cost $2,219,599) | | | | 2,219,599 |
| |
| TOTAL INVESTMENT PORTFOLIO – 99.9% | | | | |
| (Cost $32,720,060) | | | | 45,912,049 |
| |
| NET OTHER ASSETS – 0.1% | | | | 27,892 |
| NET ASSETS – 100% | | $ | | 45,939,941 |
See accompanying notes which are an integral part of the financial statements.
13 Annual Report
(a) Non-income producing
(b) Affiliated fund that is available only to investment companies and other accounts managed by Fidelity Investments. The rate quoted is the annualized seven-day yield of the fund at period end. A complete unaudited listing of the fund’s holdings as of its most recent quarter end is available upon request.
(c) Investment made with cash collateral received from securites on loan.
(d) Security or a portion of the security is on loan at period end.
Investments - continued
Legend
|
See accompanying notes which are an integral part of the financial statements.
| Financial Statements | | | | | | |
| |
| |
| Statement of Assets and Liabilities | | | | | | |
| | | | | | | October 31, 2005 |
| Assets | | | | | | |
| Investment in securities, at value (including securities loaned | | | | |
| of $179,340) (cost $32,720,060) — See accompanying | | | | |
| schedule | | | | $ | | 45,912,049 |
| Receivable for investments sold | | | | | | 483,807 |
| Receivable for fund shares sold | | | | | | 441,254 |
| Dividends receivable | | | | | | 135,133 |
| Interest receivable | | | | | | 2,795 |
| Receivable from investment adviser for expense reductions . | | | | 5,146 |
| Other affiliated receivables | | | | | | 2,420 |
| Other receivables | | | | | | 6,143 |
| Total assets | | | | | | 46,988,747 |
| Liabilities | | | | | | |
| Payable for investments purchased | | $ | | 669,050 | | |
| Payable for fund shares redeemed | | | | 96,812 | | |
| Accrued management fee | | | | 26,446 | | |
| Distribution fees payable | | | | 20,782 | | |
| Other affiliated payables | | | | 13,646 | | |
| Other payables and accrued expenses | | | | 41,995 | | |
| Collateral on securities loaned, at value | | | | 180,075 | | |
| Total liabilities | | | | | | 1,048,806 |
| Net Assets | | | | $ | | 45,939,941 |
| Net Assets consist of: | | | | | | |
| Paid in capital | | | | $ | | 31,225,497 |
| Undistributed net investment income | | | | | | 389,525 |
| Accumulated undistributed net realized gain (loss) on | | | | | | |
| investments and foreign currency transactions | | | | | | 1,131,846 |
| Net unrealized appreciation (depreciation) on investments | | | | |
| and assets and liabilities in foreign currencies | | | | | | 13,193,073 |
| Net Assets | | | | $ | | 45,939,941 |
See accompanying notes which are an integral part of the financial statements.
15 Annual Report
| Financial Statements - continued | | | | |
| |
| |
| |
| Statement of Assets and Liabilities — continued | | | | |
| |
| | | | | October 31, 2005 |
| Calculation of Maximum Offering Price | | | | |
| Class A: | | | | |
| Net Asset Value and redemption price per share | | | | |
| ($13,736,253 ÷ 505,668 shares) | | $ | | 27.16 |
| Maximum offering price per share (100/94.25 of $27.16) | | $ | | 28.82 |
| Class T: | | | | |
| Net Asset Value and redemption price per share | | | | |
| ($9,143,518 ÷ 338,855 shares) | | $ | | 26.98 |
| Maximum offering price per share (100/96.50 of $26.98) | | $ | | 27.96 |
| |
| Class B: | | | | |
| Net Asset Value and offering price per share | | | | |
| ($8,998,326 ÷ 339,045 shares)A | | $ | | 26.54 |
| Class C: | | | | |
| Net Asset Value and offering price per share | | | | |
| ($9,251,592 ÷ 349,337 shares)A | | $ | | 26.48 |
| Institutional Class: | | | | |
| Net Asset Value, offering price and redemption price per | | | | |
| share ($4,810,252 ÷ 174,004 shares) | | $ | | 27.64 |
| A Redemption price per share is equal to net asset value less any applicable contingent deferred sales charge. | | | | |
See accompanying notes which are an integral part of the financial statements.
Annual Report 16
| Statement of Operations | | | | | | |
| | | | | Year ended October 31, 2005 |
| |
| Investment Income | | | | | | |
| Dividends | | | | $ | | 943,049 |
| Interest | | | | | | 24,319 |
| Security lending | | | | | | 300 |
| | | | | | | 967,668 |
| Less foreign taxes withheld | | | | | | (70,446) |
| Total income | | | | | | 897,222 |
| |
| Expenses | | | | | | |
| Management fee | | $ | | 190,972 | | |
| Transfer agent fees | | | | 94,220 | | |
| Distribution fees | | | | 146,190 | | |
| Accounting and security lending fees | | | | 18,633 | | |
| Independent trustees’ compensation | | | | 108 | | |
| Custodian fees and expenses | | | | 48,438 | | |
| Registration fees | | | | 56,552 | | |
| Audit | | | | 39,839 | | |
| Legal | | | | 1,454 | | |
| Miscellaneous | | | | 28 | | |
| Total expenses before reductions | | | | 596,434 | | |
| Expense reductions | | | | (112,048) | | 484,386 |
| |
| Net investment income (loss) | | | | | | 412,836 |
| Realized and Unrealized Gain (Loss) | | | | | | |
| Net realized gain (loss) on: | | | | | | |
| Investment securities | | | | 1,481,275 | | |
| Foreign currency transactions | | | | (22,215) | | |
| Total net realized gain (loss) | | | | | | 1,459,060 |
| Change in net unrealized appreciation (depreciation) on: | | | | | | |
| Investment securities | | | | 10,528,634 | | |
| Assets and liabilities in foreign currencies | | | | 530 | | |
| Total change in net unrealized appreciation | | | | | | |
| (depreciation) | | | | | | 10,529,164 |
| Net gain (loss) | | | | | | 11,988,224 |
| Net increase (decrease) in net assets resulting from | | | | | | |
| operations | | | | $ | | 12,401,060 |
See accompanying notes which are an integral part of the financial statements.
17 Annual Report
| Financial Statements - continued | | | | | | | | |
| |
| |
| Statement of Changes in Net Assets | | | | | | | | |
| | | | | Year ended | | | | Year ended |
| | | | | October 31, | | | | October 31, |
| | | | | 2005 | | | | 2004 |
| Increase (Decrease) in Net Assets | | | | | | | | |
| Operations | | | | | | | | |
| Net investment income (loss) | | $ | | 412,836 | | $ | | 155,744 |
| Net realized gain (loss) | | | | 1,459,060 | | | | 592,441 |
| Change in net unrealized appreciation (depreciation) . | | 10,529,164 | | | | 1,802,841 |
| Net increase (decrease) in net assets resulting | | | | | | | | |
| from operations | | | | 12,401,060 | | | | 2,551,026 |
| Distributions to shareholders from net investment income | | . | | (118,538) | | | | (34,709) |
| Share transactions -- net increase (decrease) | | | | 20,231,894 | | | | 5,776,559 |
| Redemption fees | | | | 57,593 | | | | 4,047 |
| Total increase (decrease) in net assets | | | | 32,572,009 | | | | 8,296,923 |
| |
| Net Assets | | | | | | | | |
| Beginning of period | | | | 13,367,932 | | | | 5,071,009 |
| End of period (including undistributed net investment | | | | | | | | |
| income of $389,525 and undistributed net invest- | | | | | | | | |
| ment income of $117,443, respectively) | | $ | | 45,939,941 | | $ | | 13,367,932 |
See accompanying notes which are an integral part of the financial statements.
| Financial Highlights — Class A | | | | | | | | | | | | | | |
| Years ended October 31, | | 2005 | | 2004 | | | | 2003 | | | | 2002 | | | | 2001 |
| Selected Per-Share Data | | | | | | | | | | | | | | | | |
| Net asset value, beginning of | | | | | | | | | | | | | | | | |
| period | | $ 16.72 | | $ 12.49 | | $ | | 8.29 | | $ | | 9.62 | | $ 13.26 |
| Income from Investment | | | | | | | | | | | | | | | | |
| Operations | | | | | | | | | | | | | | | | |
| Net investment income (loss)C | | 42 | | .24 | | | | .12 | | | | .09 | | | | .14D |
| Net realized and unrealized | | | | | | | | | | | | | | | | |
| gain (loss) | | 10.14 | | 4.09 | | | | 4.17 | | | | (1.30) | | | | (3.70) |
| Total from investment operations | | 10.56 | | 4.33 | | | | 4.29 | | | | (1.21) | | | | (3.56) |
| Distributions from net investment | | | | | | | | | | | | | | | | |
| income | | (.17) | | (.11) | | | | (.09) | | | | (.12) | | | | — |
| Distributions from net realized | | | | | | | | | | | | | | | | |
| gain | | — | | — | | | | — | | | | — | | | | (.08) |
| Total distributions | | (.17) | | (.11) | | | | (.09) | | | | (.12) | | | | (.08) |
| Redemption fees added to paid in | | | | | | | | | | | | | | | | |
| capitalC | | 05 | | .01 | | | | — | | | | — | | | | — |
| Net asset value, end of period | | $ 27.16 | | $ 16.72 | | $ | | 12.49 | | $ | | 8.29 | | $ | | 9.62 |
| Total ReturnA,B | | 63.94% | | 34.98% | | | | 52.29% | | | | (12.87)% | | | | (26.97)% |
| Ratios to Average Net AssetsE | | | | | | | | | | | | | | | | |
| Expenses before expense | | | | | | | | | | | | | | | | |
| reductions | | 1.93% | | 3.07% | | | | 5.92% | | | | 5.99% | | | | 4.96% |
| Expenses net of voluntary waiv- | | | | | | | | | | | | | | | | |
| ers, if any | | 1.56% | | 2.02% | | | | 2.02% | | | | 2.15% | | | | 2.11% |
| Expenses net of all reductions | | 1.50% | | 1.98% | | | | 2.02% | | | | 2.12% | | | | 2.05% |
| Net investment income (loss) | | 1.88% | | 1.63% | | | | 1.22% | | | | .86% | | | | 1.22% |
| Supplemental Data | | | | | | | | | | | | | | | | |
| Net assets, end of period (000 | | | | | | | | | | | | | | | | |
| omitted) | | $13,736 | | $ 1,954 | | $ | | 918 | | $ | | 428 | | $ | | 546 |
| Portfolio turnover rate | | 42% | | 71% | | | | 67% | | | | 132% | | | | 111% |
A Total returns would have been lower had certain expenses not been reduced during the periods shown.
B Total returns do not include the effect of the sales charges.
C Calculated based on average shares outstanding during the period.
D Investment income per share reflects a special dividend which amounted to $.06 per share.
E Expense ratios reflect operating expenses of the class. Expenses before reductions do not reflect amounts reimbursed by the investment adviser or reductions from brokerage service arrangements or other expense offset arrangements and do not represent the amount paid by the class during periods when reimbursements or reductions occur. Expenses net of any voluntary waivers reflect expenses after reimbursement by the investment adviser but prior to reductions from brokerage service arrangements or other expense offset arrangements. Expenses net of all reductions repre sent the net expenses paid by the class.
See accompanying notes which are an integral part of the financial statements.
19 Annual Report
| Financial Highlights — Class T | | | | | | | | | | | | |
| Years ended October 31, | | 2005 | | 2004 | | | | 2003 | | | | 2002 | | 2001 |
| Selected Per-Share Data | | | | | | | | | | | | | | |
| Net asset value, beginning of | | | | | | | | | | | | | | |
| period | | $ 16.63 | | $ 12.44 | | $ | | 8.24 | | $ | | 9.57 | | $ 13.21 |
| Income from Investment | | | | | | | | | | | | | | |
| Operations | | | | | | | | | | | | | | |
| Net investment income (loss)C | | 36 | | .20 | | | | .10 | | | | .06 | | .11D |
| Net realized and unrealized | | | | | | | | | | | | | | |
| gain (loss) | | 10.09 | | 4.07 | | | | 4.16 | | | | (1.30) | | (3.67) |
| Total from investment operations | | 10.45 | | 4.27 | | | | 4.26 | | | | (1.24) | | (3.56) |
| Distributions from net investment | | | | | | | | | | | | | | |
| income | | (.15) | | (.09) | | | | (.06) | | | | (.09) | | — |
| Distributions from net realized | | | | | | | | | | | | | | |
| gain | | — | | — | | | | — | | | | — | | (.08) |
| Total distributions | | (.15) | | (.09) | | | | (.06) | | | | (.09) | | (.08) |
| Redemption fees added to paid in | | | | | | | | | | | | | | |
| capitalC | | 05 | | .01 | | | | — | | | | — | | — |
| Net asset value, end of period | | $ 26.98 | | $ 16.63 | | $ | | 12.44 | | $ | | 8.24 | | $ 9.57 |
| Total ReturnA,B | | 63.57% | | 34.59% | | | | 52.06% | | | | (13.18)% | | (27.07)% |
| Ratios to Average Net AssetsE | | | | | | | | | | | | | | |
| Expenses before expense | | | | | | | | | | | | | | |
| reductions | | 2.26% | | 3.47% | | | | 6.58% | | | | 6.65% | | 5.48% |
| Expenses net of voluntary waiv- | | | | | | | | | | | | | | |
| ers, if any | | 1.82% | | 2.27% | | | | 2.27% | | | | 2.40% | | 2.36% |
| Expenses net of all reductions | | 1.77% | | 2.23% | | | | 2.27% | | | | 2.37% | | 2.30% |
| Net investment income (loss) | | 1.61% | | 1.38% | | | | .97% | | | | .61% | | .97% |
| Supplemental Data | | | | | | | | | | | | | | |
| Net assets, end of period (000 | | | | | | | | | | | | | | |
| omitted) | | $ 9,144 | | $ 2,585 | | $ | | 1,315 | | $ | | 836 | | $ 1,124 |
| Portfolio turnover rate | | 42% | | 71% | | | | 67% | | | | 132% | | 111% |
A Total returns would have been lower had certain expenses not been reduced during the periods shown.
B Total returns do not include the effect of the sales charges.
C Calculated based on average shares outstanding during the period.
D Investment income per share reflects a special dividend which amounted to $.06 per share.
E Expense ratios reflect operating expenses of the class. Expenses before reductions do not reflect amounts reimbursed by the investment adviser or reductions from brokerage service arrangements or other expense offset arrangements and do not represent the amount paid by the class during periods when reimbursements or reductions occur. Expenses net of any voluntary waivers reflect expenses after reimbursement by the investment adviser but prior to reductions from brokerage service arrangements or other expense offset arrangements. Expenses net of all reductions repre sent the net expenses paid by the class.
See accompanying notes which are an integral part of the financial statements.
| Financial Highlights — Class B | | | | | | | | | | | | |
| Years ended October 31, | | 2005 | | 2004 | | | | 2003 | | | | 2002 | | 2001 |
| Selected Per-Share Data | | | | | | | | | | | | | | |
| Net asset value, beginning of | | | | | | | | | | | | | | |
| period | | $ 16.40 | | $ 12.29 | | $ | | 8.13 | | $ | | 9.44 | | $ 13.08 |
| Income from Investment | | | | | | | | | | | | | | |
| Operations | | | | | | | | | | | | | | |
| Net investment income (loss)C | | 24 | | .13 | | | | .05 | | | | .01 | | .05D |
| Net realized and unrealized | | | | | | | | | | | | | | |
| gain (loss) | | 9.95 | | 4.02 | | | | 4.12 | | | | (1.28) | | (3.61) |
| Total from investment operations | | 10.19 | | 4.15 | | | | 4.17 | | | | (1.27) | | (3.56) |
| Distributions from net investment | | | | | | | | | | | | | | |
| income | | (.10) | | (.05) | | | | (.01) | | | | (.04) | | — |
| Distributions from net realized | | | | | | | | | | | | | | |
| gain | | — | | — | | | | — | | | | — | | (.08) |
| Total distributions | | (.10) | | (.05) | | | | (.01) | | | | (.04) | | (.08) |
| Redemption fees added to paid in | | | | | | | | | | | | | | |
| capitalC | | 05 | | .01 | | | | — | | | | — | | — |
| Net asset value, end of period | | $ 26.54 | | $ 16.40 | | $ | | 12.29 | | $ | | 8.13 | | $ 9.44 |
| Total ReturnA,B | | 62.73% | | 33.95% | | | | 51.35% | | | | (13.56)% | | (27.34)% |
| Ratios to Average Net AssetsE | | | | | | | | | | | | | | |
| Expenses before expense | | | | | | | | | | | | | | |
| reductions | | 2.73% | | 3.67% | | | | 6.80% | | | | 6.90% | | 5.81% |
| Expenses net of voluntary waiv- | | | | | | | | | | | | | | |
| ers, if any | | 2.34% | | 2.77% | | | | 2.77% | | | | 2.90% | | 2.86% |
| Expenses net of all reductions | | 2.28% | | 2.73% | | | | 2.77% | | | | 2.87% | | 2.80% |
| Net investment income (loss) | | 1.10% | | .88% | | | | .47% | | | | .11% | | .46% |
| Supplemental Data | | | | | | | | | | | | | | |
| Net assets, end of period (000 | | | | | | | | | | | | | | |
| omitted) | | $ 8,998 | | $ 3,222 | | $ | | 1,513 | | $ | | 814 | | $ 1,003 |
| Portfolio turnover rate | | 42% | | 71% | | | | 67% | | | | 132% | | 111% |
A Total returns would have been lower had certain expenses not been reduced during the periods shown.
B Total returns do not include the effect of the contingent deferred sales charge.
C Calculated based on average shares outstanding during the period.
D Investment income per share reflects a special dividend which amounted to $.06 per share.
E Expense ratios reflect operating expenses of the class. Expenses before reductions do not reflect amounts reimbursed by the investment adviser or reductions from brokerage service arrangements or other expense offset arrangements and do not represent the amount paid by the class during periods when reimbursements or reductions occur. Expenses net of any voluntary waivers reflect expenses after reimbursement by the investment adviser but prior to reductions from brokerage service arrangements or other expense offset arrangements. Expenses net of all reductions repre sent the net expenses paid by the class.
See accompanying notes which are an integral part of the financial statements.
21 Annual Report
| Financial Highlights — Class C | | | | | | | | | | | | | | |
| Years ended October 31, | | 2005 | | 2004 | | | | 2003 | | | | 2002 | | | | 2001 |
| Selected Per-Share Data | | | | | | | | | | | | | | | | |
| Net asset value, beginning of | | | | | | | | | | | | | | | | |
| period | | $ 16.35 | | $ 12.25 | | $ | | 8.11 | | $ | | 9.43 | | $ 13.07 |
| Income from Investment | | | | | | | | | | | | | | | | |
| Operations | | | | | | | | | | | | | | | | |
| Net investment income (loss)C | | 24 | | .13 | | | | .05 | | | | .01 | | | | .06D |
| Net realized and unrealized | | | | | | | | | | | | | | | | |
| gain (loss) | | 9.94 | | 4.01 | | | | 4.10 | | | | (1.28) | | | | (3.62) |
| Total from investment operations | | 10.18 | | 4.14 | | | | 4.15 | | | | (1.27) | | | | (3.56) |
| Distributions from net investment | | | | | | | | | | | | | | | | |
| income | | (.10) | | (.05) | | | | (.01) | | | | (.05) | | | | — |
| Distributions from net realized | | | | | | | | | | | | | | | | |
| gain | | — | | — | | | | — | | | | — | | | | (.08) |
| Total distributions | | (.10) | | (.05) | | | | (.01) | | | | (.05) | | | | (.08) |
| Redemption fees added to paid in | | | | | | | | | | | | | | | | |
| capitalC | | 05 | | .01 | | | | — | | | | — | | | | — |
| Net asset value, end of period | | $ 26.48 | | $ 16.35 | | $ | | 12.25 | | $ | | 8.11 | | $ | | 9.43 |
| Total ReturnA,B | | 62.86% | | 33.98% | | | | 51.23% | | | | (13.60)% | | | | (27.36)% |
| Ratios to Average Net AssetsE | | | | | | | | | | | | | | | | |
| Expenses before expense | | | | | | | | | | | | | | | | |
| reductions | | 2.69% | | 3.83% | | | | 6.85% | | | | 6.88% | | | | 5.82% |
| Expenses net of voluntary waiv- | | | | | | | | | | | | | | | | |
| ers, if any | | 2.32% | | 2.77% | | | | 2.77% | | | | 2.90% | | | | 2.86% |
| Expenses net of all reductions | | 2.26% | | 2.73% | | | | 2.77% | | | | 2.87% | | | | 2.79% |
| Net investment income (loss) | | 1.12% | | .88% | | | | .47% | | | | .11% | | | | .47% |
| Supplemental Data | | | | | | | | | | | | | | | | |
| Net assets, end of period (000 | | | | | | | | | | | | | | | | |
| omitted) | | $ 9,252 | | $ 2,167 | | $ | | 1,114 | | $ | | 686 | | $ | | 759 |
| Portfolio turnover rate | | 42% | | 71% | | | | 67% | | | | 132% | | | | 111% |
A Total returns would have been lower had certain expenses not been reduced during the periods shown.
B Total returns do not include the effect of the contingent deferred sales charge.
C Calculated based on average shares outstanding during the period.
D Investment income per share reflects a special dividend which amounted to $.06 per share.
E Expense ratios reflect operating expenses of the class. Expenses before reductions do not reflect amounts reimbursed by the investment adviser or reductions from brokerage service arrangements or other expense offset arrangements and do not represent the amount paid by the class during periods when reimbursements or reductions occur. Expenses net of any voluntary waivers reflect expenses after reimbursement by the investment adviser but prior to reductions from brokerage service arrangements or other expense offset arrangements. Expenses net of all reductions repre sent the net expenses paid by the class.
See accompanying notes which are an integral part of the financial statements.
| Financial Highlights — Institutional Class | | | | | | | | | | | | |
| Years ended October 31, | | 2005 | | 2004 | | | | 2003 | | | | 2002 | | | | 2001 |
| Selected Per-Share Data | | | | | | | | | | | | | | | | |
| Net asset value, beginning of | | | | | | | | | | | | | | | | |
| period | | $ 16.97 | | $ 12.64 | | $ | | 8.35 | | $ | | 9.69 | | $ 13.32 |
| Income from Investment | | | | | | | | | | | | | | | | |
| Operations | | | | | | | | | | | | | | | | |
| Net investment income (loss)B | | 46 | | .28 | | | | .14 | | | | .11 | | | | .17C |
| Net realized and unrealized | | | | | | | | | | | | | | | | |
| gain (loss) | | 10.33 | | 4.15 | | | | 4.24 | | | | (1.30) | | | | (3.72) |
| Total from investment operations | | 10.79 | | 4.43 | | | | 4.38 | | | | (1.19) | | | | (3.55) |
| Distributions from net investment | | | | | | | | | | | | | | | | |
| income | | (.17) | | (.11)�� | | | | (.09) | | | | (.15) | | | | — |
| Distributions from net realized | | | | | | | | | | | | | | | | |
| gain | | — | | — | | | | — | | | | — | | | | (.08) |
| Total distributions | | (.17) | | (.11) | | | | (.09) | | | | (.15) | | | | (.08) |
| Redemption fees added to paid in | | | | | | | | | | | | | | | | |
| capitalB | | 05 | | .01 | | | | — | | | | — | | | | — |
| Net asset value, end of period | | $ 27.64 | | $ 16.97 | | $ | | 12.64 | | $ | | 8.35 | | $ | | 9.69 |
| Total ReturnA | | 64.36% | | 35.36% | | | | 52.99% | | | | (12.65)% | | | | (26.77)% |
| Ratios to Average Net AssetsD | | | | | | | | | | | | | | | | |
| Expenses before expense | | | | | | | | | | | | | | | | |
| reductions | | 1.59% | | 2.14% | | | | 5.40% | | | | 5.49% | | | | 4.54% |
| Expenses net of voluntary waiv- | | | | | | | | | | | | | | | | |
| ers, if any | | 1.36% | | 1.77% | | | | 1.77% | | | | 1.90% | | | | 1.86% |
| Expenses net of all reductions | | 1.30% | | 1.73% | | | | 1.77% | | | | 1.87% | | | | 1.80% |
| Net investment income (loss) | | 2.08% | | 1.88% | | | | 1.47% | | | | 1.11% | | | | 1.46% |
| Supplemental Data | | | | | | | | | | | | | | | | |
| Net assets, end of period (000 | | | | | | | | | | | | | | | | |
| omitted) | | $ 4,810 | | $ 3,440 | | $ | | 210 | | $ | | 285 | | $ | | 344 |
| Portfolio turnover rate | | 42% | | 71% | | | | 67% | | | | 132% | | | | 111% |
A Total returns would have been lower had certain expenses not been reduced during the periods shown.
B Calculated based on average shares outstanding during the period.
C Investment income per share reflects a special dividend which amounted to $.06 per share.
D Expense ratios reflect operating expenses of the class. Expenses before reductions do not reflect amounts reimbursed by the investment adviser or reductions from brokerage service arrangements or other expense offset arrangements and do not represent the amount paid by the class during periods when reimbursements or reductions occur. Expenses net of any voluntary waivers reflect expenses after reimbursement by the investment adviser but prior to reductions from brokerage service arrangements or other expense offset arrangements. Expenses net of all reductions repre sent the net expenses paid by the class.
See accompanying notes which are an integral part of the financial statements.
23 Annual Report
Notes to Financial Statements
For the period ended October 31, 2005
|
1. Significant Accounting Policies.
Fidelity Advisor Latin America Fund (the fund) is a non-diversified fund of Fidelity Advisor Series VIII (the trust) and is authorized to issue an unlimited number of shares. The trust is registered under the Investment Company Act of 1940, as amended (the 1940 Act), as an open-end management investment company organized as a Massachusetts business trust.
The fund offers Class A, Class T, Class B, Class C, and Institutional Class shares, each of which has equal rights as to assets and voting privileges. Each class has exclusive voting rights with respect to matters that affect that class. Class B shares will automatically convert to Class A shares after a holding period of seven years from the initial date of purchase. Investment income, realized and unrealized capital gains and losses, the common expenses of the fund, and certain fund-level expense reductions, if any, are allocated on a pro rata basis to each class based on the relative net assets of each class to the total net assets of the fund. Each class differs with respect to transfer agent and distribution and service plan fees incurred. Certain expense reductions also differ by class.
The fund’s investments in emerging markets can be subject to social, economic, regulatory, and political uncertainties and can be extremely volatile. The fund may invest in affiliated money market central funds (Money Market Central Funds) which are open-end investment companies available to investment companies and other accounts managed by Fidelity Management & Research Company (FMR) and its affiliates. The financial statements have been prepared in conformity with accounting principles generally accepted in the United States of America, which require management to make certain estimates and assumptions at the date of the financial statements. The following summarizes the significant accounting policies of the fund:
Security Valuation. Investments are valued and net asset value (NAV) per share is calculated (NAV calculation) as of the close of business of the New York Stock Exchange (NYSE), normally 4:00 p.m. Eastern time. Wherever possible, the fund uses independent pricing services approved by the Board of Trustees to value its investments.
Equity securities, including restricted securities, for which market quotations are readily available, are valued at the last reported sale price or official closing price as reported by an independent pricing service on the primary market or exchange on which they are traded. In the event there were no sales during the day or closing prices are not available, securities are valued at the last quoted bid price.
Investments in open-end mutual funds, are valued at their closing net asset value each business day. Short-term securities with remaining maturities of sixty days or less for which quotations are not readily available are valued at amortized cost, which approximates value.
1. Significant Accounting Policies - continued
Security Valuation - continued
When current market prices or quotations are not readily available or do not accurately reflect fair value, valuations may be determined in accordance with procedures adopted by the Board of Trustees. For example, when developments occur between the close of a market and the close of the NYSE that may materially affect the value of some or all of the securities, or when trading in a security is halted, those securities may be fair valued. Factors used in the determination of fair value may include monitoring news to identify significant market or security specific events such as changes in the value of U.S. securities market, reviewing developments in foreign markets and evaluating the performance of ADRs, futures contracts and exchange-traded funds. Because the fund’s utilization of fair value pricing depends on market activity, the frequency with which fair value pricing is used can not be predicted and may be utilized to a significant extent. The value of securities used for NAV calculation under fair value pricing may differ from published prices for the same securities.
Foreign Currency. The fund uses foreign currency contracts to facilitate transactions in foreign-denominated securities. Losses from these transactions may arise from changes in the value of the foreign currency or if the counterparties do not perform under the contracts’ terms.
Foreign-denominated assets, including investment securities, and liabilities are translated into U.S. dollars at the exchange rate at period end. Purchases and sales of investment securities, income and dividends received and expenses denominated in foreign currencies are translated into U.S. dollars at the exchange rate in effect on the transaction date.
The effects of exchange rate fluctuations on investments are included with the net realized and unrealized gain (loss) on investment securities. Other foreign currency transactions resulting in realized and unrealized gain (loss) are disclosed separately.
Investment Transactions and Income. Security transactions are accounted for as of trade date. Gains and losses on securities sold are determined on the basis of identified cost. Dividend income is recorded on the ex-dividend date, except for certain dividends from foreign securities where the ex-dividend date may have passed, which are recorded as soon as the fund is informed of the ex-dividend date. Non-cash dividends included in dividend income, if any, are recorded at the fair market value of the securities received. Interest income is accrued as earned. Interest income includes coupon interest and amortization of premium and accretion of discount on debt securities. Investment income is recorded net of foreign taxes withheld where recovery of such taxes is uncertain.
25 Annual Report
Notes to Financial Statements - continued
1. Significant Accounting Policies - continued
Expenses. Most expenses of the trust can be directly attributed to a fund. Expenses which cannot be directly attributed are apportioned among each fund in the trust.
Income Tax Information and Distributions to Shareholders. Each year, the fund intends to qualify as a regulated investment company by distributing all of its taxable income and realized gains under Subchapter M of the Internal Revenue Code. As a result, no provision for income taxes is required in the accompanying financial statements. Foreign taxes are provided for based on the fund’s understanding of the tax rules and rates that exist in the foreign markets in which it invests.
Distributions are recorded on the ex-dividend date. Income dividends and capital gain distributions are declared separately for each class. Income and capital gain distributions are determined in accordance with income tax regulations, which may differ from generally accepted accounting principles. In addition, the fund will claim a portion of the payment made to redeeming shareholders as a distribution for income tax purposes.
Capital accounts within the financial statements are adjusted for permanent book-tax differences. These adjustments have no impact on net assets or the results of operations. Temporary book-tax differences will reverse in a subsequent period.
Book-tax differences are primarily due to foreign currency transactions, capital loss carryforwards and losses deferred due to wash sales.
The tax-basis components of distributable earnings and the federal tax cost as of period end were as follows:
| Unrealized appreciation | | $ | | 13,441,264 | | | | |
| Unrealized depreciation | | | | (353,467) | | | | |
| Net unrealized appreciation (depreciation) | | | | 13,087,797 | | | | |
| Undistributed ordinary income | | | | 343,753 | | | | |
| Undistributed long-term capital gain | | | | 1,066,983 | | | | |
| |
| Cost for federal income tax purposes | | $ | | 32,824,252 | | | | |
| |
| The tax character of distributions paid was as follows: | | | | |
| | | | | October 31, 2005 | | | | October 31, 2004 |
| Ordinary Income | | $ | | 118,538 | | $ | | 34,709 |
Short-Term Trading (Redemption) Fees. Shares held in the fund less than 90 days are subject to a redemption fee equal to 1.50% of the proceeds of the redeemed shares. All redemption fees, including any estimated redemption fees paid by FMR, are retained by the fund and accounted for as an addition to paid in capital.
Repurchase Agreements. FMR has received an Exemptive Order from the Securities and Exchange Commission (the SEC) which permits the fund and other affiliated entities of FMR to transfer uninvested cash balances into joint trading accounts which are then invested in repurchase agreements. The fund may also invest directly with institutions in repurchase agreements. Repurchase agreements are collateralized by government or non-government securities. Collateral is held in segregated accounts with custodian banks and may be obtained in the event of a default of the counterparty. The fund monitors, on a daily basis, the value of the collateral to ensure it is at least equal to the principal amount of the repurchase agreement (including accrued interest). In the event of a default by the counterparty, realization of the collateral proceeds could be delayed, during which time the value of the collateral may decline.
3. Purchases and Sales of Investments.
Purchases and sales of securities, other than short-term securities and U.S. government securities, aggregated $29,764,435 and $10,913,067, respectively.
4. Fees and Other Transactions with Affiliates.
Management Fee. FMR and its affiliates provide the fund with investment management related services for which the fund pays a monthly management fee. The management fee is the sum of an individual fund fee rate that is based on an annual rate of .45% of the fund’s average net assets and a group fee rate that averaged .27% during the period. The group fee rate is based upon the average net assets of all the mutual funds advised by FMR. The group fee rate decreases as assets under management increase and increases as assets under management decrease. For the period, the total annual management fee rate was .72% of the fund’s average net assets.
Distribution and Service Plan. In accordance with Rule 12b-1 of the 1940 Act, the fund has adopted separate Distribution and Service Plans for each class of shares. Certain classes pay Fidelity Distributors Corporation (FDC), an affiliate of FMR, separate Distribution and Service Fees, each of which is based on an annual percentage of each class’ average net assets. In addition, FDC may pay financial intermediaries for selling shares of the fund and providing shareholder support services. For the period, the
27 Annual Report
Notes to Financial Statements - continued
4. Fees and Other Transactions with Affiliates - continued
Distribution and Service Plan - continued
Distribution and Service Fee rates and the total amounts paid to and retained by FDC were as follows:
| | | Distribution | | Service | | | | Paid to | | | | Retained |
| | | Fee | | Fee | | | | FDC | | | | by FDC |
| Class A | | 0% | | .25% | | $ | | 14,113 | | $ | | 680 |
| Class T | | 25% | | .25% | | | | 27,600 | | | | 1,386 |
| Class B | | 75% | | .25% | | | | 58,492 | | | | 44,712 |
| Class C | | 75% | | .25% | | | | 45,985 | | | | 23,848 |
| |
| | | | | | | $ | | 146,190 | | $ | | 70,626 |
Sales Load. FDC receives a front-end sales charge of up to 5.75% for selling Class A shares, and 3.50% for selling Class T shares, some of which is paid to financial intermediaries for selling shares of the fund. FDC receives the proceeds of contingent deferred sales charges levied on Class A, Class T, Class B, and Class C redemptions. These charges depend on the holding period. The deferred sales charges range from 5% to 1% for Class B, 1% for Class C, and .25% for certain purchases of Class A and Class T shares.
| For the period, sales charge amounts retained by FDC were as follows: | | |
| | | | | Retained |
| | | | | by FDC |
| Class A | | $ | | 48,230 |
| Class T | | | | 6,142 |
| Class B* | | | | 5,012 |
| Class C* | | | | 8,625 |
| | | $ | | 68,009 |
* When Class B and Class C shares are initially sold, FDC pays commissions from its own resources to financial intermediaries through which the sales are made.
Transfer Agent Fees. Fidelity Investments Institutional Operations Company, Inc. (FIIOC), an affiliate of FMR, is the transfer, dividend disbursing and shareholder servicing agent for each class of the fund. FIIOC receives account fees and asset-based fees that vary according to the account size and type of account of the shareholders of the
4. Fees and Other Transactions with Affiliates - continued
Transfer Agent Fees - continued
respective classes of the fund. FIIOC pays for typesetting, printing and mailing of shareholder reports, except proxy statements. For the period the total transfer agent fees paid by each class to FIIOC, were as follows:
| | | | | | | % of |
| | | | | | | Average |
| | | | | Amount | | Net Assets |
| Class A | | $ | | 22,350 | | .39 |
| Class T | | | | 24,542 | | .44 |
| Class B | | | | 21,646 | | .37 |
| Class C | | | | 17,042 | | .37 |
| Institutional Class | | | | 8,640 | | .18 |
| | | $ | | 94,220 | | |
Accounting and Security Lending Fees. Fidelity Service Company, Inc. (FSC), an affiliate of FMR, maintains the fund’s accounting records. The accounting fee is based on the level of average net assets for the month. Under a separate contract, FSC administers the security lending program. The security lending fee is based on the number and duration of lending transactions.
Affiliated Central Funds. The fund may invest in Money Market Central Funds which seek preservation of capital and current income and are managed by Fidelity Investments Money Management, Inc. (FIMM), an affiliate of FMR.
The Money Market Central Funds do not pay a management fee. Income distributions earned by the fund are recorded as income in the accompanying financial statements and totaled $24,600 for the period.
Brokerage Commissions. The fund placed a portion of its portfolio transactions with brokerage firms which are affiliates of the investment adviser. The commissions paid to these affiliated firms were $1,306 for the period.
5. Committed Line of Credit.
|
The fund participates with other funds managed by FMR in a $4.2 billion credit facility (the “line of credit”) to be utilized for temporary or emergency purposes to fund shareholder redemptions or for other short-term liquidity purposes. The fund has agreed to pay commitment fees on its pro rata portion of the line of credit. During the period, there were no borrowings on this line of credit.
29 Annual Report
Notes to Financial Statements - continued
6. Security Lending.
The fund lends portfolio securities from time to time in order to earn additional income. The fund receives collateral (in the form of U.S. Treasury obligations, letters of credit and/or cash) against the loaned securities and maintains collateral in an amount not less than 100% of the market value of the loaned securities during the period of the loan. The market value of the loaned securities is determined at the close of business of the fund and any additional required collateral is delivered to the fund on the next business day. If the borrower defaults on its obligation to return the securities loaned because of insolvency or other reasons, a fund could experience delays and costs in recovering the securities loaned or in gaining access to the collateral. Cash collateral is invested in the Fidelity Securities Lending Cash Central Fund. The value of loaned securities and cash collateral at period end are disclosed on the fund’s Statement of Assets and Liabilities. Security lending income represents the income earned on investing cash collateral, less fees and expenses associated with the loan, plus any premium payments that may be received on the loan of certain types of securities.
FMR voluntarily agreed to reimburse each class to the extent annual operating expenses exceeded certain levels of average net assets as noted in the table below. Some expenses, for example interest expense, are excluded from this reimbursement.
| The following classes were in reimbursement during the period: | | | | |
| | | Expense | | | | Reimbursement |
| | | Limitations | | | | from adviser |
| Class A | | 2.00% | | -- | | 1.50%* | | $ | | 21,338 |
| Class T | | 2.25% | | -- | | 1.75%* | | | | 24,221 |
| Class B | | 2.75% | | -- | | 2.25%* | | | | 23,322 |
| Class C | | 2.75% | | -- | | 2.25%* | | | | 17,286 |
| Institutional Class | | 1.75% | | -- | | 1.25%* | | | | 11,339 |
| | | | | | | | | $ | | 97,506 |
| * Expense limitation in effect at period end. | | | | | | | | | | |
Many of the brokers with whom FMR places trades on behalf of the fund provided services to the fund in addition to trade execution. These services included payments of certain expenses on behalf of the fund totaling $14,542 for the period.
The fund’s organizational documents provide former and current trustees and officers with a limited indemnification against liabilities arising in connection with the performance of their duties to the fund. In the normal course of business, the fund may also enter into contracts that provide general indemnifications. The fund’s maximum exposure under these arrangements is unknown as this would be dependent on future claims that may be made against the fund. The risk of material loss from such claims is considered remote.
| 9. Distributions to Shareholders. | | | | | | |
| |
| Distributions to shareholders of each class were as follows: | | | | |
| | | | | Years ended October 31, |
| | | | | 2005 | | | | 2004 |
| From net investment income | | | | | | | | |
| Class A | | $ | | 24,366 | | $ | | 10,215 |
| Class T | | | | 23,671 | | | | 10,212 |
| Class B | | | | 21,602 | | | | 7,001 |
| Class C | | | | 13,964 | | | | 5,151 |
| Institutional Class | | | | 34,935 | | | | 2,130 |
| Total | | $ | | 118,538 | | $ | | 34,709 |
31 Annual Report
| Notes to Financial Statements - continued | | | | | | |
| |
| |
| 10. Share Transactions. | | | | | | | | | | |
| |
| Transactions for each class of shares were as follows: | | | | | | | | |
| | | Shares | | | | | | Dollars |
| | | Years ended October 31, | | | | Years ended October 31, |
| | | 2005 | | 2004 | | | | 2005 | | | | 2004 |
| Class A | | | | | | | | | | | | |
| Shares sold | | 510,169 | | 276,925 | | $ 11,788,852 | | $ | | 4,006,837 |
| Reinvestment of distributions | | 1,263 | | 755 | | | | 23,193 | | | | 10,009 |
| Shares redeemed | | (122,643) | | (234,253) | | | | (2,635,879) | | | | (3,410,954) |
| Net increase (decrease) | | 388,789 | | 43,427 | | $ | | 9,176,166 | | $ | | 605,892 |
| Class T | | | | | | | | | | | | |
| Shares sold | | 375,209 | | 108,101 | | $ | | 8,423,891 | | $ | | 1,626,926 |
| Reinvestment of distributions | | 1,255 | | 741 | | | | 22,942 | | | | 9,793 |
| Shares redeemed | | (193,005) | | (59,194) | | | | (4,421,751) | | | | (847,801) |
| Net increase (decrease) | | 183,459 | | 49,648 | | $ | | 4,025,082 | | $ | | 788,918 |
| Class B | | | | | | | | | | | | |
| Shares sold | | 197,277 | | 125,045 | | $ | | 4,199,916 | | $ | | 1,827,579 |
| Reinvestment of distributions | | 1,091 | | 510 | | | | 19,707 | | | | 6,666 |
| Shares redeemed | | (55,807) | | (52,239) | | | | (1,185,949) | | | | (743,755) |
| Net increase (decrease) | | 142,561 | | 73,316 | | $ | | 3,033,674 | | $ | | 1,090,490 |
| Class C | | | | | | | | | | | | |
| Shares sold | | 307,309 | | 85,290 | | $ | | 6,947,916 | | $ | | 1,256,003 |
| Reinvestment of distributions | | 709 | | 363 | | | | 12,755 | | | | 4,728 |
| Shares redeemed | | (91,202) | | (44,079) | | | | (1,969,800) | | | | (631,163) |
| Net increase (decrease) | | 216,816 | | 41,574 | | $ | | 4,990,871 | | $ | | 629,568 |
| Institutional Class | | | | | | | | | | | | |
| Shares sold | | 58,199 | | 454,651 | | $ | | 1,308,916 | | $ | | 6,720,457 |
| Reinvestment of distributions | | 1,584 | | 131 | | | | 29,523 | | | | 1,760 |
| Shares redeemed | | (88,472) | | (268,729) | | | | (2,332,338) | | | | (4,060,526) |
| Net increase (decrease) | | (28,689) | | 186,053 | | $ | | (993,899) | | $ | | 2,661,691 |
Report of Independent Registered Public Accounting Firm
To the Trustees of Fidelity Advisor Series VIII and the Shareholders of Fidelity Advisor Latin America Fund:
In our opinion, the accompanying statement of assets and liabilities, including the schedule of investments, and the related statements of operations and of changes in net assets and the financial highlights present fairly, in all material respects, the financial position of Fidelity Advisor Latin America Fund (a fund of Fidelity Advisor Series VIII) at October 31, 2005 and the results of its operations, the changes in its net assets and the financial highlights for the periods indicated, in conformity with accounting principles generally accepted in the United States of America. These financial statements and financial highlights (hereafter referred to as “financial statements”) are the responsibility of the Fidelity Advisor Latin America Fund’s management; our responsibility is to express an opinion on these financial statements based on our audits. We conducted our audits of these financial statements in accordance with the standards of the Public Company Accounting Oversight Board (United States). Those standards require that we plan and perform the audit to obtain reasonable assurance about whether the financial statements are free of material misstatement. An audit includes examining, on a test basis, evidence supporting the amounts and disclosures in the financial statements, assessing the accounting principles used and significant estimates made by management, and evaluating the overall financial statement presentation. We believe that our audits, which included confirmation of securities at October 31, 2005 by correspondence with the custodian and brokers, provide a reasonable basis for our opinion.
/s/ PricewaterhouseCoopers LLP
PricewaterhouseCoopers LLP
Boston, Massachusetts
December 19, 2005
|
33 Annual Report
Trustees and Officers
The Trustees, Members of the Advisory Board, and executive officers of the trust and fund, as applicable, are listed below. The Board of Trustees governs the fund and is responsible for protecting the interests of shareholders. The Trustees are experienced executives who meet periodically throughout the year to oversee the fund’s activities, review contractual arrangements with companies that provide services to the fund, and review the fund’s performance. Except for William O. McCoy, Stephen P. Jonas, and Kenneth L. Wolfe, each of the Trustees oversees 322 funds advised by FMR or an affiliate. Mr. McCoy oversees 324 funds advised by FMR or an affiliate. Mr. Jonas and Mr. Wolfe oversee 319 funds advised by FMR or an affiliate.
The Trustees hold office without limit in time except that (a) any Trustee may resign; (b) any Trustee may be removed by written instrument, signed by at least two-thirds of the number of Trustees prior to such removal; (c) any Trustee who requests to be retired or who has become incapacitated by illness or injury may be retired by written instrument signed by a majority of the other Trustees; and (d) any Trustee may be removed at any special meeting of shareholders by a two-thirds vote of the outstanding voting securities of the trust. Each Trustee who is not an interested person (as defined in the 1940 Act) (Independent Trustee), shall retire not later than the last day of the calendar year in which his or her 72nd birthday occurs. The Independent Trustees may waive this mandatory retirement age policy with respect to individual Trustees. The executive officers and Advisory Board Members hold office without limit in time, except that any officer and Advisory Board Member may resign or may be removed by a vote of a majority of the Trustees at any regular meeting or any special meeting of the Trustees. Except as indicated, each individual has held the office shown or other offices in the same company for the past five years.
The fund’s Statement of Additional Information (SAI) includes more information about the Trustees. To request a free copy, call Fidelity at 1-877-208-0098.
Correspondence intended for each Trustee who is an interested person may be sent to Fidelity Investments, 82 Devonshire Street, Boston, Massachusetts 02109.
| Name, Age; Principal Occupation |
| |
| Edward C. Johnson 3d (75)** |
| |
| Year of Election or Appointment: 1983 |
| Mr. Johnson is Chairman of the Board of Trustees. Mr. Johnson serves as |
| Chief Executive Officer, Chairman, and a Director of FMR Corp.; a Di- |
| rector and Chairman of the Board and of the Executive Committee of |
| FMR; Chairman and a Director of Fidelity Management & Research (Far |
| East) Inc.; Chairman and a Director of Fidelity Investments Money Man- |
| agement, Inc.; and Chairman (2001-present) and a Director |
| (2000-present) of FMR Co., Inc. |
| Name, Age; Principal Occupation |
| |
| Abigail P. Johnson (43)** |
| |
| Year of Election or Appointment: 2001 |
| Ms. Johnson serves as President of Fidelity Employer Services Company |
| (FESCO) (2005-present). She is President and a Director of Fidelity In- |
| vestments Money Management, Inc. (2001-present), FMR Co., Inc. |
| (2001-present), and a Director of FMR Corp. Previously, Ms. Johnson |
| served as President and a Director of FMR (2001-2005), Senior Vice |
| President of the Fidelity funds (2001-2005), and managed a number of |
| Fidelity funds. |
| |
| Stephen P. Jonas (52) |
| |
| Year of Election or Appointment: 2005 |
| Mr. Jonas is Senior Vice President of Advisor Latin America |
| (2005-present). He also serves as Senior Vice President of other Fidelity |
| funds (2005-present). Mr. Jonas is Executive Director of FMR |
| (2005-present). Previously, Mr. Jonas served as President of Fidelity En- |
| terprise Operations and Risk Services (2004-2005), Chief Administra- |
| tive Officer (2002-2004), and Chief Financial Officer of FMR Co. |
| (1998-2000). Mr. Jonas has been with Fidelity Investments since 1987 |
| and has held various financial and management positions including |
| Chief Financial Officer of FMR. In addition, he serves on the Boards of |
| Boston Ballet (2003-present) and Simmons College (2003-present). |
| |
| Robert L. Reynolds (53) |
| |
| Year of Election or Appointment: 2003 |
| Mr. Reynolds is a Director (2003-present) and Chief Operating Officer |
| (2002-present) of FMR Corp. He also serves on the Board at Fidelity |
| Investments Canada, Ltd. (2000-present). Previously, Mr. Reynolds |
| served as President of Fidelity Investments Institutional Retirement Group |
| (1996-2000). |
| * | Trustees have been determined to be “Interested Trustees” by virtue of, among other things, their affiliation with the trust or various entities under common control with FMR. |
| |
| ** | Edward C. Johnson 3d, Trustee, is Abigail P. Johnson’s father. |
| |
35 Annual Report
Trustees and Officers - continued
Independent Trustees:
Correspondence intended for each Independent Trustee (that is, the Trustees other than the Interested Trustees) may be sent to Fidelity Investments, P.O. Box 55235, Boston, Massachusetts 02205-5235.
| Name, Age; Principal Occupation |
| |
| Dennis J. Dirks (57) |
| |
| Year of Election or Appointment: 2005 |
| Prior to his retirement in May 2003, Mr. Dirks was Chief Operating |
| Officer and a member of the Board of The Depository Trust & Clearing |
| Corporation (DTCC) (1999-2003). He also served as President, Chief |
| Operating Officer, and Board member of The Depository Trust |
| Company (DTC) (1999-2003) and President and Board member of the |
| National Securities Clearing Corporation (NSCC) (1999-2003). In addi- |
| tion, Mr. Dirks served as Chief Executive Officer and Board member of |
| the Government Securities Clearing Corporation (2001-2003) and Chief |
| Executive Officer and Board member of the Mortgage-Backed Securities |
| Clearing Corporation (2001-2003). Mr. Dirks also serves as a Trustee of |
| Manhattan College (2005-present). |
| |
| Robert M. Gates (62) |
| |
| Year of Election or Appointment: 1997 |
| Dr. Gates is Vice Chairman of the Independent Trustees (2005-present). |
| Dr. Gates is President of Texas A&M University (2002-present). He was |
| Director of the Central Intelligence Agency (CIA) from 1991 to 1993. |
| From 1989 to 1991, Dr. Gates served as Assistant to the President of |
| the United States and Deputy National Security Advisor. Dr. Gates is a |
| Director of NACCO Industries, Inc. (mining and manufacturing), Parker |
| Drilling Co., Inc. (drilling and rental tools for the energy industry, |
| 2001-present), and Brinker International (restaurant management, |
| 2003-present). Previously, Dr. Gates served as a Director of LucasVarity |
| PLC (automotive components and diesel engines), a Director of TRW Inc. |
| (automotive, space, defense, and information technology), and Dean of |
| the George Bush School of Government and Public Service at Texas |
| A&M University (1999-2001). Dr. Gates also is a Trustee of the Forum |
| for International Policy. |
| Name, Age; Principal Occupation |
| |
| George H. Heilmeier (69) |
| |
| Year of Election or Appointment: 2004 |
| Dr. Heilmeier is Chairman Emeritus of Telcordia Technologies (commu- |
| nication software and systems), where prior to his retirement, he served |
| as company Chairman and Chief Executive Officer. He currently serves |
| on the Boards of Directors of The Mitre Corporation (systems engineer- |
| ing and information technology support for the government), and HRL |
| Laboratories (private research and development, 2004-present). He is |
| Chairman of the General Motors Science & Technology Advisory Board |
| and a Life Fellow of the Institute of Electrical and Electronics Engineers |
| (IEEE) (2000-present). Dr. Heilmeier is a member of the Defense Science |
| Board and the National Security Agency Advisory Board. He is also a |
| member of the National Academy of Engineering, the American |
| Academy of Arts and Sciences, and the Board of Overseers of the |
| School of Engineering and Applied Science of the University of Pennsyl- |
| vania. Previously, Dr. Heilmeier served as a Director of TRW Inc. (auto- |
| motive, space, defense, and information technology, 1992-2002), |
| Compaq (1994-2002), Automatic Data Processing, Inc. (ADP) |
| (technology-based business outsourcing, 1995-2002), INET Technolo- |
| gies Inc. (telecommunications network surveillance, 2001-2004), and |
| Teletech Holdings (customer management services). He is the recipient of |
| the 2005 Kyoto Prize in Advanced Technology for his invention of the |
| liquid display. |
| |
| Marie L. Knowles (59) |
| |
| Year of Election or Appointment: 2001 |
| Prior to Ms. Knowles’ retirement in June 2000, she served as Executive |
| Vice President and Chief Financial Officer of Atlantic Richfield Company |
| (ARCO) (diversified energy, 1996-2000). From 1993 to 1996, she was |
| a Senior Vice President of ARCO and President of ARCO Transportation |
| Company. She served as a Director of ARCO from 1996 to 1998. She |
| currently serves as a Director of Phelps Dodge Corporation (copper |
| mining and manufacturing) and McKesson Corporation (healthcare ser- |
| vice, 2002-present). Ms. Knowles is a Trustee of the Brookings Institution |
| and the Catalina Island Conservancy and also serves as a member of |
| the Advisory Board for the School of Engineering of the University of |
| Southern California. |
37 Annual Report
Trustees and Officers - continued
| Name, Age; Principal Occupation |
| |
| Ned C. Lautenbach (61) |
| |
| Year of Election or Appointment: 2000 |
| Mr. Lautenbach has been a partner of Clayton, Dubilier & Rice, Inc. |
| (private equity investment firm) since September 1998. Previously, Mr. |
| Lautenbach was with the International Business Machines Corporation |
| (IBM) from 1968 until his retirement in 1998. Mr. Lautenbach serves as |
| a Director of Italtel Holding S.p.A. (telecommunications (Milan, Italy), |
| 2004-present) and Eaton Corporation (diversified industrial) as well as |
| the Philharmonic Center for the Arts in Naples, Florida. He also is a |
| member of the Board of Trustees of Fairfield University (2005-present), |
| as well as a member of the Council on Foreign Relations. |
| |
| Marvin L. Mann (72) |
| |
| Year of Election or Appointment: 1993 |
| Mr. Mann is Chairman of the Independent Trustees (2001-present). He is |
| Chairman Emeritus of Lexmark International, Inc. (computer |
| peripherals), where he served as CEO until April 1998, retired as |
| Chairman May 1999, and remains a member of the Board. Prior to |
| 1991, he held the positions of Vice President of International Business |
| Machines Corporation (IBM) and President and General Manager of |
| various IBM divisions and subsidiaries. He is a member of the Executive |
| Committee of the Independent Director’s Council of the Investment Com- |
| pany Institute. In addition, Mr. Mann is a member of the President’s |
| Cabinet at the University of Alabama and the Board of Visitors of the |
| Culverhouse College of Commerce and Business Administration at the |
| University of Alabama. |
| |
| William O. McCoy (72) |
| |
| Year of Election or Appointment: 1997 |
| Prior to his retirement in December 1994, Mr. McCoy was Vice Chair- |
| man of the Board of BellSouth Corporation (telecommunications) and |
| President of BellSouth Enterprises. He is currently a Director of Liberty |
| Corporation (holding company), Duke Realty Corporation (real estate), |
| and Progress Energy, Inc. (electric utility). He is also a partner of Frank- |
| lin Street Partners (private investment management firm) and a member |
| of the Research Triangle Foundation Board. In addition, Mr. McCoy |
| served as the Interim Chancellor (1999-2000) and a member of the |
| Board of Visitors for the University of North Carolina at Chapel Hill and |
| currently serves on the Board of Directors of the University of North |
| Carolina Health Care System and the Board of Visitors of the Kenan- |
| Flagler Business School (University of North Carolina at Chapel Hill). He |
| also served as Vice President of Finance for the University of North Car- |
| olina (16-school system). |
| Name, Age; Principal Occupation |
| |
| Cornelia M. Small (61) |
| |
| Year of Election or Appointment: 2005 |
| Ms. Small is a member (2000-present) and Chairperson (2002-present) |
| of the Investment Committee, and a member (2002-present) of the |
| Board of Trustees of Smith College. Previously, she served as Chief In- |
| vestment Officer (1999-2000), Director of Global Equity Investments |
| (1996-1999), and a member of the Board of Directors of Scudder, |
| Stevens & Clark (1990-1997) and Scudder Kemper Investments |
| (1997-1998). In addition, Ms. Small served as Co-Chair (2000-2003) |
| of the Annual Fund for the Fletcher School of Law and Diplomacy. |
| |
| William S. Stavropoulos (66) |
| |
| Year of Election or Appointment: 2001 |
| Mr. Stavropoulos is Chairman of the Board (2000-present) and a Mem- |
| ber of the Board of Directors of The Dow Chemical Company. Since |
| joining The Dow Chemical Company in 1967, Mr. Stavropoulos served |
| in numerous senior management positions, including President |
| (1993-2000; 2002-2003), CEO (1995-2000; 2002-2004), and Chair- |
| man of the Executive Committee (2000-2004). Currently, he is a Direc- |
| tor of NCR Corporation (data warehousing and technology solutions), |
| BellSouth Corporation (telecommunications), Chemical Financial Corpo- |
| ration, Maersk Inc. (industrial conglomerate, 2002-present), and Metal- |
| mark Capital (private equity investment firm, 2005-present). He also |
| serves as a member of the Board of Trustees of the American Enterprise |
| Institute for Public Policy Research. In addition, Mr. Stavropoulos is a |
| member of The Business Council, J.P. Morgan International Council and |
| the University of Notre Dame Advisory Council for the College of |
| Science. |
| |
| Kenneth L. Wolfe (66) |
| |
| Year of Election or Appointment: 2005 |
| Mr. Wolfe also serves as a Trustee (2005-present) or Member of the |
| Advisory Board (2004-present) of other investment companies advised |
| by FMR. Prior to his retirement in 2001, Mr. Wolfe was Chairman and |
| Chief Executive Officer of Hershey Foods Corporation (1993-2001). He |
| currently serves as a member of the boards of Adelphia Communica- |
| tions Corporation (2003-present), Bausch & Lomb, Inc., and Revlon Inc. |
| (2004-present). |
39 Annual Report
Trustees and Officers - continued
Advisory Board Members and Executive Officers:
Correspondence intended for Mr. Gamper may be sent to Fidelity Investments, P.O. Box 55235, Boston, Massachusetts 02205-5235. Correspondence intended for each executive officer and Mr. Lynch may be sent to Fidelity Investments, 82 Devonshire Street, Boston, Massachusetts 02109.
| Name, Age; Principal Occupation |
| |
| Albert R. Gamper, Jr. (63) |
| |
| Year of Election or Appointment: 2005 |
| Member of the Advisory Board of Fidelity Advisor Series VIII. Prior to his |
| retirement in December 2004, Mr. Gamper served as Chairman of the |
| Board of CIT Group Inc. (commercial finance). During his tenure with |
| CIT Group Inc. Mr. Gamper served in numerous senior management |
| positions, including Chairman (1987-1989; 1999-2001; 2002-2004), |
| Chief Executive Officer (1987-2004), and President (1989-2002). He |
| currently serves as a member of the Board of Directors of Public Service |
| Enterprise Group (utilities, 2001-present), Chairman of the Board of |
| Governors, Rutgers University (2004-present), and Chairman of the |
| Board of Saint Barnabas Health Care System. |
| |
| Peter S. Lynch (61) |
| |
| Year of Election or Appointment: 2003 |
| Member of the Advisory Board of Fidelity Advisor Series VIII. Vice |
| Chairman and a Director of FMR, and Vice Chairman (2001-present) |
| and a Director (2000-present) of FMR Co., Inc. Previously, Mr. Lynch |
| served as a Trustee of the Fidelity funds (1990-2003). In addition, he |
| serves as a Trustee of Boston College, Massachusetts Eye & Ear |
| Infirmary, Historic Deerfield, John F. Kennedy Library, and the Museum |
| of Fine Arts of Boston. |
| |
| Dwight D. Churchill (51) |
| |
| Year of Election or Appointment: 2005 |
| Vice President of Advisor Latin America. Mr. Churchill also serves as |
| Vice President of certain Equity Funds (2005-present) and certain High |
| Income Funds (2005-present). Previously, he served as Head of Fidelity’s |
| Fixed-Income Division (2000-2005), Vice President of Fidelity’s Money |
| Market Funds (2000-2005), Vice President of Fidelity’s Bond Funds, and |
| Senior Vice President of FIMM (2000) and FMR. Mr. Churchill joined |
| Fidelity in 1993 as Vice President and Group Leader of Taxable Fixed- |
| Income Investments. |
| Name, Age; Principal Occupation |
| |
| Eric D. Roiter (56) |
| |
| Year of Election or Appointment: 1998 |
| Secretary of Advisor Latin America. He also serves as Secretary of other |
| Fidelity funds; Vice President, General Counsel, and Secretary of FMR |
| Co., Inc. (2001-present) and FMR; Assistant Secretary of Fidelity Man- |
| agement & Research (U.K.) Inc. (2001-present), Fidelity Management & |
| Research (Far East) Inc. (2001-present), and Fidelity Investments Money |
| Management, Inc. (2001-present). Mr. Roiter is an Adjunct Member, |
| Faculty of Law, at Boston College Law School (2003-present). Previously, |
| Mr. Roiter served as Vice President and Secretary of Fidelity Distributors |
| Corporation (FDC) (1998-2005). |
| |
| Stuart Fross (46) |
| |
| Year of Election or Appointment: 2003 |
| Assistant Secretary of Advisor Latin America. Mr. Fross also serves as |
| Assistant Secretary of other Fidelity funds (2003-present), Vice President |
| and Secretary of FDC (2005-present), and is an employee of FMR. |
| |
| Christine Reynolds (47) |
| |
| Year of Election or Appointment: 2004 |
| President, Treasurer, and Anti-Money Laundering (AML) officer of Advi- |
| sor Latin America. Ms. Reynolds also serves as President, Treasurer, and |
| AML officer of other Fidelity funds (2004) and is a Vice President (2003) |
| and an employee (2002) of FMR. Before joining Fidelity Investments, |
| Ms. Reynolds worked at PricewaterhouseCoopers LLP (PwC) |
| (1980-2002), where she was most recently an audit partner with PwC’s |
| investment management practice. |
| |
| Paul M. Murphy (58) |
| |
| Year of Election or Appointment: 2005 |
| Chief Financial Officer of Advisor Latin America. Mr. Murphy also serves as |
| Chief Financial Officer of other Fidelity funds (2005-present). He also |
| serves as Senior Vice President of Fidelity Pricing and Cash Management |
| Services Group (FPCMS). |
| |
| Kenneth A. Rathgeber (58) |
| |
| Year of Election or Appointment: 2004 |
| Chief Compliance Officer of Advisor Latin America. Mr. Rathgeber also |
| serves as Chief Compliance Officer of other Fidelity funds (2004) and |
| Executive Vice President of Risk Oversight for Fidelity Investments |
| (2002). Previously, he served as Executive Vice President and Chief Op- |
| erating Officer for Fidelity Investments Institutional Services Company, |
| Inc. (1998-2002). |
41 Annual Report
Trustees and Officers - continued
| Name, Age; Principal Occupation |
| |
| John R. Hebble (47) |
| |
| Year of Election or Appointment: 2003 |
| Deputy Treasurer of Advisor Latin America. Mr. Hebble also serves as |
| Deputy Treasurer of other Fidelity funds (2003), and is an employee of |
| FMR. Before joining Fidelity Investments, Mr. Hebble worked at Deutsche |
| Asset Management where he served as Director of Fund Accounting |
| (2002-2003) and Assistant Treasurer of the Scudder Funds |
| (1998-2003). |
| |
| Bryan A. Mehrmann (44) |
| |
| Year of Election or Appointment: 2005 |
| Deputy Treasurer of Advisor Latin America. Mr. Mehrmann also serves |
| as Deputy Treasurer of other Fidelity funds (2005-present) and is an |
| employee of FMR. Previously, Mr. Mehrmann served as Vice President of |
| Fidelity Investments Institutional Services Group (FIIS)/Fidelity Investments |
| Institutional Operations Corporation, Inc. (FIIOC) Client Services |
| (1998-2004). |
| |
| Kimberley H. Monasterio (41) |
| |
| Year of Election or Appointment: 2004 |
| Deputy Treasurer of Advisor Latin America. Ms. Monasterio also serves |
| as Deputy Treasurer of other Fidelity funds (2004) and is an employee |
| of FMR (2004). Before joining Fidelity Investments, Ms. Monasterio |
| served as Treasurer (2000-2004) and Chief Financial Officer |
| (2002-2004) of the Franklin Templeton Funds and Senior Vice President |
| of Franklin Templeton Services, LLC (2000-2004). |
| |
| Kenneth B. Robins (36) |
| |
| Year of Election or Appointment: 2005 |
| Deputy Treasurer of Advisor Latin America. Mr. Robins also serves as |
| Deputy Treasurer of other Fidelity funds (2005-present) and is an em- |
| ployee of FMR (2004-present). Before joining Fidelity Investments, Mr. |
| Robins worked at KPMG LLP, where he was a partner in KPMG’s de- |
| partment of professional practice (2002-2004) and a Senior Manager |
| (1999-2000). In addition, Mr. Robins served as Assistant Chief Accoun- |
| tant, United States Securities and Exchange Commission (2000-2002). |
| |
| Robert G. Byrnes (38) |
| |
| Year of Election or Appointment: 2005 |
| Assistant Treasurer of Advisor Latin America. Mr. Byrnes also serves as |
| Assistant Treasurer of other Fidelity funds (2005-present) and is an em- |
| ployee of FMR (2005-present). Previously, Mr. Byrnes served as Vice |
| President of FPCMS (2003-2005). Before joining Fidelity Investments, |
| Mr. Byrnes worked at Deutsche Asset Management where he served as |
| Vice President of the Investment Operations Group (2000-2003). |
| Name, Age; Principal Occupation |
| |
| John H. Costello (59) |
| |
| Year of Election or Appointment: 1998 |
| Assistant Treasurer of Advisor Latin America. Mr. Costello also serves as |
| Assistant Treasurer of other Fidelity funds and is an employee of FMR. |
| |
| Peter L. Lydecker (51) |
| |
| Year of Election or Appointment: 2004 |
| Assistant Treasurer of Advisor Latin America. Mr. Lydecker also serves |
| as Assistant Treasurer of other Fidelity funds (2004) and is an employee |
| of FMR. |
| |
| Mark Osterheld (50) |
| |
| Year of Election or Appointment: 2002 |
| Assistant Treasurer of Advisor Latin America. Mr. Osterheld also serves |
| as Assistant Treasurer of other Fidelity funds (2002) and is an employee |
| of FMR. |
| |
| Gary W. Ryan (47) |
| |
| Year of Election or Appointment: 2005 |
| Assistant Treasurer of Advisor Latin America. Mr. Ryan also serves as |
| Assistant Treasurer of other Fidelity funds (2005-present) and is an em- |
| ployee of FMR (2005-present). Previously, Mr. Ryan served as Vice Pres- |
| ident of Fund Reporting in FPCMS (1999-2005). |
| |
| Salvatore Schiavone (39) |
| |
| Year of Election or Appointment: 2005 |
| Assistant Treasurer of Advisor Latin America. Mr. Schiavone also serves |
| as Assistant Treasurer of other Fidelity funds (2005-present) and is an |
| employee of FMR (2005-present). Before joining Fidelity Investments, |
| Mr. Schiavone worked at Deutsche Asset Management, where he most |
| recently served as Assistant Treasurer (2003-2005) of the Scudder |
| Funds and Vice President and Head of Fund Reporting (1996-2003). |
43 Annual Report
The Board of Trustees of Advisor Latin America Fund voted to pay to shareholders of record at the opening of business on record date, the following distributions per share derived from capital gains realized from sales of portfolio securities, and dividends derived from net investment income:
| | | Pay Date | | Record Date | | Dividends | | Capital Gains |
| Institutional Class | | 12/05/05 | | 12/02/05 | | $.296 | | $.55 |
The fund hereby designates as capital gain dividends: For dividends with respect to the taxable year ended October 31, 2005, $1,066,983, or if subsequently determined to be different, the net capital gain of such year.
Institutional Class designates 100% of the dividends distributed during the fiscal year as amounts which may be taken into account as a dividend for purposes of the maximum rate under section 1(h)(11) of the Internal Revenue Code.
The amounts per share which represent income derived from sources within, and taxes paid to, foreign countries or possessions of the United States are as follows:
| | | Pay Date | | Income | | Taxes |
| Institutional Class | | 12/06/04 | | $.216 | | $.046 |
The fund will notify shareholders in January 2006 of amounts for use in preparing 2005 income tax returns.
Board Approval of Investment Advisory Contracts and Management Fees
Advisor Latin America Fund
Each year, typically in July, the Board of Trustees, including the independent Trustees (together, the Board), votes on the renewal of the management contract and sub-advisory agreements (together, the Advisory Contracts) for the fund. The Board, assisted by the advice of fund counsel and independent Trustees’ counsel, requests and considers a broad range of information throughout the year.
The Board meets regularly each month except August and takes into account throughout the year matters bearing on Advisory Contracts. The Board, acting directly and through its separate committees, considers at each of its meetings factors that are relevant to the annual renewal of the fund’s Advisory Contracts, including the services and support provided to the fund and its shareholders by Fidelity. At the time of the renewal, the Board had 11 standing committees, each composed of independent Trustees with varying backgrounds, to which the Board has assigned specific subject matter responsibilities in order to enhance effective decision-making by the Board. Each committee has adopted a written charter outlining the structure and purposes of the committee. One such committee, the Equity Contract Committee, meets periodically during the first six months of each year and as necessary to consider matters specifically related to the annual renewal of Advisory Contracts. The committee requests and receives information on, and makes recommendations to the independent Trustees concerning, the approval and annual review of the Advisory Contracts.
At its July 2005 meeting, the Board of Trustees, including the independent Trustees, unanimously determined to renew the Advisory Contracts for the fund. In reaching its determination, the Board considered all factors it believed relevant, including (1) the nature, extent, and quality of the services to be provided to the fund and its shareholders by Fidelity (including the investment performance of the fund); (2) the competitiveness of the management fee and total expenses of the fund; (3) the total costs of the services to be provided by and the profits to be realized by the investment adviser and its affiliates from the relationship with the fund; (4) the extent to which economies of scale would be realized as the fund grows; and (5) whether fee levels reflect these economies of scale, if any, for the benefit of fund shareholders.
In determining whether to renew the Advisory Contracts for the fund, the Board ultimately reached a determination, with the assistance of fund counsel and independent Trustees’ counsel, that the renewal of the Advisory Contracts and the compensation to be received by Fidelity under the management contract is consistent with Fidelity’s fiduciary duty under applicable law. In addition to evaluating the specific factors noted above, the Board, in reaching its determination, is aware that shareholders in the fund have a broad range of investment choices available to them, including a wide choice among mutual funds offered by competitors to Fidelity, and that the fund’s shareholders, with the opportunity to review and weigh the disclosure provided by the fund in its
45 Annual Report
Board Approval of Investment Advisory Contracts and Management Fees - continued
prospectus and other public disclosures, have chosen to invest in this fund, managed by Fidelity.
Nature, Extent, and Quality of Services Provided by Fidelity. The Board considered staffing within the investment adviser, FMR, and the sub-advisers (together, the Investment Advisers), including the background of the fund’s portfolio manager and the fund’s investment objective and discipline. The independent Trustees also had discussions with senior management of Fidelity’s investment operations and investment groups. The Board considered the structure of the portfolio manager compensation program and whether this structure provides appropriate incentives.
Fidelity Resources Dedicated to Investment Management and Support Services. The Board reviewed the size, education, and experience of the Investment Advisers’ investment staff, their use of technology, and the Investment Advisers’ approach to recruiting, training, and retaining portfolio managers and other research, advisory, and management personnel. The Board considered Fidelity’s extensive global research capabilities that enable the Investment Advisers to aggregate data from various sources in an effort to produce positive investment results. The Board noted that Fidelity’s analysts have access to a variety of technological tools that enable them to perform both fundamental and quantitative analysis and to specialize in various disciplines. The Board also considered that Fidelity’s portfolio managers and analysts have access to daily portfolio attribution that allows for monitoring of a fund’s portfolio, as well as an electronic communication system that provides immediate real-time access to research concerning issuers and credit enhancers.
Shareholder and Administrative Services. The Board considered the nature, extent, quality, and cost of administrative, distribution, and shareholder services performed by the Investment Advisers and their affiliates under the Advisory Contracts and under separate agreements covering transfer agency, pricing and bookkeeping, and securities lending services for the fund. The Board also considered the nature and extent of the Investment Advisers’ supervision of third party service providers, principally custodians and subcustodians. The Board reviewed the allocation of fund brokerage, including allocations to brokers affiliated with the Investment Advisers, the use of brokerage commissions to pay fund expenses, and the use of “soft” commission dollars to pay for research services. The Board also considered that Fidelity voluntarily decided in 2004 to stop using “soft” commission dollars to pay for market data and, instead, to pay for that data out of its own resources. The Board also considered the resources devoted to, and the record of compliance with, the fund’s compliance policies and procedures.
The Board noted that the growth of fund assets across the complex allows Fidelity to reinvest in the development of services designed to enhance the value or convenience of the Fidelity funds as investment vehicles. These services include 24-hour access to
account information and market information through phone representatives and over the Internet, and investor education materials and asset allocation tools.
Investment in a Large Fund Family. The Board considered the benefits to shareholders of investing in a Fidelity fund, including the benefits of investing in a fund that is part of a large family of funds offering a variety of investment disciplines and providing for a large variety of mutual fund investor services. For example, fund shareholders are offered the privilege of exchanging shares of the fund for shares of other Fidelity funds, as set forth in the fund’s prospectus, without paying an additional sales charge. The Board noted that, since the last Advisory Contract renewals in July 2004, Fidelity has taken a number of actions that benefited particular funds, including (i) voluntarily deciding in 2004 to stop using “soft” commission dollars to pay for market data and, instead, to pay for that data out of its own resources, (ii) contractually agreeing to impose management fee reductions and expense limitations on its five Spartan stock index funds and its stock index fund available through variable insurance products, (iii) contractually agreeing to eliminate the management fees on the Fidelity Freedom Funds and the Fidelity Advisor Freedom Funds, (iv) contractually agreeing to reduce the management fees on most of its investment-grade taxable bond funds, and (v) contractually agreeing to impose expense limitations on its retail and Spartan investment-grade taxable bond funds.
Investment Performance and Compliance. The Board considered whether the fund has operated within its investment objective, as well as its record of compliance with its investment restrictions. It also reviewed the fund’s absolute investment performance for each class, as well as the fund’s relative investment performance for each class measured against (i) a broad-based securities market index, and (ii) a peer group of mutual funds deemed appropriate by the Board over multiple periods. The following charts considered by the Board show, over the one-, three-, and five-year periods ended December 31, 2004, the returns of Class C and Institutional Class of the fund, the returns of a broad-based securities market index (“benchmark”), and a range of returns of a peer group of mutual funds identified by Lipper Inc. as having an investment objective similar to that of the fund. The returns of Class C and Institutional Class represent the performance of classes with the highest and lowest 12b-1 fees, respectively (not necessarily with the highest and lowest total expenses). The box within each chart shows the 25th percentile return (bottom of box) and the 75th percentile return (top of box) of the Lipper peer group. Returns shown above the box are in the first quartile and returns shown below the box are in the fourth quartile. The percentage beaten numbers noted below each chart correspond to the percentile box and represent the percentage of funds in the Lipper peer group whose performance was equal to or lower than that of the class indicated.
47 Annual Report
Board Approval of Investment Advisory Contracts and Management Fees - continued
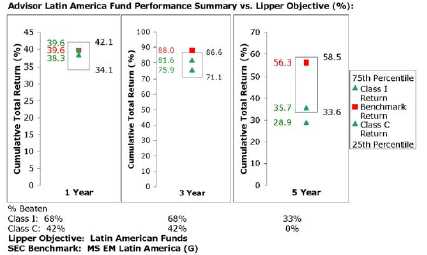
The Board reviewed the fund’s relative investment performance against its Lipper peer group and stated that the performance of Institutional Class of the fund was in the second quartile for the one- and three-year periods and the third quartile for the five-year period. The Board also stated that the relative investment performance of the fund was lower than its benchmark for certain periods, although the one-year cumulative total return of Institutional Class of the fund compared favorably to its benchmark. The Board considered that the variations in performance among the fund’s classes reflect the variations in class expenses, which result in lower performance for higher expense classes.
The Board has had thorough discussions with FMR throughout the year about the Board’s and FMR’s concerns about equity research, equity fund performance, and compliance with internal policies governing gifts and entertainment. FMR has taken steps that it believes will refocus and strengthen equity research and equity portfolio management and compliance. The Board noted with favor FMR’s recent reorganization of its senior management team and FMR’s plans to dedicate additional resources to investment research, and participated in the process that led to those changes.
Based on its review, and giving particular weight to the nature and quality of the resources dedicated by the Investment Advisers to maintain and improve relative performance, the Board concluded that the nature, extent, and quality of the services provided by Fidelity will benefit the fund’s shareholders, particularly in light of the Board’s view that the fund’s shareholders benefit from investing in a fund that is part of a large family of funds offering a variety of investment disciplines and services.
Competitiveness of Management Fee and Total Fund Expenses. The Board considered the fund’s management fee and total expenses compared to “mapped groups” of competitive funds and classes. Fidelity creates “mapped groups” by combining similar Lipper investment objective categories that have comparable management fee characteristics. Combining Lipper investment objective categories aids the Board’s management fee and total expense comparisons by broadening the competitive group used for comparison and by reducing the number of universes to which various Fidelity funds are compared.
The Board considered two proprietary management fee comparisons for the 12-month periods shown in the chart below. The group of Lipper funds used by the Board for management fee comparisons is referred to below as the “Total Mapped Group” and, for the reasons explained above, is broader than the Lipper peer group used by the Board for performance comparisons. The Total Mapped Group comparison focuses on a fund’s standing relative to the total universe of comparable funds available to investors, in terms of gross management fees before expense reimbursements or caps. “TMG %” represents the percentage of funds in the Total Mapped Group that had management fees that were lower than the fund’s. For example, a TMG % of 12% means that 88% of the funds in the Total Mapped Group had higher management fees than the fund. The “Asset-Size Peer Group” (ASPG) comparison focuses on a fund’s standing relative to non-Fidelity funds similar in size to the fund within the Total Mapped Group. The ASPG represents at least 15% of the funds in the Total Mapped Group with comparable asset size and management fee characteristics, subject to a minimum of 50 funds (or all funds in the Total Mapped Group if fewer than 50). Additional information, such as the ASPG quartile (“quadrant”) in which the fund’s management fee ranked, is also included in the chart and considered by the Board.
49 Annual Report
Board Approval of Investment Advisory Contracts and Management Fees - continued

The Board noted that the fund’s management fee ranked below the median of its Total Mapped Group and below the median of its ASPG for 2004.
Based on its review, the Board concluded that the fund’s management fee was fair and reasonable in light of the services that the fund receives and the other factors considered.
In its review of each class’s total expenses, the Board considered the fund’s management fee as well as other fund or class expenses, as applicable, such as transfer agent fees, pricing and bookkeeping fees, fund-paid 12b-1 fees, and custodial, legal, and audit fees. The Board also noted the effects of any waivers and reimbursements on fees and expenses. As part of its review, the Board also considered current and historical total expenses of each class of the fund compared to competitive fund median expenses. Each class of the fund is compared to those funds and classes in the Total Mapped Group (used by the Board for management fee comparisons) that have a similar sales load structure.
The Board noted that the total expenses of Class A ranked below its competitive median for 2004, and the total expenses of each of Class B, Class C, Class T and Institutional Class ranked above its competitive median for 2004. The Board noted that the fund offers multiple classes, each of which has a different sales load and 12b-1 fee structure, and that the multiple structures are intended to offer a range of pricing options for the intermediary market. The Board also noted that the total expenses of the classes vary primarily by the level of their 12b-1 fees, although differences in transfer agent fees may also cause expenses to vary from class to class.
Furthermore, the Board considered that on December 16, 2004, it had approved changes (effective January 1, 2005) in the transfer agent and service agreements for the fund that established maximum transfer agent fees and eliminated the minimum pricing and bookkeeping fee to prevent small funds or funds with small average account sizes from having relatively high fees in basis points (the “small-fund fee reductions”). The Board considered that, if the small-fund fee reductions had been in effect in 2004, the total expenses of each of Class B, Class C, Class T and Institutional Class would have ranked below the median.
In its review of total expenses, the Board also considered Fidelity fee structures and other information on clients that FMR and its affiliates service in other competitive markets, such as other mutual funds advised or subadvised by FMR or its affiliates, pension plan clients, and other institutional clients.
Based on its review, the Board concluded that the total expenses for each class of the fund were reasonable, although in some cases above the median of the universe presented for comparison, in light of the services that the fund and its shareholders receive and the other factors considered.
Costs of the Services and Profitability. The Board considered the revenues earned and the expenses incurred by Fidelity in conducting the business of developing, marketing, distributing, managing, administering and servicing the fund and its shareholders. The Board also considered the level of Fidelity’s profits in respect of all the Fidelity funds.
On an annual basis, FMR presents to the Board Fidelity’s profitability for the fund. Fidelity calculates the profitability for each fund, as well as aggregate profitability for groups of Fidelity funds and all Fidelity funds, using a series of detailed revenue and cost allocation methodologies which originate with the audited books and records of Fidelity. The Audit Committee of the Board reviews any significant changes from the prior year’s methodologies.
PricewaterhouseCoopers LLP (PwC), independent registered accounting firm and auditor to Fidelity and certain Fidelity funds, has been engaged annually by the Board as part of the Board’s assessment of the results of Fidelity’s profitability analysis. PwC’s engagement includes the review and assessment of Fidelity’s methodologies used in determining the revenues and expenses attributable to Fidelity’s mutual fund business, and completion of agreed-upon procedures surrounding the mathematical accuracy of fund profitability and its conformity to allocation methodologies. After considering PwC’s reports issued under the engagement and information provided by Fidelity, the Board believes that while other allocation methods may also be reasonable, Fidelity’s profitability methodologies are reasonable in all material respects.
51 Annual Report
Board Approval of Investment Advisory Contracts and Management Fees - continued
The Board has also reviewed Fidelity’s non-fund businesses and any fall-out benefits related to the mutual fund business as well as cases where Fidelity’s affiliates may benefit from or be related to the fund’s business. In addition, a special committee of the Board reviewed services provided to Fidelity by its affiliates and determined that the fees that Fidelity paid for such services were reasonable.
The Board considered the costs of the services provided by and the profits realized by Fidelity in connection with the operation of the fund and determined that the amount of profit is a fair entrepreneurial profit for the management of the fund.
Economies of Scale. The Board considered whether there have been economies of scale in respect of the management of the Fidelity funds, whether the Fidelity funds (including the fund) have appropriately benefited from any such economies of scale, and whether there is potential for realization of any further economies of scale. The Board considered the extent to which the fund will benefit from economies of scale through increased services to the fund, through waivers or reimbursements, or through fee or expense reductions, including reductions that occur through operation of the transfer agent agreement. The transfer agent fee varies in part based on the number of accounts in the fund. If the number of accounts decreases or the average account size increases, the overall transfer agent fee rate decreases.
The Board recognized that the fund’s management contract incorporates a “group fee” structure, which provides for lower fee rates as total fund assets under FMR’s management increase, and for higher fee rates as total fund assets under FMR’s management decrease. The Board considered that the group fee is designed to deliver the benefits of economies of scale to fund shareholders when total fund assets increase, even if assets of any particular fund are unchanged or have declined, because some portion of Fidelity’s costs are attributable to services provided to all Fidelity funds, and all funds benefit if those costs can be allocated among more assets. The Board concluded that, given the group fee structure, fund shareholders will achieve a certain level of economies of scale as assets under FMR’s management increase at the fund complex level, regardless of whether Fidelity achieves any such economies of scale.
The Board further concluded that any potential economies of scale are being shared between fund shareholders and Fidelity in an appropriate manner.
Additional Information Requested by the Board. In order to develop fully the factual basis for consideration of the Advisory Contracts, the Board requested additional information regarding (i) equity fund transfer agency fees; (ii) Fidelity’s fund profitability methodology and the impact of various changes in the methodology over time; (iii) benefits to shareholders from economies of scale; (iv) composition and characteristics of various fund and industry data used in comparisons; and (v) compensation of portfolio managers and research analysts.
Based on its evaluation of all of the conclusions noted above, and after considering all material factors, the Board ultimately concluded that the existing advisory fee structures are fair and reasonable, and that the fund’s existing Advisory Contracts should be renewed.
53 Annual Report
55 Annual Report
Investment Adviser
Fidelity Management & Research Company
Boston, MA
Investment Sub-Advisers
FMR Co., Inc.
Fidelity Management & Research
(U.K.) Inc.
Fidelity Management & Research
(Far East) Inc.
Fidelity International
Investment Advisors
Fidelity Investments Japan Limited
Fidelity International Investment
Advisors (U.K.) Limited
General Distributor
Fidelity Distributors Corporation
Boston, MA
Transfer and Service Agents
Fidelity Investments Institutional
Operations Company, Inc.
Boston, MA
Fidelity Service Company, Inc.
Boston, MA
Custodian
State Street Bank and Trust Company
Quincy, MA
|


Fidelity® Advisor
Overseas
Fund - Class A, Class T, Class B and Class C
Annual Report October 31, 2005

| Contents | | | | |
| |
| Chairman’s Message | | 4 | | Ned Johnson’s message to shareholders. |
| Performance | | 6 | | How the fund has done over time. |
| Management’s Discussion | | 8 | | The manager’s review of fund |
| | | | | performance, strategy and outlook. |
| Shareholder Expense | | 9 | | An example of shareholder expenses. |
| Example | | | | |
| Investment Changes | | 11 | | A summary of major shifts in the fund’s |
| | | | | investments over the past six months. |
| Investments | | 12 | | A complete list of the fund’s investments |
| | | | | with their market values. |
| Financial Statements | | 21 | | Statements of assets and liabilities, |
| | | | | operations, and changes in net assets, |
| | | | | as well as financial highlights. |
| Notes | | 30 | | Notes to the financial statements. |
| Report of Independent | | 39 | | |
| Registered Public | | | | |
| Accounting Firm | | | | |
| Trustees and Officers | | 40 | | |
| Distributions | | 50 | | |
| Board Approval of | | 51 | | |
| Investment Advisory | | | | |
| Contracts and | | | | |
| Management Fees | | | | |
To view a fund’s proxy voting guidelines and proxy voting record for the 12-month period ended June 30, visit www.fidelity.com/proxyvotingresults or visit the Securities and Exchange Commission’s (SEC) web site at www.sec.gov. You may also call 1-877-208-0098 to request a free copy of the proxy voting guidelines.
Standard & Poor’s, S&P and S&P 500 are registered service marks of The McGraw-Hill Companies, Inc. and have been licensed for use by Fidelity Distributors Corporation.
Other third party marks appearing herein are the property of their respective owners.
All other marks appearing herein are registered or unregistered trademarks or service marks of FMR Corp. or an affiliated company.
This report and the financial statements contained herein are submitted for the general information of the shareholders of the fund. This report is not authorized for distribution to prospective investors in the fund unless preceded or accompanied by an effective prospectus.
A fund files its complete schedule of portfolio holdings with the SEC for the first and third quarters of each fiscal year on Form N-Q. Forms N-Q are available on the SEC’s web site at http://www.sec.gov. A fund’s Forms N-Q may be reviewed and copied at the SEC’s Public Reference Room in Washington, DC. Information regarding the operation of the SEC’s Public Reference Room may be obtained by calling 1-800-SEC-0330. For a complete list of a fund’s portfolio holdings, view the most recent quarterly holdings report, semiannual report, or annual report on Fidelity’s web site at http://www.advisor.fidelity.com.
NOT FDIC INSURED · MAY LOSE VALUE · NO BANK GUARANTEE
Neither the fund nor Fidelity Distributors Corporation is a bank.
3 Annual Report
Chairman’s Message
(Photograph of Edward C. Johnson 3d)
Dear Shareholder:
During the past year or so, much has been reported about the mutual fund industry, and much of it has been more critical than I believe is warranted. Allegations that some companies have been less than forthright with their shareholders have cast a shadow on the entire industry. I continue to find these reports disturbing, and assert that they do not create an accurate picture of the industry overall. Therefore, I would like to remind everyone where Fidelity stands on these issues. I will say two things specifically regarding allegations that some mutual fund companies were in violation of the Securities and Exchange Commission’s forward pricing rules or were involved in so-called “market timing” activities.
First, Fidelity has no agreements that permit customers who buy fund shares after 4 p.m. to obtain the 4 p.m. price. This is not a new policy. This is not to say that someone could not deceive the company through fraudulent acts. However, we are extremely diligent in preventing fraud from occurring in this manner — and in every other. But I underscore again that Fidelity has no so-called “agreements” that sanction illegal practices.
Second, Fidelity continues to stand on record, as we have for years, in opposition to predatory short-term trading that adversely affects shareholders in a mutual fund. Back in the 1980s, we initiated a fee — which is returned to the fund and, therefore, to investors — to discourage this activity. Further, we took the lead several years ago in developing a Fair Value Pricing Policy to prevent market timing on foreign securities in our funds. I am confident we will find other ways to make it more difficult for predatory traders to operate. However, this will only be achieved through close cooperation among regulators, legislators and the industry.
Yes, there have been unfortunate instances of unethical and illegal activity within the mutual fund industry from time to time. That is true of any industry. When this occurs, confessed or convicted offenders should be dealt with appropriately. But we are still concerned about the risk of over-regulation and the quick application of simplistic solutions to intricate problems. Every system can be improved, and we support and applaud well thought out improvements by regulators, legislators and industry representatives that achieve the common goal of building and protecting the value of investors’ holdings.
For nearly 60 years, Fidelity has worked very hard to improve its products and service to justify your trust. When our family founded this company in 1946, we had only a few hundred customers. Today, we serve more than 18 million customers including individual investors and participants in retirement plans across America.
Annual Report 4
Let me close by saying that we do not take your trust in us for granted, and we realize that we must always work to improve all aspects of our service to you. In turn, we urge you to continue your active participation with your financial matters, so that your interests can be well served.
Best regards,
/s/Edward C. Johnson 3d
5 Annual Report
Performance: The Bottom Line
Average annual total return reflects the change in the value of an investment, assuming reinvestment of the class’ dividend income and capital gains (the profits earned upon the sale of securities that have grown in value) and assuming a constant rate of performance each year. The $10,000 table and the fund’s returns do not reflect the deduction of taxes that a shareholder would pay on fund distributions or the redemption of fund shares. During periods of reimbursement by Fidelity, a fund’s total return will be greater than it would be had the reimbursement not occurred. How a fund did yesterday is no guarantee of how it will do tomorrow. Returns may reflect the conversion of Class B shares to Class A shares after a maximum of seven years.
| Average Annual Total Returns | | | | | | |
| Periods ended October 31, 2005 | | Past 1 | | Past 5 | | Past 10 |
| | | year | | years | | years |
| Class A (incl. 5.75% | | | | | | |
| sales charge)A | | 9.74% | | --0.17% | | 5.66% |
| |
| Class T (incl. 3.50% | | | | | | |
| sales charge) | | 12.24% | | 0.15% | | 5.79% |
| |
| Class B (incl. contingent | | | | | | |
| deferred sales charge)B | | 10.53% | | --0.20% | | 5.74% |
| |
| Class C (incl. contingent | | | | | | |
| deferred sales charge)C | | 14.58% | | 0.24% | | 5.51% |
A Class A’s 12b-1 fee may have ranged over time between 0.25% and 0.35%, as an equivalent amount of brokerage commissions of up to 0.10% of the class’s average net assets may have been used to promote the sale of class shares. This practice has been discontinued and no commissions incurred after June 30, 2003 have been used to pay distribution expenses. Class A’s 12b-1 plan currently authorizes a 0.25% 12b-1 fee. The initial offering of Class A shares took place on September 3, 1996. Returns prior to September 3, 1996 are those of Class T, the original class of the fund, and reflect a 0.50% 12b-1 fee (0.65% prior to January 1, 1996).
B Class B shares bear a 1.00% 12b-1 fee. Class B shares’ contingent deferred sales charges included in the past one year, past 5 year, and the past 10 year total return figures are 5%, 2% and 0%, respectively.
C Class C shares bear a 1.00% 12b-1 fee. The initial offering of Class C shares took place on Novem-ber 3, 1997. Returns prior to November 3, 1997 are those of Class B shares and reflect Class B shares’ 1.00% 12b-1 fee. Class C shares’ contingent deferred sales charge included in the past one year, past five year, and past 10 year total return figures are 1%, 0%, and 0%, respectively.
Let’s say hypothetically that $10,000 was invested in Fidelity® Advisor Overseas Fund —Class T on October 31, 1995, and the current 3.50% sales charge was paid. The chart shows how the value of your investment would have changed, and also shows how the MSCIr EAFEr Index performed over the same period.
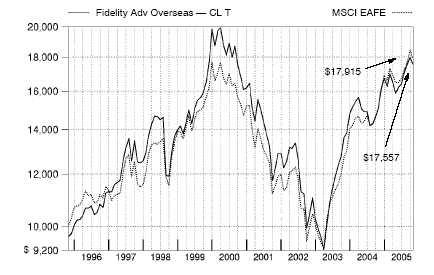
Management’s Discussion of Fund Performance
Comments from Graeme Rockett, Portfolio Manager of Fidelity® Advisor Overseas Fund
Foreign stock markets enjoyed broad-based advances during the 12-month period that ended October 31, 2005, encouraged by better-than-expected corporate earnings and markedly improved economies. For the 12 months overall, the Morgan Stanley Capital InternationalSM Europe, Australasia, Far East (MSCIr EAFE®) Index — a performance measure of developed stock markets outside the United States and Canada — gained 18.28% . The Japanese stock market climbed to its highest level in more than four years. Positive economic indicators and Prime Minister Koizumi’s decisive election victory attracted record inflows from overseas investors. In response, the Tokyo Stock Exchange Stock Price Index (TOPIX) soared 22.89% . Southeast Asian equities outside of Japan, particularly South Korea, also responded well to the better macroeconomic environment, illustrated by the 19.44% return for the MSCI All Country Far East ex Japan index. Euro-pean stock markets were up as well, despite investors’ concern about higher energy prices and potential downgrades to economic growth in the region. For the year overall, the MSCI Europe index rose 16.51% . Returns for U.S. investors in overseas markets, while robust, were tempered somewhat by the strength of the dollar versus many major currencies. During the past year, Fidelity Advisor Overseas Fund’s Class A, Class T, Class B and Class C shares gained 16.44%, 16.31%, 15.53% and 15.58%, respectively, trailing the LipperSM International Funds Average, which rose 17.75%, and the MSCI EAFE index. A big overweighting in the information technology (IT) sector — particularly among semiconductors — was the main reason for lagging the index, as that group was IT’s worst-performing component during the period. Good stock picking within the group, however, helped offset some of the damage there. Among the biggest detractors were Japanese semiconductor equipment maker Tokyo Electron, German chip maker Infineon Technologies and Taiwan-ese chip maker United Microelectronics. French telecommunications equipment giant Alcatel also disappointed in the tech hardware/equipment space. On the upside, the fund was buoyed by astute stock selection in financials, especially among banks, as well as in energy stocks. Canadian oil and natural gas producer EnCana and French integrated oil company Total were the two biggest relative contributors. Strong results also came from South Korea’s Kookmin Bank and India’s Housing Development Finance Corp., helped in part by favorable currency movements in these countries. Some of these stocks were no longer held at period end.
The views expressed in this statement reflect those of the portfolio manager only through the end of the period of the report as stated on the cover and do not necessarily represent the views of Fidelity or any other person in the Fidelity organization. Any such views are subject to change at any time based upon market or other conditions and Fidelity disclaims any responsibility to update such views. These views may not be relied on as investment advice and, because investment decisions for a Fidelity fund are based on numerous factors, may not be relied on as an indication of trading intent on behalf of any Fidelity fund.
Shareholder Expense Example
As a shareholder of the Fund, you incur two types of costs: (1) transaction costs, including sales charges (loads) on purchase payments or redemption proceeds, redemption fees, and (2) ongoing costs, including management fees, distribution and/or service (12b-1) fees and other Fund expenses. This Example is intended to help you understand your ongoing costs (in dollars) of investing in the Fund and to compare these costs with the ongoing costs of investing in other mutual funds.
The Example is based on an investment of $1,000 invested at the beginning of the period and held for the entire period (May 1, 2005 to October 31, 2005).
The first line of the table below for each class of the Fund provides information about actual account values and actual expenses. You may use the information in this line, together with the amount you invested, to estimate the expenses that you paid over the period. Simply divide your account value by $1,000.00 (for example, an $8,600 account value divided by $1,000.00 = 8.6), then multiply the result by the number in the first line for a class of the Fund under the heading entitled “Expenses Paid During Period” to estimate the expenses you paid on your account during this period.
Hypothetical Example for Comparison Purposes
The second line of the table below for each class of the Fund provides information about hypothetical account values and hypothetical expenses based on a Class’ actual expense ratio and an assumed rate of return of 5% per year before expenses, which is not the Class’ actual return. The hypothetical account values and expenses may not be used to estimate the actual ending account balance or expenses you paid for the period. You may use this information to compare the ongoing costs of investing in the Fund and other funds. To do so, compare this 5% hypothetical example with the 5% hypothetical examples that appear in the shareholder reports of the other funds.
9 Annual Report
Shareholder Expense Example - continued
Please note that the expenses shown in the table are meant to highlight your ongoing costs only and do not reflect any transaction costs. Therefore, the second line of the table is useful in comparing ongoing costs only, and will not help you determine the relative total costs of owning different funds. In addition, if these transactional costs were included, your costs would have been higher.
| | | | | | | | | | | | | Expenses Paid |
| | | | | Beginning | | | | Ending | | | | During Period* |
| | | | | Account Value | | | | Account Value | | | | May 1, 2005 |
| | | | | May 1, 2005 | | | | October 31, 2005 | | to October 31, 2005 |
| Class A | | | | | | | | | | | | |
| Actual | | $ | | 1,000.00 | | $ | | 1,108.00 | | $ | | 6.48 |
| HypotheticalA | | $ | | 1,000.00 | | $ | | 1,019.06 | | $ | | 6.21 |
| Class T | | | | | | | | | | | | |
| Actual | | $ | | 1,000.00 | | $ | | 1,106.90 | | $ | | 7.17 |
| HypotheticalA | | $ | | 1,000.00 | | $ | | 1,018.40 | | $ | | 6.87 |
| Class B | | | | | | | | | | | | |
| Actual | | $ | | 1,000.00 | | $ | | 1,103.30 | | $ | | 10.60 |
| HypotheticalA | | $ | | 1,000.00 | | $ | | 1,015.12 | | $ | | 10.16 |
| Class C | | | | | | | | | | | | |
| Actual | | $ | | 1,000.00 | | $ | | 1,103.90 | | $ | | 10.45 |
| HypotheticalA | | $ | | 1,000.00 | | $ | | 1,015.27 | | $ | | 10.01 |
| Institutional Class | | | | | | | | | | | | |
| Actual | | $ | | 1,000.00 | | $ | | 1,110.20 | | $ | | 4.36 |
| HypotheticalA | | $ | | 1,000.00 | | $ | | 1,021.07 | | $ | | 4.18 |
| |
| A 5% return per year before expenses | | | | | | | | |
* Expenses are equal to each Class’ annualized expense ratio (shown in the table below); multiplied by the average account value over the period, multiplied by 184/365 (to reflect the one-half year period).
| | | Annualized |
| | | Expense Ratio |
| Class A | | 1.22% |
| Class T | | 1.35% |
| Class B | | 2.00% |
| Class C | | 1.97% |
| Institutional Class | | 82% |
Investment Changes
| Top Five Stocks as of October 31, 2005 | | | | |
| | | % of fund’s | | % of fund’s net assets |
| | | net assets | | 6 months ago |
| BP PLC (United Kingdom, Oil, Gas & | | | | |
| Consumable Fuels) | | 2.2 | | 2.5 |
| Total SA Series B (France, Oil, Gas & | | | | |
| Consumable Fuels) | | 1.9 | | 4.4 |
| Toyota Motor Corp. (Japan, Automobiles) | | 1.8 | | 1.1 |
| Vodafone Group PLC (United Kingdom, Wireless | | | | |
| Telecommunication Services) | | 1.8 | | 2.5 |
| Novartis AG (Reg.) (Switzerland, | | | | |
| Pharmaceuticals) | | 1.8 | | 1.7 |
| | | 9.5 | | |
| Top Five Market Sectors as of October 31, 2005 | | |
| | | % of fund’s | | % of fund’s net assets |
| | | net assets | | 6 months ago |
| Financials | | 25.7 | | 27.9 |
| Consumer Discretionary | | 12.6 | | 9.7 |
| Health Care | | 10.0 | | 7.1 |
| Information Technology | | 9.3 | | 25.1 |
| Energy | | 8.8 | | 9.4 |
| Top Five Countries as of October 31, 2005 | | |
| (excluding cash equivalents) | | % of fund’s | | % of fund’s net assets |
| | | net assets | | 6 months ago |
| United Kingdom | | 23.6 | | 11.6 |
| Japan | | 18.6 | | 20.1 |
| France | | 11.0 | | 11.2 |
| Switzerland | | 8.9 | | 10.6 |
| Germany | | 8.8 | | 8.3 |
| Percentages are adjusted for the effect of open futures contracts, if applicable. | | |

11 Annual Report
| Investments October 31, 2005 | | | | | | | | |
| Showing Percentage of Net Assets | | | | | | | | |
| |
| Common Stocks — 95.2% | | | | | | | | |
| | | | | Shares | | Value (Note 1) |
| | | | | | | | | (000s) |
| |
| Australia – 0.9% | | | | | | | | |
| BHP Billiton Ltd. | | | | 344,600 | | $ | | 5,350 |
| Computershare Ltd. | | | | 539,700 | | | | 2,643 |
| Rio Tinto Ltd. | | | | 32,300 | | | | 1,360 |
| TOTAL AUSTRALIA | | | | | | | | 9,353 |
| |
| Austria – 0.3% | | | | | | | | |
| OMV AG | | | | 68,200 | | | | 3,679 |
| Belgium – 0.5% | | | | | | | | |
| InBev SA | | | | 83,900 | | | | 3,354 |
| Umicore SA | | | | 22,900 | | | | 2,292 |
| TOTAL BELGIUM | | | | | | | | 5,646 |
| |
| Canada – 0.2% | | | | | | | | |
| Talisman Energy, Inc. | | | | 37,800 | | | | 1,674 |
| Denmark – 0.9% | | | | | | | | |
| East Asiatic Co. Ltd. | | | | 21,500 | | | | 1,627 |
| GN Store Nordic AS | | | | 256,300 | | | | 3,088 |
| Vestas Wind Systems AS (a)(d) | | | | 250,900 | | | | 5,430 |
| TOTAL DENMARK | | | | | | | | 10,145 |
| |
| Egypt – 0.1% | | | | | | | | |
| Orascom Telecom SAE GDR | | | | 21,600 | | | | 1,059 |
| Finland – 1.2% | | | | | | | | |
| Neste Oil Oyj | | | | 94,300 | | | | 2,922 |
| Nokia Corp. | | | | 631,800 | | | | 10,627 |
| TOTAL FINLAND | | | | | | | | 13,549 |
| |
| France – 11.0% | | | | | | | | |
| Accor SA | | | | 111,912 | | | | 5,589 |
| Alstom SA (a) | | | | 85,100 | | | | 4,080 |
| AXA SA | | | | 191,996 | | | | 5,560 |
| BNP Paribas SA | | | | 81,481 | | | | 6,178 |
| Carrefour SA | | | | 94,100 | | | | 4,185 |
| CNP Assurances | | | | 39,700 | | | | 2,763 |
| Compagnie Generale de Geophysique SA (a) | | | | 22,300 | | | | 1,945 |
| Financiere Marc de Lacharriere SA (Fimalac) | | | | 39,600 | | | | 2,150 |
| France Telecom SA | | | | 132,999 | | | | 3,457 |
| Gaz de France | | | | 66,700 | | | | 2,051 |
| Groupe Danone | | | | 47,600 | | | | 4,856 |
| Hermes International SA | | | | 9,900 | | | | 2,222 |
| L’Air Liquide SA | | | | 33,400 | | | | 6,074 |
See accompanying notes which are an integral part of the financial statements.
| Common Stocks – continued | | | | | | |
| | | Shares | | Value (Note 1) |
| | | | | | | (000s) |
| |
| France – continued | | | | | | |
| L’Oreal SA | | 61,534 | | $ | | 4,525 |
| Lagardere S.C.A. (Reg.) | | 48,400 | | | | 3,327 |
| Louis Vuitton Moet Hennessy (LVMH) | | 41,800 | | | | 3,385 |
| Neopost SA | | 33,600 | | | | 3,242 |
| Pernod Ricard SA | | 32,700 | | | | 5,719 |
| Safran SA | | 177,100 | | | | 3,524 |
| Sanofi-Aventis sponsored ADR | | 258,800 | | | | 10,383 |
| Silicon On Insulator Technologies SA (SOITEC) (a)(d) | | 99,200 | | | | 1,485 |
| Total SA Series B | | 80,497 | | | | 20,288 |
| Vallourec SA | | 3,200 | | | | 1,439 |
| Vinci SA | | 34,500 | | | | 2,696 |
| Vivendi Universal SA sponsored ADR | | 280,900 | | | | 8,826 |
| TOTAL FRANCE | | | | | | 119,949 |
| |
| Germany – 8.8% | | | | | | |
| Adidas-Salomon AG | | 18,400 | | | | 3,088 |
| Allianz AG (Reg.) | | 53,400 | | | | 7,551 |
| BASF AG | | 74,832 | | | | 5,388 |
| Bayer AG | | 154,800 | | | | 5,387 |
| DaimlerChrysler AG | | 140,000 | | | | 7,007 |
| Deutsche Bank AG (NY Shares) | | 43,200 | | | | 4,044 |
| Deutsche Boerse AG | | 28,610 | | | | 2,692 |
| Deutsche Post AG | | 222,800 | | | | 4,968 |
| Deutsche Telekom AG sponsored ADR | | 120,000 | | | | 2,124 |
| E.ON AG | | 123,979 | | | | 11,236 |
| ESCADA AG (a) | | 160,488 | | | | 4,079 |
| GFK AG | | 39,220 | | | | 1,300 |
| Heidelberger Druckmaschinen AG | | 152,700 | | | | 4,851 |
| Hugo Boss AG | | 100,700 | | | | 3,428 |
| Hypo Real Estate Holding AG | | 68,400 | | | | 3,308 |
| IWKA AG | | 89,100 | | | | 1,976 |
| Metro AG | | 85,900 | | | | 3,907 |
| MPC Muenchmeyer Petersen Capital AG | | 20,700 | | | | 1,464 |
| SAP AG sponsored ADR | | 231,100 | | | | 9,923 |
| SGL Carbon AG (a) | | 241,400 | | | | 3,533 |
| Software AG (Bearer) | | 47,800 | | | | 2,171 |
| United Internet AG | | 68,900 | | | | 2,226 |
| TOTAL GERMANY | | | | | | 95,651 |
| |
| Gibraltar – 0.1% | | | | | | |
| PartyGaming PLC | | 574,400 | | | | 887 |
See accompanying notes which are an integral part of the financial statements.
13 Annual Report
| Investments - continued | | | | | | |
| |
| |
| Common Stocks – continued | | | | | | |
| | | Shares | | Value (Note 1) |
| | | | | | | (000s) |
| |
| Greece – 0.4% | | | | | | |
| Cosmote Mobile Telecommunications SA | | 200,000 | | $ | | 4,109 |
| Hong Kong – 0.9% | | | | | | |
| Esprit Holdings Ltd. | | 393,500 | | | | 2,774 |
| Hong Kong Exchanges & Clearing Ltd. | | 889,500 | | | | 2,972 |
| Hutchison Whampoa Ltd. | | 215,700 | | | | 2,042 |
| Wharf Holdings Ltd. | | 709,000 | | | | 2,419 |
| TOTAL HONG KONG | | | | | | 10,207 |
| |
| India – 1.6% | | | | | | |
| Bajaj Auto Ltd. | | 51,100 | | | | 1,936 |
| Cipla Ltd. | | 212,928 | | | | 1,702 |
| Housing Development Finance Corp. Ltd. | | 213,020 | | | | 4,575 |
| Infosys Technologies Ltd. | | 64,897 | | | | 3,631 |
| Satyam Computer Services Ltd. | | 290,105 | | | | 3,881 |
| State Bank of India | | 84,732 | | | | 1,757 |
| TOTAL INDIA | | | | | | 17,482 |
| |
| Ireland – 1.6% | | | | | | |
| Allied Irish Banks PLC | | 332,900 | | | | 7,001 |
| DEPFA BANK PLC | | 194,000 | | | | 3,023 |
| Irish Life & Permanent PLC | | 233,800 | | | | 4,120 |
| Ryanair Holdings PLC sponsored ADR (a) | | 54,900 | | | | 2,721 |
| TOTAL IRELAND | | | | | | 16,865 |
| |
| Israel – 0.3% | | | | | | |
| Bank Hapoalim BM (Reg.) | | 990,500 | | | | 3,794 |
| Italy – 2.9% | | | | | | |
| Azimut Holdings Spa | | 211,200 | | | | 1,524 |
| Banca Intesa Spa | | 993,300 | | | | 4,635 |
| Banche Popolari Unite S.c.a.r.l. | | 160,800 | | | | 3,404 |
| ENI Spa (d) | | 395,291 | | | | 10,574 |
| Telecom Italia Spa sponsored ADR | | 69,400 | | | | 2,015 |
| Unicredito Italiano Spa | | 1,615,700 | | | | 9,022 |
| TOTAL ITALY | | | | | | 31,174 |
| |
| Japan – 18.6% | | | | | | |
| Aeon Co. Ltd. | | 347,400 | | | | 7,220 |
| Aoyama Trading Co. Ltd. | | 76,800 | | | | 2,315 |
| Astellas Pharma, Inc. | | 146,000 | | | | 5,247 |
| Canon, Inc. | | 115,800 | | | | 6,146 |
| Credit Saison Co. Ltd. | | 69,200 | | | | 3,146 |
See accompanying notes which are an integral part of the financial statements.
| Common Stocks – continued | | | | | | |
| | | Shares | | Value (Note 1) |
| | | | | | | (000s) |
| |
| Japan – continued | | | | | | |
| Daiwa Securities Group, Inc. | | 809,000 | | $ | | 6,649 |
| E*TRADE Securities Co. Ltd. (d) | | 900 | | | | 4,731 |
| Fujitsu Ltd. | | 693,000 | | | | 4,585 |
| Hoya Corp. | | 32,900 | | | | 1,157 |
| Hoya Corp. New | | 98,700 | | | | 3,445 |
| Ibiden Co. Ltd. | | 53,700 | | | | 2,176 |
| Intelligent Wave, Inc. | | 800 | | | | 2,653 |
| JAFCO Co. Ltd. (d) | | 55,400 | | | | 3,339 |
| JFE Holdings, Inc. | | 86,200 | | | | 2,680 |
| KOEI Co. Ltd. (d) | | 50,600 | | | | 1,534 |
| Kose Corp. | | 47,300 | | | | 1,716 |
| Kyushu-Shinwa Holdings, Inc. (a) | | 2,251,000 | | | | 6,160 |
| Millea Holdings, Inc. | | 210 | | | | 3,821 |
| Mitsubishi UFJ Financial Group, Inc. | | 557 | | | | 7,068 |
| Mitsui & Co. Ltd. | | 319,000 | | | | 3,931 |
| Mitsui Fudosan Co. Ltd. | | 56,000 | | | | 919 |
| Mitsui Trust Holdings, Inc. | | 404,500 | | | | 4,883 |
| Mizuho Financial Group, Inc. | | 500 | | | | 3,343 |
| Murata Manufacturing Co. Ltd. | | 50,000 | | | | 2,498 |
| Nafco Co. Ltd. | | 25,500 | | | | 844 |
| Nikko Cordial Corp. | | 537,000 | | | | 6,511 |
| Nippon Electric Glass Co. Ltd. | | 172,000 | | | | 3,299 |
| Nippon Steel Corp. | | 953,000 | | | | 3,409 |
| Nishimatsuya Chain Co. Ltd. | | 45,000 | | | | 1,715 |
| Nitto Denko Corp. | | 92,100 | | | | 5,591 |
| Nomura Holdings, Inc. | | 275,300 | | | | 4,264 |
| OMC Card, Inc. | | 162,600 | | | | 2,736 |
| ORIX Corp. | | 19,900 | | | | 3,735 |
| Otsuka Kagu Ltd. | | 79,800 | | | | 2,322 |
| Sega Sammy Holdings, Inc. | | 83,800 | | | | 3,019 |
| Sega Sammy Holdings, Inc. New | | 54,500 | | | | 1,978 |
| Seiyu Ltd. (a)(d) | | 838,000 | | | | 1,720 |
| Seven & I Holdings Co. Ltd. (a) | | 50,600 | | | | 1,665 |
| Sompo Japan Insurance, Inc | | 234,700 | | | | 3,537 |
| Sony Corp. sponsored ADR | | 66,700 | | | | 2,188 |
| Sumitomo Mitsui Financial Group, Inc. | | 970 | | | | 8,988 |
| T&D Holdings, Inc. | | 44,450 | | | | 2,806 |
| Takashimaya Co. Ltd. | | 328,000 | | | | 4,414 |
| Takefuji Corp. | | 55,520 | | | | 3,899 |
| The Keiyo Bank Ltd. | | 697,000 | | | | 5,245 |
| The Sumitomo Warehouse Co. Ltd. (d) | | 175,000 | | | | 1,361 |
| Tokuyama Corp. | | 189,000 | | | | 1,882 |
See accompanying notes which are an integral part of the financial statements.
15 Annual Report
| Investments - continued | | | | | | |
| |
| |
| Common Stocks – continued | | | | | | |
| | | Shares | | Value (Note 1) |
| | | | | | | (000s) |
| |
| Japan – continued | | | | | | |
| Tokyo Electron Ltd. | | 67,400 | | $ | | 3,391 |
| Toyota Motor Corp. | | 430,400 | | | | 19,973 |
| USS Co. Ltd. | | 16,980 | | | | 1,171 |
| Xebio Co. Ltd. | | 43,000 | | | | 1,854 |
| Yahoo! Japan Corp | | 2,843 | | | | 3,028 |
| Yahoo! Japan Corp. New | | 2,343 | | | | 2,536 |
| Yamada Denki Co. Ltd. | | 15,200 | | | | 1,339 |
| TOTAL JAPAN | | | | | | 201,782 |
| |
| Korea (South) – 0.5% | | | | | | |
| Hyundai Motor Co. | | 29,481 | | | | 2,163 |
| Shinsegae Co. Ltd. | | 8,090 | | | | 2,898 |
| TOTAL KOREA (SOUTH) | | | | | | 5,061 |
| |
| Luxembourg – 0.3% | | | | | | |
| SES Global unit | | 229,400 | | | | 3,589 |
| Mexico – 0.3% | | | | | | |
| Fomento Economico Mexicano SA de CV sponsored ADR | | 47,900 | | | | 3,257 |
| Netherlands – 3.3% | | | | | | |
| ABN-AMRO Holding NV | | 205,100 | | | | 4,869 |
| ASML Holding NV (a) | | 309,522 | | | | 5,256 |
| DSM NV | | 89,900 | | | | 3,228 |
| EADS NV (d) | | 113,300 | | | | 3,925 |
| ING Groep NV (Certificaten Van Aandelen) | | 185,946 | | | | 5,366 |
| Koninklijke Numico NV (a) | | 71,200 | | | | 2,883 |
| Unilever NV (NY Shares) | | 31,700 | | | | 2,229 |
| VNU NV | | 266,240 | | | | 8,467 |
| TOTAL NETHERLANDS | | | | | | 36,223 |
| |
| Norway – 1.7% | | | | | | |
| DnB NOR ASA | | 518,300 | | | | 5,298 |
| Ocean RIG ASA (a) | | 184,300 | | | | 2,054 |
| Statoil ASA | | 206,100 | | | | 4,609 |
| Telenor ASA | | 355,000 | | | | 3,465 |
| Yara International ASA | | 151,600 | | | | 2,499 |
| TOTAL NORWAY | | | | | | 17,925 |
| |
| Oman – 0.0% | | | | | | |
| BankMuscat SAOG sponsored GDR (a) | | 18,500 | | | | 463 |
| Philippines – 0.2% | | | | | | |
| Philippine Long Distance Telephone Co. sponsored ADR (d) | | 56,700 | | | | 1,710 |
See accompanying notes which are an integral part of the financial statements.
| Common Stocks – continued | | | | | | |
| | | Shares | | Value (Note 1) |
| | | | | | | (000s) |
| |
| South Africa – 0.3% | | | | | | |
| Nedbank Group Ltd | | 264,000 | | $ | | 3,364 |
| Spain – 1.7% | | | | | | |
| Banco Bilbao Vizcaya Argentaria SA | | 209,400 | | | | 3,692 |
| Banco Pastor SA (Reg.) | | 38,200 | | | | 1,634 |
| Banco Santander Central Hispano SA sponsored ADR | | 300,000 | | | | 3,807 |
| Gestevision Telecinco SA | | 15,600 | | | | 346 |
| Telefonica SA | | 581,848 | | | | 9,300 |
| TOTAL SPAIN | | | | | | 18,779 |
| |
| Sweden – 1.8% | | | | | | |
| Eniro AB | | 233,800 | | | | 2,555 |
| Gambro AB (A Shares) | | 224,400 | | | | 3,171 |
| Kungsleden AB | | 84,000 | | | | 2,200 |
| Modern Times Group AB (MTG) (B Shares) (a) | | 60,900 | | | | 2,329 |
| Telefonaktiebolaget LM Ericsson (B Shares) sponsored ADR | | 277,700 | | | | 9,111 |
| TOTAL SWEDEN | | | | | | 19,366 |
| |
| Switzerland – 8.9% | | | | | | |
| ABB Ltd. (Reg.) (a) | | 758,159 | | | | 5,799 |
| Clariant AG (Reg.) | | 190,900 | | | | 2,547 |
| Compagnie Financiere Richemont unit | | 120,700 | | | | 4,592 |
| Credit Suisse Group (Reg.) | | 200,604 | | | | 8,889 |
| Nestle SA (Reg.) | | 42,881 | | | | 12,773 |
| Nobel Biocare Holding AG (Switzerland) | | 22,500 | | | | 5,188 |
| Novartis AG (Reg.) | | 351,054 | | | | 18,894 |
| Phonak Holding AG | | 57,100 | | | | 2,381 |
| Roche Holding AG (participation certificate) | | 110,884 | | | | 16,566 |
| Societe Generale de Surveillance Holding SA (SGS) (Reg.) | | 6,700 | | | | 4,937 |
| Syngenta AG (Switzerland) | | 30,800 | | | | 3,302 |
| UBS AG (Reg.) | | 126,431 | | | | 10,831 |
| TOTAL SWITZERLAND | | | | | | 96,699 |
| |
| Taiwan – 0.8% | | | | | | |
| Acer, Inc. | | 930,000 | | | | 1,882 |
| Hon Hai Precision Industry Co. Ltd. (Foxconn) | | 96,187 | | | | 416 |
| Sunplus Technology Co. Ltd. | | 103,512 | | | | 90 |
| Taiwan Semiconductor Manufacturing Co. Ltd. | | 2,068,782 | | | | 3,206 |
| United Microelectronics Corp. | | 4,364,956 | | | | 2,316 |
| United Microelectronics Corp. sponsored ADR (d) | | 79,561 | | | | 232 |
| TOTAL TAIWAN | | | | | | 8,142 |
See accompanying notes which are an integral part of the financial statements.
17 Annual Report
| Investments - continued | | | | | | |
| |
| |
| Common Stocks – continued | | | | | | |
| | | Shares | | Value (Note 1) |
| | | | | | | (000s) |
| |
| United Kingdom – 23.6% | | | | | | |
| Admiral Group PLC | | 234,900 | | $ | | 1,817 |
| Anglo American PLC (United Kingdom) | | 115,500 | | | | 3,415 |
| AstraZeneca PLC (United Kingdom) | | 209,400 | | | | 9,402 |
| BAE Systems PLC | | 918,100 | | | | 5,372 |
| Barclays PLC | | 427,500 | | | | 4,234 |
| Benfield Group PLC | | 395,200 | | | | 2,239 |
| BG Group PLC | | 778,000 | | | | 6,832 |
| BHP Billiton PLC | | 441,702 | | | | 6,495 |
| Body Shop International PLC | | 411,000 | | | | 1,528 |
| BP PLC | | 2,113,708 | | | | 23,393 |
| British Land Co. PLC | | 342,300 | | | | 5,394 |
| Cadbury Schweppes PLC | | 453,100 | | | | 4,460 |
| Corin Group PLC | | 132,100 | | | | 777 |
| Diageo PLC | | 459,300 | | | | 6,824 |
| Easynet Group PLC (a) | | 635,600 | | | | 1,936 |
| Eircom Group PLC | | 707,800 | | | | 1,697 |
| Gallaher Group PLC | | 179,400 | | | | 2,782 |
| GlaxoSmithKline PLC | | 723,500 | | | | 18,807 |
| Gyrus Group PLC (a) | | 680,600 | | | | 3,850 |
| HBOS PLC | | 139,400 | | | | 2,060 |
| Hilton Group PLC | | 891,300 | | | | 5,353 |
| HSBC Holdings PLC (United Kingdom) (Reg.) | | 1,020,567 | | | | 16,076 |
| Informa PLC | | 374,900 | | | | 2,484 |
| Intertek Group PLC | | 80,500 | | | | 1,015 |
| ITE Group PLC | | 1,217,300 | | | | 2,435 |
| ITV PLC | | 1,906,208 | | | | 3,510 |
| Jardine Lloyd Thompson Group PLC | | 674,400 | | | | 5,695 |
| Lloyds TSB Group PLC | | 332,400 | | | | 2,719 |
| M&C Saatchi | | 591,000 | | | | 1,130 |
| Man Group PLC | | 128,897 | | | | 3,514 |
| Mothercare PLC | | 159,693 | | | | 896 |
| O2 PLC | | 1,168,000 | | | | 4,255 |
| Pipex Communications PLC (a) | | 1,032,700 | | | | 169 |
| Prudential PLC | | 598,700 | | | | 5,024 |
| Reckitt Benckiser PLC | | 74,500 | | | | 2,252 |
| Reuters Group PLC | | 803,400 | | | | 5,110 |
| Rio Tinto PLC (Reg.) | | 148,418 | | | | 5,663 |
| Royal Bank of Scotland Group PLC | | 269,500 | | | | 7,462 |
| Royal Dutch Shell PLC: | | | | | | |
| Class A sponsored ADR | | 233,500 | | | | 14,486 |
| Class B | | 99,000 | | | | 3,238 |
| SABMiller PLC | | 232,600 | | | | 4,390 |
See accompanying notes which are an integral part of the financial statements.
| Common Stocks – continued | | | | | | |
| | | Shares | | Value (Note 1) |
| | | | | | | (000s) |
| |
| United Kingdom – continued | | | | | | |
| Smiths Group PLC | | 227,400 | | $ | | 3,674 |
| Sportingbet PLC | | 505,900 | | | | 2,638 |
| Taylor Nelson Sofres PLC | | 610,600 | | | | 2,249 |
| Tesco PLC | | 1,212,211 | | | | 6,455 |
| Virgin Mobile Holdings (UK) PLC | | 513,700 | | | | 2,728 |
| Vodafone Group PLC | | 7,598,379 | | | | 19,953 |
| Whatman PLC | | 582,900 | | | | 2,890 |
| Xstrata PLC | | 135,500 | | | | 3,102 |
| Yell Group PLC | | 268,400 | | | | 2,103 |
| TOTAL UNITED KINGDOM | | | | | | 255,982 |
| |
| United States of America – 1.5% | | | | | | |
| Dominion Resources, Inc. | | 57,200 | | | | 4,352 |
| Janus Capital Group, Inc. | | 265,800 | | | | 4,665 |
| Synthes, Inc. | | 66,498 | | | | 7,041 |
| TOTAL UNITED STATES OF AMERICA | | | | | | 16,058 |
| |
| TOTAL COMMON STOCKS | | | | | | |
| (Cost $1,009,530) | | | | | | 1,033,623 |
| |
| Money Market Funds — 7.7% | | | | | | |
| |
| Fidelity Cash Central Fund, 3.92% (b) | | 54,191,991 | | | | 54,192 |
| Fidelity Securities Lending Cash Central Fund, | | | | | | |
| 3.94% (b)(c) | | 29,296,188 | | | | 29,296 |
| TOTAL MONEY MARKET FUNDS | | | | | | |
| (Cost $83,488) | | | | | | 83,488 |
| |
| TOTAL INVESTMENT PORTFOLIO – 102.9% | | | | | | |
| (Cost $1,093,018) | | | | 1,117,111 |
| |
| NET OTHER ASSETS – (2.9)% | | | | | | (31,592) |
| NET ASSETS – 100% | | $ | | 1,085,519 |
See accompanying notes which are an integral part of the financial statements.
19 Annual Report
Investments - continued
Legend
|
(a) Non-income producing
(b) Affiliated fund that is available only to investment companies and other accounts managed by Fidelity Investments. The rate quoted is the annualized seven-day yield of the fund at period end. A complete unaudited listing of the fund’s holdings as of its most recent quarter end is available upon request.
(c) Investment made with cash collateral received from securities on loan.
(d) Security or a portion of the security is on loan at period end.
See accompanying notes which are an integral part of the financial statements.
| Financial Statements | | | | | | | | |
| |
| |
| Statement of Assets and Liabilities | | | | | | | | |
| Amounts in thousands (except per-share amounts) | | | | | | | | October 31, 2005 |
| |
| Assets | | | | | | | | |
| Investment in securities, at value (including securities | | | | | | | | |
| loaned of $28,128) (cost $1,093,018) — See | | | | | | | | |
| accompanying schedule | | | | | | $ | | 1,117,111 |
| Receivable for investments sold | | | | | | | | 6,847 |
| Receivable for fund shares sold | | | | | | | | 1,098 |
| Dividends receivable | | | | | | | | 1,029 |
| Interest receivable | | | | | | | | 120 |
| Other affiliated receivables | | | | | | | | 1 |
| Other receivables | | | | | | | | 435 |
| Total assets | | | | | | | | 1,126,641 |
| |
| Liabilities | | | | | | | | |
| Payable to custodian bank | | $ | | 148 | | | | |
| Payable for investments purchased | | | | 7,641 | | | | |
| Payable for fund shares redeemed | | | | 2,734 | | | | |
| Accrued management fee | | | | 432 | | | | |
| Distribution fees payable | | | | 341 | | | | |
| Other affiliated payables | | | | 292 | | | | |
| Other payables and accrued expenses | | | | 238 | | | | |
| Collateral on securities loaned, at value | | | | 29,296 | | | | |
| Total liabilities | | | | | | | | 41,122 |
| |
| Net Assets | | | | | | $ | | 1,085,519 |
| Net Assets consist of: | | | | | | | | |
| Paid in capital | | | | | | $ | | 1,043,170 |
| Undistributed net investment income | | | | | | | | 7,795 |
| Accumulated undistributed net realized gain (loss) on | | | | | | | | |
| investments and foreign currency transactions | | | | | | | | 10,582 |
| Net unrealized appreciation (depreciation) on | | | | | | | | |
| investments and assets and liabilities in foreign | | | | | | | | |
| currencies | | | | | | | | 23,972 |
| Net Assets | | | | | | $ | | 1,085,519 |
See accompanying notes which are an integral part of the financial statements.
21 Annual Report
| Financial Statements - continued | | | | |
| |
| |
| Statement of Assets and Liabilities — continued | | | | |
| Amounts in thousands (except per-share amounts) | | | | October 31, 2005 |
| |
| Calculation of Maximum Offering Price | | | | |
| Class A: | | | | |
| Net Asset Value and redemption price per share | | | | |
| ($132,699 ÷ 7,229 shares) | | $ | | 18.36 |
| Maximum offering price per share (100/94.25 of | | | | |
| $18.36) | | $ | | 19.48 |
| Class T: | | | | |
| Net Asset Value and redemption price per share | | | | |
| ($581,821 ÷ 31,214 shares) | | $ | | 18.64 |
| Maximum offering price per share (100/96.50 of | | | | |
| $18.64) | | $ | | 19.32 |
| Class B: | | | | |
| Net Asset Value and offering price per share | | | | |
| ($46,656 ÷ 2,647 shares)A | | $ | | 17.63 |
| Class C: | | | | |
| Net Asset Value and offering price per share | | | | |
| ($37,554 ÷ 2,092 shares)A | | $ | | 17.95 |
| Institutional Class: | | | | |
| Net Asset Value, offering price and redemption | | | | |
| price per share ($286,789 ÷ 15,387 shares) . | | $ | | 18.64 |
| |
| A Redemption price per share is equal to net asset value less any applicable contingent deferred sales charge. | | | | |
See accompanying notes which are an integral part of the financial statements.
Annual Report 22
| Statement of Operations | | | | | | |
| Amounts in thousands | | | | Year ended October 31, 2005 |
| |
| Investment Income | | | | | | |
| Dividends | | | | $ | | 25,987 |
| Interest | | | | | | 733 |
| Security lending | | | | | | 1,067 |
| | | | | | | 27,787 |
| Less foreign taxes withheld | | | | | | (3,677) |
| Total income | | | | | | 24,110 |
| |
| Expenses | | | | | | |
| Management fee | | | | | | |
| Basic fee | | $ | | 9,114 | | |
| Performance adjustment | | | | (2,646) | | |
| Transfer agent fees | | | | 3,174 | | |
| Distribution fees | | | | 5,223 | | |
| Accounting and security lending fees | | | | 625 | | |
| Independent trustees’ compensation | | | | 6 | | |
| Custodian fees and expenses | | | | 576 | | |
| Registration fees | | | | 90 | | |
| Audit | | | | 83 | | |
| Legal | | | | 5 | | |
| Interest | | | | 39 | | |
| Miscellaneous | | | | 23 | | |
| Total expenses before reductions | | | | 16,312 | | |
| Expense reductions | | | | (1,162) | | 15,150 |
| |
| Net investment income (loss) | | | | | | 8,960 |
| Realized and Unrealized Gain (Loss) | | | | | | |
| Net realized gain (loss) on: | | | | | | |
| Investment securities (net of foreign taxes of $199) | | | | 270,061 | | |
| Foreign currency transactions | | | | 76 | | |
| Total net realized gain (loss) | | | | | | 270,137 |
| Change in net unrealized appreciation (depreciation) on: | | | | |
| Investment securities (net of decrease in deferred for- | | | | |
| eign taxes of $515) | | | | (63,413) | | |
| Assets and liabilities in foreign currencies | | | | (73) | | |
| Total change in net unrealized appreciation | | | | | | |
| (depreciation) | | | | | | (63,486) |
| Net gain (loss) | | | | | | 206,651 |
| Net increase (decrease) in net assets resulting from | | | | | | |
| operations | | | | $ | | 215,611 |
See accompanying notes which are an integral part of the financial statements.
23 Annual Report
| Financial Statements - continued | | | | | | | | |
| |
| |
| Statement of Changes in Net Assets | | | | | | | | |
| | | | | Year ended | | | | Year ended |
| | | | | October 31, | | | | October 31, |
| Amounts in thousands | | | | 2005 | | | | 2004 |
| Increase (Decrease) in Net Assets | | | | | | | | |
| Operations | | | | | | | | |
| Net investment income (loss) | | $ | | 8,960 | | $ | | 1,999 |
| Net realized gain (loss) | | | | 270,137 | | | | 144,792 |
| Change in net unrealized appreciation (depreciation) . | | (63,486) | | | | (48) |
| Net increase (decrease) in net assets resulting | | | | | | | | |
| from operations | | | | 215,611 | | | | 146,743 |
| Distributions to shareholders from net investment income | | . | | (2,281) | | | | (9,233) |
| Distributions to shareholders from net realized gain | | | | (5,591) | | | | — |
| Total distributions | | | | (7,872) | | | | (9,233) |
| Share transactions -- net increase (decrease) | | | | (709,958) | | | | 98,813 |
| Redemption fees | | | | 52 | | | | 19 |
| Total increase (decrease) in net assets | | | | (502,167) | | | | 236,342 |
| |
| Net Assets | | | | | | | | |
| Beginning of period | | | | 1,587,686 | | | | 1,351,344 |
| End of period (including undistributed net investment | | | | | | | | |
| income of $7,795 and undistributed net investment | | | | | | | | |
| income of $897, respectively) | | $ | | 1,085,519 | | $ | | 1,587,686 |
See accompanying notes which are an integral part of the financial statements.
| Financial Highlights — Class A | | | | | | | | |
| Years ended October 31, | | 2005 | | 2004 | | 2003 | | 2002 | | 2001 |
| Selected Per-Share Data | | | | | | | | | | |
| Net asset value, beginning of | | | | | | | | | | |
| period | | $ 15.86 | | $ 14.41 | | $ 11.01 | | $ 12.90 | | $ 19.88 |
| Income from Investment | | | | | | | | | | |
| Operations | | | | | | | | | | |
| Net investment income | | | | | | | | | | |
| (loss)C | | 13 | | .04D | | .05 | | .01 | | .06 |
| Net realized and unreal- | | | | | | | | | | |
| ized gain (loss) | | 2.47 | | 1.54 | | 3.35 | | (1.90) | | (4.89) |
| Total from investment | | | | | | | | | | |
| operations | | 2.60 | | 1.58 | | 3.40 | | (1.89) | | (4.83) |
| Distributions from net | | | | | | | | | | |
| investment income | | (.04) | | (.13) | | — | | — | | (.43) |
| Distributions from net | | | | | | | | | | |
| realized gain | | (.06) | | — | | — | | — | | (1.72) |
| Total distributions | | (.10) | | (.13) | | — | | — | | (2.15) |
| Redemption fees added to | | | | | | | | | | |
| paid in capitalC | | —F | | —F | | — | | — | | — |
| Net asset value, end of | | | | | | | | | | |
| period | | $ 18.36 | | $ 15.86 | | $ 14.41 | | $ 11.01 | | $ 12.90 |
| Total ReturnA,B | | 16.44% | | 11.03% | | 30.88% | | (14.65)% | | (27.16)% |
| Ratios to Average Net AssetsE | | | | | | | | | | |
| Expenses before expense | | | | | | | | | | |
| reductions | | 1.24% | | 1.36% | | 1.34% | | 1.56% | | 1.46% |
| Expenses net of voluntary | | | | | | | | | | |
| waivers, if any | | 1.24% | | 1.36% | | 1.34% | | 1.56% | | 1.46% |
| Expenses net of all | | | | | | | | | | |
| reductions | | 1.15% | | 1.32% | | 1.30% | | 1.52% | | 1.41% |
| Net investment income | | | | | | | | | | |
| (loss) | | 76% | | .24%D | | .43% | | .07% | | .40% |
| Supplemental Data | | | | | | | | | | |
| Net assets, end of period | | | | | | | | | | |
| (in millions) | | $ 133 | | $ 115 | | $ 68 | | $ 44 | | $ 46 |
| Portfolio turnover rate | | 120% | | 85% | | 99% | | 73% | | 99% |
A Total returns would have been lower had certain expenses not been reduced during the periods shown.
B Total returns do not include the effect of the sales charges.
C Calculated based on average shares outstanding during the period.
D Net investment income per share includes approximately $.01 per share received as a result of a reorganization of an issuer that was in bank ruptcy. Excluding this non recurring amount, the ratio of net investment income to average net assets would have been .21%.
E Expense ratios reflect operating expenses of the class. Expenses before reductions do not reflect amounts reimbursed by the investment adviser or reductions from brokerage service arrangements or other expense offset arrangements and do not represent the amount paid by the class during periods when reimbursements or reductions occur. Expenses net of any voluntary waivers reflect expenses after reimbursement by the investment adviser but prior to reductions from brokerage service arrangements or other expense offset arrangements. Expenses net of all reductions repre sent the net expenses paid by the class.
F Amount represents less than $.01 per share.
See accompanying notes which are an integral part of the financial statements.
25 Annual Report
| Financial Highlights — Class T | | | | | | | | |
| Years ended October 31, | | 2005 | | 2004 | | 2003 | | 2002 | | 2001 |
| Selected Per-Share Data | | | | | | | | | | |
| Net asset value, beginning of | | | | | | | | | | |
| period | | $ 16.09 | | $ 14.61 | | $ 11.18 | | $ 13.11 | | $ 20.13 |
| Income from Investment | | | | | | | | | | |
| Operations | | | | | | | | | | |
| Net investment income | | | | | | | | | | |
| (loss)C | | 11 | | .02D | | .04 | | (.01) | | .04 |
| Net realized and unreal- | | | | | | | | | | |
| ized gain (loss) | | 2.51 | | 1.56 | | 3.39 | | (1.92) | | (4.99) |
| Total from investment | | | | | | | | | | |
| operations | | 2.62 | | 1.58 | | 3.43 | | (1.93) | | (4.95) |
| Distributions from net | | | | | | | | | | |
| investment income | | (.01) | | (.10) | | — | | — | | (.35) |
| Distributions from net | | | | | | | | | | |
| realized gain | | (.06) | | — | | — | | — | | (1.72) |
| Total distributions | | (.07) | | (.10) | | — | | — | | (2.07) |
| Redemption fees added to | | | | | | | | | | |
| paid in capitalC | | —F | | —F | | — | | — | | — |
| Net asset value, end of | | | | | | | | | | |
| period | | $ 18.64 | | $ 16.09 | | $ 14.61 | | $ 11.18 | | $ 13.11 |
| Total ReturnA,B | | 16.31% | | 10.86% | | 30.68% | | (14.72)% | | (27.33)% |
| Ratios to Average Net AssetsE | | | | | | | | | | |
| Expenses before expense | | | | | | | | | | |
| reductions | | 1.36% | | 1.48% | | 1.46% | | 1.68% | | 1.62% |
| Expenses net of voluntary | | | | | | | | | | |
| waivers, if any | | 1.36% | | 1.48% | | 1.46% | | 1.68% | | 1.62% |
| Expenses net of all | | | | | | | | | | |
| reductions | | 1.27% | | 1.43% | | 1.42% | | 1.64% | | 1.57% |
| Net investment income | | | | | | | | | | |
| (loss) | | 64% | | .12%D | | .31% | | (.05)% | | .24% |
| Supplemental Data | | | | | | | | | | |
| Net assets, end of period | | | | | | | | | | |
| (in millions) | | $ 582 | | $ 1,181 | | $ 1,114 | | $ 928 | | $ 1,185 |
| Portfolio turnover rate | | 120% | | 85% | | 99% | | 73% | | 99% |
A Total returns would have been lower had certain expenses not been reduced during the periods shown.
B Total returns do not include the effect of the sales charges.
C Calculated based on average shares outstanding during the period.
D Net investment income per share includes approximately $.01 per share received as a result of a reorganization of an issuer that was in bank ruptcy. Excluding this non recurring amount, the ratio of net investment income to average net assets would have been .09%.
E Expense ratios reflect operating expenses of the class. Expenses before reductions do not reflect amounts reimbursed by the investment adviser or reductions from brokerage service arrangements or other expense offset arrangements and do not represent the amount paid by the class during periods when reimbursements or reductions occur. Expenses net of any voluntary waivers reflect expenses after reimbursement by the investment adviser but prior to reductions from brokerage service arrangements or other expense offset arrangements. Expenses net of all reductions repre sent the net expenses paid by the class.
F Amount represents less than $.01 per share.
See accompanying notes which are an integral part of the financial statements.
| Financial Highlights — Class B | | | | | | | | |
| Years ended October 31, | | 2005 | | 2004 | | 2003 | | 2002 | | 2001 |
| Selected Per-Share Data | | | | | | | | | | |
| Net asset value, beginning of | | | | | | | | | | |
| period | | $ 15.26 | | $ 13.87 | | $ 10.71 | | $ 12.63 | | $ 19.49 |
| Income from Investment | | | | | | | | | | |
| Operations | | | | | | | | | | |
| Net investment income | | | | | | | | | | |
| (loss)C | | (.01) | | (.10)D | | (.06) | | (.08) | | (.06) |
| Net realized and unreal- | | | | | | | | | | |
| ized gain (loss) | | 2.38 | | 1.50 | | 3.22 | | (1.84) | | (4.83) |
| Total from investment | | | | | | | | | | |
| operations | | 2.37 | | 1.40 | | 3.16 | | (1.92) | | (4.89) |
| Distributions from net | | | | | | | | | | |
| investment income | | — | | (.01) | | — | | — | | (.25) |
| Distributions from net | | | | | | | | | | |
| realized gain | | — | | — | | — | | — | | (1.72) |
| Total distributions | | — | | (.01) | | — | | — | | (1.97) |
| Redemption fees added to | | | | | | | | | | |
| paid in capitalC | | —F | | —F | | — | | — | | — |
| Net asset value, end of | | | | | | | | | | |
| period | | $ 17.63 | | $ 15.26 | | $ 13.87 | | $ 10.71 | | $ 12.63 |
| Total ReturnA,B | | 15.53% | | 10.10% | | 29.51% | | (15.20)% | | (27.83)% |
| Ratios to Average Net AssetsE | | | | | | | | | | |
| Expenses before expense | | | | | | | | | | |
| reductions | | 2.04% | | 2.25% | | 2.27% | | 2.43% | | 2.27% |
| Expenses net of voluntary | | | | | | | | | | |
| waivers, if any | | 2.04% | | 2.25% | | 2.27% | | 2.30% | | 2.27% |
| Expenses net of all | | | | | | | | | | |
| reductions | | 1.95% | | 2.21% | | 2.22% | | 2.26% | | 2.23% |
| Net investment income | | | | | | | | | | |
| (loss) | | (.04)% | | (.65)%D | | (.49)% | | (.66)% | | (.42)% |
| Supplemental Data | | | | | | | | | | |
| Net assets, end of period | | | | | | | | | | |
| (in millions) | | $ 47 | | $ 57 | | $ 59 | | $ 53 | | $ 80 |
| Portfolio turnover rate | | 120% | | 85% | | 99% | | 73% | | 99% |
A Total returns would have been lower had certain expenses not been reduced during the periods shown.
B Total returns do not include the effect of the contingent deferred sales charge.
C Calculated based on average shares outstanding during the period.
D Net investment income per share includes approximately $.01 per share received as a result of a reorganization of an issuer that was in bank ruptcy. Excluding this non recurring amount, the ratio of net investment income to average net assets would have been (.68)%.
E Expense ratios reflect operating expenses of the class. Expenses before reductions do not reflect amounts reimbursed by the investment adviser or reductions from brokerage service arrangements or other expense offset arrangements and do not represent the amount paid by the class during periods when reimbursements or reductions occur. Expenses net of any voluntary waivers reflect expenses after reimbursement by the investment adviser but prior to reductions from brokerage service arrangements or other expense offset arrangements. Expenses net of all reductions repre sent the net expenses paid by the class.
F Amount represents less than $.01 per share.
See accompanying notes which are an integral part of the financial statements.
27 Annual Report
| Financial Highlights — Class C | | | | | | | | |
| Years ended October 31, | | 2005 | | 2004 | | 2003 | | 2002 | | 2001 |
| Selected Per-Share Data | | | | | | | | | | |
| Net asset value, beginning of | | | | | | | | | | |
| period | | $ 15.53 | | $ 14.11 | | $ 10.88 | | $ 12.84 | | $ 19.80 |
| Income from Investment | | | | | | | | | | |
| Operations | | | | | | | | | | |
| Net investment income | | | | | | | | | | |
| (loss)C | | —F | | (.08)D | | (.05) | | (.08) | | (.05) |
| Net realized and unreal- | | | | | | | | | | |
| ized gain (loss) | | 2.42 | | 1.52 | | 3.28 | | (1.88) | | (4.89) |
| Total from investment | | | | | | | | | | |
| operations | | 2.42 | | 1.44 | | 3.23 | | (1.96) | | (4.94) |
| Distributions from net | | | | | | | | | | |
| investment income | | — | | (.02) | | — | | — | | (.30) |
| Distributions from net | | | | | | | | | | |
| realized gain | | — | | — | | — | | — | | (1.72) |
| Total distributions | | — | | (.02) | | — | | — | | (2.02) |
| Redemption fees added to | | | | | | | | | | |
| paid in capitalC | | —F | | —F | | — | | — | | — |
| Net asset value, end of | | | | | | | | | | |
| period | | $ 17.95 | | $ 15.53 | | $ 14.11 | | $ 10.88 | | $ 12.84 |
| Total ReturnA,B | | 15.58% | | 10.21% | | 29.69% | | (15.26)% | | (27.70)% |
| Ratios to Average Net AssetsE | | | | | | | | | | |
| Expenses before expense | | | | | | | | | | |
| reductions | | 2.00% | | 2.14% | | 2.17% | | 2.34% | | 2.19% |
| Expenses net of voluntary | | | | | | | | | | |
| waivers, if any | | 2.00% | | 2.14% | | 2.17% | | 2.30% | | 2.19% |
| Expenses net of all | | | | | | | | | | |
| reductions | | 1.90% | | 2.10% | | 2.13% | | 2.26% | | 2.14% |
| Net investment income | | | | | | | | | | |
| (loss) | | 01% | | (.54)%D | | (.40)% | | (.66)% | | (.34)% |
| Supplemental Data | | | | | | | | | | |
| Net assets, end of period | | | | | | | | | | |
| (in millions) | | $ 38 | | $ 40 | | $ 41 | | $ 36 | | $ 52 |
| Portfolio turnover rate | | 120% | | 85% | | 99% | | 73% | | 99% |
A Total returns would have been lower had certain expenses not been reduced during the periods shown.
B Total returns do not include the effect of the contingent deferred sales charge.
C Calculated based on average shares outstanding during the period.
D Net investment income per share includes approximately $.01 per share received as a result of a reorganization of an issuer that was in bank ruptcy. Excluding this non recurring amount, the ratio of net investment income to average net assets would have been (.57)%.
E Expense ratios reflect operating expenses of the class. Expenses before reductions do not reflect amounts reimbursed by the investment adviser or reductions from brokerage service arrangements or other expense offset arrangements and do not represent the amount paid by the class during periods when reimbursements or reductions occur. Expenses net of any voluntary waivers reflect expenses after reimbursement by the investment adviser but prior to reductions from brokerage service arrangements or other expense offset arrangements. Expenses net of all reductions repre sent the net expenses paid by the class.
F Amount represents less than $.01 per share.
See accompanying notes which are an integral part of the financial statements.
| Financial Highlights — Institutional Class | | | | |
| Years ended October 31, | | 2005 | | 2004 | | 2003 | | 2002 | | 2001 |
| Selected Per-Share Data | | | | | | | | | | |
| Net asset value, beginning of | | | | | | | | | | |
| period | | $ 16.09 | | $ 14.60 | | $ 11.11 | | $ 12.97 | | $ 19.95 |
| Income from Investment | | | | | | | | | | |
| Operations | | | | | | | | | | |
| Net investment income | | | | | | | | | | |
| (loss)B | | 21 | | .10C | | .10 | | .06 | | .12 |
| Net realized and unreal- | | | | | | | | | | |
| ized gain (loss) | | 2.50 | | 1.56 | | 3.39 | | (1.92) | | (4.91) |
| Total from investment | | | | | | | | | | |
| operations | | 2.71 | | 1.66 | | 3.49 | | (1.86) | | (4.79) |
| Distributions from net | | | | | | | | | | |
| investment income | | (.10) | | (.17) | | — | | — | | (.47) |
| Distributions from net | | | | | | | | | | |
| realized gain | | (.06) | | — | | — | | — | | (1.72) |
| Total distributions | | (.16) | | (.17) | | — | | — | | (2.19) |
| Redemption fees added to | | | | | | | | | | |
| paid in capitalB | | —E | | —E | | — | | — | | — |
| Net asset value, end of | | | | | | | | | | |
| period | | $ 18.64 | | $ 16.09 | | $ 14.60 | | $ 11.11 | | $ 12.97 |
| Total ReturnA | | 16.91% | | 11.46% | | 31.41% | | (14.34)% | | (26.89)% |
| Ratios to Average Net AssetsD | | | | | | | | | | |
| Expenses before expense | | | | | | | | | | |
| reductions | | 83% | | .98% | | .93% | | 1.14% | | 1.06% |
| Expenses net of voluntary | | | | | | | | | | |
| waivers, if any | | 83% | | .98% | | .93% | | 1.14% | | 1.06% |
| Expenses net of all | | | | | | | | | | |
| reductions | | 73% | | .93% | | .89% | | 1.10% | | 1.02% |
| Net investment income | | | | | | | | | | |
| (loss) | | 1.18% | | .62%C | | .84% | | .49% | | .79% |
| Supplemental Data | | | | | | | | | | |
| Net assets, end of period | | | | | | | | | | |
| (in millions) | | $ 287 | | $ 194 | | $ 69 | | $ 63 | | $ 69 |
| Portfolio turnover rate | | 120% | | 85% | | 99% | | 73% | | 99% |
A Total returns would have been lower had certain expenses not been reduced during the periods shown.
B Calculated based on average shares outstanding during the period.
C Net investment income per share includes approximately $.01 per share received as a result of a reorganization of an issuer that was in bank ruptcy. Excluding this non recurring amount, the ratio of net investment income to average net assets would have been .59%.
D Expense ratios reflect operating expenses of the class. Expenses before reductions do not reflect amounts reimbursed by the investment adviser or reductions from brokerage service arrangements or other expense offset arrangements and do not represent the amount paid by the class during periods when reimbursements or reductions occur. Expenses net of any voluntary waivers reflect expenses after reimbursement by the investment adviser but prior to reductions from brokerage service arrangements or other expense offset arrangements. Expenses net of all reductions repre sent the net expenses paid by the class.
E Amount represents less than $.01 per share.
See accompanying notes which are an integral part of the financial statements.
29 Annual Report
Notes to Financial Statements
For the period ended October 31, 2005
(Amounts in thousands except ratios)
|
1. Significant Accounting Policies.
Fidelity Advisor Overseas Fund (the fund) is a fund of Fidelity Advisor Series VIII (the trust) and is authorized to issue an unlimited number of shares. The trust is registered under the Investment Company Act of 1940, as amended (the 1940 Act), as an open-end management investment company organized as a Massachusetts business trust.
The fund offers Class A, Class T, Class B, Class C, and Institutional Class shares, each of which has equal rights as to assets and voting privileges. Each class has exclusive voting rights with respect to matters that affect that class. Class B shares will automatically convert to Class A shares after a holding period of seven years from the initial date of purchase. Investment income, realized and unrealized capital gains and losses, the common expenses of the fund, and certain fund-level expense reductions, if any, are allocated on a pro rata basis to each class based on the relative net assets of each class to the total net assets of the fund. Each class differs with respect to transfer agent and distribution and service plan fees incurred. Certain expense reductions also differ by class.
The fund may invest in affiliated money market central funds (Money Market Central Funds), which are open-end investment companies available to investment companies and other accounts managed by Fidelity Management & Research Company (FMR) and its affiliates. The fund’s investments in emerging markets can be subject to social, economic, regulatory, and political uncertainties and can be extremely volatile. The financial statements have been prepared in conformity with accounting principles generally accepted in the United States of America, which require management to make certain estimates and assumptions at the date of the financial statements. The following summarizes the significant accounting policies of the fund:
Security Valuation. Investments are valued and net asset value (NAV) per share is calculated (NAV calculation) as of the close of business of the New York Stock Exchange (NYSE), normally 4:00 p.m. Eastern time. Wherever possible, the fund uses independent pricing services approved by the Board of Trustees to value its investments.
Equity securities, including restricted securities, for which market quotations are readily available, are valued at the last reported sale price or official closing price as reported by an independent pricing service on the primary market or exchange on which they are traded. In the event there were no sales during the day or closing prices are not available, securities are valued at the last quoted bid price. Investments in open-end mutual funds are valued at their closing net asset value each business day. Short-term securities with remaining maturities of sixty days or less for which quotations are not readily available are valued at amortized cost, which approximates value.
1. Significant Accounting Policies - continued
Security Valuation - continued
When current market prices or quotations are not readily available or do not accurately reflect fair value, valuations may be determined in accordance with procedures adopted by the Board of Trustees. For example, when developments occur between the close of a market and the close of the NYSE that may materially affect the value of some or all of the securities, or when trading in a security is halted, those securities may be fair valued.
Factors used in the determination of fair value may include monitoring news to identify significant market or security specific events such as changes in the value of U.S. securities market, reviewing developments in foreign markets and evaluating the performance of ADRs, futures contracts and exchange-traded funds. Because the fund’s utilization of fair value pricing depends on market activity, the frequency with which fair value pricing is used can not be predicted and may be utilized to a significant extent. The value of securities used for NAV calculation under fair value pricing may differ from published prices for the same securities.
Foreign Currency. The fund uses foreign currency contracts to facilitate transactions in foreign-denominated securities. Losses from these transactions may arise from changes in the value of the foreign currency or if the counterparties do not perform under the contracts’ terms.
Foreign-denominated assets, including investment securities, and liabilities are translated into U.S. dollars at the exchange rate at period end. Purchases and sales of investment securities, income and dividends received and expenses denominated in foreign currencies are translated into U.S. dollars at the exchange rate in effect on the transaction date.
The effects of exchange rate fluctuations on investments are included with the net realized and unrealized gain (loss) on investment securities. Other foreign currency transactions resulting in realized and unrealized gain (loss) are disclosed separately.
Investment Transactions and Income. Security transactions are accounted for as of trade date. Gains and losses on securities sold are determined on the basis of identified cost. Dividend income is recorded on the ex-dividend date, except for certain dividends from foreign securities where the ex-dividend date may have passed, which are recorded as soon as the fund is informed of the ex-dividend date. Non-cash dividends included in dividend income, if any, are recorded at the fair market value of the securities received. Interest income is accrued as earned. Interest income includes coupon interest and amortization of premium and accretion of discount on debt securities. Investment income is recorded net of foreign taxes withheld where recovery of such taxes is uncertain.
31 Annual Report
Notes to Financial Statements - continued
(Amounts in thousands except ratios)
1. Significant Accounting Policies - continued
Expenses. Most expenses of the trust can be directly attributed to a fund. Expenses which cannot be directly attributed are apportioned among each fund in the trust.
Income Tax Information and Distributions to Shareholders. Each year, the fund intends to qualify as a regulated investment company by distributing all of its taxable income and realized gains under Subchapter M of the Internal Revenue Code. As a result, no provision for income taxes is required in the accompanying financial statements. Foreign taxes are provided for based on the fund’s understanding of the tax rules and rates that exist in the foreign markets in which it invests.
Distributions are recorded on the ex-dividend date. Income dividends and capital gain distributions are declared separately for each class. Income and capital gain distributions are determined in accordance with income tax regulations, which may differ from generally accepted accounting principles. In addition, the fund will claim a portion of the payment made to redeeming shareholders as a distribution for income tax purposes.
Capital accounts within the financial statements are adjusted for permanent book-tax differences. These adjustments have no impact on net assets or the results of operations. Temporary book-tax differences will reverse in a subsequent period.
Book-tax differences are primarily due to foreign currency transactions, certain foreign taxes, passive foreign investment companies (PFIC), capital loss carryforward, and losses deferred due to wash sales.
The tax-basis components of distributable earnings and the federal tax cost as of period end were as follows:
| Unrealized appreciation | | $ | | 75,603 | | | | |
| Unrealized depreciation | | | | (58,685) | | | | |
| Net unrealized appreciation (depreciation) | | | | 16,918 | | | | |
| Undistributed ordinary income | | | | 15,854 | | | | |
| Undistributed long-term capital gain | | | | 8,404 | | | | |
| |
| Cost for federal income tax purposes | | $ | | 1,100,193 | | | | |
| |
| The tax character of distributions paid was as follows: | | | | |
| | | | | October 31, 2005 | | | | October 31, 2004 |
| Ordinary Income | | $ | | 7,872 | | $ | | 9,233 |
Short-Term Trading (Redemption) Fees. Shares held in the fund less than 30 days are subject to a redemption fee equal to 1.00% of the proceeds of the redeemed shares. All redemption fees, including any estimated redemption fees paid by FMR, are retained by the fund and accounted for as an addition to paid in capital.
Repurchase Agreements. FMR has received an Exemptive Order from the Securities and Exchange Commission (the SEC) which permits the fund and other affiliated entities of FMR to transfer uninvested cash balances into joint trading accounts which are then invested in repurchase agreements. The fund may also invest directly with institutions in repurchase agreements. Repurchase agreements are collateralized by government or non-government securities. Collateral is held in segregated accounts with custodian banks and may be obtained in the event of a default of the counterparty. The fund monitors, on a daily basis, the value of the collateral to ensure it is at least equal to the principal amount of the repurchase agreement (including accrued interest). In the event of a default by the counterparty, realization of the collateral proceeds could be delayed, during which time the value of the collateral may decline.
3. Purchases and Sales of Investments.
Purchases and sales of securities, other than short-term securities and U.S. government securities, aggregated $1,474,617 and $2,149,058, respectively.
4. Fees and Other Transactions with Affiliates.
Management Fee. FMR and its affiliates provide the fund with investment management related services for which the fund pays a monthly management fee. The management fee is the sum of an individual fund fee rate that is based on an annual rate of .45% of the fund’s average net assets and a group fee rate that averaged .27% during the period. The group fee rate is based upon the average net assets of all the mutual funds advised by FMR. The group fee rate decreases as assets under management increase and increases as assets under management decrease. In addition, the management fee is subject to a performance adjustment (up to a maximum of .20% of the fund’s average net assets over a 36 month performance period). The upward or downward adjustment to the management fee is based on the investment performance of the asset-weighted return of all classes as compared to an appropriate benchmark index. For the period, the total annual management fee rate, including the performance adjustment, was .51% of the fund’s average net assets.
Distribution and Service Plan. In accordance with Rule 12b-1 of the 1940 Act, the fund has adopted separate Distribution and Service Plans for each class of shares. Certain classes pay Fidelity Distributors Corporation (FDC), an affiliate of FMR, separate Distribution and Service Fees, each of which is based on an annual percentage of each class’ average net assets. In addition, FDC may pay financial intermediaries for selling shares of the fund and providing shareholder support services. For the period, the
33 Annual Report
Notes to Financial Statements - continued
(Amounts in thousands except ratios)
4. Fees and Other Transactions with Affiliates - continued
Distribution and Service Plan - continued
Distribution and Service Fee rates and the total amounts paid to and retained by FDC were as follows:
| | | Distribution | | Service | | | | Paid to | | | | Retained |
| | | Fee | | Fee | | | | FDC | | | | by FDC |
| Class A | | 0% | | .25% | | $ | | 303 | | $ | | 4 |
| Class T | | 25% | | .25% | | | | 3,993 | | | | 54 |
| Class B | | 75% | | .25% | | | | 534 | | | | 401 |
| Class C | | 75% | | .25% | | | | 393 | | | | 26 |
| | | | | | | $ | | 5,223 | | $ | | 485 |
Sales Load. FDC receives a front-end sales charge of up to 5.75% for selling Class A shares, and 3.50% for selling Class T shares, some of which is paid to financial intermediaries for selling shares of the fund. FDC receives the proceeds of contingent deferred sales charges levied on Class A, Class T, Class B, and Class C redemptions. These charges depend on the holding period. The deferred sales charges range from 5% to 1% for Class B, 1% for Class C, and .25% for certain purchases of Class A and Class T shares.
| For the period, sales charge amounts retained by FDC were as follows: | | |
| | | | | Retained |
| | | | | by FDC |
| Class A | | $ | | 17 |
| Class T | | | | 16 |
| Class B* | | | | 87 |
| Class C* | | | | 2 |
| | | $ | | 122 |
* When Class B and Class C shares are initially sold, FDC pays commissions from its own resources to financial intermediaries through which the sales are made.
Transfer Agent Fees. Fidelity Investments Institutional Operations Company, Inc. (FIIOC), an affiliate of FMR, is the transfer, dividend disbursing and shareholder servicing agent for each class of the fund. FIIOC receives account fees and asset-based fees that vary according to the account size and type of account of the shareholders of the
4. Fees and Other Transactions with Affiliates - continued
Transfer Agent Fees - continued
respective classes of the fund. FIIOC pays for typesetting, printing and mailing of shareholder reports, except proxy statements. For the period the total transfer agent fees paid by each class to FIIOC, were as follows:
| | | | | | | % of |
| | | | | | | Average |
| | | | | Amount | | Net Assets |
| Class A | | $ | | 444 | | .37 |
| Class T | | | | 1,867 | | .23 |
| Class B | | | | 221 | | .41 |
| Class C | | | | 145 | | .37 |
| Institutional Class | | | | 497 | | .20 |
| | | $ | | 3,174 | | |
Accounting and Security Lending Fees. Fidelity Service Company, Inc. (FSC), an affiliate of FMR, maintains the fund’s accounting records. The accounting fee is based on the level of average net assets for the month. Under a separate contract, FSC administers the security lending program. The security lending fee is based on the number and duration of lending transactions.
Affiliated Central Funds. The fund may invest in Money Market Central Funds which seek preservation of capital and current income and are managed by Fidelity Investments Money Management, Inc. (FIMM), an affiliate of FMR.
The Money Market Central Funds do not pay a management fee. Income distributions earned by the fund are recorded as income in the accompanying financial statements and totaled $2,345 for the period.
Brokerage Commissions. The fund placed a portion of its portfolio transactions with brokerage firms which are affiliates of the investment adviser. The commissions paid to these affiliated firms were $2 for the period.
Interfund Lending Program. Pursuant to an Exemptive Order issued by the SEC, the fund, along with other registered investment companies having management contracts with FMR, may participate in an interfund lending program. This program provides an alternative credit facility allowing the funds to borrow from, or lend money to, other participating affiliated funds. At period end, there were no interfund loans outstanding. The fund’s activity in this program during the period for which loans were outstanding was as follows:
| | | | | | | | | Interest Earned | | | | |
| Borrower | | | | Average Daily | | Weighted Average | | (included in | | | | |
| or Lender | | | | Loan Balance | | Interest Rate | | interest income) | | | | Interest Expense |
| Borrower | | $ | | 20,669 | | 2.77% | | — | | $ | | 38 |
35 Annual Report
Notes to Financial Statements - continued
(Amounts in thousands except ratios)
5. Committed Line of Credit.
The fund participates with other funds managed by FMR in a $4.2 billion credit facility (the “line of credit”) to be utilized for temporary or emergency purposes to fund shareholder redemptions or for other short-term liquidity purposes. The fund has agreed to pay commitment fees on its pro rata portion of the line of credit. During the period, there were no borrowings on this line of credit.
The fund lends portfolio securities from time to time in order to earn additional income. The fund receives collateral (in the form of U.S. Treasury obligations, letters of credit and/or cash) against the loaned securities and maintains collateral in an amount not less than 100% of the market value of the loaned securities during the period of the loan. The market value of the loaned securities is determined at the close of business of the fund and any additional required collateral is delivered to the fund on the next business day. If the borrower defaults on its obligation to return the securities loaned because of insolvency or other reasons, a fund could experience delays and costs in recovering the securities loaned or in gaining access to the collateral. Cash collateral is invested in the Fidelity Securities Lending Cash Central Fund. The value of loaned securities and cash collateral at period end are disclosed on the fund’s Statement of Assets and Liabilities. Security lending income represents the income earned on investing cash collateral, less fees and expenses associated with the loan, plus any premium payments that may be received on the loan of certain types of securities.
The fund is permitted to have bank borrowings for temporary or emergency purposes to fund shareholder redemptions. The fund has established borrowing arrangements with certain banks. The interest rate on the borrowings is the bank’s base rate, as revised from time to time. The average daily loan balance during the period for which loans were outstanding amounted to $5,536. The weighted average interest rate was 2.81% . At period end, there were no bank borrowings outstanding.
Many of the brokers with whom FMR places trades on behalf of the fund provided services to the fund in addition to trade execution. These services included payments of certain expenses on behalf of the fund totaling $1,161 for the period. In addition, through arrangements with each class’ transfer agent, credits realized as a result of uninvested cash balances were used to reduce the fund’s expenses. During the period, credits reduced each class’ transfer agent expense as noted in the table below.
| | | | | Transfer Agent |
| | | | | expense reduction |
| Class A | | $ | | 1 |
Annual Report 36
The fund’s organizational documents provide former and current trustees and officers with a limited indemnification against liabilities arising in connection with the performance of their duties to the fund. In the normal course of business, the fund may also enter into contracts that provide general indemnifications. The fund’s maximum exposure under these arrangements is unknown as this would be dependent on future claims that may be made against the fund. The risk of material loss from such claims is considered remote.
| 10. Distributions to Shareholders. | | | | | | | | |
| |
| Distributions to shareholders of each class were as follows: | | | | | | |
| Years ended October 31, | | | | 2005 | | | | 2004 | | |
| From net investment income | | | | | | | | | | |
| Class A | | $ | | 302 | | $ | | | | 690 |
| Class T | | | | 731 | | | | | | 7,601 |
| Class B | | | | — | | | | | | 43 |
| Class C | | | | — | | | | | | 60 |
| Institutional Class | | | | 1,248 | | | | | | 839 |
| Total | | $ | | 2,281 | | $ | | | | 9,233 |
| From net realized gain | | | | | | | | | | |
| Class A | | $ | | 453 | | $ | | | | — |
| Class T | | | | 4,389 | | | | | | — |
| Institutional Class | | | | 749 | | | | | | — |
| Total | | $ | | 5,591 | | $ | | | | — |
37 Annual Report
| Notes to Financial Statements - continued | | | | | | |
| (Amounts in thousands except ratios) | | | | | | | | | | |
| |
| |
| 11. Share Transactions. | | | | | | | | | | |
| |
| Transactions for each class of shares were as follows: | | | | | | | | |
| | | Shares | | | | | | Dollars | | |
| Years ended October 31, | | 2005 | | 2004 | | | | 2005 | | | | 2004 |
| Class A | | | | | | | | | | | | |
| Shares sold | | 3,732 | | 7,000 | | $ | | 65,178 | | $ | | 108,791 |
| Reinvestment of distributions | | 39 | | 42 | | | | 666 | | | | 626 |
| Shares redeemed | | (3,797) | | (4,530) | | | | (66,076) | | | | (70,180) |
| Net increase (decrease) | | (26) | | 2,512 | | $ | | (232) | | $ | | 39,237 |
| Class T | | | | | | | | | | | | |
| Shares sold | | 8,485 | | 24,989 | | $ | | 148,888 | | $ | | 393,254 |
| Reinvestment of distributions | | 288 | | 495 | | | | 5,033 | | | | 7,425 |
| Shares redeemed | | (50,965) | | (28,317) | | | | (894,992) | | | | (445,467) |
| Net increase (decrease) | | (42,192) | | (2,833) | | $ | | (741,071) | | $ | | (44,788) |
| Class B | | | | | | | | | | | | |
| Shares sold | | 210 | | 620 | | $ | | 3,515 | | $ | | 9,320 |
| Reinvestment of distributions | | — | | 3 | | | | — | | | | 38 |
| Shares redeemed | | (1,282) | | (1,179) | | | | (21,411) | | | | (17,557) |
| Net increase (decrease) | | (1,072) | | (556) | | $ | | (17,896) | | $ | | (8,199) |
| Class C | | | | | | | | | | | | |
| Shares sold | | 321 | | 667 | | $ | | 5,484 | | $ | | 10,090 |
| Reinvestment of distributions | | — | | 4 | | | | — | | | | 52 |
| Shares redeemed | | (822) | | (957) | | | | (14,006) | | | | (14,442) |
| Net increase (decrease) | | (501) | | (286) | | $ | | (8,522) | | $ | | (4,300) |
| Institutional Class | | | | | | | | | | | | |
| Shares sold | | 5,599 | | 9,569 | | $ | | 98,450 | | $ | | 152,454 |
| Reinvestment of distributions | | 61 | | 35 | | | | 1,066 | | | | 515 |
| Shares redeemed | | (2,356) | | (2,281) | | | | (41,753) | | | | (36,106) |
| Net increase (decrease) | | 3,304 | | 7,323 | | $ | | 57,763 | | $ | | 116,863 |
Report of Independent Registered Public Accounting Firm
To the Trustees of Fidelity Advisor Series VIII and the Shareholders of Fidelity Advisor Overseas Fund:
In our opinion, the accompanying statement of assets and liabilities, including the schedule of investments, and the related statements of operations and of changes in net assets and the financial highlights present fairly, in all material respects, the financial position of Fidelity Advisor Overseas Fund (a fund of Fidelity Advisor Series VIII) at October 31, 2005 and the results of its operations, the changes in its net assets and the financial highlights for the periods indicated, in conformity with accounting principles generally accepted in the United States of America. These financial statements and financial highlights (hereafter referred to as “financial statements”) are the responsibility of the Fidelity Advisor Overseas Fund’s management; our responsibility is to express an opinion on these financial statements based on our audits. We conducted our audits of these financial statements in accordance with the standards of the Public Company Accounting Oversight Board (United States). Those standards require that we plan and perform the audit to obtain reasonable assurance about whether the financial statements are free of material misstatement. An audit includes examining, on a test basis, evidence supporting the amounts and disclosures in the financial statements, assessing the accounting principles used and significant estimates made by management, and evaluating the overall financial statement presentation. We believe that our audits, which included confirmation of securities at October 31, 2005 by correspondence with the custodian and brokers, provide a reasonable basis for our opinion.
/s/ PricewaterhouseCoopers LLP
PricewaterhouseCoopers LLP
Boston, Massachusetts
December 13, 2005
|
39 Annual Report
Trustees and Officers
The Trustees, Members of the Advisory Board, and executive officers of the trust and fund, as applicable, are listed below. The Board of Trustees governs the fund and is responsible for protecting the interests of shareholders. The Trustees are experienced executives who meet periodically throughout the year to oversee the fund’s activities, review contractual arrangements with companies that provide services to the fund, and review the fund’s performance. Except for William O. McCoy, Stephen P. Jonas, and Kenneth L. Wolfe, each of the Trustees oversees 322 funds advised by FMR or an affiliate. Mr. McCoy oversees 324 funds advised by FMR or an affiliate. Mr. Jonas and Mr. Wolfe oversee 319 funds advised by FMR or an affiliate.
The Trustees hold office without limit in time except that (a) any Trustee may resign; (b) any Trustee may be removed by written instrument, signed by at least two-thirds of the number of Trustees prior to such removal; (c) any Trustee who requests to be retired or who has become incapacitated by illness or injury may be retired by written instrument signed by a majority of the other Trustees; and (d) any Trustee may be removed at any special meeting of shareholders by a two-thirds vote of the outstanding voting securities of the trust. Each Trustee who is not an interested person (as defined in the 1940 Act) (Independent Trustee), shall retire not later than the last day of the calendar year in which his or her 72nd birthday occurs. The Independent Trustees may waive this mandatory retirement age policy with respect to individual Trustees. The executive officers and Advisory Board Members hold office without limit in time, except that any officer and Advisory Board Member may resign or may be removed by a vote of a majority of the Trustees at any regular meeting or any special meeting of the Trustees. Except as indicated, each individual has held the office shown or other offices in the same company for the past five years.
The fund’s Statements of Additional Information (SAI) includes more information about the Trustees. To request a free copy, call Fidelity at 1-877-208-0098.
Correspondence intended for each Trustee who is an interested person may be sent to Fidelity Investments, 82 Devonshire Street, Boston, Massachusetts 02109.
| Name, Age; Principal Occupation |
| |
| Edward C. Johnson 3d (75)** |
| |
| Year of Election or Appointment: 1983 |
| Mr. Johnson is Chairman of the Board of Trustees. Mr. Johnson serves as |
| Chief Executive Officer, Chairman, and a Director of FMR Corp.; a Di- |
| rector and Chairman of the Board and of the Executive Committee of |
| FMR; Chairman and a Director of Fidelity Management & Research (Far |
| East) Inc.; Chairman and a Director of Fidelity Investments Money Man- |
| agement, Inc.; and Chairman (2001-present) and a Director |
| (2000-present) of FMR Co., Inc. |
| Name, Age; Principal Occupation |
| |
| Abigail P. Johnson (43)** |
| |
| Year of Election or Appointment: 2001 |
| Ms. Johnson serves as President of Fidelity Employer Services Company |
| (FESCO) (2005-present). She is President and a Director of Fidelity In- |
| vestments Money Management, Inc. (2001-present), FMR Co., Inc. |
| (2001-present), and a Director of FMR Corp. Previously, Ms. Johnson |
| served as President and a Director of FMR (2001-2005), Senior Vice |
| President of the Fidelity funds (2001-2005), and managed a number of |
| Fidelity funds. |
| |
| Stephen P. Jonas (52) |
| |
| Year of Election or Appointment: 2005 |
| Mr. Jonas is Senior Vice President of Advisor Overseas (2005-present). |
| He also serves as Senior Vice President of other Fidelity funds |
| (2005-present). Mr. Jonas is Executive Director of FMR (2005-present). |
| Previously, Mr. Jonas served as President of Fidelity Enterprise Opera- |
| tions and Risk Services (2004-2005), Chief Administrative Officer |
| (2002-2004), and Chief Financial Officer of FMR Co. (1998-2000). Mr. |
| Jonas has been with Fidelity Investments since 1987 and has held vari- |
| ous financial and management positions including Chief Financial Offi- |
| cer of FMR. In addition, he serves on the Boards of Boston Ballet |
| (2003-present) and Simmons College (2003-present). |
| |
| Robert L. Reynolds (53) |
| |
| Year of Election or Appointment: 2003 |
| Mr. Reynolds is a Director (2003-present) and Chief Operating Officer |
| (2002-present) of FMR Corp. He also serves on the Board at Fidelity |
| Investments Canada, Ltd. (2000-present). Previously, Mr. Reynolds |
| served as President of Fidelity Investments Institutional Retirement Group |
| (1996-2000). |
* Trustees have been determined to be “Interested Trustees” by virtue of, among other things, their affiliation with the trust or various entities under common control with FMR.
** Edward C. Johnson 3d, Trustee, is Abigail P. Johnson’s father.
41 Annual Report
Trustees and Officers - continued
Independent Trustees:
Correspondence intended for each Independent Trustee (that is, the Trustees other than the Interested Trustees) may be sent to Fidelity Investments, P.O. Box 55235, Boston, Massachusetts 02205-5235.
| Name, Age; Principal Occupation |
| |
| Dennis J. Dirks (57) |
| |
| Year of Election or Appointment: 2005 |
| Prior to his retirement in May 2003, Mr. Dirks was Chief Operating |
| Officer and a member of the Board of The Depository Trust & Clearing |
| Corporation (DTCC) (1999-2003). He also served as President, Chief |
| Operating Officer, and Board member of The Depository Trust |
| Company (DTC) (1999-2003) and President and Board member of the |
| National Securities Clearing Corporation (NSCC) (1999-2003). In addi- |
| tion, Mr. Dirks served as Chief Executive Officer and Board member of |
| the Government Securities Clearing Corporation (2001-2003) and Chief |
| Executive Officer and Board member of the Mortgage-Backed Securities |
| Clearing Corporation (2001-2003). Mr. Dirks also serves as a Trustee of |
| Manhattan College (2005-present). |
| |
| Robert M. Gates (62) |
| |
| Year of Election or Appointment: 1997 |
| Dr. Gates is Vice Chairman of the Independent Trustees (2005-present). |
| Dr. Gates is President of Texas A&M University (2002-present). He was |
| Director of the Central Intelligence Agency (CIA) from 1991 to 1993. |
| From 1989 to 1991, Dr. Gates served as Assistant to the President of |
| the United States and Deputy National Security Advisor. Dr. Gates is a |
| Director of NACCO Industries, Inc. (mining and manufacturing), Parker |
| Drilling Co., Inc. (drilling and rental tools for the energy industry, |
| 2001-present), and Brinker International (restaurant management, |
| 2003-present). Previously, Dr. Gates served as a Director of LucasVarity |
| PLC (automotive components and diesel engines), a Director of TRW Inc. |
| (automotive, space, defense, and information technology), and Dean of |
| the George Bush School of Government and Public Service at Texas |
| A&M University (1999-2001). Dr. Gates also is a Trustee of the Forum |
| for International Policy. |
| Name, Age; Principal Occupation |
| |
| George H. Heilmeier (69) |
| |
| Year of Election or Appointment: 2004 |
| Dr. Heilmeier is Chairman Emeritus of Telcordia Technologies (commu- |
| nication software and systems), where prior to his retirement, he served |
| as company Chairman and Chief Executive Officer. He currently serves |
| on the Boards of Directors of The Mitre Corporation (systems engineer- |
| ing and information technology support for the government), and HRL |
| Laboratories (private research and development, 2004-present). He is |
| Chairman of the General Motors Science & Technology Advisory Board |
| and a Life Fellow of the Institute of Electrical and Electronics Engineers |
| (IEEE) (2000-present). Dr. Heilmeier is a member of the Defense Science |
| Board and the National Security Agency Advisory Board. He is also a |
| member of the National Academy of Engineering, the American |
| Academy of Arts and Sciences, and the Board of Overseers of the |
| School of Engineering and Applied Science of the University of Pennsyl- |
| vania. Previously, Dr. Heilmeier served as a Director of TRW Inc. (auto- |
| motive, space, defense, and information technology, 1992-2002), |
| Compaq (1994-2002), Automatic Data Processing, Inc. (ADP) |
| (technology-based business outsourcing, 1995-2002), INET Technolo- |
| gies Inc. (telecommunications network surveillance, 2001-2004), and |
| Teletech Holdings (customer management services). He is the recipient of |
| the 2005 Kyoto Prize in Advanced Technology for his invention of the |
| liquid display. |
| |
| Marie L. Knowles (59) |
| |
| Year of Election or Appointment: 2001 |
| Prior to Ms. Knowles’ retirement in June 2000, she served as Executive |
| Vice President and Chief Financial Officer of Atlantic Richfield Company |
| (ARCO) (diversified energy, 1996-2000). From 1993 to 1996, she was |
| a Senior Vice President of ARCO and President of ARCO Transportation |
| Company. She served as a Director of ARCO from 1996 to 1998. She |
| currently serves as a Director of Phelps Dodge Corporation (copper |
| mining and manufacturing) and McKesson Corporation (healthcare ser- |
| vice, 2002-present). Ms. Knowles is a Trustee of the Brookings Institution |
| and the Catalina Island Conservancy and also serves as a member of |
| the Advisory Board for the School of Engineering of the University of |
| Southern California. |
43 Annual Report
Trustees and Officers - continued
| Name, Age; Principal Occupation |
| |
| Ned C. Lautenbach (61) |
| |
| Year of Election or Appointment: 2000 |
| Mr. Lautenbach has been a partner of Clayton, Dubilier & Rice, Inc. |
| (private equity investment firm) since September 1998. Previously, Mr. |
| Lautenbach was with the International Business Machines Corporation |
| (IBM) from 1968 until his retirement in 1998. Mr. Lautenbach serves as |
| a Director of Italtel Holding S.p.A. (telecommunications (Milan, Italy), |
| 2004-present) and Eaton Corporation (diversified industrial) as well as |
| the Philharmonic Center for the Arts in Naples, Florida. He also is a |
| member of the Board of Trustees of Fairfield University (2005-present), |
| as well as a member of the Council on Foreign Relations. |
| |
| Marvin L. Mann (72) |
| |
| Year of Election or Appointment: 1993 |
| Mr. Mann is Chairman of the Independent Trustees (2001-present). He is |
| Chairman Emeritus of Lexmark International, Inc. (computer |
| peripherals), where he served as CEO until April 1998, retired as |
| Chairman May 1999, and remains a member of the Board. Prior to |
| 1991, he held the positions of Vice President of International Business |
| Machines Corporation (IBM) and President and General Manager of |
| various IBM divisions and subsidiaries. He is a member of the Executive |
| Committee of the Independent Director’s Council of the Investment Com- |
| pany Institute. In addition, Mr. Mann is a member of the President’s |
| Cabinet at the University of Alabama and the Board of Visitors of the |
| Culverhouse College of Commerce and Business Administration at the |
| University of Alabama. |
| |
| William O. McCoy (72) |
| |
| Year of Election or Appointment: 1997 |
| Prior to his retirement in December 1994, Mr. McCoy was Vice Chair- |
| man of the Board of BellSouth Corporation (telecommunications) and |
| President of BellSouth Enterprises. He is currently a Director of Liberty |
| Corporation (holding company), Duke Realty Corporation (real estate), |
| and Progress Energy, Inc. (electric utility). He is also a partner of Frank- |
| lin Street Partners (private investment management firm) and a member |
| of the Research Triangle Foundation Board. In addition, Mr. McCoy |
| served as the Interim Chancellor (1999-2000) and a member of the |
| Board of Visitors for the University of North Carolina at Chapel Hill and |
| currently serves on the Board of Directors of the University of North |
| Carolina Health Care System and the Board of Visitors of the Kenan- |
| Flagler Business School (University of North Carolina at Chapel Hill). He |
| also served as Vice President of Finance for the University of North Car- |
| olina (16-school system). |
| Name, Age; Principal Occupation |
| |
| Cornelia M. Small (61) |
| |
| Year of Election or Appointment: 2005 |
| Ms. Small is a member (2000-present) and Chairperson (2002-present) |
| of the Investment Committee, and a member (2002-present) of the |
| Board of Trustees of Smith College. Previously, she served as Chief In- |
| vestment Officer (1999-2000), Director of Global Equity Investments |
| (1996-1999), and a member of the Board of Directors of Scudder, |
| Stevens & Clark (1990-1997) and Scudder Kemper Investments |
| (1997-1998). In addition, Ms. Small served as Co-Chair (2000-2003) |
| of the Annual Fund for the Fletcher School of Law and Diplomacy. |
| |
| William S. Stavropoulos (66) |
| |
| Year of Election or Appointment:2001 |
| Mr. Stavropoulos is Chairman of the Board (2000-present) and a Mem- |
| ber of the Board of Directors of The Dow Chemical Company. Since |
| joining The Dow Chemical Company in 1967, Mr. Stavropoulos served |
| in numerous senior management positions, including President |
| (1993-2000; 2002-2003), CEO (1995-2000; 2002-2004), and Chair- |
| man of the Executive Committee (2000-2004). Currently, he is a Direc- |
| tor of NCR Corporation (data warehousing and technology solutions), |
| BellSouth Corporation (telecommunications), Chemical Financial Corpo- |
| ration, Maersk Inc. (industrial conglomerate, 2002-present), and Metal- |
| mark Capital (private equity investment firm, 2005-present). He also |
| serves as a member of the Board of Trustees of the American Enterprise |
| Institute for Public Policy Research. In addition, Mr. Stavropoulos is a |
| member of The Business Council, J.P. Morgan International Council and |
| the University of Notre Dame Advisory Council for the College of |
| Science. |
| |
| Kenneth L. Wolfe (66) |
| |
| Year of Election or Appointment: 2005 |
| Mr. Wolfe also serves as a Trustee (2005-present) or Member of the |
| Advisory Board (2004-present) of other investment companies advised |
| by FMR. Prior to his retirement in 2001, Mr. Wolfe was Chairman and |
| Chief Executive Officer of Hershey Foods Corporation (1993-2001). He |
| currently serves as a member of the boards of Adelphia Communica- |
| tions Corporation (2003-present), Bausch & Lomb, Inc., and Revlon Inc. |
| (2004-present). |
45 Annual Report
Trustees and Officers - continued
Advisory Board Members and Executive Officers:
Correspondence intended for Mr. Gamper may be sent to Fidelity Investments, P.O. Box 55235, Boston, Massachusetts 02205-5235. Correspondence intended for each executive officer and Mr. Lynch may be sent to Fidelity Investments, 82 Devonshire Street, Boston, Massachusetts 02109.
| Name, Age; Principal Occupation |
| |
| Albert R. Gamper, Jr. (63) |
| |
| Year of Election or Appointment: 2005 |
| Member of the Advisory Board of Fidelity Advisor Series VIII Trust. Prior |
| to his retirement in December 2004, Mr. Gamper served as Chairman |
| of the Board of CIT Group Inc. (commercial finance). During his tenure |
| with CIT Group Inc. Mr. Gamper served in numerous senior manage- |
| ment positions, including Chairman (1987-1989; 1999-2001; |
| 2002-2004), Chief Executive Officer (1987-2004), and President |
| (1989-2002). He currently serves as a member of the Board of Direc- |
| tors of Public Service Enterprise Group (utilities, 2001-present), Chair- |
| man of the Board of Governors, Rutgers University (2004-present), and |
| Chairman of the Board of Saint Barnabas Health Care System. |
| |
| Peter S. Lynch (61) |
| |
| Year of Election or Appointment: 2003 |
| Member of the Advisory Board of Fidelity Advisor Series VIII Trust. Vice |
| Chairman and a Director of FMR, and Vice Chairman (2001-present) |
| and a Director (2000-present) of FMR Co., Inc. Previously, Mr. Lynch |
| served as a Trustee of the Fidelity funds (1990-2003). In addition, he |
| serves as a Trustee of Boston College, Massachusetts Eye & Ear |
| Infirmary, Historic Deerfield, John F. Kennedy Library, and the Museum |
| of Fine Arts of Boston. |
| |
| Dwight D. Churchill (51) |
| |
| Year of Election or Appointment: 2005 |
| Vice President of Advisor Overseas. Mr. Churchill also serves as Vice |
| President of certain Equity Funds (2005-present) and certain High In- |
| come Funds (2005-present). Previously, he served as Head of Fidelity’s |
| Fixed-Income Division (2000-2005), Vice President of Fidelity’s Money |
| Market Funds (2000-2005), Vice President of Fidelity’s Bond Funds, and |
| Senior Vice President of FIMM (2000) and FMR. Mr. Churchill joined |
| Fidelity in 1993 as Vice President and Group Leader of Taxable Fixed- |
| Income Investments. |
| Name, Age; Principal Occupation |
| |
| Eric D. Roiter (56) |
| |
| Year of Election or Appointment: 1998 |
| Secretary of Advisor Overseas. He also serves as Secretary of other |
| Fidelity funds; Vice President, General Counsel, and Secretary of FMR |
| Co., Inc. (2001-present) and FMR; Assistant Secretary of Fidelity Man- |
| agement & Research (U.K.) Inc. (2001-present), Fidelity Management & |
| Research (Far East) Inc. (2001-present), and Fidelity Investments Money |
| Management, Inc. (2001-present). Mr. Roiter is an Adjunct Member, |
| Faculty of Law, at Boston College Law School (2003-present). Previously, |
| Mr. Roiter served as Vice President and Secretary of Fidelity Distributors |
| Corporation (FDC) (1998-2005). |
| |
| Stuart Fross (46) |
| |
| Year of Election or Appointment: 2003 |
| Assistant Secretary of Advisor Overseas. Mr. Fross also serves as Assis- |
| tant Secretary of other Fidelity funds (2003-present), Vice President and |
| Secretary of FDC (2005-present), and is an employee of FMR. |
| |
| Christine Reynolds (47) |
| |
| Year of Election or Appointment: 2004 |
| President, Treasurer, and Anti-Money Laundering (AML) officer of Advi- |
| sor Overseas. Ms. Reynolds also serves as President, Treasurer, and |
| AML officer of other Fidelity funds (2004) and is a Vice President (2003) |
| and an employee (2002) of FMR. Before joining Fidelity Investments, |
| Ms. Reynolds worked at PricewaterhouseCoopers LLP (PwC) |
| (1980-2002), where she was most recently an audit partner with PwC’s |
| investment management practice. |
| |
| Paul M. Murphy (58) |
| |
| Year of Election or Appointment: 2005 |
| Chief Financial Officer of Advisor Diversified International. Mr. Murphy |
| also serves as Chief Financial Officer of other Fidelity funds |
| (2005-present). He also serves as Senior Vice President of Fidelity Pri- |
| cing and Cash Management Services Group (FPCMS). |
| |
| Kenneth A. Rathgeber (58) |
| |
| Year of Election or Appointment: 2004 |
| Chief Compliance Officer of Advisor Overseas. Mr. Rathgeber also |
| serves as Chief Compliance Officer of other Fidelity funds (2004) and |
| Executive Vice President of Risk Oversight for Fidelity Investments |
| (2002). Previously, he served as Executive Vice President and Chief Op- |
| erating Officer for Fidelity Investments Institutional Services Company, |
| Inc. (1998-2002). |
47 Annual Report
Trustees and Officers - continued
| Name, Age; Principal Occupation |
| |
| John R. Hebble (47) |
| |
| Year of Election or Appointment: 2003 |
| Deputy Treasurer of Advisor Overseas. Mr. Hebble also serves as |
| Deputy Treasurer of other Fidelity funds (2003), and is an employee of |
| FMR. Before joining Fidelity Investments, Mr. Hebble worked at Deutsche |
| Asset Management where he served as Director of Fund Accounting |
| (2002-2003) and Assistant Treasurer of the Scudder Funds |
| (1998-2003). |
| |
| Bryan A. Mehrmann (44) |
| |
| Year of Election or Appointment: 2005 |
| Deputy Treasurer of Advisor Overseas. Mr. Mehrmann also serves as |
| Deputy Treasurer of other Fidelity funds (2005-present) and is an em- |
| ployee of FMR. Previously, Mr. Mehrmann served as Vice President of |
| Fidelity Investments Institutional Services Group (FIIS)/Fidelity Investments |
| Institutional Operations Corporation, Inc. (FIIOC) Client Services |
| (1998-2004). |
| |
| Kimberley H. Monasterio (41) |
| |
| Year of Election or Appointment: 2004 |
| Deputy Treasurer of Advisor Overseas. Ms. Monasterio also serves as |
| Deputy Treasurer of other Fidelity funds (2004) and is an employee of |
| FMR (2004). Before joining Fidelity Investments, Ms. Monasterio served |
| as Treasurer (2000-2004) and Chief Financial Officer (2002-2004) of |
| the Franklin Templeton Funds and Senior Vice President of Franklin Tem- |
| pleton Services, LLC (2000-2004). |
| |
| Kenneth B. Robins (36) |
| |
| Year of Election or Appointment: 2005 |
| Deputy Treasurer of Advisor Overseas. Mr. Robins also serves as Deputy |
| Treasurer of other Fidelity funds (2005-present) and is an employee of |
| FMR (2004-present). Before joining Fidelity Investments, Mr. Robins |
| worked at KPMG LLP, where he was a partner in KPMG’s department of |
| professional practice (2002-2004) and a Senior Manager |
| (1999-2000). In addition, Mr. Robins served as Assistant Chief Accoun- |
| tant, United States Securities and Exchange Commission (2000-2002). |
| |
| Robert G. Byrnes (38) |
| |
| Year of Election or Appointment: 2005 |
| Assistant Treasurer of Advisor Overseas. Mr. Byrnes also serves as As- |
| sistant Treasurer of other Fidelity funds (2005-present) and is an em- |
| ployee of FMR (2005-present). Previously, Mr. Byrnes served as Vice |
| President of FPCMS (2003-2005). Before joining Fidelity Investments, |
| Mr. Byrnes worked at Deutsche Asset Management where he served as |
| Vice President of the Investment Operations Group (2000-2003). |
| Name, Age; Principal Occupation |
| |
| John H. Costello (59) |
| |
| Year of Election or Appointment: 1986 |
| Assistant Treasurer of Advisor Overseas. Mr. Costello also serves as |
| Assistant Treasurer of other Fidelity funds and is an employee of FMR. |
| |
| Peter L. Lydecker (51) |
| |
| Year of Election or Appointment: 2004 |
| Assistant Treasurer of Advisor Overseas. Mr. Lydecker also serves as |
| Assistant Treasurer of other Fidelity funds (2004) and is an employee of |
| FMR. |
| |
| Mark Osterheld (50) |
| |
| Year of Election or Appointment: 2002 |
| Assistant Treasurer of Advisor Overseas. Mr. Osterheld also serves as |
| Assistant Treasurer of other Fidelity funds (2002) and is an employee of |
| FMR. |
| |
| Gary W. Ryan (47) |
| |
| Year of Election or Appointment: 2005 |
| Assistant Treasurer of Advisor Overseas. Mr. Ryan also serves as Assis- |
| tant Treasurer of other Fidelity funds (2005-present) and is an employee |
| of FMR (2005-present). Previously, Mr. Ryan served as Vice President of |
| Fund Reporting in FPCMS (1999-2005). |
| |
| Salvatore Schiavone (39) |
| |
| Year of Election or Appointment: 2005 |
| Assistant Treasurer of Advisor Overseas. Mr. Schiavone also serves as |
| Assistant Treasurer of other Fidelity funds (2005-present) and is an em- |
| ployee of FMR (2005-present). Before joining Fidelity Investments, Mr. |
| Schiavone worked at Deutsche Asset Management, where he most re- |
| cently served as Assistant Treasurer (2003-2005) of the Scudder Funds |
| and Vice President and Head of Fund Reporting (1996-2003). |
49 Annual Report
The Board of Trustees of Advisor Overseas Fund voted to pay to shareholders of record at the opening of business on record date, the following distributions per share derived from capital gains realized from sales of portfolio securities, and dividends derived from net investment income:
| | | Pay Date | | Record Date | | Dividends | | Capital Gains |
| Class A | | 12/05/05 | | 12/02/05 | | $.191 | | $.30 |
| Class T | | 12/05/05 | | 12/02/05 | | $.124 | | $.30 |
| Class B | | 12/05/05 | | 12/02/05 | | $.019 | | $.30 |
| Class C | | 12/05/05 | | 12/02/05 | | $.038 | | $.30 |
The fund hereby designates as capital gain dividends: For dividends with respect to the taxable year ended October 31, 2005, $8,404,026, or, if subsequently determined to be different, the net capital gain of such year, and for dividends with respect to the taxable year ended October 31, 2004, $0, or, if subsequently determined to be different, the excess of: (a) the net capital gain of such year, over (b) amounts previously designated as capital gain dividends with respect to such year.
Class A and Class T designates 100% of the dividend distributed during the fiscal year as amounts which may be taken into account as a dividend for purposes of the maximum rate under section 1(h)(11) of the Internal Revenue Code.
The amounts per share which represent income derived from sources within, and taxes paid to, foreign countries or possessions of the United States are as follows:
| | | Pay Date | | Income | | Taxes |
| Class A | | 12/06/04 | | $.117 | | $.017 |
| Class T | | 12/06/04 | | $.087 | | $.017 |
The fund will notify shareholders in January 2006 of amounts for use in preparing 2005 income tax returns.
Board Approval of Investment Advisory Contracts and Management Fees
Advisor Overseas Fund
Each year, typically in July, the Board of Trustees, including the independent Trustees (together, the Board), votes on the renewal of the management contract and sub-advisory agreements (together, the Advisory Contracts) for the fund. The Board, assisted by the advice of fund counsel and independent Trustees’ counsel, requests and considers a broad range of information throughout the year.
The Board meets regularly each month except August and takes into account throughout the year matters bearing on Advisory Contracts. The Board, acting directly and through its separate committees, considers at each of its meetings factors that are relevant to the annual renewal of the fund’s Advisory Contracts, including the services and support provided to the fund and its shareholders by Fidelity. At the time of the renewal, the Board had 11 standing committees, each composed of independent Trustees with varying backgrounds, to which the Board has assigned specific subject matter responsibilities in order to enhance effective decision-making by the Board. Each committee has adopted a written charter outlining the structure and purposes of the committee. One such committee, the Equity Contract Committee, meets periodically during the first six months of each year and as necessary to consider matters specifically related to the annual renewal of Advisory Contracts. The committee requests and receives information on, and makes recommendations to the independent Trustees concerning, the approval and annual review of the Advisory Contracts.
At its July 2005 meeting, the Board of Trustees, including the independent Trustees, unanimously determined to renew the Advisory Contracts for the fund. In reaching its determination, the Board considered all factors it believed relevant, including (1) the nature, extent, and quality of the services to be provided to the fund and its shareholders by Fidelity (including the investment performance of the fund); (2) the competitiveness of the management fee and total expenses of the fund; (3) the total costs of the services to be provided by and the profits to be realized by the investment adviser and its affiliates from the relationship with the fund; (4) the extent to which economies of scale would be realized as the fund grows; and (5) whether fee levels reflect these economies of scale, if any, for the benefit of fund shareholders.
In determining whether to renew the Advisory Contracts for the fund, the Board ultimately reached a determination, with the assistance of fund counsel and independent Trustees’ counsel, that the renewal of the Advisory Contracts and the compensation to be received by Fidelity under the management contract is consistent with Fidelity’s fiduciary duty under applicable law. In addition to evaluating the specific factors noted above, the Board, in reaching its determination, is aware that shareholders in the fund have a broad range of investment choices available to them, including a wide choice among mutual funds offered by competitors to Fidelity, and that the fund’s shareholders, with the opportunity to review and weigh the disclosure provided by the fund in its
51 Annual Report
Board Approval of Investment Advisory Contracts and Management Fees - continued
prospectus and other public disclosures, have chosen to invest in this fund, managed by Fidelity.
Nature, Extent, and Quality of Services Provided by Fidelity. The Board considered staffing within the investment adviser, FMR, and the sub-advisers (together, the Investment Advisers), including the background of the fund’s portfolio manager and the fund’s investment objective and discipline. The independent Trustees also had discussions with senior management of Fidelity’s investment operations and investment groups. The Board considered the structure of the portfolio manager compensation program and whether this structure provides appropriate incentives.
Fidelity Resources Dedicated to Investment Management and Support Services. The Board reviewed the size, education, and experience of the Investment Advisers’ investment staff, their use of technology, and the Investment Advisers’ approach to recruiting, training, and retaining portfolio managers and other research, advisory, and management personnel. The Board considered Fidelity’s extensive global research capabilities that enable the Investment Advisers to aggregate data from various sources in an effort to produce positive investment results. The Board noted that Fidelity’s analysts have access to a variety of technological tools that enable them to perform both fundamental and quantitative analysis and to specialize in various disciplines. The Board also considered that Fidelity’s portfolio managers and analysts have access to daily portfolio attribution that allows for monitoring of a fund’s portfolio, as well as an electronic communication system that provides immediate real-time access to research concerning issuers and credit enhancers.
Shareholder and Administrative Services. The Board considered the nature, extent, quality, and cost of administrative, distribution, and shareholder services performed by the Investment Advisers and their affiliates under the Advisory Contracts and under separate agreements covering transfer agency, pricing and bookkeeping, and securities lending services for the fund. The Board also considered the nature and extent of the Investment Advisers’ supervision of third party service providers, principally custodians and subcustodians. The Board reviewed the allocation of fund brokerage, including allocations to brokers affiliated with the Investment Advisers, the use of brokerage commissions to pay fund expenses, and the use of “soft” commission dollars to pay for research services. The Board also considered that Fidelity voluntarily decided in 2004 to stop using “soft” commission dollars to pay for market data and, instead, to pay for that data out of its own resources. The Board also considered the resources devoted to, and the record of compliance with, the fund’s compliance policies and procedures.
The Board noted that the growth of fund assets across the complex allows Fidelity to reinvest in the development of services designed to enhance the value or convenience of the Fidelity funds as investment vehicles. These services include 24-hour access to
account information and market information through phone representatives and over the Internet, and investor education materials and asset allocation tools.
Investment in a Large Fund Family. The Board considered the benefits to shareholders of investing in a Fidelity fund, including the benefits of investing in a fund that is part of a large family of funds offering a variety of investment disciplines and providing for a large variety of mutual fund investor services. For example, fund shareholders are offered the privilege of exchanging shares of the fund for shares of other Fidelity funds, as set forth in the fund’s prospectus, without paying an additional sales charge. The Board noted that, since the last Advisory Contract renewals in July 2004, Fidelity has taken a number of actions that benefited particular funds, including (i) voluntarily deciding in 2004 to stop using “soft” commission dollars to pay for market data and, instead, to pay for that data out of its own resources, (ii) contractually agreeing to impose management fee reductions and expense limitations on its five Spartan stock index funds and its stock index fund available through variable insurance products, (iii) contractually agreeing to eliminate the management fees on the Fidelity Freedom Funds and the Fidelity Advisor Freedom Funds, (iv) contractually agreeing to reduce the management fees on most of its investment-grade taxable bond funds, and (v) contractually agreeing to impose expense limitations on its retail and Spartan investment-grade taxable bond funds.
Investment Performance and Compliance. The Board considered whether the fund has operated within its investment objective, as well as its record of compliance with its investment restrictions. It also reviewed the fund’s absolute investment performance for each class, as well as the fund’s relative investment performance for each class measured against (i) a broad-based securities market index, and (ii) a peer group of mutual funds deemed appropriate by the Board over multiple periods. The following charts considered by the Board show, over the one-, three-, and five-year periods ended December 31, 2004, the returns of Class C and Institutional Class of the fund, the returns of a broad-based securities market index (“benchmark”), and a range of returns of a peer group of mutual funds identified by Lipper Inc. as having an investment objective similar to that of the fund. The returns of Class C and Institutional Class represent the performance of classes with the highest and lowest 12b-1 fees, respectively (not necessarily with the highest and lowest total expenses). The box within each chart shows the 25th percentile return (bottom of box) and the 75th percentile return (top of box) of the Lipper peer group. Returns shown above the box are in the first quartile and returns shown below the box are in the fourth quartile. The percentage beaten numbers noted below each chart correspond to the percentile box and represent the percentage of funds in the Lipper peer group whose performance was equal to or lower than that of the class indicated.
53 Annual Report
Board Approval of Investment Advisory Contracts and Management Fees - continued

The Board reviewed the fund’s relative investment performance against its Lipper peer group and stated that the performance of Institutional Class of the fund was in the fourth quartile for the one-year period and the third quartile for the three- and five-year periods. The Board also stated that the relative investment performance of the fund was lower than its benchmark over time. The Board considered that the variations in performance among the fund’s classes reflect the variations in class expenses, which result in lower performance for higher expense classes. The Board discussed with FMR actions to be taken by FMR to improve the fund’s disappointing performance.
The Board also considered that the fund’s management fee is subject to upward or downward adjustment depending upon whether, and to what extent, the fund’s investment performance for the performance period exceeds, or is exceeded by, the record (over the same period) of a Board-approved performance adjustment index. The Board realizes that the performance adjustment provides FMR with a strong economic incentive to seek to achieve superior performance for the fund’s shareholders and helps to more closely align the interests of FMR and the fund’s shareholders.
The Board has had thorough discussions with FMR throughout the year about the Board’s and FMR’s concerns about equity research, equity fund performance, and compliance with internal policies governing gifts and entertainment. FMR has taken steps that it believes will refocus and strengthen equity research and equity portfolio management and compliance. The Board noted with favor FMR’s recent reorganization of its senior management team and FMR’s plans to dedicate additional resources to investment research, and participated in the process that led to those changes.
Based on its review, and giving particular weight to the nature and quality of the resources dedicated by the Investment Advisers to maintain and improve relative performance, the Board concluded that the nature, extent, and quality of the services provided by Fidelity will benefit the fund’s shareholders, particularly in light of the Board’s view that the fund’s shareholders benefit from investing in a fund that is part of a large family of funds offering a variety of investment disciplines and services.
Competitiveness of Management Fee and Total Fund Expenses. The Board considered the fund’s management fee and total expenses compared to “mapped groups” of competitive funds and classes. Fidelity creates “mapped groups” by combining similar Lipper investment objective categories that have comparable management fee characteristics. Combining Lipper investment objective categories aids the Board’s management fee and total expense comparisons by broadening the competitive group used for comparison and by reducing the number of universes to which various Fidelity funds are compared.
The Board considered two proprietary management fee comparisons for the 12-month periods shown in the chart below. The group of Lipper funds used by the Board for management fee comparisons is referred to below as the “Total Mapped Group” and, for the reasons explained above, is broader than the Lipper peer group used by the Board for performance comparisons. The Total Mapped Group comparison focuses on a fund’s standing relative to the total universe of comparable funds available to investors, in terms of gross management fees before expense reimbursements or caps. “TMG %” represents the percentage of funds in the Total Mapped Group that had management fees that were lower than the fund’s. For example, a TMG % of 21% means that 79% of the funds in the Total Mapped Group had higher management fees than the fund. The “Asset-Size Peer Group” (ASPG) comparison focuses on a fund’s standing relative to non-Fidelity funds similar in size to the fund within the Total Mapped Group. The ASPG represents at least 15% of the funds in the Total Mapped Group with comparable asset size and management fee characteristics, subject to a minimum of 50 funds (or all funds in the Total Mapped Group if fewer than 50). Additional information, such as the ASPG quartile (“quadrant”) in which the fund’s management fee ranked and the impact of the fund’s performance adjustment, is also included in the chart and considered by the Board.
55 Annual Report
Board Approval of Investment Advisory Contracts and Management Fees - continued

The Board noted that the fund’s management fee ranked below the median of its Total Mapped Group and below the median of its ASPG for 2004. The Board also noted the effect of the fund’s negative performance adjustment on the fund’s management fee ranking.
Based on its review, the Board concluded that the fund’s management fee was fair and reasonable in light of the services that the fund receives and the other factors considered.
In its review of each class’s total expenses, the Board considered the fund’s management fee as well as other fund or class expenses, as applicable, such as transfer agent fees, pricing and bookkeeping fees, fund-paid 12b-1 fees, and custodial, legal, and audit fees. The Board also noted the effects of any waivers and reimbursements on fees and expenses, as well as the fund’s negative performance adjustment. As part of its review, the Board also considered current and historical total expenses of each class of the fund compared to competitive fund median expenses. Each class of the fund is compared to those funds and classes in the Total Mapped Group (used by the Board for management fee comparisons) that have a similar sales load structure.
The Board noted that each class’s total expenses ranked below its competitive median for 2004.
In its review of total expenses, the Board also considered Fidelity fee structures and other information on clients that FMR and its affiliates service in other competitive markets, such as other mutual funds advised or subadvised by FMR or its affiliates, pension plan clients, and other institutional clients.
Based on its review, the Board concluded that the total expenses for each class of the fund were reasonable in light of the services that the fund and its shareholders receive and the other factors considered.
Costs of the Services and Profitability. The Board considered the revenues earned and the expenses incurred by Fidelity in conducting the business of developing, marketing, distributing, managing, administering and servicing the fund and its shareholders. The Board also considered the level of Fidelity’s profits in respect of all the Fidelity funds.
On an annual basis, FMR presents to the Board Fidelity’s profitability for the fund. Fidelity calculates the profitability for each fund, as well as aggregate profitability for groups of Fidelity funds and all Fidelity funds, using a series of detailed revenue and cost allocation methodologies which originate with the audited books and records of Fidelity. The Audit Committee of the Board reviews any significant changes from the prior year’s methodologies.
PricewaterhouseCoopers LLP (PwC), independent registered accounting firm and auditor to Fidelity and certain Fidelity funds, has been engaged annually by the Board as part of the Board’s assessment of the results of Fidelity’s profitability analysis. PwC’s engagement includes the review and assessment of Fidelity’s methodologies used in determining the revenues and expenses attributable to Fidelity’s mutual fund business, and completion of agreed-upon procedures surrounding the mathematical accuracy of fund profitability and its conformity to allocation methodologies. After considering PwC’s reports issued under the engagement and information provided by Fidelity, the Board believes that while other allocation methods may also be reasonable, Fidelity’s profitability methodologies are reasonable in all material respects.
The Board has also reviewed Fidelity’s non-fund businesses and any fall-out benefits related to the mutual fund business as well as cases where Fidelity’s affiliates may benefit from or be related to the fund’s business. In addition, a special committee of the Board reviewed services provided to Fidelity by its affiliates and determined that the fees that Fidelity paid for such services were reasonable.
The Board considered the costs of the services provided by and the profits realized by Fidelity in connection with the operation of the fund and determined that the amount of profit is a fair entrepreneurial profit for the management of the fund.
Economies of Scale. The Board considered whether there have been economies of scale in respect of the management of the Fidelity funds, whether the Fidelity funds (including the fund) have appropriately benefited from any such economies of scale, and whether there is potential for realization of any further economies of scale. The Board considered the extent to which the fund will benefit from economies of scale through increased services to the fund, through waivers or reimbursements, or through fee or
57 Annual Report
Board Approval of Investment Advisory Contracts and Management Fees - continued
expense reductions, including reductions that occur through operation of the transfer agent agreement. The transfer agent fee varies in part based on the number of accounts in the fund. If the number of accounts decreases or the average account size increases, the overall transfer agent fee rate decreases.
The Board recognized that the fund’s management contract incorporates a “group fee” structure, which provides for lower fee rates as total fund assets under FMR’s management increase, and for higher fee rates as total fund assets under FMR’s management decrease. The Board considered that the group fee is designed to deliver the benefits of economies of scale to fund shareholders when total fund assets increase, even if assets of any particular fund are unchanged or have declined, because some portion of Fidelity’s costs are attributable to services provided to all Fidelity funds, and all funds benefit if those costs can be allocated among more assets. The Board concluded that, given the group fee structure, fund shareholders will achieve a certain level of economies of scale as assets under FMR’s management increase at the fund complex level, regardless of whether Fidelity achieves any such economies of scale.
The Board further concluded that any potential economies of scale are being shared between fund shareholders and Fidelity in an appropriate manner.
Additional Information Requested by the Board. In order to develop fully the factual basis for consideration of the Advisory Contracts, the Board requested additional information regarding (i) equity fund transfer agency fees; (ii) Fidelity’s fund profitability methodology and the impact of various changes in the methodology over time; (iii) benefits to shareholders from economies of scale; (iv) composition and characteristics of various fund and industry data used in comparisons; and (v) compensation of portfolio managers and research analysts.
Based on its evaluation of all of the conclusions noted above, and after considering all material factors, the Board ultimately concluded that the existing advisory fee structures are fair and reasonable, and that the fund’s existing Advisory Contracts should be renewed.
59 Annual Report
61 Annual Report
Investment Adviser
Fidelity Management & Research Company
Boston, MA
Investment Sub-Advisers
FMR Co., Inc.
Fidelity Management & Research
(U.K.) Inc.
Fidelity Management & Research
(Far East) Inc.
Fidelity International
Investment Advisors
Fidelity Investments Japan Limited
Fidelity International Investment
Advisors (U.K.) Limited
General Distributor
Fidelity Distributors Corporation
Boston, MA
Transfer and Service Agents
Fidelity Investments Institutional
Operations Company, Inc.
Boston, MA
Fidelity Service Company, Inc.
Boston, MA
Custodian
JPMorgan Chase Bank
New York, NY
|


Fidelity® Advisor
Overseas
Fund - Institutional Class
Annual Report October 31, 2005

| Contents | | | | |
| |
| Chairman’s Message | | 4 | | Ned Johnson’s message to shareholders. |
| Performance | | 6 | | How the fund has done over time. |
| Management’s Discussion | | 7 | | The manager’s review of fund |
| | | | | performance, strategy and outlook. |
| Shareholder Expense | | 8 | | An example of shareholder expenses. |
| Example | | | | |
| Investment Changes | | 10 | | A summary of major shifts in the fund’s |
| | | | | investments over the past six months. |
| Investments | | 11 | | A complete list of the fund’s investments |
| | | | | with their market values. |
| Financial Statements | | 20 | | Statements of assets and liabilities, |
| | | | | operations, and changes in net assets, |
| | | | | as well as financial highlights. |
| Notes | | 29 | | Notes to the financial statements. |
| Report of Independent | | 38 | | |
| Registered Public | | | | |
| Accounting Firm | | | | |
| Trustees and Officers | | 39 | | |
| Distributions | | 49 | | |
| Board Approval of | | 50 | | |
| Investment Advisory | | | | |
| Contracts and | | | | |
| Management Fees | | | | |
To view a fund’s proxy voting guidelines and proxy voting record for the 12-month period ended June 30, visit www.fidelity.com/proxyvotingresults or visit the Securities and Exchange Commission’s (SEC) web site at www.sec.gov. You may also call 1-877-208-0098 to request a free copy of the proxy voting guidelines.
Standard & Poor’s, S&P and S&P 500 are registered service marks of The McGraw-Hill Companies, Inc. and have been licensed for use by Fidelity Distributors Corporation.
Other third party marks appearing herein are the property of their respective owners.
All other marks appearing herein are registered or unregistered trademarks or service marks of FMR Corp. or an affiliated company.
This report and the financial statements contained herein are submitted for the general information of the shareholders of the fund. This report is not authorized for distribution to prospective investors in the fund unless preceded or accompanied by an effective prospectus.
A fund files its complete schedule of portfolio holdings with the SEC for the first and third quarters of each fiscal year on Form N-Q. Forms N-Q are available on the SEC’s web site at http://www.sec.gov. A fund’s Forms N-Q may be reviewed and copied at the SEC’s Public Reference Room in Washington, DC. Information regarding the operation of the SEC’s Public Reference Room may be obtained by calling 1-800-SEC-0330. For a complete list of a fund’s portfolio holdings, view the most recent quarterly holdings report, semiannual report, or annual report on Fidelity’s web site at http://www.advisor.fidelity.com.
NOT FDIC INSURED · MAY LOSE VALUE · NO BANK GUARANTEE
Neither the fund nor Fidelity Distributors Corporation is a bank.
3 Annual Report
Chairman’s Message
(Photograph of Edward C. Johnson 3d)
Dear Shareholder:
During the past year or so, much has been reported about the mutual fund industry, and much of it has been more critical than I believe is warranted. Allegations that some companies have been less than forthright with their shareholders have cast a shadow on the entire industry. I continue to find these reports disturbing, and assert that they do not create an accurate picture of the industry overall. Therefore, I would like to remind everyone where Fidelity stands on these issues. I will say two things specifically regarding allegations that some mutual fund companies were in violation of the Securities and Exchange Commission’s forward pricing rules or were involved in so-called “market timing” activities.
First, Fidelity has no agreements that permit customers who buy fund shares after 4 p.m. to obtain the 4 p.m. price. This is not a new policy. This is not to say that someone could not deceive the company through fraudulent acts. However, we are extremely diligent in preventing fraud from occurring in this manner — and in every other. But I underscore again that Fidelity has no so-called “agreements” that sanction illegal practices.
Second, Fidelity continues to stand on record, as we have for years, in opposition to predatory short-term trading that adversely affects shareholders in a mutual fund. Back in the 1980s, we initiated a fee — which is returned to the fund and, therefore, to investors — to discourage this activity. Further, we took the lead several years ago in developing a Fair Value Pricing Policy to prevent market timing on foreign securities in our funds. I am confident we will find other ways to make it more difficult for predatory traders to operate. However, this will only be achieved through close cooperation among regulators, legislators and the industry.
Yes, there have been unfortunate instances of unethical and illegal activity within the mutual fund industry from time to time. That is true of any industry. When this occurs, confessed or convicted offenders should be dealt with appropriately. But we are still concerned about the risk of over-regulation and the quick application of simplistic solutions to intricate problems. Every system can be improved, and we support and applaud well thought out improvements by regulators, legislators and industry representatives that achieve the common goal of building and protecting the value of investors’ holdings.
For nearly 60 years, Fidelity has worked very hard to improve its products and service to justify your trust. When our family founded this company in 1946, we had only a few hundred customers. Today, we serve more than 18 million customers including individual investors and participants in retirement plans across America.
Annual Report 4
Let me close by saying that we do not take your trust in us for granted, and we realize that we must always work to improve all aspects of our service to you. In turn, we urge you to continue your active participation with your financial matters, so that your interests can be well served.
Best regards,
/s/Edward C. Johnson 3d
5 Annual Report
Performance: The Bottom Line
Average annual total return reflects the change in the value of an investment, assuming reinvestment of the class’ dividend income and capital gains (the profits earned upon the sale of securities that have grown in value) and assuming a constant rate of performance each year. The $10,000 table and the fund’s returns do not reflect the deduction of taxes that a shareholder would pay on fund distributions or the redemption of fund shares. During periods of reimbursement by Fidelity, a fund’s total return will be greater than it would be had the reimbursement not occurred. How a fund did yesterday is no guarantee of how it will do tomorrow.
| Average Annual Total Returns | | | | | | |
| Periods ended October 31, 2005 | | Past 1 | | Past 5 | | Past 10 |
| | | year | | years | | years |
| Institutional Class | | 16.91% | | 1.41% | | 6.65% |
$10,000 Over 10 Years
Let’s say hypothetically that $10,000 was invested in Fidelityr Advisor Overseas Fund —Institutional Class on October 31, 1995. The chart shows how the value of your investment would have changed, and also shows how the MSCIr EAFEr Index performed over the same period.
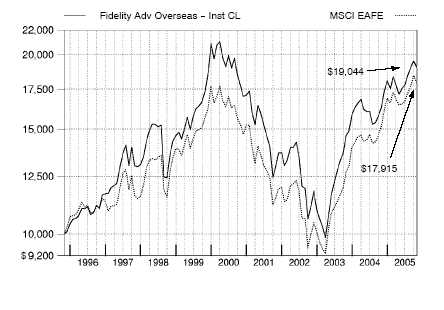
Annual Report 6
Management’s Discussion of Fund Performance
Comments from Graeme Rockett, Portfolio Manager of Fidelity® Advisor Overseas Fund
Foreign stock markets enjoyed broad-based advances during the 12-month period that ended October 31, 2005, encouraged by better-than-expected corporate earnings and markedly improved economies. For the 12 months overall, the Morgan Stanley Capital InternationalSM Europe, Australasia, Far East (MSCIr EAFE®) Index — a performance measure of developed stock markets outside the United States and Canada — gained 18.28% . The Japanese stock market climbed to its highest level in more than four years. Positive economic indicators and Prime Minister Koizumi’s decisive election victory attracted record inflows from overseas investors. In response, the Tokyo Stock Exchange Stock Price Index (TOPIX) soared 22.89% . Southeast Asian equities outside of Japan, particularly South Korea, also responded well to the better macroeconomic environment, illustrated by the 19.44% return for the MSCI All Country Far East ex Japan index. Euro-pean stock markets were up as well, despite investors’ concern about higher energy prices and potential downgrades to economic growth in the region. For the year overall, the MSCI Europe index rose 16.51% . Although robust, returns for U.S. investors in overseas markets were tempered somewhat by the strength of the dollar versus many major currencies.
During the past year, Fidelity Advisor Overseas Fund’s Institutional Class shares gained 16.91%, trailing the LipperSM International Funds Average, which rose 17.75%, and the MSCI EAFE index. A big overweighting in the information technology (IT) sector —particularly among semiconductors — was the main reason for lagging the index, as that group was IT’s worst-performing component during the period. Good stock picking within the group, however, helped offset some of the damage there. Among the biggest detractors were Japanese semiconductor equipment maker Tokyo Electron, German chip maker Infineon Technologies and Taiwanese chip maker United Microelectronics. French telecommunications equipment giant Alcatel also disappointed in the tech hardware/equipment and equipment space. On the upside, the fund was buoyed by astute stock selection in financials, especially among banks, as well as in energy stocks. Canadian oil and natural gas producer EnCana and French integrated oil company Total were the two biggest relative contributors. Strong results also came from South Korea’s Kookmin Bank and India’s Housing Development Finance Corp., helped in part by favorable currency movements in these countries. Some of these stocks were no longer held at period end.
The views expressed in this statement reflect those of the portfolio manager only through the end of the period of the report as stated on the cover and do not necessarily represent the views of Fidelity or any other person in the Fidelity organization. Any such views are subject to change at any time based upon market or other conditions and Fidelity disclaims any responsibility to update such views. These views may not be relied on as investment advice and, because investment decisions for a Fidelity fund are based on numerous factors, may not be relied on as an indication of trading intent on behalf of any Fidelity fund.
Shareholder Expense Example
As a shareholder of the Fund, you incur two types of costs: (1) transaction costs, including sales charges (loads) on purchase payments or redemption proceeds, redemption fees, and (2) ongoing costs, including management fees, distribution and/or service (12b-1) fees and other Fund expenses. This Example is intended to help you understand your ongoing costs (in dollars) of investing in the Fund and to compare these costs with the ongoing costs of investing in other mutual funds.
The Example is based on an investment of $1,000 invested at the beginning of the period and held for the entire period (May 1, 2005 to October 31, 2005).
The first line of the table below for each class of the Fund provides information about actual account values and actual expenses. You may use the information in this line, together with the amount you invested, to estimate the expenses that you paid over the period. Simply divide your account value by $1,000.00 (for example, an $8,600 account value divided by $1,000.00 = 8.6), then multiply the result by the number in the first line for a class of the Fund under the heading entitled “Expenses Paid During Period” to estimate the expenses you paid on your account during this period.
Hypothetical Example for Comparison Purposes
The second line of the table below for each class of the Fund provides information about hypothetical account values and hypothetical expenses based on a Class’ actual expense ratio and an assumed rate of return of 5% per year before expenses, which is not the Class’ actual return. The hypothetical account values and expenses may not be used to estimate the actual ending account balance or expenses you paid for the period. You may use this information to compare the ongoing costs of investing in the Fund and other funds. To do so, compare this 5% hypothetical example with the 5% hypothetical examples that appear in the shareholder reports of the other funds.
Please note that the expenses shown in the table are meant to highlight your ongoing costs only and do not reflect any transaction costs. Therefore, the second line of the table is useful in comparing ongoing costs only, and will not help you determine the relative total costs of owning different funds. In addition, if these transactional costs were included, your costs would have been higher.
| | | | | | | | | | | | | Expenses Paid |
| | | | | Beginning | | | | Ending | | | | During Period* |
| | | | | Account Value | | | | Account Value | | | | May 1, 2005 |
| | | | | May 1, 2005 | | | | October 31, 2005 | | to October 31, 2005 |
| Class A | | | | | | | | | | | | |
| Actual | | $ | | 1,000.00 | | $ | | 1,108.00 | | $ | | 6.48 |
| HypotheticalA | | $ | | 1,000.00 | | $ | | 1,019.06 | | $ | | 6.21 |
| Class T | | | | | | | | | | | | |
| Actual | | $ | | 1,000.00 | | $ | | 1,106.90 | | $ | | 7.17 |
| HypotheticalA | | $ | | 1,000.00 | | $ | | 1,018.40 | | $ | | 6.87 |
| Class B | | | | | | | | | | | | |
| Actual | | $ | | 1,000.00 | | $ | | 1,103.30 | | $ | | 10.60 |
| HypotheticalA | | $ | | 1,000.00 | | $ | | 1,015.12 | | $ | | 10.16 |
| Class C | | | | | | | | | | | | |
| Actual | | $ | | 1,000.00 | | $ | | 1,103.90 | | $ | | 10.45 |
| HypotheticalA | | $ | | 1,000.00 | | $ | | 1,015.27 | | $ | | 10.01 |
| Institutional Class | | | | | | | | | | | | |
| Actual | | $ | | 1,000.00 | | $ | | 1,110.20 | | $ | | 4.36 |
| HypotheticalA | | $ | | 1,000.00 | | $ | | 1,021.07 | | $ | | 4.18 |
| |
| A 5% return per year before expenses | | | | | | | | |
* Expenses are equal to each Class’ annualized expense ratio (shown in the table below); multiplied by the average account value over the period, multiplied by 184/365 (to reflect the one-half year period).
| | | Annualized |
| | | Expense Ratio |
| Class A | | 1.22% |
| Class T | | 1.35% |
| Class B | | 2.00% |
| Class C | | 1.97% |
| Institutional Class | | 82% |
9 Annual Report
Investment Changes
| Top Five Stocks as of October 31, 2005 | | | | |
| | | % of fund’s | | % of fund’s net assets |
| | | net assets | | 6 months ago |
| BP PLC (United Kingdom, Oil, Gas & | | | | |
| Consumable Fuels) | | 2.2 | | 2.5 |
| Total SA Series B (France, Oil, Gas & | | | | |
| Consumable Fuels) | | 1.9 | | 4.4 |
| Toyota Motor Corp. (Japan, Automobiles) | | 1.8 | | 1.1 |
| Vodafone Group PLC (United Kingdom, Wireless | | | | |
| Telecommunication Services) | | 1.8 | | 2.5 |
| Novartis AG (Reg.) (Switzerland, | | | | |
| Pharmaceuticals) | | 1.8 | | 1.7 |
| | | 9.5 | | |
| Top Five Market Sectors as of October 31, 2005 | | |
| | | % of fund’s | | % of fund’s net assets |
| | | net assets | | 6 months ago |
| Financials | | 25.7 | | 27.9 |
| Consumer Discretionary | | 12.6 | | 9.7 |
| Health Care | | 10.0 | | 7.1 |
| Information Technology | | 9.3 | | 25.1 |
| Energy | | 8.8 | | 9.4 |
| Top Five Countries as of October 31, 2005 | | |
| (excluding cash equivalents) | | % of fund’s | | % of fund’s net assets |
| | | net assets | | 6 months ago |
| United Kingdom | | 23.6 | | 11.6�� |
| Japan | | 18.6 | | 20.1 |
| France | | 11.0 | | 11.2 |
| Switzerland | | 8.9 | | 10.6 |
| Germany | | 8.8 | | 8.3 |
| Percentages are adjusted for the effect of open futures contracts, if applicable. | | |
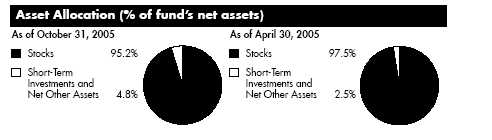
Annual Report 10
| Investments October 31, 2005 | | | | | | | | |
| Showing Percentage of Net Assets | | | | | | | | |
| |
| Common Stocks — 95.2% | | | | | | | | |
| | | | | Shares | | Value (Note 1) |
| | | | | | | | | (000s) |
| |
| Australia – 0.9% | | | | | | | | |
| BHP Billiton Ltd. | | | | 344,600 | | $ | | 5,350 |
| Computershare Ltd. | | | | 539,700 | | | | 2,643 |
| Rio Tinto Ltd. | | | | 32,300 | | | | 1,360 |
| TOTAL AUSTRALIA | | | | | | | | 9,353 |
| |
| Austria – 0.3% | | | | | | | | |
| OMV AG | | | | 68,200 | | | | 3,679 |
| Belgium – 0.5% | | | | | | | | |
| InBev SA | | | | 83,900 | | | | 3,354 |
| Umicore SA | | | | 22,900 | | | | 2,292 |
| TOTAL BELGIUM | | | | | | | | 5,646 |
| |
| Canada – 0.2% | | | | | | | | |
| Talisman Energy, Inc. | | | | 37,800 | | | | 1,674 |
| Denmark – 0.9% | | | | | | | | |
| East Asiatic Co. Ltd. | | | | 21,500 | | | | 1,627 |
| GN Store Nordic AS | | | | 256,300 | | | | 3,088 |
| Vestas Wind Systems AS (a)(d) | | | | 250,900 | | | | 5,430 |
| TOTAL DENMARK | | | | | | | | 10,145 |
| |
| Egypt – 0.1% | | | | | | | | |
| Orascom Telecom SAE GDR | | | | 21,600 | | | | 1,059 |
| Finland – 1.2% | | | | | | | | |
| Neste Oil Oyj | | | | 94,300 | | | | 2,922 |
| Nokia Corp. | | | | 631,800 | | | | 10,627 |
| TOTAL FINLAND | | | | | | | | 13,549 |
| |
| France – 11.0% | | | | | | | | |
| Accor SA | | | | 111,912 | | | | 5,589 |
| Alstom SA (a) | | | | 85,100 | | | | 4,080 |
| AXA SA | | | | 191,996 | | | | 5,560 |
| BNP Paribas SA | | | | 81,481 | | | | 6,178 |
| Carrefour SA | | | | 94,100 | | | | 4,185 |
| CNP Assurances | | | | 39,700 | | | | 2,763 |
| Compagnie Generale de Geophysique SA (a) | | | | 22,300 | | | | 1,945 |
| Financiere Marc de Lacharriere SA (Fimalac) | | | | 39,600 | | | | 2,150 |
| France Telecom SA | | | | 132,999 | | | | 3,457 |
| Gaz de France | | | | 66,700 | | | | 2,051 |
| Groupe Danone | | | | 47,600 | | | | 4,856 |
| Hermes International SA | | | | 9,900 | | | | 2,222 |
| L’Air Liquide SA | | | | 33,400 | | | | 6,074 |
See accompanying notes which are an integral part of the financial statements.
11 Annual Report
| Investments - continued | | | | | | |
| |
| |
| Common Stocks – continued | | | | | | |
| | | Shares | | Value (Note 1) |
| | | | | | | (000s) |
| |
| France – continued | | | | | | |
| L’Oreal SA | | 61,534 | | $ | | 4,525 |
| Lagardere S.C.A. (Reg.) | | 48,400 | | | | 3,327 |
| Louis Vuitton Moet Hennessy (LVMH) | | 41,800 | | | | 3,385 |
| Neopost SA | | 33,600 | | | | 3,242 |
| Pernod Ricard SA | | 32,700 | | | | 5,719 |
| Safran SA | | 177,100 | | | | 3,524 |
| Sanofi-Aventis sponsored ADR | | 258,800 | | | | 10,383 |
| Silicon On Insulator Technologies SA (SOITEC) (a)(d) | | 99,200 | | | | 1,485 |
| Total SA Series B | | 80,497 | | | | 20,288 |
| Vallourec SA | | 3,200 | | | | 1,439 |
| Vinci SA | | 34,500 | | | | 2,696 |
| Vivendi Universal SA sponsored ADR | | 280,900 | | | | 8,826 |
| TOTAL FRANCE | | | | | | 119,949 |
| |
| Germany – 8.8% | | | | | | |
| Adidas-Salomon AG | | 18,400 | | | | 3,088 |
| Allianz AG (Reg.) | | 53,400 | | | | 7,551 |
| BASF AG | | 74,832 | | | | 5,388 |
| Bayer AG | | 154,800 | | | | 5,387 |
| DaimlerChrysler AG | | 140,000 | | | | 7,007 |
| Deutsche Bank AG (NY Shares) | | 43,200 | | | | 4,044 |
| Deutsche Boerse AG | | 28,610 | | | | 2,692 |
| Deutsche Post AG | | 222,800 | | | | 4,968 |
| Deutsche Telekom AG sponsored ADR | | 120,000 | | | | 2,124 |
| E.ON AG | | 123,979 | | | | 11,236 |
| ESCADA AG (a) | | 160,488 | | | | 4,079 |
| GFK AG | | 39,220 | | | | 1,300 |
| Heidelberger Druckmaschinen AG | | 152,700 | | | | 4,851 |
| Hugo Boss AG | | 100,700 | | | | 3,428 |
| Hypo Real Estate Holding AG | | 68,400 | | | | 3,308 |
| IWKA AG | | 89,100 | | | | 1,976 |
| Metro AG | | 85,900 | | | | 3,907 |
| MPC Muenchmeyer Petersen Capital AG | | 20,700 | | | | 1,464 |
| SAP AG sponsored ADR | | 231,100 | | | | 9,923 |
| SGL Carbon AG (a) | | 241,400 | | | | 3,533 |
| Software AG (Bearer) | | 47,800 | | | | 2,171 |
| United Internet AG | | 68,900 | | | | 2,226 |
| TOTAL GERMANY | | | | | | 95,651 |
| |
| Gibraltar – 0.1% | | | | | | |
| PartyGaming PLC | | 574,400 | | | | 887 |
See accompanying notes which are an integral part of the financial statements.
| Common Stocks – continued | | | | | | |
| | | Shares | | Value (Note 1) |
| | | | | | | (000s) |
| |
| Greece – 0.4% | | | | | | |
| Cosmote Mobile Telecommunications SA | | 200,000 | | $ | | 4,109 |
| Hong Kong – 0.9% | | | | | | |
| Esprit Holdings Ltd. | | 393,500 | | | | 2,774 |
| Hong Kong Exchanges & Clearing Ltd. | | 889,500 | | | | 2,972 |
| Hutchison Whampoa Ltd. | | 215,700 | | | | 2,042 |
| Wharf Holdings Ltd. | | 709,000 | | | | 2,419 |
| TOTAL HONG KONG | | | | | | 10,207 |
| |
| India – 1.6% | | | | | | |
| Bajaj Auto Ltd. | | 51,100 | | | | 1,936 |
| Cipla Ltd. | | 212,928 | | | | 1,702 |
| Housing Development Finance Corp. Ltd. | | 213,020 | | | | 4,575 |
| Infosys Technologies Ltd. | | 64,897 | | | | 3,631 |
| Satyam Computer Services Ltd. | | 290,105 | | | | 3,881 |
| State Bank of India | | 84,732 | | | | 1,757 |
| TOTAL INDIA | | | | | | 17,482 |
| |
| Ireland – 1.6% | | | | | | |
| Allied Irish Banks PLC | | 332,900 | | | | 7,001 |
| DEPFA BANK PLC | | 194,000 | | | | 3,023 |
| Irish Life & Permanent PLC | | 233,800 | | | | 4,120 |
| Ryanair Holdings PLC sponsored ADR (a) | | 54,900 | | | | 2,721 |
| TOTAL IRELAND | | | | | | 16,865 |
| |
| Israel – 0.3% | | | | | | |
| Bank Hapoalim BM (Reg.) | | 990,500 | | | | 3,794 |
| Italy – 2.9% | | | | | | |
| Azimut Holdings Spa | | 211,200 | | | | 1,524 |
| Banca Intesa Spa | | 993,300 | | | | 4,635 |
| Banche Popolari Unite S.c.a.r.l. | | 160,800 | | | | 3,404 |
| ENI Spa (d) | | 395,291 | | | | 10,574 |
| Telecom Italia Spa sponsored ADR | | 69,400 | | | | 2,015 |
| Unicredito Italiano Spa | | 1,615,700 | | | | 9,022 |
| TOTAL ITALY | | | | | | 31,174 |
| |
| Japan – 18.6% | | | | | | |
| Aeon Co. Ltd. | | 347,400 | | | | 7,220 |
| Aoyama Trading Co. Ltd. | | 76,800 | | | | 2,315 |
| Astellas Pharma, Inc. | | 146,000 | | | | 5,247 |
| Canon, Inc. | | 115,800 | | | | 6,146 |
| Credit Saison Co. Ltd. | | 69,200 | | | | 3,146 |
See accompanying notes which are an integral part of the financial statements.
13 Annual Report
| Investments - continued | | | | | | |
| |
| |
| Common Stocks – continued | | | | | | |
| | | Shares | | Value (Note 1) |
| | | | | | | (000s) |
| |
| Japan – continued | | | | | | |
| Daiwa Securities Group, Inc. | | 809,000 | | $ | | 6,649 |
| E*TRADE Securities Co. Ltd. (d) | | 900 | | | | 4,731 |
| Fujitsu Ltd. | | 693,000 | | | | 4,585 |
| Hoya Corp. | | 32,900 | | | | 1,157 |
| Hoya Corp. New | | 98,700 | | | | 3,445 |
| Ibiden Co. Ltd. | | 53,700 | | | | 2,176 |
| Intelligent Wave, Inc. | | 800 | | | | 2,653 |
| JAFCO Co. Ltd. (d) | | 55,400 | | | | 3,339 |
| JFE Holdings, Inc. | | 86,200 | | | | 2,680 |
| KOEI Co. Ltd. (d) | | 50,600 | | | | 1,534 |
| Kose Corp. | | 47,300 | | | | 1,716 |
| Kyushu-Shinwa Holdings, Inc. (a) | | 2,251,000 | | | | 6,160 |
| Millea Holdings, Inc. | | 210 | | | | 3,821 |
| Mitsubishi UFJ Financial Group, Inc. | | 557 | | | | 7,068 |
| Mitsui & Co. Ltd. | | 319,000 | | | | 3,931 |
| Mitsui Fudosan Co. Ltd. | | 56,000 | | | | 919 |
| Mitsui Trust Holdings, Inc. | | 404,500 | | | | 4,883 |
| Mizuho Financial Group, Inc. | | 500 | | | | 3,343 |
| Murata Manufacturing Co. Ltd. | | 50,000 | | | | 2,498 |
| Nafco Co. Ltd. | | 25,500 | | | | 844 |
| Nikko Cordial Corp. | | 537,000 | | | | 6,511 |
| Nippon Electric Glass Co. Ltd. | | 172,000 | | | | 3,299 |
| Nippon Steel Corp. | | 953,000 | | | | 3,409 |
| Nishimatsuya Chain Co. Ltd. | | 45,000 | | | | 1,715 |
| Nitto Denko Corp. | | 92,100 | | | | 5,591 |
| Nomura Holdings, Inc. | | 275,300 | | | | 4,264 |
| OMC Card, Inc. | | 162,600 | | | | 2,736 |
| ORIX Corp. | | 19,900 | | | | 3,735 |
| Otsuka Kagu Ltd. | | 79,800 | | | | 2,322 |
| Sega Sammy Holdings, Inc. | | 83,800 | | | | 3,019 |
| Sega Sammy Holdings, Inc. New | | 54,500 | | | | 1,978 |
| Seiyu Ltd. (a)(d) | | 838,000 | | | | 1,720 |
| Seven & I Holdings Co. Ltd. (a) | | 50,600 | | | | 1,665 |
| Sompo Japan Insurance, Inc | | 234,700 | | | | 3,537 |
| Sony Corp. sponsored ADR | | 66,700 | | | | 2,188 |
| Sumitomo Mitsui Financial Group, Inc. | | 970 | | | | 8,988 |
| T&D Holdings, Inc. | | 44,450 | | | | 2,806 |
| Takashimaya Co. Ltd. | | 328,000 | | | | 4,414 |
| Takefuji Corp. | | 55,520 | | | | 3,899 |
| The Keiyo Bank Ltd. | | 697,000 | | | | 5,245 |
| The Sumitomo Warehouse Co. Ltd. (d) | | 175,000 | | | | 1,361 |
| Tokuyama Corp. | | 189,000 | | | | 1,882 |
See accompanying notes which are an integral part of the financial statements.
| Common Stocks – continued | | | | | | |
| | | Shares | | Value (Note 1) |
| | | | | | | (000s) |
| |
| Japan – continued | | | | | | |
| Tokyo Electron Ltd. | | 67,400 | | $ | | 3,391 |
| Toyota Motor Corp. | | 430,400 | | | | 19,973 |
| USS Co. Ltd. | | 16,980 | | | | 1,171 |
| Xebio Co. Ltd. | | 43,000 | | | | 1,854 |
| Yahoo! Japan Corp | | 2,843 | | | | 3,028 |
| Yahoo! Japan Corp. New | | 2,343 | | | | 2,536 |
| Yamada Denki Co. Ltd. | | 15,200 | | | | 1,339 |
| TOTAL JAPAN | | | | | | 201,782 |
| |
| Korea (South) – 0.5% | | | | | | |
| Hyundai Motor Co. | | 29,481 | | | | 2,163 |
| Shinsegae Co. Ltd. | | 8,090 | | | | 2,898 |
| TOTAL KOREA (SOUTH) | | | | | | 5,061 |
| |
| Luxembourg – 0.3% | | | | | | |
| SES Global unit | | 229,400 | | | | 3,589 |
| Mexico – 0.3% | | | | | | |
| Fomento Economico Mexicano SA de CV sponsored ADR | | 47,900 | | | | 3,257 |
| Netherlands – 3.3% | | | | | | |
| ABN-AMRO Holding NV | | 205,100 | | | | 4,869 |
| ASML Holding NV (a) | | 309,522 | | | | 5,256 |
| DSM NV | | 89,900 | | | | 3,228 |
| EADS NV (d) | | 113,300 | | | | 3,925 |
| ING Groep NV (Certificaten Van Aandelen) | | 185,946 | | | | 5,366 |
| Koninklijke Numico NV (a) | | 71,200 | | | | 2,883 |
| Unilever NV (NY Shares) | | 31,700 | | | | 2,229 |
| VNU NV | | 266,240 | | | | 8,467 |
| TOTAL NETHERLANDS | | | | | | 36,223 |
| |
| Norway – 1.7% | | | | | | |
| DnB NOR ASA | | 518,300 | | | | 5,298 |
| Ocean RIG ASA (a) | | 184,300 | | | | 2,054 |
| Statoil ASA | | 206,100 | | | | 4,609 |
| Telenor ASA | | 355,000 | | | | 3,465 |
| Yara International ASA | | 151,600 | | | | 2,499 |
| TOTAL NORWAY | | | | | | 17,925 |
| |
| Oman – 0.0% | | | | | | |
| BankMuscat SAOG sponsored GDR (a) | | 18,500 | | | | 463 |
| Philippines – 0.2% | | | | | | |
| Philippine Long Distance Telephone Co. sponsored ADR (d) | | 56,700 | | | | 1,710 |
See accompanying notes which are an integral part of the financial statements.
15 Annual Report
| Investments - continued | | | | | | |
| |
| |
| Common Stocks – continued | | | | | | |
| | | Shares | | Value (Note 1) |
| | | | | | | (000s) |
| |
| South Africa – 0.3% | | | | | | |
| Nedbank Group Ltd | | 264,000 | | $ | | 3,364 |
| Spain – 1.7% | | | | | | |
| Banco Bilbao Vizcaya Argentaria SA | | 209,400 | | | | 3,692 |
| Banco Pastor SA (Reg.) | | 38,200 | | | | 1,634 |
| Banco Santander Central Hispano SA sponsored ADR | | 300,000 | | | | 3,807 |
| Gestevision Telecinco SA | | 15,600 | | | | 346 |
| Telefonica SA | | 581,848 | | | | 9,300 |
| TOTAL SPAIN | | | | | | 18,779 |
| |
| Sweden – 1.8% | | | | | | |
| Eniro AB | | 233,800 | | | | 2,555 |
| Gambro AB (A Shares) | | 224,400 | | | | 3,171 |
| Kungsleden AB | | 84,000 | | | | 2,200 |
| Modern Times Group AB (MTG) (B Shares) (a) | | 60,900 | | | | 2,329 |
| Telefonaktiebolaget LM Ericsson (B Shares) sponsored ADR | | 277,700 | | | | 9,111 |
| TOTAL SWEDEN | | | | | | 19,366 |
| |
| Switzerland – 8.9% | | | | | | |
| ABB Ltd. (Reg.) (a) | | 758,159 | | | | 5,799 |
| Clariant AG (Reg.) | | 190,900 | | | | 2,547 |
| Compagnie Financiere Richemont unit | | 120,700 | | | | 4,592 |
| Credit Suisse Group (Reg.) | | 200,604 | | | | 8,889 |
| Nestle SA (Reg.) | | 42,881 | | | | 12,773 |
| Nobel Biocare Holding AG (Switzerland) | | 22,500 | | | | 5,188 |
| Novartis AG (Reg.) | | 351,054 | | | | 18,894 |
| Phonak Holding AG | | 57,100 | | | | 2,381 |
| Roche Holding AG (participation certificate) | | 110,884 | | | | 16,566 |
| Societe Generale de Surveillance Holding SA (SGS) (Reg.) | | 6,700 | | | | 4,937 |
| Syngenta AG (Switzerland) | | 30,800 | | | | 3,302 |
| UBS AG (Reg.) | | 126,431 | | | | 10,831 |
| TOTAL SWITZERLAND | | | | | | 96,699 |
| |
| Taiwan – 0.8% | | | | | | |
| Acer, Inc. | | 930,000 | | | | 1,882 |
| Hon Hai Precision Industry Co. Ltd. (Foxconn) | | 96,187 | | | | 416 |
| Sunplus Technology Co. Ltd. | | 103,512 | | | | 90 |
| Taiwan Semiconductor Manufacturing Co. Ltd. | | 2,068,782 | | | | 3,206 |
| United Microelectronics Corp. | | 4,364,956 | | | | 2,316 |
| United Microelectronics Corp. sponsored ADR (d) | | 79,561 | | | | 232 |
| TOTAL TAIWAN | | | | | | 8,142 |
See accompanying notes which are an integral part of the financial statements.
| Common Stocks – continued | | | | | | |
| | | Shares | | Value (Note 1) |
| | | | | | | (000s) |
| |
| United Kingdom – 23.6% | | | | | | |
| Admiral Group PLC | | 234,900 | | $ | | 1,817 |
| Anglo American PLC (United Kingdom) | | 115,500 | | | | 3,415 |
| AstraZeneca PLC (United Kingdom) | | 209,400 | | | | 9,402 |
| BAE Systems PLC | | 918,100 | | | | 5,372 |
| Barclays PLC | | 427,500 | | | | 4,234 |
| Benfield Group PLC | | 395,200 | | | | 2,239 |
| BG Group PLC | | 778,000 | | | | 6,832 |
| BHP Billiton PLC | | 441,702 | | | | 6,495 |
| Body Shop International PLC | | 411,000 | | | | 1,528 |
| BP PLC | | 2,113,708 | | | | 23,393 |
| British Land Co. PLC | | 342,300 | | | | 5,394 |
| Cadbury Schweppes PLC | | 453,100 | | | | 4,460 |
| Corin Group PLC | | 132,100 | | | | 777 |
| Diageo PLC | | 459,300 | | | | 6,824 |
| Easynet Group PLC (a) | | 635,600 | | | | 1,936 |
| Eircom Group PLC | | 707,800 | | | | 1,697 |
| Gallaher Group PLC | | 179,400 | | | | 2,782 |
| GlaxoSmithKline PLC | | 723,500 | | | | 18,807 |
| Gyrus Group PLC (a) | | 680,600 | | | | 3,850 |
| HBOS PLC | | 139,400 | | | | 2,060 |
| Hilton Group PLC | | 891,300 | | | | 5,353 |
| HSBC Holdings PLC (United Kingdom) (Reg.) | | 1,020,567 | | | | 16,076 |
| Informa PLC | | 374,900 | | | | 2,484 |
| Intertek Group PLC | | 80,500 | | | | 1,015 |
| ITE Group PLC | | 1,217,300 | | | | 2,435 |
| ITV PLC | | 1,906,208 | | | | 3,510 |
| Jardine Lloyd Thompson Group PLC | | 674,400 | | | | 5,695 |
| Lloyds TSB Group PLC | | 332,400 | | | | 2,719 |
| M&C Saatchi | | 591,000 | | | | 1,130 |
| Man Group PLC | | 128,897 | | | | 3,514 |
| Mothercare PLC | | 159,693 | | | | 896 |
| O2 PLC | | 1,168,000 | | | | 4,255 |
| Pipex Communications PLC (a) | | 1,032,700 | | | | 169 |
| Prudential PLC | | 598,700 | | | | 5,024 |
| Reckitt Benckiser PLC | | 74,500 | | | | 2,252 |
| Reuters Group PLC | | 803,400 | | | | 5,110 |
| Rio Tinto PLC (Reg.) | | 148,418 | | | | 5,663 |
| Royal Bank of Scotland Group PLC | | 269,500 | | | | 7,462 |
| Royal Dutch Shell PLC: | | | | | | |
| Class A sponsored ADR | | 233,500 | | | | 14,486 |
| Class B | | 99,000 | | | | 3,238 |
| SABMiller PLC | | 232,600 | | | | 4,390 |
See accompanying notes which are an integral part of the financial statements.
17 Annual Report
| Investments - continued | | | | | | |
| |
| |
| Common Stocks – continued | | | | | | |
| | | Shares | | Value (Note 1) |
| | | | | | | (000s) |
| |
| United Kingdom – continued | | | | | | |
| Smiths Group PLC | | 227,400 | | $ | | 3,674 |
| Sportingbet PLC | | 505,900 | | | | 2,638 |
| Taylor Nelson Sofres PLC | | 610,600 | | | | 2,249 |
| Tesco PLC | | 1,212,211 | | | | 6,455 |
| Virgin Mobile Holdings (UK) PLC | | 513,700 | | | | 2,728 |
| Vodafone Group PLC | | 7,598,379 | | | | 19,953 |
| Whatman PLC | | 582,900 | | | | 2,890 |
| Xstrata PLC | | 135,500 | | | | 3,102 |
| Yell Group PLC | | 268,400 | | | | 2,103 |
| TOTAL UNITED KINGDOM | | | | | | 255,982 |
| |
| United States of America – 1.5% | | | | | | |
| Dominion Resources, Inc. | | 57,200 | | | | 4,352 |
| Janus Capital Group, Inc. | | 265,800 | | | | 4,665 |
| Synthes, Inc. | | 66,498 | | | | 7,041 |
| TOTAL UNITED STATES OF AMERICA | | | | | | 16,058 |
| |
| TOTAL COMMON STOCKS | | | | | | |
| (Cost $1,009,530) | | | | | | 1,033,623 |
| |
| Money Market Funds — 7.7% | | | | | | |
| |
| Fidelity Cash Central Fund, 3.92% (b) | | 54,191,991 | | | | 54,192 |
| Fidelity Securities Lending Cash Central Fund, | | | | | | |
| 3.94% (b)(c) | | 29,296,188 | | | | 29,296 |
| TOTAL MONEY MARKET FUNDS | | | | | | |
| (Cost $83,488) | | | | | | 83,488 |
| |
| TOTAL INVESTMENT PORTFOLIO – 102.9% | | | | | | |
| (Cost $1,093,018) | | | | 1,117,111 |
| |
| NET OTHER ASSETS – (2.9)% | | | | | | (31,592) |
| NET ASSETS – 100% | | $ | | 1,085,519 |
See accompanying notes which are an integral part of the financial statements.
(a) Non-income producing
(b) Affiliated fund that is available only to investment companies and other accounts managed by Fidelity Investments. The rate quoted is the annualized seven-day yield of the fund at period end. A complete unaudited listing of the fund’s holdings as of its most recent quarter end is available upon request.
(c) Investment made with cash collateral received from securities on loan.
(d) Security or a portion of the security is on loan at period end.
See accompanying notes which are an integral part of the financial statements.
19 Annual Report
| Financial Statements | | | | | | | | |
| |
| |
| Statement of Assets and Liabilities | | | | | | | | |
| Amounts in thousands (except per-share amounts) | | | | | | | | October 31, 2005 |
| |
| Assets | | | | | | | | |
| Investment in securities, at value (including securities | | | | | | | | |
| loaned of $28,128) (cost $1,093,018) — See | | | | | | | | |
| accompanying schedule | | | | | | $ | | 1,117,111 |
| Receivable for investments sold | | | | | | | | 6,847 |
| Receivable for fund shares sold | | | | | | | | 1,098 |
| Dividends receivable | | | | | | | | 1,029 |
| Interest receivable | | | | | | | | 120 |
| Other affiliated receivables | | | | | | | | 1 |
| Other receivables | | | | | | | | 435 |
| Total assets | | | | | | | | 1,126,641 |
| |
| Liabilities | | | | | | | | |
| Payable to custodian bank | | $ | | 148 | | | | |
| Payable for investments purchased | | | | 7,641 | | | | |
| Payable for fund shares redeemed | | | | 2,734 | | | | |
| Accrued management fee | | | | 432 | | | | |
| Distribution fees payable | | | | 341 | | | | |
| Other affiliated payables | | | | 292 | | | | |
| Other payables and accrued expenses | | | | 238 | | | | |
| Collateral on securities loaned, at value | | | | 29,296 | | | | |
| Total liabilities | | | | | | | | 41,122 |
| |
| Net Assets | | | | | | $ | | 1,085,519 |
| Net Assets consist of: | | | | | | | | |
| Paid in capital | | | | | | $ | | 1,043,170 |
| Undistributed net investment income | | | | | | | | 7,795 |
| Accumulated undistributed net realized gain (loss) on | | | | | | | | |
| investments and foreign currency transactions | | | | | | | | 10,582 |
| Net unrealized appreciation (depreciation) on | | | | | | | | |
| investments and assets and liabilities in foreign | | | | | | | | |
| currencies | | | | | | | | 23,972 |
| Net Assets | | | | | | $ | | 1,085,519 |
See accompanying notes which are an integral part of the financial statements.
| Statement of Assets and Liabilities — continued | | | | |
| Amounts in thousands (except per-share amounts) | | | | October 31, 2005 |
| |
| Calculation of Maximum Offering Price | | | | |
| Class A: | | | | |
| Net Asset Value and redemption price per share | | | | |
| ($132,699 ÷ 7,229 shares) | | $ | | 18.36 |
| Maximum offering price per share (100/94.25 of | | | | |
| $18.36) | | $ | | 19.48 |
| Class T: | | | | |
| Net Asset Value and redemption price per share | | | | |
| ($581,821 ÷ 31,214 shares) | | $ | | 18.64 |
| Maximum offering price per share (100/96.50 of | | | | |
| $18.64) | | $ | | 19.32 |
| Class B: | | | | |
| Net Asset Value and offering price per share | | | | |
| ($46,656 ÷ 2,647 shares)A | | $ | | 17.63 |
| Class C: | | | | |
| Net Asset Value and offering price per share | | | | |
| ($37,554 ÷ 2,092 shares)A | | $ | | 17.95 |
| Institutional Class: | | | | |
| Net Asset Value, offering price and redemption | | | | |
| price per share ($286,789 ÷ 15,387 shares) . | | $ | | 18.64 |
| |
| A Redemption price per share is equal to net asset value less any applicable contingent deferred sales charge. | | | | |
See accompanying notes which are an integral part of the financial statements.
21 Annual Report
| Financial Statements - continued | | | | | | |
| |
| |
| Statement of Operations | | | | | | |
| Amounts in thousands | | | | Year ended October 31, 2005 |
| |
| Investment Income | | | | | | |
| Dividends | | | | $ | | 25,987 |
| Interest | | | | | | 733 |
| Security lending | | | | | | 1,067 |
| | | | | | | 27,787 |
| Less foreign taxes withheld | | | | | | (3,677) |
| Total income | | | | | | 24,110 |
| |
| Expenses | | | | | | |
| Management fee | | | | | | |
| Basic fee | | $ | | 9,114 | | |
| Performance adjustment | | | | (2,646) | | |
| Transfer agent fees | | | | 3,174 | | |
| Distribution fees | | | | 5,223 | | |
| Accounting and security lending fees | | | | 625 | | |
| Independent trustees’ compensation | | | | 6 | | |
| Custodian fees and expenses | | | | 576 | | |
| Registration fees | | | | 90 | | |
| Audit | | | | 83 | | |
| Legal | | | | 5 | | |
| Interest | | | | 39 | | |
| Miscellaneous | | | | 23 | | |
| Total expenses before reductions | | | | 16,312 | | |
| Expense reductions | | | | (1,162) | | 15,150 |
| |
| Net investment income (loss) | | | | | | 8,960 |
| Realized and Unrealized Gain (Loss) | | | | | | |
| Net realized gain (loss) on: | | | | | | |
| Investment securities (net of foreign taxes of $199) | | | | 270,061 | | |
| Foreign currency transactions | | | | 76 | | |
| Total net realized gain (loss) | | | | | | 270,137 |
| Change in net unrealized appreciation (depreciation) on: | | | | |
| Investment securities (net of decrease in deferred for- | | | | |
| eign taxes of $515) | | | | (63,413) | | |
| Assets and liabilities in foreign currencies | | | | (73) | | |
| Total change in net unrealized appreciation | | | | | | |
| (depreciation) | | | | | | (63,486) |
| Net gain (loss) | | | | | | 206,651 |
| Net increase (decrease) in net assets resulting from | | | | | | |
| operations | | | | $ | | 215,611 |
See accompanying notes which are an integral part of the financial statements.
| Statement of Changes in Net Assets | | | | | | | | |
| | | | | Year ended | | | | Year ended |
| | | | | October 31, | | | | October 31, |
| Amounts in thousands | | | | 2005 | | | | 2004 |
| Increase (Decrease) in Net Assets | | | | | | | | |
| Operations | | | | | | | | |
| Net investment income (loss) | | $ | | 8,960 | | $ | | 1,999 |
| Net realized gain (loss) | | | | 270,137 | | | | 144,792 |
| Change in net unrealized appreciation (depreciation) . | | (63,486) | | | | (48) |
| Net increase (decrease) in net assets resulting | | | | | | | | |
| from operations | | | | 215,611 | | | | 146,743 |
| Distributions to shareholders from net investment income | | . | | (2,281) | | | | (9,233) |
| Distributions to shareholders from net realized gain | | | | (5,591) | | | | — |
| Total distributions | | | | (7,872) | | | | (9,233) |
| Share transactions -- net increase (decrease) | | | | (709,958) | | | | 98,813 |
| Redemption fees | | | | 52 | | | | 19 |
| Total increase (decrease) in net assets | | | | (502,167) | | | | 236,342 |
| |
| Net Assets | | | | | | | | |
| Beginning of period | | | | 1,587,686 | | | | 1,351,344 |
| End of period (including undistributed net investment | | | | | | | | |
| income of $7,795 and undistributed net investment | | | | | | | | |
| income of $897, respectively) | | $ | | 1,085,519 | | $ | | 1,587,686 |
See accompanying notes which are an integral part of the financial statements.
23 Annual Report
| Financial Highlights — Class A | | | | | | | | |
| Years ended October 31, | | 2005 | | 2004 | | 2003 | | 2002 | | 2001 |
| Selected Per-Share Data | | | | | | | | | | |
| Net asset value, beginning of | | | | | | | | | | |
| period | | $ 15.86 | | $ 14.41 | | $ 11.01 | | $ 12.90 | | $ 19.88 |
| Income from Investment | | | | | | | | | | |
| Operations | | | | | | | | | | |
| Net investment income | | | | | | | | | | |
| (loss)C | | 13 | | .04D | | .05 | | .01 | | .06 |
| Net realized and unreal- | | | | | | | | | | |
| ized gain (loss) | | 2.47 | | 1.54 | | 3.35 | | (1.90) | | (4.89) |
| Total from investment | | | | | | | | | | |
| operations | | 2.60 | | 1.58 | | 3.40 | | (1.89) | | (4.83) |
| Distributions from net | | | | | | | | | | |
| investment income | | (.04) | | (.13) | | — | | — | | (.43) |
| Distributions from net | | | | | | | | | | |
| realized gain | | (.06) | | — | | — | | — | | (1.72) |
| Total distributions | | (.10) | | (.13) | | — | | — | | (2.15) |
| Redemption fees added to | | | | | | | | | | |
| paid in capitalC | | —F | | —F | | — | | — | | — |
| Net asset value, end of | | | | | | | | | | |
| period | | $ 18.36 | | $ 15.86 | | $ 14.41 | | $ 11.01 | | $ 12.90 |
| Total ReturnA,B | | 16.44% | | 11.03% | | 30.88% | | (14.65)% | | (27.16)% |
| Ratios to Average Net AssetsE | | | | | | | | | | |
| Expenses before expense | | | | | | | | | | |
| reductions | | 1.24% | | 1.36% | | 1.34% | | 1.56% | | 1.46% |
| Expenses net of voluntary | | | | | | | | | | |
| waivers, if any | | 1.24% | | 1.36% | | 1.34% | | 1.56% | | 1.46% |
| Expenses net of all | | | | | | | | | | |
| reductions | | 1.15% | | 1.32% | | 1.30% | | 1.52% | | 1.41% |
| Net investment income | | | | | | | | | | |
| (loss) | | 76% | | .24%D | | .43% | | .07% | | .40% |
| Supplemental Data | | | | | | | | | | |
| Net assets, end of period | | | | | | | | | | |
| (in millions) | | $ 133 | | $ 115 | | $ 68 | | $ 44 | | $ 46 |
| Portfolio turnover rate | | 120% | | 85% | | 99% | | 73% | | 99% |
A Total returns would have been lower had certain expenses not been reduced during the periods shown.
B Total returns do not include the effect of the sales charges.
C Calculated based on average shares outstanding during the period.
D Net investment income per share includes approximately $.01 per share received as a result of a reorganization of an issuer that was in bank ruptcy. Excluding this non recurring amount, the ratio of net investment income to average net assets would have been .21%.
E Expense ratios reflect operating expenses of the class. Expenses before reductions do not reflect amounts reimbursed by the investment adviser or reductions from brokerage service arrangements or other expense offset arrangements and do not represent the amount paid by the class during periods when reimbursements or reductions occur. Expenses net of any voluntary waivers reflect expenses after reimbursement by the investment adviser but prior to reductions from brokerage service arrangements or other expense offset arrangements. Expenses net of all reductions repre sent the net expenses paid by the class.
F Amount represents less than $.01 per share.
See accompanying notes which are an integral part of the financial statements.
| Financial Highlights — Class T | | | | | | | | |
| Years ended October 31, | | 2005 | | 2004 | | 2003 | | 2002 | | 2001 |
| Selected Per-Share Data | | | | | | | | | | |
| Net asset value, beginning of | | | | | | | | | | |
| period | | $ 16.09 | | $ 14.61 | | $ 11.18 | | $ 13.11 | | $ 20.13 |
| Income from Investment | | | | | | | | | | |
| Operations | | | | | | | | | | |
| Net investment income | | | | | | | | | | |
| (loss)C | | 11 | | .02D | | .04 | | (.01) | | .04 |
| Net realized and unreal- | | | | | | | | | | |
| ized gain (loss) | | 2.51 | | 1.56 | | 3.39 | | (1.92) | | (4.99) |
| Total from investment | | | | | | | | | | |
| operations | | 2.62 | | 1.58 | | 3.43 | | (1.93) | | (4.95) |
| Distributions from net | | | | | | | | | | |
| investment income | | (.01) | | (.10) | | — | | — | | (.35) |
| Distributions from net | | | | | | | | | | |
| realized gain | | (.06) | | — | | — | | — | | (1.72) |
| Total distributions | | (.07) | | (.10) | | — | | — | | (2.07) |
| Redemption fees added to | | | | | | | | | | |
| paid in capitalC | | —F | | —F | | — | | — | | — |
| Net asset value, end of | | | | | | | | | | |
| period | | $ 18.64 | | $ 16.09 | | $ 14.61 | | $ 11.18 | | $ 13.11 |
| Total ReturnA,B | | 16.31% | | 10.86% | | 30.68% | | (14.72)% | | (27.33)% |
| Ratios to Average Net AssetsE | | | | | | | | | | |
| Expenses before expense | | | | | | | | | | |
| reductions | | 1.36% | | 1.48% | | 1.46% | | 1.68% | | 1.62% |
| Expenses net of voluntary | | | | | | | | | | |
| waivers, if any | | 1.36% | | 1.48% | | 1.46% | | 1.68% | | 1.62% |
| Expenses net of all | | | | | | | | | | |
| reductions | | 1.27% | | 1.43% | | 1.42% | | 1.64% | | 1.57% |
| Net investment income | | | | | | | | | | |
| (loss) | | 64% | | .12%D | | .31% | | (.05)% | | .24% |
| Supplemental Data | | | | | | | | | | |
| Net assets, end of period | | | | | | | | | | |
| (in millions) | | $ 582 | | $ 1,181 | | $ 1,114 | | $ 928 | | $ 1,185 |
| Portfolio turnover rate | | 120% | | 85% | | 99% | | 73% | | 99% |
A Total returns would have been lower had certain expenses not been reduced during the periods shown.
B Total returns do not include the effect of the sales charges.
C Calculated based on average shares outstanding during the period.
D Net investment income per share includes approximately $.01 per share received as a result of a reorganization of an issuer that was in bank ruptcy. Excluding this non recurring amount, the ratio of net investment income to average net assets would have been .09%.
E Expense ratios reflect operating expenses of the class. Expenses before reductions do not reflect amounts reimbursed by the investment adviser or reductions from brokerage service arrangements or other expense offset arrangements and do not represent the amount paid by the class during periods when reimbursements or reductions occur. Expenses net of any voluntary waivers reflect expenses after reimbursement by the investment adviser but prior to reductions from brokerage service arrangements or other expense offset arrangements. Expenses net of all reductions repre sent the net expenses paid by the class.
F Amount represents less than $.01 per share.
See accompanying notes which are an integral part of the financial statements.
25 Annual Report
| Financial Highlights — Class B | | | | | | | | |
| Years ended October 31, | | 2005 | | 2004 | | 2003 | | 2002 | | 2001 |
| Selected Per-Share Data | | | | | | | | | | |
| Net asset value, beginning of | | | | | | | | | | |
| period | | $ 15.26 | | $ 13.87 | | $ 10.71 | | $ 12.63 | | $ 19.49 |
| Income from Investment | | | | | | | | | | |
| Operations | | | | | | | | | | |
| Net investment income | | | | | | | | | | |
| (loss)C | | (.01) | | (.10)D | | (.06) | | (.08) | | (.06) |
| Net realized and unreal- | | | | | | | | | | |
| ized gain (loss) | | 2.38 | | 1.50 | | 3.22 | | (1.84) | | (4.83) |
| Total from investment | | | | | | | | | | |
| operations | | 2.37 | | 1.40 | | 3.16 | | (1.92) | | (4.89) |
| Distributions from net | | | | | | | | | | |
| investment income | | — | | (.01) | | — | | — | | (.25) |
| Distributions from net | | | | | | | | | | |
| realized gain | | — | | — | | — | | — | | (1.72) |
| Total distributions | | — | | (.01) | | — | | — | | (1.97) |
| Redemption fees added to | | | | | | | | | | |
| paid in capitalC | | —F | | —F | | — | | — | | — |
| Net asset value, end of | | | | | | | | | | |
| period | | $ 17.63 | | $ 15.26 | | $ 13.87 | | $ 10.71 | | $ 12.63 |
| Total ReturnA,B | | 15.53% | | 10.10% | | 29.51% | | (15.20)% | | (27.83)% |
| Ratios to Average Net AssetsE | | | | | | | | | | |
| Expenses before expense | | | | | | | | | | |
| reductions | | 2.04% | | 2.25% | | 2.27% | | 2.43% | | 2.27% |
| Expenses net of voluntary | | | | | | | | | | |
| waivers, if any | | 2.04% | | 2.25% | | 2.27% | | 2.30% | | 2.27% |
| Expenses net of all | | | | | | | | | | |
| reductions | | 1.95% | | 2.21% | | 2.22% | | 2.26% | | 2.23% |
| Net investment income | | | | | | | | | | |
| (loss) | | (.04)% | | (.65)%D | | (.49)% | | (.66)% | | (.42)% |
| Supplemental Data | | | | | | | | | | |
| Net assets, end of period | | | | | | | | | | |
| (in millions) | | $ 47 | | $ 57 | | $ 59 | | $ 53 | | $ 80 |
| Portfolio turnover rate | | 120% | | 85% | | 99% | | 73% | | 99% |
A Total returns would have been lower had certain expenses not been reduced during the periods shown.
B Total returns do not include the effect of the contingent deferred sales charge.
C Calculated based on average shares outstanding during the period.
D Net investment income per share includes approximately $.01 per share received as a result of a reorganization of an issuer that was in bank ruptcy. Excluding this non recurring amount, the ratio of net investment income to average net assets would have been (.68)%.
E Expense ratios reflect operating expenses of the class. Expenses before reductions do not reflect amounts reimbursed by the investment adviser or reductions from brokerage service arrangements or other expense offset arrangements and do not represent the amount paid by the class during periods when reimbursements or reductions occur. Expenses net of any voluntary waivers reflect expenses after reimbursement by the investment adviser but prior to reductions from brokerage service arrangements or other expense offset arrangements. Expenses net of all reductions repre sent the net expenses paid by the class.
F Amount represents less than $.01 per share.
See accompanying notes which are an integral part of the financial statements.
| Financial Highlights — Class C | | | | | | | | |
| Years ended October 31, | | 2005 | | 2004 | | 2003 | | 2002 | | 2001 |
| Selected Per-Share Data | | | | | | | | | | |
| Net asset value, beginning of | | | | | | | | | | |
| period | | $ 15.53 | | $ 14.11 | | $ 10.88 | | $ 12.84 | | $ 19.80 |
| Income from Investment | | | | | | | | | | |
| Operations | | | | | | | | | | |
| Net investment income | | | | | | | | | | |
| (loss)C | | —F | | (.08)D | | (.05) | | (.08) | | (.05) |
| Net realized and unreal- | | | | | | | | | | |
| ized gain (loss) | | 2.42 | | 1.52 | | 3.28 | | (1.88) | | (4.89) |
| Total from investment | | | | | | | | | | |
| operations | | 2.42 | | 1.44 | | 3.23 | | (1.96) | | (4.94) |
| Distributions from net | | | | | | | | | | |
| investment income | | — | | (.02) | | — | | — | | (.30) |
| Distributions from net | | | | | | | | | | |
| realized gain | | — | | — | | — | | — | | (1.72) |
| Total distributions | | — | | (.02) | | — | | — | | (2.02) |
| Redemption fees added to | | | | | | | | | | |
| paid in capitalC | | —F | | —F | | — | | — | | — |
| Net asset value, end of | | | | | | | | | | |
| period | | $ 17.95 | | $ 15.53 | | $ 14.11 | | $ 10.88 | | $ 12.84 |
| Total ReturnA,B | | 15.58% | | 10.21% | | 29.69% | | (15.26)% | | (27.70)% |
| Ratios to Average Net AssetsE | | | | | | | | | | |
| Expenses before expense | | | | | | | | | | |
| reductions | | 2.00% | | 2.14% | | 2.17% | | 2.34% | | 2.19% |
| Expenses net of voluntary | | | | | | | | | | |
| waivers, if any | | 2.00% | | 2.14% | | 2.17% | | 2.30% | | 2.19% |
| Expenses net of all | | | | | | | | | | |
| reductions | | 1.90% | | 2.10% | | 2.13% | | 2.26% | | 2.14% |
| Net investment income | | | | | | | | | | |
| (loss) | | 01% | | (.54)%D | | (.40)% | | (.66)% | | (.34)% |
| Supplemental Data | | | | | | | | | | |
| Net assets, end of period | | | | | | | | | | |
| (in millions) | | $ 38 | | $ 40 | | $ 41 | | $ 36 | | $ 52 |
| Portfolio turnover rate | | 120% | | 85% | | 99% | | 73% | | 99% |
A Total returns would have been lower had certain expenses not been reduced during the periods shown.
B Total returns do not include the effect of the contingent deferred sales charge.
C Calculated based on average shares outstanding during the period.
D Net investment income per share includes approximately $.01 per share received as a result of a reorganization of an issuer that was in bank ruptcy. Excluding this non recurring amount, the ratio of net investment income to average net assets would have been (.57)%.
E Expense ratios reflect operating expenses of the class. Expenses before reductions do not reflect amounts reimbursed by the investment adviser or reductions from brokerage service arrangements or other expense offset arrangements and do not represent the amount paid by the class during periods when reimbursements or reductions occur. Expenses net of any voluntary waivers reflect expenses after reimbursement by the investment adviser but prior to reductions from brokerage service arrangements or other expense offset arrangements. Expenses net of all reductions repre sent the net expenses paid by the class.
F Amount represents less than $.01 per share.
See accompanying notes which are an integral part of the financial statements.
27 Annual Report
| Financial Highlights — Institutional Class | | | | |
| Years ended October 31, | | 2005 | | 2004 | | 2003 | | 2002 | | 2001 |
| Selected Per-Share Data | | | | | | | | | | |
| Net asset value, beginning of | | | | | | | | | | |
| period | | $ 16.09 | | $ 14.60 | | $ 11.11 | | $ 12.97 | | $ 19.95 |
| Income from Investment | | | | | | | | | | |
| Operations | | | | | | | | | | |
| Net investment income | | | | | | | | | | |
| (loss)B | | 21 | | .10C | | .10 | | .06 | | .12 |
| Net realized and unreal- | | | | | | | | | | |
| ized gain (loss) | | 2.50 | | 1.56 | | 3.39 | | (1.92) | | (4.91) |
| Total from investment | | | | | | | | | | |
| operations | | 2.71 | | 1.66 | | 3.49 | | (1.86) | | (4.79) |
| Distributions from net | | | | | | | | | | |
| investment income | | (.10) | | (.17) | | — | | — | | (.47) |
| Distributions from net | | | | | | | | | | |
| realized gain | | (.06) | | — | | — | | — | | (1.72) |
| Total distributions | | (.16) | | (.17) | | — | | — | | (2.19) |
| Redemption fees added to | | | | | | | | | | |
| paid in capitalB | | —E | | —E | | — | | — | | — |
| Net asset value, end of | | | | | | | | | | |
| period | | $ 18.64 | | $ 16.09 | | $ 14.60 | | $ 11.11 | | $ 12.97 |
| Total ReturnA | | 16.91% | | 11.46% | | 31.41% | | (14.34)% | | (26.89)% |
| Ratios to Average Net AssetsD | | | | | | | | | | |
| Expenses before expense | | | | | | | | | | |
| reductions | | 83% | | .98% | | .93% | | 1.14% | | 1.06% |
| Expenses net of voluntary | | | | | | | | | | |
| waivers, if any | | 83% | | .98% | | .93% | | 1.14% | | 1.06% |
| Expenses net of all | | | | | | | | | | |
| reductions | | 73% | | .93% | | .89% | | 1.10% | | 1.02% |
| Net investment income | | | | | | | | | | |
| (loss) | | 1.18% | | .62%C | | .84% | | .49% | | .79% |
| Supplemental Data | | | | | | | | | | |
| Net assets, end of period | | | | | | | | | | |
| (in millions) | | $ 287 | | $ 194 | | $ 69 | | $ 63 | | $ 69 |
| Portfolio turnover rate | | 120% | | 85% | | 99% | | 73% | | 99% |
A Total returns would have been lower had certain expenses not been reduced during the periods shown.
B Calculated based on average shares outstanding during the period.
C Net investment income per share includes approximately $.01 per share received as a result of a reorganization of an issuer that was in bank ruptcy. Excluding this non recurring amount, the ratio of net investment income to average net assets would have been .59%.
D Expense ratios reflect operating expenses of the class. Expenses before reductions do not reflect amounts reimbursed by the investment adviser or reductions from brokerage service arrangements or other expense offset arrangements and do not represent the amount paid by the class during periods when reimbursements or reductions occur. Expenses net of any voluntary waivers reflect expenses after reimbursement by the investment adviser but prior to reductions from brokerage service arrangements or other expense offset arrangements. Expenses net of all reductions repre sent the net expenses paid by the class.
E Amount represents less than $.01 per share.
See accompanying notes which are an integral part of the financial statements.
Notes to Financial Statements
For the period ended October 31, 2005
(Amounts in thousands except ratios)
|
1. Significant Accounting Policies.
Fidelity Advisor Overseas Fund (the fund) is a fund of Fidelity Advisor Series VIII (the trust) and is authorized to issue an unlimited number of shares. The trust is registered under the Investment Company Act of 1940, as amended (the 1940 Act), as an open-end management investment company organized as a Massachusetts business trust.
The fund offers Class A, Class T, Class B, Class C, and Institutional Class shares, each of which has equal rights as to assets and voting privileges. Each class has exclusive voting rights with respect to matters that affect that class. Class B shares will automatically convert to Class A shares after a holding period of seven years from the initial date of purchase. Investment income, realized and unrealized capital gains and losses, the common expenses of the fund, and certain fund-level expense reductions, if any, are allocated on a pro rata basis to each class based on the relative net assets of each class to the total net assets of the fund. Each class differs with respect to transfer agent and distribution and service plan fees incurred. Certain expense reductions also differ by class.
The fund may invest in affiliated money market central funds (Money Market Central Funds), which are open-end investment companies available to investment companies and other accounts managed by Fidelity Management & Research Company (FMR) and its affiliates. The fund’s investments in emerging markets can be subject to social, economic, regulatory, and political uncertainties and can be extremely volatile. The financial statements have been prepared in conformity with accounting principles generally accepted in the United States of America, which require management to make certain estimates and assumptions at the date of the financial statements. The following summarizes the significant accounting policies of the fund:
Security Valuation. Investments are valued and net asset value (NAV) per share is calculated (NAV calculation) as of the close of business of the New York Stock Exchange (NYSE), normally 4:00 p.m. Eastern time. Wherever possible, the fund uses independent pricing services approved by the Board of Trustees to value its investments.
Equity securities, including restricted securities, for which market quotations are readily available, are valued at the last reported sale price or official closing price as reported by an independent pricing service on the primary market or exchange on which they are traded. In the event there were no sales during the day or closing prices are not available, securities are valued at the last quoted bid price. Investments in open-end mutual funds are valued at their closing net asset value each business day. Short-term securities with remaining maturities of sixty days or less for which quotations are not readily available are valued at amortized cost, which approximates value.
29 Annual Report
Notes to Financial Statements - continued
(Amounts in thousands except ratios)
1. Significant Accounting Policies - continued
Security Valuation - continued
When current market prices or quotations are not readily available or do not accurately reflect fair value, valuations may be determined in accordance with procedures adopted by the Board of Trustees. For example, when developments occur between the close of a market and the close of the NYSE that may materially affect the value of some or all of the securities, or when trading in a security is halted, those securities may be fair valued.
Factors used in the determination of fair value may include monitoring news to identify significant market or security specific events such as changes in the value of U.S. securities market, reviewing developments in foreign markets and evaluating the performance of ADRs, futures contracts and exchange-traded funds. Because the fund’s utilization of fair value pricing depends on market activity, the frequency with which fair value pricing is used can not be predicted and may be utilized to a significant extent. The value of securities used for NAV calculation under fair value pricing may differ from published prices for the same securities.
Foreign Currency. The fund uses foreign currency contracts to facilitate transactions in foreign-denominated securities. Losses from these transactions may arise from changes in the value of the foreign currency or if the counterparties do not perform under the contracts’ terms.
Foreign-denominated assets, including investment securities, and liabilities are translated into U.S. dollars at the exchange rate at period end. Purchases and sales of investment securities, income and dividends received and expenses denominated in foreign currencies are translated into U.S. dollars at the exchange rate in effect on the transaction date.
The effects of exchange rate fluctuations on investments are included with the net realized and unrealized gain (loss) on investment securities. Other foreign currency transactions resulting in realized and unrealized gain (loss) are disclosed separately.
Investment Transactions and Income. Security transactions are accounted for as of trade date. Gains and losses on securities sold are determined on the basis of identified cost. Dividend income is recorded on the ex-dividend date, except for certain dividends from foreign securities where the ex-dividend date may have passed, which are recorded as soon as the fund is informed of the ex-dividend date. Non-cash dividends included in dividend income, if any, are recorded at the fair market value of the securities received. Interest income is accrued as earned. Interest income includes coupon interest and amortization of premium and accretion of discount on debt securities. Investment income is recorded net of foreign taxes withheld where recovery of such taxes is uncertain.
1. Significant Accounting Policies - continued
Expenses. Most expenses of the trust can be directly attributed to a fund. Expenses which cannot be directly attributed are apportioned among each fund in the trust.
Income Tax Information and Distributions to Shareholders. Each year, the fund intends to qualify as a regulated investment company by distributing all of its taxable income and realized gains under Subchapter M of the Internal Revenue Code. As a result, no provision for income taxes is required in the accompanying financial statements. Foreign taxes are provided for based on the fund’s understanding of the tax rules and rates that exist in the foreign markets in which it invests.
Distributions are recorded on the ex-dividend date. Income dividends and capital gain distributions are declared separately for each class. Income and capital gain distributions are determined in accordance with income tax regulations, which may differ from generally accepted accounting principles. In addition, the fund will claim a portion of the payment made to redeeming shareholders as a distribution for income tax purposes.
Capital accounts within the financial statements are adjusted for permanent book-tax differences. These adjustments have no impact on net assets or the results of operations. Temporary book-tax differences will reverse in a subsequent period.
Book-tax differences are primarily due to foreign currency transactions, certain foreign taxes, passive foreign investment companies (PFIC), capital loss carryforward, and losses deferred due to wash sales.
The tax-basis components of distributable earnings and the federal tax cost as of period end were as follows:
| Unrealized appreciation | | $ | | 75,603 | | | | |
| Unrealized depreciation | | | | (58,685) | | | | |
| Net unrealized appreciation (depreciation) | | | | 16,918 | | | | |
| Undistributed ordinary income | | | | 15,854 | | | | |
| Undistributed long-term capital gain | | | | 8,404 | | | | |
| |
| Cost for federal income tax purposes | | $ | | 1,100,193 | | | | |
| |
| The tax character of distributions paid was as follows: | | | | |
| | | | | October 31, 2005 | | | | October 31, 2004 |
| Ordinary Income | | $ | | 7,872 | | $ | | 9,233 |
Short-Term Trading (Redemption) Fees. Shares held in the fund less than 30 days are subject to a redemption fee equal to 1.00% of the proceeds of the redeemed shares. All redemption fees, including any estimated redemption fees paid by FMR, are retained by the fund and accounted for as an addition to paid in capital.
31 Annual Report
Notes to Financial Statements - continued
(Amounts in thousands except ratios)
2. Operating Policies.
Repurchase Agreements. FMR has received an Exemptive Order from the Securities and Exchange Commission (the SEC) which permits the fund and other affiliated entities of FMR to transfer uninvested cash balances into joint trading accounts which are then invested in repurchase agreements. The fund may also invest directly with institutions in repurchase agreements. Repurchase agreements are collateralized by government or non-government securities. Collateral is held in segregated accounts with custodian banks and may be obtained in the event of a default of the counterparty. The fund monitors, on a daily basis, the value of the collateral to ensure it is at least equal to the principal amount of the repurchase agreement (including accrued interest). In the event of a default by the counterparty, realization of the collateral proceeds could be delayed, during which time the value of the collateral may decline.
3. Purchases and Sales of Investments.
Purchases and sales of securities, other than short-term securities and U.S. government securities, aggregated $1,474,617 and $2,149,058, respectively.
4. Fees and Other Transactions with Affiliates.
Management Fee. FMR and its affiliates provide the fund with investment management related services for which the fund pays a monthly management fee. The management fee is the sum of an individual fund fee rate that is based on an annual rate of .45% of the fund’s average net assets and a group fee rate that averaged .27% during the period. The group fee rate is based upon the average net assets of all the mutual funds advised by FMR. The group fee rate decreases as assets under management increase and increases as assets under management decrease. In addition, the management fee is subject to a performance adjustment (up to a maximum of .20% of the fund’s average net assets over a 36 month performance period). The upward or downward adjustment to the management fee is based on the investment performance of the asset-weighted return of all classes as compared to an appropriate benchmark index. For the period, the total annual management fee rate, including the performance adjustment, was .51% of the fund’s average net assets.
Distribution and Service Plan. In accordance with Rule 12b-1 of the 1940 Act, the fund has adopted separate Distribution and Service Plans for each class of shares. Certain classes pay Fidelity Distributors Corporation (FDC), an affiliate of FMR, separate Distribution and Service Fees, each of which is based on an annual percentage of each class’ average net assets. In addition, FDC may pay financial intermediaries for selling shares of the fund and providing shareholder support services. For the period, the
4. Fees and Other Transactions with Affiliates - continued
Distribution and Service Plan - continued
Distribution and Service Fee rates and the total amounts paid to and retained by FDC were as follows:
| | | Distribution | | Service | | | | Paid to | | | | Retained |
| | | Fee | | Fee | | | | FDC | | | | by FDC |
| Class A | | 0% | | .25% | | $ | | 303 | | $ | | 4 |
| Class T | | 25% | | .25% | | | | 3,993 | | | | 54 |
| Class B | | 75% | | .25% | | | | 534 | | | | 401 |
| Class C | | 75% | | .25% | | | | 393 | | | | 26 |
| | | | | | | $ | | 5,223 | | $ | | 485 |
Sales Load. FDC receives a front-end sales charge of up to 5.75% for selling Class A shares, and 3.50% for selling Class T shares, some of which is paid to financial intermediaries for selling shares of the fund. FDC receives the proceeds of contingent deferred sales charges levied on Class A, Class T, Class B, and Class C redemptions. These charges depend on the holding period. The deferred sales charges range from 5% to 1% for Class B, 1% for Class C, and .25% for certain purchases of Class A and Class T shares.
| For the period, sales charge amounts retained by FDC were as follows: | | |
| | | | | Retained |
| | | | | by FDC |
| Class A | | $ | | 17 |
| Class T | | | | 16 |
| Class B* | | | | 87 |
| Class C* | | | | 2 |
| | | $ | | 122 |
* When Class B and Class C shares are initially sold, FDC pays commissions from its own resources to financial intermediaries through which the sales are made.
Transfer Agent Fees. Fidelity Investments Institutional Operations Company, Inc. (FIIOC), an affiliate of FMR, is the transfer, dividend disbursing and shareholder servicing agent for each class of the fund. FIIOC receives account fees and asset-based fees that vary according to the account size and type of account of the shareholders of the
33 Annual Report
Notes to Financial Statements - continued
(Amounts in thousands except ratios)
4. Fees and Other Transactions with Affiliates - continued
Transfer Agent Fees - continued
respective classes of the fund. FIIOC pays for typesetting, printing and mailing of shareholder reports, except proxy statements. For the period the total transfer agent fees paid by each class to FIIOC, were as follows:
| | | | | | | % of |
| | | | | | | Average |
| | | | | Amount | | Net Assets |
| Class A | | $ | | 444 | | .37 |
| Class T | | | | 1,867 | | .23 |
| Class B | | | | 221 | | .41 |
| Class C | | | | 145 | | .37 |
| Institutional Class | | | | 497 | | .20 |
| | | $ | | 3,174 | | |
Accounting and Security Lending Fees. Fidelity Service Company, Inc. (FSC), an affiliate of FMR, maintains the fund’s accounting records. The accounting fee is based on the level of average net assets for the month. Under a separate contract, FSC administers the security lending program. The security lending fee is based on the number and duration of lending transactions.
Affiliated Central Funds. The fund may invest in Money Market Central Funds which seek preservation of capital and current income and are managed by Fidelity Investments Money Management, Inc. (FIMM), an affiliate of FMR.
The Money Market Central Funds do not pay a management fee. Income distributions earned by the fund are recorded as income in the accompanying financial statements and totaled $2,345 for the period.
Brokerage Commissions. The fund placed a portion of its portfolio transactions with brokerage firms which are affiliates of the investment adviser. The commissions paid to these affiliated firms were $2 for the period.
Interfund Lending Program. Pursuant to an Exemptive Order issued by the SEC, the fund, along with other registered investment companies having management contracts with FMR, may participate in an interfund lending program. This program provides an alternative credit facility allowing the funds to borrow from, or lend money to, other participating affiliated funds. At period end, there were no interfund loans outstanding. The fund’s activity in this program during the period for which loans were outstanding was as follows:
| | | | | | | | | Interest Earned | | | | |
| Borrower | | | | Average Daily | | Weighted Average | | (included in | | | | |
| or Lender | | | | Loan Balance | | Interest Rate | | interest income) | | | | Interest Expense |
| Borrower | | $ | | 20,669 | | 2.77% | | — | | $ | | 38 |
Annual Report 34
| | 5. Committed Line of Credit.
|
The fund participates with other funds managed by FMR in a $4.2 billion credit facility (the “line of credit”) to be utilized for temporary or emergency purposes to fund shareholder redemptions or for other short-term liquidity purposes. The fund has agreed to pay commitment fees on its pro rata portion of the line of credit. During the period, there were no borrowings on this line of credit.
The fund lends portfolio securities from time to time in order to earn additional income. The fund receives collateral (in the form of U.S. Treasury obligations, letters of credit and/or cash) against the loaned securities and maintains collateral in an amount not less than 100% of the market value of the loaned securities during the period of the loan. The market value of the loaned securities is determined at the close of business of the fund and any additional required collateral is delivered to the fund on the next business day. If the borrower defaults on its obligation to return the securities loaned because of insolvency or other reasons, a fund could experience delays and costs in recovering the securities loaned or in gaining access to the collateral. Cash collateral is invested in the Fidelity Securities Lending Cash Central Fund. The value of loaned securities and cash collateral at period end are disclosed on the fund’s Statement of Assets and Liabilities. Security lending income represents the income earned on investing cash collateral, less fees and expenses associated with the loan, plus any premium payments that may be received on the loan of certain types of securities.
The fund is permitted to have bank borrowings for temporary or emergency purposes to fund shareholder redemptions. The fund has established borrowing arrangements with certain banks. The interest rate on the borrowings is the bank’s base rate, as revised from time to time. The average daily loan balance during the period for which loans were outstanding amounted to $5,536. The weighted average interest rate was 2.81% . At period end, there were no bank borrowings outstanding.
Many of the brokers with whom FMR places trades on behalf of the fund provided services to the fund in addition to trade execution. These services included payments of certain expenses on behalf of the fund totaling $1,161 for the period. In addition, through arrangements with each class’ transfer agent, credits realized as a result of uninvested cash balances were used to reduce the fund’s expenses. During the period, credits reduced each class’ transfer agent expense as noted in the table below.
| | | | | Transfer Agent |
| | | | | expense reduction |
| Class A | | $ | | 1 |
35 Annual Report
Notes to Financial Statements - continued
(Amounts in thousands except ratios)
9. Other.
The fund’s organizational documents provide former and current trustees and officers with a limited indemnification against liabilities arising in connection with the performance of their duties to the fund. In the normal course of business, the fund may also enter into contracts that provide general indemnifications. The fund’s maximum exposure under these arrangements is unknown as this would be dependent on future claims that may be made against the fund. The risk of material loss from such claims is considered remote.
| 10. Distributions to Shareholders. | | | | | | | | |
| |
| Distributions to shareholders of each class were as follows: | | | | | | |
| Years ended October 31, | | | | 2005 | | | | 2004 | | |
| From net investment income | | | | | | | | | | |
| Class A | | $ | | 302 | | $ | | | | 690 |
| Class T | | | | 731 | | | | | | 7,601 |
| Class B | | | | — | | | | | | 43 |
| Class C | | | | — | | | | | | 60 |
| Institutional Class | | | | 1,248 | | | | | | 839 |
| Total | | $ | | 2,281 | | $ | | | | 9,233 |
| From net realized gain | | | | | | | | | | |
| Class A | | $ | | 453 | | $ | | | | — |
| Class T | | | | 4,389 | | | | | | — |
| Institutional Class | | | | 749 | | | | | | — |
| Total | | $ | | 5,591 | | $ | | | | — |
| 11. Share Transactions. | | | | | | | | | | |
| |
| Transactions for each class of shares were as follows: | | | | | | | | |
| | | Shares | | | | | | Dollars | | |
| Years ended October 31, | | 2005 | | 2004 | | | | 2005 | | | | 2004 |
| Class A | | | | | | | | | | | | |
| Shares sold | | 3,732 | | 7,000 | | $ | | 65,178 | | $ | | 108,791 |
| Reinvestment of distributions | | 39 | | 42 | | | | 666 | | | | 626 |
| Shares redeemed | | (3,797) | | (4,530) | | | | (66,076) | | | | (70,180) |
| Net increase (decrease) | | (26) | | 2,512 | | $ | | (232) | | $ | | 39,237 |
| Class T | | | | | | | | | | | | |
| Shares sold | | 8,485 | | 24,989 | | $ | | 148,888 | | $ | | 393,254 |
| Reinvestment of distributions | | 288 | | 495 | | | | 5,033 | | | | 7,425 |
| Shares redeemed | | (50,965) | | (28,317) | | | | (894,992) | | | | (445,467) |
| Net increase (decrease) | | (42,192) | | (2,833) | | $ | | (741,071) | | $ | | (44,788) |
| Class B | | | | | | | | | | | | |
| Shares sold | | 210 | | 620 | | $ | | 3,515 | | $ | | 9,320 |
| Reinvestment of distributions | | — | | 3 | | | | — | | | | 38 |
| Shares redeemed | | (1,282) | | (1,179) | | | | (21,411) | | | | (17,557) |
| Net increase (decrease) | | (1,072) | | (556) | | $ | | (17,896) | | $ | | (8,199) |
| Class C | | | | | | | | | | | | |
| Shares sold | | 321 | | 667 | | $ | | 5,484 | | $ | | 10,090 |
| Reinvestment of distributions | | — | | 4 | | | | — | | | | 52 |
| Shares redeemed | | (822) | | (957) | | | | (14,006) | | | | (14,442) |
| Net increase (decrease) | | (501) | | (286) | | $ | | (8,522) | | $ | | (4,300) |
| Institutional Class | | | | | | | | | | | | |
| Shares sold | | 5,599 | | 9,569 | | $ | | 98,450 | | $ | | 152,454 |
| Reinvestment of distributions | | 61 | | 35 | | | | 1,066 | | | | 515 |
| Shares redeemed | | (2,356) | | (2,281) | | | | (41,753) | | | | (36,106) |
| Net increase (decrease) | | 3,304 | | 7,323 | | $ | | 57,763 | | $ | | 116,863 |
37 Annual Report
Report of Independent Registered Public Accounting Firm
To the Trustees of Fidelity Advisor Series VIII and the Shareholders of Fidelity Advisor Overseas Fund:
In our opinion, the accompanying statement of assets and liabilities, including the schedule of investments, and the related statements of operations and of changes in net assets and the financial highlights present fairly, in all material respects, the financial position of Fidelity Advisor Overseas Fund (a fund of Fidelity Advisor Series VIII) at October 31, 2005 and the results of its operations, the changes in its net assets and the financial highlights for the periods indicated, in conformity with accounting principles generally accepted in the United States of America. These financial statements and financial highlights (hereafter referred to as “financial statements”) are the responsibility of the Fidelity Advisor Overseas Fund’s management; our responsibility is to express an opinion on these financial statements based on our audits. We conducted our audits of these financial statements in accordance with the standards of the Public Company Accounting Oversight Board (United States). Those standards require that we plan and perform the audit to obtain reasonable assurance about whether the financial statements are free of material misstatement. An audit includes examining, on a test basis, evidence supporting the amounts and disclosures in the financial statements, assessing the accounting principles used and significant estimates made by management, and evaluating the overall financial statement presentation. We believe that our audits, which included confirmation of securities at October 31, 2005 by correspondence with the custodian and brokers, provide a reasonable basis for our opinion.
/s/ PricewaterhouseCoopers LLP
PricewaterhouseCoopers LLP
Boston, Massachusetts
December 13, 2005
|
Trustees and Officers
The Trustees, Members of the Advisory Board, and executive officers of the trust and fund, as applicable, are listed below. The Board of Trustees governs the fund and is responsible for protecting the interests of shareholders. The Trustees are experienced executives who meet periodically throughout the year to oversee the fund’s activities, review contractual arrangements with companies that provide services to the fund, and review the fund’s performance. Except for William O. McCoy, Stephen P. Jonas, and Kenneth L. Wolfe, each of the Trustees oversees 322 funds advised by FMR or an affiliate. Mr. McCoy oversees 324 funds advised by FMR or an affiliate. Mr. Jonas and Mr. Wolfe oversee 319 funds advised by FMR or an affiliate.
The Trustees hold office without limit in time except that (a) any Trustee may resign; (b) any Trustee may be removed by written instrument, signed by at least two-thirds of the number of Trustees prior to such removal; (c) any Trustee who requests to be retired or who has become incapacitated by illness or injury may be retired by written instrument signed by a majority of the other Trustees; and (d) any Trustee may be removed at any special meeting of shareholders by a two-thirds vote of the outstanding voting securities of the trust. Each Trustee who is not an interested person (as defined in the 1940 Act) (Independent Trustee), shall retire not later than the last day of the calendar year in which his or her 72nd birthday occurs. The Independent Trustees may waive this mandatory retirement age policy with respect to individual Trustees. The executive officers and Advisory Board Members hold office without limit in time, except that any officer and Advisory Board Member may resign or may be removed by a vote of a majority of the Trustees at any regular meeting or any special meeting of the Trustees. Except as indicated, each individual has held the office shown or other offices in the same company for the past five years.
The fund’s Statements of Additional Information (SAI) includes more information about the Trustees. To request a free copy, call Fidelity at 1-877-208-0098.
Correspondence intended for each Trustee who is an interested person may be sent to Fidelity Investments, 82 Devonshire Street, Boston, Massachusetts 02109.
| Name, Age; Principal Occupation |
| |
| Edward C. Johnson 3d (75)** |
| |
| Year of Election or Appointment: 1983 |
| Mr. Johnson is Chairman of the Board of Trustees. Mr. Johnson serves as |
| Chief Executive Officer, Chairman, and a Director of FMR Corp.; a Di- |
| rector and Chairman of the Board and of the Executive Committee of |
| FMR; Chairman and a Director of Fidelity Management & Research (Far |
| East) Inc.; Chairman and a Director of Fidelity Investments Money Man- |
| agement, Inc.; and Chairman (2001-present) and a Director |
| (2000-present) of FMR Co., Inc. |
39 Annual Report
Trustees and Officers - continued
| Name, Age; Principal Occupation |
| |
| Abigail P. Johnson (43)** |
| |
| Year of Election or Appointment: 2001 |
| Ms. Johnson serves as President of Fidelity Employer Services Company |
| (FESCO) (2005-present). She is President and a Director of Fidelity In- |
| vestments Money Management, Inc. (2001-present), FMR Co., Inc. |
| (2001-present), and a Director of FMR Corp. Previously, Ms. Johnson |
| served as President and a Director of FMR (2001-2005), Senior Vice |
| President of the Fidelity funds (2001-2005), and managed a number of |
| Fidelity funds. |
| |
| Stephen P. Jonas (52) |
| |
| Year of Election or Appointment: 2005 |
| Mr. Jonas is Senior Vice President of Advisor Overseas (2005-present). |
| He also serves as Senior Vice President of other Fidelity funds |
| (2005-present). Mr. Jonas is Executive Director of FMR (2005-present). |
| Previously, Mr. Jonas served as President of Fidelity Enterprise Opera- |
| tions and Risk Services (2004-2005), Chief Administrative Officer |
| (2002-2004), and Chief Financial Officer of FMR Co. (1998-2000). Mr. |
| Jonas has been with Fidelity Investments since 1987 and has held vari- |
| ous financial and management positions including Chief Financial Offi- |
| cer of FMR. In addition, he serves on the Boards of Boston Ballet |
| (2003-present) and Simmons College (2003-present). |
| |
| Robert L. Reynolds (53) |
| |
| Year of Election or Appointment: 2003 |
| Mr. Reynolds is a Director (2003-present) and Chief Operating Officer |
| (2002-present) of FMR Corp. He also serves on the Board at Fidelity |
| Investments Canada, Ltd. (2000-present). Previously, Mr. Reynolds |
| served as President of Fidelity Investments Institutional Retirement Group |
| (1996-2000). |
* Trustees have been determined to be “Interested Trustees” by virtue of, among other things, their affiliation with the trust or various entities under common control with FMR.
** Edward C. Johnson 3d, Trustee, is Abigail P. Johnson’s father.
Correspondence intended for each Independent Trustee (that is, the Trustees other than the Interested Trustees) may be sent to Fidelity Investments, P.O. Box 55235, Boston, Massachusetts 02205-5235.
| Name, Age; Principal Occupation |
| |
| Dennis J. Dirks (57) |
| |
| Year of Election or Appointment: 2005 |
| Prior to his retirement in May 2003, Mr. Dirks was Chief Operating |
| Officer and a member of the Board of The Depository Trust & Clearing |
| Corporation (DTCC) (1999-2003). He also served as President, Chief |
| Operating Officer, and Board member of The Depository Trust |
| Company (DTC) (1999-2003) and President and Board member of the |
| National Securities Clearing Corporation (NSCC) (1999-2003). In addi- |
| tion, Mr. Dirks served as Chief Executive Officer and Board member of |
| the Government Securities Clearing Corporation (2001-2003) and Chief |
| Executive Officer and Board member of the Mortgage-Backed Securities |
| Clearing Corporation (2001-2003). Mr. Dirks also serves as a Trustee of |
| Manhattan College (2005-present). |
| |
| Robert M. Gates (62) |
| |
| Year of Election or Appointment: 1997 |
| Dr. Gates is Vice Chairman of the Independent Trustees (2005-present). |
| Dr. Gates is President of Texas A&M University (2002-present). He was |
| Director of the Central Intelligence Agency (CIA) from 1991 to 1993. |
| From 1989 to 1991, Dr. Gates served as Assistant to the President of |
| the United States and Deputy National Security Advisor. Dr. Gates is a |
| Director of NACCO Industries, Inc. (mining and manufacturing), Parker |
| Drilling Co., Inc. (drilling and rental tools for the energy industry, |
| 2001-present), and Brinker International (restaurant management, |
| 2003-present). Previously, Dr. Gates served as a Director of LucasVarity |
| PLC (automotive components and diesel engines), a Director of TRW Inc. |
| (automotive, space, defense, and information technology), and Dean of |
| the George Bush School of Government and Public Service at Texas |
| A&M University (1999-2001). Dr. Gates also is a Trustee of the Forum |
| for International Policy. |
41 Annual Report
Trustees and Officers - continued
| Name, Age; Principal Occupation |
| |
| George H. Heilmeier (69) |
| |
| Year of Election or Appointment: 2004 |
| Dr. Heilmeier is Chairman Emeritus of Telcordia Technologies (commu- |
| nication software and systems), where prior to his retirement, he served |
| as company Chairman and Chief Executive Officer. He currently serves |
| on the Boards of Directors of The Mitre Corporation (systems engineer- |
| ing and information technology support for the government), and HRL |
| Laboratories (private research and development, 2004-present). He is |
| Chairman of the General Motors Science & Technology Advisory Board |
| and a Life Fellow of the Institute of Electrical and Electronics Engineers |
| (IEEE) (2000-present). Dr. Heilmeier is a member of the Defense Science |
| Board and the National Security Agency Advisory Board. He is also a |
| member of the National Academy of Engineering, the American |
| Academy of Arts and Sciences, and the Board of Overseers of the |
| School of Engineering and Applied Science of the University of Pennsyl- |
| vania. Previously, Dr. Heilmeier served as a Director of TRW Inc. (auto- |
| motive, space, defense, and information technology, 1992-2002), |
| Compaq (1994-2002), Automatic Data Processing, Inc. (ADP) |
| (technology-based business outsourcing, 1995-2002), INET Technolo- |
| �� gies Inc. (telecommunications network surveillance, 2001-2004), and |
| Teletech Holdings (customer management services). He is the recipient of |
| the 2005 Kyoto Prize in Advanced Technology for his invention of the |
| liquid display. |
| |
| Marie L. Knowles (59) |
| |
| Year of Election or Appointment: 2001 |
| Prior to Ms. Knowles’ retirement in June 2000, she served as Executive |
| Vice President and Chief Financial Officer of Atlantic Richfield Company |
| (ARCO) (diversified energy, 1996-2000). From 1993 to 1996, she was |
| a Senior Vice President of ARCO and President of ARCO Transportation |
| Company. She served as a Director of ARCO from 1996 to 1998. She |
| currently serves as a Director of Phelps Dodge Corporation (copper |
| mining and manufacturing) and McKesson Corporation (healthcare ser- |
| vice, 2002-present). Ms. Knowles is a Trustee of the Brookings Institution |
| and the Catalina Island Conservancy and also serves as a member of |
| the Advisory Board for the School of Engineering of the University of |
| Southern California. |
| Name, Age; Principal Occupation |
| |
| Ned C. Lautenbach (61) |
| |
| Year of Election or Appointment: 2000 |
| Mr. Lautenbach has been a partner of Clayton, Dubilier & Rice, Inc. |
| (private equity investment firm) since September 1998. Previously, Mr. |
| Lautenbach was with the International Business Machines Corporation |
| (IBM) from 1968 until his retirement in 1998. Mr. Lautenbach serves as |
| a Director of Italtel Holding S.p.A. (telecommunications (Milan, Italy), |
| 2004-present) and Eaton Corporation (diversified industrial) as well as |
| the Philharmonic Center for the Arts in Naples, Florida. He also is a |
| member of the Board of Trustees of Fairfield University (2005-present), |
| as well as a member of the Council on Foreign Relations. |
| |
| Marvin L. Mann (72) |
| |
| Year of Election or Appointment: 1993 |
| Mr. Mann is Chairman of the Independent Trustees (2001-present). He is |
| Chairman Emeritus of Lexmark International, Inc. (computer |
| peripherals), where he served as CEO until April 1998, retired as |
| Chairman May 1999, and remains a member of the Board. Prior to |
| 1991, he held the positions of Vice President of International Business |
| Machines Corporation (IBM) and President and General Manager of |
| various IBM divisions and subsidiaries. He is a member of the Executive |
| Committee of the Independent Director’s Council of the Investment Com- |
| pany Institute. In addition, Mr. Mann is a member of the President’s |
| Cabinet at the University of Alabama and the Board of Visitors of the |
| Culverhouse College of Commerce and Business Administration at the |
| University of Alabama. |
| |
| William O. McCoy (72) |
| |
| Year of Election or Appointment: 1997 |
| Prior to his retirement in December 1994, Mr. McCoy was Vice Chair- |
| man of the Board of BellSouth Corporation (telecommunications) and |
| President of BellSouth Enterprises. He is currently a Director of Liberty |
| Corporation (holding company), Duke Realty Corporation (real estate), |
| and Progress Energy, Inc. (electric utility). He is also a partner of Frank- |
| lin Street Partners (private investment management firm) and a member |
| of the Research Triangle Foundation Board. In addition, Mr. McCoy |
| served as the Interim Chancellor (1999-2000) and a member of the |
| Board of Visitors for the University of North Carolina at Chapel Hill and |
| currently serves on the Board of Directors of the University of North |
| Carolina Health Care System and the Board of Visitors of the Kenan- |
| Flagler Business School (University of North Carolina at Chapel Hill). He |
| also served as Vice President of Finance for the University of North Car- |
| olina (16-school system). |
43 Annual Report
Trustees and Officers - continued
| Name, Age; Principal Occupation |
| |
| Cornelia M. Small (61) |
| |
| Year of Election or Appointment: 2005 |
| Ms. Small is a member (2000-present) and Chairperson (2002-present) |
| of the Investment Committee, and a member (2002-present) of the |
| Board of Trustees of Smith College. Previously, she served as Chief In- |
| vestment Officer (1999-2000), Director of Global Equity Investments |
| (1996-1999), and a member of the Board of Directors of Scudder, |
| Stevens & Clark (1990-1997) and Scudder Kemper Investments |
| (1997-1998). In addition, Ms. Small served as Co-Chair (2000-2003) |
| of the Annual Fund for the Fletcher School of Law and Diplomacy. |
| |
| William S. Stavropoulos (66) |
| |
| Year of Election or Appointment:2001 |
| Mr. Stavropoulos is Chairman of the Board (2000-present) and a Mem- |
| ber of the Board of Directors of The Dow Chemical Company. Since |
| joining The Dow Chemical Company in 1967, Mr. Stavropoulos served |
| in numerous senior management positions, including President |
| (1993-2000; 2002-2003), CEO (1995-2000; 2002-2004), and Chair- |
| man of the Executive Committee (2000-2004). Currently, he is a Direc- |
| tor of NCR Corporation (data warehousing and technology solutions), |
| BellSouth Corporation (telecommunications), Chemical Financial Corpo- |
| ration, Maersk Inc. (industrial conglomerate, 2002-present), and Metal- |
| mark Capital (private equity investment firm, 2005-present). He also |
| serves as a member of the Board of Trustees of the American Enterprise |
| Institute for Public Policy Research. In addition, Mr. Stavropoulos is a |
| member of The Business Council, J.P. Morgan International Council and |
| the University of Notre Dame Advisory Council for the College of |
| Science. |
| |
| Kenneth L. Wolfe (66) |
| |
| Year of Election or Appointment: 2005 |
| Mr. Wolfe also serves as a Trustee (2005-present) or Member of the |
| Advisory Board (2004-present) of other investment companies advised |
| by FMR. Prior to his retirement in 2001, Mr. Wolfe was Chairman and |
| Chief Executive Officer of Hershey Foods Corporation (1993-2001). He |
| currently serves as a member of the boards of Adelphia Communica- |
| tions Corporation (2003-present), Bausch & Lomb, Inc., and Revlon Inc. |
| (2004-present). |
Advisory Board Members and Executive Officers:
Correspondence intended for Mr. Gamper may be sent to Fidelity Investments, P.O. Box 55235, Boston, Massachusetts 02205-5235. Correspondence intended for each executive officer and Mr. Lynch may be sent to Fidelity Investments, 82 Devonshire Street, Boston, Massachusetts 02109.
| Name, Age; Principal Occupation |
| |
| Albert R. Gamper, Jr. (63) |
| |
| Year of Election or Appointment: 2005 |
| Member of the Advisory Board of Fidelity Advisor Series VIII Trust. Prior |
| to his retirement in December 2004, Mr. Gamper served as Chairman |
| of the Board of CIT Group Inc. (commercial finance). During his tenure |
| with CIT Group Inc. Mr. Gamper served in numerous senior manage- |
| ment positions, including Chairman (1987-1989; 1999-2001; |
| 2002-2004), Chief Executive Officer (1987-2004), and President |
| (1989-2002). He currently serves as a member of the Board of Direc- |
| tors of Public Service Enterprise Group (utilities, 2001-present), Chair- |
| man of the Board of Governors, Rutgers University (2004-present), and |
| Chairman of the Board of Saint Barnabas Health Care System. |
| |
| Peter S. Lynch (61) |
| |
| Year of Election or Appointment: 2003 |
| Member of the Advisory Board of Fidelity Advisor Series VIII Trust. Vice |
| Chairman and a Director of FMR, and Vice Chairman (2001-present) |
| and a Director (2000-present) of FMR Co., Inc. Previously, Mr. Lynch |
| served as a Trustee of the Fidelity funds (1990-2003). In addition, he |
| serves as a Trustee of Boston College, Massachusetts Eye & Ear |
| Infirmary, Historic Deerfield, John F. Kennedy Library, and the Museum |
| of Fine Arts of Boston. |
| |
| Dwight D. Churchill (51) |
| |
| Year of Election or Appointment: 2005 |
| Vice President of Advisor Overseas. Mr. Churchill also serves as Vice |
| President of certain Equity Funds (2005-present) and certain High In- |
| come Funds (2005-present). Previously, he served as Head of Fidelity’s |
| Fixed-Income Division (2000-2005), Vice President of Fidelity’s Money |
| Market Funds (2000-2005), Vice President of Fidelity’s Bond Funds, and |
| Senior Vice President of FIMM (2000) and FMR. Mr. Churchill joined |
| Fidelity in 1993 as Vice President and Group Leader of Taxable Fixed- |
| Income Investments. |
45 Annual Report
Trustees and Officers - continued
| Name, Age; Principal Occupation |
| |
| Eric D. Roiter (56) |
| |
| Year of Election or Appointment: 1998 |
| Secretary of Advisor Overseas. He also serves as Secretary of other |
| Fidelity funds; Vice President, General Counsel, and Secretary of FMR |
| Co., Inc. (2001-present) and FMR; Assistant Secretary of Fidelity Man- |
| agement & Research (U.K.) Inc. (2001-present), Fidelity Management & |
| Research (Far East) Inc. (2001-present), and Fidelity Investments Money |
| Management, Inc. (2001-present). Mr. Roiter is an Adjunct Member, |
| Faculty of Law, at Boston College Law School (2003-present). Previously, |
| Mr. Roiter served as Vice President and Secretary of Fidelity Distributors |
| Corporation (FDC) (1998-2005). |
| |
| Stuart Fross (46) |
| |
| Year of Election or Appointment: 2003 |
| Assistant Secretary of Advisor Overseas. Mr. Fross also serves as Assis- |
| tant Secretary of other Fidelity funds (2003-present), Vice President and |
| Secretary of FDC (2005-present), and is an employee of FMR. |
| |
| Christine Reynolds (47) |
| |
| Year of Election or Appointment: 2004 |
| President, Treasurer, and Anti-Money Laundering (AML) officer of Advi- |
| sor Overseas. Ms. Reynolds also serves as President, Treasurer, and |
| AML officer of other Fidelity funds (2004) and is a Vice President (2003) |
| and an employee (2002) of FMR. Before joining Fidelity Investments, |
| Ms. Reynolds worked at PricewaterhouseCoopers LLP (PwC) |
| (1980-2002), where she was most recently an audit partner with PwC’s |
| investment management practice. |
| |
| Paul M. Murphy (58) |
| |
| Year of Election or Appointment: 2005 |
| Chief Financial Officer of Advisor Diversified International. Mr. Murphy |
| also serves as Chief Financial Officer of other Fidelity funds |
| (2005-present). He also serves as Senior Vice President of Fidelity Pri- |
| cing and Cash Management Services Group (FPCMS). |
| |
| Kenneth A. Rathgeber (58) |
| |
| Year of Election or Appointment: 2004 |
| Chief Compliance Officer of Advisor Overseas. Mr. Rathgeber also |
| serves as Chief Compliance Officer of other Fidelity funds (2004) and |
| Executive Vice President of Risk Oversight for Fidelity Investments |
| (2002). Previously, he served as Executive Vice President and Chief Op- |
| erating Officer for Fidelity Investments Institutional Services Company, |
| Inc. (1998-2002). |
| Name, Age; Principal Occupation |
| |
| John R. Hebble (47) |
| |
| Year of Election or Appointment: 2003 |
| Deputy Treasurer of Advisor Overseas. Mr. Hebble also serves as |
| Deputy Treasurer of other Fidelity funds (2003), and is an employee of |
| FMR. Before joining Fidelity Investments, Mr. Hebble worked at Deutsche |
| Asset Management where he served as Director of Fund Accounting |
| (2002-2003) and Assistant Treasurer of the Scudder Funds |
| (1998-2003). |
| |
| Bryan A. Mehrmann (44) |
| |
| Year of Election or Appointment: 2005 |
| Deputy Treasurer of Advisor Overseas. Mr. Mehrmann also serves as |
| Deputy Treasurer of other Fidelity funds (2005-present) and is an em- |
| ployee of FMR. Previously, Mr. Mehrmann served as Vice President of |
| Fidelity Investments Institutional Services Group (FIIS)/Fidelity Investments |
| Institutional Operations Corporation, Inc. (FIIOC) Client Services |
| (1998-2004). |
| |
| Kimberley H. Monasterio (41) |
| |
| Year of Election or Appointment: 2004 |
| Deputy Treasurer of Advisor Overseas. Ms. Monasterio also serves as |
| Deputy Treasurer of other Fidelity funds (2004) and is an employee of |
| FMR (2004). Before joining Fidelity Investments, Ms. Monasterio served |
| as Treasurer (2000-2004) and Chief Financial Officer (2002-2004) of |
| the Franklin Templeton Funds and Senior Vice President of Franklin Tem- |
| pleton Services, LLC (2000-2004). |
| |
| Kenneth B. Robins (36) |
| |
| Year of Election or Appointment: 2005 |
| Deputy Treasurer of Advisor Overseas. Mr. Robins also serves as Deputy |
| Treasurer of other Fidelity funds (2005-present) and is an employee of |
| FMR (2004-present). Before joining Fidelity Investments, Mr. Robins |
| worked at KPMG LLP, where he was a partner in KPMG’s department of |
| professional practice (2002-2004) and a Senior Manager |
| (1999-2000). In addition, Mr. Robins served as Assistant Chief Accoun- |
| tant, United States Securities and Exchange Commission (2000-2002). |
| |
| Robert G. Byrnes (38) |
| |
| Year of Election or Appointment: 2005 |
| Assistant Treasurer of Advisor Overseas. Mr. Byrnes also serves as As- |
| sistant Treasurer of other Fidelity funds (2005-present) and is an em- |
| ployee of FMR (2005-present). Previously, Mr. Byrnes served as Vice |
| President of FPCMS (2003-2005). Before joining Fidelity Investments, |
| Mr. Byrnes worked at Deutsche Asset Management where he served as |
| Vice President of the Investment Operations Group (2000-2003). |
47 Annual Report
Trustees and Officers - continued
| Name, Age; Principal Occupation |
| |
| John H. Costello (59) |
| |
| Year of Election or Appointment: 1986 |
| Assistant Treasurer of Advisor Overseas. Mr. Costello also serves as |
| Assistant Treasurer of other Fidelity funds and is an employee of FMR. |
| |
| Peter L. Lydecker (51) |
| |
| Year of Election or Appointment: 2004 |
| Assistant Treasurer of Advisor Overseas. Mr. Lydecker also serves as |
| Assistant Treasurer of other Fidelity funds (2004) and is an employee of |
| FMR. |
| |
| Mark Osterheld (50) |
| |
| Year of Election or Appointment: 2002 |
| Assistant Treasurer of Advisor Overseas. Mr. Osterheld also serves as |
| Assistant Treasurer of other Fidelity funds (2002) and is an employee of |
| FMR. |
| |
| Gary W. Ryan (47) |
| |
| Year of Election or Appointment: 2005 |
| Assistant Treasurer of Advisor Overseas. Mr. Ryan also serves as Assis- |
| tant Treasurer of other Fidelity funds (2005-present) and is an employee |
| of FMR (2005-present). Previously, Mr. Ryan served as Vice President of |
| Fund Reporting in FPCMS (1999-2005). |
| |
| Salvatore Schiavone (39) |
| |
| Year of Election or Appointment: 2005 |
| Assistant Treasurer of Advisor Overseas. Mr. Schiavone also serves as |
| Assistant Treasurer of other Fidelity funds (2005-present) and is an em- |
| ployee of FMR (2005-present). Before joining Fidelity Investments, Mr. |
| Schiavone worked at Deutsche Asset Management, where he most re- |
| cently served as Assistant Treasurer (2003-2005) of the Scudder Funds |
| and Vice President and Head of Fund Reporting (1996-2003). |
The Board of Trustees of Advisor Overseas Fund voted to pay to shareholders of record at the opening of business on record date, the following distributions per share derived from capital gains realized from sales of portfolio securities, and dividends derived from net investment income:
| | | Pay Date | | Record Date | | Dividends | | Capital Gains |
| Institutional Class | | 12/05/05 | | 12/02/05 | | $.214 | | $.30 |
The fund hereby designates as capital gain dividends: For dividends with respect to the taxable year ended October 31, 2005, $8,404,026, or, if subsequently determined to be different, the net capital gain of such year, and for dividends with respect to the taxable year ended October 31, 2004, $0, or, if subsequently determined to be different, the excess of: (a) the net capital gain of such year, over (b) amounts previously designated as capital gain dividends with respect to such year.
Institutional Class designates 100 % of the dividend distributed during the fiscal year as amounts which may be taken into account as a dividend for purposes of the maximum rate under section 1(h)(11) of the Internal Revenue Code.
The amounts per share which represent income derived from sources within, and taxes paid to, foreign countries or possessions of the United States are as follows:
| | | Pay Date | | Income | | Taxes |
| Institutional Class | | 12/06/04 | | $.177 | | $.017 |
The fund will notify shareholders in January 2006 of amounts for use in preparing 2005 income tax returns.
49 Annual Report
Board Approval of Investment Advisory Contracts and Management Fees
Advisor Overseas Fund
Each year, typically in July, the Board of Trustees, including the independent Trustees (together, the Board), votes on the renewal of the management contract and sub-advisory agreements (together, the Advisory Contracts) for the fund. The Board, assisted by the advice of fund counsel and independent Trustees’ counsel, requests and considers a broad range of information throughout the year.
The Board meets regularly each month except August and takes into account throughout the year matters bearing on Advisory Contracts. The Board, acting directly and through its separate committees, considers at each of its meetings factors that are relevant to the annual renewal of the fund’s Advisory Contracts, including the services and support provided to the fund and its shareholders by Fidelity. At the time of the renewal, the Board had 11 standing committees, each composed of independent Trustees with varying backgrounds, to which the Board has assigned specific subject matter responsibilities in order to enhance effective decision-making by the Board. Each committee has adopted a written charter outlining the structure and purposes of the committee. One such committee, the Equity Contract Committee, meets periodically during the first six months of each year and as necessary to consider matters specifically related to the annual renewal of Advisory Contracts. The committee requests and receives information on, and makes recommendations to the independent Trustees concerning, the approval and annual review of the Advisory Contracts.
At its July 2005 meeting, the Board of Trustees, including the independent Trustees, unanimously determined to renew the Advisory Contracts for the fund. In reaching its determination, the Board considered all factors it believed relevant, including (1) the nature, extent, and quality of the services to be provided to the fund and its shareholders by Fidelity (including the investment performance of the fund); (2) the competitiveness of the management fee and total expenses of the fund; (3) the total costs of the services to be provided by and the profits to be realized by the investment adviser and its affiliates from the relationship with the fund; (4) the extent to which economies of scale would be realized as the fund grows; and (5) whether fee levels reflect these economies of scale, if any, for the benefit of fund shareholders.
In determining whether to renew the Advisory Contracts for the fund, the Board ultimately reached a determination, with the assistance of fund counsel and independent Trustees’ counsel, that the renewal of the Advisory Contracts and the compensation to be received by Fidelity under the management contract is consistent with Fidelity’s fiduciary duty under applicable law. In addition to evaluating the specific factors noted above, the Board, in reaching its determination, is aware that shareholders in the fund have a broad range of investment choices available to them, including a wide choice among mutual funds offered by competitors to Fidelity, and that the fund’s shareholders, with the opportunity to review and weigh the disclosure provided by the fund in its
prospectus and other public disclosures, have chosen to invest in this fund, managed by Fidelity.
Nature, Extent, and Quality of Services Provided by Fidelity. The Board considered staffing within the investment adviser, FMR, and the sub-advisers (together, the Investment Advisers), including the background of the fund’s portfolio manager and the fund’s investment objective and discipline. The independent Trustees also had discussions with senior management of Fidelity’s investment operations and investment groups. The Board considered the structure of the portfolio manager compensation program and whether this structure provides appropriate incentives.
Fidelity Resources Dedicated to Investment Management and Support Services. The Board reviewed the size, education, and experience of the Investment Advisers’ investment staff, their use of technology, and the Investment Advisers’ approach to recruiting, training, and retaining portfolio managers and other research, advisory, and management personnel. The Board considered Fidelity’s extensive global research capabilities that enable the Investment Advisers to aggregate data from various sources in an effort to produce positive investment results. The Board noted that Fidelity’s analysts have access to a variety of technological tools that enable them to perform both fundamental and quantitative analysis and to specialize in various disciplines. The Board also considered that Fidelity’s portfolio managers and analysts have access to daily portfolio attribution that allows for monitoring of a fund’s portfolio, as well as an electronic communication system that provides immediate real-time access to research concerning issuers and credit enhancers.
Shareholder and Administrative Services. The Board considered the nature, extent, quality, and cost of administrative, distribution, and shareholder services performed by the Investment Advisers and their affiliates under the Advisory Contracts and under separate agreements covering transfer agency, pricing and bookkeeping, and securities lending services for the fund. The Board also considered the nature and extent of the Investment Advisers’ supervision of third party service providers, principally custodians and subcustodians. The Board reviewed the allocation of fund brokerage, including allocations to brokers affiliated with the Investment Advisers, the use of brokerage commissions to pay fund expenses, and the use of “soft” commission dollars to pay for research services. The Board also considered that Fidelity voluntarily decided in 2004 to stop using “soft” commission dollars to pay for market data and, instead, to pay for that data out of its own resources. The Board also considered the resources devoted to, and the record of compliance with, the fund’s compliance policies and procedures.
The Board noted that the growth of fund assets across the complex allows Fidelity to reinvest in the development of services designed to enhance the value or convenience of the Fidelity funds as investment vehicles. These services include 24-hour access to
51 Annual Report
Board Approval of Investment Advisory Contracts and Management Fees - continued
account information and market information through phone representatives and over the Internet, and investor education materials and asset allocation tools.
Investment in a Large Fund Family. The Board considered the benefits to shareholders of investing in a Fidelity fund, including the benefits of investing in a fund that is part of a large family of funds offering a variety of investment disciplines and providing for a large variety of mutual fund investor services. For example, fund shareholders are offered the privilege of exchanging shares of the fund for shares of other Fidelity funds, as set forth in the fund’s prospectus, without paying an additional sales charge. The Board noted that, since the last Advisory Contract renewals in July 2004, Fidelity has taken a number of actions that benefited particular funds, including (i) voluntarily deciding in 2004 to stop using “soft” commission dollars to pay for market data and, instead, to pay for that data out of its own resources, (ii) contractually agreeing to impose management fee reductions and expense limitations on its five Spartan stock index funds and its stock index fund available through variable insurance products, (iii) contractually agreeing to eliminate the management fees on the Fidelity Freedom Funds and the Fidelity Advisor Freedom Funds, (iv) contractually agreeing to reduce the management fees on most of its investment-grade taxable bond funds, and (v) contractually agreeing to impose expense limitations on its retail and Spartan investment-grade taxable bond funds.
Investment Performance and Compliance. The Board considered whether the fund has operated within its investment objective, as well as its record of compliance with its investment restrictions. It also reviewed the fund’s absolute investment performance for each class, as well as the fund’s relative investment performance for each class measured against (i) a broad-based securities market index, and (ii) a peer group of mutual funds deemed appropriate by the Board over multiple periods. The following charts considered by the Board show, over the one-, three-, and five-year periods ended December 31, 2004, the returns of Class C and Institutional Class of the fund, the returns of a broad-based securities market index (“benchmark”), and a range of returns of a peer group of mutual funds identified by Lipper Inc. as having an investment objective similar to that of the fund. The returns of Class C and Institutional Class represent the performance of classes with the highest and lowest 12b-1 fees, respectively (not necessarily with the highest and lowest total expenses). The box within each chart shows the 25th percentile return (bottom of box) and the 75th percentile return (top of box) of the Lipper peer group. Returns shown above the box are in the first quartile and returns shown below the box are in the fourth quartile. The percentage beaten numbers noted below each chart correspond to the percentile box and represent the percentage of funds in the Lipper peer group whose performance was equal to or lower than that of the class indicated.

The Board reviewed the fund’s relative investment performance against its Lipper peer group and stated that the performance of Institutional Class of the fund was in the fourth quartile for the one-year period and the third quartile for the three- and five-year periods. The Board also stated that the relative investment performance of the fund was lower than its benchmark over time. The Board considered that the variations in performance among the fund’s classes reflect the variations in class expenses, which result in lower performance for higher expense classes. The Board discussed with FMR actions to be taken by FMR to improve the fund’s disappointing performance.
The Board also considered that the fund’s management fee is subject to upward or downward adjustment depending upon whether, and to what extent, the fund’s investment performance for the performance period exceeds, or is exceeded by, the record (over the same period) of a Board-approved performance adjustment index. The Board realizes that the performance adjustment provides FMR with a strong economic incentive to seek to achieve superior performance for the fund’s shareholders and helps to more closely align the interests of FMR and the fund’s shareholders.
The Board has had thorough discussions with FMR throughout the year about the Board’s and FMR’s concerns about equity research, equity fund performance, and compliance with internal policies governing gifts and entertainment. FMR has taken steps that it believes will refocus and strengthen equity research and equity portfolio management and compliance. The Board noted with favor FMR’s recent reorganization of its senior management team and FMR’s plans to dedicate additional resources to investment research, and participated in the process that led to those changes.
53 Annual Report
Board Approval of Investment Advisory Contracts and Management Fees - continued
Based on its review, and giving particular weight to the nature and quality of the resources dedicated by the Investment Advisers to maintain and improve relative performance, the Board concluded that the nature, extent, and quality of the services provided by Fidelity will benefit the fund’s shareholders, particularly in light of the Board’s view that the fund’s shareholders benefit from investing in a fund that is part of a large family of funds offering a variety of investment disciplines and services.
Competitiveness of Management Fee and Total Fund Expenses. The Board considered the fund’s management fee and total expenses compared to “mapped groups” of competitive funds and classes. Fidelity creates “mapped groups” by combining similar Lipper investment objective categories that have comparable management fee characteristics. Combining Lipper investment objective categories aids the Board’s management fee and total expense comparisons by broadening the competitive group used for comparison and by reducing the number of universes to which various Fidelity funds are compared.
The Board considered two proprietary management fee comparisons for the 12-month periods shown in the chart below. The group of Lipper funds used by the Board for management fee comparisons is referred to below as the “Total Mapped Group” and, for the reasons explained above, is broader than the Lipper peer group used by the Board for performance comparisons. The Total Mapped Group comparison focuses on a fund’s standing relative to the total universe of comparable funds available to investors, in terms of gross management fees before expense reimbursements or caps. “TMG %” represents the percentage of funds in the Total Mapped Group that had management fees that were lower than the fund’s. For example, a TMG % of 21% means that 79% of the funds in the Total Mapped Group had higher management fees than the fund. The “Asset-Size Peer Group” (ASPG) comparison focuses on a fund’s standing relative to non-Fidelity funds similar in size to the fund within the Total Mapped Group. The ASPG represents at least 15% of the funds in the Total Mapped Group with comparable asset size and management fee characteristics, subject to a minimum of 50 funds (or all funds in the Total Mapped Group if fewer than 50). Additional information, such as the ASPG quartile (“quadrant”) in which the fund’s management fee ranked and the impact of the fund’s performance adjustment, is also included in the chart and considered by the Board.
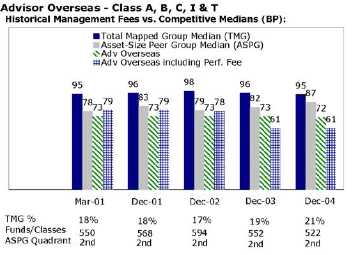
The Board noted that the fund’s management fee ranked below the median of its Total Mapped Group and below the median of its ASPG for 2004. The Board also noted the effect of the fund’s negative performance adjustment on the fund’s management fee ranking.
Based on its review, the Board concluded that the fund’s management fee was fair and reasonable in light of the services that the fund receives and the other factors considered.
In its review of each class’s total expenses, the Board considered the fund’s management fee as well as other fund or class expenses, as applicable, such as transfer agent fees, pricing and bookkeeping fees, fund-paid 12b-1 fees, and custodial, legal, and audit fees. The Board also noted the effects of any waivers and reimbursements on fees and expenses, as well as the fund’s negative performance adjustment. As part of its review, the Board also considered current and historical total expenses of each class of the fund compared to competitive fund median expenses. Each class of the fund is compared to those funds and classes in the Total Mapped Group (used by the Board for management fee comparisons) that have a similar sales load structure.
The Board noted that each class’s total expenses ranked below its competitive median for 2004.
In its review of total expenses, the Board also considered Fidelity fee structures and other information on clients that FMR and its affiliates service in other competitive markets, such as other mutual funds advised or subadvised by FMR or its affiliates, pension plan clients, and other institutional clients.
55 Annual Report
Board Approval of Investment Advisory Contracts and Management Fees - continued
Based on its review, the Board concluded that the total expenses for each class of the fund were reasonable in light of the services that the fund and its shareholders receive and the other factors considered.
Costs of the Services and Profitability. The Board considered the revenues earned and the expenses incurred by Fidelity in conducting the business of developing, marketing, distributing, managing, administering and servicing the fund and its shareholders. The Board also considered the level of Fidelity’s profits in respect of all the Fidelity funds.
On an annual basis, FMR presents to the Board Fidelity’s profitability for the fund. Fidelity calculates the profitability for each fund, as well as aggregate profitability for groups of Fidelity funds and all Fidelity funds, using a series of detailed revenue and cost allocation methodologies which originate with the audited books and records of Fidelity. The Audit Committee of the Board reviews any significant changes from the prior year’s methodologies.
PricewaterhouseCoopers LLP (PwC), independent registered accounting firm and auditor to Fidelity and certain Fidelity funds, has been engaged annually by the Board as part of the Board’s assessment of the results of Fidelity’s profitability analysis. PwC’s engagement includes the review and assessment of Fidelity’s methodologies used in determining the revenues and expenses attributable to Fidelity’s mutual fund business, and completion of agreed-upon procedures surrounding the mathematical accuracy of fund profitability and its conformity to allocation methodologies. After considering PwC’s reports issued under the engagement and information provided by Fidelity, the Board believes that while other allocation methods may also be reasonable, Fidelity’s profitability methodologies are reasonable in all material respects.
The Board has also reviewed Fidelity’s non-fund businesses and any fall-out benefits related to the mutual fund business as well as cases where Fidelity’s affiliates may benefit from or be related to the fund’s business. In addition, a special committee of the Board reviewed services provided to Fidelity by its affiliates and determined that the fees that Fidelity paid for such services were reasonable.
The Board considered the costs of the services provided by and the profits realized by Fidelity in connection with the operation of the fund and determined that the amount of profit is a fair entrepreneurial profit for the management of the fund.
Economies of Scale. The Board considered whether there have been economies of scale in respect of the management of the Fidelity funds, whether the Fidelity funds (including the fund) have appropriately benefited from any such economies of scale, and whether there is potential for realization of any further economies of scale. The Board considered the extent to which the fund will benefit from economies of scale through increased services to the fund, through waivers or reimbursements, or through fee or
expense reductions, including reductions that occur through operation of the transfer agent agreement. The transfer agent fee varies in part based on the number of accounts in the fund. If the number of accounts decreases or the average account size increases, the overall transfer agent fee rate decreases.
The Board recognized that the fund’s management contract incorporates a “group fee” structure, which provides for lower fee rates as total fund assets under FMR’s management increase, and for higher fee rates as total fund assets under FMR’s management decrease. The Board considered that the group fee is designed to deliver the benefits of economies of scale to fund shareholders when total fund assets increase, even if assets of any particular fund are unchanged or have declined, because some portion of Fidelity’s costs are attributable to services provided to all Fidelity funds, and all funds benefit if those costs can be allocated among more assets. The Board concluded that, given the group fee structure, fund shareholders will achieve a certain level of economies of scale as assets under FMR’s management increase at the fund complex level, regardless of whether Fidelity achieves any such economies of scale.
The Board further concluded that any potential economies of scale are being shared between fund shareholders and Fidelity in an appropriate manner.
Additional Information Requested by the Board. In order to develop fully the factual basis for consideration of the Advisory Contracts, the Board requested additional information regarding (i) equity fund transfer agency fees; (ii) Fidelity’s fund profitability methodology and the impact of various changes in the methodology over time; (iii) benefits to shareholders from economies of scale; (iv) composition and characteristics of various fund and industry data used in comparisons; and (v) compensation of portfolio managers and research analysts.
Based on its evaluation of all of the conclusions noted above, and after considering all material factors, the Board ultimately concluded that the existing advisory fee structures are fair and reasonable, and that the fund’s existing Advisory Contracts should be renewed.
57 Annual Report
59 Annual Report
61 Annual Report
63 Annual Report
Investment Adviser
Fidelity Management & Research Company
Boston, MA
Investment Sub-Advisers
FMR Co., Inc.
Fidelity Management & Research
(U.K.) Inc.
Fidelity Management & Research
(Far East) Inc.
Fidelity International
Investment Advisors
Fidelity Investments Japan Limited
Fidelity International Investment
Advisors (U.K.) Limited
General Distributor
Fidelity Distributors Corporation
Boston, MA
Transfer and Service Agents
Fidelity Investments Institutional
Operations Company, Inc.
Boston, MA
Fidelity Service Company, Inc.
Boston, MA
Custodian
JPMorgan Chase Bank
New York, NY
|


Fidelity® Advisor
Value Leaders
Fund - Class A, Class T, Class B and Class C
Annual Report October 31, 2005

Contents
| Chairman’s Message | | 4 | | Ned Johnson’s message to shareholders. |
| Performance | | 6 | | How the fund has done over time. |
| Management’s Discussion | | 8 | | The manager’s review of fund |
| | | | | performance, strategy and outlook. |
| Shareholder Expense | | 9 | | An example of shareholder expenses. |
| Example | | | | |
| Investment Changes | | 11 | | A summary of major shifts in the fund’s |
| | | | | investments over the past six months. |
| Investments | | 12 | | A complete list of the fund’s investments |
| | | | | with their market values. |
| Financial Statements | | 23 | | Statements of assets and liabilities, |
| | | | | operations, and changes in net assets, as |
| | | | | well as financial highlights. |
| Notes | | 32 | | Notes to the financial statements. |
| Report of Independent | | 41 | | |
| Registered Public | | | | |
| Accounting Firm | | | | |
| Trustees and Officers | | 42 | | |
| Distributions | | 52 | | |
| Board Approval of | | 53 | | |
| Investment Advisory | | | | |
| Contracts and | | | | |
| Management Fees | | | | |
To view a fund’s proxy voting guidelines and proxy voting record for the 12-month period ended June 30, visit www.fidelity.com/proxyvotingresults or visit the Securities and Exchange Commission’s (SEC) web site at www.sec.gov. You may also call 1-877-208-0098 to request a free copy of the proxy voting guidelines.
Standard & Poor’s, S&P and S&P 500 are registered service marks of The McGraw-Hill Companies, Inc. and have been licensed for use by Fidelity Distributors Corporation.
Other third party marks appearing herein are the property of their respective owners.
All other marks appearing herein are registered or unregistered trademarks or service marks of FMR Corp. or an affiliated company.
Annual Report 2
This report and the financial statements contained herein are submitted for the general information of the shareholders of the fund. This report is not authorized for distribution to prospective investors in the fund unless preceded or accompanied by an effective prospectus.
A fund files its complete schedule of portfolio holdings with the SEC for the first and third quarters of each fiscal year on Form N-Q. Forms N-Q are available on the SEC’s web site at http://www.sec.gov. A fund’s Forms N-Q may be reviewed and copied at the SEC’s Public Reference Room in Washington, DC. Information regarding the operation of the SEC’s Public Reference Room may be obtained by calling 1-800-SEC-0330. For a complete list of a fund’s portfolio holdings, view the most recent quarterly holdings report, semiannual report, or annual report on Fidelity’s web site at http://www.advisor.fidelity.com.
NOT FDIC INSURED · MAY LOSE VALUE · NO BANK GUARANTEE
Neither the fund nor Fidelity Distributors Corporation is a bank.
3 Annual Report
Chairman’s Message
(Photograph of Edward C. Johnson 3d)
Dear Shareholder:
During the past year or so, much has been reported about the mutual fund industry, and much of it has been more critical than I believe is warranted. Allegations that some companies have been less than forthright with their shareholders have cast a shadow on the entire industry. I continue to find these reports disturbing, and assert that they do not create an accurate picture of the industry overall. Therefore, I would like to remind everyone where Fidelity stands on these issues. I will say two things specifically regarding allegations that some mutual fund companies were in violation of the Securities and Exchange Commission’s forward pricing rules or were involved in so-called “market timing” activities.
First, Fidelity has no agreements that permit customers who buy fund shares after 4 p.m. to obtain the 4 p.m. price. This is not a new policy. This is not to say that someone could not deceive the company through fraudulent acts. However, we are extremely diligent in preventing fraud from occurring in this manner — and in every other. But I underscore again that Fidelity has no so-called “agreements” that sanction illegal practices.
Second, Fidelity continues to stand on record, as we have for years, in opposition to predatory short-term trading that adversely affects shareholders in a mutual fund. Back in the 1980s, we initiated a fee — which is returned to the fund and, therefore, to investors — to discourage this activity. Further, we took the lead several years ago in developing a Fair Value Pricing Policy to prevent market timing on foreign securities in our funds. I am confident we will find other ways to make it more difficult for predatory traders to operate. However, this will only be achieved through close cooperation among regulators, legislators and the industry.
Yes, there have been unfortunate instances of unethical and illegal activity within the mutual fund industry from time to time. That is true of any industry. When this occurs, confessed or convicted offenders should be dealt with appropriately. But we are still concerned about the risk of over-regulation and the quick application of simplistic solutions to intricate problems. Every system can be improved, and we support and applaud well thought out improvements by regulators, legislators and industry representatives that achieve the common goal of building and protecting the value of investors’ holdings.
For nearly 60 years, Fidelity has worked very hard to improve its products and service to justify your trust. When our family founded this company in 1946, we had only a few hundred customers. Today, we serve more than 18 million customers including individual investors and participants in retirement plans across America.
Annual Report 4
Let me close by saying that we do not take your trust in us for granted, and we realize that we must always work to improve all aspects of our service to you. In turn, we urge you to continue your active participation with your financial matters, so that your interests can be well served.
Best regards,
/s/Edward C. Johnson 3d
5 Annual Report
Performance: The Bottom Line
Average annual total return reflects the change in the value of an investment, assuming reinvestment of the class’ dividend income and capital gains (the profits earned upon the sale of securities that have grown in value) and assuming a constant rate of performance each year. The $10,000 table and the fund’s returns do not reflect the deduction of taxes that a shareholder would pay on fund distributions or the redemption of fund shares. During periods of reimbursement by Fidelity, a fund’s total return will be greater than it would be had the reimbursement not occurred. How a fund did yesterday is no guarantee of how it will do tomorrow. Returns may reflect the conversion of Class B shares to Class A shares after a maximum of seven years.
| Average Annual Total Returns | | | | |
| Periods ended October 31, 2005 | | Past 1 | | Life of |
| | | year | | fundA |
| Class A (incl. 5.75% sales charge) | | 6.88% | | 9.87% |
| Class T (incl. 3.50% sales charge) | | 9.01% | | 10.66% |
| Class B (incl. contingent deferred | | | | |
| sales charge)B | | 7.35% | | 10.67% |
| Class C (incl. contingent deferred | | | | |
| sales charge)C | | 11.45% | | 11.76% |
A From June 17, 2003.
B Class B shares’ contingent deferred sales charge included in the past one year and life of fund total
return figures are 5% and 4%, respectively.
|
C Class C shares’ contingent deferred sales charge included in the past one year and life of fund total return figures are 1% and 0%, respectively.
| | $10,000 Over Life of Fund
|
Let’s say hypothetically that $10,000 was invested in Fidelity® Advisor Value Leaders Fund - Class T on June 17, 2003, when the fund started, and the current 3.50% sales charge was paid. The chart shows how the value of your investment would have changed, and also shows how the Russell 1000r Value Index performed over the same period.

Management’s Discussion of Fund Performance
Comments from Brian Hogan, Portfolio Manager of Fidelity® Advisor Value Leaders Fund
U.S. equity markets had respectable performance during the year that ended October 31, 2005. The period got off to a great start with a strong November and December of 2004. However, the markets were later dragged down by surging oil prices, further disorder in Iraq, potential new troubles with Iran and Syria, and terrorist attacks in London. While stocks recovered nicely, Hurricane Katrina would drive them down again. The devastating storm led to record-high prices for gasoline, natural gas and oil, as well as fears of a corresponding leap in inflation. The Federal Reserve Board responded to this and to other inflationary pressures during the period by raising short-term interest rates eight times. Nonetheless, stocks moved higher despite a very weak October. Market breadth was narrow, as most of the gains were concentrated in rapidly appreciating energy-related investments. For the year overall, the Standard & Poor’s 500SM Index was up 8.72%, followed closely by the technology-laden NASDAQ Compositer Index at 8.15% . The Dow Jones Industrial AverageSM rose 6.45% .
During the past year, the fund’s Class A, Class T, Class B and Class C shares gained 13.40%, 12.96%, 12.35% and 12.45%, respectively, while the Russell 1000r Value Index rose 11.86% and the LipperSM Growth Funds Average returned 10.58% . The fund’s outperformance of its index was driven by strong stock selection within pharmaceuticals and biotechnology, energy, telecommunication services and consumer staples. Favorable industry positioning within financials also contributed. Conversely, an underweighting in the surging utilities sector detracted from returns, as did an overweighting in industrials and weak results in technology. Underweighting pharmaceutical company Pfizer — a component of the Russell index — helped the most, as the company suffered due to concerns about competition and patent protection for its flagship product, Lipitor. Energy companies Halliburton and National Oilwell Varco benefited from continued high prices for oil and natural gas, which helped the fund’s performance. Banco Bradesco, one of the largest banks in Brazil, also did well, due to an improving economy and strong consumer loan demand. On the negative side, Tyco International detracted from performance after experiencing earnings setbacks. The fund’s underweighted position compared to the index in energy giant ConocoPhillips, whose stock price gained on strong energy prices, also took away from relative returns. Another notable detractor was containerboard producer Smurfit-Stone Container.
The views expressed in this statement reflect those of the portfolio manager only through the end of the period of the report as stated on the cover and do not necessarily represent the views of Fidelity or any other person in the Fidelity organization. Any such views are subject to change at any time based upon market or other conditions and Fidelity disclaims any responsibility to update such views. These views may not be relied on as investment advice and, because investment decisions for a Fidelity fund are based on numerous factors, may not be relied on as an indication of trading intent on behalf of any Fidelity fund.
Shareholder Expense Example
As a shareholder of the Fund, you incur two types of costs: (1) transaction costs, including sales charges (loads) on purchase payments or redemption proceeds, and (2) ongoing costs, including management fees, distribution and/or service (12b-1) fees and other Fund expenses. This Example is intended to help you understand your ongoing costs (in dollars) of investing in the Fund and to compare these costs with the ongoing costs of investing in other mutual funds.
The Example is based on an investment of $1,000 invested at the beginning of the period and held for the entire period (May 1, 2005 to October 31, 2005).
The first line of the table below for each class of the Fund provides information about actual account values and actual expenses. You may use the information in this line, together with the amount you invested, to estimate the expenses that you paid over the period. Simply divide your account value by $1,000.00 (for example, an $8,600 account value divided by $1,000.00 = 8.6), then multiply the result by the number in the first line for a class of the Fund under the heading entitled “Expenses Paid During Period” to estimate the expenses you paid on your account during this period.
Hypothetical Example for Comparison Purposes
The second line of the table below for each class of the Fund provides information about hypothetical account values and hypothetical expenses based on a Class’ actual expense ratio and an assumed rate of return of 5% per year before expenses, which is not the Class’ actual return. The hypothetical account values and expenses may not be used to estimate the actual ending account balance or expenses you paid for the period. You may use this information to compare the ongoing costs of investing in the Fund and other funds. To do so, compare this 5% hypothetical example with the 5% hypothetical examples that appear in the shareholder reports of the other funds.
Please note that the expenses shown in the table are meant to highlight your ongoing costs only and do not reflect any transaction costs. Therefore, the second line of the table is useful in comparing ongoing costs only, and will not help you determine the relative total costs of owning different funds. In addition, if these transactional costs were included, your costs would have been higher.
| | | | | | | | | | | | | Expenses Paid |
| | | | | Beginning | | | | Ending | | | | During Period* |
| | | | | Account Value | | | | Account Value | | | | May 1, 2005 |
| | | | | May 1, 2005 | | | | October 31, 2005 | | to October 31, 2005 |
| Class A | | | | | | | | | | | | |
| Actual | | $ | | 1,000.00 | | $ | | 1,072.20 | | $ | | 6.53 |
| HypotheticalA | | $ | | 1,000.00 | | $ | | 1,018.90 | | $ | | 6.36 |
| Class T | | | | | | | | | | | | |
| Actual | | $ | | 1,000.00 | | $ | | 1,070.90 | | $ | | 7.83 |
| HypotheticalA | | $ | | 1,000.00 | | $ | | 1,017.64 | | $ | | 7.63 |
| Class B | | | | | | | | | | | | |
| Actual | | $ | | 1,000.00 | | $ | | 1,068.30 | | $ | | 10.43 |
| HypotheticalA | | $ | | 1,000.00 | | $ | | 1,015.12 | | $ | | 10.16 |
9 Annual Report
| Shareholder Expense Example - continued | | | | |
| |
| |
| | | | | | | | | | | | | Expenses Paid |
| | | | | Beginning | | | | Ending | | | | During Period* |
| | | | | Account Value | | | | Account Value | | | | May 1, 2005 |
| | | | | May 1, 2005 | | | | October 31, 2005 | | to October 31, 2005 |
| Class C | | | | | | | | | | | | |
| Actual | | $ | | 1,000.00 | | $ | | 1,068.30 | | $ | | 10.43 |
| HypotheticalA | | $ | | 1,000.00 | | $ | | 1,015.12 | | $ | | 10.16 |
| Institutional Class | | | | | | | | | | | | |
| Actual | | $ | | 1,000.00 | | $ | | 1,073.60 | | $ | | 5.23 |
| HypotheticalA | | $ | | 1,000.00 | | $ | | 1,020.16 | | $ | | 5.09 |
| |
| A 5% return per year before expenses | | | | | | | | |
*Expenses are equal to each Class’ annualized expense ratio (shown in the table below); multiplied by the average account value over the period, multiplied by 184/365 (to reflect the one-half year period).
| | | Annualized |
| | | Expense Ratio |
| Class A | | 1.25% |
| Class T | | 1.50% |
| Class B | | 2.00% |
| Class C | | 2.00% |
| Institutional Class | | 1.00% |
Investment Changes
| Top Ten Stocks as of October 31, 2005 | | | | |
| | | % of fund’s | | % of fund’s net assets |
| | | net assets | | 6 months ago |
| American International Group, Inc. | | 4.5 | | 2.6 |
| Honeywell International, Inc. | | 3.6 | | 3.1 |
| General Electric Co. | | 3.5 | | 6.8 |
| Exxon Mobil Corp. | | 3.3 | | 4.4 |
| Bank of America Corp. | | 1.9 | | 2.6 |
| JPMorgan Chase & Co. | | 1.7 | | 0.5 |
| Hewlett-Packard Co. | | 1.7 | | 0.0 |
| Halliburton Co. | | 1.6 | | 1.1 |
| Baxter International, Inc. | | 1.6 | | 2.0 |
| Altria Group, Inc. | | 1.5 | | 2.0 |
| | | 24.9 | | |
| Top Five Market Sectors as of October 31, 2005 | | |
| | | % of fund’s | | % of fund’s net assets |
| | | net assets | | 6 months ago |
| Financials | | 22.7 | | 17.5 |
| Energy | | 14.8 | | 13.4 |
| Industrials | | 14.1 | | 20.2 |
| Health Care | | 11.8 | | 10.8 |
| Information Technology | | 11.2 | | 8.0 |
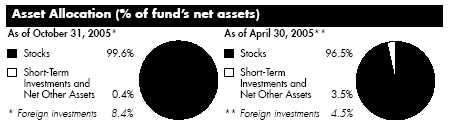
11 Annual Report
| Investments October 31, 2005 | | | | | | | | |
| Showing Percentage of Net Assets | | | | | | | | |
| Common Stocks — 99.6% | | | | | | | | |
| | | | | Shares | | Value (Note 1) |
| |
| CONSUMER DISCRETIONARY – 8.3% | | | | | | | | |
| Diversified Consumer Services – 0.5% | | | | | | | | |
| Apollo Group, Inc. Class A (a) | | | | 1,900 | | $ | | 119,738 |
| Service Corp. International (SCI) | | | | 9,900 | | | | 82,863 |
| | | | | | | | | 202,601 |
| Hotels, Restaurants & Leisure – 0.5% | | | | | | | | |
| McDonald’s Corp. | | | | 5,200 | | | | 164,320 |
| Red Robin Gourmet Burgers, Inc. (a) | | | | 1,000 | | | | 48,230 |
| Ruth’s Chris Steak House, Inc. | | | | 100 | | | | 1,786 |
| | | | | | | | | 214,336 |
| Household Durables – 0.8% | | | | | | | | |
| D.R. Horton, Inc. | | | | 1,800 | | | | 55,242 |
| KB Home | | | | 600 | | | | 39,210 |
| LG Electronics, Inc. | | | | 450 | | | | 29,181 |
| Sony Corp. sponsored ADR | | | | 2,900 | | | | 95,120 |
| Techtronic Industries Co. Ltd. | | | | 21,000 | | | | 51,605 |
| Toll Brothers, Inc. (a) | | | | 900 | | | | 33,219 |
| | | | | | | | | 303,577 |
| Internet & Catalog Retail – 1.0% | | | | | | | | |
| Coldwater Creek, Inc. (a) | | | | 2,900 | | | | 78,271 |
| eBay, Inc. (a) | | | | 6,500 | | | | 257,400 |
| Expedia, Inc., Delaware (a) | | | | 1,450 | | | | 27,246 |
| IAC/InterActiveCorp (a) | | | | 1,450 | | | | 37,120 |
| | | | | | | | | 400,037 |
| Leisure Equipment & Products – 1.0% | | | | | | | | |
| Eastman Kodak Co. | | | | 13,800 | | | | 302,220 |
| Leapfrog Enterprises, Inc. Class A (a)(d) | | | | 4,700 | | | | 70,500 |
| | | | | | | | | 372,720 |
| Media – 3.4% | | | | | | | | |
| Clear Channel Communications, Inc. | | | | 3,020 | | | | 91,868 |
| Lamar Advertising Co. Class A (a) | | | | 5,664 | | | | 252,728 |
| News Corp. Class A | | | | 1,476 | | | | 21,033 |
| NTL, Inc. (a) | | | | 900 | | | | 55,188 |
| The Reader’s Digest Association, Inc. (non-vtg.) | | | | 2,500 | | | | 38,300 |
| Time Warner, Inc. | | | | 15,000 | | | | 267,450 |
| Univision Communications, Inc. Class A (a) | | | | 11,800 | | | | 308,452 |
| Viacom, Inc. Class B (non-vtg.) | | | | 1,534 | | | | 47,508 |
| Walt Disney Co. | | | | 8,900 | | | | 216,893 |
| XM Satellite Radio Holdings, Inc. Class A (a) | | | | 300 | | | | 8,649 |
| | | | | | | | | 1,308,069 |
See accompanying notes which are an integral part of the financial statements.
| Common Stocks – continued | | | | | | |
| | | Shares | | Value (Note 1) |
| |
| CONSUMER DISCRETIONARY – continued | | | | | | |
| Specialty Retail – 1.1% | | | | | | |
| Blockbuster, Inc. Class B | | 3 | | $ | | 13 |
| Home Depot, Inc. | | 7,250 | | | | 297,540 |
| Maidenform Brands, Inc. | | 200 | | | | 2,518 |
| OfficeMax, Inc. | | 2,600 | | | | 72,852 |
| Staples, Inc. | | 1,600 | | | | 36,368 |
| | | | | | | 409,291 |
| |
| TOTAL CONSUMER DISCRETIONARY | | | | | | 3,210,631 |
| |
| CONSUMER STAPLES – 5.9% | | | | | | |
| Beverages – 0.9% | | | | | | |
| Coca-Cola Enterprises, Inc. | | 2,900 | | | | 54,810 |
| Diageo PLC sponsored ADR | | 600 | | | | 35,658 |
| PepsiCo, Inc. | | 900 | | | | 53,172 |
| The Coca-Cola Co. | | 4,400 | | | | 188,232 |
| | | | | | | 331,872 |
| Food & Staples Retailing – 1.9% | | | | | | |
| CVS Corp. | | 1,600 | | | | 39,056 |
| Kroger Co. (a) | | 14,200 | | | | 282,580 |
| Rite Aid Corp. (a) | | 3,800 | | | | 13,300 |
| Safeway, Inc. | | 9,800 | | | | 227,948 |
| Wal-Mart Stores, Inc. | | 3,300 | | | | 156,123 |
| Walgreen Co. | | 800 | | | | 36,344 |
| | | | | | | 755,351 |
| Food Products – 0.5% | | | | | | |
| Nestle SA (Reg.) | | 332 | | | | 98,893 |
| Tyson Foods, Inc. Class A | | 5,100 | | | | 90,780 |
| | | | | | | 189,673 |
| Household Products – 1.1% | | | | | | |
| Colgate-Palmolive Co. | | 7,800 | | | | 413,088 |
| Tobacco – 1.5% | | | | | | |
| Altria Group, Inc. | | 7,830 | | | | 587,642 |
| |
| TOTAL CONSUMER STAPLES | | | | | | 2,277,626 |
| |
| ENERGY – 14.8% | | | | | | |
| Energy Equipment & Services – 6.5% | | | | | | |
| BJ Services Co. | | 6,800 | | | | 236,300 |
| FMC Technologies, Inc. (a) | | 2,300 | | | | 83,858 |
| GlobalSantaFe Corp. | | 4,000 | | | | 178,200 |
See accompanying notes which are an integral part of the financial statements.
13 Annual Report
| Investments - continued | | | | | | |
| |
| |
| Common Stocks – continued | | | | | | |
| | | Shares | | Value (Note 1) |
| |
| ENERGY – continued | | | | | | |
| Energy Equipment & Services – continued | | | | | | |
| Halliburton Co. | | 10,500 | | $ | | 620,550 |
| Hercules Offshore, Inc. | | 400 | | | | 8,708 |
| National Oilwell Varco, Inc. (a) | | 6,832 | | | | 426,795 |
| Noble Corp. | | 1,200 | | | | 77,256 |
| Pride International, Inc. (a) | | 6,000 | | | | 168,420 |
| Schlumberger Ltd. (NY Shares) | | 4,100 | | | | 372,157 |
| Smith International, Inc. | | 4,200 | | | | 136,080 |
| Weatherford International Ltd. (a) | | 3,430 | | | | 214,718 |
| | | | | | | 2,523,042 |
| Oil, Gas & Consumable Fuels – 8.3% | | | | | | |
| Amerada Hess Corp. | | 1,200 | | | | 150,120 |
| Apache Corp. | | 1,400 | | | | 89,362 |
| Chevron Corp. | | 8,500 | | | | 485,095 |
| ConocoPhillips | | 2,300 | | | | 150,374 |
| El Paso Corp. | | 7,800 | | | | 92,508 |
| Encore Acquisition Co. (a) | | 1,250 | | | | 42,888 |
| Exxon Mobil Corp. | | 22,870 | | | | 1,283,922 |
| Occidental Petroleum Corp. | | 1,700 | | | | 134,096 |
| OMI Corp. | | 3,700 | | | | 66,896 |
| Quicksilver Resources, Inc. (a) | | 7,550 | | | | 292,412 |
| Valero Energy Corp. | | 2,500 | | | | 263,100 |
| XTO Energy, Inc. | | 3,300 | | | | 143,418 |
| | | | | | | 3,194,191 |
| |
| TOTAL ENERGY | | | | | | 5,717,233 |
| |
| FINANCIALS – 22.7% | | | | | | |
| Capital Markets – 4.2% | | | | | | |
| Bear Stearns Companies, Inc. | | 500 | | | | 52,900 |
| Charles Schwab Corp. | | 6,600 | | | | 100,320 |
| Investors Financial Services Corp. | | 1,600 | | | | 61,088 |
| Lehman Brothers Holdings, Inc. | | 1,100 | | | | 131,637 |
| Merrill Lynch & Co., Inc. | | 5,600 | | | | 362,544 |
| Morgan Stanley | | 6,800 | | | | 369,988 |
| Nomura Holdings, Inc. | | 4,100 | | | | 63,509 |
| Nuveen Investments, Inc. Class A | | 900 | | | | 36,423 |
| State Street Corp. | | 5,100 | | | | 281,673 |
| TradeStation Group, Inc. (a) | | 5,200 | | | | 51,896 |
| UBS AG (NY Shares) | | 1,200 | | | | 102,804 |
| | | | | | | 1,614,782 |
See accompanying notes which are an integral part of the financial statements.
| Common Stocks – continued | | | | | | |
| | | Shares | | Value (Note 1) |
| |
| FINANCIALS – continued | | | | | | |
| Commercial Banks – 4.1% | | | | | | |
| Banco Bradesco SA (PN) sponsored ADR (non-vtg.) | | 1,700 | | $ | | 88,213 |
| Bank of America Corp. | | 16,742 | | | | 732,295 |
| Korea Exchange Bank (a) | | 10,750 | | | | 118,415 |
| UCBH Holdings, Inc. | | 5,400 | | | | 93,960 |
| Wachovia Corp. | | 8,259 | | | | 417,245 |
| Wells Fargo & Co. | | 2,550 | | | | 153,510 |
| | | | | | | 1,603,638 |
| Diversified Financial Services – 3.0% | | | | | | |
| Citigroup, Inc. | | 10,600 | | | | 485,268 |
| JPMorgan Chase & Co. | | 17,940 | | | | 656,963 |
| | | | | | | 1,142,231 |
| Insurance – 9.1% | | | | | | |
| ACE Ltd. | | 8,600 | | | | 448,060 |
| American International Group, Inc. | | 26,940 | | | | 1,745,708 |
| Aspen Insurance Holdings Ltd. | | 1,600 | | | | 38,704 |
| Endurance Specialty Holdings Ltd. | | 1,200 | | | | 39,792 |
| Hartford Financial Services Group, Inc. | | 4,700 | | | | 374,825 |
| Hilb Rogal & Hobbs Co. | | 3,000 | | | | 112,350 |
| Montpelier Re Holdings Ltd. | | 1,100 | | | | 22,110 |
| PartnerRe Ltd. | | 4,100 | | | | 261,252 |
| Platinum Underwriters Holdings Ltd. | | 1,600 | | | | 45,584 |
| Scottish Re Group Ltd. | | 2,300 | | | | 56,465 |
| The Chubb Corp. | | 230 | | | | 21,383 |
| W.R. Berkley Corp. | | 6,850 | | | | 299,345 |
| XL Capital Ltd. Class A | | 900 | | | | 57,654 |
| | | | | | | 3,523,232 |
| Real Estate – 0.7% | | | | | | |
| Apartment Investment & Management Co. Class A | | 1,800 | | | | 69,120 |
| Equity Lifestyle Properties, Inc. | | 350 | | | | 14,816 |
| Equity Residential (SBI) | | 2,100 | | | | 82,425 |
| General Growth Properties, Inc. | | 2,500 | | | | 106,200 |
| Spirit Finance Corp. (e) | | 300 | | | | 3,366 |
| | | | | | | 275,927 |
| Thrifts & Mortgage Finance – 1.6% | | | | | | |
| Doral Financial Corp. | | 4,600 | | | | 39,376 |
| Fannie Mae | | 5,760 | | | | 273,715 |
| Freddie Mac | | 1,900 | | | | 116,565 |
| Golden West Financial Corp., Delaware | | 1,240 | | | | 72,825 |
| Hudson City Bancorp, Inc. | | 3,500 | | | | 41,440 |
See accompanying notes which are an integral part of the financial statements.
15 Annual Report
| Investments - continued | | | | | | |
| |
| |
| Common Stocks – continued | | | | | | |
| | | Shares | | Value (Note 1) |
| |
| FINANCIALS – continued | | | | | | |
| Thrifts & Mortgage Finance – continued | | | | | | |
| Sovereign Bancorp, Inc. | | 3,600 | | $ | | 77,652 |
| W Holding Co., Inc. | | 1,836 | | | | 14,156 |
| | | | | | | 635,729 |
| |
| TOTAL FINANCIALS | | | | | | 8,795,539 |
| |
| HEALTH CARE – 11.8% | | | | | | |
| Biotechnology – 2.7% | | | | | | |
| Alkermes, Inc. (a) | | 1,500 | | | | 24,435 |
| Alnylam Pharmaceuticals, Inc. (a) | | 5,600 | | | | 53,816 |
| Amgen, Inc. (a) | | 1,400 | | | | 106,064 |
| Biogen Idec, Inc. (a) | | 2,200 | | | | 89,386 |
| BioMarin Pharmaceutical, Inc. (a) | | 8,000 | | | | 67,200 |
| Cephalon, Inc. (a) | | 7,600 | | | | 346,484 |
| Genentech, Inc. (a) | | 700 | | | | 63,420 |
| ImClone Systems, Inc. (a) | | 2,700 | | | | 93,690 |
| MedImmune, Inc. (a) | | 4,050 | | | | 141,669 |
| ONYX Pharmaceuticals, Inc. (a) | | 1,500 | | | | 38,535 |
| Serologicals Corp. (a) | | 1,200 | | | | 23,376 |
| | | | | | | 1,048,075 |
| Health Care Equipment & Supplies – 4.1% | | | | | | |
| Baxter International, Inc. | | 15,840 | | | | 605,563 |
| C.R. Bard, Inc. | | 900 | | | | 56,142 |
| Dionex Corp. (a) | | 800 | | | | 38,744 |
| Medtronic, Inc. | | 5,050 | | | | 286,133 |
| PerkinElmer, Inc. | | 6,100 | | | | 134,627 |
| Syneron Medical Ltd. (a) | | 700 | | | | 25,158 |
| Thermo Electron Corp. (a) | | 6,500 | | | | 196,235 |
| Varian, Inc. (a) | | 1,000 | | | | 36,770 |
| Waters Corp. (a) | | 5,500 | | | | 199,100 |
| | | | | | | 1,578,472 |
| Health Care Providers & Services – 1.0% | | | | | | |
| McKesson Corp. | | 1,400 | | | | 63,602 |
| Psychiatric Solutions, Inc. (a) | | 1,500 | | | | 82,050 |
| Sierra Health Services, Inc. (a) | | 1,100 | | | | 82,500 |
| UnitedHealth Group, Inc. | | 2,300 | | | | 133,147 |
| WebMD Health Corp. Class A | | 800 | | | | 20,896 |
| | | | | | | 382,195 |
See accompanying notes which are an integral part of the financial statements.
| Common Stocks – continued | | | | | | |
| | | Shares | | Value (Note 1) |
| |
| HEALTH CARE – continued | | | | | | |
| Pharmaceuticals – 4.0% | | | | | | |
| Allergan, Inc. | | 500 | | $ | | 44,650 |
| Connetics Corp. (a) | | 800 | | | | 10,432 |
| Merck & Co., Inc. | | 2,000 | | | | 56,440 |
| Pfizer, Inc. | | 26,900 | | | | 584,806 |
| Schering-Plough Corp. | | 12,140 | | | | 246,928 |
| Teva Pharmaceutical Industries Ltd. sponsored ADR | | 5,100 | | | | 194,412 |
| Valeant Pharmaceuticals International | | 1,500 | | | | 25,740 |
| Wyeth | | 9,200 | | | | 409,952 |
| | | | | | | 1,573,360 |
| |
| TOTAL HEALTH CARE | | | | | | 4,582,102 |
| |
| INDUSTRIALS – 14.1% | | | | | | |
| Aerospace & Defense – 4.3% | | | | | | |
| Hexcel Corp. (a) | | 2,300 | | | | 36,386 |
| Honeywell International, Inc. | | 40,540 | | | | 1,386,468 |
| K&F Industries Holdings, Inc. | | 400 | | | | 6,256 |
| Orbital Sciences Corp. (a) | | 2,000 | | | | 23,260 |
| Raytheon Co. | | 1,700 | | | | 62,815 |
| The Boeing Co. | | 200 | | | | 12,928 |
| United Technologies Corp. | | 2,200 | | | | 112,816 |
| | | | | | | 1,640,929 |
| Air Freight & Logistics – 0.2% | | | | | | |
| EGL, Inc. (a) | | 3,000 | | | | 84,090 |
| Airlines – 0.7% | | | | | | |
| ACE Aviation Holdings, Inc. Class A (a) | | 2,000 | | | | 52,498 |
| AirTran Holdings, Inc. (a) | | 5,400 | | | | 80,784 |
| JetBlue Airways Corp. (a) | | 3,600 | | | | 66,996 |
| Southwest Airlines Co. | | 2,700 | | | | 43,227 |
| US Airways Group, Inc. (a) | | 1,000 | | | | 24,680 |
| | | | | | | 268,185 |
| Building Products – 0.3% | | | | | | |
| Lennox International, Inc. | | 2,700 | | | | 75,303 |
| Masco Corp. | | 1,250 | | | | 35,625 |
| | | | | | | 110,928 |
| Commercial Services & Supplies – 0.5% | | | | | | |
| Robert Half International, Inc. | | 4,700 | | | | 173,336 |
| Construction & Engineering – 1.1% | | | | | | |
| Chicago Bridge & Iron Co. NV (NY Shares) | | 2,200 | | | | 49,060 |
See accompanying notes which are an integral part of the financial statements.
17 Annual Report
| Investments - continued | | | | | | |
| |
| |
| Common Stocks – continued | | | | | | |
| | | Shares | | Value (Note 1) |
| |
| INDUSTRIALS – continued | | | | | | |
| Construction & Engineering – continued | | | | | | |
| Fluor Corp. | | 4,000 | | $ | | 254,400 |
| Foster Wheeler Ltd. (a) | | 950 | | | | 26,866 |
| Jacobs Engineering Group, Inc. (a) | | 1,500 | | | | 95,625 |
| | | | | | | 425,951 |
| Electrical Equipment – 0.4% | | | | | | |
| ABB Ltd. sponsored ADR (a) | | 7,200 | | | | 56,088 |
| Rockwell Automation, Inc. | | 1,800 | | | | 95,670 |
| | | | | | | 151,758 |
| Industrial Conglomerates – 5.0% | | | | | | |
| 3M Co. | | 500 | | | | 37,990 |
| General Electric Co. | | 39,430 | | | | 1,337,071 |
| Smiths Group PLC | | 5,900 | | | | 95,317 |
| Tyco International Ltd. | | 18,100 | | | | 477,659 |
| | | | | | | 1,948,037 |
| Machinery – 0.5% | | | | | | |
| Deere & Co. | | 1,700 | | | | 103,156 |
| ITT Industries, Inc. | | 730 | | | | 74,168 |
| Watts Water Technologies, Inc. Class A | | 1,000 | | | | 27,760 |
| | | | | | | 205,084 |
| Road & Rail – 0.6% | | | | | | |
| Norfolk Southern Corp. | | 6,000 | | | | 241,200 |
| Trading Companies & Distributors – 0.5% | | | | | | |
| Watsco, Inc. | | 1,850 | | | | 105,136 |
| WESCO International, Inc. (a) | | 2,600 | | | | 103,350 |
| | | | | | | 208,486 |
| |
| TOTAL INDUSTRIALS | | | | | | 5,457,984 |
| |
| INFORMATION TECHNOLOGY – 11.2% | | | | | | |
| Communications Equipment – 1.2% | | | | | | |
| Comverse Technology, Inc. (a) | | 4,700 | | | | 117,970 |
| Dycom Industries, Inc. (a) | | 4,200 | | | | 83,706 |
| Extreme Networks, Inc. (a) | | 4,100 | | | | 19,803 |
| MasTec, Inc. (a) | | 3,700 | | | | 37,703 |
| Motorola, Inc. | | 2,500 | | | | 55,400 |
| Nokia Corp. sponsored ADR | | 9,900 | | | | 166,518 |
| | | | | | | 481,100 |
| Computers & Peripherals – 2.1% | | | | | | |
| Dell, Inc. (a) | | 800 | | | | 25,504 |
See accompanying notes which are an integral part of the financial statements.
| Common Stocks – continued | | | | | | |
| | | Shares | | Value (Note 1) |
| |
| INFORMATION TECHNOLOGY – continued | | | | | | |
| Computers & Peripherals – continued | | | | | | |
| EMC Corp. (a) | | 4,300 | | $ | | 60,028 |
| Hewlett-Packard Co. | | 23,300 | | | | 653,332 |
| Lexmark International, Inc. Class A (a) | | 700 | | | | 29,064 |
| Maxtor Corp. (a) | | 9,300 | | | | 32,550 |
| | | | | | | 800,478 |
| Electronic Equipment & Instruments – 1.8% | | | | | | |
| Agilent Technologies, Inc. (a) | | 10,500 | | | | 336,105 |
| Amphenol Corp. Class A | | 1,800 | | | | 71,946 |
| Jabil Circuit, Inc. (a) | | 2,100 | | | | 62,685 |
| Symbol Technologies, Inc. | | 6,300 | | | | 52,290 |
| Trimble Navigation Ltd. (a) | | 2,500 | | | | 72,175 |
| Vishay Intertechnology, Inc. (a) | | 7,200 | | | | 81,648 |
| | | | | | | 676,849 |
| Internet Software & Services – 1.3% | | | | | | |
| Akamai Technologies, Inc. (a) | | 2,100 | | | | 36,414 |
| Digital River, Inc. (a) | | 800 | | | | 22,408 |
| Google, Inc. Class A (sub. vtg.) (a) | | 800 | | | | 297,712 |
| Yahoo!, Inc. (a) | | 3,500 | | | | 129,395 |
| | | | | | | 485,929 |
| IT Services – 0.6% | | | | | | |
| Anteon International Corp. (a) | | 1,800 | | | | 81,360 |
| Ceridian Corp. (a) | | 4,900 | | | | 107,359 |
| First Data Corp. | | 1,200 | | | | 48,540 |
| | | | | | | 237,259 |
| Office Electronics – 0.4% | | | | | | |
| Xerox Corp. (a) | | 6,000 | | | | 81,420 |
| Zebra Technologies Corp. Class A (a) | | 2,100 | | | | 90,531 |
| | | | | | | 171,951 |
| Semiconductors & Semiconductor Equipment – 1.8% | | | | | | |
| Altera Corp. (a) | | 2,000 | | | | 33,300 |
| Analog Devices, Inc. | | 1,900 | | | | 66,082 |
| Cabot Microelectronics Corp. (a)(d) | | 1,100 | | | | 32,340 |
| Freescale Semiconductor, Inc. Class A (a) | | 5,000 | | | | 118,450 |
| Intel Corp. | | 8,000 | | | | 188,000 |
| Maxim Integrated Products, Inc. | | 3,300 | | | | 114,444 |
| Micron Technology, Inc. (a) | | 4,600 | | | | 59,754 |
| PMC-Sierra, Inc. (a) | | 3,200 | | | | 22,720 |
| Samsung Electronics Co. Ltd. | | 128 | | | | 67,678 |
| | | | | | | 702,768 |
See accompanying notes which are an integral part of the financial statements.
19 Annual Report
| Investments - continued | | | | | | |
| |
| |
| Common Stocks – continued | | | | | | |
| | | Shares | | Value (Note 1) |
| |
| INFORMATION TECHNOLOGY – continued | | | | | | |
| Software – 2.0% | | | | | | |
| BEA Systems, Inc. (a) | | 7,569 | | $ | | 66,759 |
| Cognos, Inc. (a) | | 800 | | | | 29,832 |
| Macrovision Corp. (a) | | 500 | | | | 9,420 |
| Microsoft Corp. | | 13,160 | | | | 338,212 |
| NAVTEQ Corp. (a) | | 2,000 | | | | 78,240 |
| Oracle Corp. (a) | | 2,900 | | | | 36,772 |
| Symantec Corp. (a) | | 7,200 | | | | 171,720 |
| Ulticom, Inc. (a) | | 3,800 | | | | 40,014 |
| | | | | | | 770,969 |
| |
| TOTAL INFORMATION TECHNOLOGY | | | | | | 4,327,303 |
| |
| MATERIALS – 5.9% | | | | | | |
| Chemicals – 3.6% | | | | | | |
| Chemtura Corp. | | 2,300 | | | | 24,610 |
| E.I. du Pont de Nemours & Co. | | 11,800 | | | | 491,942 |
| Ecolab, Inc. | | 2,000 | | | | 66,160 |
| Georgia Gulf Corp. | | 1,700 | | | | 49,470 |
| Lyondell Chemical Co. | | 10,380 | | | | 278,184 |
| Monsanto Co. | | 650 | | | | 40,957 |
| Mosaic Co. (a) | | 3,200 | | | | 42,240 |
| NOVA Chemicals Corp. | | 3,600 | | | | 128,240 |
| Praxair, Inc. | | 3,000 | | | | 148,230 |
| Rockwood Holdings, Inc. | | 3,400 | | | | 68,238 |
| Rohm & Haas Co. | | 1,100 | | | | 47,883 |
| | | | | | | 1,386,154 |
| Construction Materials – 0.2% | | | | | | |
| Martin Marietta Materials, Inc. | | 1,100 | | | | 86,801 |
| Containers & Packaging – 0.9% | | | | | | |
| Crown Holdings, Inc. (a) | | 2,000 | | | | 32,440 |
| Owens-Illinois, Inc. (a) | | 6,712 | | | | 127,796 |
| Packaging Corp. of America | | 2,700 | | | | 54,783 |
| Smurfit-Stone Container Corp. (a) | | 14,275 | | | | 150,744 |
| | | | | | | 365,763 |
| Metals & Mining – 1.2% | | | | | | |
| Alcoa, Inc. | | 3,400 | | | | 82,586 |
See accompanying notes which are an integral part of the financial statements.
| Common Stocks – continued | | | | | | |
| | | Shares | | Value (Note 1) |
| |
| MATERIALS – continued | | | | | | |
| Metals & Mining – continued | | | | | | |
| Freeport-McMoRan Copper & Gold, Inc. Class B | | 1,900 | | $ | | 93,898 |
| Newmont Mining Corp. | | 6,350 | | | | 270,510 |
| | | | | | | 446,994 |
| |
| TOTAL MATERIALS | | | | | | 2,285,712 |
| |
| TELECOMMUNICATION SERVICES – 3.8% | | | | | | |
| Diversified Telecommunication Services – 1.7% | | | | | | |
| Covad Communications Group, Inc. (a) | | 63,400 | | | | 56,426 |
| SBC Communications, Inc. | | 20,550 | | | | 490,118 |
| Verizon Communications, Inc. | | 3,350 | | | | 105,559 |
| | | | | | | 652,103 |
| Wireless Telecommunication Services – 2.1% | | | | | | |
| American Tower Corp. Class A (a) | | 9,300 | | | | 221,805 |
| Leap Wireless International, Inc. (a) | | 1,200 | | | | 39,612 |
| Nextel Partners, Inc. Class A (a) | | 5,800 | | | | 145,870 |
| Sprint Nextel Corp. | | 17,026 | | | | 396,876 |
| | | | | | | 804,163 |
| |
| TOTAL TELECOMMUNICATION SERVICES | | | | | | 1,456,266 |
| |
| UTILITIES – 1.1% | | | | | | |
| Electric Utilities – 0.2% | | | | | | |
| PPL Corp. | | 3,000 | | | | 94,020 |
| Independent Power Producers & Energy Traders – 0.4% | | | | | | |
| AES Corp. (a) | | 4,000 | | | | 63,560 |
| TXU Corp. | | 1,000 | | | | 100,750 |
| | | | | | | 164,310 |
| Multi-Utilities – 0.5% | | | | | | |
| CMS Energy Corp. (a) | | 6,300 | | | | 93,933 |
| PG&E Corp. | | 2,500 | | | | 90,950 |
| | | | | | | 184,883 |
| |
| TOTAL UTILITIES | | | | | | 443,213 |
| |
| TOTAL COMMON STOCKS | | | | | | |
| (Cost $34,959,974) | | | | 38,553,609 |
See accompanying notes which are an integral part of the financial statements.
21 Annual Report
| Investments - continued | | | | | | | | |
| |
| Money Market Funds — 0.7% | | | | | | | | |
| | | Shares | | | | Value (Note 1) |
| Fidelity Cash Central Fund, 3.92% (b) | | 189,868 | | | | $ | | 189,868 |
| Fidelity Securities Lending Cash Central Fund, 3.94% (b)(c) | | 81,700 | | | | | | 81,700 |
| TOTAL MONEY MARKET FUNDS | | | | | | | | |
| (Cost $271,568) | | | | | | | | 271,568 |
| |
| TOTAL INVESTMENT PORTFOLIO – 100.3% | | | | | | | | |
| (Cost $35,231,542) | | | | | | 38,825,177 |
| |
| NET OTHER ASSETS – (0.3)% | | | | | | | | (134,895) |
| NET ASSETS – 100% | | | | $ | | 38,690,282 |
(a) Non-income producing
(b) Affiliated fund that is available only to investment companies and other accounts managed by Fidelity Investments. The rate quoted is the annualized seven-day yield of the fund at period end. A complete unaudited listing of the fund’s holdings as of its most recent quarter end is available upon request.
(c) Includes investment made with cash collateral received from securities on loan.
(d) Security or a portion of the security is on loan at period end.
(e) Security exempt from registration under Rule 144A of the Securities Act of 1933. These securities may be resold in transactions exempt from registration, normally to qualified institutional buyers. At the period end, the value of these securities amounted to $3,366 or 0.0% of net assets.
See accompanying notes which are an integral part of the financial statements.
| Financial Statements | | | | | | | | |
| |
| |
| Statement of Assets and Liabilities | | | | | | | | |
| | | | | | | | | October 31, 2005 |
| |
| Assets | | | | | | | | |
| Investment in securities, at value (including securities | | | | | | | | |
| loaned of $83,400) (cost $35,231,542) — See | | | | | | | | |
| accompanying schedule | | | | | | $ | | 38,825,177 |
| Receivable for investments sold | | | | | | | | 280,853 |
| Receivable for fund shares sold | | | | | | | | 98,410 |
| Dividends receivable | | | | | | | | 23,849 |
| Interest receivable | | | | | | | | 322 |
| Receivable from investment adviser for expense | | | | | | | | |
| reductions | | | | | | | | 7,590 |
| Other affiliated receivables | | | | | | | | 351 |
| Other receivables | | | | | | | | 4,652 |
| Total assets | | | | | | | | 39,241,204 |
| |
| Liabilities | | | | | | | | |
| Payable to custodian bank | | $ | | 46,629 | | | | |
| Payable for investments purchased | | | | 308,101 | | | | |
| Payable for fund shares redeemed | | | | 32,219 | | | | |
| Accrued management fee | | | | 18,053 | | | | |
| Distribution fees payable | | | | 16,970 | | | | |
| Other affiliated payables | | | | 9,634 | | | | |
| Other payables and accrued expenses | | | | 37,616 | | | | |
| Collateral on securities loaned, at value | | | | 81,700 | | | | |
| Total liabilities | | | | | | | | 550,922 |
| |
| Net Assets | | | | | | $ | | 38,690,282 |
| Net Assets consist of: | | | | | | | | |
| Paid in capital | | | | | | $ | | 34,271,931 |
| Undistributed net investment income | | | | | | | | 7,929 |
| Accumulated undistributed net realized gain (loss) on | | | | | | | | |
| investments and foreign currency transactions | | | | | | | | 816,766 |
| Net unrealized appreciation (depreciation) on | | | | | | | | |
| investments and assets and liabilities in foreign | | | | | | | | |
| currencies | | | | | | | | 3,593,656 |
| Net Assets | | | | | | $ | | 38,690,282 |
See accompanying notes which are an integral part of the financial statements.
23 Annual Report
| Financial Statements - continued | | | | |
| |
| |
| |
| Statement of Assets and Liabilities | | | | |
| | | October 31, 2005 |
| Calculation of Maximum Offering Price | | | | |
| Class A: | | | | |
| Net Asset Value and redemption price per share | | | | |
| ($7,120,788 ÷ 538,577 shares) | | $ | | 13.22 |
| Maximum offering price per share (100/94.25 of $13.22) | | $ | | 14.03 |
| Class T: | | | | |
| Net Asset Value and redemption price per share | | | | |
| ($21,580,159 ÷ 1,642,665 shares) | | $ | | 13.14 |
| Maximum offering price per share (100/96.50 of $13.14) | | $ | | 13.62 |
| Class B: | | | | |
| Net Asset Value and offering price per share ($4,240,096 | | | | |
| ÷ 326,313 shares)A | | $ | | 12.99 |
| Class C: | | | | |
| Net Asset Value and offering price per share ($3,891,904 | | | | |
| ÷ 299,543 shares)A | | $ | | 12.99 |
| Institutional Class: | | | | |
| Net Asset Value, offering price and redemption price per | | | | |
| share ($1,857,335 ÷ 139,896 shares) | | $ | | 13.28 |
| |
| A Redemption price per share is equal to net asset value less any applicable contingent deferred sales charge. | | | | |
See accompanying notes which are an integral part of the financial statements.
Annual Report 24
| Statement of Operations | | | | | | |
| | | | | Year ended October 31, 2005 |
| |
| Investment Income | | | | | | |
| Dividends | | | | $ | | 559,182 |
| Interest | | | | | | 16,818 |
| Security lending | | | | | | 1,244 |
| Total income | | | | | | 577,244 |
| |
| Expenses | | | | | | |
| Management fee | | $ | | 189,039 | | |
| Transfer agent fees | | | | 83,765 | | |
| Distribution fees | | | | 177,186 | | |
| Accounting and security lending fees | | | | 17,447 | | |
| Independent trustees’ compensation | | | | 147 | | |
| Custodian fees and expenses | | | | 18,850 | | |
| Registration fees | | | | 62,903 | | |
| Audit | | | | 36,493 | | |
| Legal | | | | 1,384 | | |
| Miscellaneous | | | | 1,192 | | |
| Total expenses before reductions | | | | 588,406 | | |
| Expense reductions | | | | (75,554) | | 512,852 |
| |
| Net investment income (loss) | | | | | | 64,392 |
| Realized and Unrealized Gain (Loss) | | | | | | |
| Net realized gain (loss) on: | | | | | | |
| Investment securities | | | | 883,951 | | |
| Foreign currency transactions | | | | (436) | | |
| Total net realized gain (loss) | | | | | | 883,515 |
| Change in net unrealized appreciation (depreciation) on: | | | | |
| Investment securities | | | | 2,424,608 | | |
| Assets and liabilities in foreign currencies | | | | 20 | | |
| Total change in net unrealized appreciation | | | | | | |
| (depreciation) | | | | | | 2,424,628 |
| Net gain (loss) | | | | | | 3,308,143 |
| Net increase (decrease) in net assets resulting from | | | | | | |
| operations | | | | $ | | 3,372,535 |
See accompanying notes which are an integral part of the financial statements.
25 Annual Report
| Financial Statements - continued | | | | | | | | |
| |
| |
| Statement of Changes in Net Assets | | | | | | | | |
| | | | | Year ended | | | | Year ended |
| | | | | October 31, | | | | October 31, |
| | | | | 2005 | | | | 2004 |
| Increase (Decrease) in Net Assets | | | | | | | | |
| Operations | | | | | | | | |
| Net investment income (loss) | | $ | | 64,392 | | $ | | (17,048) |
| Net realized gain (loss) | | | | 883,515 | | | | (3,779) |
| Change in net unrealized appreciation (depreciation) . | | | | 2,424,628 | | | | 939,930 |
| Net increase (decrease) in net assets resulting | | | | | | | | |
| from operations | | | | 3,372,535 | | | | 919,103 |
| Distributions to shareholders from net investment income . | | | | (59,389) | | | | — |
| Distributions to shareholders from net realized gain | | | | (20,268) | | | | — |
| Total distributions | | | | (79,657) | | | | — |
| Share transactions -- net increase (decrease) | | | | 12,400,050 | | | | 16,177,102 |
| Total increase (decrease) in net assets | | | | 15,692,928 | | | | 17,096,205 |
| |
| Net Assets | | | | | | | | |
| Beginning of period | | | | 22,997,354 | | | | 5,901,149 |
| End of period (including undistributed net investment | | | | | | | | |
| income of $7,929 and undistributed net investment | | | | | | | | |
| income of $0, respectively) | | $ | | 38,690,282 | | $ | | 22,997,354 |
See accompanying notes which are an integral part of the financial statements.
| Financial Highlights — Class A | | | | | | | | | | | | |
| |
| Years ended October 31, | | | | 2005 | | | | 2004 | | | | 2003F |
| Selected Per-Share Data | | | | | | | | | | | | |
| Net asset value, beginning of period | | $ | | 11.70 | | $ | | 10.37 | | $ | | 10.00 |
| Income from Investment Operations | | | | | | | | | | | | |
| Net investment income (loss)E | | | | 06 | | | | .01 | | | | —H |
| Net realized and unrealized gain (loss) | | | | 1.51 | | | | 1.32 | | | | .37 |
| Total from investment operations | | | | 1.57 | | | | 1.33 | | | | .37 |
| Distributions from net investment income | | | | (.04) | | | | — | | | | — |
| Distributions from net realized gain | | | | (.01) | | | | — | | | | — |
| Total distributions | | | | (.05) | | | | — | | | | — |
| Net asset value, end of period | | $ | | 13.22 | | $ | | 11.70 | | $ | | 10.37 |
| Total ReturnB,C,D | | | | 13.40% | | | | 12.83% | | | | 3.70% |
| Ratios to Average Net AssetsG | | | | | | | | | | | | |
| Expenses before expense reductions | | | | 1.50% | | | | 3.39% | | | | 5.52%A |
| Expenses net of voluntary waivers, if any | | | | 1.30% | | | | 1.50% | | | | 1.75%A |
| Expenses net of all reductions | | | | 1.26% | | | | 1.47% | | | | 1.73%A |
| Net investment income (loss) | | | | 48% | | | | .11% | | | | (.05)%A |
| Supplemental Data | | | | | | | | | | | | |
| Net assets, end of period (000 omitted) | | $ | | 7,121 | | $ | | 4,000 | | $ | | 1,123 |
| Portfolio turnover rate | | | | 86% | | | | 111% | | | | 108%A |
A Annualized
B Total returns for periods of less than one year are not annualized.
C Total returns would have been lower had certain expenses not been reduced during the periods shown. D Total returns do not include the effect of the sales charges.
E Calculated based on average shares outstanding during the period.
F For the period June 17, 2003 (commencement of operations) to October 31, 2003.
G Expense ratios reflect operating expenses of the class. Expenses before reductions do not reflect amounts reimbursed by the investment adviser or reductions from brokerage service arrangements or other expense offset arrangements and do not represent the amount paid by the class during periods when reimbursements or reductions occur. Expense ratios before reductions for start up periods may not be representative of longer term operating periods. Expenses net of any voluntary waivers reflect expenses after reimbursement by the investment adviser but prior to reductions from brokerage service arrangements or other expense offset arrangements. Expenses net of all reductions represent the net expenses paid by the class.
H Amount represents less than $.01 per share.
See accompanying notes which are an integral part of the financial statements.
27 Annual Report
| Financial Highlights — Class T | | | | | | | | | | | | |
| |
| Years ended October 31, | | | | 2005 | | | | 2004 | | | | 2003F |
| Selected Per-Share Data | | | | | | | | | | | | |
| Net asset value, beginning of period | | $ | | 11.67 | | $ | | 10.36 | | $ | | 10.00 |
| Income from Investment Operations | | | | | | | | | | | | |
| Net investment income (loss)E | | | | 03 | | | | (.02) | | | | (.01) |
| Net realized and unrealized gain (loss) | | | | 1.48 | | | | 1.33 | | | | .37 |
| Total from investment operations | | | | 1.51 | | | | 1.31 | | | | .36 |
| Distributions from net investment income | | | | (.03) | | | | — | | | | — |
| Distributions from net realized gain | | | | (.01) | | | | — | | | | — |
| Total distributions | | | | (.04) | | | | — | | | | — |
| Net asset value, end of period | | $ | | 13.14 | | $ | | 11.67 | | $ | | 10.36 |
| Total ReturnB,C,D | | | | 12.96% | | | | 12.64% | | | | 3.60% |
| Ratios to Average Net AssetsG | | | | | | | | | | | | |
| Expenses before expense reductions | | | | 1.72% | | | | 3.30% | | | | 5.77%A |
| Expenses net of voluntary waivers, if any | | | | 1.55% | | | | 1.75% | | | | 2.00%A |
| Expenses net of all reductions | | | | 1.51% | | | | 1.72% | | | | 1.98%A |
| Net investment income (loss) | | | | 23% | | | | (.14)% | | | | (.30)%A |
| Supplemental Data | | | | | | | | | | | | |
| Net assets, end of period (000 omitted) | | $21,580 | | $13,340 | | $ | | 1,546 |
| Portfolio turnover rate | | | | 86% | | | | 111% | | | | 108%A |
A Annualized
B Total returns for periods of less than one year are not annualized.
C Total returns would have been lower had certain expenses not been reduced during the periods shown. D Total returns do not include the effect of the sales charges.
E Calculated based on average shares outstanding during the period.
F For the period June 17, 2003 (commencement of operations) to October 31, 2003.
G Expense ratios reflect operating expenses of the class. Expenses before reductions do not reflect amounts reimbursed by the investment adviser or reductions from brokerage service arrangements or other expense offset arrangements and do not represent the amount paid by the class during periods when reimbursements or reductions occur. Expense ratios before reductions for start up periods may not be representative of longer term operating periods. Expenses net of any voluntary waivers reflect expenses after reimbursement by the investment adviser but prior to reductions from brokerage service arrangements or other expense offset arrangements. Expenses net of all reductions represent the net expenses paid by the class.
See accompanying notes which are an integral part of the financial statements.
| Financial Highlights — Class B | | | | | | | | | | | | |
| |
| Years ended October 31, | | | | 2005 | | | | 2004 | | | | 2003F |
| Selected Per-Share Data | | | | | | | | | | | | |
| Net asset value, beginning of period | | $ | | 11.59 | | $ | | 10.34 | | $ | | 10.00 |
| Income from Investment Operations | | | | | | | | | | | | |
| Net investment income (loss)E | | | | (.03) | | | | (.07) | | | | (.03) |
| Net realized and unrealized gain (loss) | | | | 1.46 | | | | 1.32 | | | | .37 |
| Total from investment operations | | | | 1.43 | | | | 1.25 | | | | .34 |
| Distributions from net investment income | | | | (.02) | | | | — | | | | — |
| Distributions from net realized gain | | | | (.01) | | | | — | | | | — |
| Total distributions | | | | (.03) | | | | — | | | | — |
| Net asset value, end of period | | $ | | 12.99 | | $ | | 11.59 | | $ | | 10.34 |
| Total ReturnB,C,D | | | | 12.35% | | | | 12.09% | | | | 3.40% |
| Ratios to Average Net AssetsG | | | | | | | | | | | | |
| Expenses before expense reductions | | | | 2.31% | | | | 4.33% | | | | 6.24%A |
| Expenses net of voluntary waivers, if any | | | | 2.05% | | | | 2.25% | | | | 2.50%A |
| Expenses net of all reductions | | | | 2.01% | | | | 2.22% | | | | 2.48%A |
| Net investment income (loss) | | | | (.27)% | | | | (.64)% | | | | (.80)%A |
| Supplemental Data | | | | | | | | | | | | |
| Net assets, end of period (000 omitted) | | $ | | 4,240 | | $ | | 2,560 | | $ | | 1,125 |
| Portfolio turnover rate | | | | 86% | | | | 111% | | | | 108%A |
A Annualized
B Total returns for periods of less than one year are not annualized.
C Total returns would have been lower had certain expenses not been reduced during the periods shown. D Total returns do not include the effect of the contingent deferred sales charge.
E Calculated based on average shares outstanding during the period.
F For the period June 17, 2003 (commencement of operations) to October 31, 2003.
G Expense ratios reflect operating expenses of the class. Expenses before reductions do not reflect amounts reimbursed by the investment adviser or reductions from brokerage service arrangements or other expense offset arrangements and do not represent the amount paid by the class during periods when reimbursements or reductions occur. Expense ratios before reductions for start up periods may not be representative of longer term operating periods. Expenses net of any voluntary waivers reflect expenses after reimbursement by the investment adviser but prior to reductions from brokerage service arrangements or other expense offset arrangements. Expenses net of all reductions represent the net expenses paid by the class.
See accompanying notes which are an integral part of the financial statements.
29 Annual Report
| Financial Highlights — Class C | | | | | | | | | | | | |
| |
| Years ended October 31, | | | | 2005 | | | | 2004 | | | | 2003F |
| Selected Per-Share Data | | | | | | | | | | | | |
| Net asset value, beginning of period | | $ | | 11.58 | | $ | | 10.34 | | $ | | 10.00 |
| Income from Investment Operations | | | | | | | | | | | | |
| Net investment income (loss)E | | | | (.03) | | | | (.07) | | | | (.03) |
| Net realized and unrealized gain (loss) | | | | 1.47 | | | | 1.31 | | | | .37 |
| Total from investment operations | | | | 1.44 | | | | 1.24 | | | | .34 |
| Distributions from net investment income | | | | (.02) | | | | — | | | | — |
| Distributions from net realized gain | | | | (.01) | | | | — | | | | — |
| Total distributions | | | | (.03) | | | | — | | | | — |
| Net asset value, end of period | | $ | | 12.99 | | $ | | 11.58 | | $ | | 10.34 |
| Total ReturnB,C,D | | | | 12.45% | | | | 11.99% | | | | 3.40% |
| Ratios to Average Net AssetsG | | | | | | | | | | | | |
| Expenses before expense reductions | | | | 2.30% | | | | 4.39% | | | | 6.24%A |
| Expenses net of voluntary waivers, if any | | | | 2.05% | | | | 2.25% | | | | 2.50%A |
| Expenses net of all reductions | | | | 2.01% | | | | 2.22% | | | | 2.48%A |
| Net investment income (loss) | | | | (.27)% | | | | (.64)% | | | | (.80)%A |
| Supplemental Data | | | | | | | | | | | | |
| Net assets, end of period (000 omitted) | | $ | | 3,892 | | $ | | 1,815 | | $ | | 1,069 |
| Portfolio turnover rate | | | | 86% | | | | 111% | | | | 108%A |
A Annualized
B Total returns for periods of less than one year are not annualized.
C Total returns would have been lower had certain expenses not been reduced during the periods shown. D Total returns do not include the effect of the contingent deferred sales charge.
E Calculated based on average shares outstanding during the period.
F For the period June 17, 2003 (commencement of operations) to October 31, 2003.
G Expense ratios reflect operating expenses of the class. Expenses before reductions do not reflect amounts reimbursed by the investment adviser or reductions from brokerage service arrangements or other expense offset arrangements and do not represent the amount paid by the class during periods when reimbursements or reductions occur. Expense ratios before reductions for start up periods may not be representative of longer term operating periods. Expenses net of any voluntary waivers reflect expenses after reimbursement by the investment adviser but prior to reductions from brokerage service arrangements or other expense offset arrangements. Expenses net of all reductions represent the net expenses paid by the class.
See accompanying notes which are an integral part of the financial statements.
| Financial Highlights — Institutional Class | | | | | | | | | | | | |
| |
| Years ended October 31, | | | | 2005 | | | | 2004 | | | | 2003E |
| Selected Per-Share Data | | | | | | | | | | | | |
| Net asset value, beginning of period | | $ | | 11.75 | | $ | | 10.38 | | $ | | 10.00 |
| Income from Investment Operations | | | | | | | | | | | | |
| Net investment income (loss)D | | | | 09 | | | | .04 | | | | .01 |
| Net realized and unrealized gain (loss) | | | | 1.49 | | | | 1.33 | | | | .37 |
| Total from investment operations | | | | 1.58 | | | | 1.37 | | | | .38 |
| Distributions from net investment income | | | | (.04) | | | | — | | | | — |
| Distributions from net realized gain | | | | (.01) | | | | — | | | | — |
| Total distributions | | | | (.05) | | | | — | | | | — |
| Net asset value, end of period | | $ | | 13.28 | | $ | | 11.75 | | $ | | 10.38 |
| Total ReturnB,C | | | | 13.47% | | | | 13.20% | | | | 3.80% |
| Ratios to Average Net AssetsF | | | | | | | | | | | | |
| Expenses before expense reductions | | | | 1.14% | | | | 3.41% | | | | 5.27%A |
| Expenses net of voluntary waivers, if any | | | | 1.06% | | | | 1.25% | | | | 1.50%A |
| Expenses net of all reductions | | | | 1.02% | | | | 1.22% | | | | 1.48%A |
| Net investment income (loss) | | | | 72% | | | | .36% | | | | .20%A |
| Supplemental Data | | | | | | | | | | | | |
| Net assets, end of period (000 omitted) | | $ | | 1,857 | | $ | | 1,282 | | $ | | 1,038 |
| Portfolio turnover rate | | | | 86% | | | | 111% | | | | 108%A |
A Annualized
B Total returns for periods of less than one year are not annualized.
C Total returns would have been lower had certain expenses not been reduced during the periods shown. D Calculated based on average shares outstanding during the period.
E For the period June 17, 2003 (commencement of operations) to October 31, 2003.
F Expense ratios reflect operating expenses of the class. Expenses before reductions do not reflect amounts reimbursed by the investment adviser or reductions from brokerage service arrangements or other expense offset arrangements and do not represent the amount paid by the class during periods when reimbursements or reductions occur. Expense ratios before reductions for start up periods may not be representative of longer term operating periods. Expenses net of any voluntary waivers reflect expenses after reimbursement by the investment adviser but prior to reductions from brokerage service arrangements or other expense offset arrangements. Expenses net of all reductions represent the net expenses paid by the class.
See accompanying notes which are an integral part of the financial statements.
31 Annual Report
Notes to Financial Statements
For the period ended October 31, 2005
|
1. Significant Accounting Policies.
Fidelity Advisor Value Leaders Fund (the fund) is a non-diversified fund of Fidelity Advisor Series VIII (the trust) and is authorized to issue an unlimited number of shares. The trust is registered under the Investment Company Act of 1940, as amended (the 1940 Act), as an open-end management investment company organized as a Massachusetts business trust.
The fund offers Class A, Class T, Class B, Class C, and Institutional Class shares, each of which has equal rights as to assets and voting privileges. Each class has exclusive voting rights with respect to matters that affect that class. Class B shares will automatically convert to Class A shares after a holding period of seven years from the initial date of purchase. Investment income, realized and unrealized capital gains and losses, the common expenses of the fund, and certain fund-level expense reductions, if any, are allocated on a pro rata basis to each class based on the relative net assets of each class to the total net assets of the fund. Each class differs with respect to transfer agent and distribution and service plan fees incurred. Certain expense reductions also differ by class.
The fund may invest in affiliated money market central funds (Money Market Central Funds), which are open-end investment companies available to investment companies and other accounts managed by Fidelity Management & Research Company (FMR) and its affiliates. The financial statements have been prepared in conformity with accounting principles generally accepted in the United States of America, which require management to make certain estimates and assumptions at the date of the financial statements. The following summarizes the significant accounting policies of the fund:
Security Valuation. Investments are valued and net asset value (NAV) per share is calculated (NAV calculation) as of the close of business of the New York Stock Exchange (NYSE), normally 4:00 p.m. Eastern time. Wherever possible, the fund uses independent pricing services approved by the Board of Trustees to value its investments.
Equity securities, including restricted securities, for which market quotations are readily available, are valued at the last reported sale price or official closing price as reported by an independent pricing service on the primary market or exchange on which they are traded. In the event there were no sales during the day or closing prices are not available, securities are valued at the last quoted bid price. Investments in open-end mutual funds, are valued at their closing net asset value each business day. Short-term securities with remaining maturities of sixty days or less for which quotations are not readily available are valued at amortized cost, which approximates value.
When current market prices or quotations are not readily available or do not accurately reflect fair value, valuations may be determined in accordance with procedures adopted by the Board of Trustees. For example, when developments occur between the close of a market and the close of the NYSE that may materially affect the value of some or all of
1. Significant Accounting Policies - continued
Security Valuation - continued
the securities, or when trading in a security is halted, those securities may be fair valued. Factors used in the determination of fair value may include monitoring news to identify significant market or security specific events such as changes in the value of U.S. securities market, reviewing developments in foreign markets and evaluating the performance of ADRs, futures contracts and exchange-traded funds. Because the fund’s utilization of fair value pricing depends on market activity, the frequency with which fair value pricing is used can not be predicted and may be utilized to a significant extent. The value of securities used for NAV calculation under fair value pricing may differ from published prices for the same securities.
Foreign Currency. The fund uses foreign currency contracts to facilitate transactions in foreign-denominated securities. Losses from these transactions may arise from changes in the value of the foreign currency or if the counterparties do not perform under the contracts’ terms. Foreign-denominated assets, including investment securities, and liabilities are translated into U.S. dollars at the exchange rate at period end. Purchases and sales of investment securities, income and dividends received and expenses denominated in foreign currencies are translated into U.S. dollars at the exchange rate in effect on the transaction date.
The effects of exchange rate fluctuations on investments are included with the net realized and unrealized gain (loss) on investment securities. Other foreign currency transactions resulting in realized and unrealized gain (loss) are disclosed separately.
Investment Transactions and Income. Security transactions are accounted for as of trade date. Gains and losses on securities sold are determined on the basis of identified cost. Dividend income is recorded on the ex-dividend date, except for certain dividends from foreign securities where the ex-dividend date may have passed, which are recorded as soon as the fund is informed of the ex-dividend date. Non-cash dividends included in dividend income, if any, are recorded at the fair market value of the securities received. Distributions received on securities that represent a return of capital or capital gains are recorded as a reduction of cost of investments and/or as a realized gain. The fund estimates the components of distributions received that may be considered return of capital distributions or capital gain distributions. Interest income is accrued as earned. Interest income includes coupon interest and amortization of premium and accretion of discount on debt securities. Investment income is recorded net of foreign taxes withheld where recovery of such taxes is uncertain.
Expenses. Most expenses of the trust can be directly attributed to a fund. Expenses which cannot be directly attributed are apportioned among each fund in the trust.
33 Annual Report
Notes to Financial Statements - continued
1. Significant Accounting Policies - continued
Income Tax Information and Distributions to Shareholders. Each year, the fund intends to qualify as a regulated investment company by distributing all of its taxable income and realized gains under Subchapter M of the Internal Revenue Code. As a result, no provision for income taxes is required in the accompanying financial statements. Foreign taxes are provided for based on the fund’s understanding of the tax rules and rates that exist in the foreign markets in which it invests.
Distributions are recorded on the ex-dividend date. Income dividends and capital gain distributions are declared separately for each class. Income and capital gain distributions are determined in accordance with income tax regulations, which may differ from generally accepted accounting principles. In addition, the fund will claim a portion of the payment made to redeeming shareholders as a distribution for income tax purposes.
Capital accounts within the financial statements are adjusted for permanent book-tax differences. These adjustments have no impact on net assets or the results of operations. Temporary book-tax differences will reverse in a subsequent period.
Book-tax differences are primarily due to foreign currency transactions and losses deferred due to wash sales.
The tax-basis components of distributable earnings and the federal tax cost as of period end were as follows:
| Unrealized appreciation | | $ | | 4,606,359 | | | | |
| Unrealized depreciation | | | | (1,185,891) | | | | |
| Net unrealized appreciation (depreciation) | | | | 3,420,468 | | | | |
| Undistributed ordinary income | | | | 259,857 | | | | |
| Undistributed long-term capital gain | | | | 702,221 | | | | |
| |
| Cost for federal income tax purposes | | $ | | 35,404,709 | | | | |
| |
| The tax character of distributions paid was as follows: | | | | |
| |
| | | | | October 31, 2005 | | | | October 31, 2004 |
| Ordinary Income | | $ | | 59,389 | | $ | | — |
| Long-term Capital Gains | | | | 20,268 | | | | — |
| Total | | $ | | 79,657 | | $ | | — |
Repurchase Agreements. FMR has received an Exemptive Order from the Securities and Exchange Commission (the SEC) which permits the fund and other affiliated entities of FMR to transfer uninvested cash balances into joint trading accounts which are then invested in repurchase agreements. The fund may also invest directly with institutions in repurchase agreements. Repurchase agreements are collateralized by government or non-government securities. Collateral is held in segregated accounts with custodian banks and may be obtained in the event of a default of the counterparty. The fund monitors, on a daily basis, the value of the collateral to ensure it is at least equal to the principal amount of the repurchase agreement (including accrued interest). In the event of a default by the counterparty, realization of the collateral proceeds could be delayed, during which time the value of the collateral may decline.
Restricted Securities. The fund may invest in securities that are subject to legal or contractual restrictions on resale. These securities generally may be resold in transactions exempt from registration or to the public if the securities are registered. Disposal of these securities may involve time-consuming negotiations and expense, and prompt sale at an acceptable price may be difficult. Information regarding restricted securities is included at the end of the fund’s Schedule of Investments.
3. Purchases and Sales of Investments.
Purchases and sales of securities, other than short-term securities and U.S. government securities, aggregated $40,819,326 and $28,101,275, respectively.
4. Fees and Other Transactions with Affiliates.
Management Fee. FMR and its affiliates provide the fund with investment management related services for which the fund pays a monthly management fee. The management fee is the sum of an individual fund fee rate that is based on an annual rate of .30% of the fund’s average net assets and a group rate fee that averaged .27% during the period. The group fee rate is based upon the average net assets of all the mutual funds advised by FMR. The group fee rate decreases as assets under management increase and increases as assets under management decrease. For the period, the total annual management fee rate was .57% of the fund’s average net assets.
Distribution and Service Plan. In accordance with Rule 12b-1 of the 1940 Act, the fund has adopted separate Distribution and Service Plans for each class of shares. Certain classes pay Fidelity Distributors Corporation (FDC), an affiliate of FMR, separate Distribution and Service Fees, each of which is based on an annual percentage of each class’ average net assets. In addition, FDC may pay financial intermediaries for selling
35 Annual Report
Notes to Financial Statements - continued
4. Fees and Other Transactions with Affiliates - continued
Distribution and Service Plan - continued
shares of the fund and providing shareholder support services. For the period, the Distribution and Service Fee rates and the total amounts paid to and retained by FDC were as follows:
| | | Distribution | | Service | | | | Paid to | | | | Retained |
| | | Fee | | Fee | | | | FDC | | | | by FDC |
| Class A | | 0% | | .25% | | $ | | 14,217 | | $ | | 3,185 |
| Class T | | 25% | | .25% | | | | 94,672 | | | | 6,206 |
| Class B | | 75% | | .25% | | | | 37,727 | | | | 31,444 |
| Class C | | 75% | | .25% | | | | 30,570 | | | | 21,916 |
| |
| | | | | | | $ | | 177,186 | | $ | | 62,751 |
Sales Load. FDC receives a front-end sales charge of up to 5.75% for selling Class A shares, and 3.50% for selling Class T shares, some of which is paid to financial intermediaries for selling shares of the fund. FDC receives the proceeds of contingent deferred sales charges levied on Class A, Class T, Class B, and Class C redemptions. These charges depend on the holding period. The deferred sales charges range from 5% to 1% for Class B, 1% for Class C, and .25% for certain purchases of Class A and Class T shares.
| For the period, sales charge amounts retained by FDC were as follows: | | |
| |
| | | | | Retained |
| | | | | by FDC |
| Class A | | $ | | 9,281 |
| Class T | | | | 4,757 |
| Class B* | | | | 3,117 |
| Class C* | | | | 665 |
| | | $ | | 17,820 |
* When Class B and Class C shares are initially sold, FDC pays commissions from its own resources to financial intermediaries through which the sales are made.
Transfer Agent Fees. Fidelity Investments Institutional Operations Company, Inc. (FIIOC), an affiliate of FMR, is the transfer, dividend disbursing and shareholder servicing agent for each class of the fund. FIIOC receives account fees and asset-based fees that vary according to the account size and type of account of the shareholders of the respective classes of the fund. FIIOC pays for typesetting, printing and mailing of
4. Fees and Other Transactions with Affiliates - continued
Transfer Agent Fees - continued
|
shareholder reports, except proxy statements. For the period the total transfer agent fees paid by each class to FIIOC, were as follows:
| | | | | | | % of |
| | | | | | | Average |
| | | | | Amount | | Net Assets |
| Class A | | $ | | 14,881 | | .26 |
| Class T | | | | 44,604 | | .24 |
| Class B | | | | 12,174 | | .32 |
| Class C | | | | 9,715 | | .32 |
| Institutional Class | | | | 2,391 | | .15 |
| | | $ | | 83,765 | | |
Accounting and Security Lending Fees. Fidelity Service Company, Inc. (FSC), an affiliate of FMR, maintains the fund’s accounting records. The accounting fee is based on the level of average net assets for the month. Under a separate contract, FSC administers the security lending program. The security lending fee is based on the number and duration of lending transactions.
Affiliated Central Funds. The fund may invest in Money Market Central Funds which seek preservation of capital and current income and are managed by Fidelity Investments Money Management, Inc. (FIMM), an affiliate of FMR.
The Money Market Central Funds do not pay a management fee. Income distributions earned by the fund are recorded as income in the accompanying financial statements and totaled $18,664 for the period.
Brokerage Commissions. The fund placed a portion of its portfolio transactions with brokerage firms which are affiliates of the investment adviser. The commissions paid to these affiliated firms were $2,429 for the period.
5. Committed Line of Credit.
|
The fund participates with other funds managed by FMR in a $4.2 billion credit facility (the “line of credit”) to be utilized for temporary or emergency purposes to fund shareholder redemptions or for other short-term liquidity purposes. The fund has agreed to pay commitment fees on its pro rata portion of the line of credit. During the period, there were no borrowings on this line of credit.
37 Annual Report
Notes to Financial Statements - continued
6. Security Lending.
The fund lends portfolio securities from time to time in order to earn additional income. The fund receives collateral (in the form of U.S. Treasury obligations, letters of credit and/or cash) against the loaned securities and maintains collateral in an amount not less than 100% of the market value of the loaned securities during the period of the loan. The market value of the loaned securities is determined at the close of business of the fund and any additional required collateral is delivered to the fund on the next business day. If the borrower defaults on its obligation to return the securities loaned because of insolvency or other reasons, a fund could experience delays and costs in recovering the securities loaned or in gaining access to the collateral. Cash collateral is invested in the Fidelity Securities Lending Cash Central Fund. The value of loaned securities and cash collateral at period end are disclosed on the fund’s Statement of Assets and Liabilities. Security lending income represents the income earned on investing cash collateral, less fees and expenses associated with the loan, plus any premium payments that may be received on the loan of certain types of securities.
FMR voluntarily agreed to reimburse each class to the extent annual operating expenses exceeded certain levels of average net assets as noted in the table below. Some expenses, for example interest expense, are excluded from this reimbursement.
The following classes were in reimbursement during the period:
| | | Expense | | | | Reimbursement |
| | | Limitations | | | | from adviser |
| |
| Class A | | 1.50% --1.25%* | | $ | | 11,101 |
| Class T | | 1.75% | | -- | | 1.50%* | | | | 32,603 |
| Class B | | 2.25% | | -- | | 2.00%* | | | | 9,702 |
| Class C | | 2.25% | | -- | | 2.00%* | | | | 7,697 |
| Institutional Class | | 1.25% | | -- | | 1.00%* | | | | 1,265 |
| | | | | | | | | $ | | 62,368 |
| * Expense limitation in effect at period end. | | | | | | | | | | |
Many of the brokers with whom FMR places trades on behalf of the fund provided services to the fund in addition to trade execution. These services included payments of certain expenses on behalf of the fund totaling $13,186 for the period.
The fund’s organizational documents provide former and current trustees and officers with a limited indemnification against liabilities arising in connection with the performance of their duties to the fund. In the normal course of business, the fund may also enter into contracts that provide general indemnifications. The fund’s maximum exposure under these arrangements is unknown as this would be dependent on future claims that may be made against the fund. The risk of material loss from such claims is considered remote.
| 9. Distributions to Shareholders. | | | | | | | | |
| |
| Distributions to shareholders of each class were as follows: | | | | | | |
| |
| Years ended October 31, | | | | 2005 | | | | 2004 | | |
| From net investment income | | | | | | | | | | |
| Class A | | $ | | 12,129 | | $ | | | | — |
| Class T | | | | 34,269 | | | | | | — |
| Class B | | | | 5,103 | | | | | | — |
| Class C | | | | 3,425 | | | | | | — |
| Institutional Class | | | | 4,463 | | | | | | — |
| Total | | $ | | 59,389 | | $ | | | | — |
| From net realized gain | | | | | | | | | | |
| Class A | | $ | | 3,465 | | $ | | | | — |
| Class T | | | | 11,423 | | | | | | — |
| Class B | | | | 2,551 | | | | | | — |
| Class C | | | | 1,713 | | | | | | — |
| Institutional Class | | | | 1,116 | | | | | | — |
| Total | | $ | | 20,268 | | $ | | | | — |
39 Annual Report
| Notes to Financial Statements - continued | | | | | | | | |
| |
| |
| 10. Share Transactions. | | | | | | | | | | | | |
| |
| Transactions for each class of shares were as follows: | | | | | | | | |
| |
| | | Shares | | | | | | Dollars | | |
| | | Years ended October 31, | | | | Years ended October 31, |
| | | 2005 | | 2004 | | | | 2005 | | | | 2004 |
| Class A | | | | | | | | | | | | |
| Shares sold | | 229,609 | | 238,269 | | $ | | 2,958,743 | | $ | | 2,746,499 |
| Reinvestment of distributions | | 1,066 | | — | | | | 13,266 | | | | — |
| Shares redeemed | | (33,940) | | (4,657) | | | | (427,578) | | | | (52,873) |
| Net increase (decrease) | | 196,735 | | 233,612 | | $ | | 2,544,431 | | $ | | 2,693,626 |
| Class T | | | | | | | | | | | | |
| Shares sold | | 774,584 | | 1,030,154 | | $ | | 9,925,711 | | $ 11,903,301 |
| Reinvestment of distributions | | 3,489 | | — | | | | 43,232 | | | | — |
| Shares redeemed | | (279,010) | | (35,709) | | | | (3,602,636) | | | | (410,022) |
| Net increase (decrease) | | 499,063 | | 994,445 | | $ | | 6,366,307 | | $ 11,493,279 |
| Class B | | | | | | | | | | | | |
| Shares sold | | 178,938 | | 122,344 | | $ | | 2,237,451 | | $ | | 1,393,395 |
| Reinvestment of distributions | | 545 | | — | | | | 6,714 | | | | — |
| Shares redeemed | | (74,090) | | (10,214) | | | | (937,154) | | | | (114,565) |
| Net increase (decrease) | | 105,393 | | 112,130 | | $ | | 1,307,011 | | $ | | 1,278,830 |
| Class C | | | | | | | | | | | | |
| Shares sold | | 165,584 | | 59,183 | | $ | | 2,070,746 | | $ | | 669,159 |
| Reinvestment of distributions | | 415 | | — | | | | 5,114 | | | | — |
| Shares redeemed | | (23,171) | | (5,841) | | | | (293,654) | | | | (64,678) |
| Net increase (decrease) | | 142,828 | | 53,342 | | $ | | 1,782,206 | | $ | | 604,481 |
| Institutional Class | | | | | | | | | | | | |
| Shares sold | | 31,161 | | 9,131 | | $ | | 405,122 | | $ | | 106,886 |
| Reinvestment of distributions | | 413 | | — | | | | 5,149 | | | | — |
| Shares redeemed | | (810) | | — | | | | (10,176) | | | | — |
| Net increase (decrease) | | 30,764 | | 9,131 | | $ | | 400,095 | | $ | | 106,886 |
Report of Independent Registered Public Accounting Firm
To the Trustees of Fidelity Advisor Series VIII and the Shareholders of Fidelity Advisor Value Leaders Fund:
In our opinion, the accompanying statement of assets and liabilities, including the schedule of investments, and the related statements of operations and of changes in net assets and the financial highlights present fairly, in all material respects, the financial position of Fidelity Advisor Value Leaders Fund (a fund of Fidelity Advisor Series VIII) at October 31, 2005 and the results of its operations, the changes in its net assets and the financial highlights for the periods indicated, in conformity with accounting principles generally accepted in the United States of America. These financial statements and financial highlights (hereafter referred to as “financial statements”) are the responsibility of the Fidelity Advisor Value Leaders Fund’s management; our responsibility is to express an opinion on these financial statements based on our audits. We conducted our audits of these financial statements in accordance with the standards of the Public Company Accounting Oversight Board (United States). Those standards require that we plan and perform the audit to obtain reasonable assurance about whether the financial statements are free of material misstatement. An audit includes examining, on a test basis, evidence supporting the amounts and disclosures in the financial statements, assessing the accounting principles used and significant estimates made by management, and evaluating the overall financial statement presentation. We believe that our audits, which included confirmation of securities at October 31, 2005 by correspondence with the custodian and brokers, provide a reasonable basis for our opinion.
/s/ PricewaterhouseCoopers LLP
PricewaterhouseCoopers LLP
Boston, Massachusetts
December 13, 2005
|
41 Annual Report
Trustees and Officers
The Trustees, Members of the Advisory Board, and executive officers of the trust and funds, as applicable, are listed below. The Board of Trustees governs each fund and is responsible for protecting the interests of shareholders. The Trustees are experienced executives who meet periodically throughout the year to oversee each fund’s activities, review contractual arrangements with companies that provide services to each fund, and review each fund’s performance. Except for William O. McCoy, Stephen P. Jonas, and Kenneth L. Wolfe, each of the Trustees oversees 322 funds advised by FMR or an affiliate. Mr. McCoy oversees 324 funds advised by FMR or an affiliate. Mr. Jonas and Mr. Wolfe oversee 319 funds advised by FMR or an affiliate.
The Trustees hold office without limit in time except that (a) any Trustee may resign; (b) any Trustee may be removed by written instrument, signed by at least two-thirds of the number of Trustees prior to such removal; (c) any Trustee who requests to be retired or who has become incapacitated by illness or injury may be retired by written instrument signed by a majority of the other Trustees; and (d) any Trustee may be removed at any special meeting of shareholders by a two-thirds vote of the outstanding voting securities of the trust. Each Trustee who is not an interested person (as defined in the 1940 Act) (Independent Trustee), shall retire not later than the last day of the calendar year in which his or her 72nd birthday occurs. The Independent Trustees may waive this mandatory retirement age policy with respect to individual Trustees. The executive officers and Advisory Board Members hold office without limit in time, except that any officer and Advisory Board Member may resign or may be removed by a vote of a majority of the Trustees at any regular meeting or any special meeting of the Trustees. Except as indicated, each individual has held the office shown or other offices in the same company for the past five years.
The fund’s Statement of Additional Information (SAI) includes more information about the Trustees. To request a free copy, call Fidelity at 1-877-208-0098.
Correspondence intended for each Trustee who is an interested person may be sent to Fidelity Investments, 82 Devonshire Street, Boston, Massachusetts 02109.
| Name, Age; Principal Occupation |
| |
| Edward C. Johnson 3d (75)** |
| |
| Year of Election or Appointment: 1983 |
| Mr. Johnson is Chairman of the Board of Trustees. Mr. Johnson serves |
| as Chief Executive Officer, Chairman, and a Director of FMR Corp.; a |
| Director and Chairman of the Board and of the Executive Committee of |
| FMR; Chairman and a Director of Fidelity Management & Research |
| (Far East) Inc.; Chairman and a Director of Fidelity Investments Money |
| Management, Inc.; and Chairman (2001-present) and a Director |
| (2000-present) of FMR Co., Inc. |
| Name, Age; Principal Occupation |
| |
| Abigail P. Johnson (43)** |
| |
| Year of Election or Appointment: 2001 |
| Ms. Johnson serves as President of Fidelity Employer Services Company |
| (FESCO) (2005-present). She is President and a Director of Fidelity In- |
| vestments Money Management, Inc. (2001-present), FMR Co., Inc. |
| (2001-present), and a Director of FMR Corp. Previously, Ms. Johnson |
| served as President and a Director of FMR (2001-2005), Senior Vice |
| President of the Fidelity funds (2001-2005), and managed a number of |
| Fidelity funds. |
| |
| Stephen P. Jonas (52) |
| |
| Year of Election or Appointment: 2005 |
| Mr. Jonas is Senior Vice President of Advisor Value Leaders |
| (2005-present). He also serves as Senior Vice President of other |
| Fidelity funds (2005-present). Mr. Jonas is Executive Director of FMR |
| (2005-present). Previously, Mr. Jonas served as President of Fidelity |
| Enterprise Operations and Risk Services (2004-2005), Chief Adminis- |
| trative Officer (2002-2004), and Chief Financial Officer of FMR Co. |
| (1998-2000). Mr. Jonas has been with Fidelity Investments since 1987 |
| and has held various financial and management positions including |
| Chief Financial Officer of FMR. In addition, he serves on the Boards of |
| Boston Ballet (2003-present) and Simmons College (2003-present). |
| |
| Robert L. Reynolds (53) |
| |
| Year of Election or Appointment: 2003 |
| Mr. Reynolds is a Director (2003-present) and Chief Operating Officer |
| (2002-present) of FMR Corp. He also serves on the Board at Fidelity |
| Investments Canada, Ltd. (2000-present). Previously, Mr. Reynolds |
| served as President of Fidelity Investments Institutional Retirement Group |
| (1996-2000). |
* Trustees have been determined to be “Interested Trustees” by virtue of, among other things, their affiliation with the trust or various entities under common control with FMR.
** Edward C. Johnson 3d, Trustee, is Abigail P. Johnson’s father.
43 Annual Report
Trustees and Officers - continued
Independent Trustees:
Correspondence intended for each Independent Trustee (that is, the Trustees other than the Interested Trustees) may be sent to Fidelity Investments, P.O. Box 55235, Boston, Massachusetts 02205-5235.
| Name, Age; Principal Occupation |
| |
| Dennis J. Dirks (57) |
| |
| Year of Election or Appointment: 2005 |
| Prior to his retirement in May 2003, Mr. Dirks was Chief Operating |
| Officer and a member of the Board of The Depository Trust & Clearing |
| Corporation (DTCC) (1999-2003). He also served as President, Chief |
| Operating Officer, and Board member of The Depository Trust Company |
| (DTC) (1999-2003) and President and Board member of the National |
| Securities Clearing Corporation (NSCC) (1999-2003). In addition, |
| Mr. Dirks served as Chief Executive Officer and Board member of the |
| Government Securities Clearing Corporation (2001-2003) and Chief |
| Executive Officer and Board member of the Mortgage-Backed Securities |
| Clearing Corporation (2001-2003). Mr. Dirks also serves as a Trustee of |
| Manhattan College (2005-present). |
| |
| Robert M. Gates (62) |
| |
| Year of Election or Appointment: 1997 |
| Dr. Gates is Vice Chairman of the Independent Trustees (2005-present). |
| Dr. Gates is President of Texas A&M University (2002-present). He was |
| Director of the Central Intelligence Agency (CIA) from 1991 to 1993. |
| From 1989 to 1991, Dr. Gates served as Assistant to the President of |
| the United States and Deputy National Security Advisor. Dr. Gates is a |
| Director of NACCO Industries, Inc. (mining and manufacturing), Parker |
| Drilling Co., Inc. (drilling and rental tools for the energy industry, |
| 2001-present), and Brinker International (restaurant management, |
| 2003-present). Previously, Dr. Gates served as a Director of LucasVarity |
| PLC (automotive components and diesel engines), a Director of TRW Inc. |
| (automotive, space, defense, and information technology), and Dean of |
| the George Bush School of Government and Public Service at Texas |
| A&M University (1999-2001). Dr. Gates also is a Trustee of the Forum |
| for International Policy. |
| Name, Age; Principal Occupation |
| |
| George H. Heilmeier (69) |
| |
| Year of Election or Appointment: 2004 |
| Dr. Heilmeier is Chairman Emeritus of Telcordia Technologies |
| (communication software and systems), where prior to his retirement, |
| he served as company Chairman and Chief Executive Officer. He |
| currently serves on the Boards of Directors of The Mitre Corporation |
| (systems engineering and information technology support for the |
| government), and HRL Laboratories (private research and development, |
| 2004-present). He is Chairman of the General Motors Science & |
| Technology Advisory Board and a Life Fellow of the Institute of Electrical |
| and Electronics Engineers (IEEE) (2000-present). Dr. Heilmeier is a mem- |
| ber of the Defense Science Board and the National Security Agency |
| Advisory Board. He is also a member of the National Academy of |
| Engineering, the American Academy of Arts and Sciences, and the |
| Board of Overseers of the School of Engineering and Applied Science |
| of the University of Pennsylvania. Previously, Dr. Heilmeier served as a |
| Director of TRW Inc. (automotive, space, defense, and information tech- |
| nology, 1992-2002), Compaq (1994-2002), Automatic Data Processing, |
| Inc. (ADP) (technology-based business outsourcing, 1995-2002), INET |
| Technologies Inc. (telecommunications network surveillance, 2001-2004), |
| and Teletech Holdings (customer management services). He is the recipi- |
| ent of the 2005 Kyoto Prize in Advanced Technology for his invention of |
| the liquid display. |
| |
| Marie L. Knowles (59) |
| |
| Year of Election or Appointment: 2001 |
| Prior to Ms. Knowles’ retirement in June 2000, she served as Executive |
| Vice President and Chief Financial Officer of Atlantic Richfield Company |
| (ARCO) (diversified energy, 1996-2000). From 1993 to 1996, she was |
| a Senior Vice President of ARCO and President of ARCO Transportation |
| Company. She served as a Director of ARCO from 1996 to 1998. She |
| currently serves as a Director of Phelps Dodge Corporation (copper |
| mining and manufacturing) and McKesson Corporation (healthcare ser- |
| vice, 2002-present). Ms. Knowles is a Trustee of the Brookings Institution |
| and the Catalina Island Conservancy and also serves as a member of |
| the Advisory Board for the School of Engineering of the University of |
| Southern California. |
45 Annual Report
Trustees and Officers - continued
| Name, Age; Principal Occupation |
| |
| Ned C. Lautenbach (61) |
| |
| Year of Election or Appointment: 2000 |
| Mr. Lautenbach has been a partner of Clayton, Dubilier & Rice, Inc. |
| (private equity investment firm) since September 1998. Previously, |
| Mr. Lautenbach was with the International Business Machines Corpora- |
| tion (IBM) from 1968 until his retirement in 1998. Mr. Lautenbach serves |
| as a Director of Italtel Holding S.p.A. (telecommunications (Milan, Italy), |
| 2004-present) and Eaton Corporation (diversified industrial) as well as |
| the Philharmonic Center for the Arts in Naples, Florida. He also is a |
| member of the Board of Trustees of Fairfield University (2005-present), |
| as well as a member of the Council on Foreign Relations. |
| |
| Marvin L. Mann (72) |
| |
| Year of Election or Appointment: 1993 |
| Mr. Mann is Chairman of the Independent Trustees (2001-present). He is |
| Chairman Emeritus of Lexmark International, Inc. (computer peripherals), |
| where he served as CEO until April 1998, retired as Chairman May |
| 1999, and remains a member of the Board. Prior to 1991, he held the |
| positions of Vice President of International Business Machines Corpora- |
| tion (IBM) and President and General Manager of various IBM divisions |
| and subsidiaries. He is a member of the Executive Committee of the |
| Independent Director’s Council of the Investment Company Institute. In |
| addition, Mr. Mann is a member of the President’s Cabinet at the Uni- |
| versity of Alabama and the Board of Visitors of the Culverhouse College |
| of Commerce and Business Administration at the University of Alabama. |
| |
| William O. McCoy (72) |
| |
| Year of Election or Appointment: 1997 |
| Prior to his retirement in December 1994, Mr. McCoy was Vice Chair- |
| man of the Board of BellSouth Corporation (telecommunications) and |
| President of BellSouth Enterprises. He is currently a Director of Liberty |
| Corporation (holding company), Duke Realty Corporation (real estate), |
| and Progress Energy, Inc. (electric utility). He is also a partner of Frank- |
| lin Street Partners (private investment management firm) and a member |
| of the Research Triangle Foundation Board. In addition, Mr. McCoy |
| served as the Interim Chancellor (1999-2000) and a member of the |
| Board of Visitors for the University of North Carolina at Chapel Hill and |
| currently serves on the Board of Directors of the University of North |
| Carolina Health Care System and the Board of Visitors of the Kenan- |
| Flagler Business School (University of North Carolina at Chapel Hill). |
| He also served as Vice President of Finance for the University of North |
| Carolina (16-school system). |
| Name, Age; Principal Occupation |
| |
| Cornelia M. Small (61) |
| |
| Year of Election or Appointment: 2005 |
| Ms. Small is a member (2000-present) and Chairperson (2002-present) |
| of the Investment Committee, and a member (2002-present) of the |
| Board of Trustees of Smith College. Previously, she served as Chief |
| Investment Officer (1999-2000), Director of Global Equity Investments |
| (1996-1999), and a member of the Board of Directors of Scudder, |
| Stevens & Clark (1990-1997) and Scudder Kemper Investments |
| (1997-1998). In addition, Ms. Small served as Co-Chair (2000-2003) |
| of the Annual Fund for the Fletcher School of Law and Diplomacy. |
| |
| William S. Stavropoulos (66) |
| |
| Year of Election or Appointment: 2001 |
| Mr. Stavropoulos is Chairman of the Board (2000-present) and a |
| Member of the Board of Directors of The Dow Chemical Company. |
| Since joining The Dow Chemical Company in 1967, Mr. Stavropoulos |
| served in numerous senior management positions, including President |
| (1993-2000; 2002-2003), CEO (1995-2000; 2002-2004), and Chair- |
| man of the Executive Committee (2000-2004). Currently, he is a Direc- |
| tor of NCR Corporation (data warehousing and technology solutions), |
| BellSouth Corporation (telecommunications), Chemical Financial Corpo- |
| ration, Maersk Inc. (industrial conglomerate, 2002-present), and Metal- |
| mark Capital (private equity investment firm, 2005-present). He also |
| serves as a member of the Board of Trustees of the American Enterprise |
| Institute for Public Policy Research. In addition, Mr. Stavropoulos is a |
| member of The Business Council, J.P. Morgan International Council and |
| the University of Notre Dame Advisory Council for the College of Science. |
| |
| Kenneth L. Wolfe (66) |
| |
| Year of Election or Appointment: 2005 |
| Mr. Wolfe also serves as a Trustee (2005-present) or Member of the |
| Advisory Board (2004-present) of other investment companies advised |
| by FMR. Prior to his retirement in 2001, Mr. Wolfe was Chairman and |
| Chief Executive Officer of Hershey Foods Corporation (1993-2001). He |
| currently serves as a member of the boards of Adelphia Communications |
| Corporation (2003-present), Bausch & Lomb, Inc., and Revlon Inc. |
| (2004-present). |
47 Annual Report
Trustees and Officers - continued
Advisory Board Members and Executive Officers:
Correspondence intended for Mr. Gamper may be sent to Fidelity Investments, P.O. Box 55235, Boston, Massachusetts 02205-5235. Correspondence intended for each executive officer and Mr. Lynch may be sent to Fidelity Investments, 82 Devonshire Street, Boston, Massachusetts 02109.
| Name, Age; Principal Occupation |
| |
| Albert R. Gamper, Jr. (63) |
| |
| Year of Election or Appointment: 2005 |
| Member of the Advisory Board of Fidelity Advisor Series VIII. Prior to his |
| retirement in December 2004, Mr. Gamper served as Chairman of the |
| Board of CIT Group Inc. (commercial finance). During his tenure with |
| CIT Group Inc. Mr. Gamper served in numerous senior management |
| positions, including Chairman (1987-1989; 1999-2001; 2002-2004), |
| Chief Executive Officer (1987-2004), and President (1989-2002). He |
| currently serves as a member of the Board of Directors of Public Service |
| Enterprise Group (utilities, 2001-present), Chairman of the Board of |
| Governors, Rutgers University (2004-present), and Chairman of the |
| Board of Saint Barnabas Health Care System. |
| |
| Peter S. Lynch (61) |
| |
| Year of Election or Appointment: 2003 |
| Member of the Advisory Board of Fidelity Advisor Series VIII. Vice |
| Chairman and a Director of FMR, and Vice Chairman (2001-present) |
| and a Director (2000-present) of FMR Co., Inc. Previously, Mr. Lynch |
| served as a Trustee of the Fidelity funds (1990-2003). In addition, he |
| serves as a Trustee of Boston College, Massachusetts Eye & Ear Infir- |
| mary, Historic Deerfield, John F. Kennedy Library, and the Museum of |
| Fine Arts of Boston. |
| |
| Dwight D. Churchill (51) |
| |
| Year of Election or Appointment: 2005 |
| Vice President of Advisor Value Leaders. Mr. Churchill also serves as |
| Vice President of certain Equity Funds (2005-present) and certain High |
| Income Funds (2005-present). Previously, he served as Head of Fidelity’s |
| Fixed-Income Division (2000-2005), Vice President of Fidelity’s Money |
| Market Funds (2000-2005), Vice President of Fidelity’s Bond Funds, and |
| Senior Vice President of FIMM (2000) and FMR. Mr. Churchill joined |
| Fidelity in 1993 as Vice President and Group Leader of Taxable Fixed- |
| Income Investments. |
| Name, Age; Principal Occupation |
| |
| Eric D. Roiter (56) |
| |
| Year of Election or Appointment: 2003 |
| Secretary of Advisor Value Leaders. He also serves as Secretary of |
| Fidelity funds; Vice President, General Counsel, and Secretary of FMR |
| Co., Inc. (2001-present) and FMR; Assistant Secretary of Fidelity Man- |
| agement & Research (U.K.) Inc. (2001-present), Fidelity Management & |
| Research (Far East) Inc. (2001-present), and Fidelity Investments Money |
| Management, Inc. (2001-present). Mr. Roiter is an Adjunct Member, |
| Faculty of Law, at Boston College Law School (2003-present). Previously, |
| Mr. Roiter served as Vice President and Secretary of Fidelity Distributors |
| Corporation (FDC) (1998-2005). |
| |
| Stuart Fross (46) |
| |
| Year of Election or Appointment: 2003 |
| Assistant Secretary of Advisor Value Leaders. Mr. Fross also serves as |
| Assistant Secretary of other Fidelity funds (2003-present), Vice President |
| and Secretary of FDC (2005-present), and is an employee of FMR. |
| |
| Christine Reynolds (47) |
| |
| Year of Election or Appointment: 2004 |
| President, Treasurer, and Anti-Money Laundering (AML) officer of Advi- |
| sor Value Leaders. Ms. Reynolds also serves as President, Treasurer, and |
| AML officer of other Fidelity funds (2004) and is a Vice President (2003) |
| and an employee (2002) of FMR. Before joining Fidelity Investments, |
| Ms. Reynolds worked at PricewaterhouseCoopers LLP (PwC) (1980-2002), |
| where she was most recently an audit partner with PwC’s investment |
| management practice. |
| |
| Paul M. Murphy (58) |
| |
| Year of Election or Appointment: 2005 |
| Chief Financial Officer of Advisor Value Leaders. Mr. Murphy also |
| serves as Chief Financial Officer of other Fidelity funds (2005-present). |
| He also serves as Senior Vice President of Fidelity Pricing and Cash |
| Management Service Group (FPCMS). |
| |
| Kenneth A. Rathgeber (58) |
| |
| Year of Election or Appointment: 2004 |
| Chief Compliance Officer of Advisor Value Leaders. Mr. Rathgeber also |
| serves as Chief Compliance Officer of other Fidelity funds (2004) and |
| Executive Vice President of Risk Oversight for Fidelity Investments |
| (2002). Previously, he served as Executive Vice President and Chief |
| Operating Officer for Fidelity Investments Institutional Services |
| Company, Inc. (1998-2002). |
49 Annual Report
Trustees and Officers - continued
| Name, Age; Principal Occupation |
| |
| John R. Hebble (47) |
| |
| Year of Election or Appointment: 2003 |
| Deputy Treasurer of Advisor Value Leaders. Mr. Hebble also serves as |
| Deputy Treasurer of other Fidelity funds (2003), and is an employee of |
| FMR. Before joining Fidelity Investments, Mr. Hebble worked at Deutsche |
| Asset Management where he served as Director of Fund Accounting |
| (2002-2003) and Assistant Treasurer of the Scudder Funds |
| (1998-2003). |
| |
| Bryan A. Mehrmann (44) |
| |
| Year of Election or Appointment: 2005 |
| Deputy Treasurer of Advisor Value Leaders. Mr. Mehrmann also serves |
| as Deputy Treasurer of other Fidelity funds (2005-present) and is an |
| employee of FMR. Previously, Mr. Mehrmann served as Vice President of |
| Fidelity Investments Institutional Services Group (FIIS)/Fidelity Investments |
| Institutional Operations Corporation, Inc. (FIIOC) Client Services |
| (1998-2004). |
| |
| Kimberley H. Monasterio (41) |
| |
| Year of Election or Appointment: 2004 |
| Deputy Treasurer of Advisor Value Leaders. Ms. Monasterio also serves |
| as Deputy Treasurer of other Fidelity funds (2004) and is an employee |
| of FMR (2004). Before joining Fidelity Investments, Ms. Monasterio |
| served as Treasurer (2000-2004) and Chief Financial Officer |
| (2002-2004) of the Franklin Templeton Funds and Senior Vice President |
| of Franklin Templeton Services, LLC (2000-2004). |
| |
| Kenneth B. Robins (36) |
| |
| Year of Election or Appointment: 2005 |
| Deputy Treasurer of Advisor Value Leaders. Mr. Robins also serves as |
| Deputy Treasurer of other Fidelity funds (2005-present) and is an |
| employee of FMR (2004-present). Before joining Fidelity Investments, |
| Mr. Robins worked at KPMG LLP, where he was a partner in KPMG’s |
| department of professional practice (2002-2004) and a Senior Man- |
| ager (1999-2000). In addition, Mr. Robins served as Assistant Chief |
| Accountant, United States Securities and Exchange Commission |
| (2000-2002). |
| |
| Robert G. Byrnes (38) |
| |
| Year of Election or Appointment: 2005 |
| Assistant Treasurer of Advisor Value Leaders. Mr. Byrnes also serves as |
| Assistant Treasurer of other Fidelity funds (2005-present) and is an |
| employee of FMR (2005-present). Previously, Mr. Byrnes served as Vice |
| President of FPCMS (2003-2005). Before joining Fidelity Investments, |
| Mr. Byrnes worked at Deutsche Asset Management where he served as |
| Vice President of the Investment Operations Group (2000-2003). |
| Name, Age; Principal Occupation |
| |
| John H. Costello (59) |
| |
| Year of Election or Appointment: 2003 |
| Assistant Treasurer of Advisor Value Leaders. Mr. Costello also serves as |
| Assistant Treasurer of other Fidelity funds and is an employee of FMR. |
| |
| Peter L. Lydecker (51) |
| |
| Year of Election or Appointment: 2004 |
| Assistant Treasurer of Advisor Value Leaders. Mr. Lydecker also serves |
| as Assistant Treasurer of other Fidelity funds (2004) and is an employee |
| of FMR. |
| |
| Mark Osterheld (50) |
| |
| Year of Election or Appointment: 2003 |
| Assistant Treasurer of Advisor Value Leaders. Mr. Osterheld also serves |
| as Assistant Treasurer of other Fidelity funds (2002) and is an employee |
| of FMR. |
| |
| Gary W. Ryan (47) |
| |
| Year of Election or Appointment: 2005 |
| Assistant Treasurer of Advisor Value Leaders. Mr. Ryan also serves as |
| Assistant Treasurer of other Fidelity funds (2005-present) and is an |
| employee of FMR (2005-present). Previously, Mr. Ryan served as Vice |
| President of Fund Reporting in FPCMS (1999-2005). |
| |
| Salvatore Schiavone (39) |
| |
| Year of Election or Appointment: 2005 |
| Assistant Treasurer of Advisor Value Leaders. Mr. Schiavone also serves |
| as Assistant Treasurer of other Fidelity funds (2005-present) and is an |
| employee of FMR (2005-present). Before joining Fidelity Investments, |
| Mr. Schiavone worked at Deutsche Asset Management, where he most |
| recently served as Assistant Treasurer (2003-2005) of the Scudder |
| Funds and Vice President and Head of Fund Reporting (1996-2003). |
51 Annual Report
The Board of Trustees of Fidelity Advisor Value Leaders Fund voted to pay to shareholders of record at the opening of business on record date, the following distributions per share derived from capital gains realized from sales of portfolio securities, and dividends derived from net investment income:
| | | Pay Date | | Record Date | | Dividends | | Capital Gains |
| Class A | | 12/5/05 | | 12/2/05 | | $0.04 | | $0.334 |
| Class T | | 12/5/05 | | 12/2/05 | | $0.006 | | $0.334 |
| Class B | | 12/5/05 | | 12/2/05 | | — | | $0.280 |
| Class C | | 12/5/05 | | 12/2/05 | | — | | $0.290 |
The fund hereby designates as capital gain dividends: For dividends with respect to the taxable year ended October 31, 2005, $702,221, or, if subsequently determined to be different, the net capital gain of such year, and for dividends with respect to the taxable year ended October 31, 2004, $23,939, or, if subsequently determined to be different, the excess of: (a) the net capital gain of such year, over (b) amounts previously designated as capital gain dividends with respect to such year.
Class A, Class T, Class B, and Class C designates 100% of the dividend distributed during the fiscal year as qualifying for the dividends-received deduction for corporate shareholders.
Class A, Class T, Class B, and Class C designates 100% of the dividend distributed during the fiscal year as amounts which may be taken into account as a dividend for purposes of the maximum rate under section 1(h)(11) of the Internal Revenue Code.
The fund will notify shareholders in January 2006 of amounts for use in preparing 2005 income tax returns.
Board Approval of Investment Advisory Contracts and Management Fees
Advisor Value Leaders Fund
Each year, typically in July, the Board of Trustees, including the independent Trustees (together, the Board), votes on the renewal of the management contract and sub-advisory agreements (together, the Advisory Contracts) for the fund. The Board, assisted by the advice of fund counsel and independent Trustees’ counsel, requests and considers a broad range of information throughout the year.
The Board meets regularly each month except August and takes into account throughout the year matters bearing on Advisory Contracts. The Board, acting directly and through its separate committees, considers at each of its meetings factors that are relevant to the annual renewal of the fund’s Advisory Contracts, including the services and support provided to the fund and its shareholders by Fidelity. At the time of the renewal, the Board had 11 standing committees, each composed of independent Trustees with varying backgrounds, to which the Board has assigned specific subject matter responsibilities in order to enhance effective decision-making by the Board. Each committee has adopted a written charter outlining the structure and purposes of the committee. One such committee, the Equity Contract Committee, meets periodically during the first six months of each year and as necessary to consider matters specifically related to the annual renewal of Advisory Contracts. The committee requests and receives information on, and makes recommendations to the independent Trustees concerning, the approval and annual review of the Advisory Contracts.
At its July 2005 meeting, the Board of Trustees, including the independent Trustees, unanimously determined to renew the Advisory Contracts for the fund. In reaching its determination, the Board considered all factors it believed relevant, including (1) the nature, extent, and quality of the services to be provided to the fund and its shareholders by Fidelity (including the investment performance of the fund); (2) the competitiveness of the management fee and total expenses of the fund; (3) the total costs of the services to be provided by and the profits to be realized by the investment adviser and its affiliates from the relationship with the fund; (4) the extent to which economies of scale would be realized as the fund grows; and (5) whether fee levels reflect these economies of scale, if any, for the benefit of fund shareholders.
In determining whether to renew the Advisory Contracts for the fund, the Board ultimately reached a determination, with the assistance of fund counsel and independent Trustees’ counsel, that the renewal of the Advisory Contracts and the compensation to be received by Fidelity under the management contract is consistent with Fidelity’s fiduciary duty under applicable law. In addition to evaluating the specific factors noted above, the Board, in reaching its determination, is aware that shareholders in the fund have a broad range of investment choices available to them, including a wide choice among mutual funds offered by competitors to Fidelity, and that the fund’s shareholders, with the opportunity to review and weigh the disclosure provided by the fund in its
53 Annual Report
Board Approval of Investment Advisory Contracts and Management Fees - continued
prospectus and other public disclosures, have chosen to invest in this fund, managed by Fidelity.
Nature, Extent, and Quality of Services Provided by Fidelity. The Board considered staffing within the investment adviser, FMR, and the sub-advisers (together, the Investment Advisers), including the background of the fund’s portfolio manager and the fund’s investment objective and discipline. The independent Trustees also had discussions with senior management of Fidelity’s investment operations and investment groups. The Board considered the structure of the portfolio manager compensation program and whether this structure provides appropriate incentives.
Fidelity Resources Dedicated to Investment Management and Support Services. The Board reviewed the size, education, and experience of the Investment Advisers’ investment staff, their use of technology, and the Investment Advisers’ approach to recruiting, training, and retaining portfolio managers and other research, advisory, and management personnel. The Board considered Fidelity’s extensive global research capabilities that enable the Investment Advisers to aggregate data from various sources in an effort to produce positive investment results. The Board noted that Fidelity’s analysts have access to a variety of technological tools that enable them to perform both fundamental and quantitative analysis and to specialize in various disciplines. The Board also considered that Fidelity’s portfolio managers and analysts have access to daily portfolio attribution that allows for monitoring of a fund’s portfolio, as well as an electronic communication system that provides immediate real-time access to research concerning issuers and credit enhancers.
Shareholder and Administrative Services. The Board considered the nature, extent, quality, and cost of administrative, distribution, and shareholder services performed by the Investment Advisers and their affiliates under the Advisory Contracts and under separate agreements covering transfer agency, pricing and bookkeeping, and securities lending services for the fund. The Board also considered the nature and extent of the Investment Advisers’ supervision of third party service providers, principally custodians and subcustodians. The Board reviewed the allocation of fund brokerage, including allocations to brokers affiliated with the Investment Advisers, the use of brokerage commissions to pay fund expenses, and the use of “soft” commission dollars to pay for research services. The Board also considered that Fidelity voluntarily decided in 2004 to stop using “soft” commission dollars to pay for market data and, instead, to pay for that data out of its own resources. The Board also considered the resources devoted to, and the record of compliance with, the fund’s compliance policies and procedures.
The Board noted that the growth of fund assets across the complex allows Fidelity to reinvest in the development of services designed to enhance the value or convenience of the Fidelity funds as investment vehicles. These services include 24-hour access to
account information and market information through phone representatives and over the Internet, and investor education materials and asset allocation tools.
Investment in a Large Fund Family. The Board considered the benefits to shareholders of investing in a Fidelity fund, including the benefits of investing in a fund that is part of a large family of funds offering a variety of investment disciplines and providing for a large variety of mutual fund investor services. For example, fund shareholders are offered the privilege of exchanging shares of the fund for shares of other Fidelity funds, as set forth in the fund’s prospectus, without paying an additional sales charge. The Board noted that, since the last Advisory Contract renewals in July 2004, Fidelity has taken a number of actions that benefited particular funds, including (i) voluntarily deciding in 2004 to stop using “soft” commission dollars to pay for market data and, instead, to pay for that data out of its own resources, (ii) contractually agreeing to impose management fee reductions and expense limitations on its five Spartan stock index funds and its stock index fund available through variable insurance products, (iii) contractually agreeing to eliminate the management fees on the Fidelity Freedom Funds and the Fidelity Advisor Freedom Funds, (iv) contractually agreeing to reduce the management fees on most of its investment-grade taxable bond funds, and (v) contractually agreeing to impose expense limitations on its retail and Spartan investment-grade taxable bond funds.
Investment Performance and Compliance. The Board considered whether the fund has operated within its investment objective, as well as its record of compliance with its investment restrictions. It also reviewed the fund’s absolute investment performance for each class, as well as the fund’s relative investment performance for each class measured against (i) a broad-based securities market index, and (ii) a peer group of mutual funds. Because the fund had been in existence less than three calendar years, the following chart considered by the Board shows, for the one-year period ended December 31, 2004, the returns of Class C and Institutional Class of the fund, the return of a broad-based securities market index (“benchmark”), and a range of returns of a peer group of mutual funds identified by Lipper Inc. as having an investment objective similar to that of the fund. The returns of Class C and Institutional Class represent the performance of classes with the highest and lowest 12b-1 fees, respectively (not necessarily with the highest and lowest total expenses). The box within the chart shows the 25th percentile return (bottom of box) and the 75th percentile return (top of box) of the Lipper peer group. Returns shown above the box are in the first quartile and returns shown below the box are in the fourth quartile. The percentage beaten numbers noted below the chart correspond to the percentile box and represent the percentage of funds in the Lipper peer group whose performance was equal to or lower than that of the class indicated.
55 Annual Report
Board Approval of Investment Advisory Contracts and Management Fees - continued

The Board reviewed the fund’s relative investment performance against its Lipper peer group and stated that the performance of Institutional Class of the fund was in the first quartile for the one-year period. The Board noted that FMR does not consider that Lipper peer group to be a meaningful comparison for the fund, however, because the peer group includes funds with different investment mandates (some broader, some narrower) than the fund. For example, the peer group includes funds that are not limited to a particular investment style, funds that focus on growth-oriented stocks, and funds that (like the fund) focus their investments on value-oriented securities. The Board also stated that the relative investment performance of the fund was lower than its benchmark for the one-year period. The Board considered that the variations in performance among the fund’s classes reflect the variations in class expenses, which result in lower performance for higher expense classes. The Board stated that it is difficult to evaluate in any comprehensive fashion the performance of the fund, in light of its relatively recent launch.
The Board has had thorough discussions with FMR throughout the year about the Board’s and FMR’s concerns about equity research, equity fund performance, and compliance with internal policies governing gifts and entertainment. FMR has taken steps that it believes will refocus and strengthen equity research and equity portfolio management and compliance. The Board noted with favor FMR’s recent reorganization of its senior management team and FMR’s plans to dedicate additional resources to investment research, and participated in the process that led to those changes.
Based on its review, and giving particular weight to the nature and quality of the resources dedicated by the Investment Advisers to maintain and improve relative performance, the Board concluded that the nature, extent, and quality of the services
provided by Fidelity will benefit the fund’s shareholders, particularly in light of the Board’s view that the fund’s shareholders benefit from investing in a fund that is part of a large family of funds offering a variety of investment disciplines and services.
Competitiveness of Management Fee and Total Fund Expenses. The Board considered the fund’s management fee and total expenses compared to “mapped groups” of competitive funds and classes. Fidelity creates “mapped groups” by combining similar Lipper investment objective categories that have comparable management fee characteristics. Combining Lipper investment objective categories aids the Board’s management fee and total expense comparisons by broadening the competitive group used for comparison and by reducing the number of universes to which various Fidelity funds are compared.
The Board considered two proprietary management fee comparisons for the 12-month (or shorter) periods shown in the chart below. The group of Lipper funds used by the Board for management fee comparisons is referred to below as the “Total Mapped Group” and, for the reasons explained above, is broader than the Lipper peer group used by the Board for performance comparisons. The Total Mapped Group comparison focuses on a fund’s standing relative to the total universe of comparable funds available to investors, in terms of gross management fees before expense reimbursements or caps. “TMG %” represents the percentage of funds in the Total Mapped Group that had management fees that were lower than the fund’s. For example, a TMG % of 15% means that 85% of the funds in the Total Mapped Group had higher management fees than the fund. The “Asset-Size Peer Group” (ASPG) comparison focuses on a fund’s standing relative to non-Fidelity funds similar in size to the fund within the Total Mapped Group. The ASPG represents at least 15% of the funds in the Total Mapped Group with comparable asset size and management fee characteristics, subject to a minimum of 50 funds (or all funds in the Total Mapped Group if fewer than 50). Additional information, such as the ASPG quartile (“quadrant”) in which the fund’s management fee ranked, is also included in the chart and considered by the Board.
57 Annual Report
Board Approval of Investment Advisory Contracts and Management Fees - continued

The Board noted that the fund’s management fee ranked below the median of its Total Mapped Group and below the median of its ASPG for 2004.
Based on its review, the Board concluded that the fund’s management fee was fair and reasonable in light of the services that the fund receives and the other factors considered.
In its review of each class’s total expenses, the Board considered the fund’s management fee as well as other fund or class expenses, as applicable, such as transfer agent fees, pricing and bookkeeping fees, fund-paid 12b-1 fees, and custodial, legal, and audit fees. The Board also noted the effects of any waivers and reimbursements on fees and expenses. As part of its review, the Board also considered current and historical total expenses of each class of the fund compared to competitive fund median expenses. Each class of the fund is compared to those funds and classes in the Total Mapped Group (used by the Board for management fee comparisons) that have a similar sales load structure.
The Board noted that the total expenses of each class ranked above its competitive median for 2004. The Board noted that the fund offers multiple classes, each of which has a different sales load and 12b-1 fee structure, and that the multiple structures are intended to offer a range of pricing options for the intermediary market. The Board also noted that the total expenses of the classes vary primarily by the level of their 12b-1 fees, although differences in transfer agent fees may also cause expenses to vary from class to class.
Furthermore, the Board considered that on December 16, 2004, it had approved changes (effective January 1, 2005) in the transfer agent and service agreements for the fund that established maximum transfer agent fees and eliminated the minimum pricing and bookkeeping fee to prevent small funds or funds with small average account sizes from having relatively high fees in basis points (the “small-fund fee reductions”). The Board considered that, if the small-fund fee reductions had been in effect in 2004, the total expenses of each of Class A, Class B, Class C and Institutional Class would have ranked below the median.
In its review of total expenses, the Board also considered Fidelity fee structures and other information on clients that FMR and its affiliates service in other competitive markets, such as other mutual funds advised or subadvised by FMR or its affiliates, pension plan clients, and other institutional clients.
Based on its review, the Board concluded that the total expenses for each class of the fund were reasonable, although in all cases above the median of the universe presented for comparison, in light of the services that the fund and its shareholders receive and the other factors considered.
Costs of the Services and Profitability. The Board considered the revenues earned and the expenses incurred by Fidelity in conducting the business of developing, marketing, distributing, managing, administering and servicing the fund and its shareholders. The Board also considered the level of Fidelity’s profits in respect of all the Fidelity funds.
On an annual basis, FMR presents to the Board Fidelity’s profitability for the fund. Fidelity calculates the profitability for each fund, as well as aggregate profitability for groups of Fidelity funds and all Fidelity funds, using a series of detailed revenue and cost allocation methodologies which originate with the audited books and records of Fidelity. The Audit Committee of the Board reviews any significant changes from the prior year’s methodologies.
PricewaterhouseCoopers LLP (PwC), independent registered accounting firm and auditor to Fidelity and certain Fidelity funds, has been engaged annually by the Board as part of the Board’s assessment of the results of Fidelity’s profitability analysis. PwC’s engagement includes the review and assessment of Fidelity’s methodologies used in determining the revenues and expenses attributable to Fidelity’s mutual fund business, and completion of agreed-upon procedures surrounding the mathematical accuracy of fund profitability and its conformity to allocation methodologies. After considering PwC’s reports issued under the engagement and information provided by Fidelity, the Board believes that while other allocation methods may also be reasonable, Fidelity’s profitability methodologies are reasonable in all material respects.
59 Annual Report
Board Approval of Investment Advisory Contracts and Management Fees - continued
The Board has also reviewed Fidelity’s non-fund businesses and any fall-out benefits related to the mutual fund business as well as cases where Fidelity’s affiliates may benefit from or be related to the fund’s business. In addition, a special committee of the Board reviewed services provided to Fidelity by its affiliates and determined that the fees that Fidelity paid for such services were reasonable.
The Board considered the costs of the services provided by and the profits realized by Fidelity in connection with the operation of the fund and determined that the amount of profit is a fair entrepreneurial profit for the management of the fund.
Economies of Scale. The Board considered whether there have been economies of scale in respect of the management of the Fidelity funds, whether the Fidelity funds (including the fund) have appropriately benefited from any such economies of scale, and whether there is potential for realization of any further economies of scale. The Board considered the extent to which the fund will benefit from economies of scale through increased services to the fund, through waivers or reimbursements, or through fee or expense reductions, including reductions that occur through operation of the transfer agent agreement. The transfer agent fee varies in part based on the number of accounts in the fund. If the number of accounts decreases or the average account size increases, the overall transfer agent fee rate decreases.
The Board recognized that the fund’s management contract incorporates a “group fee” structure, which provides for lower fee rates as total fund assets under FMR’s management increase, and for higher fee rates as total fund assets under FMR’s management decrease. The Board considered that the group fee is designed to deliver the benefits of economies of scale to fund shareholders when total fund assets increase, even if assets of any particular fund are unchanged or have declined, because some portion of Fidelity’s costs are attributable to services provided to all Fidelity funds, and all funds benefit if those costs can be allocated among more assets. The Board concluded that, given the group fee structure, fund shareholders will achieve a certain level of economies of scale as assets under FMR’s management increase at the fund complex level, regardless of whether Fidelity achieves any such economies of scale.
The Board further concluded that any potential economies of scale are being shared between fund shareholders and Fidelity in an appropriate manner.
Additional Information Requested by the Board. In order to develop fully the factual basis for consideration of the Advisory Contracts, the Board requested additional information regarding (i) equity fund transfer agency fees; (ii) Fidelity’s fund profitability methodology and the impact of various changes in the methodology over time; (iii) benefits to shareholders from economies of scale; (iv) composition and characteristics of various fund and industry data used in comparisons; and (v) compensation of portfolio managers and research analysts.
Based on its evaluation of all of the conclusions noted above, and after considering all material factors, the Board ultimately concluded that the existing advisory fee structures are fair and reasonable, and that the fund’s existing Advisory Contracts should be renewed.
61 Annual Report
Investment Adviser
Fidelity Management & Research Company
Boston, MA
Investment Sub-Advisers
FMR Co., Inc.
Fidelity Management & Research
(U.K.) Inc.
Fidelity Management & Research
(Far East) Inc.
Fidelity International
Investment Advisors
Fidelity Investments Japan Limited
Fidelity International Investment
Advisors (U.K.) Limited
General Distributor
Fidelity Distributors Corporation
Boston, MA
Transfer and Service Agents
Fidelity Investments Institutional
Operations Company, Inc.
Boston, MA
Fidelity Service Company, Inc.
Boston, MA
Custodian
Brown Brothers Harriman & Company
Boston, MA
|

Fidelity® Advisor
Value Leaders
Fund - Institutional Class
Annual Report October 31, 2005

Contents
| Chairman’s Message | | 4 | | Ned Johnson’s message to shareholders. |
| Performance | | 6 | | How the fund has done over time. |
| Management’s Discussion | | 7 | | The manager’s review of fund |
| | | | | performance, strategy and outlook. |
| Shareholder Expense | | 8 | | An example of shareholder expenses. |
| Example | | | | |
| Investment Changes | | 10 | | A summary of major shifts in the fund’s |
| | | | | investments over the past six months. |
| Investments | | 11 | | A complete list of the fund’s investments |
| | | | | with their market values. |
| Financial Statements | | 22 | | Statements of assets and liabilities, |
| | | | | operations, and changes in net assets, as |
| | | | | well as financial highlights. |
| Notes | | 31 | | Notes to the financial statements. |
| Report of Independent | | 40 | | |
| Registered Public | | | | |
| Accounting Firm | | | | |
| Trustees and Officers | | 41 | | |
| Distributions | | 51 | | |
| Board Approval of | | 52 | | |
| Investment Advisory | | | | |
| Contracts and | | | | |
| Management Fees | | | | |
To view a fund’s proxy voting guidelines and proxy voting record for the 12-month period ended June 30, visit www.fidelity.com/proxyvotingresults or visit the Securities and Exchange Commission’s (SEC) web site at www.sec.gov. You may also call 1-877-208-0098 to request a free copy of the proxy voting guidelines.
Standard & Poor’s, S&P and S&P 500 are registered service marks of The McGraw-Hill Companies, Inc. and have been licensed for use by Fidelity Distributors Corporation.
Other third party marks appearing herein are the property of their respective owners.
All other marks appearing herein are registered or unregistered trademarks or service marks of FMR Corp. or an affiliated company.
Annual Report 2
This report and the financial statements contained herein are submitted for the general information of the shareholders of the fund. This report is not authorized for distribution to prospective investors in the fund unless preceded or accompanied by an effective prospectus.
A fund files its complete schedule of portfolio holdings with the SEC for the first and third quarters of each fiscal year on Form N-Q. Forms N-Q are available on the SEC’s web site at http://www.sec.gov. A fund’s Forms N-Q may be reviewed and copied at the SEC’s Public Reference Room in Washington, DC. Information regarding the operation of the SEC’s Public Reference Room may be obtained by calling 1-800-SEC-0330. For a complete list of a fund’s portfolio holdings, view the most recent quarterly holdings report, semiannual report, or annual report on Fidelity’s web site at http://www.advisor.fidelity.com.
NOT FDIC INSURED · MAY LOSE VALUE · NO BANK GUARANTEE
Neither the fund nor Fidelity Distributors Corporation is a bank.
3 Annual Report
Chairman’s Message
(Photograph of Edward C. Johnson 3d)
Dear Shareholder:
During the past year or so, much has been reported about the mutual fund industry, and much of it has been more critical than I believe is warranted. Allegations that some companies have been less than forthright with their shareholders have cast a shadow on the entire industry. I continue to find these reports disturbing, and assert that they do not create an accurate picture of the industry overall. Therefore, I would like to remind everyone where Fidelity stands on these issues. I will say two things specifically regarding allegations that some mutual fund companies were in violation of the Securities and Exchange Commission’s forward pricing rules or were involved in so-called “market timing” activities.
First, Fidelity has no agreements that permit customers who buy fund shares after 4 p.m. to obtain the 4 p.m. price. This is not a new policy. This is not to say that someone could not deceive the company through fraudulent acts. However, we are extremely diligent in preventing fraud from occurring in this manner — and in every other. But I underscore again that Fidelity has no so-called “agreements” that sanction illegal practices.
Second, Fidelity continues to stand on record, as we have for years, in opposition to predatory short-term trading that adversely affects shareholders in a mutual fund. Back in the 1980s, we initiated a fee — which is returned to the fund and, therefore, to investors — to discourage this activity. Further, we took the lead several years ago in developing a Fair Value Pricing Policy to prevent market timing on foreign securities in our funds. I am confident we will find other ways to make it more difficult for predatory traders to operate. However, this will only be achieved through close cooperation among regulators, legislators and the industry.
Yes, there have been unfortunate instances of unethical and illegal activity within the mutual fund industry from time to time. That is true of any industry. When this occurs, confessed or convicted offenders should be dealt with appropriately. But we are still concerned about the risk of over-regulation and the quick application of simplistic solutions to intricate problems. Every system can be improved, and we support and applaud well thought out improvements by regulators, legislators and industry representatives that achieve the common goal of building and protecting the value of investors’ holdings.
For nearly 60 years, Fidelity has worked very hard to improve its products and service to justify your trust. When our family founded this company in 1946, we had only a few hundred customers. Today, we serve more than 18 million customers including individual investors and participants in retirement plans across America.
Annual Report 4
Let me close by saying that we do not take your trust in us for granted, and we realize that we must always work to improve all aspects of our service to you. In turn, we urge you to continue your active participation with your financial matters, so that your interests can be well served.
Best regards,
/s/Edward C. Johnson 3d
5 Annual Report
Performance: The Bottom Line
Average annual total return reflects the change in the value of an investment, assuming reinvestment of the class’ dividend income and capital gains (the profits earned upon the sale of securities that have grown in value) and assuming a constant rate of performance each year. The $10,000 table and the fund’s returns do not reflect the deduction of taxes that a shareholder would pay on fund distributions or the redemption of fund shares. During periods of reimbursement by Fidelity, a fund’s total return will be greater than it would be had the reimbursement not occurred. How a fund did yesterday is no guarantee of how it will do tomorrow.
| Average Annual Total Returns | | | | |
| Periods ended October 31, 2005 | | Past 1 | | Life of |
| | | year | | fundA |
| Institutional Class | | 13.47% | | 12.88% |
| A From June 17, 2003. | | | | |
| |
| $10,000 Over Life of Fund | | | | |
Let’s say hypothetically that $10,000 was invested in Fidelityr Advisor Value Leaders Fund - Institutional Class on June 17, 2003, when the fund started. The chart shows how the value of your investment would have changed, and also shows how the Russell 1000r Value Index performed over the same period.
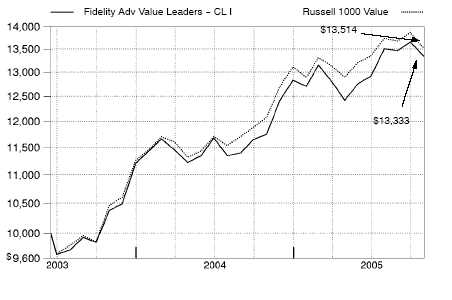
Annual Report 6
Management’s Discussion of Fund Performance
Comments from Brian Hogan, Portfolio Manager of Fidelity® Advisor Value Leaders Fund
U.S. equity markets had respectable performance during the year that ended October 31, 2005. The period got off to a great start with a strong November and December of 2004. However, the markets were later dragged down by surging oil prices, further disorder in Iraq, potential new troubles with Iran and Syria, and terrorist attacks in London. While stocks recovered nicely, Hurricane Katrina would drive them down again. The devastating storm led to record-high prices for gasoline, natural gas and oil, as well as fears of a corresponding leap in inflation. The Federal Reserve Board responded to this and to other inflationary pressures during the period by raising short-term interest rates eight times. Nonetheless, stocks moved higher despite a very weak October. Market breadth was narrow, as most of the gains were concentrated in rapidly appreciating energy-related investments. For the year overall, the Standard & Poor’s 500SM Index was up 8.72%, followed closely by the technology-laden NASDAQ Compositer Index at 8.15% . The Dow Jones Industrial AverageSM rose 6.45% .
During the past year, the fund’s Institutional Class shares gained 13.47% . During the same time frame, the Russell 1000r Value Index returned 11.86%, while the LipperSM Growth Funds Average returned 10.58% . The fund’s outperformance of its index was driven by strong stock selection within pharmaceuticals and biotechnology, energy, telecommunication services and consumer staples. Favorable industry positioning within financials also contributed. Conversely, an underweighting in the surging utilities sector detracted from returns, as did an overweighting in industrials and weak results in technology. Underweighting pharmaceutical company Pfizer — a component of the Russell index — helped the most, as the company suffered due to concerns about competition and patent protection for its flagship product, Lipitor. Energy companies Halliburton and National Oilwell Varco benefited from continued high prices for oil and natural gas, which helped the fund’s performance. Banco Bradesco, one of the largest banks in Brazil, also did well, due to an improving economy and strong consumer loan demand. On the negative side, Tyco International detracted from performance after experiencing earnings setbacks. The fund’s underweighted position compared to the index in energy giant ConocoPhillips, whose stock price gained on strong energy prices, also took away from relative returns. Another notable detractor was containerboard producer Smurfit-Stone Container.
The views expressed in this statement reflect those of the portfolio manager only through the end of the period of the report as stated on the cover and do not necessarily represent the views of Fidelity or any other person in the Fidelity organization. Any such views are subject to change at any time based upon market or other conditions and Fidelity disclaims any responsibility to update such views. These views may not be relied on as investment advice and, because investment decisions for a Fidelity fund are based on numerous factors, may not be relied on as an indication of trading intent on behalf of any Fidelity fund.
7 Annual Report
7
Shareholder Expense Example
As a shareholder of the Fund, you incur two types of costs: (1) transaction costs, including sales charges (loads) on purchase payments or redemption proceeds, and (2) ongoing costs, including management fees, distribution and/or service (12b-1) fees and other Fund expenses. This Example is intended to help you understand your ongoing costs (in dollars) of investing in the Fund and to compare these costs with the ongoing costs of investing in other mutual funds.
The Example is based on an investment of $1,000 invested at the beginning of the period and held for the entire period (May 1, 2005 to October 31, 2005).
The first line of the table below for each class of the Fund provides information about actual account values and actual expenses. You may use the information in this line, together with the amount you invested, to estimate the expenses that you paid over the period. Simply divide your account value by $1,000.00 (for example, an $8,600 account value divided by $1,000.00 = 8.6), then multiply the result by the number in the first line for a class of the Fund under the heading entitled “Expenses Paid During Period” to estimate the expenses you paid on your account during this period.
Hypothetical Example for Comparison Purposes
The second line of the table below for each class of the Fund provides information about hypothetical account values and hypothetical expenses based on a Class’ actual expense ratio and an assumed rate of return of 5% per year before expenses, which is not the Class’ actual return. The hypothetical account values and expenses may not be used to estimate the actual ending account balance or expenses you paid for the period. You may use this information to compare the ongoing costs of investing in the Fund and other funds. To do so, compare this 5% hypothetical example with the 5% hypothetical examples that appear in the shareholder reports of the other funds.
Please note that the expenses shown in the table are meant to highlight your ongoing costs only and do not reflect any transaction costs. Therefore, the second line of the table is useful in comparing ongoing costs only, and will not help you determine the relative total costs of owning different funds. In addition, if these transactional costs were included, your costs would have been higher.
| | | | | | | | | | | | | Expenses Paid |
| | | | | Beginning | | | | Ending | | | | During Period* |
| | | | | Account Value | | | | Account Value | | | | May 1, 2005 |
| | | | | May 1, 2005 | | | | October 31, 2005 | | to October 31, 2005 |
| Class A | | | | | | | | | | | | |
| Actual | | $ | | 1,000.00 | | $ | | 1,072.20 | | $ | | 6.53 |
| HypotheticalA | | $ | | 1,000.00 | | $ | | 1,018.90 | | $ | | 6.36 |
| Class T | | | | | | | | | | | | |
| Actual | | $ | | 1,000.00 | | $ | | 1,070.90 | | $ | | 7.83 |
| HypotheticalA | | $ | | 1,000.00 | | $ | | 1,017.64 | | $ | | 7.63 |
| Class B | | | | | | | | | | | | |
| Actual | | $ | | 1,000.00 | | $ | | 1,068.30 | | $ | | 10.43 |
| HypotheticalA | | $ | | 1,000.00 | | $ | | 1,015.12 | | $ | | 10.16 |
Annual Report 8
| | | | | | | | | | | | | Expenses Paid |
| | | | | Beginning | | | | Ending | | | | During Period* |
| | | | | Account Value | | | | Account Value | | | | May 1, 2005 |
| | | | | May 1, 2005 | | | | October 31, 2005 | | to October 31, 2005 |
| Class C | | | | | | | | | | | | |
| Actual | | $ | | 1,000.00 | | $ | | 1,068.30 | | $ | | 10.43 |
| HypotheticalA | | $ | | 1,000.00 | | $ | | 1,015.12 | | $ | | 10.16 |
| Institutional Class | | | | | | | | | | | | |
| Actual | | $ | | 1,000.00 | | $ | | 1,073.60 | | $ | | 5.23 |
| HypotheticalA | | $ | | 1,000.00 | | $ | | 1,020.16 | | $ | | 5.09 |
| |
| A 5% return per year before expenses | | | | | | | | |
*Expenses are equal to each Class’ annualized expense ratio (shown in the table below); multiplied by the average account value over the period, multiplied by 184/365 (to reflect the one-half year period).
| | | Annualized |
| | | Expense Ratio |
| Class A | | 1.25% |
| Class T | | 1.50% |
| Class B | | 2.00% |
| Class C | | 2.00% |
| Institutional Class | | 1.00% |
9 Annual Report
Investment Changes
| Top Ten Stocks as of October 31, 2005 | | | | |
| | | % of fund’s | | % of fund’s net assets |
| | | net assets | | 6 months ago |
| American International Group, Inc. | | 4.5 | | 2.6 |
| Honeywell International, Inc. | | 3.6 | | 3.1 |
| General Electric Co. | | 3.5 | | 6.8 |
| Exxon Mobil Corp. | | 3.3 | | 4.4 |
| Bank of America Corp. | | 1.9 | | 2.6 |
| JPMorgan Chase & Co. | | 1.7 | | 0.5 |
| Hewlett-Packard Co. | | 1.7 | | 0.0 |
| Halliburton Co. | | 1.6 | | 1.1 |
| Baxter International, Inc. | | 1.6 | | 2.0 |
| Altria Group, Inc. | | 1.5 | | 2.0 |
| | | 24.9 | | |
| Top Five Market Sectors as of October 31, 2005 | | |
| | | % of fund’s | | % of fund’s net assets |
| | | net assets | | 6 months ago |
| Financials | | 22.7 | | 17.5 |
| Energy | | 14.8 | | 13.4 |
| Industrials | | 14.1 | | 20.2 |
| Health Care | | 11.8 | | 10.8 |
| Information Technology | | 11.2 | | 8.0 |
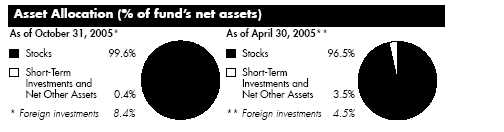
| Investments October 31, 2005 | | | | | | | | |
| Showing Percentage of Net Assets | | | | | | | | |
| Common Stocks — 99.6% | | | | | | | | |
| | | | | Shares | | Value (Note 1) |
| |
| CONSUMER DISCRETIONARY – 8.3% | | | | | | | | |
| Diversified Consumer Services – 0.5% | | | | | | | | |
| Apollo Group, Inc. Class A (a) | | | | 1,900 | | $ | | 119,738 |
| Service Corp. International (SCI) | | | | 9,900 | | | | 82,863 |
| | | | | | | | | 202,601 |
| Hotels, Restaurants & Leisure – 0.5% | | | | | | | | |
| McDonald’s Corp. | | | | 5,200 | | | | 164,320 |
| Red Robin Gourmet Burgers, Inc. (a) | | | | 1,000 | | | | 48,230 |
| Ruth’s Chris Steak House, Inc. | | | | 100 | | | | 1,786 |
| | | | | | | | | 214,336 |
| Household Durables – 0.8% | | | | | | | | |
| D.R. Horton, Inc. | | | | 1,800 | | | | 55,242 |
| KB Home | | | | 600 | | | | 39,210 |
| LG Electronics, Inc. | | | | 450 | | | | 29,181 |
| Sony Corp. sponsored ADR | | | | 2,900 | | | | 95,120 |
| Techtronic Industries Co. Ltd. | | | | 21,000 | | | | 51,605 |
| Toll Brothers, Inc. (a) | | | | 900 | | | | 33,219 |
| | | | | | | | | 303,577 |
| Internet & Catalog Retail – 1.0% | | | | | | | | |
| Coldwater Creek, Inc. (a) | | | | 2,900 | | | | 78,271 |
| eBay, Inc. (a) | | | | 6,500 | | | | 257,400 |
| Expedia, Inc., Delaware (a) | | | | 1,450 | | | | 27,246 |
| IAC/InterActiveCorp (a) | | | | 1,450 | | | | 37,120 |
| | | | | | | | | 400,037 |
| Leisure Equipment & Products – 1.0% | | | | | | | | |
| Eastman Kodak Co. | | | | 13,800 | | | | 302,220 |
| Leapfrog Enterprises, Inc. Class A (a)(d) | | | | 4,700 | | | | 70,500 |
| | | | | | | | | 372,720 |
| Media – 3.4% | | | | | | | | |
| Clear Channel Communications, Inc. | | | | 3,020 | | | | 91,868 |
| Lamar Advertising Co. Class A (a) | | | | 5,664 | | | | 252,728 |
| News Corp. Class A | | | | 1,476 | | | | 21,033 |
| NTL, Inc. (a) | | | | 900 | | | | 55,188 |
| The Reader’s Digest Association, Inc. (non-vtg.) | | | | 2,500 | | | | 38,300 |
| Time Warner, Inc. | | | | 15,000 | | | | 267,450 |
| Univision Communications, Inc. Class A (a) | | | | 11,800 | | | | 308,452 |
| Viacom, Inc. Class B (non-vtg.) | | | | 1,534 | | | | 47,508 |
| Walt Disney Co. | | | | 8,900 | | | | 216,893 |
| XM Satellite Radio Holdings, Inc. Class A (a) | | | | 300 | | | | 8,649 |
| | | | | | | | | 1,308,069 |
See accompanying notes which are an integral part of the financial statements.
11 Annual Report
| Investments - continued | | | | | | |
| |
| |
| Common Stocks – continued | | | | | | |
| | | Shares | | Value (Note 1) |
| |
| CONSUMER DISCRETIONARY – continued | | | | | | |
| Specialty Retail – 1.1% | | | | | | |
| Blockbuster, Inc. Class B | | 3 | | $ | | 13 |
| Home Depot, Inc. | | 7,250 | | | | 297,540 |
| Maidenform Brands, Inc. | | 200 | | | | 2,518 |
| OfficeMax, Inc. | | 2,600 | | | | 72,852 |
| Staples, Inc. | | 1,600 | | | | 36,368 |
| | | | | | | 409,291 |
| |
| TOTAL CONSUMER DISCRETIONARY | | | | | | 3,210,631 |
| |
| CONSUMER STAPLES – 5.9% | | | | | | |
| Beverages – 0.9% | | | | | | |
| Coca-Cola Enterprises, Inc. | | 2,900 | | | | 54,810 |
| Diageo PLC sponsored ADR | | 600 | | | | 35,658 |
| PepsiCo, Inc. | | 900 | | | | 53,172 |
| The Coca-Cola Co. | | 4,400 | | | | 188,232 |
| | | | | | | 331,872 |
| Food & Staples Retailing – 1.9% | | | | | | |
| CVS Corp. | | 1,600 | | | | 39,056 |
| Kroger Co. (a) | | 14,200 | | | | 282,580 |
| Rite Aid Corp. (a) | | 3,800 | | | | 13,300 |
| Safeway, Inc. | | 9,800 | | | | 227,948 |
| Wal-Mart Stores, Inc. | | 3,300 | | | | 156,123 |
| Walgreen Co. | | 800 | | | | 36,344 |
| | | | | | | 755,351 |
| Food Products – 0.5% | | | | | | |
| Nestle SA (Reg.) | | 332 | | | | 98,893 |
| Tyson Foods, Inc. Class A | | 5,100 | | | | 90,780 |
| | | | | | | 189,673 |
| Household Products – 1.1% | | | | | | |
| Colgate-Palmolive Co. | | 7,800 | | | | 413,088 |
| Tobacco – 1.5% | | | | | | |
| Altria Group, Inc. | | 7,830 | | | | 587,642 |
| |
| TOTAL CONSUMER STAPLES | | | | | | 2,277,626 |
| |
| ENERGY – 14.8% | | | | | | |
| Energy Equipment & Services – 6.5% | | | | | | |
| BJ Services Co. | | 6,800 | | | | 236,300 |
| FMC Technologies, Inc. (a) | | 2,300 | | | | 83,858 |
| GlobalSantaFe Corp. | | 4,000 | | | | 178,200 |
See accompanying notes which are an integral part of the financial statements.
| Common Stocks – continued | | | | | | |
| | | Shares | | Value (Note 1) |
| |
| ENERGY – continued | | | | | | |
| Energy Equipment & Services – continued | | | | | | |
| Halliburton Co. | | 10,500 | | $ | | 620,550 |
| Hercules Offshore, Inc. | | 400 | | | | 8,708 |
| National Oilwell Varco, Inc. (a) | | 6,832 | | | | 426,795 |
| Noble Corp. | | 1,200 | | | | 77,256 |
| Pride International, Inc. (a) | | 6,000 | | | | 168,420 |
| Schlumberger Ltd. (NY Shares) | | 4,100 | | | | 372,157 |
| Smith International, Inc. | | 4,200 | | | | 136,080 |
| Weatherford International Ltd. (a) | | 3,430 | | | | 214,718 |
| | | | | | | 2,523,042 |
| Oil, Gas & Consumable Fuels – 8.3% | | | | | | |
| Amerada Hess Corp. | | 1,200 | | | | 150,120 |
| Apache Corp. | | 1,400 | | | | 89,362 |
| Chevron Corp. | | 8,500 | | | | 485,095 |
| ConocoPhillips | | 2,300 | | | | 150,374 |
| El Paso Corp. | | 7,800 | | | | 92,508 |
| Encore Acquisition Co. (a) | | 1,250 | | | | 42,888 |
| Exxon Mobil Corp. | | 22,870 | | | | 1,283,922 |
| Occidental Petroleum Corp. | | 1,700 | | | | 134,096 |
| OMI Corp. | | 3,700 | | | | 66,896 |
| Quicksilver Resources, Inc. (a) | | 7,550 | | | | 292,412 |
| Valero Energy Corp. | | 2,500 | | | | 263,100 |
| XTO Energy, Inc. | | 3,300 | | | | 143,418 |
| | | | | | | 3,194,191 |
| |
| TOTAL ENERGY | | | | | | 5,717,233 |
| |
| FINANCIALS – 22.7% | | | | | | |
| Capital Markets – 4.2% | | | | | | |
| Bear Stearns Companies, Inc. | | 500 | | | | 52,900 |
| Charles Schwab Corp. | | 6,600 | | | | 100,320 |
| Investors Financial Services Corp. | | 1,600 | | | | 61,088 |
| Lehman Brothers Holdings, Inc. | | 1,100 | | | | 131,637 |
| Merrill Lynch & Co., Inc. | | 5,600 | | | | 362,544 |
| Morgan Stanley | | 6,800 | | | | 369,988 |
| Nomura Holdings, Inc. | | 4,100 | | | | 63,509 |
| Nuveen Investments, Inc. Class A | | 900 | | | | 36,423 |
| State Street Corp. | | 5,100 | | | | 281,673 |
| TradeStation Group, Inc. (a) | | 5,200 | | | | 51,896 |
| UBS AG (NY Shares) | | 1,200 | | | | 102,804 |
| | | | | | | 1,614,782 |
See accompanying notes which are an integral part of the financial statements.
13 Annual Report
| Investments - continued | | | | | | |
| |
| |
| Common Stocks – continued | | | | | | |
| | | Shares | | Value (Note 1) |
| |
| FINANCIALS – continued | | | | | | |
| Commercial Banks – 4.1% | | | | | | |
| Banco Bradesco SA (PN) sponsored ADR (non-vtg.) | | 1,700 | | $ | | 88,213 |
| Bank of America Corp. | | 16,742 | | | | 732,295 |
| Korea Exchange Bank (a) | | 10,750 | | | | 118,415 |
| UCBH Holdings, Inc. | | 5,400 | | | | 93,960 |
| Wachovia Corp. | | 8,259 | | | | 417,245 |
| Wells Fargo & Co. | | 2,550 | | | | 153,510 |
| | | | | | | 1,603,638 |
| Diversified Financial Services – 3.0% | | | | | | |
| Citigroup, Inc. | | 10,600 | | | | 485,268 |
| JPMorgan Chase & Co. | | 17,940 | | | | 656,963 |
| | | | | | | 1,142,231 |
| Insurance – 9.1% | | | | | | |
| ACE Ltd. | | 8,600 | | | | 448,060 |
| American International Group, Inc. | | 26,940 | | | | 1,745,708 |
| Aspen Insurance Holdings Ltd. | | 1,600 | | | | 38,704 |
| Endurance Specialty Holdings Ltd. | | 1,200 | | | | 39,792 |
| Hartford Financial Services Group, Inc. | | 4,700 | | | | 374,825 |
| Hilb Rogal & Hobbs Co. | | 3,000 | | | | 112,350 |
| Montpelier Re Holdings Ltd. | | 1,100 | | | | 22,110 |
| PartnerRe Ltd. | | 4,100 | | | | 261,252 |
| Platinum Underwriters Holdings Ltd. | | 1,600 | | | | 45,584 |
| Scottish Re Group Ltd. | | 2,300 | | | | 56,465 |
| The Chubb Corp. | | 230 | | | | 21,383 |
| W.R. Berkley Corp. | | 6,850 | | | | 299,345 |
| XL Capital Ltd. Class A | | 900 | | | | 57,654 |
| | | | | | | 3,523,232 |
| Real Estate – 0.7% | | | | | | |
| Apartment Investment & Management Co. Class A | | 1,800 | | | | 69,120 |
| Equity Lifestyle Properties, Inc. | | 350 | | | | 14,816 |
| Equity Residential (SBI) | | 2,100 | | | | 82,425 |
| General Growth Properties, Inc. | | 2,500 | | | | 106,200 |
| Spirit Finance Corp. (e) | | 300 | | | | 3,366 |
| | | | | | | 275,927 |
| Thrifts & Mortgage Finance – 1.6% | | | | | | |
| Doral Financial Corp. | | 4,600 | | | | 39,376 |
| Fannie Mae | | 5,760 | | | | 273,715 |
| Freddie Mac | | 1,900 | | | | 116,565 |
| Golden West Financial Corp., Delaware | | 1,240 | | | | 72,825 |
| Hudson City Bancorp, Inc. | | 3,500 | | | | 41,440 |
See accompanying notes which are an integral part of the financial statements.
| Common Stocks – continued | | | | | | |
| | | Shares | | Value (Note 1) |
| |
| FINANCIALS – continued | | | | | | |
| Thrifts & Mortgage Finance – continued | | | | | | |
| Sovereign Bancorp, Inc. | | 3,600 | | $ | | 77,652 |
| W Holding Co., Inc. | | 1,836 | | | | 14,156 |
| | | | | | | 635,729 |
| |
| TOTAL FINANCIALS | | | | | | 8,795,539 |
| |
| HEALTH CARE – 11.8% | | | | | | |
| Biotechnology – 2.7% | | | | | | |
| Alkermes, Inc. (a) | | 1,500 | | | | 24,435 |
| Alnylam Pharmaceuticals, Inc. (a) | | 5,600 | | | | 53,816 |
| Amgen, Inc. (a) | | 1,400 | | | | 106,064 |
| Biogen Idec, Inc. (a) | | 2,200 | | | | 89,386 |
| BioMarin Pharmaceutical, Inc. (a) | | 8,000 | | | | 67,200 |
| Cephalon, Inc. (a) | | 7,600 | | | | 346,484 |
| Genentech, Inc. (a) | | 700 | | | | 63,420 |
| ImClone Systems, Inc. (a) | | 2,700 | | | | 93,690 |
| MedImmune, Inc. (a) | | 4,050 | | | | 141,669 |
| ONYX Pharmaceuticals, Inc. (a) | | 1,500 | | | | 38,535 |
| Serologicals Corp. (a) | | 1,200 | | | | 23,376 |
| | | | | | | 1,048,075 |
| Health Care Equipment & Supplies – 4.1% | | | | | | |
| Baxter International, Inc. | | 15,840 | | | | 605,563 |
| C.R. Bard, Inc. | | 900 | | | | 56,142 |
| Dionex Corp. (a) | | 800 | | | | 38,744 |
| Medtronic, Inc. | | 5,050 | | | | 286,133 |
| PerkinElmer, Inc. | | 6,100 | | | | 134,627 |
| Syneron Medical Ltd. (a) | | 700 | | | | 25,158 |
| Thermo Electron Corp. (a) | | 6,500 | | | | 196,235 |
| Varian, Inc. (a) | | 1,000 | | | | 36,770 |
| Waters Corp. (a) | | 5,500 | | | | 199,100 |
| | | | | | | 1,578,472 |
| Health Care Providers & Services – 1.0% | | | | | | |
| McKesson Corp. | | 1,400 | | | | 63,602 |
| Psychiatric Solutions, Inc. (a) | | 1,500 | | | | 82,050 |
| Sierra Health Services, Inc. (a) | | 1,100 | | | | 82,500 |
| UnitedHealth Group, Inc. | | 2,300 | | | | 133,147 |
| WebMD Health Corp. Class A | | 800 | | | | 20,896 |
| | | | | | | 382,195 |
See accompanying notes which are an integral part of the financial statements.
15 Annual Report
| Investments - continued | | | | | | |
| |
| |
| Common Stocks – continued | | | | | | |
| | | Shares | | Value (Note 1) |
| |
| HEALTH CARE – continued | | | | | | |
| Pharmaceuticals – 4.0% | | | | | | |
| Allergan, Inc. | | 500 | | $ | | 44,650 |
| Connetics Corp. (a) | | 800 | | | | 10,432 |
| Merck & Co., Inc. | | 2,000 | | | | 56,440 |
| Pfizer, Inc. | | 26,900 | | | | 584,806 |
| Schering-Plough Corp. | | 12,140 | | | | 246,928 |
| Teva Pharmaceutical Industries Ltd. sponsored ADR | | 5,100 | | | | 194,412 |
| Valeant Pharmaceuticals International | | 1,500 | | | | 25,740 |
| Wyeth | | 9,200 | | | | 409,952 |
| | | | | | | 1,573,360 |
| |
| TOTAL HEALTH CARE | | | | | | 4,582,102 |
| |
| INDUSTRIALS – 14.1% | | | | | | |
| Aerospace & Defense – 4.3% | | | | | | |
| Hexcel Corp. (a) | | 2,300 | | | | 36,386 |
| Honeywell International, Inc. | | 40,540 | | | | 1,386,468 |
| K&F Industries Holdings, Inc. | | 400 | | | | 6,256 |
| Orbital Sciences Corp. (a) | | 2,000 | | | | 23,260 |
| Raytheon Co. | | 1,700 | | | | 62,815 |
| The Boeing Co. | | 200 | | | | 12,928 |
| United Technologies Corp. | | 2,200 | | | | 112,816 |
| | | | | | | 1,640,929 |
| Air Freight & Logistics – 0.2% | | | | | | |
| EGL, Inc. (a) | | 3,000 | | | | 84,090 |
| Airlines – 0.7% | | | | | | |
| ACE Aviation Holdings, Inc. Class A (a) | | 2,000 | | | | 52,498 |
| AirTran Holdings, Inc. (a) | | 5,400 | | | | 80,784 |
| JetBlue Airways Corp. (a) | | 3,600 | | | | 66,996 |
| Southwest Airlines Co. | | 2,700 | | | | 43,227 |
| US Airways Group, Inc. (a) | | 1,000 | | | | 24,680 |
| | | | | | | 268,185 |
| Building Products – 0.3% | | | | | | |
| Lennox International, Inc. | | 2,700 | | | | 75,303 |
| Masco Corp. | | 1,250 | | | | 35,625 |
| | | | | | | 110,928 |
| Commercial Services & Supplies – 0.5% | | | | | | |
| Robert Half International, Inc. | | 4,700 | | | | 173,336 |
| Construction & Engineering – 1.1% | | | | | | |
| Chicago Bridge & Iron Co. NV (NY Shares) | | 2,200 | | | | 49,060 |
See accompanying notes which are an integral part of the financial statements.
| Common Stocks – continued | | | | | | |
| | | Shares | | Value (Note 1) |
| |
| INDUSTRIALS – continued | | | | | | |
| Construction & Engineering – continued | | | | | | |
| Fluor Corp. | | 4,000 | | $ | | 254,400 |
| Foster Wheeler Ltd. (a) | | 950 | | | | 26,866 |
| Jacobs Engineering Group, Inc. (a) | | 1,500 | | | | 95,625 |
| | | | | | | 425,951 |
| Electrical Equipment – 0.4% | | | | | | |
| ABB Ltd. sponsored ADR (a) | | 7,200 | | | | 56,088 |
| Rockwell Automation, Inc. | | 1,800 | | | | 95,670 |
| | | | | | | 151,758 |
| Industrial Conglomerates – 5.0% | | | | | | |
| 3M Co. | | 500 | | | | 37,990 |
| General Electric Co. | | 39,430 | | | | 1,337,071 |
| Smiths Group PLC | | 5,900 | | | | 95,317 |
| Tyco International Ltd. | | 18,100 | | | | 477,659 |
| | | | | | | 1,948,037 |
| Machinery – 0.5% | | | | | | |
| Deere & Co. | | 1,700 | | | | 103,156 |
| ITT Industries, Inc. | | 730 | | | | 74,168 |
| Watts Water Technologies, Inc. Class A | | 1,000 | | | | 27,760 |
| | | | | | | 205,084 |
| Road & Rail – 0.6% | | | | | | |
| Norfolk Southern Corp. | | 6,000 | | | | 241,200 |
| Trading Companies & Distributors – 0.5% | | | | | | |
| Watsco, Inc. | | 1,850 | | | | 105,136 |
| WESCO International, Inc. (a) | | 2,600 | | | | 103,350 |
| | | | | | | 208,486 |
| |
| TOTAL INDUSTRIALS | | | | | | 5,457,984 |
| |
| INFORMATION TECHNOLOGY – 11.2% | | | | | | |
| Communications Equipment – 1.2% | | | | | | |
| Comverse Technology, Inc. (a) | | 4,700 | | | | 117,970 |
| Dycom Industries, Inc. (a) | | 4,200 | | | | 83,706 |
| Extreme Networks, Inc. (a) | | 4,100 | | | | 19,803 |
| MasTec, Inc. (a) | | 3,700 | | | | 37,703 |
| Motorola, Inc. | | 2,500 | | | | 55,400 |
| Nokia Corp. sponsored ADR | | 9,900 | | | | 166,518 |
| | | | | | | 481,100 |
| Computers & Peripherals – 2.1% | | | | | | |
| Dell, Inc. (a) | | 800 | | | | 25,504 |
See accompanying notes which are an integral part of the financial statements.
17 Annual Report
| Investments - continued | | | | | | |
| |
| |
| Common Stocks – continued | | | | | | |
| | | Shares | | Value (Note 1) |
| |
| INFORMATION TECHNOLOGY – continued | | | | | | |
| Computers & Peripherals – continued | | | | | | |
| EMC Corp. (a) | | 4,300 | | $ | | 60,028 |
| Hewlett-Packard Co. | | 23,300 | | | | 653,332 |
| Lexmark International, Inc. Class A (a) | | 700 | | | | 29,064 |
| Maxtor Corp. (a) | | 9,300 | | | | 32,550 |
| | | | | | | 800,478 |
| Electronic Equipment & Instruments – 1.8% | | | | | | |
| Agilent Technologies, Inc. (a) | | 10,500 | | | | 336,105 |
| Amphenol Corp. Class A | | 1,800 | | | | 71,946 |
| Jabil Circuit, Inc. (a) | | 2,100 | | | | 62,685 |
| Symbol Technologies, Inc. | | 6,300 | | | | 52,290 |
| Trimble Navigation Ltd. (a) | | 2,500 | | | | 72,175 |
| Vishay Intertechnology, Inc. (a) | | 7,200 | | | | 81,648 |
| | | | | | | 676,849 |
| Internet Software & Services – 1.3% | | | | | | |
| Akamai Technologies, Inc. (a) | | 2,100 | | | | 36,414 |
| Digital River, Inc. (a) | | 800 | | | | 22,408 |
| Google, Inc. Class A (sub. vtg.) (a) | | 800 | | | | 297,712 |
| Yahoo!, Inc. (a) | | 3,500 | | | | 129,395 |
| | | | | | | 485,929 |
| IT Services – 0.6% | | | | | | |
| Anteon International Corp. (a) | | 1,800 | | | | 81,360 |
| Ceridian Corp. (a) | | 4,900 | | | | 107,359 |
| First Data Corp. | | 1,200 | | | | 48,540 |
| | | | | | | 237,259 |
| Office Electronics – 0.4% | | | | | | |
| Xerox Corp. (a) | | 6,000 | | | | 81,420 |
| Zebra Technologies Corp. Class A (a) | | 2,100 | | | | 90,531 |
| | | | | | | 171,951 |
| Semiconductors & Semiconductor Equipment – 1.8% | | | | | | |
| Altera Corp. (a) | | 2,000 | | | | 33,300 |
| Analog Devices, Inc. | | 1,900 | | | | 66,082 |
| Cabot Microelectronics Corp. (a)(d) | | 1,100 | | | | 32,340 |
| Freescale Semiconductor, Inc. Class A (a) | | 5,000 | | | | 118,450 |
| Intel Corp. | | 8,000 | | | | 188,000 |
| Maxim Integrated Products, Inc. | | 3,300 | | | | 114,444 |
| Micron Technology, Inc. (a) | | 4,600 | | | | 59,754 |
| PMC-Sierra, Inc. (a) | | 3,200 | | | | 22,720 |
| Samsung Electronics Co. Ltd. | | 128 | | | | 67,678 |
| | | | | | | 702,768 |
See accompanying notes which are an integral part of the financial statements.
| Common Stocks – continued | | | | | | |
| | | Shares | | Value (Note 1) |
| |
| INFORMATION TECHNOLOGY – continued | | | | | | |
| Software – 2.0% | | | | | | |
| BEA Systems, Inc. (a) | | 7,569 | | $ | | 66,759 |
| Cognos, Inc. (a) | | 800 | | | | 29,832 |
| Macrovision Corp. (a) | | 500 | | | | 9,420 |
| Microsoft Corp. | | 13,160 | | | | 338,212 |
| NAVTEQ Corp. (a) | | 2,000 | | | | 78,240 |
| Oracle Corp. (a) | | 2,900 | | | | 36,772 |
| Symantec Corp. (a) | | 7,200 | | | | 171,720 |
| Ulticom, Inc. (a) | | 3,800 | | | | 40,014 |
| | | | | | | 770,969 |
| |
| TOTAL INFORMATION TECHNOLOGY | | | | | | 4,327,303 |
| |
| MATERIALS – 5.9% | | | | | | |
| Chemicals – 3.6% | | | | | | |
| Chemtura Corp. | | 2,300 | | | | 24,610 |
| E.I. du Pont de Nemours & Co. | | 11,800 | | | | 491,942 |
| Ecolab, Inc. | | 2,000 | | | | 66,160 |
| Georgia Gulf Corp. | | 1,700 | | | | 49,470 |
| Lyondell Chemical Co. | | 10,380 | | | | 278,184 |
| Monsanto Co. | | 650 | | | | 40,957 |
| Mosaic Co. (a) | | 3,200 | | | | 42,240 |
| NOVA Chemicals Corp. | | 3,600 | | | | 128,240 |
| Praxair, Inc. | | 3,000 | | | | 148,230 |
| Rockwood Holdings, Inc. | | 3,400 | | | | 68,238 |
| Rohm & Haas Co. | | 1,100 | | | | 47,883 |
| | | | | | | 1,386,154 |
| Construction Materials – 0.2% | | | | | | |
| Martin Marietta Materials, Inc. | | 1,100 | | | | 86,801 |
| Containers & Packaging – 0.9% | | | | | | |
| Crown Holdings, Inc. (a) | | 2,000 | | | | 32,440 |
| Owens-Illinois, Inc. (a) | | 6,712 | | | | 127,796 |
| Packaging Corp. of America | | 2,700 | | | | 54,783 |
| Smurfit-Stone Container Corp. (a) | | 14,275 | | | | 150,744 |
| | | | | | | 365,763 |
| Metals & Mining – 1.2% | | | | | | |
| Alcoa, Inc. | | 3,400 | | | | 82,586 |
See accompanying notes which are an integral part of the financial statements.
19 Annual Report
| Investments - continued | | | | | | |
| |
| |
| Common Stocks – continued | | | | | | |
| | | Shares | | Value (Note 1) |
| |
| MATERIALS – continued | | | | | | |
| Metals & Mining – continued | | | | | | |
| Freeport-McMoRan Copper & Gold, Inc. Class B | | 1,900 | | $ | | 93,898 |
| Newmont Mining Corp. | | 6,350 | | | | 270,510 |
| | | | | | | 446,994 |
| |
| TOTAL MATERIALS | | | | | | 2,285,712 |
| |
| TELECOMMUNICATION SERVICES – 3.8% | | | | | | |
| Diversified Telecommunication Services – 1.7% | | | | | | |
| Covad Communications Group, Inc. (a) | | 63,400 | | | | 56,426 |
| SBC Communications, Inc. | | 20,550 | | | | 490,118 |
| Verizon Communications, Inc. | | 3,350 | | | | 105,559 |
| | | | | | | 652,103 |
| Wireless Telecommunication Services – 2.1% | | | | | | |
| American Tower Corp. Class A (a) | | 9,300 | | | | 221,805 |
| Leap Wireless International, Inc. (a) | | 1,200 | | | | 39,612 |
| Nextel Partners, Inc. Class A (a) | | 5,800 | | | | 145,870 |
| Sprint Nextel Corp. | | 17,026 | | | | 396,876 |
| | | | | | | 804,163 |
| |
| TOTAL TELECOMMUNICATION SERVICES | | | | | | 1,456,266 |
| |
| UTILITIES – 1.1% | | | | | | |
| Electric Utilities – 0.2% | | | | | | |
| PPL Corp. | | 3,000 | | | | 94,020 |
| Independent Power Producers & Energy Traders – 0.4% | | | | | | |
| AES Corp. (a) | | 4,000 | | | | 63,560 |
| TXU Corp. | | 1,000 | | | | 100,750 |
| | | | | | | 164,310 |
| Multi-Utilities – 0.5% | | | | | | |
| CMS Energy Corp. (a) | | 6,300 | | | | 93,933 |
| PG&E Corp. | | 2,500 | | | | 90,950 |
| | | | | | | 184,883 |
| |
| TOTAL UTILITIES | | | | | | 443,213 |
| |
| TOTAL COMMON STOCKS | | | | | | |
| (Cost $34,959,974) | | | | 38,553,609 |
See accompanying notes which are an integral part of the financial statements.
| Money Market Funds — 0.7% | | | | | | | | |
| | | Shares | | | | Value (Note 1) |
| Fidelity Cash Central Fund, 3.92% (b) | | 189,868 | | | | $ | | 189,868 |
| Fidelity Securities Lending Cash Central Fund, 3.94% (b)(c) | | 81,700 | | | | | | 81,700 |
| TOTAL MONEY MARKET FUNDS | | | | | | | | |
| (Cost $271,568) | | | | | | | | 271,568 |
| |
| TOTAL INVESTMENT PORTFOLIO – 100.3% | | | | | | | | |
| (Cost $35,231,542) | | | | | | 38,825,177 |
| |
| NET OTHER ASSETS – (0.3)% | | | | | | | | (134,895) |
| NET ASSETS – 100% | | | | $ | | 38,690,282 |
Legend
(a) Non-income producing
(b) Affiliated fund that is available only to investment companies and other accounts managed by Fidelity Investments. The rate quoted is the annualized seven-day yield of the fund at period end. A complete unaudited listing of the fund’s holdings as of its most recent quarter end is available upon request.
(c) Includes investment made with cash collateral received from securities on loan.
(d) Security or a portion of the security is on loan at period end.
(e) Security exempt from registration under Rule 144A of the Securities Act of 1933. These securities may be resold in transactions exempt from registration, normally to qualified institutional buyers. At the period end, the value of these securities amounted to $3,366 or 0.0% of net assets.
See accompanying notes which are an integral part of the financial statements.
21 Annual Report
| Financial Statements | | | | | | | | |
| |
| |
| Statement of Assets and Liabilities | | | | | | | | |
| | | | | | | | | October 31, 2005 |
| |
| Assets | | | | | | | | |
| Investment in securities, at value (including securities | | | | | | | | |
| loaned of $83,400) (cost $35,231,542) — See | | | | | | | | |
| accompanying schedule | | | | | | $ | | 38,825,177 |
| Receivable for investments sold | | | | | | | | 280,853 |
| Receivable for fund shares sold | | | | | | | | 98,410 |
| Dividends receivable | | | | | | | | 23,849 |
| Interest receivable | | | | | | | | 322 |
| Receivable from investment adviser for expense | | | | | | | | |
| reductions | | | | | | | | 7,590 |
| Other affiliated receivables | | | | | | | | 351 |
| Other receivables | | | | | | | | 4,652 |
| Total assets | | | | | | | | 39,241,204 |
| |
| Liabilities | | | | | | | | |
| Payable to custodian bank | | $ | | 46,629 | | | | |
| Payable for investments purchased | | | | 308,101 | | | | |
| Payable for fund shares redeemed | | | | 32,219 | | | | |
| Accrued management fee | | | | 18,053 | | | | |
| Distribution fees payable | | | | 16,970 | | | | |
| Other affiliated payables | | | | 9,634 | | | | |
| Other payables and accrued expenses | | | | 37,616 | | | | |
| Collateral on securities loaned, at value | | | | 81,700 | | | | |
| Total liabilities | | | | | | | | 550,922 |
| |
| Net Assets | | | | | | $ | | 38,690,282 |
| Net Assets consist of: | | | | | | | | |
| Paid in capital | | | | | | $ | | 34,271,931 |
| Undistributed net investment income | | | | | | | | 7,929 |
| Accumulated undistributed net realized gain (loss) on | | | | | | | | |
| investments and foreign currency transactions | | | | | | | | 816,766 |
| Net unrealized appreciation (depreciation) on | | | | | | | | |
| investments and assets and liabilities in foreign | | | | | | | | |
| currencies | | | | | | | | 3,593,656 |
| Net Assets | | | | | | $ | | 38,690,282 |
See accompanying notes which are an integral part of the financial statements.
| Statement of Assets and Liabilities | | | | |
| | | October 31, 2005 |
| Calculation of Maximum Offering Price | | | | |
| Class A: | | | | |
| Net Asset Value and redemption price per share | | | | |
| ($7,120,788 ÷ 538,577 shares) | | $ | | 13.22 |
| |
| Maximum offering price per share (100/94.25 of $13.22) | | $ | | 14.03 |
| Class T: | | | | |
| Net Asset Value and redemption price per share | | | | |
| ($21,580,159 ÷ 1,642,665 shares) | | $ | | 13.14 |
| |
| Maximum offering price per share (100/96.50 of $13.14) | | $ | | 13.62 |
| Class B: | | | | |
| Net Asset Value and offering price per share ($4,240,096 | | | | |
| ÷ 326,313 shares)A | | $ | | 12.99 |
| |
| Class C: | | | | |
| Net Asset Value and offering price per share ($3,891,904 | | | | |
| ÷ 299,543 shares)A | | $ | | 12.99 |
| |
| Institutional Class: | | | | |
| Net Asset Value, offering price and redemption price per | | | | |
| share ($1,857,335 ÷ 139,896 shares) | | $ | | 13.28 |
| |
| A Redemption price per share is equal to net asset value less any applicable contingent deferred sales charge. | | | | |
See accompanying notes which are an integral part of the financial statements.
23 Annual Report
| Financial Statements - continued | | | | | | |
| |
| |
| Statement of Operations | | | | | | |
| | | | | Year ended October 31, 2005 |
| |
| Investment Income | | | | | | |
| Dividends | | | | $ | | 559,182 |
| Interest | | | | | | 16,818 |
| Security lending | | | | | | 1,244 |
| Total income | | | | | | 577,244 |
| |
| Expenses | | | | | | |
| Management fee | | $ | | 189,039 | | |
| Transfer agent fees | | | | 83,765 | | |
| Distribution fees | | | | 177,186 | | |
| Accounting and security lending fees | | | | 17,447 | | |
| Independent trustees’ compensation | | | | 147 | | |
| Custodian fees and expenses | | | | 18,850 | | |
| Registration fees | | | | 62,903 | | |
| Audit | | | | 36,493 | | |
| Legal | | | | 1,384 | | |
| Miscellaneous | | | | 1,192 | | |
| Total expenses before reductions | | | | 588,406 | | |
| Expense reductions | | | | (75,554) | | 512,852 |
| |
| Net investment income (loss) | | | | | | 64,392 |
| Realized and Unrealized Gain (Loss) | | | | | | |
| Net realized gain (loss) on: | | | | | | |
| Investment securities | | | | 883,951 | | |
| Foreign currency transactions | | | | (436) | | |
| Total net realized gain (loss) | | | | | | 883,515 |
| Change in net unrealized appreciation (depreciation) on: | | | | |
| Investment securities | | | | 2,424,608 | | |
| Assets and liabilities in foreign currencies | | | | 20 | | |
| Total change in net unrealized appreciation | | | | | | |
| (depreciation) | | | | | | 2,424,628 |
| Net gain (loss) | | | | | | 3,308,143 |
| Net increase (decrease) in net assets resulting from | | | | | | |
| operations | | | | $ | | 3,372,535 |
See accompanying notes which are an integral part of the financial statements.
| Statement of Changes in Net Assets | | | | | | | | |
| | | | | Year ended | | | | Year ended |
| | | | | October 31, | | | | October 31, |
| | | | | 2005 | | | | 2004 |
| Increase (Decrease) in Net Assets | | | | | | | | |
| Operations | | | | | | | | |
| Net investment income (loss) | | $ | | 64,392 | | $ | | (17,048) |
| Net realized gain (loss) | | | | 883,515 | | | | (3,779) |
| Change in net unrealized appreciation (depreciation) . | | | | 2,424,628 | | | | 939,930 |
| Net increase (decrease) in net assets resulting | | | | | | | | |
| from operations | | | | 3,372,535 | | | | 919,103 |
| Distributions to shareholders from net investment income . | | | | (59,389) | | | | — |
| Distributions to shareholders from net realized gain | | | | (20,268) | | | | — |
| Total distributions | | | | (79,657) | | | | — |
| Share transactions -- net increase (decrease) | | | | 12,400,050 | | | | 16,177,102 |
| Total increase (decrease) in net assets | | | | 15,692,928 | | | | 17,096,205 |
| |
| Net Assets | | | | | | | | |
| Beginning of period | | | | 22,997,354 | | | | 5,901,149 |
| End of period (including undistributed net investment | | | | | | | | |
| income of $7,929 and undistributed net investment | | | | | | | | |
| income of $0, respectively) | | $ | | 38,690,282 | | $ | | 22,997,354 |
See accompanying notes which are an integral part of the financial statements.
25 Annual Report
| Financial Highlights — Class A | | | | | | | | | | | | |
| |
| Years ended October 31, | | | | 2005 | | | | 2004 | | | | 2003F |
| Selected Per-Share Data | | | | | | | | | | | | |
| Net asset value, beginning of period | | $ | | 11.70 | | $ | | 10.37 | | $ | | 10.00 |
| Income from Investment Operations | | | | | | | | | | | | |
| Net investment income (loss)E | | | | 06 | | | | .01 | | | | —H |
| Net realized and unrealized gain (loss) | | | | 1.51 | | | | 1.32 | | | | .37 |
| Total from investment operations | | | | 1.57 | | | | 1.33 | | | | .37 |
| Distributions from net investment income | | | | (.04) | | | | — | | | | — |
| Distributions from net realized gain | | | | (.01) | | | | — | | | | — |
| Total distributions | | | | (.05) | | | | — | | | | — |
| Net asset value, end of period | | $ | | 13.22 | | $ | | 11.70 | | $ | | 10.37 |
| Total ReturnB,C,D | | | | 13.40% | | | | 12.83% | | | | 3.70% |
| Ratios to Average Net AssetsG | | | | | | | | | | | | |
| Expenses before expense reductions | | | | 1.50% | | | | 3.39% | | | | 5.52%A |
| Expenses net of voluntary waivers, if any | | | | 1.30% | | | | 1.50% | | | | 1.75%A |
| Expenses net of all reductions | | | | 1.26% | | | | 1.47% | | | | 1.73%A |
| Net investment income (loss) | | | | 48% | | | | .11% | | | | (.05)%A |
| Supplemental Data | | | | | | | | | | | | |
| Net assets, end of period (000 omitted) | | $ | | 7,121 | | $ | | 4,000 | | $ | | 1,123 |
| Portfolio turnover rate | | | | 86% | | | | 111% | | | | 108%A |
A Annualized
B Total returns for periods of less than one year are not annualized.
C Total returns would have been lower had certain expenses not been reduced during the periods shown. D Total returns do not include the effect of the sales charges.
E Calculated based on average shares outstanding during the period.
F For the period June 17, 2003 (commencement of operations) to October 31, 2003.
G Expense ratios reflect operating expenses of the class. Expenses before reductions do not reflect amounts reimbursed by the investment adviser or reductions from brokerage service arrangements or other expense offset arrangements and do not represent the amount paid by the class during periods when reimbursements or reductions occur. Expense ratios before reductions for start up periods may not be representative of longer term operating periods. Expenses net of any voluntary waivers reflect expenses after reimbursement by the investment adviser but prior to reductions from brokerage service arrangements or other expense offset arrangements. Expenses net of all reductions represent the net expenses paid by the class.
H Amount represents less than $.01 per share.
See accompanying notes which are an integral part of the financial statements.
| Financial Highlights — Class T | | | | | | | | | | | | |
| |
| Years ended October 31, | | | | 2005 | | | | 2004 | | | | 2003F |
| Selected Per-Share Data | | | | | | | | | | | | |
| Net asset value, beginning of period | | $ | | 11.67 | | $ | | 10.36 | | $ | | 10.00 |
| Income from Investment Operations | | | | | | | | | | | | |
| Net investment income (loss)E | | | | 03 | | | | (.02) | | | | (.01) |
| Net realized and unrealized gain (loss) | | | | 1.48 | | | | 1.33 | | | | .37 |
| Total from investment operations | | | | 1.51 | | | | 1.31 | | | | .36 |
| Distributions from net investment income | | | | (.03) | | | | — | | | | — |
| Distributions from net realized gain | | | | (.01) | | | | — | | | | — |
| Total distributions | | | | (.04) | | | | — | | | | — |
| Net asset value, end of period | | $ | | 13.14 | | $ | | 11.67 | | $ | | 10.36 |
| Total ReturnB,C,D | | | | 12.96% | | | | 12.64% | | | | 3.60% |
| Ratios to Average Net AssetsG | | | | | | | | | | | | |
| Expenses before expense reductions | | | | 1.72% | | | | 3.30% | | | | 5.77%A |
| Expenses net of voluntary waivers, if any | | | | 1.55% | | | | 1.75% | | | | 2.00%A |
| Expenses net of all reductions | | | | 1.51% | | | | 1.72% | | | | 1.98%A |
| Net investment income (loss) | | | | 23% | | | | (.14)% | | | | (.30)%A |
| Supplemental Data | | | | | | | | | | | | |
| Net assets, end of period (000 omitted) | | $21,580 | | $13,340 | | $ | | 1,546 |
| Portfolio turnover rate | | | | 86% | | | | 111% | | | | 108%A |
A Annualized
B Total returns for periods of less than one year are not annualized.
C Total returns would have been lower had certain expenses not been reduced during the periods shown. D Total returns do not include the effect of the sales charges.
E Calculated based on average shares outstanding during the period.
F For the period June 17, 2003 (commencement of operations) to October 31, 2003.
G Expense ratios reflect operating expenses of the class. Expenses before reductions do not reflect amounts reimbursed by the investment adviser or reductions from brokerage service arrangements or other expense offset arrangements and do not represent the amount paid by the class during periods when reimbursements or reductions occur. Expense ratios before reductions for start up periods may not be representative of longer term operating periods. Expenses net of any voluntary waivers reflect expenses after reimbursement by the investment adviser but prior to reductions from brokerage service arrangements or other expense offset arrangements. Expenses net of all reductions represent the net expenses paid by the class.
See accompanying notes which are an integral part of the financial statements.
27 Annual Report
| Financial Highlights — Class B | | | | | | | | | | | | |
| |
| Years ended October 31, | | | | 2005 | | | | 2004 | | | | 2003F |
| Selected Per-Share Data | | | | | | | | | | | | |
| Net asset value, beginning of period | | $ | | 11.59 | | $ | | 10.34 | | $ | | 10.00 |
| Income from Investment Operations | | | | | | | | | | | | |
| Net investment income (loss)E | | | | (.03) | | | | (.07) | | | | (.03) |
| Net realized and unrealized gain (loss) | | | | 1.46 | | | | 1.32 | | | | .37 |
| Total from investment operations | | | | 1.43 | | | | 1.25 | | | | .34 |
| Distributions from net investment income | | | | (.02) | | | | — | | | | — |
| Distributions from net realized gain | | | | (.01) | | | | — | | | | — |
| Total distributions | | | | (.03) | | | | — | | | | — |
| Net asset value, end of period | | $ | | 12.99 | | $ | | 11.59 | | $ | | 10.34 |
| Total ReturnB,C,D | | | | 12.35% | | | | 12.09% | | | | 3.40% |
| Ratios to Average Net AssetsG | | | | | | | | | | | | |
| Expenses before expense reductions | | | | 2.31% | | | | 4.33% | | | | 6.24%A |
| Expenses net of voluntary waivers, if any | | | | 2.05% | | | | 2.25% | | | | 2.50%A |
| Expenses net of all reductions | | | | 2.01% | | | | 2.22% | | | | 2.48%A |
| Net investment income (loss) | | | | (.27)% | | | | (.64)% | | | | (.80)%A |
| Supplemental Data | | | | | | | | | | | | |
| Net assets, end of period (000 omitted) | | $ | | 4,240 | | $ | | 2,560 | | $ | | 1,125 |
| Portfolio turnover rate | | | | 86% | | | | 111% | | | | 108%A |
A Annualized
B Total returns for periods of less than one year are not annualized.
C Total returns would have been lower had certain expenses not been reduced during the periods shown. D Total returns do not include the effect of the contingent deferred sales charge.
E Calculated based on average shares outstanding during the period.
F For the period June 17, 2003 (commencement of operations) to October 31, 2003.
G Expense ratios reflect operating expenses of the class. Expenses before reductions do not reflect amounts reimbursed by the investment adviser or reductions from brokerage service arrangements or other expense offset arrangements and do not represent the amount paid by the class during periods when reimbursements or reductions occur. Expense ratios before reductions for start up periods may not be representative of longer term operating periods. Expenses net of any voluntary waivers reflect expenses after reimbursement by the investment adviser but prior to reductions from brokerage service arrangements or other expense offset arrangements. Expenses net of all reductions represent the net expenses paid by the class.
See accompanying notes which are an integral part of the financial statements.
| Financial Highlights — Class C | | | | | | | | | | | | |
| |
| Years ended October 31, | | | | 2005 | | | | 2004 | | | | 2003F |
| Selected Per-Share Data | | | | | | | | | | | | |
| Net asset value, beginning of period | | $ | | 11.58 | | $ | | 10.34 | | $ | | 10.00 |
| Income from Investment Operations | | | | | | | | | | | | |
| Net investment income (loss)E | | | | (.03) | | | | (.07) | | | | (.03) |
| Net realized and unrealized gain (loss) | | | | 1.47 | | | | 1.31 | | | | .37 |
| Total from investment operations | | | | 1.44 | | | | 1.24 | | | | .34 |
| Distributions from net investment income | | | | (.02) | | | | — | | | | — |
| Distributions from net realized gain | | | | (.01) | | | | — | | | | — |
| Total distributions | | | | (.03) | | | | — | | | | — |
| Net asset value, end of period | | $ | | 12.99 | | $ | | 11.58 | | $ | | 10.34 |
| Total ReturnB,C,D | | | | 12.45% | | | | 11.99% | | | | 3.40% |
| Ratios to Average Net AssetsG | | | | | | | | | | | | |
| Expenses before expense reductions | | | | 2.30% | | | | 4.39% | | | | 6.24%A |
| Expenses net of voluntary waivers, if any | | | | 2.05% | | | | 2.25% | | | | 2.50%A |
| Expenses net of all reductions | | | | 2.01% | | | | 2.22% | | | | 2.48%A |
| Net investment income (loss) | | | | (.27)% | | | | (.64)% | | | | (.80)%A |
| Supplemental Data | | | | | | | | | | | | |
| Net assets, end of period (000 omitted) | | $ | | 3,892 | | $ | | 1,815 | | $ | | 1,069 |
| Portfolio turnover rate | | | | 86% | | | | 111% | | | | 108%A |
A Annualized
B Total returns for periods of less than one year are not annualized.
C Total returns would have been lower had certain expenses not been reduced during the periods shown. D Total returns do not include the effect of the contingent deferred sales charge.
E Calculated based on average shares outstanding during the period.
F For the period June 17, 2003 (commencement of operations) to October 31, 2003.
G Expense ratios reflect operating expenses of the class. Expenses before reductions do not reflect amounts reimbursed by the investment adviser or reductions from brokerage service arrangements or other expense offset arrangements and do not represent the amount paid by the class during periods when reimbursements or reductions occur. Expense ratios before reductions for start up periods may not be representative of longer term operating periods. Expenses net of any voluntary waivers reflect expenses after reimbursement by the investment adviser but prior to reductions from brokerage service arrangements or other expense offset arrangements. Expenses net of all reductions represent the net expenses paid by the class.
See accompanying notes which are an integral part of the financial statements.
29 Annual Report
| Financial Highlights — Institutional Class | | | | | | | | | | | | |
| |
| Years ended October 31, | | | | 2005 | | | | 2004 | | | | 2003E |
| Selected Per-Share Data | | | | | | | | | | | | |
| Net asset value, beginning of period | | $ | | 11.75 | | $ | | 10.38 | | $ | | 10.00 |
| Income from Investment Operations | | | | | | | | | | | | |
| Net investment income (loss)D | | | | 09 | | | | .04 | | | | .01 |
| Net realized and unrealized gain (loss) | | | | 1.49 | | | | 1.33 | | | | .37 |
| Total from investment operations | | | | 1.58 | | | | 1.37 | | | | .38 |
| Distributions from net investment income | | | | (.04) | | | | — | | | | — |
| Distributions from net realized gain | | | | (.01) | | | | — | | | | — |
| Total distributions | | | | (.05) | | | | — | | | | — |
| Net asset value, end of period | | $ | | 13.28 | | $ | | 11.75 | | $ | | 10.38 |
| Total ReturnB,C | | | | 13.47% | | | | 13.20% | | | | 3.80% |
| Ratios to Average Net AssetsF | | | | | | | | | | | | |
| Expenses before expense reductions | | | | 1.14% | | | | 3.41% | | | | 5.27%A |
| Expenses net of voluntary waivers, if any | | | | 1.06% | | | | 1.25% | | | | 1.50%A |
| Expenses net of all reductions | | | | 1.02% | | | | 1.22% | | | | 1.48%A |
| Net investment income (loss) | | | | 72% | | | | .36% | | | | .20%A |
| Supplemental Data | | | | | | | | | | | | |
| Net assets, end of period (000 omitted) | | $ | | 1,857 | | $ | | 1,282 | | $ | | 1,038 |
| Portfolio turnover rate | | | | 86% | | | | 111% | | | | 108%A |
A Annualized
B Total returns for periods of less than one year are not annualized.
C Total returns would have been lower had certain expenses not been reduced during the periods shown. D Calculated based on average shares outstanding during the period.
E For the period June 17, 2003 (commencement of operations) to October 31, 2003.
F Expense ratios reflect operating expenses of the class. Expenses before reductions do not reflect amounts reimbursed by the investment adviser or reductions from brokerage service arrangements or other expense offset arrangements and do not represent the amount paid by the class during periods when reimbursements or reductions occur. Expense ratios before reductions for start up periods may not be representative of longer term operating periods. Expenses net of any voluntary waivers reflect expenses after reimbursement by the investment adviser but prior to reductions from brokerage service arrangements or other expense offset arrangements. Expenses net of all reductions represent the net expenses paid by the class.
See accompanying notes which are an integral part of the financial statements.
Notes to Financial Statements
For the period ended October 31, 2005
|
1. Significant Accounting Policies.
Fidelity Advisor Value Leaders Fund (the fund) is a non-diversified fund of Fidelity Advisor Series VIII (the trust) and is authorized to issue an unlimited number of shares. The trust is registered under the Investment Company Act of 1940, as amended (the 1940 Act), as an open-end management investment company organized as a Massachusetts business trust.
The fund offers Class A, Class T, Class B, Class C, and Institutional Class shares, each of which has equal rights as to assets and voting privileges. Each class has exclusive voting rights with respect to matters that affect that class. Class B shares will automatically convert to Class A shares after a holding period of seven years from the initial date of purchase. Investment income, realized and unrealized capital gains and losses, the common expenses of the fund, and certain fund-level expense reductions, if any, are allocated on a pro rata basis to each class based on the relative net assets of each class to the total net assets of the fund. Each class differs with respect to transfer agent and distribution and service plan fees incurred. Certain expense reductions also differ by class.
The fund may invest in affiliated money market central funds (Money Market Central Funds), which are open-end investment companies available to investment companies and other accounts managed by Fidelity Management & Research Company (FMR) and its affiliates. The financial statements have been prepared in conformity with accounting principles generally accepted in the United States of America, which require management to make certain estimates and assumptions at the date of the financial statements. The following summarizes the significant accounting policies of the fund:
Security Valuation. Investments are valued and net asset value (NAV) per share is calculated (NAV calculation) as of the close of business of the New York Stock Exchange (NYSE), normally 4:00 p.m. Eastern time. Wherever possible, the fund uses independent pricing services approved by the Board of Trustees to value its investments.
Equity securities, including restricted securities, for which market quotations are readily available, are valued at the last reported sale price or official closing price as reported by an independent pricing service on the primary market or exchange on which they are traded. In the event there were no sales during the day or closing prices are not available, securities are valued at the last quoted bid price. Investments in open-end mutual funds, are valued at their closing net asset value each business day. Short-term securities with remaining maturities of sixty days or less for which quotations are not readily available are valued at amortized cost, which approximates value.
When current market prices or quotations are not readily available or do not accurately reflect fair value, valuations may be determined in accordance with procedures adopted by the Board of Trustees. For example, when developments occur between the close of a market and the close of the NYSE that may materially affect the value of some or all of
31 Annual Report
Notes to Financial Statements - continued
1. Significant Accounting Policies - continued
Security Valuation - continued
the securities, or when trading in a security is halted, those securities may be fair valued. Factors used in the determination of fair value may include monitoring news to identify significant market or security specific events such as changes in the value of U.S. securities market, reviewing developments in foreign markets and evaluating the performance of ADRs, futures contracts and exchange-traded funds. Because the fund’s utilization of fair value pricing depends on market activity, the frequency with which fair value pricing is used can not be predicted and may be utilized to a significant extent. The value of securities used for NAV calculation under fair value pricing may differ from published prices for the same securities.
Foreign Currency. The fund uses foreign currency contracts to facilitate transactions in foreign-denominated securities. Losses from these transactions may arise from changes in the value of the foreign currency or if the counterparties do not perform under the contracts’ terms. Foreign-denominated assets, including investment securities, and liabilities are translated into U.S. dollars at the exchange rate at period end. Purchases and sales of investment securities, income and dividends received and expenses denominated in foreign currencies are translated into U.S. dollars at the exchange rate in effect on the transaction date.
The effects of exchange rate fluctuations on investments are included with the net realized and unrealized gain (loss) on investment securities. Other foreign currency transactions resulting in realized and unrealized gain (loss) are disclosed separately.
Investment Transactions and Income. Security transactions are accounted for as of trade date. Gains and losses on securities sold are determined on the basis of identified cost. Dividend income is recorded on the ex-dividend date, except for certain dividends from foreign securities where the ex-dividend date may have passed, which are recorded as soon as the fund is informed of the ex-dividend date. Non-cash dividends included in dividend income, if any, are recorded at the fair market value of the securities received. Distributions received on securities that represent a return of capital or capital gains are recorded as a reduction of cost of investments and/or as a realized gain. The fund estimates the components of distributions received that may be considered return of capital distributions or capital gain distributions. Interest income is accrued as earned. Interest income includes coupon interest and amortization of premium and accretion of discount on debt securities. Investment income is recorded net of foreign taxes withheld where recovery of such taxes is uncertain.
Expenses. Most expenses of the trust can be directly attributed to a fund. Expenses which cannot be directly attributed are apportioned among each fund in the trust.
1. Significant Accounting Policies - continued
Income Tax Information and Distributions to Shareholders. Each year, the fund intends to qualify as a regulated investment company by distributing all of its taxable income and realized gains under Subchapter M of the Internal Revenue Code. As a result, no provision for income taxes is required in the accompanying financial statements. Foreign taxes are provided for based on the fund’s understanding of the tax rules and rates that exist in the foreign markets in which it invests.
Distributions are recorded on the ex-dividend date. Income dividends and capital gain distributions are declared separately for each class. Income and capital gain distributions are determined in accordance with income tax regulations, which may differ from generally accepted accounting principles. In addition, the fund will claim a portion of the payment made to redeeming shareholders as a distribution for income tax purposes.
Capital accounts within the financial statements are adjusted for permanent book-tax differences. These adjustments have no impact on net assets or the results of operations. Temporary book-tax differences will reverse in a subsequent period.
Book-tax differences are primarily due to foreign currency transactions and losses deferred due to wash sales.
The tax-basis components of distributable earnings and the federal tax cost as of period end were as follows:
| Unrealized appreciation | | $ | | 4,606,359 | | | | |
| Unrealized depreciation | | | | (1,185,891) | | | | |
| Net unrealized appreciation (depreciation) | | | | 3,420,468 | | | | |
| Undistributed ordinary income | | | | 259,857 | | | | |
| Undistributed long-term capital gain | | | | 702,221 | | | | |
| |
| Cost for federal income tax purposes | | $ | | 35,404,709 | | | | |
| |
| The tax character of distributions paid was as follows: | | | | |
| |
| | | | | October 31, 2005 | | | | October 31, 2004 |
| Ordinary Income | | $ | | 59,389 | | $ | | — |
| Long-term Capital Gains | | | | 20,268 | | | | — |
| Total | | $ | | 79,657 | | $ | | — |
33 Annual Report
Notes to Financial Statements - continued
2. Operating Policies.
Repurchase Agreements. FMR has received an Exemptive Order from the Securities and Exchange Commission (the SEC) which permits the fund and other affiliated entities of FMR to transfer uninvested cash balances into joint trading accounts which are then invested in repurchase agreements. The fund may also invest directly with institutions in repurchase agreements. Repurchase agreements are collateralized by government or non-government securities. Collateral is held in segregated accounts with custodian banks and may be obtained in the event of a default of the counterparty. The fund monitors, on a daily basis, the value of the collateral to ensure it is at least equal to the principal amount of the repurchase agreement (including accrued interest). In the event of a default by the counterparty, realization of the collateral proceeds could be delayed, during which time the value of the collateral may decline.
Restricted Securities. The fund may invest in securities that are subject to legal or contractual restrictions on resale. These securities generally may be resold in transactions exempt from registration or to the public if the securities are registered. Disposal of these securities may involve time-consuming negotiations and expense, and prompt sale at an acceptable price may be difficult. Information regarding restricted securities is included at the end of the fund’s Schedule of Investments.
3. Purchases and Sales of Investments.
Purchases and sales of securities, other than short-term securities and U.S. government securities, aggregated $40,819,326 and $28,101,275, respectively.
4. Fees and Other Transactions with Affiliates.
Management Fee. FMR and its affiliates provide the fund with investment management related services for which the fund pays a monthly management fee. The management fee is the sum of an individual fund fee rate that is based on an annual rate of .30% of the fund’s average net assets and a group rate fee that averaged .27% during the period. The group fee rate is based upon the average net assets of all the mutual funds advised by FMR. The group fee rate decreases as assets under management increase and increases as assets under management decrease. For the period, the total annual management fee rate was .57% of the fund’s average net assets.
Distribution and Service Plan. In accordance with Rule 12b-1 of the 1940 Act, the fund has adopted separate Distribution and Service Plans for each class of shares. Certain classes pay Fidelity Distributors Corporation (FDC), an affiliate of FMR, separate Distribution and Service Fees, each of which is based on an annual percentage of each class’ average net assets. In addition, FDC may pay financial intermediaries for selling
4. Fees and Other Transactions with Affiliates - continued
Distribution and Service Plan - continued
shares of the fund and providing shareholder support services. For the period, the Distribution and Service Fee rates and the total amounts paid to and retained by FDC were as follows:
| | | Distribution | | Service | | | | Paid to | | | | Retained |
| | | Fee | | Fee | | | | FDC | | | | by FDC |
| Class A | | 0% | | .25% | | $ | | 14,217 | | $ | | 3,185 |
| Class T | | 25% | | .25% | | | | 94,672 | | | | 6,206 |
| Class B | | 75% | | .25% | | | | 37,727 | | | | 31,444 |
| Class C | | 75% | | .25% | | | | 30,570 | | | | 21,916 |
| |
| | | | | | | $ | | 177,186 | | $ | | 62,751 |
Sales Load. FDC receives a front-end sales charge of up to 5.75% for selling Class A shares, and 3.50% for selling Class T shares, some of which is paid to financial intermediaries for selling shares of the fund. FDC receives the proceeds of contingent deferred sales charges levied on Class A, Class T, Class B, and Class C redemptions. These charges depend on the holding period. The deferred sales charges range from 5% to 1% for Class B, 1% for Class C, and .25% for certain purchases of Class A and Class T shares.
| For the period, sales charge amounts retained by FDC were as follows: | | |
| |
| | | | | Retained |
| | | | | by FDC |
| Class A | | $ | | 9,281 |
| Class T | | | | 4,757 |
| Class B* | | | | 3,117 |
| Class C* | | | | 665 |
| | | $ | | 17,820 |
* When Class B and Class C shares are initially sold, FDC pays commissions from its own resources to financial intermediaries through which the sales are made.
Transfer Agent Fees. Fidelity Investments Institutional Operations Company, Inc. (FIIOC), an affiliate of FMR, is the transfer, dividend disbursing and shareholder servicing agent for each class of the fund. FIIOC receives account fees and asset-based fees that vary according to the account size and type of account of the shareholders of the respective classes of the fund. FIIOC pays for typesetting, printing and mailing of
35 Annual Report
Notes to Financial Statements - continued
4. Fees and Other Transactions with Affiliates - continued
Transfer Agent Fees - continued
shareholder reports, except proxy statements. For the period the total transfer agent fees paid by each class to FIIOC, were as follows:
| | | | | | | % of |
| | | | | | | Average |
| | | | | Amount | | Net Assets |
| Class A | | $ | | 14,881 | | .26 |
| Class T | | | | 44,604 | | .24 |
| Class B | | | | 12,174 | | .32 |
| Class C | | | | 9,715 | | .32 |
| Institutional Class | | | | 2,391 | | .15 |
| | | $ | | 83,765 | | |
Accounting and Security Lending Fees. Fidelity Service Company, Inc. (FSC), an affiliate of FMR, maintains the fund’s accounting records. The accounting fee is based on the level of average net assets for the month. Under a separate contract, FSC administers the security lending program. The security lending fee is based on the number and duration of lending transactions.
Affiliated Central Funds. The fund may invest in Money Market Central Funds which seek preservation of capital and current income and are managed by Fidelity Investments Money Management, Inc. (FIMM), an affiliate of FMR.
The Money Market Central Funds do not pay a management fee. Income distributions earned by the fund are recorded as income in the accompanying financial statements and totaled $18,664 for the period.
Brokerage Commissions. The fund placed a portion of its portfolio transactions with brokerage firms which are affiliates of the investment adviser. The commissions paid to these affiliated firms were $2,429 for the period.
5. Committed Line of Credit.
|
The fund participates with other funds managed by FMR in a $4.2 billion credit facility (the “line of credit”) to be utilized for temporary or emergency purposes to fund shareholder redemptions or for other short-term liquidity purposes. The fund has agreed to pay commitment fees on its pro rata portion of the line of credit. During the period, there were no borrowings on this line of credit.
The fund lends portfolio securities from time to time in order to earn additional income. The fund receives collateral (in the form of U.S. Treasury obligations, letters of credit and/or cash) against the loaned securities and maintains collateral in an amount not less than 100% of the market value of the loaned securities during the period of the loan. The market value of the loaned securities is determined at the close of business of the fund and any additional required collateral is delivered to the fund on the next business day. If the borrower defaults on its obligation to return the securities loaned because of insolvency or other reasons, a fund could experience delays and costs in recovering the securities loaned or in gaining access to the collateral. Cash collateral is invested in the Fidelity Securities Lending Cash Central Fund. The value of loaned securities and cash collateral at period end are disclosed on the fund’s Statement of Assets and Liabilities. Security lending income represents the income earned on investing cash collateral, less fees and expenses associated with the loan, plus any premium payments that may be received on the loan of certain types of securities.
FMR voluntarily agreed to reimburse each class to the extent annual operating expenses exceeded certain levels of average net assets as noted in the table below. Some expenses, for example interest expense, are excluded from this reimbursement.
The following classes were in reimbursement during the period:
| | | Expense | | | | Reimbursement |
| | | Limitations | | | | from adviser |
| |
| Class A | | 1.50% --1.25%* | | $ | | 11,101 |
| Class T | | 1.75% | | -- | | 1.50%* | | | | 32,603 |
| Class B | | 2.25% | | -- | | 2.00%* | | | | 9,702 |
| Class C | | 2.25% | | -- | | 2.00%* | | | | 7,697 |
| Institutional Class | | 1.25% | | -- | | 1.00%* | | | | 1,265 |
| | | | | | | | | $ | | 62,368 |
| * Expense limitation in effect at period end. | | | | | | | | | | |
Many of the brokers with whom FMR places trades on behalf of the fund provided services to the fund in addition to trade execution. These services included payments of certain expenses on behalf of the fund totaling $13,186 for the period.
37 Annual Report
Notes to Financial Statements - continued
8. Other.
The fund’s organizational documents provide former and current trustees and officers with a limited indemnification against liabilities arising in connection with the performance of their duties to the fund. In the normal course of business, the fund may also enter into contracts that provide general indemnifications. The fund’s maximum exposure under these arrangements is unknown as this would be dependent on future claims that may be made against the fund. The risk of material loss from such claims is considered remote.
| 9. Distributions to Shareholders. | | | | | | | | |
| |
| Distributions to shareholders of each class were as follows: | | | | | | |
| |
| Years ended October 31, | | | | 2005 | | | | 2004 | | |
| From net investment income | | | | | | | | | | |
| Class A | | $ | | 12,129 | | $ | | | | — |
| Class T | | | | 34,269 | | | | | | — |
| Class B | | | | 5,103 | | | | | | — |
| Class C | | | | 3,425 | | | | | | — |
| Institutional Class | | | | 4,463 | | | | | | — |
| Total | | $ | | 59,389 | | $ | | | | — |
| From net realized gain | | | | | | | | | | |
| Class A | | $ | | 3,465 | | $ | | | | — |
| Class T | | | | 11,423 | | | | | | — |
| Class B | | | | 2,551 | | | | | | — |
| Class C | | | | 1,713 | | | | | | — |
| Institutional Class | | | | 1,116 | | | | | | — |
| Total | | $ | | 20,268 | | $ | | | | — |
| 10. Share Transactions. | | | | | | | | | | | | |
| |
| Transactions for each class of shares were as follows: | | | | | | | | |
| |
| | | Shares | | | | | | Dollars | | |
| | | Years ended October 31, | | | | Years ended October 31, |
| | | 2005 | | 2004 | | | | 2005 | | | | 2004 |
| Class A | | | | | | | | | | | | |
| Shares sold | | 229,609 | | 238,269 | | $ | | 2,958,743 | | $ | | 2,746,499 |
| Reinvestment of distributions | | 1,066 | | — | | | | 13,266 | | | | — |
| Shares redeemed | | (33,940) | | (4,657) | | | | (427,578) | | | | (52,873) |
| Net increase (decrease) | | 196,735 | | 233,612 | | $ | | 2,544,431 | | $ | | 2,693,626 |
| Class T | | | | | | | | | | | | |
| Shares sold | | 774,584 | | 1,030,154 | | $ | | 9,925,711 | | $ 11,903,301 |
| Reinvestment of distributions | | 3,489 | | — | | | | 43,232 | | | | — |
| Shares redeemed | | (279,010) | | (35,709) | | | | (3,602,636) | | | | (410,022) |
| Net increase (decrease) | | 499,063 | | 994,445 | | $ | | 6,366,307 | | $ 11,493,279 |
| Class B | | | | | | | | | | | | |
| Shares sold | | 178,938 | | 122,344 | | $ | | 2,237,451 | | $ | | 1,393,395 |
| Reinvestment of distributions | | 545 | | — | | | | 6,714 | | | | — |
| Shares redeemed | | (74,090) | | (10,214) | | | | (937,154) | | | | (114,565) |
| Net increase (decrease) | | 105,393 | | 112,130 | | $ | | 1,307,011 | | $ | | 1,278,830 |
| Class C | | | | | | | | | | | | |
| Shares sold | | 165,584 | | 59,183 | | $ | | 2,070,746 | | $ | | 669,159 |
| Reinvestment of distributions | | 415 | | — | | | | 5,114 | | | | — |
| Shares redeemed | | (23,171) | | (5,841) | | | | (293,654) | | | | (64,678) |
| Net increase (decrease) | | 142,828 | | 53,342 | | $ | | 1,782,206 | | $ | | 604,481 |
| Institutional Class | | | | | | | | | | | | |
| Shares sold | | 31,161 | | 9,131 | | $ | | 405,122 | | $ | | 106,886 |
| Reinvestment of distributions | | 413 | | — | | | | 5,149 | | | | — |
| Shares redeemed | | (810) | | — | | | | (10,176) | | | | — |
| Net increase (decrease) | | 30,764 | | 9,131 | | $ | | 400,095 | | $ | | 106,886 |
39 Annual Report
Report of Independent Registered Public Accounting Firm
To the Trustees of Fidelity Advisor Series VIII and the Shareholders of Fidelity Advisor Value Leaders Fund:
In our opinion, the accompanying statement of assets and liabilities, including the schedule of investments, and the related statements of operations and of changes in net assets and the financial highlights present fairly, in all material respects, the financial position of Fidelity Advisor Value Leaders Fund (a fund of Fidelity Advisor Series VIII) at October 31, 2005 and the results of its operations, the changes in its net assets and the financial highlights for the periods indicated, in conformity with accounting principles generally accepted in the United States of America. These financial statements and financial highlights (hereafter referred to as “financial statements”) are the responsibility of the Fidelity Advisor Value Leaders Fund’s management; our responsibility is to express an opinion on these financial statements based on our audits. We conducted our audits of these financial statements in accordance with the standards of the Public Company Accounting Oversight Board (United States). Those standards require that we plan and perform the audit to obtain reasonable assurance about whether the financial statements are free of material misstatement. An audit includes examining, on a test basis, evidence supporting the amounts and disclosures in the financial statements, assessing the accounting principles used and significant estimates made by management, and evaluating the overall financial statement presentation. We believe that our audits, which included confirmation of securities at October 31, 2005 by correspondence with the custodian and brokers, provide a reasonable basis for our opinion.
/s/ PricewaterhouseCoopers LLP
PricewaterhouseCoopers LLP
Boston, Massachusetts
December 13, 2005
|
Trustees and Officers
The Trustees, Members of the Advisory Board, and executive officers of the trust and funds, as applicable, are listed below. The Board of Trustees governs each fund and is responsible for protecting the interests of shareholders. The Trustees are experienced executives who meet periodically throughout the year to oversee each fund’s activities, review contractual arrangements with companies that provide services to each fund, and review each fund’s performance. Except for William O. McCoy, Stephen P. Jonas, and Kenneth L. Wolfe, each of the Trustees oversees 322 funds advised by FMR or an affiliate. Mr. McCoy oversees 324 funds advised by FMR or an affiliate. Mr. Jonas and Mr. Wolfe oversee 319 funds advised by FMR or an affiliate.
The Trustees hold office without limit in time except that (a) any Trustee may resign; (b) any Trustee may be removed by written instrument, signed by at least two-thirds of the number of Trustees prior to such removal; (c) any Trustee who requests to be retired or who has become incapacitated by illness or injury may be retired by written instrument signed by a majority of the other Trustees; and (d) any Trustee may be removed at any special meeting of shareholders by a two-thirds vote of the outstanding voting securities of the trust. Each Trustee who is not an interested person (as defined in the 1940 Act) (Independent Trustee), shall retire not later than the last day of the calendar year in which his or her 72nd birthday occurs. The Independent Trustees may waive this mandatory retirement age policy with respect to individual Trustees. The executive officers and Advisory Board Members hold office without limit in time, except that any officer and Advisory Board Member may resign or may be removed by a vote of a majority of the Trustees at any regular meeting or any special meeting of the Trustees. Except as indicated, each individual has held the office shown or other offices in the same company for the past five years.
The fund’s Statement of Additional Information (SAI) includes more information about the Trustees. To request a free copy, call Fidelity at 1-877-208-0098.
Correspondence intended for each Trustee who is an interested person may be sent to Fidelity Investments, 82 Devonshire Street, Boston, Massachusetts 02109.
| Name, Age; Principal Occupation |
| |
| Edward C. Johnson 3d (75)** |
| |
| Year of Election or Appointment: 1983 |
| Mr. Johnson is Chairman of the Board of Trustees. Mr. Johnson serves |
| as Chief Executive Officer, Chairman, and a Director of FMR Corp.; a |
| Director and Chairman of the Board and of the Executive Committee of |
| FMR; Chairman and a Director of Fidelity Management & Research |
| (Far East) Inc.; Chairman and a Director of Fidelity Investments Money |
| Management, Inc.; and Chairman (2001-present) and a Director |
| (2000-present) of FMR Co., Inc. |
41 Annual Report
Trustees and Officers - continued
| Name, Age; Principal Occupation |
| |
| Abigail P. Johnson (43)** |
| |
| Year of Election or Appointment: 2001 |
| Ms. Johnson serves as President of Fidelity Employer Services Company |
| (FESCO) (2005-present). She is President and a Director of Fidelity In- |
| vestments Money Management, Inc. (2001-present), FMR Co., Inc. |
| (2001-present), and a Director of FMR Corp. Previously, Ms. Johnson |
| served as President and a Director of FMR (2001-2005), Senior Vice |
| President of the Fidelity funds (2001-2005), and managed a number of |
| Fidelity funds. |
| |
| Stephen P. Jonas (52) |
| |
| Year of Election or Appointment: 2005 |
| Mr. Jonas is Senior Vice President of Advisor Value Leaders |
| (2005-present). He also serves as Senior Vice President of other |
| Fidelity funds (2005-present). Mr. Jonas is Executive Director of FMR |
| (2005-present). Previously, Mr. Jonas served as President of Fidelity |
| Enterprise Operations and Risk Services (2004-2005), Chief Adminis- |
| trative Officer (2002-2004), and Chief Financial Officer of FMR Co. |
| (1998-2000). Mr. Jonas has been with Fidelity Investments since 1987 |
| and has held various financial and management positions including |
| Chief Financial Officer of FMR. In addition, he serves on the Boards of |
| Boston Ballet (2003-present) and Simmons College (2003-present). |
| |
| Robert L. Reynolds (53) |
| |
| Year of Election or Appointment: 2003 |
| Mr. Reynolds is a Director (2003-present) and Chief Operating Officer |
| (2002-present) of FMR Corp. He also serves on the Board at Fidelity |
| Investments Canada, Ltd. (2000-present). Previously, Mr. Reynolds |
| served as President of Fidelity Investments Institutional Retirement Group |
| (1996-2000). |
* Trustees have been determined to be “Interested Trustees” by virtue of, among other things, their affiliation with the trust or various entities under common control with FMR.
** Edward C. Johnson 3d, Trustee, is Abigail P. Johnson’s father.
Correspondence intended for each Independent Trustee (that is, the Trustees other than the Interested Trustees) may be sent to Fidelity Investments, P.O. Box 55235, Boston, Massachusetts 02205-5235.
| Name, Age; Principal Occupation |
| |
| Dennis J. Dirks (57) |
| |
| Year of Election or Appointment: 2005 |
| Prior to his retirement in May 2003, Mr. Dirks was Chief Operating |
| Officer and a member of the Board of The Depository Trust & Clearing |
| Corporation (DTCC) (1999-2003). He also served as President, Chief |
| Operating Officer, and Board member of The Depository Trust Company |
| (DTC) (1999-2003) and President and Board member of the National |
| Securities Clearing Corporation (NSCC) (1999-2003). In addition, |
| Mr. Dirks served as Chief Executive Officer and Board member of the |
| Government Securities Clearing Corporation (2001-2003) and Chief |
| Executive Officer and Board member of the Mortgage-Backed Securities |
| Clearing Corporation (2001-2003). Mr. Dirks also serves as a Trustee of |
| Manhattan College (2005-present). |
| |
| Robert M. Gates (62) |
| |
| Year of Election or Appointment: 1997 |
| Dr. Gates is Vice Chairman of the Independent Trustees (2005-present). |
| Dr. Gates is President of Texas A&M University (2002-present). He was |
| Director of the Central Intelligence Agency (CIA) from 1991 to 1993. |
| From 1989 to 1991, Dr. Gates served as Assistant to the President of |
| the United States and Deputy National Security Advisor. Dr. Gates is a |
| Director of NACCO Industries, Inc. (mining and manufacturing), Parker |
| Drilling Co., Inc. (drilling and rental tools for the energy industry, |
| 2001-present), and Brinker International (restaurant management, |
| 2003-present). Previously, Dr. Gates served as a Director of LucasVarity |
| PLC (automotive components and diesel engines), a Director of TRW Inc. |
| (automotive, space, defense, and information technology), and Dean of |
| the George Bush School of Government and Public Service at Texas |
| A&M University (1999-2001). Dr. Gates also is a Trustee of the Forum |
| for International Policy. |
43 Annual Report
Trustees and Officers - continued
| Name, Age; Principal Occupation |
| |
| George H. Heilmeier (69) |
| |
| Year of Election or Appointment: 2004 |
| Dr. Heilmeier is Chairman Emeritus of Telcordia Technologies |
| (communication software and systems), where prior to his retirement, |
| he served as company Chairman and Chief Executive Officer. He |
| currently serves on the Boards of Directors of The Mitre Corporation |
| (systems engineering and information technology support for the |
| government), and HRL Laboratories (private research and development, |
| 2004-present). He is Chairman of the General Motors Science & |
| Technology Advisory Board and a Life Fellow of the Institute of Electrical |
| and Electronics Engineers (IEEE) (2000-present). Dr. Heilmeier is a mem- |
| ber of the Defense Science Board and the National Security Agency |
| Advisory Board. He is also a member of the National Academy of |
| Engineering, the American Academy of Arts and Sciences, and the |
| Board of Overseers of the School of Engineering and Applied Science |
| of the University of Pennsylvania. Previously, Dr. Heilmeier served as a |
| Director of TRW Inc. (automotive, space, defense, and information tech- |
| nology, 1992-2002), Compaq (1994-2002), Automatic Data Processing, |
| Inc. (ADP) (technology-based business outsourcing, 1995-2002), INET |
| Technologies Inc. (telecommunications network surveillance, 2001-2004), |
| and Teletech Holdings (customer management services). He is the recipi- |
| ent of the 2005 Kyoto Prize in Advanced Technology for his invention of |
| the liquid display. |
| |
| Marie L. Knowles (59) |
| |
| Year of Election or Appointment: 2001 |
| Prior to Ms. Knowles’ retirement in June 2000, she served as Executive |
| Vice President and Chief Financial Officer of Atlantic Richfield Company |
| (ARCO) (diversified energy, 1996-2000). From 1993 to 1996, she was |
| a Senior Vice President of ARCO and President of ARCO Transportation |
| Company. She served as a Director of ARCO from 1996 to 1998. She |
| currently serves as a Director of Phelps Dodge Corporation (copper |
| mining and manufacturing) and McKesson Corporation (healthcare ser- |
| vice, 2002-present). Ms. Knowles is a Trustee of the Brookings Institution |
| and the Catalina Island Conservancy and also serves as a member of |
| the Advisory Board for the School of Engineering of the University of |
| Southern California. |
| Name, Age; Principal Occupation |
| |
| Ned C. Lautenbach (61) |
| |
| Year of Election or Appointment: 2000 |
| Mr. Lautenbach has been a partner of Clayton, Dubilier & Rice, Inc. |
| (private equity investment firm) since September 1998. Previously, |
| Mr. Lautenbach was with the International Business Machines Corpora- |
| tion (IBM) from 1968 until his retirement in 1998. Mr. Lautenbach serves |
| as a Director of Italtel Holding S.p.A. (telecommunications (Milan, Italy), |
| 2004-present) and Eaton Corporation (diversified industrial) as well as |
| the Philharmonic Center for the Arts in Naples, Florida. He also is a |
| member of the Board of Trustees of Fairfield University (2005-present), |
| as well as a member of the Council on Foreign Relations. |
| |
| Marvin L. Mann (72) |
| |
| Year of Election or Appointment: 1993 |
| Mr. Mann is Chairman of the Independent Trustees (2001-present). He is |
| Chairman Emeritus of Lexmark International, Inc. (computer peripherals), |
| where he served as CEO until April 1998, retired as Chairman May |
| 1999, and remains a member of the Board. Prior to 1991, he held the |
| positions of Vice President of International Business Machines Corpora- |
| tion (IBM) and President and General Manager of various IBM divisions |
| and subsidiaries. He is a member of the Executive Committee of the |
| Independent Director’s Council of the Investment Company Institute. In |
| addition, Mr. Mann is a member of the President’s Cabinet at the Uni- |
| versity of Alabama and the Board of Visitors of the Culverhouse College |
| of Commerce and Business Administration at the University of Alabama. |
| |
| William O. McCoy (72) |
| |
| Year of Election or Appointment: 1997 |
| Prior to his retirement in December 1994, Mr. McCoy was Vice Chair- |
| man of the Board of BellSouth Corporation (telecommunications) and |
| President of BellSouth Enterprises. He is currently a Director of Liberty |
| Corporation (holding company), Duke Realty Corporation (real estate), |
| and Progress Energy, Inc. (electric utility). He is also a partner of Frank- |
| lin Street Partners (private investment management firm) and a member |
| of the Research Triangle Foundation Board. In addition, Mr. McCoy |
| served as the Interim Chancellor (1999-2000) and a member of the |
| Board of Visitors for the University of North Carolina at Chapel Hill and |
| currently serves on the Board of Directors of the University of North |
| Carolina Health Care System and the Board of Visitors of the Kenan- |
| Flagler Business School (University of North Carolina at Chapel Hill). |
| He also served as Vice President of Finance for the University of North |
| Carolina (16-school system). |
45 Annual Report
Trustees and Officers - continued
| Name, Age; Principal Occupation |
| |
| Cornelia M. Small (61) |
| |
| Year of Election or Appointment: 2005 |
| Ms. Small is a member (2000-present) and Chairperson (2002-present) |
| of the Investment Committee, and a member (2002-present) of the |
| Board of Trustees of Smith College. Previously, she served as Chief |
| Investment Officer (1999-2000), Director of Global Equity Investments |
| (1996-1999), and a member of the Board of Directors of Scudder, |
| Stevens & Clark (1990-1997) and Scudder Kemper Investments |
| (1997-1998). In addition, Ms. Small served as Co-Chair (2000-2003) |
| of the Annual Fund for the Fletcher School of Law and Diplomacy. |
| |
| William S. Stavropoulos (66) |
| |
| Year of Election or Appointment: 2001 |
| Mr. Stavropoulos is Chairman of the Board (2000-present) and a |
| Member of the Board of Directors of The Dow Chemical Company. |
| Since joining The Dow Chemical Company in 1967, Mr. Stavropoulos |
| served in numerous senior management positions, including President |
| (1993-2000; 2002-2003), CEO (1995-2000; 2002-2004), and Chair- |
| man of the Executive Committee (2000-2004). Currently, he is a Direc- |
| tor of NCR Corporation (data warehousing and technology solutions), |
| BellSouth Corporation (telecommunications), Chemical Financial Corpo- |
| ration, Maersk Inc. (industrial conglomerate, 2002-present), and Metal- |
| mark Capital (private equity investment firm, 2005-present). He also |
| serves as a member of the Board of Trustees of the American Enterprise |
| Institute for Public Policy Research. In addition, Mr. Stavropoulos is a |
| member of The Business Council, J.P. Morgan International Council and |
| the University of Notre Dame Advisory Council for the College of Science. |
| |
| Kenneth L. Wolfe (66) |
| |
| Year of Election or Appointment: 2005 |
| Mr. Wolfe also serves as a Trustee (2005-present) or Member of the |
| Advisory Board (2004-present) of other investment companies advised |
| by FMR. Prior to his retirement in 2001, Mr. Wolfe was Chairman and |
| Chief Executive Officer of Hershey Foods Corporation (1993-2001). He |
| currently serves as a member of the boards of Adelphia Communications |
| Corporation (2003-present), Bausch & Lomb, Inc., and Revlon Inc. |
| (2004-present). |
Advisory Board Members and Executive Officers:
Correspondence intended for Mr. Gamper may be sent to Fidelity Investments, P.O. Box 55235, Boston, Massachusetts 02205-5235. Correspondence intended for each executive officer and Mr. Lynch may be sent to Fidelity Investments, 82 Devonshire Street, Boston, Massachusetts 02109.
| Name, Age; Principal Occupation |
| |
| Albert R. Gamper, Jr. (63) |
| |
| Year of Election or Appointment: 2005 |
| Member of the Advisory Board of Fidelity Advisor Series VIII. Prior to his |
| retirement in December 2004, Mr. Gamper served as Chairman of the |
| Board of CIT Group Inc. (commercial finance). During his tenure with |
| CIT Group Inc. Mr. Gamper served in numerous senior management |
| positions, including Chairman (1987-1989; 1999-2001; 2002-2004), |
| Chief Executive Officer (1987-2004), and President (1989-2002). He |
| currently serves as a member of the Board of Directors of Public Service |
| Enterprise Group (utilities, 2001-present), Chairman of the Board of |
| Governors, Rutgers University (2004-present), and Chairman of the |
| Board of Saint Barnabas Health Care System. |
| |
| Peter S. Lynch (61) |
| |
| Year of Election or Appointment: 2003 |
| Member of the Advisory Board of Fidelity Advisor Series VIII. Vice |
| Chairman and a Director of FMR, and Vice Chairman (2001-present) |
| and a Director (2000-present) of FMR Co., Inc. Previously, Mr. Lynch |
| served as a Trustee of the Fidelity funds (1990-2003). In addition, he |
| serves as a Trustee of Boston College, Massachusetts Eye & Ear Infir- |
| mary, Historic Deerfield, John F. Kennedy Library, and the Museum of |
| Fine Arts of Boston. |
| |
| Dwight D. Churchill (51) |
| |
| Year of Election or Appointment: 2005 |
| Vice President of Advisor Value Leaders. Mr. Churchill also serves as |
| Vice President of certain Equity Funds (2005-present) and certain High |
| Income Funds (2005-present). Previously, he served as Head of Fidelity’s |
| Fixed-Income Division (2000-2005), Vice President of Fidelity’s Money |
| Market Funds (2000-2005), Vice President of Fidelity’s Bond Funds, and |
| Senior Vice President of FIMM (2000) and FMR. Mr. Churchill joined |
| Fidelity in 1993 as Vice President and Group Leader of Taxable Fixed- |
| Income Investments. |
47 Annual Report
Trustees and Officers - continued
| Name, Age; Principal Occupation |
| |
| Eric D. Roiter (56) |
| |
| Year of Election or Appointment: 2003 |
| Secretary of Advisor Value Leaders. He also serves as Secretary of |
| Fidelity funds; Vice President, General Counsel, and Secretary of FMR |
| Co., Inc. (2001-present) and FMR; Assistant Secretary of Fidelity Man- |
| agement & Research (U.K.) Inc. (2001-present), Fidelity Management & |
| Research (Far East) Inc. (2001-present), and Fidelity Investments Money |
| Management, Inc. (2001-present). Mr. Roiter is an Adjunct Member, |
| Faculty of Law, at Boston College Law School (2003-present). Previously, |
| Mr. Roiter served as Vice President and Secretary of Fidelity Distributors |
| Corporation (FDC) (1998-2005). |
| |
| Stuart Fross (46) |
| |
| Year of Election or Appointment: 2003 |
| Assistant Secretary of Advisor Value Leaders. Mr. Fross also serves as |
| Assistant Secretary of other Fidelity funds (2003-present), Vice President |
| and Secretary of FDC (2005-present), and is an employee of FMR. |
| |
| Christine Reynolds (47) |
| |
| Year of Election or Appointment: 2004 |
| President, Treasurer, and Anti-Money Laundering (AML) officer of Advi- |
| sor Value Leaders. Ms. Reynolds also serves as President, Treasurer, and |
| AML officer of other Fidelity funds (2004) and is a Vice President (2003) |
| and an employee (2002) of FMR. Before joining Fidelity Investments, |
| Ms. Reynolds worked at PricewaterhouseCoopers LLP (PwC) (1980-2002), |
| where she was most recently an audit partner with PwC’s investment |
| management practice. |
| |
| Paul M. Murphy (58) |
| |
| Year of Election or Appointment: 2005 |
| Chief Financial Officer of Advisor Value Leaders. Mr. Murphy also |
| serves as Chief Financial Officer of other Fidelity funds (2005-present). |
| He also serves as Senior Vice President of Fidelity Pricing and Cash |
| Management Service Group (FPCMS). |
| |
| Kenneth A. Rathgeber (58) |
| |
| Year of Election or Appointment: 2004 |
| Chief Compliance Officer of Advisor Value Leaders. Mr. Rathgeber also |
| serves as Chief Compliance Officer of other Fidelity funds (2004) and |
| Executive Vice President of Risk Oversight for Fidelity Investments |
| (2002). Previously, he served as Executive Vice President and Chief |
| Operating Officer for Fidelity Investments Institutional Services |
| Company, Inc. (1998-2002). |
| Name, Age; Principal Occupation |
| |
| John R. Hebble (47) |
| |
| Year of Election or Appointment: 2003 |
| Deputy Treasurer of Advisor Value Leaders. Mr. Hebble also serves as |
| Deputy Treasurer of other Fidelity funds (2003), and is an employee of |
| FMR. Before joining Fidelity Investments, Mr. Hebble worked at Deutsche |
| Asset Management where he served as Director of Fund Accounting |
| (2002-2003) and Assistant Treasurer of the Scudder Funds |
| (1998-2003). |
| |
| Bryan A. Mehrmann (44) |
| |
| Year of Election or Appointment: 2005 |
| Deputy Treasurer of Advisor Value Leaders. Mr. Mehrmann also serves |
| as Deputy Treasurer of other Fidelity funds (2005-present) and is an |
| employee of FMR. Previously, Mr. Mehrmann served as Vice President of |
| Fidelity Investments Institutional Services Group (FIIS)/Fidelity Investments |
| Institutional Operations Corporation, Inc. (FIIOC) Client Services |
| (1998-2004). |
| |
| Kimberley H. Monasterio (41) |
| |
| Year of Election or Appointment: 2004 |
| Deputy Treasurer of Advisor Value Leaders. Ms. Monasterio also serves |
| as Deputy Treasurer of other Fidelity funds (2004) and is an employee |
| of FMR (2004). Before joining Fidelity Investments, Ms. Monasterio |
| served as Treasurer (2000-2004) and Chief Financial Officer |
| (2002-2004) of the Franklin Templeton Funds and Senior Vice President |
| of Franklin Templeton Services, LLC (2000-2004). |
| |
| Kenneth B. Robins (36) |
| |
| Year of Election or Appointment: 2005 |
| Deputy Treasurer of Advisor Value Leaders. Mr. Robins also serves as |
| Deputy Treasurer of other Fidelity funds (2005-present) and is an |
| employee of FMR (2004-present). Before joining Fidelity Investments, |
| Mr. Robins worked at KPMG LLP, where he was a partner in KPMG’s |
| department of professional practice (2002-2004) and a Senior Man- |
| ager (1999-2000). In addition, Mr. Robins served as Assistant Chief |
| Accountant, United States Securities and Exchange Commission |
| (2000-2002). |
| |
| Robert G. Byrnes (38) |
| |
| Year of Election or Appointment: 2005 |
| Assistant Treasurer of Advisor Value Leaders. Mr. Byrnes also serves as |
| Assistant Treasurer of other Fidelity funds (2005-present) and is an |
| employee of FMR (2005-present). Previously, Mr. Byrnes served as Vice |
| President of FPCMS (2003-2005). Before joining Fidelity Investments, |
| Mr. Byrnes worked at Deutsche Asset Management where he served as |
| Vice President of the Investment Operations Group (2000-2003). |
49 Annual Report
Trustees and Officers - continued
| Name, Age; Principal Occupation |
| |
| John H. Costello (59) |
| |
| Year of Election or Appointment: 2003 |
| Assistant Treasurer of Advisor Value Leaders. Mr. Costello also serves as |
| Assistant Treasurer of other Fidelity funds and is an employee of FMR. |
| |
| Peter L. Lydecker (51) |
| |
| Year of Election or Appointment: 2004 |
| Assistant Treasurer of Advisor Value Leaders. Mr. Lydecker also serves |
| as Assistant Treasurer of other Fidelity funds (2004) and is an employee |
| of FMR. |
| |
| Mark Osterheld (50) |
| |
| Year of Election or Appointment: 2003 |
| Assistant Treasurer of Advisor Value Leaders. Mr. Osterheld also serves |
| as Assistant Treasurer of other Fidelity funds (2002) and is an employee |
| of FMR. |
| |
| Gary W. Ryan (47) |
| |
| Year of Election or Appointment: 2005 |
| Assistant Treasurer of Advisor Value Leaders. Mr. Ryan also serves as |
| Assistant Treasurer of other Fidelity funds (2005-present) and is an |
| employee of FMR (2005-present). Previously, Mr. Ryan served as Vice |
| President of Fund Reporting in FPCMS (1999-2005). |
| |
| Salvatore Schiavone (39) |
| |
| Year of Election or Appointment: 2005 |
| Assistant Treasurer of Advisor Value Leaders. Mr. Schiavone also serves |
| as Assistant Treasurer of other Fidelity funds (2005-present) and is an |
| employee of FMR (2005-present). Before joining Fidelity Investments, |
| Mr. Schiavone worked at Deutsche Asset Management, where he most |
| recently served as Assistant Treasurer (2003-2005) of the Scudder |
| Funds and Vice President and Head of Fund Reporting (1996-2003). |
The Board of Trustees of Fidelity Advisor Value Leaders Fund voted to pay to shareholders of record at the opening of business on record date, the following distributions per share derived from capital gains realized from sales of portfolio securities, and dividends derived from net investment income:
| | | Pay Date | | Record Date | | Dividends | | Capital Gains |
| Institutional Class | | 12/5/05 | | 12/2/05 | | $0.068 | | $0.334 |
The fund hereby designates as capital gain dividends: For dividends with respect to the taxable year ended October 31, 2005, $702,221, or, if subsequently determined to be different, the net capital gain of such year, and for dividends with respect to the taxable year ended October 31, 2004, $23,939, or, if subsequently determined to be different, the excess of: (a) the net capital gain of such year, over (b) amounts previously designated as capital gain dividends with respect to such year.
Institutional Class designates 100% of the dividend distributed during the fiscal year as qualifying for the dividends-received deduction for corporate shareholders.
Institutional Class designates 100% of the dividend distributed during the fiscal year as amounts which may be taken into account as a dividend for purposes of the maximum rate under section 1(h)(11) of the Internal Revenue Code.
The fund will notify shareholders in January 2006 of amounts for use in preparing 2005 income tax returns.
51 Annual Report
Board Approval of Investment Advisory Contracts and Management Fees
Advisor Value Leaders Fund
Each year, typically in July, the Board of Trustees, including the independent Trustees (together, the Board), votes on the renewal of the management contract and sub-advisory agreements (together, the Advisory Contracts) for the fund. The Board, assisted by the advice of fund counsel and independent Trustees’ counsel, requests and considers a broad range of information throughout the year.
The Board meets regularly each month except August and takes into account throughout the year matters bearing on Advisory Contracts. The Board, acting directly and through its separate committees, considers at each of its meetings factors that are relevant to the annual renewal of the fund’s Advisory Contracts, including the services and support provided to the fund and its shareholders by Fidelity. At the time of the renewal, the Board had 11 standing committees, each composed of independent Trustees with varying backgrounds, to which the Board has assigned specific subject matter responsibilities in order to enhance effective decision-making by the Board. Each committee has adopted a written charter outlining the structure and purposes of the committee. One such committee, the Equity Contract Committee, meets periodically during the first six months of each year and as necessary to consider matters specifically related to the annual renewal of Advisory Contracts. The committee requests and receives information on, and makes recommendations to the independent Trustees concerning, the approval and annual review of the Advisory Contracts.
At its July 2005 meeting, the Board of Trustees, including the independent Trustees, unanimously determined to renew the Advisory Contracts for the fund. In reaching its determination, the Board considered all factors it believed relevant, including (1) the nature, extent, and quality of the services to be provided to the fund and its shareholders by Fidelity (including the investment performance of the fund); (2) the competitiveness of the management fee and total expenses of the fund; (3) the total costs of the services to be provided by and the profits to be realized by the investment adviser and its affiliates from the relationship with the fund; (4) the extent to which economies of scale would be realized as the fund grows; and (5) whether fee levels reflect these economies of scale, if any, for the benefit of fund shareholders.
In determining whether to renew the Advisory Contracts for the fund, the Board ultimately reached a determination, with the assistance of fund counsel and independent Trustees’ counsel, that the renewal of the Advisory Contracts and the compensation to be received by Fidelity under the management contract is consistent with Fidelity’s fiduciary duty under applicable law. In addition to evaluating the specific factors noted above, the Board, in reaching its determination, is aware that shareholders in the fund have a broad range of investment choices available to them, including a wide choice among mutual funds offered by competitors to Fidelity, and that the fund’s shareholders, with the opportunity to review and weigh the disclosure provided by the fund in its
prospectus and other public disclosures, have chosen to invest in this fund, managed by Fidelity.
Nature, Extent, and Quality of Services Provided by Fidelity. The Board considered staffing within the investment adviser, FMR, and the sub-advisers (together, the Investment Advisers), including the background of the fund’s portfolio manager and the fund’s investment objective and discipline. The independent Trustees also had discussions with senior management of Fidelity’s investment operations and investment groups. The Board considered the structure of the portfolio manager compensation program and whether this structure provides appropriate incentives.
Fidelity Resources Dedicated to Investment Management and Support Services. The Board reviewed the size, education, and experience of the Investment Advisers’ investment staff, their use of technology, and the Investment Advisers’ approach to recruiting, training, and retaining portfolio managers and other research, advisory, and management personnel. The Board considered Fidelity’s extensive global research capabilities that enable the Investment Advisers to aggregate data from various sources in an effort to produce positive investment results. The Board noted that Fidelity’s analysts have access to a variety of technological tools that enable them to perform both fundamental and quantitative analysis and to specialize in various disciplines. The Board also considered that Fidelity’s portfolio managers and analysts have access to daily portfolio attribution that allows for monitoring of a fund’s portfolio, as well as an electronic communication system that provides immediate real-time access to research concerning issuers and credit enhancers.
Shareholder and Administrative Services. The Board considered the nature, extent, quality, and cost of administrative, distribution, and shareholder services performed by the Investment Advisers and their affiliates under the Advisory Contracts and under separate agreements covering transfer agency, pricing and bookkeeping, and securities lending services for the fund. The Board also considered the nature and extent of the Investment Advisers’ supervision of third party service providers, principally custodians and subcustodians. The Board reviewed the allocation of fund brokerage, including allocations to brokers affiliated with the Investment Advisers, the use of brokerage commissions to pay fund expenses, and the use of “soft” commission dollars to pay for research services. The Board also considered that Fidelity voluntarily decided in 2004 to stop using “soft” commission dollars to pay for market data and, instead, to pay for that data out of its own resources. The Board also considered the resources devoted to, and the record of compliance with, the fund’s compliance policies and procedures.
The Board noted that the growth of fund assets across the complex allows Fidelity to reinvest in the development of services designed to enhance the value or convenience of the Fidelity funds as investment vehicles. These services include 24-hour access to
53 Annual Report
Board Approval of Investment Advisory Contracts and Management Fees - continued
account information and market information through phone representatives and over the Internet, and investor education materials and asset allocation tools.
Investment in a Large Fund Family. The Board considered the benefits to shareholders of investing in a Fidelity fund, including the benefits of investing in a fund that is part of a large family of funds offering a variety of investment disciplines and providing for a large variety of mutual fund investor services. For example, fund shareholders are offered the privilege of exchanging shares of the fund for shares of other Fidelity funds, as set forth in the fund’s prospectus, without paying an additional sales charge. The Board noted that, since the last Advisory Contract renewals in July 2004, Fidelity has taken a number of actions that benefited particular funds, including (i) voluntarily deciding in 2004 to stop using “soft” commission dollars to pay for market data and, instead, to pay for that data out of its own resources, (ii) contractually agreeing to impose management fee reductions and expense limitations on its five Spartan stock index funds and its stock index fund available through variable insurance products, (iii) contractually agreeing to eliminate the management fees on the Fidelity Freedom Funds and the Fidelity Advisor Freedom Funds, (iv) contractually agreeing to reduce the management fees on most of its investment-grade taxable bond funds, and (v) contractually agreeing to impose expense limitations on its retail and Spartan investment-grade taxable bond funds.
Investment Performance and Compliance. The Board considered whether the fund has operated within its investment objective, as well as its record of compliance with its investment restrictions. It also reviewed the fund’s absolute investment performance for each class, as well as the fund’s relative investment performance for each class measured against (i) a broad-based securities market index, and (ii) a peer group of mutual funds. Because the fund had been in existence less than three calendar years, the following chart considered by the Board shows, for the one-year period ended December 31, 2004, the returns of Class C and Institutional Class of the fund, the return of a broad-based securities market index (“benchmark”), and a range of returns of a peer group of mutual funds identified by Lipper Inc. as having an investment objective similar to that of the fund. The returns of Class C and Institutional Class represent the performance of classes with the highest and lowest 12b-1 fees, respectively (not necessarily with the highest and lowest total expenses). The box within the chart shows the 25th percentile return (bottom of box) and the 75th percentile return (top of box) of the Lipper peer group. Returns shown above the box are in the first quartile and returns shown below the box are in the fourth quartile. The percentage beaten numbers noted below the chart correspond to the percentile box and represent the percentage of funds in the Lipper peer group whose performance was equal to or lower than that of the class indicated.
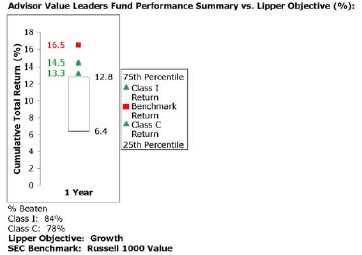
The Board reviewed the fund’s relative investment performance against its Lipper peer group and stated that the performance of Institutional Class of the fund was in the first quartile for the one-year period. The Board noted that FMR does not consider that Lipper peer group to be a meaningful comparison for the fund, however, because the peer group includes funds with different investment mandates (some broader, some narrower) than the fund. For example, the peer group includes funds that are not limited to a particular investment style, funds that focus on growth-oriented stocks, and funds that (like the fund) focus their investments on value-oriented securities. The Board also stated that the relative investment performance of the fund was lower than its benchmark for the one-year period. The Board considered that the variations in performance among the fund’s classes reflect the variations in class expenses, which result in lower performance for higher expense classes. The Board stated that it is difficult to evaluate in any comprehensive fashion the performance of the fund, in light of its relatively recent launch.
The Board has had thorough discussions with FMR throughout the year about the Board’s and FMR’s concerns about equity research, equity fund performance, and compliance with internal policies governing gifts and entertainment. FMR has taken steps that it believes will refocus and strengthen equity research and equity portfolio management and compliance. The Board noted with favor FMR’s recent reorganization of its senior management team and FMR’s plans to dedicate additional resources to investment research, and participated in the process that led to those changes.
Based on its review, and giving particular weight to the nature and quality of the resources dedicated by the Investment Advisers to maintain and improve relative performance, the Board concluded that the nature, extent, and quality of the services
55 Annual Report
Board Approval of Investment Advisory Contracts and Management Fees - continued
provided by Fidelity will benefit the fund’s shareholders, particularly in light of the Board’s view that the fund’s shareholders benefit from investing in a fund that is part of a large family of funds offering a variety of investment disciplines and services.
Competitiveness of Management Fee and Total Fund Expenses. The Board considered the fund’s management fee and total expenses compared to “mapped groups” of competitive funds and classes. Fidelity creates “mapped groups” by combining similar Lipper investment objective categories that have comparable management fee characteristics. Combining Lipper investment objective categories aids the Board’s management fee and total expense comparisons by broadening the competitive group used for comparison and by reducing the number of universes to which various Fidelity funds are compared.
The Board considered two proprietary management fee comparisons for the 12-month (or shorter) periods shown in the chart below. The group of Lipper funds used by the Board for management fee comparisons is referred to below as the “Total Mapped Group” and, for the reasons explained above, is broader than the Lipper peer group used by the Board for performance comparisons. The Total Mapped Group comparison focuses on a fund’s standing relative to the total universe of comparable funds available to investors, in terms of gross management fees before expense reimbursements or caps. “TMG %” represents the percentage of funds in the Total Mapped Group that had management fees that were lower than the fund’s. For example, a TMG % of 15% means that 85% of the funds in the Total Mapped Group had higher management fees than the fund. The “Asset-Size Peer Group” (ASPG) comparison focuses on a fund’s standing relative to non-Fidelity funds similar in size to the fund within the Total Mapped Group. The ASPG represents at least 15% of the funds in the Total Mapped Group with comparable asset size and management fee characteristics, subject to a minimum of 50 funds (or all funds in the Total Mapped Group if fewer than 50). Additional information, such as the ASPG quartile (“quadrant”) in which the fund’s management fee ranked, is also included in the chart and considered by the Board.

The Board noted that the fund’s management fee ranked below the median of its Total Mapped Group and below the median of its ASPG for 2004.
Based on its review, the Board concluded that the fund’s management fee was fair and reasonable in light of the services that the fund receives and the other factors considered.
In its review of each class’s total expenses, the Board considered the fund’s management fee as well as other fund or class expenses, as applicable, such as transfer agent fees, pricing and bookkeeping fees, fund-paid 12b-1 fees, and custodial, legal, and audit fees. The Board also noted the effects of any waivers and reimbursements on fees and expenses. As part of its review, the Board also considered current and historical total expenses of each class of the fund compared to competitive fund median expenses. Each class of the fund is compared to those funds and classes in the Total Mapped Group (used by the Board for management fee comparisons) that have a similar sales load structure.
The Board noted that the total expenses of each class ranked above its competitive median for 2004. The Board noted that the fund offers multiple classes, each of which has a different sales load and 12b-1 fee structure, and that the multiple structures are intended to offer a range of pricing options for the intermediary market. The Board also noted that the total expenses of the classes vary primarily by the level of their 12b-1 fees, although differences in transfer agent fees may also cause expenses to vary from class to class.
57 Annual Report
Board Approval of Investment Advisory Contracts and Management Fees - continued
Furthermore, the Board considered that on December 16, 2004, it had approved changes (effective January 1, 2005) in the transfer agent and service agreements for the fund that established maximum transfer agent fees and eliminated the minimum pricing and bookkeeping fee to prevent small funds or funds with small average account sizes from having relatively high fees in basis points (the “small-fund fee reductions”). The Board considered that, if the small-fund fee reductions had been in effect in 2004, the total expenses of each of Class A, Class B, Class C and Institutional Class would have ranked below the median.
In its review of total expenses, the Board also considered Fidelity fee structures and other information on clients that FMR and its affiliates service in other competitive markets, such as other mutual funds advised or subadvised by FMR or its affiliates, pension plan clients, and other institutional clients.
Based on its review, the Board concluded that the total expenses for each class of the fund were reasonable, although in all cases above the median of the universe presented for comparison, in light of the services that the fund and its shareholders receive and the other factors considered.
Costs of the Services and Profitability. The Board considered the revenues earned and the expenses incurred by Fidelity in conducting the business of developing, marketing, distributing, managing, administering and servicing the fund and its shareholders. The Board also considered the level of Fidelity’s profits in respect of all the Fidelity funds.
On an annual basis, FMR presents to the Board Fidelity’s profitability for the fund. Fidelity calculates the profitability for each fund, as well as aggregate profitability for groups of Fidelity funds and all Fidelity funds, using a series of detailed revenue and cost allocation methodologies which originate with the audited books and records of Fidelity. The Audit Committee of the Board reviews any significant changes from the prior year’s methodologies.
PricewaterhouseCoopers LLP (PwC), independent registered accounting firm and auditor to Fidelity and certain Fidelity funds, has been engaged annually by the Board as part of the Board’s assessment of the results of Fidelity’s profitability analysis. PwC’s engagement includes the review and assessment of Fidelity’s methodologies used in determining the revenues and expenses attributable to Fidelity’s mutual fund business, and completion of agreed-upon procedures surrounding the mathematical accuracy of fund profitability and its conformity to allocation methodologies. After considering PwC’s reports issued under the engagement and information provided by Fidelity, the Board believes that while other allocation methods may also be reasonable, Fidelity’s profitability methodologies are reasonable in all material respects.
The Board has also reviewed Fidelity’s non-fund businesses and any fall-out benefits related to the mutual fund business as well as cases where Fidelity’s affiliates may benefit from or be related to the fund’s business. In addition, a special committee of the Board reviewed services provided to Fidelity by its affiliates and determined that the fees that Fidelity paid for such services were reasonable.
The Board considered the costs of the services provided by and the profits realized by Fidelity in connection with the operation of the fund and determined that the amount of profit is a fair entrepreneurial profit for the management of the fund.
Economies of Scale. The Board considered whether there have been economies of scale in respect of the management of the Fidelity funds, whether the Fidelity funds (including the fund) have appropriately benefited from any such economies of scale, and whether there is potential for realization of any further economies of scale. The Board considered the extent to which the fund will benefit from economies of scale through increased services to the fund, through waivers or reimbursements, or through fee or expense reductions, including reductions that occur through operation of the transfer agent agreement. The transfer agent fee varies in part based on the number of accounts in the fund. If the number of accounts decreases or the average account size increases, the overall transfer agent fee rate decreases.
The Board recognized that the fund’s management contract incorporates a “group fee” structure, which provides for lower fee rates as total fund assets under FMR’s management increase, and for higher fee rates as total fund assets under FMR’s management decrease. The Board considered that the group fee is designed to deliver the benefits of economies of scale to fund shareholders when total fund assets increase, even if assets of any particular fund are unchanged or have declined, because some portion of Fidelity’s costs are attributable to services provided to all Fidelity funds, and all funds benefit if those costs can be allocated among more assets. The Board concluded that, given the group fee structure, fund shareholders will achieve a certain level of economies of scale as assets under FMR’s management increase at the fund complex level, regardless of whether Fidelity achieves any such economies of scale.
The Board further concluded that any potential economies of scale are being shared between fund shareholders and Fidelity in an appropriate manner.
Additional Information Requested by the Board. In order to develop fully the factual basis for consideration of the Advisory Contracts, the Board requested additional information regarding (i) equity fund transfer agency fees; (ii) Fidelity’s fund profitability methodology and the impact of various changes in the methodology over time; (iii) benefits to shareholders from economies of scale; (iv) composition and characteristics of various fund and industry data used in comparisons; and (v) compensation of portfolio managers and research analysts.
59 Annual Report
Board Approval of Investment Advisory Contracts and Management Fees - continued
Based on its evaluation of all of the conclusions noted above, and after considering all material factors, the Board ultimately concluded that the existing advisory fee structures are fair and reasonable, and that the fund’s existing Advisory Contracts should be renewed.
61 Annual Report
63 Annual Report
Investment Adviser
Fidelity Management & Research Company
Boston, MA
Investment Sub-Advisers
FMR Co., Inc.
Fidelity Management & Research
(U.K.) Inc.
Fidelity Management & Research
(Far East) Inc.
Fidelity International
Investment Advisors
Fidelity Investments Japan Limited
Fidelity International Investment
Advisors (U.K.) Limited
General Distributor
Fidelity Distributors Corporation
Boston, MA
Transfer and Service Agents
Fidelity Investments Institutional
Operations Company, Inc.
Boston, MA
Fidelity Service Company, Inc.
Boston, MA
Custodian
Brown Brothers Harriman & Company
Boston, MA
|

As of the end of the period, October 31, 2005, Fidelity Advisor Series VIII (the trust) has adopted a code of ethics, as defined in Item 2 of Form N-CSR, that applies to its President and Treasurer and its Chief Financial Officer. A copy of the code of ethics is filed as an exhibit to this Form N-CSR.
Item 3. Audit Committee Financial Expert
The Board of Trustees of the trust has determined that Marie L. Knowles is an audit committee financial expert, as defined in Item 3 of Form N-CSR. Ms. Knowles is independent for purposes of Item 3 of Form N-CSR.
Item 4. Principal Accountant Fees and Services
For the fiscal years ended October 31, 2005 and October 31, 2004, the aggregate Audit Fees billed by PricewaterhouseCoopers LLP (PwC) for professional services rendered for the audits of the financial statements, or services that are normally provided in connection with statutory and regulatory filings or engagements for those fiscal years, for Fidelity Advisor Diversified International Fund, Fidelity Advisor Emerging Asia Fund, Fidelity Advisor Global Equity Fund, Fidelity Advisor Japan Fund, Fidelity Advisor Korea Fund, Fidelity Advisor Latin America Fund, Fidelity Advisor Overseas Fund and Fidelity Advisor Value Leaders Fund (the funds) and for all funds in the Fidelity Group of Funds are shown in the table below.
| Fund | | 2005A | | 2004A |
| Fidelity Advisor Diversified International Fund | | $55,000 | | $41,000 |
| Fidelity Advisor Emerging Asia Fund | | $73,000 | | $67,000 |
| Fidelity Advisor Global Equity Fund | | $34,000 | | $33,000 |
| Fidelity Advisor Japan Fund | | $34,000 | | $33,000 |
| Fidelity Advisor Korea Fund | | $76,000 | | $70,000 |
| Fidelity Advisor Latin America Fund | | $34,000 | | $33,000 |
| Fidelity Advisor Overseas Fund | | $59,000 | | $58,000 |
| Fidelity Advisor Value Leaders Fund | | $31,000 | | $27,000 |
| All funds in the Fidelity Group of Funds audited by | | | | |
| PwC | | $11,900,000 | | $10,600,000 |
| |
| A Aggregate amounts may reflect rounding. | | | | |
For the fiscal years ended October 31, 2005 and October 31, 2004, the aggregate Audit Fees billed by Deloitte & Touche LLP, the member firms of Deloitte Touche Tohmatsu, and their respective affiliates (collectively, “Deloitte Entities”) for professional services rendered for the audits of the financial statements, or services that are normally provided in connection with statutory and regulatory filings or engagements for those fiscal years, for Fidelity Advisor Emerging Markets Fund, Fidelity Advisor Europe Capital Appreciation Fund and Fidelity Advisor International Capital Appreciation Fund (the funds) and for all funds in the Fidelity Group of Funds are shown in the table below.
| Fund | | 2005A | | 2004A,B |
| Fidelity Advisor Emerging Markets Fund | | $36,000 | | $30,000 |
| Fidelity Advisor Europe Capital Appreciation Fund | | $36,000 | | $36,000 |
| Fidelity Advisor International Capital Appreciation | | $38,000 | | $38,000 |
| Fund | | | | |
| All funds in the Fidelity Group of Funds audited by | | | | |
| Deloitte Entities | | $5,400,000 | | $4,300,000 |
| A | Aggregate amounts may reflect rounding. |
| |
| B | Fidelity Advisor Emerging Markets Fund commenced operations on March 29, 2004. |
| |
In each of the fiscal years ended October 31, 2005 and October 31, 2004, the aggregate Audit-Related Fees billed by PwC for services rendered for assurance and related services to each fund that are reasonably related to the performance of the audit or review of the fund’s financial statements, but not reported as Audit Fees, are shown in the table below.
| Fund | | 2005A | | | | 2004 A | | |
| Fidelity Advisor Diversified International Fund | | | | $0 | | | | $0 |
| Fidelity Advisor Emerging Asia Fund | | | | $0 | | | | $0 |
| Fidelity Advisor Global Equity Fund | | | | $0 | | | | $0 |
| Fidelity Advisor Japan Fund | | | | $0 | | | | $0 |
| Fidelity Advisor Korea Fund | | | | $0 | | | | $0 |
| Fidelity Advisor Latin America Fund | | | | $0 | | | | $0 |
| Fidelity Advisor Overseas Fund | | | | $0 | | | | $0 |
| Fidelity Advisor Value Leaders Fund | | | | $0 | | | | $0 |
| |
| A | | Aggregate amounts may reflect rounding. | | | | | | | | |
In each of the fiscal years ended October 31, 2005 and October 31, 2004, the aggregate Audit-Related Fees billed by Deloitte Entities for services rendered for assurance and related services to each fund that are reasonably related to the performance of the audit or review of the fund’s financial statements, but not reported as Audit Fees, are shown in the table below.
| Fund | | 2005A | | 2004 A,B |
| Fidelity Advisor Emerging Markets Fund | | $0 | | $0 |
| Fidelity Advisor Europe Capital Appreciation Fund | | $0 | | $0 |
| Fidelity Advisor International Capital Appreciation Fund | | $0 | | $0 |
| A | Aggregate amounts may reflect rounding. |
| |
| B | Fidelity Advisor Emerging Markets Fund commenced operations on March 29, 2004. |
| |
In each of the fiscal years ended October 31, 2005 and October 31, 2004, the aggregate Audit-Related Fees that were billed by PwC and Deloitte Entities that were required to be
approved by the Audit Committee for services rendered on behalf of Fidelity Management & Research Company (FMR) and entities controlling, controlled by, or under common control with FMR (not including any sub-adviser whose role is primarily portfolio management and is subcontracted with or overseen by another investment adviser) that provide ongoing services to the funds (“Fund Service Providers”) for assurance and related services that relate directly to the operations and financial reporting of each fund that are reasonably related to the performance of the audit or review of the fund’s financial statements, but not reported as Audit Fees, are shown in the table below.
| Billed By | | 2005 A | | | | 2004A,B | | |
| PwC | | | | $0 | | | | $0 |
| Deloitte Entities | | | | $0 | | | | $0 |
| A | Aggregate amounts may reflect rounding. |
| |
| B | May include amounts billed prior to Fidelity Advisor Emerging Markets Fund’s commencement of operations. |
| |
Fees included in the audit-related category comprise assurance and related services (e.g., due diligence services) that are traditionally performed by the independent registered public accounting firm. These audit-related services include due diligence related to mergers and acquisitions, accounting consultations and audits in connection with acquisitions, internal control reviews, attest services that are not required by statute or regulation and consultation concerning financial accounting and reporting standards.
In each of the fiscal years ended October 31, 2005 and October 31, 2004, the aggregate Tax Fees billed by PwC for professional services rendered for tax compliance, tax advice, and tax planning for each fund is shown in the table below.
| Fund | | 2005A | | 2004A |
| Fidelity Advisor Diversified International Fund | | $62,500 | | $21,800 |
| Fidelity Advisor Emerging Asia Fund | | $25,800 | | $28,000 |
| Fidelity Advisor Global Equity Fund | | $2,400 | | $2,200 |
| Fidelity Advisor Japan Fund | | $2,400 | | $2,200 |
| Fidelity Advisor Korea Fund | | $4,200 | | $4,000 |
| Fidelity Advisor Latin America Fund | | $2,400 | | $2,200 |
| Fidelity Advisor Overseas Fund | | $4,200 | | $4,000 |
| Fidelity Advisor Value Leaders Fund | | $2,500 | | $2,300 |
| |
| A | | Aggregate amounts may reflect rounding. | | | | |
In each of the fiscal years ended October 31, 2005 and October 31, 2004, the aggregate Tax Fees billed by Deloitte Entities for professional services rendered for tax compliance, tax advice, and tax planning for each fund is shown in the table below.
| Fund | | 2005A | | 2004A,B |
| Fidelity Advisor Emerging Markets Fund | | $3,600 | | $2,800 |
| Fidelity Advisor Europe Capital Appreciation Fund | | $2,900 | | $2,900 |
| Fidelity Advisor International Capital Appreciation Fund | | $2,900 | | $2,900 |
| A | Aggregate amounts may reflect rounding. |
| |
| B | Fidelity Advisor Emerging Markets Fund commenced operations on March 29, 2004. |
| |
In each of the fiscal years ended October 31, 2005 and October 31, 2004, the aggregate Tax Fees billed by PwC and Deloitte Entities that were required to be approved by the Audit Committee for professional services rendered on behalf of the Fund Service Providers for tax compliance, tax advice, and tax planning that relate directly to the operations and financial reporting of each fund is shown in the table below.
| Billed By | | 2005A | | | | 2004A,B |
| PwC | | | | $0 | | $0 |
| Deloitte Entities | | | | $0 | | $0 |
| A | Aggregate amounts may reflect rounding. |
| |
| B | May include amounts billed prior to Fidelity Advisor Emerging Markets Fund’s commencement of operations. |
| |
Fees included in the Tax Fees category comprise all services performed by professional staff in the independent registered public accounting firm’s tax division except those services related to the audit. Typically, this category would include fees for tax compliance, tax planning, and tax advice. Tax compliance, tax advice, and tax planning services include preparation of original and amended tax returns, claims for refund and tax payment-planning services, assistance with tax audits and appeals, tax advice related to mergers and acquisitions and requests for rulings or technical advice from taxing authorities.
(d) All Other Fees.
In each of the fiscal years ended October 31, 2005 and October 31, 2004, the aggregate Other Fees billed by PwC for all other non-audit services rendered to the funds is shown in the table below.
| Fund | | | | 2005A | | 2004A |
| Fidelity Advisor Diversified International Fund | | $7,000 | | $3,800 |
| Fidelity Advisor Emerging Asia Fund | | $1,400 | | $1,300 |
| Fidelity Advisor Global Equity Fund | | $1,400 | | $1,300 |
| Fidelity Advisor Japan Fund | | $1,400 | | $1,300 |
| Fidelity Advisor Korea Fund | | $1,400 | | $1,300 |
| Fidelity Advisor Latin America Fund | | $1,400 | | $1,300 |
| Fidelity Advisor Overseas Fund | | $2,500 | | $2,500 |
| Fidelity Advisor Value Leaders Fund | | $1,400 | | $1,200 |
| |
| |
| A Aggregate amounts may reflect rounding. | | | | |
In each of the fiscal years ended October 31, 2005 and October 31, 2004, the aggregate Other Fees billed by Deloitte Entities for all other non-audit services rendered to the funds is shown in the table below.
| Fund | | 2005A | | 2004A,B |
| Fidelity Advisor Emerging Markets Fund | | $0 | | $0 |
| Fidelity Advisor Europe Capital Appreciation Fund | | $0 | | $0 |
| Fidelity Advisor International Capital Appreciation Fund | | $0 | | $0 |
| A | Aggregate amounts may reflect rounding. |
| |
| B | Fidelity Advisor Emerging Markets Fund commenced operations on March 29, 2004. |
| |
In each of the fiscal years ended October 31, 2005 and October 31, 2004, the aggregate Other Fees billed by PwC and Deloitte Entities that were required to be approved by the Audit Committee for all other non-audit services rendered on behalf of the Fund Service Providers that relate directly to the operations and financial reporting of each fund is shown in the table below.
| Billed By | | 2005A | | 2004A,B |
| PwC | | $420,000 | | $300,000 |
| Deloitte Entities | | $210,000 | | $720,000 |
| A | Aggregate amounts may reflect rounding. |
| |
| B | May include amounts billed prior to Fidelity Advisor Emerging Markets Fund’s commencement of operations. |
| |
Fees included in the All Other Fees category include services related to internal control reviews, strategy and other consulting, financial information systems design and implementation, consulting on other information systems, and other tax services unrelated to the fund.
(e) (1) Audit Committee Pre-Approval Policies and Procedures:
The trust’s Audit Committee must pre-approve all audit and non-audit services provided by the independent registered public accounting firm relating to the operations or financial reporting of the funds. Prior to the commencement of any audit or non-audit services to a fund, the Audit Committee reviews the services to determine whether they are appropriate and permissible under applicable law.
The trust’s Audit Committee has adopted policies and procedures to, among other purposes, provide a framework for the Committee’s consideration of non–audit services by the audit firms that audit the Fidelity funds. The policies and procedures require that any non–audit service provided by a fund audit firm to a Fidelity Fund and any non–audit service provided by a fund auditor to a Fund Service Provider that relates directly to the operations and financial reporting of a Fidelity fund (Covered Service) are subject to approval by the Audit Committee before such service is provided. Non–audit services provided by a fund audit firm for a Fund Service Provider that do not relate directly to the operations and financial reporting of a Fidelity fund (Non–Covered Service) but that are expected to exceed $50,000 are also subject to pre–approval by the Audit Committee. All Covered Services, as well as Non–Covered Services that are expected to exceed $50,000, must be approved in advance of provision of the service either: (i) by formal resolution of the Audit Committee, or (ii) by oral or written approval of the service by the Chair of the Audit Committee (or if the Chair is unavailable, such other member of the Audit Committee as may be designated by the Chair to act in the Chair’s absence). The approval contemplated by (ii) above is permitted where the Treasurer determines that action on such an engagement is necessary before the next meeting of the Audit Committee. Neither pre–approval nor advance notice of Non–Covered Service engagements for which fees are not expected to exceed $50,000 is required; such engagements are to be reported to the Audit Committee monthly.
| (e) (2) | | Services approved pursuant to paragraph (c)(7)(i)(C) of Rule 2-01 of |
| | | Regulation S-X: |
There were no amounts that were approved by the Audit Committee pursuant to the de minimis exception for the fiscal years ended October 31, 2005 and October 31, 2004 on behalf of each fund.
There were no amounts that were required to be approved by the Audit Committee pursuant to the de minimis exception for the fiscal years ended October 31, 2005 and October 31, 2004 on behalf of the Fund Service Providers that relate directly to the operations and financial reporting of each fund.
| (f) | Not applicable. |
| |
| (g) | For the fiscal years ended October 31, 2005 and October 31, 2004, the aggregate |
| |
fees billed by PwC of $4,150,000A and $2,300,000A for non-audit services rendered on behalf of the funds, FMR (not including any sub-adviser whose role is primarily portfolio management and is subcontracted with or overseen by another investment adviser) and Fund Service Providers relating to Covered Services and Non-Covered Services are shown in the table below.
| | | | | 2005A | | 2004A |
| Covered Services | | $550,000 | | $350,000 |
| Non-Covered Services | | $3,600,000 | | $1,950,000 |
| |
| A | | Aggregate amounts may reflect rounding. | | |
For the fiscal years ended October 31, 2005 and October 31, 2004, the aggregate fees billed by Deloitte Entities of $650,000A and $1,600,000A,B for non-audit services rendered on behalf of the fund, FMR (not including any sub-adviser whose role is primarily portfolio management and is subcontracted with or overseen by another investment adviser) and Fund Service Providers relating to Covered Services and Non-Covered Services are shown in the table below.
| | | 2005A | | 2004A,B |
| Covered Services | | $250,000 | | $700,000 |
| Non-Covered Services | | $400,000 | | $900,000 |
| A | Aggregate amounts may reflect rounding. |
| |
| B | May include amounts billed prior to Fidelity Advisor Emerging Markets Fund’s commencement of operations. |
| |
(h) The trust’s Audit Committee has considered Non-Covered Services that were not pre-approved that were provided by PwC and Deloitte Entities to Fund Service Providers to be compatible with maintaining the independence of PwC and Deloitte Entities in their audit of the funds, taking into account representations from PwC and Deloitte Entities, in accordance with Independence Standards Board Standard No.1, regarding their independence from the funds and their related entities.
Item 5. Audit Committee of Listed Registrants
| Item 7. | | Disclosure of Proxy Voting Policies and Procedures for Closed-End |
| | | Management Investment Companies |
Item 8. Portfolio Managers of Closed-End Management Investment Companies
| Item 9. | | Purchase of Equity Securities by Closed-End Management Investment |
| | | Company and Affiliated Purchasers |
Item 10. Submission of Matters to a Vote of Security Holders
There were no material changes to the procedures by which shareholders may recommend nominees to the trust’s Board of Trustees.
(a)(i) The President and Treasurer and the Chief Financial Officer have concluded that the trust’s disclosure controls and procedures (as defined in Rule 30a-3(c) under the Investment Company Act) provide reasonable assurances that material information relating to the trust is made known to them by the appropriate persons, based on their evaluation of these controls and procedures as of a date within 90 days of the filing date of this report.
(a)(ii) There was no change in the trust’s internal control over financial reporting (as defined in Rule 30a-3(d) under the Investment Company Act) that occurred during the second fiscal quarter of the period covered by this report that has materially affected, or is reasonably likely to materially affect, the trust’s internal control over financial reporting.
| Item 12. | | | | Exhibits |
| |
| (a) | | (1) | | Code of Ethics pursuant to Item 2 of Form N-CSR is filed and attached |
| | | | | hereto as EX-99.CODE ETH. |
| (a) | | (2) | | Certification pursuant to Rule 30a-2(a) under the Investment Company Act |
| | | | | of 1940 (17 CFR 270.30a-2(a)) is filed and attached hereto as Exhibit |
| | | | | 99.CERT. |
| (a) | | (3) | | Not applicable. |
| |
| (b) | | | | Certification pursuant to Rule 30a-2(b) under the Investment Company Act |
| | | | | of 1940 (17 CFR 270.30a-2(b)) is furnished and attached hereto as Exhibit |
| | | | | 99.906CERT. |
Pursuant to the requirements of the Securities Exchange Act of 1934 and the Investment Company Act of 1940, the registrant has duly caused this report to be signed on its behalf by the undersigned, thereunto duly authorized.
Fidelity Advisor Series VIII
|
| By: | | /s/Christine Reynolds |
| | | Christine Reynolds |
| | | President and Treasurer |
| |
| Date: | | December 22, 2005 |
Pursuant to the requirements of the Securities Exchange Act of 1934 and the Investment Company Act of 1940, this report has been signed below by the following persons on behalf of the registrant and in the capacities and on the dates indicated.
| By: | | /s/Christine Reynolds |
| | | Christine Reynolds |
| | | President and Treasurer |
| |
| Date: | | December 22, 2005 |
| |
| |
| By: | | /s/Paul M. Murphy |
| | | Paul M. Murphy |
| | | Chief Financial Officer |
| |
| Date: | | December 22, 2005 |