UNITED STATES
SECURITIES AND EXCHANGE COMMISSION
Washington, D.C. 20549
FORM N-CSR
CERTIFIED SHAREHOLDER REPORT OF REGISTERED
MANAGEMENT INVESTMENT COMPANIES
Investment Company Act file number 811-3855
Fidelity Advisor Series VIII
(Exact name of registrant as specified in charter)
82 Devonshire St., Boston, Massachusetts 02109
(Address of principal executive offices) (Zip code)
Scott C. Goebel, Secretary
82 Devonshire St.
Boston, Massachusetts 02109
(Name and address of agent for service)
Registrant's telephone number, including area code: 617-563-7000
Date of fiscal year end: | October 31 |
| |
Date of reporting period: | October 31, 2010 |
Item 1. Reports to Stockholders
(Fidelity Investment logo)(registered trademark)
Fidelity AdvisorSM
Diversified International
Fund - Class A, Class T, Class B
and Class C
Annual Report
October 31, 2010
(2_fidelity_logos) (Registered_Trademark)
Contents
Chairman's Message | <Click Here> | The Chairman's message to shareholders. |
Performance | <Click Here> | How the fund has done over time. |
Management's Discussion of Fund Performance | <Click Here> | The Portfolio Manager's review of fund performance and strategy. |
Shareholder Expense Example | <Click Here> | An example of shareholder expenses. |
Investment Changes | <Click Here> | A summary of major shifts in the fund's investments over the past six months. |
Investments | <Click Here> | A complete list of the fund's investments with their market values. |
Financial Statements | <Click Here> | Statements of assets and liabilities, operations, and changes in net assets,
as well as financial highlights. |
Notes | <Click Here> | Notes to the financial statements. |
Report of Independent Registered Public Accounting Firm | <Click Here> | |
Trustees and Officers | <Click Here> | |
Distributions | <Click Here> | |
Board Approval of Investment Advisory Contracts and Management Fees | <Click Here> | |
To view a fund's proxy voting guidelines and proxy voting record for the 12-month period ended June 30, visit http://www.fidelity.com/proxyvotingresults or visit the Securities and Exchange Commission's (SEC) web site at http://www.sec.gov. You may also call 1-877-208-0098 to request a free copy of the proxy voting guidelines.
Standard & Poor's, S&P and S&P 500 are registered service marks of The McGraw-Hill Companies, Inc. and have been licensed for use by Fidelity Distributors Corporation.
Other third party marks appearing herein are the property of their respective owners.
All other marks appearing herein are registered or unregistered trademarks or service marks of FMR LLC or an affiliated company.
Annual Report
This report and the financial statements contained herein are submitted for the general information of the shareholders of the fund. This report is not authorized for distribution to prospective investors in the fund unless preceded or accompanied by an effective prospectus.
A fund files its complete schedule of portfolio holdings with the SEC for the first and third quarters of each fiscal year on Form N-Q. Forms N-Q are available on the SEC's web site at http://www.sec.gov. A fund's Forms N-Q may be reviewed and copied at the SEC's Public Reference Room in Washington, DC. Information regarding the operation of the SEC's Public Reference Room may be obtained by calling 1-800-SEC-0330. For a complete list of a fund's portfolio holdings, view the most recent holdings listing, semiannual report, or annual report on Fidelity's web site at http://www.fidelity.com, or http://www.advisor.fidelity.com, as applicable.
NOT FDIC INSURED • MAY LOSE VALUE • NO BANK GUARANTEE
Neither the fund nor Fidelity Distributors Corporation is a bank.
Annual Report
(photo_of_Edward_C_Johnson_3d)
Dear Shareholder:
Equities have staged a rally in the second half of 2010, shaking off concerns about the European debt crisis and the possibility of a double-dip recession in the U.S. Although the short-term surge pushed major equity indexes back into positive territory for the year, several questions remain about the longer-term outlook, including lackluster economic growth and persistently high unemployment. Financial markets are always unpredictable, of course, but there also are several time-tested investment principles that can help put the odds in your favor.
One of the basic tenets is to invest for the long term. Over time, riding out the markets' inevitable ups and downs has proven much more effective than selling into panic or chasing the hottest trend. Even missing only a few of the markets' best days can significantly diminish investor returns. Patience also affords the benefits of compounding - of earning interest on additional income or reinvested dividends and capital gains. There can be tax advantages and cost benefits to consider as well. While staying the course doesn't eliminate risk, it can considerably lessen the effect of short-term declines.
You can further manage your investing risk through diversification. And today, more than ever, geographic diversification should be taken into account. Studies indicate that asset allocation is the single most important determinant of a portfolio's long-term success. The right mix of stocks, bonds and cash - aligned to your particular risk tolerance and investment objective - is very important. Age-appropriate rebalancing is also an essential aspect of asset allocation. For younger investors, an emphasis on equities - which historically have been the best-performing asset class over time - is encouraged. As investors near their specific goal, such as retirement or sending a child to college, consideration may be given to replacing volatile assets (e.g. common stocks) with more-stable fixed investments (bonds or savings plans).
A third principle - investing regularly - can help lower the average cost of your purchases. Investing a certain amount of money each month or quarter helps ensure you won't pay for all your shares at market highs. This strategy - known as dollar cost averaging - also reduces "emotion" from investing, helping shareholders avoid selling weak performers just prior to an upswing, or chasing a hot performer just before a correction.
We invite you to contact us via the Internet, through our Investor Centers or by phone. It is our privilege to provide you the information you need to make the investments that are right for you.
Sincerely,
(The chairman's signature appears here.)
Edward C. Johnson 3d
Annual Report
Average annual total return reflects the change in the value of an investment, assuming reinvestment of the class' distributions from dividend income and capital gains (the profits earned upon the sale of securities that have grown in value, if any) and assuming a constant rate of performance each year. The $10,000 table and the fund's returns do not reflect the deduction of taxes that a shareholder would pay on fund distributions or the redemption of fund shares. During periods of reimbursement by Fidelity, a fund's total return will be greater than it would be had the reimbursement not occurred. How a fund did yesterday is no guarantee of how it will do tomorrow. Returns may reflect the conversion of Class B shares to Class A shares after a maximum of seven years.
Average Annual Total Returns
Periods ended October 31, 2010 | Past 1
year | Past 5
years | Past 10
years |
Class A (incl. 5.75% sales charge) | 4.78% | -0.03% | 3.80% |
Class T (incl. 3.50% sales charge) | 7.00% | 0.21% | 3.77% |
Class B (incl. contingent deferred sales charge) A | 5.34% | 0.05% | 3.78% |
Class C (incl. contingent deferred sales charge) B | 9.32% | 0.40% | 3.61% |
A Class B shares' contingent deferred sales charges included in the past one year, past five years, and past ten years total return figures are 5%, 2%, and 0%, respectively.
B Class C shares' contingent deferred sales charges included in the past one year, past five years, and past ten years total return figures are 1%, 0%, and 0%, respectively.
Annual Report
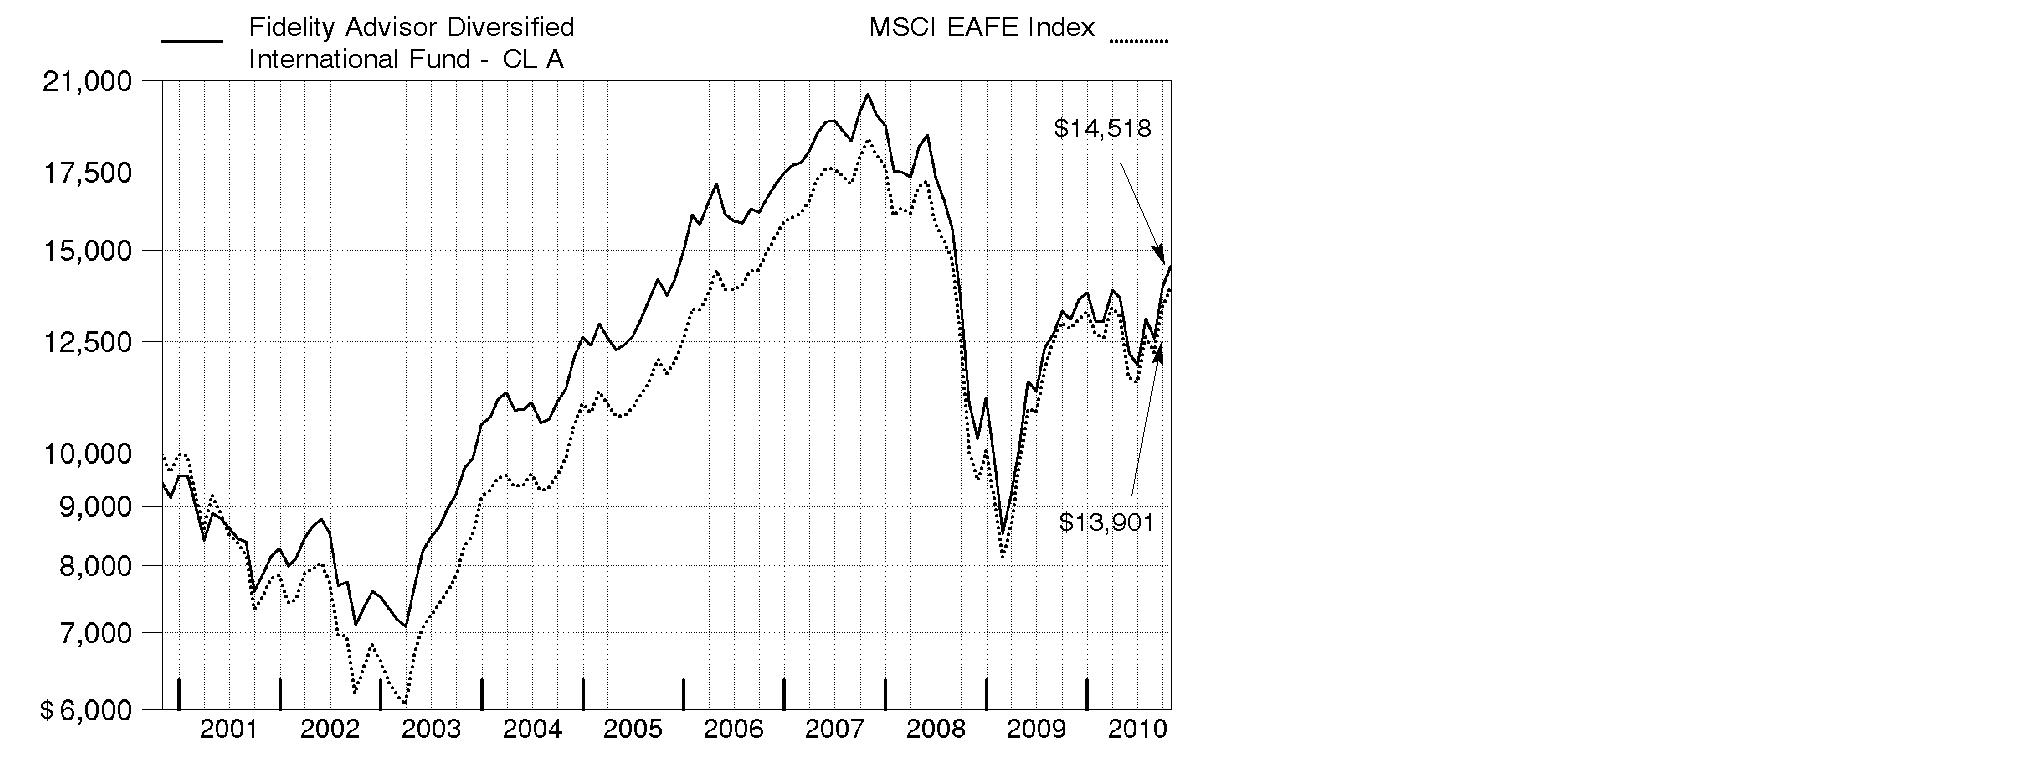
$10,000 Over Past 10 Years
Let's say hypothetically that $10,000 was invested in Fidelity AdvisorSM Diversified International Fund - Class A on October 31, 2000, and the current 5.75% sales charge was paid. The chart shows how the value of your investment would have changed, and also shows how the MSCI® EAFE® (Europe, Australasia, Far East) Index performed over the same period.
Annual Report
Market Recap: International stocks rode a wave of volatility similar to that of their U.S. counterparts during the 12 months ending October 31, 2010. Stocks gained modestly in the first half of the period, despite growing concerns about the European debt crisis. Sentiment turned decidedly negative in May and June, however, and the market suffered a precipitous decline. These losses were more than offset during the last four months of the period, when signs of economic growth and subsiding debt fears helped propel international stocks about 21%. For the full year, the MSCI® ACWI® (All Country World Index) ex USA Index gained 12.76%, boosted in part by a generally depreciating U.S. dollar. Within the index, Canada and emerging markets were standouts, returning 23% and 24%, respectively. Results in the latter group were led by strong-performing India, Mexico and South Africa, while China fell short of the MSCI benchmark due to cooling economic growth. The developed Asia ex Japan segment rose 16% for the period, lifted by solid results from Singapore and Hong Kong. Meanwhile, Europe rose just 9%, held back mainly by debt-riddled Spain and Italy, as well as lagging major constituent France. Japan returned only 5%, a result of that nation's continued weak economy.
Comments from William Bower, Portfolio Manager of Fidelity AdvisorSM Diversified International Fund: For the year, the fund's Class A, Class T, Class B and Class C shares gained 11.17%, 10.88%, 10.34% and 10.32%, respectively (excluding sales charges), outperforming the 8.49% return of the MSCI EAFE® (Europe, Australasia, Far East) Index. The fund was helped most by strong security selection in the consumer discretionary, materials, health care, technology and financials groups. In terms of countries, my picks in Germany were particularly productive, while underweighting Japan and overweighting China also aided results. Individual investments that contributed included Danish pharmaceutical company Novo Nordisk, German automakers Volkswagen - not held at period end - and BMW, two out-of-benchmark positions - Chinese Internet search provider Baidu and Taiwanese smart phone manufacturer HTC - German medical equipment company Fresenius and French holding company PPR. Conversely, underweighting industrials hurt, as did overweighting energy. Geographically, unfavorable stock selection in the United Kingdom and China curtailed results. At the issuer level, detractors included energy companies Transocean - not part of the benchmark - and BP, Spanish telecommunications company Telefonica, an out-of-benchmark investment in Canadian energy firm Petrobank Energy & Resources and French insurance company AXA.
The views expressed above reflect those of the portfolio manager(s) only through the end of the period as stated on the cover of this report and do not necessarily represent the views of Fidelity or any other person in the Fidelity organization. Any such views are subject to change at any time based upon market or other conditions and Fidelity disclaims any responsibility to update such views. These views may not be relied on as investment advice and, because investment decisions for a Fidelity fund are based on numerous factors, may not be relied on as an indication of trading intent on behalf of any Fidelity fund.
Annual Report
Shareholder Expense Example
As a shareholder of the Fund, you incur two types of costs: (1) transaction costs, including sales charges (loads) on purchase payments or redemption proceeds, redemption fees, and (2) ongoing costs, including management fees, distribution and/or service (12b-1) fees and other Fund expenses. This Example is intended to help you understand your ongoing costs (in dollars) of investing in the Fund and to compare these costs with the ongoing costs of investing in other mutual funds.
The Example is based on an investment of $1,000 invested at the beginning of the period and held for the entire period (May 1, 2010 to October 31, 2010).
Actual Expenses
The first line of the accompanying table for each class of the Fund provides information about actual account values and actual expenses. You may use the information in this line, together with the amount you invested, to estimate the expenses that you paid over the period. Simply divide your account value by $1,000.00 (for example, an $8,600 account value divided by $1,000.00 = 8.6), then multiply the result by the number in the first line for a class of the Fund under the heading entitled "Expenses Paid During Period" to estimate the expenses you paid on your account during this period. In addition, the Fund, as a shareholder in the underlying Fidelity Central Funds, will indirectly bear its pro-rata share of the fees and expenses incurred by the underlying Fidelity Central Funds. These fees and expenses are not included in the Fund's annualized expense ratio used to calculate the expense estimate in the table below.
Hypothetical Example for Comparison Purposes
The second line of the accompanying table for each class of the Fund provides information about hypothetical account values and hypothetical expenses based on a Class' actual expense ratio and an assumed rate of return of 5% per year before expenses, which is not the Class' actual return. The hypothetical account values and expenses may not be used to estimate the actual ending account balance or expenses you paid for the period. You may use this information to compare the ongoing costs of investing in the Fund and other funds. To do so, compare this 5% hypothetical example with the 5% hypothetical examples that appear in the shareholder reports of the other funds. In addition, the Fund, as a shareholder in the underlying Fidelity Central Funds, will indirectly bear its pro-rata share of the fees and expenses incurred by the underlying Fidelity Central Funds. These fees and expenses are not included in the Fund's annualized expense ratio used to calculate the expense estimate in the table below.
Please note that the expenses shown in the table are meant to highlight your ongoing costs only and do not reflect any transaction costs. Therefore, the second line of the table is useful in comparing ongoing costs only, and will not help you determine the relative total costs of owning different funds. In addition, if these transactional costs were included, your costs would have been higher.
Annual Report
| Annualized Expense Ratio | Beginning
Account Value
May 1, 2010 | Ending
Account Value
October 31, 2010 | Expenses Paid
During Period*
May 1, 2010 to
October 31, 2010 |
Class A | 1.33% | | | |
Actual | | $ 1,000.00 | $ 1,064.00 | $ 6.92 |
HypotheticalA | | $ 1,000.00 | $ 1,018.50 | $ 6.77 |
Class T | 1.57% | | | |
Actual | | $ 1,000.00 | $ 1,062.50 | $ 8.16 |
HypotheticalA | | $ 1,000.00 | $ 1,017.29 | $ 7.98 |
Class B | 2.08% | | | |
Actual | | $ 1,000.00 | $ 1,059.70 | $ 10.80 |
HypotheticalA | | $ 1,000.00 | $ 1,014.72 | $ 10.56 |
Class C | 2.07% | | | |
Actual | | $ 1,000.00 | $ 1,059.50 | $ 10.75 |
HypotheticalA | | $ 1,000.00 | $ 1,014.77 | $ 10.51 |
Institutional Class | .99% | | | |
Actual | | $ 1,000.00 | $ 1,065.70 | $ 5.15 |
HypotheticalA | | $ 1,000.00 | $ 1,020.21 | $ 5.04 |
A 5% return per year before expenses
* Expenses are equal to each Class' annualized expense ratio, multiplied by the average account value over the period, multiplied by 184/365 (to reflect the one-half year period).
Annual Report
Investment Changes (Unaudited)
Top Five Stocks as of October 31, 2010 |
| % of fund's
net assets | % of fund's net assets
6 months ago |
Royal Dutch Shell PLC Class B (United Kingdom, Oil, Gas & Consumable Fuels) | 2.9 | 2.1 |
Nestle SA (Switzerland, Food Products) | 2.3 | 1.9 |
BP PLC (United Kingdom, Oil, Gas & Consumable Fuels) | 2.1 | 1.0 |
Vodafone Group PLC sponsored ADR (United Kingdom, Wireless Telecommunication Services) | 1.8 | 1.5 |
BHP Billiton Ltd. sponsored ADR (Australia, Metals & Mining) | 1.7 | 1.4 |
| 10.8 | |
Top Five Market Sectors as of October 31, 2010 |
| % of fund's
net assets | % of fund's net assets
6 months ago |
Financials | 20.9 | 21.0 |
Consumer Discretionary | 15.6 | 11.2 |
Energy | 11.4 | 10.8 |
Materials | 10.2 | 9.3 |
Information Technology | 9.5 | 10.1 |
Top Five Countries as of October 31, 2010 |
(excluding cash equivalents) | % of fund's
net assets | % of fund's net assets
6 months ago |
United Kingdom | 18.0 | 18.2 |
Japan | 11.9 | 14.9 |
United States of America | 7.6 | 7.1 |
Germany | 7.6 | 7.1 |
Switzerland | 7.2 | 7.1 |
Percentages are adjusted for the effect of open futures contracts, if applicable. |
Asset Allocation (% of fund's net assets) |
As of October 31, 2010 | As of April 30, 2010 |
 | Stocks 97.7% | | | Stocks 96.8% | |
 | Short-Term
Investments and
Net Other Assets 2.3% | | | Short-Term
Investments and
Net Other Assets 3.2% | |

Annual Report
Investments October 31, 2010
Showing Percentage of Net Assets
Common Stocks - 96.3% |
| Shares | | Value (000s) |
Australia - 3.1% |
AMP Ltd. | 1,750,898 | | $ 9,160 |
BHP Billiton Ltd. sponsored ADR (d) | 781,400 | | 64,536 |
Newcrest Mining Ltd. | 793,987 | | 31,082 |
QBE Insurance Group Ltd. | 460,000 | | 7,742 |
Westfield Group unit | 550,000 | | 6,670 |
TOTAL AUSTRALIA | | 119,190 |
Bailiwick of Guernsey - 0.6% |
Resolution Ltd. | 5,536,682 | | 23,232 |
Bailiwick of Jersey - 1.7% |
Experian PLC | 1,858,400 | | 21,601 |
Randgold Resources Ltd. sponsored ADR | 100,000 | | 9,392 |
Shire PLC | 253,700 | | 5,953 |
United Business Media Ltd. | 1,000,000 | | 10,542 |
WPP PLC | 1,657,434 | | 19,258 |
TOTAL BAILIWICK OF JERSEY | | 66,746 |
Belgium - 1.3% |
Ageas | 2,957,657 | | 9,091 |
Anheuser-Busch InBev SA NV | 647,963 | | 40,604 |
TOTAL BELGIUM | | 49,695 |
Bermuda - 1.2% |
Assured Guaranty Ltd. | 434,900 | | 8,285 |
Clear Media Ltd. (a) | 16,000,000 | | 9,557 |
Huabao International Holdings Ltd. | 9,597,000 | | 14,461 |
Li & Fung Ltd. | 2,532,000 | | 13,377 |
Sihuan Pharmaceutical Holdings Group Ltd. | 188,000 | | 137 |
TOTAL BERMUDA | | 45,817 |
Brazil - 1.7% |
Banco do Brasil SA | 625,000 | | 12,161 |
Banco Santander (Brasil) SA ADR | 590,000 | | 8,496 |
BM&F Bovespa SA | 1,325,000 | | 11,099 |
Drogasil SA | 275,000 | | 6,956 |
Estacio Participacoes SA | 279,000 | | 4,167 |
Itau Unibanco Banco Multiplo SA ADR | 450,600 | | 11,067 |
Mills Estruturas e Servicos de Engenharia SA (a) | 191,000 | | 2,305 |
Souza Cruz Industria Comerico | 100,000 | | 5,138 |
Weg SA | 136,900 | | 1,768 |
TOTAL BRAZIL | | 63,157 |
Common Stocks - continued |
| Shares | | Value (000s) |
Canada - 4.5% |
Agnico-Eagle Mines Ltd. (Canada) | 150,000 | | $ 11,633 |
Barrick Gold Corp. | 170,000 | | 8,187 |
Canadian Natural Resources Ltd. | 445,000 | | 16,200 |
Fairfax Financial Holdings Ltd. (sub. vtg.) | 18,000 | | 7,363 |
Goldcorp, Inc. | 165,000 | | 7,367 |
InterOil Corp. (a)(d) | 65,000 | | 4,627 |
Ivanhoe Mines Ltd. (a) | 226,400 | | 5,421 |
Loblaw Companies Ltd. | 89,800 | | 3,837 |
Niko Resources Ltd. | 246,600 | | 23,526 |
Open Text Corp. (a) | 162,200 | | 7,176 |
OZ Optics Ltd. unit (a)(f) | 5,400 | | 24 |
Painted Pony Petroleum Ltd. (a)(e) | 170,900 | | 1,176 |
Painted Pony Petroleum Ltd. Class A (a) | 700,000 | | 4,818 |
Petrobank Energy & Resources Ltd. (a) | 670,000 | | 26,665 |
Silver Wheaton Corp. (a) | 245,700 | | 7,063 |
Suncor Energy, Inc. | 340,000 | | 10,894 |
Talisman Energy, Inc. | 920,000 | | 16,679 |
Uranium One, Inc. (a) | 2,355,000 | | 9,629 |
TOTAL CANADA | | 172,285 |
Cayman Islands - 1.1% |
BaWang International (Group) Holding Ltd. | 1,732,000 | | 728 |
Belle International Holdings Ltd. | 1,052,000 | | 1,900 |
Hengan International Group Co. Ltd. | 1,180,000 | | 11,113 |
Hengdeli Holdings Ltd. | 33,848,000 | | 18,777 |
Lijun International Pharmaceutical Holding Ltd. | 7,710,000 | | 2,646 |
Microport Scientific Corp. | 152,000 | | 155 |
Silver Base Group Holdings Ltd. | 2,819,000 | | 2,058 |
Want Want China Holdings Ltd. | 4,036,000 | | 3,723 |
TOTAL CAYMAN ISLANDS | | 41,100 |
China - 1.5% |
Agricultural Bank of China (H Shares) | 18,804,000 | | 9,922 |
Baidu.com, Inc. sponsored ADR (a) | 117,300 | | 12,904 |
China Merchants Bank Co. Ltd. (H Shares) | 8,336,500 | | 23,661 |
Minth Group Ltd. | 422,000 | | 789 |
NetEase.com, Inc. sponsored ADR (a) | 151,100 | | 6,316 |
Tingyi (Cayman Islands) Holding Corp. | 1,800,000 | | 4,900 |
TOTAL CHINA | | 58,492 |
Denmark - 2.6% |
Carlsberg AS Series B | 222,400 | | 24,319 |
Novo Nordisk AS Series B | 503,627 | | 52,872 |
Common Stocks - continued |
| Shares | | Value (000s) |
Denmark - continued |
Pandora A/S | 118,200 | | $ 5,735 |
William Demant Holding AS (a) | 200,000 | | 14,991 |
TOTAL DENMARK | | 97,917 |
Finland - 0.2% |
Nokia Corp. sponsored ADR | 875,000 | | 9,345 |
France - 6.9% |
Accor SA | 50,000 | | 2,050 |
Alstom SA | 77,071 | | 3,889 |
Atos Origin SA (a) | 165,300 | | 7,642 |
AXA SA | 1,039,600 | | 18,921 |
BNP Paribas SA | 415,900 | | 30,411 |
Cap Gemini SA | 223,000 | | 11,374 |
Essilor International SA | 207,928 | | 13,882 |
Euler Hermes SA (a) | 51,500 | | 4,848 |
Iliad Group SA | 90,000 | | 10,131 |
LVMH Moet Hennessy - Louis Vuitton | 213,735 | | 33,487 |
Pernod-Ricard SA | 89,000 | | 7,890 |
PPR SA | 169,000 | | 27,701 |
Sanofi-Aventis sponsored ADR | 566,500 | | 19,890 |
Schneider Electric SA | 83,121 | | 11,797 |
Societe Generale Series A | 459,400 | | 27,503 |
Technip SA | 149,900 | | 12,596 |
Vallourec SA | 179,276 | | 18,602 |
TOTAL FRANCE | | 262,614 |
Germany - 6.2% |
BASF AG | 232,106 | | 16,885 |
Bayerische Motoren Werke AG (BMW) | 556,088 | | 39,857 |
Daimler AG (United States) (a) | 392,300 | | 25,892 |
Deutsche Boerse AG | 183,800 | | 12,931 |
ElringKlinger AG | 81,300 | | 2,709 |
Fresenius Medical Care AG & Co. KGaA | 285,300 | | 18,170 |
Fresenius SE | 251,500 | | 22,190 |
HeidelbergCement AG | 201,200 | | 10,522 |
Linde AG | 164,408 | | 23,666 |
Metro AG | 120,000 | | 8,409 |
Munich Re Group | 66,428 | | 10,385 |
Rheinmetall AG | 57,200 | | 4,120 |
Siemens AG | 360,000 | | 41,116 |
TOTAL GERMANY | | 236,852 |
Common Stocks - continued |
| Shares | | Value (000s) |
Hong Kong - 0.8% |
AIA Group Ltd. | 2,016,600 | | $ 5,997 |
Henderson Land Development Co. Ltd. | 1,379,325 | | 9,796 |
Henderson Land Development Co. Ltd. warrants 6/1/11 (a) | 259,200 | | 100 |
Swire Pacific Ltd. (A Shares) | 537,000 | | 7,621 |
Wharf Holdings Ltd. | 1,204,000 | | 7,906 |
TOTAL HONG KONG | | 31,420 |
India - 1.1% |
GEI Industrial Systems Ltd. | 100,000 | | 464 |
HDFC Bank Ltd. | 218,176 | | 11,246 |
Housing Development Finance Corp. Ltd. | 480,042 | | 7,448 |
Infrastructure Development Finance Co. Ltd. | 1,296,940 | | 5,853 |
Larsen & Toubro Ltd. | 97,989 | | 4,483 |
Shriram Transport Finance Co. Ltd. | 117,337 | | 2,333 |
State Bank of India | 118,494 | | 8,422 |
TOTAL INDIA | | 40,249 |
Ireland - 0.4% |
CRH PLC | 553,600 | | 9,560 |
Ingersoll-Rand Co. Ltd. | 148,000 | | 5,818 |
TOTAL IRELAND | | 15,378 |
Italy - 2.2% |
Fiat SpA | 1,481,200 | | 25,062 |
Intesa Sanpaolo SpA | 4,424,523 | | 15,561 |
Mediaset SpA | 1,372,400 | | 10,121 |
Saipem SpA | 745,000 | | 33,100 |
TOTAL ITALY | | 83,844 |
Japan - 11.9% |
Canon, Inc. | 486,700 | | 22,404 |
Denso Corp. | 574,700 | | 17,872 |
eAccess Ltd. | 4,850 | | 3,538 |
Fanuc Ltd. | 60,000 | | 8,686 |
Fast Retailing Co. Ltd. | 83,100 | | 10,885 |
Hikari Tsushin, Inc. | 197,900 | | 3,738 |
Honda Motor Co. Ltd. sponsored ADR | 530,700 | | 19,121 |
Itochu Corp. | 994,700 | | 8,718 |
Japan Tobacco, Inc. | 6,756 | | 20,989 |
JSR Corp. | 510,000 | | 8,829 |
Kakaku.com, Inc. | 1,000 | | 4,834 |
Keyence Corp. | 55,500 | | 13,759 |
Komatsu Ltd. | 474,800 | | 11,605 |
Common Stocks - continued |
| Shares | | Value (000s) |
Japan - continued |
Mazda Motor Corp. | 3,743,000 | | $ 9,513 |
Miraca Holdings, Inc. | 156,800 | | 5,643 |
Mitsubishi Corp. | 627,500 | | 15,072 |
Mitsubishi UFJ Financial Group, Inc. | 5,202,800 | | 24,146 |
Mitsui & Co. Ltd. | 1,430,500 | | 22,498 |
Nintendo Co. Ltd. | 51,600 | | 13,370 |
Nippon Electric Glass Co. Ltd. | 62,000 | | 797 |
Nitori Holdings Co. Ltd. | 48,900 | | 4,302 |
NSK Ltd. | 1,180,000 | | 8,921 |
NTT DoCoMo, Inc. | 4,700 | | 7,923 |
ORIX Corp. | 437,860 | | 39,939 |
Rakuten, Inc. | 21,226 | | 16,354 |
Ricoh Co. Ltd. | 560,000 | | 7,834 |
ROHM Co. Ltd. | 143,000 | | 8,921 |
SOFTBANK CORP. | 1,203,800 | | 38,660 |
Sony Financial Holdings, Inc. | 1,800 | | 6,263 |
Start Today Co. Ltd. | 2,636 | | 8,199 |
Sumitomo Corp. | 335,100 | | 4,243 |
Sumitomo Mitsui Financial Group, Inc. | 580,100 | | 17,315 |
Tokyo Electron Ltd. | 293,700 | | 16,572 |
Toyota Motor Corp. | 259,700 | | 9,199 |
Yahoo! Japan Corp. | 33,399 | | 11,658 |
TOTAL JAPAN | | 452,320 |
Korea (South) - 1.5% |
Amorepacific Corp. | 11,767 | | 10,883 |
NCsoft Corp. | 47,096 | | 10,366 |
Samsung Electronics Co. Ltd. | 38,425 | | 25,457 |
Shinhan Financial Group Co. Ltd. | 255,670 | | 9,902 |
TOTAL KOREA (SOUTH) | | 56,608 |
Luxembourg - 0.3% |
SES SA FDR (France) unit | 460,133 | | 11,790 |
Mexico - 0.2% |
Wal-Mart de Mexico SA de CV Series V | 2,600,000 | | 7,111 |
Netherlands - 3.3% |
AEGON NV (a) | 1,350,000 | | 8,554 |
AerCap Holdings NV (a) | 325,000 | | 4,196 |
Gemalto NV | 190,000 | | 8,650 |
ING Groep NV sponsored ADR (a) | 2,200,200 | | 23,718 |
Koninklijke Ahold NV | 580,056 | | 8,015 |
Koninklijke KPN NV | 1,083,162 | | 18,086 |
Common Stocks - continued |
| Shares | | Value (000s) |
Netherlands - continued |
Koninklijke Philips Electronics NV unit | 766,000 | | $ 23,325 |
LyondellBasell Industries NV Class A (a) | 292,400 | | 7,854 |
Randstad Holdings NV (a) | 228,171 | | 10,858 |
Wolters Kluwer NV (Certificaten Van Aandelen) | 580,300 | | 13,198 |
TOTAL NETHERLANDS | | 126,454 |
Netherlands Antilles - 0.4% |
Schlumberger Ltd. | 212,800 | | 14,873 |
Norway - 1.1% |
DnB NOR ASA | 1,334,600 | | 18,313 |
Storebrand ASA (A Shares) (a) | 600,000 | | 4,363 |
Telenor ASA | 1,296,000 | | 20,891 |
TOTAL NORWAY | | 43,567 |
Qatar - 0.1% |
Commercial Bank of Qatar GDR (Reg. S) | 1,100,000 | | 5,040 |
Russia - 0.2% |
OJSC MMC Norilsk Nickel sponsored ADR | 215,000 | | 4,010 |
Uralkali JSC GDR (Reg. S) | 80,000 | | 1,980 |
TOTAL RUSSIA | | 5,990 |
South Africa - 1.0% |
AngloGold Ashanti Ltd. sponsored ADR | 235,000 | | 11,071 |
Clicks Group Ltd. | 1,483,615 | | 9,679 |
Impala Platinum Holdings Ltd. | 132,500 | | 3,745 |
Mr Price Group Ltd. | 500,000 | | 4,544 |
Naspers Ltd. Class N | 73,200 | | 3,844 |
Shoprite Holdings Ltd. | 265,100 | | 3,747 |
TOTAL SOUTH AFRICA | | 36,630 |
Spain - 4.1% |
Banco Bilbao Vizcaya Argentaria SA | 741,130 | | 9,762 |
Banco Santander SA sponsored ADR (d) | 4,425,000 | | 56,684 |
Enagas SA | 183,872 | | 4,051 |
Gestevision Telecinco SA | 388,000 | | 4,949 |
Iberdrola SA | 623,076 | | 5,254 |
Inditex SA (d) | 255,501 | | 21,335 |
Prosegur Compania de Seguridad SA (Reg.) | 201,900 | | 12,097 |
Red Electrica Corporacion SA | 145,000 | | 7,283 |
Telefonica SA sponsored ADR (d) | 420,700 | | 34,136 |
TOTAL SPAIN | | 155,551 |
Common Stocks - continued |
| Shares | | Value (000s) |
Sweden - 1.3% |
Elekta AB (B Shares) | 388,800 | | $ 14,710 |
H&M Hennes & Mauritz AB (B Shares) | 628,621 | | 22,147 |
Swedbank AB (A Shares) (a) | 942,900 | | 13,159 |
TOTAL SWEDEN | | 50,016 |
Switzerland - 7.2% |
Clariant AG (Reg.) (a) | 575,000 | | 9,720 |
Kuehne & Nagel International AG | 155,700 | | 19,250 |
Lonza Group AG | 66,205 | | 5,794 |
Nestle SA | 1,590,894 | | 87,112 |
Novartis AG sponsored ADR | 331,300 | | 19,199 |
Roche Holding AG (participation certificate) | 78,174 | | 11,476 |
Sonova Holding AG Class B | 95,606 | | 11,072 |
Syngenta AG (Switzerland) | 67,700 | | 18,740 |
Transocean Ltd. (a) | 290,000 | | 18,374 |
UBS AG (a) | 2,250,000 | | 38,210 |
Zurich Financial Services AG | 140,231 | | 34,319 |
TOTAL SWITZERLAND | | 273,266 |
Taiwan - 1.0% |
HTC Corp. | 1,519,000 | | 34,296 |
Taiwan Fertilizer Co. Ltd. | 1,704,000 | | 5,818 |
TOTAL TAIWAN | | 40,114 |
United Kingdom - 18.0% |
Anglo American PLC (United Kingdom) | 284,300 | | 13,246 |
Associated British Foods PLC | 552,200 | | 9,263 |
Barclays PLC | 3,725,000 | | 16,367 |
BG Group PLC | 1,189,544 | | 23,165 |
BHP Billiton PLC | 507,732 | | 17,984 |
BP PLC sponsored ADR | 1,950,000 | | 79,619 |
Britvic PLC | 510,100 | | 3,942 |
Burberry Group PLC | 773,100 | | 12,622 |
Carphone Warehouse Group PLC | 1,401,600 | | 6,838 |
GlaxoSmithKline PLC | 1,675,000 | | 32,705 |
HSBC Holdings PLC sponsored ADR | 1,090,900 | | 56,847 |
Inchcape PLC (a) | 2,155,000 | | 12,039 |
Intertek Group PLC | 527,100 | | 15,665 |
ITV PLC (a) | 9,345,700 | | 10,219 |
Johnson Matthey PLC | 199,600 | | 6,121 |
Lloyds Banking Group PLC (a) | 24,162,500 | | 26,554 |
Misys PLC (a) | 1,828,000 | | 8,241 |
Next PLC | 107,300 | | 3,928 |
Common Stocks - continued |
| Shares | | Value (000s) |
United Kingdom - continued |
Ocado Group PLC (a)(d) | 761,000 | | $ 1,703 |
Pearson PLC | 1,160,500 | | 17,772 |
QinetiQ Group PLC | 3,300,000 | | 5,678 |
Reckitt Benckiser Group PLC | 499,600 | | 27,943 |
Rio Tinto PLC | 384,600 | | 24,977 |
Royal Dutch Shell PLC Class B | 3,489,966 | | 111,673 |
Sage Group PLC | 2,741,500 | | 11,833 |
Serco Group PLC | 1,877,354 | | 18,468 |
Standard Chartered PLC (United Kingdom) | 415,857 | | 12,029 |
TalkTalk Telecom Group PLC (a) | 2,100,000 | | 4,438 |
Tesco PLC | 3,149,866 | | 21,541 |
Vedanta Resources PLC | 180,830 | | 6,012 |
Vodafone Group PLC sponsored ADR | 2,468,600 | | 67,911 |
TOTAL UNITED KINGDOM | | 687,343 |
United States of America - 7.6% |
Alliance Data Systems Corp. (a) | 107,000 | | 6,497 |
Anadarko Petroleum Corp. | 296,700 | | 18,268 |
Apple, Inc. (a) | 77,200 | | 23,227 |
AsiaInfo Holdings, Inc. (a)(d) | 531,300 | | 11,805 |
C. R. Bard, Inc. | 120,000 | | 9,974 |
CF Industries Holdings, Inc. | 99,100 | | 12,143 |
Chevron Corp. | 120,000 | | 9,913 |
Citigroup, Inc. (a) | 1,950,000 | | 8,132 |
eBay, Inc. (a) | 335,000 | | 9,986 |
Google, Inc. Class A (a) | 44,600 | | 27,339 |
Hewlett-Packard Co. | 130,000 | | 5,468 |
Illumina, Inc. (a) | 129,800 | | 7,049 |
Jacobs Engineering Group, Inc. (a) | 104,200 | | 4,023 |
JPMorgan Chase & Co. | 187,600 | | 7,059 |
Kulicke & Soffa Industries, Inc. (a) | 700,000 | | 4,354 |
Lear Corp. (a) | 23,400 | | 2,069 |
Medco Health Solutions, Inc. (a) | 249,100 | | 13,085 |
Morgan Stanley | 293,000 | | 7,287 |
Newmont Mining Corp. | 125,000 | | 7,609 |
Philip Morris International, Inc. | 244,600 | | 14,309 |
Regions Financial Corp. | 925,900 | | 5,833 |
SanDisk Corp. (a) | 240,800 | | 9,049 |
Schweitzer-Mauduit International, Inc. | 150,000 | | 9,627 |
The Walt Disney Co. | 164,500 | | 5,940 |
Virgin Media, Inc. | 840,000 | | 21,361 |
Common Stocks - continued |
| Shares | | Value (000s) |
United States of America - continued |
Visa, Inc. Class A | 155,000 | | $ 12,116 |
Wells Fargo & Co. | 665,000 | | 17,343 |
TOTAL UNITED STATES OF AMERICA | | 290,865 |
TOTAL COMMON STOCKS (Cost $3,136,793) | 3,674,871 |
Nonconvertible Preferred Stocks - 1.4% |
| | | |
Germany - 1.4% |
ProSiebenSat.1 Media AG | 609,700 | | 16,110 |
Volkswagen AG | 242,500 | | 36,442 |
TOTAL NONCONVERTIBLE PREFERRED STOCKS (Cost $32,378) | 52,552 |
Money Market Funds - 4.7% |
| | | |
Fidelity Cash Central Fund, 0.23% (b) | 86,229,271 | | 86,229 |
Fidelity Securities Lending Cash Central Fund, 0.24% (b)(c) | 94,620,655 | | 94,621 |
TOTAL MONEY MARKET FUNDS (Cost $180,850) | 180,850 |
TOTAL INVESTMENT PORTFOLIO - 102.4% (Cost $3,350,021) | | 3,908,273 |
NET OTHER ASSETS (LIABILITIES) - (2.4)% | | (93,312) |
NET ASSETS - 100% | $ 3,814,961 |
Legend |
(a) Non-income producing |
(b) Affiliated fund that is available only to investment companies and other accounts managed by Fidelity Investments. The rate quoted is the annualized seven-day yield of the fund at period end. A complete unaudited listing of the fund's holdings as of its most recent quarter end is available upon request. In addition, each Fidelity Central Fund's financial statements, which are not covered by the Fund's report of Independent Registered Accounting Firm, are available on the SEC's website or upon request. |
(c) Investment made with cash collateral received from securities on loan. |
(d) Security or a portion of the security is on loan at period end. |
(e) Security exempt from registration under Rule 144A of the Securities Act of 1933. These securities may be resold in transactions exempt from registration, normally to qualified institutional buyers. At the end of the period, the value of these securities amounted to $1,176,000 or 0.0% of net assets. |
(f) Restricted securities - Investment in securities not registered under the Securities Act of 1933 (excluding 144A issues). At the end of the period, the value of restricted securities (excluding 144A issues) amounted to $24,000 or 0.0% of net assets. |
Additional information on each holding is as follows: |
Security | Acquisition Date | Acquisition Cost (000s) |
OZ Optics Ltd. unit | 8/18/00 | $ 80 |
Affiliated Central Funds |
Information regarding fiscal year to date income earned by the Fund from investments in Fidelity Central Funds is as follows: |
Fund | Income earned
(Amounts in thousands) |
Fidelity Cash Central Fund | $ 106 |
Fidelity Securities Lending Cash Central Fund | 2,425 |
Total | $ 2,531 |
Other Information |
The following is a summary of the inputs used, as of October 31, 2010, involving the Fund's assets and liabilities carried at fair value. The inputs or methodology used for valuing securities may not be an indication of the risk associated with investing in those securities. For more information on valuation inputs, and their aggregation into the levels used in the tables below, please refer to the Security Valuation section in the accompanying Notes to Financial Statements. |
Valuation Inputs at Reporting Date: |
Description
(Amounts in thousands) | Total | Level 1 | Level 2 | Level 3 |
Investments in Securities: | | | | |
Equities: | | | | |
United Kingdom | $ 687,343 | $ 439,311 | $ 248,032 | $ - |
Japan | 452,320 | 156,810 | 295,510 | - |
United States of America | 290,865 | 290,865 | - | - |
Germany | 289,404 | 230,118 | 59,286 | - |
Switzerland | 273,266 | 216,316 | 56,950 | - |
France | 262,614 | 262,614 | - | - |
Canada | 172,285 | 172,261 | - | 24 |
Spain | 155,551 | 145,789 | 9,762 | - |
Netherlands | 126,454 | 117,900 | 8,554 | - |
Other | 1,017,321 | 918,432 | 98,889 | - |
Money Market Funds | 180,850 | 180,850 | - | - |
Total Investments in Securities: | $ 3,908,273 | $ 3,131,266 | $ 776,983 | $ 24 |
Other Information - continued |
The following is a reconciliation of Investments in Securities for which Level 3 inputs were used in determining value: |
(Amounts in thousands) | |
Investments in Securities: | |
Beginning Balance | $ 25 |
Total Realized Gain (Loss) | - |
Total Unrealized Gain (Loss) | (1) |
Cost of Purchases | - |
Proceeds of Sales | - |
Amortization/Accretion | - |
Transfers in to Level 3 | - |
Transfers out of Level 3 | - |
Ending Balance | $ 24 |
The change in unrealized gain (loss) for the period attributable to Level 3 securities held at October 31, 2010 | $ (1) |
The information used in the above reconciliation represents fiscal year to date activity for any Investments in Securities identified as using Level 3 inputs at either the beginning or the end of the current fiscal period. Transfers in or out of Level 3 represent the beginning value of any Security or Instrument where a change in the pricing level occurred from the beginning to the end of the period. The cost of purchases and the proceeds of sales may include securities received or delivered through corporate actions or exchanges. Realized and unrealized gains (losses) disclosed in the reconciliation are included in Net Gain (Loss) on the Fund's Statement of Operations. |
Income Tax Information |
At October 31, 2010, the Fund had a capital loss carryforward of approximately $3,277,388,000 of which $9,101,000 and $3,268,287,000 will expire on October 31, 2016 and 2017, respectively. Capital loss carryforwards are only available to offset future capital gains of the Fund to the extent provided by regulations and may be limited. |
See accompanying notes which are an integral part of the financial statements.
Annual Report
Statement of Assets and Liabilities
Amounts in thousands (except per-share amounts) | October 31, 2010 |
| | |
Assets | | |
Investment in securities, at value (including securities loaned of $92,302) - See accompanying schedule: Unaffiliated issuers (cost $3,169,171) | $ 3,727,423 | |
Fidelity Central Funds (cost $180,850) | 180,850 | |
Total Investments (cost $3,350,021) | | $ 3,908,273 |
Foreign currency held at value (cost $1,356) | | 1,356 |
Receivable for investments sold | | 15,637 |
Receivable for fund shares sold | | 5,234 |
Dividends receivable | | 7,996 |
Distributions receivable from Fidelity Central Funds | | 34 |
Other receivables | | 426 |
Total assets | | 3,938,956 |
| | |
Liabilities | | |
Payable for investments purchased | $ 13,747 | |
Payable for fund shares redeemed | 8,530 | |
Accrued management fee | 2,267 | |
Distribution and service plan fees payable | 1,015 | |
Other affiliated payables | 950 | |
Other payables and accrued expenses | 2,865 | |
Collateral on securities loaned, at value | 94,621 | |
Total liabilities | | 123,995 |
| | |
Net Assets | | $ 3,814,961 |
Net Assets consist of: | | |
Paid in capital | | $ 6,528,597 |
Undistributed net investment income | | 32,132 |
Accumulated undistributed net realized gain (loss) on investments and foreign currency transactions | | (3,301,713) |
Net unrealized appreciation (depreciation) on investments and assets and liabilities in foreign currencies | | 555,945 |
Net Assets | | $ 3,814,961 |
See accompanying notes which are an integral part of the financial statements.
Annual Report
Statement of Assets and Liabilities - continued
Amounts in thousands (except per-share amounts) | October 31, 2010 |
| | |
Calculation of Maximum Offering Price Class A:
Net Asset Value and redemption price per share ($1,302,101 ÷ 83,315 shares) | | $ 15.63 |
| | |
Maximum offering price per share (100/94.25 of $15.63) | | $ 16.58 |
Class T:
Net Asset Value and redemption price per share ($621,485 ÷ 40,162 shares) | | $ 15.47 |
| | |
Maximum offering price per share (100/96.50 of $15.47) | | $ 16.03 |
Class B:
Net Asset Value and offering price per share ($156,970 ÷ 10,529 shares)A | | $ 14.91 |
| | |
Class C:
Net Asset Value and offering price per share ($418,670 ÷ 27,997 shares)A | | $ 14.95 |
| | |
Institutional Class:
Net Asset Value, offering price and redemption price per share ($1,315,735 ÷ 82,766 shares) | | $ 15.90 |
A Redemption price per share is equal to net asset value less any applicable contingent deferred sales charge.
See accompanying notes which are an integral part of the financial statements.
Annual Report
Financial Statements - continued
Statement of Operations
Amounts in thousands | Year ended October 31, 2010 |
| | |
Investment Income | | |
Dividends | | $ 100,146 |
Interest | | 3 |
Income from Fidelity Central Funds | | 2,531 |
Income before foreign taxes withheld | | 102,680 |
Less foreign taxes withheld | | (8,513) |
Total income | | 94,167 |
| | |
Expenses | | |
Management fee | $ 29,779 | |
Transfer agent fees | 11,057 | |
Distribution and service plan fees | 13,361 | |
Accounting and security lending fees | 1,560 | |
Custodian fees and expenses | 809 | |
Independent trustees' compensation | 24 | |
Registration fees | 139 | |
Audit | 111 | |
Legal | 25 | |
Interest | 3 | |
Miscellaneous | 67 | |
Total expenses before reductions | 56,935 | |
Expense reductions | (967) | 55,968 |
Net investment income (loss) | | 38,199 |
Realized and Unrealized Gain (Loss) Net realized gain (loss) on: | | |
Investment securities: | | |
Unaffiliated issuers (net of foreign taxes of $1,740) | 466,839 | |
Foreign currency transactions | (1,542) | |
Capital gain distributions from Fidelity Central Funds | 5 | |
Total net realized gain (loss) | | 465,302 |
Change in net unrealized appreciation (depreciation) on: Investment securities (net of decrease in deferred foreign taxes of $2,466) | (92,828) | |
Assets and liabilities in foreign currencies | 41 | |
Total change in net unrealized appreciation (depreciation) | | (92,787) |
Net gain (loss) | | 372,515 |
Net increase (decrease) in net assets resulting from operations | | $ 410,714 |
See accompanying notes which are an integral part of the financial statements.
Annual Report
Statement of Changes in Net Assets
Amounts in thousands | Year ended
October 31,
2010 | Year ended
October 31,
2009 |
Increase (Decrease) in Net Assets | | |
Operations | | |
Net investment income (loss) | $ 38,199 | $ 66,036 |
Net realized gain (loss) | 465,302 | (3,113,043) |
Change in net unrealized appreciation (depreciation) | (92,787) | 3,684,384 |
Net increase (decrease) in net assets resulting
from operations | 410,714 | 637,377 |
Distributions to shareholders from net investment income | (59,773) | (208,554) |
Distributions to shareholders from net realized gain | (3,252) | - |
Total distributions | (63,025) | (208,554) |
Share transactions - net increase (decrease) | (1,259,295) | (1,890,462) |
Redemption fees | 104 | 327 |
Total increase (decrease) in net assets | (911,502) | (1,461,312) |
| | |
Net Assets | | |
Beginning of period | 4,726,463 | 6,187,775 |
End of period (including undistributed net investment income of $32,132 and undistributed net investment income of $53,494, respectively) | $ 3,814,961 | $ 4,726,463 |
See accompanying notes which are an integral part of the financial statements.
Annual Report
Financial Highlights - Class A
Years ended October 31, | 2010 | 2009 | 2008 | 2007 | 2006 |
Selected Per-Share Data | | | | | |
Net asset value, beginning of period | $ 14.25 | $ 12.57 | $ 26.62 | $ 23.42 | $ 20.30 |
Income from Investment Operations | | | | | |
Net investment income (loss) C | .14 | .17 | .36 | .31 | .30 |
Net realized and unrealized gain (loss) | 1.44 | 1.96 | (11.15) | 4.69 | 3.91 |
Total from investment operations | 1.58 | 2.13 | (10.79) | 5.00 | 4.21 |
Distributions from net investment income | (.19) | (.45) | (.24) | (.23) | (.14) |
Distributions from net realized gain | (.01) | - | (3.02) | (1.57) | (.95) |
Total distributions | (.20) | (.45) | (3.26) | (1.80) | (1.09) |
Redemption fees added to paid in capital C, G | - | - | - | - | - |
Net asset value, end of period | $ 15.63 | $ 14.25 | $ 12.57 | $ 26.62 | $ 23.42 |
Total Return A, B | 11.17% | 18.16% | (45.95)% | 22.76% | 21.54% |
Ratios to Average Net Assets D, F | | | | | |
Expenses before reductions | 1.32% | 1.34% | 1.26% | 1.25% | 1.26% |
Expenses net of fee waivers, if any | 1.32% | 1.34% | 1.26% | 1.25% | 1.26% |
Expenses net of all reductions | 1.30% | 1.31% | 1.22% | 1.21% | 1.20% |
Net investment income (loss) | .95% | 1.43% | 1.80% | 1.26% | 1.33% |
Supplemental Data | | | | | |
Net assets, end of period (in millions) | $ 1,302 | $ 1,662 | $ 2,004 | $ 5,774 | $ 4,694 |
Portfolio turnover rate E | 59% | 92% | 88% | 105% | 83% |
A Total returns would have been lower had certain expenses not been reduced during the periods shown.
B Total returns do not include the effect of the sales charges.
C Calculated based on average shares outstanding during the period.
D Fees and expenses of the underlying Fidelity Central Funds are not included in the Fund's expense ratio. The Fund indirectly bears its proportionate share of the expenses of any underlying Fidelity Central Funds.
E Amount does not include the portfolio activity of any underlying Fidelity Central Funds.
F Expense ratios reflect operating expenses of the class. Expenses before reductions do not reflect amounts reimbursed by the investment adviser or reductions from brokerage service arrangements or reductions from other expense offset arrangements and do not represent the amount paid by the class during periods when reimbursements or reductions occur. Expenses net of fee waivers reflect expenses after reimbursement by the investment adviser but prior to reductions from brokerage service arrangements or other expense offset arrangements. Expenses net of all reductions represent the net expenses paid by the class.
G Amount represents less than $.01 per share.
See accompanying notes which are an integral part of the financial statements.
Annual Report
Financial Highlights - Class T
Years ended October 31, | 2010 | 2009 | 2008 | 2007 | 2006 |
Selected Per-Share Data | | | | | |
Net asset value, beginning of period | $ 14.11 | $ 12.42 | $ 26.30 | $ 23.17 | $ 20.12 |
Income from Investment Operations | | | | | |
Net investment income (loss) C | .10 | .14 | .31 | .25 | .25 |
Net realized and unrealized gain (loss) | 1.43 | 1.94 | (11.01) | 4.63 | 3.89 |
Total from investment operations | 1.53 | 2.08 | (10.70) | 4.88 | 4.14 |
Distributions from net investment income | (.16) | (.39) | (.16) | (.18) | (.14) |
Distributions from net realized gain | (.01) | - | (3.02) | (1.57) | (.95) |
Total distributions | (.17) | (.39) | (3.18) | (1.75) | (1.09) |
Redempti on fees added to paid in capital C, G | - | - | - | - | - |
Net asset value, end of period | $ 15.47 | $ 14.11 | $ 12.42 | $ 26.30 | $ 23.17 |
Total Return A, B | 10.88% | 17.84% | (46.04)% | 22.43% | 21.33% |
Ratios to Average Net Assets D, F | | | | | |
Expenses before reductions | 1.55% | 1.58% | 1.49% | 1.47% | 1.48% |
Expenses net of fee waivers, if any | 1.55% | 1.58% | 1.49% | 1.47% | 1.48% |
Expenses net of all reductions | 1.53% | 1.55% | 1.44% | 1.43% | 1.42% |
Net investment income (loss) | .71% | 1.19% | 1.57% | 1.04% | 1.12% |
Supplemental Data | | | | | |
Net assets, end of period (in millions) | $ 621 | $ 832 | $ 1,110 | $ 3,569 | $ 3,609 |
Portfolio turnover rate E | 59% | 92% | 88% | 105% | 83% |
A Total returns would have been lower had certain expenses not been reduced during the periods shown.
B Total returns do not include the effect of the sales charges.
C Calculated based on average shares outstanding during the period.
D Fees and expenses of the underlying Fidelity Central Funds are not included in the Fund's expense ratio. The Fund indirectly bears its proportionate share of the expenses of any underlying Fidelity Central Funds.
E Amount does not include the portfolio activity of any underlying Fidelity Central Funds.
F Expense ratios reflect operating expenses of the class. Expenses before reductions do not reflect amounts reimbursed by the investment adviser or reductions from brokerage service arrangements or reductions from other expense offset arrangements and do not represent the amount paid by the class during periods when reimbursements or reductions occur. Expenses net of fee waivers reflect expenses after reimbursement by the investment adviser but prior to reductions from brokerage service arrangements or other expense offset arrangements. Expenses net of all reductions represent the net expenses paid by the class.
G Amount represents less than $.01 per share.
See accompanying notes which are an integral part of the financial statements.
Annual Report
Financial Highlights - Class B
Years ended October 31, | 2010 | 2009 | 2008 | 2007 | 2006 |
Selected Per-Share Data | | | | | |
Net asset value, beginning of period | $ 13.61 | $ 11.95 | $ 25.44 | $ 22.46 | $ 19.60 |
Income from Investment Operations | | | | | |
Net investment income (loss) C | .02 | .08 | .18 | .10 | .10 |
Net realized and unrealized gain (loss) | 1.38 | 1.88 | (10.62) | 4.50 | 3.79 |
Total from investment operations | 1.40 | 1.96 | (10.44) | 4.60 | 3.89 |
Distributions from net investment income | (.09) | (.30) | (.03) | (.05) | (.08) |
Distributions from net realized gain | (.01) | - | (3.02) | (1.57) | (.95) |
Total distributions | (.10) | (.30) | (3.05) | (1.62) | (1.03) |
Redemption fees added to paid in capital C, G | - | - | - | - | - |
Net asset value, end of period | $ 14.91 | $ 13.61 | $ 11.95 | $ 25.44 | $ 22.46 |
Total Return A, B | 10.34% | 17.25% | (46.39)% | 21.73% | 20.55% |
Ratios to Average Net Assets D, F | | | | | |
Expenses before reductions | 2.09% | 2.10% | 2.08% | 2.08% | 2.12% |
Expenses net of fee waivers, if any | 2.09% | 2.10% | 2.08% | 2.08% | 2.12% |
Expenses net of all reductions | 2.07% | 2.07% | 2.04% | 2.04% | 2.06% |
Net investment income (loss) | .18% | .67% | .97% | .42% | .48% |
Supplemental Data | | | | | |
Net assets, end of period (in millions) | $ 157 | $ 191 | $ 221 | $ 559 | $ 508 |
Portfolio turnover rate E | 59% | 92% | 88% | 105% | 83% |
A Total returns would have been lower had certain expenses not been reduced during the periods shown.
B Total returns do not include the effect of the contingent deferred sales charge.
C Calculated based on average shares outstanding during the period.
D Fees and expenses of the underlying Fidelity Central Funds are not included in the Fund's expense ratio. The Fund indirectly bears its proportionate share of the expenses of any underlying Fidelity Central Funds.
E Amount does not include the portfolio activity of any underlying Fidelity Central Funds.
F Expense ratios reflect operating expenses of the class. Expenses before reductions do not reflect amounts reimbursed by the investment adviser or reductions from brokerage service arrangements or reductions from other expense offset arrangements and do not represent the amount paid by the class during periods when reimbursements or reductions occur. Expenses net of fee waivers reflect expenses after reimbursement by the investment adviser but prior to reductions from brokerage service arrangements or other expense offset arrangements. Expenses net of all reductions represent the net expenses paid by the class.
G Amount represents less than $.01 per share.
See accompanying notes which are an integral part of the financial statements.
Annual Report
Financial Highlights - Class C
Years ended October 31, | 2010 | 2009 | 2008 | 2007 | 2006 |
Selected Per-Share Data | | | | | |
Net asset value, beginning of period | $ 13.65 | $ 11.98 | $ 25.50 | $ 22.53 | $ 19.65 |
Income from Investment Operations | | | | | |
Net investment income (loss) C | .03 | .08 | .20 | .12 | .12 |
Net realized and unrealized gain (loss) | 1.38 | 1.89 | (10.64) | 4.50 | 3.79 |
Total from investment operations | 1.41 | 1.97 | (10.44) | 4.62 | 3.91 |
Distributions from net investment income | (.10) | (.30) | (.06) | (.08) | (.08) |
Distributions from net realized gain | (.01) | - | (3.02) | (1.57) | (.95) |
Total distributions | (.11) | (.30) | (3.08) | (1.65) | (1.03) |
Redemption fees added to paid in capital C, G | - | - | - | - | - |
Net asset value, end of period | $ 14.95 | $ 13.65 | $ 11.98 | $ 25.50 | $ 22.53 |
Total Return A, B | 10.32% | 17.24% | (46.33)% | 21.81% | 20.62% |
Ratios to Average Net Assets D, F | | | | | |
Expenses before reductions | 2.06% | 2.09% | 2.01% | 2.00% | 2.02% |
Expenses net of fee waivers, if any | 2.06% | 2.09% | 2.01% | 2.00% | 2.02% |
Expenses net of all reductions | 2.04% | 2.06% | 1.97% | 1.96% | 1.96% |
Net investment income (loss) | .21% | .68% | 1.04% | .51% | .57% |
Supplemental Data | | | | | |
Net assets, end of period (in millions) | $ 419 | $ 502 | $ 618 | $ 1,673 | $ 1,395 |
Portfolio turnover rate E | 59% | 92% | 88% | 105% | 83% |
A Total returns would have been lower had certain expenses not been reduced during the periods shown.
B Total returns do not include the effect of the contingent deferred sales charge.
C Calculated based on average shares outstanding during the period.
D Fees and expenses of the underlying Fidelity Central Funds are not included in the Fund's expense ratio. The Fund indirectly bears its proportionate share of the expenses of any underlying Fidelity Central Funds.
E Amount does not include the portfolio activity of any underlying Fidelity Central Funds.
F Expense ratios reflect operating expenses of the class. Expenses before reductions do not reflect amounts reimbursed by the investment adviser or reductions from brokerage service arrangements or reductions from other expense offset arrangements and do not represent the amount paid by the class during periods when reimbursements or reductions occur. Expenses net of fee waivers reflect expenses after reimbursement by the investment adviser but prior to reductions from brokerage service arrangements or other expense offset arrangements. Expenses net of all reductions represent the net expenses paid by the class.
G Amount represents less than $.01 per share.
See accompanying notes which are an integral part of the financial statements.
Annual Report
Financial Highlights - Institutional Class
Years ended October 31, | 2010 | 2009 | 2008 | 2007 | 2006 |
Selected Per-Share Data | | | | | |
Net asset value, beginning of period | $ 14.48 | $ 12.81 | $ 27.06 | $ 23.78 | $ 20.56 |
Income from Investment Operations | | | | | |
Net investment income (loss) B | .19 | .21 | .41 | .38 | .37 |
Net realized and unrealized gain (loss) | 1.47 | 1.98 | (11.34) | 4.76 | 3.98 |
Total from investment operations | 1.66 | 2.19 | (10.93) | 5.14 | 4.35 |
Distributions from net investment income | (.23) | (.52) | (.30) | (.29) | (.18) |
Distributions from net realized gain | (.01) | - | (3.02) | (1.57) | (.95) |
Total distributions | (.24) | (.52) | (3.32) | (1.86) | (1.13) |
Redemption fees added to paid in capital B, F | - | - | - | - | - |
Net asset value, end of period | $ 15.90 | $ 14.48 | $ 12.81 | $ 27.06 | $ 23.78 |
Total Return A | 11.55% | 18.45% | (45.79)% | 23.07% | 21.96% |
Ratios to Average Net Assets C, E | | | | | |
Expenses before reductions | .99% | 1.07% | .99% | .98% | .97% |
Expenses net of fee waivers, if any | .99% | 1.07% | .99% | .98% | .97% |
Expenses net of all reductions | .97% | 1.04% | .94% | .94% | .92% |
Net investment income (loss) | 1.28% | 1.70% | 2.07% | 1.53% | 1.62% |
Supplemental Data | | | | | |
Net assets, end of period (in millions) | $ 1,316 | $ 1,540 | $ 2,235 | $ 5,266 | $ 4,220 |
Portfolio turnover rate D | 59% | 92% | 88% | 105% | 83% |
A Total returns would have been lower had certain expenses not been reduced during the periods shown.
B Calculated based on average shares outstanding during the period.
C Fees and expenses of the underlying Fidelity Central Funds are not included in the Fund's expense ratio. The Fund indirectly bears its proportionate share of the expenses of any underlying Fidelity Central Funds.
D Amount does not include the portfolio activity of any underlying Fidelity Central Funds.
E Expense ratios reflect operating expenses of the class. Expenses before reductions do not reflect amounts reimbursed by the investment adviser or reductions from brokerage service arrangements or reductions from other expense offset arrangements and do not represent the amount paid by the class during periods when reimbursements or reductions occur. Expenses net of fee waivers reflect expenses after reimbursement by the investment adviser but prior to reductions from brokerage service arrangements or other expense offset arrangements. Expenses net of all reductions represent the net expenses paid by the class.
F Amount represents less than $.01 per share.
See accompanying notes which are an integral part of the financial statements.
Annual Report
Notes to Financial Statements
For the period ended October 31, 2010
(Amounts in thousands except ratios)
1. Organization.
Fidelity Advisor Diversified International Fund (the Fund) is a fund of Fidelity Advisor Series VIII (the Trust) and is authorized to issue an unlimited number of shares. The Trust is registered under the Investment Company Act of 1940, as amended (the 1940 Act), as an open-end management investment company organized as a Massachusetts business trust. The Fund offers Class A, Class T, Class C and Institutional Class shares, each of which has equal rights as to assets and voting privileges. Effective after the close of business on September 1, 2010, Class B shares were closed to new accounts and additional purchases by existing shareholders. Each class has exclusive voting rights with respect to matters that affect that class. Class B shares will automatically convert to Class A shares after a holding period of seven years from the initial date of purchase. Investment income, realized and unrealized capital gains and losses, the common expenses of the Fund, and certain fund-level expense reductions, if any, are allocated on a pro-rata basis to each class based on the relative net assets of each class to the total net assets of the Fund. Each class differs with respect to transfer agent and distribution and service plan fees incurred. Certain expense reductions also differ by class. The Fund's investments in emerging markets can be subject to social, economic, regulatory, and political uncertainties and can be extremely volatile.
2. Investments in Fidelity Central Funds.
The Fund may invest in Fidelity Central Funds, which are open-end investment companies available only to other investment companies and accounts managed by Fidelity Management & Research Company (FMR) and its affiliates. The Fund's Schedule of Investments lists each of the Fidelity Central Funds held as of period end, if any, as an investment of the Fund, but does not include the underlying holdings of each Fidelity Central Fund. As an Investing Fund, the Fund indirectly bears its proportionate share of the expenses of the underlying Fidelity Central Funds.
The Money Market Central Funds seek preservation of capital and current income and are managed by Fidelity Investments Money Management, Inc. (FIMM), an affiliate of FMR.
A complete unaudited list of holdings for each Fidelity Central Fund is available upon request or at the Securities and Exchange Commission (the SEC) web site at www.sec.gov. In addition, the financial statements of the Fidelity Central Funds, which are not covered by the Fund's Report of Independent Registered Public Accounting Firm, are available on the SEC web site or upon request.
Annual Report
Notes to Financial Statements - continued
(Amounts in thousands except ratios)
3. Significant Accounting Policies.
The financial statements have been prepared in conformity with accounting principles generally accepted in the United States of America (GAAP), which require management to make certain estimates and assumptions at the date of the financial statements. Actual results could differ from those estimates. The following summarizes the significant accounting policies of the Fund:
Security Valuation. Investments are valued as of 4:00 p.m. Eastern time on the last calendar day of the period. The Fund uses independent pricing services approved by the Board of Trustees to value its investments. When current market prices or quotations are not readily available or reliable, valuations may be determined in good faith in accordance with procedures adopted by the Board of Trustees. Factors used in determining value may include market or security specific events. The frequency with which these procedures are used cannot be predicted and they may be utilized to a significant extent. The value used for net asset value (NAV) calculation under these procedures may differ from published prices for the same securities.
The Fund categorizes the inputs to valuation techniques used to value its investments into a disclosure hierarchy consisting of three levels as shown below.
Level 1 - quoted prices in active markets for identical investments
Level 2 - other significant observable inputs (including quoted prices for similar investments, interest rates, prepayment speeds, etc.)
Level 3 - unobservable inputs (including the fund's own assumptions based on the best information available)
Changes in valuation techniques may result in transfers in or out of an assigned level within the disclosure hierarchy. The aggregate value of investments by input level, as of October 31, 2010, as well as a roll forward of Level 3 securities, is included at the end of the Fund's Schedule of Investments. Valuation techniques used to value the Fund's investments by major category are as follows.
Equity securities, including restricted securities, for which market quotations are readily available, are valued at the last reported sale price or official closing price as reported by an independent pricing service on the primary market or exchange on which they are traded and are categorized as Level 1 in the hierarchy. In the event there were no sales during the day or closing prices are not available, securities are valued at the last quoted bid price or may be valued using the last available price and are generally categorized as Level 2 in the hierarchy. For foreign equity securities, when significant market or security specific events arise, comparisons to the valuation of American Depositary Receipts (ADRs), futures contracts, Exchange-traded funds (ETFs) and certain indexes as well as
Annual Report
3. Significant Accounting Policies - continued
Security Valuation - continued
quoted prices for similar securities are used and are categorized as Level 2 in the hierarchy in these circumstances. Utilizing these techniques may result in transfers between Level 1 and Level 2. For restricted equity securities and private placements where observable inputs are limited, assumptions about market activity and risk are used and are categorized as Level 3 in the hierarchy.
Investments in open-end mutual funds, including the Fidelity Central Funds, are valued at their closing net asset value each business day and are categorized as Level 1 in the hierarchy. Short-term securities with remaining maturities of sixty days or less for which quotations are not readily available are valued at amortized cost, which approximates fair value and are categorized as Level 2 in the hierarchy.
Foreign Currency. The Fund uses foreign currency contracts to facilitate transactions in foreign-denominated securities. Gains and losses from these transactions may arise from changes in the value of the foreign currency or if the counterparties do not perform under the contracts' terms.
Foreign-denominated assets, including investment securities, and liabilities are translated into U.S. dollars at the exchange rate at period end. Purchases and sales of investment securities, income and dividends received and expenses denominated in foreign currencies are translated into U.S. dollars at the exchange rate in effect on the transaction date.
The effects of exchange rate fluctuations on investments are included with the net realized and unrealized gain (loss) on investment securities. Other foreign currency transactions resulting in realized and unrealized gain (loss) are disclosed separately.
Investment Transactions and Income. For financial reporting purposes, the Fund's investment holdings and NAV include trades executed through the end of the last business day of the period. The NAV per share for processing shareholder transactions is calculated as of the close of business of the New York Stock Exchange (NYSE), normally 4:00 p.m. Eastern time and includes trades executed through the end of the prior business day. Gains and losses on securities sold are determined on the basis of identified cost and may include proceeds received from litigation. Dividend income is recorded on the ex-dividend date, except for certain dividends from foreign securities where the ex-dividend date may have passed, which are recorded as soon as the Fund is informed of the ex-dividend date. Non-cash dividends included in dividend income, if any, are recorded at the fair market value of the securities received. Distributions received on securities that represent a return of capital or capital gain are recorded as a reduction of cost of investments and/or as a realized gain. The Fund estimates the components of distributions received that may be considered return of capital distributions or capital
Annual Report
Notes to Financial Statements - continued
(Amounts in thousands except ratios)
3. Significant Accounting Policies - continued
Investment Transactions and Income - continued
gain distributions. Interest income and distributions from the Fidelity Central Funds are accrued as earned. Interest income includes coupon interest and amortization of premium and accretion of discount on debt securities. Investment income is recorded net of foreign taxes withheld where recovery of such taxes is uncertain.
Expenses. Most expenses of the Trust can be directly attributed to a fund. Expenses which cannot be directly attributed are apportioned amongst each fund in the Trust. Expense estimates are accrued in the period to which they relate and adjustments are made when actual amounts are known.
Deferred Trustee Compensation. Under a Deferred Compensation Plan (the Plan), independent Trustees may elect to defer receipt of a portion of their annual compensation. Deferred amounts are invested in a cross-section of Fidelity funds, are marked-to-market and remain in the Fund until distributed in accordance with the Plan. The investment of deferred amounts and the offsetting payable to the Trustees are included in the accompanying Statement of Assets and Liabilities.
Income Tax Information and Distributions to Shareholders. Each year the Fund intends to qualify as a regulated investment company, including distributing substantially all of its taxable income and realized gains under Subchapter M of the Internal Revenue Code and filing its U.S. federal tax return. As a result, no provision for income taxes is required. As of October 31, 2010, the Fund did not have any unrecognized tax benefits in the accompanying financial statements. A fund's federal tax return is subject to examination by the Internal Revenue Service (IRS) for a period of three years. Foreign taxes are provided for based on the Fund's understanding of the tax rules and rates that exist in the foreign markets in which it invests. The Fund is subject to a tax imposed on short term capital gains on securities of certain issuers domiciled in India. The Fund records an estimated deferred tax liability included in Other payables and accrued expenses in the accompanying Statement of Assets & Liabilities for net unrealized gains on these securities in an amount that would be payable if the securities were disposed of at period end.
Distributions are declared and recorded on the ex-dividend date. Income dividends and capital gain distributions are declared separately for each class. Income and capital gain distributions are determined in accordance with income tax regulations, which may differ from GAAP.
Capital accounts within the financial statements are adjusted for permanent book-tax differences. These adjustments have no impact on net assets or the results of operations. Temporary book-tax differences will reverse in a subsequent period.
Annual Report
3. Significant Accounting Policies - continued
Income Tax Information and Distributions to Shareholders - continued
Book-tax differences are primarily due to the short-term gain distributions from the Fidelity Central Funds, foreign currency transactions, certain foreign taxes, passive foreign investment companies (PFIC), deferred trustees compensation, capital loss carryforwards and losses deferred due to wash sales.
The federal tax cost of investment securities and unrealized appreciation (depreciation) as of period end were as follows:
Gross unrealized appreciation | $ 710,165 |
Gross unrealized depreciation | (183,888) |
Net unrealized appreciation (depreciation) | $ 526,277 |
| |
Tax Cost | $ 3,381,996 |
The tax-based components of distributable earnings as of period end were as follows:
Undistributed ordinary income | $ 39,837 |
Capital loss carryforward | $ (3,277,388) |
Net unrealized appreciation (depreciation) | $ 526,592 |
The tax character of distributions paid was as follows:
| October 31, 2010 | October 31, 2009 |
Ordinary Income | $ 63,025 | $ 208,554 |
Short-Term Trading (Redemption) Fees. Shares held by investors in the Fund less than 30 days are subject to a redemption fee equal to 1.00% of the net asset value of shares redeemed. All redemption fees, which reduce the proceeds of the shareholder redemption, are retained by the Fund and accounted for as an addition to paid in capital.
4. Operating Policies.
Restricted Securities. The Fund may invest in securities that are subject to legal or contractual restrictions on resale. These securities generally may be resold in transactions exempt from registration or to the public if the securities are registered. Disposal of these securities may involve time-consuming negotiations and expense, and prompt sale at an acceptable price may be difficult. Information regarding restricted securities is included at the end of the Fund's Schedule of Investments.
Annual Report
Notes to Financial Statements - continued
(Amounts in thousands except ratios)
5. Purchases and Sales of Investments.
Purchases and sales of securities, other than short-term securities, aggregated $2,397,518 and $3,656,002, respectively.
6. Fees and Other Transactions with Affiliates.
Management Fee. FMR and its affiliates provide the Fund with investment management related services for which the Fund pays a monthly management fee. The management fee is the sum of an individual fund fee rate that is based on an annual rate of .45% of the Fund's average net assets and a group fee rate that averaged .26% during the period. The group fee rate is based upon the average net assets of all the mutual funds advised by FMR. The group fee rate decreases as assets under management increase and increases as assets under management decrease. For the period, the total annual management fee rate was .71% of the Fund's average net assets.
Distribution and Service Plan Fees. In accordance with Rule 12b-1 of the 1940 Act, the Fund has adopted separate Distribution and Service Plans for each class of shares. Certain classes pay Fidelity Distributors Corporation (FDC), an affiliate of FMR, separate Distribution and Service Fees, each of which is based on an annual percentage of each class' average net assets. In addition, FDC may pay financial intermediaries for selling shares of the Fund and providing shareholder support services. For the period, the Distribution and Service Fee rates, total fees and amounts retained by FDC were as follows:
| Distribution
Fee | Service
Fee | Total Fees | Retained
by FDC |
Class A | -% | .25% | $ 3,603 | $ 32 |
Class T | .25% | .25% | 3,542 | - |
Class B | .75% | .25% | 1,713 | 1,286 |
Class C | .75% | .25% | 4,503 | 192 |
| | | $ 13,361 | $ 1,510 |
Sales Load. FDC receives a front-end sales charge of up to 5.75% for selling Class A shares, and 3.50% for selling Class T shares, some of which is paid to financial intermediaries for selling shares of the Fund. FDC receives the proceeds of contingent deferred sales charges levied on Class A, Class T, Class B, and Class C redemptions. These charges depend on the holding period. The deferred sales charges range from 5% to 1% for Class B, 1% for Class C, 1.00% for certain purchases of Class A shares (1.00% to .50% prior to July 12, 2010) and .25% for certain purchases of Class T shares.
Annual Report
6. Fees and Other Transactions with Affiliates - continued
Sales Load - continued
For the period, sales charge amounts retained by FDC were as follows:
| Retained
by FDC |
Class A | $ 144 |
Class T | 40 |
Class B* | 365 |
Class C* | 16 |
| $ 565 |
* When Class B and Class C shares are initially sold, FDC pays commissions from its own resources to financial intermediaries through which the sales are made.
Transfer Agent Fees. Fidelity Investments Institutional Operations Company, Inc. (FIIOC), an affiliate of FMR, is the transfer, dividend disbursing and shareholder servicing agent for each class of the Fund. FIIOC receives account fees and asset-based fees that vary according to the account size and type of account of the shareholders of the respective classes of the Fund. FIIOC pays for typesetting, printing and mailing of shareholder reports, except proxy statements. For the period, transfer agent fees for each class were as follows:
| Amount | % of
Average
Net Assets |
Class A | $ 4,244 | .29 |
Class T | 1,969 | .28 |
Class B | 537 | .31 |
Class C | 1,270 | .28 |
Institutional Class | 3,037 | .21 |
| $ 11,057 | |
Accounting and Security Lending Fees. Fidelity Service Company, Inc. (FSC), an affiliate of FMR, maintains the Fund's accounting records. The accounting fee is based on the level of average net assets for the month. Under a separate contract, FSC administers the security lending program. The security lending fee is based on the number and duration of lending transactions.
Brokerage Commissions. The Fund placed a portion of its portfolio transactions with brokerage firms which are affiliates of the investment adviser. The commissions paid to these affiliated firms were $12 for the period.
Annual Report
Notes to Financial Statements - continued
(Amounts in thousands except ratios)
6. Fees and Other Transactions with Affiliates - continued
Interfund Lending Program. Pursuant to an Exemptive Order issued by the SEC, the Fund, along with other registered investment companies having management contracts with FMR, may participate in an interfund lending program. This program provides an alternative credit facility allowing the funds to borrow from, or lend money to, other participating affiliated funds. At period end, there were no interfund loans outstanding. The Fund's activity in this program during the period for which loans were outstanding was as follows:
Borrower or Lender | Average Daily
Loan Balance | Weighted Average
Interest Rate | Interest
Expense |
Borrower | $ 10,419 | .46% | $ 3 |
7. Committed Line of Credit.
The Fund participates with other funds managed by FMR or an affiliate in a $3.75 billion credit facility (the "line of credit") to be utilized for temporary or emergency purposes to fund shareholder redemptions or for other short-term liquidity purposes. The Fund has agreed to pay commitment fees on its pro-rata portion of the line of credit, which amounted to $17 and is reflected in Miscellaneous expenses on the Statement of Operations. During the period, there were no borrowings on this line of credit.
8. Security Lending.
The Fund lends portfolio securities through a lending agent from time to time in order to earn additional income. The lending agent may loan securities to certain qualified borrowers, including Fidelity Capital Markets (FCM), a broker-dealer affiliated with the Fund. On the settlement date of the loan, the Fund receives collateral (in the form of U.S. Treasury obligations, letters of credit and/or cash) against the loaned securities and maintains collateral in an amount not less than 100% of the market value of the loaned securities during the period of the loan. The market value of the loaned securities is determined at the close of business of the Fund and any additional required collateral is delivered to the Fund on the next business day. If the borrower defaults on its obligation to return the securities loaned because of insolvency or other reasons, a fund could experience delays and costs in recovering the securities loaned or in gaining access to the collateral. Any cash collateral received is invested in the Fidelity Securities Lending Cash Central Fund. The value of loaned securities and cash collateral at period end are disclosed on the Fund's Statement of Assets and Liabilities. Security lending income represents the income earned on investing cash collateral, less rebates paid to borrowers and lending agent fees associated with the loan, plus any premium payments received for
Annual Report
8. Security Lending - continued
lending certain types of securities. Security lending income is presented in the Statement of Operations as a component of income from Fidelity Central Funds. Total security lending income during the period amounted to $2,425. During the period, there were no securities loaned to FCM.
9. Expense Reductions.
Many of the brokers with whom FMR places trades on behalf of the Fund provided services to the Fund in addition to trade execution. These services included payments of certain expenses on behalf of the Fund totaling $967 for the period.
10. Distributions to Shareholders.
Distributions to shareholders of each class were as follows:
Years ended October 31, | 2010 | 2009 |
From net investment income | | |
Class A | $ 21,908 | $ 68,117 |
Class T | 9,175 | 33,086 |
Class B | 1,280 | 5,353 |
Class C | 3,424 | 14,560 |
Institutional Class | 23,986 | 87,438 |
Total | $ 59,773 | $ 208,554 |
From net realized gain | | |
Class A | $ 1,135 | $ - |
Class T | 581 | - |
Class B | 138 | - |
Class C | 360 | - |
Institutional Class | 1,038 | - |
Total | $ 3,252 | $ - |
Annual Report
Notes to Financial Statements - continued
(Amounts in thousands except ratios)
11. Share Transactions.
Transactions for each class of shares were as follows:
| Shares | Dollars |
Years ended October 31, | 2010 | 2009 | 2010 | 2009 |
Class A | | | | |
Shares sold | 11,857 | 21,418 | $ 171,401 | $ 253,623 |
Reinvestment of distributions | 1,361 | 5,430 | 20,356 | 57,665 |
Shares redeemed | (46,493) | (69,599) | (670,244) | (816,403) |
Net increase (decrease) | (33,275) | (42,751) | $ (478,487) | $ (505,115) |
Class T | | | | |
Shares sold | 5,521 | 8,679 | $ 79,294 | $ 101,272 |
Reinvestment of distributions | 636 | 2,991 | 9,432 | 31,524 |
Shares redeemed | (24,938) | (42,114) | (355,762) | (489,737) |
Net increase (decrease) | (18,781) | (30,444) | $ (267,036) | $ (356,941) |
Class B | | | | |
Shares sold | 579 | 830 | $ 8,025 | $ 9,528 |
Reinvestment of distributions | 88 | 460 | 1,270 | 4,698 |
Shares redeemed | (4,186) | (5,692) | (57,671) | (63,258) |
Net increase (decrease) | (3,519) | (4,402) | $ (48,376) | $ (49,032) |
Class C | | | | |
Shares sold | 1,779 | 2,588 | $ 24,719 | $ 29,408 |
Reinvestment of distributions | 201 | 1,031 | 2,898 | 10,558 |
Shares redeemed | (10,773) | (18,446) | (148,900) | (204,594) |
Net increase (decrease) | (8,793) | (14,827) | $ (121,283) | $ (164,628) |
Institutional Class | | | | |
Shares sold | 22,171 | 29,717 | $ 322,782 | $ 339,054 |
Reinvestment of distributions | 1,330 | 5,968 | 20,174 | 64,270 |
Shares redeemed | (47,045) | (103,818) | (687,069) | (1,218,070) |
Net increase (decrease) | (23,544) | (68,133) | $ (344,113) | $ (814,746) |
12. Other.
The Fund's organizational documents provide former and current trustees and officers with a limited indemnification against liabilities arising in connection with the performance of their duties to the Fund. In the normal course of business, the Fund may also enter into contracts that provide general indemnifications. The Fund's maximum exposure under these arrangements is unknown as this would be dependent on future claims that may be made against the Fund. The risk of material loss from such claims is considered remote.
Annual Report
To the Trustees of Fidelity Advisor Series VIII and the Shareholders of Fidelity Advisor Diversified International Fund:
In our opinion, the accompanying statement of assets and liabilities, including the schedule of investments, and the related statements of operations and of changes in net assets and the financial highlights present fairly, in all material respects, the financial position of Fidelity Advisor Diversified International Fund (a fund of Fidelity Advisor Series VIII) at October 31, 2010, the results of its operations for the year then ended, the changes in its net assets for each of the two years in the period then ended and the financial highlights for each of the five years in the period then ended in conformity with accounting principles generally accepted in the United States of America. These financial statements and financial highlights (hereafter referred to as "financial statements") are the responsibility of the Fidelity Advisor Diversified International Fund's management. Our responsibility is to express an opinion on these financial statements based on our audits. We conducted our audits of these financial statements in accordance with the standards of the Public Company Accounting Oversight Board (United States). Those standards require that we plan and perform the audit to obtain reasonable assurance about whether the financial statements are free of material misstatement. An audit includes examining, on a test basis, evidence supporting the amounts and disclosures in the financial statements, assessing the accounting principles used and significant estimates made by management, and evaluating the overall financial statement presentation. We believe that our audits, which included confirmation of securities at October 31, 2010 by correspondence with the custodian and brokers, provide a reasonable basis for our opinion.
/s/ PricewaterhouseCoopers LLP
PricewaterhouseCoopers LLP
Boston, Massachusetts
December 16, 2010
Annual Report
The Trustees, Member of the Advisory Board, and executive officers of the trust and fund, as applicable, are listed below. The Board of Trustees governs the fund and is responsible for protecting the interests of shareholders. The Trustees are experienced executives who meet periodically throughout the year to oversee the fund's activities, review contractual arrangements with companies that provide services to the fund, oversee management of the risks associated with such activities and contractual arrangements, and review the fund's performance. Except for James C. Curvey, each of the Trustees oversees 221 funds advised by FMR or an affiliate. Mr. Curvey oversees 410 funds advised by FMR or an affiliate.
The Trustees hold office without limit in time except that (a) any Trustee may resign; (b) any Trustee may be removed by written instrument, signed by at least two-thirds of the number of Trustees prior to such removal; (c) any Trustee who requests to be retired or who has become incapacitated by illness or injury may be retired by written instrument signed by a majority of the other Trustees; and (d) any Trustee may be removed at any special meeting of shareholders by a two-thirds vote of the outstanding voting securities of the trust. Each Trustee who is not an interested person (as defined in the 1940 Act) (Independent Trustee), shall retire not later than the last day of the calendar year in which his or her 72nd birthday occurs. The Independent Trustees may waive this mandatory retirement age policy with respect to individual Trustees. The executive officers and Advisory Board Member hold office without limit in time, except that any officer and Advisory Board Member may resign or may be removed by a vote of a majority of the Trustees at any regular meeting or any special meeting of the Trustees. Except as indicated, each individual has held the office shown or other offices in the same company for the past five years.
Experience, Skills, Attributes, and Qualifications of the Fund's Trustees. The Governance and Nominating Committee has adopted a statement of policy that describes the experience, qualifications, attributes, and skills that are necessary and desirable for potential Independent Trustee candidates (Statement of Policy). The Board believes that each Trustee satisfied at the time he or she was initially elected or appointed a Trustee, and continues to satisfy, the standards contemplated by the Statement of Policy. The Governance and Nominating Committee also engages professional search firms to help identify potential Independent Trustee candidates who have the experience, qualifications, attributes, and skills consistent with the Statement of Policy. From time to time, additional criteria based on the composition and skills of the current Independent Trustees, as well as experience or skills that may be appropriate in light of future changes to board composition, business conditions, and regulatory or other developments, have also been considered by the professional search firms and the Governance and Nominating Committee. In addition, the Board takes into account the Trustees' commitment and participation in Board and committee meetings, as well as their leadership of standing and ad hoc committees throughout their tenure.
In determining that a particular Trustee was and continues to be qualified to serve as a Trustee, the Board has considered a variety of criteria, none of which, in isolation, was controlling. The Board believes that, collectively, the Trustees have balanced and diverse experience, qualifications, attributes, and skills, which allow the Board to operate effectively in governing the fund and protecting the interests of shareholders. Information about the specific experience, skills, attributes, and qualifications of each Trustee, which in each case led to the Board's conclusion that the Trustee should serve (or continue to serve) as a trustee of the fund, is provided below.
Annual Report
Board Structure and Oversight Function. Edward C. Johnson 3d is an interested person (as defined in the 1940 Act) and currently serves as Chairman. The Trustees have determined that an interested Chairman is appropriate and benefits shareholders because an interested Chairman has a personal and professional stake in the quality and continuity of services provided to the fund. Independent Trustees exercise their informed business judgment to appoint an individual of their choosing to serve as Chairman, regardless of whether the Trustee happens to be independent or a member of management. The Independent Trustees have determined that they can act independently and effectively without having an Independent Trustee serve as Chairman and that a key structural component for assuring that they are in a position to do so is for the Independent Trustees to constitute a substantial majority for the Board. The Independent Trustees also regularly meet in executive session. Ned C. Lautenbach serves as Chairman of the Independent Trustees and as such (i) acts as a liaison between the Independent Trustees and management with respect to matters important to the Independent Trustees and (ii) with management prepares agendas for Board meetings.
Fidelity funds are overseen by different Boards of Trustees. The fund's Board oversees Fidelity's equity and high income funds and another Board oversees Fidelity's investment-grade bond, money market, and asset allocation funds. The asset allocation funds may invest in Fidelity funds overseen by the fund's Board. The use of separate Boards, each with its own committee structure, allows the Trustees of each group of Fidelity funds to focus on the unique issues of the funds they oversee, including common research, investment, and operational issues. On occasion, the separate Boards establish joint committees to address issues of overlapping consequences for the Fidelity funds overseen by each Board.
The Trustees operate using a system of committees to facilitate the timely and efficient consideration of all matters of importance to the Trustees, the fund, and fund shareholders and to facilitate compliance with legal and regulatory requirements and oversight of the fund's activities and associated risks. The Board, acting through its committees, has charged FMR and its affiliates with (i) identifying events or circumstances the occurrence of which could have demonstrably adverse effects on the fund's business and/or reputation; (ii) implementing processes and controls to lessen the possibility that such events or circumstances occur or to mitigate the effects of such events or circumstances if they do occur; and (iii) creating and maintaining a system designed to evaluate continuously business and market conditions in order to facilitate the identification and implementation processes described in (i) and (ii) above. Because the day-to-day operations and activities of the fund are carried out by or through FMR, its affiliates and other service providers, the fund's exposure to risks is mitigated but not eliminated by the processes overseen by the Trustees. While each of the Board's committees has responsibility for overseeing different aspects of the fund's activities, oversight is exercised primarily through the Operations, Audit, and Compliance Committees. Appropriate personnel, including but not limited to the fund's Chief Compliance Officer (CCO), FMR's internal auditor, the independent accountants, the fund's Treasurer and portfolio management personnel, make periodic reports to the Board's committees, as appropriate. The responsibilities of each committee, including their oversight responsibilities, are described further under "Standing Committees of the Fund's Trustees."
Annual Report
Trustees and Officers - continued
The fund's Statement of Additional Information (SAI) includes more information about the Trustees. To request a free copy, call Fidelity at 1-877-208-0098.
Interested Trustees*:
Correspondence intended for each Trustee who is an interested person may be sent to Fidelity Investments, 82 Devonshire Street, Boston, Massachusetts 02109.
Name, Age; Principal Occupations and Other Relevant Experience+ |
Edward C. Johnson 3d (80) |
| Year of Election or Appointment: 1983 Mr. Johnson is Trustee and Chairman of the Board of Trustees of certain Trusts. Mr. Johnson serves as Chief Executive Officer, Chairman, and a Director of FMR LLC; Chairman and a Director of FMR; Chairman and a Director of Fidelity Research & Analysis Company (FRAC); Chairman and a Director of Fidelity Investments Money Management, Inc.; and Chairman and a Director of FMR Co., Inc. In addition, Mr. Johnson serves as Chairman and Director of FIL Limited. Previously, Mr. Johnson served as President of FMR LLC (2006-2007). |
James C. Curvey (75) |
| Year of Election or Appointment: 2007 Mr. Curvey also serves as Trustee (2007-present) of other investment companies advised by FMR. Mr. Curvey is a Director of Fidelity Investments Money Management, Inc. (2009-present), Director of Fidelity Research & Analysis Co. (2009-present) and Director of FMR and FMR Co., Inc. (2007-present). Mr. Curvey is also Vice Chairman (2007-present) and Director of FMR LLC. In addition, Mr. Curvey serves as an Overseer for the Boston Symphony Orchestra and a member of the Trustees of Villanova University. Previously, Mr. Curvey was the Vice Chairman (2006-2007) and Director (2000-2007) of FMR Corp. |
* Trustees have been determined to be "Interested Trustees" by virtue of, among other things, their affiliation with the trust or various entities under common control with FMR.
Annual Report
+ The information above includes each Trustee's principal occupation during the last five years and other information relating to the experience, attributes, and skills relevant to each Trustee's qualifications to serve as a Trustee, which led to the conclusion that each Trustee should serve as a Trustee for the fund.
Independent Trustees:
Correspondence intended for each Independent Trustee (that is, the Trustees other than the Interested Trustees) may be sent to Fidelity Investments, P.O. Box 55235, Boston, Massachusetts 02205-5235.
Name, Age; Principal Occupations and Other Relevant Experience+ |
Dennis J. Dirks (62) |
| Year of Election or Appointment: 2005 Prior to his retirement in May 2003, Mr. Dirks was Chief Operating Officer and a member of the Board of The Depository Trust & Clearing Corporation (DTCC). He also served as President, Chief Operating Officer, and Board member of The Depository Trust Company (DTC) and President and Board member of the National Securities Clearing Corporation (NSCC). In addition, Mr. Dirks served as Chief Executive Officer and Board member of the Government Securities Clearing Corporation, Chief Executive Officer and Board member of the Mortgage-Backed Securities Clearing Corporation, as a Trustee and a member of the Finance Committee of Manhattan College (2005-2008), and as a Trustee and a member of the Finance Committee of AHRC of Nassau County (2006-2008). Mr. Dirks is a member of the Independent Directors Council (IDC) Governing Council (2010-Present) and Board of Directors for The Brookville Center for Children's Services, Inc. (2009-present). |
Alan J. Lacy (57) |
| Year of Election or Appointment: 2008 Mr. Lacy serves as Senior Adviser (2007-present) of Oak Hill Capital Partners, L.P. (private equity). Mr. Lacy also served as Chief Executive Officer (2000-2005) and Vice Chairman (2005-2006) of Sears Holdings Corporation and Sears, Roebuck and Co. (retail). In addition, Mr. Lacy serves as a member of the Board of Directors of The Western Union Company (global money transfer, 2006-present) and Bristol-Myers Squibb Company (global pharmaceuticals, 2007-present). Mr. Lacy is Chairman (2008-present) and a member (2006-present) of the Board of Trustees of The National Parks Conservation Association. |
Ned C. Lautenbach (66) |
| Year of Election or Appointment: 2000 Mr. Lautenbach is Chairman of the Independent Trustees of the Equity and High Income Funds (2006-present). Mr. Lautenbach currently serves as the Lead Director of the Eaton Corporation Board of Directors (diversified industrial, 1997-present). Mr. Lautenbach is also a member of the Board of Directors of the Philharmonic Center for the Arts in Naples, Florida (1999-present); a member of the Board of Trustees of Fairfield University (2005-present); and a member of the Council on Foreign Relations (1994-present). Previously, Mr. Lautenbach was a Partner/Advisory Partner at Clayton, Dubilier & Rice, Inc. (private equity investment, 1998-2010), as well as a Director of Sony Corporation (2006-2007). |
Joseph Mauriello (66) |
| Year of Election or Appointment: 2008 Prior to his retirement in January 2006, Mr. Mauriello served in numerous senior management positions including Deputy Chairman and Chief Operating Officer (2004-2005), and Vice Chairman of Financial Services (2002-2004) of KPMG LLP US (professional services, 1965-2005). Mr. Mauriello currently serves as a member of the Board of Directors of XL Group plc. (global insurance and re-insurance, 2006-present) and of Arcadia Resources Inc. (health care services and products, 2007-present). Previously, Mr. Mauriello served as a Director of the Hamilton Funds of the Bank of New York (2006-2007). |
Cornelia M. Small (66) |
| Year of Election or Appointment: 2005 Ms. Small is a member of the Board of Directors of the Teagle Foundation (2009-present). Ms. Small is also a member of the Investment Committee, and Chair (2008-present) and a member of the Board of Trustees of Smith College. In addition, Ms. Small serves on the Investment Committee of the Berkshire Taconic Community Foundation (2008-
present). Previously, Ms. Small served as Chairperson of the Investment Committee (2002-2008) of Smith College. In addition, Ms. Small served as Chief Investment Officer, Director of Global Equity Investments, and a member of the Board of Directors of Scudder, Stevens & Clark and Scudder Kemper Investments. |
William S. Stavropoulos (71) |
| Year of Election or Appointment: 2001 Mr. Stavropoulos is Vice Chairman of the Independent Trustees of the Equity and High Income Funds (2006-present). Mr. Stavropoulos serves as President and Founder of the Michigan Baseball Foundation, the Great Lakes Loons (2007-present). Mr. Stavropoulos is Chairman Emeritus of the Board of Directors of The Dow Chemical Company, where he previously served in numerous senior management positions, including President, CEO (1995-2000; 2002-2004), Chairman of the Executive Committee (2000-2006), and as a member of the Board of Directors (1990-2006). Currently, Mr. Stavropoulos is Chairman of Univar (global distributor of commodity and specialty chemicals, 2010-present), a Director of Teradata Corporation (data warehousing and technology solutions, 2008-present), Chemical Financial Corporation, Maersk Inc. (industrial conglomerate), Tyco International, Inc. (multinational manufacturing and services, 2007-present), and a member of the Advisory Board for Metalmark Capital (private equity investment, 2005-
present). Mr. Stavropoulos is a special advisor to Clayton, Dubilier & Rice, Inc. (private equity investment). In addition, Mr. Stavropoulos is a member of the University of Notre Dame Advisory Council for the College of Science. |
David M. Thomas (61) |
| Year of Election or Appointment: 2008 Previously, Mr. Thomas served as Executive Chairman (2005-2006) and Chairman and Chief Executive Officer (2000-2005) of IMS Health, Inc. (pharmaceutical and healthcare information solutions). In addition, Mr. Thomas serves as a member of the Board of Directors of Fortune Brands, Inc. (consumer products), and Interpublic Group of Companies, Inc. (marketing communication, 2004-present). |
Michael E. Wiley (60) |
| Year of Election or Appointment: 2008 Mr. Wiley also serves as a Director of Asia Pacific Exploration Consolidated (international oil and gas exploration and production, 2008-present). Mr. Wiley serves as a Director of Tesoro Corporation (independent oil refiner and marketer, 2005-present), and a Director of Bill Barrett Corporation (exploration and production, 2005-present). In addition, Mr. Wiley also serves as a Director of Post Oak Bank (privately-held bank, 2004-present). Previously, Mr. Wiley served as a member of the Board of Trustees of the University of Tulsa (2000-2006; 2007-2010), as a Senior Energy Advisor of Katzenbach Partners, LLC (consulting, 2006-2007), as an Advisory Director of Riverstone Holdings (private investment), Chairman, President, and CEO of Baker Hughes, Inc. (oilfield services, 2000-2004), and as Director of Spinnaker Exploration Company (exploration and production, 2001-2005). |
Annual Report
Trustees and Officers - continued
+ The information above includes each Trustee's principal occupation during the last five years and other information relating to the experience, attributes, and skills relevant to each Trustee's qualifications to serve as a Trustee, which led to the conclusion that each Trustee should serve as a Trustee for the fund.
Advisory Board Member and Executive Officers:
Correspondence intended for each executive officer and Peter S. Lynch may be sent to Fidelity Investments, 82 Devonshire Street, Boston, Massachusetts 02109.
Name, Age; Principal Occupation |
Peter S. Lynch (66) |
| Year of Election or Appointment: 2003 Member of the Advisory Board of Fidelity's Equity and High Income Funds. Mr. Lynch is Vice Chairman and a Director of FMR and FMR Co., Inc. In addition, Mr. Lynch serves as a Trustee of Boston College and as the Chairman of the Inner-City Scholarship Fund. Previously, Mr. Lynch served on the Special Olympics International Board of Directors (1997-2006). |
Kenneth B. Robins (41) |
| Year of Election or Appointment: 2008 President and Treasurer of Fidelity's Equity and High Income Funds. Mr. Robins also serves as President and Treasurer (2010-present) and Assistant Treasurer (2009-present) of other Fidelity funds and is an employee of Fidelity Investments (2004-present). Previously, Mr. Robins served as Deputy Treasurer of the Fidelity funds (2005-2008) and Treasurer and Chief Financial Officer of The North Carolina Capital Management Trust: Cash and Term Portfolios (2006-2008). |
Bruce T. Herring (45) |
| Year of Election or Appointment: 2006 Vice President of certain Equity Funds. Mr. Herring also serves as Chief Investment Officer and Director of Fidelity Management & Research (U.K.) Inc. (2010-present) and Group Chief Investments Officer of FMR. Previously, Mr. Herring served as Vice President (2005-2006) and Senior Vice President (2006-2007) of Fidelity Management & Research Company, Vice President of FMR Co., Inc. (2001-2007) and as a portfolio manager for Fidelity U.S. Equity Funds. |
Brian B. Hogan (46) |
| Year of Election or Appointment: 2009 Vice President of certain Equity Funds and Vice President of Sector Funds. Mr. Hogan also serves as President of FMR's Equity Division (2009-present). Previously, Mr. Hogan served as Senior Vice President, Equity Research of FMR (2006-2009) and as a portfolio manager. |
Scott C. Goebel (42) |
| Year of Election or Appointment: 2008 Secretary and Chief Legal Officer (CLO) of the Fidelity funds. Mr. Goebel also serves as Secretary and CLO of The North Carolina Capital Management Trust: Cash and Term Portfolio (2008-present); General Counsel, Secretary, and Senior Vice President of FMR (2008-present) and FMR Co., Inc. (2008-present); Deputy General Counsel of FMR LLC; Chief Legal Officer of Fidelity Management & Research (Hong Kong) Limited (2008-present) and Assistant Secretary of Fidelity Management & Research (Japan) Inc. (2008-present), Fidelity Investments Money Management, Inc. (2008-present), Fidelity Management & Research (U.K.) Inc. (2008-present), and Fidelity Research and Analysis Company (2008-present). Previously, Mr. Goebel served as Assistant Secretary of the Funds (2007-2008) and as Vice President and Secretary of Fidelity Distributors Corporation (FDC) (2005-2007). |
William C. Coffey (41) |
| Year of Election or Appointment: 2009 Assistant Secretary of Fidelity's Equity and High Income Funds. Mr. Coffey also serves as Senior Vice President and Deputy General Counsel of FMR LLC (2010-present), and is an employee of Fidelity Investments. Previously, Mr. Coffey served as Vice President and Associate General Counsel of FMR LLC (2005-2009). |
Holly C. Laurent (56) |
| Year of Election or Appointment: 2008 Anti-Money Laundering (AML) Officer of the Fidelity funds. Ms. Laurent also serves as AML Officer of The North Carolina Capital Management Trust: Cash and Term Portfolio (2008-present) and is an employee of Fidelity Investments. Previously, Ms. Laurent was Senior Vice President and Head of Legal for Fidelity Business Services India Pvt. Ltd. (2006-
2008), and Senior Vice President, Deputy General Counsel and Group Head for FMR LLC (2005-2006). |
Christine Reynolds (52) |
| Year of Election or Appointment: 2008 Chief Financial Officer of the Fidelity funds. Ms. Reynolds became President of Fidelity Pricing and Cash Management Services (FPCMS) in August 2008. Ms. Reynolds served as Chief Operating Officer of FPCMS (2007-2008). Previously, Ms. Reynolds served as President, Treasurer, and Anti-Money Laundering officer of the Fidelity funds (2004-2007). |
Kenneth A. Rathgeber (63) |
| Year of Election or Appointment: 2004 Chief Compliance Officer of Fidelity's Equity and High Income Funds. Mr. Rathgeber is Chief Compliance Officer of Fidelity Management & Research (Hong Kong) Limited (2008-present), Fidelity Management & Research (Japan) Inc. (2008-present), FMR (2005-present), FMR Co., Inc. (2005-present), Fidelity Management & Research (U.K.) Inc. (2005-present), Fidelity Research & Analysis Company (2005-present), Fidelity Investments Money Management, Inc. (2005-present), Pyramis Global Advisors, LLC (2005-present), and Strategic Advisers, Inc. (2005-present). |
Jeffrey S. Christian (49) |
| Year of Election or Appointment: 2009 Deputy Treasurer of the Fidelity funds. Mr. Christian is an employee of Fidelity Investments. Previously, Mr. Christian served as Chief Financial Officer (2008-2009) of certain Fidelity funds and Senior Vice President of Fidelity Pricing and Cash Management Services (FPCMS) (2004-2009). |
Bryan A. Mehrmann (49) |
| Year of Election or Appointment: 2005 Deputy Treasurer of the Fidelity funds. Mr. Mehrmann is an employee of Fidelity Investments. |
Adrien E. Deberghes (43) |
| Year of Election or Appointment: 2008 Deputy Treasurer of Fidelity's Equity and High Income Funds. Mr. Deberghes also serves as Assistant Treasurer of other Fidelity funds (2010-present) and is an employee of Fidelity Investments (2008-
present). Previously, Mr. Deberghes served as Senior Vice President of Mutual Fund Administration at State Street Corporation (2007-2008), Senior Director of Mutual Fund Administration at Investors Bank & Trust (2005-2007), and Director of Finance for Dunkin' Brands (2000-2005). |
Stephanie J. Dorsey (41) |
| Year of Election or Appointment: 2010 Assistant Treasurer of Fidelity's Equity and High Income Funds. Ms. Dorsey also serves as Deputy Treasurer of other Fidelity funds (2008-
present) and is an employee of Fidelity Investments (2008-present). Previously, Ms. Dorsey served as Treasurer (2004-2008) of the JPMorgan Mutual Funds and Vice President (2004-2008) of JPMorgan Chase Bank. |
Name, Age; Principal Occupation |
John R. Hebble (52) |
| Year of Election or Appointment: 2009 Assistant Treasurer of Fidelity's Equity and High Income Funds. Mr. Hebble also serves as Treasurer and Chief Financial Officer of The North Carolina Capital Management Trust: Cash and Term Portfolio (2008-present), President and Treasurer of other Fidelity funds (2008-present) and is an employee of Fidelity Investments. |
Gary W. Ryan (52) |
| Year of Election or Appointment: 2005 Assistant Treasurer of the Fidelity funds. Mr. Ryan is an employee of Fidelity Investments. Previously, Mr. Ryan served as Vice President of Fund Reporting in Fidelity Pricing and Cash Management Services (FPCMS) (1999-2005). |
Jonathan Davis (42) |
| Year of Election or Appointment: 2010 Assistant Treasurer of the Fidelity funds. Mr. Davis is an employee of Fidelity Investments. Previously, Mr. Davis served as Vice President and Associate General Counsel of FMR LLC (2003-2010). |
Annual Report
The Board of Trustees of Advisor Diversified International Fund voted to pay to shareholders of record at the opening of business on record date, the following distributions per share derived from capital gains realized from sales of portfolio securities, and dividends derived from net investment income:
| Pay Date | Record Date | Dividends | Capital Gains |
Class A | 12/06/10 | 12/03/10 | $0.141 | $0.034 |
Class T | 12/06/10 | 12/03/10 | $0.106 | $0.034 |
Class B | 12/06/10 | 12/03/10 | $0.042 | $0.034 |
Class C | 12/06/10 | 12/03/10 | $0.049 | $0.034 |
Class A, Class T, Class B, and Class C designate 100%, of each dividend distributed in December 2009, as amounts which may be taken into account as a dividend for purposes of the maximum rate under section 1(h)(11) of the Internal Revenue Code.
The amounts per share which represent income derived from sources within, and taxes paid to, foreign countries or possessions of the United States are as follows:
| Pay Date | Income | Taxes |
Class A | 12/07/09 | $0.231 | $0.0282 |
Class T | 12/07/09 | $0.196 | $0.0282 |
Class B | 12/07/09 | $0.131 | $0.0282 |
Class C | 12/07/09 | $0.133 | $0.0282 |
The fund will notify shareholders in January 2011 of amounts for use in preparing 2010 income tax returns.
Annual Report
Board Approval of Investment Advisory Contracts and Management Fees
Fidelity Advisor Diversified International Fund
Each year, the Board of Trustees, including the Independent Trustees (together, the Board), votes on the renewal of the management contract and sub-advisory agreements (together, the Advisory Contracts) for the fund. The Board, assisted by the advice of fund counsel and Independent Trustees' counsel, requests and considers a broad range of information relevant to the renewal of the Advisory Contracts throughout the year.
The Board meets regularly and considers at each of its meetings factors that are relevant to its annual consideration of the renewal of the fund's Advisory Contracts, including the services and support provided to the fund and its shareholders. The Board has established various standing committees, each composed of Independent Trustees with varying backgrounds, to which the Board has assigned specific subject matter responsibilities in order to enhance effective decision-making by the Board. The Board, acting directly and through its Committees, requests and receives information concerning the annual consideration of the renewal of the fund's Advisory Contracts. The Board also meets as needed to consider matters specifically related to the Board's annual consideration of the renewal of Advisory Contracts. Members of the Board may also meet with trustees of other Fidelity funds through ad hoc joint committees to discuss certain matters relevant to the Fidelity funds.
At its July 2010 meeting, the Board of Trustees, including the Independent Trustees, unanimously determined to renew the fund's Advisory Contracts. In reaching its determination, the Board considered all factors it believed relevant, including (i) the nature, extent, and quality of the services to be provided to the fund and its shareholders (including the investment performance of the fund); (ii) the competitiveness of the fund's management fee and total expenses; (iii) the total costs of the services to be provided by and the profits to be realized by Fidelity from its relationship with the fund; (iv) the extent to which economies of scale would be realized as the fund grows; and (v) whether fee levels reflect these economies of scale, if any, for the benefit of fund shareholders.
In considering whether to renew the Advisory Contracts for the fund, the Board reached a determination, with the assistance of fund counsel and Independent Trustees' counsel and through the exercise of its business judgment, that the renewal of the Advisory Contracts is in the best interests of fund shareholders and that the compensation to be received by Fidelity under the management contract is fair and reasonable. The Board's decision to renew the Advisory Contracts was not based on any single factor noted above, but rather was based on a comprehensive consideration of all the information provided to the Board at its meetings throughout the year. The Board, in reaching its determination to renew the Advisory Contracts, is aware that shareholders in the fund have a broad range of investment choices available to them, including a wide choice among mutual funds offered by Fidelity's competitors, and that the fund's shareholders, with the opportunity to review and weigh the disclosure provided by the fund in its prospectus and other public disclosures, have chosen to invest in this fund, managed by Fidelity.
Annual Report
Board Approval of Investment Advisory Contracts and
Management Fees - continued
Nature, Extent, and Quality of Services Provided. The Board considered the staffing within the investment adviser, FMR, and the sub-advisers (together, the Investment Advisers), including the backgrounds of the fund's investment personnel and the fund's investment objective and discipline. The Independent Trustees also had discussions with senior management of Fidelity's investment operations and investment groups. The Board considered the structure of the portfolio manager compensation program and whether this structure provides appropriate incentives to act in the best interest of the fund.
Resources Dedicated to Investment Management and Support Services. The Board and the equity research subcommittee of the Board's Fund Oversight Committee reviewed the size, education, and experience of the Investment Advisers' investment staff, their use of technology, and the Investment Advisers' approach to recruiting, training, and retaining portfolio managers and other research, advisory, and management personnel. The Board noted that Fidelity's analysts have access to a variety of technological tools and market and securities data that enable them to perform both fundamental and quantitative analysis and to specialize in various disciplines. The Board considered Fidelity's extensive global research capabilities that enable the Investment Advisers to aggregate data from various sources in an effort to produce positive investment results. The Board also considered that Fidelity's portfolio managers and analysts have access to daily portfolio attribution that allows for monitoring of a fund's portfolio, as well as an electronic communication system that provides immediate real-time access to research concerning issuers and credit enhancers. The Board noted FMR's continued focus on strengthening the organization and discipline of equity portfolio management and research.
Shareholder and Administrative Services. The Board considered (i) the nature, extent, quality, and cost of advisory, administrative, and shareholder services performed by the Investment Advisers and their affiliates under the Advisory Contracts and under separate agreements covering transfer agency, pricing and bookkeeping, and securities lending services for the fund; (ii) the nature and extent of the investment adviser's supervision of third party service providers, principally custodians and subcustodians; and (iii) the resources devoted to, and the record of compliance with, the fund's compliance policies and procedures. The Board also reviewed the allocation of fund brokerage, including allocations to brokers affiliated with the Investment Advisers, the use of brokerage commissions to pay fund expenses, and the use of "soft" commission dollars to pay for research services.
The Board noted that the growth of fund assets over time across the complex allows Fidelity to reinvest in the development of services designed to enhance the value or convenience of the Fidelity funds as investment vehicles. These services include 24-hour access to account information and market information through phone representatives and over the Internet, and investor education materials and asset allocation tools.
Annual Report
Investment in a Large Fund Family. The Board considered the benefits to shareholders of investing in a Fidelity fund, including the benefits of investing in a fund that is part of a large family of funds offering a variety of investment disciplines and providing a large variety of mutual fund investor services. The Board noted that Fidelity had taken, or had made recommendations that resulted in the Fidelity funds taking, a number of actions over the previous year that benefited particular funds, including (i) dedicating additional resources to investment research and restructuring and broadening the focus of the investment research teams; (ii) bolstering the senior management team that oversees asset management; (iii) launching Class F of certain funds as a lower-fee class available to Freedom K and Freedom Index Funds; (iv) lowering the initial investment minimums and ongoing balance requirements for Real Estate High Income Fund; (v) eliminating subsequent purchase minimums for all funds and adding a waiver of the investment minimum requirement for new accounts opened with the proceeds of a systematic withdrawal plan; (vi) eliminating the withdrawal minimum and maximum limits for systematic withdrawals from Advisor funds; (vii) expanding sales load waivers on Class A shares for Destiny Planholders and expanding Institutional Class eligibility for Class O Destiny Planholders; and (viii) changing certain Class A and Class T sales charge structures to further align them with industry practices.
Investment Performance. The Board considered whether the fund has operated in accordance with its investment objective, as well as its record of compliance with its investment restrictions. It also reviewed the fund's absolute investment performance for each class, as well as the fund's relative investment performance for each class measured over multiple periods against (i) a broad-based securities market index, and (ii) a peer group of mutual funds deemed appropriate by Fidelity and reviewed by the Board. The following charts considered by the Board show, over the one-, three-, and five-year periods ended December 31, 2009, the cumulative total returns of Institutional Class (Class I) and Class B of the fund, the cumulative total returns of a broad-based securities market index ("benchmark"), and a range of cumulative total returns of a peer group of mutual funds identified by Morningstar, Inc. as having an investment style similar to that of the fund based on underlying portfolio holdings. The returns of Institutional Class (Class I) and Class B show the performance of the highest and lowest performing classes, respectively (based on five-year performance). The box within each chart shows the 25th percentile return (bottom of box) and the 75th percentile return (top of box) of the peer group. Returns shown above the box are in the first quartile and returns shown below the box are in the fourth quartile. The percentage beaten numbers noted below each chart correspond to the percentile box and represent the percentage of funds in the peer group whose performance was equal to or lower than that of the class indicated.
Annual Report
Board Approval of Investment Advisory Contracts and
Management Fees - continued
Fidelity Advisor Diversified International Fund
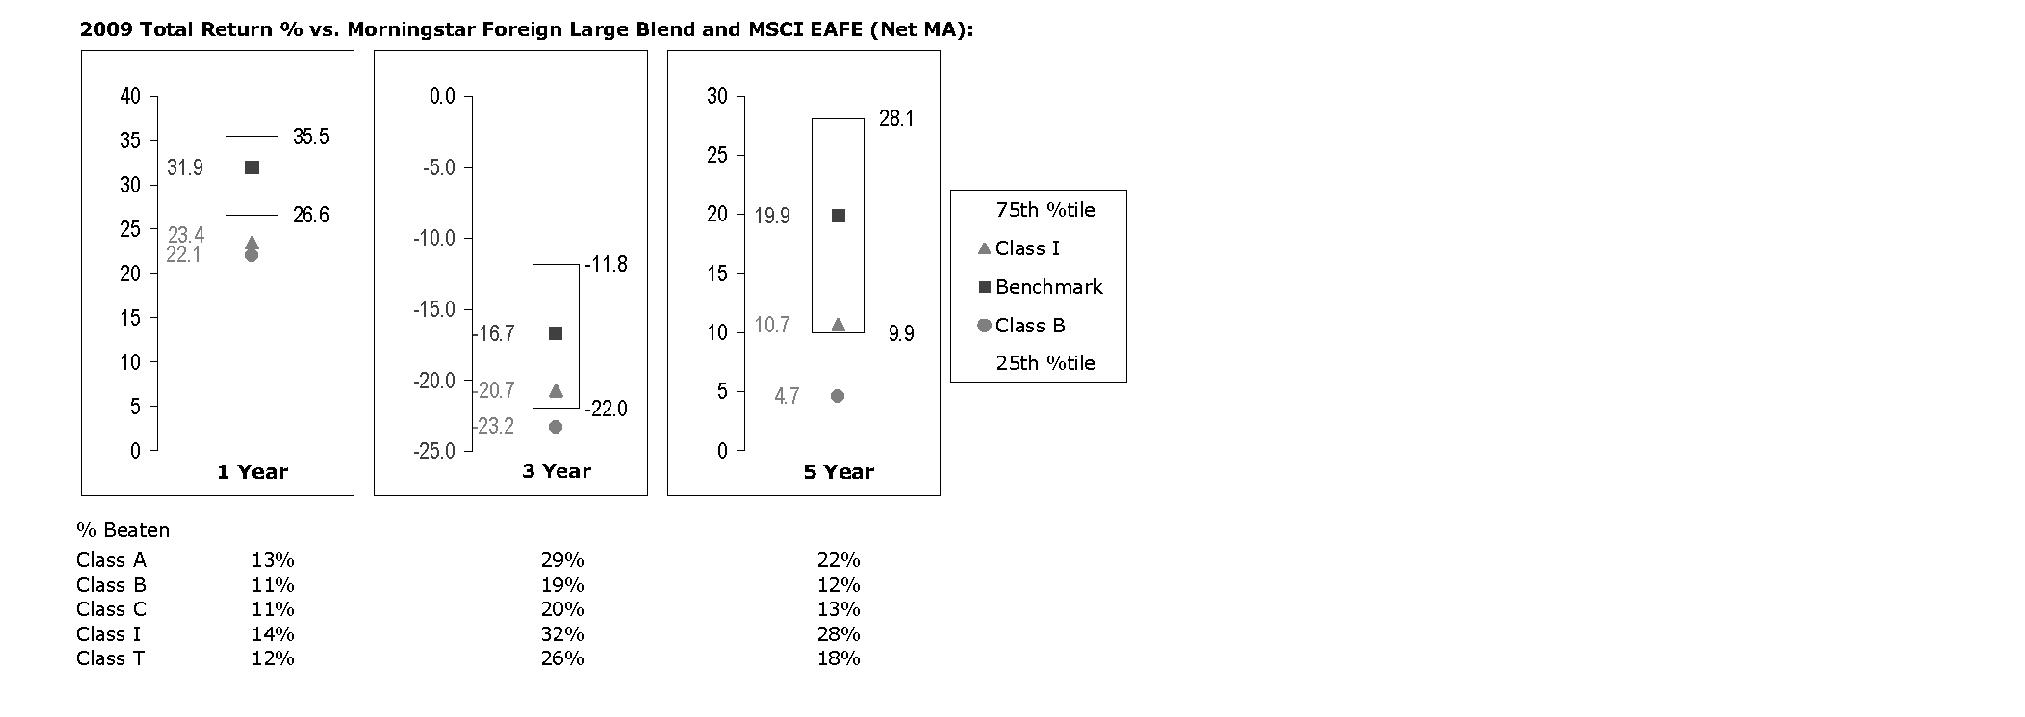
The Board reviewed the fund's relative investment performance against its peer group and noted that the performance of Institutional Class (Class I) of the fund was in the fourth quartile for the one-year period and the third quartile for the three- and five-year periods. The Board also noted that the investment performance of the fund was lower than its benchmark for all the periods shown. The Board considered that the variations in performance among the fund's classes reflect the variations in class expenses, which result in lower performance for higher expense classes. The Board discussed with FMR actions that have been taken by FMR to improve the fund's disappointing performance relative to its peer group and benchmark. The Board also reviewed the fund's performance since inception as well as performance in the current year. The Board will continue to closely monitor the performance of the fund in the coming year and discuss with FMR other appropriate actions to address the performance of the fund.
Based on its review, and giving particular weight to the nature and quality of the resources dedicated by the Investment Advisers to maintain and improve relative performance and factoring in the unprecedented market events in recent years, the Board concluded that the nature, extent, and quality of investment management and support services and of shareholder and administrative services provided to the fund will benefit the fund's shareholders, particularly in light of the Board's view that the fund's shareholders benefit from investing in a fund that is part of a large family of funds offering a variety of investment disciplines and services.
Competitiveness of Management Fee and Total Fund Expenses. The Board considered the fund's management fee and total expenses compared to "mapped groups" of competitive funds and classes. Fidelity creates "mapped groups" by combining similar Lipper investment objective categories that have comparable management fee characteristics. Combining Lipper investment objective categories aids the Board's management fee and total expense comparisons by broadening the competitive group used for comparison and by reducing the number of universes to which various Fidelity funds are compared.
Annual Report
Management Fee. The Board considered two proprietary management fee comparisons for the 12-month periods shown in the chart below. The group of Lipper funds used by the Board for management fee comparisons is referred to below as the "Total Mapped Group." The Total Mapped Group comparison focuses on a fund's standing relative to the total universe of comparable funds available to investors, in terms of gross management fees before expense reimbursements or caps. "TMG %" represents the percentage of funds in the Total Mapped Group that had management fees that were lower than the fund's. For example, a TMG % of 15% means that 85% of the funds in the Total Mapped Group had higher management fees than the fund. The "Asset-Size Peer Group" (ASPG) comparison focuses on a fund's standing relative to non-Fidelity funds similar in size to the fund within the Total Mapped Group. The ASPG represents at least 15% of the funds in the Total Mapped Group with comparable asset size and management fee characteristics, subject to a minimum of 50 funds (or all funds in the Total Mapped Group if fewer than 50). Additional information, such as the ASPG quartile in which the fund's management fee ranked, is also included in the chart and considered by the Board.
Fidelity Advisor Diversified International Fund
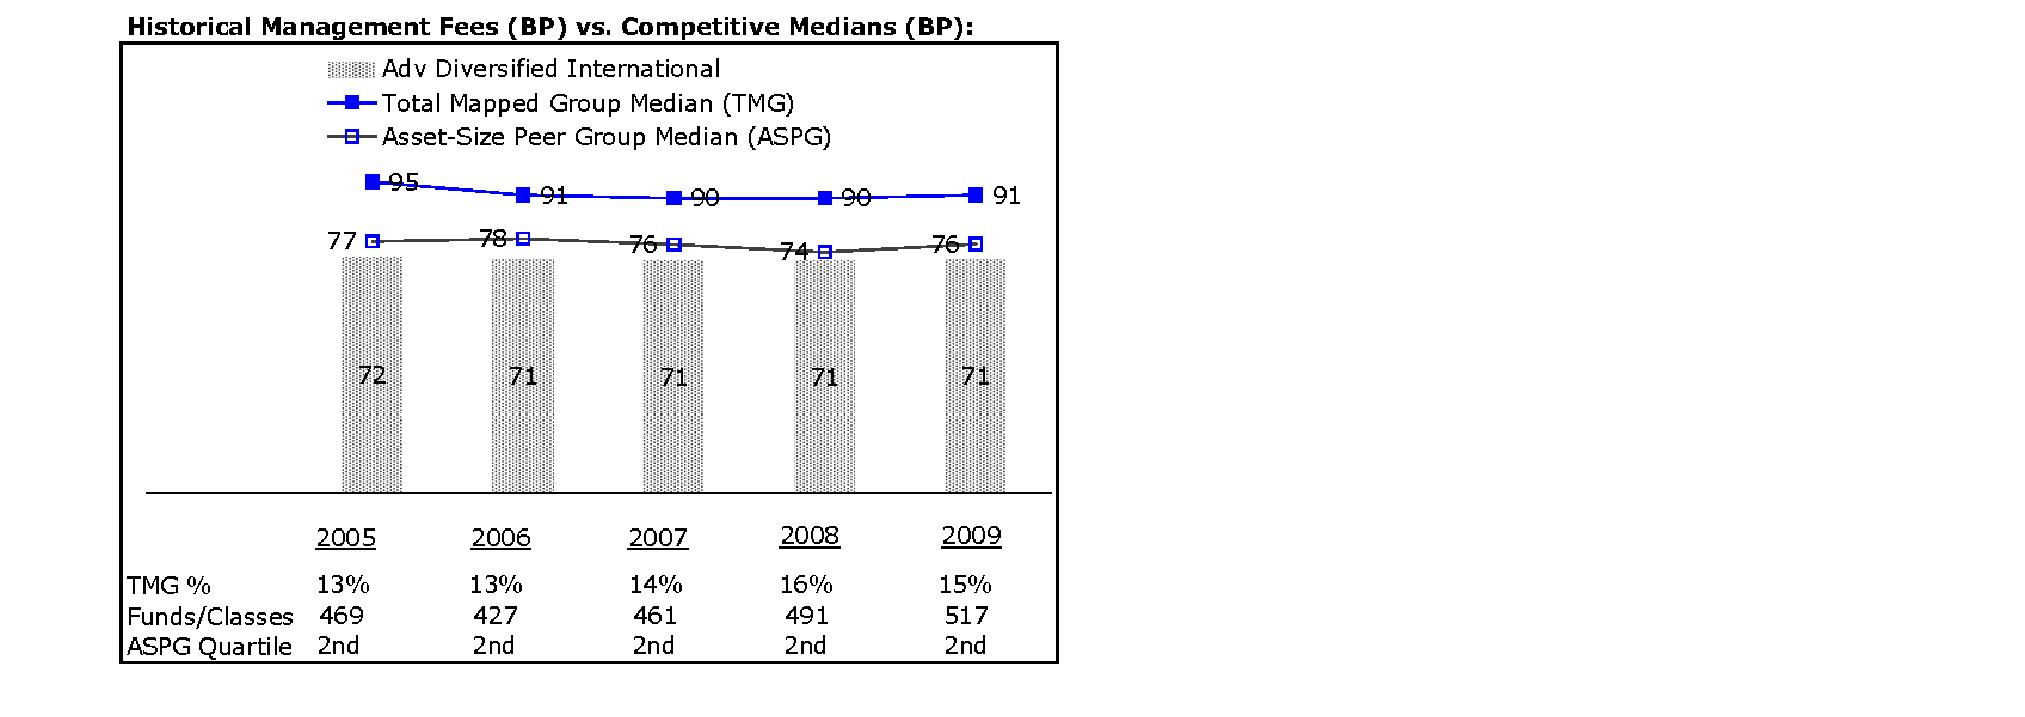
Annual Report
Board Approval of Investment Advisory Contracts and
Management Fees - continued
The Board noted that the fund's management fee ranked below the median of its Total Mapped Group and below the median of its ASPG for 2009.
Based on its review, the Board concluded that the fund's management fee is fair and reasonable in light of the services that the fund receives and the other factors considered.
Total Expenses. In its review of each class's total expenses, the Board considered the fund's management fee as well as other fund or class expenses, as applicable, such as transfer agent fees, pricing and bookkeeping fees, fund-paid 12b-1 fees, and custodial, legal, and audit fees. The Board also noted the effects of any waivers and reimbursements on fees and expenses. As part of its review, the Board also considered current and historical total expenses of each class of the fund compared to competitive fund median expenses. Each class of the fund is compared to those funds and classes in the Total Mapped Group (used by the Board for management fee comparisons) that have a similar sales load structure.
The Board noted that the total expenses of each of Class A, Class B, Class C, and Institutional Class ranked below its competitive median for 2009 and the total expenses of Class T ranked above its competitive median for 2009. The Board considered that the total expenses for Class T were above the median primarily because its 12b-1 fee is higher than the typical front-end load class. The Board noted that the fund offers multiple classes, each of which has a different sales load and 12b-1 fee structure, and that the multiple structures are intended to offer a range of pricing options for the intermediary market. The Board also noted that the total expenses of the classes vary primarily by the level of their 12b-1 fees, although differences in transfer agent fees may also cause expenses to vary from class to class.
Fees Charged to Other Fidelity Clients. The Board also considered Fidelity fee structures and other information with respect to clients of FMR and its affiliates, such as other mutual funds advised or subadvised by FMR or its affiliates, pension plan clients, and other institutional clients. In March 2010, the Board created an ad hoc joint committee with the board of other Fidelity funds (the Committee) to review and compare Fidelity's institutional investment advisory business with its business of providing services to the Fidelity funds, including the differences in services provided, fees charged, and costs incurred, as well as competition in their respective marketplaces.
Based on its review of total expenses and fees charged to other Fidelity clients, the Board concluded that the total expenses of each class of the fund were reasonable, although in one case above the median of the universe presented for comparison, in light of the services that the fund and its shareholders receive and the other factors considered, including the findings of the Committee.
Annual Report
Costs of the Services and Profitability. The Board considered the revenues earned and the expenses incurred by Fidelity in conducting the business of developing, marketing, distributing, managing, administering and servicing the fund and its shareholders. The Board also considered the level of Fidelity's profits in respect of all the Fidelity funds.
On an annual basis, FMR presents to the Board Fidelity's profitability for the fund. Fidelity calculates the profitability for each fund, as well as aggregate profitability for groups of Fidelity funds and all Fidelity funds, using a series of detailed revenue and cost allocation methodologies which originate with the audited books and records of Fidelity. The Audit Committee of the Board reviews any significant changes from the prior year's methodologies.
PricewaterhouseCoopers LLP (PwC), independent registered public accounting firm and auditor to Fidelity and certain Fidelity funds, has been engaged annually by the Board as part of the Board's assessment of Fidelity's profitability analysis. PwC's engagement includes the review and assessment of Fidelity's methodologies used in determining the revenues and expenses attributable to Fidelity's mutual fund business, and completion of agreed-upon procedures surrounding the mathematical accuracy of fund profitability and its conformity to allocation methodologies. After considering PwC's reports issued under the engagement and information provided by Fidelity, the Board believes that while other allocation methods may also be reasonable, Fidelity's profitability methodologies are reasonable in all material respects.
The Board has also reviewed Fidelity's non-fund businesses and fall-out benefits related to the mutual fund business as well as cases where Fidelity's affiliates may benefit from or be related to the fund's business.
The Board considered the costs of the services provided by and the profits realized by Fidelity in connection with the operation of the fund and were satisfied that the profitability was not excessive in the circumstances.
Economies of Scale. The Board considered whether there have been economies of scale in respect of the management of the Fidelity funds, whether the Fidelity funds (including the fund) have appropriately benefited from any such economies of scale, and whether there is potential for realization of any further economies of scale. The Board considered the extent to which the fund will benefit from economies of scale through increased services to the fund, through waivers or reimbursements, or through fee or expense reductions.
In February 2009, the Board and the board of other Fidelity funds created an ad hoc committee (the Economies of Scale Committee) to analyze whether FMR attains economies of scale in respect of the management and servicing of the Fidelity funds, whether the Fidelity funds have appropriately benefited from such economies of scale, and whether there is potential for realization of any further economies of scale.
Annual Report
Board Approval of Investment Advisory Contracts and
Management Fees - continued
The Board recognized that the fund's management contract incorporates a "group fee" structure, which provides for lower group fee rates as total fund assets under FMR's management increase, and for higher group fee rates as total fund assets under FMR's management decrease. FMR calculates the group fee rates based on a tiered asset "breakpoint" schedule that varies based on asset class. The Board considered that the group fee is designed to deliver the benefits of economies of scale to fund shareholders when total Fidelity fund assets increase, even if assets of any particular fund are unchanged or have declined, because some portion of Fidelity's costs are attributable to services provided to all Fidelity funds, and all funds benefit if those costs can be allocated among more assets. The Board concluded that, given the group fee structure, fund shareholders will benefit from lower management fees as assets under FMR's management increase at the fund complex level, regardless of whether Fidelity achieves any such economies of scale.
The Board concluded, considering the findings of the Economies of Scale Committee, that any potential economies of scale are being appropriately shared between fund shareholders and Fidelity.
Additional Information Requested by the Board. In order to develop fully the factual basis for consideration of the Fidelity funds' Advisory Contracts, the Board requested and received additional information on certain topics, including (i) fund performance trends, actions to be taken by FMR to improve certain funds' overall performance, and Fidelity's long-term strategies for certain funds; (ii) portfolio manager changes that have occurred during the past year and length of portfolio manager tenure for different categories of funds over time; (iii) Fidelity's compensation structure for portfolio managers, research analysts, and other key personnel, the rationale for the compensation structure, and how the compensation structure provides appropriate performance incentives; (iv) the amount of the investment that each portfolio manager has made in the Fidelity fund(s) that he or she manages; (v) management and other fees paid by FMR to affiliated sub-advisers on behalf of the Fidelity funds; (vi) Fidelity's fee structures and rationale for recommending different fees among different categories of funds; (vii) Fidelity's rationale for recommending which funds should have a performance adjustment component as part of their management fees; (viii) the rationale for any differences between fund fee structures and fee structures in place for other Fidelity clients; and (ix) explanations regarding the relative total expenses borne by certain funds and classes, total expense competitive trends, and actions that might be taken by FMR to reduce total expenses for certain funds and classes.
Annual Report
Based on its evaluation of all of the conclusions noted above, and after considering all factors it believed relevant, the Board ultimately concluded that the advisory fee structures are fair and reasonable, and that the fund's Advisory Contracts should be renewed.
Annual Report
Investment Adviser
Fidelity Management & Research Company
Boston, MA
Investment Sub-Advisers
FMR Co., Inc.
Fidelity Management & Research
(U.K.) Inc.
Fidelity Research & Analysis Company
FIL Investment Advisors
FIL Investments (Japan) Limited
FIL Investment Advisors (U.K.) Ltd.
Fidelity Management & Research
Company (Hong Kong) Limited
Fidelity Management & Research
Company (Japan) Inc.
General Distributor
Fidelity Distributors Corporation
Boston, MA
Transfer and Service Agents
Fidelity Investments Institutional Operations Company, Inc.
Boston, MA
Fidelity Service Company, Inc.
Boston, MA
Custodian
State Street Bank and Trust Company
Quincy, MA
ADIF-UANN-1210
1.784735.107

(Fidelity Investment logo)(registered trademark)
Fidelity Advisor SM
Diversified International
Fund - Institutional Class
Annual Report
October 31, 2010
(2_fidelity_logos) (Registered_Trademark)
Contents
Chairman's Message | <Click Here> | The Chairman's message to shareholders. |
Performance | <Click Here> | How the fund has done over time. |
Management's Discussion of Fund Performance | <Click Here> | The Portfolio Manager's review of fund performance and strategy. |
Shareholder Expense Example | <Click Here> | An example of shareholder expenses. |
Investment Changes | <Click Here> | A summary of major shifts in the fund's investments over the past six months. |
Investments | <Click Here> | A complete list of the fund's investments with their market values. |
Financial Statements | <Click Here> | Statements of assets and liabilities, operations, and changes in net assets, as well as financial highlights. |
Notes | <Click Here> | Notes to the financial statements. |
Report of Independent Registered Public Accounting Firm | <Click Here> | |
Trustees and Officers | <Click Here> | |
Distributions | <Click Here> | |
Board Approval of Investment Advisory Contracts and Management Fees | <Click Here> | |
To view a fund's proxy voting guidelines and proxy voting record for the 12-month period ended June 30, visit http://www.fidelity.com/proxyvotingresults or visit the Securities and Exchange Commission's (SEC) web site at http://www.sec.gov. You may also call 1-877-208-0098 to request a free copy of the proxy voting guidelines.
Standard & Poor's, S&P and S&P 500 are registered service marks of The McGraw-Hill Companies, Inc. and have been licensed for use by Fidelity Distributors Corporation.
Other third party marks appearing herein are the property of their respective owners.
All other marks appearing herein are registered or unregistered trademarks or service marks of FMR LLC or an affiliated company.
Annual Report
This report and the financial statements contained herein are submitted for the general information of the shareholders of the fund. This report is not authorized for distribution to prospective investors in the fund unless preceded or accompanied by an effective prospectus.
A fund files its complete schedule of portfolio holdings with the SEC for the first and third quarters of each fiscal year on Form N-Q. Forms N-Q are available on the SEC's web site at http://www.sec.gov. A fund's Forms N-Q may be reviewed and copied at the SEC's Public Reference Room in Washington, DC. Information regarding the operation of the SEC's Public Reference Room may be obtained by calling 1-800-SEC-0330. For a complete list of a fund's portfolio holdings, view the most recent holdings listing, semiannual report, or annual report on Fidelity's web site at http://www.fidelity.com or http://www.advisor.fidelity.com, as applicable.
NOT FDIC INSURED • MAY LOSE VALUE • NO BANK GUARANTEE
Neither the fund nor Fidelity Distributors Corporation is a bank.
Annual Report
(photo_of_Edward_C_Johnson_3d)
Dear Shareholder:
Equities have staged a rally in the second half of 2010, shaking off concerns about the European debt crisis and the possibility of a double-dip recession in the U.S. Although the short-term surge pushed major equity indexes back into positive territory for the year, several questions remain about the longer-term outlook, including lackluster economic growth and persistently high unemployment. Financial markets are always unpredictable, of course, but there also are several time-tested investment principles that can help put the odds in your favor.
One of the basic tenets is to invest for the long term. Over time, riding out the markets' inevitable ups and downs has proven much more effective than selling into panic or chasing the hottest trend. Even missing only a few of the markets' best days can significantly diminish investor returns. Patience also affords the benefits of compounding - of earning interest on additional income or reinvested dividends and capital gains. There can be tax advantages and cost benefits to consider as well. While staying the course doesn't eliminate risk, it can considerably lessen the effect of short-term declines.
You can further manage your investing risk through diversification. And today, more than ever, geographic diversification should be taken into account. Studies indicate that asset allocation is the single most important determinant of a portfolio's long-term success. The right mix of stocks, bonds and cash - aligned to your particular risk tolerance and investment objective - is very important. Age-appropriate rebalancing is also an essential aspect of asset allocation. For younger investors, an emphasis on equities - which historically have been the best-performing asset class over time - is encouraged. As investors near their specific goal, such as retirement or sending a child to college, consideration may be given to replacing volatile assets (e.g. common stocks) with more-stable fixed investments (bonds or savings plans).
A third principle - investing regularly - can help lower the average cost of your purchases. Investing a certain amount of money each month or quarter helps ensure you won't pay for all your shares at market highs. This strategy - known as dollar cost averaging - also reduces "emotion" from investing, helping shareholders avoid selling weak performers just prior to an upswing, or chasing a hot performer just before a correction.
We invite you to contact us via the Internet, through our Investor Centers or by phone. It is our privilege to provide you the information you need to make the investments that are right for you.
Sincerely,
(The chairman's signature appears here.)
Edward C. Johnson 3d
Annual Report
Average annual total return reflects the change in the value of an investment, assuming reinvestment of the class' distributions from dividend income and capital gains (the profits earned upon the sale of securities that have grown in value, if any) and assuming a constant rate of performance each year. The $10,000 table and the fund's returns do not reflect the deduction of taxes that a shareholder would pay on fund distributions or the redemption of fund shares. During periods of reimbursement by Fidelity, a fund's total return will be greater than it would be had the reimbursement not occurred. How a fund did yesterday is no guarantee of how it will do tomorrow.
Average Annual Total Returns
Periods ended October 31, 2010 | Past 1
year | Past 5
years | Past 10
years |
Institutional Class | 11.55% | 1.46% | 4.74% |
$10,000 Over Past 10 Years
Let's say hypothetically that $10,000 was invested in Fidelity AdvisorSM Diversified International Fund - Institutional Class on October 31, 2000. The chart shows how the value of your investment would have changed, and also shows how the MSCI ® EAFE® (Europe, Australia, Far East) Index performed over the same period.
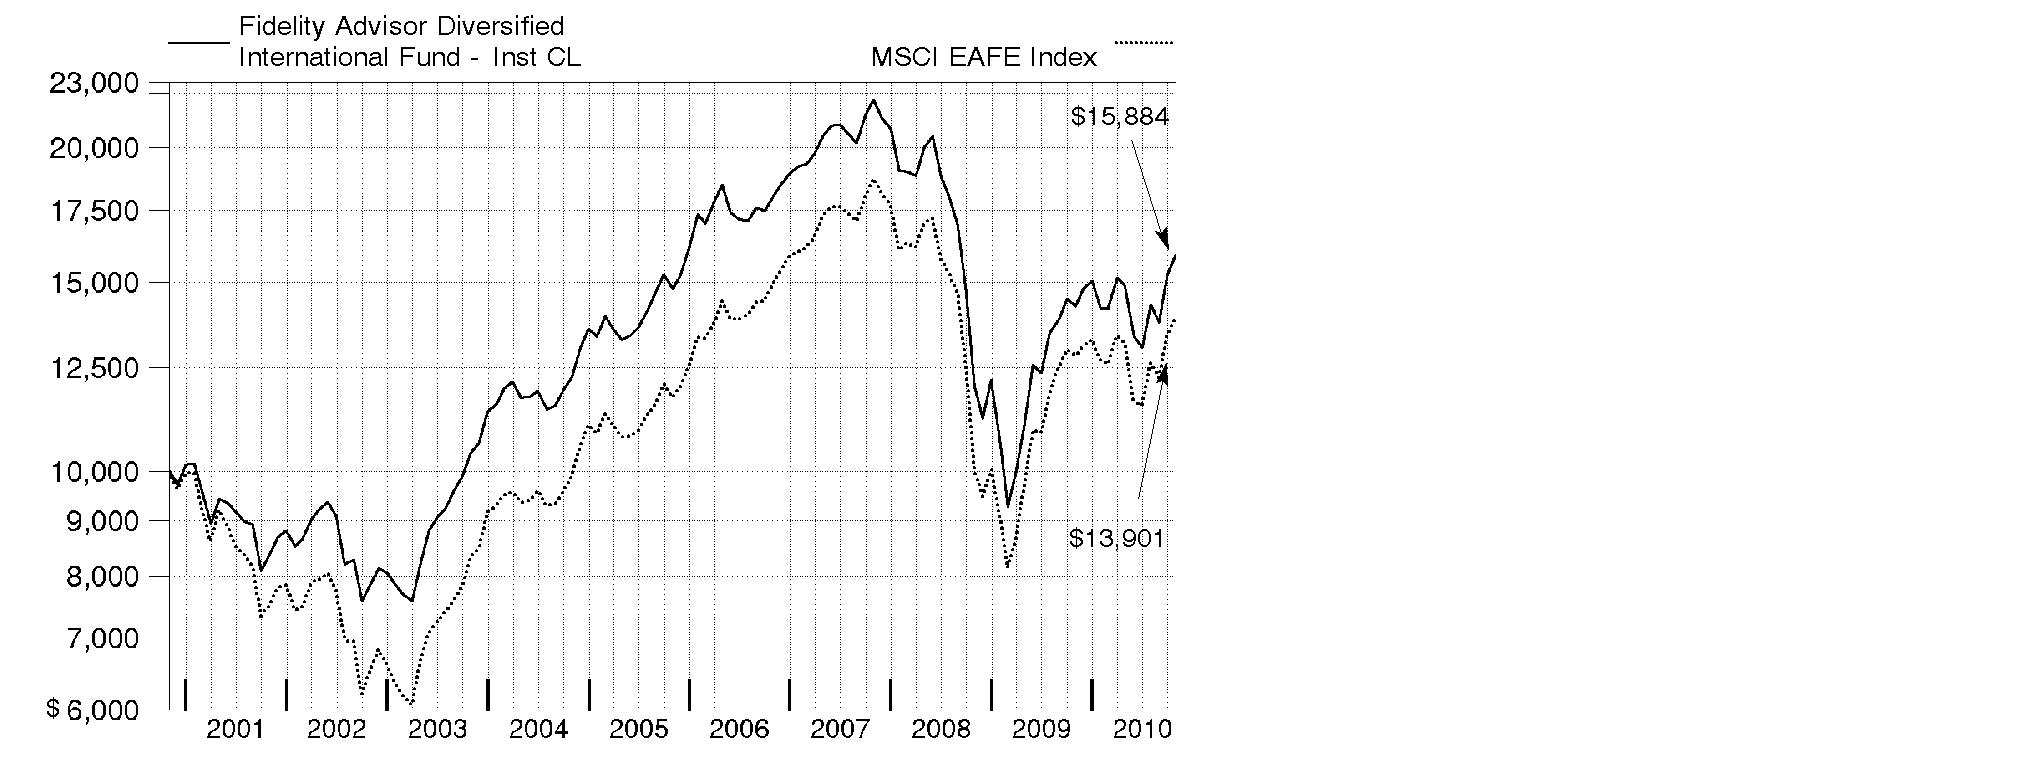
Annual Report
Market Recap: International stocks rode a wave of volatility similar to that of their U.S. counterparts during the 12 months ending October 31, 2010. Stocks gained modestly in the first half of the period, despite growing concerns about the European debt crisis. Sentiment turned decidedly negative in May and June, however, and the market suffered a precipitous decline. These losses were more than offset during the last four months of the period, when signs of economic growth and subsiding debt fears helped propel international stocks about 21%. For the full year, the MSCI® ACWI® (All Country World Index) ex USA Index gained 12.76%, boosted in part by a generally depreciating U.S. dollar. Within the index, Canada and emerging markets were standouts, returning 23% and 24%, respectively. Results in the latter group were led by strong-performing India, Mexico and South Africa, while China fell short of the MSCI benchmark due to cooling economic growth. The developed Asia ex Japan segment rose 16% for the period, lifted by solid results from Singapore and Hong Kong. Meanwhile, Europe rose just 9%, held back mainly by debt-riddled Spain and Italy, as well as lagging major constituent France. Japan returned only 5%, a result of that nation's continued weak economy.
Comments from William Bower, Portfolio Manager of Fidelity AdvisorSM Diversified International Fund: For the year, the fund's Institutional Class shares gained 11.55%, outperforming the 8.49% return of the MSCI® EAFE® (Europe, Australasia, Far East) Index. The fund was helped most by strong security selection in the consumer discretionary, materials, health care, technology and financials groups. In terms of countries, my picks in Germany were particularly productive, while underweighting Japan and overweighting China also aided results. Individual investments that contributed included Danish pharmaceutical company Novo Nordisk, German automakers Volkswagen - not held at period end - and BMW, two out-of-benchmark positions - Chinese Internet search provider Baidu and Taiwanese smart phone manufacturer HTC - German medical equipment company Fresenius and French holding company PPR. Conversely, underweighting industrials hurt, as did overweighting energy. Geographically, unfavorable stock selection in the United Kingdom and China curtailed results. At the issuer level, detractors included energy companies Transocean - - not part of the benchmark - and BP, Spanish telecommunications company Telefonica, an out-of-benchmark investment in Canadian energy firm Petrobank Energy & Resources and French insurance company AXA.
The views expressed above reflect those of the portfolio manager(s) only through the end of the period as stated on the cover of this report and do not necessarily represent the views of Fidelity or any other person in the Fidelity organization. Any such views are subject to change at any time based upon market or other conditions and Fidelity disclaims any responsibility to update such views. These views may not be relied on as investment advice and, because investment decisions for a Fidelity fund are based on numerous factors, may not be relied on as an indication of trading intent on behalf of any Fidelity fund.
Annual Report
Shareholder Expense Example
As a shareholder of the Fund, you incur two types of costs: (1) transaction costs, including sales charges (loads) on purchase payments or redemption proceeds, redemption fees, and (2) ongoing costs, including management fees, distribution and/or service (12b-1) fees and other Fund expenses. This Example is intended to help you understand your ongoing costs (in dollars) of investing in the Fund and to compare these costs with the ongoing costs of investing in other mutual funds.
The Example is based on an investment of $1,000 invested at the beginning of the period and held for the entire period (May 1, 2010 to October 31, 2010).
Actual Expenses
The first line of the accompanying table for each class of the Fund provides information about actual account values and actual expenses. You may use the information in this line, together with the amount you invested, to estimate the expenses that you paid over the period. Simply divide your account value by $1,000.00 (for example, an $8,600 account value divided by $1,000.00 = 8.6), then multiply the result by the number in the first line for a class of the Fund under the heading entitled "Expenses Paid During Period" to estimate the expenses you paid on your account during this period. In addition, the Fund, as a shareholder in the underlying Fidelity Central Funds, will indirectly bear its pro-rata share of the fees and expenses incurred by the underlying Fidelity Central Funds. These fees and expenses are not included in the Fund's annualized expense ratio used to calculate the expense estimate in the table below.
Hypothetical Example for Comparison Purposes
The second line of the accompanying table for each class of the Fund provides information about hypothetical account values and hypothetical expenses based on a Class' actual expense ratio and an assumed rate of return of 5% per year before expenses, which is not the Class' actual return. The hypothetical account values and expenses may not be used to estimate the actual ending account balance or expenses you paid for the period. You may use this information to compare the ongoing costs of investing in the Fund and other funds. To do so, compare this 5% hypothetical example with the 5% hypothetical examples that appear in the shareholder reports of the other funds. In addition, the Fund, as a shareholder in the underlying Fidelity Central Funds, will indirectly bear its pro-rata share of the fees and expenses incurred by the underlying Fidelity Central Funds. These fees and expenses are not included in the Fund's annualized expense ratio used to calculate the expense estimate in the table below.
Please note that the expenses shown in the table are meant to highlight your ongoing costs only and do not reflect any transaction costs. Therefore, the second line of the table is useful in comparing ongoing costs only, and will not help you determine the relative total costs of owning different funds. In addition, if these transactional costs were included, your costs would have been higher.
Annual Report
Shareholder Expense Example - continued
| Annualized Expense Ratio | Beginning
Account Value
May 1, 2010 | Ending
Account Value
October 31, 2010 | Expenses Paid
During Period*
May 1, 2010 to
October 31, 2010 |
Class A | 1.33% | | | |
Actual | | $ 1,000.00 | $ 1,064.00 | $ 6.92 |
HypotheticalA | | $ 1,000.00 | $ 1,018.50 | $ 6.77 |
Class T | 1.57% | | | |
Actual | | $ 1,000.00 | $ 1,062.50 | $ 8.16 |
HypotheticalA | | $ 1,000.00 | $ 1,017.29 | $ 7.98 |
Class B | 2.08% | | | |
Actual | | $ 1,000.00 | $ 1,059.70 | $ 10.80 |
HypotheticalA | | $ 1,000.00 | $ 1,014.72 | $ 10.56 |
Class C | 2.07% | | | |
Actual | | $ 1,000.00 | $ 1,059.50 | $ 10.75 |
HypotheticalA | | $ 1,000.00 | $ 1,014.77 | $ 10.51 |
Institutional Class | .99% | | | |
Actual | | $ 1,000.00 | $ 1,065.70 | $ 5.15 |
HypotheticalA | | $ 1,000.00 | $ 1,020.21 | $ 5.04 |
A 5% return per year before expenses
* Expenses are equal to each Class' annualized expense ratio, multiplied by the average account value over the period, multiplied by 184/365 (to reflect the one-half year period).
Annual Report
Investment Changes (Unaudited)
Top Five Stocks as of October 31, 2010 |
| % of fund's
net assets | % of fund's net assets
6 months ago |
Royal Dutch Shell PLC Class B (United Kingdom, Oil, Gas & Consumable Fuels) | 2.9 | 2.1 |
Nestle SA (Switzerland, Food Products) | 2.3 | 1.9 |
BP PLC (United Kingdom, Oil, Gas & Consumable Fuels) | 2.1 | 1.0 |
Vodafone Group PLC sponsored ADR (United Kingdom, Wireless Telecommunication Services) | 1.8 | 1.5 |
BHP Billiton Ltd. sponsored ADR (Australia, Metals & Mining) | 1.7 | 1.4 |
| 10.8 | |
Top Five Market Sectors as of October 31, 2010 |
| % of fund's
net assets | % of fund's net assets
6 months ago |
Financials | 20.9 | 21.0 |
Consumer Discretionary | 15.6 | 11.2 |
Energy | 11.4 | 10.8 |
Materials | 10.2 | 9.3 |
Information Technology | 9.5 | 10.1 |
Top Five Countries as of October 31, 2010 |
(excluding cash equivalents) | % of fund's
net assets | % of fund's net assets
6 months ago |
United Kingdom | 18.0 | 18.2 |
Japan | 11.9 | 14.9 |
United States of America | 7.6 | 7.1 |
Germany | 7.6 | 7.1 |
Switzerland | 7.2 | 7.1 |
Percentages are adjusted for the effect of open futures contracts, if applicable. |
Asset Allocation (% of fund's net assets) |
As of October 31, 2010 | As of April 30, 2010 |
| Stocks 97.7% | | | Stocks 96.8% | |
| Short-Term
Investments and
Net Other Assets 2.3% | | | Short-Term
Investments and
Net Other Assets 3.2% | |

Annual Report
Investments October 31, 2010
Showing Percentage of Net Assets
Common Stocks - 96.3% |
| Shares | | Value (000s) |
Australia - 3.1% |
AMP Ltd. | 1,750,898 | | $ 9,160 |
BHP Billiton Ltd. sponsored ADR (d) | 781,400 | | 64,536 |
Newcrest Mining Ltd. | 793,987 | | 31,082 |
QBE Insurance Group Ltd. | 460,000 | | 7,742 |
Westfield Group unit | 550,000 | | 6,670 |
TOTAL AUSTRALIA | | 119,190 |
Bailiwick of Guernsey - 0.6% |
Resolution Ltd. | 5,536,682 | | 23,232 |
Bailiwick of Jersey - 1.7% |
Experian PLC | 1,858,400 | | 21,601 |
Randgold Resources Ltd. sponsored ADR | 100,000 | | 9,392 |
Shire PLC | 253,700 | | 5,953 |
United Business Media Ltd. | 1,000,000 | | 10,542 |
WPP PLC | 1,657,434 | | 19,258 |
TOTAL BAILIWICK OF JERSEY | | 66,746 |
Belgium - 1.3% |
Ageas | 2,957,657 | | 9,091 |
Anheuser-Busch InBev SA NV | 647,963 | | 40,604 |
TOTAL BELGIUM | | 49,695 |
Bermuda - 1.2% |
Assured Guaranty Ltd. | 434,900 | | 8,285 |
Clear Media Ltd. (a) | 16,000,000 | | 9,557 |
Huabao International Holdings Ltd. | 9,597,000 | | 14,461 |
Li & Fung Ltd. | 2,532,000 | | 13,377 |
Sihuan Pharmaceutical Holdings Group Ltd. | 188,000 | | 137 |
TOTAL BERMUDA | | 45,817 |
Brazil - 1.7% |
Banco do Brasil SA | 625,000 | | 12,161 |
Banco Santander (Brasil) SA ADR | 590,000 | | 8,496 |
BM&F Bovespa SA | 1,325,000 | | 11,099 |
Drogasil SA | 275,000 | | 6,956 |
Estacio Participacoes SA | 279,000 | | 4,167 |
Itau Unibanco Banco Multiplo SA ADR | 450,600 | | 11,067 |
Mills Estruturas e Servicos de Engenharia SA (a) | 191,000 | | 2,305 |
Souza Cruz Industria Comerico | 100,000 | | 5,138 |
Weg SA | 136,900 | | 1,768 |
TOTAL BRAZIL | | 63,157 |
Common Stocks - continued |
| Shares | | Value (000s) |
Canada - 4.5% |
Agnico-Eagle Mines Ltd. (Canada) | 150,000 | | $ 11,633 |
Barrick Gold Corp. | 170,000 | | 8,187 |
Canadian Natural Resources Ltd. | 445,000 | | 16,200 |
Fairfax Financial Holdings Ltd. (sub. vtg.) | 18,000 | | 7,363 |
Goldcorp, Inc. | 165,000 | | 7,367 |
InterOil Corp. (a)(d) | 65,000 | | 4,627 |
Ivanhoe Mines Ltd. (a) | 226,400 | | 5,421 |
Loblaw Companies Ltd. | 89,800 | | 3,837 |
Niko Resources Ltd. | 246,600 | | 23,526 |
Open Text Corp. (a) | 162,200 | | 7,176 |
OZ Optics Ltd. unit (a)(f) | 5,400 | | 24 |
Painted Pony Petroleum Ltd. (a)(e) | 170,900 | | 1,176 |
Painted Pony Petroleum Ltd. Class A (a) | 700,000 | | 4,818 |
Petrobank Energy & Resources Ltd. (a) | 670,000 | | 26,665 |
Silver Wheaton Corp. (a) | 245,700 | | 7,063 |
Suncor Energy, Inc. | 340,000 | | 10,894 |
Talisman Energy, Inc. | 920,000 | | 16,679 |
Uranium One, Inc. (a) | 2,355,000 | | 9,629 |
TOTAL CANADA | | 172,285 |
Cayman Islands - 1.1% |
BaWang International (Group) Holding Ltd. | 1,732,000 | | 728 |
Belle International Holdings Ltd. | 1,052,000 | | 1,900 |
Hengan International Group Co. Ltd. | 1,180,000 | | 11,113 |
Hengdeli Holdings Ltd. | 33,848,000 | | 18,777 |
Lijun International Pharmaceutical Holding Ltd. | 7,710,000 | | 2,646 |
Microport Scientific Corp. | 152,000 | | 155 |
Silver Base Group Holdings Ltd. | 2,819,000 | | 2,058 |
Want Want China Holdings Ltd. | 4,036,000 | | 3,723 |
TOTAL CAYMAN ISLANDS | | 41,100 |
China - 1.5% |
Agricultural Bank of China (H Shares) | 18,804,000 | | 9,922 |
Baidu.com, Inc. sponsored ADR (a) | 117,300 | | 12,904 |
China Merchants Bank Co. Ltd. (H Shares) | 8,336,500 | | 23,661 |
Minth Group Ltd. | 422,000 | | 789 |
NetEase.com, Inc. sponsored ADR (a) | 151,100 | | 6,316 |
Tingyi (Cayman Islands) Holding Corp. | 1,800,000 | | 4,900 |
TOTAL CHINA | | 58,492 |
Denmark - 2.6% |
Carlsberg AS Series B | 222,400 | | 24,319 |
Novo Nordisk AS Series B | 503,627 | | 52,872 |
Common Stocks - continued |
| Shares | | Value (000s) |
Denmark - continued |
Pandora A/S | 118,200 | | $ 5,735 |
William Demant Holding AS (a) | 200,000 | | 14,991 |
TOTAL DENMARK | | 97,917 |
Finland - 0.2% |
Nokia Corp. sponsored ADR | 875,000 | | 9,345 |
France - 6.9% |
Accor SA | 50,000 | | 2,050 |
Alstom SA | 77,071 | | 3,889 |
Atos Origin SA (a) | 165,300 | | 7,642 |
AXA SA | 1,039,600 | | 18,921 |
BNP Paribas SA | 415,900 | | 30,411 |
Cap Gemini SA | 223,000 | | 11,374 |
Essilor International SA | 207,928 | | 13,882 |
Euler Hermes SA (a) | 51,500 | | 4,848 |
Iliad Group SA | 90,000 | | 10,131 |
LVMH Moet Hennessy - Louis Vuitton | 213,735 | | 33,487 |
Pernod-Ricard SA | 89,000 | | 7,890 |
PPR SA | 169,000 | | 27,701 |
Sanofi-Aventis sponsored ADR | 566,500 | | 19,890 |
Schneider Electric SA | 83,121 | | 11,797 |
Societe Generale Series A | 459,400 | | 27,503 |
Technip SA | 149,900 | | 12,596 |
Vallourec SA | 179,276 | | 18,602 |
TOTAL FRANCE | | 262,614 |
Germany - 6.2% |
BASF AG | 232,106 | | 16,885 |
Bayerische Motoren Werke AG (BMW) | 556,088 | | 39,857 |
Daimler AG (United States) (a) | 392,300 | | 25,892 |
Deutsche Boerse AG | 183,800 | | 12,931 |
ElringKlinger AG | 81,300 | | 2,709 |
Fresenius Medical Care AG & Co. KGaA | 285,300 | | 18,170 |
Fresenius SE | 251,500 | | 22,190 |
HeidelbergCement AG | 201,200 | | 10,522 |
Linde AG | 164,408 | | 23,666 |
Metro AG | 120,000 | | 8,409 |
Munich Re Group | 66,428 | | 10,385 |
Rheinmetall AG | 57,200 | | 4,120 |
Siemens AG | 360,000 | | 41,116 |
TOTAL GERMANY | | 236,852 |
Common Stocks - continued |
| Shares | | Value (000s) |
Hong Kong - 0.8% |
AIA Group Ltd. | 2,016,600 | | $ 5,997 |
Henderson Land Development Co. Ltd. | 1,379,325 | | 9,796 |
Henderson Land Development Co. Ltd. warrants 6/1/11 (a) | 259,200 | | 100 |
Swire Pacific Ltd. (A Shares) | 537,000 | | 7,621 |
Wharf Holdings Ltd. | 1,204,000 | | 7,906 |
TOTAL HONG KONG | | 31,420 |
India - 1.1% |
GEI Industrial Systems Ltd. | 100,000 | | 464 |
HDFC Bank Ltd. | 218,176 | | 11,246 |
Housing Development Finance Corp. Ltd. | 480,042 | | 7,448 |
Infrastructure Development Finance Co. Ltd. | 1,296,940 | | 5,853 |
Larsen & Toubro Ltd. | 97,989 | | 4,483 |
Shriram Transport Finance Co. Ltd. | 117,337 | | 2,333 |
State Bank of India | 118,494 | | 8,422 |
TOTAL INDIA | | 40,249 |
Ireland - 0.4% |
CRH PLC | 553,600 | | 9,560 |
Ingersoll-Rand Co. Ltd. | 148,000 | | 5,818 |
TOTAL IRELAND | | 15,378 |
Italy - 2.2% |
Fiat SpA | 1,481,200 | | 25,062 |
Intesa Sanpaolo SpA | 4,424,523 | | 15,561 |
Mediaset SpA | 1,372,400 | | 10,121 |
Saipem SpA | 745,000 | | 33,100 |
TOTAL ITALY | | 83,844 |
Japan - 11.9% |
Canon, Inc. | 486,700 | | 22,404 |
Denso Corp. | 574,700 | | 17,872 |
eAccess Ltd. | 4,850 | | 3,538 |
Fanuc Ltd. | 60,000 | | 8,686 |
Fast Retailing Co. Ltd. | 83,100 | | 10,885 |
Hikari Tsushin, Inc. | 197,900 | | 3,738 |
Honda Motor Co. Ltd. sponsored ADR | 530,700 | | 19,121 |
Itochu Corp. | 994,700 | | 8,718 |
Japan Tobacco, Inc. | 6,756 | | 20,989 |
JSR Corp. | 510,000 | | 8,829 |
Kakaku.com, Inc. | 1,000 | | 4,834 |
Keyence Corp. | 55,500 | | 13,759 |
Komatsu Ltd. | 474,800 | | 11,605 |
Common Stocks - continued |
| Shares | | Value (000s) |
Japan - continued |
Mazda Motor Corp. | 3,743,000 | | $ 9,513 |
Miraca Holdings, Inc. | 156,800 | | 5,643 |
Mitsubishi Corp. | 627,500 | | 15,072 |
Mitsubishi UFJ Financial Group, Inc. | 5,202,800 | | 24,146 |
Mitsui & Co. Ltd. | 1,430,500 | | 22,498 |
Nintendo Co. Ltd. | 51,600 | | 13,370 |
Nippon Electric Glass Co. Ltd. | 62,000 | | 797 |
Nitori Holdings Co. Ltd. | 48,900 | | 4,302 |
NSK Ltd. | 1,180,000 | | 8,921 |
NTT DoCoMo, Inc. | 4,700 | | 7,923 |
ORIX Corp. | 437,860 | | 39,939 |
Rakuten, Inc. | 21,226 | | 16,354 |
Ricoh Co. Ltd. | 560,000 | | 7,834 |
ROHM Co. Ltd. | 143,000 | | 8,921 |
SOFTBANK CORP. | 1,203,800 | | 38,660 |
Sony Financial Holdings, Inc. | 1,800 | | 6,263 |
Start Today Co. Ltd. | 2,636 | | 8,199 |
Sumitomo Corp. | 335,100 | | 4,243 |
Sumitomo Mitsui Financial Group, Inc. | 580,100 | | 17,315 |
Tokyo Electron Ltd. | 293,700 | | 16,572 |
Toyota Motor Corp. | 259,700 | | 9,199 |
Yahoo! Japan Corp. | 33,399 | | 11,658 |
TOTAL JAPAN | | 452,320 |
Korea (South) - 1.5% |
Amorepacific Corp. | 11,767 | | 10,883 |
NCsoft Corp. | 47,096 | | 10,366 |
Samsung Electronics Co. Ltd. | 38,425 | | 25,457 |
Shinhan Financial Group Co. Ltd. | 255,670 | | 9,902 |
TOTAL KOREA (SOUTH) | | 56,608 |
Luxembourg - 0.3% |
SES SA FDR (France) unit | 460,133 | | 11,790 |
Mexico - 0.2% |
Wal-Mart de Mexico SA de CV Series V | 2,600,000 | | 7,111 |
Netherlands - 3.3% |
AEGON NV (a) | 1,350,000 | | 8,554 |
AerCap Holdings NV (a) | 325,000 | | 4,196 |
Gemalto NV | 190,000 | | 8,650 |
ING Groep NV sponsored ADR (a) | 2,200,200 | | 23,718 |
Koninklijke Ahold NV | 580,056 | | 8,015 |
Koninklijke KPN NV | 1,083,162 | | 18,086 |
Common Stocks - continued |
| Shares | | Value (000s) |
Netherlands - continued |
Koninklijke Philips Electronics NV unit | 766,000 | | $ 23,325 |
LyondellBasell Industries NV Class A (a) | 292,400 | | 7,854 |
Randstad Holdings NV (a) | 228,171 | | 10,858 |
Wolters Kluwer NV (Certificaten Van Aandelen) | 580,300 | | 13,198 |
TOTAL NETHERLANDS | | 126,454 |
Netherlands Antilles - 0.4% |
Schlumberger Ltd. | 212,800 | | 14,873 |
Norway - 1.1% |
DnB NOR ASA | 1,334,600 | | 18,313 |
Storebrand ASA (A Shares) (a) | 600,000 | | 4,363 |
Telenor ASA | 1,296,000 | | 20,891 |
TOTAL NORWAY | | 43,567 |
Qatar - 0.1% |
Commercial Bank of Qatar GDR (Reg. S) | 1,100,000 | | 5,040 |
Russia - 0.2% |
OJSC MMC Norilsk Nickel sponsored ADR | 215,000 | | 4,010 |
Uralkali JSC GDR (Reg. S) | 80,000 | | 1,980 |
TOTAL RUSSIA | | 5,990 |
South Africa - 1.0% |
AngloGold Ashanti Ltd. sponsored ADR | 235,000 | | 11,071 |
Clicks Group Ltd. | 1,483,615 | | 9,679 |
Impala Platinum Holdings Ltd. | 132,500 | | 3,745 |
Mr Price Group Ltd. | 500,000 | | 4,544 |
Naspers Ltd. Class N | 73,200 | | 3,844 |
Shoprite Holdings Ltd. | 265,100 | | 3,747 |
TOTAL SOUTH AFRICA | | 36,630 |
Spain - 4.1% |
Banco Bilbao Vizcaya Argentaria SA | 741,130 | | 9,762 |
Banco Santander SA sponsored ADR (d) | 4,425,000 | | 56,684 |
Enagas SA | 183,872 | | 4,051 |
Gestevision Telecinco SA | 388,000 | | 4,949 |
Iberdrola SA | 623,076 | | 5,254 |
Inditex SA (d) | 255,501 | | 21,335 |
Prosegur Compania de Seguridad SA (Reg.) | 201,900 | | 12,097 |
Red Electrica Corporacion SA | 145,000 | | 7,283 |
Telefonica SA sponsored ADR (d) | 420,700 | | 34,136 |
TOTAL SPAIN | | 155,551 |
Common Stocks - continued |
| Shares | | Value (000s) |
Sweden - 1.3% |
Elekta AB (B Shares) | 388,800 | | $ 14,710 |
H&M Hennes & Mauritz AB (B Shares) | 628,621 | | 22,147 |
Swedbank AB (A Shares) (a) | 942,900 | | 13,159 |
TOTAL SWEDEN | | 50,016 |
Switzerland - 7.2% |
Clariant AG (Reg.) (a) | 575,000 | | 9,720 |
Kuehne & Nagel International AG | 155,700 | | 19,250 |
Lonza Group AG | 66,205 | | 5,794 |
Nestle SA | 1,590,894 | | 87,112 |
Novartis AG sponsored ADR | 331,300 | | 19,199 |
Roche Holding AG (participation certificate) | 78,174 | | 11,476 |
Sonova Holding AG Class B | 95,606 | | 11,072 |
Syngenta AG (Switzerland) | 67,700 | | 18,740 |
Transocean Ltd. (a) | 290,000 | | 18,374 |
UBS AG (a) | 2,250,000 | | 38,210 |
Zurich Financial Services AG | 140,231 | | 34,319 |
TOTAL SWITZERLAND | | 273,266 |
Taiwan - 1.0% |
HTC Corp. | 1,519,000 | | 34,296 |
Taiwan Fertilizer Co. Ltd. | 1,704,000 | | 5,818 |
TOTAL TAIWAN | | 40,114 |
United Kingdom - 18.0% |
Anglo American PLC (United Kingdom) | 284,300 | | 13,246 |
Associated British Foods PLC | 552,200 | | 9,263 |
Barclays PLC | 3,725,000 | | 16,367 |
BG Group PLC | 1,189,544 | | 23,165 |
BHP Billiton PLC | 507,732 | | 17,984 |
BP PLC sponsored ADR | 1,950,000 | | 79,619 |
Britvic PLC | 510,100 | | 3,942 |
Burberry Group PLC | 773,100 | | 12,622 |
Carphone Warehouse Group PLC | 1,401,600 | | 6,838 |
GlaxoSmithKline PLC | 1,675,000 | | 32,705 |
HSBC Holdings PLC sponsored ADR | 1,090,900 | | 56,847 |
Inchcape PLC (a) | 2,155,000 | | 12,039 |
Intertek Group PLC | 527,100 | | 15,665 |
ITV PLC (a) | 9,345,700 | | 10,219 |
Johnson Matthey PLC | 199,600 | | 6,121 |
Lloyds Banking Group PLC (a) | 24,162,500 | | 26,554 |
Misys PLC (a) | 1,828,000 | | 8,241 |
Next PLC | 107,300 | | 3,928 |
Common Stocks - continued |
| Shares | | Value (000s) |
United Kingdom - continued |
Ocado Group PLC (a)(d) | 761,000 | | $ 1,703 |
Pearson PLC | 1,160,500 | | 17,772 |
QinetiQ Group PLC | 3,300,000 | | 5,678 |
Reckitt Benckiser Group PLC | 499,600 | | 27,943 |
Rio Tinto PLC | 384,600 | | 24,977 |
Royal Dutch Shell PLC Class B | 3,489,966 | | 111,673 |
Sage Group PLC | 2,741,500 | | 11,833 |
Serco Group PLC | 1,877,354 | | 18,468 |
Standard Chartered PLC (United Kingdom) | 415,857 | | 12,029 |
TalkTalk Telecom Group PLC (a) | 2,100,000 | | 4,438 |
Tesco PLC | 3,149,866 | | 21,541 |
Vedanta Resources PLC | 180,830 | | 6,012 |
Vodafone Group PLC sponsored ADR | 2,468,600 | | 67,911 |
TOTAL UNITED KINGDOM | | 687,343 |
United States of America - 7.6% |
Alliance Data Systems Corp. (a) | 107,000 | | 6,497 |
Anadarko Petroleum Corp. | 296,700 | | 18,268 |
Apple, Inc. (a) | 77,200 | | 23,227 |
AsiaInfo Holdings, Inc. (a)(d) | 531,300 | | 11,805 |
C. R. Bard, Inc. | 120,000 | | 9,974 |
CF Industries Holdings, Inc. | 99,100 | | 12,143 |
Chevron Corp. | 120,000 | | 9,913 |
Citigroup, Inc. (a) | 1,950,000 | | 8,132 |
eBay, Inc. (a) | 335,000 | | 9,986 |
Google, Inc. Class A (a) | 44,600 | | 27,339 |
Hewlett-Packard Co. | 130,000 | | 5,468 |
Illumina, Inc. (a) | 129,800 | | 7,049 |
Jacobs Engineering Group, Inc. (a) | 104,200 | | 4,023 |
JPMorgan Chase & Co. | 187,600 | | 7,059 |
Kulicke & Soffa Industries, Inc. (a) | 700,000 | | 4,354 |
Lear Corp. (a) | 23,400 | | 2,069 |
Medco Health Solutions, Inc. (a) | 249,100 | | 13,085 |
Morgan Stanley | 293,000 | | 7,287 |
Newmont Mining Corp. | 125,000 | | 7,609 |
Philip Morris International, Inc. | 244,600 | | 14,309 |
Regions Financial Corp. | 925,900 | | 5,833 |
SanDisk Corp. (a) | 240,800 | | 9,049 |
Schweitzer-Mauduit International, Inc. | 150,000 | | 9,627 |
The Walt Disney Co. | 164,500 | | 5,940 |
Virgin Media, Inc. | 840,000 | | 21,361 |
Common Stocks - continued |
| Shares | | Value (000s) |
United States of America - continued |
Visa, Inc. Class A | 155,000 | | $ 12,116 |
Wells Fargo & Co. | 665,000 | | 17,343 |
TOTAL UNITED STATES OF AMERICA | | 290,865 |
TOTAL COMMON STOCKS (Cost $3,136,793) | 3,674,871 |
Nonconvertible Preferred Stocks - 1.4% |
| | | |
Germany - 1.4% |
ProSiebenSat.1 Media AG | 609,700 | | 16,110 |
Volkswagen AG | 242,500 | | 36,442 |
TOTAL NONCONVERTIBLE PREFERRED STOCKS (Cost $32,378) | 52,552 |
Money Market Funds - 4.7% |
| | | |
Fidelity Cash Central Fund, 0.23% (b) | 86,229,271 | | 86,229 |
Fidelity Securities Lending Cash Central Fund, 0.24% (b)(c) | 94,620,655 | | 94,621 |
TOTAL MONEY MARKET FUNDS (Cost $180,850) | 180,850 |
TOTAL INVESTMENT PORTFOLIO - 102.4% (Cost $3,350,021) | | 3,908,273 |
NET OTHER ASSETS (LIABILITIES) - (2.4)% | | (93,312) |
NET ASSETS - 100% | $ 3,814,961 |
Legend |
(a) Non-income producing |
(b) Affiliated fund that is available only to investment companies and other accounts managed by Fidelity Investments. The rate quoted is the annualized seven-day yield of the fund at period end. A complete unaudited listing of the fund's holdings as of its most recent quarter end is available upon request. In addition, each Fidelity Central Fund's financial statements, which are not covered by the Fund's report of Independent Registered Accounting Firm, are available on the SEC's website or upon request. |
(c) Investment made with cash collateral received from securities on loan. |
(d) Security or a portion of the security is on loan at period end. |
(e) Security exempt from registration under Rule 144A of the Securities Act of 1933. These securities may be resold in transactions exempt from registration, normally to qualified institutional buyers. At the end of the period, the value of these securities amounted to $1,176,000 or 0.0% of net assets. |
(f) Restricted securities - Investment in securities not registered under the Securities Act of 1933 (excluding 144A issues). At the end of the period, the value of restricted securities (excluding 144A issues) amounted to $24,000 or 0.0% of net assets. |
Additional information on each holding is as follows: |
Security | Acquisition Date | Acquisition Cost (000s) |
OZ Optics Ltd. unit | 8/18/00 | $ 80 |
Affiliated Central Funds |
Information regarding fiscal year to date income earned by the Fund from investments in Fidelity Central Funds is as follows: |
Fund | Income earned
(Amounts in thousands) |
Fidelity Cash Central Fund | $ 106 |
Fidelity Securities Lending Cash Central Fund | 2,425 |
Total | $ 2,531 |
Other Information |
The following is a summary of the inputs used, as of October 31, 2010, involving the Fund's assets and liabilities carried at fair value. The inputs or methodology used for valuing securities may not be an indication of the risk associated with investing in those securities. For more information on valuation inputs, and their aggregation into the levels used in the tables below, please refer to the Security Valuation section in the accompanying Notes to Financial Statements. |
Valuation Inputs at Reporting Date: |
Description
(Amounts in thousands) | Total | Level 1 | Level 2 | Level 3 |
Investments in Securities: | | | | |
Equities: | | | | |
United Kingdom | $ 687,343 | $ 439,311 | $ 248,032 | $ - |
Japan | 452,320 | 156,810 | 295,510 | - |
United States of America | 290,865 | 290,865 | - | - |
Germany | 289,404 | 230,118 | 59,286 | - |
Switzerland | 273,266 | 216,316 | 56,950 | - |
France | 262,614 | 262,614 | - | - |
Canada | 172,285 | 172,261 | - | 24 |
Spain | 155,551 | 145,789 | 9,762 | - |
Netherlands | 126,454 | 117,900 | 8,554 | - |
Other | 1,017,321 | 918,432 | 98,889 | - |
Money Market Funds | 180,850 | 180,850 | - | - |
Total Investments in Securities: | $ 3,908,273 | $ 3,131,266 | $ 776,983 | $ 24 |
Other Information - continued |
The following is a reconciliation of Investments in Securities for which Level 3 inputs were used in determining value: |
(Amounts in thousands) | |
Investments in Securities: | |
Beginning Balance | $ 25 |
Total Realized Gain (Loss) | - |
Total Unrealized Gain (Loss) | (1) |
Cost of Purchases | - |
Proceeds of Sales | - |
Amortization/Accretion | - |
Transfers in to Level 3 | - |
Transfers out of Level 3 | - |
Ending Balance | $ 24 |
The change in unrealized gain (loss) for the period attributable to Level 3 securities held at October 31, 2010 | $ (1) |
The information used in the above reconciliation represents fiscal year to date activity for any Investments in Securities identified as using Level 3 inputs at either the beginning or the end of the current fiscal period. Transfers in or out of Level 3 represent the beginning value of any Security or Instrument where a change in the pricing level occurred from the beginning to the end of the period. The cost of purchases and the proceeds of sales may include securities received or delivered through corporate actions or exchanges. Realized and unrealized gains (losses) disclosed in the reconciliation are included in Net Gain (Loss) on the Fund's Statement of Operations. |
Income Tax Information |
At October 31, 2010, the Fund had a capital loss carryforward of approximately $3,277,388,000 of which $9,101,000 and $3,268,287,000 will expire on October 31, 2016 and 2017, respectively. Capital loss carryforwards are only available to offset future capital gains of the Fund to the extent provided by regulations and may be limited. |
See accompanying notes which are an integral part of the financial statements.
Annual Report
Statement of Assets and Liabilities
Amounts in thousands (except per-share amounts) | October 31, 2010 |
| | |
Assets | | |
Investment in securities, at value (including securities loaned of $92,302) - See accompanying schedule: Unaffiliated issuers (cost $3,169,171) | $ 3,727,423 | |
Fidelity Central Funds (cost $180,850) | 180,850 | |
Total Investments (cost $3,350,021) | | $ 3,908,273 |
Foreign currency held at value (cost $1,356) | | 1,356 |
Receivable for investments sold | | 15,637 |
Receivable for fund shares sold | | 5,234 |
Dividends receivable | | 7,996 |
Distributions receivable from Fidelity Central Funds | | 34 |
Other receivables | | 426 |
Total assets | | 3,938,956 |
| | |
Liabilities | | |
Payable for investments purchased | $ 13,747 | |
Payable for fund shares redeemed | 8,530 | |
Accrued management fee | 2,267 | |
Distribution and service plan fees payable | 1,015 | |
Other affiliated payables | 950 | |
Other payables and accrued expenses | 2,865 | |
Collateral on securities loaned, at value | 94,621 | |
Total liabilities | | 123,995 |
| | |
Net Assets | | $ 3,814,961 |
Net Assets consist of: | | |
Paid in capital | | $ 6,528,597 |
Undistributed net investment income | | 32,132 |
Accumulated undistributed net realized gain (loss) on investments and foreign currency transactions | | (3,301,713) |
Net unrealized appreciation (depreciation) on investments and assets and liabilities in foreign currencies | | 555,945 |
Net Assets | | $ 3,814,961 |
See accompanying notes which are an integral part of the financial statements.
Annual Report
Financial Statements - continued
Statement of Assets and Liabilities - continued
Amounts in thousands (except per-share amounts) | October 31, 2010 |
| | |
Calculation of Maximum Offering Price Class A:
Net Asset Value and redemption price per share ($1,302,101 ÷ 83,315 shares) | | $ 15.63 |
| | |
Maximum offering price per share (100/94.25 of $15.63) | | $ 16.58 |
Class T:
Net Asset Value and redemption price per share ($621,485 ÷ 40,162 shares) | | $ 15.47 |
| | |
Maximum offering price per share (100/96.50 of $15.47) | | $ 16.03 |
Class B:
Net Asset Value and offering price per share ($156,970 ÷ 10,529 shares)A | | $ 14.91 |
| | |
Class C:
Net Asset Value and offering price per share ($418,670 ÷ 27,997 shares)A | | $ 14.95 |
| | |
Institutional Class:
Net Asset Value, offering price and redemption price per share ($1,315,735 ÷ 82,766 shares) | | $ 15.90 |
A Redemption price per share is equal to net asset value less any applicable contingent deferred sales charge.
See accompanying notes which are an integral part of the financial statements.
Annual Report
Statement of Operations
Amounts in thousands | Year ended October 31, 2010 |
| | |
Investment Income | | |
Dividends | | $ 100,146 |
Interest | | 3 |
Income from Fidelity Central Funds | | 2,531 |
Income before foreign taxes withheld | | 102,680 |
Less foreign taxes withheld | | (8,513) |
Total income | | 94,167 |
| | |
Expenses | | |
Management fee | $ 29,779 | |
Transfer agent fees | 11,057 | |
Distribution and service plan fees | 13,361 | |
Accounting and security lending fees | 1,560 | |
Custodian fees and expenses | 809 | |
Independent trustees' compensation | 24 | |
Registration fees | 139 | |
Audit | 111 | |
Legal | 25 | |
Interest | 3 | |
Miscellaneous | 67 | |
Total expenses before reductions | 56,935 | |
Expense reductions | (967) | 55,968 |
Net investment income (loss) | | 38,199 |
Realized and Unrealized Gain (Loss) Net realized gain (loss) on: | | |
Investment securities: | | |
Unaffiliated issuers (net of foreign taxes of $1,740) | 466,839 | |
Foreign currency transactions | (1,542) | |
Capital gain distributions from Fidelity Central Funds | 5 | |
Total net realized gain (loss) | | 465,302 |
Change in net unrealized appreciation (depreciation) on: Investment securities (net of decrease in deferred foreign taxes of $2,466) | (92,828) | |
Assets and liabilities in foreign currencies | 41 | |
Total change in net unrealized appreciation (depreciation) | | (92,787) |
Net gain (loss) | | 372,515 |
Net increase (decrease) in net assets resulting from operations | | $ 410,714 |
See accompanying notes which are an integral part of the financial statements.
Annual Report
Financial Statements - continued
Statement of Changes in Net Assets
Amounts in thousands | Year ended
October 31,
2010 | Year ended
October 31,
2009 |
Increase (Decrease) in Net Assets | | |
Operations | | |
Net investment income (loss) | $ 38,199 | $ 66,036 |
Net realized gain (loss) | 465,302 | (3,113,043) |
Change in net unrealized appreciation (depreciation) | (92,787) | 3,684,384 |
Net increase (decrease) in net assets resulting
from operations | 410,714 | 637,377 |
Distributions to shareholders from net investment income | (59,773) | (208,554) |
Distributions to shareholders from net realized gain | (3,252) | - |
Total distributions | (63,025) | (208,554) |
Share transactions - net increase (decrease) | (1,259,295) | (1,890,462) |
Redemption fees | 104 | 327 |
Total increase (decrease) in net assets | (911,502) | (1,461,312) |
| | |
Net Assets | | |
Beginning of period | 4,726,463 | 6,187,775 |
End of period (including undistributed net investment income of $32,132 and undistributed net investment income of $53,494, respectively) | $ 3,814,961 | $ 4,726,463 |
See accompanying notes which are an integral part of the financial statements.
Annual Report
Financial Highlights - Class A
Years ended October 31, | 2010 | 2009 | 2008 | 2007 | 2006 |
Selected Per-Share Data | | | | | |
Net asset value, beginning of period | $ 14.25 | $ 12.57 | $ 26.62 | $ 23.42 | $ 20.30 |
Income from Investment Operations | | | | | |
Net investment income (loss) C | .14 | .17 | .36 | .31 | .30 |
Net realized and unrealized gain (loss) | 1.44 | 1.96 | (11.15) | 4.69 | 3.91 |
Total from investment operations | 1.58 | 2.13 | (10.79) | 5.00 | 4.21 |
Distributions from net investment income | (.19) | (.45) | (.24) | (.23) | (.14) |
Distributions from net realized gain | (.01) | - | (3.02) | (1.57) | (.95) |
Total distributions | (.20) | (.45) | (3.26) | (1.80) | (1.09) |
Redemption fees added to paid in capital C, G | - | - | - | - | - |
Net asset value, end of period | $ 15.63 | $ 14.25 | $ 12.57 | $ 26.62 | $ 23.42 |
Total Return A, B | 11.17% | 18.16% | (45.95)% | 22.76% | 21.54% |
Ratios to Average Net Assets D, F | | | | | |
Expenses before reductions | 1.32% | 1.34% | 1.26% | 1.25% | 1.26% |
Expenses net of fee waivers, if any | 1.32% | 1.34% | 1.26% | 1.25% | 1.26% |
Expenses net of all reductions | 1.30% | 1.31% | 1.22% | 1.21% | 1.20% |
Net investment income (loss) | .95% | 1.43% | 1.80% | 1.26% | 1.33% |
Supplemental Data | | | | | |
Net assets, end of period (in millions) | $ 1,302 | $ 1,662 | $ 2,004 | $ 5,774 | $ 4,694 |
Portfolio turnover rate E | 59% | 92% | 88% | 105% | 83% |
A Total returns would have been lower had certain expenses not been reduced during the periods shown.
B Total returns do not include the effect of the sales charges.
C Calculated based on average shares outstanding during the period.
D Fees and expenses of the underlying Fidelity Central Funds are not included in the Fund's expense ratio. The Fund indirectly bears its proportionate share of the expenses of any underlying Fidelity Central Funds.
E Amount does not include the portfolio activity of any underlying Fidelity Central Funds.
F Expense ratios reflect operating expenses of the class. Expenses before reductions do not reflect amounts reimbursed by the investment adviser or reductions from brokerage service arrangements or reductions from other expense offset arrangements and do not represent the amount paid by the class during periods when reimbursements or reductions occur. Expenses net of fee waivers reflect expenses after reimbursement by the investment adviser but prior to reductions from brokerage service arrangements or other expense offset arrangements. Expenses net of all reductions represent the net expenses paid by the class.
G Amount represents less than $.01 per share.
See accompanying notes which are an integral part of the financial statements.
Annual Report
Financial Highlights - Class T
Years ended October 31, | 2010 | 2009 | 2008 | 2007 | 2006 |
Selected Per-Share Data | | | | | |
Net asset value, beginning of period | $ 14.11 | $ 12.42 | $ 26.30 | $ 23.17 | $ 20.12 |
Income from Investment Operations | | | | | |
Net investment income (loss) C | .10 | .14 | .31 | .25 | .25 |
Net realized and unrealized gain (loss) | 1.43 | 1.94 | (11.01) | 4.63 | 3.89 |
Total from investment operations | 1.53 | 2.08 | (10.70) | 4.88 | 4.14 |
Distributions from net investment income | (.16) | (.39) | (.16) | (.18) | (.14) |
Distributions from net realized gain | (.01) | - | (3.02) | (1.57) | (.95) |
Total distributions | (.17) | (.39) | (3.18) | (1.75) | (1.09) |
Redempti on fees added to paid in capital C, G | - | - | - | - | - |
Net asset value, end of period | $ 15.47 | $ 14.11 | $ 12.42 | $ 26.30 | $ 23.17 |
Total Return A, B | 10.88% | 17.84% | (46.04)% | 22.43% | 21.33% |
Ratios to Average Net Assets D, F | | | | | |
Expenses before reductions | 1.55% | 1.58% | 1.49% | 1.47% | 1.48% |
Expenses net of fee waivers, if any | 1.55% | 1.58% | 1.49% | 1.47% | 1.48% |
Expenses net of all reductions | 1.53% | 1.55% | 1.44% | 1.43% | 1.42% |
Net investment income (loss) | .71% | 1.19% | 1.57% | 1.04% | 1.12% |
Supplemental Data | | | | | |
Net assets, end of period (in millions) | $ 621 | $ 832 | $ 1,110 | $ 3,569 | $ 3,609 |
Portfolio turnover rate E | 59% | 92% | 88% | 105% | 83% |
A Total returns would have been lower had certain expenses not been reduced during the periods shown.
B Total returns do not include the effect of the sales charges.
C Calculated based on average shares outstanding during the period.
D Fees and expenses of the underlying Fidelity Central Funds are not included in the Fund's expense ratio. The Fund indirectly bears its proportionate share of the expenses of any underlying Fidelity Central Funds.
E Amount does not include the portfolio activity of any underlying Fidelity Central Funds.
F Expense ratios reflect operating expenses of the class. Expenses before reductions do not reflect amounts reimbursed by the investment adviser or reductions from brokerage service arrangements or reductions from other expense offset arrangements and do not represent the amount paid by the class during periods when reimbursements or reductions occur. Expenses net of fee waivers reflect expenses after reimbursement by the investment adviser but prior to reductions from brokerage service arrangements or other expense offset arrangements. Expenses net of all reductions represent the net expenses paid by the class.
G Amount represents less than $.01 per share.
See accompanying notes which are an integral part of the financial statements.
Annual Report
Financial Highlights - Class B
Years ended October 31, | 2010 | 2009 | 2008 | 2007 | 2006 |
Selected Per-Share Data | | | | | |
Net asset value, beginning of period | $ 13.61 | $ 11.95 | $ 25.44 | $ 22.46 | $ 19.60 |
Income from Investment Operations | | | | | |
Net investment income (loss) C | .02 | .08 | .18 | .10 | .10 |
Net realized and unrealized gain (loss) | 1.38 | 1.88 | (10.62) | 4.50 | 3.79 |
Total from investment operations | 1.40 | 1.96 | (10.44) | 4.60 | 3.89 |
Distributions from net investment income | (.09) | (.30) | (.03) | (.05) | (.08) |
Distributions from net realized gain | (.01) | - | (3.02) | (1.57) | (.95) |
Total distributions | (.10) | (.30) | (3.05) | (1.62) | (1.03) |
Redemption fees added to paid in capital C, G | - | - | - | - | - |
Net asset value, end of period | $ 14.91 | $ 13.61 | $ 11.95 | $ 25.44 | $ 22.46 |
Total Return A, B | 10.34% | 17.25% | (46.39)% | 21.73% | 20.55% |
Ratios to Average Net Assets D, F | | | | | |
Expenses before reductions | 2.09% | 2.10% | 2.08% | 2.08% | 2.12% |
Expenses net of fee waivers, if any | 2.09% | 2.10% | 2.08% | 2.08% | 2.12% |
Expenses net of all reductions | 2.07% | 2.07% | 2.04% | 2.04% | 2.06% |
Net investment income (loss) | .18% | .67% | .97% | .42% | .48% |
Supplemental Data | | | | | |
Net assets, end of period (in millions) | $ 157 | $ 191 | $ 221 | $ 559 | $ 508 |
Portfolio turnover rate E | 59% | 92% | 88% | 105% | 83% |
A Total returns would have been lower had certain expenses not been reduced during the periods shown.
B Total returns do not include the effect of the contingent deferred sales charge.
C Calculated based on average shares outstanding during the period.
D Fees and expenses of the underlying Fidelity Central Funds are not included in the Fund's expense ratio. The Fund indirectly bears its proportionate share of the expenses of any underlying Fidelity Central Funds.
E Amount does not include the portfolio activity of any underlying Fidelity Central Funds.
F Expense ratios reflect operating expenses of the class. Expenses before reductions do not reflect amounts reimbursed by the investment adviser or reductions from brokerage service arrangements or reductions from other expense offset arrangements and do not represent the amount paid by the class during periods when reimbursements or reductions occur. Expenses net of fee waivers reflect expenses after reimbursement by the investment adviser but prior to reductions from brokerage service arrangements or other expense offset arrangements. Expenses net of all reductions represent the net expenses paid by the class.
G Amount represents less than $.01 per share.
See accompanying notes which are an integral part of the financial statements.
Annual Report
Financial Highlights - Class C
Years ended October 31, | 2010 | 2009 | 2008 | 2007 | 2006 |
Selected Per-Share Data | | | | | |
Net asset value, beginning of period | $ 13.65 | $ 11.98 | $ 25.50 | $ 22.53 | $ 19.65 |
Income from Investment Operations | | | | | |
Net investment income (loss) C | .03 | .08 | .20 | .12 | .12 |
Net realized and unrealized gain (loss) | 1.38 | 1.89 | (10.64) | 4.50 | 3.79 |
Total from investment operations | 1.41 | 1.97 | (10.44) | 4.62 | 3.91 |
Distributions from net investment income | (.10) | (.30) | (.06) | (.08) | (.08) |
Distributions from net realized gain | (.01) | - | (3.02) | (1.57) | (.95) |
Total distributions | (.11) | (.30) | (3.08) | (1.65) | (1.03) |
Redemption fees added to paid in capital C, G | - | - | - | - | - |
Net asset value, end of period | $ 14.95 | $ 13.65 | $ 11.98 | $ 25.50 | $ 22.53 |
Total Return A, B | 10.32% | 17.24% | (46.33)% | 21.81% | 20.62% |
Ratios to Average Net Assets D, F | | | | | |
Expenses before reductions | 2.06% | 2.09% | 2.01% | 2.00% | 2.02% |
Expenses net of fee waivers, if any | 2.06% | 2.09% | 2.01% | 2.00% | 2.02% |
Expenses net of all reductions | 2.04% | 2.06% | 1.97% | 1.96% | 1.96% |
Net investment income (loss) | .21% | .68% | 1.04% | .51% | .57% |
Supplemental Data | | | | | |
Net assets, end of period (in millions) | $ 419 | $ 502 | $ 618 | $ 1,673 | $ 1,395 |
Portfolio turnover rate E | 59% | 92% | 88% | 105% | 83% |
A Total returns would have been lower had certain expenses not been reduced during the periods shown.
B Total returns do not include the effect of the contingent deferred sales charge.
C Calculated based on average shares outstanding during the period.
D Fees and expenses of the underlying Fidelity Central Funds are not included in the Fund's expense ratio. The Fund indirectly bears its proportionate share of the expenses of any underlying Fidelity Central Funds.
E Amount does not include the portfolio activity of any underlying Fidelity Central Funds.
F Expense ratios reflect operating expenses of the class. Expenses before reductions do not reflect amounts reimbursed by the investment adviser or reductions from brokerage service arrangements or reductions from other expense offset arrangements and do not represent the amount paid by the class during periods when reimbursements or reductions occur. Expenses net of fee waivers reflect expenses after reimbursement by the investment adviser but prior to reductions from brokerage service arrangements or other expense offset arrangements. Expenses net of all reductions represent the net expenses paid by the class.
G Amount represents less than $.01 per share.
See accompanying notes which are an integral part of the financial statements.
Annual Report
Financial Highlights - Institutional Class
Years ended October 31, | 2010 | 2009 | 2008 | 2007 | 2006 |
Selected Per-Share Data | | | | | |
Net asset value, beginning of period | $ 14.48 | $ 12.81 | $ 27.06 | $ 23.78 | $ 20.56 |
Income from Investment Operations | | | | | |
Net investment income (loss) B | .19 | .21 | .41 | .38 | .37 |
Net realized and unrealized gain (loss) | 1.47 | 1.98 | (11.34) | 4.76 | 3.98 |
Total from investment operations | 1.66 | 2.19 | (10.93) | 5.14 | 4.35 |
Distributions from net investment income | (.23) | (.52) | (.30) | (.29) | (.18) |
Distributions from net realized gain | (.01) | - | (3.02) | (1.57) | (.95) |
Total distributions | (.24) | (.52) | (3.32) | (1.86) | (1.13) |
Redemption fees added to paid in capital B, F | - | - | - | - | - |
Net asset value, end of period | $ 15.90 | $ 14.48 | $ 12.81 | $ 27.06 | $ 23.78 |
Total Return A | 11.55% | 18.45% | (45.79)% | 23.07% | 21.96% |
Ratios to Average Net Assets C, E | | | | | |
Expenses before reductions | .99% | 1.07% | .99% | .98% | .97% |
Expenses net of fee waivers, if any | .99% | 1.07% | .99% | .98% | .97% |
Expenses net of all reductions | .97% | 1.04% | .94% | .94% | .92% |
Net investment income (loss) | 1.28% | 1.70% | 2.07% | 1.53% | 1.62% |
Supplemental Data | | | | | |
Net assets, end of period (in millions) | $ 1,316 | $ 1,540 | $ 2,235 | $ 5,266 | $ 4,220 |
Portfolio turnover rate D | 59% | 92% | 88% | 105% | 83% |
A Total returns would have been lower had certain expenses not been reduced during the periods shown.
B Calculated based on average shares outstanding during the period.
C Fees and expenses of the underlying Fidelity Central Funds are not included in the Fund's expense ratio. The Fund indirectly bears its proportionate share of the expenses of any underlying Fidelity Central Funds.
D Amount does not include the portfolio activity of any underlying Fidelity Central Funds.
E Expense ratios reflect operating expenses of the class. Expenses before reductions do not reflect amounts reimbursed by the investment adviser or reductions from brokerage service arrangements or reductions from other expense offset arrangements and do not represent the amount paid by the class during periods when reimbursements or reductions occur. Expenses net of fee waivers reflect expenses after reimbursement by the investment adviser but prior to reductions from brokerage service arrangements or other expense offset arrangements. Expenses net of all reductions represent the net expenses paid by the class.
F Amount represents less than $.01 per share.
See accompanying notes which are an integral part of the financial statements.
Annual Report
Notes to Financial Statements
For the period ended October 31, 2010
(Amounts in thousands except ratios)
1. Organization.
Fidelity Advisor Diversified International Fund (the Fund) is a fund of Fidelity Advisor Series VIII (the Trust) and is authorized to issue an unlimited number of shares. The Trust is registered under the Investment Company Act of 1940, as amended (the 1940 Act), as an open-end management investment company organized as a Massachusetts business trust. The Fund offers Class A, Class T, Class C and Institutional Class shares, each of which has equal rights as to assets and voting privileges. Effective after the close of business on September 1, 2010, Class B shares were closed to new accounts and additional purchases by existing shareholders. Each class has exclusive voting rights with respect to matters that affect that class. Class B shares will automatically convert to Class A shares after a holding period of seven years from the initial date of purchase. Investment income, realized and unrealized capital gains and losses, the common expenses of the Fund, and certain fund-level expense reductions, if any, are allocated on a pro-rata basis to each class based on the relative net assets of each class to the total net assets of the Fund. Each class differs with respect to transfer agent and distribution and service plan fees incurred. Certain expense reductions also differ by class. The Fund's investments in emerging markets can be subject to social, economic, regulatory, and political uncertainties and can be extremely volatile.
2. Investments in Fidelity Central Funds.
The Fund may invest in Fidelity Central Funds, which are open-end investment companies available only to other investment companies and accounts managed by Fidelity Management & Research Company (FMR) and its affiliates. The Fund's Schedule of Investments lists each of the Fidelity Central Funds held as of period end, if any, as an investment of the Fund, but does not include the underlying holdings of each Fidelity Central Fund. As an Investing Fund, the Fund indirectly bears its proportionate share of the expenses of the underlying Fidelity Central Funds.
The Money Market Central Funds seek preservation of capital and current income and are managed by Fidelity Investments Money Management, Inc. (FIMM), an affiliate of FMR.
A complete unaudited list of holdings for each Fidelity Central Fund is available upon request or at the Securities and Exchange Commission (the SEC) web site at www.sec.gov. In addition, the financial statements of the Fidelity Central Funds, which are not covered by the Fund's Report of Independent Registered Public Accounting Firm, are available on the SEC web site or upon request.
Annual Report
Notes to Financial Statements - continued
(Amounts in thousands except ratios)
3. Significant Accounting Policies.
The financial statements have been prepared in conformity with accounting principles generally accepted in the United States of America (GAAP), which require management to make certain estimates and assumptions at the date of the financial statements. Actual results could differ from those estimates. The following summarizes the significant accounting policies of the Fund:
Security Valuation. Investments are valued as of 4:00 p.m. Eastern time on the last calendar day of the period. The Fund uses independent pricing services approved by the Board of Trustees to value its investments. When current market prices or quotations are not readily available or reliable, valuations may be determined in good faith in accordance with procedures adopted by the Board of Trustees. Factors used in determining value may include market or security specific events. The frequency with which these procedures are used cannot be predicted and they may be utilized to a significant extent. The value used for net asset value (NAV) calculation under these procedures may differ from published prices for the same securities.
The Fund categorizes the inputs to valuation techniques used to value its investments into a disclosure hierarchy consisting of three levels as shown below.
Level 1 - quoted prices in active markets for identical investments
Level 2 - other significant observable inputs (including quoted prices for similar investments, interest rates, prepayment speeds, etc.)
Level 3 - unobservable inputs (including the fund's own assumptions based on the best information available)
Changes in valuation techniques may result in transfers in or out of an assigned level within the disclosure hierarchy. The aggregate value of investments by input level, as of October 31, 2010, as well as a roll forward of Level 3 securities, is included at the end of the Fund's Schedule of Investments. Valuation techniques used to value the Fund's investments by major category are as follows.
Equity securities, including restricted securities, for which market quotations are readily available, are valued at the last reported sale price or official closing price as reported by an independent pricing service on the primary market or exchange on which they are traded and are categorized as Level 1 in the hierarchy. In the event there were no sales during the day or closing prices are not available, securities are valued at the last quoted bid price or may be valued using the last available price and are generally categorized as Level 2 in the hierarchy. For foreign equity securities, when significant market or security specific events arise, comparisons to the valuation of American Depositary Receipts (ADRs), futures contracts, Exchange-traded funds (ETFs) and certain indexes as well as
Annual Report
3. Significant Accounting Policies - continued
Security Valuation - continued
quoted prices for similar securities are used and are categorized as Level 2 in the hierarchy in these circumstances. Utilizing these techniques may result in transfers between Level 1 and Level 2. For restricted equity securities and private placements where observable inputs are limited, assumptions about market activity and risk are used and are categorized as Level 3 in the hierarchy.
Investments in open-end mutual funds, including the Fidelity Central Funds, are valued at their closing net asset value each business day and are categorized as Level 1 in the hierarchy. Short-term securities with remaining maturities of sixty days or less for which quotations are not readily available are valued at amortized cost, which approximates fair value and are categorized as Level 2 in the hierarchy.
Foreign Currency. The Fund uses foreign currency contracts to facilitate transactions in foreign-denominated securities. Gains and losses from these transactions may arise from changes in the value of the foreign currency or if the counterparties do not perform under the contracts' terms.
Foreign-denominated assets, including investment securities, and liabilities are translated into U.S. dollars at the exchange rate at period end. Purchases and sales of investment securities, income and dividends received and expenses denominated in foreign currencies are translated into U.S. dollars at the exchange rate in effect on the transaction date.
The effects of exchange rate fluctuations on investments are included with the net realized and unrealized gain (loss) on investment securities. Other foreign currency transactions resulting in realized and unrealized gain (loss) are disclosed separately.
Investment Transactions and Income. For financial reporting purposes, the Fund's investment holdings and NAV include trades executed through the end of the last business day of the period. The NAV per share for processing shareholder transactions is calculated as of the close of business of the New York Stock Exchange (NYSE), normally 4:00 p.m. Eastern time and includes trades executed through the end of the prior business day. Gains and losses on securities sold are determined on the basis of identified cost and may include proceeds received from litigation. Dividend income is recorded on the ex-dividend date, except for certain dividends from foreign securities where the ex-dividend date may have passed, which are recorded as soon as the Fund is informed of the ex-dividend date. Non-cash dividends included in dividend income, if any, are recorded at the fair market value of the securities received. Distributions received on securities that represent a return of capital or capital gain are recorded as a reduction of cost of investments and/or as a realized gain. The Fund estimates the components of distributions received that may be considered return of capital distributions or capital
Annual Report
Notes to Financial Statements - continued
(Amounts in thousands except ratios)
3. Significant Accounting Policies - continued
Investment Transactions and Income - continued
gain distributions. Interest income and distributions from the Fidelity Central Funds are accrued as earned. Interest income includes coupon interest and amortization of premium and accretion of discount on debt securities. Investment income is recorded net of foreign taxes withheld where recovery of such taxes is uncertain.
Expenses. Most expenses of the Trust can be directly attributed to a fund. Expenses which cannot be directly attributed are apportioned amongst each fund in the Trust. Expense estimates are accrued in the period to which they relate and adjustments are made when actual amounts are known.
Deferred Trustee Compensation. Under a Deferred Compensation Plan (the Plan), independent Trustees may elect to defer receipt of a portion of their annual compensation. Deferred amounts are invested in a cross-section of Fidelity funds, are marked-to-market and remain in the Fund until distributed in accordance with the Plan. The investment of deferred amounts and the offsetting payable to the Trustees are included in the accompanying Statement of Assets and Liabilities.
Income Tax Information and Distributions to Shareholders. Each year the Fund intends to qualify as a regulated investment company, including distributing substantially all of its taxable income and realized gains under Subchapter M of the Internal Revenue Code and filing its U.S. federal tax return. As a result, no provision for income taxes is required. As of October 31, 2010, the Fund did not have any unrecognized tax benefits in the accompanying financial statements. A fund's federal tax return is subject to examination by the Internal Revenue Service (IRS) for a period of three years. Foreign taxes are provided for based on the Fund's understanding of the tax rules and rates that exist in the foreign markets in which it invests. The Fund is subject to a tax imposed on short term capital gains on securities of certain issuers domiciled in India. The Fund records an estimated deferred tax liability included in Other payables and accrued expenses in the accompanying Statement of Assets & Liabilities for net unrealized gains on these securities in an amount that would be payable if the securities were disposed of at period end.
Distributions are declared and recorded on the ex-dividend date. Income dividends and capital gain distributions are declared separately for each class. Income and capital gain distributions are determined in accordance with income tax regulations, which may differ from GAAP.
Capital accounts within the financial statements are adjusted for permanent book-tax differences. These adjustments have no impact on net assets or the results of operations. Temporary book-tax differences will reverse in a subsequent period.
Annual Report
3. Significant Accounting Policies - continued
Income Tax Information and Distributions to Shareholders - continued
Book-tax differences are primarily due to the short-term gain distributions from the Fidelity Central Funds, foreign currency transactions, certain foreign taxes, passive foreign investment companies (PFIC), deferred trustees compensation, capital loss carryforwards and losses deferred due to wash sales.
The federal tax cost of investment securities and unrealized appreciation (depreciation) as of period end were as follows:
Gross unrealized appreciation | $ 710,165 |
Gross unrealized depreciation | (183,888) |
Net unrealized appreciation (depreciation) | $ 526,277 |
| |
Tax Cost | $ 3,381,996 |
The tax-based components of distributable earnings as of period end were as follows:
Undistributed ordinary income | $ 39,837 |
Capital loss carryforward | $ (3,277,388) |
Net unrealized appreciation (depreciation) | $ 526,592 |
The tax character of distributions paid was as follows:
| October 31, 2010 | October 31, 2009 |
Ordinary Income | $ 63,025 | $ 208,554 |
Short-Term Trading (Redemption) Fees. Shares held by investors in the Fund less than 30 days are subject to a redemption fee equal to 1.00% of the net asset value of shares redeemed. All redemption fees, which reduce the proceeds of the shareholder redemption, are retained by the Fund and accounted for as an addition to paid in capital.
4. Operating Policies.
Restricted Securities. The Fund may invest in securities that are subject to legal or contractual restrictions on resale. These securities generally may be resold in transactions exempt from registration or to the public if the securities are registered. Disposal of these securities may involve time-consuming negotiations and expense, and prompt sale at an acceptable price may be difficult. Information regarding restricted securities is included at the end of the Fund's Schedule of Investments.
Annual Report
Notes to Financial Statements - continued
(Amounts in thousands except ratios)
5. Purchases and Sales of Investments.
Purchases and sales of securities, other than short-term securities, aggregated $2,397,518 and $3,656,002, respectively.
6. Fees and Other Transactions with Affiliates.
Management Fee. FMR and its affiliates provide the Fund with investment management related services for which the Fund pays a monthly management fee. The management fee is the sum of an individual fund fee rate that is based on an annual rate of .45% of the Fund's average net assets and a group fee rate that averaged .26% during the period. The group fee rate is based upon the average net assets of all the mutual funds advised by FMR. The group fee rate decreases as assets under management increase and increases as assets under management decrease. For the period, the total annual management fee rate was .71% of the Fund's average net assets.
Distribution and Service Plan Fees. In accordance with Rule 12b-1 of the 1940 Act, the Fund has adopted separate Distribution and Service Plans for each class of shares. Certain classes pay Fidelity Distributors Corporation (FDC), an affiliate of FMR, separate Distribution and Service Fees, each of which is based on an annual percentage of each class' average net assets. In addition, FDC may pay financial intermediaries for selling shares of the Fund and providing shareholder support services. For the period, the Distribution and Service Fee rates, total fees and amounts retained by FDC were as follows:
| Distribution
Fee | Service
Fee | Total Fees | Retained
by FDC |
Class A | -% | .25% | $ 3,603 | $ 32 |
Class T | .25% | .25% | 3,542 | - |
Class B | .75% | .25% | 1,713 | 1,286 |
Class C | .75% | .25% | 4,503 | 192 |
| | | $ 13,361 | $ 1,510 |
Sales Load. FDC receives a front-end sales charge of up to 5.75% for selling Class A shares, and 3.50% for selling Class T shares, some of which is paid to financial intermediaries for selling shares of the Fund. FDC receives the proceeds of contingent deferred sales charges levied on Class A, Class T, Class B, and Class C redemptions. These charges depend on the holding period. The deferred sales charges range from 5% to 1% for Class B, 1% for Class C, 1.00% for certain purchases of Class A shares (1.00% to .50% prior to July 12, 2010) and .25% for certain purchases of Class T shares.
Annual Report
6. Fees and Other Transactions with Affiliates - continued
Sales Load - continued
For the period, sales charge amounts retained by FDC were as follows:
| Retained
by FDC |
Class A | $ 144 |
Class T | 40 |
Class B* | 365 |
Class C* | 16 |
| $ 565 |
* When Class B and Class C shares are initially sold, FDC pays commissions from its own resources to financial intermediaries through which the sales are made.
Transfer Agent Fees. Fidelity Investments Institutional Operations Company, Inc. (FIIOC), an affiliate of FMR, is the transfer, dividend disbursing and shareholder servicing agent for each class of the Fund. FIIOC receives account fees and asset-based fees that vary according to the account size and type of account of the shareholders of the respective classes of the Fund. FIIOC pays for typesetting, printing and mailing of shareholder reports, except proxy statements. For the period, transfer agent fees for each class were as follows:
| Amount | % of
Average
Net Assets |
Class A | $ 4,244 | .29 |
Class T | 1,969 | .28 |
Class B | 537 | .31 |
Class C | 1,270 | .28 |
Institutional Class | 3,037 | .21 |
| $ 11,057 | |
Accounting and Security Lending Fees. Fidelity Service Company, Inc. (FSC), an affiliate of FMR, maintains the Fund's accounting records. The accounting fee is based on the level of average net assets for the month. Under a separate contract, FSC administers the security lending program. The security lending fee is based on the number and duration of lending transactions.
Brokerage Commissions. The Fund placed a portion of its portfolio transactions with brokerage firms which are affiliates of the investment adviser. The commissions paid to these affiliated firms were $12 for the period.
Annual Report
Notes to Financial Statements - continued
(Amounts in thousands except ratios)
6. Fees and Other Transactions with Affiliates - continued
Interfund Lending Program. Pursuant to an Exemptive Order issued by the SEC, the Fund, along with other registered investment companies having management contracts with FMR, may participate in an interfund lending program. This program provides an alternative credit facility allowing the funds to borrow from, or lend money to, other participating affiliated funds. At period end, there were no interfund loans outstanding. The Fund's activity in this program during the period for which loans were outstanding was as follows:
Borrower or Lender | Average Daily
Loan Balance | Weighted Average
Interest Rate | Interest
Expense |
Borrower | $ 10,419 | .46% | $ 3 |
7. Committed Line of Credit.
The Fund participates with other funds managed by FMR or an affiliate in a $3.75 billion credit facility (the "line of credit") to be utilized for temporary or emergency purposes to fund shareholder redemptions or for other short-term liquidity purposes. The Fund has agreed to pay commitment fees on its pro-rata portion of the line of credit, which amounted to $17 and is reflected in Miscellaneous expenses on the Statement of Operations. During the period, there were no borrowings on this line of credit.
8. Security Lending.
The Fund lends portfolio securities through a lending agent from time to time in order to earn additional income. The lending agent may loan securities to certain qualified borrowers, including Fidelity Capital Markets (FCM), a broker-dealer affiliated with the Fund. On the settlement date of the loan, the Fund receives collateral (in the form of U.S. Treasury obligations, letters of credit and/or cash) against the loaned securities and maintains collateral in an amount not less than 100% of the market value of the loaned securities during the period of the loan. The market value of the loaned securities is determined at the close of business of the Fund and any additional required collateral is delivered to the Fund on the next business day. If the borrower defaults on its obligation to return the securities loaned because of insolvency or other reasons, a fund could experience delays and costs in recovering the securities loaned or in gaining access to the collateral. Any cash collateral received is invested in the Fidelity Securities Lending Cash Central Fund. The value of loaned securities and cash collateral at period end are disclosed on the Fund's Statement of Assets and Liabilities. Security lending income represents the income earned on investing cash collateral, less rebates paid to borrowers and lending agent fees associated with the loan, plus any premium payments received for
Annual Report
8. Security Lending - continued
lending certain types of securities. Security lending income is presented in the Statement of Operations as a component of income from Fidelity Central Funds. Total security lending income during the period amounted to $2,425. During the period, there were no securities loaned to FCM.
9. Expense Reductions.
Many of the brokers with whom FMR places trades on behalf of the Fund provided services to the Fund in addition to trade execution. These services included payments of certain expenses on behalf of the Fund totaling $967 for the period.
10. Distributions to Shareholders.
Distributions to shareholders of each class were as follows:
Years ended October 31, | 2010 | 2009 |
From net investment income | | |
Class A | $ 21,908 | $ 68,117 |
Class T | 9,175 | 33,086 |
Class B | 1,280 | 5,353 |
Class C | 3,424 | 14,560 |
Institutional Class | 23,986 | 87,438 |
Total | $ 59,773 | $ 208,554 |
From net realized gain | | |
Class A | $ 1,135 | $ - |
Class T | 581 | - |
Class B | 138 | - |
Class C | 360 | - |
Institutional Class | 1,038 | - |
Total | $ 3,252 | $ - |
Annual Report
Notes to Financial Statements - continued
(Amounts in thousands except ratios)
11. Share Transactions.
Transactions for each class of shares were as follows:
| Shares | Dollars |
Years ended October 31, | 2010 | 2009 | 2010 | 2009 |
Class A | | | | |
Shares sold | 11,857 | 21,418 | $ 171,401 | $ 253,623 |
Reinvestment of distributions | 1,361 | 5,430 | 20,356 | 57,665 |
Shares redeemed | (46,493) | (69,599) | (670,244) | (816,403) |
Net increase (decrease) | (33,275) | (42,751) | $ (478,487) | $ (505,115) |
Class T | | | | |
Shares sold | 5,521 | 8,679 | $ 79,294 | $ 101,272 |
Reinvestment of distributions | 636 | 2,991 | 9,432 | 31,524 |
Shares redeemed | (24,938) | (42,114) | (355,762) | (489,737) |
Net increase (decrease) | (18,781) | (30,444) | $ (267,036) | $ (356,941) |
Class B | | | | |
Shares sold | 579 | 830 | $ 8,025 | $ 9,528 |
Reinvestment of distributions | 88 | 460 | 1,270 | 4,698 |
Shares redeemed | (4,186) | (5,692) | (57,671) | (63,258) |
Net increase (decrease) | (3,519) | (4,402) | $ (48,376) | $ (49,032) |
Class C | | | | |
Shares sold | 1,779 | 2,588 | $ 24,719 | $ 29,408 |
Reinvestment of distributions | 201 | 1,031 | 2,898 | 10,558 |
Shares redeemed | (10,773) | (18,446) | (148,900) | (204,594) |
Net increase (decrease) | (8,793) | (14,827) | $ (121,283) | $ (164,628) |
Institutional Class | | | | |
Shares sold | 22,171 | 29,717 | $ 322,782 | $ 339,054 |
Reinvestment of distributions | 1,330 | 5,968 | 20,174 | 64,270 |
Shares redeemed | (47,045) | (103,818) | (687,069) | (1,218,070) |
Net increase (decrease) | (23,544) | (68,133) | $ (344,113) | $ (814,746) |
12. Other.
The Fund's organizational documents provide former and current trustees and officers with a limited indemnification against liabilities arising in connection with the performance of their duties to the Fund. In the normal course of business, the Fund may also enter into contracts that provide general indemnifications. The Fund's maximum exposure under these arrangements is unknown as this would be dependent on future claims that may be made against the Fund. The risk of material loss from such claims is considered remote.
Annual Report
To the Trustees of Fidelity Advisor Series VIII and the Shareholders of Fidelity Advisor Diversified International Fund:
In our opinion, the accompanying statement of assets and liabilities, including the schedule of investments, and the related statements of operations and of changes in net assets and the financial highlights present fairly, in all material respects, the financial position of Fidelity Advisor Diversified International Fund (a fund of Fidelity Advisor Series VIII) at October 31, 2010, the results of its operations for the year then ended, the changes in its net assets for each of the two years in the period then ended and the financial highlights for each of the five years in the period then ended in conformity with accounting principles generally accepted in the United States of America. These financial statements and financial highlights (hereafter referred to as "financial statements") are the responsibility of the Fidelity Advisor Diversified International Fund's management. Our responsibility is to express an opinion on these financial statements based on our audits. We conducted our audits of these financial statements in accordance with the standards of the Public Company Accounting Oversight Board (United States). Those standards require that we plan and perform the audit to obtain reasonable assurance about whether the financial statements are free of material misstatement. An audit includes examining, on a test basis, evidence supporting the amounts and disclosures in the financial statements, assessing the accounting principles used and significant estimates made by management, and evaluating the overall financial statement presentation. We believe that our audits, which included confirmation of securities at October 31, 2010 by correspondence with the custodian and brokers, provide a reasonable basis for our opinion.
/s/ PricewaterhouseCoopers LLP
PricewaterhouseCoopers LLP
Boston, Massachusetts
December 16, 2010
Annual Report
The Trustees, Member of the Advisory Board, and executive officers of the trust and fund, as applicable, are listed below. The Board of Trustees governs the fund and is responsible for protecting the interests of shareholders. The Trustees are experienced executives who meet periodically throughout the year to oversee the fund's activities, review contractual arrangements with companies that provide services to the fund, oversee management of the risks associated with such activities and contractual arrangements, and review the fund's performance. Except for James C. Curvey, each of the Trustees oversees 221 funds advised by FMR or an affiliate. Mr. Curvey oversees 410 funds advised by FMR or an affiliate.
The Trustees hold office without limit in time except that (a) any Trustee may resign; (b) any Trustee may be removed by written instrument, signed by at least two-thirds of the number of Trustees prior to such removal; (c) any Trustee who requests to be retired or who has become incapacitated by illness or injury may be retired by written instrument signed by a majority of the other Trustees; and (d) any Trustee may be removed at any special meeting of shareholders by a two-thirds vote of the outstanding voting securities of the trust. Each Trustee who is not an interested person (as defined in the 1940 Act) (Independent Trustee), shall retire not later than the last day of the calendar year in which his or her 72nd birthday occurs. The Independent Trustees may waive this mandatory retirement age policy with respect to individual Trustees. The executive officers and Advisory Board Member hold office without limit in time, except that any officer and Advisory Board Member may resign or may be removed by a vote of a majority of the Trustees at any regular meeting or any special meeting of the Trustees. Except as indicated, each individual has held the office shown or other offices in the same company for the past five years.
Experience, Skills, Attributes, and Qualifications of the Fund's Trustees. The Governance and Nominating Committee has adopted a statement of policy that describes the experience, qualifications, attributes, and skills that are necessary and desirable for potential Independent Trustee candidates (Statement of Policy). The Board believes that each Trustee satisfied at the time he or she was initially elected or appointed a Trustee, and continues to satisfy, the standards contemplated by the Statement of Policy. The Governance and Nominating Committee also engages professional search firms to help identify potential Independent Trustee candidates who have the experience, qualifications, attributes, and skills consistent with the Statement of Policy. From time to time, additional criteria based on the composition and skills of the current Independent Trustees, as well as experience or skills that may be appropriate in light of future changes to board composition, business conditions, and regulatory or other developments, have also been considered by the professional search firms and the Governance and Nominating Committee. In addition, the Board takes into account the Trustees' commitment and participation in Board and committee meetings, as well as their leadership of standing and ad hoc committees throughout their tenure.
In determining that a particular Trustee was and continues to be qualified to serve as a Trustee, the Board has considered a variety of criteria, none of which, in isolation, was controlling. The Board believes that, collectively, the Trustees have balanced and diverse experience, qualifications, attributes, and skills, which allow the Board to operate effectively in governing the fund and protecting the interests of shareholders. Information about the specific experience, skills, attributes, and qualifications of each Trustee, which in each case led to the Board's conclusion that the Trustee should serve (or continue to serve) as a trustee of the fund, is provided below.
Annual Report
Board Structure and Oversight Function. Edward C. Johnson 3d is an interested person (as defined in the 1940 Act) and currently serves as Chairman. The Trustees have determined that an interested Chairman is appropriate and benefits shareholders because an interested Chairman has a personal and professional stake in the quality and continuity of services provided to the fund. Independent Trustees exercise their informed business judgment to appoint an individual of their choosing to serve as Chairman, regardless of whether the Trustee happens to be independent or a member of management. The Independent Trustees have determined that they can act independently and effectively without having an Independent Trustee serve as Chairman and that a key structural component for assuring that they are in a position to do so is for the Independent Trustees to constitute a substantial majority for the Board. The Independent Trustees also regularly meet in executive session. Ned C. Lautenbach serves as Chairman of the Independent Trustees and as such (i) acts as a liaison between the Independent Trustees and management with respect to matters important to the Independent Trustees and (ii) with management prepares agendas for Board meetings.
Fidelity funds are overseen by different Boards of Trustees. The fund's Board oversees Fidelity's equity and high income funds and another Board oversees Fidelity's investment-grade bond, money market, and asset allocation funds. The asset allocation funds may invest in Fidelity funds overseen by the fund's Board. The use of separate Boards, each with its own committee structure, allows the Trustees of each group of Fidelity funds to focus on the unique issues of the funds they oversee, including common research, investment, and operational issues. On occasion, the separate Boards establish joint committees to address issues of overlapping consequences for the Fidelity funds overseen by each Board.
The Trustees operate using a system of committees to facilitate the timely and efficient consideration of all matters of importance to the Trustees, the fund, and fund shareholders and to facilitate compliance with legal and regulatory requirements and oversight of the fund's activities and associated risks. The Board, acting through its committees, has charged FMR and its affiliates with (i) identifying events or circumstances the occurrence of which could have demonstrably adverse effects on the fund's business and/or reputation; (ii) implementing processes and controls to lessen the possibility that such events or circumstances occur or to mitigate the effects of such events or circumstances if they do occur; and (iii) creating and maintaining a system designed to evaluate continuously business and market conditions in order to facilitate the identification and implementation processes described in (i) and (ii) above. Because the day-to-day operations and activities of the fund are carried out by or through FMR, its affiliates and other service providers, the fund's exposure to risks is mitigated but not eliminated by the processes overseen by the Trustees. While each of the Board's committees has responsibility for overseeing different aspects of the fund's activities, oversight is exercised primarily through the Operations, Audit, and Compliance Committees. Appropriate personnel, including but not limited to the fund's Chief Compliance Officer (CCO), FMR's internal auditor, the independent accountants, the fund's Treasurer and portfolio management personnel, make periodic reports to the Board's committees, as appropriate. The responsibilities of each committee, including their oversight responsibilities, are described further under "Standing Committees of the Fund's Trustees."
Annual Report
Trustees and Officers - continued
The fund's Statement of Additional Information (SAI) includes more information about the Trustees. To request a free copy, call Fidelity at 1-877-208-0098.
Interested Trustees*:
Correspondence intended for each Trustee who is an interested person may be sent to Fidelity Investments, 82 Devonshire Street, Boston, Massachusetts 02109.
Name, Age; Principal Occupations and Other Relevant Experience+ |
Edward C. Johnson 3d (80) |
| Year of Election or Appointment: 1983 Mr. Johnson is Trustee and Chairman of the Board of Trustees of certain Trusts. Mr. Johnson serves as Chief Executive Officer, Chairman, and a Director of FMR LLC; Chairman and a Director of FMR; Chairman and a Director of Fidelity Research & Analysis Company (FRAC); Chairman and a Director of Fidelity Investments Money Management, Inc.; and Chairman and a Director of FMR Co., Inc. In addition, Mr. Johnson serves as Chairman and Director of FIL Limited. Previously, Mr. Johnson served as President of FMR LLC (2006-2007). |
James C. Curvey (75) |
| Year of Election or Appointment: 2007 Mr. Curvey also serves as Trustee (2007-present) of other investment companies advised by FMR. Mr. Curvey is a Director of Fidelity Investments Money Management, Inc. (2009-present), Director of Fidelity Research & Analysis Co. (2009-present) and Director of FMR and FMR Co., Inc. (2007-present). Mr. Curvey is also Vice Chairman (2007-present) and Director of FMR LLC. In addition, Mr. Curvey serves as an Overseer for the Boston Symphony Orchestra and a member of the Trustees of Villanova University. Previously, Mr. Curvey was the Vice Chairman (2006-2007) and Director (2000-2007) of FMR Corp. |
* Trustees have been determined to be "Interested Trustees" by virtue of, among other things, their affiliation with the trust or various entities under common control with FMR.
Annual Report
+ The information above includes each Trustee's principal occupation during the last five years and other information relating to the experience, attributes, and skills relevant to each Trustee's qualifications to serve as a Trustee, which led to the conclusion that each Trustee should serve as a Trustee for the fund.
Independent Trustees:
Correspondence intended for each Independent Trustee (that is, the Trustees other than the Interested Trustees) may be sent to Fidelity Investments, P.O. Box 55235, Boston, Massachusetts 02205-5235.
Name, Age; Principal Occupations and Other Relevant Experience+ |
Dennis J. Dirks (62) |
| Year of Election or Appointment: 2005 Prior to his retirement in May 2003, Mr. Dirks was Chief Operating Officer and a member of the Board of The Depository Trust & Clearing Corporation (DTCC). He also served as President, Chief Operating Officer, and Board member of The Depository Trust Company (DTC) and President and Board member of the National Securities Clearing Corporation (NSCC). In addition, Mr. Dirks served as Chief Executive Officer and Board member of the Government Securities Clearing Corporation, Chief Executive Officer and Board member of the Mortgage-Backed Securities Clearing Corporation, as a Trustee and a member of the Finance Committee of Manhattan College (2005-2008), and as a Trustee and a member of the Finance Committee of AHRC of Nassau County (2006-2008). Mr. Dirks is a member of the Independent Directors Council (IDC) Governing Council (2010-Present) and Board of Directors for The Brookville Center for Children's Services, Inc. (2009-present). |
Alan J. Lacy (57) |
| Year of Election or Appointment: 2008 Mr. Lacy serves as Senior Adviser (2007-present) of Oak Hill Capital Partners, L.P. (private equity). Mr. Lacy also served as Chief Executive Officer (2000-2005) and Vice Chairman (2005-2006) of Sears Holdings Corporation and Sears, Roebuck and Co. (retail). In addition, Mr. Lacy serves as a member of the Board of Directors of The Western Union Company (global money transfer, 2006-present) and Bristol-Myers Squibb Company (global pharmaceuticals, 2007-present). Mr. Lacy is Chairman (2008-present) and a member (2006-present) of the Board of Trustees of The National Parks Conservation Association. |
Ned C. Lautenbach (66) |
| Year of Election or Appointment: 2000 Mr. Lautenbach is Chairman of the Independent Trustees of the Equity and High Income Funds (2006-present). Mr. Lautenbach currently serves as the Lead Director of the Eaton Corporation Board of Directors (diversified industrial, 1997-present). Mr. Lautenbach is also a member of the Board of Directors of the Philharmonic Center for the Arts in Naples, Florida (1999-present); a member of the Board of Trustees of Fairfield University (2005-present); and a member of the Council on Foreign Relations (1994-present). Previously, Mr. Lautenbach was a Partner/Advisory Partner at Clayton, Dubilier & Rice, Inc. (private equity investment, 1998-2010), as well as a Director of Sony Corporation (2006-2007). |
Joseph Mauriello (66) |
| Year of Election or Appointment: 2008 Prior to his retirement in January 2006, Mr. Mauriello served in numerous senior management positions including Deputy Chairman and Chief Operating Officer (2004-2005), and Vice Chairman of Financial Services (2002-2004) of KPMG LLP US (professional services, 1965-2005). Mr. Mauriello currently serves as a member of the Board of Directors of XL Group plc. (global insurance and re-insurance, 2006-present) and of Arcadia Resources Inc. (health care services and products, 2007-present). Previously, Mr. Mauriello served as a Director of the Hamilton Funds of the Bank of New York (2006-2007). |
Cornelia M. Small (66) |
| Year of Election or Appointment: 2005 Ms. Small is a member of the Board of Directors of the Teagle Foundation (2009-present). Ms. Small is also a member of the Investment Committee, and Chair (2008-present) and a member of the Board of Trustees of Smith College. In addition, Ms. Small serves on the Investment Committee of the Berkshire Taconic Community Foundation (2008-
present). Previously, Ms. Small served as Chairperson of the Investment Committee (2002-2008) of Smith College. In addition, Ms. Small served as Chief Investment Officer, Director of Global Equity Investments, and a member of the Board of Directors of Scudder, Stevens & Clark and Scudder Kemper Investments. |
William S. Stavropoulos (71) |
| Year of Election or Appointment: 2001 Mr. Stavropoulos is Vice Chairman of the Independent Trustees of the Equity and High Income Funds (2006-present). Mr. Stavropoulos serves as President and Founder of the Michigan Baseball Foundation, the Great Lakes Loons (2007-present). Mr. Stavropoulos is Chairman Emeritus of the Board of Directors of The Dow Chemical Company, where he previously served in numerous senior management positions, including President, CEO (1995-2000; 2002-2004), Chairman of the Executive Committee (2000-2006), and as a member of the Board of Directors (1990-2006). Currently, Mr. Stavropoulos is Chairman of Univar (global distributor of commodity and specialty chemicals, 2010-present), a Director of Teradata Corporation (data warehousing and technology solutions, 2008-present), Chemical Financial Corporation, Maersk Inc. (industrial conglomerate), Tyco International, Inc. (multinational manufacturing and services, 2007-present), and a member of the Advisory Board for Metalmark Capital (private equity investment, 2005-
present). Mr. Stavropoulos is a special advisor to Clayton, Dubilier & Rice, Inc. (private equity investment). In addition, Mr. Stavropoulos is a member of the University of Notre Dame Advisory Council for the College of Science. |
David M. Thomas (61) |
| Year of Election or Appointment: 2008 Previously, Mr. Thomas served as Executive Chairman (2005-2006) and Chairman and Chief Executive Officer (2000-2005) of IMS Health, Inc. (pharmaceutical and healthcare information solutions). In addition, Mr. Thomas serves as a member of the Board of Directors of Fortune Brands, Inc. (consumer products), and Interpublic Group of Companies, Inc. (marketing communication, 2004-present). |
Michael E. Wiley (60) |
| Year of Election or Appointment: 2008 Mr. Wiley also serves as a Director of Asia Pacific Exploration Consolidated (international oil and gas exploration and production, 2008-present). Mr. Wiley serves as a Director of Tesoro Corporation (independent oil refiner and marketer, 2005-present), and a Director of Bill Barrett Corporation (exploration and production, 2005-present). In addition, Mr. Wiley also serves as a Director of Post Oak Bank (privately-held bank, 2004-present). Previously, Mr. Wiley served as a member of the Board of Trustees of the University of Tulsa (2000-2006; 2007-2010), as a Senior Energy Advisor of Katzenbach Partners, LLC (consulting, 2006-2007), as an Advisory Director of Riverstone Holdings (private investment), Chairman, President, and CEO of Baker Hughes, Inc. (oilfield services, 2000-2004), and as Director of Spinnaker Exploration Company (exploration and production, 2001-2005). |
Annual Report
Trustees and Officers - continued
+ The information above includes each Trustee's principal occupation during the last five years and other information relating to the experience, attributes, and skills relevant to each Trustee's qualifications to serve as a Trustee, which led to the conclusion that each Trustee should serve as a Trustee for the fund.
Advisory Board Member and Executive Officers:
Correspondence intended for each executive officer and Peter S. Lynch may be sent to Fidelity Investments, 82 Devonshire Street, Boston, Massachusetts 02109.
Name, Age; Principal Occupation |
Peter S. Lynch (66) |
| Year of Election or Appointment: 2003 Member of the Advisory Board of Fidelity's Equity and High Income Funds. Mr. Lynch is Vice Chairman and a Director of FMR and FMR Co., Inc. In addition, Mr. Lynch serves as a Trustee of Boston College and as the Chairman of the Inner-City Scholarship Fund. Previously, Mr. Lynch served on the Special Olympics International Board of Directors (1997-2006). |
Kenneth B. Robins (41) |
| Year of Election or Appointment: 2008 President and Treasurer of Fidelity's Equity and High Income Funds. Mr. Robins also serves as President and Treasurer (2010-present) and Assistant Treasurer (2009-present) of other Fidelity funds and is an employee of Fidelity Investments (2004-present). Previously, Mr. Robins served as Deputy Treasurer of the Fidelity funds (2005-2008) and Treasurer and Chief Financial Officer of The North Carolina Capital Management Trust: Cash and Term Portfolios (2006-2008). |
Bruce T. Herring (45) |
| Year of Election or Appointment: 2006 Vice President of certain Equity Funds. Mr. Herring also serves as Chief Investment Officer and Director of Fidelity Management & Research (U.K.) Inc. (2010-present) and Group Chief Investments Officer of FMR. Previously, Mr. Herring served as Vice President (2005-2006) and Senior Vice President (2006-2007) of Fidelity Management & Research Company, Vice President of FMR Co., Inc. (2001-2007) and as a portfolio manager for Fidelity U.S. Equity Funds. |
Brian B. Hogan (46) |
| Year of Election or Appointment: 2009 Vice President of certain Equity Funds and Vice President of Sector Funds. Mr. Hogan also serves as President of FMR's Equity Division (2009-present). Previously, Mr. Hogan served as Senior Vice President, Equity Research of FMR (2006-2009) and as a portfolio manager. |
Scott C. Goebel (42) |
| Year of Election or Appointment: 2008 Secretary and Chief Legal Officer (CLO) of the Fidelity funds. Mr. Goebel also serves as Secretary and CLO of The North Carolina Capital Management Trust: Cash and Term Portfolio (2008-present); General Counsel, Secretary, and Senior Vice President of FMR (2008-present) and FMR Co., Inc. (2008-present); Deputy General Counsel of FMR LLC; Chief Legal Officer of Fidelity Management & Research (Hong Kong) Limited (2008-present) and Assistant Secretary of Fidelity Management & Research (Japan) Inc. (2008-present), Fidelity Investments Money Management, Inc. (2008-present), Fidelity Management & Research (U.K.) Inc. (2008-present), and Fidelity Research and Analysis Company (2008-present). Previously, Mr. Goebel served as Assistant Secretary of the Funds (2007-2008) and as Vice President and Secretary of Fidelity Distributors Corporation (FDC) (2005-2007). |
William C. Coffey (41) |
| Year of Election or Appointment: 2009 Assistant Secretary of Fidelity's Equity and High Income Funds. Mr. Coffey also serves as Senior Vice President and Deputy General Counsel of FMR LLC (2010-present), and is an employee of Fidelity Investments. Previously, Mr. Coffey served as Vice President and Associate General Counsel of FMR LLC (2005-2009). |
Holly C. Laurent (56) |
| Year of Election or Appointment: 2008 Anti-Money Laundering (AML) Officer of the Fidelity funds. Ms. Laurent also serves as AML Officer of The North Carolina Capital Management Trust: Cash and Term Portfolio (2008-present) and is an employee of Fidelity Investments. Previously, Ms. Laurent was Senior Vice President and Head of Legal for Fidelity Business Services India Pvt. Ltd. (2006-
2008), and Senior Vice President, Deputy General Counsel and Group Head for FMR LLC (2005-2006). |
Christine Reynolds (52) |
| Year of Election or Appointment: 2008 Chief Financial Officer of the Fidelity funds. Ms. Reynolds became President of Fidelity Pricing and Cash Management Services (FPCMS) in August 2008. Ms. Reynolds served as Chief Operating Officer of FPCMS (2007-2008). Previously, Ms. Reynolds served as President, Treasurer, and Anti-Money Laundering officer of the Fidelity funds (2004-2007). |
Kenneth A. Rathgeber (63) |
| Year of Election or Appointment: 2004 Chief Compliance Officer of Fidelity's Equity and High Income Funds. Mr. Rathgeber is Chief Compliance Officer of Fidelity Management & Research (Hong Kong) Limited (2008-present), Fidelity Management & Research (Japan) Inc. (2008-present), FMR (2005-present), FMR Co., Inc. (2005-present), Fidelity Management & Research (U.K.) Inc. (2005-present), Fidelity Research & Analysis Company (2005-present), Fidelity Investments Money Management, Inc. (2005-present), Pyramis Global Advisors, LLC (2005-present), and Strategic Advisers, Inc. (2005-present). |
Jeffrey S. Christian (49) |
| Year of Election or Appointment: 2009 Deputy Treasurer of the Fidelity funds. Mr. Christian is an employee of Fidelity Investments. Previously, Mr. Christian served as Chief Financial Officer (2008-2009) of certain Fidelity funds and Senior Vice President of Fidelity Pricing and Cash Management Services (FPCMS) (2004-2009). |
Bryan A. Mehrmann (49) |
| Year of Election or Appointment: 2005 Deputy Treasurer of the Fidelity funds. Mr. Mehrmann is an employee of Fidelity Investments. |
Adrien E. Deberghes (43) |
| Year of Election or Appointment: 2008 Deputy Treasurer of Fidelity's Equity and High Income Funds. Mr. Deberghes also serves as Assistant Treasurer of other Fidelity funds (2010-present) and is an employee of Fidelity Investments (2008-
present). Previously, Mr. Deberghes served as Senior Vice President of Mutual Fund Administration at State Street Corporation (2007-2008), Senior Director of Mutual Fund Administration at Investors Bank & Trust (2005-2007), and Director of Finance for Dunkin' Brands (2000-2005). |
Stephanie J. Dorsey (41) |
| Year of Election or Appointment: 2010 Assistant Treasurer of Fidelity's Equity and High Income Funds. Ms. Dorsey also serves as Deputy Treasurer of other Fidelity funds (2008-
present) and is an employee of Fidelity Investments (2008-present). Previously, Ms. Dorsey served as Treasurer (2004-2008) of the JPMorgan Mutual Funds and Vice President (2004-2008) of JPMorgan Chase Bank. |
Name, Age; Principal Occupation |
John R. Hebble (52) |
| Year of Election or Appointment: 2009 Assistant Treasurer of Fidelity's Equity and High Income Funds. Mr. Hebble also serves as Treasurer and Chief Financial Officer of The North Carolina Capital Management Trust: Cash and Term Portfolio (2008-present), President and Treasurer of other Fidelity funds (2008-present) and is an employee of Fidelity Investments. |
Gary W. Ryan (52) |
| Year of Election or Appointment: 2005 Assistant Treasurer of the Fidelity funds. Mr. Ryan is an employee of Fidelity Investments. Previously, Mr. Ryan served as Vice President of Fund Reporting in Fidelity Pricing and Cash Management Services (FPCMS) (1999-2005). |
Jonathan Davis (42) |
| Year of Election or Appointment: 2010 Assistant Treasurer of the Fidelity funds. Mr. Davis is an employee of Fidelity Investments. Previously, Mr. Davis served as Vice President and Associate General Counsel of FMR LLC (2003-2010). |
Annual Report
The Board of Trustees of Advisor Diversified International Fund voted to pay to shareholders of record at the opening of business on record date, the following distributions per share derived from capital gains realized from sales of portfolio securities, and dividends derived from net investment income:
| Pay Date | Record Date | Dividends | Capital Gains |
Institutional Class | 12/06/10 | 12/03/10 | $0.188 | $0.034 |
Institutional Class designates 100% of the dividends distributed in December 2009 as amounts which may be taken into account as a dividend for purposes of the maximum rate under section 1(h)(11) of the Internal Revenue Code.
The amounts per share which represent income derived from sources within, and taxes paid to, foreign countries or possessions of the United States are as follows:
| Pay Date | Income | Taxes |
Institutional Class | 12/07/09 | $0.269 | $0.0282 |
The fund will notify shareholders in January 2011 of amounts for use in preparing 2010 income tax returns.
Annual Report
Board Approval of Investment Advisory Contracts and Management Fees
Fidelity Advisor Diversified International Fund
Each year, the Board of Trustees, including the Independent Trustees (together, the Board), votes on the renewal of the management contract and sub-advisory agreements (together, the Advisory Contracts) for the fund. The Board, assisted by the advice of fund counsel and Independent Trustees' counsel, requests and considers a broad range of information relevant to the renewal of the Advisory Contracts throughout the year.
The Board meets regularly and considers at each of its meetings factors that are relevant to its annual consideration of the renewal of the fund's Advisory Contracts, including the services and support provided to the fund and its shareholders. The Board has established various standing committees, each composed of Independent Trustees with varying backgrounds, to which the Board has assigned specific subject matter responsibilities in order to enhance effective decision-making by the Board. The Board, acting directly and through its Committees, requests and receives information concerning the annual consideration of the renewal of the fund's Advisory Contracts. The Board also meets as needed to consider matters specifically related to the Board's annual consideration of the renewal of Advisory Contracts. Members of the Board may also meet with trustees of other Fidelity funds through ad hoc joint committees to discuss certain matters relevant to the Fidelity funds.
At its July 2010 meeting, the Board of Trustees, including the Independent Trustees, unanimously determined to renew the fund's Advisory Contracts. In reaching its determination, the Board considered all factors it believed relevant, including (i) the nature, extent, and quality of the services to be provided to the fund and its shareholders (including the investment performance of the fund); (ii) the competitiveness of the fund's management fee and total expenses; (iii) the total costs of the services to be provided by and the profits to be realized by Fidelity from its relationship with the fund; (iv) the extent to which economies of scale would be realized as the fund grows; and (v) whether fee levels reflect these economies of scale, if any, for the benefit of fund shareholders.
In considering whether to renew the Advisory Contracts for the fund, the Board reached a determination, with the assistance of fund counsel and Independent Trustees' counsel and through the exercise of its business judgment, that the renewal of the Advisory Contracts is in the best interests of fund shareholders and that the compensation to be received by Fidelity under the management contract is fair and reasonable. The Board's decision to renew the Advisory Contracts was not based on any single factor noted above, but rather was based on a comprehensive consideration of all the information provided to the Board at its meetings throughout the year. The Board, in reaching its determination to renew the Advisory Contracts, is aware that shareholders in the fund have a broad range of investment choices available to them, including a wide choice among mutual funds offered by Fidelity's competitors, and that the fund's shareholders, with the opportunity to review and weigh the disclosure provided by the fund in its prospectus and other public disclosures, have chosen to invest in this fund, managed by Fidelity.
Annual Report
Board Approval of Investment Advisory Contracts and
Management Fees - continued
Nature, Extent, and Quality of Services Provided. The Board considered the staffing within the investment adviser, FMR, and the sub-advisers (together, the Investment Advisers), including the backgrounds of the fund's investment personnel and the fund's investment objective and discipline. The Independent Trustees also had discussions with senior management of Fidelity's investment operations and investment groups. The Board considered the structure of the portfolio manager compensation program and whether this structure provides appropriate incentives to act in the best interest of the fund.
Resources Dedicated to Investment Management and Support Services. The Board and the equity research subcommittee of the Board's Fund Oversight Committee reviewed the size, education, and experience of the Investment Advisers' investment staff, their use of technology, and the Investment Advisers' approach to recruiting, training, and retaining portfolio managers and other research, advisory, and management personnel. The Board noted that Fidelity's analysts have access to a variety of technological tools and market and securities data that enable them to perform both fundamental and quantitative analysis and to specialize in various disciplines. The Board considered Fidelity's extensive global research capabilities that enable the Investment Advisers to aggregate data from various sources in an effort to produce positive investment results. The Board also considered that Fidelity's portfolio managers and analysts have access to daily portfolio attribution that allows for monitoring of a fund's portfolio, as well as an electronic communication system that provides immediate real-time access to research concerning issuers and credit enhancers. The Board noted FMR's continued focus on strengthening the organization and discipline of equity portfolio management and research.
Shareholder and Administrative Services. The Board considered (i) the nature, extent, quality, and cost of advisory, administrative, and shareholder services performed by the Investment Advisers and their affiliates under the Advisory Contracts and under separate agreements covering transfer agency, pricing and bookkeeping, and securities lending services for the fund; (ii) the nature and extent of the investment adviser's supervision of third party service providers, principally custodians and subcustodians; and (iii) the resources devoted to, and the record of compliance with, the fund's compliance policies and procedures. The Board also reviewed the allocation of fund brokerage, including allocations to brokers affiliated with the Investment Advisers, the use of brokerage commissions to pay fund expenses, and the use of "soft" commission dollars to pay for research services.
The Board noted that the growth of fund assets over time across the complex allows Fidelity to reinvest in the development of services designed to enhance the value or convenience of the Fidelity funds as investment vehicles. These services include 24-hour access to account information and market information through phone representatives and over the Internet, and investor education materials and asset allocation tools.
Annual Report
Investment in a Large Fund Family. The Board considered the benefits to shareholders of investing in a Fidelity fund, including the benefits of investing in a fund that is part of a large family of funds offering a variety of investment disciplines and providing a large variety of mutual fund investor services. The Board noted that Fidelity had taken, or had made recommendations that resulted in the Fidelity funds taking, a number of actions over the previous year that benefited particular funds, including (i) dedicating additional resources to investment research and restructuring and broadening the focus of the investment research teams; (ii) bolstering the senior management team that oversees asset management; (iii) launching Class F of certain funds as a lower-fee class available to Freedom K and Freedom Index Funds; (iv) lowering the initial investment minimums and ongoing balance requirements for Real Estate High Income Fund; (v) eliminating subsequent purchase minimums for all funds and adding a waiver of the investment minimum requirement for new accounts opened with the proceeds of a systematic withdrawal plan; (vi) eliminating the withdrawal minimum and maximum limits for systematic withdrawals from Advisor funds; (vii) expanding sales load waivers on Class A shares for Destiny Planholders and expanding Institutional Class eligibility for Class O Destiny Planholders; and (viii) changing certain Class A and Class T sales charge structures to further align them with industry practices.
Investment Performance. The Board considered whether the fund has operated in accordance with its investment objective, as well as its record of compliance with its investment restrictions. It also reviewed the fund's absolute investment performance for each class, as well as the fund's relative investment performance for each class measured over multiple periods against (i) a broad-based securities market index, and (ii) a peer group of mutual funds deemed appropriate by Fidelity and reviewed by the Board. The following charts considered by the Board show, over the one-, three-, and five-year periods ended December 31, 2009, the cumulative total returns of Institutional Class (Class I) and Class B of the fund, the cumulative total returns of a broad-based securities market index ("benchmark"), and a range of cumulative total returns of a peer group of mutual funds identified by Morningstar, Inc. as having an investment style similar to that of the fund based on underlying portfolio holdings. The returns of Institutional Class (Class I) and Class B show the performance of the highest and lowest performing classes, respectively (based on five-year performance). The box within each chart shows the 25th percentile return (bottom of box) and the 75th percentile return (top of box) of the peer group. Returns shown above the box are in the first quartile and returns shown below the box are in the fourth quartile. The percentage beaten numbers noted below each chart correspond to the percentile box and represent the percentage of funds in the peer group whose performance was equal to or lower than that of the class indicated.
Annual Report
Board Approval of Investment Advisory Contracts and
Management Fees - continued
Fidelity Advisor Diversified International Fund
The Board reviewed the fund's relative investment performance against its peer group and noted that the performance of Institutional Class (Class I) of the fund was in the fourth quartile for the one-year period and the third quartile for the three- and five-year periods. The Board also noted that the investment performance of the fund was lower than its benchmark for all the periods shown. The Board considered that the variations in performance among the fund's classes reflect the variations in class expenses, which result in lower performance for higher expense classes. The Board discussed with FMR actions that have been taken by FMR to improve the fund's disappointing performance relative to its peer group and benchmark. The Board also reviewed the fund's performance since inception as well as performance in the current year. The Board will continue to closely monitor the performance of the fund in the coming year and discuss with FMR other appropriate actions to address the performance of the fund.
Based on its review, and giving particular weight to the nature and quality of the resources dedicated by the Investment Advisers to maintain and improve relative performance and factoring in the unprecedented market events in recent years, the Board concluded that the nature, extent, and quality of investment management and support services and of shareholder and administrative services provided to the fund will benefit the fund's shareholders, particularly in light of the Board's view that the fund's shareholders benefit from investing in a fund that is part of a large family of funds offering a variety of investment disciplines and services.
Competitiveness of Management Fee and Total Fund Expenses. The Board considered the fund's management fee and total expenses compared to "mapped groups" of competitive funds and classes. Fidelity creates "mapped groups" by combining similar Lipper investment objective categories that have comparable management fee characteristics. Combining Lipper investment objective categories aids the Board's management fee and total expense comparisons by broadening the competitive group used for comparison and by reducing the number of universes to which various Fidelity funds are compared.
Annual Report
Management Fee. The Board considered two proprietary management fee comparisons for the 12-month periods shown in the chart below. The group of Lipper funds used by the Board for management fee comparisons is referred to below as the "Total Mapped Group." The Total Mapped Group comparison focuses on a fund's standing relative to the total universe of comparable funds available to investors, in terms of gross management fees before expense reimbursements or caps. "TMG %" represents the percentage of funds in the Total Mapped Group that had management fees that were lower than the fund's. For example, a TMG % of 15% means that 85% of the funds in the Total Mapped Group had higher management fees than the fund. The "Asset-Size Peer Group" (ASPG) comparison focuses on a fund's standing relative to non-Fidelity funds similar in size to the fund within the Total Mapped Group. The ASPG represents at least 15% of the funds in the Total Mapped Group with comparable asset size and management fee characteristics, subject to a minimum of 50 funds (or all funds in the Total Mapped Group if fewer than 50). Additional information, such as the ASPG quartile in which the fund's management fee ranked, is also included in the chart and considered by the Board.
Fidelity Advisor Diversified International Fund
Annual Report
Board Approval of Investment Advisory Contracts and
Management Fees - continued
The Board noted that the fund's management fee ranked below the median of its Total Mapped Group and below the median of its ASPG for 2009.
Based on its review, the Board concluded that the fund's management fee is fair and reasonable in light of the services that the fund receives and the other factors considered.
Total Expenses. In its review of each class's total expenses, the Board considered the fund's management fee as well as other fund or class expenses, as applicable, such as transfer agent fees, pricing and bookkeeping fees, fund-paid 12b-1 fees, and custodial, legal, and audit fees. The Board also noted the effects of any waivers and reimbursements on fees and expenses. As part of its review, the Board also considered current and historical total expenses of each class of the fund compared to competitive fund median expenses. Each class of the fund is compared to those funds and classes in the Total Mapped Group (used by the Board for management fee comparisons) that have a similar sales load structure.
The Board noted that the total expenses of each of Class A, Class B, Class C, and Institutional Class ranked below its competitive median for 2009 and the total expenses of Class T ranked above its competitive median for 2009. The Board considered that the total expenses for Class T were above the median primarily because its 12b-1 fee is higher than the typical front-end load class. The Board noted that the fund offers multiple classes, each of which has a different sales load and 12b-1 fee structure, and that the multiple structures are intended to offer a range of pricing options for the intermediary market. The Board also noted that the total expenses of the classes vary primarily by the level of their 12b-1 fees, although differences in transfer agent fees may also cause expenses to vary from class to class.
Fees Charged to Other Fidelity Clients. The Board also considered Fidelity fee structures and other information with respect to clients of FMR and its affiliates, such as other mutual funds advised or subadvised by FMR or its affiliates, pension plan clients, and other institutional clients. In March 2010, the Board created an ad hoc joint committee with the board of other Fidelity funds (the Committee) to review and compare Fidelity's institutional investment advisory business with its business of providing services to the Fidelity funds, including the differences in services provided, fees charged, and costs incurred, as well as competition in their respective marketplaces.
Based on its review of total expenses and fees charged to other Fidelity clients, the Board concluded that the total expenses of each class of the fund were reasonable, although in one case above the median of the universe presented for comparison, in light of the services that the fund and its shareholders receive and the other factors considered, including the findings of the Committee.
Annual Report
Costs of the Services and Profitability. The Board considered the revenues earned and the expenses incurred by Fidelity in conducting the business of developing, marketing, distributing, managing, administering and servicing the fund and its shareholders. The Board also considered the level of Fidelity's profits in respect of all the Fidelity funds.
On an annual basis, FMR presents to the Board Fidelity's profitability for the fund. Fidelity calculates the profitability for each fund, as well as aggregate profitability for groups of Fidelity funds and all Fidelity funds, using a series of detailed revenue and cost allocation methodologies which originate with the audited books and records of Fidelity. The Audit Committee of the Board reviews any significant changes from the prior year's methodologies.
PricewaterhouseCoopers LLP (PwC), independent registered public accounting firm and auditor to Fidelity and certain Fidelity funds, has been engaged annually by the Board as part of the Board's assessment of Fidelity's profitability analysis. PwC's engagement includes the review and assessment of Fidelity's methodologies used in determining the revenues and expenses attributable to Fidelity's mutual fund business, and completion of agreed-upon procedures surrounding the mathematical accuracy of fund profitability and its conformity to allocation methodologies. After considering PwC's reports issued under the engagement and information provided by Fidelity, the Board believes that while other allocation methods may also be reasonable, Fidelity's profitability methodologies are reasonable in all material respects.
The Board has also reviewed Fidelity's non-fund businesses and fall-out benefits related to the mutual fund business as well as cases where Fidelity's affiliates may benefit from or be related to the fund's business.
The Board considered the costs of the services provided by and the profits realized by Fidelity in connection with the operation of the fund and were satisfied that the profitability was not excessive in the circumstances.
Economies of Scale. The Board considered whether there have been economies of scale in respect of the management of the Fidelity funds, whether the Fidelity funds (including the fund) have appropriately benefited from any such economies of scale, and whether there is potential for realization of any further economies of scale. The Board considered the extent to which the fund will benefit from economies of scale through increased services to the fund, through waivers or reimbursements, or through fee or expense reductions.
In February 2009, the Board and the board of other Fidelity funds created an ad hoc committee (the Economies of Scale Committee) to analyze whether FMR attains economies of scale in respect of the management and servicing of the Fidelity funds, whether the Fidelity funds have appropriately benefited from such economies of scale, and whether there is potential for realization of any further economies of scale.
Annual Report
Board Approval of Investment Advisory Contracts and
Management Fees - continued
The Board recognized that the fund's management contract incorporates a "group fee" structure, which provides for lower group fee rates as total fund assets under FMR's management increase, and for higher group fee rates as total fund assets under FMR's management decrease. FMR calculates the group fee rates based on a tiered asset "breakpoint" schedule that varies based on asset class. The Board considered that the group fee is designed to deliver the benefits of economies of scale to fund shareholders when total Fidelity fund assets increase, even if assets of any particular fund are unchanged or have declined, because some portion of Fidelity's costs are attributable to services provided to all Fidelity funds, and all funds benefit if those costs can be allocated among more assets. The Board concluded that, given the group fee structure, fund shareholders will benefit from lower management fees as assets under FMR's management increase at the fund complex level, regardless of whether Fidelity achieves any such economies of scale.
The Board concluded, considering the findings of the Economies of Scale Committee, that any potential economies of scale are being appropriately shared between fund shareholders and Fidelity.
Additional Information Requested by the Board. In order to develop fully the factual basis for consideration of the Fidelity funds' Advisory Contracts, the Board requested and received additional information on certain topics, including (i) fund performance trends, actions to be taken by FMR to improve certain funds' overall performance, and Fidelity's long-term strategies for certain funds; (ii) portfolio manager changes that have occurred during the past year and length of portfolio manager tenure for different categories of funds over time; (iii) Fidelity's compensation structure for portfolio managers, research analysts, and other key personnel, the rationale for the compensation structure, and how the compensation structure provides appropriate performance incentives; (iv) the amount of the investment that each portfolio manager has made in the Fidelity fund(s) that he or she manages; (v) management and other fees paid by FMR to affiliated sub-advisers on behalf of the Fidelity funds; (vi) Fidelity's fee structures and rationale for recommending different fees among different categories of funds; (vii) Fidelity's rationale for recommending which funds should have a performance adjustment component as part of their management fees; (viii) the rationale for any differences between fund fee structures and fee structures in place for other Fidelity clients; and (ix) explanations regarding the relative total expenses borne by certain funds and classes, total expense competitive trends, and actions that might be taken by FMR to reduce total expenses for certain funds and classes.
Annual Report
Based on its evaluation of all of the conclusions noted above, and after considering all factors it believed relevant, the Board ultimately concluded that the advisory fee structures are fair and reasonable, and that the fund's Advisory Contracts should be renewed.
Annual Report
Investment Adviser
Fidelity Management & Research Company
Boston, MA
Investment Sub-Advisers
FMR Co., Inc.
Fidelity Management & Research
(U.K.) Inc.
Fidelity Research & Analysis Company
FIL Investment Advisors
FIL Investments (Japan) Limited
FIL Investment Advisors (U.K.) Ltd.
Fidelity Management & Research
Company (Hong Kong) Limited
Fidelity Management & Research
Company (Japan) Inc.
General Distributor
Fidelity Distributors Corporation
Boston, MA
Transfer and Service Agents
Fidelity Investments Institutional Operations Company, Inc.
Boston, MA
Fidelity Service Company, Inc.
Boston, MA
Custodian
State Street Bank and Trust Company
Quincy, MA
ADIFI-UANN-1210
1.784736.107
(Fidelity Investment logo)(registered trademark)
Fidelity AdvisorSM
Emerging Asia
Fund - Class A, Class T, Class B
and Class C
Annual Report
October 31, 2010
(2_fidelity_logos) (Registered_Trademark)
Contents
Chairman's Message | <Click Here> | The Chairman's message to shareholders. |
Performance | <Click Here> | How the fund has done over time. |
Management's Discussion of Fund Performance | <Click Here> | The Portfolio Manager's review of fundperformance and strategy. |
Shareholder Expense Example | <Click Here> | An example of shareholder expenses. |
Investment Changes | <Click Here> | A summary of major shifts in the fund's investments over the past six months. |
Investments | <Click Here> | A complete list of the fund's investments with their market values. |
Financial Statements | <Click Here> | Statements of assets and liabilities, operations, and changes in net assets,
as well as financial highlights. |
Notes | <Click Here> | Notes to financial statements. |
Report of Independent Registered Public Accounting Firm | <Click Here> | |
Trustees and Officers | <Click Here> | |
Distributions | <Click Here> | |
Board Approval of Investment Advisory Contracts and Management Fees | <Click Here> | |
To view a fund's proxy voting guidelines and proxy voting record for the 12-month period ended June 30, visit http://www.fidelity.com/proxyvotingresults or visit the Securities and Exchange Commission's (SEC) web site at http://www.sec.gov. You may also call 1-877-208-0098 to request a free copy of the proxy voting guidelines.
Standard & Poor's, S&P and S&P 500 are registered service marks of The McGraw-Hill Companies, Inc. and have been licensed for use by Fidelity Distributors Corporation.
Other third party marks appearing herein are the property of their respective owners.
All other marks appearing herein are registered or unregistered trademarks or service marks of FMR LLC or an affiliated company.
Annual Report
This report and the financial statements contained herein are submitted for the general information of the shareholders of the fund. This report is not authorized for distribution to prospective investors in the fund unless preceded or accompanied by an effective prospectus.
A fund files its complete schedule of portfolio holdings with the SEC for the first and third quarters of each fiscal year on Form N-Q. Forms N-Q are available on the SEC's web site at http://www.sec.gov. A fund's Forms N-Q may be reviewed and copied at the SEC's Public Reference Room in Washington, DC. Information regarding the operation of the SEC's Public Reference Room may be obtained by calling 1-800-SEC-0330. For a complete list of a fund's portfolio holdings, view the most recent holdings listing, semiannual report, or annual report on Fidelity's web site at http://www.fidelity.com or http://www.advisor.fidelity.com, as applicable.
NOT FDIC INSURED • MAY LOSE VALUE • NO BANK GUARANTEE
Neither the fund nor Fidelity Distributors Corporation is a bank.
Annual Report
(photo_of_Edward_C_Johnson_3d)
Dear Shareholder:
Equities have staged a rally in the second half of 2010, shaking off concerns about the European debt crisis and the possibility of a double-dip recession in the U.S. Although the short-term surge pushed major equity indexes back into positive territory for the year, several questions remain about the longer-term outlook, including lackluster economic growth and persistently high unemployment. Financial markets are always unpredictable, of course, but there also are several time-tested investment principles that can help put the odds in your favor.
One of the basic tenets is to invest for the long term. Over time, riding out the markets' inevitable ups and downs has proven much more effective than selling into panic or chasing the hottest trend. Even missing only a few of the markets' best days can significantly diminish investor returns. Patience also affords the benefits of compounding - of earning interest on additional income or reinvested dividends and capital gains. There can be tax advantages and cost benefits to consider as well. While staying the course doesn't eliminate risk, it can considerably lessen the effect of short-term declines.
You can further manage your investing risk through diversification. And today, more than ever, geographic diversification should be taken into account. Studies indicate that asset allocation is the single most important determinant of a portfolio's long-term success. The right mix of stocks, bonds and cash - aligned to your particular risk tolerance and investment objective - is very important. Age-appropriate rebalancing is also an essential aspect of asset allocation. For younger investors, an emphasis on equities - which historically have been the best-performing asset class over time - is encouraged. As investors near their specific goal, such as retirement or sending a child to college, consideration may be given to replacing volatile assets (e.g. common stocks) with more-stable fixed investments (bonds or savings plans).
A third principle - investing regularly - can help lower the average cost of your purchases. Investing a certain amount of money each month or quarter helps ensure you won't pay for all your shares at market highs. This strategy - known as dollar cost averaging - also reduces "emotion" from investing, helping shareholders avoid selling weak performers just prior to an upswing, or chasing a hot performer just before a correction.
We invite you to contact us via the Internet, through our Investor Centers or by phone. It is our privilege to provide you the information you need to make the investments that are right for you.
Sincerely,
(The chairman's signature appears here.)
Edward C. Johnson 3d
Annual Report
Average annual total return reflects the change in the value of an investment, assuming reinvestment of the class' distributions from dividend income and capital gains (the profits earned upon the sale of securities that have grown in value, if any) and assuming a constant rate of performance each year. The $10,000 table and the fund's returns do not reflect the deduction of taxes that a shareholder would pay on fund distributions or the redemption of fund shares. During periods of reimbursement by Fidelity, a fund's total return will be greater than it would be had the reimbursement not occurred. How a fund did yesterday is no guarantee of how it will do tomorrow. Returns reflect the conversion of Class B shares to Class A shares after a maximum of seven years.
Average Annual Total Returns
Periods ended October 31, 2010 | Past 1
year | Past 5
years | Past 10 years |
Class A (incl. 5.75% sales charge) | 21.14% | 18.26% | 12.95% |
Class T (incl. 3.50% sales charge) | 23.64% | 18.50% | 12.92% |
Class B (incl. contingent deferred sales charge) A | 22.48% | 18.55% | 13.02% |
Class C (incl. contingent deferred sales charge) B | 26.58% | 18.77% | 12.77% |
A Class B shares' contingent deferred sales charges included in the past one year, past five years, and past 10 years total return figures are 5%, 2%, and 0%, respectively.
B Class C shares' contingent deferred sales charge included in the past one year, past five years, and past 10 years total return figures are 1%, 0%, and 0%, respectively.
Annual Report
$10,000 Over 10 Years
Let's say hypothetically that $10,000 was invested in Fidelity AdvisorSM Emerging Asia Fund - Class A on October 31, 2000, and the current 5.75% sales charge was paid. The chart shows how the value of your investment would have changed, and also shows how the MSCI® AC (All Country) Asia ex Japan Index performed over the same period.
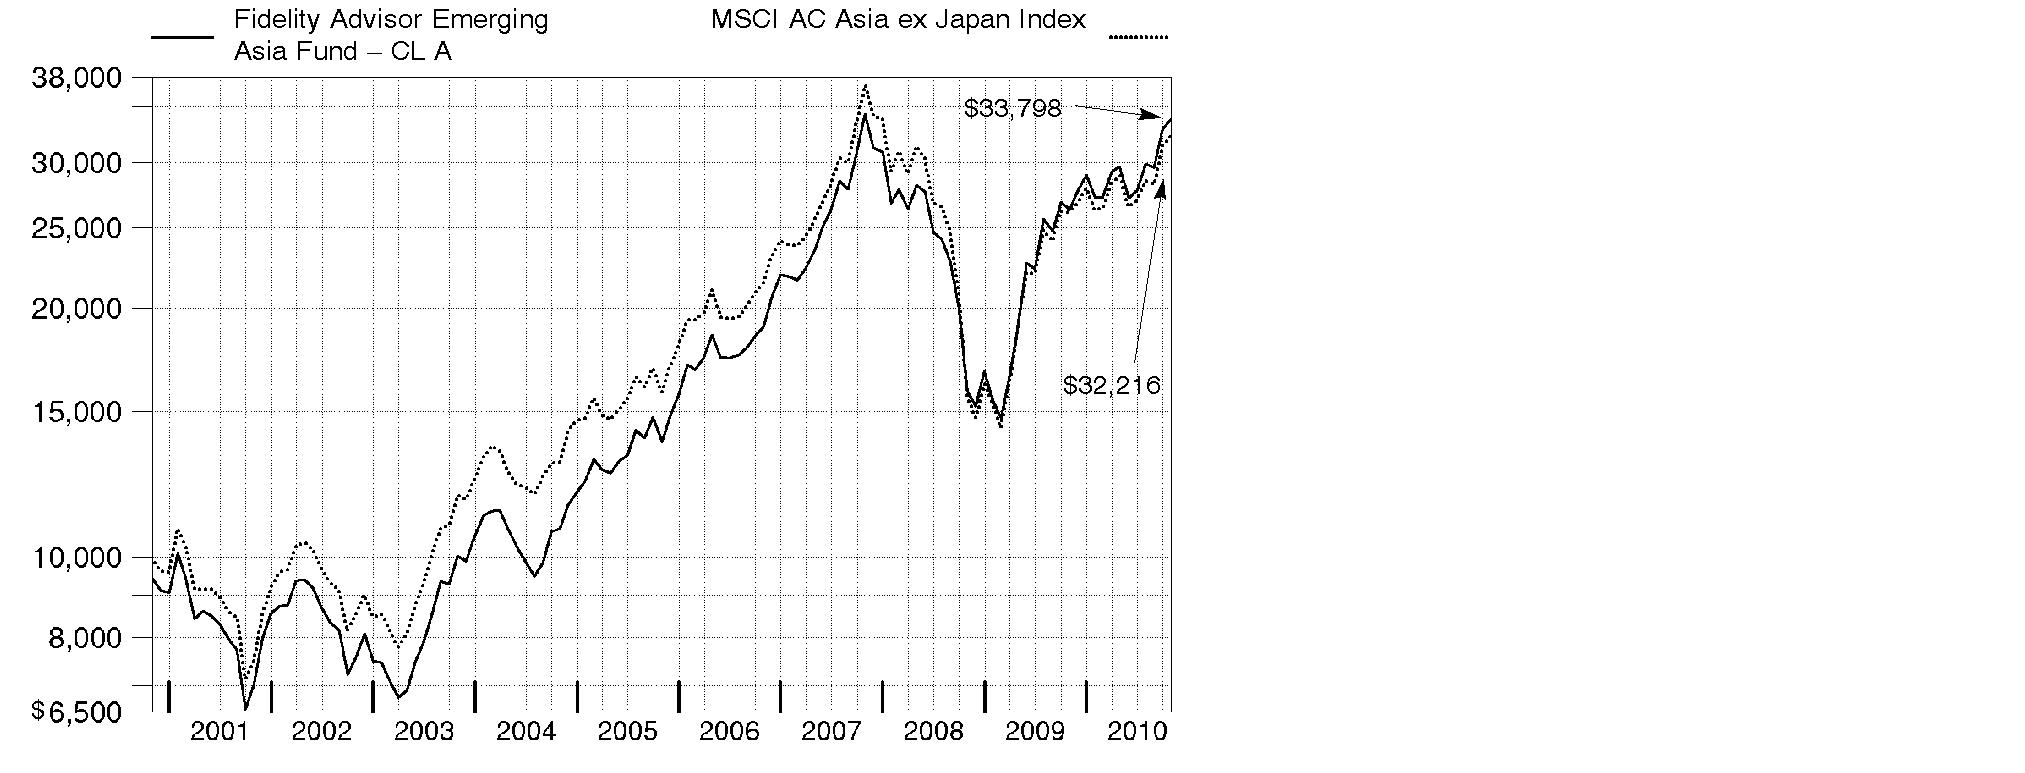
Annual Report
Market Recap: Stock markets in emerging Asia posted solid gains during the past year, reflecting continued healthy growth in the region's economies compared with most developed nations. A favorable backdrop for riskier assets also helped bolster performance, as did the falling value of the U.S. dollar relative to local currencies. For the 12 months ending October 31, 2010, the MSCI® AC (All Country) Asia ex Japan Index returned 23.59%. Among major index components, India and South Korea recorded market-beating results, with returns of roughly 35% and 25%, respectively. One notable standout with a more-modest index weighting was Thailand, which soared to a gain of more than 62%, despite the nation's ongoing political turmoil. On the other hand, sizable index components Taiwan and Hong Kong, with returns of approximately 21% and 17%, respectively, trailed the broader index for the period. With its return of more than 9%, China lagged all other benchmark components, as the government's attempts to tighten credit and keep inflation in check hampered that market's gains. From a sector perspective, consumer discretionary led the pack with a return of 46%, followed by health care and consumer staples. The weakest result came from utilities, which was up only 14%.
Comments from Colin Chickles, Portfolio Manager of Fidelity AdvisorSM Emerging Asia Fund: During the year, the fund's Class A, Class T, Class B and Class C shares returned 28.53%, 28.13%, 27.48% and 27.58%, respectively (excluding sales charges), outpacing the MSCI index. Stock selection in consumer discretionary and financials aided relative performance, as did stock picking in information technology, materials and energy, and an overweighting in consumer discretionary. Geographically, stock selection in India and China contributed the most. Four of the fund's top-five individual contributors were based in India, including motorcycle maker Bajaj Auto, gold/jewelry retailer Titan Industries, lender LIC Housing Finance and Tata Consultancy Services, a provider of technology outsourcing services. Hong Kong-based Pacific Textiles Holdings performed well but was sold from the fund for valuation reasons. Conversely, positioning in consumer staples and telecommunication services modestly detracted. Negative regional influences included security selection in the United Kingdom and an overweighting in China early in the period. China's BaWang International Group Holding, a maker of herbal hair and skin care products, was the biggest detractor and was sold. Underweighting Korea's LG Chemical and not owning casino operator Genting Singapore, both strong performers, also hurt, as did overweighting China Life Insurance. Some stocks mentioned were out-of-benchmark positions.
The views expressed above reflect those of the portfolio manager(s) only through the end of the period as stated on the cover of this report and do not necessarily represent the views of Fidelity or any other person in the Fidelity organization. Any such views are subject to change at any time based upon market or other conditions and Fidelity disclaims any responsibility to update such views. These views may not be relied on as investment advice and, because investment decisions for a Fidelity fund are based on numerous factors, may not be relied on as an indication of trading intent on behalf of any Fidelity fund.
Annual Report
Shareholder Expense Example
As a shareholder of the Fund, you incur two types of costs: (1) transaction costs, including sales charges (loads) on purchase payments or redemption proceeds, redemption fees, and (2) ongoing costs, including management fees, distribution and/or service (12b-1) fees and other Fund expenses. This Example is intended to help you understand your ongoing costs (in dollars) of investing in the Fund and to compare these costs with the ongoing costs of investing in other mutual funds.
The Example is based on an investment of $1,000 invested at the beginning of the period and held for the entire period (May 1, 2010 to October 31, 2010).
Actual Expenses
The first line of the accompanying table for each class of the Fund provides information about actual account values and actual expenses. You may use the information in this line, together with the amount you invested, to estimate the expenses that you paid over the period. Simply divide your account value by $1,000.00 (for example, an $8,600 account value divided by $1,000.00 = 8.6), then multiply the result by the number in the first line for a class of the Fund under the heading entitled "Expenses Paid During Period" to estimate the expenses you paid on your account during this period. In addition, the Fund, as a shareholder in the underlying Fidelity Central Funds, will indirectly bear its pro-rata share of the fees and expenses incurred by the underlying Fidelity Central Funds. These fees and expenses are not included in the Fund's annualized expense ratio used to calculate the expense estimate in the table below.
Hypothetical Example for Comparison Purposes
The second line of the accompanying table for each class of the Fund provides information about hypothetical account values and hypothetical expenses based on a Class' actual expense ratio and an assumed rate of return of 5% per year before expenses, which is not the Class' actual return. The hypothetical account values and expenses may not be used to estimate the actual ending account balance or expenses you paid for the period. You may use this information to compare the ongoing costs of investing in the Fund and other funds. To do so, compare this 5% hypothetical example with the 5% hypothetical examples that appear in the shareholder reports of the other funds. In addition, the Fund, as a shareholder in the underlying Fidelity Central Funds, will indirectly bear its pro-rata share of the fees and expenses incurred by the underlying Fidelity Central Funds. These fees and expenses are not included in the Fund's annualized expense ratio used to calculate the expense estimate in the table below.
Please note that the expenses shown in the table are meant to highlight your ongoing costs only and do not reflect any transaction costs. Therefore, the second line of the table is useful in comparing ongoing costs only, and will not help you determine the relative total costs of owning different funds. In addition, if these transactional costs were included, your costs would have been higher.
Annual Report
| Annualized
Expense Ratio | Beginning
Account Value
May 1, 2010 | Ending
Account Value
October 31, 2010 | Expenses Paid
During Period*
May 1, 2010 to
October 31, 2010 |
Class A | 1.43% | | | |
Actual | | $ 1,000.00 | $ 1,139.30 | $ 7.71 |
HypotheticalA | | $ 1,000.00 | $ 1,018.00 | $ 7.27 |
Class T | 1.74% | | | |
Actual | | $ 1,000.00 | $ 1,137.40 | $ 9.37 |
HypotheticalA | | $ 1,000.00 | $ 1,016.43 | $ 8.84 |
Class B | 2.22% | | | |
Actual | | $ 1,000.00 | $ 1,134.80 | $ 11.95 |
HypotheticalA | | $ 1,000.00 | $ 1,014.01 | $ 11.27 |
Class C | 2.17% | | | |
Actual | | $ 1,000.00 | $ 1,134.70 | $ 11.68 |
HypotheticalA | | $ 1,000.00 | $ 1,014.27 | $ 11.02 |
Institutional Class | 1.13% | | | |
Actual | | $ 1,000.00 | $ 1,140.70 | $ 6.10 |
HypotheticalA | | $ 1,000.00 | $ 1,019.51 | $ 5.75 |
A 5% return per year before expenses
* Expenses are equal to each Class' annualized expense ratio, multiplied by the average account value over the period, multiplied by 184/365 (to reflect the one-half year period).
Annual Report
Investment Changes (Unaudited)
Top Ten Stocks as of October 31, 2010 |
| % of fund's
net assets | % of fund's net assets
6 months ago |
Samsung Electronics Co. Ltd. | 3.7 | 3.5 |
China Mobile (Hong Kong) Ltd. | 3.0 | 3.0 |
Taiwan Semiconductor Manufacturing Co. Ltd. | 2.5 | 1.0 |
China Construction Bank Corp. (H Shares) | 2.5 | 1.9 |
CNOOC Ltd. | 1.9 | 1.8 |
China Life Insurance Co. Ltd. (H Shares) | 1.8 | 1.7 |
Reliance Industries Ltd. | 1.4 | 1.0 |
Formosa Plastics Corp. | 1.3 | 1.0 |
Hon Hai Precision Industry Co. Ltd. (Foxconn) | 1.3 | 1.9 |
Keppel Corp. Ltd. | 1.3 | 0.9 |
| 20.7 | |
Top Five Market Sectors as of October 31, 2010 |
| % of fund's
net assets | % of fund's net assets
6 months ago |
Financials | 32.0 | 29.4 |
Information Technology | 15.8 | 21.5 |
Industrials | 10.4 | 9.4 |
Consumer Discretionary | 9.3 | 8.9 |
Materials | 8.3 | 7.1 |
Asset Allocation (% of fund's net assets) |
As of October 31, 2010 | As of April 30, 2010 |
| Stocks 97.3% | | | Stocks 95.7% | |
| Short-Term
Investments and
Net Other Assets 2.7% | | | Short-Term
Investments and
Net Other Assets 4.3% | |

Annual Report
Investments October 31, 2010
Showing Percentage of Net Assets
Common Stocks - 97.3% |
| Shares | | Value |
Australia - 0.1% |
Wesfarmers Ltd. | 17,600 | | $ 571,395 |
Bermuda - 1.9% |
Beijing Enterprises Water Group Ltd. (a) | 1,004,000 | | 351,020 |
China Green (Holdings) Ltd. | 525,000 | | 538,462 |
China Yurun Food Group Ltd. | 576,000 | | 2,240,464 |
Huabao International Holdings Ltd. | 837,000 | | 1,261,237 |
Jardine Matheson Holdings Ltd. | 39,600 | | 1,782,000 |
Jinhui Shipping & Transportation Ltd. (a) | 78,000 | | 310,174 |
Noble Group Ltd. | 992,272 | | 1,425,965 |
TOTAL BERMUDA | | 7,909,322 |
British Virgin Islands - 0.1% |
ReneSola Ltd. sponsored ADR (a)(d) | 46,000 | | 550,620 |
Canada - 0.2% |
Niko Resources Ltd. | 9,300 | | 887,234 |
Cayman Islands - 4.0% |
Ausnutria Dairy Hunan Co. Ltd. (H Shares) | 203,000 | | 93,496 |
Belle International Holdings Ltd. | 1,259,000 | | 2,273,956 |
Central China Real Estate Ltd. | 3,788,000 | | 860,104 |
Chaoda Modern Agriculture (Holdings) Ltd. | 2,062,000 | | 1,681,257 |
China Digital TV Holding Co. Ltd. ADR (a) | 47,400 | | 311,892 |
China Infrastructure Machinery Holdings Ltd. | 524,000 | | 281,224 |
China Lilang Ltd. | 727,000 | | 1,136,751 |
Country Garden Holdings Co. Ltd. | 2,537,000 | | 896,808 |
Enn Energy Holdings Ltd. | 302,000 | | 907,802 |
International Taifeng Holdings Ltd. | 470,000 | | 271,647 |
JA Solar Holdings Co. Ltd. ADR (a) | 232,280 | | 1,939,538 |
Kingboard Chemical Holdings Ltd. | 460,500 | | 2,239,748 |
Maoye International Holdings Ltd. | 849,000 | | 365,833 |
Mecox Lane Ltd. ADR | 1,300 | | 21,229 |
Peak Sport Products Co. Ltd. | 372,000 | | 296,592 |
Shenguan Holdings Group Ltd. | 570,000 | | 742,719 |
Shui On Land Ltd. | 2,588,500 | | 1,299,050 |
SouFun Holdings Ltd. ADR | 600 | | 44,100 |
TPK Holdings Co. | 1,000 | | 16,501 |
Trina Solar Ltd. ADR (a)(d) | 18,600 | | 497,736 |
Youyuan International Holdings Ltd. | 518,000 | | 231,893 |
TOTAL CAYMAN ISLANDS | | 16,409,876 |
China - 15.3% |
Air China Ltd. (H Shares) (a) | 1,458,000 | | 1,959,988 |
Bank of China Ltd. (H Shares) | 4,260,000 | | 2,550,092 |
Common Stocks - continued |
| Shares | | Value |
China - continued |
Bank of Communications Co. Ltd. (H Shares) | 2,023,000 | | $ 2,210,587 |
China Communications Construction Co. Ltd. (H Shares) | 1,346,000 | | 1,286,742 |
China Communications Services Corp. Ltd. (H Shares) | 1,002,000 | | 584,298 |
China Construction Bank Corp. (H Shares) | 10,753,000 | | 10,251,852 |
China Life Insurance Co. Ltd. (H Shares) | 1,725,000 | | 7,583,594 |
China Merchants Bank Co. Ltd. (H Shares) | 1,157,500 | | 3,285,277 |
China Metal Recycling (Holdings) Ltd. | 541,800 | | 603,223 |
China Minsheng Banking Corp. Ltd. (H Shares) | 2,065,000 | | 1,920,806 |
China Petroleum & Chemical Corp. (H Shares) | 5,236,000 | | 4,981,862 |
China Railway Group Ltd. | 1,348,000 | | 1,086,921 |
China Southern Airlines Ltd. (H Shares) (a) | 506,000 | | 344,025 |
Dalian Port (PDA) Co. Ltd. (H Shares) | 618,000 | | 267,092 |
Digital China Holdings Ltd. (H Shares) | 900,000 | | 1,625,544 |
Dongfeng Motor Group Co. Ltd. (H Shares) | 1,128,000 | | 2,444,819 |
Great Wall Motor Co. Ltd. (H Shares) | 252,500 | | 793,211 |
Harbin Power Equipment Co. Ltd. (H Shares) | 766,000 | | 1,031,710 |
Huadian Power International Corp. Ltd. (H shares) | 4,672,000 | | 1,072,880 |
Huaneng Power International, Inc. (H Shares) | 4,454,000 | | 2,547,934 |
Industrial & Commercial Bank of China Ltd. (H Shares) | 4,028,000 | | 3,242,667 |
PICC Property & Casualty Co. Ltd. (H Shares) (a) | 1,350,000 | | 1,992,453 |
Ping An Insurance Group Co. China Ltd. (H Shares) | 489,500 | | 5,269,960 |
Sina Corp. (a) | 2,200 | | 123,860 |
Sinotrans Ltd. (H Shares) | 4,213,000 | | 1,135,968 |
Tencent Holdings Ltd. | 38,700 | | 886,212 |
Weichai Power Co. Ltd. (H Shares) | 100,000 | | 1,313,337 |
Xinjiang Goldwind Science & Technology Co. Ltd. (H Shares) (a) | 67,200 | | 173,825 |
Zhongpin, Inc. (a)(d) | 19,500 | | 394,290 |
TOTAL CHINA | | 62,965,029 |
Hong Kong - 14.1% |
Cathay Pacific Airways Ltd. | 1,086,000 | | 2,921,219 |
Cheung Kong Holdings Ltd. | 320,000 | | 4,871,472 |
China Everbright Ltd. | 318,000 | | 826,667 |
China Mobile (Hong Kong) Ltd. | 1,203,500 | | 12,290,520 |
China Resources Power Holdings Co. Ltd. | 1,286,000 | | 2,475,358 |
Citic Pacific Ltd. | 681,000 | | 1,814,243 |
CLP Holdings Ltd. | 514,500 | | 4,181,713 |
CNOOC Ltd. | 3,704,500 | | 7,733,952 |
First Pacific Co. Ltd. | 388,000 | | 358,905 |
Galaxy Entertainment Group Ltd. (a) | 320,000 | | 301,371 |
Hang Lung Group Ltd. | 372,000 | | 2,469,202 |
Common Stocks - continued |
| Shares | | Value |
Hong Kong - continued |
Hang Seng Bank Ltd. | 248,200 | | $ 3,631,141 |
Henderson Land Development Co. Ltd. | 1,390 | | 9,872 |
Hongkong Land Holdings Ltd. | 435,000 | | 3,001,500 |
Hysan Development Co. Ltd. | 599,000 | | 2,314,472 |
PCCW Ltd. | 4,464,000 | | 1,704,685 |
Swire Pacific Ltd. (A Shares) | 182,000 | | 2,582,809 |
Wharf Holdings Ltd. | 696,000 | | 4,570,411 |
TOTAL HONG KONG | | 58,059,512 |
India - 11.1% |
Apollo Tyres Ltd. | 455,823 | | 735,796 |
Asian Paints India Ltd. | 22,411 | | 1,358,943 |
Bajaj Auto Ltd. | 32,896 | | 1,121,358 |
Bank of Baroda | 75,638 | | 1,794,619 |
Bank of India | 68,795 | | 755,154 |
Bharti Airtel Ltd. | 150,431 | | 1,105,197 |
Cadila Healthcare Ltd. | 90,301 | | 1,422,508 |
Canara Bank | 69,757 | | 1,135,469 |
Ess Dee Aluminium Ltd. | 87,436 | | 936,300 |
HDFC Bank Ltd. | 57,149 | | 2,945,844 |
Hindalco Industries Ltd. | 314,128 | | 1,491,798 |
ICSA (India) Ltd. | 186,602 | | 545,808 |
IFCI Ltd. | 347,735 | | 542,490 |
Indian Oil Corp. Ltd. | 144,385 | | 1,361,763 |
Indian Overseas Bank | 93,478 | | 337,006 |
Jubilant Life Sciences Ltd. | 117,476 | | 830,217 |
Larsen & Toubro Ltd. | 44,269 | | 2,025,238 |
LIC Housing Finance Ltd. | 18,918 | | 572,149 |
Mahindra & Mahindra Ltd. | 122,838 | | 2,033,305 |
Oil & Natural Gas Corp. Ltd. | 55,142 | | 1,622,288 |
Oriental Bank of Commerce | 74,575 | | 839,379 |
Patni Computer Systems Ltd. | 158,817 | | 1,659,341 |
Reliance Industries Ltd. | 231,988 | | 5,737,549 |
Rural Electrification Corp. Ltd. | 284,104 | | 2,375,706 |
State Bank of India | 28,897 | | 2,053,985 |
Sun TV Ltd. | 71,692 | | 807,576 |
Tata Consultancy Services Ltd. | 132,969 | | 3,158,558 |
Titan Industries Ltd. | 12,572 | | 1,007,504 |
Tulip Telecom Ltd. | 203,154 | | 817,887 |
Union Bank of India | 116,851 | | 1,003,173 |
Voltas Ltd. | 110,325 | | 610,303 |
Common Stocks - continued |
| Shares | | Value |
India - continued |
Zee Entertainment Enterprises Ltd. | 140,469 | | $ 875,297 |
Zee Learn Ltd. (a) | 35,117 | | 10,299 |
TOTAL INDIA | | 45,629,807 |
Indonesia - 2.5% |
PT Astra International Tbk | 414,000 | | 2,640,333 |
PT Bank Negara Indonesia (Persero) Tbk | 3,610,000 | | 1,575,271 |
PT Bank Rakyat Indonesia Tbk | 2,828,500 | | 3,607,817 |
PT BISI International Tbk (a) | 2,542,500 | | 668,517 |
PT Indofood Sukses Makmur Tbk | 1,696,000 | | 986,763 |
PT XL Axiata Tbk (a) | 1,025,500 | | 659,762 |
TOTAL INDONESIA | | 10,138,463 |
Korea (South) - 19.0% |
Asiana Airlines, Inc. (a) | 40,610 | | 330,441 |
Busan Bank | 167,700 | | 2,087,861 |
Cheil Worldwide, Inc. | 90,840 | | 989,586 |
CJ CheilJedang Corp. | 7,076 | | 1,362,342 |
CJ Corp. | 30,390 | | 2,143,110 |
CJ Home Shopping (a) | 3,650 | | 823,806 |
Daegu Bank Co. Ltd. | 92,800 | | 1,217,252 |
Daelim Industrial Co. | 13,373 | | 1,089,343 |
Dongbu Insurance Co. Ltd. | 22,820 | | 805,650 |
Doosan Co. Ltd. | 8,555 | | 1,152,585 |
Doosan Construction & Engineering Co. Ltd. | 105,020 | | 691,105 |
Duksan Hi-Metal Co. Ltd. (a) | 71,235 | | 1,476,012 |
GS Holdings Corp. | 73,700 | | 3,866,874 |
Halla Climate Control Co. | 43,640 | | 811,095 |
Hanwha Chemical Corp. | 36,980 | | 1,004,659 |
Hanwha Corp. | 37,120 | | 1,401,284 |
Honam Petrochemical Corp. | 8,704 | | 1,919,601 |
Hyosung Corp. | 6,059 | | 673,521 |
Hyundai Department Store Co. Ltd. | 3,735 | | 413,524 |
Hyundai Mipo Dockyard Co. Ltd. | 5,301 | | 886,250 |
Hyundai Mobis | 17,634 | | 4,390,858 |
Hyundai Motor Co. | 33,086 | | 5,001,885 |
Hyundai Steel Co. | 19,080 | | 1,849,462 |
Industrial Bank of Korea | 190,600 | | 2,737,385 |
Kia Motors Corp. | 66,300 | | 2,647,283 |
Korea Zinc Co. Ltd. | 5,051 | | 1,273,418 |
Kyeryong Construction Industrial Co. Ltd. | 11,900 | | 200,538 |
LG Chemical Ltd. | 12,328 | | 3,804,193 |
Common Stocks - continued |
| Shares | | Value |
Korea (South) - continued |
LG Corp. | 33,474 | | $ 2,396,315 |
LIG Non-Life Insurance Co. Ltd. | 51,310 | | 1,060,878 |
Lotte Shopping Co. Ltd. | 5,912 | | 2,421,054 |
Meritz Fire & Marine Insurance Co. Ltd. | 32,950 | | 226,211 |
POSCO | 11,765 | | 4,858,983 |
Samsung Electronics Co. Ltd. | 23,163 | | 15,345,863 |
SK Telecom Co. Ltd. | 34,493 | | 5,253,527 |
TOTAL KOREA (SOUTH) | | 78,613,754 |
Malaysia - 2.7% |
AMMB Holdings Bhd | 823,600 | | 1,673,144 |
Axiata Group Bhd (a) | 1,425,200 | | 2,056,942 |
Genting Malaysia Bhd | 1,470,500 | | 1,654,372 |
Glomac Bhd | 351,000 | | 180,521 |
Malayan Banking Bhd | 1,120,900 | | 3,242,719 |
Public Bank Bhd (For. Reg.) | 569,400 | | 2,335,437 |
TOTAL MALAYSIA | | 11,143,135 |
Mauritius - 0.5% |
Golden Agri-Resources Ltd. | 3,810,000 | | 1,913,389 |
Philippines - 0.2% |
Megaworld Corp. | 5,560,000 | | 331,786 |
Universal Robina Corp. | 382,000 | | 386,897 |
TOTAL PHILIPPINES | | 718,683 |
Singapore - 5.6% |
CapitaLand Ltd. | 669,000 | | 2,010,670 |
Ezra Holdings Ltd. | 256,800 | | 347,215 |
Keppel Corp. Ltd. | 687,000 | | 5,297,273 |
Keppel Land Ltd. | 509,000 | | 1,742,154 |
MobileOne Ltd. | 544,000 | | 933,076 |
Oversea-Chinese Banking Corp. Ltd. | 500,209 | | 3,482,101 |
Raffles Medical Group Ltd. | 349,000 | | 587,824 |
SembCorp Industries Ltd. | 861,000 | | 3,046,728 |
SembCorp Marine Ltd. | 577,000 | | 2,050,684 |
Singapore Exchange Ltd. | 296,000 | | 2,012,516 |
United Overseas Bank Ltd. | 3,017 | | 43,450 |
Yangzijiang Shipbuilding Holdings Ltd. | 550,000 | | 794,638 |
Yanlord Land Group Ltd. | 739,000 | | 982,060 |
TOTAL SINGAPORE | | 23,330,389 |
Common Stocks - continued |
| Shares | | Value |
Taiwan - 14.1% |
Cando Corp. (a) | 188,339 | | $ 146,770 |
China Airlines Ltd. (a) | 1,000,000 | | 779,284 |
Chroma ATE, Inc. | 739,896 | | 1,905,042 |
Compal Electronics, Inc. | 2,271,836 | | 2,895,004 |
Delta Electronics, Inc. | 691,000 | | 2,856,118 |
Far East Department Stores Co. Ltd. | 858,900 | | 1,066,434 |
Farglory Land Development Co. Ltd. | 414,000 | | 1,028,067 |
Formosa Chemicals & Fibre Corp. | 1,291,000 | | 3,703,637 |
Formosa Plastics Corp. | 1,891,000 | | 5,424,924 |
Fubon Financial Holding Co. Ltd. | 3,570,549 | | 4,374,958 |
Hon Hai Precision Industry Co. Ltd. (Foxconn) | 1,414,000 | | 5,359,386 |
HTC Corp. | 146,750 | | 3,313,323 |
Huaku Development Co. Ltd. | 340,971 | | 945,873 |
Hung Poo Real Estate Development Co. Ltd. | 857,000 | | 1,275,489 |
Insyde Software Corp. | 176,195 | | 551,527 |
King Slide Works Co. Ltd. | 59,850 | | 276,712 |
Macronix International Co. Ltd. | 3,214,000 | | 1,979,543 |
Powertech Technology, Inc. | 451,000 | | 1,488,352 |
Taishin Financial Holdings Co. Ltd. | 7,324,890 | | 3,207,108 |
Taiwan Cement Corp. | 804,000 | | 856,409 |
Taiwan Semiconductor Manufacturing Co. Ltd. | 5,012,393 | | 10,317,619 |
Tripod Technology Corp. | 398,000 | | 1,528,018 |
U-Ming Marine Transport Corp. | 431,000 | | 887,208 |
Wistron Corp. | 1,024,000 | | 2,104,545 |
TOTAL TAIWAN | | 58,271,350 |
Thailand - 4.9% |
Advanced Info Service PCL (For. Reg.) | 209,200 | | 628,858 |
Asian Property Development PCL (For. Reg.) | 1,197,500 | | 263,978 |
Bangkok Bank Public Co. Ltd.: | | | |
(For. Reg.) | 387,900 | | 2,001,688 |
NVDR | 163,000 | | 811,189 |
Banpu PCL unit | 156,000 | | 4,032,866 |
BEC World PCL (For. Reg.) | 968,100 | | 1,075,128 |
C.P. Seven Eleven PCL | 964,900 | | 1,434,137 |
Charoen Pokphand Foods PCL (For. Reg.) | 1,516,900 | | 1,180,487 |
Electricity Generating PCL: | | | |
unit | 166,300 | | 533,226 |
(For. Reg.) | 393,700 | | 1,262,365 |
LPN Development PCL | 652,300 | | 252,728 |
National Finance PCL (For. Reg.) | 1,089,100 | | 1,436,855 |
Preuksa Real Estate PCL (For. Reg.) | 656,100 | | 473,339 |
Common Stocks - continued |
| Shares | | Value |
Thailand - continued |
PTT Aromatics & Refining PLC | 1,836,500 | | $ 1,824,846 |
Quality Houses PCL | 6,187,000 | | 479,420 |
Siam Cement PCL (For. Reg.) | 169,700 | | 1,864,773 |
Supalai PCL (For. Reg.) | 2,140,000 | | 857,715 |
TOTAL THAILAND | | 20,413,598 |
United Kingdom - 0.9% |
HSBC Holdings PLC (Hong Kong) | 270,828 | | 2,822,957 |
Vedanta Resources PLC | 25,100 | | 834,440 |
TOTAL UNITED KINGDOM | | 3,657,397 |
United States of America - 0.1% |
China Natural Gas, Inc. (a)(d) | 13,300 | | 82,061 |
Cognizant Technology Solutions Corp. Class A (a) | 2,900 | | 189,051 |
TOTAL UNITED STATES OF AMERICA | | 271,112 |
TOTAL COMMON STOCKS (Cost $321,814,732) | 401,454,065 |
Money Market Funds - 2.3% |
| | | |
Fidelity Cash Central Fund, 0.23% (b) | 8,492,417 | | 8,492,417 |
Fidelity Securities Lending Cash Central Fund, 0.24% (b)(c) | 1,122,900 | | 1,122,900 |
TOTAL MONEY MARKET FUNDS (Cost $9,615,317) | 9,615,317 |
TOTAL INVESTMENT PORTFOLIO - 99.6% (Cost $331,430,049) | | 411,069,382 |
NET OTHER ASSETS (LIABILITIES) - 0.4% | | 1,547,700 |
NET ASSETS - 100% | $ 412,617,082 |
Legend |
(a) Non-income producing |
(b) Affiliated fund that is available only to investment companies and other accounts managed by Fidelity Investments. The rate quoted is the annualized seven-day yield of the fund at period end. A complete unaudited listing of the fund's holdings as of its most recent quarter end is available upon request. In addition, each Fidelity Central Fund's financial statements, which are not covered by the Fund's report of Independent Registered Public Accounting Firm, are available on the SEC's website or upon request. |
(c) Investment made with cash collateral received from securities on loan. |
(d) Security or a portion of the security is on loan at period end. |
Affiliated Central Funds |
Information regarding fiscal year to date income earned by the Fund from investments in Fidelity Central Funds is as follows: |
Fund | Income earned |
Fidelity Cash Central Fund | $ 14,419 |
Fidelity Securities Lending Cash Central Fund | 44,746 |
Total | $ 59,165 |
Other Information |
The following is a summary of the inputs used, as of October 31, 2010, involving the Fund's assets and liabilities carried at fair value. The inputs or methodology used for valuing securities may not be an indication of the risk associated with investing in those securities. For more information on valuation inputs, and their aggregation into the levels used in the tables below, please refer to the Security Valuation section in the accompanying Notes to Financial Statements. |
Valuation Inputs at Reporting Date: |
Description | Total | Level 1 | Level 2 | Level 3 |
Investments in Securities: | | | | |
Equities: | | | | |
Korea (South) | $ 78,613,754 | $ 68,501,244 | $ 10,112,510 | $ - |
China | 62,965,029 | 47,851,639 | 15,113,390 | - |
Taiwan | 58,271,350 | 47,953,731 | 10,317,619 | - |
Hong Kong | 58,059,512 | 38,035,040 | 20,024,472 | - |
India | 45,629,807 | 37,480,735 | 8,138,773 | 10,299 |
Singapore | 23,330,389 | 23,330,389 | - | - |
Thailand | 20,413,598 | 20,413,598 | - | - |
Cayman Islands | 16,409,876 | 16,409,876 | - | - |
Malaysia | 11,143,135 | 11,143,135 | - | - |
Other | 26,617,615 | 23,794,658 | 2,822,957 | - |
Money Market Funds | 9,615,317 | 9,615,317 | - | - |
Total Investments in Securities: | $ 411,069,382 | $ 344,529,362 | $ 66,529,721 | $ 10,299 |
The following is a reconciliation of Investments in Securities for which Level 3 inputs were used in determining value: |
Investments in Securities: | |
Beginning Balance | $ - |
Total Realized Gain (Loss) | - |
Total Unrealized Gain (Loss) | - |
Cost of Purchases | 10,299 |
Proceeds of Sales | - |
Amortization/Accretion | - |
Transfers in to Level 3 | - |
Transfers out of Level 3 | - |
Ending Balance | $ 10,299 |
The change in unrealized gain (loss) for the period attributable to Level 3 securities held at October 31, 2010 | $ - |
The information used in the above reconciliation represents fiscal year to date activity for any Investments in Securities identified as using Level 3 inputs at either the beginning or the end of the current fiscal period. Transfers in or out of Level 3 represent the beginning value of any Security or Instrument where a change in the pricing level occurred from the beginning to the end of the period. The cost of purchases and the proceeds of sales may include securities received or delivered through corporate actions or exchanges. Realized and unrealized gains (losses) disclosed in the reconciliation are included in Net Gain (Loss) on the Fund's Statement of Operations. |
See accompanying notes which are an integral part of the financial statements.
Annual Report
Statement of Assets and Liabilities
| October 31, 2010 |
| | |
Assets | | |
Investment in securities, at value (including securities loaned of $1,069,128) - See accompanying schedule: Unaffiliated issuers (cost $321,814,732) | $ 401,454,065 | |
Fidelity Central Funds (cost $9,615,317) | 9,615,317 | |
Total Investments (cost $331,430,049) | | $ 411,069,382 |
Foreign currency held at value (cost $22,603) | | 22,634 |
Receivable for investments sold | | 1,832,733 |
Receivable for fund shares sold | | 1,451,748 |
Dividends receivable | | 199,927 |
Distributions receivable from Fidelity Central Funds | | 6,645 |
Other receivables | | 311,868 |
Total assets | | 414,894,937 |
| | |
Liabilities | | |
Payable for fund shares redeemed | $ 537,465 | |
Accrued management fee | 239,296 | |
Distribution and service plan fees payable | 159,773 | |
Other affiliated payables | 97,577 | |
Other payables and accrued expenses | 120,844 | |
Collateral on securities loaned, at value | 1,122,900 | |
Total liabilities | | 2,277,855 |
| | |
Net Assets | | $ 412,617,082 |
Net Assets consist of: | | |
Paid in capital | | $ 308,680,969 |
Undistributed net investment income | | 1,972,932 |
Accumulated undistributed net realized gain (loss) on investments and foreign currency transactions | | 22,311,022 |
Net unrealized appreciation (depreciation) on investments and assets and liabilities in foreign currencies | | 79,652,159 |
Net Assets | | $ 412,617,082 |
See accompanying notes which are an integral part of the financial statements.
Annual Report
Financial Statements - continued
Statement of Assets and Liabilities - continued
| October 31, 2010 |
| | |
Calculation of Maximum Offering Price Class A:
Net Asset Value and redemption price per share ($189,254,827 ÷ 5,741,073 shares) | | $ 32.97 |
| | |
Maximum offering price per share (100/94.25 of $32.97) | | $ 34.98 |
Class T:
Net Asset Value and redemption price per share ($61,619,507 ÷ 1,913,837 shares) | | $ 32.20 |
| | |
Maximum offering price per share (100/96.50 of $32.20) | | $ 33.37 |
Class B:
Net Asset Value and offering price per share ($29,611,355 ÷ 964,059 shares)A | | $ 30.72 |
| | |
Class C:
Net Asset Value and offering price per share ($87,088,942 ÷ 2,847,675 shares)A | | $ 30.58 |
| | |
Institutional Class:
Net Asset Value, offering price and redemption price per share ($45,042,451 ÷ 1,332,662 shares) | | $ 33.80 |
A Redemption price per share is equal to net asset value less any applicable contingent deferred sales charge.
See accompanying notes which are an integral part of the financial statements.
Annual Report
Statement of Operations
| Year ended October 31, 2010 |
| | |
Investment Income | | |
Dividends | | $ 8,449,311 |
Interest | | 50 |
Income from Fidelity Central Funds | | 59,165 |
Income before foreign taxes withheld | | 8,508,526 |
Less foreign taxes withheld | | (876,943) |
Total income | | 7,631,583 |
| | |
Expenses | | |
Management fee | $ 2,397,259 | |
Transfer agent fees | 900,588 | |
Distribution and service plan fees | 1,615,364 | |
Accounting and security lending fees | 175,511 | |
Custodian fees and expenses | 378,039 | |
Independent trustees' compensation | 1,856 | |
Registration fees | 71,295 | |
Audit | 103,825 | |
Legal | 1,509 | |
Interest | 1,167 | |
Miscellaneous | 3,691 | |
Total expenses before reductions | 5,650,104 | |
Expense reductions | (137,688) | 5,512,416 |
Net investment income (loss) | | 2,119,167 |
Realized and Unrealized Gain (Loss) Net realized gain (loss) on: | | |
Investment securities: | | |
Unaffiliated issuers | 58,247,481 | |
Foreign currency transactions | (133,318) | |
Total net realized gain (loss) | | 58,114,163 |
Change in net unrealized appreciation (depreciation) on: Investment securities | 23,745,972 | |
Assets and liabilities in foreign currencies | 21,285 | |
Total change in net unrealized appreciation (depreciation) | | 23,767,257 |
Net gain (loss) | | 81,881,420 |
Net increase (decrease) in net assets resulting from operations | | $ 84,000,587 |
See accompanying notes which are an integral part of the financial statements.
Annual Report
Financial Statements - continued
Statement of Changes in Net Assets
| Year ended
October 31,
2010 | Year ended
October 31,
2009 |
Increase (Decrease) in Net Assets | | |
Operations | | |
Net investment income (loss) | $ 2,119,167 | $ 1,327,380 |
Net realized gain (loss) | 58,114,163 | (7,124,629) |
Change in net unrealized appreciation (depreciation) | 23,767,257 | 100,271,241 |
Net increase (decrease) in net assets resulting
from operations | 84,000,587 | 94,473,992 |
Distributions to shareholders from net investment income | (971,544) | (378,765) |
Distributions to shareholders from net realized gain | (2,532,430) | - |
Total distributions | (3,503,974) | (378,765) |
Share transactions - net increase (decrease) | 46,082,399 | 41,327,444 |
Redemption fees | 86,566 | 52,262 |
Total increase (decrease) in net assets | 126,665,578 | 135,474,933 |
| | |
Net Assets | | |
Beginning of period | 285,951,504 | 150,476,571 |
End of period (including undistributed net investment income of $1,972,932 and undistributed net investment income of $948,615, respectively) | $ 412,617,082 | $ 285,951,504 |
See accompanying notes which are an integral part of the financial statements.
Annual Report
Financial Highlights - Class A
Years ended October 31, | 2010 | 2009 | 2008 | 2007 | 2006 |
Selected Per-Share Data | | | | | |
Net asset value, beginning of period | $ 25.96 | $ 15.74 | $ 37.55 | $ 22.48 | $ 17.70 |
Income from Investment Operations | | | | | |
Net investment income (loss) C | .25 | .19 | .19 | .24 | .22 |
Net realized and unrealized gain (loss) | 7.09 | 10.07 | (18.72) | 16.64 | 6.10 |
Total from investment operations | 7.34 | 10.26 | (18.53) | 16.88 | 6.32 |
Distributions from net investment income | (.12) | (.05) | (.23) | (.15) | (.16) |
Distributions from net realized gain | (.22) | - | (3.06) | (1.68) | (1.39) |
Total distributions | (.34) | (.05) | (3.29) | (1.83) | (1.55) |
Redemption fees added to paid in capital C | .01 | .01 | .01 | .02 | .01 |
Net asset value, end of period | $ 32.97 | $ 25.96 | $ 15.74 | $ 37.55 | $ 22.48 |
Total Return A, B | 28.53% | 65.43% | (53.66)% | 80.43% | 38.02% |
Ratios to Average Net Assets D, F | | | | | |
Expenses before reductions | 1.44% | 1.54% | 1.50% | 1.47% | 1.73% |
Expenses net of fee waivers, if any | 1.44% | 1.50% | 1.50% | 1.47% | 1.50% |
Expenses net of all reductions | 1.40% | 1.41% | 1.41% | 1.40% | 1.39% |
Net investment income (loss) | .86% | .94% | .73% | .88% | 1.08% |
Supplemental Data | | | | | |
Net assets, end of period (000 omitted) | $ 189,255 | $ 131,564 | $ 71,722 | $ 152,630 | $ 55,790 |
Portfolio turnover rate E | 138% | 91% | 92% G | 66% | 77% |
A Total returns would have been lower had certain expenses not been reduced during the periods shown.
B Total returns do not include the effect of the sales charges.
C Calculated based on average shares outstanding during the period.
D Fees and expenses of the underlying Fidelity Central Funds are not included in the Fund's expense ratio. The Fund indirectly bears its proportionate share of the expenses of any underlying Fidelity Central Funds.
E Amount does not include the portfolio activity of any underlying Fidelity Central Funds.
F Expense ratios reflect operating expenses of the class. Expenses before reductions do not reflect amounts reimbursed by the investment adviser or reductions from brokerage service arrangements or reductions from other expense offset arrangements and do not represent the amount paid by the class during periods when reimbursements or reductions occur. Expenses net of fee waivers reflect expenses after reimbursement by the investment adviser but prior to reductions from brokerage service arrangements or other expense offset arrangements. Expenses net of all reductions represent the net expenses paid by the class.
G The portfolio turnover rate does not include the assets acquired in the merger.
See accompanying notes which are an integral part of the financial statements.
Annual Report
Financial Highlights - Class T
Years ended October 31, | 2010 | 2009 | 2008 | 2007 | 2006 |
Selected Per-Share Data | | | | | |
Net asset value, beginning of period | $ 25.40 | $ 15.43 | $ 36.88 | $ 22.13 | $ 17.45 |
Income from Investment Operations | | | | | |
Net investment income (loss) C | .15 | .14 | .12 | .16 | .17 |
Net realized and unrealized gain (loss) | 6.94 | 9.86 | (18.38) | 16.37 | 6.01 |
Total from investment operations | 7.09 | 10.00 | (18.26) | 16.53 | 6.18 |
Distributions from net investment income | (.08) | (.04) | (.14) | (.12) | (.12) |
Distributions from net realized gain | (.22) | - | (3.06) | (1.68) | (1.39) |
Total distributions | (.30) | (.04) | (3.20) | (1.80) | (1.51) |
Redemption fees added to paid in capital C | .01 | .01 | .01 | .02 | .01 |
Net asset value, end of period | $ 32.20 | $ 25.40 | $ 15.43 | $ 36.88 | $ 22.13 |
Total Return A, B | 28.13% | 65.06% | (53.79)% | 79.98% | 37.69% |
Ratios to Average Net Assets D, F | | | | | |
Expenses before reductions | 1.74% | 1.84% | 1.80% | 1.79% | 2.07% |
Expenses net of fee waivers, if any | 1.74% | 1.75% | 1.75% | 1.75% | 1.75% |
Expenses net of all reductions | 1.70% | 1.66% | 1.66% | 1.67% | 1.64% |
Net investment income (loss) | .55% | .69% | .48% | .61% | .83% |
Supplemental Data | | | | | |
Net assets, end of period (000 omitted) | $ 61,620 | $ 45,259 | $ 25,205 | $ 64,813 | $ 28,850 |
Portfolio turnover rate E | 138% | 91% | 92% G | 66% | 77% |
A Total returns would have been lower had certain expenses not been reduced during the periods shown.
B Total returns do not include the effect of the sales charges.
C Calculated based on average shares outstanding during the period.
D Fees and expenses of the underlying Fidelity Central Funds are not included in the Fund's expense ratio. The Fund indirectly bears its proportionate share of the expenses of any underlying Fidelity Central Funds.
E Amount does not include the portfolio activity of any underlying Fidelity Central Funds.
F Expense ratios reflect operating expenses of the class. Expenses before reductions do not reflect amounts reimbursed by the investment adviser or reductions from brokerage service arrangements or reductions from other expense offset arrangements and do not represent the amount paid by the class during periods when reimbursements or reductions occur. Expenses net of fee waivers reflect expenses after reimbursement by the investment adviser but prior to reductions from brokerage service arrangements or other expense offset arrangements. Expenses net of all reductions represent the net expenses paid by the class.
G The portfolio turnover rate does not include the assets acquired in the merger.
See accompanying notes which are an integral part of the financial statements.
Annual Report
Financial Highlights - Class B
Years ended October 31, | 2010 | 2009 | 2008 | 2007 | 2006 |
Selected Per-Share Data | | | | | |
Net asset value, beginning of period | $ 24.29 | $ 14.82 | $ 35.55 | $ 21.42 | $ 16.94 |
Income from Investment Operations | | | | | |
Net investment income (loss) C | .02 | .04 | (.01) | .03 | .06 |
Net realized and unrealized gain (loss) | 6.61 | 9.45 | (17.68) | 15.79 | 5.84 |
Total from investment operations | 6.63 | 9.49 | (17.69) | 15.82 | 5.90 |
Distributions from net investment income | - | (.03) | - | (.03) | (.04) |
Distributions from net realized gain | (.21) | - | (3.05) | (1.68) | (1.39) |
Total distributions | (.21) | (.03) | (3.05) | (1.71) | (1.43) |
Redemption fees added to paid in capital C | .01 | .01 | .01 | .02 | .01 |
Net asset value, end of period | $ 30.72 | $ 24.29 | $ 14.82 | $ 35.55 | $ 21.42 |
Total Return A, B | 27.48% | 64.23% | (54.01)% | 79.01% | 36.99% |
Ratios to Average Net Assets D, F | | | | | |
Expenses before reductions | 2.24% | 2.32% | 2.29% | 2.28% | 2.59% |
Expenses net of fee waivers, if any | 2.24% | 2.25% | 2.25% | 2.25% | 2.25% |
Expenses net of all reductions | 2.20% | 2.16% | 2.16% | 2.17% | 2.14% |
Net investment income (loss) | .06% | .19% | (.02)% | .11% | .33% |
Supplemental Data | | | | | |
Net assets, end of period (000 omitted) | $ 29,611 | $ 25,750 | $ 17,040 | $ 40,775 | $ 18,985 |
Portfolio turnover rate E | 138% | 91% | 92% G | 66% | 77% |
A Total returns would have been lower had certain expenses not been reduced during the periods shown.
B Total returns do not include the effect of the contingent deferred sales charge.
C Calculated based on average shares outstanding during the period.
D Fees and expenses of the underlying Fidelity Central Funds are not included in the Fund's expense ratio. The Fund indirectly bears its proportionate share of the expenses of any underlying Fidelity Central Funds.
E Amount does not include the portfolio activity of any underlying Fidelity Central Funds.
F Expense ratios reflect operating expenses of the class. Expenses before reductions do not reflect amounts reimbursed by the investment adviser or reductions from brokerage service arrangements or reductions from other expense offset arrangements and do not represent the amount paid by the class during periods when reimbursements or reductions occur. Expenses net of fee waivers reflect expenses after reimbursement by the investment adviser but prior to reductions from brokerage service arrangements or other expense offset arrangements. Expenses net of all reductions represent the net expenses paid by the class.
G The portfolio turnover rate does not include the assets acquired in the merger.
See accompanying notes which are an integral part of the financial statements.
Annual Report
Financial Highlights - Class C
Years ended October 31, | 2010 | 2009 | 2008 | 2007 | 2006 |
Selected Per-Share Data | | | | | |
Net asset value, beginning of period | $ 24.19 | $ 14.76 | $ 35.48 | $ 21.39 | $ 16.94 |
Income from Investment Operations | | | | | |
Net investment income (loss) C | .03 | .04 | - H | .04 | .06 |
Net realized and unrealized gain (loss) | 6.59 | 9.41 | (17.63) | 15.76 | 5.84 |
Total from investment operations | 6.62 | 9.45 | (17.63) | 15.80 | 5.90 |
Distributions from net investment income | (.02) | (.03) | (.04) | (.05) | (.07) |
Distributions from net realized gain | (.22) | - | (3.06) | (1.68) | (1.39) |
Total distributions | (.24) | (.03) | (3.10) | (1.73) | (1.46) |
Redemption fees added to paid in capital C | .01 | .01 | .01 | .02 | .01 |
Net asset value, end of period | $ 30.58 | $ 24.19 | $ 14.76 | $ 35.48 | $ 21.39 |
Total Return A, B | 27.58% | 64.21% | (54.02)% | 79.05% | 37.02% |
Ratios to Average Net Assets D, F | | | | | |
Expenses before reductions | 2.17% | 2.28% | 2.25% | 2.21% | 2.46% |
Expenses net of fee waivers, if any | 2.17% | 2.25% | 2.25% | 2.21% | 2.25% |
Expenses net of all reductions | 2.13% | 2.16% | 2.16% | 2.13% | 2.14% |
Net investment income (loss) | .12% | .19% | (.02)% | .14% | .33% |
Supplemental Data | | | | | |
Net assets, end of period (000 omitted) | $ 87,089 | $ 59,491 | $ 30,577 | $ 82,070 | $ 33,047 |
Portfolio turnover rate E | 138% | 91% | 92% G | 66% | 77% |
A Total returns would have been lower had certain expenses not been reduced during the periods shown.
B Total returns do not include the effect of the contingent deferred sales charge.
C Calculated based on average shares outstanding during the period.
D Fees and expenses of the underlying Fidelity Central Funds are not included in the Fund's expense ratio. The Fund indirectly bears its proportionate share of the expenses of any underlying Fidelity Central Funds.
E Amount does not include the portfolio activity of any underlying Fidelity Central Funds.
F Expense ratios reflect operating expenses of the class. Expenses before reductions do not reflect amounts reimbursed by the investment adviser or reductions from brokerage service arrangements or reductions from other expense offset arrangements and do not represent the amount paid by the class during periods when reimbursements or reductions occur. Expenses net of fee waivers reflect expenses after reimbursement by the investment adviser but prior to reductions from brokerage service arrangements or other expense offset arrangements. Expenses net of all reductions represent the net expenses paid by the class.
G The portfolio turnover rate does not include the assets acquired in the merger.
H Amount represents less than $.01 per share.
See accompanying notes which are an integral part of the financial statements.
Annual Report
Financial Highlights - Institutional Class
Years ended October 31, | 2010 | 2009 | 2008 | 2007 | 2006 |
Selected Per-Share Data | | | | | |
Net asset value, beginning of period | $ 26.58 | $ 16.07 | $ 38.25 | $ 22.84 | $ 17.97 |
Income from Investment Operations | | | | | |
Net investment income (loss) B | .34 | .26 | .27 | .34 | .27 |
Net realized and unrealized gain (loss) | 7.26 | 10.29 | (19.09) | 16.92 | 6.19 |
Total from investment operations | 7.60 | 10.55 | (18.82) | 17.26 | 6.46 |
Distributions from net investment income | (.17) | (.05) | (.31) | (.19) | (.21) |
Distributions from net realized gain | (.22) | - | (3.06) | (1.68) | (1.39) |
Total distributions | (.39) | (.05) | (3.37) | (1.87) | (1.60) |
Redemption fees added to paid in capital B | .01 | .01 | .01 | .02 | .01 |
Net asset value, end of period | $ 33.80 | $ 26.58 | $ 16.07 | $ 38.25 | $ 22.84 |
Total Return A | 28.87% | 65.94% | (53.53)% | 80.97% | 38.28% |
Ratios to Average Net Assets C, E | | | | | |
Expenses before reductions | 1.14% | 1.25% | 1.20% | 1.16% | 1.41% |
Expenses net of fee waivers, if any | 1.14% | 1.25% | 1.20% | 1.16% | 1.25% |
Expenses net of all reductions | 1.10% | 1.16% | 1.11% | 1.08% | 1.14% |
Net investment income (loss) | 1.16% | 1.18% | 1.03% | 1.20% | 1.33% |
Supplemental Data | | | | | |
Net assets, end of period (000 omitted) | $ 45,042 | $ 23,888 | $ 5,933 | $ 16,300 | $ 5,086 |
Portfolio turnover rate D | 138% | 91% | 92% F | 66% | 77% |
A Total returns would have been lower had certain expenses not been reduced during the periods shown.
B Calculated based on average shares outstanding during the period.
C Fees and expenses of the underlying Fidelity Central Funds are not included in the Fund's expense ratio. The Fund indirectly bears its proportionate share of the expenses of any underlying Fidelity Central Funds.
D Amount does not include the portfolio activity of any underlying Fidelity Central Funds.
E Expense ratios reflect operating expenses of the class. Expenses before reductions do not reflect amounts reimbursed by the investment adviser or reductions from brokerage service arrangements or reductions from other expense offset arrangements and do not represent the amount paid by the class during periods when reimbursements or reductions occur. Expenses net of fee waivers reflect expenses after reimbursement by the investment adviser but prior to reductions from brokerage service arrangements or other expense offset arrangements. Expenses net of all reductions represent the net expenses paid by the class.
F The portfolio turnover rate does not include the assets acquired in the merger.
See accompanying notes which are an integral part of the financial statements.
Annual Report
Notes to Financial Statements
For the period ended October 31, 2010
1. Organization.
Fidelity Advisor Emerging Asia Fund (the Fund) is a fund of Fidelity Advisor Series VIII (the Trust) and is authorized to issue an unlimited number of shares. The Trust is registered under the Investment Company Act of 1940, as amended (the 1940 Act), as an open-end management investment company organized as a Massachusetts business trust. The Fund offers Class A, Class T, Class C, and Institutional Class shares, each of which has equal rights as to assets and voting privileges. Effective after the close of business on September 1, 2010, Class B shares were closed to new accounts and additional purchases by existing shareholders. Each class has exclusive voting rights with respect to matters that affect that class. Class B shares will automatically convert to Class A shares after a holding period of seven years from the initial date of purchase. Investment income, realized and unrealized capital gains and losses, the common expenses of the Fund, and certain fund-level expense reductions, if any, are allocated on a pro-rata basis to each class based on the relative net assets of each class to the total net assets of the Fund. Each class differs with respect to transfer agent and distribution and service plan fees incurred. Certain expense reductions also differ by class. The Fund's investments in emerging markets can be subject to social, economic, regulatory, and political uncertainties and can be extremely volatile.
2. Investments in Fidelity Central Funds.
The Fund may invest in Fidelity Central Funds, which are open-end investment companies available only to other investment companies and accounts managed by Fidelity Management & Research Company (FMR) and its affiliates. The Fund's Schedule of Investments lists each of the Fidelity Central Funds held as of period end, if any, as an investment of the Fund, but does not include the underlying holdings of each Fidelity Central Fund. As an Investing Fund, the Fund indirectly bears its proportionate share of the expenses of the underlying Fidelity Central Funds.
The Money Market Central Funds seek preservation of capital and current income and are managed by Fidelity Investments Money Management, Inc. (FIMM), an affiliate of FMR.
A complete unaudited list of holdings for each Fidelity Central Fund is available upon request or at the Securities and Exchange Commission (the SEC) web site at www.sec.gov. In addition, the financial statements of the Fidelity Central Funds, which are not covered by the Fund's Report of Independent Registered Public Accounting Firm, are available on the SEC web site or upon request.
3. Significant Accounting Policies.
The financial statements have been prepared in conformity with accounting principles generally accepted in the United States of America (GAAP), which require management
Annual Report
Notes to Financial Statements - continued
3. Significant Accounting Policies - continued
to make certain estimates and assumptions at the date of the financial statements. Actual results could differ from those estimates. The following summarizes the significant accounting policies of the Fund:
Security Valuation. Investments are valued as of 4:00 p.m. Eastern time on the last calendar day of the period. The Fund uses independent pricing services approved by the Board of Trustees to value its investments. When current market prices or quotations are not readily available or reliable, valuations may be determined in good faith in accordance with procedures adopted by the Board of Trustees. Factors used in determining value may include market or security specific events. The frequency with which these procedures are used cannot be predicted and they may be utilized to a significant extent. The value used for net asset value (NAV) calculation under these procedures may differ from published prices for the same securities.
The Fund categorizes the inputs to valuation techniques used to value its investments into a disclosure hierarchy consisting of three levels as shown below.
Level 1 - quoted prices in active markets for identical investments
Level 2 - other significant observable inputs (including quoted prices for similar investments, interest rates, prepayment speeds, etc.)
Level 3 - unobservable inputs (including the fund's own assumptions based on the best information available)
Changes in valuation techniques may result in transfers in or out of an assigned level within the disclosure hierarchy. The aggregate value of investments by input level, as of October 31, 2010, as well as a roll forward of Level 3 securities, is included at the end of the Fund's Schedule of Investments. Valuation techniques used to value the Fund's investments by major category are as follows.
Equity securities, including restricted securities, for which market quotations are readily available, are valued at the last reported sale price or official closing price as reported by an independent pricing service on the primary market or exchange on which they are traded and are categorized as Level 1 in the hierarchy. In the event there were no sales during the day or closing prices are not available, securities are valued at the last quoted bid price or may be valued using the last available price and are generally categorized as Level 2 in the hierarchy. For foreign equity securities, when significant market or security specific events arise, comparisons to the valuation of American Depositary Receipts (ADRs), futures contracts, Exchange-traded funds (ETFs) and certain indexes as well as quoted prices for similar securities are used and are categorized as Level 2 in the hierarchy in these circumstances. Utilizing these techniques may result in significant transfers between Level 1 and Level 2. For restricted equity securities and private placements
Annual Report
3. Significant Accounting Policies - continued
Security Valuation - continued
where observable inputs are limited, assumptions about market activity and risk are used and are categorized as Level 3 in the hierarchy.
Investments in open-end mutual funds, including the Fidelity Central Funds, are valued at their closing net asset value each business day and are categorized as Level 1 in the hierarchy. Short-term securities with remaining maturities of sixty days or less for which quotations are not readily available are valued at amortized cost, which approximates fair value and are categorized as Level 2 in the hierarchy.
Foreign Currency. The Fund uses foreign currency contracts to facilitate transactions in foreign-denominated securities. Gains and losses from these transactions may arise from changes in the value of the foreign currency or if the counterparties do not perform under the contracts' terms.
Foreign-denominated assets, including investment securities, and liabilities are translated into U.S. dollars at the exchange rate at period end. Purchases and sales of investment securities, income and dividends received and expenses denominated in foreign currencies are translated into U.S. dollars at the exchange rate in effect on the transaction date.
The effects of exchange rate fluctuations on investments are included with the net realized and unrealized gain (loss) on investment securities. Other foreign currency transactions resulting in realized and unrealized gain (loss) are disclosed separately.
Investment Transactions and Income. For financial reporting purposes, the Fund's investment holdings and NAV include trades executed through the end of the last business day of the period. The NAV per share for processing shareholder transactions is calculated as of the close of business of the New York Stock Exchange (NYSE), normally 4:00 p.m. Eastern time and includes trades executed through the end of the prior business day. Gains and losses on securities sold are determined on the basis of identified cost. Dividend income is recorded on the ex-dividend date, except for certain dividends from foreign securities where the ex-dividend date may have passed, which are recorded as soon as the Fund is informed of the ex-dividend date. Non-cash dividends included in dividend income, if any, are recorded at the fair market value of the securities received. Distributions received on securities that represent a return of capital or capital gain are recorded as a reduction of cost of investments and/or as a realized gain. The Fund estimates the components of distributions received that may be considered return of capital distributions or capital gain distributions. Interest income and distributions from the Fidelity Central Funds are accrued as earned. Interest income includes coupon interest and amortization of premium and accretion of discount on debt securities.
Annual Report
Notes to Financial Statements - continued
3. Significant Accounting Policies - continued
Investment Transactions and Income - continued
Investment income is recorded net of foreign taxes withheld where recovery of such taxes is uncertain.
Expenses. Most expenses of the Trust can be directly attributed to a fund. Expenses which cannot be directly attributed are apportioned amongst each fund in the Trust. Expense estimates are accrued in the period to which they relate and adjustments are made when actual amounts are known.
Income Tax Information and Distributions to Shareholders. Each year the Fund intends to qualify as a regulated investment company, including distributing substantially all of its taxable income and realized gains under Subchapter M of the Internal Revenue Code and filing its U.S. federal tax return. As a result, no provision for income taxes is required. As of October 31, 2010, the Fund did not have any unrecognized tax benefits in the accompanying financial statements. A fund's federal tax return is subject to examination by the Internal Revenue Service (IRS) for a period of three years. Foreign taxes are provided for based on the Fund's understanding of the tax rules and rates that exist in the foreign markets in which it invests. The Fund received a final ruling from the Authority for Advance Ruling in India regarding the applicability of taxes imposed by the country on realized capital gains under the US/India tax treaty. The ruling entitled the Fund to a refund of capital gains taxes paid in prior years and exempts the Fund from taxes on future realized gains. The India Central Board of Direct Taxation may challenge the ruling at any time which could result in the reversal of some or all of the benefits recorded by the Fund.
Distributions are declared and recorded on the ex-dividend date. Income dividends and capital gain distributions are declared separately for each class. Income and capital gain distributions are determined in accordance with income tax regulations, which may differ from GAAP. In addition, the Fund claimed a portion of the payment made to redeeming shareholders as a distribution for income tax purposes.
Capital accounts within the financial statements are adjusted for permanent book-tax differences. These adjustments have no impact on net assets or the results of operations. Temporary book-tax differences will reverse in a subsequent period.
Book-tax differences are primarily due to the short-term gain distributions from the Fidelity Central Funds, foreign currency transactions, passive foreign investment companies (PFIC), capital loss carryforwards and losses deferred due to wash sales.
Annual Report
3. Significant Accounting Policies - continued
Income Tax Information and Distributions to Shareholders - continued
The federal tax cost of investment securities and unrealized appreciation (depreciation) as of period end were as follows:
Gross unrealized appreciation | $ 82,381,299 |
Gross unrealized depreciation | (4,100,234) |
Net unrealized appreciation (depreciation) | $ 78,281,065 |
| |
Tax Cost | $ 332,788,317 |
The tax-based components of distributable earnings as of period end were as follows:
Undistributed ordinary income | $ 3,510,734 |
Undistributed long-term capital gain | $ 22,131,489 |
Net unrealized appreciation (depreciation) | $ 78,293,891 |
The tax character of distributions paid was as follows:
| October 31, 2010 | October 31, 2009 |
Ordinary Income | $ 3,503,974 | $ 378,765 |
Short-Term Trading (Redemption) Fees. Shares held by investors in the Fund less than 90 days are subject to a redemption fee equal to 1.50% of the net asset value of shares redeemed. All redemption fees, which reduce the proceeds of the shareholder redemption, are retained by the Fund and accounted for as an addition to paid in capital.
4. Purchases and Sales of Investments.
Purchases and sales of securities, other than short-term securities, aggregated $497,568,164 and $452,618,938, respectively.
5. Fees and Other Transactions with Affiliates.
Management Fee. FMR and its affiliates provide the Fund with investment management related services for which the Fund pays a monthly management fee. The management fee is the sum of an individual fund fee rate that is based on an annual rate of .45% of the Fund's average net assets and a group fee rate that averaged .26% during the period. The group fee rate is based upon the average net assets of all the mutual funds advised by FMR. The group fee rate decreases as assets under management increase and increases as assets under management decrease. For the period, the total annual management fee rate was .71% of the Fund's average net assets.
Annual Report
Notes to Financial Statements - continued
5. Fees and Other Transactions with Affiliates - continued
Distribution and Service Plan Fees. In accordance with Rule 12b-1 of the 1940 Act, the Fund has adopted separate Distribution and Service Plans for each class of shares. Certain classes pay Fidelity Distributors Corporation (FDC), an affiliate of FMR, separate Distribution and Service Fees, each of which is based on an annual percentage of each class' average net assets. In addition, FDC may pay financial intermediaries for selling shares of the Fund and providing shareholder support services. For the period, the Distribution and Service Fee rates, total fees and amounts retained by FDC were as follows:
| Distribution
Fee | Service
Fee | Total
Fees | Retained
by FDC |
Class A | -% | .25% | $ 387,193 | $ 13,813 |
Class T | .25% | .25% | 260,010 | 380 |
Class B | .75% | .25% | 270,241 | 202,921 |
Class C | .75% | .25% | 697,920 | 180,451 |
| | | $ 1,615,364 | $ 397,565 |
Sales Load. FDC receives a front-end sales charge of up to 5.75% for selling Class A shares, and 3.50% for selling Class T shares, some of which is paid to financial intermediaries for selling shares of the Fund. FDC receives the proceeds of contingent deferred sales charges levied on Class A, Class T, Class B, and Class C redemptions. These charges depend on the holding period. The deferred sales charges range from 5% to 1% for Class B, 1% for Class C, 1.00% for certain purchases of Class A shares (1.00% to .50% prior to July 12, 2010) and .25% for certain purchases of Class T shares.
For the period, sales charge amounts retained by FDC were as follows:
| Retained
by FDC |
Class A | $ 102,146 |
Class T | 18,095 |
Class B * | 61,217 |
Class C* | 18,167 |
| $ 199,625 |
* When Class B and Class C shares are initially sold, FDC pays commissions from its own resources to financial intermediaries through which the sales are made.
Transfer Agent Fees. Fidelity Investments Institutional Operations Company, Inc. (FIIOC), an affiliate of FMR, is the transfer, dividend disbursing and shareholder servicing agent for each class of the Fund. FIIOC receives account fees and asset-based fees that vary according to the account size and type of account of the shareholders of the respective classes of the Fund. FIIOC pays for typesetting, printing and mailing of shareholder reports, except proxy statements.
Annual Report
5. Fees and Other Transactions with Affiliates - continued
Transfer Agent Fees - continued
For the period, transfer agent fees for each class were as follows:
| Amount | % of
Average
Net Assets |
Class A | $ 404,308 | .26 |
Class T | 164,938 | .32 |
Class B | 84,247 | .31 |
Class C | 173,270 | .25 |
Institutional Class | 73,825 | .21 |
| $ 900,588 | |
Accounting and Security Lending Fees. Fidelity Service Company, Inc. (FSC), an affiliate of FMR, maintains the Fund's accounting records. The accounting fee is based on the level of average net assets for the month. Under a separate contract, FSC administers the security lending program. The security lending fee is based on the number and duration of lending transactions.
Brokerage Commissions. The Fund placed a portion of its portfolio transactions with brokerage firms which are affiliates of the investment adviser. The commissions paid to these affiliated firms were $72 for the period.
Interfund Lending Program. Pursuant to an Exemptive Order issued by the SEC, the Fund, along with other registered investment companies having management contracts with FMR, may participate in an interfund lending program. This program provides an alternative credit facility allowing the funds to borrow from, or lend money to, other participating affiliated funds. At period end, there were no interfund loans outstanding. The Fund's activity in this program during the period for which loans were outstanding was as follows:
Borrower or Lender | Average Daily Loan Balance | Weighted Average Interest Rate | Interest
Expense |
Borrower | $ 8,908,818 | .43% | $ 1,167 |
6. Committed Line of Credit.
The Fund participates with other funds managed by FMR or an affiliate in a $3.75 billion credit facility (the "line of credit") to be utilized for temporary or emergency purposes to fund shareholder redemptions or for other short-term liquidity purposes. The Fund has agreed to pay commitment fees on its pro-rata portion of the line of credit, which amounted to $1,292 and is reflected in Miscellaneous expenses on the Statement of Operations. During the period, there were no borrowings on this line of credit.
Annual Report
Notes to Financial Statements - continued
7. Security Lending.
The Fund lends portfolio securities through a lending agent from time to time in order to earn additional income. The lending agent may loan securities to certain qualified borrowers, including Fidelity Capital Markets (FCM), a broker-dealer affiliated with the Fund. On the settlement date of the loan, the Fund receives collateral (in the form of U.S. Treasury obligations, letters of credit and/or cash) against the loaned securities and maintains collateral in an amount not less than 100% of the market value of the loaned securities during the period of the loan. The market value of the loaned securities is determined at the close of business of the Fund and any additional required collateral is delivered to the Fund on the next business day. If the borrower defaults on its obligation to return the securities loaned because of insolvency or other reasons, a fund could experience delays and costs in recovering the securities loaned or in gaining access to the collateral. Any cash collateral received is invested in the Fidelity Securities Lending Cash Central Fund. The value of loaned securities and cash collateral at period end are disclosed on the Fund's Statement of Assets and Liabilities. Security lending income represents the income earned on investing cash collateral, less rebates paid to borrowers and lending agent fees associated with the loan, plus any premium payments received for lending certain types of securities. Security lending income is presented in the Statement of Operations as a component of income from Fidelity Central Funds. Total security lending income during the period amounted to $44,746. During the period, there were no securities loaned to FCM.
8. Expense Reductions.
Many of the brokers with whom FMR places trades on behalf of the Fund provided services to the Fund in addition to trade execution. These services included payments of certain expenses on behalf of the Fund totaling $137,629 for the period. In addition, through arrangements with the Fund's custodian, credits realized as a result of uninvested cash balances were used to reduce the Fund's expenses. During the period, these credits reduced the Fund's custody expenses by $59.
9. Distributions to Shareholders.
Distributions to shareholders of each class were as follows:
Years ended October 31, | 2010 | 2009 |
From net investment income | | |
Class A | $ 615,994 | $ 205,871 |
Class T | 138,177 | 65,048 |
Class B | - | 32,430 |
Class C | 55,860 | 56,716 |
Institutional Class | 161,513 | 18,700 |
Total | $ 971,544 | $ 378,765 |
Annual Report
9. Distributions to Shareholders - continued
Years ended October 31, | 2010 | 2009 |
From net realized gain | | |
Class A | $ 1,138,813 | $ - |
Class T | 399,983 | - |
Class B | 223,532 | - |
Class C | 558,596 | - |
Institutional Class | 211,506 | - |
Total | $ 2,532,430 | $ - |
10. Share Transactions.
Transactions for each class of shares were as follows:
| Shares | Dollars |
Years ended October 31, | 2010 | 2009 | 2010 | 2009 |
Class A | | | | |
Shares sold | 2,066,420 | 1,822,219 | $ 59,859,672 | $ 40,851,858 |
Reinvestment of distributions | 54,021 | 11,447 | 1,525,557 | 172,610 |
Shares redeemed | (1,447,315) | (1,322,917) | (40,817,600) | (25,301,756) |
Net increase (decrease) | 673,126 | 510,749 | $ 20,567,629 | $ 15,722,712 |
Class T | | | | |
Shares sold | 516,790 | 578,954 | $ 14,594,570 | $ 11,921,295 |
Reinvestment of distributions | 18,968 | 4,255 | 524,658 | 63,009 |
Shares redeemed | (403,834) | (434,633) | (11,178,425) | (8,198,583) |
Net increase (decrease) | 131,924 | 148,576 | $ 3,940,803 | $ 3,785,721 |
Class B | | | | |
Shares sold | 202,362 | 214,878 | $ 5,365,940 | $ 4,421,597 |
Reinvestment of distributions | 6,691 | 1,834 | 177,369 | 26,200 |
Shares redeemed | (305,292) | (306,312) | (8,111,865) | (5,387,171) |
Net increase (decrease) | (96,239) | (89,600) | $ (2,568,556) | $ (939,374) |
Class C | | | | |
Shares sold | 996,034 | 985,972 | $ 27,112,281 | $ 20,555,792 |
Reinvestment of distributions | 18,926 | 3,108 | 499,282 | 44,229 |
Shares redeemed | (626,174) | (601,665) | (16,404,984) | (10,608,252) |
Net increase (decrease) | 388,786 | 387,415 | $ 11,206,579 | $ 9,991,769 |
Annual Report
Notes to Financial Statements - continued
10. Share Transactions - continued
| Shares | Dollars |
Years ended October 31, | 2010 | 2009 | 2010 | 2009 |
Institutional Class | | | | |
Shares sold | 836,632 | 726,101 | $ 24,478,070 | $ 16,617,065 |
Reinvestment of distributions | 9,083 | 550 | 262,322 | 8,469 |
Shares redeemed | (411,905) | (196,957) | (11,804,448) | (3,858,918) |
Net increase (decrease) | 433,810 | 529,694 | $ 12,935,944 | $ 12,766,616 |
11. Other.
The Fund's organizational documents provide former and current trustees and officers with a limited indemnification against liabilities arising in connection with the performance of their duties to the Fund. In the normal course of business, the Fund may also enter into contracts that provide general indemnifications. The Fund's maximum exposure under these arrangements is unknown as this would be dependent on future claims that may be made against the Fund. The risk of material loss from such claims is considered remote.
Annual Report
To the Trustees of Fidelity Advisor Series VIII and the Shareholders of Fidelity Advisor Emerging Asia Fund:
In our opinion, the accompanying statement of assets and liabilities, including the schedule of investments, and the related statements of operations and of changes in net assets and the financial highlights present fairly, in all material respects, the financial position of Fidelity Advisor Emerging Asia Fund (a fund of Fidelity Advisor Series VIII) at October 31, 2010, the results of its operations for the year then ended, the changes in its net assets for each of the two years in the period then ended and the financial highlights for each of the five years in the period then ended, in conformity with accounting principles generally accepted in the United States of America. These financial statements and financial highlights (hereafter referred to as "financial statements") are the responsibility of the Fidelity Advisor Emerging Asia Fund's management. Our responsibility is to express an opinion on these financial statements based on our audits. We conducted our audits of these financial statements in accordance with the standards of the Public Company Accounting Oversight Board (United States). Those standards require that we plan and perform the audit to obtain reasonable assurance about whether the financial statements are free of material misstatement. An audit includes examining, on a test basis, evidence supporting the amounts and disclosures in the financial statements, assessing the accounting principles used and significant estimates made by management, and evaluating the overall financial statement presentation. We believe that our audits, which included confirmation of securities at October 31, 2010 by correspondence with the custodian and brokers, provide a reasonable basis for our opinion.
/s/ PricewaterhouseCoopers LLP
PricewaterhouseCoopers LLP
Boston, Massachusetts
December 10, 2010
Annual Report
The Trustees, Member of the Advisory Board, and executive officers of the trust and fund, as applicable, are listed below. The Board of Trustees governs the fund and is responsible for protecting the interests of shareholders. The Trustees are experienced executives who meet periodically throughout the year to oversee the fund's activities, review contractual arrangements with companies that provide services to the fund, oversee management of the risks associated with such activities and contractual arrangements, and review the fund's performance. Except for James C. Curvey, each of the Trustees oversees 221 funds advised by FMR or an affiliate. Mr. Curvey oversees 410 funds advised by FMR or an affiliate.
The Trustees hold office without limit in time except that (a) any Trustee may resign; (b) any Trustee may be removed by written instrument, signed by at least two-thirds of the number of Trustees prior to such removal; (c) any Trustee who requests to be retired or who has become incapacitated by illness or injury may be retired by written instrument signed by a majority of the other Trustees; and (d) any Trustee may be removed at any special meeting of shareholders by a two-thirds vote of the outstanding voting securities of the trust. Each Trustee who is not an interested person (as defined in the 1940 Act) (Independent Trustee), shall retire not later than the last day of the calendar year in which his or her 72nd birthday occurs. The Independent Trustees may waive this mandatory retirement age policy with respect to individual Trustees. The executive officers and Advisory Board Member hold office without limit in time, except that any officer and Advisory Board Member may resign or may be removed by a vote of a majority of the Trustees at any regular meeting or any special meeting of the Trustees. Except as indicated, each individual has held the office shown or other offices in the same company for the past five years.
Experience, Skills, Attributes, and Qualifications of the Fund's Trustees. The Governance and Nominating Committee has adopted a statement of policy that describes the experience, qualifications, attributes, and skills that are necessary and desirable for potential Independent Trustee candidates (Statement of Policy). The Board believes that each Trustee satisfied at the time he or she was initially elected or appointed a Trustee, and continues to satisfy, the standards contemplated by the Statement of Policy. The Governance and Nominating Committee also engages professional search firms to help identify potential Independent Trustee candidates who have the experience, qualifications, attributes, and skills consistent with the Statement of Policy. From time to time, additional criteria based on the composition and skills of the current Independent Trustees, as well as experience or skills that may be appropriate in light of future changes to board composition, business conditions, and regulatory or other developments, have also been considered by the professional search firms and the Governance and Nominating Committee. In addition, the Board takes into account the Trustees' commitment and participation in Board and committee meetings, as well as their leadership of standing and ad hoc committees throughout their tenure.
In determining that a particular Trustee was and continues to be qualified to serve as a Trustee, the Board has considered a variety of criteria, none of which, in isolation, was controlling. The Board believes that, collectively, the Trustees have balanced and diverse experience, qualifications, attributes, and skills, which allow the Board to operate effectively in governing the fund and protecting the interests of shareholders. Information about the specific experience, skills, attributes, and qualifications of each Trustee, which in each case led to the Board's conclusion that the Trustee should serve (or continue to serve) as a trustee of the fund, is provided below.
Annual Report
Board Structure and Oversight Function. Edward C. Johnson 3d is an interested person (as defined in the 1940 Act) and currently serves as Chairman. The Trustees have determined that an interested Chairman is appropriate and benefits shareholders because an interested Chairman has a personal and professional stake in the quality and continuity of services provided to the fund. Independent Trustees exercise their informed business judgment to appoint an individual of their choosing to serve as Chairman, regardless of whether the Trustee happens to be independent or a member of management. The Independent Trustees have determined that they can act independently and effectively without having an Independent Trustee serve as Chairman and that a key structural component for assuring that they are in a position to do so is for the Independent Trustees to constitute a substantial majority for the Board. The Independent Trustees also regularly meet in executive session. Ned C. Lautenbach serves as Chairman of the Independent Trustees and as such (i) acts as a liaison between the Independent Trustees and management with respect to matters important to the Independent Trustees and (ii) with management prepares agendas for Board meetings.
Fidelity funds are overseen by different Boards of Trustees. The fund's Board oversees Fidelity's equity and high income funds and another Board oversees Fidelity's investment-grade bond, money market, and asset allocation funds. The asset allocation funds may invest in Fidelity funds overseen by the fund's Board. The use of separate Boards, each with its own committee structure, allows the Trustees of each group of Fidelity funds to focus on the unique issues of the funds they oversee, including common research, investment, and operational issues. On occasion, the separate Boards establish joint committees to address issues of overlapping consequences for the Fidelity funds overseen by each Board.
The Trustees operate using a system of committees to facilitate the timely and efficient consideration of all matters of importance to the Trustees, the fund, and fund shareholders and to facilitate compliance with legal and regulatory requirements and oversight of the fund's activities and associated risks. The Board, acting through its committees, has charged FMR and its affiliates with (i) identifying events or circumstances the occurrence of which could have demonstrably adverse effects on the fund's business and/or reputation; (ii) implementing processes and controls to lessen the possibility that such events or circumstances occur or to mitigate the effects of such events or circumstances if they do occur; and (iii) creating and maintaining a system designed to evaluate continuously business and market conditions in order to facilitate the identification and implementation processes described in (i) and (ii) above. Because the day-to-day operations and activities of the fund are carried out by or through FMR, its affiliates and other service providers, the fund's exposure to risks is mitigated but not eliminated by the processes overseen by the Trustees. While each of the Board's committees has responsibility for overseeing different aspects of the fund's activities, oversight is exercised primarily through the Operations, Audit, and Compliance Committees. Appropriate personnel, including but not limited to the fund's Chief Compliance Officer (CCO), FMR's internal auditor, the independent accountants, the fund's Treasurer and portfolio management personnel, make periodic reports to the Board's committees, as appropriate. The responsibilities of each committee, including their oversight responsibilities, are described further under "Standing Committees of the Fund's Trustees."
Annual Report
Trustees and Officers - continued
The fund's Statement of Additional Information (SAI) includes more information about the Trustees. To request a free copy, call Fidelity at 1-877-208-0098.
Interested Trustees*:
Correspondence intended for each Trustee who is an interested person may be sent to Fidelity Investments, 82 Devonshire Street, Boston, Massachusetts 02109.
Name, Age; Principal Occupations and Other Relevant Experience+ |
Edward C. Johnson 3d (80) |
| Year of Election or Appointment: 1983 Mr. Johnson is Trustee and Chairman of the Board of Trustees of certain Trusts. Mr. Johnson serves as Chief Executive Officer, Chairman, and a Director of FMR LLC; Chairman and a Director of FMR; Chairman and a Director of Fidelity Research & Analysis Company (FRAC); Chairman and a Director of Fidelity Investments Money Management, Inc.; and Chairman and a Director of FMR Co., Inc. In addition, Mr. Johnson serves as Chairman and Director of FIL Limited. Previously, Mr. Johnson served as President of FMR LLC (2006-2007). |
James C. Curvey (75) |
| Year of Election or Appointment: 2007 Mr. Curvey also serves as Trustee (2007-present) of other investment companies advised by FMR. Mr. Curvey is a Director of Fidelity Investments Money Management, Inc. (2009-present), Director of Fidelity Research & Analysis Co. (2009-present) and Director of FMR and FMR Co., Inc. (2007-present). Mr. Curvey is also Vice Chairman (2007-present) and Director of FMR LLC. In addition, Mr. Curvey serves as an Overseer for the Boston Symphony Orchestra and a member of the Trustees of Villanova University. Previously, Mr. Curvey was the Vice Chairman (2006-2007) and Director (2000-2007) of FMR Corp. |
* Trustees have been determined to be "Interested Trustees" by virtue of, among other things, their affiliation with the trust or various entities under common control with FMR.
Annual Report
+ The information above includes each Trustee's principal occupation during the last five years and other information relating to the experience, attributes, and skills relevant to each Trustee's qualifications to serve as a Trustee, which led to the conclusion that each Trustee should serve as a Trustee for the fund.
Independent Trustees:
Correspondence intended for each Independent Trustee (that is, the Trustees other than the Interested Trustees) may be sent to Fidelity Investments, P.O. Box 55235, Boston, Massachusetts 02205-5235.
Name, Age; Principal Occupations and Other Relevant Experience+ |
Dennis J. Dirks (62) |
| Year of Election or Appointment: 2005 Prior to his retirement in May 2003, Mr. Dirks was Chief Operating Officer and a member of the Board of The Depository Trust & Clearing Corporation (DTCC). He also served as President, Chief Operating Officer, and Board member of The Depository Trust Company (DTC) and President and Board member of the National Securities Clearing Corporation (NSCC). In addition, Mr. Dirks served as Chief Executive Officer and Board member of the Government Securities Clearing Corporation, Chief Executive Officer and Board member of the Mortgage-Backed Securities Clearing Corporation, as a Trustee and a member of the Finance Committee of Manhattan College (2005-2008), and as a Trustee and a member of the Finance Committee of AHRC of Nassau County (2006-2008). Mr. Dirks is a member of the Independent Directors Council (IDC) Governing Council (2010-Present) and Board of Directors for The Brookville Center for Children's Services, Inc. (2009-present). |
Alan J. Lacy (57) |
| Year of Election or Appointment: 2008 Mr. Lacy serves as Senior Adviser (2007-present) of Oak Hill Capital Partners, L.P. (private equity). Mr. Lacy also served as Chief Executive Officer (2000-2005) and Vice Chairman (2005-2006) of Sears Holdings Corporation and Sears, Roebuck and Co. (retail). In addition, Mr. Lacy serves as a member of the Board of Directors of The Western Union Company (global money transfer, 2006-present) and Bristol-Myers Squibb Company (global pharmaceuticals, 2007-present). Mr. Lacy is Chairman (2008-present) and a member (2006-present) of the Board of Trustees of The National Parks Conservation Association. |
Ned C. Lautenbach (66) |
| Year of Election or Appointment: 2000 Mr. Lautenbach is Chairman of the Independent Trustees of the Equity and High Income Funds (2006-present). Mr. Lautenbach currently serves as the Lead Director of the Eaton Corporation Board of Directors (diversified industrial, 1997-present). Mr. Lautenbach is also a member of the Board of Directors of the Philharmonic Center for the Arts in Naples, Florida (1999-present); a member of the Board of Trustees of Fairfield University (2005-present); and a member of the Council on Foreign Relations (1994-present). Previously, Mr. Lautenbach was a Partner/Advisory Partner at Clayton, Dubilier & Rice, Inc. (private equity investment, 1998-2010), as well as a Director of Sony Corporation (2006-2007). |
Joseph Mauriello (66) |
| Year of Election or Appointment: 2008 Prior to his retirement in January 2006, Mr. Mauriello served in numerous senior management positions including Deputy Chairman and Chief Operating Officer (2004-2005), and Vice Chairman of Financial Services (2002-2004) of KPMG LLP US (professional services, 1965-2005). Mr. Mauriello currently serves as a member of the Board of Directors of XL Group plc. (global insurance and re-insurance, 2006-present) and of Arcadia Resources Inc. (health care services and products, 2007-present). Previously, Mr. Mauriello served as a Director of the Hamilton Funds of the Bank of New York (2006-2007). |
Cornelia M. Small (66) |
| Year of Election or Appointment: 2005 Ms. Small is a member of the Board of Directors of the Teagle Foundation (2009-present). Ms. Small is also a member of the Investment Committee, and Chair (2008-present) and a member of the Board of Trustees of Smith College. In addition, Ms. Small serves on the Investment Committee of the Berkshire Taconic Community Foundation (2008-present). Previously, Ms. Small served as Chairperson of the Investment Committee (2002-2008) of Smith College. In addition, Ms. Small served as Chief Investment Officer, Director of Global Equity Investments, and a member of the Board of Directors of Scudder, Stevens & Clark and Scudder Kemper Investments. |
William S. Stavropoulos (71) |
| Year of Election or Appointment: 2001 Mr. Stavropoulos is Vice Chairman of the Independent Trustees of the Equity and High Income Funds (2006-present). Mr. Stavropoulos serves as President and Founder of the Michigan Baseball Foundation, the Great Lakes Loons (2007-present). Mr. Stavropoulos is Chairman Emeritus of the Board of Directors of The Dow Chemical Company, where he previously served in numerous senior management positions, including President, CEO (1995-2000; 2002-2004), Chairman of the Executive Committee (2000-2006), and as a member of the Board of Directors (1990-2006). Currently, Mr. Stavropoulos is Chairman of Univar (global distributor of commodity and specialty chemicals, 2010-present), a Director of Teradata Corporation (data warehousing and technology solutions, 2008-present), Chemical Financial Corporation, Maersk Inc. (industrial conglomerate), Tyco International, Inc. (multinational manufacturing and services, 2007-present), and a member of the Advisory Board for Metalmark Capital (private equity investment, 2005-present). Mr. Stavropoulos is a special advisor to Clayton, Dubilier & Rice, Inc. (private equity investment). In addition, Mr. Stavropoulos is a member of the University of Notre Dame Advisory Council for the College of Science. |
David M. Thomas (61) |
| Year of Election or Appointment: 2008 Previously, Mr. Thomas served as Executive Chairman (2005-2006) and Chairman and Chief Executive Officer (2000-2005) of IMS Health, Inc. (pharmaceutical and healthcare information solutions). In addition, Mr. Thomas serves as a member of the Board of Directors of Fortune Brands, Inc. (consumer products), and Interpublic Group of Companies, Inc. (marketing communication, 2004-present). |
Michael E. Wiley (60) |
| Year of Election or Appointment: 2008 Mr. Wiley also serves as a Director of Asia Pacific Exploration Consolidated (international oil and gas exploration and production, 2008-present). Mr. Wiley serves as a Director of Tesoro Corporation (independent oil refiner and marketer, 2005-present), and a Director of Bill Barrett Corporation (exploration and production, 2005-present). In addition, Mr. Wiley also serves as a Director of Post Oak Bank (privately-held bank, 2004-present). Previously, Mr. Wiley served as a member of the Board of Trustees of the University of Tulsa (2000-2006; 2007-2010), as a Senior Energy Advisor of Katzenbach Partners, LLC (consulting, 2006-2007), as an Advisory Director of Riverstone Holdings (private investment), Chairman, President, and CEO of Baker Hughes, Inc. (oilfield services, 2000-2004), and as Director of Spinnaker Exploration Company (exploration and production, 2001-2005). |
Annual Report
Trustees and Officers - continued
+ The information above includes each Trustee's principal occupation during the last five years and other information relating to the experience, attributes, and skills relevant to each Trustee's qualifications to serve as a Trustee, which led to the conclusion that each Trustee should serve as a Trustee for the fund.
Advisory Board Member and Executive Officers:
Correspondence intended for each executive officer and Peter S. Lynch may be sent to Fidelity Investments, 82 Devonshire Street, Boston, Massachusetts 02109.
Name, Age; Principal Occupation |
Peter S. Lynch (66) |
| Year of Election or Appointment: 2003 Member of the Advisory Board of Fidelity's Equity and High Income Funds. Mr. Lynch is Vice Chairman and a Director of FMR and FMR Co., Inc. In addition, Mr. Lynch serves as a Trustee of Boston College and as the Chairman of the Inner-City Scholarship Fund. Previously, Mr. Lynch served on the Special Olympics International Board of Directors (1997-2006). |
Kenneth B. Robins (41) |
| Year of Election or Appointment: 2008 President and Treasurer of Fidelity's Equity and High Income Funds. Mr. Robins also serves as President and Treasurer (2010-present) and Assistant Treasurer (2009-present) of other Fidelity funds and is an employee of Fidelity Investments (2004-present). Previously, Mr. Robins served as Deputy Treasurer of the Fidelity funds (2005-2008) and Treasurer and Chief Financial Officer of The North Carolina Capital Management Trust: Cash and Term Portfolios (2006-2008). |
Bruce T. Herring (45) |
| Year of Election or Appointment: 2006 Vice President of certain Equity Funds. Mr. Herring also serves as Chief Investment Officer and Director of Fidelity Management & Research (U.K.) Inc. (2010-present) and Group Chief Investments Officer of FMR. Previously, Mr. Herring served as Vice President (2005-2006) and Senior Vice President (2006-2007) of Fidelity Management & Research Company, Vice President of FMR Co., Inc. (2001-2007) and as a portfolio manager for Fidelity U.S. Equity Funds. |
Brian B. Hogan (46) |
| Year of Election or Appointment: 2009 Vice President of certain Equity Funds and Vice President of Sector Funds. Mr. Hogan also serves as President of FMR's Equity Division (2009-present). Previously, Mr. Hogan served as Senior Vice President, Equity Research of FMR (2006-2009) and as a portfolio manager. |
Scott C. Goebel (42) |
| Year of Election or Appointment: 2008 Secretary and Chief Legal Officer (CLO) of the Fidelity funds. Mr. Goebel also serves as Secretary and CLO of The North Carolina Capital Management Trust: Cash and Term Portfolio (2008-present); General Counsel, Secretary, and Senior Vice President of FMR (2008-present) and FMR Co., Inc. (2008-present); Deputy General Counsel of FMR LLC; Chief Legal Officer of Fidelity Management & Research (Hong Kong) Limited (2008-present) and Assistant Secretary of Fidelity Management & Research (Japan) Inc. (2008-present), Fidelity Investments Money Management, Inc. (2008-present), Fidelity Management & Research (U.K.) Inc. (2008-present), and Fidelity Research and Analysis Company (2008-present). Previously, Mr. Goebel served as Assistant Secretary of the Funds (2007-2008) and as Vice President and Secretary of Fidelity Distributors Corporation (FDC) (2005-2007). |
William C. Coffey (41) |
| Year of Election or Appointment: 2009 Assistant Secretary of Fidelity's Equity and High Income Funds. Mr. Coffey also serves as Senior Vice President and Deputy General Counsel of FMR LLC (2010-present), and is an employee of Fidelity Investments. Previously, Mr. Coffey served as Vice President and Associate General Counsel of FMR LLC (2005-2009). |
Holly C. Laurent (56) |
| Year of Election or Appointment: 2008 Anti-Money Laundering (AML) Officer of the Fidelity funds. Ms. Laurent also serves as AML Officer of The North Carolina Capital Management Trust: Cash and Term Portfolio (2008-present) and is an employee of Fidelity Investments. Previously, Ms. Laurent was Senior Vice President and Head of Legal for Fidelity Business Services India Pvt. Ltd. (2006-2008), and Senior Vice President, Deputy General Counsel and Group Head for FMR LLC (2005-2006). |
Christine Reynolds (52) |
| Year of Election or Appointment: 2008 Chief Financial Officer of the Fidelity funds. Ms. Reynolds became President of Fidelity Pricing and Cash Management Services (FPCMS) in August 2008. Ms. Reynolds served as Chief Operating Officer of FPCMS (2007-2008). Previously, Ms. Reynolds served as President, Treasurer, and Anti-Money Laundering officer of the Fidelity funds (2004-2007). |
Kenneth A. Rathgeber (63) |
| Year of Election or Appointment: 2004 Chief Compliance Officer of Fidelity's Equity and High Income Funds. Mr. Rathgeber is Chief Compliance Officer of Fidelity Management & Research (Hong Kong) Limited (2008-present), Fidelity Management & Research (Japan) Inc. (2008-present), FMR (2005-present), FMR Co., Inc. (2005-present), Fidelity Management & Research (U.K.) Inc. (2005-present), Fidelity Research & Analysis Company (2005-present), Fidelity Investments Money Management, Inc. (2005-present), Pyramis Global Advisors, LLC (2005-present), and Strategic Advisers, Inc. (2005-present). |
Jeffrey S. Christian (49) |
| Year of Election or Appointment: 2009 Deputy Treasurer of the Fidelity funds. Mr. Christian is an employee of Fidelity Investments. Previously, Mr. Christian served as Chief Financial Officer (2008-2009) of certain Fidelity funds and Senior Vice President of Fidelity Pricing and Cash Management Services (FPCMS) (2004-2009). |
Bryan A. Mehrmann (49) |
| Year of Election or Appointment: 2005 Deputy Treasurer of the Fidelity funds. Mr. Mehrmann is an employee of Fidelity Investments. |
Adrien E. Deberghes (43) |
| Year of Election or Appointment: 2008 Deputy Treasurer of Fidelity's Equity and High Income Funds. Mr. Deberghes also serves as Assistant Treasurer of other Fidelity funds (2010-present) and is an employee of Fidelity Investments (2008-present). Previously, Mr. Deberghes served as Senior Vice President of Mutual Fund Administration at State Street Corporation (2007-2008), Senior Director of Mutual Fund Administration at Investors Bank & Trust (2005-2007), and Director of Finance for Dunkin' Brands (2000-2005). |
Stephanie J. Dorsey (41) |
| Year of Election or Appointment: 2010 Assistant Treasurer of Fidelity's Equity and High Income Funds. Ms. Dorsey also serves as Deputy Treasurer of other Fidelity funds (2008-present) and is an employee of Fidelity Investments (2008-present). Previously, Ms. Dorsey served as Treasurer (2004-2008) of the JPMorgan Mutual Funds and Vice President (2004-2008) of JPMorgan Chase Bank. |
Name, Age; Principal Occupation |
John R. Hebble (52) |
| Year of Election or Appointment: 2009 Assistant Treasurer of Fidelity's Equity and High Income Funds. Mr. Hebble also serves as Treasurer and Chief Financial Officer of The North Carolina Capital Management Trust: Cash and Term Portfolio (2008-present), President and Treasurer of other Fidelity funds (2008-present) and is an employee of Fidelity Investments. |
Gary W. Ryan (52) |
| Year of Election or Appointment: 2005 Assistant Treasurer of the Fidelity funds. Mr. Ryan is an employee of Fidelity Investments. Previously, Mr. Ryan served as Vice President of Fund Reporting in Fidelity Pricing and Cash Management Services (FPCMS) (1999-2005). |
Jonathan Davis (42) |
| Year of Election or Appointment: 2010 Assistant Treasurer of the Fidelity funds. Mr. Davis is an employee of Fidelity Investments. Previously, Mr. Davis served as Vice President and Associate General Counsel of FMR LLC (2003-2010). |
Annual Report
The Board of Trustees of Advisor Emerging Asia Fund voted to pay to shareholders of record at the opening of business on record date, the following distributions per share derived from capital gains realized from sales of portfolio securities, and dividends derived from net investment income:
| Pay Date | Record Date | Dividends | Capital Gains |
Class A | 12/06/10 | 12/03/10 | $0.204 | $1.805 |
Class T | 12/06/10 | 12/03/10 | $0.122 | $1.805 |
Class B | 12/06/10 | 12/03/10 | $- | $1.774 |
Class C | 12/06/10 | 12/03/10 | $0.044 | $1.805 |
The fund hereby designates as a capital gain dividend with respect to the taxable year ended October 31, 2010, $22,131,489 or, if subsequently determined to be different, the net capital gain of such year.
Class A designates 40%, Class T designates 45%, Class B designates 60%, and Class C designates 54% of the dividends distributed during the fiscal year as amounts which may be taken into account as a dividend for purposes of the maximum rate under section 1(h)(11) of the Internal Revenue Code.
The amounts per share which represent income derived from sources within, and taxes paid to, foreign countries or possessions of the United States are as follows:
| Pay Date | Income | Taxes |
Class A | 12/07/09 | $.3147 | $.0355 |
Class T | 12/07/09 | $.2786 | $.0355 |
Class B | 12/07/09 | $.2080 | $.0355 |
Class C | 12/07/09 | $.2332 | $.0355 |
The fund will notify shareholders in January 2011 of amounts for use in preparing 2010 income tax returns.
Annual Report
Board Approval of Investment Advisory Contracts and Management Fees
Fidelity Advisor Emerging Asia Fund
Each year, the Board of Trustees, including the Independent Trustees (together, the Board), votes on the renewal of the management contract and sub-advisory agreements (together, the Advisory Contracts) for the fund. The Board, assisted by the advice of fund counsel and Independent Trustees' counsel, requests and considers a broad range of information relevant to the renewal of the Advisory Contracts throughout the year.
The Board meets regularly and considers at each of its meetings factors that are relevant to its annual consideration of the renewal of the fund's Advisory Contracts, including the services and support provided to the fund and its shareholders. The Board has established various standing committees, each composed of Independent Trustees with varying backgrounds, to which the Board has assigned specific subject matter responsibilities in order to enhance effective decision-making by the Board. The Board, acting directly and through its Committees, requests and receives information concerning the annual consideration of the renewal of the fund's Advisory Contracts. The Board also meets as needed to consider matters specifically related to the Board's annual consideration of the renewal of Advisory Contracts. Members of the Board may also meet with trustees of other Fidelity funds through ad hoc joint committees to discuss certain matters relevant to the Fidelity funds.
At its July 2010 meeting, the Board of Trustees, including the Independent Trustees, unanimously determined to renew the fund's Advisory Contracts. In reaching its determination, the Board considered all factors it believed relevant, including (i) the nature, extent, and quality of the services to be provided to the fund and its shareholders (including the investment performance of the fund); (ii) the competitiveness of the fund's management fee and total expenses; (iii) the total costs of the services to be provided by and the profits to be realized by Fidelity from its relationship with the fund; (iv) the extent to which economies of scale would be realized as the fund grows; and (v) whether fee levels reflect these economies of scale, if any, for the benefit of fund shareholders.
In considering whether to renew the Advisory Contracts for the fund, the Board reached a determination, with the assistance of fund counsel and Independent Trustees' counsel and through the exercise of its business judgment, that the renewal of the Advisory Contracts is in the best interests of fund shareholders and that the compensation to be received by Fidelity under the management contract is fair and reasonable. The Board's decision to renew the Advisory Contracts was not based on any single factor noted above, but rather was based on a comprehensive consideration of all the information provided to the Board at its meetings throughout the year. The Board, in reaching its determination to renew the Advisory Contracts, is aware that shareholders in the fund have a broad range of investment choices available to them, including a wide choice among mutual funds offered by Fidelity's competitors, and that the fund's shareholders, with the opportunity to review and weigh the disclosure provided by the fund in its prospectus and other public disclosures, have chosen to invest in this fund, managed by Fidelity.
Annual Report
Board Approval of Investment Advisory Contracts and
Management Fees - continued
Nature, Extent, and Quality of Services Provided. The Board considered the staffing within the investment adviser, FMR, and the sub-advisers (together, the Investment Advisers), including the backgrounds of the fund's investment personnel and the fund's investment objective and discipline. The Independent Trustees also had discussions with senior management of Fidelity's investment operations and investment groups. The Board considered the structure of the portfolio manager compensation program and whether this structure provides appropriate incentives to act in the best interest of the fund.
Resources Dedicated to Investment Management and Support Services. The Board and the equity research subcommittee of the Board's Fund Oversight Committee reviewed the size, education, and experience of the Investment Advisers' investment staff, their use of technology, and the Investment Advisers' approach to recruiting, training, and retaining portfolio managers and other research, advisory, and management personnel. The Board noted that Fidelity's analysts have access to a variety of technological tools and market and securities data that enable them to perform both fundamental and quantitative analysis and to specialize in various disciplines. The Board considered Fidelity's extensive global research capabilities that enable the Investment Advisers to aggregate data from various sources in an effort to produce positive investment results. The Board also considered that Fidelity's portfolio managers and analysts have access to daily portfolio attribution that allows for monitoring of a fund's portfolio, as well as an electronic communication system that provides immediate real-time access to research concerning issuers and credit enhancers. The Board noted FMR's continued focus on strengthening the organization and discipline of equity portfolio management and research.
Shareholder and Administrative Services. The Board considered (i) the nature, extent, quality, and cost of advisory, administrative, and shareholder services performed by the Investment Advisers and their affiliates under the Advisory Contracts and under separate agreements covering transfer agency, pricing and bookkeeping, and securities lending services for the fund; (ii) the nature and extent of the investment adviser's supervision of third party service providers, principally custodians and subcustodians; and (iii) the resources devoted to, and the record of compliance with, the fund's compliance policies and procedures. The Board also reviewed the allocation of fund brokerage, including allocations to brokers affiliated with the Investment Advisers, the use of brokerage commissions to pay fund expenses, and the use of "soft" commission dollars to pay for research services.
The Board noted that the growth of fund assets over time across the complex allows Fidelity to reinvest in the development of services designed to enhance the value or convenience of the Fidelity funds as investment vehicles. These services include 24-hour access to account information and market information through phone representatives and over the Internet, and investor education materials and asset allocation tools.
Annual Report
Investment in a Large Fund Family. The Board considered the benefits to shareholders of investing in a Fidelity fund, including the benefits of investing in a fund that is part of a large family of funds offering a variety of investment disciplines and providing a large variety of mutual fund investor services. The Board noted that Fidelity had taken, or had made recommendations that resulted in the Fidelity funds taking, a number of actions over the previous year that benefited particular funds, including (i) dedicating additional resources to investment research and restructuring and broadening the focus of the investment research teams; (ii) bolstering the senior management team that oversees asset management; (iii) launching Class F of certain funds as a lower-fee class available to Freedom K and Freedom Index Funds; (iv) lowering the initial investment minimums and ongoing balance requirements for Real Estate High Income Fund; (v) eliminating subsequent purchase minimums for all funds and adding a waiver of the investment minimum requirement for new accounts opened with the proceeds of a systematic withdrawal plan; (vi) eliminating the withdrawal minimum and maximum limits for systematic withdrawals from Advisor funds; (vii) expanding sales load waivers on Class A shares for Destiny Planholders and expanding Institutional Class eligibility for Class O Destiny Planholders; and (viii) changing certain Class A and Class T sales charge structures to further align them with industry practices.
Investment Performance. The Board considered whether the fund has operated in accordance with its investment objective, as well as its record of compliance with its investment restrictions. It also reviewed the fund's absolute investment performance for each class, as well as the fund's relative investment performance for each class measured over multiple periods against a broad-based securities market index. The Board noted that FMR does not believe that a meaningful peer group exists against which to compare the fund's performance. The following charts considered by the Board show, over the one-, three-, and five-year periods ended December 31, 2009, the cumulative total returns of Institutional Class (Class I) and Class B of the fund and the cumulative total returns of a broad-based securities market index ("benchmark"). The returns of Institutional Class (Class I) and Class B show the performance of the highest and lowest performing classes, respectively (based on five-year performance).
Annual Report
Board Approval of Investment Advisory Contracts and
Management Fees - continued
Fidelity Advisor Emerging Asia Fund
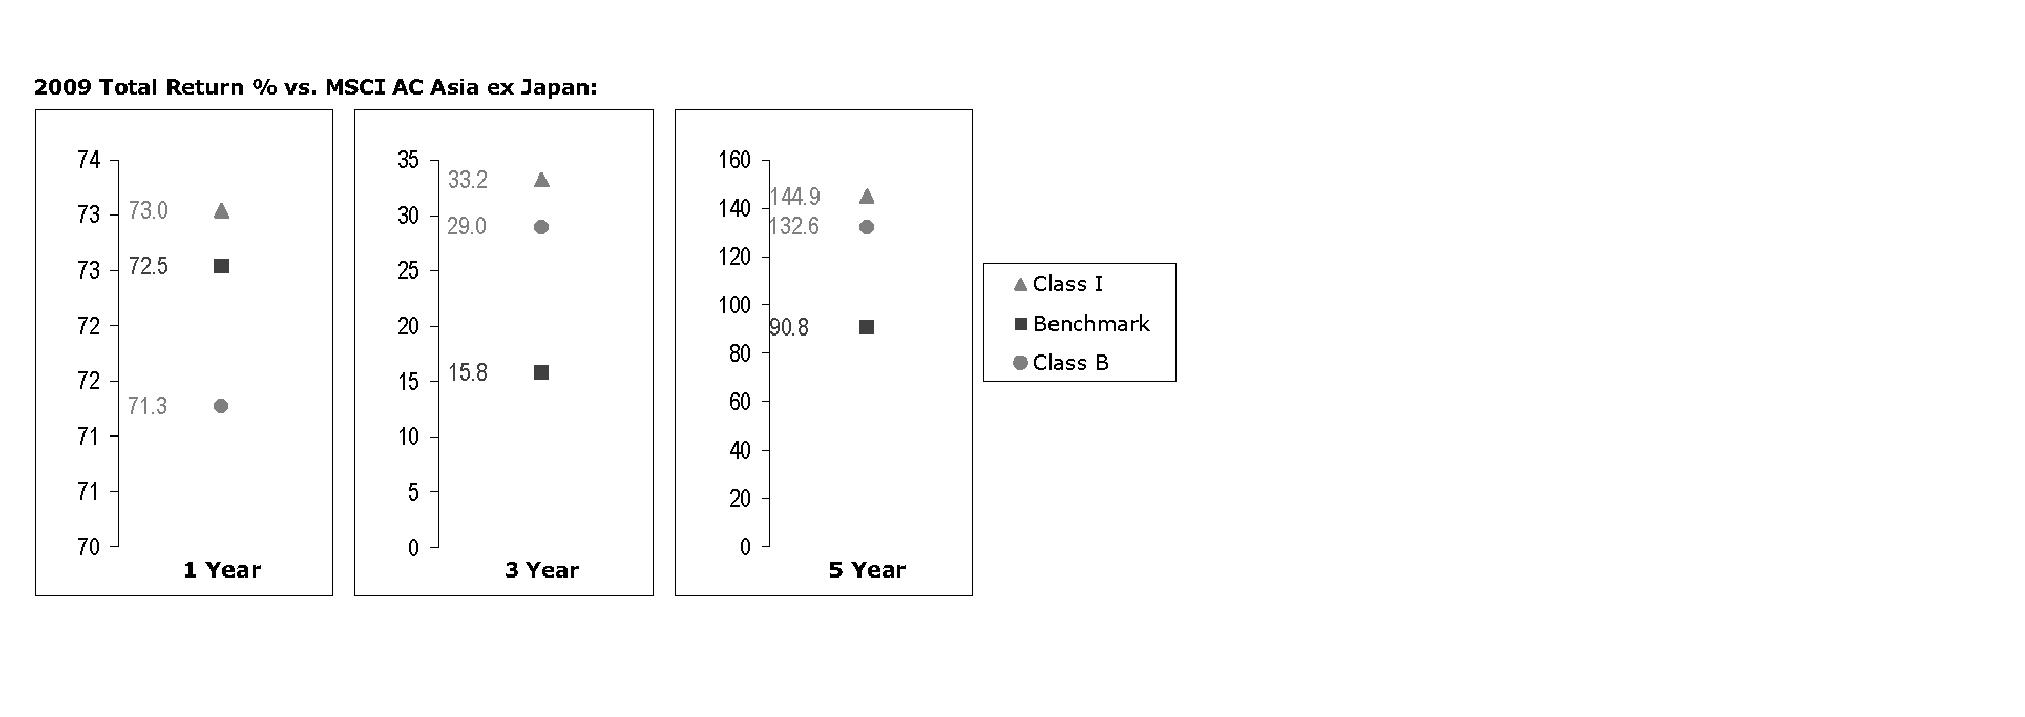
The Board noted that the investment performance of Institutional Class (Class I) of the fund compared favorably to its benchmark for all the periods shown. The Board considered that the variations in performance among the fund's classes reflect the variations in class expenses, which result in lower performance for higher expense classes. The Board also reviewed the fund's performance since inception as well as performance in the current year.
Based on its review, and giving particular weight to the nature and quality of the resources dedicated by the Investment Advisers to maintain and improve relative performance and factoring in the unprecedented market events in recent years, the Board concluded that the nature, extent, and quality of investment management and support services and of shareholder and administrative services provided to the fund will benefit the fund's shareholders, particularly in light of the Board's view that the fund's shareholders benefit from investing in a fund that is part of a large family of funds offering a variety of investment disciplines and services.
Competitiveness of Management Fee and Total Fund Expenses. The Board considered the fund's management fee and total expenses compared to "mapped groups" of competitive funds and classes. Fidelity creates "mapped groups" by combining similar Lipper investment objective categories that have comparable management fee characteristics. Combining Lipper investment objective categories aids the Board's management fee and total expense comparisons by broadening the competitive group used for comparison and by reducing the number of universes to which various Fidelity funds are compared.
Annual Report
Management Fee. The Board considered two proprietary management fee comparisons for the 12-month periods shown in the chart below. The group of Lipper funds used by the Board for management fee comparisons is referred to below as the "Total Mapped Group." The Total Mapped Group comparison focuses on a fund's standing relative to the total universe of comparable funds available to investors, in terms of gross management fees before expense reimbursements or caps. "TMG %" represents the percentage of funds in the Total Mapped Group that had management fees that were lower than the fund's. For example, a TMG % of 7% means that 93% of the funds in the Total Mapped Group had higher management fees than the fund. The "Asset-Size Peer Group" (ASPG) comparison focuses on a fund's standing relative to non-Fidelity funds similar in size to the fund within the Total Mapped Group. The ASPG represents at least 15% of the funds in the Total Mapped Group with comparable asset size and management fee characteristics, subject to a minimum of 50 funds (or all funds in the Total Mapped Group if fewer than 50). Additional information, such as the ASPG quartile in which the fund's management fee ranked, is also included in the chart and considered by the Board.
Fidelity Advisor Emerging Asia Fund
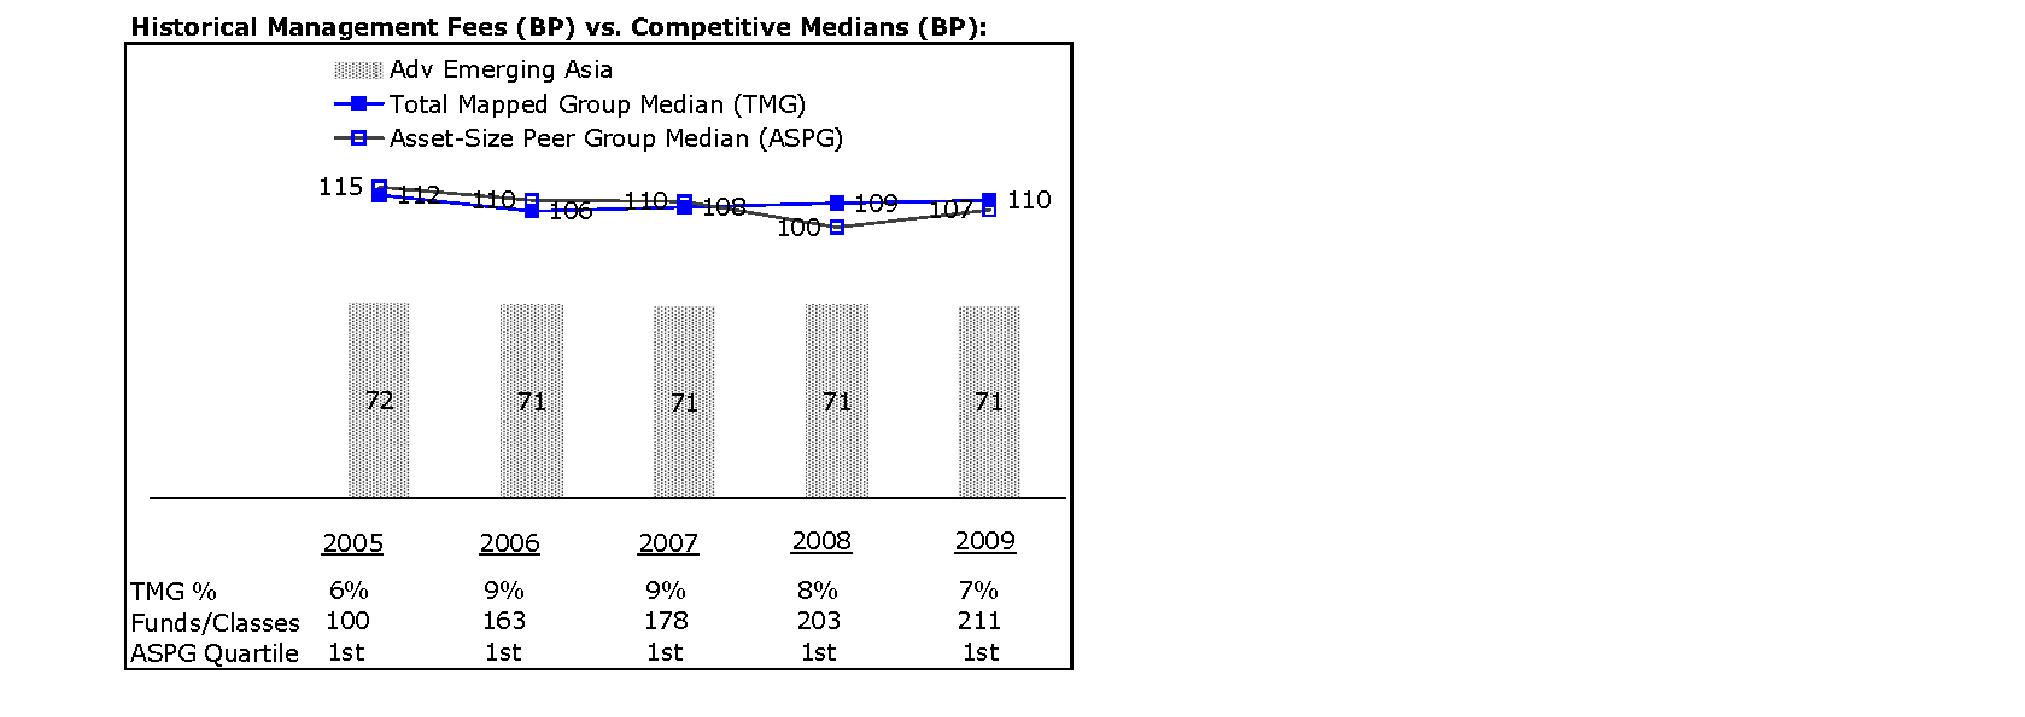
The Board noted that the fund's management fee ranked below the median of its Total Mapped Group and below the median of its ASPG for 2009.
Based on its review, the Board concluded that the fund's management fee is fair and reasonable in light of the services that the fund receives and the other factors considered.
Total Expenses. In its review of each class's total expenses, the Board considered the fund's management fee as well as other fund or class expenses, as applicable, such as transfer agent fees, pricing and bookkeeping fees, fund-paid 12b-1 fees, and custodial, legal, and audit fees. The Board also noted the effects of any waivers and reimbursements on fees and expenses. As part of its review, the Board also considered current and historical total expenses of each class of the fund compared to competitive fund median expenses. Each class of the fund is compared to those funds and classes in the Total Mapped Group (used by the Board for management fee comparisons) that have a similar sales load structure.
Annual Report
Board Approval of Investment Advisory Contracts and
Management Fees - continued
The Board noted that the total expenses of each class ranked below its competitive median for 2009.
Fees Charged to Other Fidelity Clients. The Board also considered Fidelity fee structures and other information with respect to clients of FMR and its affiliates, such as other mutual funds advised or subadvised by FMR or its affiliates, pension plan clients, and other institutional clients. In March 2010, the Board created an ad hoc joint committee with the board of other Fidelity funds (the Committee) to review and compare Fidelity's institutional investment advisory business with its business of providing services to the Fidelity funds, including the differences in services provided, fees charged, and costs incurred, as well as competition in their respective marketplaces.
Based on its review of total expenses and fees charged to other Fidelity clients, the Board concluded that the total expenses of each class of the fund were reasonable in light of the services that the fund and its shareholders receive and the other factors considered, including the findings of the Committee.
Costs of the Services and Profitability. The Board considered the revenues earned and the expenses incurred by Fidelity in conducting the business of developing, marketing, distributing, managing, administering and servicing the fund and its shareholders. The Board also considered the level of Fidelity's profits in respect of all the Fidelity funds.
On an annual basis, FMR presents to the Board Fidelity's profitability for the fund. Fidelity calculates the profitability for each fund, as well as aggregate profitability for groups of Fidelity funds and all Fidelity funds, using a series of detailed revenue and cost allocation methodologies which originate with the audited books and records of Fidelity. The Audit Committee of the Board reviews any significant changes from the prior year's methodologies.
PricewaterhouseCoopers LLP (PwC), independent registered public accounting firm and auditor to Fidelity and certain Fidelity funds, has been engaged annually by the Board as part of the Board's assessment of Fidelity's profitability analysis. PwC's engagement includes the review and assessment of Fidelity's methodologies used in determining the revenues and expenses attributable to Fidelity's mutual fund business, and completion of agreed-upon procedures surrounding the mathematical accuracy of fund profitability and its conformity to allocation methodologies. After considering PwC's reports issued under the engagement and information provided by Fidelity, the Board believes that while other allocation methods may also be reasonable, Fidelity's profitability methodologies are reasonable in all material respects.
Annual Report
The Board has also reviewed Fidelity's non-fund businesses and fall-out benefits related to the mutual fund business as well as cases where Fidelity's affiliates may benefit from or be related to the fund's business.
The Board considered the costs of the services provided by and the profits realized by Fidelity in connection with the operation of the fund and were satisfied that the profitability was not excessive in the circumstances.
Economies of Scale. The Board considered whether there have been economies of scale in respect of the management of the Fidelity funds, whether the Fidelity funds (including the fund) have appropriately benefited from any such economies of scale, and whether there is potential for realization of any further economies of scale. The Board considered the extent to which the fund will benefit from economies of scale through increased services to the fund, through waivers or reimbursements, or through fee or expense reductions.
In February 2009, the Board and the board of other Fidelity funds created an ad hoc committee (the Economies of Scale Committee) to analyze whether FMR attains economies of scale in respect of the management and servicing of the Fidelity funds, whether the Fidelity funds have appropriately benefited from such economies of scale, and whether there is potential for realization of any further economies of scale.
The Board recognized that the fund's management contract incorporates a "group fee" structure, which provides for lower group fee rates as total fund assets under FMR's management increase, and for higher group fee rates as total fund assets under FMR's management decrease. FMR calculates the group fee rates based on a tiered asset "breakpoint" schedule that varies based on asset class. The Board considered that the group fee is designed to deliver the benefits of economies of scale to fund shareholders when total Fidelity fund assets increase, even if assets of any particular fund are unchanged or have declined, because some portion of Fidelity's costs are attributable to services provided to all Fidelity funds, and all funds benefit if those costs can be allocated among more assets. The Board concluded that, given the group fee structure, fund shareholders will benefit from lower management fees as assets under FMR's management increase at the fund complex level, regardless of whether Fidelity achieves any such economies of scale.
The Board concluded, considering the findings of the Economies of Scale Committee, that any potential economies of scale are being appropriately shared between fund shareholders and Fidelity.
Annual Report
Board Approval of Investment Advisory Contracts and
Management Fees - continued
Additional Information Requested by the Board. In order to develop fully the factual basis for consideration of the Fidelity funds' Advisory Contracts, the Board requested and received additional information on certain topics, including (i) fund performance trends, actions to be taken by FMR to improve certain funds' overall performance, and Fidelity's long-term strategies for certain funds; (ii) portfolio manager changes that have occurred during the past year and length of portfolio manager tenure for different categories of funds over time; (iii) Fidelity's compensation structure for portfolio managers, research analysts, and other key personnel, the rationale for the compensation structure, and how the compensation structure provides appropriate performance incentives; (iv) the amount of the investment that each portfolio manager has made in the Fidelity fund(s) that he or she manages; (v) management and other fees paid by FMR to affiliated sub-advisers on behalf of the Fidelity funds; (vi) Fidelity's fee structures and rationale for recommending different fees among different categories of funds; (vii) Fidelity's rationale for recommending which funds should have a performance adjustment component as part of their management fees; (viii) the rationale for any differences between fund fee structures and fee structures in place for other Fidelity clients; and (ix) explanations regarding the relative total expenses borne by certain funds and classes, total expense competitive trends, and actions that might be taken by FMR to reduce total expenses for certain funds and classes.
Based on its evaluation of all of the conclusions noted above, and after considering all factors it believed relevant, the Board ultimately concluded that the advisory fee structures are fair and reasonable, and that the fund's Advisory Contracts should be renewed.
Annual Report
Investment Adviser
Fidelity Management & Research Company
Boston, MA
Investment Sub-Advisers
FMR Co., Inc.
Fidelity Management & Research
(U.K.) Inc.
Fidelity Research & Analysis Company
FIL Investment Advisors
FIL Investment Advisors (U.K.) Limited
FIL Investments (Japan) Limited
Fidelity Management & Research (Hong Kong) Limited
Fidelity Management & Research (Japan), Inc.
General Distributor
Fidelity Distributors Corporation
Boston, MA
Transfer and Service Agents
Fidelity Investments Institutional Operations Company, Inc.
Boston, MA
Fidelity Service Company, Inc.
Boston, MA
Custodian
Brown Brothers Harriman & Co.
Boston, MA
AEA-UANN-1210
1.784737.107
(Fidelity Investment logo)(registered trademark)
Fidelity AdvisorSM
Emerging Asia
Fund - Institutional Class
Annual Report
October 31, 2010
(2_fidelity_logos) (Registered_Trademark)
Contents
Chairman's Message | <Click Here> | The Chairman's message to shareholders. |
Performance | <Click Here> | How the fund has done over time. |
Management's Discussion of Fund Performance | <Click Here> | The Portfolio Manager's review of fundperformance and strategy. |
Shareholder Expense Example | <Click Here> | An example of shareholder expenses. |
Investment Changes | <Click Here> | A summary of major shifts in the fund's investments over the past six months. |
Investments | <Click Here> | A complete list of the fund's investments with their market values. |
Financial Statements | <Click Here> | Statements of assets and liabilities, operations, and changes in net assets,
as well as financial highlights. |
Notes | <Click Here> | Notes to financial statements. |
Report of Independent Registered Public Accounting Firm | <Click Here> | |
Trustees and Officers | <Click Here> | |
Distributions | <Click Here> | |
Board Approval of Investment Advisory Contracts and Management Fees | <Click Here> | |
To view a fund's proxy voting guidelines and proxy voting record for the 12-month period ended June 30, visit http://www.fidelity.com/proxyvotingresults or visit the Securities and Exchange Commission's (SEC) web site at http://www.sec.gov. You may also call 1-877-208-0098 to request a free copy of the proxy voting guidelines.
Standard & Poor's, S&P and S&P 500 are registered service marks of The McGraw-Hill Companies, Inc. and have been licensed for use by Fidelity Distributors Corporation.
Other third party marks appearing herein are the property of their respective owners.
All other marks appearing herein are registered or unregistered trademarks or service marks of FMR LLC or an affiliated company.
Annual Report
This report and the financial statements contained herein are submitted for the general information of the shareholders of the fund. This report is not authorized for distribution to prospective investors in the fund unless preceded or accompanied by an effective prospectus.
A fund files its complete schedule of portfolio holdings with the SEC for the first and third quarters of each fiscal year on Form N-Q. Forms N-Q are available on the SEC's web site at http://www.sec.gov. A fund's Forms N-Q may be reviewed and copied at the SEC's Public Reference Room in Washington, DC. Information regarding the operation of the SEC's Public Reference Room may be obtained by calling 1-800-SEC-0330. For a complete list of a fund's portfolio holdings, view the most recent holdings listing, semiannual report, or annual report on Fidelity's web site at http://www.fidelity.com or http://www.advisor.fidelity.com, as applicable.
NOT FDIC INSURED • MAY LOSE VALUE • NO BANK GUARANTEE
Neither the fund nor Fidelity Distributors Corporation is a bank.
Annual Report
(photo_of_Edward_C_Johnson_3d)
Dear Shareholder:
Equities have staged a rally in the second half of 2010, shaking off concerns about the European debt crisis and the possibility of a double-dip recession in the U.S. Although the short-term surge pushed major equity indexes back into positive territory for the year, several questions remain about the longer-term outlook, including lackluster economic growth and persistently high unemployment. Financial markets are always unpredictable, of course, but there also are several time-tested investment principles that can help put the odds in your favor.
One of the basic tenets is to invest for the long term. Over time, riding out the markets' inevitable ups and downs has proven much more effective than selling into panic or chasing the hottest trend. Even missing only a few of the markets' best days can significantly diminish investor returns. Patience also affords the benefits of compounding - of earning interest on additional income or reinvested dividends and capital gains. There can be tax advantages and cost benefits to consider as well. While staying the course doesn't eliminate risk, it can considerably lessen the effect of short-term declines.
You can further manage your investing risk through diversification. And today, more than ever, geographic diversification should be taken into account. Studies indicate that asset allocation is the single most important determinant of a portfolio's long-term success. The right mix of stocks, bonds and cash - aligned to your particular risk tolerance and investment objective - is very important. Age-appropriate rebalancing is also an essential aspect of asset allocation. For younger investors, an emphasis on equities - which historically have been the best-performing asset class over time - is encouraged. As investors near their specific goal, such as retirement or sending a child to college, consideration may be given to replacing volatile assets (e.g. common stocks) with more-stable fixed investments (bonds or savings plans).
A third principle - investing regularly - can help lower the average cost of your purchases. Investing a certain amount of money each month or quarter helps ensure you won't pay for all your shares at market highs. This strategy - known as dollar cost averaging - also reduces "emotion" from investing, helping shareholders avoid selling weak performers just prior to an upswing, or chasing a hot performer just before a correction.
We invite you to contact us via the Internet, through our Investor Centers or by phone. It is our privilege to provide you the information you need to make the investments that are right for you.
Sincerely,
(The chairman's signature appears here.)
Edward C. Johnson 3d
Annual Report
Average annual total return reflects the change in the value of an investment, assuming reinvestment of the class' distributions from dividend income and capital gains (the profits earned upon the sale of securities that have grown in value, if any) and assuming a constant rate of performance each year. The $10,000 table and the fund's returns do not reflect the deduction of taxes that a shareholder would pay on fund distributions or the redemption of fund shares. During periods of reimbursement by Fidelity, a fund's total return will be greater than it would be had the reimbursement not occurred. How a fund did yesterday is no guarantee of how it will do tomorrow.
Average Annual Total Returns
Periods ended October 31, 2010 | Past 1
year | Past 5
years | Past 10
years |
Institutional Class | 28.87% | 19.99% | 13.90% |
$10,000 Over 10 Years
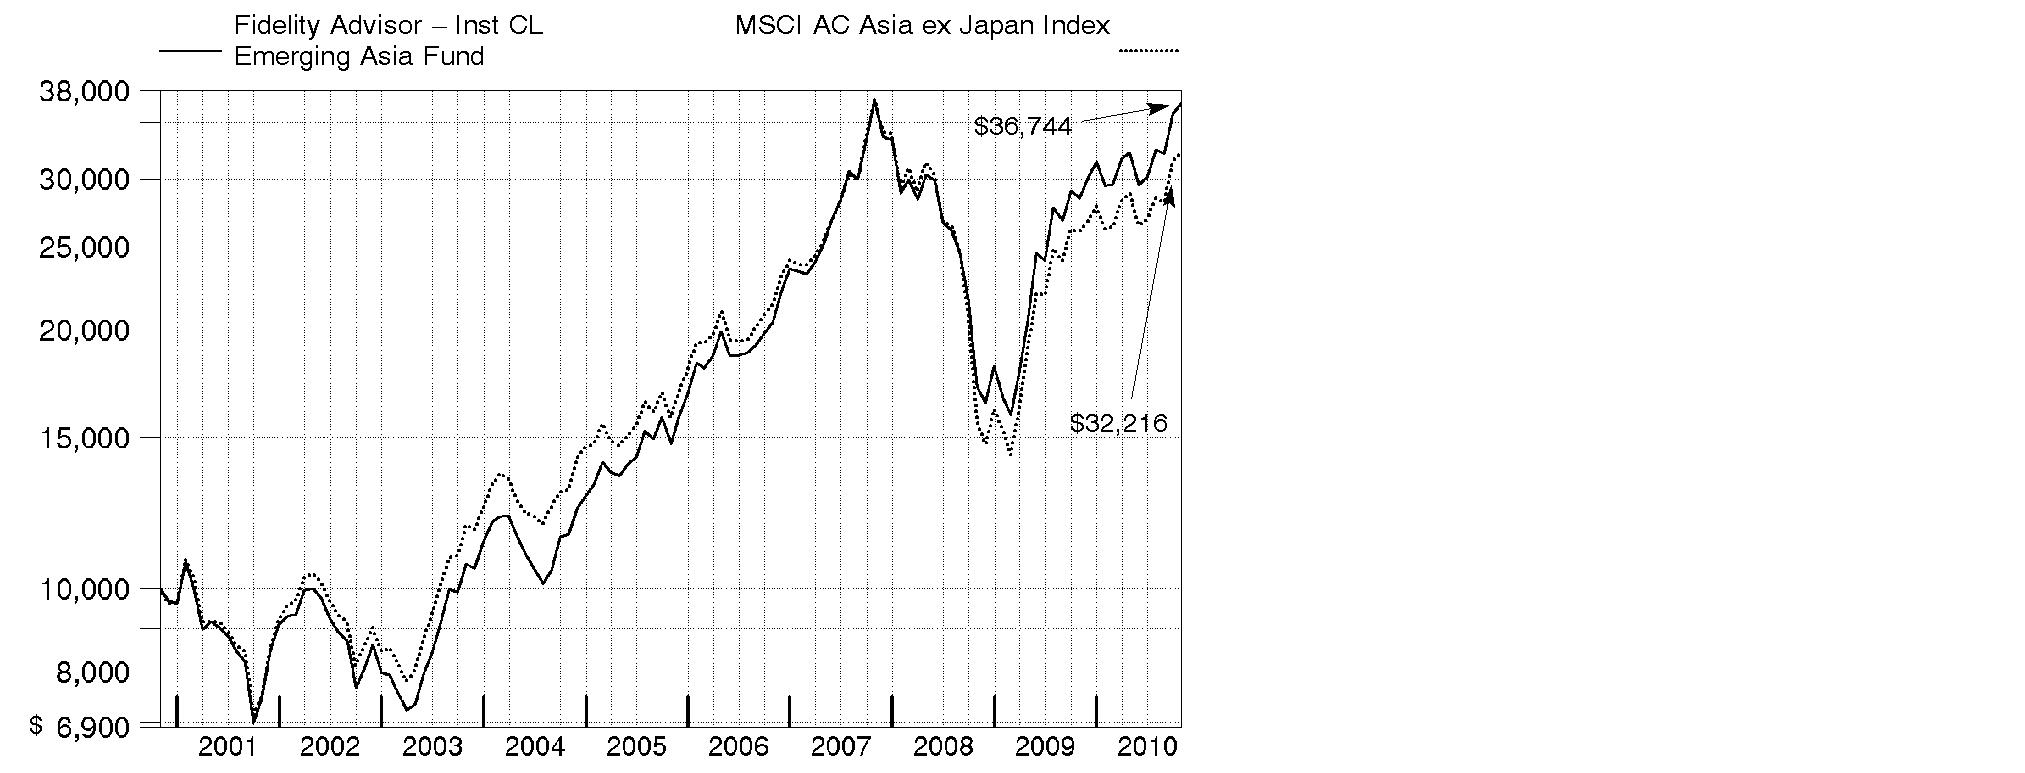 how the value of your investment would have changed, and also shows how the MSCI® AC (All Country) Asia ex Japan Index performed over the same period.
Annual Report
Market Recap: Stock markets in emerging Asia posted solid gains during the past year, reflecting continued healthy growth in the region's economies compared with most developed nations. A favorable backdrop for riskier assets also helped bolster performance, as did the falling value of the U.S. dollar relative to local currencies. For the 12 months ending October 31, 2010, the MSCI® AC (All Country) Asia ex Japan Index returned 23.59%. Among major index components, India and South Korea recorded market-beating results, with returns of roughly 35% and 25%, respectively. One notable standout with a more-modest index weighting was Thailand, which soared to a gain of more than 62%, despite the nation's ongoing political turmoil. On the other hand, sizable index components Taiwan and Hong Kong, with returns of approximately 21% and 17%, respectively, trailed the broader index for the period. With its return of more than 9%, China lagged all other benchmark components, as the government's attempts to tighten credit and keep inflation in check hampered that market's gains. From a sector perspective, consumer discretionary led the pack with a return of 46%, followed by health care and consumer staples. The weakest result came from utilities, which was up only 14%.
Comments from Colin Chickles, Portfolio Manager of Fidelity AdvisorSM Emerging Asia Fund: During the past year, the fund's Institutional Class shares returned 28.87%, outpacing the MSCI index. Stock selection in consumer discretionary and financials aided relative performance, as did stock picking in information technology, materials and energy, and an overweighting in consumer discretionary. Geographically, stock selection in India and China contributed the most. Four of the fund's top-five individual contributors were based in India, including motorcycle maker Bajaj Auto, gold/jewelry retailer Titan Industries, lender LIC Housing Finance and Tata Consultancy Services, a provider of technology outsourcing services. Hong Kong-based Pacific Textiles Holdings performed well but was sold from the fund for valuation reasons. Conversely, positioning in consumer staples and telecommunication services modestly detracted. Negative regional influences included security selection in the United Kingdom and an overweighting in China early in the period. China's BaWang International Group Holding, a maker of herbal hair and skin care products, was the biggest detractor and was sold. Underweighting Korea's LG Chemical and not owning casino operator Genting Singapore, both strong performers, also hurt, as did overweighting China Life Insurance. Some stocks mentioned were out-of-benchmark positions.
The views expressed above reflect those of the portfolio manager(s) only through the end of the period as stated on the cover of this report and do not necessarily represent the views of Fidelity or any other person in the Fidelity organization. Any such views are subject to change at any time based upon market or other conditions and Fidelity disclaims any responsibility to update such views. These views may not be relied on as investment advice and, because investment decisions for a Fidelity fund are based on numerous factors, may not be relied on as an indication of trading intent on behalf of any Fidelity fund.
Annual Report
Shareholder Expense Example
As a shareholder of the Fund, you incur two types of costs: (1) transaction costs, including sales charges (loads) on purchase payments or redemption proceeds, redemption fees, and (2) ongoing costs, including management fees, distribution and/or service (12b-1) fees and other Fund expenses. This Example is intended to help you understand your ongoing costs (in dollars) of investing in the Fund and to compare these costs with the ongoing costs of investing in other mutual funds.
The Example is based on an investment of $1,000 invested at the beginning of the period and held for the entire period (May 1, 2010 to October 31, 2010).
Actual Expenses
The first line of the accompanying table for each class of the Fund provides information about actual account values and actual expenses. You may use the information in this line, together with the amount you invested, to estimate the expenses that you paid over the period. Simply divide your account value by $1,000.00 (for example, an $8,600 account value divided by $1,000.00 = 8.6), then multiply the result by the number in the first line for a class of the Fund under the heading entitled "Expenses Paid During Period" to estimate the expenses you paid on your account during this period. In addition, the Fund, as a shareholder in the underlying Fidelity Central Funds, will indirectly bear its pro-rata share of the fees and expenses incurred by the underlying Fidelity Central Funds. These fees and expenses are not included in the Fund's annualized expense ratio used to calculate the expense estimate in the table below.
Hypothetical Example for Comparison Purposes
The second line of the accompanying table for each class of the Fund provides information about hypothetical account values and hypothetical expenses based on a Class' actual expense ratio and an assumed rate of return of 5% per year before expenses, which is not the Class' actual return. The hypothetical account values and expenses may not be used to estimate the actual ending account balance or expenses you paid for the period. You may use this information to compare the ongoing costs of investing in the Fund and other funds. To do so, compare this 5% hypothetical example with the 5% hypothetical examples that appear in the shareholder reports of the other funds. In addition, the Fund, as a shareholder in the underlying Fidelity Central Funds, will indirectly bear its pro-rata share of the fees and expenses incurred by the underlying Fidelity Central Funds. These fees and expenses are not included in the Fund's annualized expense ratio used to calculate the expense estimate in the table below.
Please note that the expenses shown in the table are meant to highlight your ongoing costs only and do not reflect any transaction costs. Therefore, the second line of the table is useful in comparing ongoing costs only, and will not help you determine the relative total costs of owning different funds. In addition, if these transactional costs were included, your costs would have been higher.
Annual Report
Shareholder Expense Example - continued
| Annualized
Expense Ratio | Beginning
Account Value
May 1, 2010 | Ending
Account Value
October 31, 2010 | Expenses Paid
During Period*
May 1, 2010 to
October 31, 2010 |
Class A | 1.43% | | | |
Actual | | $ 1,000.00 | $ 1,139.30 | $ 7.71 |
HypotheticalA | | $ 1,000.00 | $ 1,018.00 | $ 7.27 |
Class T | 1.74% | | | |
Actual | | $ 1,000.00 | $ 1,137.40 | $ 9.37 |
HypotheticalA | | $ 1,000.00 | $ 1,016.43 | $ 8.84 |
Class B | 2.22% | | | |
Actual | | $ 1,000.00 | $ 1,134.80 | $ 11.95 |
HypotheticalA | | $ 1,000.00 | $ 1,014.01 | $ 11.27 |
Class C | 2.17% | | | |
Actual | | $ 1,000.00 | $ 1,134.70 | $ 11.68 |
HypotheticalA | | $ 1,000.00 | $ 1,014.27 | $ 11.02 |
Institutional Class | 1.13% | | | |
Actual | | $ 1,000.00 | $ 1,140.70 | $ 6.10 |
HypotheticalA | | $ 1,000.00 | $ 1,019.51 | $ 5.75 |
A 5% return per year before expenses
* Expenses are equal to each Class' annualized expense ratio, multiplied by the average account value over the period, multiplied by 184/365 (to reflect the one-half year period).
Annual Report
Investment Changes (Unaudited)
Top Ten Stocks as of October 31, 2010 |
| % of fund's
net assets | % of fund's net assets
6 months ago |
Samsung Electronics Co. Ltd. | 3.7 | 3.5 |
China Mobile (Hong Kong) Ltd. | 3.0 | 3.0 |
Taiwan Semiconductor Manufacturing Co. Ltd. | 2.5 | 1.0 |
China Construction Bank Corp. (H Shares) | 2.5 | 1.9 |
CNOOC Ltd. | 1.9 | 1.8 |
China Life Insurance Co. Ltd. (H Shares) | 1.8 | 1.7 |
Reliance Industries Ltd. | 1.4 | 1.0 |
Formosa Plastics Corp. | 1.3 | 1.0 |
Hon Hai Precision Industry Co. Ltd. (Foxconn) | 1.3 | 1.9 |
Keppel Corp. Ltd. | 1.3 | 0.9 |
| 20.7 | |
Top Five Market Sectors as of October 31, 2010 |
| % of fund's
net assets | % of fund's net assets
6 months ago |
Financials | 32.0 | 29.4 |
Information Technology | 15.8 | 21.5 |
Industrials | 10.4 | 9.4 |
Consumer Discretionary | 9.3 | 8.9 |
Materials | 8.3 | 7.1 |
Asset Allocation (% of fund's net assets) |
As of October 31, 2010 | As of April 30, 2010 |
| Stocks 97.3% | | | Stocks 95.7% | |
| Short-Term
Investments and
Net Other Assets 2.7% | | | Short-Term
Investments and
Net Other Assets 4.3% | |

Annual Report
Investments October 31, 2010
Showing Percentage of Net Assets
Common Stocks - 97.3% |
| Shares | | Value |
Australia - 0.1% |
Wesfarmers Ltd. | 17,600 | | $ 571,395 |
Bermuda - 1.9% |
Beijing Enterprises Water Group Ltd. (a) | 1,004,000 | | 351,020 |
China Green (Holdings) Ltd. | 525,000 | | 538,462 |
China Yurun Food Group Ltd. | 576,000 | | 2,240,464 |
Huabao International Holdings Ltd. | 837,000 | | 1,261,237 |
Jardine Matheson Holdings Ltd. | 39,600 | | 1,782,000 |
Jinhui Shipping & Transportation Ltd. (a) | 78,000 | | 310,174 |
Noble Group Ltd. | 992,272 | | 1,425,965 |
TOTAL BERMUDA | | 7,909,322 |
British Virgin Islands - 0.1% |
ReneSola Ltd. sponsored ADR (a)(d) | 46,000 | | 550,620 |
Canada - 0.2% |
Niko Resources Ltd. | 9,300 | | 887,234 |
Cayman Islands - 4.0% |
Ausnutria Dairy Hunan Co. Ltd. (H Shares) | 203,000 | | 93,496 |
Belle International Holdings Ltd. | 1,259,000 | | 2,273,956 |
Central China Real Estate Ltd. | 3,788,000 | | 860,104 |
Chaoda Modern Agriculture (Holdings) Ltd. | 2,062,000 | | 1,681,257 |
China Digital TV Holding Co. Ltd. ADR (a) | 47,400 | | 311,892 |
China Infrastructure Machinery Holdings Ltd. | 524,000 | | 281,224 |
China Lilang Ltd. | 727,000 | | 1,136,751 |
Country Garden Holdings Co. Ltd. | 2,537,000 | | 896,808 |
Enn Energy Holdings Ltd. | 302,000 | | 907,802 |
International Taifeng Holdings Ltd. | 470,000 | | 271,647 |
JA Solar Holdings Co. Ltd. ADR (a) | 232,280 | | 1,939,538 |
Kingboard Chemical Holdings Ltd. | 460,500 | | 2,239,748 |
Maoye International Holdings Ltd. | 849,000 | | 365,833 |
Mecox Lane Ltd. ADR | 1,300 | | 21,229 |
Peak Sport Products Co. Ltd. | 372,000 | | 296,592 |
Shenguan Holdings Group Ltd. | 570,000 | | 742,719 |
Shui On Land Ltd. | 2,588,500 | | 1,299,050 |
SouFun Holdings Ltd. ADR | 600 | | 44,100 |
TPK Holdings Co. | 1,000 | | 16,501 |
Trina Solar Ltd. ADR (a)(d) | 18,600 | | 497,736 |
Youyuan International Holdings Ltd. | 518,000 | | 231,893 |
TOTAL CAYMAN ISLANDS | | 16,409,876 |
China - 15.3% |
Air China Ltd. (H Shares) (a) | 1,458,000 | | 1,959,988 |
Bank of China Ltd. (H Shares) | 4,260,000 | | 2,550,092 |
Common Stocks - continued |
| Shares | | Value |
China - continued |
Bank of Communications Co. Ltd. (H Shares) | 2,023,000 | | $ 2,210,587 |
China Communications Construction Co. Ltd. (H Shares) | 1,346,000 | | 1,286,742 |
China Communications Services Corp. Ltd. (H Shares) | 1,002,000 | | 584,298 |
China Construction Bank Corp. (H Shares) | 10,753,000 | | 10,251,852 |
China Life Insurance Co. Ltd. (H Shares) | 1,725,000 | | 7,583,594 |
China Merchants Bank Co. Ltd. (H Shares) | 1,157,500 | | 3,285,277 |
China Metal Recycling (Holdings) Ltd. | 541,800 | | 603,223 |
China Minsheng Banking Corp. Ltd. (H Shares) | 2,065,000 | | 1,920,806 |
China Petroleum & Chemical Corp. (H Shares) | 5,236,000 | | 4,981,862 |
China Railway Group Ltd. | 1,348,000 | | 1,086,921 |
China Southern Airlines Ltd. (H Shares) (a) | 506,000 | | 344,025 |
Dalian Port (PDA) Co. Ltd. (H Shares) | 618,000 | | 267,092 |
Digital China Holdings Ltd. (H Shares) | 900,000 | | 1,625,544 |
Dongfeng Motor Group Co. Ltd. (H Shares) | 1,128,000 | | 2,444,819 |
Great Wall Motor Co. Ltd. (H Shares) | 252,500 | | 793,211 |
Harbin Power Equipment Co. Ltd. (H Shares) | 766,000 | | 1,031,710 |
Huadian Power International Corp. Ltd. (H shares) | 4,672,000 | | 1,072,880 |
Huaneng Power International, Inc. (H Shares) | 4,454,000 | | 2,547,934 |
Industrial & Commercial Bank of China Ltd. (H Shares) | 4,028,000 | | 3,242,667 |
PICC Property & Casualty Co. Ltd. (H Shares) (a) | 1,350,000 | | 1,992,453 |
Ping An Insurance Group Co. China Ltd. (H Shares) | 489,500 | | 5,269,960 |
Sina Corp. (a) | 2,200 | | 123,860 |
Sinotrans Ltd. (H Shares) | 4,213,000 | | 1,135,968 |
Tencent Holdings Ltd. | 38,700 | | 886,212 |
Weichai Power Co. Ltd. (H Shares) | 100,000 | | 1,313,337 |
Xinjiang Goldwind Science & Technology Co. Ltd. (H Shares) (a) | 67,200 | | 173,825 |
Zhongpin, Inc. (a)(d) | 19,500 | | 394,290 |
TOTAL CHINA | | 62,965,029 |
Hong Kong - 14.1% |
Cathay Pacific Airways Ltd. | 1,086,000 | | 2,921,219 |
Cheung Kong Holdings Ltd. | 320,000 | | 4,871,472 |
China Everbright Ltd. | 318,000 | | 826,667 |
China Mobile (Hong Kong) Ltd. | 1,203,500 | | 12,290,520 |
China Resources Power Holdings Co. Ltd. | 1,286,000 | | 2,475,358 |
Citic Pacific Ltd. | 681,000 | | 1,814,243 |
CLP Holdings Ltd. | 514,500 | | 4,181,713 |
CNOOC Ltd. | 3,704,500 | | 7,733,952 |
First Pacific Co. Ltd. | 388,000 | | 358,905 |
Galaxy Entertainment Group Ltd. (a) | 320,000 | | 301,371 |
Hang Lung Group Ltd. | 372,000 | | 2,469,202 |
Common Stocks - continued |
| Shares | | Value |
Hong Kong - continued |
Hang Seng Bank Ltd. | 248,200 | | $ 3,631,141 |
Henderson Land Development Co. Ltd. | 1,390 | | 9,872 |
Hongkong Land Holdings Ltd. | 435,000 | | 3,001,500 |
Hysan Development Co. Ltd. | 599,000 | | 2,314,472 |
PCCW Ltd. | 4,464,000 | | 1,704,685 |
Swire Pacific Ltd. (A Shares) | 182,000 | | 2,582,809 |
Wharf Holdings Ltd. | 696,000 | | 4,570,411 |
TOTAL HONG KONG | | 58,059,512 |
India - 11.1% |
Apollo Tyres Ltd. | 455,823 | | 735,796 |
Asian Paints India Ltd. | 22,411 | | 1,358,943 |
Bajaj Auto Ltd. | 32,896 | | 1,121,358 |
Bank of Baroda | 75,638 | | 1,794,619 |
Bank of India | 68,795 | | 755,154 |
Bharti Airtel Ltd. | 150,431 | | 1,105,197 |
Cadila Healthcare Ltd. | 90,301 | | 1,422,508 |
Canara Bank | 69,757 | | 1,135,469 |
Ess Dee Aluminium Ltd. | 87,436 | | 936,300 |
HDFC Bank Ltd. | 57,149 | | 2,945,844 |
Hindalco Industries Ltd. | 314,128 | | 1,491,798 |
ICSA (India) Ltd. | 186,602 | | 545,808 |
IFCI Ltd. | 347,735 | | 542,490 |
Indian Oil Corp. Ltd. | 144,385 | | 1,361,763 |
Indian Overseas Bank | 93,478 | | 337,006 |
Jubilant Life Sciences Ltd. | 117,476 | | 830,217 |
Larsen & Toubro Ltd. | 44,269 | | 2,025,238 |
LIC Housing Finance Ltd. | 18,918 | | 572,149 |
Mahindra & Mahindra Ltd. | 122,838 | | 2,033,305 |
Oil & Natural Gas Corp. Ltd. | 55,142 | | 1,622,288 |
Oriental Bank of Commerce | 74,575 | | 839,379 |
Patni Computer Systems Ltd. | 158,817 | | 1,659,341 |
Reliance Industries Ltd. | 231,988 | | 5,737,549 |
Rural Electrification Corp. Ltd. | 284,104 | | 2,375,706 |
State Bank of India | 28,897 | | 2,053,985 |
Sun TV Ltd. | 71,692 | | 807,576 |
Tata Consultancy Services Ltd. | 132,969 | | 3,158,558 |
Titan Industries Ltd. | 12,572 | | 1,007,504 |
Tulip Telecom Ltd. | 203,154 | | 817,887 |
Union Bank of India | 116,851 | | 1,003,173 |
Voltas Ltd. | 110,325 | | 610,303 |
Common Stocks - continued |
| Shares | | Value |
India - continued |
Zee Entertainment Enterprises Ltd. | 140,469 | | $ 875,297 |
Zee Learn Ltd. (a) | 35,117 | | 10,299 |
TOTAL INDIA | | 45,629,807 |
Indonesia - 2.5% |
PT Astra International Tbk | 414,000 | | 2,640,333 |
PT Bank Negara Indonesia (Persero) Tbk | 3,610,000 | | 1,575,271 |
PT Bank Rakyat Indonesia Tbk | 2,828,500 | | 3,607,817 |
PT BISI International Tbk (a) | 2,542,500 | | 668,517 |
PT Indofood Sukses Makmur Tbk | 1,696,000 | | 986,763 |
PT XL Axiata Tbk (a) | 1,025,500 | | 659,762 |
TOTAL INDONESIA | | 10,138,463 |
Korea (South) - 19.0% |
Asiana Airlines, Inc. (a) | 40,610 | | 330,441 |
Busan Bank | 167,700 | | 2,087,861 |
Cheil Worldwide, Inc. | 90,840 | | 989,586 |
CJ CheilJedang Corp. | 7,076 | | 1,362,342 |
CJ Corp. | 30,390 | | 2,143,110 |
CJ Home Shopping (a) | 3,650 | | 823,806 |
Daegu Bank Co. Ltd. | 92,800 | | 1,217,252 |
Daelim Industrial Co. | 13,373 | | 1,089,343 |
Dongbu Insurance Co. Ltd. | 22,820 | | 805,650 |
Doosan Co. Ltd. | 8,555 | | 1,152,585 |
Doosan Construction & Engineering Co. Ltd. | 105,020 | | 691,105 |
Duksan Hi-Metal Co. Ltd. (a) | 71,235 | | 1,476,012 |
GS Holdings Corp. | 73,700 | | 3,866,874 |
Halla Climate Control Co. | 43,640 | | 811,095 |
Hanwha Chemical Corp. | 36,980 | | 1,004,659 |
Hanwha Corp. | 37,120 | | 1,401,284 |
Honam Petrochemical Corp. | 8,704 | | 1,919,601 |
Hyosung Corp. | 6,059 | | 673,521 |
Hyundai Department Store Co. Ltd. | 3,735 | | 413,524 |
Hyundai Mipo Dockyard Co. Ltd. | 5,301 | | 886,250 |
Hyundai Mobis | 17,634 | | 4,390,858 |
Hyundai Motor Co. | 33,086 | | 5,001,885 |
Hyundai Steel Co. | 19,080 | | 1,849,462 |
Industrial Bank of Korea | 190,600 | | 2,737,385 |
Kia Motors Corp. | 66,300 | | 2,647,283 |
Korea Zinc Co. Ltd. | 5,051 | | 1,273,418 |
Kyeryong Construction Industrial Co. Ltd. | 11,900 | | 200,538 |
LG Chemical Ltd. | 12,328 | | 3,804,193 |
Common Stocks - continued |
| Shares | | Value |
Korea (South) - continued |
LG Corp. | 33,474 | | $ 2,396,315 |
LIG Non-Life Insurance Co. Ltd. | 51,310 | | 1,060,878 |
Lotte Shopping Co. Ltd. | 5,912 | | 2,421,054 |
Meritz Fire & Marine Insurance Co. Ltd. | 32,950 | | 226,211 |
POSCO | 11,765 | | 4,858,983 |
Samsung Electronics Co. Ltd. | 23,163 | | 15,345,863 |
SK Telecom Co. Ltd. | 34,493 | | 5,253,527 |
TOTAL KOREA (SOUTH) | | 78,613,754 |
Malaysia - 2.7% |
AMMB Holdings Bhd | 823,600 | | 1,673,144 |
Axiata Group Bhd (a) | 1,425,200 | | 2,056,942 |
Genting Malaysia Bhd | 1,470,500 | | 1,654,372 |
Glomac Bhd | 351,000 | | 180,521 |
Malayan Banking Bhd | 1,120,900 | | 3,242,719 |
Public Bank Bhd (For. Reg.) | 569,400 | | 2,335,437 |
TOTAL MALAYSIA | | 11,143,135 |
Mauritius - 0.5% |
Golden Agri-Resources Ltd. | 3,810,000 | | 1,913,389 |
Philippines - 0.2% |
Megaworld Corp. | 5,560,000 | | 331,786 |
Universal Robina Corp. | 382,000 | | 386,897 |
TOTAL PHILIPPINES | | 718,683 |
Singapore - 5.6% |
CapitaLand Ltd. | 669,000 | | 2,010,670 |
Ezra Holdings Ltd. | 256,800 | | 347,215 |
Keppel Corp. Ltd. | 687,000 | | 5,297,273 |
Keppel Land Ltd. | 509,000 | | 1,742,154 |
MobileOne Ltd. | 544,000 | | 933,076 |
Oversea-Chinese Banking Corp. Ltd. | 500,209 | | 3,482,101 |
Raffles Medical Group Ltd. | 349,000 | | 587,824 |
SembCorp Industries Ltd. | 861,000 | | 3,046,728 |
SembCorp Marine Ltd. | 577,000 | | 2,050,684 |
Singapore Exchange Ltd. | 296,000 | | 2,012,516 |
United Overseas Bank Ltd. | 3,017 | | 43,450 |
Yangzijiang Shipbuilding Holdings Ltd. | 550,000 | | 794,638 |
Yanlord Land Group Ltd. | 739,000 | | 982,060 |
TOTAL SINGAPORE | | 23,330,389 |
Common Stocks - continued |
| Shares | | Value |
Taiwan - 14.1% |
Cando Corp. (a) | 188,339 | | $ 146,770 |
China Airlines Ltd. (a) | 1,000,000 | | 779,284 |
Chroma ATE, Inc. | 739,896 | | 1,905,042 |
Compal Electronics, Inc. | 2,271,836 | | 2,895,004 |
Delta Electronics, Inc. | 691,000 | | 2,856,118 |
Far East Department Stores Co. Ltd. | 858,900 | | 1,066,434 |
Farglory Land Development Co. Ltd. | 414,000 | | 1,028,067 |
Formosa Chemicals & Fibre Corp. | 1,291,000 | | 3,703,637 |
Formosa Plastics Corp. | 1,891,000 | | 5,424,924 |
Fubon Financial Holding Co. Ltd. | 3,570,549 | | 4,374,958 |
Hon Hai Precision Industry Co. Ltd. (Foxconn) | 1,414,000 | | 5,359,386 |
HTC Corp. | 146,750 | | 3,313,323 |
Huaku Development Co. Ltd. | 340,971 | | 945,873 |
Hung Poo Real Estate Development Co. Ltd. | 857,000 | | 1,275,489 |
Insyde Software Corp. | 176,195 | | 551,527 |
King Slide Works Co. Ltd. | 59,850 | | 276,712 |
Macronix International Co. Ltd. | 3,214,000 | | 1,979,543 |
Powertech Technology, Inc. | 451,000 | | 1,488,352 |
Taishin Financial Holdings Co. Ltd. | 7,324,890 | | 3,207,108 |
Taiwan Cement Corp. | 804,000 | | 856,409 |
Taiwan Semiconductor Manufacturing Co. Ltd. | 5,012,393 | | 10,317,619 |
Tripod Technology Corp. | 398,000 | | 1,528,018 |
U-Ming Marine Transport Corp. | 431,000 | | 887,208 |
Wistron Corp. | 1,024,000 | | 2,104,545 |
TOTAL TAIWAN | | 58,271,350 |
Thailand - 4.9% |
Advanced Info Service PCL (For. Reg.) | 209,200 | | 628,858 |
Asian Property Development PCL (For. Reg.) | 1,197,500 | | 263,978 |
Bangkok Bank Public Co. Ltd.: | | | |
(For. Reg.) | 387,900 | | 2,001,688 |
NVDR | 163,000 | | 811,189 |
Banpu PCL unit | 156,000 | | 4,032,866 |
BEC World PCL (For. Reg.) | 968,100 | | 1,075,128 |
C.P. Seven Eleven PCL | 964,900 | | 1,434,137 |
Charoen Pokphand Foods PCL (For. Reg.) | 1,516,900 | | 1,180,487 |
Electricity Generating PCL: | | | |
unit | 166,300 | | 533,226 |
(For. Reg.) | 393,700 | | 1,262,365 |
LPN Development PCL | 652,300 | | 252,728 |
National Finance PCL (For. Reg.) | 1,089,100 | | 1,436,855 |
Preuksa Real Estate PCL (For. Reg.) | 656,100 | | 473,339 |
Common Stocks - continued |
| Shares | | Value |
Thailand - continued |
PTT Aromatics & Refining PLC | 1,836,500 | | $ 1,824,846 |
Quality Houses PCL | 6,187,000 | | 479,420 |
Siam Cement PCL (For. Reg.) | 169,700 | | 1,864,773 |
Supalai PCL (For. Reg.) | 2,140,000 | | 857,715 |
TOTAL THAILAND | | 20,413,598 |
United Kingdom - 0.9% |
HSBC Holdings PLC (Hong Kong) | 270,828 | | 2,822,957 |
Vedanta Resources PLC | 25,100 | | 834,440 |
TOTAL UNITED KINGDOM | | 3,657,397 |
United States of America - 0.1% |
China Natural Gas, Inc. (a)(d) | 13,300 | | 82,061 |
Cognizant Technology Solutions Corp. Class A (a) | 2,900 | | 189,051 |
TOTAL UNITED STATES OF AMERICA | | 271,112 |
TOTAL COMMON STOCKS (Cost $321,814,732) | 401,454,065 |
Money Market Funds - 2.3% |
| | | |
Fidelity Cash Central Fund, 0.23% (b) | 8,492,417 | | 8,492,417 |
Fidelity Securities Lending Cash Central Fund, 0.24% (b)(c) | 1,122,900 | | 1,122,900 |
TOTAL MONEY MARKET FUNDS (Cost $9,615,317) | 9,615,317 |
TOTAL INVESTMENT PORTFOLIO - 99.6% (Cost $331,430,049) | | 411,069,382 |
NET OTHER ASSETS (LIABILITIES) - 0.4% | | 1,547,700 |
NET ASSETS - 100% | $ 412,617,082 |
Legend |
(a) Non-income producing |
(b) Affiliated fund that is available only to investment companies and other accounts managed by Fidelity Investments. The rate quoted is the annualized seven-day yield of the fund at period end. A complete unaudited listing of the fund's holdings as of its most recent quarter end is available upon request. In addition, each Fidelity Central Fund's financial statements, which are not covered by the Fund's report of Independent Registered Public Accounting Firm, are available on the SEC's website or upon request. |
(c) Investment made with cash collateral received from securities on loan. |
(d) Security or a portion of the security is on loan at period end. |
Affiliated Central Funds |
Information regarding fiscal year to date income earned by the Fund from investments in Fidelity Central Funds is as follows: |
Fund | Income earned |
Fidelity Cash Central Fund | $ 14,419 |
Fidelity Securities Lending Cash Central Fund | 44,746 |
Total | $ 59,165 |
Other Information |
The following is a summary of the inputs used, as of October 31, 2010, involving the Fund's assets and liabilities carried at fair value. The inputs or methodology used for valuing securities may not be an indication of the risk associated with investing in those securities. For more information on valuation inputs, and their aggregation into the levels used in the tables below, please refer to the Security Valuation section in the accompanying Notes to Financial Statements. |
Valuation Inputs at Reporting Date: |
Description | Total | Level 1 | Level 2 | Level 3 |
Investments in Securities: | | | | |
Equities: | | | | |
Korea (South) | $ 78,613,754 | $ 68,501,244 | $ 10,112,510 | $ - |
China | 62,965,029 | 47,851,639 | 15,113,390 | - |
Taiwan | 58,271,350 | 47,953,731 | 10,317,619 | - |
Hong Kong | 58,059,512 | 38,035,040 | 20,024,472 | - |
India | 45,629,807 | 37,480,735 | 8,138,773 | 10,299 |
Singapore | 23,330,389 | 23,330,389 | - | - |
Thailand | 20,413,598 | 20,413,598 | - | - |
Cayman Islands | 16,409,876 | 16,409,876 | - | - |
Malaysia | 11,143,135 | 11,143,135 | - | - |
Other | 26,617,615 | 23,794,658 | 2,822,957 | - |
Money Market Funds | 9,615,317 | 9,615,317 | - | - |
Total Investments in Securities: | $ 411,069,382 | $ 344,529,362 | $ 66,529,721 | $ 10,299 |
The following is a reconciliation of Investments in Securities for which Level 3 inputs were used in determining value: |
Investments in Securities: | |
Beginning Balance | $ - |
Total Realized Gain (Loss) | - |
Total Unrealized Gain (Loss) | - |
Cost of Purchases | 10,299 |
Proceeds of Sales | - |
Amortization/Accretion | - |
Transfers in to Level 3 | - |
Transfers out of Level 3 | - |
Ending Balance | $ 10,299 |
The change in unrealized gain (loss) for the period attributable to Level 3 securities held at October 31, 2010 | $ - |
The information used in the above reconciliation represents fiscal year to date activity for any Investments in Securities identified as using Level 3 inputs at either the beginning or the end of the current fiscal period. Transfers in or out of Level 3 represent the beginning value of any Security or Instrument where a change in the pricing level occurred from the beginning to the end of the period. The cost of purchases and the proceeds of sales may include securities received or delivered through corporate actions or exchanges. Realized and unrealized gains (losses) disclosed in the reconciliation are included in Net Gain (Loss) on the Fund's Statement of Operations. |
See accompanying notes which are an integral part of the financial statements.
Annual Report
Statement of Assets and Liabilities
| October 31, 2010 |
| | |
Assets | | |
Investment in securities, at value (including securities loaned of $1,069,128) - See accompanying schedule: Unaffiliated issuers (cost $321,814,732) | $ 401,454,065 | |
Fidelity Central Funds (cost $9,615,317) | 9,615,317 | |
Total Investments (cost $331,430,049) | | $ 411,069,382 |
Foreign currency held at value (cost $22,603) | | 22,634 |
Receivable for investments sold | | 1,832,733 |
Receivable for fund shares sold | | 1,451,748 |
Dividends receivable | | 199,927 |
Distributions receivable from Fidelity Central Funds | | 6,645 |
Other receivables | | 311,868 |
Total assets | | 414,894,937 |
| | |
Liabilities | | |
Payable for fund shares redeemed | $ 537,465 | |
Accrued management fee | 239,296 | |
Distribution and service plan fees payable | 159,773 | |
Other affiliated payables | 97,577 | |
Other payables and accrued expenses | 120,844 | |
Collateral on securities loaned, at value | 1,122,900 | |
Total liabilities | | 2,277,855 |
| | |
Net Assets | | $ 412,617,082 |
Net Assets consist of: | | |
Paid in capital | | $ 308,680,969 |
Undistributed net investment income | | 1,972,932 |
Accumulated undistributed net realized gain (loss) on investments and foreign currency transactions | | 22,311,022 |
Net unrealized appreciation (depreciation) on investments and assets and liabilities in foreign currencies | | 79,652,159 |
Net Assets | | $ 412,617,082 |
See accompanying notes which are an integral part of the financial statements.
Annual Report
Statement of Assets and Liabilities - continued
| October 31, 2010 |
| | |
Calculation of Maximum Offering Price Class A:
Net Asset Value and redemption price per share ($189,254,827 ÷ 5,741,073 shares) | | $ 32.97 |
| | |
Maximum offering price per share (100/94.25 of $32.97) | | $ 34.98 |
Class T:
Net Asset Value and redemption price per share ($61,619,507 ÷ 1,913,837 shares) | | $ 32.20 |
| | |
Maximum offering price per share (100/96.50 of $32.20) | | $ 33.37 |
Class B:
Net Asset Value and offering price per share ($29,611,355 ÷ 964,059 shares)A | | $ 30.72 |
| | |
Class C:
Net Asset Value and offering price per share ($87,088,942 ÷ 2,847,675 shares)A | | $ 30.58 |
| | |
Institutional Class:
Net Asset Value, offering price and redemption price per share ($45,042,451 ÷ 1,332,662 shares) | | $ 33.80 |
A Redemption price per share is equal to net asset value less any applicable contingent deferred sales charge.
See accompanying notes which are an integral part of the financial statements.
Annual Report
Financial Statements - continued
Statement of Operations
| Year ended October 31, 2010 |
| | |
Investment Income | | |
Dividends | | $ 8,449,311 |
Interest | | 50 |
Income from Fidelity Central Funds | | 59,165 |
Income before foreign taxes withheld | | 8,508,526 |
Less foreign taxes withheld | | (876,943) |
Total income | | 7,631,583 |
| | |
Expenses | | |
Management fee | $ 2,397,259 | |
Transfer agent fees | 900,588 | |
Distribution and service plan fees | 1,615,364 | |
Accounting and security lending fees | 175,511 | |
Custodian fees and expenses | 378,039 | |
Independent trustees' compensation | 1,856 | |
Registration fees | 71,295 | |
Audit | 103,825 | |
Legal | 1,509 | |
Interest | 1,167 | |
Miscellaneous | 3,691 | |
Total expenses before reductions | 5,650,104 | |
Expense reductions | (137,688) | 5,512,416 |
Net investment income (loss) | | 2,119,167 |
Realized and Unrealized Gain (Loss) Net realized gain (loss) on: | | |
Investment securities: | | |
Unaffiliated issuers | 58,247,481 | |
Foreign currency transactions | (133,318) | |
Total net realized gain (loss) | | 58,114,163 |
Change in net unrealized appreciation (depreciation) on: Investment securities | 23,745,972 | |
Assets and liabilities in foreign currencies | 21,285 | |
Total change in net unrealized appreciation (depreciation) | | 23,767,257 |
Net gain (loss) | | 81,881,420 |
Net increase (decrease) in net assets resulting from operations | | $ 84,000,587 |
See accompanying notes which are an integral part of the financial statements.
Annual Report
Statement of Changes in Net Assets
| Year ended
October 31,
2010 | Year ended
October 31,
2009 |
Increase (Decrease) in Net Assets | | |
Operations | | |
Net investment income (loss) | $ 2,119,167 | $ 1,327,380 |
Net realized gain (loss) | 58,114,163 | (7,124,629) |
Change in net unrealized appreciation (depreciation) | 23,767,257 | 100,271,241 |
Net increase (decrease) in net assets resulting
from operations | 84,000,587 | 94,473,992 |
Distributions to shareholders from net investment income | (971,544) | (378,765) |
Distributions to shareholders from net realized gain | (2,532,430) | - |
Total distributions | (3,503,974) | (378,765) |
Share transactions - net increase (decrease) | 46,082,399 | 41,327,444 |
Redemption fees | 86,566 | 52,262 |
Total increase (decrease) in net assets | 126,665,578 | 135,474,933 |
| | |
Net Assets | | |
Beginning of period | 285,951,504 | 150,476,571 |
End of period (including undistributed net investment income of $1,972,932 and undistributed net investment income of $948,615, respectively) | $ 412,617,082 | $ 285,951,504 |
See accompanying notes which are an integral part of the financial statements.
Annual Report
Financial Highlights - Class A
Years ended October 31, | 2010 | 2009 | 2008 | 2007 | 2006 |
Selected Per-Share Data | | | | | |
Net asset value, beginning of period | $ 25.96 | $ 15.74 | $ 37.55 | $ 22.48 | $ 17.70 |
Income from Investment Operations | | | | | |
Net investment income (loss) C | .25 | .19 | .19 | .24 | .22 |
Net realized and unrealized gain (loss) | 7.09 | 10.07 | (18.72) | 16.64 | 6.10 |
Total from investment operations | 7.34 | 10.26 | (18.53) | 16.88 | 6.32 |
Distributions from net investment income | (.12) | (.05) | (.23) | (.15) | (.16) |
Distributions from net realized gain | (.22) | - | (3.06) | (1.68) | (1.39) |
Total distributions | (.34) | (.05) | (3.29) | (1.83) | (1.55) |
Redemption fees added to paid in capital C | .01 | .01 | .01 | .02 | .01 |
Net asset value, end of period | $ 32.97 | $ 25.96 | $ 15.74 | $ 37.55 | $ 22.48 |
Total Return A, B | 28.53% | 65.43% | (53.66)% | 80.43% | 38.02% |
Ratios to Average Net Assets D, F | | | | | |
Expenses before reductions | 1.44% | 1.54% | 1.50% | 1.47% | 1.73% |
Expenses net of fee waivers, if any | 1.44% | 1.50% | 1.50% | 1.47% | 1.50% |
Expenses net of all reductions | 1.40% | 1.41% | 1.41% | 1.40% | 1.39% |
Net investment income (loss) | .86% | .94% | .73% | .88% | 1.08% |
Supplemental Data | | | | | |
Net assets, end of period (000 omitted) | $ 189,255 | $ 131,564 | $ 71,722 | $ 152,630 | $ 55,790 |
Portfolio turnover rate E | 138% | 91% | 92% G | 66% | 77% |
A Total returns would have been lower had certain expenses not been reduced during the periods shown.
B Total returns do not include the effect of the sales charges.
C Calculated based on average shares outstanding during the period.
D Fees and expenses of the underlying Fidelity Central Funds are not included in the Fund's expense ratio. The Fund indirectly bears its proportionate share of the expenses of any underlying Fidelity Central Funds.
E Amount does not include the portfolio activity of any underlying Fidelity Central Funds.
F Expense ratios reflect operating expenses of the class. Expenses before reductions do not reflect amounts reimbursed by the investment adviser or reductions from brokerage service arrangements or reductions from other expense offset arrangements and do not represent the amount paid by the class during periods when reimbursements or reductions occur. Expenses net of fee waivers reflect expenses after reimbursement by the investment adviser but prior to reductions from brokerage service arrangements or other expense offset arrangements. Expenses net of all reductions represent the net expenses paid by the class.
G The portfolio turnover rate does not include the assets acquired in the merger.
See accompanying notes which are an integral part of the financial statements.
Annual Report
Financial Highlights - Class T
Years ended October 31, | 2010 | 2009 | 2008 | 2007 | 2006 |
Selected Per-Share Data | | | | | |
Net asset value, beginning of period | $ 25.40 | $ 15.43 | $ 36.88 | $ 22.13 | $ 17.45 |
Income from Investment Operations | | | | | |
Net investment income (loss) C | .15 | .14 | .12 | .16 | .17 |
Net realized and unrealized gain (loss) | 6.94 | 9.86 | (18.38) | 16.37 | 6.01 |
Total from investment operations | 7.09 | 10.00 | (18.26) | 16.53 | 6.18 |
Distributions from net investment income | (.08) | (.04) | (.14) | (.12) | (.12) |
Distributions from net realized gain | (.22) | - | (3.06) | (1.68) | (1.39) |
Total distributions | (.30) | (.04) | (3.20) | (1.80) | (1.51) |
Redemption fees added to paid in capital C | .01 | .01 | .01 | .02 | .01 |
Net asset value, end of period | $ 32.20 | $ 25.40 | $ 15.43 | $ 36.88 | $ 22.13 |
Total Return A, B | 28.13% | 65.06% | (53.79)% | 79.98% | 37.69% |
Ratios to Average Net Assets D, F | | | | | |
Expenses before reductions | 1.74% | 1.84% | 1.80% | 1.79% | 2.07% |
Expenses net of fee waivers, if any | 1.74% | 1.75% | 1.75% | 1.75% | 1.75% |
Expenses net of all reductions | 1.70% | 1.66% | 1.66% | 1.67% | 1.64% |
Net investment income (loss) | .55% | .69% | .48% | .61% | .83% |
Supplemental Data | | | | | |
Net assets, end of period (000 omitted) | $ 61,620 | $ 45,259 | $ 25,205 | $ 64,813 | $ 28,850 |
Portfolio turnover rate E | 138% | 91% | 92% G | 66% | 77% |
A Total returns would have been lower had certain expenses not been reduced during the periods shown.
B Total returns do not include the effect of the sales charges.
C Calculated based on average shares outstanding during the period.
D Fees and expenses of the underlying Fidelity Central Funds are not included in the Fund's expense ratio. The Fund indirectly bears its proportionate share of the expenses of any underlying Fidelity Central Funds.
E Amount does not include the portfolio activity of any underlying Fidelity Central Funds.
F Expense ratios reflect operating expenses of the class. Expenses before reductions do not reflect amounts reimbursed by the investment adviser or reductions from brokerage service arrangements or reductions from other expense offset arrangements and do not represent the amount paid by the class during periods when reimbursements or reductions occur. Expenses net of fee waivers reflect expenses after reimbursement by the investment adviser but prior to reductions from brokerage service arrangements or other expense offset arrangements. Expenses net of all reductions represent the net expenses paid by the class.
G The portfolio turnover rate does not include the assets acquired in the merger.
See accompanying notes which are an integral part of the financial statements.
Annual Report
Financial Highlights - Class B
Years ended October 31, | 2010 | 2009 | 2008 | 2007 | 2006 |
Selected Per-Share Data | | | | | |
Net asset value, beginning of period | $ 24.29 | $ 14.82 | $ 35.55 | $ 21.42 | $ 16.94 |
Income from Investment Operations | | | | | |
Net investment income (loss) C | .02 | .04 | (.01) | .03 | .06 |
Net realized and unrealized gain (loss) | 6.61 | 9.45 | (17.68) | 15.79 | 5.84 |
Total from investment operations | 6.63 | 9.49 | (17.69) | 15.82 | 5.90 |
Distributions from net investment income | - | (.03) | - | (.03) | (.04) |
Distributions from net realized gain | (.21) | - | (3.05) | (1.68) | (1.39) |
Total distributions | (.21) | (.03) | (3.05) | (1.71) | (1.43) |
Redemption fees added to paid in capital C | .01 | .01 | .01 | .02 | .01 |
Net asset value, end of period | $ 30.72 | $ 24.29 | $ 14.82 | $ 35.55 | $ 21.42 |
Total Return A, B | 27.48% | 64.23% | (54.01)% | 79.01% | 36.99% |
Ratios to Average Net Assets D, F | | | | | |
Expenses before reductions | 2.24% | 2.32% | 2.29% | 2.28% | 2.59% |
Expenses net of fee waivers, if any | 2.24% | 2.25% | 2.25% | 2.25% | 2.25% |
Expenses net of all reductions | 2.20% | 2.16% | 2.16% | 2.17% | 2.14% |
Net investment income (loss) | .06% | .19% | (.02)% | .11% | .33% |
Supplemental Data | | | | | |
Net assets, end of period (000 omitted) | $ 29,611 | $ 25,750 | $ 17,040 | $ 40,775 | $ 18,985 |
Portfolio turnover rate E | 138% | 91% | 92% G | 66% | 77% |
A Total returns would have been lower had certain expenses not been reduced during the periods shown.
B Total returns do not include the effect of the contingent deferred sales charge.
C Calculated based on average shares outstanding during the period.
D Fees and expenses of the underlying Fidelity Central Funds are not included in the Fund's expense ratio. The Fund indirectly bears its proportionate share of the expenses of any underlying Fidelity Central Funds.
E Amount does not include the portfolio activity of any underlying Fidelity Central Funds.
F Expense ratios reflect operating expenses of the class. Expenses before reductions do not reflect amounts reimbursed by the investment adviser or reductions from brokerage service arrangements or reductions from other expense offset arrangements and do not represent the amount paid by the class during periods when reimbursements or reductions occur. Expenses net of fee waivers reflect expenses after reimbursement by the investment adviser but prior to reductions from brokerage service arrangements or other expense offset arrangements. Expenses net of all reductions represent the net expenses paid by the class.
G The portfolio turnover rate does not include the assets acquired in the merger.
See accompanying notes which are an integral part of the financial statements.
Annual Report
Financial Highlights - Class C
Years ended October 31, | 2010 | 2009 | 2008 | 2007 | 2006 |
Selected Per-Share Data | | | | | |
Net asset value, beginning of period | $ 24.19 | $ 14.76 | $ 35.48 | $ 21.39 | $ 16.94 |
Income from Investment Operations | | | | | |
Net investment income (loss) C | .03 | .04 | - H | .04 | .06 |
Net realized and unrealized gain (loss) | 6.59 | 9.41 | (17.63) | 15.76 | 5.84 |
Total from investment operations | 6.62 | 9.45 | (17.63) | 15.80 | 5.90 |
Distributions from net investment income | (.02) | (.03) | (.04) | (.05) | (.07) |
Distributions from net realized gain | (.22) | - | (3.06) | (1.68) | (1.39) |
Total distributions | (.24) | (.03) | (3.10) | (1.73) | (1.46) |
Redemption fees added to paid in capital C | .01 | .01 | .01 | .02 | .01 |
Net asset value, end of period | $ 30.58 | $ 24.19 | $ 14.76 | $ 35.48 | $ 21.39 |
Total Return A, B | 27.58% | 64.21% | (54.02)% | 79.05% | 37.02% |
Ratios to Average Net Assets D, F | | | | | |
Expenses before reductions | 2.17% | 2.28% | 2.25% | 2.21% | 2.46% |
Expenses net of fee waivers, if any | 2.17% | 2.25% | 2.25% | 2.21% | 2.25% |
Expenses net of all reductions | 2.13% | 2.16% | 2.16% | 2.13% | 2.14% |
Net investment income (loss) | .12% | .19% | (.02)% | .14% | .33% |
Supplemental Data | | | | | |
Net assets, end of period (000 omitted) | $ 87,089 | $ 59,491 | $ 30,577 | $ 82,070 | $ 33,047 |
Portfolio turnover rate E | 138% | 91% | 92% G | 66% | 77% |
A Total returns would have been lower had certain expenses not been reduced during the periods shown.
B Total returns do not include the effect of the contingent deferred sales charge.
C Calculated based on average shares outstanding during the period.
D Fees and expenses of the underlying Fidelity Central Funds are not included in the Fund's expense ratio. The Fund indirectly bears its proportionate share of the expenses of any underlying Fidelity Central Funds.
E Amount does not include the portfolio activity of any underlying Fidelity Central Funds.
F Expense ratios reflect operating expenses of the class. Expenses before reductions do not reflect amounts reimbursed by the investment adviser or reductions from brokerage service arrangements or reductions from other expense offset arrangements and do not represent the amount paid by the class during periods when reimbursements or reductions occur. Expenses net of fee waivers reflect expenses after reimbursement by the investment adviser but prior to reductions from brokerage service arrangements or other expense offset arrangements. Expenses net of all reductions represent the net expenses paid by the class.
G The portfolio turnover rate does not include the assets acquired in the merger.
H Amount represents less than $.01 per share.
See accompanying notes which are an integral part of the financial statements.
Annual Report
Financial Highlights - Institutional Class
Years ended October 31, | 2010 | 2009 | 2008 | 2007 | 2006 |
Selected Per-Share Data | | | | | |
Net asset value, beginning of period | $ 26.58 | $ 16.07 | $ 38.25 | $ 22.84 | $ 17.97 |
Income from Investment Operations | | | | | |
Net investment income (loss) B | .34 | .26 | .27 | .34 | .27 |
Net realized and unrealized gain (loss) | 7.26 | 10.29 | (19.09) | 16.92 | 6.19 |
Total from investment operations | 7.60 | 10.55 | (18.82) | 17.26 | 6.46 |
Distributions from net investment income | (.17) | (.05) | (.31) | (.19) | (.21) |
Distributions from net realized gain | (.22) | - | (3.06) | (1.68) | (1.39) |
Total distributions | (.39) | (.05) | (3.37) | (1.87) | (1.60) |
Redemption fees added to paid in capital B | .01 | .01 | .01 | .02 | .01 |
Net asset value, end of period | $ 33.80 | $ 26.58 | $ 16.07 | $ 38.25 | $ 22.84 |
Total Return A | 28.87% | 65.94% | (53.53)% | 80.97% | 38.28% |
Ratios to Average Net Assets C, E | | | | | |
Expenses before reductions | 1.14% | 1.25% | 1.20% | 1.16% | 1.41% |
Expenses net of fee waivers, if any | 1.14% | 1.25% | 1.20% | 1.16% | 1.25% |
Expenses net of all reductions | 1.10% | 1.16% | 1.11% | 1.08% | 1.14% |
Net investment income (loss) | 1.16% | 1.18% | 1.03% | 1.20% | 1.33% |
Supplemental Data | | | | | |
Net assets, end of period (000 omitted) | $ 45,042 | $ 23,888 | $ 5,933 | $ 16,300 | $ 5,086 |
Portfolio turnover rate D | 138% | 91% | 92% F | 66% | 77% |
A Total returns would have been lower had certain expenses not been reduced during the periods shown.
B Calculated based on average shares outstanding during the period.
C Fees and expenses of the underlying Fidelity Central Funds are not included in the Fund's expense ratio. The Fund indirectly bears its proportionate share of the expenses of any underlying Fidelity Central Funds.
D Amount does not include the portfolio activity of any underlying Fidelity Central Funds.
E Expense ratios reflect operating expenses of the class. Expenses before reductions do not reflect amounts reimbursed by the investment adviser or reductions from brokerage service arrangements or reductions from other expense offset arrangements and do not represent the amount paid by the class during periods when reimbursements or reductions occur. Expenses net of fee waivers reflect expenses after reimbursement by the investment adviser but prior to reductions from brokerage service arrangements or other expense offset arrangements. Expenses net of all reductions represent the net expenses paid by the class.
F The portfolio turnover rate does not include the assets acquired in the merger.
See accompanying notes which are an integral part of the financial statements.
Annual Report
Notes to Financial Statements
For the period ended October 31, 2010
1. Organization.
Fidelity Advisor Emerging Asia Fund (the Fund) is a fund of Fidelity Advisor Series VIII (the Trust) and is authorized to issue an unlimited number of shares. The Trust is registered under the Investment Company Act of 1940, as amended (the 1940 Act), as an open-end management investment company organized as a Massachusetts business trust. The Fund offers Class A, Class T, Class C, and Institutional Class shares, each of which has equal rights as to assets and voting privileges. Effective after the close of business on September 1, 2010, Class B shares were closed to new accounts and additional purchases by existing shareholders. Each class has exclusive voting rights with respect to matters that affect that class. Class B shares will automatically convert to Class A shares after a holding period of seven years from the initial date of purchase. Investment income, realized and unrealized capital gains and losses, the common expenses of the Fund, and certain fund-level expense reductions, if any, are allocated on a pro-rata basis to each class based on the relative net assets of each class to the total net assets of the Fund. Each class differs with respect to transfer agent and distribution and service plan fees incurred. Certain expense reductions also differ by class. The Fund's investments in emerging markets can be subject to social, economic, regulatory, and political uncertainties and can be extremely volatile.
2. Investments in Fidelity Central Funds.
The Fund may invest in Fidelity Central Funds, which are open-end investment companies available only to other investment companies and accounts managed by Fidelity Management & Research Company (FMR) and its affiliates. The Fund's Schedule of Investments lists each of the Fidelity Central Funds held as of period end, if any, as an investment of the Fund, but does not include the underlying holdings of each Fidelity Central Fund. As an Investing Fund, the Fund indirectly bears its proportionate share of the expenses of the underlying Fidelity Central Funds.
The Money Market Central Funds seek preservation of capital and current income and are managed by Fidelity Investments Money Management, Inc. (FIMM), an affiliate of FMR.
A complete unaudited list of holdings for each Fidelity Central Fund is available upon request or at the Securities and Exchange Commission (the SEC) web site at www.sec.gov. In addition, the financial statements of the Fidelity Central Funds, which are not covered by the Fund's Report of Independent Registered Public Accounting Firm, are available on the SEC web site or upon request.
3. Significant Accounting Policies.
The financial statements have been prepared in conformity with accounting principles generally accepted in the United States of America (GAAP), which require management
Annual Report
Notes to Financial Statements - continued
3. Significant Accounting Policies - continued
to make certain estimates and assumptions at the date of the financial statements. Actual results could differ from those estimates. The following summarizes the significant accounting policies of the Fund:
Security Valuation. Investments are valued as of 4:00 p.m. Eastern time on the last calendar day of the period. The Fund uses independent pricing services approved by the Board of Trustees to value its investments. When current market prices or quotations are not readily available or reliable, valuations may be determined in good faith in accordance with procedures adopted by the Board of Trustees. Factors used in determining value may include market or security specific events. The frequency with which these procedures are used cannot be predicted and they may be utilized to a significant extent. The value used for net asset value (NAV) calculation under these procedures may differ from published prices for the same securities.
The Fund categorizes the inputs to valuation techniques used to value its investments into a disclosure hierarchy consisting of three levels as shown below.
Level 1 - quoted prices in active markets for identical investments
Level 2 - other significant observable inputs (including quoted prices for similar investments, interest rates, prepayment speeds, etc.)
Level 3 - unobservable inputs (including the fund's own assumptions based on the best information available)
Changes in valuation techniques may result in transfers in or out of an assigned level within the disclosure hierarchy. The aggregate value of investments by input level, as of October 31, 2010, as well as a roll forward of Level 3 securities, is included at the end of the Fund's Schedule of Investments. Valuation techniques used to value the Fund's investments by major category are as follows.
Equity securities, including restricted securities, for which market quotations are readily available, are valued at the last reported sale price or official closing price as reported by an independent pricing service on the primary market or exchange on which they are traded and are categorized as Level 1 in the hierarchy. In the event there were no sales during the day or closing prices are not available, securities are valued at the last quoted bid price or may be valued using the last available price and are generally categorized as Level 2 in the hierarchy. For foreign equity securities, when significant market or security specific events arise, comparisons to the valuation of American Depositary Receipts (ADRs), futures contracts, Exchange-traded funds (ETFs) and certain indexes as well as quoted prices for similar securities are used and are categorized as Level 2 in the hierarchy in these circumstances. Utilizing these techniques may result in significant transfers between Level 1 and Level 2. For restricted equity securities and private placements
Annual Report
3. Significant Accounting Policies - continued
Security Valuation - continued
where observable inputs are limited, assumptions about market activity and risk are used and are categorized as Level 3 in the hierarchy.
Investments in open-end mutual funds, including the Fidelity Central Funds, are valued at their closing net asset value each business day and are categorized as Level 1 in the hierarchy. Short-term securities with remaining maturities of sixty days or less for which quotations are not readily available are valued at amortized cost, which approximates fair value and are categorized as Level 2 in the hierarchy.
Foreign Currency. The Fund uses foreign currency contracts to facilitate transactions in foreign-denominated securities. Gains and losses from these transactions may arise from changes in the value of the foreign currency or if the counterparties do not perform under the contracts' terms.
Foreign-denominated assets, including investment securities, and liabilities are translated into U.S. dollars at the exchange rate at period end. Purchases and sales of investment securities, income and dividends received and expenses denominated in foreign currencies are translated into U.S. dollars at the exchange rate in effect on the transaction date.
The effects of exchange rate fluctuations on investments are included with the net realized and unrealized gain (loss) on investment securities. Other foreign currency transactions resulting in realized and unrealized gain (loss) are disclosed separately.
Investment Transactions and Income. For financial reporting purposes, the Fund's investment holdings and NAV include trades executed through the end of the last business day of the period. The NAV per share for processing shareholder transactions is calculated as of the close of business of the New York Stock Exchange (NYSE), normally 4:00 p.m. Eastern time and includes trades executed through the end of the prior business day. Gains and losses on securities sold are determined on the basis of identified cost. Dividend income is recorded on the ex-dividend date, except for certain dividends from foreign securities where the ex-dividend date may have passed, which are recorded as soon as the Fund is informed of the ex-dividend date. Non-cash dividends included in dividend income, if any, are recorded at the fair market value of the securities received. Distributions received on securities that represent a return of capital or capital gain are recorded as a reduction of cost of investments and/or as a realized gain. The Fund estimates the components of distributions received that may be considered return of capital distributions or capital gain distributions. Interest income and distributions from the Fidelity Central Funds are accrued as earned. Interest income includes coupon interest and amortization of premium and accretion of discount on debt securities.
Annual Report
Notes to Financial Statements - continued
3. Significant Accounting Policies - continued
Investment Transactions and Income - continued
Investment income is recorded net of foreign taxes withheld where recovery of such taxes is uncertain.
Expenses. Most expenses of the Trust can be directly attributed to a fund. Expenses which cannot be directly attributed are apportioned amongst each fund in the Trust. Expense estimates are accrued in the period to which they relate and adjustments are made when actual amounts are known.
Income Tax Information and Distributions to Shareholders. Each year the Fund intends to qualify as a regulated investment company, including distributing substantially all of its taxable income and realized gains under Subchapter M of the Internal Revenue Code and filing its U.S. federal tax return. As a result, no provision for income taxes is required. As of October 31, 2010, the Fund did not have any unrecognized tax benefits in the accompanying financial statements. A fund's federal tax return is subject to examination by the Internal Revenue Service (IRS) for a period of three years. Foreign taxes are provided for based on the Fund's understanding of the tax rules and rates that exist in the foreign markets in which it invests. The Fund received a final ruling from the Authority for Advance Ruling in India regarding the applicability of taxes imposed by the country on realized capital gains under the US/India tax treaty. The ruling entitled the Fund to a refund of capital gains taxes paid in prior years and exempts the Fund from taxes on future realized gains. The India Central Board of Direct Taxation may challenge the ruling at any time which could result in the reversal of some or all of the benefits recorded by the Fund.
Distributions are declared and recorded on the ex-dividend date. Income dividends and capital gain distributions are declared separately for each class. Income and capital gain distributions are determined in accordance with income tax regulations, which may differ from GAAP. In addition, the Fund claimed a portion of the payment made to redeeming shareholders as a distribution for income tax purposes.
Capital accounts within the financial statements are adjusted for permanent book-tax differences. These adjustments have no impact on net assets or the results of operations. Temporary book-tax differences will reverse in a subsequent period.
Book-tax differences are primarily due to the short-term gain distributions from the Fidelity Central Funds, foreign currency transactions, passive foreign investment companies (PFIC), capital loss carryforwards and losses deferred due to wash sales.
Annual Report
3. Significant Accounting Policies - continued
Income Tax Information and Distributions to Shareholders - continued
The federal tax cost of investment securities and unrealized appreciation (depreciation) as of period end were as follows:
Gross unrealized appreciation | $ 82,381,299 |
Gross unrealized depreciation | (4,100,234) |
Net unrealized appreciation (depreciation) | $ 78,281,065 |
| |
Tax Cost | $ 332,788,317 |
The tax-based components of distributable earnings as of period end were as follows:
Undistributed ordinary income | $ 3,510,734 |
Undistributed long-term capital gain | $ 22,131,489 |
Net unrealized appreciation (depreciation) | $ 78,293,891 |
The tax character of distributions paid was as follows:
| October 31, 2010 | October 31, 2009 |
Ordinary Income | $ 3,503,974 | $ 378,765 |
Short-Term Trading (Redemption) Fees. Shares held by investors in the Fund less than 90 days are subject to a redemption fee equal to 1.50% of the net asset value of shares redeemed. All redemption fees, which reduce the proceeds of the shareholder redemption, are retained by the Fund and accounted for as an addition to paid in capital.
4. Purchases and Sales of Investments.
Purchases and sales of securities, other than short-term securities, aggregated $497,568,164 and $452,618,938, respectively.
5. Fees and Other Transactions with Affiliates.
Management Fee. FMR and its affiliates provide the Fund with investment management related services for which the Fund pays a monthly management fee. The management fee is the sum of an individual fund fee rate that is based on an annual rate of .45% of the Fund's average net assets and a group fee rate that averaged .26% during the period. The group fee rate is based upon the average net assets of all the mutual funds advised by FMR. The group fee rate decreases as assets under management increase and increases as assets under management decrease. For the period, the total annual management fee rate was .71% of the Fund's average net assets.
Annual Report
Notes to Financial Statements - continued
5. Fees and Other Transactions with Affiliates - continued
Distribution and Service Plan Fees. In accordance with Rule 12b-1 of the 1940 Act, the Fund has adopted separate Distribution and Service Plans for each class of shares. Certain classes pay Fidelity Distributors Corporation (FDC), an affiliate of FMR, separate Distribution and Service Fees, each of which is based on an annual percentage of each class' average net assets. In addition, FDC may pay financial intermediaries for selling shares of the Fund and providing shareholder support services. For the period, the Distribution and Service Fee rates, total fees and amounts retained by FDC were as follows:
| Distribution
Fee | Service
Fee | Total
Fees | Retained
by FDC |
Class A | -% | .25% | $ 387,193 | $ 13,813 |
Class T | .25% | .25% | 260,010 | 380 |
Class B | .75% | .25% | 270,241 | 202,921 |
Class C | .75% | .25% | 697,920 | 180,451 |
| | | $ 1,615,364 | $ 397,565 |
Sales Load. FDC receives a front-end sales charge of up to 5.75% for selling Class A shares, and 3.50% for selling Class T shares, some of which is paid to financial intermediaries for selling shares of the Fund. FDC receives the proceeds of contingent deferred sales charges levied on Class A, Class T, Class B, and Class C redemptions. These charges depend on the holding period. The deferred sales charges range from 5% to 1% for Class B, 1% for Class C, 1.00% for certain purchases of Class A shares (1.00% to .50% prior to July 12, 2010) and .25% for certain purchases of Class T shares.
For the period, sales charge amounts retained by FDC were as follows:
| Retained
by FDC |
Class A | $ 102,146 |
Class T | 18,095 |
Class B * | 61,217 |
Class C* | 18,167 |
| $ 199,625 |
* When Class B and Class C shares are initially sold, FDC pays commissions from its own resources to financial intermediaries through which the sales are made.
Transfer Agent Fees. Fidelity Investments Institutional Operations Company, Inc. (FIIOC), an affiliate of FMR, is the transfer, dividend disbursing and shareholder servicing agent for each class of the Fund. FIIOC receives account fees and asset-based fees that vary according to the account size and type of account of the shareholders of the respective classes of the Fund. FIIOC pays for typesetting, printing and mailing of shareholder reports, except proxy statements.
Annual Report
5. Fees and Other Transactions with Affiliates - continued
Transfer Agent Fees - continued
For the period, transfer agent fees for each class were as follows:
| Amount | % of
Average
Net Assets |
Class A | $ 404,308 | .26 |
Class T | 164,938 | .32 |
Class B | 84,247 | .31 |
Class C | 173,270 | .25 |
Institutional Class | 73,825 | .21 |
| $ 900,588 | |
Accounting and Security Lending Fees. Fidelity Service Company, Inc. (FSC), an affiliate of FMR, maintains the Fund's accounting records. The accounting fee is based on the level of average net assets for the month. Under a separate contract, FSC administers the security lending program. The security lending fee is based on the number and duration of lending transactions.
Brokerage Commissions. The Fund placed a portion of its portfolio transactions with brokerage firms which are affiliates of the investment adviser. The commissions paid to these affiliated firms were $72 for the period.
Interfund Lending Program. Pursuant to an Exemptive Order issued by the SEC, the Fund, along with other registered investment companies having management contracts with FMR, may participate in an interfund lending program. This program provides an alternative credit facility allowing the funds to borrow from, or lend money to, other participating affiliated funds. At period end, there were no interfund loans outstanding. The Fund's activity in this program during the period for which loans were outstanding was as follows:
Borrower or Lender | Average Daily Loan Balance | Weighted Average Interest Rate | Interest
Expense |
Borrower | $ 8,908,818 | .43% | $ 1,167 |
6. Committed Line of Credit.
The Fund participates with other funds managed by FMR or an affiliate in a $3.75 billion credit facility (the "line of credit") to be utilized for temporary or emergency purposes to fund shareholder redemptions or for other short-term liquidity purposes. The Fund has agreed to pay commitment fees on its pro-rata portion of the line of credit, which amounted to $1,292 and is reflected in Miscellaneous expenses on the Statement of Operations. During the period, there were no borrowings on this line of credit.
Annual Report
Notes to Financial Statements - continued
7. Security Lending.
The Fund lends portfolio securities through a lending agent from time to time in order to earn additional income. The lending agent may loan securities to certain qualified borrowers, including Fidelity Capital Markets (FCM), a broker-dealer affiliated with the Fund. On the settlement date of the loan, the Fund receives collateral (in the form of U.S. Treasury obligations, letters of credit and/or cash) against the loaned securities and maintains collateral in an amount not less than 100% of the market value of the loaned securities during the period of the loan. The market value of the loaned securities is determined at the close of business of the Fund and any additional required collateral is delivered to the Fund on the next business day. If the borrower defaults on its obligation to return the securities loaned because of insolvency or other reasons, a fund could experience delays and costs in recovering the securities loaned or in gaining access to the collateral. Any cash collateral received is invested in the Fidelity Securities Lending Cash Central Fund. The value of loaned securities and cash collateral at period end are disclosed on the Fund's Statement of Assets and Liabilities. Security lending income represents the income earned on investing cash collateral, less rebates paid to borrowers and lending agent fees associated with the loan, plus any premium payments received for lending certain types of securities. Security lending income is presented in the Statement of Operations as a component of income from Fidelity Central Funds. Total security lending income during the period amounted to $44,746. During the period, there were no securities loaned to FCM.
8. Expense Reductions.
Many of the brokers with whom FMR places trades on behalf of the Fund provided services to the Fund in addition to trade execution. These services included payments of certain expenses on behalf of the Fund totaling $137,629 for the period. In addition, through arrangements with the Fund's custodian, credits realized as a result of uninvested cash balances were used to reduce the Fund's expenses. During the period, these credits reduced the Fund's custody expenses by $59.
9. Distributions to Shareholders.
Distributions to shareholders of each class were as follows:
Years ended October 31, | 2010 | 2009 |
From net investment income | | |
Class A | $ 615,994 | $ 205,871 |
Class T | 138,177 | 65,048 |
Class B | - | 32,430 |
Class C | 55,860 | 56,716 |
Institutional Class | 161,513 | 18,700 |
Total | $ 971,544 | $ 378,765 |
Annual Report
9. Distributions to Shareholders - continued
Years ended October 31, | 2010 | 2009 |
From net realized gain | | |
Class A | $ 1,138,813 | $ - |
Class T | 399,983 | - |
Class B | 223,532 | - |
Class C | 558,596 | - |
Institutional Class | 211,506 | - |
Total | $ 2,532,430 | $ - |
10. Share Transactions.
Transactions for each class of shares were as follows:
| Shares | Dollars |
Years ended October 31, | 2010 | 2009 | 2010 | 2009 |
Class A | | | | |
Shares sold | 2,066,420 | 1,822,219 | $ 59,859,672 | $ 40,851,858 |
Reinvestment of distributions | 54,021 | 11,447 | 1,525,557 | 172,610 |
Shares redeemed | (1,447,315) | (1,322,917) | (40,817,600) | (25,301,756) |
Net increase (decrease) | 673,126 | 510,749 | $ 20,567,629 | $ 15,722,712 |
Class T | | | | |
Shares sold | 516,790 | 578,954 | $ 14,594,570 | $ 11,921,295 |
Reinvestment of distributions | 18,968 | 4,255 | 524,658 | 63,009 |
Shares redeemed | (403,834) | (434,633) | (11,178,425) | (8,198,583) |
Net increase (decrease) | 131,924 | 148,576 | $ 3,940,803 | $ 3,785,721 |
Class B | | | | |
Shares sold | 202,362 | 214,878 | $ 5,365,940 | $ 4,421,597 |
Reinvestment of distributions | 6,691 | 1,834 | 177,369 | 26,200 |
Shares redeemed | (305,292) | (306,312) | (8,111,865) | (5,387,171) |
Net increase (decrease) | (96,239) | (89,600) | $ (2,568,556) | $ (939,374) |
Class C | | | | |
Shares sold | 996,034 | 985,972 | $ 27,112,281 | $ 20,555,792 |
Reinvestment of distributions | 18,926 | 3,108 | 499,282 | 44,229 |
Shares redeemed | (626,174) | (601,665) | (16,404,984) | (10,608,252) |
Net increase (decrease) | 388,786 | 387,415 | $ 11,206,579 | $ 9,991,769 |
Annual Report
Notes to Financial Statements - continued
10. Share Transactions - continued
| Shares | Dollars |
Years ended October 31, | 2010 | 2009 | 2010 | 2009 |
Institutional Class | | | | |
Shares sold | 836,632 | 726,101 | $ 24,478,070 | $ 16,617,065 |
Reinvestment of distributions | 9,083 | 550 | 262,322 | 8,469 |
Shares redeemed | (411,905) | (196,957) | (11,804,448) | (3,858,918) |
Net increase (decrease) | 433,810 | 529,694 | $ 12,935,944 | $ 12,766,616 |
11. Other.
The Fund's organizational documents provide former and current trustees and officers with a limited indemnification against liabilities arising in connection with the performance of their duties to the Fund. In the normal course of business, the Fund may also enter into contracts that provide general indemnifications. The Fund's maximum exposure under these arrangements is unknown as this would be dependent on future claims that may be made against the Fund. The risk of material loss from such claims is considered remote.
Annual Report
To the Trustees of Fidelity Advisor Series VIII and the Shareholders of Fidelity Advisor Emerging Asia Fund:
In our opinion, the accompanying statement of assets and liabilities, including the schedule of investments, and the related statements of operations and of changes in net assets and the financial highlights present fairly, in all material respects, the financial position of Fidelity Advisor Emerging Asia Fund (a fund of Fidelity Advisor Series VIII) at October 31, 2010, the results of its operations for the year then ended, the changes in its net assets for each of the two years in the period then ended and the financial highlights for each of the five years in the period then ended, in conformity with accounting principles generally accepted in the United States of America. These financial statements and financial highlights (hereafter referred to as "financial statements") are the responsibility of the Fidelity Advisor Emerging Asia Fund's management. Our responsibility is to express an opinion on these financial statements based on our audits. We conducted our audits of these financial statements in accordance with the standards of the Public Company Accounting Oversight Board (United States). Those standards require that we plan and perform the audit to obtain reasonable assurance about whether the financial statements are free of material misstatement. An audit includes examining, on a test basis, evidence supporting the amounts and disclosures in the financial statements, assessing the accounting principles used and significant estimates made by management, and evaluating the overall financial statement presentation. We believe that our audits, which included confirmation of securities at October 31, 2010 by correspondence with the custodian and brokers, provide a reasonable basis for our opinion.
/s/ PricewaterhouseCoopers LLP
PricewaterhouseCoopers LLP
Boston, Massachusetts
December 10, 2010
Annual Report
The Trustees, Member of the Advisory Board, and executive officers of the trust and fund, as applicable, are listed below. The Board of Trustees governs the fund and is responsible for protecting the interests of shareholders. The Trustees are experienced executives who meet periodically throughout the year to oversee the fund's activities, review contractual arrangements with companies that provide services to the fund, oversee management of the risks associated with such activities and contractual arrangements, and review the fund's performance. Except for James C. Curvey, each of the Trustees oversees 221 funds advised by FMR or an affiliate. Mr. Curvey oversees 410 funds advised by FMR or an affiliate.
The Trustees hold office without limit in time except that (a) any Trustee may resign; (b) any Trustee may be removed by written instrument, signed by at least two-thirds of the number of Trustees prior to such removal; (c) any Trustee who requests to be retired or who has become incapacitated by illness or injury may be retired by written instrument signed by a majority of the other Trustees; and (d) any Trustee may be removed at any special meeting of shareholders by a two-thirds vote of the outstanding voting securities of the trust. Each Trustee who is not an interested person (as defined in the 1940 Act) (Independent Trustee), shall retire not later than the last day of the calendar year in which his or her 72nd birthday occurs. The Independent Trustees may waive this mandatory retirement age policy with respect to individual Trustees. The executive officers and Advisory Board Member hold office without limit in time, except that any officer and Advisory Board Member may resign or may be removed by a vote of a majority of the Trustees at any regular meeting or any special meeting of the Trustees. Except as indicated, each individual has held the office shown or other offices in the same company for the past five years.
Experience, Skills, Attributes, and Qualifications of the Fund's Trustees. The Governance and Nominating Committee has adopted a statement of policy that describes the experience, qualifications, attributes, and skills that are necessary and desirable for potential Independent Trustee candidates (Statement of Policy). The Board believes that each Trustee satisfied at the time he or she was initially elected or appointed a Trustee, and continues to satisfy, the standards contemplated by the Statement of Policy. The Governance and Nominating Committee also engages professional search firms to help identify potential Independent Trustee candidates who have the experience, qualifications, attributes, and skills consistent with the Statement of Policy. From time to time, additional criteria based on the composition and skills of the current Independent Trustees, as well as experience or skills that may be appropriate in light of future changes to board composition, business conditions, and regulatory or other developments, have also been considered by the professional search firms and the Governance and Nominating Committee. In addition, the Board takes into account the Trustees' commitment and participation in Board and committee meetings, as well as their leadership of standing and ad hoc committees throughout their tenure.
In determining that a particular Trustee was and continues to be qualified to serve as a Trustee, the Board has considered a variety of criteria, none of which, in isolation, was controlling. The Board believes that, collectively, the Trustees have balanced and diverse experience, qualifications, attributes, and skills, which allow the Board to operate effectively in governing the fund and protecting the interests of shareholders. Information about the specific experience, skills, attributes, and qualifications of each Trustee, which in each case led to the Board's conclusion that the Trustee should serve (or continue to serve) as a trustee of the fund, is provided below.
Annual Report
Board Structure and Oversight Function. Edward C. Johnson 3d is an interested person (as defined in the 1940 Act) and currently serves as Chairman. The Trustees have determined that an interested Chairman is appropriate and benefits shareholders because an interested Chairman has a personal and professional stake in the quality and continuity of services provided to the fund. Independent Trustees exercise their informed business judgment to appoint an individual of their choosing to serve as Chairman, regardless of whether the Trustee happens to be independent or a member of management. The Independent Trustees have determined that they can act independently and effectively without having an Independent Trustee serve as Chairman and that a key structural component for assuring that they are in a position to do so is for the Independent Trustees to constitute a substantial majority for the Board. The Independent Trustees also regularly meet in executive session. Ned C. Lautenbach serves as Chairman of the Independent Trustees and as such (i) acts as a liaison between the Independent Trustees and management with respect to matters important to the Independent Trustees and (ii) with management prepares agendas for Board meetings.
Fidelity funds are overseen by different Boards of Trustees. The fund's Board oversees Fidelity's equity and high income funds and another Board oversees Fidelity's investment-grade bond, money market, and asset allocation funds. The asset allocation funds may invest in Fidelity funds overseen by the fund's Board. The use of separate Boards, each with its own committee structure, allows the Trustees of each group of Fidelity funds to focus on the unique issues of the funds they oversee, including common research, investment, and operational issues. On occasion, the separate Boards establish joint committees to address issues of overlapping consequences for the Fidelity funds overseen by each Board.
The Trustees operate using a system of committees to facilitate the timely and efficient consideration of all matters of importance to the Trustees, the fund, and fund shareholders and to facilitate compliance with legal and regulatory requirements and oversight of the fund's activities and associated risks. The Board, acting through its committees, has charged FMR and its affiliates with (i) identifying events or circumstances the occurrence of which could have demonstrably adverse effects on the fund's business and/or reputation; (ii) implementing processes and controls to lessen the possibility that such events or circumstances occur or to mitigate the effects of such events or circumstances if they do occur; and (iii) creating and maintaining a system designed to evaluate continuously business and market conditions in order to facilitate the identification and implementation processes described in (i) and (ii) above. Because the day-to-day operations and activities of the fund are carried out by or through FMR, its affiliates and other service providers, the fund's exposure to risks is mitigated but not eliminated by the processes overseen by the Trustees. While each of the Board's committees has responsibility for overseeing different aspects of the fund's activities, oversight is exercised primarily through the Operations, Audit, and Compliance Committees. Appropriate personnel, including but not limited to the fund's Chief Compliance Officer (CCO), FMR's internal auditor, the independent accountants, the fund's Treasurer and portfolio management personnel, make periodic reports to the Board's committees, as appropriate. The responsibilities of each committee, including their oversight responsibilities, are described further under "Standing Committees of the Fund's Trustees."
Annual Report
Trustees and Officers - continued
The fund's Statement of Additional Information (SAI) includes more information about the Trustees. To request a free copy, call Fidelity at 1-877-208-0098.
Interested Trustees*:
Correspondence intended for each Trustee who is an interested person may be sent to Fidelity Investments, 82 Devonshire Street, Boston, Massachusetts 02109.
Name, Age; Principal Occupations and Other Relevant Experience+ |
Edward C. Johnson 3d (80) |
| Year of Election or Appointment: 1983 Mr. Johnson is Trustee and Chairman of the Board of Trustees of certain Trusts. Mr. Johnson serves as Chief Executive Officer, Chairman, and a Director of FMR LLC; Chairman and a Director of FMR; Chairman and a Director of Fidelity Research & Analysis Company (FRAC); Chairman and a Director of Fidelity Investments Money Management, Inc.; and Chairman and a Director of FMR Co., Inc. In addition, Mr. Johnson serves as Chairman and Director of FIL Limited. Previously, Mr. Johnson served as President of FMR LLC (2006-2007). |
James C. Curvey (75) |
| Year of Election or Appointment: 2007 Mr. Curvey also serves as Trustee (2007-present) of other investment companies advised by FMR. Mr. Curvey is a Director of Fidelity Investments Money Management, Inc. (2009-present), Director of Fidelity Research & Analysis Co. (2009-present) and Director of FMR and FMR Co., Inc. (2007-present). Mr. Curvey is also Vice Chairman (2007-present) and Director of FMR LLC. In addition, Mr. Curvey serves as an Overseer for the Boston Symphony Orchestra and a member of the Trustees of Villanova University. Previously, Mr. Curvey was the Vice Chairman (2006-2007) and Director (2000-2007) of FMR Corp. |
* Trustees have been determined to be "Interested Trustees" by virtue of, among other things, their affiliation with the trust or various entities under common control with FMR.
Annual Report
+ The information above includes each Trustee's principal occupation during the last five years and other information relating to the experience, attributes, and skills relevant to each Trustee's qualifications to serve as a Trustee, which led to the conclusion that each Trustee should serve as a Trustee for the fund.
Independent Trustees:
Correspondence intended for each Independent Trustee (that is, the Trustees other than the Interested Trustees) may be sent to Fidelity Investments, P.O. Box 55235, Boston, Massachusetts 02205-5235.
Name, Age; Principal Occupations and Other Relevant Experience+ |
Dennis J. Dirks (62) |
| Year of Election or Appointment: 2005 Prior to his retirement in May 2003, Mr. Dirks was Chief Operating Officer and a member of the Board of The Depository Trust & Clearing Corporation (DTCC). He also served as President, Chief Operating Officer, and Board member of The Depository Trust Company (DTC) and President and Board member of the National Securities Clearing Corporation (NSCC). In addition, Mr. Dirks served as Chief Executive Officer and Board member of the Government Securities Clearing Corporation, Chief Executive Officer and Board member of the Mortgage-Backed Securities Clearing Corporation, as a Trustee and a member of the Finance Committee of Manhattan College (2005-2008), and as a Trustee and a member of the Finance Committee of AHRC of Nassau County (2006-2008). Mr. Dirks is a member of the Independent Directors Council (IDC) Governing Council (2010-Present) and Board of Directors for The Brookville Center for Children's Services, Inc. (2009-present). |
Alan J. Lacy (57) |
| Year of Election or Appointment: 2008 Mr. Lacy serves as Senior Adviser (2007-present) of Oak Hill Capital Partners, L.P. (private equity). Mr. Lacy also served as Chief Executive Officer (2000-2005) and Vice Chairman (2005-2006) of Sears Holdings Corporation and Sears, Roebuck and Co. (retail). In addition, Mr. Lacy serves as a member of the Board of Directors of The Western Union Company (global money transfer, 2006-present) and Bristol-Myers Squibb Company (global pharmaceuticals, 2007-present). Mr. Lacy is Chairman (2008-present) and a member (2006-present) of the Board of Trustees of The National Parks Conservation Association. |
Ned C. Lautenbach (66) |
| Year of Election or Appointment: 2000 Mr. Lautenbach is Chairman of the Independent Trustees of the Equity and High Income Funds (2006-present). Mr. Lautenbach currently serves as the Lead Director of the Eaton Corporation Board of Directors (diversified industrial, 1997-present). Mr. Lautenbach is also a member of the Board of Directors of the Philharmonic Center for the Arts in Naples, Florida (1999-present); a member of the Board of Trustees of Fairfield University (2005-present); and a member of the Council on Foreign Relations (1994-present). Previously, Mr. Lautenbach was a Partner/Advisory Partner at Clayton, Dubilier & Rice, Inc. (private equity investment, 1998-2010), as well as a Director of Sony Corporation (2006-2007). |
Joseph Mauriello (66) |
| Year of Election or Appointment: 2008 Prior to his retirement in January 2006, Mr. Mauriello served in numerous senior management positions including Deputy Chairman and Chief Operating Officer (2004-2005), and Vice Chairman of Financial Services (2002-2004) of KPMG LLP US (professional services, 1965-2005). Mr. Mauriello currently serves as a member of the Board of Directors of XL Group plc. (global insurance and re-insurance, 2006-present) and of Arcadia Resources Inc. (health care services and products, 2007-present). Previously, Mr. Mauriello served as a Director of the Hamilton Funds of the Bank of New York (2006-2007). |
Cornelia M. Small (66) |
| Year of Election or Appointment: 2005 Ms. Small is a member of the Board of Directors of the Teagle Foundation (2009-present). Ms. Small is also a member of the Investment Committee, and Chair (2008-present) and a member of the Board of Trustees of Smith College. In addition, Ms. Small serves on the Investment Committee of the Berkshire Taconic Community Foundation (2008-present). Previously, Ms. Small served as Chairperson of the Investment Committee (2002-2008) of Smith College. In addition, Ms. Small served as Chief Investment Officer, Director of Global Equity Investments, and a member of the Board of Directors of Scudder, Stevens & Clark and Scudder Kemper Investments. |
William S. Stavropoulos (71) |
| Year of Election or Appointment: 2001 Mr. Stavropoulos is Vice Chairman of the Independent Trustees of the Equity and High Income Funds (2006-present). Mr. Stavropoulos serves as President and Founder of the Michigan Baseball Foundation, the Great Lakes Loons (2007-present). Mr. Stavropoulos is Chairman Emeritus of the Board of Directors of The Dow Chemical Company, where he previously served in numerous senior management positions, including President, CEO (1995-2000; 2002-2004), Chairman of the Executive Committee (2000-2006), and as a member of the Board of Directors (1990-2006). Currently, Mr. Stavropoulos is Chairman of Univar (global distributor of commodity and specialty chemicals, 2010-present), a Director of Teradata Corporation (data warehousing and technology solutions, 2008-present), Chemical Financial Corporation, Maersk Inc. (industrial conglomerate), Tyco International, Inc. (multinational manufacturing and services, 2007-present), and a member of the Advisory Board for Metalmark Capital (private equity investment, 2005-present). Mr. Stavropoulos is a special advisor to Clayton, Dubilier & Rice, Inc. (private equity investment). In addition, Mr. Stavropoulos is a member of the University of Notre Dame Advisory Council for the College of Science. |
David M. Thomas (61) |
| Year of Election or Appointment: 2008 Previously, Mr. Thomas served as Executive Chairman (2005-2006) and Chairman and Chief Executive Officer (2000-2005) of IMS Health, Inc. (pharmaceutical and healthcare information solutions). In addition, Mr. Thomas serves as a member of the Board of Directors of Fortune Brands, Inc. (consumer products), and Interpublic Group of Companies, Inc. (marketing communication, 2004-present). |
Michael E. Wiley (60) |
| Year of Election or Appointment: 2008 Mr. Wiley also serves as a Director of Asia Pacific Exploration Consolidated (international oil and gas exploration and production, 2008-present). Mr. Wiley serves as a Director of Tesoro Corporation (independent oil refiner and marketer, 2005-present), and a Director of Bill Barrett Corporation (exploration and production, 2005-present). In addition, Mr. Wiley also serves as a Director of Post Oak Bank (privately-held bank, 2004-present). Previously, Mr. Wiley served as a member of the Board of Trustees of the University of Tulsa (2000-2006; 2007-2010), as a Senior Energy Advisor of Katzenbach Partners, LLC (consulting, 2006-2007), as an Advisory Director of Riverstone Holdings (private investment), Chairman, President, and CEO of Baker Hughes, Inc. (oilfield services, 2000-2004), and as Director of Spinnaker Exploration Company (exploration and production, 2001-2005). |
Annual Report
Trustees and Officers - continued
+ The information above includes each Trustee's principal occupation during the last five years and other information relating to the experience, attributes, and skills relevant to each Trustee's qualifications to serve as a Trustee, which led to the conclusion that each Trustee should serve as a Trustee for the fund.
Advisory Board Member and Executive Officers:
Correspondence intended for each executive officer and Peter S. Lynch may be sent to Fidelity Investments, 82 Devonshire Street, Boston, Massachusetts 02109.
Name, Age; Principal Occupation |
Peter S. Lynch (66) |
| Year of Election or Appointment: 2003 Member of the Advisory Board of Fidelity's Equity and High Income Funds. Mr. Lynch is Vice Chairman and a Director of FMR and FMR Co., Inc. In addition, Mr. Lynch serves as a Trustee of Boston College and as the Chairman of the Inner-City Scholarship Fund. Previously, Mr. Lynch served on the Special Olympics International Board of Directors (1997-2006). |
Kenneth B. Robins (41) |
| Year of Election or Appointment: 2008 President and Treasurer of Fidelity's Equity and High Income Funds. Mr. Robins also serves as President and Treasurer (2010-present) and Assistant Treasurer (2009-present) of other Fidelity funds and is an employee of Fidelity Investments (2004-present). Previously, Mr. Robins served as Deputy Treasurer of the Fidelity funds (2005-2008) and Treasurer and Chief Financial Officer of The North Carolina Capital Management Trust: Cash and Term Portfolios (2006-2008). |
Bruce T. Herring (45) |
| Year of Election or Appointment: 2006 Vice President of certain Equity Funds. Mr. Herring also serves as Chief Investment Officer and Director of Fidelity Management & Research (U.K.) Inc. (2010-present) and Group Chief Investments Officer of FMR. Previously, Mr. Herring served as Vice President (2005-2006) and Senior Vice President (2006-2007) of Fidelity Management & Research Company, Vice President of FMR Co., Inc. (2001-2007) and as a portfolio manager for Fidelity U.S. Equity Funds. |
Brian B. Hogan (46) |
| Year of Election or Appointment: 2009 Vice President of certain Equity Funds and Vice President of Sector Funds. Mr. Hogan also serves as President of FMR's Equity Division (2009-present). Previously, Mr. Hogan served as Senior Vice President, Equity Research of FMR (2006-2009) and as a portfolio manager. |
Scott C. Goebel (42) |
| Year of Election or Appointment: 2008 Secretary and Chief Legal Officer (CLO) of the Fidelity funds. Mr. Goebel also serves as Secretary and CLO of The North Carolina Capital Management Trust: Cash and Term Portfolio (2008-present); General Counsel, Secretary, and Senior Vice President of FMR (2008-present) and FMR Co., Inc. (2008-present); Deputy General Counsel of FMR LLC; Chief Legal Officer of Fidelity Management & Research (Hong Kong) Limited (2008-present) and Assistant Secretary of Fidelity Management & Research (Japan) Inc. (2008-present), Fidelity Investments Money Management, Inc. (2008-present), Fidelity Management & Research (U.K.) Inc. (2008-present), and Fidelity Research and Analysis Company (2008-present). Previously, Mr. Goebel served as Assistant Secretary of the Funds (2007-2008) and as Vice President and Secretary of Fidelity Distributors Corporation (FDC) (2005-2007). |
William C. Coffey (41) |
| Year of Election or Appointment: 2009 Assistant Secretary of Fidelity's Equity and High Income Funds. Mr. Coffey also serves as Senior Vice President and Deputy General Counsel of FMR LLC (2010-present), and is an employee of Fidelity Investments. Previously, Mr. Coffey served as Vice President and Associate General Counsel of FMR LLC (2005-2009). |
Holly C. Laurent (56) |
| Year of Election or Appointment: 2008 Anti-Money Laundering (AML) Officer of the Fidelity funds. Ms. Laurent also serves as AML Officer of The North Carolina Capital Management Trust: Cash and Term Portfolio (2008-present) and is an employee of Fidelity Investments. Previously, Ms. Laurent was Senior Vice President and Head of Legal for Fidelity Business Services India Pvt. Ltd. (2006-2008), and Senior Vice President, Deputy General Counsel and Group Head for FMR LLC (2005-2006). |
Christine Reynolds (52) |
| Year of Election or Appointment: 2008 Chief Financial Officer of the Fidelity funds. Ms. Reynolds became President of Fidelity Pricing and Cash Management Services (FPCMS) in August 2008. Ms. Reynolds served as Chief Operating Officer of FPCMS (2007-2008). Previously, Ms. Reynolds served as President, Treasurer, and Anti-Money Laundering officer of the Fidelity funds (2004-2007). |
Kenneth A. Rathgeber (63) |
| Year of Election or Appointment: 2004 Chief Compliance Officer of Fidelity's Equity and High Income Funds. Mr. Rathgeber is Chief Compliance Officer of Fidelity Management & Research (Hong Kong) Limited (2008-present), Fidelity Management & Research (Japan) Inc. (2008-present), FMR (2005-present), FMR Co., Inc. (2005-present), Fidelity Management & Research (U.K.) Inc. (2005-present), Fidelity Research & Analysis Company (2005-present), Fidelity Investments Money Management, Inc. (2005-present), Pyramis Global Advisors, LLC (2005-present), and Strategic Advisers, Inc. (2005-present). |
Jeffrey S. Christian (49) |
| Year of Election or Appointment: 2009 Deputy Treasurer of the Fidelity funds. Mr. Christian is an employee of Fidelity Investments. Previously, Mr. Christian served as Chief Financial Officer (2008-2009) of certain Fidelity funds and Senior Vice President of Fidelity Pricing and Cash Management Services (FPCMS) (2004-2009). |
Bryan A. Mehrmann (49) |
| Year of Election or Appointment: 2005 Deputy Treasurer of the Fidelity funds. Mr. Mehrmann is an employee of Fidelity Investments. |
Adrien E. Deberghes (43) |
| Year of Election or Appointment: 2008 Deputy Treasurer of Fidelity's Equity and High Income Funds. Mr. Deberghes also serves as Assistant Treasurer of other Fidelity funds (2010-present) and is an employee of Fidelity Investments (2008-present). Previously, Mr. Deberghes served as Senior Vice President of Mutual Fund Administration at State Street Corporation (2007-2008), Senior Director of Mutual Fund Administration at Investors Bank & Trust (2005-2007), and Director of Finance for Dunkin' Brands (2000-2005). |
Stephanie J. Dorsey (41) |
| Year of Election or Appointment: 2010 Assistant Treasurer of Fidelity's Equity and High Income Funds. Ms. Dorsey also serves as Deputy Treasurer of other Fidelity funds (2008-present) and is an employee of Fidelity Investments (2008-present). Previously, Ms. Dorsey served as Treasurer (2004-2008) of the JPMorgan Mutual Funds and Vice President (2004-2008) of JPMorgan Chase Bank. |
Name, Age; Principal Occupation |
John R. Hebble (52) |
| Year of Election or Appointment: 2009 Assistant Treasurer of Fidelity's Equity and High Income Funds. Mr. Hebble also serves as Treasurer and Chief Financial Officer of The North Carolina Capital Management Trust: Cash and Term Portfolio (2008-present), President and Treasurer of other Fidelity funds (2008-present) and is an employee of Fidelity Investments. |
Gary W. Ryan (52) |
| Year of Election or Appointment: 2005 Assistant Treasurer of the Fidelity funds. Mr. Ryan is an employee of Fidelity Investments. Previously, Mr. Ryan served as Vice President of Fund Reporting in Fidelity Pricing and Cash Management Services (FPCMS) (1999-2005). |
Jonathan Davis (42) |
| Year of Election or Appointment: 2010 Assistant Treasurer of the Fidelity funds. Mr. Davis is an employee of Fidelity Investments. Previously, Mr. Davis served as Vice President and Associate General Counsel of FMR LLC (2003-2010). |
Annual Report
The Board of Trustees of Advisor Emerging Asia Fund voted to pay to shareholders of record at the opening of business on record date, the following distributions per share derived from capital gains realized from sales of portfolio securities, and dividends derived from net investment income:
| Pay Date | Record Date | Dividends | Capital Gains |
Institutional Class | 12/06/10 | 12/03/10 | $0.288 | $1.805 |
The fund hereby designates as a capital gain dividend with respect to the taxable year ended October 31, 2010, $22,131,489, or, if subsequently determined to be different, the net capital gain of such year.
Institutional Class designates 35% of the dividends distributed during the fiscal year as amounts which may be taken into account as a dividend for purposes of the maximum rate under section 1(h)(11) of the Internal Revenue Code.
The amounts per share which represent income derived from sources within, and taxes paid to, foreign countries or possessions of the United States are $.3559 and $.0355 for the dividend paid 12/07/09.
The fund will notify shareholders in January 2011 of amounts for use in preparing 2010 income tax returns.
Annual Report
Board Approval of Investment Advisory Contracts and Management Fees
Fidelity Advisor Emerging Asia Fund
Each year, the Board of Trustees, including the Independent Trustees (together, the Board), votes on the renewal of the management contract and sub-advisory agreements (together, the Advisory Contracts) for the fund. The Board, assisted by the advice of fund counsel and Independent Trustees' counsel, requests and considers a broad range of information relevant to the renewal of the Advisory Contracts throughout the year.
The Board meets regularly and considers at each of its meetings factors that are relevant to its annual consideration of the renewal of the fund's Advisory Contracts, including the services and support provided to the fund and its shareholders. The Board has established various standing committees, each composed of Independent Trustees with varying backgrounds, to which the Board has assigned specific subject matter responsibilities in order to enhance effective decision-making by the Board. The Board, acting directly and through its Committees, requests and receives information concerning the annual consideration of the renewal of the fund's Advisory Contracts. The Board also meets as needed to consider matters specifically related to the Board's annual consideration of the renewal of Advisory Contracts. Members of the Board may also meet with trustees of other Fidelity funds through ad hoc joint committees to discuss certain matters relevant to the Fidelity funds.
At its July 2010 meeting, the Board of Trustees, including the Independent Trustees, unanimously determined to renew the fund's Advisory Contracts. In reaching its determination, the Board considered all factors it believed relevant, including (i) the nature, extent, and quality of the services to be provided to the fund and its shareholders (including the investment performance of the fund); (ii) the competitiveness of the fund's management fee and total expenses; (iii) the total costs of the services to be provided by and the profits to be realized by Fidelity from its relationship with the fund; (iv) the extent to which economies of scale would be realized as the fund grows; and (v) whether fee levels reflect these economies of scale, if any, for the benefit of fund shareholders.
In considering whether to renew the Advisory Contracts for the fund, the Board reached a determination, with the assistance of fund counsel and Independent Trustees' counsel and through the exercise of its business judgment, that the renewal of the Advisory Contracts is in the best interests of fund shareholders and that the compensation to be received by Fidelity under the management contract is fair and reasonable. The Board's decision to renew the Advisory Contracts was not based on any single factor noted above, but rather was based on a comprehensive consideration of all the information provided to the Board at its meetings throughout the year. The Board, in reaching its determination to renew the Advisory Contracts, is aware that shareholders in the fund have a broad range of investment choices available to them, including a wide choice among mutual funds offered by Fidelity's competitors, and that the fund's shareholders, with the opportunity to review and weigh the disclosure provided by the fund in its prospectus and other public disclosures, have chosen to invest in this fund, managed by Fidelity.
Annual Report
Board Approval of Investment Advisory Contracts and
Management Fees - continued
Nature, Extent, and Quality of Services Provided. The Board considered the staffing within the investment adviser, FMR, and the sub-advisers (together, the Investment Advisers), including the backgrounds of the fund's investment personnel and the fund's investment objective and discipline. The Independent Trustees also had discussions with senior management of Fidelity's investment operations and investment groups. The Board considered the structure of the portfolio manager compensation program and whether this structure provides appropriate incentives to act in the best interest of the fund.
Resources Dedicated to Investment Management and Support Services. The Board and the equity research subcommittee of the Board's Fund Oversight Committee reviewed the size, education, and experience of the Investment Advisers' investment staff, their use of technology, and the Investment Advisers' approach to recruiting, training, and retaining portfolio managers and other research, advisory, and management personnel. The Board noted that Fidelity's analysts have access to a variety of technological tools and market and securities data that enable them to perform both fundamental and quantitative analysis and to specialize in various disciplines. The Board considered Fidelity's extensive global research capabilities that enable the Investment Advisers to aggregate data from various sources in an effort to produce positive investment results. The Board also considered that Fidelity's portfolio managers and analysts have access to daily portfolio attribution that allows for monitoring of a fund's portfolio, as well as an electronic communication system that provides immediate real-time access to research concerning issuers and credit enhancers. The Board noted FMR's continued focus on strengthening the organization and discipline of equity portfolio management and research.
Shareholder and Administrative Services. The Board considered (i) the nature, extent, quality, and cost of advisory, administrative, and shareholder services performed by the Investment Advisers and their affiliates under the Advisory Contracts and under separate agreements covering transfer agency, pricing and bookkeeping, and securities lending services for the fund; (ii) the nature and extent of the investment adviser's supervision of third party service providers, principally custodians and subcustodians; and (iii) the resources devoted to, and the record of compliance with, the fund's compliance policies and procedures. The Board also reviewed the allocation of fund brokerage, including allocations to brokers affiliated with the Investment Advisers, the use of brokerage commissions to pay fund expenses, and the use of "soft" commission dollars to pay for research services.
The Board noted that the growth of fund assets over time across the complex allows Fidelity to reinvest in the development of services designed to enhance the value or convenience of the Fidelity funds as investment vehicles. These services include 24-hour access to account information and market information through phone representatives and over the Internet, and investor education materials and asset allocation tools.
Annual Report
Investment in a Large Fund Family. The Board considered the benefits to shareholders of investing in a Fidelity fund, including the benefits of investing in a fund that is part of a large family of funds offering a variety of investment disciplines and providing a large variety of mutual fund investor services. The Board noted that Fidelity had taken, or had made recommendations that resulted in the Fidelity funds taking, a number of actions over the previous year that benefited particular funds, including (i) dedicating additional resources to investment research and restructuring and broadening the focus of the investment research teams; (ii) bolstering the senior management team that oversees asset management; (iii) launching Class F of certain funds as a lower-fee class available to Freedom K and Freedom Index Funds; (iv) lowering the initial investment minimums and ongoing balance requirements for Real Estate High Income Fund; (v) eliminating subsequent purchase minimums for all funds and adding a waiver of the investment minimum requirement for new accounts opened with the proceeds of a systematic withdrawal plan; (vi) eliminating the withdrawal minimum and maximum limits for systematic withdrawals from Advisor funds; (vii) expanding sales load waivers on Class A shares for Destiny Planholders and expanding Institutional Class eligibility for Class O Destiny Planholders; and (viii) changing certain Class A and Class T sales charge structures to further align them with industry practices.
Investment Performance. The Board considered whether the fund has operated in accordance with its investment objective, as well as its record of compliance with its investment restrictions. It also reviewed the fund's absolute investment performance for each class, as well as the fund's relative investment performance for each class measured over multiple periods against a broad-based securities market index. The Board noted that FMR does not believe that a meaningful peer group exists against which to compare the fund's performance. The following charts considered by the Board show, over the one-, three-, and five-year periods ended December 31, 2009, the cumulative total returns of Institutional Class (Class I) and Class B of the fund and the cumulative total returns of a broad-based securities market index ("benchmark"). The returns of Institutional Class (Class I) and Class B show the performance of the highest and lowest performing classes, respectively (based on five-year performance).
Annual Report
Board Approval of Investment Advisory Contracts and
Management Fees - continued
Fidelity Advisor Emerging Asia Fund
The Board noted that the investment performance of Institutional Class (Class I) of the fund compared favorably to its benchmark for all the periods shown. The Board considered that the variations in performance among the fund's classes reflect the variations in class expenses, which result in lower performance for higher expense classes. The Board also reviewed the fund's performance since inception as well as performance in the current year.
Based on its review, and giving particular weight to the nature and quality of the resources dedicated by the Investment Advisers to maintain and improve relative performance and factoring in the unprecedented market events in recent years, the Board concluded that the nature, extent, and quality of investment management and support services and of shareholder and administrative services provided to the fund will benefit the fund's shareholders, particularly in light of the Board's view that the fund's shareholders benefit from investing in a fund that is part of a large family of funds offering a variety of investment disciplines and services.
Competitiveness of Management Fee and Total Fund Expenses. The Board considered the fund's management fee and total expenses compared to "mapped groups" of competitive funds and classes. Fidelity creates "mapped groups" by combining similar Lipper investment objective categories that have comparable management fee characteristics. Combining Lipper investment objective categories aids the Board's management fee and total expense comparisons by broadening the competitive group used for comparison and by reducing the number of universes to which various Fidelity funds are compared.
Annual Report
Management Fee. The Board considered two proprietary management fee comparisons for the 12-month periods shown in the chart below. The group of Lipper funds used by the Board for management fee comparisons is referred to below as the "Total Mapped Group." The Total Mapped Group comparison focuses on a fund's standing relative to the total universe of comparable funds available to investors, in terms of gross management fees before expense reimbursements or caps. "TMG %" represents the percentage of funds in the Total Mapped Group that had management fees that were lower than the fund's. For example, a TMG % of 7% means that 93% of the funds in the Total Mapped Group had higher management fees than the fund. The "Asset-Size Peer Group" (ASPG) comparison focuses on a fund's standing relative to non-Fidelity funds similar in size to the fund within the Total Mapped Group. The ASPG represents at least 15% of the funds in the Total Mapped Group with comparable asset size and management fee characteristics, subject to a minimum of 50 funds (or all funds in the Total Mapped Group if fewer than 50). Additional information, such as the ASPG quartile in which the fund's management fee ranked, is also included in the chart and considered by the Board.
Fidelity Advisor Emerging Asia Fund
The Board noted that the fund's management fee ranked below the median of its Total Mapped Group and below the median of its ASPG for 2009.
Based on its review, the Board concluded that the fund's management fee is fair and reasonable in light of the services that the fund receives and the other factors considered.
Total Expenses. In its review of each class's total expenses, the Board considered the fund's management fee as well as other fund or class expenses, as applicable, such as transfer agent fees, pricing and bookkeeping fees, fund-paid 12b-1 fees, and custodial, legal, and audit fees. The Board also noted the effects of any waivers and reimbursements on fees and expenses. As part of its review, the Board also considered current and historical total expenses of each class of the fund compared to competitive fund median expenses. Each class of the fund is compared to those funds and classes in the Total Mapped Group (used by the Board for management fee comparisons) that have a similar sales load structure.
Annual Report
Board Approval of Investment Advisory Contracts and
Management Fees - continued
The Board noted that the total expenses of each class ranked below its competitive median for 2009.
Fees Charged to Other Fidelity Clients. The Board also considered Fidelity fee structures and other information with respect to clients of FMR and its affiliates, such as other mutual funds advised or subadvised by FMR or its affiliates, pension plan clients, and other institutional clients. In March 2010, the Board created an ad hoc joint committee with the board of other Fidelity funds (the Committee) to review and compare Fidelity's institutional investment advisory business with its business of providing services to the Fidelity funds, including the differences in services provided, fees charged, and costs incurred, as well as competition in their respective marketplaces.
Based on its review of total expenses and fees charged to other Fidelity clients, the Board concluded that the total expenses of each class of the fund were reasonable in light of the services that the fund and its shareholders receive and the other factors considered, including the findings of the Committee.
Costs of the Services and Profitability. The Board considered the revenues earned and the expenses incurred by Fidelity in conducting the business of developing, marketing, distributing, managing, administering and servicing the fund and its shareholders. The Board also considered the level of Fidelity's profits in respect of all the Fidelity funds.
On an annual basis, FMR presents to the Board Fidelity's profitability for the fund. Fidelity calculates the profitability for each fund, as well as aggregate profitability for groups of Fidelity funds and all Fidelity funds, using a series of detailed revenue and cost allocation methodologies which originate with the audited books and records of Fidelity. The Audit Committee of the Board reviews any significant changes from the prior year's methodologies.
PricewaterhouseCoopers LLP (PwC), independent registered public accounting firm and auditor to Fidelity and certain Fidelity funds, has been engaged annually by the Board as part of the Board's assessment of Fidelity's profitability analysis. PwC's engagement includes the review and assessment of Fidelity's methodologies used in determining the revenues and expenses attributable to Fidelity's mutual fund business, and completion of agreed-upon procedures surrounding the mathematical accuracy of fund profitability and its conformity to allocation methodologies. After considering PwC's reports issued under the engagement and information provided by Fidelity, the Board believes that while other allocation methods may also be reasonable, Fidelity's profitability methodologies are reasonable in all material respects.
Annual Report
The Board has also reviewed Fidelity's non-fund businesses and fall-out benefits related to the mutual fund business as well as cases where Fidelity's affiliates may benefit from or be related to the fund's business.
The Board considered the costs of the services provided by and the profits realized by Fidelity in connection with the operation of the fund and were satisfied that the profitability was not excessive in the circumstances.
Economies of Scale. The Board considered whether there have been economies of scale in respect of the management of the Fidelity funds, whether the Fidelity funds (including the fund) have appropriately benefited from any such economies of scale, and whether there is potential for realization of any further economies of scale. The Board considered the extent to which the fund will benefit from economies of scale through increased services to the fund, through waivers or reimbursements, or through fee or expense reductions.
In February 2009, the Board and the board of other Fidelity funds created an ad hoc committee (the Economies of Scale Committee) to analyze whether FMR attains economies of scale in respect of the management and servicing of the Fidelity funds, whether the Fidelity funds have appropriately benefited from such economies of scale, and whether there is potential for realization of any further economies of scale.
The Board recognized that the fund's management contract incorporates a "group fee" structure, which provides for lower group fee rates as total fund assets under FMR's management increase, and for higher group fee rates as total fund assets under FMR's management decrease. FMR calculates the group fee rates based on a tiered asset "breakpoint" schedule that varies based on asset class. The Board considered that the group fee is designed to deliver the benefits of economies of scale to fund shareholders when total Fidelity fund assets increase, even if assets of any particular fund are unchanged or have declined, because some portion of Fidelity's costs are attributable to services provided to all Fidelity funds, and all funds benefit if those costs can be allocated among more assets. The Board concluded that, given the group fee structure, fund shareholders will benefit from lower management fees as assets under FMR's management increase at the fund complex level, regardless of whether Fidelity achieves any such economies of scale.
The Board concluded, considering the findings of the Economies of Scale Committee, that any potential economies of scale are being appropriately shared between fund shareholders and Fidelity.
Annual Report
Board Approval of Investment Advisory Contracts and
Management Fees - continued
Additional Information Requested by the Board. In order to develop fully the factual basis for consideration of the Fidelity funds' Advisory Contracts, the Board requested and received additional information on certain topics, including (i) fund performance trends, actions to be taken by FMR to improve certain funds' overall performance, and Fidelity's long-term strategies for certain funds; (ii) portfolio manager changes that have occurred during the past year and length of portfolio manager tenure for different categories of funds over time; (iii) Fidelity's compensation structure for portfolio managers, research analysts, and other key personnel, the rationale for the compensation structure, and how the compensation structure provides appropriate performance incentives; (iv) the amount of the investment that each portfolio manager has made in the Fidelity fund(s) that he or she manages; (v) management and other fees paid by FMR to affiliated sub-advisers on behalf of the Fidelity funds; (vi) Fidelity's fee structures and rationale for recommending different fees among different categories of funds; (vii) Fidelity's rationale for recommending which funds should have a performance adjustment component as part of their management fees; (viii) the rationale for any differences between fund fee structures and fee structures in place for other Fidelity clients; and (ix) explanations regarding the relative total expenses borne by certain funds and classes, total expense competitive trends, and actions that might be taken by FMR to reduce total expenses for certain funds and classes.
Based on its evaluation of all of the conclusions noted above, and after considering all factors it believed relevant, the Board ultimately concluded that the advisory fee structures are fair and reasonable, and that the fund's Advisory Contracts should be renewed.
Annual Report
Investment Adviser
Fidelity Management & Research Company
Boston, MA
Investment Sub-Advisers
FMR Co., Inc.
Fidelity Management & Research
(U.K.) Inc.
Fidelity Research & Analysis Company
FIL Investment Advisors
FIL Investment Advisors (U.K.) Limited
FIL Investments (Japan) Limited
Fidelity Management & Research (Hong Kong) Limited
Fidelity Management & Research (Japan), Inc.
General Distributor
Fidelity Distributors Corporation
Boston, MA
Transfer and Service Agents
Fidelity Investments Institutional Operations Company, Inc.
Boston, MA
Fidelity Service Company, Inc.
Boston, MA
Custodian
Brown Brothers Harriman & Co.
Boston, MA
AEAI-UANN-1210
1.784738.107
(Fidelity Investment logo)(registered trademark)
Fidelity AdvisorSM
Emerging Markets
Fund - Class A, Class T, Class B
and Class C
Annual Report
October 31, 2010
(2_fidelity_logos) (Registered_Trademark)
Contents
Chairman's Message | <Click Here> | The Chairman's message to shareholders. |
Performance | <Click Here> | How the fund has done over time. |
Management's Discussion of Fund Performance | <Click Here> | The Portfolio Manager's review of fundperformance and strategy. |
Shareholder Expense Example | <Click Here> | An example of shareholder expenses. |
Investment Changes | <Click Here> | A summary of major shifts in the fund's investments over the past six months. |
Investments | <Click Here> | A complete list of the fund's investments with their market values. |
Financial Statements | <Click Here> | Statements of assets and liabilities, operations, and changes in net assets,
as well as financial highlights. |
Notes | <Click Here> | Notes to the financial statements. |
Report of Independent Registered Public Accounting Firm | <Click Here> | |
Trustees and Officers | <Click Here> | |
Distributions | <Click Here> | |
Board Approval of Investment Advisory Contracts and Management Fees | <Click Here> | |
To view a fund's proxy voting guidelines and proxy voting record for the 12-month period ended June 30, visit http://www.fidelity.com/proxyvotingresults or visit the Securities and Exchange Commission's (SEC) web site at http://www.sec.gov. You may also call 1-877-208-0098 to request a free copy of the proxy voting guidelines.
Standard & Poor's, S&P and S&P 500 are registered service marks of The McGraw-Hill Companies, Inc. and have been licensed for use by Fidelity Distributors Corporation.
Other third party marks appearing herein are the property of their respective owners.
All other marks appearing herein are registered or unregistered trademarks or service marks of FMR LLC or an affiliated company.
Annual Report
This report and the financial statements contained herein are submitted for the general information of the shareholders of the fund. This report is not authorized for distribution to prospective investors in the fund unless preceded or accompanied by an effective prospectus.
A fund files its complete schedule of portfolio holdings with the SEC for the first and third quarters of each fiscal year on Form N-Q. Forms N-Q are available on the SEC's web site at http://www.sec.gov. A fund's Forms N-Q may be reviewed and copied at the SEC's Public Reference Room in Washington, DC. Information regarding the operation of the SEC's Public Reference Room may be obtained by calling 1-800-SEC-0330. For a complete list of a fund's portfolio holdings, view the most recent holdings listing, semiannual report, or annual report on Fidelity's web site at http://www.fidelity.com or http://advisor.fidelity.com, as applicable.
NOT FDIC INSURED • MAY LOSE VALUE • NO BANK GUARANTEE
Neither the fund nor Fidelity Distributors Corporation is a bank.
Annual Report
(photo_of_Edward_C_Johnson_3d)
Dear Shareholder:
Equities have staged a rally in the second half of 2010, shaking off concerns about the European debt crisis and the possibility of a double-dip recession in the U.S. Although the short-term surge pushed major equity indexes back into positive territory for the year, several questions remain about the longer-term outlook, including lackluster economic growth and persistently high unemployment. Financial markets are always unpredictable, of course, but there also are several time-tested investment principles that can help put the odds in your favor.
One of the basic tenets is to invest for the long term. Over time, riding out the markets' inevitable ups and downs has proven much more effective than selling into panic or chasing the hottest trend. Even missing only a few of the markets' best days can significantly diminish investor returns. Patience also affords the benefits of compounding - of earning interest on additional income or reinvested dividends and capital gains. There can be tax advantages and cost benefits to consider as well. While staying the course doesn't eliminate risk, it can considerably lessen the effect of short-term declines.
You can further manage your investing risk through diversification. And today, more than ever, geographic diversification should be taken into account. Studies indicate that asset allocation is the single most important determinant of a portfolio's long-term success. The right mix of stocks, bonds and cash - aligned to your particular risk tolerance and investment objective - is very important. Age-appropriate rebalancing is also an essential aspect of asset allocation. For younger investors, an emphasis on equities - which historically have been the best-performing asset class over time - is encouraged. As investors near their specific goal, such as retirement or sending a child to college, consideration may be given to replacing volatile assets (e.g. common stocks) with more-stable fixed investments (bonds or savings plans).
A third principle - investing regularly - can help lower the average cost of your purchases. Investing a certain amount of money each month or quarter helps ensure you won't pay for all your shares at market highs. This strategy - known as dollar cost averaging - also reduces "emotion" from investing, helping shareholders avoid selling weak performers just prior to an upswing, or chasing a hot performer just before a correction.
We invite you to contact us via the Internet, through our Investor Centers or by phone. It is our privilege to provide you the information you need to make the investments that are right for you.
Sincerely,
(The chairman's signature appears here.)
Edward C. Johnson 3d
Annual Report
Average annual total return reflects the change in the value of an investment, assuming reinvestment of the class' distributions from dividend income and capital gains (the profits earned upon the sale of securities that have grown in value, if any) and assuming a constant rate of performance each year. The $10,000 table and the fund's returns do not reflect the deduction of taxes that a shareholder would pay on fund distributions or the redemption of fund shares. During periods of reimbursement by Fidelity, a fund's total return will be greater than it would be had the reimbursement not occurred. How a fund did yesterday is no guarantee of how it will do tomorrow.
Average Annual Total Returns
Periods ended October 31, 2010 | Past 1
year | Past 5
years | Life of
fund A |
Class A (incl. 5.75% sales charge) | 17.52% | 11.47% | 13.95% |
Class T (incl. 3.50% sales charge) | 20.03% | 11.71% | 14.06% |
Class B (incl. contingent deferred sales charge) B | 18.77% | 11.70% | 14.11% |
Class C (incl. contingent deferred sales charge) C | 22.80% | 11.95% | 14.12% |
A From March 29, 2004.
B Class B shares' contingent deferred sales charges included in the past one year, past five years, and life of fund total return figures are 5%, 2%, and 0%, respectively.
C Class C shares' contingent deferred sales charge included in the past one year, past five years, and life of fund total return figures are 1%, 0%, and 0%, respectively.
Annual Report
$10,000 Over Life of Fund
Let's say hypothetically that $10,000 was invested in Fidelity AdvisorSM Emerging Markets Fund - Class A on March 29, 2004, when the fund started, and the current 5.75% sales charge was paid. The chart shows how the value of your investment would have changed, and also shows how the MSCI® Emerging Markets Index performed over the same period.
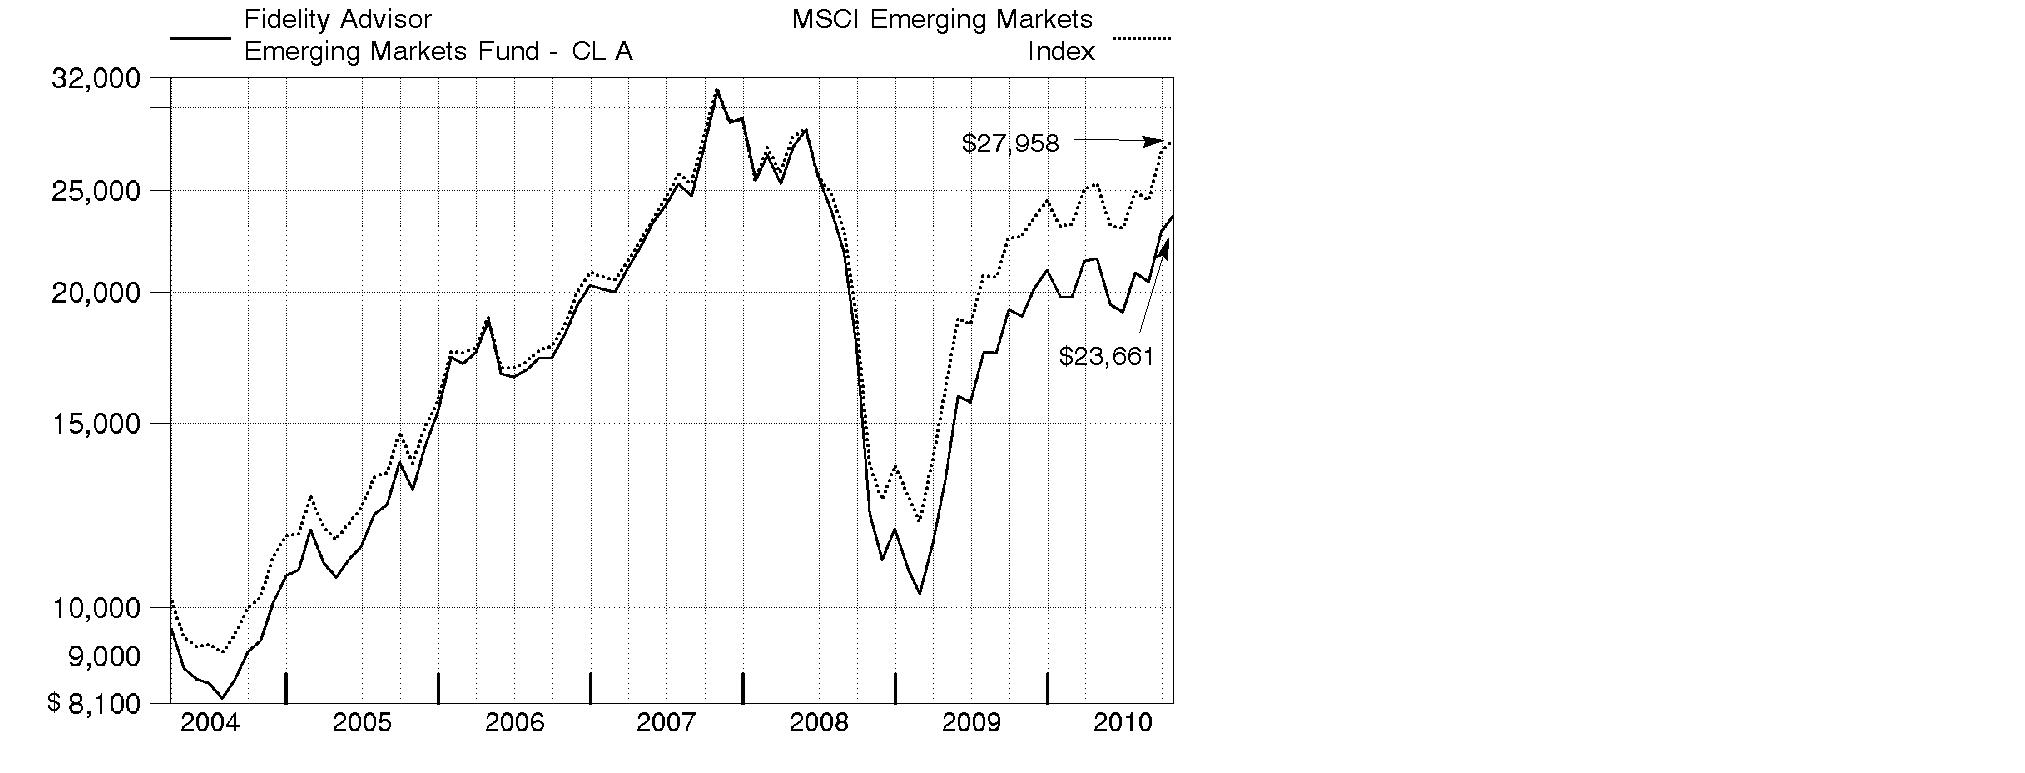
Annual Report
Market Recap: The return-to-risk theme was evident within emerging markets during the 12 months ending October 31, 2010. The combination of strong economic growth and superior fiscal conditions bolstered the performance of emerging-markets stocks, as they finished the period well ahead of most foreign developed-country stock indexes. Several smaller country constituents provided a big boost to the index, while most of its biggest components, though strong, still lagged. The falling value of the U.S. dollar relative to most emerging-markets currencies also provided a meaningful contribution. Rising commodity prices supported returns in commodity-producing regions, such as Latin America, which also benefited from the announced integration of the Chile, Colombia and Peru stock exchanges, scheduled for November. For the 12 months ending October 31, 2010, the MSCI® Emerging Markets Index climbed 23.89%. Among emerging-markets countries, major index components South Korea, Taiwan, Brazil and China gained roughly 25%, 21%, 15% and 9%, respectively. India, also a large constituent, solidly beat the index, returning about 35%. Other strong-performing countries included Thailand (62%), Turkey (55%), Indonesia (52%), Malaysia (36%), Mexico (34%) and South Africa (33%).
Comments from Robert von Rekowsky, Portfolio Manager of Fidelity AdvisorSM Emerging Markets Fund: During the past year, the fund's Class A, Class T, Class B and Class C shares gained 24.69%, 24.38%, 23.77% and 23.80%, respectively (excluding sales charges), straddling the return of the MSCI index. Relative performance was aided by stock selection and an overweighting in consumer discretionary. Solid picks in information technology, energy and materials also bolstered our results, as did underweighting financials. From a country standpoint, security selection in Russia, China, India and South Korea aided performance, along with an overweighting and rewarding stock picking in Indonesia. Two Chinese stocks topped our list of relative contributors: an out-of-benchmark stake in Internet search/advertising Baidu and not owning weak-performing index component China Life Insurance. Indonesian tobacco producer/distributor Gudang Garam also bolstered results. On the negative side, a small cash position dampened the fund's gain in a rising market. Weak stock selection and an underweighting in industrials also hurt, as did lackluster picks in utilities and telecommunication services. Geographically, our selections in Brazil were weak, and underweighting Chile also hurt. Hungarian holding OTP Bank suffered from that nation's decision to impose a bank tax. Russian oil producer Rosneft also detracted. Both detractors I've mentioned were sold from the fund.
The views expressed above reflect those of the portfolio manager(s) only through the end of the period as stated on the cover of this report and do not necessarily represent the views of Fidelity or any other person in the Fidelity organization. Any such views are subject to change at any time based upon market or other conditions and Fidelity disclaims any responsibility to update such views. These views may not be relied on as investment advice and, because investment decisions for a Fidelity fund are based on numerous factors, may not be relied on as an indication of trading intent on behalf of any Fidelity fund.
Annual Report
Shareholder Expense Example
As a shareholder of the Fund, you incur two types of costs: (1) transaction costs, including sales charges (loads) on purchase payments or redemption proceeds, redemption fees, and (2) ongoing costs, including management fees, distribution and/or service (12b-1) fees and other Fund expenses. This Example is intended to help you understand your ongoing costs (in dollars) of investing in the Fund and to compare these costs with the ongoing costs of investing in other mutual funds.
The Example is based on an investment of $1,000 invested at the beginning of the period and held for the entire period (May 1, 2010 to October 31, 2010).
Actual Expenses
The first line of the accompanying table for each class of the Fund provides information about actual account values and actual expenses. You may use the information in this line, together with the amount you invested, to estimate the expenses that you paid over the period. Simply divide your account value by $1,000.00 (for example, an $8,600 account value divided by $1,000.00 = 8.6), then multiply the result by the number in the first line for a class of the Fund under the heading entitled "Expenses Paid During Period" to estimate the expenses you paid on your account during this period. In addition, the Fund, as a shareholder in the underlying Fidelity Central Funds, will indirectly bear its pro-rata share of the fees and expenses incurred by the underlying Fidelity Central Funds. These fees and expenses are not included in the Fund's annualized expense ratio used to calculate the expense estimate in the table below.
Hypothetical Example for Comparison Purposes
The second line of the accompanying table for each class of the Fund provides information about hypothetical account values and hypothetical expenses based on a Class' actual expense ratio and an assumed rate of return of 5% per year before expenses, which is not the Class' actual return. The hypothetical account values and expenses may not be used to estimate the actual ending account balance or expenses you paid for the period. You may use this information to compare the ongoing costs of investing in the Fund and other funds. To do so, compare this 5% hypothetical example with the 5% hypothetical examples that appear in the shareholder reports of the other funds. In addition, the Fund, as a shareholder in the underlying Fidelity Central Funds, will indirectly bear its pro-rata share of the fees and expenses incurred by the underlying Fidelity Central Funds. These fees and expenses are not included in the Fund's annualized expense ratio used to calculate the expense estimate in the table below.
Please note that the expenses shown in the table are meant to highlight your ongoing costs only and do not reflect any transaction costs. Therefore, the second line of the table is useful in comparing ongoing costs only, and will not help you determine the relative total costs of owning different funds. In addition, if these transactional costs were included, your costs would have been higher.
Annual Report
| Annualized
Expense Ratio | Beginning
Account Value
May 1, 2010 | Ending
Account Value
October 31, 2010 | Expenses Paid
During Period*
May 1, 2010 to
October 31, 2010 |
Class A | 1.54% | | | |
Actual | | $ 1,000.00 | $ 1,099.20 | $ 8.15 |
HypotheticalA | | $ 1,000.00 | $ 1,017.44 | $ 7.83 |
Class T | 1.79% | | | |
Actual | | $ 1,000.00 | $ 1,098.10 | $ 9.47 |
HypotheticalA | | $ 1,000.00 | $ 1,016.18 | $ 9.10 |
Class B | 2.29% | | | |
Actual | | $ 1,000.00 | $ 1,095.60 | $ 12.10 |
HypotheticalA | | $ 1,000.00 | $ 1,013.66 | $ 11.62 |
Class C | 2.28% | | | |
Actual | | $ 1,000.00 | $ 1,095.70 | $ 12.04 |
HypotheticalA | | $ 1,000.00 | $ 1,013.71 | $ 11.57 |
Institutional Class | 1.22% | | | |
Actual | | $ 1,000.00 | $ 1,101.50 | $ 6.46 |
HypotheticalA | | $ 1,000.00 | $ 1,019.06 | $ 6.21 |
A 5% return per year before expenses
* Expenses are equal to each Class' annualized expense ratio, multiplied by the average account value over the period, multiplied by 184/365 (to reflect the one-half year period).
Annual Report
Investment Changes (Unaudited)
Top Five Stocks as of October 31, 2010 |
| % of fund's
net assets | % of fund's net assets
6 months ago |
America Movil SAB de CV Series L sponsored ADR (Mexico, Wireless Telecommunication Services) | 2.1 | 1.3 |
Vale SA (PN-A) sponsored ADR (Brazil, Metals & Mining) | 1.9 | 3.5 |
Samsung Electronics Co. Ltd. (Korea (South), Semiconductors & Semiconductor Equipment) | 1.9 | 2.4 |
Banco Bradesco SA (PN) sponsored ADR (Brazil, Commercial Banks) | 1.9 | 1.3 |
Petroleo Brasileiro SA-Petrobras (PN), (non-vtg.) (Brazil, Oil, Gas & Consumable Fuels) | 1.9 | 2.9 |
| 9.7 | |
Top Five Market Sectors as of October 31, 2010 |
| % of fund's
net assets | % of fund's net assets
6 months ago |
Financials | 26.0 | 22.1 |
Materials | 15.8 | 16.3 |
Energy | 13.2 | 13.1 |
Consumer Discretionary | 10.6 | 8.3 |
Information Technology | 9.7 | 14.3 |
Top Five Countries as of October 31, 2010 |
(excluding cash equivalents) | % of fund's
net assets | % of fund's net assets
6 months ago |
Brazil | 13.4 | 13.9 |
Korea (South) | 11.8 | 11.9 |
India | 8.7 | 6.6 |
China | 8.0 | 7.8 |
Russia | 7.9 | 8.5 |
Percentages are adjusted for the effect of open futures contracts, if applicable. |
Asset Allocation (% of fund's net assets) |
As of October 31, 2010 | As of April 30, 2010 |
| Stocks 98.1% | | | Stocks 96.5% | |
| Short-Term
Investments and
Net Other Assets 1.9% | | | Short-Term
Investments and
Net Other Assets 3.5% | |

Annual Report
Investments October 31, 2010
Showing Percentage of Net Assets
Common Stocks - 98.1% |
| Shares | | Value |
Argentina - 0.5% |
Banco Macro SA sponsored ADR | 73,676 | | $ 3,672,749 |
Austria - 0.2% |
Erste Bank AG | 32,350 | | 1,459,785 |
Bahamas (Nassau) - 0.2% |
Petrominerales Ltd. | 42,900 | | 1,099,105 |
Bailiwick of Jersey - 0.7% |
Heritage Oil PLC | 239,841 | | 1,323,780 |
Randgold Resources Ltd. sponsored ADR | 28,000 | | 2,629,760 |
West China Cement Ltd. (a) | 2,134,000 | | 825,931 |
TOTAL BAILIWICK OF JERSEY | | 4,779,471 |
Bermuda - 2.4% |
Aquarius Platinum Ltd.: | | | |
(Australia) | 454,459 | | 2,613,387 |
(United Kingdom) | 199,511 | | 1,151,687 |
China Yurun Food Group Ltd. | 716,000 | | 2,785,022 |
CNPC (Hong Kong) Ltd. | 2,239,000 | | 2,848,126 |
Credicorp Ltd. (NY Shares) | 13,500 | | 1,699,380 |
Jinhui Shipping & Transportation Ltd. (a) | 69,643 | | 276,941 |
Orient Overseas International Ltd. | 401,000 | | 3,515,298 |
Sinofert Holdings Ltd. (a) | 2,186,000 | | 1,156,278 |
Texwinca Holdings Ltd. | 1,012,000 | | 1,104,534 |
TOTAL BERMUDA | | 17,150,653 |
Brazil - 13.4% |
AES Tiete SA (PN) (non-vtg.) | 97,600 | | 1,345,356 |
Banco Bradesco SA (PN) sponsored ADR (d) | 641,690 | | 13,347,152 |
Banco do Brasil SA | 258,000 | | 5,019,868 |
Banco do Estado do Rio Grande do Sul SA | 71,800 | | 788,821 |
Brascan Residential Properties SA | 119,000 | | 647,743 |
Brasil Insurance Participacoes e Administracao SA (a) | 900 | | 714,202 |
Companhia de Bebidas das Americas (AmBev) (PN) sponsored ADR | 34,900 | | 4,859,476 |
Companhia Energetica de Minas Gerais (CEMIG) (PN) sponsored ADR (non-vtg.) (d) | 1,347 | | 24,030 |
Companhia Siderurgica Nacional SA (CSN) sponsored ADR (d) | 331,700 | | 5,599,096 |
Confab Industrial SA (PN) (non-vtg.) | 117,200 | | 423,689 |
Drogasil SA | 46,700 | | 1,181,226 |
Eletropaulo Metropolitana SA (PN-B) | 53,400 | | 932,271 |
Estacio Participacoes SA | 52,000 | | 776,699 |
Even Construtora e Incorporadora SA | 88,300 | | 502,436 |
Common Stocks - continued |
| Shares | | Value |
Brazil - continued |
Fleury SA | 57,000 | | $ 737,127 |
Gafisa SA sponsored ADR (d) | 231,850 | | 3,892,762 |
Light SA | 97,400 | | 1,226,374 |
Localiza Rent A Car SA | 168,500 | | 2,788,194 |
Lojas Renner SA | 94,300 | | 3,724,994 |
Natura Cosmeticos SA | 106,700 | | 3,054,485 |
OGX Petroleo e Gas Participacoes SA (a) | 584,400 | | 7,667,416 |
OSX Brasil SA | 2,100 | | 675,229 |
PDG Realty SA Empreendimentos e Participacoes | 287,600 | | 3,595,845 |
Petroleo Brasileiro SA - Petrobras: | | | |
(ON) sponsored ADR | 61,200 | | 2,088,144 |
(PN) (non-vtg.) | 300,300 | | 4,563,105 |
(PN) sponsored ADR (non-vtg.) | 278,710 | | 8,692,965 |
TIM Participacoes SA sponsored ADR (non-vtg.) | 75,100 | | 2,422,726 |
Vale SA (PN-A) sponsored ADR | 484,000 | | 13,905,320 |
Weg SA | 64,000 | | 826,522 |
TOTAL BRAZIL | | 96,023,273 |
Canada - 1.7% |
Eldorado Gold Corp. | 183,185 | | 3,101,878 |
First Quantum Minerals Ltd. | 44,600 | | 3,905,506 |
Niko Resources Ltd. | 15,800 | | 1,507,344 |
Pacific Rubiales Energy Corp. (a) | 25,600 | | 816,017 |
Sherritt International Corp. | 111,000 | | 863,055 |
Uranium One, Inc. (a) | 562,500 | | 2,299,858 |
TOTAL CANADA | | 12,493,658 |
Cayman Islands - 2.9% |
3SBio, Inc. sponsored ADR (a) | 70,306 | | 1,058,105 |
Alibaba.com Ltd. (a) | 316,000 | | 617,222 |
China Shanshui Cement Group Ltd. | 3,101,000 | | 2,208,356 |
Daphne International Holdings Ltd. | 1,860,000 | | 2,078,065 |
Eurasia Drilling Co. Ltd.: | | | |
GDR (e) | 16,500 | | 420,750 |
GDR (Reg. S) | 136,902 | | 3,491,001 |
Evergreen International Holdings Ltd. (a) | 38,000 | | 22,551 |
Geely Automobile Holdings Ltd. (d) | 3,925,000 | | 2,212,837 |
Global Education & Technology Group Ltd. ADR (a) | 2,800 | | 27,804 |
Hidili Industry International Development Ltd. | 2,044,000 | | 2,178,157 |
International Mining Machinery Holdings Ltd. | 1,528,000 | | 1,330,624 |
Kingboard Chemical Holdings Ltd. | 647,000 | | 3,146,834 |
Kingboard Chemical Holdings Ltd. warrants 10/31/12 (a) | 39,750 | | 22,769 |
Common Stocks - continued |
| Shares | | Value |
Cayman Islands - continued |
Microport Scientific Corp. | 27,000 | | $ 27,518 |
Shenguan Holdings Group Ltd. | 640,000 | | 833,930 |
Trina Solar Ltd. ADR (a)(d) | 47,200 | | 1,263,072 |
TOTAL CAYMAN ISLANDS | | 20,939,595 |
China - 8.0% |
Anhui Expressway Co. Ltd. (H Shares) | 976,000 | | 742,900 |
Baidu.com, Inc. sponsored ADR (a) | 29,115 | | 3,202,941 |
China Communications Services Corp. Ltd. (H Shares) | 2,086,000 | | 1,216,413 |
China Construction Bank Corp. (H Shares) | 9,078,000 | | 8,654,916 |
China Merchants Bank Co. Ltd. (H Shares) | 2,077,342 | | 5,896,020 |
China Minsheng Banking Corp. Ltd. (H Shares) | 1,854,000 | | 1,724,540 |
China Suntien Green Energy Corp. Ltd. (H Shares) | 137,000 | | 46,131 |
Digital China Holdings Ltd. (H Shares) | 573,000 | | 1,034,930 |
Golden Eagle Retail Group Ltd. (H Shares) | 1,152,000 | | 3,061,597 |
Harbin Power Equipment Co. Ltd. (H Shares) | 1,716,000 | | 2,311,245 |
Industrial & Commercial Bank of China Ltd. (H Shares) | 16,023,000 | | 12,899,019 |
Minth Group Ltd. | 1,463,000 | | 2,736,784 |
Ping An Insurance Group Co. China Ltd. (H Shares) | 717,000 | | 7,719,226 |
Weichai Power Co. Ltd. (H Shares) | 115,000 | | 1,510,337 |
Yantai Changyu Pioneer Wine Co. (B Shares) | 294,239 | | 3,792,224 |
Zhaojin Mining Industry Co. Ltd. (H Shares) | 117,000 | | 363,774 |
TOTAL CHINA | | 56,912,997 |
Colombia - 0.6% |
Ecopetrol SA ADR (d) | 83,100 | | 3,967,194 |
Czech Republic - 1.1% |
Ceske Energeticke Zavody AS | 82,400 | | 3,650,839 |
Komercni Banka AS | 19,993 | | 4,536,417 |
TOTAL CZECH REPUBLIC | | 8,187,256 |
Egypt - 0.8% |
Commercial International Bank Ltd. sponsored GDR | 773,408 | | 5,916,571 |
Georgia - 0.2% |
Bank of Georgia unit (a) | 65,500 | | 1,080,095 |
Hong Kong - 4.0% |
China Mobile (Hong Kong) Ltd. | 1,061,700 | | 10,842,414 |
Chow Sang Sang Holdings International Ltd. | 272,000 | | 715,859 |
CNOOC Ltd. | 4,667,000 | | 9,743,381 |
CNOOC Ltd. sponsored ADR (d) | 15,200 | | 3,175,584 |
Common Stocks - continued |
| Shares | | Value |
Hong Kong - continued |
I.T Ltd. | 710,000 | | $ 599,052 |
Shanghai Industrial Holdings Ltd. | 791,000 | | 3,643,116 |
TOTAL HONG KONG | | 28,719,406 |
Hungary - 0.2% |
Egis Rt. | 9,660 | | 1,134,884 |
India - 8.7% |
Bank of Baroda | 188,912 | | 4,482,205 |
Bharat Heavy Electricals Ltd. | 71,922 | | 3,968,164 |
Housing Development Finance Corp. Ltd. | 409,052 | | 6,346,420 |
Idea Cellular Ltd. (a) | 816,360 | | 1,242,267 |
Indian Oil Corp. Ltd. | 105,445 | | 994,502 |
Indian Overseas Bank | 416,476 | | 1,501,475 |
Infosys Technologies Ltd. sponsored ADR | 110,897 | | 7,478,894 |
Infotech Enterprises Ltd. | 93,657 | | 345,680 |
Infrastructure Development Finance Co. Ltd. | 864,610 | | 3,902,205 |
Jain Irrigation Systems Ltd. | 563,515 | | 2,949,475 |
JSW Steel Ltd. | 143,166 | | 4,334,385 |
LIC Housing Finance Ltd. | 23,184 | | 701,169 |
Radico Khaitan Ltd. | 117,492 | | 473,944 |
Reliance Industries Ltd. | 354,189 | | 8,759,835 |
Rural Electrification Corp. Ltd. | 416,544 | | 3,483,182 |
Shriram Transport Finance Co. Ltd. | 77,265 | | 1,536,410 |
Tata Consultancy Services Ltd. | 249,445 | | 5,925,339 |
Tata Steel Ltd. | 69,491 | | 924,038 |
Ultratech Cement Ltd. | 103,025 | | 2,556,508 |
TOTAL INDIA | | 61,906,097 |
Indonesia - 6.0% |
Indofood Sukses Makmur Tbk PT (a) | 1,031,500 | | 657,851 |
PT Astra International Tbk | 831,000 | | 5,299,799 |
PT Bank Mandiri (Persero) Tbk | 1,864,500 | | 1,460,306 |
PT Bank Negara Indonesia (Persero) Tbk | 7,737,500 | | 3,376,360 |
PT Bank Rakyat Indonesia Tbk | 4,013,000 | | 5,118,675 |
PT Bank Tabungan Negara Tbk | 4,634,000 | | 1,031,793 |
PT Bumi Serpong Damai Tbk | 6,288,500 | | 591,030 |
PT Ciputra Development Tbk (a) | 14,439,000 | | 678,531 |
PT Delta Dunia Petroindo Tbk (a) | 9,099,500 | | 1,089,394 |
PT Gudang Garam Tbk | 664,500 | | 3,546,475 |
PT Indo Tambangraya Megah Tbk | 389,500 | | 1,969,833 |
PT Indocement Tunggal Prakarsa Tbk | 2,178,500 | | 4,460,589 |
PT Indofood Sukses Makmur Tbk | 7,463,500 | | 4,342,396 |
Common Stocks - continued |
| Shares | | Value |
Indonesia - continued |
PT Kalbe Farma Tbk | 4,199,500 | | $ 1,256,912 |
PT Perusahaan Gas Negara Tbk Series B | 5,981,700 | | 2,710,586 |
PT Tambang Batubbara Bukit Asam Tbk | 402,500 | | 884,936 |
PT Tower Bersama Infrastructure Tbk | 5,965,000 | | 1,701,900 |
PT XL Axiata Tbk (a) | 4,435,500 | | 2,853,605 |
TOTAL INDONESIA | | 43,030,971 |
Kazakhstan - 0.3% |
KazMunaiGas Exploration & Production JSC (Reg. S) GDR | 113,377 | | 1,950,084 |
Korea (South) - 11.8% |
Busan Bank | 115,560 | | 1,438,719 |
CJ Corp. | 37,857 | | 2,669,684 |
Daegu Bank Co. Ltd. | 99,630 | | 1,306,841 |
Daelim Industrial Co. | 26,393 | | 2,149,932 |
Doosan Co. Ltd. | 14,089 | | 1,898,162 |
GS Holdings Corp. | 38,060 | | 1,996,923 |
Hanjin Heavy Industries & Consolidated Co. Ltd. | 64,127 | | 2,446,463 |
Honam Petrochemical Corp. | 17,477 | | 3,854,420 |
Hyundai Department Store Co. Ltd. | 8,984 | | 994,671 |
Hyundai Heavy Industries Co. Ltd. | 15,786 | | 5,145,014 |
Hyundai Mobis | 29,270 | | 7,288,216 |
Hyundai Motor Co. | 69,081 | | 10,443,547 |
Industrial Bank of Korea | 332,840 | | 4,780,227 |
Kia Motors Corp. | 142,910 | | 5,706,232 |
KT Corp. | 67,330 | | 2,654,576 |
LG Chemical Ltd. | 8,890 | | 2,743,290 |
Lumens Co. Ltd. (a) | 110,857 | | 985,834 |
NCsoft Corp. | 14,333 | | 3,154,662 |
Samsung Electronics Co. Ltd. | 20,158 | | 13,355,009 |
Shinhan Financial Group Co. Ltd. | 183,610 | | 7,110,907 |
Tong Yang Securities, Inc. | 140,980 | | 1,422,964 |
Young Poong Precision Corp. | 33,794 | | 395,190 |
TOTAL KOREA (SOUTH) | | 83,941,483 |
Lebanon - 0.0% |
BLOM Bank SAL GDR | 33,800 | | 310,960 |
Luxembourg - 0.8% |
Evraz Group SA GDR (a) | 109,693 | | 3,325,892 |
Millicom International Cellular SA | 27,000 | | 2,554,200 |
TOTAL LUXEMBOURG | | 5,880,092 |
Common Stocks - continued |
| Shares | | Value |
Malaysia - 0.8% |
AirAsia Bhd (a) | 1,193,800 | | $ 947,826 |
Axiata Group Bhd (a) | 2,052,000 | | 2,961,581 |
RHB Capital BHD | 324,200 | | 836,813 |
Top Glove Corp. Bhd | 606,800 | | 1,072,774 |
TOTAL MALAYSIA | | 5,818,994 |
Mexico - 2.7% |
America Movil SAB de CV Series L sponsored ADR | 266,968 | | 15,286,582 |
Banco Compartamos SA de CV | 371,100 | | 2,628,844 |
Genomma Lab Internacional SA de CV (a) | 472,200 | | 1,025,799 |
TOTAL MEXICO | | 18,941,225 |
Nigeria - 0.3% |
Guaranty Trust Bank PLC GDR (Reg. S) | 322,072 | | 2,338,243 |
Norway - 0.1% |
Det Norske Oljeselskap ASA (DNO) (A Shares) (a) | 434,500 | | 682,232 |
Peru - 0.6% |
Compania de Minas Buenaventura SA sponsored ADR | 86,089 | | 4,566,161 |
Poland - 0.1% |
Bank Handlowy w Warszawie SA | 31,126 | | 982,737 |
Qatar - 0.3% |
Commercial Bank of Qatar GDR (Reg. S) | 394,744 | | 1,808,782 |
Russia - 7.9% |
Cherkizovo Group OJSC GDR (a) | 68,074 | | 1,386,882 |
LSR Group OJSC GDR (Reg. S) (a) | 105,400 | | 895,900 |
Magnit OJSC GDR (Reg. S) | 180,961 | | 4,838,897 |
Mechel Steel Group OAO sponsored ADR | 140,300 | | 3,304,065 |
OAO NOVATEK GDR | 77,998 | | 7,460,509 |
OAO Raspadskaya (a) | 124,100 | | 722,614 |
OAO Tatneft sponsored ADR | 134,400 | | 4,240,320 |
OJSC MMC Norilsk Nickel sponsored ADR | 263,717 | | 4,918,322 |
OJSC Oil Company Rosneft GDR (Reg. S) | 955,000 | | 6,656,350 |
Polymetal JSC GDR (Reg. S) (a) | 248,906 | | 3,932,715 |
Protek (a) | 42,900 | | 77,878 |
RusHydro JSC: | | | |
rights 6/30/10 (a) | 429,046 | | 22,126 |
sponsored ADR (a) | 591,729 | | 3,062,198 |
Sberbank (Savings Bank of the Russian Federation) | 2,072,600 | | 6,811,166 |
Sberbank (Savings Bank of the Russian Federation) GDR | 9,007 | | 3,383,853 |
Severstal JSC (a) | 69,200 | | 944,405 |
Common Stocks - continued |
| Shares | | Value |
Russia - continued |
Sistema JSFC sponsored GDR | 126,821 | | $ 3,271,982 |
TGK-1 OAO (a) | 1,003,697,000 | | 696,566 |
TOTAL RUSSIA | | 56,626,748 |
Singapore - 0.8% |
Keppel Corp. Ltd. | 325,000 | | 2,505,988 |
Straits Asia Resources Ltd. | 1,264,000 | | 2,236,390 |
Yanlord Land Group Ltd. | 546,000 | | 725,581 |
TOTAL SINGAPORE | | 5,467,959 |
South Africa - 6.4% |
African Bank Investments Ltd. | 797,247 | | 4,090,343 |
African Rainbow Minerals Ltd. | 144,368 | | 3,683,058 |
AngloGold Ashanti Ltd. | 89,100 | | 4,178,796 |
AngloGold Ashanti Ltd. sponsored ADR | 47,100 | | 2,218,881 |
Aspen Pharmacare Holdings Ltd. | 219,026 | | 2,923,453 |
Clicks Group Ltd. | 409,078 | | 2,668,770 |
Foschini Ltd. | 273,866 | | 3,324,291 |
Imperial Holdings Ltd. | 7,072 | | 115,342 |
Mr Price Group Ltd. | 419,577 | | 3,813,002 |
Mvelaphanda Resources Ltd. (a) | 487,559 | | 3,187,729 |
Shoprite Holdings Ltd. | 278,600 | | 3,938,155 |
Standard Bank Group Ltd. | 446,933 | | 6,590,699 |
Wilson Bayly Holmes-Ovcon Ltd. | 58,277 | | 1,126,265 |
Woolworths Holdings Ltd. | 953,361 | | 3,735,842 |
TOTAL SOUTH AFRICA | | 45,594,626 |
Spain - 0.3% |
Banco Bilbao Vizcaya Argentaria SA sponsored ADR | 97,554 | | 1,282,835 |
Banco Santander SA sponsored ADR | 50,900 | | 652,029 |
TOTAL SPAIN | | 1,934,864 |
Taiwan - 6.9% |
Advanced Semiconductor Engineering, Inc. | 775,432 | | 675,139 |
Advanced Semiconductor Engineering, Inc. sponsored ADR (d) | 630,574 | | 2,793,443 |
Alpha Networks, Inc. | 1,180,000 | | 1,048,718 |
Asia Cement Corp. | 2,885,926 | | 2,975,036 |
Chroma ATE, Inc. | 570,393 | | 1,468,615 |
Farglory Land Development Co. Ltd. | 477,000 | | 1,184,512 |
Formosa Plastics Corp. | 2,177,000 | | 6,245,404 |
Fubon Financial Holding Co. Ltd. | 3,399,726 | | 4,165,650 |
HTC Corp. | 372,050 | | 8,400,149 |
Common Stocks - continued |
| Shares | | Value |
Taiwan - continued |
Huaku Development Co. Ltd. | 333,000 | | $ 923,761 |
Macronix International Co. Ltd. | 5,707,061 | | 3,515,050 |
Pegatron Corp. (a) | 1,245,000 | | 1,686,171 |
Ruentex Development Co. Ltd. | 378,000 | | 627,427 |
Taishin Financial Holdings Co. Ltd. | 8,750,130 | | 3,831,130 |
Taiwan Cement Corp. | 1,518,000 | | 1,616,952 |
Taiwan Semiconductor Manufacturing Co. Ltd. | 1,581,534 | | 3,255,464 |
Unimicron Technology Corp. | 420,000 | | 714,981 |
Wistron Corp. | 2,087,499 | | 4,290,269 |
TOTAL TAIWAN | | 49,417,871 |
Thailand - 1.4% |
Advanced Info Service PCL (For. Reg.) | 840,400 | | 2,526,253 |
Banpu PCL (For. Reg.) | 71,400 | | 1,845,812 |
BEC World PCL (For. Reg.) | 1,219,500 | | 1,354,321 |
Siam Commercial Bank PCL (For. Reg.) | 1,287,200 | | 4,406,747 |
Total Access Communication PCL (For. Reg.) | 14,600 | | 20,481 |
TOTAL THAILAND | | 10,153,614 |
Turkey - 3.2% |
Enka Insaat ve Sanayi AS | 325,222 | | 1,485,187 |
Sinpas Gayrimenkul Yatirim Ortakligi AS (a) | 631,000 | | 959,060 |
Tofas Turk Otomobil Fabrikasi AS | 501,202 | | 2,778,049 |
Turk Hava Yollari AO | 1,166,142 | | 4,837,583 |
Turkiye Garanti Bankasi AS | 1,458,375 | | 8,947,710 |
Turkiye Halk Bankasi AS | 360,000 | | 3,639,406 |
TOTAL TURKEY | | 22,646,995 |
United Arab Emirates - 0.3% |
DP World Ltd. | 3,301,483 | | 1,977,588 |
United Kingdom - 0.8% |
Hikma Pharmaceuticals PLC | 204,043 | | 2,569,493 |
Xstrata PLC | 172,825 | | 3,349,004 |
TOTAL UNITED KINGDOM | | 5,918,497 |
United States of America - 0.7% |
CTC Media, Inc. | 92,000 | | 2,171,200 |
Freeport-McMoRan Copper & Gold, Inc. | 33,122 | | 3,135,991 |
TOTAL UNITED STATES OF AMERICA | | 5,307,191 |
TOTAL COMMON STOCKS (Cost $538,959,000) | 700,740,706 |
Money Market Funds - 4.5% |
| Shares | | Value |
Fidelity Cash Central Fund, 0.23% (b) | 5,123,487 | | $ 5,123,487 |
Fidelity Securities Lending Cash Central Fund, 0.24% (b)(c) | 26,828,675 | | 26,828,675 |
TOTAL MONEY MARKET FUNDS (Cost $31,952,162) | 31,952,162 |
TOTAL INVESTMENT PORTFOLIO - 102.6% (Cost $570,911,162) | | 732,692,868 |
NET OTHER ASSETS (LIABILITIES) - (2.6)% | | (18,646,437) |
NET ASSETS - 100% | $ 714,046,431 |
Legend |
(a) Non-income producing |
(b) Affiliated fund that is available only to investment companies and other accounts managed by Fidelity Investments. The rate quoted is the annualized seven-day yield of the fund at period end. A complete unaudited listing of the fund's holdings as of its most recent quarter end is available upon request. In addition, each Fidelity Central Fund's financial statements, which are not covered by the Fund's report of Independent Registered Public Accounting Firm, are available on the SEC's website or upon request. |
(c) Investment made with cash collateral received from securities on loan. |
(d) Security or a portion of the security is on loan at period end. |
(e) Security exempt from registration under Rule 144A of the Securities Act of 1933. These securities may be resold in transactions exempt from registration, normally to qualified institutional buyers. At the end of the period, the value of these securities amounted to $420,750 or 0.1% of net assets. |
Affiliated Central Funds |
Information regarding fiscal year to date income earned by the Fund from investments in Fidelity Central Funds is as follows: |
Fund | Income earned |
Fidelity Cash Central Fund | $ 28,975 |
Fidelity Securities Lending Cash Central Fund | 119,973 |
Total | $ 148,948 |
Other Information |
The following is a summary of the inputs used, as of October 31, 2010, involving the Fund's assets and liabilities carried at fair value. The inputs or methodology used for valuing securities may not be an indication of the risk associated with investing in those securities. For more information on valuation inputs, and their aggregation into the levels used in the tables below, please refer to the Security Valuation section in the accompanying Notes to Financial Statements. |
Valuation Inputs at Reporting Date: |
Description | Total | Level 1 | Level 2 | Level 3 |
Investments in Securities: | | | | |
Equities: | | | | |
Brazil | $ 96,023,273 | $ 95,309,071 | $ 714,202 | $ - |
Korea (South) | 83,941,483 | 81,286,907 | 2,654,576 | - |
India | 61,906,097 | 57,423,892 | 4,482,205 | - |
China | 56,912,997 | 56,912,997 | - | - |
Russia | 56,626,748 | 56,626,748 | - | - |
Taiwan | 49,417,871 | 45,487,268 | 3,930,603 | - |
South Africa | 45,594,626 | 41,415,830 | 4,178,796 | - |
Indonesia | 43,030,971 | 43,030,971 | - | - |
Hong Kong | 28,719,406 | 8,133,611 | 20,585,795 | - |
Other | 178,567,234 | 178,544,683 | 22,551 | - |
Money Market Funds | 31,952,162 | 31,952,162 | - | - |
Total Investments in Securities: | $ 732,692,868 | $ 696,124,140 | $ 36,568,728 | $ - |
The following is a reconciliation of Investments in Securities for which Level 3 inputs were used in determining value: |
Investments in Securities: | |
Beginning Balance | $ 8,214 |
Total Realized Gain (Loss) | (585,848) |
Total Unrealized Gain (Loss) | 586,553 |
Cost of Purchases | - |
Proceeds of Sales | (8,919) |
Amortization/Accretion | - |
Transfers in to Level 3 | - |
Transfers out of Level 3 | - |
Ending Balance | $ - |
The change in unrealized gain (loss) for the period attributable to Level 3 securities held at October 31, 2010 | $ - |
The information used in the above reconciliation represents fiscal year to date activity for any Investments in Securities identified as using Level 3 inputs at either the beginning or the end of the current fiscal period. Transfers in or out of Level 3 represent the beginning value of any Security or Instrument where a change in the pricing level occurred from the beginning to the end of the period. The cost of purchases and the proceeds of sales may include securities received or delivered through corporate actions or exchanges. Realized and unrealized gains (losses) disclosed in the reconciliation are included in Net Gain (Loss) on the Fund's Statement of Operations. |
Income Tax Information |
At October 31, 2010, the Fund had a capital loss carryforward of approximately $120,287,626 of which $34,783,611 and $85,504,015 will expire on October 31, 2016 and 2017, respectively. Capital loss carryforwards are only available to offset future capital gains of the Fund to the extent provided by regulations and may be limited. |
See accompanying notes which are an integral part of the financial statements.
Annual Report
Statement of Assets and Liabilities
| October 31, 2010 |
| | |
Assets | | |
Investment in securities, at value (including securities loaned of $26,322,895) - See accompanying schedule: Unaffiliated issuers (cost $538,959,000) | $ 700,740,706 | |
Fidelity Central Funds (cost $31,952,162) | 31,952,162 | |
Total Investments (cost $570,911,162) | | $ 732,692,868 |
Foreign currency held at value (cost $187,486) | | 187,770 |
Receivable for investments sold | | 3,626,831 |
Receivable for fund shares sold | | 8,035,226 |
Dividends receivable | | 1,069,669 |
Distributions receivable from Fidelity Central Funds | | 11,993 |
Other receivables | | 832,392 |
Total assets | | 746,456,749 |
| | |
Liabilities | | |
Payable for investments purchased | $ 2,978,374 | |
Payable for fund shares redeemed | 982,818 | |
Accrued management fee | 473,883 | |
Distribution and service plan fees payable | 215,399 | |
Other affiliated payables | 180,343 | |
Other payables and accrued expenses | 750,826 | |
Collateral on securities loaned, at value | 26,828,675 | |
Total liabilities | | 32,410,318 |
| | |
Net Assets | | $ 714,046,431 |
Net Assets consist of: | | |
Paid in capital | | $ 678,638,691 |
Undistributed net investment income | | 2,876,119 |
Accumulated undistributed net realized gain (loss) on investments and foreign currency transactions | | (128,693,728) |
Net unrealized appreciation (depreciation) on investments and assets and liabilities in foreign currencies | | 161,225,349 |
Net Assets | | $ 714,046,431 |
See accompanying notes which are an integral part of the financial statements.
Annual Report
Statement of Assets and Liabilities - continued
| October 31, 2010 |
| | |
Calculation of Maximum Offering Price
Class A:
Net Asset Value and redemption price per share ($286,969,778 ÷ 12,101,328 shares) | | $ 23.71 |
| | |
Maximum offering price per share (100/94.25 of $23.71) | | $ 25.16 |
Class T:
Net Asset Value and redemption price per share ($104,416,924 ÷ 4,422,172 shares) | | $ 23.61 |
| | |
Maximum offering price per share (100/96.50 of $23.61) | | $ 24.47 |
Class B:
Net Asset Value and offering price per share ($31,159,412 ÷ 1,346,506 shares)A | | $ 23.14 |
| | |
Class C:
Net Asset Value and offering price per share ($106,710,959 ÷ 4,613,748 shares)A | | $ 23.13 |
| | |
Institutional Class:
Net Asset Value, offering price and redemption price per share ($184,789,358 ÷ 7,742,088 shares) | | $ 23.87 |
A Redemption price per share is equal to net asset value less any applicable contingent deferred sales charge.
See accompanying notes which are an integral part of the financial statements.
Annual Report
Financial Statements - continued
Statement of Operations
| Year ended October 31, 2010 |
| | |
Investment Income | | |
Dividends | | $ 14,303,797 |
Income from Fidelity Central Funds | | 148,948 |
Income before foreign taxes withheld | | 14,452,745 |
Less foreign taxes withheld | | (1,608,281) |
Total income | | 12,844,464 |
| | |
Expenses | | |
Management fee | $ 4,957,849 | |
Transfer agent fees | 1,781,912 | |
Distribution and service plan fees | 2,354,595 | |
Accounting and security lending fees | 311,201 | |
Custodian fees and expenses | 652,462 | |
Independent trustees' compensation | 3,385 | |
Registration fees | 103,644 | |
Audit | 76,774 | |
Legal | 2,774 | |
Miscellaneous | 7,369 | |
Total expenses before reductions | 10,251,965 | |
Expense reductions | (332,640) | 9,919,325 |
Net investment income (loss) | | 2,925,139 |
Realized and Unrealized Gain (Loss) Net realized gain (loss) on: | | |
Investment securities: | | |
Unaffiliated issuers | 52,271,092 | |
Foreign currency transactions | (745,666) | |
Total net realized gain (loss) | | 51,525,426 |
Change in net unrealized appreciation (depreciation) on: Investment securities (net of decrease in deferred foreign taxes of $135,635) | 78,542,670 | |
Assets and liabilities in foreign currencies | (9,023) | |
Total change in net unrealized appreciation (depreciation) | | 78,533,647 |
Net gain (loss) | | 130,059,073 |
Net increase (decrease) in net assets resulting from operations | | $ 132,984,212 |
See accompanying notes which are an integral part of the financial statements.
Annual Report
Statement of Changes in Net Assets
| Year ended
October 31,
2010 | Year ended
October 31,
2009 |
Increase (Decrease) in Net Assets | | |
Operations | | |
Net investment income (loss) | $ 2,925,139 | $ 2,011,330 |
Net realized gain (loss) | 51,525,426 | (85,535,731) |
Change in net unrealized appreciation (depreciation) | 78,533,647 | 248,506,280 |
Net increase (decrease) in net assets resulting
from operations | 132,984,212 | 164,981,879 |
Distributions to shareholders from net investment income | (1,614,133) | (2,545,671) |
Distributions to shareholders from net realized gain | (3,680,474) | - |
Total distributions | (5,294,607) | (2,545,671) |
Share transactions - net increase (decrease) | 64,839,760 | 78,864,198 |
Redemption fees | 140,252 | 123,947 |
Total increase (decrease) in net assets | 192,669,617 | 241,424,353 |
| | |
Net Assets | | |
Beginning of period | 521,376,814 | 279,952,461 |
End of period (including undistributed net investment income of $2,876,119 and undistributed net investment income of $1,565,113, respectively) | $ 714,046,431 | $ 521,376,814 |
See accompanying notes which are an integral part of the financial statements.
Annual Report
Financial Highlights - Class A
Years ended October 31, | 2010 | 2009 | 2008 | 2007 | 2006 |
Selected Per-Share Data | | | | | |
Net asset value, beginning of period | $ 19.20 | $ 12.59 | $ 32.75 | $ 19.22 | $ 13.75 |
Income from Investment Operations | | | | | |
Net investment income (loss) C | .12 | .10 | .24 | .09 | .09 |
Net realized and unrealized gain (loss) | 4.59 | 6.64 | (19.61) | 13.46 | 5.47 |
Total from investment operations | 4.71 | 6.74 | (19.37) | 13.55 | 5.56 |
Distributions from net investment income | (.07) | (.14) | (.02) | (.03) | (.11) |
Distributions from net realized gain | (.13) | - | (.79) | - | - |
Total distributions | (.20) | (.14) | (.81) | (.03) | (.11) |
Redemption fees added to paid in capital C | - G | .01 | .02 | .01 | .02 |
Net asset value, end of period | $ 23.71 | $ 19.20 | $ 12.59 | $ 32.75 | $ 19.22 |
Total Return A, B | 24.69% | 54.54% | (60.55)% | 70.63% | 40.75% |
Ratios to Average Net Assets D, F | | | | | |
Expenses before reductions | 1.56% | 1.60% | 1.59% | 1.59% | 1.84% |
Expenses net of fee waivers, if any | 1.56% | 1.60% | 1.59% | 1.59% | 1.60% |
Expenses net of all reductions | 1.50% | 1.53% | 1.53% | 1.54% | 1.49% |
Net investment income (loss) | .59% | .70% | .94% | .36% | .51% |
Supplemental Data | | | | | |
Net assets, end of period (000 omitted) | $ 286,970 | $ 216,187 | $ 122,911 | $ 218,836 | $ 68,232 |
Portfolio turnover rate E | 86% | 85% | 61% | 48% | 48% |
A Total returns would have been lower had certain expenses not been reduced during the periods shown.
B Total returns do not include the effect of the sales charges.
C Calculated based on average shares outstanding during the period.
D Fees and expenses of the underlying Fidelity Central Funds are not included in the Fund's expense ratio. The Fund indirectly bears its proportionate share of the expenses of any underlying Fidelity Central Funds.
E Amount does not include the portfolio activity of any underlying Fidelity Central Funds.
F Expense ratios reflect operating expenses of the class. Expenses before reductions do not reflect amounts reimbursed by the investment adviser or reductions from brokerage service arrangements or reductions from other expense offset arrangements and do not represent the amount paid by the class during periods when reimbursements or reductions occur. Expenses net of fee waivers reflect expenses after reimbursement by the investment adviser but prior to reductions from brokerage service arrangements or other expense offset arrangements. Expenses net of all reductions represent the net expenses paid by the class.
G Amount represents less than $.01 per share.
See accompanying notes which are an integral part of the financial statements.
Annual Report
Financial Highlights - Class T
Years ended October 31, | 2010 | 2009 | 2008 | 2007 | 2006 |
Selected Per-Share Data | | | | | |
Net asset value, beginning of period | $ 19.14 | $ 12.49 | $ 32.52 | $ 19.10 | $ 13.69 |
Income from Investment Operations | | | | | |
Net investment income (loss) C | .07 | .07 | .17 | .03 | .05 |
Net realized and unrealized gain (loss) | 4.57 | 6.64 | (19.48) | 13.38 | 5.43 |
Total from investment operations | 4.64 | 6.71 | (19.31) | 13.41 | 5.48 |
Distributions from net investment income | (.04) | (.07) | - | - | (.09) |
Distributions from net realized gain | (.13) | - | (.74) | - | - |
Total distributions | (.17) | (.07) | (.74) | - | (.09) |
Redemption fees added to paid in capital C | - G | .01 | .02 | .01 | .02 |
Net asset value, end of period | $ 23.61 | $ 19.14 | $ 12.49 | $ 32.52 | $ 19.10 |
Total Return A, B | 24.38% | 54.17% | (60.66)% | 70.26% | 40.32% |
Ratios to Average Net Assets D, F | | | | | |
Expenses before reductions | 1.81% | 1.87% | 1.84% | 1.86% | 2.12% |
Expenses net of fee waivers, if any | 1.81% | 1.85% | 1.84% | 1.85% | 1.85% |
Expenses net of all reductions | 1.76% | 1.78% | 1.79% | 1.79% | 1.74% |
Net investment income (loss) | .33% | .44% | .69% | .11% | .26% |
Supplemental Data | | | | | |
Net assets, end of period (000 omitted) | $ 104,417 | $ 86,959 | $ 47,300 | $ 119,952 | $ 41,369 |
Portfolio turnover rate E | 86% | 85% | 61% | 48% | 48% |
A Total returns would have been lower had certain expenses not been reduced during the periods shown.
B Total returns do not include the effect of the sales charges.
C Calculated based on average shares outstanding during the period.
D Fees and expenses of the underlying Fidelity Central Funds are not included in the Fund's expense ratio. The Fund indirectly bears its proportionate share of the expenses of any underlying Fidelity Central Funds.
E Amount does not include the portfolio activity of any underlying Fidelity Central Funds.
F Expense ratios reflect operating expenses of the class. Expenses before reductions do not reflect amounts reimbursed by the investment adviser or reductions from brokerage service arrangements or reductions from other expense offset arrangements and do not represent the amount paid by the class during periods when reimbursements or reductions occur. Expenses net of fee waivers reflect expenses after reimbursement by the investment adviser but prior to reductions from brokerage service arrangements or other expense offset arrangements. Expenses net of all reductions represent the net expenses paid by the class.
G Amount represents less than $.01 per share.
See accompanying notes which are an integral part of the financial statements.
Annual Report
Financial Highlights - Class B
Years ended October 31, | 2010 | 2009 | 2008 | 2007 | 2006 |
Selected Per-Share Data | | | | | |
Net asset value, beginning of period | $ 18.80 | $ 12.26 | $ 32.03 | $ 18.91 | $ 13.58 |
Income from Investment Operations | | | | | |
Net investment income (loss) C | (.03) | (.01) | .04 | (.09) | (.04) |
Net realized and unrealized gain (loss) | 4.49 | 6.55 | (19.13) | 13.20 | 5.40 |
Total from investment operations | 4.46 | 6.54 | (19.09) | 13.11 | 5.36 |
Distributions from net investment income | - | - | - | - | (.05) |
Distributions from net realized gain | (.12) | - | (.70) | - | - |
Total distributions | (.12) | - | (.70) | - | (.05) |
Redemption fees added to paid in capital C | - G | - G | .02 | .01 | .02 |
Net asset value, end of period | $ 23.14 | $ 18.80 | $ 12.26 | $ 32.03 | $ 18.91 |
Total Return A, B | 23.77% | 53.34% | (60.83)% | 69.38% | 39.67% |
Ratios to Average Net Assets D, F | | | | | |
Expenses before reductions | 2.32% | 2.36% | 2.35% | 2.37% | 2.66% |
Expenses net of fee waivers, if any | 2.32% | 2.35% | 2.35% | 2.35% | 2.35% |
Expenses net of all reductions | 2.26% | 2.28% | 2.30% | 2.29% | 2.24% |
Net investment income (loss) | (.17)% | (.05)% | .18% | (.39)% | (.24)% |
Supplemental Data | | | | | |
Net assets, end of period (000 omitted) | $ 31,159 | $ 27,580 | $ 17,307 | $ 41,042 | $ 18,622 |
Portfolio turnover rate E | 86% | 85% | 61% | 48% | 48% |
A Total returns would have been lower had certain expenses not been reduced during the periods shown.
B Total returns do not include the effect of the contingent deferred sales charge.
C Calculated based on average shares outstanding during the period.
D Fees and expenses of the underlying Fidelity Central Funds are not included in the Fund's expense ratio. The Fund indirectly bears its proportionate share of the expenses of any underlying Fidelity Central Funds.
E Amount does not include the portfolio activity of any underlying Fidelity Central Funds.
F Expense ratios reflect operating expenses of the class. Expenses before reductions do not reflect amounts reimbursed by the investment adviser or reductions from brokerage service arrangements or reductions from other expense offset arrangements and do not represent the amount paid by the class during periods when reimbursements or reductions occur. Expenses net of fee waivers reflect expenses after reimbursement by the investment adviser but prior to reductions from brokerage service arrangements or other expense offset arrangements. Expenses net of all reductions represent the net expenses paid by the class.
G Amount represents less than $.01 per share.
See accompanying notes which are an integral part of the financial statements.
Annual Report
Financial Highlights - Class C
Years ended October 31, | 2010 | 2009 | 2008 | 2007 | 2006 |
Selected Per-Share Data | | | | | |
Net asset value, beginning of period | $ 18.80 | $ 12.26 | $ 32.04 | $ 18.91 | $ 13.59 |
Income from Investment Operations | | | | | |
Net investment income (loss) C | (.03) | (.01) | .05 | (.09) | (.04) |
Net realized and unrealized gain (loss) | 4.49 | 6.54 | (19.15) | 13.21 | 5.39 |
Total from investment operations | 4.46 | 6.53 | (19.10) | 13.12 | 5.35 |
Distributions from net investment income | - | - | - | - | (.05) |
Distributions from net realized gain | (.13) | - | (.70) | - | - |
Total distributions | (.13) | - | (.70) | - | (.05) |
Redemption fees added to paid in capital C | - G | .01 | .02 | .01 | .02 |
Net asset value, end of period | $ 23.13 | $ 18.80 | $ 12.26 | $ 32.04 | $ 18.91 |
Total Return A, B | 23.80% | 53.34% | (60.84)% | 69.43% | 39.59% |
Ratios to Average Net Assets D, F | | | | | |
Expenses before reductions | 2.30% | 2.34% | 2.34% | 2.34% | 2.58% |
Expenses net of fee waivers, if any | 2.30% | 2.34% | 2.34% | 2.34% | 2.35% |
Expenses net of all reductions | 2.24% | 2.28% | 2.29% | 2.29% | 2.24% |
Net investment income (loss) | (.15)% | (.05)% | .19% | (.39)% | (.24)% |
Supplemental Data | | | | | |
Net assets, end of period (000 omitted) | $ 106,711 | $ 83,939 | $ 44,878 | $ 104,885 | $ 42,805 |
Portfolio turnover rate E | 86% | 85% | 61% | 48% | 48% |
A Total returns would have been lower had certain expenses not been reduced during the periods shown.
B Total returns do not include the effect of the contingent deferred sales charge.
C Calculated based on average shares outstanding during the period.
D Fees and expenses of the underlying Fidelity Central Funds are not included in the Fund's expense ratio. The Fund indirectly bears its proportionate share of the expenses of any underlying Fidelity Central Funds.
E Amount does not include the portfolio activity of any underlying Fidelity Central Funds.
F Expense ratios reflect operating expenses of the class. Expenses before reductions do not reflect amounts reimbursed by the investment adviser or reductions from brokerage service arrangements or reductions from other expense offset arrangements and do not represent the amount paid by the class during periods when reimbursements or reductions occur. Expenses net of fee waivers reflect expenses after reimbursement by the investment adviser but prior to reductions from brokerage service arrangements or other expense offset arrangements. Expenses net of all reductions represent the net expenses paid by the class.
G Amount represents less than $.01 per share.
See accompanying notes which are an integral part of the financial statements.
Annual Report
Financial Highlights - Institutional Class
Years ended October 31, | 2010 | 2009 | 2008 | 2007 | 2006 |
Selected Per-Share Data | | | | | |
Net asset value, beginning of period | $ 19.29 | $ 12.71 | $ 33.02 | $ 19.34 | $ 13.80 |
Income from Investment Operations | | | | | |
Net investment income (loss) B | .20 | .15 | .31 | .18 | .14 |
Net realized and unrealized gain (loss) | 4.62 | 6.65 | (19.76) | 13.55 | 5.49 |
Total from investment operations | 4.82 | 6.80 | (19.45) | 13.73 | 5.63 |
Distributions from net investment income | (.11) | (.23) | (.09) | (.06) | (.11) |
Distributions from net realized gain | (.13) | - | (.79) | - | - |
Total distributions | (.24) | (.23) | (.88) | (.06) | (.11) |
Redemption fees added to paid in capital B | - F | .01 | .02 | .01 | .02 |
Net asset value, end of period | $ 23.87 | $ 19.29 | $ 12.71 | $ 33.02 | $ 19.34 |
Total Return A | 25.15% | 54.97% | (60.42)% | 71.23% | 41.11% |
Ratios to Average Net Assets C, E | | | | | |
Expenses before reductions | 1.22% | 1.30% | 1.27% | 1.25% | 1.47% |
Expenses net of fee waivers, if any | 1.22% | 1.30% | 1.27% | 1.25% | 1.35% |
Expenses net of all reductions | 1.17% | 1.23% | 1.21% | 1.19% | 1.24% |
Net investment income (loss) | .93% | .99% | 1.26% | .71% | .75% |
Supplemental Data | | | | | |
Net assets, end of period (000 omitted) | $ 184,789 | $ 106,713 | $ 47,557 | $ 52,011 | $ 9,172 |
Portfolio turnover rate D | 86% | 85% | 61% | 48% | 48% |
A Total returns would have been lower had certain expenses not been reduced during the periods shown.
B Calculated based on average shares outstanding during the period.
C Fees and expenses of the underlying Fidelity Central Funds are not included in the Fund's expense ratio. The Fund indirectly bears its proportionate share of the expenses of any underlying Fidelity Central Funds.
D Amount does not include the portfolio activity of any underlying Fidelity Central Funds.
E Expense ratios reflect operating expenses of the class. Expenses before reductions do not reflect amounts reimbursed by the investment adviser or reductions from brokerage service arrangements or reductions from other expense offset arrangements and do not represent the amount paid by the class during periods when reimbursements or reductions occur. Expenses net of fee waivers reflect expenses after reimbursement by the investment adviser but prior to reductions from brokerage service arrangements or other expense offset arrangements. Expenses net of all reductions represent the net expenses paid by the class.
F Amount represents less than $.01 per share.
See accompanying notes which are an integral part of the financial statements.
Annual Report
Notes to Financial Statements
For the period ended October 31, 2010
1. Organization.
Fidelity Advisor Emerging Markets Fund (the Fund) is a fund of Fidelity Advisor Series VIII (the Trust) and is authorized to issue an unlimited number of shares. The Trust is registered under the Investment Company Act of 1940, as amended (the 1940 Act), as an open-end management investment company organized as a Massachusetts business trust. The Fund offers Class A, Class T, Class C and Institutional Class shares, each of which has equal rights as to assets and voting privileges. Effective after the close of business on September 1, 2010, Class B shares were closed to new accounts and additional purchases by existing shareholders. Each class has exclusive voting rights with respect to matters that affect that class. Class B shares will automatically convert to Class A shares after a holding period of seven years from the initial date of purchase. Investment income, realized and unrealized capital gains and losses, the common expenses of the Fund, and certain fund-level expense reductions, if any, are allocated on a pro-rata basis to each class based on the relative net assets of each class to the total net assets of the Fund. Each class differs with respect to transfer agent and distribution and service plan fees incurred. Certain expense reductions also differ by class. The Fund's investments in emerging markets can be subject to social, economic, regulatory, and political uncertainties and can be extremely volatile.
2. Investments in Fidelity Central Funds.
The Fund may invest in Fidelity Central Funds, which are open-end investment companies available only to other investment companies and accounts managed by Fidelity Management & Research Company (FMR) and its affiliates. The Fund's Schedule of Investments lists each of the Fidelity Central Funds held as of period end, if any, as an investment of the Fund, but does not include the underlying holdings of each Fidelity Central Fund. As an Investing Fund, the Fund indirectly bears its proportionate share of the expenses of the underlying Fidelity Central Funds.
The Money Market Central Funds seek preservation of capital and current income and are managed by Fidelity Investments Money Management, Inc. (FIMM), an affiliate of FMR.
A complete unaudited list of holdings for each Fidelity Central Fund is available upon request or at the Securities and Exchange Commission (the SEC) web site at www.sec.gov. In addition, the financial statements of the Fidelity Central Funds, which are not covered by the Fund's Report of Independent Registered Public Accounting Firm, are available on the SEC web site or upon request.
Annual Report
Notes to Financial Statements - continued
3. Significant Accounting Policies.
The financial statements have been prepared in conformity with accounting principles generally accepted in the United States of America (GAAP), which require management to make certain estimates and assumptions at the date of the financial statements. Actual results could differ from those estimates. The following summarizes the significant accounting policies of the Fund:
Security Valuation. Investments are valued as of 4:00 p.m. Eastern time on the last calendar day of the period. The Fund uses independent pricing services approved by the Board of Trustees to value its investments. When current market prices or quotations are not readily available or reliable, valuations may be determined in good faith in accordance with procedures adopted by the Board of Trustees. Factors used in determining value may include market or security specific events. The frequency with which these procedures are used cannot be predicted and they may be utilized to a significant extent. The value used for net asset value (NAV) calculation under these procedures may differ from published prices for the same securities.
The Fund categorizes the inputs to valuation techniques used to value its investments into a disclosure hierarchy consisting of three levels as shown below.
Level 1 - quoted prices in active markets for identical investments
Level 2 - other significant observable inputs (including quoted prices for similar investments, interest rates, prepayment speeds, etc.)
Level 3 - unobservable inputs (including the fund's own assumptions based on the best information available)
Changes in valuation techniques may result in transfers in or out of an assigned level within the disclosure hierarchy. The aggregate value of investments by input level, as of October 31, 2010, as well as a roll forward of Level 3 securities, is included at the end of the Fund's Schedule of Investments. Valuation techniques used to value the Fund's investments by major category are as follows.
Equity securities, including restricted securities, for which market quotations are readily available, are valued at the last reported sale price or official closing price as reported by an independent pricing service on the primary market or exchange on which they are traded and are categorized as Level 1 in the hierarchy. In the event there were no sales during the day or closing prices are not available, securities are valued at the last quoted bid price or may be valued using the last available price and are generally categorized as Level 2 in the hierarchy. For foreign equity securities, when significant market or security specific events arise, comparisons to the valuation of American Depositary Receipts (ADRs), futures contracts, Exchange-traded funds (ETFs) and certain indexes as well as quoted prices for similar securities are used and are categorized as Level 2 in the
Annual Report
3. Significant Accounting Policies - continued
Security Valuation - continued
hierarchy in these circumstances. Utilizing these techniques may result in significant transfers between Level 1 and Level 2. For restricted equity securities and private placements where observable inputs are limited, assumptions about market activity and risk are used and are categorized as Level 3 in the hierarchy.
Investments in open-end mutual funds, including the Fidelity Central Funds, are valued at their closing net asset value each business day and are categorized as Level 1 in the hierarchy. Short-term securities with remaining maturities of sixty days or less for which quotations are not readily available are valued at amortized cost, which approximates fair value and are categorized as Level 2 in the hierarchy.
Foreign Currency. The Fund uses foreign currency contracts to facilitate transactions in foreign-denominated securities. Gains and losses from these transactions may arise from changes in the value of the foreign currency or if the counterparties do not perform under the contracts' terms.
Foreign-denominated assets, including investment securities, and liabilities are translated into U.S. dollars at the exchange rate at period end. Purchases and sales of investment securities, income and dividends received and expenses denominated in foreign currencies are translated into U.S. dollars at the exchange rate in effect on the transaction date.
The effects of exchange rate fluctuations on investments are included with the net realized and unrealized gain (loss) on investment securities. Other foreign currency transactions resulting in realized and unrealized gain (loss) are disclosed separately.
Investment Transactions and Income. For financial reporting purposes, the Fund's investment holdings and NAV include trades executed through the end of the last business day of the period. The NAV per share for processing shareholder transactions is calculated as of the close of business of the New York Stock Exchange (NYSE), normally 4:00 p.m. Eastern time and includes trades executed through the end of the prior business day. Gains and losses on securities sold are determined on the basis of identified cost. Dividend income is recorded on the ex-dividend date, except for certain dividends from foreign securities where the ex-dividend date may have passed, which are recorded as soon as the Fund is informed of the ex-dividend date. Non-cash dividends included in dividend income, if any, are recorded at the fair market value of the securities received. Distributions received on securities that represent a return of capital or capital gain are recorded as a reduction of cost of investments and/or as a realized gain. The Fund estimates the components of distributions received that may be considered return of capital distributions or capital gain distributions. Interest income and distributions from
Annual Report
Notes to Financial Statements - continued
3. Significant Accounting Policies - continued
Investment Transactions and Income - continued
the Fidelity Central Funds are accrued as earned. Interest income includes coupon interest and amortization of premium and accretion of discount on debt securities. Investment income is recorded net of foreign taxes withheld where recovery of such taxes is uncertain.
Expenses. Most expenses of the Trust can be directly attributed to a fund. Expenses which cannot be directly attributed are apportioned amongst each fund in the Trust. Expense estimates are accrued in the period to which they relate and adjustments are made when actual amounts are known.
Income Tax Information and Distributions to Shareholders. Each year the Fund intends to qualify as a regulated investment company, including distributing substantially all of its taxable income and realized gains under Subchapter M of the Internal Revenue Code and filing its U.S. federal tax return. As a result, no provision for income taxes is required. As of October 31, 2010, the Fund did not have any unrecognized tax benefits in the accompanying financial statements. A fund's federal tax return is subject to examination by the Internal Revenue Service (IRS) for a period of three years. Foreign taxes are provided for based on the Fund's understanding of the tax rules and rates that exist in the foreign markets in which it invests. The Fund is subject to a tax imposed on short term capital gains on securities of certain issuers domiciled in India. The Fund records an estimated deferred tax liability included in Other payables and accrued expenses in the accompanying Statement of Assets & Liabilities for net unrealized gains on these securities in an amount that would be payable if the securities were disposed of at period end.
Distributions are declared and recorded on the ex-dividend date. Income dividends and capital gain distributions are declared separately for each class. Income and capital gain distributions are determined in accordance with income tax regulations, which may differ from GAAP.
Capital accounts within the financial statements are adjusted for permanent book-tax differences. These adjustments have no impact on net assets or the results of operations. Temporary book-tax differences will reverse in a subsequent period.
Book-tax differences are primarily due to the short-term gain distributions from the Fidelity Central Funds, foreign currency transactions, passive foreign investment companies (PFIC), capital loss carryforwards, and losses deferred due to wash sales.
Annual Report
3. Significant Accounting Policies - continued
Income Tax Information and Distributions to Shareholders - continued
The federal tax cost of investment securities and unrealized appreciation (depreciation) as of period end were as follows:
Gross unrealized appreciation | $ 164,161,308 |
Gross unrealized depreciation | (14,042,469) |
Net unrealized appreciation (depreciation) | $ 150,118,839 |
| |
Tax Cost | $ 582,574,029 |
The tax-based components of distributable earnings as of period end were as follows:
Undistributed ordinary income | $ 6,152,884 |
Capital loss carryforward | $ (120,287,627) |
Net unrealized appreciation (depreciation) | $ 150,119,484 |
The tax character of distributions paid was as follows:
| October 31, 2010 | October 31, 2009 |
Ordinary Income | $ 5,294,607 | $ 2,545,671 |
Short-Term Trading (Redemption) Fees. Shares held by investors in the Fund less than 90 days are subject to a redemption fee equal to 1.50% of the net asset value of shares redeemed. All redemption fees, which reduce the proceeds of the shareholder redemption, are retained by the Fund and accounted for as an addition to paid in capital.
4. Operating Policies.
Restricted Securities. The Fund may invest in securities that are subject to legal or contractual restrictions on resale. These securities generally may be resold in transactions exempt from registration or to the public if the securities are registered. Disposal of these securities may involve time-consuming negotiations and expense, and prompt sale at an acceptable price may be difficult. Information regarding restricted securities is included at the end of the Fund's Schedule of Investments.
5. Purchases and Sales of Investments.
Purchases and sales of securities, other than short-term securities, aggregated $560,949,603 and $507,918,970, respectively.
Annual Report
Notes to Financial Statements - continued
6. Fees and Other Transactions with Affiliates.
Management Fee. FMR and its affiliates provide the Fund with investment management related services for which the Fund pays a monthly management fee. The management fee is the sum of an individual fund fee rate that is based on an annual rate of .55% of the Fund's average net assets and a group fee rate that averaged .26% during the period. The group fee rate is based upon the average net assets of all the mutual funds advised by FMR. The group fee rate decreases as assets under management increase and increases as assets under management decrease. For the period, the total annual management fee rate was .81% of the Fund's average net assets.
Distribution and Service Plan Fees. In accordance with Rule 12b-1 of the 1940 Act, the Fund has adopted separate Distribution and Service Plans for each class of shares. Certain classes pay Fidelity Distributors Corporation (FDC), an affiliate of FMR, separate Distribution and Service Fees, each of which is based on an annual percentage of each class' average net assets. In addition, FDC may pay financial intermediaries for selling shares of the Fund and providing shareholder support services. For the period, the Distribution and Service Fee rates, total fees and amounts retained by FDC were as follows:
| Distribution
Fee | Service
Fee | Total
Fees | Retained
by FDC |
Class A | 0% | .25% | $ 625,966 | $ 17,708 |
Class T | .25% | .25% | 478,780 | 0 |
Class B | .75% | .25% | 294,152 | 220,741 |
Class C | .75% | .25% | 955,697 | 180,969 |
| | | $ 2,354,595 | $ 419,418 |
Sales Load. FDC receives a front-end sales charge of up to 5.75% for selling Class A shares, and 3.50% for selling Class T shares, some of which is paid to financial intermediaries for selling shares of the Fund. FDC receives the proceeds of contingent deferred sales charges levied on Class A, Class T, Class B, and Class C redemptions. These charges depend on the holding period. The deferred sales charges range from 5% to 1% for Class B, 1% for Class C, 1.00% for certain purchases of Class A shares (1.00% to .50% prior to July 12, 2010) and .25% for certain purchases of Class T shares.
Annual Report
6. Fees and Other Transactions with Affiliates - continued
Sales Load - continued
For the period, sales charge amounts retained by FDC were as follows:
| Retained
by FDC |
Class A | $ 127,111 |
Class T | 25,998 |
Class B* | 69,434 |
Class C* | 13,380 |
| $ 235,923 |
* When Class B and Class C shares are initially sold, FDC pays commissions from its own resources to financial intermediaries through which the sales are made.
Transfer Agent Fees. Fidelity Investments Institutional Operations Company, Inc. (FIIOC), an affiliate of FMR, is the transfer, dividend disbursing and shareholder servicing agent for each class of the Fund. FIIOC receives account fees and asset-based fees that vary according to the account size and type of account of the shareholders of the respective classes of the Fund. FIIOC pays for typesetting, printing and mailing of shareholder reports, except proxy statements. For the period, transfer agent fees for each class were as follows:
| Amount | % of
Average
Net Assets |
Class A | $ 778,041 | .31 |
Class T | 303,226 | .32 |
Class B | 94,288 | .32 |
Class C | 288,716 | .30 |
Institutional Class | 317,641 | .22 |
| $ 1,781,912 | |
Accounting and Security Lending Fees. Fidelity Service Company, Inc. (FSC), an affiliate of FMR, maintains the Fund's accounting records. The accounting fee is based on the level of average net assets for the month. Under a separate contract, FSC administers the security lending program. The security lending fee is based on the number and duration of lending transactions.
Brokerage Commissions. The Fund placed a portion of its portfolio transactions with brokerage firms which are affiliates of the investment adviser. The commissions paid to these affiliated firms were $194 for the period.
Annual Report
Notes to Financial Statements - continued
7. Committed Line of Credit.
The Fund participates with other funds managed by FMR or an affiliate in a $3.75 billion credit facility (the "line of credit") to be utilized for temporary or emergency purposes to fund shareholder redemptions or for other short-term liquidity purposes. The Fund has agreed to pay commitment fees on its pro-rata portion of the line of credit, which amounted to $2,359 and is reflected in Miscellaneous expenses on the Statement of Operations. During the period, there were no borrowings on this line of credit.
8. Security Lending.
The Fund lends portfolio securities through a lending agent from time to time in order to earn additional income. The lending agent may loan securities to certain qualified borrowers, including Fidelity Capital Markets (FCM), a broker-dealer affiliated with the Fund. On the settlement date of the loan, the Fund receives collateral (in the form of U.S. Treasury obligations, letters of credit and/or cash) against the loaned securities and maintains collateral in an amount not less than 100% of the market value of the loaned securities during the period of the loan. The market value of the loaned securities is determined at the close of business of the Fund and any additional required collateral is delivered to the Fund on the next business day. If the borrower defaults on its obligation to return the securities loaned because of insolvency or other reasons, a fund could experience delays and costs in recovering the securities loaned or in gaining access to the collateral. Any cash collateral received is invested in the Fidelity Securities Lending Cash Central Fund. The value of loaned securities and cash collateral at period end are disclosed on the Fund's Statement of Assets and Liabilities. Security lending income represents the income earned on investing cash collateral, less rebates paid to borrowers and lending agent fees associated with the loan, plus any premium payments received for lending certain types of securities. Security lending income is presented in the Statement of Operations as a component of income from Fidelity Central Funds. Total security lending income during the period amounted to $119,973. During the period, there were no securities loaned to FCM.
9. Expense Reductions.
Many of the brokers with whom FMR places trades on behalf of the Fund provided services to the Fund in addition to trade execution. These services included payments of certain expenses on behalf of the Fund totaling $332,640 for the period.
Annual Report
10. Distributions to Shareholders.
Distributions to shareholders of each class were as follows:
Years ended October 31, | 2010 | 2009 |
From net investment income | | |
Class A | $ 823,941 | $ 1,384,374 |
Class T | 194,714 | 245,641 |
Institutional Class | 595,478 | 915,656 |
Total | $ 1,614,133 | $ 2,545,671 |
From net realized gain | | |
Class A | $ 1,543,065 | $ - |
Class T | 631,634 | - |
Class B | 170,009 | - |
Class C | 588,609 | - |
Institutional Class | 747,157 | - |
Total | $ 3,680,474 | $ - |
11. Share Transactions.
Transactions for each class of shares were as follows:
| Shares | Dollars |
Years ended October 31, | 2010 | 2009 | 2010 | 2009 |
Class A | | | | |
Shares sold | 4,968,910 | 5,278,453 | $ 104,602,234 | $ 79,857,327 |
Reinvestment of distributions | 108,006 | 121,361 | 2,258,405 | 1,308,274 |
Shares redeemed | (4,235,043) | (3,903,351) | (87,859,971) | (54,239,793) |
Net increase (decrease) | 841,873 | 1,496,463 | $ 19,000,668 | $ 26,925,808 |
Class T | | | | |
Shares sold | 1,526,646 | 2,313,290 | $ 32,084,382 | $ 33,479,708 |
Reinvestment of distributions | 38,153 | 21,833 | 796,254 | 235,144 |
Shares redeemed | (1,685,925) | (1,578,742) | (34,798,827) | (23,073,162) |
Net increase (decrease) | (121,126) | 756,381 | $ (1,918,191) | $ 10,641,690 |
Class B | | | | |
Shares sold | 284,855 | 451,532 | $ 5,842,113 | $ 6,737,050 |
Reinvestment of distributions | 7,131 | - | 146,541 | - |
Shares redeemed | (412,420) | (396,698) | (8,414,002) | (5,309,719) |
Net increase (decrease) | (120,434) | 54,834 | $ (2,425,348) | $ 1,427,331 |
Class C | | | | |
Shares sold | 1,416,872 | 2,096,953 | $ 29,287,955 | $ 32,821,201 |
Reinvestment of distributions | 24,169 | - | 496,184 | - |
Shares redeemed | (1,291,795) | (1,293,905) | (26,390,410) | (16,362,891) |
Net increase (decrease) | 149,246 | 803,048 | $ 3,393,729 | $ 16,458,310 |
Annual Report
Notes to Financial Statements - continued
11. Share Transactions - continued
| Shares | Dollars |
Years ended October 31, | 2010 | 2009 | 2010 | 2009 |
Institutional Class | | | | |
Shares sold | 4,771,525 | 3,535,627 | $ 100,570,593 | $ 48,287,342 |
Reinvestment of distributions | 25,873 | 38,684 | 542,822 | 418,179 |
Shares redeemed | (2,586,784) | (1,784,638) | (54,324,513) | (25,294,462) |
Net increase (decrease) | 2,210,614 | 1,789,673 | $ 46,788,902 | $ 23,411,059 |
12. Other.
The Fund's organizational documents provide former and current trustees and officers with a limited indemnification against liabilities arising in connection with the performance of their duties to the Fund. In the normal course of business, the Fund may also enter into contracts that provide general indemnifications. The Fund's maximum exposure under these arrangements is unknown as this would be dependent on future claims that may be made against the Fund. The risk of material loss from such claims is considered remote.
Annual Report
To the Trustees of Fidelity Advisor Series VIII and Shareholders of Fidelity Advisor Emerging Markets Fund:
We have audited the accompanying statement of assets and liabilities of Fidelity Advisor Emerging Markets Fund (the Fund), a fund of Fidelity Advisor Series VIII, including the schedule of investments, as of October 31, 2010, and the related statement of operations for the year then ended, the statement of changes in net assets for each of the two years in the period then ended, and the financial highlights for each of the five years in the period then ended. These financial statements and financial highlights are the responsibility of the Fund's management. Our responsibility is to express an opinion on these financial statements and financial highlights based on our audits.
We conducted our audits in accordance with standards of the Public Company Accounting Oversight Board (United States). Those standards require that we plan and perform the audit to obtain reasonable assurance about whether the financial statements and financial highlights are free of material misstatement. The Fund is not required to have, nor were we engaged to perform, an audit of its internal control over financial reporting. Our audits included consideration of internal control over financial reporting as a basis for designing audit procedures that are appropriate in the circumstances, but not for the purpose of expressing an opinion on the effectiveness of the Fund's internal control over financial reporting. Accordingly, we express no such opinion. An audit also includes examining, on a test basis, evidence supporting the amounts and disclosures in the financial statements, assessing the accounting principles used and significant estimates made by management, as well as evaluating the overall financial statement presentation. Our procedures included confirmation of securities owned as of October 31, 2010, by correspondence with the custodians and brokers; where replies were not received from brokers, we performed other auditing procedures. We believe that our audits provide a reasonable basis for our opinion.
In our opinion, the financial statements and financial highlights referred to above present fairly, in all material respects, the financial position of Fidelity Advisor Emerging Markets Fund as of October 31, 2010, the results of its operations for the year then ended, the changes in its net assets for each of the two years in the period then ended, and the financial highlights for each of the five years in the period then ended, in conformity with accounting principles generally accepted in the United States of America.
/s/ Deloitte & Touche LLP
DELOITTE & TOUCHE LLP
Boston, Massachusetts
December 14, 2010
Annual Report
The Trustees, Member of the Advisory Board, and executive officers of the trust and fund, as applicable, are listed below. The Board of Trustees governs the fund and is responsible for protecting the interests of shareholders. The Trustees are experienced executives who meet periodically throughout the year to oversee the fund's activities, review contractual arrangements with companies that provide services to the fund, oversee management of the risks associated with such activities and contractual arrangements, and review the fund's performance. Except for James C. Curvey, each of the Trustees oversees 221 funds advised by FMR or an affiliate. Mr. Curvey oversees 410 funds advised by FMR or an affiliate.
The Trustees hold office without limit in time except that (a) any Trustee may resign; (b) any Trustee may be removed by written instrument, signed by at least two-thirds of the number of Trustees prior to such removal; (c) any Trustee who requests to be retired or who has become incapacitated by illness or injury may be retired by written instrument signed by a majority of the other Trustees; and (d) any Trustee may be removed at any special meeting of shareholders by a two-thirds vote of the outstanding voting securities of the trust. Each Trustee who is not an interested person (as defined in the 1940 Act) (Independent Trustee), shall retire not later than the last day of the calendar year in which his or her 72nd birthday occurs. The Independent Trustees may waive this mandatory retirement age policy with respect to individual Trustees. The executive officers and Advisory Board Member hold office without limit in time, except that any officer and Advisory Board Member may resign or may be removed by a vote of a majority of the Trustees at any regular meeting or any special meeting of the Trustees. Except as indicated, each individual has held the office shown or other offices in the same company for the past five years.
Experience, Skills, Attributes, and Qualifications of the Fund's Trustees. The Governance and Nominating Committee has adopted a statement of policy that describes the experience, qualifications, attributes, and skills that are necessary and desirable for potential Independent Trustee candidates (Statement of Policy). The Board believes that each Trustee satisfied at the time he or she was initially elected or appointed a Trustee, and continues to satisfy, the standards contemplated by the Statement of Policy. The Governance and Nominating Committee also engages professional search firms to help identify potential Independent Trustee candidates who have the experience, qualifications, attributes, and skills consistent with the Statement of Policy. From time to time, additional criteria based on the composition and skills of the current Independent Trustees, as well as experience or skills that may be appropriate in light of future changes to board composition, business conditions, and regulatory or other developments, have also been considered by the professional search firms and the Governance and Nominating Committee. In addition, the Board takes into account the Trustees' commitment and participation in Board and committee meetings, as well as their leadership of standing and ad hoc committees throughout their tenure.
In determining that a particular Trustee was and continues to be qualified to serve as a Trustee, the Board has considered a variety of criteria, none of which, in isolation, was controlling. The Board believes that, collectively, the Trustees have balanced and diverse experience, qualifications, attributes, and skills, which allow the Board to operate effectively in governing the fund and protecting the interests of shareholders. Information about the specific experience, skills, attributes, and qualifications of each Trustee, which in each case led to the Board's conclusion that the Trustee should serve (or continue to serve) as a trustee of the fund, is provided below.
Annual Report
Board Structure and Oversight Function. Edward C. Johnson 3d is an interested person (as defined in the 1940 Act) and currently serves as Chairman. The Trustees have determined that an interested Chairman is appropriate and benefits shareholders because an interested Chairman has a personal and professional stake in the quality and continuity of services provided to the fund. Independent Trustees exercise their informed business judgment to appoint an individual of their choosing to serve as Chairman, regardless of whether the Trustee happens to be independent or a member of management. The Independent Trustees have determined that they can act independently and effectively without having an Independent Trustee serve as Chairman and that a key structural component for assuring that they are in a position to do so is for the Independent Trustees to constitute a substantial majority for the Board. The Independent Trustees also regularly meet in executive session. Ned C. Lautenbach serves as Chairman of the Independent Trustees and as such (i) acts as a liaison between the Independent Trustees and management with respect to matters important to the Independent Trustees and (ii) with management prepares agendas for Board meetings.
Fidelity funds are overseen by different Boards of Trustees. The fund's Board oversees Fidelity's equity and high income funds and another Board oversees Fidelity's investment-grade bond, money market, and asset allocation funds. The asset allocation funds may invest in Fidelity funds overseen by the fund's Board. The use of separate Boards, each with its own committee structure, allows the Trustees of each group of Fidelity funds to focus on the unique issues of the funds they oversee, including common research, investment, and operational issues. On occasion, the separate Boards establish joint committees to address issues of overlapping consequences for the Fidelity funds overseen by each Board.
The Trustees operate using a system of committees to facilitate the timely and efficient consideration of all matters of importance to the Trustees, the fund, and fund shareholders and to facilitate compliance with legal and regulatory requirements and oversight of the fund's activities and associated risks. The Board, acting through its committees, has charged FMR and its affiliates with (i) identifying events or circumstances the occurrence of which could have demonstrably adverse effects on the fund's business and/or reputation; (ii) implementing processes and controls to lessen the possibility that such events or circumstances occur or to mitigate the effects of such events or circumstances if they do occur; and (iii) creating and maintaining a system designed to evaluate continuously business and market conditions in order to facilitate the identification and implementation processes described in (i) and (ii) above. Because the day-to-day operations and activities of the fund are carried out by or through FMR, its affiliates and other service providers, the fund's exposure to risks is mitigated but not eliminated by the processes overseen by the Trustees. While each of the Board's committees has responsibility for overseeing different aspects of the fund's activities, oversight is exercised primarily through the Operations, Audit, and Compliance Committees. Appropriate personnel, including but not limited to the fund's Chief Compliance Officer (CCO), FMR's internal auditor, the independent accountants, the fund's Treasurer and portfolio management personnel, make periodic reports to the Board's committees, as appropriate. The responsibilities of each committee, including their oversight responsibilities, are described further under "Standing Committees of the Fund's Trustees."
Annual Report
Trustees and Officers - continued
The fund's Statement of Additional Information (SAI) includes more information about the Trustees. To request a free copy, call Fidelity at 1-877-208-0098.
Interested Trustees*:
Correspondence intended for each Trustee who is an interested person may be sent to Fidelity Investments, 82 Devonshire Street, Boston, Massachusetts 02109.
Name, Age; Principal Occupations and Other Relevant Experience+ |
Edward C. Johnson 3d (80) |
| Year of Election or Appointment: 1983 Mr. Johnson is Trustee and Chairman of the Board of Trustees of certain Trusts. Mr. Johnson serves as Chief Executive Officer, Chairman, and a Director of FMR LLC; Chairman and a Director of FMR; Chairman and a Director of Fidelity Research & Analysis Company (FRAC); Chairman and a Director of Fidelity Investments Money Management, Inc.; and Chairman and a Director of FMR Co., Inc. In addition, Mr. Johnson serves as Chairman and Director of FIL Limited. Previously, Mr. Johnson served as President of FMR LLC (2006-2007). |
James C. Curvey (75) |
| Year of Election or Appointment: 2007 Mr. Curvey also serves as Trustee (2007-present) of other investment companies advised by FMR. Mr. Curvey is a Director of Fidelity Investments Money Management, Inc. (2009-present), Director of Fidelity Research & Analysis Co. (2009-present) and Director of FMR and FMR Co., Inc. (2007-present). Mr. Curvey is also Vice Chairman (2007-present) and Director of FMR LLC. In addition, Mr. Curvey serves as an Overseer for the Boston Symphony Orchestra and a member of the Trustees of Villanova University. Previously, Mr. Curvey was the Vice Chairman (2006-2007) and Director (2000-2007) of FMR Corp. |
* Trustees have been determined to be "Interested Trustees" by virtue of, among other things, their affiliation with the trust or various entities under common control with FMR.
Annual Report
+ The information above includes each Trustee's principal occupation during the last five years and other information relating to the experience, attributes, and skills relevant to each Trustee's qualifications to serve as a Trustee, which led to the conclusion that each Trustee should serve as a Trustee for the fund.
Independent Trustees:
Correspondence intended for each Independent Trustee (that is, the Trustees other than the Interested Trustees) may be sent to Fidelity Investments, P.O. Box 55235, Boston, Massachusetts 02205-5235.
Name, Age; Principal Occupations and Other Relevant Experience+ |
Dennis J. Dirks (62) |
| Year of Election or Appointment: 2005 Prior to his retirement in May 2003, Mr. Dirks was Chief Operating Officer and a member of the Board of The Depository Trust & Clearing Corporation (DTCC). He also served as President, Chief Operating Officer, and Board member of The Depository Trust Company (DTC) and President and Board member of the National Securities Clearing Corporation (NSCC). In addition, Mr. Dirks served as Chief Executive Officer and Board member of the Government Securities Clearing Corporation, Chief Executive Officer and Board member of the Mortgage-Backed Securities Clearing Corporation, as a Trustee and a member of the Finance Committee of Manhattan College (2005-2008), and as a Trustee and a member of the Finance Committee of AHRC of Nassau County (2006-2008). Mr. Dirks is a member of the Independent Directors Council (IDC) Governing Council (2010-Present) and Board of Directors for The Brookville Center for Children's Services, Inc. (2009-present). |
Alan J. Lacy (57) |
| Year of Election or Appointment: 2008 Mr. Lacy serves as Senior Adviser (2007-present) of Oak Hill Capital Partners, L.P. (private equity). Mr. Lacy also served as Chief Executive Officer (2000-2005) and Vice Chairman (2005-2006) of Sears Holdings Corporation and Sears, Roebuck and Co. (retail). In addition, Mr. Lacy serves as a member of the Board of Directors of The Western Union Company (global money transfer, 2006-present) and Bristol-Myers Squibb Company (global pharmaceuticals, 2007-present). Mr. Lacy is Chairman (2008-present) and a member (2006-present) of the Board of Trustees of The National Parks Conservation Association. |
Ned C. Lautenbach (66) |
| Year of Election or Appointment: 2000 Mr. Lautenbach is Chairman of the Independent Trustees of the Equity and High Income Funds (2006-present). Mr. Lautenbach currently serves as the Lead Director of the Eaton Corporation Board of Directors (diversified industrial, 1997-present). Mr. Lautenbach is also a member of the Board of Directors of the Philharmonic Center for the Arts in Naples, Florida (1999-present); a member of the Board of Trustees of Fairfield University (2005-present); and a member of the Council on Foreign Relations (1994-present). Previously, Mr. Lautenbach was a Partner/Advisory Partner at Clayton, Dubilier & Rice, Inc. (private equity investment, 1998-2010), as well as a Director of Sony Corporation (2006-2007). |
Joseph Mauriello (66) |
| Year of Election or Appointment: 2008 Prior to his retirement in January 2006, Mr. Mauriello served in numerous senior management positions including Deputy Chairman and Chief Operating Officer (2004-2005), and Vice Chairman of Financial Services (2002-2004) of KPMG LLP US (professional services, 1965-2005). Mr. Mauriello currently serves as a member of the Board of Directors of XL Group plc. (global insurance and re-insurance, 2006-present) and of Arcadia Resources Inc. (health care services and products, 2007-present). Previously, Mr. Mauriello served as a Director of the Hamilton Funds of the Bank of New York (2006-2007). |
Cornelia M. Small (66) |
| Year of Election or Appointment: 2005 Ms. Small is a member of the Board of Directors of the Teagle Foundation (2009-present). Ms. Small is also a member of the Investment Committee, and Chair (2008-present) and a member of the Board of Trustees of Smith College. In addition, Ms. Small serves on the Investment Committee of the Berkshire Taconic Community Foundation (2008-present). Previously, Ms. Small served as Chairperson of the Investment Committee (2002-2008) of Smith College. In addition, Ms. Small served as Chief Investment Officer, Director of Global Equity Investments, and a member of the Board of Directors of Scudder, Stevens & Clark and Scudder Kemper Investments. |
William S. Stavropoulos (71) |
| Year of Election or Appointment: 2001 Mr. Stavropoulos is Vice Chairman of the Independent Trustees of the Equity and High Income Funds (2006-present). Mr. Stavropoulos serves as President and Founder of the Michigan Baseball Foundation, the Great Lakes Loons (2007-present). Mr. Stavropoulos is Chairman Emeritus of the Board of Directors of The Dow Chemical Company, where he previously served in numerous senior management positions, including President, CEO (1995-2000; 2002-2004), Chairman of the Executive Committee (2000-2006), and as a member of the Board of Directors (1990-2006). Currently, Mr. Stavropoulos is Chairman of Univar (global distributor of commodity and specialty chemicals, 2010-present), a Director of Teradata Corporation (data warehousing and technology solutions, 2008-present), Chemical Financial Corporation, Maersk Inc. (industrial conglomerate), Tyco International, Inc. (multinational manufacturing and services, 2007-present), and a member of the Advisory Board for Metalmark Capital (private equity investment, 2005-present). Mr. Stavropoulos is a special advisor to Clayton, Dubilier & Rice, Inc. (private equity investment). In addition, Mr. Stavropoulos is a member of the University of Notre Dame Advisory Council for the College of Science. |
David M. Thomas (61) |
| Year of Election or Appointment: 2008 Previously, Mr. Thomas served as Executive Chairman (2005-2006) and Chairman and Chief Executive Officer (2000-2005) of IMS Health, Inc. (pharmaceutical and healthcare information solutions). In addition, Mr. Thomas serves as a member of the Board of Directors of Fortune Brands, Inc. (consumer products), and Interpublic Group of Companies, Inc. (marketing communication, 2004-present). |
Michael E. Wiley (60) |
| Year of Election or Appointment: 2008 Mr. Wiley also serves as a Director of Asia Pacific Exploration Consolidated (international oil and gas exploration and production, 2008-present). Mr. Wiley serves as a Director of Tesoro Corporation (independent oil refiner and marketer, 2005-present), and a Director of Bill Barrett Corporation (exploration and production, 2005-present). In addition, Mr. Wiley also serves as a Director of Post Oak Bank (privately-held bank, 2004-present). Previously, Mr. Wiley served as a member of the Board of Trustees of the University of Tulsa (2000-2006; 2007-2010), as a Senior Energy Advisor of Katzenbach Partners, LLC (consulting, 2006-2007), as an Advisory Director of Riverstone Holdings (private investment), Chairman, President, and CEO of Baker Hughes, Inc. (oilfield services, 2000-2004), and as Director of Spinnaker Exploration Company (exploration and production, 2001-2005). |
Annual Report
Trustees and Officers - continued
+ The information above includes each Trustee's principal occupation during the last five years and other information relating to the experience, attributes, and skills relevant to each Trustee's qualifications to serve as a Trustee, which led to the conclusion that each Trustee should serve as a Trustee for the fund.
Advisory Board Member and Executive Officers:
Correspondence intended for each executive officer and Peter S. Lynch may be sent to Fidelity Investments, 82 Devonshire Street, Boston, Massachusetts 02109.
Name, Age; Principal Occupation |
Peter S. Lynch (66) |
| Year of Election or Appointment: 2003 Member of the Advisory Board of Fidelity's Equity and High Income Funds. Mr. Lynch is Vice Chairman and a Director of FMR and FMR Co., Inc. In addition, Mr. Lynch serves as a Trustee of Boston College and as the Chairman of the Inner-City Scholarship Fund. Previously, Mr. Lynch served on the Special Olympics International Board of Directors (1997-2006). |
Kenneth B. Robins (41) |
| Year of Election or Appointment: 2008 President and Treasurer of Fidelity's Equity and High Income Funds. Mr. Robins also serves as President and Treasurer (2010-present) and Assistant Treasurer (2009-present) of other Fidelity funds and is an employee of Fidelity Investments (2004-present). Previously, Mr. Robins served as Deputy Treasurer of the Fidelity funds (2005-2008) and Treasurer and Chief Financial Officer of The North Carolina Capital Management Trust: Cash and Term Portfolios (2006-2008). |
Bruce T. Herring (45) |
| Year of Election or Appointment: 2006 Vice President of certain Equity Funds. Mr. Herring also serves as Chief Investment Officer and Director of Fidelity Management & Research (U.K.) Inc. (2010-present) and Group Chief Investments Officer of FMR. Previously, Mr. Herring served as Vice President (2005-2006) and Senior Vice President (2006-2007) of Fidelity Management & Research Company, Vice President of FMR Co., Inc. (2001-2007) and as a portfolio manager for Fidelity U.S. Equity Funds. |
Brian B. Hogan (46) |
| Year of Election or Appointment: 2009 Vice President of certain Equity Funds and Vice President of Sector Funds. Mr. Hogan also serves as President of FMR's Equity Division (2009-present). Previously, Mr. Hogan served as Senior Vice President, Equity Research of FMR (2006-2009) and as a portfolio manager. |
Scott C. Goebel (42) |
| Year of Election or Appointment: 2008 Secretary and Chief Legal Officer (CLO) of the Fidelity funds. Mr. Goebel also serves as Secretary and CLO of The North Carolina Capital Management Trust: Cash and Term Portfolio (2008-present); General Counsel, Secretary, and Senior Vice President of FMR (2008-present) and FMR Co., Inc. (2008-present); Deputy General Counsel of FMR LLC; Chief Legal Officer of Fidelity Management & Research (Hong Kong) Limited (2008-present) and Assistant Secretary of Fidelity Management & Research (Japan) Inc. (2008-present), Fidelity Investments Money Management, Inc. (2008-present), Fidelity Management & Research (U.K.) Inc. (2008-present), and Fidelity Research and Analysis Company (2008-present). Previously, Mr. Goebel served as Assistant Secretary of the Funds (2007-2008) and as Vice President and Secretary of Fidelity Distributors Corporation (FDC) (2005-2007). |
William C. Coffey (41) |
| Year of Election or Appointment: 2009 Assistant Secretary of Fidelity's Equity and High Income Funds. Mr. Coffey also serves as Senior Vice President and Deputy General Counsel of FMR LLC (2010-present), and is an employee of Fidelity Investments. Previously, Mr. Coffey served as Vice President and Associate General Counsel of FMR LLC (2005-2009). |
Holly C. Laurent (56) |
| Year of Election or Appointment: 2008 Anti-Money Laundering (AML) Officer of the Fidelity funds. Ms. Laurent also serves as AML Officer of The North Carolina Capital Management Trust: Cash and Term Portfolio (2008-present) and is an employee of Fidelity Investments. Previously, Ms. Laurent was Senior Vice President and Head of Legal for Fidelity Business Services India Pvt. Ltd. (2006-2008), and Senior Vice President, Deputy General Counsel and Group Head for FMR LLC (2005-2006). |
Christine Reynolds (52) |
| Year of Election or Appointment: 2008 Chief Financial Officer of the Fidelity funds. Ms. Reynolds became President of Fidelity Pricing and Cash Management Services (FPCMS) in August 2008. Ms. Reynolds served as Chief Operating Officer of FPCMS (2007-2008). Previously, Ms. Reynolds served as President, Treasurer, and Anti-Money Laundering officer of the Fidelity funds (2004-2007). |
Kenneth A. Rathgeber (63) |
| Year of Election or Appointment: 2004 Chief Compliance Officer of Fidelity's Equity and High Income Funds. Mr. Rathgeber is Chief Compliance Officer of Fidelity Management & Research (Hong Kong) Limited (2008-present), Fidelity Management & Research (Japan) Inc. (2008-present), FMR (2005-present), FMR Co., Inc. (2005-present), Fidelity Management & Research (U.K.) Inc. (2005-present), Fidelity Research & Analysis Company (2005-present), Fidelity Investments Money Management, Inc. (2005-present), Pyramis Global Advisors, LLC (2005-present), and Strategic Advisers, Inc. (2005-present). |
Jeffrey S. Christian (49) |
| Year of Election or Appointment: 2009 Deputy Treasurer of the Fidelity funds. Mr. Christian is an employee of Fidelity Investments. Previously, Mr. Christian served as Chief Financial Officer (2008-2009) of certain Fidelity funds and Senior Vice President of Fidelity Pricing and Cash Management Services (FPCMS) (2004-2009). |
Bryan A. Mehrmann (49) |
| Year of Election or Appointment: 2005 Deputy Treasurer of the Fidelity funds. Mr. Mehrmann is an employee of Fidelity Investments. |
Adrien E. Deberghes (43) |
| Year of Election or Appointment: 2008 Deputy Treasurer of Fidelity's Equity and High Income Funds. Mr. Deberghes also serves as Assistant Treasurer of other Fidelity funds (2010-present) and is an employee of Fidelity Investments (2008-present). Previously, Mr. Deberghes served as Senior Vice President of Mutual Fund Administration at State Street Corporation (2007-2008), Senior Director of Mutual Fund Administration at Investors Bank & Trust (2005-2007), and Director of Finance for Dunkin' Brands (2000-2005). |
Stephanie J. Dorsey (41) |
| Year of Election or Appointment: 2010 Assistant Treasurer of Fidelity's Equity and High Income Funds. Ms. Dorsey also serves as Deputy Treasurer of other Fidelity funds (2008-present) and is an employee of Fidelity Investments (2008-present). Previously, Ms. Dorsey served as Treasurer (2004-2008) of the JPMorgan Mutual Funds and Vice President (2004-2008) of JPMorgan Chase Bank. |
Name, Age; Principal Occupation |
John R. Hebble (52) |
| Year of Election or Appointment: 2009 Assistant Treasurer of Fidelity's Equity and High Income Funds. Mr. Hebble also serves as Treasurer and Chief Financial Officer of The North Carolina Capital Management Trust: Cash and Term Portfolio (2008-present), President and Treasurer of other Fidelity funds (2008-present) and is an employee of Fidelity Investments. |
Gary W. Ryan (52) |
| Year of Election or Appointment: 2005 Assistant Treasurer of the Fidelity funds. Mr. Ryan is an employee of Fidelity Investments. Previously, Mr. Ryan served as Vice President of Fund Reporting in Fidelity Pricing and Cash Management Services (FPCMS) (1999-2005). |
Jonathan Davis (42) |
| Year of Election or Appointment: 2010 Assistant Treasurer of the Fidelity funds. Mr. Davis is an employee of Fidelity Investments. Previously, Mr. Davis served as Vice President and Associate General Counsel of FMR LLC (2003-2010). |
Annual Report
The Board of Trustees of Advisor Emerging Markets voted to pay to shareholders of record at the opening of business on record date, the following distributions per share derived from capital gains realized from sales of portfolio securities, and dividends derived from net investment income:
| Pay Date | Record Date | Dividends | Capital Gains |
Class A | 12/06/10 | 12/03/10 | $.106 | $.125 |
Class T | 12/06/10 | 12/03/10 | $.032 | $.125 |
Class B | 12/06/10 | 12/03/10 | $.00 | $.025 |
Class C | 12/06/10 | 12/03/10 | $.00 | $.05 |
Class A designates 92%, Class T designates 100%, Class B designates 100%, and Class C designates 100% of the dividends distributed during the fiscal year as amounts which may be taken into account as a dividend for purposes of the maximum rate under section 1(h)(11) of the Internal Revenue Code.
The amounts per share which represent income derived from sources within, and taxes paid to, foreign countries or possessions of the United States are as follows:
| Pay Date | Income | Taxes |
Class A | 12/07/09 | $.166 | $.0282 |
Class T | 12/07/09 | $.144 | $.0282 |
Class B | 12/07/09 | $.102 | $.0282 |
Class C | 12/07/09 | $.112 | $.0282 |
The fund will notify shareholders in January 2011 of amounts for use in preparing 2010 income tax returns.
Annual Report
Board Approval of Investment Advisory Contracts and Management Fees
Fidelity Advisor Emerging Markets Fund
Each year, the Board of Trustees, including the Independent Trustees (together, the Board), votes on the renewal of the management contract and sub-advisory agreements (together, the Advisory Contracts) for the fund. The Board, assisted by the advice of fund counsel and Independent Trustees' counsel, requests and considers a broad range of information relevant to the renewal of the Advisory Contracts throughout the year.
The Board meets regularly and considers at each of its meetings factors that are relevant to its annual consideration of the renewal of the fund's Advisory Contracts, including the services and support provided to the fund and its shareholders. The Board has established various standing committees, each composed of Independent Trustees with varying backgrounds, to which the Board has assigned specific subject matter responsibilities in order to enhance effective decision-making by the Board. The Board, acting directly and through its Committees, requests and receives information concerning the annual consideration of the renewal of the fund's Advisory Contracts. The Board also meets as needed to consider matters specifically related to the Board's annual consideration of the renewal of Advisory Contracts. Members of the Board may also meet with trustees of other Fidelity funds through ad hoc joint committees to discuss certain matters relevant to the Fidelity funds.
At its July 2010 meeting, the Board of Trustees, including the Independent Trustees, unanimously determined to renew the fund's Advisory Contracts. In reaching its determination, the Board considered all factors it believed relevant, including (i) the nature, extent, and quality of the services to be provided to the fund and its shareholders (including the investment performance of the fund); (ii) the competitiveness of the fund's management fee and total expenses; (iii) the total costs of the services to be provided by and the profits to be realized by Fidelity from its relationship with the fund; (iv) the extent to which economies of scale would be realized as the fund grows; and (v) whether fee levels reflect these economies of scale, if any, for the benefit of fund shareholders.
In considering whether to renew the Advisory Contracts for the fund, the Board reached a determination, with the assistance of fund counsel and Independent Trustees' counsel and through the exercise of its business judgment, that the renewal of the Advisory Contracts is in the best interests of fund shareholders and that the compensation to be received by Fidelity under the management contract is fair and reasonable. The Board's decision to renew the Advisory Contracts was not based on any single factor noted above, but rather was based on a comprehensive consideration of all the information provided to the Board at its meetings throughout the year. The Board, in reaching its determination to renew the Advisory Contracts, is aware that shareholders in the fund have a broad range of investment choices available to them, including a wide choice among mutual funds offered by Fidelity's competitors, and that the fund's shareholders, with the opportunity to review and weigh the disclosure provided by the fund in its prospectus and other public disclosures, have chosen to invest in this fund, managed by Fidelity.
Annual Report
Board Approval of Investment Advisory Contracts and
Management Fees - continued
Nature, Extent, and Quality of Services Provided. The Board considered the staffing within the investment adviser, FMR, and the sub-advisers (together, the Investment Advisers), including the backgrounds of the fund's investment personnel and the fund's investment objective and discipline. The Independent Trustees also had discussions with senior management of Fidelity's investment operations and investment groups. The Board considered the structure of the portfolio manager compensation program and whether this structure provides appropriate incentives to act in the best interest of the fund.
Resources Dedicated to Investment Management and Support Services. The Board and the equity research subcommittee of the Board's Fund Oversight Committee reviewed the size, education, and experience of the Investment Advisers' investment staff, their use of technology, and the Investment Advisers' approach to recruiting, training, and retaining portfolio managers and other research, advisory, and management personnel. The Board noted that Fidelity's analysts have access to a variety of technological tools and market and securities data that enable them to perform both fundamental and quantitative analysis and to specialize in various disciplines. The Board considered Fidelity's extensive global research capabilities that enable the Investment Advisers to aggregate data from various sources in an effort to produce positive investment results. The Board also considered that Fidelity's portfolio managers and analysts have access to daily portfolio attribution that allows for monitoring of a fund's portfolio, as well as an electronic communication system that provides immediate real-time access to research concerning issuers and credit enhancers. The Board noted FMR's continued focus on strengthening the organization and discipline of equity portfolio management and research.
Shareholder and Administrative Services. The Board considered (i) the nature, extent, quality, and cost of advisory, administrative, and shareholder services performed by the Investment Advisers and their affiliates under the Advisory Contracts and under separate agreements covering transfer agency, pricing and bookkeeping, and securities lending services for the fund; (ii) the nature and extent of the investment adviser's supervision of third party service providers, principally custodians and subcustodians; and (iii) the resources devoted to, and the record of compliance with, the fund's compliance policies and procedures. The Board also reviewed the allocation of fund brokerage, including allocations to brokers affiliated with the Investment Advisers, the use of brokerage commissions to pay fund expenses, and the use of "soft" commission dollars to pay for research services.
The Board noted that the growth of fund assets over time across the complex allows Fidelity to reinvest in the development of services designed to enhance the value or convenience of the Fidelity funds as investment vehicles. These services include 24-hour access to account information and market information through phone representatives and over the Internet, and investor education materials and asset allocation tools.
Annual Report
Investment in a Large Fund Family. The Board considered the benefits to shareholders of investing in a Fidelity fund, including the benefits of investing in a fund that is part of a large family of funds offering a variety of investment disciplines and providing a large variety of mutual fund investor services. The Board noted that Fidelity had taken, or had made recommendations that resulted in the Fidelity funds taking, a number of actions over the previous year that benefited particular funds, including (i) dedicating additional resources to investment research and restructuring and broadening the focus of the investment research teams; (ii) bolstering the senior management team that oversees asset management; (iii) launching Class F of certain funds as a lower-fee class available to Freedom K and Freedom Index Funds; (iv) lowering the initial investment minimums and ongoing balance requirements for Real Estate High Income Fund; (v) eliminating subsequent purchase minimums for all funds and adding a waiver of the investment minimum requirement for new accounts opened with the proceeds of a systematic withdrawal plan; (vi) eliminating the withdrawal minimum and maximum limits for systematic withdrawals from Advisor funds; (vii) expanding sales load waivers on Class A shares for Destiny Planholders and expanding Institutional Class eligibility for Class O Destiny Planholders; and (viii) changing certain Class A and Class T sales charge structures to further align them with industry practices.
Investment Performance. The Board considered whether the fund has operated in accordance with its investment objective, as well as its record of compliance with its investment restrictions. It also reviewed the fund's absolute investment performance for each class, as well as the fund's relative investment performance for each class measured over multiple periods against (i) a broad-based securities market index, and (ii) a peer group of mutual funds deemed appropriate by Fidelity and reviewed by the Board. The following charts considered by the Board show, over the one-, three-, and five-year periods ended December 31, 2009, the cumulative total returns of Institutional Class (Class I) and Class C of the fund, the cumulative total returns of a broad-based securities market index ("benchmark"), and a range of cumulative total returns of a peer group of mutual funds identified by Morningstar, Inc. as having an investment style similar to that of the fund based on underlying portfolio holdings. The returns of Institutional Class (Class I) and Class C show the performance of the highest and lowest performing classes, respectively (based on five-year performance). The box within each chart shows the 25th percentile return (bottom of box) and the 75th percentile return (top of box) of the peer group. Returns shown above the box are in the first quartile and returns shown below the box are in the fourth quartile. The percentage beaten numbers noted below each chart correspond to the percentile box and represent the percentage of funds in the peer group whose performance was equal to or lower than that of the class indicated.
Annual Report
Board Approval of Investment Advisory Contracts and
Management Fees - continued
Fidelity Advisor Emerging Markets Fund
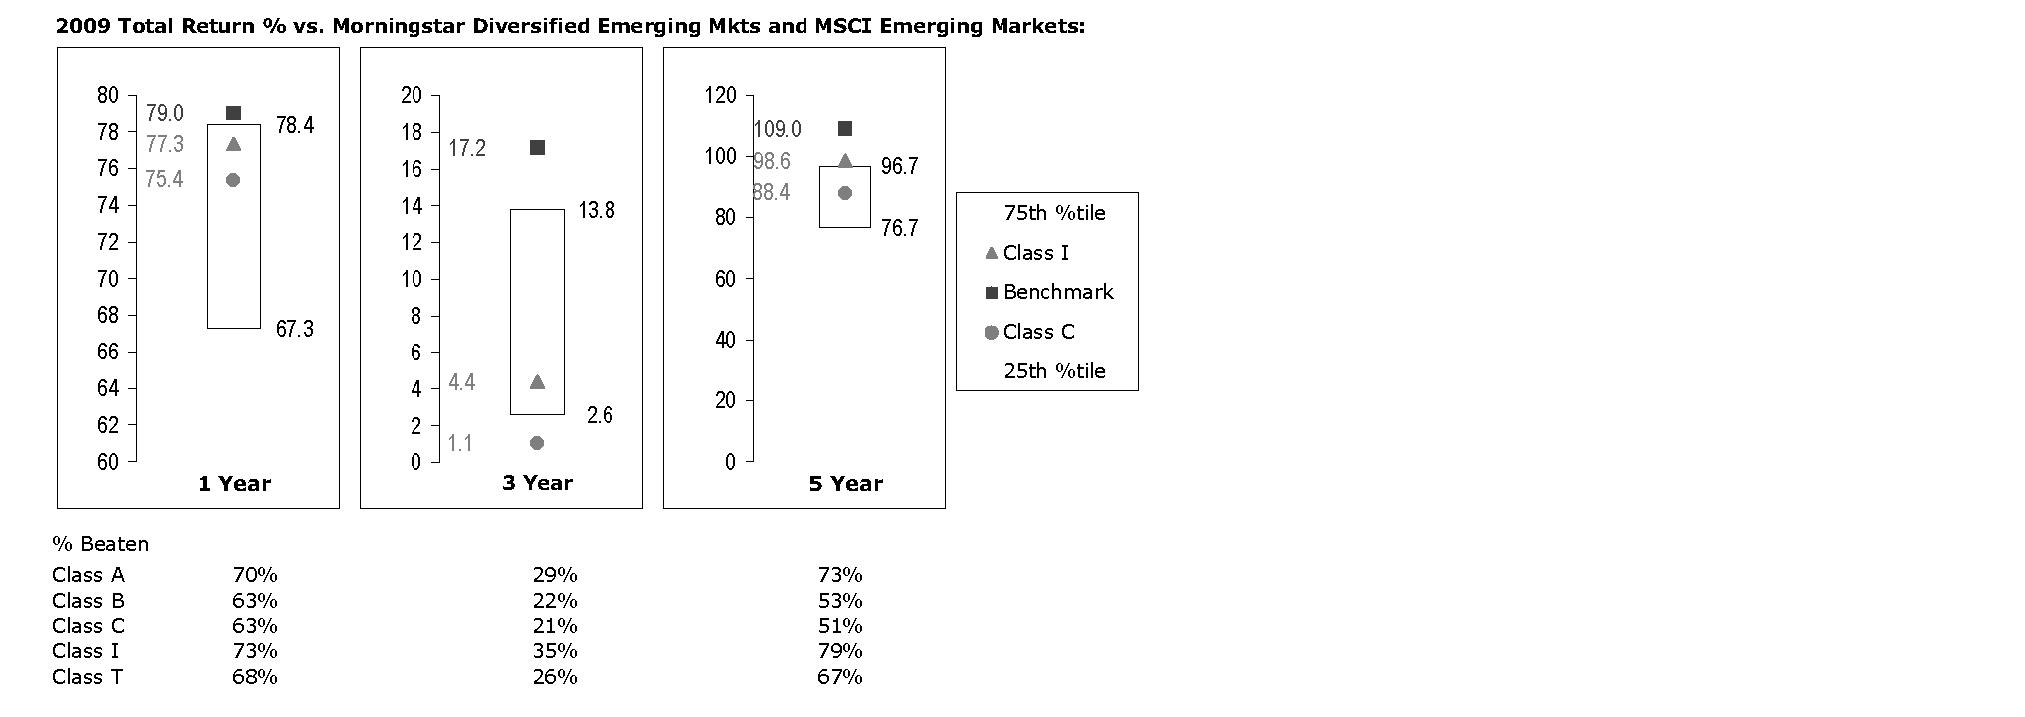
The Board reviewed the fund's relative investment performance against its peer group and noted that the performance of Institutional Class (Class I) of the fund was in the second quartile for the one-year period, the third quartile for the three-year period, and the first quartile for the five-year period. The Board also noted that the investment performance of the fund was lower than its benchmark for all the periods shown. The Board considered that the variations in performance among the fund's classes reflect the variations in class expenses, which result in lower performance for higher expense classes. The Board also reviewed the fund's performance since inception as well as performance in the current year.
Based on its review, and giving particular weight to the nature and quality of the resources dedicated by the Investment Advisers to maintain and improve relative performance and factoring in the unprecedented market events in recent years, the Board concluded that the nature, extent, and quality of investment management and support services and of shareholder and administrative services provided to the fund will benefit the fund's shareholders, particularly in light of the Board's view that the fund's shareholders benefit from investing in a fund that is part of a large family of funds offering a variety of investment disciplines and services.
Competitiveness of Management Fee and Total Fund Expenses. The Board considered the fund's management fee and total expenses compared to "mapped groups" of competitive funds and classes. Fidelity creates "mapped groups" by combining similar Lipper investment objective categories that have comparable management fee characteristics. Combining Lipper investment objective categories aids the Board's management fee and total expense comparisons by broadening the competitive group used for comparison and by reducing the number of universes to which various Fidelity funds are compared.
Annual Report
Management Fee. The Board considered two proprietary management fee comparisons for the 12-month periods shown in the chart below. The group of Lipper funds used by the Board for management fee comparisons is referred to below as the "Total Mapped Group." The Total Mapped Group comparison focuses on a fund's standing relative to the total universe of comparable funds available to investors, in terms of gross management fees before expense reimbursements or caps. "TMG %" represents the percentage of funds in the Total Mapped Group that had management fees that were lower than the fund's. For example, a TMG % of 15% means that 85% of the funds in the Total Mapped Group had higher management fees than the fund. The "Asset-Size Peer Group" (ASPG) comparison focuses on a fund's standing relative to non-Fidelity funds similar in size to the fund within the Total Mapped Group. The ASPG represents at least 15% of the funds in the Total Mapped Group with comparable asset size and management fee characteristics, subject to a minimum of 50 funds (or all funds in the Total Mapped Group if fewer than 50). Additional information, such as the ASPG quartile in which the fund's management fee ranked, is also included in the chart and considered by the Board.
Fidelity Advisor Emerging Markets Fund
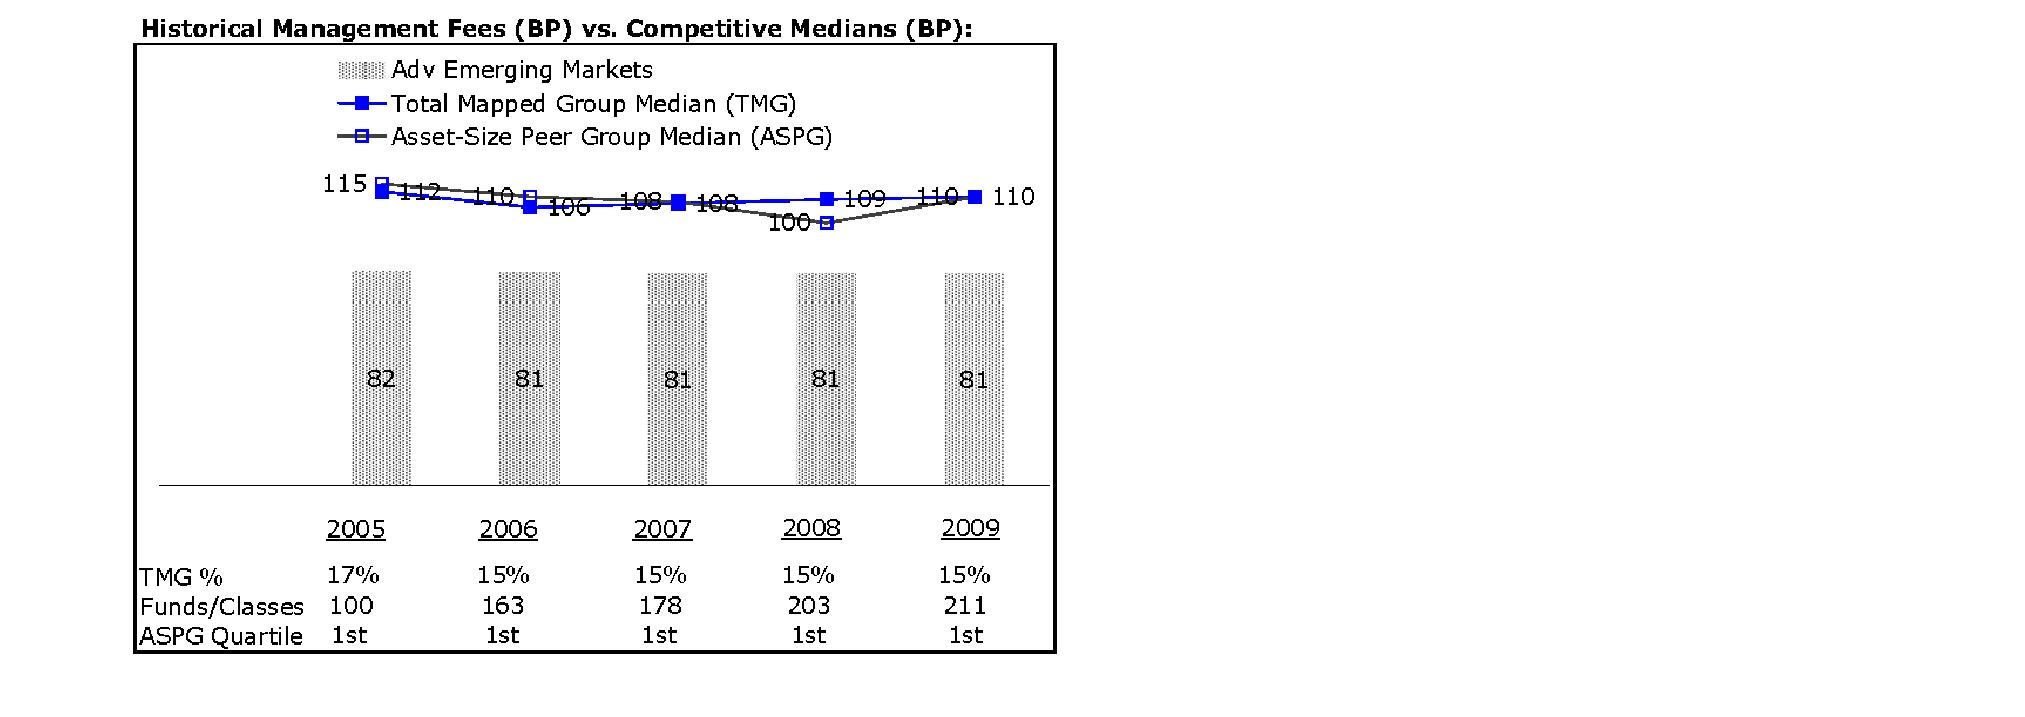
The Board noted that the fund's management fee ranked below the median of its Total Mapped Group and below the median of its ASPG for 2009.
Annual Report
Board Approval of Investment Advisory Contracts and
Management Fees - continued
Based on its review, the Board concluded that the fund's management fee is fair and reasonable in light of the services that the fund receives and the other factors considered.
Total Expenses. In its review of each class's total expenses, the Board considered the fund's management fee as well as other fund or class expenses, as applicable, such as transfer agent fees, pricing and bookkeeping fees, fund-paid 12b-1 fees, and custodial, legal, and audit fees. The Board also noted the effects of any waivers and reimbursements on fees and expenses. As part of its review, the Board also considered current and historical total expenses of each class of the fund compared to competitive fund median expenses. Each class of the fund is compared to those funds and classes in the Total Mapped Group (used by the Board for management fee comparisons) that have a similar sales load structure.
The Board noted that the total expenses of each of Class A, Class B, Class C, and Institutional Class ranked below its competitive median for 2009 and the total expenses of Class T ranked above its competitive median for 2009. The Board considered that the total expenses for Class T were above the median primarily because its 12b-1 fee is higher than the typical front-end load class. The Board noted that the fund offers multiple classes, each of which has a different sales load and 12b-1 fee structure, and that the multiple structures are intended to offer a range of pricing options for the intermediary market. The Board also noted that the total expenses of the classes vary primarily by the level of their 12b-1 fees, although differences in transfer agent fees may also cause expenses to vary from class to class.
Fees Charged to Other Fidelity Clients. The Board also considered Fidelity fee structures and other information with respect to clients of FMR and its affiliates, such as other mutual funds advised or subadvised by FMR or its affiliates, pension plan clients, and other institutional clients. In March 2010, the Board created an ad hoc joint committee with the board of other Fidelity funds (the Committee) to review and compare Fidelity's institutional investment advisory business with its business of providing services to the Fidelity funds, including the differences in services provided, fees charged, and costs incurred, as well as competition in their respective marketplaces.
Based on its review of total expenses and fees charged to other Fidelity clients, the Board concluded that the total expenses of each class of the fund were reasonable, although in one case above the median of the universe presented for comparison, in light of the services that the fund and its shareholders receive and the other factors considered, including the findings of the Committee.
Costs of the Services and Profitability. The Board considered the revenues earned and the expenses incurred by Fidelity in conducting the business of developing, marketing, distributing, managing, administering and servicing the fund and its shareholders. The Board also considered the level of Fidelity's profits in respect of all the Fidelity funds.
Annual Report
On an annual basis, FMR presents to the Board Fidelity's profitability for the fund. Fidelity calculates the profitability for each fund, as well as aggregate profitability for groups of Fidelity funds and all Fidelity funds, using a series of detailed revenue and cost allocation methodologies which originate with the audited books and records of Fidelity. The Audit Committee of the Board reviews any significant changes from the prior year's methodologies.
PricewaterhouseCoopers LLP (PwC), independent registered public accounting firm and auditor to Fidelity and certain Fidelity funds, has been engaged annually by the Board as part of the Board's assessment of Fidelity's profitability analysis. PwC's engagement includes the review and assessment of Fidelity's methodologies used in determining the revenues and expenses attributable to Fidelity's mutual fund business, and completion of agreed-upon procedures surrounding the mathematical accuracy of fund profitability and its conformity to allocation methodologies. After considering PwC's reports issued under the engagement and information provided by Fidelity, the Board believes that while other allocation methods may also be reasonable, Fidelity's profitability methodologies are reasonable in all material respects.
The Board has also reviewed Fidelity's non-fund businesses and fall-out benefits related to the mutual fund business as well as cases where Fidelity's affiliates may benefit from or be related to the fund's business.
The Board considered the costs of the services provided by and the profits realized by Fidelity in connection with the operation of the fund and were satisfied that the profitability was not excessive in the circumstances.
Economies of Scale. The Board considered whether there have been economies of scale in respect of the management of the Fidelity funds, whether the Fidelity funds (including the fund) have appropriately benefited from any such economies of scale, and whether there is potential for realization of any further economies of scale. The Board considered the extent to which the fund will benefit from economies of scale through increased services to the fund, through waivers or reimbursements, or through fee or expense reductions.
In February 2009, the Board and the board of other Fidelity funds created an ad hoc committee (the Economies of Scale Committee) to analyze whether FMR attains economies of scale in respect of the management and servicing of the Fidelity funds, whether the Fidelity funds have appropriately benefited from such economies of scale, and whether there is potential for realization of any further economies of scale.
The Board recognized that the fund's management contract incorporates a "group fee" structure, which provides for lower group fee rates as total fund assets under FMR's management increase, and for higher group fee rates as total fund assets under FMR's management decrease. FMR calculates the group fee rates based on a tiered asset "breakpoint" schedule that varies based on asset class. The Board considered that the group fee is designed to deliver the benefits of economies of scale to fund shareholders when total Fidelity fund assets increase, even if assets of any particular fund are unchanged or have declined, because some portion of Fidelity's costs are attributable to services provided to all Fidelity funds, and all funds benefit if those costs can be allocated among more assets. The Board concluded that, given the group fee structure, fund shareholders will benefit from lower management fees as assets under FMR's management increase at the fund complex level, regardless of whether Fidelity achieves any such economies of scale.
Annual Report
Board Approval of Investment Advisory Contracts and
Management Fees - continued
The Board concluded, considering the findings of the Economies of Scale Committee, that any potential economies of scale are being appropriately shared between fund shareholders and Fidelity.
Additional Information Requested by the Board. In order to develop fully the factual basis for consideration of the Fidelity funds' Advisory Contracts, the Board requested and received additional information on certain topics, including (i) fund performance trends, actions to be taken by FMR to improve certain funds' overall performance, and Fidelity's long-term strategies for certain funds; (ii) portfolio manager changes that have occurred during the past year and length of portfolio manager tenure for different categories of funds over time; (iii) Fidelity's compensation structure for portfolio managers, research analysts, and other key personnel, the rationale for the compensation structure, and how the compensation structure provides appropriate performance incentives; (iv) the amount of the investment that each portfolio manager has made in the Fidelity fund(s) that he or she manages; (v) management and other fees paid by FMR to affiliated sub-advisers on behalf of the Fidelity funds; (vi) Fidelity's fee structures and rationale for recommending different fees among different categories of funds; (vii) Fidelity's rationale for recommending which funds should have a performance adjustment component as part of their management fees; (viii) the rationale for any differences between fund fee structures and fee structures in place for other Fidelity clients; and (ix) explanations regarding the relative total expenses borne by certain funds and classes, total expense competitive trends, and actions that might be taken by FMR to reduce total expenses for certain funds and classes.
Based on its evaluation of all of the conclusions noted above, and after considering all factors it believed relevant, the Board ultimately concluded that the advisory fee structures are fair and reasonable, and that the fund's Advisory Contracts should be renewed.
Annual Report
Investment Adviser
Fidelity Management & Research Company
Boston, MA
Investment Sub-Advisers
FMR Co., Inc.
Fidelity Management & Research
(U.K.) Inc.
Fidelity Research & Analysis Company
Fidelity Management & Research
(Hong Kong) Limited
FIL Investments (Japan) Limited
Fidelity Management & Research
(Japan) Inc.
FIL Investment Advisors (UK) Limited
FIL Investment Advisors
General Distributor
Fidelity Distributors Corporation
Boston, MA
Transfer and Service Agents
Fidelity Investments Institutional Operations Company, Inc.
Boston, MA
Fidelity Service Company, Inc.
Boston, MA
Custodian
JPMorgan Chase Bank
New York, NY
FAEM-UANN-1210
1.809005.106
(Fidelity Investment logo)(registered trademark)
Fidelity AdvisorSM
Emerging Markets
Fund - Institutional Class
Annual Report
October 31, 2010
(2_fidelity_logos) (Registered_Trademark)
Contents
Chairman's Message | <Click Here> | The Chairman's message to shareholders. |
Performance | <Click Here> | How the fund has done over time. |
Management's Discussion of Fund Performance | <Click Here> | The Portfolio Manager's review of fundperformance and strategy. |
Shareholder Expense Example | <Click Here> | An example of shareholder expenses. |
Investment Changes | <Click Here> | A summary of major shifts in the fund's investments over the past six months. |
Investments | <Click Here> | A complete list of the fund's investments with their market values. |
Financial Statements | <Click Here> | Statements of assets and liabilities, operations, and changes in net assets,
as well as financial highlights. |
Notes | <Click Here> | Notes to the financial statements. |
Report of Independent Registered Public Accounting Firm | <Click Here> | |
Trustees and Officers | <Click Here> | |
Distributions | <Click Here> | |
Board Approval of Investment Advisory Contracts and Management Fees | <Click Here> | |
To view a fund's proxy voting guidelines and proxy voting record for the 12-month period ended June 30, visit http://www.fidelity.com/proxyvotingresults or visit the Securities and Exchange Commission's (SEC) web site at http://www.sec.gov. You may also call 1-877-208-0098 to request a free copy of the proxy voting guidelines.
Standard & Poor's, S&P and S&P 500 are registered service marks of The McGraw-Hill Companies, Inc. and have been licensed for use by Fidelity Distributors Corporation.
Other third party marks appearing herein are the property of their respective owners.
All other marks appearing herein are registered or unregistered trademarks or service marks of FMR LLC or an affiliated company.
Annual Report
This report and the financial statements contained herein are submitted for the general information of the shareholders of the fund. This report is not authorized for distribution to prospective investors in the fund unless preceded or accompanied by an effective prospectus.
A fund files its complete schedule of portfolio holdings with the SEC for the first and third quarters of each fiscal year on Form N-Q. Forms N-Q are available on the SEC's web site at http://www.sec.gov. A fund's Forms N-Q may be reviewed and copied at the SEC's Public Reference Room in Washington, DC. Information regarding the operation of the SEC's Public Reference Room may be obtained by calling 1-800-SEC-0330. For a complete list of a fund's portfolio holdings, view the most recent holdings listing, semiannual report, or annual report on Fidelity's web site at http://www.fidelity.com or http://www.advisor.fidelity.com, as applicable.
NOT FDIC INSURED • MAY LOSE VALUE • NO BANK GUARANTEE
Neither the fund nor Fidelity Distributors Corporation is a bank.
Annual Report
(photo_of_Edward_C_Johnson_3d)
Dear Shareholder:
Equities have staged a rally in the second half of 2010, shaking off concerns about the European debt crisis and the possibility of a double-dip recession in the U.S. Although the short-term surge pushed major equity indexes back into positive territory for the year, several questions remain about the longer-term outlook, including lackluster economic growth and persistently high unemployment. Financial markets are always unpredictable, of course, but there also are several time-tested investment principles that can help put the odds in your favor.
One of the basic tenets is to invest for the long term. Over time, riding out the markets' inevitable ups and downs has proven much more effective than selling into panic or chasing the hottest trend. Even missing only a few of the markets' best days can significantly diminish investor returns. Patience also affords the benefits of compounding - of earning interest on additional income or reinvested dividends and capital gains. There can be tax advantages and cost benefits to consider as well. While staying the course doesn't eliminate risk, it can considerably lessen the effect of short-term declines.
You can further manage your investing risk through diversification. And today, more than ever, geographic diversification should be taken into account. Studies indicate that asset allocation is the single most important determinant of a portfolio's long-term success. The right mix of stocks, bonds and cash - aligned to your particular risk tolerance and investment objective - is very important. Age-appropriate rebalancing is also an essential aspect of asset allocation. For younger investors, an emphasis on equities - which historically have been the best-performing asset class over time - is encouraged. As investors near their specific goal, such as retirement or sending a child to college, consideration may be given to replacing volatile assets (e.g. common stocks) with more-stable fixed investments (bonds or savings plans).
A third principle - investing regularly - can help lower the average cost of your purchases. Investing a certain amount of money each month or quarter helps ensure you won't pay for all your shares at market highs. This strategy - known as dollar cost averaging - also reduces "emotion" from investing, helping shareholders avoid selling weak performers just prior to an upswing, or chasing a hot performer just before a correction.
We invite you to contact us via the Internet, through our Investor Centers or by phone. It is our privilege to provide you the information you need to make the investments that are right for you.
Sincerely,
(The chairman's signature appears here.)
Edward C. Johnson 3d
Annual Report
Average annual total return reflects the change in the value of an investment, assuming reinvestment of the class' distributions from dividend income and capital gains (the profits earned upon the sale of securities that have grown in value, if any) and assuming a constant rate of performance each year. The $10,000 table and the fund's returns do not reflect the deduction of taxes that a shareholder would pay on fund distributions or the redemption of fund shares. During periods of reimbursement by Fidelity, a fund's total return will be greater than it would be had the reimbursement not occurred. How a fund did yesterday is no guarantee of how it will do tomorrow.
Average Annual Total Returns
Periods ended October 31, 2010 | Past 1
year | Past 5
years | Life of
fundA |
Institutional Class | 25.15% | 13.15% | 15.32% |
A From March 29, 2004.
$10,000 Over Life of Fund
Let's say hypothetically that $10,000 was invested in Fidelity AdvisorSM Emerging Markets Fund - Institutional Class on March 29, 2004, when the fund started. The chart shows how the value of your investment would have changed, and also shows how the MSCI® Emerging Markets Index performed over the same period.
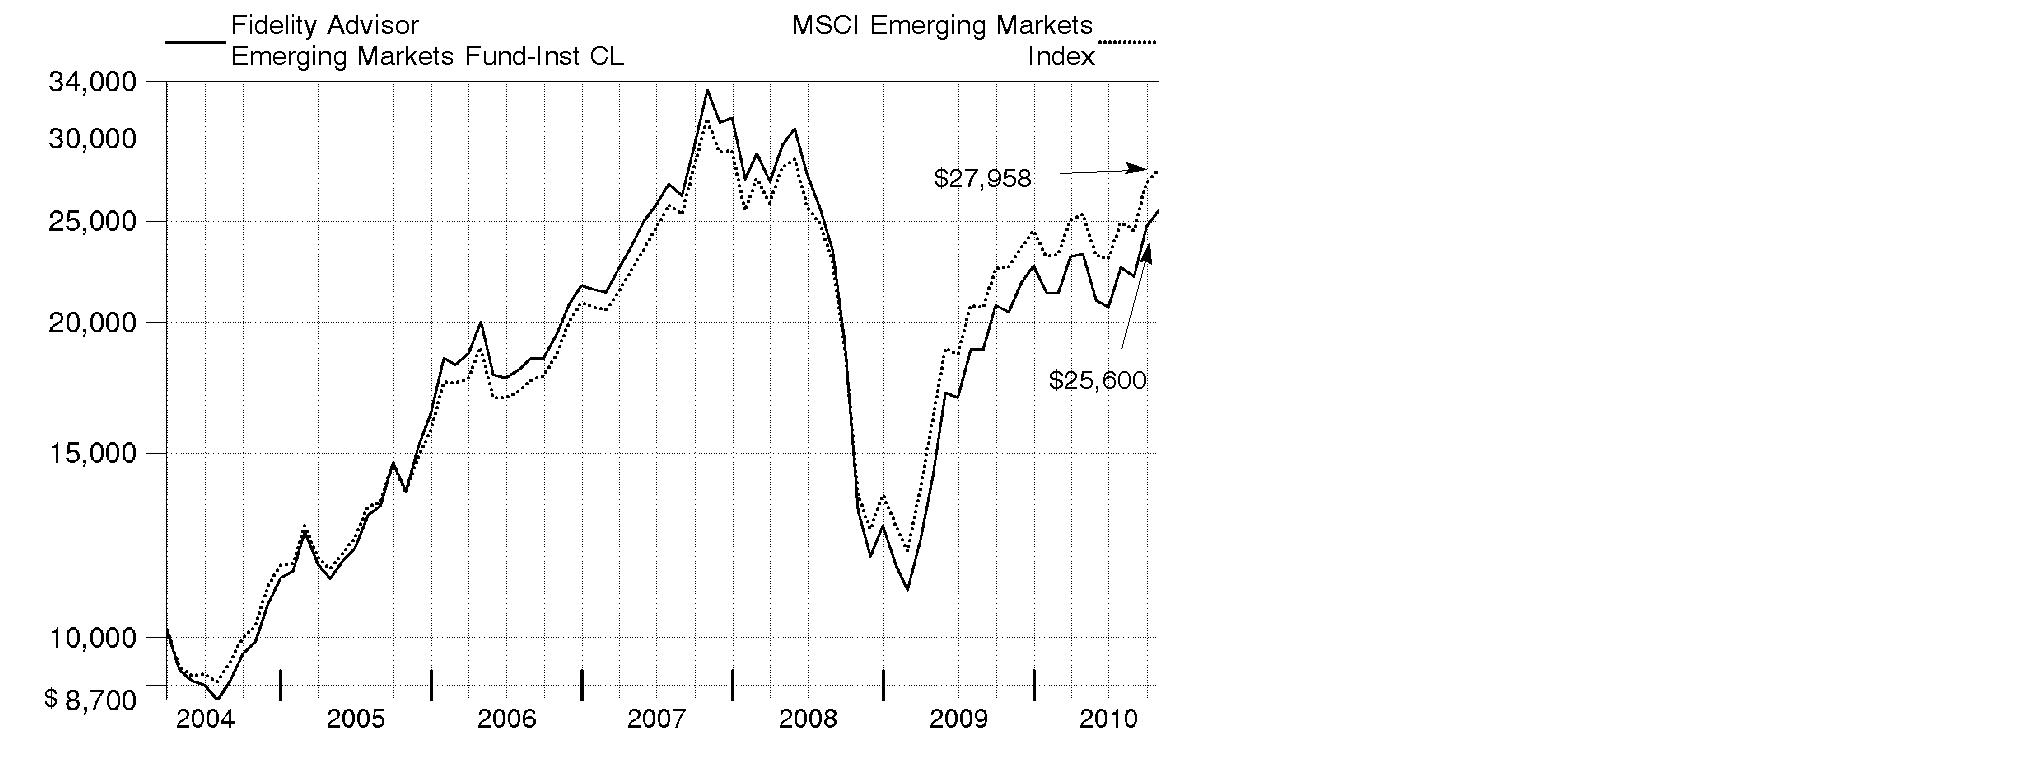
Annual Report
Market Recap: The return-to-risk theme was evident within emerging markets during the 12 months ending October 31, 2010. The combination of strong economic growth and superior fiscal conditions bolstered the performance of emerging-markets stocks, as they finished the period well ahead of most foreign developed-country stock indexes. Several smaller country constituents provided a big boost to the index, while most of its biggest components, though strong, still lagged. The falling value of the U.S. dollar relative to most emerging-markets currencies also provided a meaningful contribution. Rising commodity prices supported returns in commodity-producing regions, such as Latin America, which also benefited from the announced integration of the Chile, Colombia and Peru stock exchanges, scheduled for November. For the 12 months ending October 31, 2010, the MSCI® Emerging Markets Index climbed 23.89%. Among emerging-markets countries, major index components South Korea, Taiwan, Brazil and China gained roughly 25%, 21%, 15% and 9%, respectively. India, also a large constituent, solidly beat the index, returning about 35%. Other strong-performing countries included Thailand (62%), Turkey (55%), Indonesia (52%), Malaysia (36%), Mexico (34%) and South Africa (33%).
Comments from Robert von Rekowsky, Portfolio Manager of Fidelity AdvisorSM Emerging Markets Fund: During the past year, the fund's Institutional Class shares gained 25.15%, topping the MSCI index. Relative performance was aided by stock selection and an overweighting in consumer discretionary. Solid picks in information technology, energy and materials also bolstered our results, as did underweighting financials. From a country standpoint, security selection in Russia, China, India and South Korea aided performance, along with an overweighting and rewarding stock picking in Indonesia. Two Chinese stocks topped our list of relative contributors: an out-of-benchmark stake in Internet search/advertising Baidu and not owning weak-performing index component China Life Insurance. Indonesian tobacco producer/distributor Gudang Garam also bolstered results. On the negative side, a small cash position dampened the fund's gain in a rising market. Weak stock selection and an underweighting in industrials also hurt, as did lackluster picks in utilities and telecommunication services. Geographically, our selections in Brazil were weak, and underweighting Chile also hurt. Hungarian holding OTP Bank suffered from that nation's decision to impose a bank tax. Russian oil producer Rosneft also detracted. Both detractors I've mentioned were sold from the fund.
The views expressed above reflect those of the portfolio manager(s) only through the end of the period as stated on the cover of this report and do not necessarily represent the views of Fidelity or any other person in the Fidelity organization. Any such views are subject to change at any time based upon market or other conditions and Fidelity disclaims any responsibility to update such views. These views may not be relied on as investment advice and, because investment decisions for a Fidelity fund are based on numerous factors, may not be relied on as an indication of trading intent on behalf of any Fidelity fund.
Annual Report
Shareholder Expense Example
As a shareholder of the Fund, you incur two types of costs: (1) transaction costs, including sales charges (loads) on purchase payments or redemption proceeds, redemption fees, and (2) ongoing costs, including management fees, distribution and/or service (12b-1) fees and other Fund expenses. This Example is intended to help you understand your ongoing costs (in dollars) of investing in the Fund and to compare these costs with the ongoing costs of investing in other mutual funds.
The Example is based on an investment of $1,000 invested at the beginning of the period and held for the entire period (May 1, 2010 to October 31, 2010).
Actual Expenses
The first line of the accompanying table for each class of the Fund provides information about actual account values and actual expenses. You may use the information in this line, together with the amount you invested, to estimate the expenses that you paid over the period. Simply divide your account value by $1,000.00 (for example, an $8,600 account value divided by $1,000.00 = 8.6), then multiply the result by the number in the first line for a class of the Fund under the heading entitled "Expenses Paid During Period" to estimate the expenses you paid on your account during this period. In addition, the Fund, as a shareholder in the underlying Fidelity Central Funds, will indirectly bear its pro-rata share of the fees and expenses incurred by the underlying Fidelity Central Funds. These fees and expenses are not included in the Fund's annualized expense ratio used to calculate the expense estimate in the table below.
Hypothetical Example for Comparison Purposes
The second line of the accompanying table for each class of the Fund provides information about hypothetical account values and hypothetical expenses based on a Class' actual expense ratio and an assumed rate of return of 5% per year before expenses, which is not the Class' actual return. The hypothetical account values and expenses may not be used to estimate the actual ending account balance or expenses you paid for the period. You may use this information to compare the ongoing costs of investing in the Fund and other funds. To do so, compare this 5% hypothetical example with the 5% hypothetical examples that appear in the shareholder reports of the other funds. In addition, the Fund, as a shareholder in the underlying Fidelity Central Funds, will indirectly bear its pro-rata share of the fees and expenses incurred by the underlying Fidelity Central Funds. These fees and expenses are not included in the Fund's annualized expense ratio used to calculate the expense estimate in the table below.
Please note that the expenses shown in the table are meant to highlight your ongoing costs only and do not reflect any transaction costs. Therefore, the second line of the table is useful in comparing ongoing costs only, and will not help you determine the relative total costs of owning different funds. In addition, if these transactional costs were included, your costs would have been higher.
Annual Report
| Annualized
Expense Ratio | Beginning
Account Value
May 1, 2010 | Ending
Account Value
October 31, 2010 | Expenses Paid
During Period*
May 1, 2010 to
October 31, 2010 |
Class A | 1.54% | | | |
Actual | | $ 1,000.00 | $ 1,099.20 | $ 8.15 |
HypotheticalA | | $ 1,000.00 | $ 1,017.44 | $ 7.83 |
Class T | 1.79% | | | |
Actual | | $ 1,000.00 | $ 1,098.10 | $ 9.47 |
HypotheticalA | | $ 1,000.00 | $ 1,016.18 | $ 9.10 |
Class B | 2.29% | | | |
Actual | | $ 1,000.00 | $ 1,095.60 | $ 12.10 |
HypotheticalA | | $ 1,000.00 | $ 1,013.66 | $ 11.62 |
Class C | 2.28% | | | |
Actual | | $ 1,000.00 | $ 1,095.70 | $ 12.04 |
HypotheticalA | | $ 1,000.00 | $ 1,013.71 | $ 11.57 |
Institutional Class | 1.22% | | | |
Actual | | $ 1,000.00 | $ 1,101.50 | $ 6.46 |
HypotheticalA | | $ 1,000.00 | $ 1,019.06 | $ 6.21 |
A 5% return per year before expenses
* Expenses are equal to each Class' annualized expense ratio, multiplied by the average account value over the period, multiplied by 184/365 (to reflect the one-half year period).
Annual Report
Investment Changes (Unaudited)
Top Five Stocks as of October 31, 2010 |
| % of fund's
net assets | % of fund's net assets
6 months ago |
America Movil SAB de CV Series L sponsored ADR (Mexico, Wireless Telecommunication Services) | 2.1 | 1.3 |
Vale SA (PN-A) sponsored ADR (Brazil, Metals & Mining) | 1.9 | 3.5 |
Samsung Electronics Co. Ltd. (Korea (South), Semiconductors & Semiconductor Equipment) | 1.9 | 2.4 |
Banco Bradesco SA (PN) sponsored ADR (Brazil, Commercial Banks) | 1.9 | 1.3 |
Petroleo Brasileiro SA-Petrobras (PN), (non-vtg.) (Brazil, Oil, Gas & Consumable Fuels) | 1.9 | 2.9 |
| 9.7 | |
Top Five Market Sectors as of October 31, 2010 |
| % of fund's
net assets | % of fund's net assets
6 months ago |
Financials | 26.0 | 22.1 |
Materials | 15.8 | 16.3 |
Energy | 13.2 | 13.1 |
Consumer Discretionary | 10.6 | 8.3 |
Information Technology | 9.7 | 14.3 |
Top Five Countries as of October 31, 2010 |
(excluding cash equivalents) | % of fund's
net assets | % of fund's net assets
6 months ago |
Brazil | 13.4 | 13.9 |
Korea (South) | 11.8 | 11.9 |
India | 8.7 | 6.6 |
China | 8.0 | 7.8 |
Russia | 7.9 | 8.5 |
Percentages are adjusted for the effect of open futures contracts, if applicable. |
Asset Allocation (% of fund's net assets) |
As of October 31, 2010 | As of April 30, 2010 |
| Stocks 98.1% | | | Stocks 96.5% | |
| Short-Term
Investments and
Net Other Assets 1.9% | | | Short-Term
Investments and
Net Other Assets 3.5% | |

Annual Report
Investments October 31, 2010
Showing Percentage of Net Assets
Common Stocks - 98.1% |
| Shares | | Value |
Argentina - 0.5% |
Banco Macro SA sponsored ADR | 73,676 | | $ 3,672,749 |
Austria - 0.2% |
Erste Bank AG | 32,350 | | 1,459,785 |
Bahamas (Nassau) - 0.2% |
Petrominerales Ltd. | 42,900 | | 1,099,105 |
Bailiwick of Jersey - 0.7% |
Heritage Oil PLC | 239,841 | | 1,323,780 |
Randgold Resources Ltd. sponsored ADR | 28,000 | | 2,629,760 |
West China Cement Ltd. (a) | 2,134,000 | | 825,931 |
TOTAL BAILIWICK OF JERSEY | | 4,779,471 |
Bermuda - 2.4% |
Aquarius Platinum Ltd.: | | | |
(Australia) | 454,459 | | 2,613,387 |
(United Kingdom) | 199,511 | | 1,151,687 |
China Yurun Food Group Ltd. | 716,000 | | 2,785,022 |
CNPC (Hong Kong) Ltd. | 2,239,000 | | 2,848,126 |
Credicorp Ltd. (NY Shares) | 13,500 | | 1,699,380 |
Jinhui Shipping & Transportation Ltd. (a) | 69,643 | | 276,941 |
Orient Overseas International Ltd. | 401,000 | | 3,515,298 |
Sinofert Holdings Ltd. (a) | 2,186,000 | | 1,156,278 |
Texwinca Holdings Ltd. | 1,012,000 | | 1,104,534 |
TOTAL BERMUDA | | 17,150,653 |
Brazil - 13.4% |
AES Tiete SA (PN) (non-vtg.) | 97,600 | | 1,345,356 |
Banco Bradesco SA (PN) sponsored ADR (d) | 641,690 | | 13,347,152 |
Banco do Brasil SA | 258,000 | | 5,019,868 |
Banco do Estado do Rio Grande do Sul SA | 71,800 | | 788,821 |
Brascan Residential Properties SA | 119,000 | | 647,743 |
Brasil Insurance Participacoes e Administracao SA (a) | 900 | | 714,202 |
Companhia de Bebidas das Americas (AmBev) (PN) sponsored ADR | 34,900 | | 4,859,476 |
Companhia Energetica de Minas Gerais (CEMIG) (PN) sponsored ADR (non-vtg.) (d) | 1,347 | | 24,030 |
Companhia Siderurgica Nacional SA (CSN) sponsored ADR (d) | 331,700 | | 5,599,096 |
Confab Industrial SA (PN) (non-vtg.) | 117,200 | | 423,689 |
Drogasil SA | 46,700 | | 1,181,226 |
Eletropaulo Metropolitana SA (PN-B) | 53,400 | | 932,271 |
Estacio Participacoes SA | 52,000 | | 776,699 |
Even Construtora e Incorporadora SA | 88,300 | | 502,436 |
Common Stocks - continued |
| Shares | | Value |
Brazil - continued |
Fleury SA | 57,000 | | $ 737,127 |
Gafisa SA sponsored ADR (d) | 231,850 | | 3,892,762 |
Light SA | 97,400 | | 1,226,374 |
Localiza Rent A Car SA | 168,500 | | 2,788,194 |
Lojas Renner SA | 94,300 | | 3,724,994 |
Natura Cosmeticos SA | 106,700 | | 3,054,485 |
OGX Petroleo e Gas Participacoes SA (a) | 584,400 | | 7,667,416 |
OSX Brasil SA | 2,100 | | 675,229 |
PDG Realty SA Empreendimentos e Participacoes | 287,600 | | 3,595,845 |
Petroleo Brasileiro SA - Petrobras: | | | |
(ON) sponsored ADR | 61,200 | | 2,088,144 |
(PN) (non-vtg.) | 300,300 | | 4,563,105 |
(PN) sponsored ADR (non-vtg.) | 278,710 | | 8,692,965 |
TIM Participacoes SA sponsored ADR (non-vtg.) | 75,100 | | 2,422,726 |
Vale SA (PN-A) sponsored ADR | 484,000 | | 13,905,320 |
Weg SA | 64,000 | | 826,522 |
TOTAL BRAZIL | | 96,023,273 |
Canada - 1.7% |
Eldorado Gold Corp. | 183,185 | | 3,101,878 |
First Quantum Minerals Ltd. | 44,600 | | 3,905,506 |
Niko Resources Ltd. | 15,800 | | 1,507,344 |
Pacific Rubiales Energy Corp. (a) | 25,600 | | 816,017 |
Sherritt International Corp. | 111,000 | | 863,055 |
Uranium One, Inc. (a) | 562,500 | | 2,299,858 |
TOTAL CANADA | | 12,493,658 |
Cayman Islands - 2.9% |
3SBio, Inc. sponsored ADR (a) | 70,306 | | 1,058,105 |
Alibaba.com Ltd. (a) | 316,000 | | 617,222 |
China Shanshui Cement Group Ltd. | 3,101,000 | | 2,208,356 |
Daphne International Holdings Ltd. | 1,860,000 | | 2,078,065 |
Eurasia Drilling Co. Ltd.: | | | |
GDR (e) | 16,500 | | 420,750 |
GDR (Reg. S) | 136,902 | | 3,491,001 |
Evergreen International Holdings Ltd. (a) | 38,000 | | 22,551 |
Geely Automobile Holdings Ltd. (d) | 3,925,000 | | 2,212,837 |
Global Education & Technology Group Ltd. ADR (a) | 2,800 | | 27,804 |
Hidili Industry International Development Ltd. | 2,044,000 | | 2,178,157 |
International Mining Machinery Holdings Ltd. | 1,528,000 | | 1,330,624 |
Kingboard Chemical Holdings Ltd. | 647,000 | | 3,146,834 |
Kingboard Chemical Holdings Ltd. warrants 10/31/12 (a) | 39,750 | | 22,769 |
Common Stocks - continued |
| Shares | | Value |
Cayman Islands - continued |
Microport Scientific Corp. | 27,000 | | $ 27,518 |
Shenguan Holdings Group Ltd. | 640,000 | | 833,930 |
Trina Solar Ltd. ADR (a)(d) | 47,200 | | 1,263,072 |
TOTAL CAYMAN ISLANDS | | 20,939,595 |
China - 8.0% |
Anhui Expressway Co. Ltd. (H Shares) | 976,000 | | 742,900 |
Baidu.com, Inc. sponsored ADR (a) | 29,115 | | 3,202,941 |
China Communications Services Corp. Ltd. (H Shares) | 2,086,000 | | 1,216,413 |
China Construction Bank Corp. (H Shares) | 9,078,000 | | 8,654,916 |
China Merchants Bank Co. Ltd. (H Shares) | 2,077,342 | | 5,896,020 |
China Minsheng Banking Corp. Ltd. (H Shares) | 1,854,000 | | 1,724,540 |
China Suntien Green Energy Corp. Ltd. (H Shares) | 137,000 | | 46,131 |
Digital China Holdings Ltd. (H Shares) | 573,000 | | 1,034,930 |
Golden Eagle Retail Group Ltd. (H Shares) | 1,152,000 | | 3,061,597 |
Harbin Power Equipment Co. Ltd. (H Shares) | 1,716,000 | | 2,311,245 |
Industrial & Commercial Bank of China Ltd. (H Shares) | 16,023,000 | | 12,899,019 |
Minth Group Ltd. | 1,463,000 | | 2,736,784 |
Ping An Insurance Group Co. China Ltd. (H Shares) | 717,000 | | 7,719,226 |
Weichai Power Co. Ltd. (H Shares) | 115,000 | | 1,510,337 |
Yantai Changyu Pioneer Wine Co. (B Shares) | 294,239 | | 3,792,224 |
Zhaojin Mining Industry Co. Ltd. (H Shares) | 117,000 | | 363,774 |
TOTAL CHINA | | 56,912,997 |
Colombia - 0.6% |
Ecopetrol SA ADR (d) | 83,100 | | 3,967,194 |
Czech Republic - 1.1% |
Ceske Energeticke Zavody AS | 82,400 | | 3,650,839 |
Komercni Banka AS | 19,993 | | 4,536,417 |
TOTAL CZECH REPUBLIC | | 8,187,256 |
Egypt - 0.8% |
Commercial International Bank Ltd. sponsored GDR | 773,408 | | 5,916,571 |
Georgia - 0.2% |
Bank of Georgia unit (a) | 65,500 | | 1,080,095 |
Hong Kong - 4.0% |
China Mobile (Hong Kong) Ltd. | 1,061,700 | | 10,842,414 |
Chow Sang Sang Holdings International Ltd. | 272,000 | | 715,859 |
CNOOC Ltd. | 4,667,000 | | 9,743,381 |
CNOOC Ltd. sponsored ADR (d) | 15,200 | | 3,175,584 |
Common Stocks - continued |
| Shares | | Value |
Hong Kong - continued |
I.T Ltd. | 710,000 | | $ 599,052 |
Shanghai Industrial Holdings Ltd. | 791,000 | | 3,643,116 |
TOTAL HONG KONG | | 28,719,406 |
Hungary - 0.2% |
Egis Rt. | 9,660 | | 1,134,884 |
India - 8.7% |
Bank of Baroda | 188,912 | | 4,482,205 |
Bharat Heavy Electricals Ltd. | 71,922 | | 3,968,164 |
Housing Development Finance Corp. Ltd. | 409,052 | | 6,346,420 |
Idea Cellular Ltd. (a) | 816,360 | | 1,242,267 |
Indian Oil Corp. Ltd. | 105,445 | | 994,502 |
Indian Overseas Bank | 416,476 | | 1,501,475 |
Infosys Technologies Ltd. sponsored ADR | 110,897 | | 7,478,894 |
Infotech Enterprises Ltd. | 93,657 | | 345,680 |
Infrastructure Development Finance Co. Ltd. | 864,610 | | 3,902,205 |
Jain Irrigation Systems Ltd. | 563,515 | | 2,949,475 |
JSW Steel Ltd. | 143,166 | | 4,334,385 |
LIC Housing Finance Ltd. | 23,184 | | 701,169 |
Radico Khaitan Ltd. | 117,492 | | 473,944 |
Reliance Industries Ltd. | 354,189 | | 8,759,835 |
Rural Electrification Corp. Ltd. | 416,544 | | 3,483,182 |
Shriram Transport Finance Co. Ltd. | 77,265 | | 1,536,410 |
Tata Consultancy Services Ltd. | 249,445 | | 5,925,339 |
Tata Steel Ltd. | 69,491 | | 924,038 |
Ultratech Cement Ltd. | 103,025 | | 2,556,508 |
TOTAL INDIA | | 61,906,097 |
Indonesia - 6.0% |
Indofood Sukses Makmur Tbk PT (a) | 1,031,500 | | 657,851 |
PT Astra International Tbk | 831,000 | | 5,299,799 |
PT Bank Mandiri (Persero) Tbk | 1,864,500 | | 1,460,306 |
PT Bank Negara Indonesia (Persero) Tbk | 7,737,500 | | 3,376,360 |
PT Bank Rakyat Indonesia Tbk | 4,013,000 | | 5,118,675 |
PT Bank Tabungan Negara Tbk | 4,634,000 | | 1,031,793 |
PT Bumi Serpong Damai Tbk | 6,288,500 | | 591,030 |
PT Ciputra Development Tbk (a) | 14,439,000 | | 678,531 |
PT Delta Dunia Petroindo Tbk (a) | 9,099,500 | | 1,089,394 |
PT Gudang Garam Tbk | 664,500 | | 3,546,475 |
PT Indo Tambangraya Megah Tbk | 389,500 | | 1,969,833 |
PT Indocement Tunggal Prakarsa Tbk | 2,178,500 | | 4,460,589 |
PT Indofood Sukses Makmur Tbk | 7,463,500 | | 4,342,396 |
Common Stocks - continued |
| Shares | | Value |
Indonesia - continued |
PT Kalbe Farma Tbk | 4,199,500 | | $ 1,256,912 |
PT Perusahaan Gas Negara Tbk Series B | 5,981,700 | | 2,710,586 |
PT Tambang Batubbara Bukit Asam Tbk | 402,500 | | 884,936 |
PT Tower Bersama Infrastructure Tbk | 5,965,000 | | 1,701,900 |
PT XL Axiata Tbk (a) | 4,435,500 | | 2,853,605 |
TOTAL INDONESIA | | 43,030,971 |
Kazakhstan - 0.3% |
KazMunaiGas Exploration & Production JSC (Reg. S) GDR | 113,377 | | 1,950,084 |
Korea (South) - 11.8% |
Busan Bank | 115,560 | | 1,438,719 |
CJ Corp. | 37,857 | | 2,669,684 |
Daegu Bank Co. Ltd. | 99,630 | | 1,306,841 |
Daelim Industrial Co. | 26,393 | | 2,149,932 |
Doosan Co. Ltd. | 14,089 | | 1,898,162 |
GS Holdings Corp. | 38,060 | | 1,996,923 |
Hanjin Heavy Industries & Consolidated Co. Ltd. | 64,127 | | 2,446,463 |
Honam Petrochemical Corp. | 17,477 | | 3,854,420 |
Hyundai Department Store Co. Ltd. | 8,984 | | 994,671 |
Hyundai Heavy Industries Co. Ltd. | 15,786 | | 5,145,014 |
Hyundai Mobis | 29,270 | | 7,288,216 |
Hyundai Motor Co. | 69,081 | | 10,443,547 |
Industrial Bank of Korea | 332,840 | | 4,780,227 |
Kia Motors Corp. | 142,910 | | 5,706,232 |
KT Corp. | 67,330 | | 2,654,576 |
LG Chemical Ltd. | 8,890 | | 2,743,290 |
Lumens Co. Ltd. (a) | 110,857 | | 985,834 |
NCsoft Corp. | 14,333 | | 3,154,662 |
Samsung Electronics Co. Ltd. | 20,158 | | 13,355,009 |
Shinhan Financial Group Co. Ltd. | 183,610 | | 7,110,907 |
Tong Yang Securities, Inc. | 140,980 | | 1,422,964 |
Young Poong Precision Corp. | 33,794 | | 395,190 |
TOTAL KOREA (SOUTH) | | 83,941,483 |
Lebanon - 0.0% |
BLOM Bank SAL GDR | 33,800 | | 310,960 |
Luxembourg - 0.8% |
Evraz Group SA GDR (a) | 109,693 | | 3,325,892 |
Millicom International Cellular SA | 27,000 | | 2,554,200 |
TOTAL LUXEMBOURG | | 5,880,092 |
Common Stocks - continued |
| Shares | | Value |
Malaysia - 0.8% |
AirAsia Bhd (a) | 1,193,800 | | $ 947,826 |
Axiata Group Bhd (a) | 2,052,000 | | 2,961,581 |
RHB Capital BHD | 324,200 | | 836,813 |
Top Glove Corp. Bhd | 606,800 | | 1,072,774 |
TOTAL MALAYSIA | | 5,818,994 |
Mexico - 2.7% |
America Movil SAB de CV Series L sponsored ADR | 266,968 | | 15,286,582 |
Banco Compartamos SA de CV | 371,100 | | 2,628,844 |
Genomma Lab Internacional SA de CV (a) | 472,200 | | 1,025,799 |
TOTAL MEXICO | | 18,941,225 |
Nigeria - 0.3% |
Guaranty Trust Bank PLC GDR (Reg. S) | 322,072 | | 2,338,243 |
Norway - 0.1% |
Det Norske Oljeselskap ASA (DNO) (A Shares) (a) | 434,500 | | 682,232 |
Peru - 0.6% |
Compania de Minas Buenaventura SA sponsored ADR | 86,089 | | 4,566,161 |
Poland - 0.1% |
Bank Handlowy w Warszawie SA | 31,126 | | 982,737 |
Qatar - 0.3% |
Commercial Bank of Qatar GDR (Reg. S) | 394,744 | | 1,808,782 |
Russia - 7.9% |
Cherkizovo Group OJSC GDR (a) | 68,074 | | 1,386,882 |
LSR Group OJSC GDR (Reg. S) (a) | 105,400 | | 895,900 |
Magnit OJSC GDR (Reg. S) | 180,961 | | 4,838,897 |
Mechel Steel Group OAO sponsored ADR | 140,300 | | 3,304,065 |
OAO NOVATEK GDR | 77,998 | | 7,460,509 |
OAO Raspadskaya (a) | 124,100 | | 722,614 |
OAO Tatneft sponsored ADR | 134,400 | | 4,240,320 |
OJSC MMC Norilsk Nickel sponsored ADR | 263,717 | | 4,918,322 |
OJSC Oil Company Rosneft GDR (Reg. S) | 955,000 | | 6,656,350 |
Polymetal JSC GDR (Reg. S) (a) | 248,906 | | 3,932,715 |
Protek (a) | 42,900 | | 77,878 |
RusHydro JSC: | | | |
rights 6/30/10 (a) | 429,046 | | 22,126 |
sponsored ADR (a) | 591,729 | | 3,062,198 |
Sberbank (Savings Bank of the Russian Federation) | 2,072,600 | | 6,811,166 |
Sberbank (Savings Bank of the Russian Federation) GDR | 9,007 | | 3,383,853 |
Severstal JSC (a) | 69,200 | | 944,405 |
Common Stocks - continued |
| Shares | | Value |
Russia - continued |
Sistema JSFC sponsored GDR | 126,821 | | $ 3,271,982 |
TGK-1 OAO (a) | 1,003,697,000 | | 696,566 |
TOTAL RUSSIA | | 56,626,748 |
Singapore - 0.8% |
Keppel Corp. Ltd. | 325,000 | | 2,505,988 |
Straits Asia Resources Ltd. | 1,264,000 | | 2,236,390 |
Yanlord Land Group Ltd. | 546,000 | | 725,581 |
TOTAL SINGAPORE | | 5,467,959 |
South Africa - 6.4% |
African Bank Investments Ltd. | 797,247 | | 4,090,343 |
African Rainbow Minerals Ltd. | 144,368 | | 3,683,058 |
AngloGold Ashanti Ltd. | 89,100 | | 4,178,796 |
AngloGold Ashanti Ltd. sponsored ADR | 47,100 | | 2,218,881 |
Aspen Pharmacare Holdings Ltd. | 219,026 | | 2,923,453 |
Clicks Group Ltd. | 409,078 | | 2,668,770 |
Foschini Ltd. | 273,866 | | 3,324,291 |
Imperial Holdings Ltd. | 7,072 | | 115,342 |
Mr Price Group Ltd. | 419,577 | | 3,813,002 |
Mvelaphanda Resources Ltd. (a) | 487,559 | | 3,187,729 |
Shoprite Holdings Ltd. | 278,600 | | 3,938,155 |
Standard Bank Group Ltd. | 446,933 | | 6,590,699 |
Wilson Bayly Holmes-Ovcon Ltd. | 58,277 | | 1,126,265 |
Woolworths Holdings Ltd. | 953,361 | | 3,735,842 |
TOTAL SOUTH AFRICA | | 45,594,626 |
Spain - 0.3% |
Banco Bilbao Vizcaya Argentaria SA sponsored ADR | 97,554 | | 1,282,835 |
Banco Santander SA sponsored ADR | 50,900 | | 652,029 |
TOTAL SPAIN | | 1,934,864 |
Taiwan - 6.9% |
Advanced Semiconductor Engineering, Inc. | 775,432 | | 675,139 |
Advanced Semiconductor Engineering, Inc. sponsored ADR (d) | 630,574 | | 2,793,443 |
Alpha Networks, Inc. | 1,180,000 | | 1,048,718 |
Asia Cement Corp. | 2,885,926 | | 2,975,036 |
Chroma ATE, Inc. | 570,393 | | 1,468,615 |
Farglory Land Development Co. Ltd. | 477,000 | | 1,184,512 |
Formosa Plastics Corp. | 2,177,000 | | 6,245,404 |
Fubon Financial Holding Co. Ltd. | 3,399,726 | | 4,165,650 |
HTC Corp. | 372,050 | | 8,400,149 |
Common Stocks - continued |
| Shares | | Value |
Taiwan - continued |
Huaku Development Co. Ltd. | 333,000 | | $ 923,761 |
Macronix International Co. Ltd. | 5,707,061 | | 3,515,050 |
Pegatron Corp. (a) | 1,245,000 | | 1,686,171 |
Ruentex Development Co. Ltd. | 378,000 | | 627,427 |
Taishin Financial Holdings Co. Ltd. | 8,750,130 | | 3,831,130 |
Taiwan Cement Corp. | 1,518,000 | | 1,616,952 |
Taiwan Semiconductor Manufacturing Co. Ltd. | 1,581,534 | | 3,255,464 |
Unimicron Technology Corp. | 420,000 | | 714,981 |
Wistron Corp. | 2,087,499 | | 4,290,269 |
TOTAL TAIWAN | | 49,417,871 |
Thailand - 1.4% |
Advanced Info Service PCL (For. Reg.) | 840,400 | | 2,526,253 |
Banpu PCL (For. Reg.) | 71,400 | | 1,845,812 |
BEC World PCL (For. Reg.) | 1,219,500 | | 1,354,321 |
Siam Commercial Bank PCL (For. Reg.) | 1,287,200 | | 4,406,747 |
Total Access Communication PCL (For. Reg.) | 14,600 | | 20,481 |
TOTAL THAILAND | | 10,153,614 |
Turkey - 3.2% |
Enka Insaat ve Sanayi AS | 325,222 | | 1,485,187 |
Sinpas Gayrimenkul Yatirim Ortakligi AS (a) | 631,000 | | 959,060 |
Tofas Turk Otomobil Fabrikasi AS | 501,202 | | 2,778,049 |
Turk Hava Yollari AO | 1,166,142 | | 4,837,583 |
Turkiye Garanti Bankasi AS | 1,458,375 | | 8,947,710 |
Turkiye Halk Bankasi AS | 360,000 | | 3,639,406 |
TOTAL TURKEY | | 22,646,995 |
United Arab Emirates - 0.3% |
DP World Ltd. | 3,301,483 | | 1,977,588 |
United Kingdom - 0.8% |
Hikma Pharmaceuticals PLC | 204,043 | | 2,569,493 |
Xstrata PLC | 172,825 | | 3,349,004 |
TOTAL UNITED KINGDOM | | 5,918,497 |
United States of America - 0.7% |
CTC Media, Inc. | 92,000 | | 2,171,200 |
Freeport-McMoRan Copper & Gold, Inc. | 33,122 | | 3,135,991 |
TOTAL UNITED STATES OF AMERICA | | 5,307,191 |
TOTAL COMMON STOCKS (Cost $538,959,000) | 700,740,706 |
Money Market Funds - 4.5% |
| Shares | | Value |
Fidelity Cash Central Fund, 0.23% (b) | 5,123,487 | | $ 5,123,487 |
Fidelity Securities Lending Cash Central Fund, 0.24% (b)(c) | 26,828,675 | | 26,828,675 |
TOTAL MONEY MARKET FUNDS (Cost $31,952,162) | 31,952,162 |
TOTAL INVESTMENT PORTFOLIO - 102.6% (Cost $570,911,162) | | 732,692,868 |
NET OTHER ASSETS (LIABILITIES) - (2.6)% | | (18,646,437) |
NET ASSETS - 100% | $ 714,046,431 |
Legend |
(a) Non-income producing |
(b) Affiliated fund that is available only to investment companies and other accounts managed by Fidelity Investments. The rate quoted is the annualized seven-day yield of the fund at period end. A complete unaudited listing of the fund's holdings as of its most recent quarter end is available upon request. In addition, each Fidelity Central Fund's financial statements, which are not covered by the Fund's report of Independent Registered Public Accounting Firm, are available on the SEC's website or upon request. |
(c) Investment made with cash collateral received from securities on loan. |
(d) Security or a portion of the security is on loan at period end. |
(e) Security exempt from registration under Rule 144A of the Securities Act of 1933. These securities may be resold in transactions exempt from registration, normally to qualified institutional buyers. At the end of the period, the value of these securities amounted to $420,750 or 0.1% of net assets. |
Affiliated Central Funds |
Information regarding fiscal year to date income earned by the Fund from investments in Fidelity Central Funds is as follows: |
Fund | Income earned |
Fidelity Cash Central Fund | $ 28,975 |
Fidelity Securities Lending Cash Central Fund | 119,973 |
Total | $ 148,948 |
Other Information |
The following is a summary of the inputs used, as of October 31, 2010, involving the Fund's assets and liabilities carried at fair value. The inputs or methodology used for valuing securities may not be an indication of the risk associated with investing in those securities. For more information on valuation inputs, and their aggregation into the levels used in the tables below, please refer to the Security Valuation section in the accompanying Notes to Financial Statements. |
Valuation Inputs at Reporting Date: |
Description | Total | Level 1 | Level 2 | Level 3 |
Investments in Securities: | | | | |
Equities: | | | | |
Brazil | $ 96,023,273 | $ 95,309,071 | $ 714,202 | $ - |
Korea (South) | 83,941,483 | 81,286,907 | 2,654,576 | - |
India | 61,906,097 | 57,423,892 | 4,482,205 | - |
China | 56,912,997 | 56,912,997 | - | - |
Russia | 56,626,748 | 56,626,748 | - | - |
Taiwan | 49,417,871 | 45,487,268 | 3,930,603 | - |
South Africa | 45,594,626 | 41,415,830 | 4,178,796 | - |
Indonesia | 43,030,971 | 43,030,971 | - | - |
Hong Kong | 28,719,406 | 8,133,611 | 20,585,795 | - |
Other | 178,567,234 | 178,544,683 | 22,551 | - |
Money Market Funds | 31,952,162 | 31,952,162 | - | - |
Total Investments in Securities: | $ 732,692,868 | $ 696,124,140 | $ 36,568,728 | $ - |
The following is a reconciliation of Investments in Securities for which Level 3 inputs were used in determining value: |
Investments in Securities: | |
Beginning Balance | $ 8,214 |
Total Realized Gain (Loss) | (585,848) |
Total Unrealized Gain (Loss) | 586,553 |
Cost of Purchases | - |
Proceeds of Sales | (8,919) |
Amortization/Accretion | - |
Transfers in to Level 3 | - |
Transfers out of Level 3 | - |
Ending Balance | $ - |
The change in unrealized gain (loss) for the period attributable to Level 3 securities held at October 31, 2010 | $ - |
The information used in the above reconciliation represents fiscal year to date activity for any Investments in Securities identified as using Level 3 inputs at either the beginning or the end of the current fiscal period. Transfers in or out of Level 3 represent the beginning value of any Security or Instrument where a change in the pricing level occurred from the beginning to the end of the period. The cost of purchases and the proceeds of sales may include securities received or delivered through corporate actions or exchanges. Realized and unrealized gains (losses) disclosed in the reconciliation are included in Net Gain (Loss) on the Fund's Statement of Operations. |
Income Tax Information |
At October 31, 2010, the Fund had a capital loss carryforward of approximately $120,287,626 of which $34,783,611 and $85,504,015 will expire on October 31, 2016 and 2017, respectively. Capital loss carryforwards are only available to offset future capital gains of the Fund to the extent provided by regulations and may be limited. |
See accompanying notes which are an integral part of the financial statements.
Annual Report
Statement of Assets and Liabilities
| October 31, 2010 |
| | |
Assets | | |
Investment in securities, at value (including securities loaned of $26,322,895) - See accompanying schedule: Unaffiliated issuers (cost $538,959,000) | $ 700,740,706 | |
Fidelity Central Funds (cost $31,952,162) | 31,952,162 | |
Total Investments (cost $570,911,162) | | $ 732,692,868 |
Foreign currency held at value (cost $187,486) | | 187,770 |
Receivable for investments sold | | 3,626,831 |
Receivable for fund shares sold | | 8,035,226 |
Dividends receivable | | 1,069,669 |
Distributions receivable from Fidelity Central Funds | | 11,993 |
Other receivables | | 832,392 |
Total assets | | 746,456,749 |
| | |
Liabilities | | |
Payable for investments purchased | $ 2,978,374 | |
Payable for fund shares redeemed | 982,818 | |
Accrued management fee | 473,883 | |
Distribution and service plan fees payable | 215,399 | |
Other affiliated payables | 180,343 | |
Other payables and accrued expenses | 750,826 | |
Collateral on securities loaned, at value | 26,828,675 | |
Total liabilities | | 32,410,318 |
| | |
Net Assets | | $ 714,046,431 |
Net Assets consist of: | | |
Paid in capital | | $ 678,638,691 |
Undistributed net investment income | | 2,876,119 |
Accumulated undistributed net realized gain (loss) on investments and foreign currency transactions | | (128,693,728) |
Net unrealized appreciation (depreciation) on investments and assets and liabilities in foreign currencies | | 161,225,349 |
Net Assets | | $ 714,046,431 |
See accompanying notes which are an integral part of the financial statements.
Annual Report
Statement of Assets and Liabilities - continued
| October 31, 2010 |
| | |
Calculation of Maximum Offering Price
Class A:
Net Asset Value and redemption price per share ($286,969,778 ÷ 12,101,328 shares) | | $ 23.71 |
| | |
Maximum offering price per share (100/94.25 of $23.71) | | $ 25.16 |
Class T:
Net Asset Value and redemption price per share ($104,416,924 ÷ 4,422,172 shares) | | $ 23.61 |
| | |
Maximum offering price per share (100/96.50 of $23.61) | | $ 24.47 |
Class B:
Net Asset Value and offering price per share ($31,159,412 ÷ 1,346,506 shares)A | | $ 23.14 |
| | |
Class C:
Net Asset Value and offering price per share ($106,710,959 ÷ 4,613,748 shares)A | | $ 23.13 |
| | |
Institutional Class:
Net Asset Value, offering price and redemption price per share ($184,789,358 ÷ 7,742,088 shares) | | $ 23.87 |
A Redemption price per share is equal to net asset value less any applicable contingent deferred sales charge.
See accompanying notes which are an integral part of the financial statements.
Annual Report
Financial Statements - continued
Statement of Operations
| Year ended October 31, 2010 |
| | |
Investment Income | | |
Dividends | | $ 14,303,797 |
Income from Fidelity Central Funds | | 148,948 |
Income before foreign taxes withheld | | 14,452,745 |
Less foreign taxes withheld | | (1,608,281) |
Total income | | 12,844,464 |
| | |
Expenses | | |
Management fee | $ 4,957,849 | |
Transfer agent fees | 1,781,912 | |
Distribution and service plan fees | 2,354,595 | |
Accounting and security lending fees | 311,201 | |
Custodian fees and expenses | 652,462 | |
Independent trustees' compensation | 3,385 | |
Registration fees | 103,644 | |
Audit | 76,774 | |
Legal | 2,774 | |
Miscellaneous | 7,369 | |
Total expenses before reductions | 10,251,965 | |
Expense reductions | (332,640) | 9,919,325 |
Net investment income (loss) | | 2,925,139 |
Realized and Unrealized Gain (Loss) Net realized gain (loss) on: | | |
Investment securities: | | |
Unaffiliated issuers | 52,271,092 | |
Foreign currency transactions | (745,666) | |
Total net realized gain (loss) | | 51,525,426 |
Change in net unrealized appreciation (depreciation) on: Investment securities (net of decrease in deferred foreign taxes of $135,635) | 78,542,670 | |
Assets and liabilities in foreign currencies | (9,023) | |
Total change in net unrealized appreciation (depreciation) | | 78,533,647 |
Net gain (loss) | | 130,059,073 |
Net increase (decrease) in net assets resulting from operations | | $ 132,984,212 |
See accompanying notes which are an integral part of the financial statements.
Annual Report
Statement of Changes in Net Assets
| Year ended
October 31,
2010 | Year ended
October 31,
2009 |
Increase (Decrease) in Net Assets | | |
Operations | | |
Net investment income (loss) | $ 2,925,139 | $ 2,011,330 |
Net realized gain (loss) | 51,525,426 | (85,535,731) |
Change in net unrealized appreciation (depreciation) | 78,533,647 | 248,506,280 |
Net increase (decrease) in net assets resulting
from operations | 132,984,212 | 164,981,879 |
Distributions to shareholders from net investment income | (1,614,133) | (2,545,671) |
Distributions to shareholders from net realized gain | (3,680,474) | - |
Total distributions | (5,294,607) | (2,545,671) |
Share transactions - net increase (decrease) | 64,839,760 | 78,864,198 |
Redemption fees | 140,252 | 123,947 |
Total increase (decrease) in net assets | 192,669,617 | 241,424,353 |
| | |
Net Assets | | |
Beginning of period | 521,376,814 | 279,952,461 |
End of period (including undistributed net investment income of $2,876,119 and undistributed net investment income of $1,565,113, respectively) | $ 714,046,431 | $ 521,376,814 |
See accompanying notes which are an integral part of the financial statements.
Annual Report
Financial Highlights - Class A
Years ended October 31, | 2010 | 2009 | 2008 | 2007 | 2006 |
Selected Per-Share Data | | | | | |
Net asset value, beginning of period | $ 19.20 | $ 12.59 | $ 32.75 | $ 19.22 | $ 13.75 |
Income from Investment Operations | | | | | |
Net investment income (loss) C | .12 | .10 | .24 | .09 | .09 |
Net realized and unrealized gain (loss) | 4.59 | 6.64 | (19.61) | 13.46 | 5.47 |
Total from investment operations | 4.71 | 6.74 | (19.37) | 13.55 | 5.56 |
Distributions from net investment income | (.07) | (.14) | (.02) | (.03) | (.11) |
Distributions from net realized gain | (.13) | - | (.79) | - | - |
Total distributions | (.20) | (.14) | (.81) | (.03) | (.11) |
Redemption fees added to paid in capital C | - G | .01 | .02 | .01 | .02 |
Net asset value, end of period | $ 23.71 | $ 19.20 | $ 12.59 | $ 32.75 | $ 19.22 |
Total Return A, B | 24.69% | 54.54% | (60.55)% | 70.63% | 40.75% |
Ratios to Average Net Assets D, F | | | | | |
Expenses before reductions | 1.56% | 1.60% | 1.59% | 1.59% | 1.84% |
Expenses net of fee waivers, if any | 1.56% | 1.60% | 1.59% | 1.59% | 1.60% |
Expenses net of all reductions | 1.50% | 1.53% | 1.53% | 1.54% | 1.49% |
Net investment income (loss) | .59% | .70% | .94% | .36% | .51% |
Supplemental Data | | | | | |
Net assets, end of period (000 omitted) | $ 286,970 | $ 216,187 | $ 122,911 | $ 218,836 | $ 68,232 |
Portfolio turnover rate E | 86% | 85% | 61% | 48% | 48% |
A Total returns would have been lower had certain expenses not been reduced during the periods shown.
B Total returns do not include the effect of the sales charges.
C Calculated based on average shares outstanding during the period.
D Fees and expenses of the underlying Fidelity Central Funds are not included in the Fund's expense ratio. The Fund indirectly bears its proportionate share of the expenses of any underlying Fidelity Central Funds.
E Amount does not include the portfolio activity of any underlying Fidelity Central Funds.
F Expense ratios reflect operating expenses of the class. Expenses before reductions do not reflect amounts reimbursed by the investment adviser or reductions from brokerage service arrangements or reductions from other expense offset arrangements and do not represent the amount paid by the class during periods when reimbursements or reductions occur. Expenses net of fee waivers reflect expenses after reimbursement by the investment adviser but prior to reductions from brokerage service arrangements or other expense offset arrangements. Expenses net of all reductions represent the net expenses paid by the class.
G Amount represents less than $.01 per share.
See accompanying notes which are an integral part of the financial statements.
Annual Report
Financial Highlights - Class T
Years ended October 31, | 2010 | 2009 | 2008 | 2007 | 2006 |
Selected Per-Share Data | | | | | |
Net asset value, beginning of period | $ 19.14 | $ 12.49 | $ 32.52 | $ 19.10 | $ 13.69 |
Income from Investment Operations | | | | | |
Net investment income (loss) C | .07 | .07 | .17 | .03 | .05 |
Net realized and unrealized gain (loss) | 4.57 | 6.64 | (19.48) | 13.38 | 5.43 |
Total from investment operations | 4.64 | 6.71 | (19.31) | 13.41 | 5.48 |
Distributions from net investment income | (.04) | (.07) | - | - | (.09) |
Distributions from net realized gain | (.13) | - | (.74) | - | - |
Total distributions | (.17) | (.07) | (.74) | - | (.09) |
Redemption fees added to paid in capital C | - G | .01 | .02 | .01 | .02 |
Net asset value, end of period | $ 23.61 | $ 19.14 | $ 12.49 | $ 32.52 | $ 19.10 |
Total Return A, B | 24.38% | 54.17% | (60.66)% | 70.26% | 40.32% |
Ratios to Average Net Assets D, F | | | | | |
Expenses before reductions | 1.81% | 1.87% | 1.84% | 1.86% | 2.12% |
Expenses net of fee waivers, if any | 1.81% | 1.85% | 1.84% | 1.85% | 1.85% |
Expenses net of all reductions | 1.76% | 1.78% | 1.79% | 1.79% | 1.74% |
Net investment income (loss) | .33% | .44% | .69% | .11% | .26% |
Supplemental Data | | | | | |
Net assets, end of period (000 omitted) | $ 104,417 | $ 86,959 | $ 47,300 | $ 119,952 | $ 41,369 |
Portfolio turnover rate E | 86% | 85% | 61% | 48% | 48% |
A Total returns would have been lower had certain expenses not been reduced during the periods shown.
B Total returns do not include the effect of the sales charges.
C Calculated based on average shares outstanding during the period.
D Fees and expenses of the underlying Fidelity Central Funds are not included in the Fund's expense ratio. The Fund indirectly bears its proportionate share of the expenses of any underlying Fidelity Central Funds.
E Amount does not include the portfolio activity of any underlying Fidelity Central Funds.
F Expense ratios reflect operating expenses of the class. Expenses before reductions do not reflect amounts reimbursed by the investment adviser or reductions from brokerage service arrangements or reductions from other expense offset arrangements and do not represent the amount paid by the class during periods when reimbursements or reductions occur. Expenses net of fee waivers reflect expenses after reimbursement by the investment adviser but prior to reductions from brokerage service arrangements or other expense offset arrangements. Expenses net of all reductions represent the net expenses paid by the class.
G Amount represents less than $.01 per share.
See accompanying notes which are an integral part of the financial statements.
Annual Report
Financial Highlights - Class B
Years ended October 31, | 2010 | 2009 | 2008 | 2007 | 2006 |
Selected Per-Share Data | | | | | |
Net asset value, beginning of period | $ 18.80 | $ 12.26 | $ 32.03 | $ 18.91 | $ 13.58 |
Income from Investment Operations | | | | | |
Net investment income (loss) C | (.03) | (.01) | .04 | (.09) | (.04) |
Net realized and unrealized gain (loss) | 4.49 | 6.55 | (19.13) | 13.20 | 5.40 |
Total from investment operations | 4.46 | 6.54 | (19.09) | 13.11 | 5.36 |
Distributions from net investment income | - | - | - | - | (.05) |
Distributions from net realized gain | (.12) | - | (.70) | - | - |
Total distributions | (.12) | - | (.70) | - | (.05) |
Redemption fees added to paid in capital C | - G | - G | .02 | .01 | .02 |
Net asset value, end of period | $ 23.14 | $ 18.80 | $ 12.26 | $ 32.03 | $ 18.91 |
Total Return A, B | 23.77% | 53.34% | (60.83)% | 69.38% | 39.67% |
Ratios to Average Net Assets D, F | | | | | |
Expenses before reductions | 2.32% | 2.36% | 2.35% | 2.37% | 2.66% |
Expenses net of fee waivers, if any | 2.32% | 2.35% | 2.35% | 2.35% | 2.35% |
Expenses net of all reductions | 2.26% | 2.28% | 2.30% | 2.29% | 2.24% |
Net investment income (loss) | (.17)% | (.05)% | .18% | (.39)% | (.24)% |
Supplemental Data | | | | | |
Net assets, end of period (000 omitted) | $ 31,159 | $ 27,580 | $ 17,307 | $ 41,042 | $ 18,622 |
Portfolio turnover rate E | 86% | 85% | 61% | 48% | 48% |
A Total returns would have been lower had certain expenses not been reduced during the periods shown.
B Total returns do not include the effect of the contingent deferred sales charge.
C Calculated based on average shares outstanding during the period.
D Fees and expenses of the underlying Fidelity Central Funds are not included in the Fund's expense ratio. The Fund indirectly bears its proportionate share of the expenses of any underlying Fidelity Central Funds.
E Amount does not include the portfolio activity of any underlying Fidelity Central Funds.
F Expense ratios reflect operating expenses of the class. Expenses before reductions do not reflect amounts reimbursed by the investment adviser or reductions from brokerage service arrangements or reductions from other expense offset arrangements and do not represent the amount paid by the class during periods when reimbursements or reductions occur. Expenses net of fee waivers reflect expenses after reimbursement by the investment adviser but prior to reductions from brokerage service arrangements or other expense offset arrangements. Expenses net of all reductions represent the net expenses paid by the class.
G Amount represents less than $.01 per share.
See accompanying notes which are an integral part of the financial statements.
Annual Report
Financial Highlights - Class C
Years ended October 31, | 2010 | 2009 | 2008 | 2007 | 2006 |
Selected Per-Share Data | | | | | |
Net asset value, beginning of period | $ 18.80 | $ 12.26 | $ 32.04 | $ 18.91 | $ 13.59 |
Income from Investment Operations | | | | | |
Net investment income (loss) C | (.03) | (.01) | .05 | (.09) | (.04) |
Net realized and unrealized gain (loss) | 4.49 | 6.54 | (19.15) | 13.21 | 5.39 |
Total from investment operations | 4.46 | 6.53 | (19.10) | 13.12 | 5.35 |
Distributions from net investment income | - | - | - | - | (.05) |
Distributions from net realized gain | (.13) | - | (.70) | - | - |
Total distributions | (.13) | - | (.70) | - | (.05) |
Redemption fees added to paid in capital C | - G | .01 | .02 | .01 | .02 |
Net asset value, end of period | $ 23.13 | $ 18.80 | $ 12.26 | $ 32.04 | $ 18.91 |
Total Return A, B | 23.80% | 53.34% | (60.84)% | 69.43% | 39.59% |
Ratios to Average Net Assets D, F | | | | | |
Expenses before reductions | 2.30% | 2.34% | 2.34% | 2.34% | 2.58% |
Expenses net of fee waivers, if any | 2.30% | 2.34% | 2.34% | 2.34% | 2.35% |
Expenses net of all reductions | 2.24% | 2.28% | 2.29% | 2.29% | 2.24% |
Net investment income (loss) | (.15)% | (.05)% | .19% | (.39)% | (.24)% |
Supplemental Data | | | | | |
Net assets, end of period (000 omitted) | $ 106,711 | $ 83,939 | $ 44,878 | $ 104,885 | $ 42,805 |
Portfolio turnover rate E | 86% | 85% | 61% | 48% | 48% |
A Total returns would have been lower had certain expenses not been reduced during the periods shown.
B Total returns do not include the effect of the contingent deferred sales charge.
C Calculated based on average shares outstanding during the period.
D Fees and expenses of the underlying Fidelity Central Funds are not included in the Fund's expense ratio. The Fund indirectly bears its proportionate share of the expenses of any underlying Fidelity Central Funds.
E Amount does not include the portfolio activity of any underlying Fidelity Central Funds.
F Expense ratios reflect operating expenses of the class. Expenses before reductions do not reflect amounts reimbursed by the investment adviser or reductions from brokerage service arrangements or reductions from other expense offset arrangements and do not represent the amount paid by the class during periods when reimbursements or reductions occur. Expenses net of fee waivers reflect expenses after reimbursement by the investment adviser but prior to reductions from brokerage service arrangements or other expense offset arrangements. Expenses net of all reductions represent the net expenses paid by the class.
G Amount represents less than $.01 per share.
See accompanying notes which are an integral part of the financial statements.
Annual Report
Financial Highlights - Institutional Class
Years ended October 31, | 2010 | 2009 | 2008 | 2007 | 2006 |
Selected Per-Share Data | | | | | |
Net asset value, beginning of period | $ 19.29 | $ 12.71 | $ 33.02 | $ 19.34 | $ 13.80 |
Income from Investment Operations | | | | | |
Net investment income (loss) B | .20 | .15 | .31 | .18 | .14 |
Net realized and unrealized gain (loss) | 4.62 | 6.65 | (19.76) | 13.55 | 5.49 |
Total from investment operations | 4.82 | 6.80 | (19.45) | 13.73 | 5.63 |
Distributions from net investment income | (.11) | (.23) | (.09) | (.06) | (.11) |
Distributions from net realized gain | (.13) | - | (.79) | - | - |
Total distributions | (.24) | (.23) | (.88) | (.06) | (.11) |
Redemption fees added to paid in capital B | - F | .01 | .02 | .01 | .02 |
Net asset value, end of period | $ 23.87 | $ 19.29 | $ 12.71 | $ 33.02 | $ 19.34 |
Total Return A | 25.15% | 54.97% | (60.42)% | 71.23% | 41.11% |
Ratios to Average Net Assets C, E | | | | | |
Expenses before reductions | 1.22% | 1.30% | 1.27% | 1.25% | 1.47% |
Expenses net of fee waivers, if any | 1.22% | 1.30% | 1.27% | 1.25% | 1.35% |
Expenses net of all reductions | 1.17% | 1.23% | 1.21% | 1.19% | 1.24% |
Net investment income (loss) | .93% | .99% | 1.26% | .71% | .75% |
Supplemental Data | | | | | |
Net assets, end of period (000 omitted) | $ 184,789 | $ 106,713 | $ 47,557 | $ 52,011 | $ 9,172 |
Portfolio turnover rate D | 86% | 85% | 61% | 48% | 48% |
A Total returns would have been lower had certain expenses not been reduced during the periods shown.
B Calculated based on average shares outstanding during the period.
C Fees and expenses of the underlying Fidelity Central Funds are not included in the Fund's expense ratio. The Fund indirectly bears its proportionate share of the expenses of any underlying Fidelity Central Funds.
D Amount does not include the portfolio activity of any underlying Fidelity Central Funds.
E Expense ratios reflect operating expenses of the class. Expenses before reductions do not reflect amounts reimbursed by the investment adviser or reductions from brokerage service arrangements or reductions from other expense offset arrangements and do not represent the amount paid by the class during periods when reimbursements or reductions occur. Expenses net of fee waivers reflect expenses after reimbursement by the investment adviser but prior to reductions from brokerage service arrangements or other expense offset arrangements. Expenses net of all reductions represent the net expenses paid by the class.
F Amount represents less than $.01 per share.
See accompanying notes which are an integral part of the financial statements.
Annual Report
Notes to Financial Statements
For the period ended October 31, 2010
1. Organization.
Fidelity Advisor Emerging Markets Fund (the Fund) is a fund of Fidelity Advisor Series VIII (the Trust) and is authorized to issue an unlimited number of shares. The Trust is registered under the Investment Company Act of 1940, as amended (the 1940 Act), as an open-end management investment company organized as a Massachusetts business trust. The Fund offers Class A, Class T, Class C and Institutional Class shares, each of which has equal rights as to assets and voting privileges. Effective after the close of business on September 1, 2010, Class B shares were closed to new accounts and additional purchases by existing shareholders. Each class has exclusive voting rights with respect to matters that affect that class. Class B shares will automatically convert to Class A shares after a holding period of seven years from the initial date of purchase. Investment income, realized and unrealized capital gains and losses, the common expenses of the Fund, and certain fund-level expense reductions, if any, are allocated on a pro-rata basis to each class based on the relative net assets of each class to the total net assets of the Fund. Each class differs with respect to transfer agent and distribution and service plan fees incurred. Certain expense reductions also differ by class. The Fund's investments in emerging markets can be subject to social, economic, regulatory, and political uncertainties and can be extremely volatile.
2. Investments in Fidelity Central Funds.
The Fund may invest in Fidelity Central Funds, which are open-end investment companies available only to other investment companies and accounts managed by Fidelity Management & Research Company (FMR) and its affiliates. The Fund's Schedule of Investments lists each of the Fidelity Central Funds held as of period end, if any, as an investment of the Fund, but does not include the underlying holdings of each Fidelity Central Fund. As an Investing Fund, the Fund indirectly bears its proportionate share of the expenses of the underlying Fidelity Central Funds.
The Money Market Central Funds seek preservation of capital and current income and are managed by Fidelity Investments Money Management, Inc. (FIMM), an affiliate of FMR.
A complete unaudited list of holdings for each Fidelity Central Fund is available upon request or at the Securities and Exchange Commission (the SEC) web site at www.sec.gov. In addition, the financial statements of the Fidelity Central Funds, which are not covered by the Fund's Report of Independent Registered Public Accounting Firm, are available on the SEC web site or upon request.
Annual Report
Notes to Financial Statements - continued
3. Significant Accounting Policies.
The financial statements have been prepared in conformity with accounting principles generally accepted in the United States of America (GAAP), which require management to make certain estimates and assumptions at the date of the financial statements. Actual results could differ from those estimates. The following summarizes the significant accounting policies of the Fund:
Security Valuation. Investments are valued as of 4:00 p.m. Eastern time on the last calendar day of the period. The Fund uses independent pricing services approved by the Board of Trustees to value its investments. When current market prices or quotations are not readily available or reliable, valuations may be determined in good faith in accordance with procedures adopted by the Board of Trustees. Factors used in determining value may include market or security specific events. The frequency with which these procedures are used cannot be predicted and they may be utilized to a significant extent. The value used for net asset value (NAV) calculation under these procedures may differ from published prices for the same securities.
The Fund categorizes the inputs to valuation techniques used to value its investments into a disclosure hierarchy consisting of three levels as shown below.
Level 1 - quoted prices in active markets for identical investments
Level 2 - other significant observable inputs (including quoted prices for similar investments, interest rates, prepayment speeds, etc.)
Level 3 - unobservable inputs (including the fund's own assumptions based on the best information available)
Changes in valuation techniques may result in transfers in or out of an assigned level within the disclosure hierarchy. The aggregate value of investments by input level, as of October 31, 2010, as well as a roll forward of Level 3 securities, is included at the end of the Fund's Schedule of Investments. Valuation techniques used to value the Fund's investments by major category are as follows.
Equity securities, including restricted securities, for which market quotations are readily available, are valued at the last reported sale price or official closing price as reported by an independent pricing service on the primary market or exchange on which they are traded and are categorized as Level 1 in the hierarchy. In the event there were no sales during the day or closing prices are not available, securities are valued at the last quoted bid price or may be valued using the last available price and are generally categorized as Level 2 in the hierarchy. For foreign equity securities, when significant market or security specific events arise, comparisons to the valuation of American Depositary Receipts (ADRs), futures contracts, Exchange-traded funds (ETFs) and certain indexes as well as quoted prices for similar securities are used and are categorized as Level 2 in the
Annual Report
3. Significant Accounting Policies - continued
Security Valuation - continued
hierarchy in these circumstances. Utilizing these techniques may result in significant transfers between Level 1 and Level 2. For restricted equity securities and private placements where observable inputs are limited, assumptions about market activity and risk are used and are categorized as Level 3 in the hierarchy.
Investments in open-end mutual funds, including the Fidelity Central Funds, are valued at their closing net asset value each business day and are categorized as Level 1 in the hierarchy. Short-term securities with remaining maturities of sixty days or less for which quotations are not readily available are valued at amortized cost, which approximates fair value and are categorized as Level 2 in the hierarchy.
Foreign Currency. The Fund uses foreign currency contracts to facilitate transactions in foreign-denominated securities. Gains and losses from these transactions may arise from changes in the value of the foreign currency or if the counterparties do not perform under the contracts' terms.
Foreign-denominated assets, including investment securities, and liabilities are translated into U.S. dollars at the exchange rate at period end. Purchases and sales of investment securities, income and dividends received and expenses denominated in foreign currencies are translated into U.S. dollars at the exchange rate in effect on the transaction date.
The effects of exchange rate fluctuations on investments are included with the net realized and unrealized gain (loss) on investment securities. Other foreign currency transactions resulting in realized and unrealized gain (loss) are disclosed separately.
Investment Transactions and Income. For financial reporting purposes, the Fund's investment holdings and NAV include trades executed through the end of the last business day of the period. The NAV per share for processing shareholder transactions is calculated as of the close of business of the New York Stock Exchange (NYSE), normally 4:00 p.m. Eastern time and includes trades executed through the end of the prior business day. Gains and losses on securities sold are determined on the basis of identified cost. Dividend income is recorded on the ex-dividend date, except for certain dividends from foreign securities where the ex-dividend date may have passed, which are recorded as soon as the Fund is informed of the ex-dividend date. Non-cash dividends included in dividend income, if any, are recorded at the fair market value of the securities received. Distributions received on securities that represent a return of capital or capital gain are recorded as a reduction of cost of investments and/or as a realized gain. The Fund estimates the components of distributions received that may be considered return of capital distributions or capital gain distributions. Interest income and distributions from
Annual Report
Notes to Financial Statements - continued
3. Significant Accounting Policies - continued
Investment Transactions and Income - continued
the Fidelity Central Funds are accrued as earned. Interest income includes coupon interest and amortization of premium and accretion of discount on debt securities. Investment income is recorded net of foreign taxes withheld where recovery of such taxes is uncertain.
Expenses. Most expenses of the Trust can be directly attributed to a fund. Expenses which cannot be directly attributed are apportioned amongst each fund in the Trust. Expense estimates are accrued in the period to which they relate and adjustments are made when actual amounts are known.
Income Tax Information and Distributions to Shareholders. Each year the Fund intends to qualify as a regulated investment company, including distributing substantially all of its taxable income and realized gains under Subchapter M of the Internal Revenue Code and filing its U.S. federal tax return. As a result, no provision for income taxes is required. As of October 31, 2010, the Fund did not have any unrecognized tax benefits in the accompanying financial statements. A fund's federal tax return is subject to examination by the Internal Revenue Service (IRS) for a period of three years. Foreign taxes are provided for based on the Fund's understanding of the tax rules and rates that exist in the foreign markets in which it invests. The Fund is subject to a tax imposed on short term capital gains on securities of certain issuers domiciled in India. The Fund records an estimated deferred tax liability included in Other payables and accrued expenses in the accompanying Statement of Assets & Liabilities for net unrealized gains on these securities in an amount that would be payable if the securities were disposed of at period end.
Distributions are declared and recorded on the ex-dividend date. Income dividends and capital gain distributions are declared separately for each class. Income and capital gain distributions are determined in accordance with income tax regulations, which may differ from GAAP.
Capital accounts within the financial statements are adjusted for permanent book-tax differences. These adjustments have no impact on net assets or the results of operations. Temporary book-tax differences will reverse in a subsequent period.
Book-tax differences are primarily due to the short-term gain distributions from the Fidelity Central Funds, foreign currency transactions, passive foreign investment companies (PFIC), capital loss carryforwards, and losses deferred due to wash sales.
Annual Report
3. Significant Accounting Policies - continued
Income Tax Information and Distributions to Shareholders - continued
The federal tax cost of investment securities and unrealized appreciation (depreciation) as of period end were as follows:
Gross unrealized appreciation | $ 164,161,308 |
Gross unrealized depreciation | (14,042,469) |
Net unrealized appreciation (depreciation) | $ 150,118,839 |
| |
Tax Cost | $ 582,574,029 |
The tax-based components of distributable earnings as of period end were as follows:
Undistributed ordinary income | $ 6,152,884 |
Capital loss carryforward | $ (120,287,627) |
Net unrealized appreciation (depreciation) | $ 150,119,484 |
The tax character of distributions paid was as follows:
| October 31, 2010 | October 31, 2009 |
Ordinary Income | $ 5,294,607 | $ 2,545,671 |
Short-Term Trading (Redemption) Fees. Shares held by investors in the Fund less than 90 days are subject to a redemption fee equal to 1.50% of the net asset value of shares redeemed. All redemption fees, which reduce the proceeds of the shareholder redemption, are retained by the Fund and accounted for as an addition to paid in capital.
4. Operating Policies.
Restricted Securities. The Fund may invest in securities that are subject to legal or contractual restrictions on resale. These securities generally may be resold in transactions exempt from registration or to the public if the securities are registered. Disposal of these securities may involve time-consuming negotiations and expense, and prompt sale at an acceptable price may be difficult. Information regarding restricted securities is included at the end of the Fund's Schedule of Investments.
5. Purchases and Sales of Investments.
Purchases and sales of securities, other than short-term securities, aggregated $560,949,603 and $507,918,970, respectively.
Annual Report
Notes to Financial Statements - continued
6. Fees and Other Transactions with Affiliates.
Management Fee. FMR and its affiliates provide the Fund with investment management related services for which the Fund pays a monthly management fee. The management fee is the sum of an individual fund fee rate that is based on an annual rate of .55% of the Fund's average net assets and a group fee rate that averaged .26% during the period. The group fee rate is based upon the average net assets of all the mutual funds advised by FMR. The group fee rate decreases as assets under management increase and increases as assets under management decrease. For the period, the total annual management fee rate was .81% of the Fund's average net assets.
Distribution and Service Plan Fees. In accordance with Rule 12b-1 of the 1940 Act, the Fund has adopted separate Distribution and Service Plans for each class of shares. Certain classes pay Fidelity Distributors Corporation (FDC), an affiliate of FMR, separate Distribution and Service Fees, each of which is based on an annual percentage of each class' average net assets. In addition, FDC may pay financial intermediaries for selling shares of the Fund and providing shareholder support services. For the period, the Distribution and Service Fee rates, total fees and amounts retained by FDC were as follows:
| Distribution
Fee | Service
Fee | Total
Fees | Retained
by FDC |
Class A | 0% | .25% | $ 625,966 | $ 17,708 |
Class T | .25% | .25% | 478,780 | 0 |
Class B | .75% | .25% | 294,152 | 220,741 |
Class C | .75% | .25% | 955,697 | 180,969 |
| | | $ 2,354,595 | $ 419,418 |
Sales Load. FDC receives a front-end sales charge of up to 5.75% for selling Class A shares, and 3.50% for selling Class T shares, some of which is paid to financial intermediaries for selling shares of the Fund. FDC receives the proceeds of contingent deferred sales charges levied on Class A, Class T, Class B, and Class C redemptions. These charges depend on the holding period. The deferred sales charges range from 5% to 1% for Class B, 1% for Class C, 1.00% for certain purchases of Class A shares (1.00% to .50% prior to July 12, 2010) and .25% for certain purchases of Class T shares.
Annual Report
6. Fees and Other Transactions with Affiliates - continued
Sales Load - continued
For the period, sales charge amounts retained by FDC were as follows:
| Retained
by FDC |
Class A | $ 127,111 |
Class T | 25,998 |
Class B* | 69,434 |
Class C* | 13,380 |
| $ 235,923 |
* When Class B and Class C shares are initially sold, FDC pays commissions from its own resources to financial intermediaries through which the sales are made.
Transfer Agent Fees. Fidelity Investments Institutional Operations Company, Inc. (FIIOC), an affiliate of FMR, is the transfer, dividend disbursing and shareholder servicing agent for each class of the Fund. FIIOC receives account fees and asset-based fees that vary according to the account size and type of account of the shareholders of the respective classes of the Fund. FIIOC pays for typesetting, printing and mailing of shareholder reports, except proxy statements. For the period, transfer agent fees for each class were as follows:
| Amount | % of
Average
Net Assets |
Class A | $ 778,041 | .31 |
Class T | 303,226 | .32 |
Class B | 94,288 | .32 |
Class C | 288,716 | .30 |
Institutional Class | 317,641 | .22 |
| $ 1,781,912 | |
Accounting and Security Lending Fees. Fidelity Service Company, Inc. (FSC), an affiliate of FMR, maintains the Fund's accounting records. The accounting fee is based on the level of average net assets for the month. Under a separate contract, FSC administers the security lending program. The security lending fee is based on the number and duration of lending transactions.
Brokerage Commissions. The Fund placed a portion of its portfolio transactions with brokerage firms which are affiliates of the investment adviser. The commissions paid to these affiliated firms were $194 for the period.
Annual Report
Notes to Financial Statements - continued
7. Committed Line of Credit.
The Fund participates with other funds managed by FMR or an affiliate in a $3.75 billion credit facility (the "line of credit") to be utilized for temporary or emergency purposes to fund shareholder redemptions or for other short-term liquidity purposes. The Fund has agreed to pay commitment fees on its pro-rata portion of the line of credit, which amounted to $2,359 and is reflected in Miscellaneous expenses on the Statement of Operations. During the period, there were no borrowings on this line of credit.
8. Security Lending.
The Fund lends portfolio securities through a lending agent from time to time in order to earn additional income. The lending agent may loan securities to certain qualified borrowers, including Fidelity Capital Markets (FCM), a broker-dealer affiliated with the Fund. On the settlement date of the loan, the Fund receives collateral (in the form of U.S. Treasury obligations, letters of credit and/or cash) against the loaned securities and maintains collateral in an amount not less than 100% of the market value of the loaned securities during the period of the loan. The market value of the loaned securities is determined at the close of business of the Fund and any additional required collateral is delivered to the Fund on the next business day. If the borrower defaults on its obligation to return the securities loaned because of insolvency or other reasons, a fund could experience delays and costs in recovering the securities loaned or in gaining access to the collateral. Any cash collateral received is invested in the Fidelity Securities Lending Cash Central Fund. The value of loaned securities and cash collateral at period end are disclosed on the Fund's Statement of Assets and Liabilities. Security lending income represents the income earned on investing cash collateral, less rebates paid to borrowers and lending agent fees associated with the loan, plus any premium payments received for lending certain types of securities. Security lending income is presented in the Statement of Operations as a component of income from Fidelity Central Funds. Total security lending income during the period amounted to $119,973. During the period, there were no securities loaned to FCM.
9. Expense Reductions.
Many of the brokers with whom FMR places trades on behalf of the Fund provided services to the Fund in addition to trade execution. These services included payments of certain expenses on behalf of the Fund totaling $332,640 for the period.
Annual Report
10. Distributions to Shareholders.
Distributions to shareholders of each class were as follows:
Years ended October 31, | 2010 | 2009 |
From net investment income | | |
Class A | $ 823,941 | $ 1,384,374 |
Class T | 194,714 | 245,641 |
Institutional Class | 595,478 | 915,656 |
Total | $ 1,614,133 | $ 2,545,671 |
From net realized gain | | |
Class A | $ 1,543,065 | $ - |
Class T | 631,634 | - |
Class B | 170,009 | - |
Class C | 588,609 | - |
Institutional Class | 747,157 | - |
Total | $ 3,680,474 | $ - |
11. Share Transactions.
Transactions for each class of shares were as follows:
| Shares | Dollars |
Years ended October 31, | 2010 | 2009 | 2010 | 2009 |
Class A | | | | |
Shares sold | 4,968,910 | 5,278,453 | $ 104,602,234 | $ 79,857,327 |
Reinvestment of distributions | 108,006 | 121,361 | 2,258,405 | 1,308,274 |
Shares redeemed | (4,235,043) | (3,903,351) | (87,859,971) | (54,239,793) |
Net increase (decrease) | 841,873 | 1,496,463 | $ 19,000,668 | $ 26,925,808 |
Class T | | | | |
Shares sold | 1,526,646 | 2,313,290 | $ 32,084,382 | $ 33,479,708 |
Reinvestment of distributions | 38,153 | 21,833 | 796,254 | 235,144 |
Shares redeemed | (1,685,925) | (1,578,742) | (34,798,827) | (23,073,162) |
Net increase (decrease) | (121,126) | 756,381 | $ (1,918,191) | $ 10,641,690 |
Class B | | | | |
Shares sold | 284,855 | 451,532 | $ 5,842,113 | $ 6,737,050 |
Reinvestment of distributions | 7,131 | - | 146,541 | - |
Shares redeemed | (412,420) | (396,698) | (8,414,002) | (5,309,719) |
Net increase (decrease) | (120,434) | 54,834 | $ (2,425,348) | $ 1,427,331 |
Class C | | | | |
Shares sold | 1,416,872 | 2,096,953 | $ 29,287,955 | $ 32,821,201 |
Reinvestment of distributions | 24,169 | - | 496,184 | - |
Shares redeemed | (1,291,795) | (1,293,905) | (26,390,410) | (16,362,891) |
Net increase (decrease) | 149,246 | 803,048 | $ 3,393,729 | $ 16,458,310 |
Annual Report
Notes to Financial Statements - continued
11. Share Transactions - continued
| Shares | Dollars |
Years ended October 31, | 2010 | 2009 | 2010 | 2009 |
Institutional Class | | | | |
Shares sold | 4,771,525 | 3,535,627 | $ 100,570,593 | $ 48,287,342 |
Reinvestment of distributions | 25,873 | 38,684 | 542,822 | 418,179 |
Shares redeemed | (2,586,784) | (1,784,638) | (54,324,513) | (25,294,462) |
Net increase (decrease) | 2,210,614 | 1,789,673 | $ 46,788,902 | $ 23,411,059 |
12. Other.
The Fund's organizational documents provide former and current trustees and officers with a limited indemnification against liabilities arising in connection with the performance of their duties to the Fund. In the normal course of business, the Fund may also enter into contracts that provide general indemnifications. The Fund's maximum exposure under these arrangements is unknown as this would be dependent on future claims that may be made against the Fund. The risk of material loss from such claims is considered remote.
Annual Report
To the Trustees of Fidelity Advisor Series VIII and Shareholders of Fidelity Advisor Emerging Markets Fund:
We have audited the accompanying statement of assets and liabilities of Fidelity Advisor Emerging Markets Fund (the Fund), a fund of Fidelity Advisor Series VIII, including the schedule of investments, as of October 31, 2010, and the related statement of operations for the year then ended, the statement of changes in net assets for each of the two years in the period then ended, and the financial highlights for each of the five years in the period then ended. These financial statements and financial highlights are the responsibility of the Fund's management. Our responsibility is to express an opinion on these financial statements and financial highlights based on our audits.
We conducted our audits in accordance with standards of the Public Company Accounting Oversight Board (United States). Those standards require that we plan and perform the audit to obtain reasonable assurance about whether the financial statements and financial highlights are free of material misstatement. The Fund is not required to have, nor were we engaged to perform, an audit of its internal control over financial reporting. Our audits included consideration of internal control over financial reporting as a basis for designing audit procedures that are appropriate in the circumstances, but not for the purpose of expressing an opinion on the effectiveness of the Fund's internal control over financial reporting. Accordingly, we express no such opinion. An audit also includes examining, on a test basis, evidence supporting the amounts and disclosures in the financial statements, assessing the accounting principles used and significant estimates made by management, as well as evaluating the overall financial statement presentation. Our procedures included confirmation of securities owned as of October 31, 2010, by correspondence with the custodians and brokers; where replies were not received from brokers, we performed other auditing procedures. We believe that our audits provide a reasonable basis for our opinion.
In our opinion, the financial statements and financial highlights referred to above present fairly, in all material respects, the financial position of Fidelity Advisor Emerging Markets Fund as of October 31, 2010, the results of its operations for the year then ended, the changes in its net assets for each of the two years in the period then ended, and the financial highlights for each of the five years in the period then ended, in conformity with accounting principles generally accepted in the United States of America.
/s/ Deloitte & Touche LLP
DELOITTE & TOUCHE LLP
Boston, Massachusetts
December 14, 2010
Annual Report
The Trustees, Member of the Advisory Board, and executive officers of the trust and fund, as applicable, are listed below. The Board of Trustees governs the fund and is responsible for protecting the interests of shareholders. The Trustees are experienced executives who meet periodically throughout the year to oversee the fund's activities, review contractual arrangements with companies that provide services to the fund, oversee management of the risks associated with such activities and contractual arrangements, and review the fund's performance. Except for James C. Curvey, each of the Trustees oversees 221 funds advised by FMR or an affiliate. Mr. Curvey oversees 410 funds advised by FMR or an affiliate.
The Trustees hold office without limit in time except that (a) any Trustee may resign; (b) any Trustee may be removed by written instrument, signed by at least two-thirds of the number of Trustees prior to such removal; (c) any Trustee who requests to be retired or who has become incapacitated by illness or injury may be retired by written instrument signed by a majority of the other Trustees; and (d) any Trustee may be removed at any special meeting of shareholders by a two-thirds vote of the outstanding voting securities of the trust. Each Trustee who is not an interested person (as defined in the 1940 Act) (Independent Trustee), shall retire not later than the last day of the calendar year in which his or her 72nd birthday occurs. The Independent Trustees may waive this mandatory retirement age policy with respect to individual Trustees. The executive officers and Advisory Board Member hold office without limit in time, except that any officer and Advisory Board Member may resign or may be removed by a vote of a majority of the Trustees at any regular meeting or any special meeting of the Trustees. Except as indicated, each individual has held the office shown or other offices in the same company for the past five years.
Experience, Skills, Attributes, and Qualifications of the Fund's Trustees. The Governance and Nominating Committee has adopted a statement of policy that describes the experience, qualifications, attributes, and skills that are necessary and desirable for potential Independent Trustee candidates (Statement of Policy). The Board believes that each Trustee satisfied at the time he or she was initially elected or appointed a Trustee, and continues to satisfy, the standards contemplated by the Statement of Policy. The Governance and Nominating Committee also engages professional search firms to help identify potential Independent Trustee candidates who have the experience, qualifications, attributes, and skills consistent with the Statement of Policy. From time to time, additional criteria based on the composition and skills of the current Independent Trustees, as well as experience or skills that may be appropriate in light of future changes to board composition, business conditions, and regulatory or other developments, have also been considered by the professional search firms and the Governance and Nominating Committee. In addition, the Board takes into account the Trustees' commitment and participation in Board and committee meetings, as well as their leadership of standing and ad hoc committees throughout their tenure.
In determining that a particular Trustee was and continues to be qualified to serve as a Trustee, the Board has considered a variety of criteria, none of which, in isolation, was controlling. The Board believes that, collectively, the Trustees have balanced and diverse experience, qualifications, attributes, and skills, which allow the Board to operate effectively in governing the fund and protecting the interests of shareholders. Information about the specific experience, skills, attributes, and qualifications of each Trustee, which in each case led to the Board's conclusion that the Trustee should serve (or continue to serve) as a trustee of the fund, is provided below.
Annual Report
Board Structure and Oversight Function. Edward C. Johnson 3d is an interested person (as defined in the 1940 Act) and currently serves as Chairman. The Trustees have determined that an interested Chairman is appropriate and benefits shareholders because an interested Chairman has a personal and professional stake in the quality and continuity of services provided to the fund. Independent Trustees exercise their informed business judgment to appoint an individual of their choosing to serve as Chairman, regardless of whether the Trustee happens to be independent or a member of management. The Independent Trustees have determined that they can act independently and effectively without having an Independent Trustee serve as Chairman and that a key structural component for assuring that they are in a position to do so is for the Independent Trustees to constitute a substantial majority for the Board. The Independent Trustees also regularly meet in executive session. Ned C. Lautenbach serves as Chairman of the Independent Trustees and as such (i) acts as a liaison between the Independent Trustees and management with respect to matters important to the Independent Trustees and (ii) with management prepares agendas for Board meetings.
Fidelity funds are overseen by different Boards of Trustees. The fund's Board oversees Fidelity's equity and high income funds and another Board oversees Fidelity's investment-grade bond, money market, and asset allocation funds. The asset allocation funds may invest in Fidelity funds overseen by the fund's Board. The use of separate Boards, each with its own committee structure, allows the Trustees of each group of Fidelity funds to focus on the unique issues of the funds they oversee, including common research, investment, and operational issues. On occasion, the separate Boards establish joint committees to address issues of overlapping consequences for the Fidelity funds overseen by each Board.
The Trustees operate using a system of committees to facilitate the timely and efficient consideration of all matters of importance to the Trustees, the fund, and fund shareholders and to facilitate compliance with legal and regulatory requirements and oversight of the fund's activities and associated risks. The Board, acting through its committees, has charged FMR and its affiliates with (i) identifying events or circumstances the occurrence of which could have demonstrably adverse effects on the fund's business and/or reputation; (ii) implementing processes and controls to lessen the possibility that such events or circumstances occur or to mitigate the effects of such events or circumstances if they do occur; and (iii) creating and maintaining a system designed to evaluate continuously business and market conditions in order to facilitate the identification and implementation processes described in (i) and (ii) above. Because the day-to-day operations and activities of the fund are carried out by or through FMR, its affiliates and other service providers, the fund's exposure to risks is mitigated but not eliminated by the processes overseen by the Trustees. While each of the Board's committees has responsibility for overseeing different aspects of the fund's activities, oversight is exercised primarily through the Operations, Audit, and Compliance Committees. Appropriate personnel, including but not limited to the fund's Chief Compliance Officer (CCO), FMR's internal auditor, the independent accountants, the fund's Treasurer and portfolio management personnel, make periodic reports to the Board's committees, as appropriate. The responsibilities of each committee, including their oversight responsibilities, are described further under "Standing Committees of the Fund's Trustees."
Annual Report
Trustees and Officers - continued
The fund's Statement of Additional Information (SAI) includes more information about the Trustees. To request a free copy, call Fidelity at 1-877-208-0098.
Interested Trustees*:
Correspondence intended for each Trustee who is an interested person may be sent to Fidelity Investments, 82 Devonshire Street, Boston, Massachusetts 02109.
Name, Age; Principal Occupations and Other Relevant Experience+ |
Edward C. Johnson 3d (80) |
| Year of Election or Appointment: 1983 Mr. Johnson is Trustee and Chairman of the Board of Trustees of certain Trusts. Mr. Johnson serves as Chief Executive Officer, Chairman, and a Director of FMR LLC; Chairman and a Director of FMR; Chairman and a Director of Fidelity Research & Analysis Company (FRAC); Chairman and a Director of Fidelity Investments Money Management, Inc.; and Chairman and a Director of FMR Co., Inc. In addition, Mr. Johnson serves as Chairman and Director of FIL Limited. Previously, Mr. Johnson served as President of FMR LLC (2006-2007). |
James C. Curvey (75) |
| Year of Election or Appointment: 2007 Mr. Curvey also serves as Trustee (2007-present) of other investment companies advised by FMR. Mr. Curvey is a Director of Fidelity Investments Money Management, Inc. (2009-present), Director of Fidelity Research & Analysis Co. (2009-present) and Director of FMR and FMR Co., Inc. (2007-present). Mr. Curvey is also Vice Chairman (2007-present) and Director of FMR LLC. In addition, Mr. Curvey serves as an Overseer for the Boston Symphony Orchestra and a member of the Trustees of Villanova University. Previously, Mr. Curvey was the Vice Chairman (2006-2007) and Director (2000-2007) of FMR Corp. |
* Trustees have been determined to be "Interested Trustees" by virtue of, among other things, their affiliation with the trust or various entities under common control with FMR.
Annual Report
+ The information above includes each Trustee's principal occupation during the last five years and other information relating to the experience, attributes, and skills relevant to each Trustee's qualifications to serve as a Trustee, which led to the conclusion that each Trustee should serve as a Trustee for the fund.
Independent Trustees:
Correspondence intended for each Independent Trustee (that is, the Trustees other than the Interested Trustees) may be sent to Fidelity Investments, P.O. Box 55235, Boston, Massachusetts 02205-5235.
Name, Age; Principal Occupations and Other Relevant Experience+ |
Dennis J. Dirks (62) |
| Year of Election or Appointment: 2005 Prior to his retirement in May 2003, Mr. Dirks was Chief Operating Officer and a member of the Board of The Depository Trust & Clearing Corporation (DTCC). He also served as President, Chief Operating Officer, and Board member of The Depository Trust Company (DTC) and President and Board member of the National Securities Clearing Corporation (NSCC). In addition, Mr. Dirks served as Chief Executive Officer and Board member of the Government Securities Clearing Corporation, Chief Executive Officer and Board member of the Mortgage-Backed Securities Clearing Corporation, as a Trustee and a member of the Finance Committee of Manhattan College (2005-2008), and as a Trustee and a member of the Finance Committee of AHRC of Nassau County (2006-2008). Mr. Dirks is a member of the Independent Directors Council (IDC) Governing Council (2010-Present) and Board of Directors for The Brookville Center for Children's Services, Inc. (2009-present). |
Alan J. Lacy (57) |
| Year of Election or Appointment: 2008 Mr. Lacy serves as Senior Adviser (2007-present) of Oak Hill Capital Partners, L.P. (private equity). Mr. Lacy also served as Chief Executive Officer (2000-2005) and Vice Chairman (2005-2006) of Sears Holdings Corporation and Sears, Roebuck and Co. (retail). In addition, Mr. Lacy serves as a member of the Board of Directors of The Western Union Company (global money transfer, 2006-present) and Bristol-Myers Squibb Company (global pharmaceuticals, 2007-present). Mr. Lacy is Chairman (2008-present) and a member (2006-present) of the Board of Trustees of The National Parks Conservation Association. |
Ned C. Lautenbach (66) |
| Year of Election or Appointment: 2000 Mr. Lautenbach is Chairman of the Independent Trustees of the Equity and High Income Funds (2006-present). Mr. Lautenbach currently serves as the Lead Director of the Eaton Corporation Board of Directors (diversified industrial, 1997-present). Mr. Lautenbach is also a member of the Board of Directors of the Philharmonic Center for the Arts in Naples, Florida (1999-present); a member of the Board of Trustees of Fairfield University (2005-present); and a member of the Council on Foreign Relations (1994-present). Previously, Mr. Lautenbach was a Partner/Advisory Partner at Clayton, Dubilier & Rice, Inc. (private equity investment, 1998-2010), as well as a Director of Sony Corporation (2006-2007). |
Joseph Mauriello (66) |
| Year of Election or Appointment: 2008 Prior to his retirement in January 2006, Mr. Mauriello served in numerous senior management positions including Deputy Chairman and Chief Operating Officer (2004-2005), and Vice Chairman of Financial Services (2002-2004) of KPMG LLP US (professional services, 1965-2005). Mr. Mauriello currently serves as a member of the Board of Directors of XL Group plc. (global insurance and re-insurance, 2006-present) and of Arcadia Resources Inc. (health care services and products, 2007-present). Previously, Mr. Mauriello served as a Director of the Hamilton Funds of the Bank of New York (2006-2007). |
Cornelia M. Small (66) |
| Year of Election or Appointment: 2005 Ms. Small is a member of the Board of Directors of the Teagle Foundation (2009-present). Ms. Small is also a member of the Investment Committee, and Chair (2008-present) and a member of the Board of Trustees of Smith College. In addition, Ms. Small serves on the Investment Committee of the Berkshire Taconic Community Foundation (2008-present). Previously, Ms. Small served as Chairperson of the Investment Committee (2002-2008) of Smith College. In addition, Ms. Small served as Chief Investment Officer, Director of Global Equity Investments, and a member of the Board of Directors of Scudder, Stevens & Clark and Scudder Kemper Investments. |
William S. Stavropoulos (71) |
| Year of Election or Appointment: 2001 Mr. Stavropoulos is Vice Chairman of the Independent Trustees of the Equity and High Income Funds (2006-present). Mr. Stavropoulos serves as President and Founder of the Michigan Baseball Foundation, the Great Lakes Loons (2007-present). Mr. Stavropoulos is Chairman Emeritus of the Board of Directors of The Dow Chemical Company, where he previously served in numerous senior management positions, including President, CEO (1995-2000; 2002-2004), Chairman of the Executive Committee (2000-2006), and as a member of the Board of Directors (1990-2006). Currently, Mr. Stavropoulos is Chairman of Univar (global distributor of commodity and specialty chemicals, 2010-present), a Director of Teradata Corporation (data warehousing and technology solutions, 2008-present), Chemical Financial Corporation, Maersk Inc. (industrial conglomerate), Tyco International, Inc. (multinational manufacturing and services, 2007-present), and a member of the Advisory Board for Metalmark Capital (private equity investment, 2005-present). Mr. Stavropoulos is a special advisor to Clayton, Dubilier & Rice, Inc. (private equity investment). In addition, Mr. Stavropoulos is a member of the University of Notre Dame Advisory Council for the College of Science. |
David M. Thomas (61) |
| Year of Election or Appointment: 2008 Previously, Mr. Thomas served as Executive Chairman (2005-2006) and Chairman and Chief Executive Officer (2000-2005) of IMS Health, Inc. (pharmaceutical and healthcare information solutions). In addition, Mr. Thomas serves as a member of the Board of Directors of Fortune Brands, Inc. (consumer products), and Interpublic Group of Companies, Inc. (marketing communication, 2004-present). |
Michael E. Wiley (60) |
| Year of Election or Appointment: 2008 Mr. Wiley also serves as a Director of Asia Pacific Exploration Consolidated (international oil and gas exploration and production, 2008-present). Mr. Wiley serves as a Director of Tesoro Corporation (independent oil refiner and marketer, 2005-present), and a Director of Bill Barrett Corporation (exploration and production, 2005-present). In addition, Mr. Wiley also serves as a Director of Post Oak Bank (privately-held bank, 2004-present). Previously, Mr. Wiley served as a member of the Board of Trustees of the University of Tulsa (2000-2006; 2007-2010), as a Senior Energy Advisor of Katzenbach Partners, LLC (consulting, 2006-2007), as an Advisory Director of Riverstone Holdings (private investment), Chairman, President, and CEO of Baker Hughes, Inc. (oilfield services, 2000-2004), and as Director of Spinnaker Exploration Company (exploration and production, 2001-2005). |
Annual Report
Trustees and Officers - continued
+ The information above includes each Trustee's principal occupation during the last five years and other information relating to the experience, attributes, and skills relevant to each Trustee's qualifications to serve as a Trustee, which led to the conclusion that each Trustee should serve as a Trustee for the fund.
Advisory Board Member and Executive Officers:
Correspondence intended for each executive officer and Peter S. Lynch may be sent to Fidelity Investments, 82 Devonshire Street, Boston, Massachusetts 02109.
Name, Age; Principal Occupation |
Peter S. Lynch (66) |
| Year of Election or Appointment: 2003 Member of the Advisory Board of Fidelity's Equity and High Income Funds. Mr. Lynch is Vice Chairman and a Director of FMR and FMR Co., Inc. In addition, Mr. Lynch serves as a Trustee of Boston College and as the Chairman of the Inner-City Scholarship Fund. Previously, Mr. Lynch served on the Special Olympics International Board of Directors (1997-2006). |
Kenneth B. Robins (41) |
| Year of Election or Appointment: 2008 President and Treasurer of Fidelity's Equity and High Income Funds. Mr. Robins also serves as President and Treasurer (2010-present) and Assistant Treasurer (2009-present) of other Fidelity funds and is an employee of Fidelity Investments (2004-present). Previously, Mr. Robins served as Deputy Treasurer of the Fidelity funds (2005-2008) and Treasurer and Chief Financial Officer of The North Carolina Capital Management Trust: Cash and Term Portfolios (2006-2008). |
Bruce T. Herring (45) |
| Year of Election or Appointment: 2006 Vice President of certain Equity Funds. Mr. Herring also serves as Chief Investment Officer and Director of Fidelity Management & Research (U.K.) Inc. (2010-present) and Group Chief Investments Officer of FMR. Previously, Mr. Herring served as Vice President (2005-2006) and Senior Vice President (2006-2007) of Fidelity Management & Research Company, Vice President of FMR Co., Inc. (2001-2007) and as a portfolio manager for Fidelity U.S. Equity Funds. |
Brian B. Hogan (46) |
| Year of Election or Appointment: 2009 Vice President of certain Equity Funds and Vice President of Sector Funds. Mr. Hogan also serves as President of FMR's Equity Division (2009-present). Previously, Mr. Hogan served as Senior Vice President, Equity Research of FMR (2006-2009) and as a portfolio manager. |
Scott C. Goebel (42) |
| Year of Election or Appointment: 2008 Secretary and Chief Legal Officer (CLO) of the Fidelity funds. Mr. Goebel also serves as Secretary and CLO of The North Carolina Capital Management Trust: Cash and Term Portfolio (2008-present); General Counsel, Secretary, and Senior Vice President of FMR (2008-present) and FMR Co., Inc. (2008-present); Deputy General Counsel of FMR LLC; Chief Legal Officer of Fidelity Management & Research (Hong Kong) Limited (2008-present) and Assistant Secretary of Fidelity Management & Research (Japan) Inc. (2008-present), Fidelity Investments Money Management, Inc. (2008-present), Fidelity Management & Research (U.K.) Inc. (2008-present), and Fidelity Research and Analysis Company (2008-present). Previously, Mr. Goebel served as Assistant Secretary of the Funds (2007-2008) and as Vice President and Secretary of Fidelity Distributors Corporation (FDC) (2005-2007). |
William C. Coffey (41) |
| Year of Election or Appointment: 2009 Assistant Secretary of Fidelity's Equity and High Income Funds. Mr. Coffey also serves as Senior Vice President and Deputy General Counsel of FMR LLC (2010-present), and is an employee of Fidelity Investments. Previously, Mr. Coffey served as Vice President and Associate General Counsel of FMR LLC (2005-2009). |
Holly C. Laurent (56) |
| Year of Election or Appointment: 2008 Anti-Money Laundering (AML) Officer of the Fidelity funds. Ms. Laurent also serves as AML Officer of The North Carolina Capital Management Trust: Cash and Term Portfolio (2008-present) and is an employee of Fidelity Investments. Previously, Ms. Laurent was Senior Vice President and Head of Legal for Fidelity Business Services India Pvt. Ltd. (2006-2008), and Senior Vice President, Deputy General Counsel and Group Head for FMR LLC (2005-2006). |
Christine Reynolds (52) |
| Year of Election or Appointment: 2008 Chief Financial Officer of the Fidelity funds. Ms. Reynolds became President of Fidelity Pricing and Cash Management Services (FPCMS) in August 2008. Ms. Reynolds served as Chief Operating Officer of FPCMS (2007-2008). Previously, Ms. Reynolds served as President, Treasurer, and Anti-Money Laundering officer of the Fidelity funds (2004-2007). |
Kenneth A. Rathgeber (63) |
| Year of Election or Appointment: 2004 Chief Compliance Officer of Fidelity's Equity and High Income Funds. Mr. Rathgeber is Chief Compliance Officer of Fidelity Management & Research (Hong Kong) Limited (2008-present), Fidelity Management & Research (Japan) Inc. (2008-present), FMR (2005-present), FMR Co., Inc. (2005-present), Fidelity Management & Research (U.K.) Inc. (2005-present), Fidelity Research & Analysis Company (2005-present), Fidelity Investments Money Management, Inc. (2005-present), Pyramis Global Advisors, LLC (2005-present), and Strategic Advisers, Inc. (2005-present). |
Jeffrey S. Christian (49) |
| Year of Election or Appointment: 2009 Deputy Treasurer of the Fidelity funds. Mr. Christian is an employee of Fidelity Investments. Previously, Mr. Christian served as Chief Financial Officer (2008-2009) of certain Fidelity funds and Senior Vice President of Fidelity Pricing and Cash Management Services (FPCMS) (2004-2009). |
Bryan A. Mehrmann (49) |
| Year of Election or Appointment: 2005 Deputy Treasurer of the Fidelity funds. Mr. Mehrmann is an employee of Fidelity Investments. |
Adrien E. Deberghes (43) |
| Year of Election or Appointment: 2008 Deputy Treasurer of Fidelity's Equity and High Income Funds. Mr. Deberghes also serves as Assistant Treasurer of other Fidelity funds (2010-present) and is an employee of Fidelity Investments (2008-present). Previously, Mr. Deberghes served as Senior Vice President of Mutual Fund Administration at State Street Corporation (2007-2008), Senior Director of Mutual Fund Administration at Investors Bank & Trust (2005-2007), and Director of Finance for Dunkin' Brands (2000-2005). |
Stephanie J. Dorsey (41) |
| Year of Election or Appointment: 2010 Assistant Treasurer of Fidelity's Equity and High Income Funds. Ms. Dorsey also serves as Deputy Treasurer of other Fidelity funds (2008-present) and is an employee of Fidelity Investments (2008-present). Previously, Ms. Dorsey served as Treasurer (2004-2008) of the JPMorgan Mutual Funds and Vice President (2004-2008) of JPMorgan Chase Bank. |
Name, Age; Principal Occupation |
John R. Hebble (52) |
| Year of Election or Appointment: 2009 Assistant Treasurer of Fidelity's Equity and High Income Funds. Mr. Hebble also serves as Treasurer and Chief Financial Officer of The North Carolina Capital Management Trust: Cash and Term Portfolio (2008-present), President and Treasurer of other Fidelity funds (2008-present) and is an employee of Fidelity Investments. |
Gary W. Ryan (52) |
| Year of Election or Appointment: 2005 Assistant Treasurer of the Fidelity funds. Mr. Ryan is an employee of Fidelity Investments. Previously, Mr. Ryan served as Vice President of Fund Reporting in Fidelity Pricing and Cash Management Services (FPCMS) (1999-2005). |
Jonathan Davis (42) |
| Year of Election or Appointment: 2010 Assistant Treasurer of the Fidelity funds. Mr. Davis is an employee of Fidelity Investments. Previously, Mr. Davis served as Vice President and Associate General Counsel of FMR LLC (2003-2010). |
Annual Report
The Board of Trustees of Advisor Emerging Markets voted to pay to shareholders of record at the opening of business on record date, the following distributions per share derived from capital gains realized from sales of portfolio securities, and dividends derived from net investment income:
| Pay Date | Record Date | Dividends | Capital Gains |
Institutional Class | 12/06/10 | 12/03/10 | $.195 | $.125 |
Institutional Class designates 80% of the dividends distributed during the fiscal year as amounts which may be taken into account as a dividend for purposes of the maximum rate under section 1(h)(11) of the Internal Revenue Code.
The amounts per share which represent income derived from sources within, and taxes paid to, foreign countries or possessions of the United States are as Follows
| Pay Date | Income | Taxes |
Institutional Class | 12/7/09 | $.190 | $.0282 |
The fund will notify shareholders in January 2011 of amounts for use in preparing 2010 income tax returns.
Annual Report
Board Approval of Investment Advisory Contracts and Management Fees
Fidelity Advisor Emerging Markets Fund
Each year, the Board of Trustees, including the Independent Trustees (together, the Board), votes on the renewal of the management contract and sub-advisory agreements (together, the Advisory Contracts) for the fund. The Board, assisted by the advice of fund counsel and Independent Trustees' counsel, requests and considers a broad range of information relevant to the renewal of the Advisory Contracts throughout the year.
The Board meets regularly and considers at each of its meetings factors that are relevant to its annual consideration of the renewal of the fund's Advisory Contracts, including the services and support provided to the fund and its shareholders. The Board has established various standing committees, each composed of Independent Trustees with varying backgrounds, to which the Board has assigned specific subject matter responsibilities in order to enhance effective decision-making by the Board. The Board, acting directly and through its Committees, requests and receives information concerning the annual consideration of the renewal of the fund's Advisory Contracts. The Board also meets as needed to consider matters specifically related to the Board's annual consideration of the renewal of Advisory Contracts. Members of the Board may also meet with trustees of other Fidelity funds through ad hoc joint committees to discuss certain matters relevant to the Fidelity funds.
At its July 2010 meeting, the Board of Trustees, including the Independent Trustees, unanimously determined to renew the fund's Advisory Contracts. In reaching its determination, the Board considered all factors it believed relevant, including (i) the nature, extent, and quality of the services to be provided to the fund and its shareholders (including the investment performance of the fund); (ii) the competitiveness of the fund's management fee and total expenses; (iii) the total costs of the services to be provided by and the profits to be realized by Fidelity from its relationship with the fund; (iv) the extent to which economies of scale would be realized as the fund grows; and (v) whether fee levels reflect these economies of scale, if any, for the benefit of fund shareholders.
In considering whether to renew the Advisory Contracts for the fund, the Board reached a determination, with the assistance of fund counsel and Independent Trustees' counsel and through the exercise of its business judgment, that the renewal of the Advisory Contracts is in the best interests of fund shareholders and that the compensation to be received by Fidelity under the management contract is fair and reasonable. The Board's decision to renew the Advisory Contracts was not based on any single factor noted above, but rather was based on a comprehensive consideration of all the information provided to the Board at its meetings throughout the year. The Board, in reaching its determination to renew the Advisory Contracts, is aware that shareholders in the fund have a broad range of investment choices available to them, including a wide choice among mutual funds offered by Fidelity's competitors, and that the fund's shareholders, with the opportunity to review and weigh the disclosure provided by the fund in its prospectus and other public disclosures, have chosen to invest in this fund, managed by Fidelity.
Annual Report
Board Approval of Investment Advisory Contracts and
Management Fees - continued
Nature, Extent, and Quality of Services Provided. The Board considered the staffing within the investment adviser, FMR, and the sub-advisers (together, the Investment Advisers), including the backgrounds of the fund's investment personnel and the fund's investment objective and discipline. The Independent Trustees also had discussions with senior management of Fidelity's investment operations and investment groups. The Board considered the structure of the portfolio manager compensation program and whether this structure provides appropriate incentives to act in the best interest of the fund.
Resources Dedicated to Investment Management and Support Services. The Board and the equity research subcommittee of the Board's Fund Oversight Committee reviewed the size, education, and experience of the Investment Advisers' investment staff, their use of technology, and the Investment Advisers' approach to recruiting, training, and retaining portfolio managers and other research, advisory, and management personnel. The Board noted that Fidelity's analysts have access to a variety of technological tools and market and securities data that enable them to perform both fundamental and quantitative analysis and to specialize in various disciplines. The Board considered Fidelity's extensive global research capabilities that enable the Investment Advisers to aggregate data from various sources in an effort to produce positive investment results. The Board also considered that Fidelity's portfolio managers and analysts have access to daily portfolio attribution that allows for monitoring of a fund's portfolio, as well as an electronic communication system that provides immediate real-time access to research concerning issuers and credit enhancers. The Board noted FMR's continued focus on strengthening the organization and discipline of equity portfolio management and research.
Shareholder and Administrative Services. The Board considered (i) the nature, extent, quality, and cost of advisory, administrative, and shareholder services performed by the Investment Advisers and their affiliates under the Advisory Contracts and under separate agreements covering transfer agency, pricing and bookkeeping, and securities lending services for the fund; (ii) the nature and extent of the investment adviser's supervision of third party service providers, principally custodians and subcustodians; and (iii) the resources devoted to, and the record of compliance with, the fund's compliance policies and procedures. The Board also reviewed the allocation of fund brokerage, including allocations to brokers affiliated with the Investment Advisers, the use of brokerage commissions to pay fund expenses, and the use of "soft" commission dollars to pay for research services.
The Board noted that the growth of fund assets over time across the complex allows Fidelity to reinvest in the development of services designed to enhance the value or convenience of the Fidelity funds as investment vehicles. These services include 24-hour access to account information and market information through phone representatives and over the Internet, and investor education materials and asset allocation tools.
Annual Report
Investment in a Large Fund Family. The Board considered the benefits to shareholders of investing in a Fidelity fund, including the benefits of investing in a fund that is part of a large family of funds offering a variety of investment disciplines and providing a large variety of mutual fund investor services. The Board noted that Fidelity had taken, or had made recommendations that resulted in the Fidelity funds taking, a number of actions over the previous year that benefited particular funds, including (i) dedicating additional resources to investment research and restructuring and broadening the focus of the investment research teams; (ii) bolstering the senior management team that oversees asset management; (iii) launching Class F of certain funds as a lower-fee class available to Freedom K and Freedom Index Funds; (iv) lowering the initial investment minimums and ongoing balance requirements for Real Estate High Income Fund; (v) eliminating subsequent purchase minimums for all funds and adding a waiver of the investment minimum requirement for new accounts opened with the proceeds of a systematic withdrawal plan; (vi) eliminating the withdrawal minimum and maximum limits for systematic withdrawals from Advisor funds; (vii) expanding sales load waivers on Class A shares for Destiny Planholders and expanding Institutional Class eligibility for Class O Destiny Planholders; and (viii) changing certain Class A and Class T sales charge structures to further align them with industry practices.
Investment Performance. The Board considered whether the fund has operated in accordance with its investment objective, as well as its record of compliance with its investment restrictions. It also reviewed the fund's absolute investment performance for each class, as well as the fund's relative investment performance for each class measured over multiple periods against (i) a broad-based securities market index, and (ii) a peer group of mutual funds deemed appropriate by Fidelity and reviewed by the Board. The following charts considered by the Board show, over the one-, three-, and five-year periods ended December 31, 2009, the cumulative total returns of Institutional Class (Class I) and Class C of the fund, the cumulative total returns of a broad-based securities market index ("benchmark"), and a range of cumulative total returns of a peer group of mutual funds identified by Morningstar, Inc. as having an investment style similar to that of the fund based on underlying portfolio holdings. The returns of Institutional Class (Class I) and Class C show the performance of the highest and lowest performing classes, respectively (based on five-year performance). The box within each chart shows the 25th percentile return (bottom of box) and the 75th percentile return (top of box) of the peer group. Returns shown above the box are in the first quartile and returns shown below the box are in the fourth quartile. The percentage beaten numbers noted below each chart correspond to the percentile box and represent the percentage of funds in the peer group whose performance was equal to or lower than that of the class indicated.
Annual Report
Board Approval of Investment Advisory Contracts and
Management Fees - continued
Fidelity Advisor Emerging Markets Fund
The Board reviewed the fund's relative investment performance against its peer group and noted that the performance of Institutional Class (Class I) of the fund was in the second quartile for the one-year period, the third quartile for the three-year period, and the first quartile for the five-year period. The Board also noted that the investment performance of the fund was lower than its benchmark for all the periods shown. The Board considered that the variations in performance among the fund's classes reflect the variations in class expenses, which result in lower performance for higher expense classes. The Board also reviewed the fund's performance since inception as well as performance in the current year.
Based on its review, and giving particular weight to the nature and quality of the resources dedicated by the Investment Advisers to maintain and improve relative performance and factoring in the unprecedented market events in recent years, the Board concluded that the nature, extent, and quality of investment management and support services and of shareholder and administrative services provided to the fund will benefit the fund's shareholders, particularly in light of the Board's view that the fund's shareholders benefit from investing in a fund that is part of a large family of funds offering a variety of investment disciplines and services.
Competitiveness of Management Fee and Total Fund Expenses. The Board considered the fund's management fee and total expenses compared to "mapped groups" of competitive funds and classes. Fidelity creates "mapped groups" by combining similar Lipper investment objective categories that have comparable management fee characteristics. Combining Lipper investment objective categories aids the Board's management fee and total expense comparisons by broadening the competitive group used for comparison and by reducing the number of universes to which various Fidelity funds are compared.
Annual Report
Management Fee. The Board considered two proprietary management fee comparisons for the 12-month periods shown in the chart below. The group of Lipper funds used by the Board for management fee comparisons is referred to below as the "Total Mapped Group." The Total Mapped Group comparison focuses on a fund's standing relative to the total universe of comparable funds available to investors, in terms of gross management fees before expense reimbursements or caps. "TMG %" represents the percentage of funds in the Total Mapped Group that had management fees that were lower than the fund's. For example, a TMG % of 15% means that 85% of the funds in the Total Mapped Group had higher management fees than the fund. The "Asset-Size Peer Group" (ASPG) comparison focuses on a fund's standing relative to non-Fidelity funds similar in size to the fund within the Total Mapped Group. The ASPG represents at least 15% of the funds in the Total Mapped Group with comparable asset size and management fee characteristics, subject to a minimum of 50 funds (or all funds in the Total Mapped Group if fewer than 50). Additional information, such as the ASPG quartile in which the fund's management fee ranked, is also included in the chart and considered by the Board.
Fidelity Advisor Emerging Markets Fund
The Board noted that the fund's management fee ranked below the median of its Total Mapped Group and below the median of its ASPG for 2009.
Annual Report
Board Approval of Investment Advisory Contracts and
Management Fees - continued
Based on its review, the Board concluded that the fund's management fee is fair and reasonable in light of the services that the fund receives and the other factors considered.
Total Expenses. In its review of each class's total expenses, the Board considered the fund's management fee as well as other fund or class expenses, as applicable, such as transfer agent fees, pricing and bookkeeping fees, fund-paid 12b-1 fees, and custodial, legal, and audit fees. The Board also noted the effects of any waivers and reimbursements on fees and expenses. As part of its review, the Board also considered current and historical total expenses of each class of the fund compared to competitive fund median expenses. Each class of the fund is compared to those funds and classes in the Total Mapped Group (used by the Board for management fee comparisons) that have a similar sales load structure.
The Board noted that the total expenses of each of Class A, Class B, Class C, and Institutional Class ranked below its competitive median for 2009 and the total expenses of Class T ranked above its competitive median for 2009. The Board considered that the total expenses for Class T were above the median primarily because its 12b-1 fee is higher than the typical front-end load class. The Board noted that the fund offers multiple classes, each of which has a different sales load and 12b-1 fee structure, and that the multiple structures are intended to offer a range of pricing options for the intermediary market. The Board also noted that the total expenses of the classes vary primarily by the level of their 12b-1 fees, although differences in transfer agent fees may also cause expenses to vary from class to class.
Fees Charged to Other Fidelity Clients. The Board also considered Fidelity fee structures and other information with respect to clients of FMR and its affiliates, such as other mutual funds advised or subadvised by FMR or its affiliates, pension plan clients, and other institutional clients. In March 2010, the Board created an ad hoc joint committee with the board of other Fidelity funds (the Committee) to review and compare Fidelity's institutional investment advisory business with its business of providing services to the Fidelity funds, including the differences in services provided, fees charged, and costs incurred, as well as competition in their respective marketplaces.
Based on its review of total expenses and fees charged to other Fidelity clients, the Board concluded that the total expenses of each class of the fund were reasonable, although in one case above the median of the universe presented for comparison, in light of the services that the fund and its shareholders receive and the other factors considered, including the findings of the Committee.
Costs of the Services and Profitability. The Board considered the revenues earned and the expenses incurred by Fidelity in conducting the business of developing, marketing, distributing, managing, administering and servicing the fund and its shareholders. The Board also considered the level of Fidelity's profits in respect of all the Fidelity funds.
Annual Report
On an annual basis, FMR presents to the Board Fidelity's profitability for the fund. Fidelity calculates the profitability for each fund, as well as aggregate profitability for groups of Fidelity funds and all Fidelity funds, using a series of detailed revenue and cost allocation methodologies which originate with the audited books and records of Fidelity. The Audit Committee of the Board reviews any significant changes from the prior year's methodologies.
PricewaterhouseCoopers LLP (PwC), independent registered public accounting firm and auditor to Fidelity and certain Fidelity funds, has been engaged annually by the Board as part of the Board's assessment of Fidelity's profitability analysis. PwC's engagement includes the review and assessment of Fidelity's methodologies used in determining the revenues and expenses attributable to Fidelity's mutual fund business, and completion of agreed-upon procedures surrounding the mathematical accuracy of fund profitability and its conformity to allocation methodologies. After considering PwC's reports issued under the engagement and information provided by Fidelity, the Board believes that while other allocation methods may also be reasonable, Fidelity's profitability methodologies are reasonable in all material respects.
The Board has also reviewed Fidelity's non-fund businesses and fall-out benefits related to the mutual fund business as well as cases where Fidelity's affiliates may benefit from or be related to the fund's business.
The Board considered the costs of the services provided by and the profits realized by Fidelity in connection with the operation of the fund and were satisfied that the profitability was not excessive in the circumstances.
Economies of Scale. The Board considered whether there have been economies of scale in respect of the management of the Fidelity funds, whether the Fidelity funds (including the fund) have appropriately benefited from any such economies of scale, and whether there is potential for realization of any further economies of scale. The Board considered the extent to which the fund will benefit from economies of scale through increased services to the fund, through waivers or reimbursements, or through fee or expense reductions.
In February 2009, the Board and the board of other Fidelity funds created an ad hoc committee (the Economies of Scale Committee) to analyze whether FMR attains economies of scale in respect of the management and servicing of the Fidelity funds, whether the Fidelity funds have appropriately benefited from such economies of scale, and whether there is potential for realization of any further economies of scale.
The Board recognized that the fund's management contract incorporates a "group fee" structure, which provides for lower group fee rates as total fund assets under FMR's management increase, and for higher group fee rates as total fund assets under FMR's management decrease. FMR calculates the group fee rates based on a tiered asset "breakpoint" schedule that varies based on asset class. The Board considered that the group fee is designed to deliver the benefits of economies of scale to fund shareholders when total Fidelity fund assets increase, even if assets of any particular fund are unchanged or have declined, because some portion of Fidelity's costs are attributable to services provided to all Fidelity funds, and all funds benefit if those costs can be allocated among more assets. The Board concluded that, given the group fee structure, fund shareholders will benefit from lower management fees as assets under FMR's management increase at the fund complex level, regardless of whether Fidelity achieves any such economies of scale.
Annual Report
Board Approval of Investment Advisory Contracts and
Management Fees - continued
The Board concluded, considering the findings of the Economies of Scale Committee, that any potential economies of scale are being appropriately shared between fund shareholders and Fidelity.
Additional Information Requested by the Board. In order to develop fully the factual basis for consideration of the Fidelity funds' Advisory Contracts, the Board requested and received additional information on certain topics, including (i) fund performance trends, actions to be taken by FMR to improve certain funds' overall performance, and Fidelity's long-term strategies for certain funds; (ii) portfolio manager changes that have occurred during the past year and length of portfolio manager tenure for different categories of funds over time; (iii) Fidelity's compensation structure for portfolio managers, research analysts, and other key personnel, the rationale for the compensation structure, and how the compensation structure provides appropriate performance incentives; (iv) the amount of the investment that each portfolio manager has made in the Fidelity fund(s) that he or she manages; (v) management and other fees paid by FMR to affiliated sub-advisers on behalf of the Fidelity funds; (vi) Fidelity's fee structures and rationale for recommending different fees among different categories of funds; (vii) Fidelity's rationale for recommending which funds should have a performance adjustment component as part of their management fees; (viii) the rationale for any differences between fund fee structures and fee structures in place for other Fidelity clients; and (ix) explanations regarding the relative total expenses borne by certain funds and classes, total expense competitive trends, and actions that might be taken by FMR to reduce total expenses for certain funds and classes.
Based on its evaluation of all of the conclusions noted above, and after considering all factors it believed relevant, the Board ultimately concluded that the advisory fee structures are fair and reasonable, and that the fund's Advisory Contracts should be renewed.
Annual Report
Investment Adviser
Fidelity Management & Research Company
Boston, MA
Investment Sub-Advisers
FMR Co., Inc.
Fidelity Management & Research
(U.K.) Inc.
Fidelity Research & Analysis Company
Fidelity Management & Research
(Hong Kong) Limited
FIL Investments (Japan) Limited
Fidelity Management & Research
(Japan) Inc.
FIL Investment Advisors (UK) Limited
FIL Investment Advisors
General Distributor
Fidelity Distributors Corporation
Boston, MA
Transfer and Service Agents
Fidelity Investments Institutional Operations Company, Inc.
Boston, MA
Fidelity Service Company, Inc.
Boston, MA
Custodian
JPMorgan Chase Bank
New York, NY
FAEMI-UANN-1210
1.809006.106
(Fidelity Investment logo)(registered trademark)
Fidelity AdvisorSM
Europe Capital Appreciation
Fund - Class A, Class T, Class B
and Class C
Annual Report
October 31, 2010
(2_fidelity_logos) (Registered_Trademark)
Contents
Chairman's Message | <Click Here> | The Chairman's message to shareholders. |
Performance | <Click Here> | How the fund has done over time. |
Management's Discussion of Fund Performance | <Click Here> | The Portfolio Manager's review of fund performance and strategy. |
Shareholder Expense Example | <Click Here> | An example of shareholder expenses. |
Investment Changes | <Click Here> | A summary of major shifts in the fund's investments over the past six months. |
Investments | <Click Here> | A complete list of the fund's investments with their market values. |
Financial Statements | <Click Here> | Statements of assets and liabilities, operations, and changes in net assets,
as well as financial highlights. |
Notes | <Click Here> | Notes to financial statements. |
Report of Independent Registered Public Accounting Firm | <Click Here> | |
Trustees and Officers | <Click Here> | |
Distributions | <Click Here> | |
Board Approval of Investment Advisory Contracts and Management Fees | <Click Here> | |
To view a fund's proxy voting guidelines and proxy voting record for the 12-month period ended June 30, visit http://www.fidelity.com/proxyvotingresults or visit the Securities and Exchange Commission's (SEC) web site at http://www.sec.gov. You may also call 1-877-208-0098 to request a free copy of the proxy voting guidelines.
Standard & Poor's, S&P and S&P 500 are registered service marks of The McGraw-Hill Companies, Inc. and have been licensed for use by Fidelity Distributors Corporation.
Other third party marks appearing herein are the property of their respective owners.
All other marks appearing herein are registered or unregistered trademarks or service marks of FMR LLC or an affiliated company.
Annual Report
This report and the financial statements contained herein are submitted for the general information of the shareholders of the fund. This report is not authorized for distribution to prospective investors in the fund unless preceded or accompanied by an effective prospectus.
A fund files its complete schedule of portfolio holdings with the SEC for the first and third quarters of each fiscal year on Form N-Q. Forms N-Q are available on the SEC's web site at http://www.sec.gov. A fund's Forms N-Q may be reviewed and copied at the SEC's Public Reference Room in Washington, DC. Information regarding the operation of the SEC's Public Reference Room may be obtained by calling 1-800-SEC-0330. For a complete list of a fund's portfolio holdings, view the most recent holdings listing, semiannual report, or annual report on Fidelity's web site at http://www.fidelity.com or http://www.advisor.fidelity.com, as applicable.
NOT FDIC INSURED • MAY LOSE VALUE • NO BANK GUARANTEE
Neither the fund nor Fidelity Distributors Corporation is a bank.
Annual Report
(photo_of_Edward_C_Johnson_3d)
Dear Shareholder:
Equities have staged a rally in the second half of 2010, shaking off concerns about the European debt crisis and the possibility of a double-dip recession in the U.S. Although the short-term surge pushed major equity indexes back into positive territory for the year, several questions remain about the longer-term outlook, including lackluster economic growth and persistently high unemployment. Financial markets are always unpredictable, of course, but there also are several time-tested investment principles that can help put the odds in your favor.
One of the basic tenets is to invest for the long term. Over time, riding out the markets' inevitable ups and downs has proven much more effective than selling into panic or chasing the hottest trend. Even missing only a few of the markets' best days can significantly diminish investor returns. Patience also affords the benefits of compounding - of earning interest on additional income or reinvested dividends and capital gains. There can be tax advantages and cost benefits to consider as well. While staying the course doesn't eliminate risk, it can considerably lessen the effect of short-term declines.
You can further manage your investing risk through diversification. And today, more than ever, geographic diversification should be taken into account. Studies indicate that asset allocation is the single most important determinant of a portfolio's long-term success. The right mix of stocks, bonds and cash - aligned to your particular risk tolerance and investment objective - is very important. Age-appropriate rebalancing is also an essential aspect of asset allocation. For younger investors, an emphasis on equities - which historically have been the best-performing asset class over time - is encouraged. As investors near their specific goal, such as retirement or sending a child to college, consideration may be given to replacing volatile assets (e.g. common stocks) with more-stable fixed investments (bonds or savings plans).
A third principle - investing regularly - can help lower the average cost of your purchases. Investing a certain amount of money each month or quarter helps ensure you won't pay for all your shares at market highs. This strategy - known as dollar cost averaging - also reduces "emotion" from investing, helping shareholders avoid selling weak performers just prior to an upswing, or chasing a hot performer just before a correction.
We invite you to contact us via the Internet, through our Investor Centers or by phone. It is our privilege to provide you the information you need to make the investments that are right for you.
Sincerely,
(The chairman's signature appears here.)
Edward C. Johnson 3d
Annual Report
Average annual total return reflects the change in the value of an investment, assuming reinvestment of the class' distributions from dividend income and capital gains (the profits earned upon the sale of securities that have grown in value, if any) and assuming a constant rate of performance each year. The $10,000 table and the fund's returns do not reflect the deduction of taxes that a shareholder would pay on fund distributions or the redemption of fund shares. During periods of reimbursement by Fidelity, a fund's total return will be greater than it would be had the reimbursement not occurred. How a fund did yesterday is no guarantee of how it will do tomorrow. Returns reflect the conversion of Class B shares to Class A shares after a maximum of seven years.
Average Annual Total Returns
Periods ended October 31, 2010 | Past 1
year | Past 5
years | Past 10
years |
Class A (incl. 5.75% sales charge) | 3.43% | 2.28% | 3.23% |
Class T (incl. 3.50% sales charge) | 5.59% | 2.52% | 3.24% |
Class B (incl. contingent deferred sales charge) A | 3.87% | 2.47% | 3.33% |
Class C (incl. contingent deferred sales charge) B | 7.92% | 2.75% | 3.07% |
A Class B shares' contingent deferred sales charges included in the past one year, past five years, and past ten years total return figures are 5%, 2%, and 0%, respectively.
B Class C shares' contingent deferred sales charges included in the past one year, past five years, and past ten years total return figures are 1%, 0%, and 0%, respectively.
Annual Report
$10,000 Over 10 Years
Let's say hypothetically that $10,000 was invested in Fidelity AdvisorSM Europe Capital Appreciation Fund - Class A on October 31, 2000, and the current 5.75% sales charge was paid. The chart shows how the value of your investment would have changed, and also shows how the MSCI® Europe Index performed over the same period.
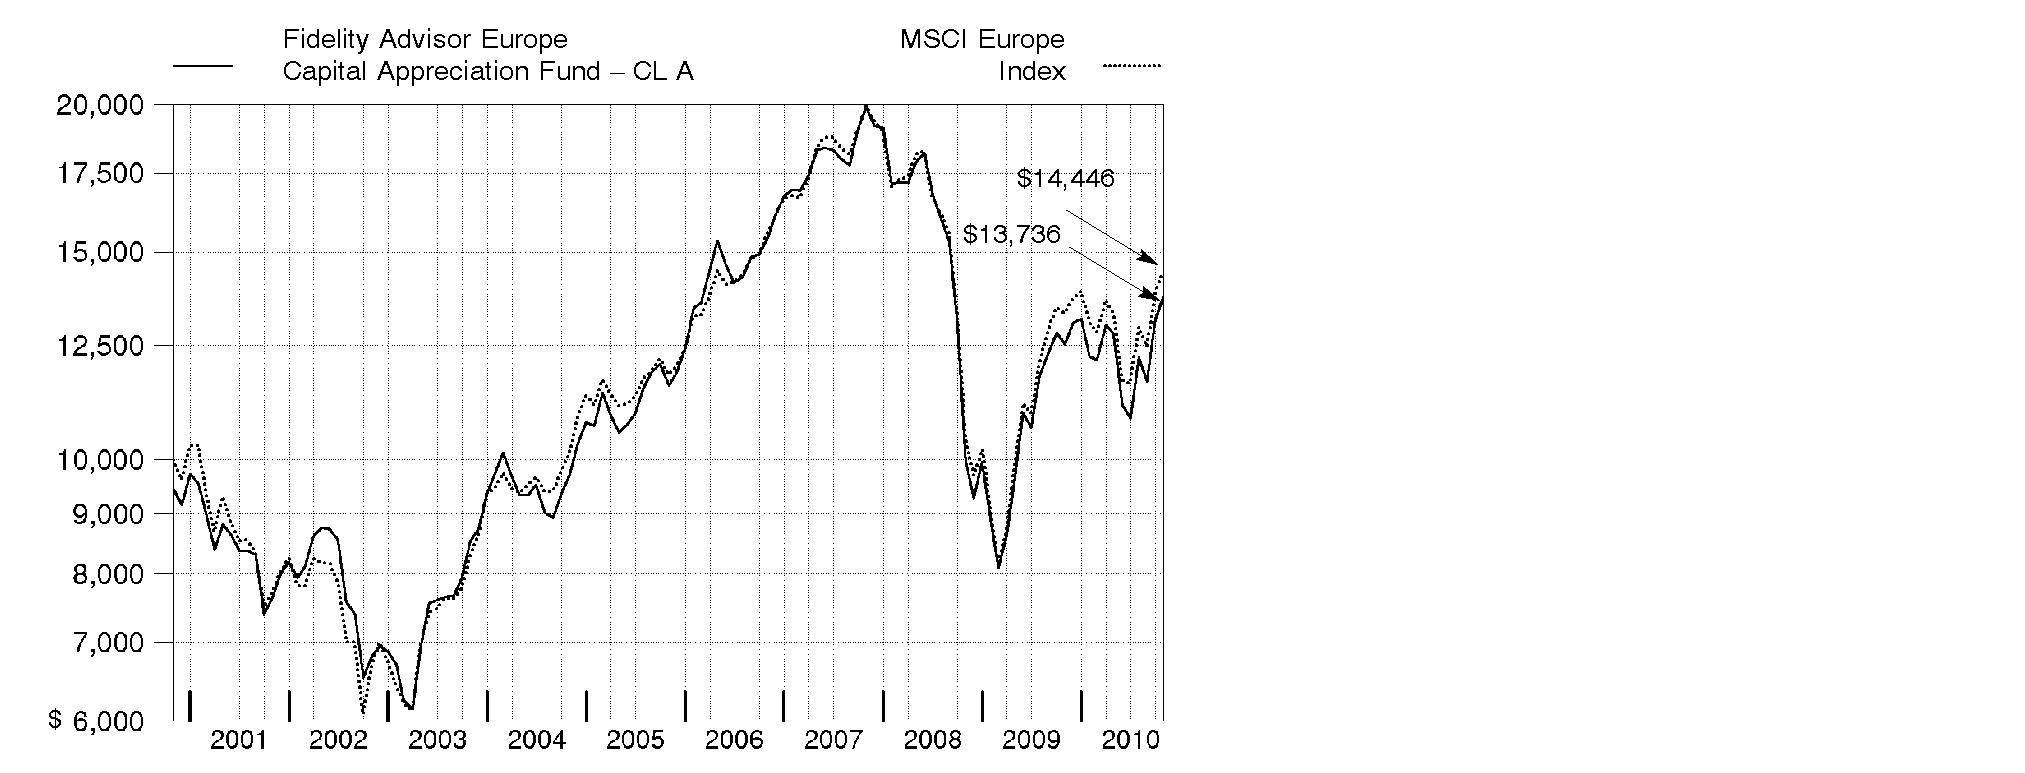
Annual Report
Market Recap: International stocks rode a wave of volatility similar to that of their U.S. counterparts during the 12 months ending October 31, 2010. Stocks gained modestly in the first half of the period, despite growing concerns about the European debt crisis. Sentiment turned decidedly negative in May and June, however, and the market suffered a precipitous decline. These losses were more than offset during the last four months of the period, when signs of economic growth and subsiding debt fears helped propel international stocks about 21%. For the full year, the MSCI® ACWI® (All Country World Index) ex USA Index gained 12.76%, boosted in part by a generally depreciating U.S. dollar. Within the index, Canada and emerging markets were standouts, returning 23% and 24%, respectively. Results in the latter group were led by strong-performing India, Mexico and South Africa, while China fell short of the MSCI benchmark due to cooling economic growth. The developed Asia ex Japan segment rose 16% for the period, lifted by solid results from Singapore and Hong Kong. Meanwhile, Europe rose just 9%, held back mainly by debt-riddled Spain and Italy, as well as lagging major constituent France. Japan returned only 5%, a result of that nation's continued weak economy.
Comments from Melissa Reilly, Portfolio Manager of Fidelity AdvisorSM Europe Capital Appreciation Fund: For the 12 months ending October 31, 2010, the fund's Class A, Class T, Class B and Class C shares advanced 9.74%, 9.42%, 8.87% and 8.92%, respectively (excluding sales charges), outpacing the 8.60% increase of the MSCI Europe Index. Stock selection and a significant overweighting in consumer discretionary contributed the most. The fund's media holdings - Germany's ProSiebenSat.1 Media, U.S.-based Virgin Media and Sweden's Modern Times Group - were beneficial, as advertising spending increased during the period. ProSiebenSat.1 Media and Virgin Media were out-of-index positions. The fund's positioning in industrials, particularly among capital goods names, and security selection in technology helped. Danish pharmaceutical company Novo Nordisk and materials firm Umicore in Belgium also aided results. Geographically, the fund's holdings in Germany and Denmark notably contributed, as did out-of-index stakes in the U.S., China and South Africa. Conversely, investments in the U.K., Spain and the Netherlands detracted. On a sector basis, the fund's positioning in telecommunication services, materials and consumer staples hurt, while several underweightings among individual stocks detracted, including AstraZeneca, a British biopharmaceutical firm, and telecom companies U.K.-based Vodafone and Telefonica in Spain. I sold Telefonica by period end. British oil company BP also hurt.
The views expressed above reflect those of the portfolio manager(s) only through the end of the period as stated on the cover of this report and do not necessarily represent the views of Fidelity or any other person in the Fidelity organization. Any such views are subject to change at any time based upon market or other conditions and Fidelity disclaims any responsibility to update such views. These views may not be relied on as investment advice and, because investment decisions for a Fidelity fund are based on numerous factors, may not be relied on as an indication of trading intent on behalf of any Fidelity fund.
Annual Report
Shareholder Expense Example
As a shareholder of the Fund, you incur two types of costs: (1) transaction costs, including sales charges (loads) on purchase payments or redemption proceeds, redemption fees, and (2) ongoing costs, including management fees, distribution and/or service (12b-1) fees and other Fund expenses. This Example is intended to help you understand your ongoing costs (in dollars) of investing in the Fund and to compare these costs with the ongoing costs of investing in other mutual funds.
The Example is based on an investment of $1,000 invested at the beginning of the period and held for the entire period (May 1, 2010 to October 31, 2010).
Actual Expenses
The first line of the accompanying table for each class of the Fund provides information about actual account values and actual expenses. You may use the information in this line, together with the amount you invested, to estimate the expenses that you paid over the period. Simply divide your account value by $1,000.00 (for example, an $8,600 account value divided by $1,000.00 = 8.6), then multiply the result by the number in the first line for a class of the Fund under the heading entitled "Expenses Paid During Period" to estimate the expenses you paid on your account during this period. In addition, the Fund, as a shareholder in the underlying Fidelity Central Funds, will indirectly bear its pro-rata share of the fees and expenses incurred by the underlying Fidelity Central Funds. These fees and expenses are not included in the Fund's annualized expense ratio used to calculate the expense estimate in the table below.
Hypothetical Example for Comparison Purposes
The second line of the accompanying table for each class of the Fund provides information about hypothetical account values and hypothetical expenses based on a Class' actual expense ratio and an assumed rate of return of 5% per year before expenses, which is not the Class' actual return. The hypothetical account values and expenses may not be used to estimate the actual ending account balance or expenses you paid for the period. You may use this information to compare the ongoing costs of investing in the Fund and other funds. To do so, compare this 5% hypothetical example with the 5% hypothetical examples that appear in the shareholder reports of the other funds. In addition, the Fund, as a shareholder in the underlying Fidelity Central Funds, will indirectly bear its pro-rata share of the fees and expenses incurred by the underlying Fidelity Central Funds. These fees and expenses are not included in the Fund's annualized expense ratio used to calculate the expense estimate in the table below.
Please note that the expenses shown in the table are meant to highlight your ongoing costs only and do not reflect any transaction costs. Therefore, the second line of the table is useful in comparing ongoing costs only, and will not help you determine the relative total costs of owning different funds. In addition, if these transactional costs were included, your costs would have been higher.
Annual Report
|
Annualized
Expense Ratio
|
Beginning
Account Value
May 1, 2010
|
Ending
Account Value
October 31, 2010
| Expenses Paid
During Period*
May 1, 2010 to
October 31, 2010 |
Class A | 1.50%** | | | |
Actual | | $ 1,000.00 | $ 1,074.10 | $ 7.84** |
HypotheticalA | | $ 1,000.00 | $ 1,017.64 | $ 7.63** |
Class T | 1.75%** | | | |
Actual | | $ 1,000.00 | $ 1,072.50 | $ 9.14** |
HypotheticalA | | $ 1,000.00 | $ 1,016.38 | $ 8.89** |
Class B | 2.25%** | | | |
Actual | | $ 1,000.00 | $ 1,069.70 | $ 11.74** |
HypotheticalA | | $ 1,000.00 | $ 1,013.86 | $ 11.42** |
Class C | 2.25%** | | | |
Actual | | $ 1,000.00 | $ 1,070.10 | $ 11.74** |
HypotheticalA | | $ 1,000.00 | $ 1,013.86 | $ 11.42** |
Institutional Class | 1.25%** | | | |
Actual | | $ 1,000.00 | $ 1,075.40 | $ 6.54** |
HypotheticalA | | $ 1,000.00 | $ 1,018.90 | $ 6.36** |
A 5% return per year before expenses
* Expenses are equal to each Class' annualized expense ratio, multiplied by the average account value over the period, multiplied by 184/365 (to reflect the one-half year period).
** If changes to voluntary expense limitations, effective November 1, 2010 had been in effect during the entire period, the annualized expense ratios and the expenses paid in the actual and hypothetical examples above would have been as follows:
| Annualized
Expense Ratio |
Expenses Paid
|
Class A | 1.45% | |
Actual | | $ 7.58 |
HypotheticalA | | $ 7.38 |
Class T | 1.70% | |
Actual | | $ 8.88 |
HypotheticalA | | $ 8.64 |
Class B | 2.20% | |
Actual | | $ 11.48 |
HypotheticalA | | $ 11.17 |
Class C | 2.20% | |
Actual | | $ 11.48 |
HypotheticalA | | $ 11.17 |
Institutional Class | 1.20% | |
Actual | | $ 6.28 |
HypotheticalA | | $ 6.11 |
A 5% return per year before expenses
Annual Report
Investment Changes (Unaudited)
Top Five Stocks as of October 31, 2010 |
| % of fund's
net assets | % of fund's net assets
6 months ago |
BP PLC (United Kingdom, Oil, Gas & Consumable Fuels) | 3.5 | 1.8 |
Royal Dutch Shell PLC Class A (United Kingdom) (United Kingdom, Oil, Gas & Consumable Fuels) | 3.2 | 4.2 |
Vodafone Group PLC (United Kingdom, Wireless Telecommunication Services) | 2.5 | 0.3 |
Novartis AG (Switzerland, Pharmaceuticals) | 2.4 | 1.7 |
HSBC Holdings PLC sponsored ADR (United Kingdom, Commercial Banks) | 2.3 | 2.9 |
| 13.9 | |
Top Five Market Sectors as of October 31, 2010 |
| % of fund's
net assets | % of fund's net assets
6 months ago |
Consumer Discretionary | 21.2 | 12.7 |
Financials | 18.9 | 23.7 |
Industrials | 11.3 | 14.0 |
Energy | 11.2 | 11.2 |
Materials | 10.0 | 9.6 |
Top Five Countries as of October 31, 2010 |
(excluding cash equivalents) | % of fund's
net assets | % of fund's net assets
6 months ago |
United Kingdom | 30.0 | 29.1 |
France | 13.0 | 12.2 |
Germany | 10.0 | 10.0 |
Switzerland | 9.5 | 11.4 |
Spain | 4.8 | 6.0 |
Percentages are adjusted for the effect of open futures contracts, if applicable. |
Asset Allocation (% of fund's net assets) |
As of October 31, 2010 | As of April 30, 2010 |
| Stocks 99.6% | | | Stocks 99.6% | |
| Short-Term
Investments and
Net Other Assets 0.4% | | | Short-Term
Investments and
Net Other Assets 0.4% | |

Annual Report
Investments October 31, 2010
Showing Percentage of Net Assets
Common Stocks - 96.1% |
| Shares | | Value |
Austria - 0.7% |
Erste Bank AG | 3,500 | | $ 157,937 |
Bailiwick of Jersey - 2.9% |
Experian PLC | 15,600 | | 181,328 |
Randgold Resources Ltd. sponsored ADR | 3,300 | | 309,936 |
Shire PLC | 7,490 | | 175,747 |
TOTAL BAILIWICK OF JERSEY | | 667,011 |
Belgium - 3.1% |
Ageas | 51,300 | | 157,681 |
Anheuser-Busch InBev SA NV | 5,433 | | 340,453 |
Anheuser-Busch InBev SA NV (strip VVPR) (a) | 6,080 | | 25 |
Umicore SA | 4,564 | | 214,777 |
TOTAL BELGIUM | | 712,936 |
Bermuda - 0.4% |
Huabao International Holdings Ltd. | 62,000 | | 93,425 |
British Virgin Islands - 0.3% |
Playtech Ltd. | 9,825 | | 70,481 |
Canada - 1.6% |
First Quantum Minerals Ltd. | 1,400 | | 122,594 |
Niko Resources Ltd. | 500 | | 47,701 |
Petrobank Energy & Resources Ltd. (a) | 1,600 | | 63,677 |
Uranium One, Inc. (a) | 32,600 | | 133,290 |
TOTAL CANADA | | 367,262 |
Cayman Islands - 0.7% |
Hengdeli Holdings Ltd. | 284,000 | | 157,549 |
China - 1.3% |
Baidu.com, Inc. sponsored ADR (a) | 900 | | 99,009 |
China Merchants Bank Co. Ltd. (H Shares) | 48,000 | | 136,236 |
Home Inns & Hotels Management, Inc. sponsored ADR (a) | 1,300 | | 66,508 |
TOTAL CHINA | | 301,753 |
Denmark - 3.1% |
Carlsberg AS Series B | 1,700 | | 185,889 |
Novo Nordisk AS Series B | 3,147 | | 330,379 |
Novozymes AS Series B | 1,000 | | 133,231 |
Pandora A/S | 1,500 | | 72,773 |
TOTAL DENMARK | | 722,272 |
Finland - 1.1% |
Nokia Corp. | 23,550 | | 252,849 |
Common Stocks - continued |
| Shares | | Value |
France - 13.0% |
Accor SA | 4,462 | | $ 182,938 |
Alstom SA | 2,192 | | 110,595 |
Atos Origin SA (a) | 3,116 | | 144,056 |
BNP Paribas SA | 5,069 | | 370,649 |
Essilor International SA | 1,397 | | 93,266 |
Iliad Group SA | 1,650 | | 185,738 |
L'Oreal SA | 2,200 | | 258,242 |
LVMH Moet Hennessy - Louis Vuitton | 1,912 | | 299,567 |
Natixis SA (a) | 34,500 | | 211,558 |
PPR SA | 1,300 | | 213,087 |
Publicis Groupe SA | 3,300 | | 164,340 |
Remy Cointreau SA | 1,423 | | 99,913 |
Safran SA | 5,100 | | 161,656 |
Schneider Electric SA | 1,637 | | 232,336 |
Societe Generale Series A | 2,155 | | 129,014 |
Vallourec SA | 1,604 | | 166,432 |
TOTAL FRANCE | | 3,023,387 |
Germany - 6.5% |
Bayerische Motoren Werke AG (BMW) | 3,554 | | 254,728 |
Fresenius Medical Care AG & Co. KGaA | 2,200 | | 140,111 |
Linde AG | 1,133 | | 163,090 |
MAN SE | 2,262 | | 248,649 |
Rheinmetall AG | 1,800 | | 129,639 |
SAP AG | 2,911 | | 151,773 |
Siemens AG | 3,782 | | 431,943 |
TOTAL GERMANY | | 1,519,933 |
Italy - 1.5% |
Mediaset SpA | 21,100 | | 155,606 |
Saipem SpA | 4,218 | | 187,402 |
TOTAL ITALY | | 343,008 |
Netherlands - 2.5% |
AEGON NV (a) | 19,000 | | 120,387 |
ASML Holding NV (Netherlands) | 4,500 | | 149,137 |
ING Groep NV (Certificaten Van Aandelen) unit (a) | 14,700 | | 157,231 |
Randstad Holdings NV (a) | 3,153 | | 150,044 |
TOTAL NETHERLANDS | | 576,799 |
Norway - 2.4% |
Aker Solutions ASA | 5,400 | | 82,208 |
DnB NOR ASA | 11,800 | | 161,917 |
Common Stocks - continued |
| Shares | | Value |
Norway - continued |
Storebrand ASA (A Shares) (a) | 28,500 | | $ 207,258 |
Telenor ASA | 6,200 | | 99,942 |
TOTAL NORWAY | | 551,325 |
Qatar - 0.3% |
Commercial Bank of Qatar GDR (Reg. S) | 17,849 | | 81,787 |
Russia - 2.0% |
Magnit OJSC GDR (Reg. S) | 4,600 | | 123,004 |
Mechel Steel Group OAO sponsored ADR | 5,000 | | 117,750 |
OJSC MMC Norilsk Nickel sponsored ADR | 6,400 | | 119,360 |
Uralkali JSC GDR (Reg. S) | 4,800 | | 118,800 |
TOTAL RUSSIA | | 478,914 |
South Africa - 0.9% |
Clicks Group Ltd. | 31,999 | | 208,757 |
Spain - 4.8% |
Banco Santander SA | 40,891 | | 524,726 |
Gestevision Telecinco SA | 27,700 | | 353,287 |
Inditex SA | 2,853 | | 238,228 |
TOTAL SPAIN | | 1,116,241 |
Sweden - 3.9% |
Elekta AB (B Shares) | 1,800 | | 68,103 |
H&M Hennes & Mauritz AB (B Shares) | 7,374 | | 259,794 |
Modern Times Group MTG AB (B Shares) | 1,500 | | 107,557 |
Sandvik AB | 11,400 | | 171,812 |
SKF AB (B Shares) | 3,700 | | 95,524 |
Swedbank AB (A Shares) (a) | 15,005 | | 209,413 |
TOTAL SWEDEN | | 912,203 |
Switzerland - 9.5% |
Clariant AG (Reg.) (a) | 7,670 | | 129,658 |
Compagnie Financiere Richemont SA Series A | 4,622 | | 230,454 |
Julius Baer Group Ltd. | 2,170 | | 91,575 |
Nestle SA | 8,426 | | 461,382 |
Novartis AG | 9,515 | | 551,157 |
Schindler Holding AG (participation certificate) | 1,591 | | 170,519 |
The Swatch Group AG (Bearer) | 500 | | 191,040 |
Transocean Ltd. (a) | 1,000 | | 63,360 |
UBS AG (a) | 18,294 | | 310,675 |
TOTAL SWITZERLAND | | 2,199,820 |
Common Stocks - continued |
| Shares | | Value |
Turkey - 0.8% |
Boyner Buyuk Magazacilik AS (a) | 25,000 | | $ 58,217 |
Turkiye Garanti Bankasi AS | 21,000 | | 128,843 |
TOTAL TURKEY | | 187,060 |
United Kingdom - 30.0% |
Aegis Group PLC | 30,624 | | 61,674 |
AstraZeneca PLC (United Kingdom) | 2,934 | | 147,567 |
BG Group PLC | 17,699 | | 344,673 |
BHP Billiton PLC | 5,413 | | 191,732 |
BP PLC | 43,400 | | 294,960 |
BP PLC sponsored ADR | 12,500 | | 510,375 |
British Airways PLC (a)(d) | 44,600 | | 193,431 |
Britvic PLC | 13,700 | | 105,884 |
Burberry Group PLC | 11,400 | | 186,115 |
Capita Group PLC | 8,500 | | 104,384 |
Carphone Warehouse Group PLC | 28,950 | | 141,234 |
Fresnillo PLC | 8,200 | | 164,220 |
GlaxoSmithKline PLC | 22,700 | | 443,220 |
HSBC Holdings PLC sponsored ADR | 10,262 | | 534,753 |
ITV PLC (a) | 138,600 | | 151,555 |
Kazakhmys PLC | 4,200 | | 88,554 |
Kesa Electricals PLC | 31,400 | | 79,737 |
Lloyds Banking Group PLC (a) | 227,200 | | 249,690 |
Micro Focus International PLC | 18,400 | | 112,553 |
Misys PLC (a) | 26,100 | | 117,671 |
Morgan Crucible Co. PLC | 25,800 | | 94,658 |
Next PLC | 2,300 | | 84,201 |
Reckitt Benckiser Group PLC | 4,200 | | 234,910 |
Royal Dutch Shell PLC Class A (United Kingdom) | 23,017 | | 747,120 |
Sage Group PLC | 19,900 | | 85,892 |
Schroders PLC | 4,700 | | 118,900 |
Standard Chartered PLC (United Kingdom) | 10,738 | | 310,616 |
TalkTalk Telecom Group PLC (a) | 43,600 | | 92,137 |
Vodafone Group PLC | 216,500 | | 591,751 |
Wolfson Microelectronics PLC (a) | 26,100 | | 106,422 |
Xstrata PLC | 13,800 | | 267,416 |
TOTAL UNITED KINGDOM | | 6,958,005 |
United States of America - 2.8% |
Allergan, Inc. | 1,500 | | 108,615 |
Anadarko Petroleum Corp. | 1,400 | | 86,198 |
Apple, Inc. (a) | 400 | | 120,348 |
Common Stocks - continued |
| Shares | | Value |
United States of America - continued |
CF Industries Holdings, Inc. | 700 | | $ 85,771 |
Google, Inc. Class A (a) | 100 | | 61,299 |
Virgin Media, Inc. (d) | 7,300 | | 185,639 |
TOTAL UNITED STATES OF AMERICA | | 647,870 |
TOTAL COMMON STOCKS (Cost $19,694,713) | 22,308,584 |
Nonconvertible Preferred Stocks - 3.5% |
| | | |
Germany - 3.5% |
ProSiebenSat.1 Media AG | 14,200 | | 375,216 |
Volkswagen AG | 2,800 | | 420,774 |
TOTAL NONCONVERTIBLE PREFERRED STOCKS (Cost $513,231) | 795,990 |
Money Market Funds - 2.9% |
| | | |
Fidelity Cash Central Fund, 0.23% (b) | 333,865 | | 333,865 |
Fidelity Securities Lending Cash Central Fund, 0.24% (b)(c) | 342,135 | | 342,135 |
TOTAL MONEY MARKET FUNDS (Cost $676,000) | 676,000 |
TOTAL INVESTMENT PORTFOLIO - 102.5% (Cost $20,883,944) | | 23,780,574 |
NET OTHER ASSETS (LIABILITIES) - (2.5)% | | (570,806) |
NET ASSETS - 100% | $ 23,209,768 |
Legend |
(a) Non-income producing |
(b) Affiliated fund that is available only to investment companies and other accounts managed by Fidelity Investments. The rate quoted is the annualized seven-day yield of the fund at period end. A complete unaudited listing of the fund's holdings as of its most recent quarter end is available upon request. In addition, each Fidelity Central Fund's financial statements, which are not covered by the Fund's report of Independent Registered Public Accounting Firm, are available on the SEC's website or upon request. |
(c) Investment made with cash collateral received from securities on loan. |
(d) Security or a portion of the security is on loan at period end. |
Affiliated Central Funds |
Information regarding fiscal year to date income earned by the Fund from investments in Fidelity Central Funds is as follows: |
Fund | Income earned |
Fidelity Cash Central Fund | $ 450 |
Fidelity Securities Lending Cash Central Fund | 9,407 |
Total | $ 9,857 |
Other Information |
The following is a summary of the inputs used, as of October 31, 2010, involving the Fund's assets and liabilities carried at fair value. The inputs or methodology used for valuing securities may not be an indication of the risk associated with investing in those securities. For more information on valuation inputs, and their aggregation into the levels used in the table below, please refer to the Security Valuation section in the accompanying Notes to Financial Statements. |
Valuation Inputs at Reporting Date: |
Description | Total | Level 1 | Level 2 | Level 3 |
Investments in Securities: | | | | |
Equities: | | | | |
United Kingdom | $ 6,958,005 | $ 5,039,085 | $ 1,918,920 | $ - |
France | 3,023,387 | 3,023,387 | - | - |
Germany | 2,315,923 | 1,592,096 | 723,827 | - |
Switzerland | 2,199,820 | 1,337,988 | 861,832 | - |
Spain | 1,116,241 | 591,515 | 524,726 | - |
Sweden | 912,203 | 912,203 | - | - |
Denmark | 722,272 | 391,893 | 330,379 | - |
Belgium | 712,936 | 712,936 | - | - |
Bailiwick of Jersey | 667,011 | 491,264 | 175,747 | - |
Other | 4,476,776 | 3,797,172 | 679,604 | - |
Money Market Funds | 676,000 | 676,000 | - | - |
Total Investments in Securities: | $ 23,780,574 | $ 18,565,539 | $ 5,215,035 | $ - |
Income Tax Information |
At October 31, 2010, the Fund had a capital loss carryforward of approximately $19,126,506 of which $11,081,881 and $8,044,625 will expire on October 31, 2016 and 2017, respectively. Capital loss carryforwards are only available to offset future capital gains of the Fund to the extent provided by regulations and may be limited. |
See accompanying notes which are an integral part of the financial statements.
Annual Report
Statement of Assets and Liabilities
| October 31, 2010 |
| | |
Assets | | |
Investment in securities, at value (including securities loaned of $327,596) - See accompanying schedule: Unaffiliated issuers (cost $20,207,944) | $ 23,104,574 | |
Fidelity Central Funds (cost $676,000) | 676,000 | |
Total Investments (cost $20,883,944) | | $ 23,780,574 |
Foreign currency held at value (cost $262) | | 265 |
Receivable for investments sold | | 54,248 |
Receivable for fund shares sold | | 2,794 |
Dividends receivable | | 48,491 |
Distributions receivable from Fidelity Central Funds | | 462 |
Receivable from investment adviser for expense reductions | | 5,159 |
Other receivables | | 7,976 |
Total assets | | 23,899,969 |
| | |
Liabilities | | |
Payable for investments purchased | $ 200,260 | |
Payable for fund shares redeemed | 50,189 | |
Accrued management fee | 13,678 | |
Distribution and service plan fees payable | 9,516 | |
Other affiliated payables | 6,430 | |
Other payables and accrued expenses | 67,993 | |
Collateral on securities loaned, at value | 342,135 | |
Total liabilities | | 690,201 |
| | |
Net Assets | | $ 23,209,768 |
Net Assets consist of: | | |
Paid in capital | | $ 39,801,000 |
Undistributed net investment income | | 65,823 |
Accumulated undistributed net realized gain (loss) on investments and foreign currency transactions | | (19,538,320) |
Net unrealized appreciation (depreciation) on investments and assets and liabilities in foreign currencies | | 2,881,265 |
Net Assets | | $ 23,209,768 |
See accompanying notes which are an integral part of the financial statements.
Annual Report
Financial Statements - continued
Statement of Assets and Liabilities - continued
| October 31, 2010 |
| | |
Calculation of Maximum Offering Price Class A:
Net Asset Value and redemption price per share ($10,276,439 ÷ 875,292 shares) | | $ 11.74 |
| | |
Maximum offering price per share (100/94.25 of $11.74) | | $ 12.46 |
Class T:
Net Asset Value and redemption price per share ($7,495,557 ÷ 641,620 shares) | | $ 11.68 |
| | |
Maximum offering price per share (100/96.50 of $11.68) | | $ 12.10 |
Class B:
Net Asset Value and offering price per share ($1,935,324 ÷ 170,496 shares)A | | $ 11.35 |
| | |
Class C:
Net Asset Value and offering price per share ($3,166,392 ÷ 280,323 shares)A | | $ 11.30 |
| | |
Institutional Class:
Net Asset Value, offering price and redemption price per share ($336,056 ÷ 28,048 shares) | | $ 11.98 |
A Redemption price per share is equal to net asset value less any applicable contingent deferred sales charge.
See accompanying notes which are an integral part of the financial statements.
Annual Report
Statement of Operations
| Year ended October 31, 2010 |
| | |
Investment Income | | |
Dividends | | $ 534,770 |
Interest | | 5 |
Income from Fidelity Central Funds | | 9,857 |
Income before foreign taxes withheld | | 544,632 |
Less foreign taxes withheld | | (57,960) |
Total income | | 486,672 |
| | |
Expenses | | |
Management fee | $ 169,951 | |
Transfer agent fees | 77,941 | |
Distribution and service plan fees | 120,721 | |
Accounting and security lending fees | 12,630 | |
Custodian fees and expenses | 67,520 | |
Independent trustees' compensation | 137 | |
Registration fees | 56,048 | |
Audit | 50,421 | |
Legal | 130 | |
Miscellaneous | 313 | |
Total expenses before reductions | 555,812 | |
Expense reductions | (154,128) | 401,684 |
Net investment income (loss) | | 84,988 |
Realized and Unrealized Gain (Loss) Net realized gain (loss) on: | | |
Investment securities: | | |
Unaffiliated issuers | 331,258 | |
Foreign currency transactions | (9,206) | |
Total net realized gain (loss) | | 322,052 |
Change in net unrealized appreciation (depreciation) on: Investment securities | 1,504,855 | |
Assets and liabilities in foreign currencies | 2,278 | |
Total change in net unrealized appreciation (depreciation) | | 1,507,133 |
Net gain (loss) | | 1,829,185 |
Net increase (decrease) in net assets resulting from operations | | $ 1,914,173 |
See accompanying notes which are an integral part of the financial statements.
Annual Report
Financial Statements - continued
Statement of Changes in Net Assets
| Year ended
October 31,
2010 | Year ended
October 31,
2009 |
Increase (Decrease) in Net Assets | | |
Operations | | |
Net investment income (loss) | $ 84,988 | $ 334,809 |
Net realized gain (loss) | 322,052 | (7,981,840) |
Change in net unrealized appreciation (depreciation) | 1,507,133 | 12,335,064 |
Net increase (decrease) in net assets resulting
from operations | 1,914,173 | 4,688,033 |
Distributions to shareholders from net investment income | (281,171) | (713,757) |
Share transactions - net increase (decrease) | (4,178,483) | (4,078,182) |
Redemption fees | 436 | 558 |
Total increase (decrease) in net assets | (2,545,045) | (103,348) |
| | |
Net Assets | | |
Beginning of period | 25,754,813 | 25,858,161 |
End of period (including undistributed net investment income of $65,823 and undistributed net investment income of $271,133, respectively) | $ 23,209,768 | $ 25,754,813 |
See accompanying notes which are an integral part of the financial statements.
Annual Report
Financial Highlights - Class A
Years ended October 31, | 2010 | 2009 | 2008 | 2007 | 2006 |
Selected Per-Share Data | | | | | |
Net asset value, beginning of period | $ 10.82 | $ 8.98 | $ 20.94 | $ 17.49 | $ 13.47 |
Income from Investment Operations | | | | | |
Net investment income (loss) C | .06 | .15 | .25 | .32 | .19 F |
Net realized and unrealized gain (loss) | .99 | 1.99 | (9.22) | 4.48 | 4.18 |
Total from investment operations | 1.05 | 2.14 | (8.97) | 4.80 | 4.37 |
Distributions from net investment income | (.13) | (.30) | (.31) | (.12) | (.13) |
Distributions from net realized gain | - | - | (2.68) | (1.23) | (.22) |
Total distributions | (.13) | (.30) | (2.99) | (1.35) | (.35) |
Redemption fees added to paid in capital C, H | - | - | - | - | - |
Net asset value, end of period | $ 11.74 | $ 10.82 | $ 8.98 | $ 20.94 | $ 17.49 |
Total Return A, B | 9.74% | 25.27% | (49.77)% | 29.16% | 33.17% |
Ratios to Average Net Assets D, G | | | | | |
Expenses before reductions | 2.05% | 2.00% | 1.63% | 1.53% | 1.81% |
Expenses net of fee waivers, if any | 1.50% | 1.50% | 1.50% | 1.50% | 1.50% |
Expenses net of all reductions | 1.43% | 1.46% | 1.46% | 1.46% | 1.40% |
Net investment income (loss) | .61% | 1.73% | 1.65% | 1.69% | 1.16% F |
Supplemental Data | | | | | |
Net assets, end of period (000 omitted) | $ 10,276 | $ 10,904 | $ 10,286 | $ 29,273 | $ 18,972 |
Portfolio turnover rate E | 143% | 109% | 112% | 173% | 173% |
A Total returns would have been lower had certain expenses not been reduced during the periods shown.
B Total returns do not include the effect of the sales charges.
C Calculated based on average shares outstanding during the period.
D Fees and expenses of the underlying Fidelity Central Funds are not included in the Fund's expense ratio. The Fund indirectly bears its proportionate share of the expenses of any underlying Fidelity Central Funds.
E Amount does not include the portfolio activity of any underlying Fidelity Central Funds.
F Investment income per share reflects a special dividend which amounted to $.08 per share. Excluding the special dividend, the ratio of net investment income (loss) to average net assets would have been .68%.
G Expense ratios reflect operating expenses of the class. Expenses before reductions do not reflect amounts reimbursed by the investment adviser or reductions from brokerage service arrangements or reductions from other expense offset arrangements and do not represent the amount paid by the class during periods when reimbursements or reductions occur. Expenses net of fee waivers reflect expenses after reimbursement by the investment adviser but prior to reductions from brokerage service arrangements or other expense offset arrangements. Expenses net of all reductions represent the net expenses paid by the class.
H Amount represents less than $.01 per share.
See accompanying notes which are an integral part of the financial statements.
Annual Report
Financial Highlights - Class T
Years ended October 31, | 2010 | 2009 | 2008 | 2007 | 2006 |
Selected Per-Share Data | | | | | |
Net asset value, beginning of period | $ 10.78 | $ 8.92 | $ 20.75 | $ 17.35 | $ 13.34 |
Income from Investment Operations | | | | | |
Net investment income (loss) C | .04 | .13 | .21 | .27 | .14 F |
Net realized and unrealized gain (loss) | .97 | 1.99 | (9.17) | 4.44 | 4.17 |
Total from investment operations | 1.01 | 2.12 | (8.96) | 4.71 | 4.31 |
Distributions from net investment income | (.11) | (.26) | (.19) | (.08) | (.08) |
Distributions from net realized gain | - | - | (2.68) | (1.23) | (.22) |
Total distributions | (.11) | (.26) | (2.87) | (1.31) | (.30) |
Redemption fees added to paid in capital C, H | - | - | - | - | - |
Net asset value, end of period | $ 11.68 | $ 10.78 | $ 8.92 | $ 20.75 | $ 17.35 |
Total Return A, B | 9.42% | 24.99% | (49.91)% | 28.86% | 32.95% |
Ratios to Average Net Assets D, G | | | | | |
Expenses before reductions | 2.34% | 2.28% | 1.88% | 1.80% | 2.07% |
Expenses net of fee waivers, if any | 1.75% | 1.75% | 1.75% | 1.75% | 1.75% |
Expenses net of all reductions | 1.67% | 1.71% | 1.71% | 1.71% | 1.65% |
Net investment income (loss) | .36% | 1.48% | 1.40% | 1.44% | .91% F |
Supplemental Data | | | | | |
Net assets, end of period (000 omitted) | $ 7,496 | $ 8,014 | $ 7,866 | $ 21,357 | $ 24,643 |
Portfolio turnover rate E | 143% | 109% | 112% | 173% | 173% |
A Total returns would have been lower had certain expenses not been reduced during the periods shown.
B Total returns do not include the effect of the sales charges.
C Calculated based on average shares outstanding during the period.
D Fees and expenses of the underlying Fidelity Central Funds are not included in the Fund's expense ratio. The Fund indirectly bears its proportionate share of the expenses of any underlying Fidelity Central Funds.
E Amount does not include the portfolio activity of any underlying Fidelity Central Funds.
F Investment income per share reflects a special dividend which amounted to $.08 per share. Excluding the special dividend, the ratio of net investment income (loss) to average net assets would have been .43%.
G Expense ratios reflect operating expenses of the class. Expenses before reductions do not reflect amounts reimbursed by the investment adviser or reductions from brokerage service arrangements or reductions from other expense offset arrangements and do not represent the amount paid by the class during periods when reimbursements or reductions occur. Expenses net of fee waivers reflect expenses after reimbursement by the investment adviser but prior to reductions from brokerage service arrangements or other expense offset arrangements. Expenses net of all reductions represent the net expenses paid by the class.
H Amount represents less than $.01 per share.
See accompanying notes which are an integral part of the financial statements.
Annual Report
Financial Highlights - Class B
Years ended October 31, | 2010 | 2009 | 2008 | 2007 | 2006 |
Selected Per-Share Data | | | | | |
Net asset value, beginning of period | $ 10.48 | $ 8.61 | $ 20.16 | $ 16.91 | $ 12.98 |
Income from Investment Operations | | | | | |
Net investment income (loss) C | (.01) | .08 | .13 | .17 | .06 F |
Net realized and unrealized gain (loss) | .94 | 1.95 | (8.86) | 4.34 | 4.10 |
Total from investment operations | .93 | 2.03 | (8.73) | 4.51 | 4.16 |
Distributions from net investment income | (.06) | (.16) | (.14) | (.03) | (.01) |
Distributions from net realized gain | - | - | (2.68) | (1.23) | (.22) |
Total distributions | (.06) | (.16) | (2.82) | (1.26) | (.23) |
Redemption fees added to paid in capital C, H | - | - | - | - | - |
Net asset value, end of period | $ 11.35 | $ 10.48 | $ 8.61 | $ 20.16 | $ 16.91 |
Total Return A, B | 8.87% | 24.34% | (50.13)% | 28.29% | 32.49% |
Ratios to Average Net Assets D, G | | | | | |
Expenses before reductions | 2.82% | 2.77% | 2.39% | 2.31% | 2.69% |
Expenses net of fee waivers, if any | 2.25% | 2.25% | 2.25% | 2.25% | 2.25% |
Expenses net of all reductions | 2.18% | 2.21% | 2.21% | 2.21% | 2.15% |
Net investment income (loss) | (.14)% | .98% | .90% | .94% | .41% F |
Supplemental Data | | | | | |
Net assets, end of period (000 omitted) | $ 1,935 | $ 2,490 | $ 2,806 | $ 11,206 | $ 8,529 |
Portfolio turnover rate E | 143% | 109% | 112% | 173% | 173% |
A Total returns would have been lower had certain expenses not been reduced during the periods shown.
B Total returns do not include the effect of the contingent deferred sales charge.
C Calculated based on average shares outstanding during the period.
D Fees and expenses of the underlying Fidelity Central Funds are not included in the Fund's expense ratio. The Fund indirectly bears its proportionate share of the expenses of any underlying Fidelity Central Funds.
E Amount does not include the portfolio activity of any underlying Fidelity Central Funds.
F Investment income per share reflects a special dividend which amounted to $.07 per share. Excluding the special dividend, the ratio of net investment income (loss) to average net assets would have been (.07)%.
G Expense ratios reflect operating expenses of the class. Expenses before reductions do not reflect amounts reimbursed by the investment adviser or reductions from brokerage service arrangements or reductions from other expense offset arrangements and do not represent the amount paid by the class during periods when reimbursements or reductions occur. Expenses net of fee waivers reflect expenses after reimbursement by the investment adviser but prior to reductions from brokerage service arrangements or other expense offset arrangements. Expenses net of all reductions represent the net expenses paid by the class.
H Amount represents less than $.01 per share.
See accompanying notes which are an integral part of the financial statements.
Annual Report
Financial Highlights - Class C
Years ended October 31, | 2010 | 2009 | 2008 | 2007 | 2006 |
Selected Per-Share Data | | | | | |
Net asset value, beginning of period | $ 10.43 | $ 8.58 | $ 20.10 | $ 16.89 | $ 13.00 |
Income from Investment Operations | | | | | |
Net investment income (loss) C | (.01) | .08 | .13 | .17 | .06 F |
Net realized and unrealized gain (loss) | .94 | 1.94 | (8.82) | 4.32 | 4.07 |
Total from investment operations | .93 | 2.02 | (8.69) | 4.49 | 4.13 |
Distributions from net investment income | (.06) | (.17) | (.15) | (.05) | (.02) |
Distributions from net realized gain | - | - | (2.68) | (1.23) | (.22) |
Total distributions | (.06) | (.17) | (2.83) | (1.28) | (.24) |
Redemption fees added to paid in capital C, H | - | - | - | - | - |
Net asset value, end of period | $ 11.30 | $ 10.43 | $ 8.58 | $ 20.10 | $ 16.89 |
Total Return A, B | 8.92% | 24.29% | (50.11)% | 28.21% | 32.25% |
Ratios to Average Net Assets D, G | | | | | |
Expenses before reductions | 2.82% | 2.77% | 2.38% | 2.26% | 2.57% |
Expenses net of fee waivers, if any | 2.25% | 2.25% | 2.25% | 2.25% | 2.25% |
Expenses net of all reductions | 2.18% | 2.21% | 2.21% | 2.21% | 2.15% |
Net investment income (loss) | (.14)% | .98% | .90% | .94% | .41% F |
Supplemental Data | | | | | |
Net assets, end of period (000 omitted) | $ 3,166 | $ 3,913 | $ 4,522 | $ 16,084 | $ 9,173 |
Portfolio turnover rate E | 143% | 109% | 112% | 173% | 173% |
A Total returns would have been lower had certain expenses not been reduced during the periods shown.
B Total returns do not include the effect of the contingent deferred sales charge.
C Calculated based on average shares outstanding during the period.
D Fees and expenses of the underlying Fidelity Central Funds are not included in the Fund's expense ratio. The Fund indirectly bears its proportionate share of the expenses of any underlying Fidelity Central Funds.
E Amount does not include the portfolio activity of any underlying Fidelity Central Funds.
F Investment income per share reflects a special dividend which amounted to $.07 per share. Excluding the special dividend, the ratio of net investment income (loss) to average net assets would have been (.07)%.
G Expense ratios reflect operating expenses of the class. Expenses before reductions do not reflect amounts reimbursed by the investment adviser or reductions from brokerage service arrangements or reductions from other expense offset arrangements and do not represent the amount paid by the class during periods when reimbursements or reductions occur. Expenses net of fee waivers reflect expenses after reimbursement by the investment adviser but prior to reductions from brokerage service arrangements or other expense offset arrangements. Expenses net of all reductions represent the net expenses paid by the class.
H Amount represents less than $.01 per share.
See accompanying notes which are an integral part of the financial statements.
Annual Report
Financial Highlights - Institutional Class
Years ended October 31, | 2010 | 2009 | 2008 | 2007 | 2006 |
Selected Per-Share Data | | | | | |
Net asset value, beginning of period | $ 11.03 | $ 9.13 | $ 21.27 | $ 17.72 | $ 13.63 |
Income from Investment Operations | | | | | |
Net investment income (loss) B | .09 | .18 | .30 | .38 | .23 E |
Net realized and unrealized gain (loss) | 1.01 | 2.03 | (9.38) | 4.54 | 4.25 |
Total from investment operations | 1.10 | 2.21 | (9.08) | 4.92 | 4.48 |
Distributions from net investment income | (.15) | (.31) | (.38) | (.14) | (.17) |
Distributions from net realized gain | - | - | (2.68) | (1.23) | (.22) |
Total distributions | (.15) | (.31) | (3.06) | (1.37) | (.39) |
Redemption fees added to paid in capital B, G | - | - | - | - | - |
Net asset value, end of period | $ 11.98 | $ 11.03 | $ 9.13 | $ 21.27 | $ 17.72 |
Total Return A | 10.00% | 25.57% | (49.63)% | 29.57% | 33.68% |
Ratios to Average Net Assets C, F | | | | | |
Expenses before reductions | 1.80% | 1.68% | 1.27% | 1.19% | 1.46% |
Expenses net of fee waivers, if any | 1.25% | 1.25% | 1.25% | 1.19% | 1.25% |
Expenses net of all reductions | 1.17% | 1.21% | 1.21% | 1.15% | 1.15% |
Net investment income (loss) | .86% | 1.98% | 1.90% | 2.00% | 1.41% E |
Supplemental Data | | | | | |
Net assets, end of period (000 omitted) | $ 336 | $ 434 | $ 378 | $ 1,738 | $ 1,331 |
Portfolio turnover rate D | 143% | 109% | 112% | 173% | 173% |
A Total returns would have been lower had certain expenses not been reduced during the periods shown.
B Calculated based on average shares outstanding during the period.
C Fees and expenses of the underlying Fidelity Central Funds are not included in the Fund's expense ratio. The Fund indirectly bears its proportionate share of the expenses of any underlying Fidelity Central Funds.
D Amount does not include the portfolio activity of any underlying Fidelity Central Funds.
E Investment income per share reflects a special dividend which amounted to $.08 per share. Excluding the special dividend, the ratio of net investment income (loss) to average net assets would have been .93%.
F Expense ratios reflect operating expenses of the class. Expenses before reductions do not reflect amounts reimbursed by the investment adviser or reductions from brokerage service arrangements or reductions from other expense offset arrangements and do not represent the amount paid by the class during periods when reimbursements or reductions occur. Expenses net of fee waivers reflect expenses after reimbursement by the investment adviser but prior to reductions from brokerage service arrangements or other expense offset arrangements. Expenses net of all reductions represent the net expenses paid by the class.
G Amount represents less than $.01 per share.
See accompanying notes which are an integral part of the financial statements.
Annual Report
Notes to Financial Statements
For the period ended October 31, 2010
1. Organization.
Fidelity Advisor Europe Capital Appreciation Fund (the Fund) is a fund of Fidelity Advisor Series VIII (the Trust) and is authorized to issue an unlimited number of shares. The Trust is registered under the Investment Company Act of 1940, as amended (the 1940 Act), as an open-end management investment company organized as a Massachusetts business trust. The Fund offers Class A, Class T, Class C and Institutional Class shares, each of which has equal rights as to assets and voting privileges. Effective after the close of business on September 1, 2010, Class B shares were closed to new accounts and additional purchases by existing shareholders. Each class has exclusive voting rights with respect to matters that affect that class. Class B shares will automatically convert to Class A shares after a holding period of seven years from the initial date of purchase. Investment income, realized and unrealized capital gains and losses, the common expenses of the Fund, and certain fund-level expense reductions, if any, are allocated on a pro-rata basis to each class based on the relative net assets of each class to the total net assets of the Fund. Each class differs with respect to transfer agent and distribution and service plan fees incurred. Certain expense reductions also differ by class.
2. Investments in Fidelity Central Funds.
The Fund may invest in Fidelity Central Funds, which are open-end investment companies available only to other investment companies and accounts managed by Fidelity Management & Research Company (FMR) and its affiliates. The Fund's Schedule of Investments lists each of the Fidelity Central Funds held as of period end, if any, as an investment of the Fund, but does not include the underlying holdings of each Fidelity Central Fund. As an Investing Fund, the Fund indirectly bears its proportionate share of the expenses of the underlying Fidelity Central Funds.
The Money Market Central Funds seek preservation of capital and current income and are managed by Fidelity Investments Money Management, Inc. (FIMM), an affiliate of FMR.
A complete unaudited list of holdings for each Fidelity Central Fund is available upon request or at the Securities and Exchange Commission (the SEC) web site at www.sec.gov. In addition, the financial statements of the Fidelity Central Funds, which are not covered by the Fund's Report of Independent Registered Public Accounting Firm, are available on the SEC web site or upon request.
3. Significant Accounting Policies.
The financial statements have been prepared in conformity with accounting principles generally accepted in the United States of America (GAAP), which require management to make certain estimates and assumptions at the date of the financial statements. Actual results could differ from those estimates. The following summarizes the significant accounting policies of the Fund:
Annual Report
Notes to Financial Statements - continued
3. Significant Accounting Policies - continued
Security Valuation. Investments are valued as of 4:00 p.m. Eastern time on the last calendar day of the period. The Fund uses independent pricing services approved by the Board of Trustees to value its investments. When current market prices or quotations are not readily available or reliable, valuations may be determined in good faith in accordance with procedures adopted by the Board of Trustees. Factors used in determining value may include market or security specific events. The frequency with which these procedures are used cannot be predicted and they may be utilized to a significant extent. The value used for net asset value (NAV) calculation under these procedures may differ from published prices for the same securities.
The Fund categorizes the inputs to valuation techniques used to value its investments into a disclosure hierarchy consisting of three levels as shown below.
Level 1 - quoted prices in active markets for identical investments
Level 2 - other significant observable inputs (including quoted prices for similar investments, interest rates, prepayment speeds, etc.)
Level 3 - unobservable inputs (including the fund's own assumptions based on the best information available)
Changes in valuation techniques may result in transfers in or out of an assigned level within the disclosure hierarchy. The aggregate value of investments by input level, as of October 31, 2010 is included at the end of the Fund's Schedule of Investments. Valuation techniques used to value the Fund's investments by major category are as follows.
Equity securities, including restricted securities, for which market quotations are readily available, are valued at the last reported sale price or official closing price as reported by an independent pricing service on the primary market or exchange on which they are traded and are categorized as Level 1 in the hierarchy. In the event there were no sales during the day or closing prices are not available, securities are valued at the last quoted bid price or may be valued using the last available price and are generally categorized as Level 2 in the hierarchy. For foreign equity securities, when significant market or security specific events arise, comparisons to the valuation of American Depositary Receipts (ADRs), futures contracts, Exchange-traded funds (ETFs) and certain indexes as well as quoted prices for similar securities are used and are categorized as Level 2 in the hierarchy in these circumstances. Utilizing these techniques may result in transfers between Level 1 and Level 2. For restricted equity securities and private placements where observable inputs are limited, assumptions about market activity and risk are used and are categorized as Level 3 in the hierarchy.
Investments in open-end mutual funds, including the Fidelity Central Funds, are valued at their closing net asset value each business day and are categorized as Level 1 in the
Annual Report
3. Significant Accounting Policies - continued
Security Valuation - continued
hierarchy. Short-term securities with remaining maturities of sixty days or less for which quotations are not readily available are valued at amortized cost, which approximates fair value and are categorized as Level 2 in the hierarchy.
Foreign Currency. The Fund uses foreign currency contracts to facilitate transactions in foreign-denominated securities. Gains and losses from these transactions may arise from changes in the value of the foreign currency or if the counterparties do not perform under the contracts' terms.
Foreign-denominated assets, including investment securities, and liabilities are translated into U.S. dollars at the exchange rate at period end. Purchases and sales of investment securities, income and dividends received and expenses denominated in foreign currencies are translated into U.S. dollars at the exchange rate in effect on the transaction date.
The effects of exchange rate fluctuations on investments are included with the net realized and unrealized gain (loss) on investment securities. Other foreign currency transactions resulting in realized and unrealized gain (loss) are disclosed separately.
Investment Transactions and Income. For financial reporting purposes, the Fund's investment holdings and NAV include trades executed through the end of the last business day of the period. The NAV per share for processing shareholder transactions is calculated as of the close of business of the New York Stock Exchange (NYSE), normally 4:00 p.m. Eastern time and includes trades executed through the end of the prior business day. Gains and losses on securities sold are determined on the basis of identified cost and may include proceeds received from litigation. Dividend income is recorded on the ex-dividend date, except for certain dividends from foreign securities where the ex-dividend date may have passed, which are recorded as soon as the Fund is informed of the ex-dividend date. Non-cash dividends included in dividend income, if any, are recorded at the fair market value of the securities received. Distributions received on securities that represent a return of capital or capital gain are recorded as a reduction of cost of investments and/or as a realized gain. The Fund estimates the components of distributions received that may be considered return of capital distributions or capital gain distributions. Interest income and distributions from the Fidelity Central Funds are accrued as earned. Interest income includes coupon interest and amortization of premium and accretion of discount on debt securities. Investment income is recorded net of foreign taxes withheld where recovery of such taxes is uncertain.
Expenses. Most expenses of the Trust can be directly attributed to a fund. Expenses which cannot be directly attributed are apportioned amongst each fund in the Trust. Expense estimates are accrued in the period to which they relate and adjustments are made when actual amounts are known.
Annual Report
Notes to Financial Statements - continued
3. Significant Accounting Policies - continued
Income Tax Information and Distributions to Shareholders. Each year the Fund intends to qualify as a regulated investment company, including distributing substantially all of its taxable income and realized gains under Subchapter M of the Internal Revenue Code and filing its U.S. federal tax return. As a result, no provision for income taxes is required. As of October 31, 2010, the Fund did not have any unrecognized tax benefits in the accompanying financial statements. A fund's federal tax return is subject to examination by the Internal Revenue Service (IRS) for a period of three years. Foreign taxes are provided for based on the Fund's understanding of the tax rules and rates that exist in the foreign markets in which it invests.
Distributions are declared and recorded on the ex-dividend date. Income dividends and capital gain distributions are declared separately for each class. Income and capital gain distributions are determined in accordance with income tax regulations, which may differ from GAAP.
Capital accounts within the financial statements are adjusted for permanent book-tax differences. These adjustments have no impact on net assets or the results of operations. Temporary book-tax differences will reverse in a subsequent period.
Book-tax differences are primarily due to the short-term gain distributions from the Fidelity Central Funds, foreign currency transactions, capital loss carryforwards and losses deferred due to wash sales.
The federal tax cost of investment securities and unrealized appreciation (depreciation) as of period end were as follows:
Gross unrealized appreciation | $ 3,479,732 |
Gross unrealized depreciation | (994,917) |
Net unrealized appreciation (depreciation) | $ 2,484,815 |
| |
Tax Cost | $ 21,295,759 |
The tax-based components of distributable earnings as of period end were as follows:
Undistributed ordinary income | $ 65,823 |
Capital loss carryforward | $ (19,126,506) |
Net unrealized appreciation (depreciation) | $ 2,469,450 |
The tax character of distributions paid was as follows:
| October 31, 2010 | October 31, 2009 |
Ordinary Income | $ 281,171 | $ 713,757 |
Annual Report
3. Significant Accounting Policies - continued
Short-Term Trading (Redemption) Fees. Shares held by investors in the Fund less than 30 days are subject to a redemption fee equal to 1.00% of the net asset value of shares redeemed. All redemption fees, which reduce the proceeds of the shareholder redemption, are retained by the Fund and accounted for as an addition to paid in capital.
4. Purchases and Sales of Investments.
Purchases and sales of securities, other than short-term securities, aggregated $33,563,180 and $37,753,503, respectively.
5. Fees and Other Transactions with Affiliates.
Management Fee. FMR and its affiliates provide the Fund with investment management related services for which the Fund pays a monthly management fee. The management fee is the sum of an individual fund fee rate that is based on an annual rate of .45% of the Fund's average net assets and a group fee rate that averaged .26% during the period. The group fee rate is based upon the average net assets of all the mutual funds advised by FMR. The group fee rate decreases as assets under management increase and increases as assets under management decrease. For the period, the total annual management fee rate was .71% of the Fund's average net assets.
Distribution and Service Plan Fees. In accordance with Rule 12b-1 of the 1940 Act, the Fund has adopted separate Distribution and Service Plans for each class of shares. Certain classes pay Fidelity Distributors Corporation (FDC), an affiliate of FMR, separate Distribution and Service Fees, each of which is based on an annual percentage of each class' average net assets. In addition, FDC may pay financial intermediaries for selling shares of the Fund and providing shareholder support services. For the period, the Distribution and Service Fee rates, total fees and amounts retained by FDC were as follows:
| Distribution
Fee | Service
Fee | Total Fees | Retained
by FDC |
Class A | 0% | .25% | $ 25,560 | $ 117 |
Class T | .25% | .25% | 38,808 | 0 |
Class B | .75% | .25% | 21,598 | 16,277 |
Class C | .75% | .25% | 34,755 | 3,072 |
| | | $ 120,721 | $ 19,466 |
Sales Load. FDC receives a front-end sales charge of up to 5.75% for selling Class A shares, and 3.50% for selling Class T shares, some of which is paid to financial intermediaries for selling shares of the Fund. FDC receives the proceeds of contingent deferred sales charges levied on Class A, Class T, Class B, and Class C redemptions. These charges
Annual Report
Notes to Financial Statements - continued
5. Fees and Other Transactions with Affiliates - continued
Sales Load - continued
depend on the holding period. The deferred sales charges range from 5% to 1% for Class B, 1% for Class C, 1.00% for certain purchases of Class A shares (1.00% to .50% prior to July 12, 2010) and .25% for certain purchases of Class T shares.
For the period, sales charge amounts retained by FDC were as follows:
| Retained
by FDC |
Class A | $ 3,042 |
Class T | 1,572 |
Class B* | 3,926 |
Class C* | 534 |
| $ 9,074 |
* When Class B and Class C shares are initially sold, FDC pays commissions from its own resources to financial intermediaries through which the sales are made.
Transfer Agent Fees. Fidelity Investments Institutional Operations Company, Inc. (FIIOC), an affiliate of FMR, is the transfer, dividend disbursing and shareholder servicing agent for each class of the Fund. FIIOC receives account fees and asset-based fees that vary according to the account size and type of account of the shareholders of the respective classes of the Fund. FIIOC pays for typesetting, printing and mailing of shareholder reports, except proxy statements. For the period, transfer agent fees for each class were as follows:
| Amount | % of
Average
Net Assets |
Class A | $ 32,600 | .32 |
Class T | 26,299 | .34 |
Class B | 6,947 | .32 |
Class C | 11,137 | .32 |
Institutional Class | 958 | .28 |
| $ 77,941 | |
Accounting and Security Lending Fees. Fidelity Service Company, Inc. (FSC), an affiliate of FMR, maintains the Fund's accounting records. The accounting fee is based on the level of average net assets for the month. Under a separate contract, FSC administers the security lending program. The security lending fee is based on the number and duration of lending transactions.
Brokerage Commissions. The Fund placed a portion of its portfolio transactions with brokerage firms which are affiliates of the investment adviser. The commissions paid to these affiliated firms were $164 for the period.
Annual Report
6. Committed Line of Credit.
The Fund participates with other funds managed by FMR or an affiliate in a $3.75 billion credit facility (the "line of credit") to be utilized for temporary or emergency purposes to fund shareholder redemptions or for other short-term liquidity purposes. The Fund has agreed to pay commitment fees on its pro-rata portion of the line of credit, which amounted to $96 and is reflected in Miscellaneous expenses on the Statement of Operations. During the period, there were no borrowings on this line of credit.
7. Security Lending.
The Fund lends portfolio securities through a lending agent from time to time in order to earn additional income. The lending agent may loan securities to certain qualified borrowers, including Fidelity Capital Markets (FCM), a broker-dealer affiliated with the Fund. On the settlement date of the loan, the Fund receives collateral (in the form of U.S. Treasury obligations, letters of credit and/or cash) against the loaned securities and maintains collateral in an amount not less than 100% of the market value of the loaned securities during the period of the loan. The market value of the loaned securities is determined at the close of business of the Fund and any additional required collateral is delivered to the Fund on the next business day. If the borrower defaults on its obligation to return the securities loaned because of insolvency or other reasons, a fund could experience delays and costs in recovering the securities loaned or in gaining access to the collateral. Any cash collateral received is invested in the Fidelity Securities Lending Cash Central Fund. The value of loaned securities and cash collateral at period end are disclosed on the Fund's Statement of Assets and Liabilities. Security lending income represents the income earned on investing cash collateral, less rebates paid to borrowers and lending agent fees associated with the loan, plus any premium payments received for lending certain types of securities. Security lending income is presented in the Statement of Operations as a component of income from Fidelity Central Funds. Total security lending income during the period amounted to $9,407.
Annual Report
Notes to Financial Statements - continued
8. Expense Reductions.
FMR voluntarily agreed to reimburse each class to the extent annual operating expenses exceeded certain levels of average net assets as noted in the table below. Some expenses, for example interest expense, including commitment fees, are excluded from this reimbursement.
The following classes were in reimbursement during the period:
| Expense
Limitations | Reimbursement
from adviser |
Class A | 1.50% | $ 56,108 |
Class T | 1.75% | 46,246 |
Class B | 2.25% | 12,183 |
Class C | 2.25% | 19,521 |
Institutional Class | 1.25% | 1,897 |
| | $ 135,955 |
Effective November 1, 2010, the expense limitation will be changed to 1.45%, 1.70%, 2.20%, 2.20% and 1.20% for Class A, T, B, C and Institutional, respectively.
Many of the brokers with whom FMR places trades on behalf of the Fund provided services to the Fund in addition to trade execution. These services included payments of certain expenses on behalf of the Fund totaling $18,173 for the period.
9. Distributions to Shareholders.
Distributions to shareholders of each class were as follows:
Years ended October 31, | 2010 | 2009 |
From net investment income | | |
Class A | $ 132,405 | $ 340,910 |
Class T | 105,744 | 225,684 |
Class B | 13,563 | 51,025 |
Class C | 22,327 | 84,088 |
Institutional Class | 7,132 | 12,050 |
Total | $ 281,171 | $ 713,757 |
Annual Report
10. Share Transactions.
Transactions for each class of shares were as follows:
| Shares | Dollars |
Years ended October 31, | 2010 | 2009 | 2010 | 2009 |
Class A | | | | |
Shares sold | 127,568 | 177,631 | $ 1,411,611 | $ 1,639,370 |
Reinvestment of distributions | 10,457 | 39,468 | 119,629 | 302,323 |
Shares redeemed | (270,495) | (354,257) | (2,873,077) | (3,023,659) |
Net increase (decrease) | (132,470) | (137,158) | $ (1,341,837) | $ (1,081,966) |
Class T | | | | |
Shares sold | 285,617 | 87,906 | $ 3,265,728 | $ 796,657 |
Reinvestment of distributions | 8,986 | 28,519 | 102,440 | 218,168 |
Shares redeemed | (396,557) | (254,291) | (4,398,721) | (2,158,253) |
Net increase (decrease) | (101,954) | (137,866) | $ (1,030,553) | $ (1,143,428) |
Class B | | | | |
Shares sold | 16,071 | 34,740 | $ 167,235 | $ 327,679 |
Reinvestment of distributions | 1,085 | 6,019 | 12,073 | 44,965 |
Shares redeemed | (84,324) | (129,030) | (867,232) | (1,025,502) |
Net increase (decrease) | (67,168) | (88,271) | $ (687,924) | $ (652,858) |
Class C | | | | |
Shares sold | 36,176 | 42,669 | $ 385,078 | $ 369,138 |
Reinvestment of distributions | 1,719 | 9,756 | 19,047 | 72,489 |
Shares redeemed | (132,930) | (204,327) | (1,389,265) | (1,641,385) |
Net increase (decrease) | (95,035) | (151,902) | $ (985,140) | $ (1,199,758) |
Institutional Class | | | | |
Shares sold | 21,917 | 14,526 | $ 240,660 | $ 135,955 |
Reinvestment of distributions | 430 | 886 | 5,009 | 6,899 |
Shares redeemed | (33,643) | (17,475) | (378,698) | (143,026) |
Net increase (decrease) | (11,296) | (2,063) | $ (133,029) | $ (172) |
11. Other.
The Fund's organizational documents provide former and current trustees and officers with a limited indemnification against liabilities arising in connection with the performance of their duties to the Fund. In the normal course of business, the Fund may also enter into contracts that provide general indemnifications. The Fund's maximum exposure under these arrangements is unknown as this would be dependent on future claims that may be made against the Fund. The risk of material loss from such claims is considered remote.
Annual Report
To the Trustees of Fidelity Advisor Series VIII and Shareholders of Fidelity Advisor Europe Capital Appreciation Fund:
We have audited the accompanying statement of assets and liabilities of Fidelity Advisor Europe Capital Appreciation Fund (the Fund), a fund of Fidelity Advisor Series VIII, including the schedule of investments, as of October 31, 2010, and the related statement of operations for the year then ended, the statement of changes in net assets for each of the two years in the period then ended, and the financial highlights for each of the five years in the period then ended. These financial statements and financial highlights are the responsibility of the Fund's management. Our responsibility is to express an opinion on these financial statements and financial highlights based on our audits.
We conducted our audits in accordance with standards of the Public Company Accounting Oversight Board (United States). Those standards require that we plan and perform the audit to obtain reasonable assurance about whether the financial statements and financial highlights are free of material misstatement. The Fund is not required to have, nor were we engaged to perform, an audit of its internal control over financial reporting. Our audits included consideration of internal control over financial reporting as a basis for designing audit procedures that are appropriate in the circumstances, but not for the purpose of expressing an opinion on the effectiveness of the Fund's internal control over financial reporting. Accordingly, we express no such opinion. An audit also includes examining, on a test basis, evidence supporting the amounts and disclosures in the financial statements, assessing the accounting principles used and significant estimates made by management, as well as evaluating the overall financial statement presentation. Our procedures included confirmation of securities owned as of October 31, 2010, by correspondence with the custodians and brokers; where replies were not received from brokers, we performed other auditing procedures. We believe that our audits provide a reasonable basis for our opinion.
In our opinion, the financial statements and financial highlights referred to above present fairly, in all material respects, the financial position of Fidelity Advisor Europe Capital Appreciation Fund as of October 31, 2010, the results of its operations for the year then ended, the changes in its net assets for each of the two years in the period then ended, and the financial highlights for each of the five years in the period then ended, in conformity with accounting principles generally accepted in the United States of America.
/s/ Deloitte & Touche LLP
DELOITTE & TOUCHE LLP
Boston, Massachusetts
December 13, 2010
Annual Report
The Trustees, Member of the Advisory Board, and executive officers of the trust and fund, as applicable, are listed below. The Board of Trustees governs the fund and is responsible for protecting the interests of shareholders. The Trustees are experienced executives who meet periodically throughout the year to oversee the fund's activities, review contractual arrangements with companies that provide services to the fund, oversee management of the risks associated with such activities and contractual arrangements, and review the fund's performance. Except for James C. Curvey, each of the Trustees oversees 221 funds advised by FMR or an affiliate. Mr. Curvey oversees 410 funds advised by FMR or an affiliate.
The Trustees hold office without limit in time except that (a) any Trustee may resign; (b) any Trustee may be removed by written instrument, signed by at least two-thirds of the number of Trustees prior to such removal; (c) any Trustee who requests to be retired or who has become incapacitated by illness or injury may be retired by written instrument signed by a majority of the other Trustees; and (d) any Trustee may be removed at any special meeting of shareholders by a two-thirds vote of the outstanding voting securities of the trust. Each Trustee who is not an interested person (as defined in the 1940 Act) (Independent Trustee), shall retire not later than the last day of the calendar year in which his or her 72nd birthday occurs. The Independent Trustees may waive this mandatory retirement age policy with respect to individual Trustees. The executive officers and Advisory Board Member hold office without limit in time, except that any officer and Advisory Board Member may resign or may be removed by a vote of a majority of the Trustees at any regular meeting or any special meeting of the Trustees. Except as indicated, each individual has held the office shown or other offices in the same company for the past five years.
Experience, Skills, Attributes, and Qualifications of the Fund's Trustees. The Governance and Nominating Committee has adopted a statement of policy that describes the experience, qualifications, attributes, and skills that are necessary and desirable for potential Independent Trustee candidates (Statement of Policy). The Board believes that each Trustee satisfied at the time he or she was initially elected or appointed a Trustee, and continues to satisfy, the standards contemplated by the Statement of Policy. The Governance and Nominating Committee also engages professional search firms to help identify potential Independent Trustee candidates who have the experience, qualifications, attributes, and skills consistent with the Statement of Policy. From time to time, additional criteria based on the composition and skills of the current Independent Trustees, as well as experience or skills that may be appropriate in light of future changes to board composition, business conditions, and regulatory or other developments, have also been considered by the professional search firms and the Governance and Nominating Committee. In addition, the Board takes into account the Trustees' commitment and participation in Board and committee meetings, as well as their leadership of standing and ad hoc committees throughout their tenure.
In determining that a particular Trustee was and continues to be qualified to serve as a Trustee, the Board has considered a variety of criteria, none of which, in isolation, was controlling. The Board believes that, collectively, the Trustees have balanced and diverse experience, qualifications, attributes, and skills, which allow the Board to operate effectively in governing the fund and protecting the interests of shareholders. Information about the specific experience, skills, attributes, and qualifications of each Trustee, which in each case led to the Board's conclusion that the Trustee should serve (or continue to serve) as a trustee of the fund, is provided below.
Annual Report
Board Structure and Oversight Function. Edward C. Johnson 3d is an interested person (as defined in the 1940 Act) and currently serves as Chairman. The Trustees have determined that an interested Chairman is appropriate and benefits shareholders because an interested Chairman has a personal and professional stake in the quality and continuity of services provided to the fund. Independent Trustees exercise their informed business judgment to appoint an individual of their choosing to serve as Chairman, regardless of whether the Trustee happens to be independent or a member of management. The Independent Trustees have determined that they can act independently and effectively without having an Independent Trustee serve as Chairman and that a key structural component for assuring that they are in a position to do so is for the Independent Trustees to constitute a substantial majority for the Board. The Independent Trustees also regularly meet in executive session. Ned C. Lautenbach serves as Chairman of the Independent Trustees and as such (i) acts as a liaison between the Independent Trustees and management with respect to matters important to the Independent Trustees and (ii) with management prepares agendas for Board meetings.
Fidelity funds are overseen by different Boards of Trustees. The fund's Board oversees Fidelity's equity and high income funds and another Board oversees Fidelity's investment-grade bond, money market, and asset allocation funds. The asset allocation funds may invest in Fidelity funds overseen by the fund's Board. The use of separate Boards, each with its own committee structure, allows the Trustees of each group of Fidelity funds to focus on the unique issues of the funds they oversee, including common research, investment, and operational issues. On occasion, the separate Boards establish joint committees to address issues of overlapping consequences for the Fidelity funds overseen by each Board.
The Trustees operate using a system of committees to facilitate the timely and efficient consideration of all matters of importance to the Trustees, the fund, and fund shareholders and to facilitate compliance with legal and regulatory requirements and oversight of the fund's activities and associated risks. The Board, acting through its committees, has charged FMR and its affiliates with (i) identifying events or circumstances the occurrence of which could have demonstrably adverse effects on the fund's business and/or reputation; (ii) implementing processes and controls to lessen the possibility that such events or circumstances occur or to mitigate the effects of such events or circumstances if they do occur; and (iii) creating and maintaining a system designed to evaluate continuously business and market conditions in order to facilitate the identification and implementation processes described in (i) and (ii) above. Because the day-to-day operations and activities of the fund are carried out by or through FMR, its affiliates and other service providers, the fund's exposure to risks is mitigated but not eliminated by the processes overseen by the Trustees. While each of the Board's committees has responsibility for overseeing different aspects of the fund's activities, oversight is exercised primarily through the Operations, Audit, and Compliance Committees. Appropriate personnel, including but not limited to the fund's Chief Compliance Officer (CCO), FMR's internal auditor, the independent accountants, the fund's Treasurer and portfolio management personnel, make periodic reports to the Board's committees, as appropriate. The responsibilities of each committee, including their oversight responsibilities, are described further under "Standing Committees of the Fund's Trustees."
Annual Report
Trustees and Officers - continued
The fund's Statement of Additional Information (SAI) includes more information about the Trustees. To request a free copy, call Fidelity at 1-877-208-0098.
Interested Trustees*:
Correspondence intended for each Trustee who is an interested person may be sent to Fidelity Investments, 82 Devonshire Street, Boston, Massachusetts 02109.
Name, Age; Principal Occupations and Other Relevant Experience+ |
Edward C. Johnson 3d (80) |
| Year of Election or Appointment: 1983 Mr. Johnson is Trustee and Chairman of the Board of Trustees of certain Trusts. Mr. Johnson serves as Chief Executive Officer, Chairman, and a Director of FMR LLC; Chairman and a Director of FMR; Chairman and a Director of Fidelity Research & Analysis Company (FRAC); Chairman and a Director of Fidelity Investments Money Management, Inc.; and Chairman and a Director of FMR Co., Inc. In addition, Mr. Johnson serves as Chairman and Director of FIL Limited. Previously, Mr. Johnson served as President of FMR LLC (2006-2007). |
James C. Curvey (75) |
| Year of Election or Appointment: 2007 Mr. Curvey also serves as Trustee (2007-present) of other investment companies advised by FMR. Mr. Curvey is a Director of Fidelity Investments Money Management, Inc. (2009-present), Director of Fidelity Research & Analysis Co. (2009-present) and Director of FMR and FMR Co., Inc. (2007-present). Mr. Curvey is also Vice Chairman (2007-present) and Director of FMR LLC. In addition, Mr. Curvey serves as an Overseer for the Boston Symphony Orchestra and a member of the Trustees of Villanova University. Previously, Mr. Curvey was the Vice Chairman (2006-2007) and Director (2000-2007) of FMR Corp. |
* Trustees have been determined to be "Interested Trustees" by virtue of, among other things, their affiliation with the trust or various entities under common control with FMR.
+ The information above includes each Trustee's principal occupation during the last five years and other information relating to the experience, attributes, and skills relevant to each Trustee's qualifications to serve as a Trustee, which led to the conclusion that each Trustee should serve as a Trustee for the fund.
Independent Trustees:
Correspondence intended for each Independent Trustee (that is, the Trustees other than the Interested Trustees) may be sent to Fidelity Investments, P.O. Box 55235, Boston, Massachusetts 02205-5235.
Name, Age; Principal Occupations and Other Relevant Experience+ |
Dennis J. Dirks (62) |
| Year of Election or Appointment: 2005 Prior to his retirement in May 2003, Mr. Dirks was Chief Operating Officer and a member of the Board of The Depository Trust & Clearing Corporation (DTCC). He also served as President, Chief Operating Officer, and Board member of The Depository Trust Company (DTC) and President and Board member of the National Securities Clearing Corporation (NSCC). In addition, Mr. Dirks served as Chief Executive Officer and Board member of the Government Securities Clearing Corporation, Chief Executive Officer and Board member of the Mortgage-Backed Securities Clearing Corporation, as a Trustee and a member of the Finance Committee of Manhattan College (2005-2008), and as a Trustee and a member of the Finance Committee of AHRC of Nassau County (2006-2008). Mr. Dirks is a member of the Independent Directors Council (IDC) Governing Council (2010-Present) and Board of Directors for The Brookville Center for Children's Services, Inc. (2009-present). |
Alan J. Lacy (57) |
| Year of Election or Appointment: 2008 Mr. Lacy serves as Senior Adviser (2007-present) of Oak Hill Capital Partners, L.P. (private equity). Mr. Lacy also served as Chief Executive Officer (2000-2005) and Vice Chairman (2005-2006) of Sears Holdings Corporation and Sears, Roebuck and Co. (retail). In addition, Mr. Lacy serves as a member of the Board of Directors of The Western Union Company (global money transfer, 2006-present) and Bristol-Myers Squibb Company (global pharmaceuticals, 2007-present). Mr. Lacy is Chairman (2008-present) and a member (2006-present) of the Board of Trustees of The National Parks Conservation Association. |
Ned C. Lautenbach (66) |
| Year of Election or Appointment: 2000 Mr. Lautenbach is Chairman of the Independent Trustees of the Equity and High Income Funds (2006-present). Mr. Lautenbach currently serves as the Lead Director of the Eaton Corporation Board of Directors (diversified industrial, 1997-present). Mr. Lautenbach is also a member of the Board of Directors of the Philharmonic Center for the Arts in Naples, Florida (1999 - present); a member of the Board of Trustees of Fairfield University (2005-present); and a member of the Council on Foreign Relations (1994 - present). Previously, Mr. Lautenbach was a Partner/Advisory Partner at Clayton, Dubilier & Rice, Inc. (private equity investment, 1998-2010), as well as a Director of Sony Corporation (2006-2007). |
Joseph Mauriello (66) |
| Year of Election or Appointment: 2008 Prior to his retirement in January 2006, Mr. Mauriello served in numerous senior management positions including Deputy Chairman and Chief Operating Officer (2004-2005), and Vice Chairman of Financial Services (2002-2004) of KPMG LLP US (professional services, 1965-2005). Mr. Mauriello currently serves as a member of the Board of Directors of XL Group plc. (global insurance and re-insurance, 2006-present) and of Arcadia Resources Inc. (health care services and products, 2007-present). Previously, Mr. Mauriello served as a Director of the Hamilton Funds of the Bank of New York (2006-2007). |
Cornelia M. Small (66) |
| Year of Election or Appointment: 2005 Ms. Small is a member of the Board of Directors of the Teagle Foundation (2009-present). Ms. Small is also a member of the Investment Committee, and Chair (2008-present) and a member of the Board of Trustees of Smith College. In addition, Ms. Small serves on the Investment Committee of the Berkshire Taconic Community Foundation (2008-present). Previously, Ms. Small served as Chairperson of the Investment Committee (2002-2008) of Smith College. In addition, Ms. Small served as Chief Investment Officer, Director of Global Equity Investments, and a member of the Board of Directors of Scudder, Stevens & Clark and Scudder Kemper Investments. |
William S. Stavropoulos (71) |
| Year of Election or Appointment: 2001 Mr. Stavropoulos is Vice Chairman of the Independent Trustees of the Equity and High Income Funds (2006-present). Mr. Stavropoulos serves as President and Founder of the Michigan Baseball Foundation, the Great Lakes Loons (2007-present). Mr. Stavropoulos is Chairman Emeritus of the Board of Directors of The Dow Chemical Company, where he previously served in numerous senior management positions, including President, CEO (1995-2000; 2002-2004), Chairman of the Executive Committee (2000-2006), and as a member of the Board of Directors (1990-2006). Currently, Mr. Stavropoulos is Chairman of Univar (global distributor of commodity and specialty chemicals, 2010-present), a Director of Teradata Corporation (data warehousing and technology solutions, 2008-present), Chemical Financial Corporation, Maersk Inc. (industrial conglomerate), Tyco International, Inc. (multinational manufacturing and services, 2007-present), and a member of the Advisory Board for Metalmark Capital (private equity investment, 2005-present). Mr. Stavropoulos is a special advisor to Clayton, Dubilier & Rice, Inc. (private equity investment). In addition, Mr. Stavropoulos is a member of the University of Notre Dame Advisory Council for the College of Science. |
David M. Thomas (61) |
| Year of Election or Appointment: 2008 Previously, Mr. Thomas served as Executive Chairman (2005-2006) and Chairman and Chief Executive Officer (2000-2005) of IMS Health, Inc. (pharmaceutical and healthcare information solutions). In addition, Mr. Thomas serves as a member of the Board of Directors of Fortune Brands, Inc. (consumer products), and Interpublic Group of Companies, Inc. (marketing communication, 2004-present). |
Michael E. Wiley (60) |
| Year of Election or Appointment: 2008 Mr. Wiley also serves as a Director of Asia Pacific Exploration Consolidated (international oil and gas exploration and production, 2008-present). Mr. Wiley serves as a Director of Tesoro Corporation (independent oil refiner and marketer, 2005-present), and a Director of Bill Barrett Corporation (exploration and production, 2005-present). In addition, Mr. Wiley also serves as a Director of Post Oak Bank (privately-held bank, 2004-present). Previously, Mr. Wiley served as a member of the Board of Trustees of the University of Tulsa (2000-2006; 2007-2010), as a Senior Energy Advisor of Katzenbach Partners, LLC (consulting, 2006-2007), as an Advisory Director of Riverstone Holdings (private investment), Chairman, President, and CEO of Baker Hughes, Inc. (oilfield services, 2000-2004), and as Director of Spinnaker Exploration Company (exploration and production, 2001-2005). |
+ The information above includes each Trustee's principal occupation during the last five years and other information relating to the experience, attributes, and skills relevant to each Trustee's qualifications to serve as a Trustee, which led to the conclusion that each Trustee should serve as a Trustee for the fund.
Advisory Board Member and Executive Officers:
Correspondence intended for each executive officer and Peter S. Lynch may be sent to Fidelity Investments, 82 Devonshire Street, Boston, Massachusetts 02109.
Name, Age; Principal Occupation |
Peter S. Lynch (66) |
| Year of Election or Appointment: 2003 Member of the Advisory Board of Fidelity's Equity and High Income Funds. Mr. Lynch is Vice Chairman and a Director of FMR and FMR Co., Inc. In addition, Mr. Lynch serves as a Trustee of Boston College and as the Chairman of the Inner-City Scholarship Fund. Previously, Mr. Lynch served on the Special Olympics International Board of Directors (1997-2006). |
Kenneth B. Robins (41) |
| Year of Election or Appointment: 2008 President and Treasurer of Fidelity's Equity and High Income Funds. Mr. Robins also serves as President and Treasurer (2010-present) and Assistant Treasurer (2009-present) of other Fidelity funds and is an employee of Fidelity Investments (2004-present). Previously, Mr. Robins served as Deputy Treasurer of the Fidelity funds (2005-2008) and Treasurer and Chief Financial Officer of The North Carolina Capital Management Trust: Cash and Term Portfolios (2006-2008). |
Bruce T. Herring (45) |
| Year of Election or Appointment: 2006 Vice President of certain Equity Funds. Mr. Herring also serves as Chief Investment Officer and Director of Fidelity Management & Research (U.K.) Inc. (2010-present) and Group Chief Investments Officer of FMR. Previously, Mr. Herring served as Vice President (2005-2006) and Senior Vice President (2006-2007) of Fidelity Management & Research Company, Vice President of FMR Co., Inc. (2001-2007) and as a portfolio manager for Fidelity U.S. Equity Funds. |
Brian B. Hogan (46) |
| Year of Election or Appointment: 2009 Vice President of certain Equity Funds and Vice President of Sector Funds. Mr. Hogan also serves as President of FMR's Equity Division (2009-present). Previously, Mr. Hogan served as Senior Vice President, Equity Research of FMR (2006-2009) and as a portfolio manager. |
Scott C. Goebel (42) |
| Year of Election or Appointment: 2008 Secretary and Chief Legal Officer (CLO) of the Fidelity funds. Mr. Goebel also serves as Secretary and CLO of The North Carolina Capital Management Trust: Cash and Term Portfolio (2008-present); General Counsel, Secretary, and Senior Vice President of FMR (2008-present) and FMR Co., Inc. (2008-present); Deputy General Counsel of FMR LLC; Chief Legal Officer of Fidelity Management & Research (Hong Kong) Limited (2008-present) and Assistant Secretary of Fidelity Management & Research (Japan) Inc. (2008-present), Fidelity Investments Money Management, Inc. (2008-present), Fidelity Management & Research (U.K.) Inc. (2008-present), and Fidelity Research and Analysis Company (2008-present). Previously, Mr. Goebel served as Assistant Secretary of the Funds (2007-2008) and as Vice President and Secretary of Fidelity Distributors Corporation (FDC) (2005-2007). |
William C. Coffey (41) |
| Year of Election or Appointment: 2009 Assistant Secretary of Fidelity's Equity and High Income Funds. Mr. Coffey also serves as Senior Vice President and Deputy General Counsel of FMR LLC (2010-present), and is an employee of Fidelity Investments. Previously, Mr. Coffey served as Vice President and Associate General Counsel of FMR LLC (2005-2009). |
Holly C. Laurent (56) |
| Year of Election or Appointment: 2008 Anti-Money Laundering (AML) Officer of the Fidelity funds. Ms. Laurent also serves as AML Officer of The North Carolina Capital Management Trust: Cash and Term Portfolio (2008-present) and is an employee of Fidelity Investments. Previously, Ms. Laurent was Senior Vice President and Head of Legal for Fidelity Business Services India Pvt. Ltd. (2006-2008), and Senior Vice President, Deputy General Counsel and Group Head for FMR LLC (2005-2006). |
Christine Reynolds (52) |
| Year of Election or Appointment: 2008 Chief Financial Officer of the Fidelity funds. Ms. Reynolds became President of Fidelity Pricing and Cash Management Services (FPCMS) in August 2008. Ms. Reynolds served as Chief Operating Officer of FPCMS (2007-2008). Previously, Ms. Reynolds served as President, Treasurer, and Anti-Money Laundering officer of the Fidelity funds (2004-2007). |
Kenneth A. Rathgeber (63) |
| Year of Election or Appointment: 2004 Chief Compliance Officer of Fidelity's Equity and High Income Funds. Mr. Rathgeber is Chief Compliance Officer of Fidelity Management & Research (Hong Kong) Limited (2008-present), Fidelity Management & Research (Japan) Inc. (2008-present), FMR (2005-present), FMR Co., Inc. (2005-present), Fidelity Management & Research (U.K.) Inc. (2005-present), Fidelity Research & Analysis Company (2005-present), Fidelity Investments Money Management, Inc. (2005-present), Pyramis Global Advisors, LLC (2005-present), and Strategic Advisers, Inc. (2005-present). |
Jeffrey S. Christian (49) |
| Year of Election or Appointment: 2009 Deputy Treasurer of the Fidelity funds. Mr. Christian is an employee of Fidelity Investments. Previously, Mr. Christian served as Chief Financial Officer (2008-2009) of certain Fidelity funds and Senior Vice President of Fidelity Pricing and Cash Management Services (FPCMS) (2004-2009). |
Bryan A. Mehrmann (49) |
| Year of Election or Appointment: 2005 Deputy Treasurer of the Fidelity funds. Mr. Mehrmann is an employee of Fidelity Investments. |
Adrien E. Deberghes (43) |
| Year of Election or Appointment: 2008 Deputy Treasurer of Fidelity's Equity and High Income Funds. Mr. Deberghes also serves as Assistant Treasurer of other Fidelity funds (2010-present) and is an employee of Fidelity Investments (2008-present). Previously, Mr. Deberghes served as Senior Vice President of Mutual Fund Administration at State Street Corporation (2007-2008), Senior Director of Mutual Fund Administration at Investors Bank & Trust (2005-2007), and Director of Finance for Dunkin' Brands (2000-2005). |
Stephanie J. Dorsey (41) |
| Year of Election or Appointment: 2010 Assistant Treasurer of Fidelity's Equity and High Income Funds. Ms. Dorsey also serves as Deputy Treasurer of other Fidelity funds (2008-present) and is an employee of Fidelity Investments (2008-present). Previously, Ms. Dorsey served as Treasurer (2004-2008) of the JPMorgan Mutual Funds and Vice President (2004-2008) of JPMorgan Chase Bank. |
John R. Hebble (52) |
| Year of Election or Appointment: 2009 Assistant Treasurer of Fidelity's Equity and High Income Funds. Mr. Hebble also serves as Treasurer and Chief Financial Officer of The North Carolina Capital Management Trust: Cash and Term Portfolio (2008-present), President and Treasurer of other Fidelity funds (2008-present) and is an employee of Fidelity Investments. |
Gary W. Ryan (52) |
| Year of Election or Appointment: 2005 Assistant Treasurer of the Fidelity funds. Mr. Ryan is an employee of Fidelity Investments. Previously, Mr. Ryan served as Vice President of Fund Reporting in Fidelity Pricing and Cash Management Services (FPCMS) (1999-2005). |
Jonathan Davis (42) |
| Year of Election or Appointment: 2010 Assistant Treasurer of the Fidelity funds. Mr. Davis is an employee of Fidelity Investments. Previously, Mr. Davis served as Vice President and Associate General Counsel of FMR LLC (2003-2010). |
Annual Report
Class A designates 100%, Class T designates 100%, Class B designates 100%, and Class C designates 100% of the dividends distributed during the fiscal year as amounts which may be taken into account as a dividend for purposes of the maximum rate under section 1(h)(11) of the Internal Revenue Code.
The amounts per share which represent income derived from sources within, and taxes paid to, foreign countries or possessions of the United States are as follows:
| Pay Date | Income | Taxes |
Class A | 12/07/09 | $0.152 | $0.0216 |
| | | |
Class T | 12/07/09 | $0.135 | $0.0216 |
| | | |
Class B | 12/07/09 | $0.080 | $0.0216 |
| | | |
Class C | 12/07/09 | $0.081 | $0.0216 |
The fund will notify shareholders in January 2011 of amounts for use in preparing 2010 income tax returns.
Annual Report
Board Approval of Investment Advisory Contracts and Management Fees
Fidelity Advisor Europe Capital Appreciation Fund
Each year, the Board of Trustees, including the Independent Trustees (together, the Board), votes on the renewal of the management contract and sub-advisory agreements (together, the Advisory Contracts) for the fund. The Board, assisted by the advice of fund counsel and Independent Trustees' counsel, requests and considers a broad range of information relevant to the renewal of the Advisory Contracts throughout the year.
The Board meets regularly and considers at each of its meetings factors that are relevant to its annual consideration of the renewal of the fund's Advisory Contracts, including the services and support provided to the fund and its shareholders. The Board has established various standing committees, each composed of Independent Trustees with varying backgrounds, to which the Board has assigned specific subject matter responsibilities in order to enhance effective decision-making by the Board. The Board, acting directly and through its Committees, requests and receives information concerning the annual consideration of the renewal of the fund's Advisory Contracts. The Board also meets as needed to consider matters specifically related to the Board's annual consideration of the renewal of Advisory Contracts. Members of the Board may also meet with trustees of other Fidelity funds through ad hoc joint committees to discuss certain matters relevant to the Fidelity funds.
At its July 2010 meeting, the Board of Trustees, including the Independent Trustees, unanimously determined to renew the fund's Advisory Contracts. In reaching its determination, the Board considered all factors it believed relevant, including (i) the nature, extent, and quality of the services to be provided to the fund and its shareholders (including the investment performance of the fund); (ii) the competitiveness of the fund's management fee and total expenses; (iii) the total costs of the services to be provided by and the profits to be realized by Fidelity from its relationship with the fund; (iv) the extent to which economies of scale would be realized as the fund grows; and (v) whether fee levels reflect these economies of scale, if any, for the benefit of fund shareholders.
In considering whether to renew the Advisory Contracts for the fund, the Board reached a determination, with the assistance of fund counsel and Independent Trustees' counsel and through the exercise of its business judgment, that the renewal of the Advisory Contracts is in the best interests of fund shareholders and that the compensation to be received by Fidelity under the management contract is fair and reasonable. The Board's decision to renew the Advisory Contracts was not based on any single factor noted above, but rather was based on a comprehensive consideration of all the information provided to the Board at its meetings throughout the year. The Board, in reaching its determination to renew the Advisory Contracts, is aware that shareholders in the fund have a broad range of investment choices available to them, including a wide choice among mutual funds offered by Fidelity's competitors, and that the fund's shareholders, with the opportunity to review and weigh the disclosure provided by the fund in its prospectus and other public disclosures, have chosen to invest in this fund, managed by Fidelity.
Annual Report
Nature, Extent, and Quality of Services Provided. The Board considered the staffing within the investment adviser, FMR, and the sub-advisers (together, the Investment Advisers), including the backgrounds of the fund's investment personnel and the fund's investment objective and discipline. The Independent Trustees also had discussions with senior management of Fidelity's investment operations and investment groups. The Board considered the structure of the portfolio manager compensation program and whether this structure provides appropriate incentives to act in the best interest of the fund.
Resources Dedicated to Investment Management and Support Services. The Board and the equity research subcommittee of the Board's Fund Oversight Committee reviewed the size, education, and experience of the Investment Advisers' investment staff, their use of technology, and the Investment Advisers' approach to recruiting, training, and retaining portfolio managers and other research, advisory, and management personnel. The Board noted that Fidelity's analysts have access to a variety of technological tools and market and securities data that enable them to perform both fundamental and quantitative analysis and to specialize in various disciplines. The Board considered Fidelity's extensive global research capabilities that enable the Investment Advisers to aggregate data from various sources in an effort to produce positive investment results. The Board also considered that Fidelity's portfolio managers and analysts have access to daily portfolio attribution that allows for monitoring of a fund's portfolio, as well as an electronic communication system that provides immediate real-time access to research concerning issuers and credit enhancers. The Board noted FMR's continued focus on strengthening the organization and discipline of equity portfolio management and research.
Shareholder and Administrative Services. The Board considered (i) the nature, extent, quality, and cost of advisory, administrative, and shareholder services performed by the Investment Advisers and their affiliates under the Advisory Contracts and under separate agreements covering transfer agency, pricing and bookkeeping, and securities lending services for the fund; (ii) the nature and extent of the investment adviser's supervision of third party service providers, principally custodians and subcustodians; and (iii) the resources devoted to, and the record of compliance with, the fund's compliance policies and procedures. The Board also reviewed the allocation of fund brokerage, including allocations to brokers affiliated with the Investment Advisers, the use of brokerage commissions to pay fund expenses, and the use of "soft" commission dollars to pay for research services.
The Board noted that the growth of fund assets over time across the complex allows Fidelity to reinvest in the development of services designed to enhance the value or convenience of the Fidelity funds as investment vehicles. These services include 24-hour access to account information and market information through phone representatives and over the Internet, and investor education materials and asset allocation tools.
Annual Report
Board Approval of Investment Advisory Contracts and
Management Fees - continued
Investment in a Large Fund Family. The Board considered the benefits to shareholders of investing in a Fidelity fund, including the benefits of investing in a fund that is part of a large family of funds offering a variety of investment disciplines and providing a large variety of mutual fund investor services. The Board noted that Fidelity had taken, or had made recommendations that resulted in the Fidelity funds taking, a number of actions over the previous year that benefited particular funds, including (i) dedicating additional resources to investment research and restructuring and broadening the focus of the investment research teams; (ii) bolstering the senior management team that oversees asset management; (iii) launching Class F of certain funds as a lower-fee class available to Freedom K and Freedom Index Funds; (iv) lowering the initial investment minimums and ongoing balance requirements for Real Estate High Income Fund; (v) eliminating subsequent purchase minimums for all funds and adding a waiver of the investment minimum requirement for new accounts opened with the proceeds of a systematic withdrawal plan; (vi) eliminating the withdrawal minimum and maximum limits for systematic withdrawals from Advisor funds; (vii) expanding sales load waivers on Class A shares for Destiny Planholders and expanding Institutional Class eligibility for Class O Destiny Planholders; and (viii) changing certain Class A and Class T sales charge structures to further align them with industry practices.
Investment Performance. The Board considered whether the fund has operated in accordance with its investment objective, as well as its record of compliance with its investment restrictions. It also reviewed the fund's absolute investment performance for each class, as well as the fund's relative investment performance for each class measured over multiple periods against (i) a broad-based securities market index, and (ii) a peer group of mutual funds deemed appropriate by Fidelity and reviewed by the Board. The following charts considered by the Board show, over the one-, three-, and five-year periods ended December 31, 2009, the cumulative total returns of Institutional Class (Class I) and Class C of the fund, the cumulative total returns of a broad-based securities market index ("benchmark"), and a range of cumulative total returns of a peer group of mutual funds identified by Morningstar, Inc. as having an investment style similar to that of the fund based on underlying portfolio holdings. The returns of Institutional Class (Class I) and Class C show the performance of the highest and lowest performing classes, respectively (based on five-year performance). The box within each chart shows the 25th percentile return (bottom of box) and the 75th percentile return (top of box) of the peer group. Returns shown above the box are in the first quartile and returns shown below the box are in the fourth quartile. The percentage beaten numbers noted below each chart correspond to the percentile box and represent the percentage of funds in the peer group whose performance was equal to or lower than that of the class indicated.
Annual Report
Fidelity Advisor Europe Capital Appreciation Fund
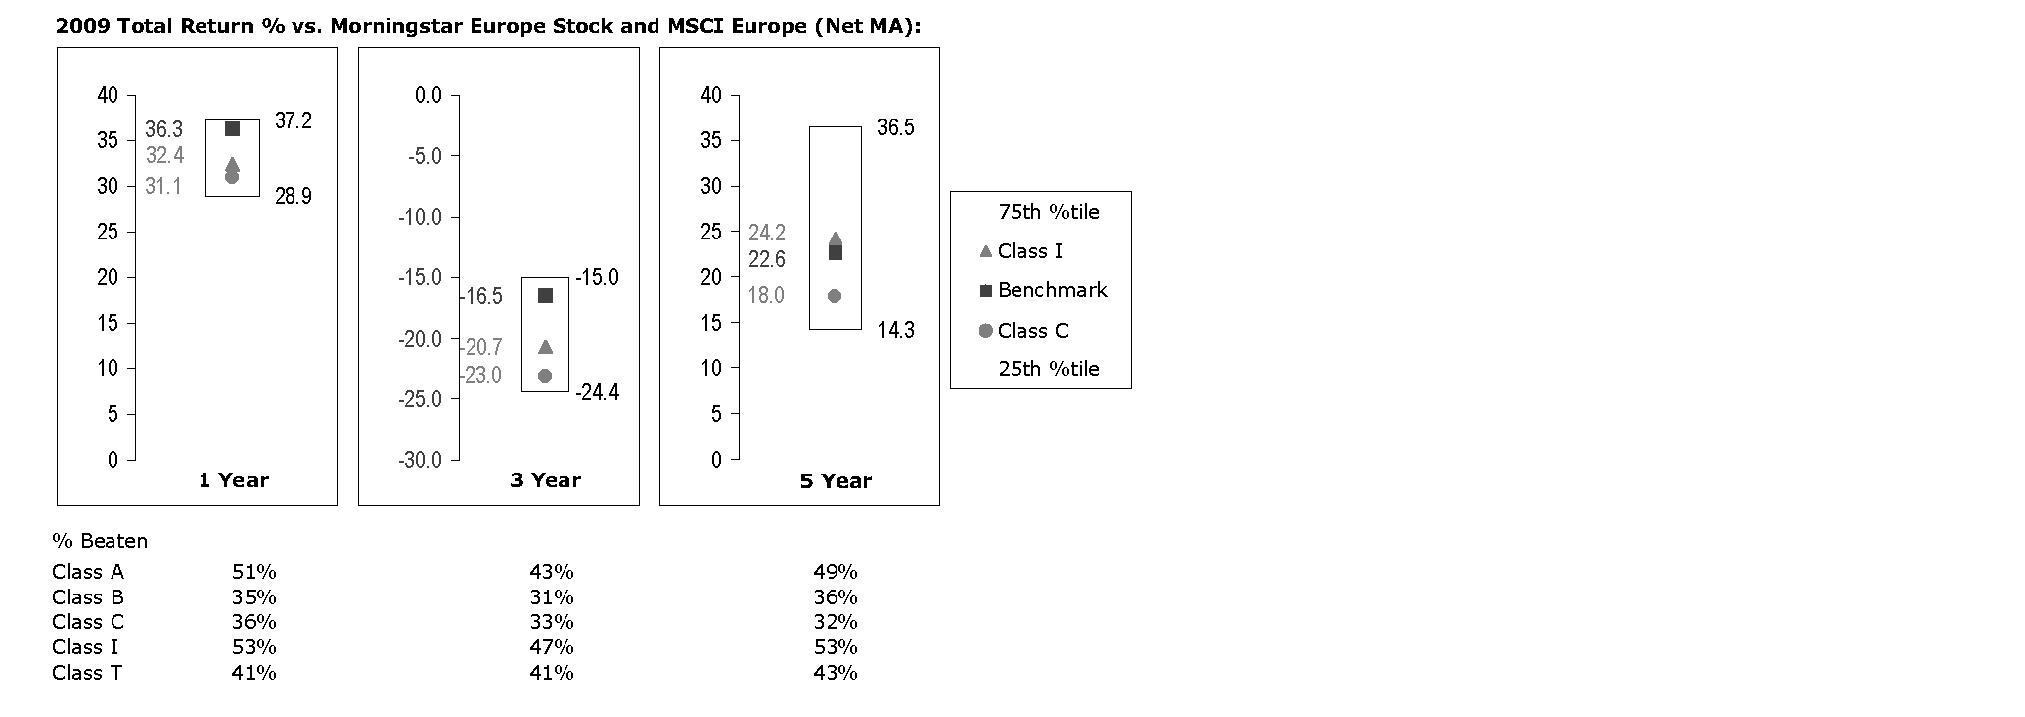
The Board reviewed the fund's relative investment performance against its peer group and noted that the performance of Institutional Class (Class I) of the fund was in the second quartile for the one- and five-year periods and the third quartile for the three-year period. The Board also noted that the investment performance of the fund was lower than its benchmark for the one- and three-year periods, although the five-year cumulative total return of Institutional Class (Class I) compared favorably to its benchmark. The Board considered that the variations in performance among the fund's classes reflect the variations in class expenses, which result in lower performance for higher expense classes. The Board also reviewed the fund's performance since inception as well as performance in the current year.
Based on its review, and giving particular weight to the nature and quality of the resources dedicated by the Investment Advisers to maintain and improve relative performance and factoring in the unprecedented market events in recent years, the Board concluded that the nature, extent, and quality of investment management and support services and of shareholder and administrative services provided to the fund will benefit the fund's shareholders, particularly in light of the Board's view that the fund's shareholders benefit from investing in a fund that is part of a large family of funds offering a variety of investment disciplines and services.
Competitiveness of Management Fee and Total Fund Expenses. The Board considered the fund's management fee and total expenses compared to "mapped groups" of competitive funds and classes. Fidelity creates "mapped groups" by combining similar Lipper investment objective categories that have comparable management fee characteristics. Combining Lipper investment objective categories aids the Board's management fee and total expense comparisons by broadening the competitive group used for comparison and by reducing the number of universes to which various Fidelity funds are compared.
Annual Report
Board Approval of Investment Advisory Contracts and
Management Fees - continued
Management Fee. The Board considered two proprietary management fee comparisons for the 12-month periods shown in the chart below. The group of Lipper funds used by the Board for management fee comparisons is referred to below as the "Total Mapped Group." The Total Mapped Group comparison focuses on a fund's standing relative to the total universe of comparable funds available to investors, in terms of gross management fees before expense reimbursements or caps. "TMG %" represents the percentage of funds in the Total Mapped Group that had management fees that were lower than the fund's. For example, a TMG % of 15% means that 85% of the funds in the Total Mapped Group had higher management fees than the fund. The "Asset-Size Peer Group" (ASPG) comparison focuses on a fund's standing relative to non-Fidelity funds similar in size to the fund within the Total Mapped Group. The ASPG represents at least 15% of the funds in the Total Mapped Group with comparable asset size and management fee characteristics, subject to a minimum of 50 funds (or all funds in the Total Mapped Group if fewer than 50). Additional information, such as the ASPG quartile in which the fund's management fee ranked, is also included in the chart and considered by the Board.
Fidelity Advisor Europe Capital Appreciation Fund
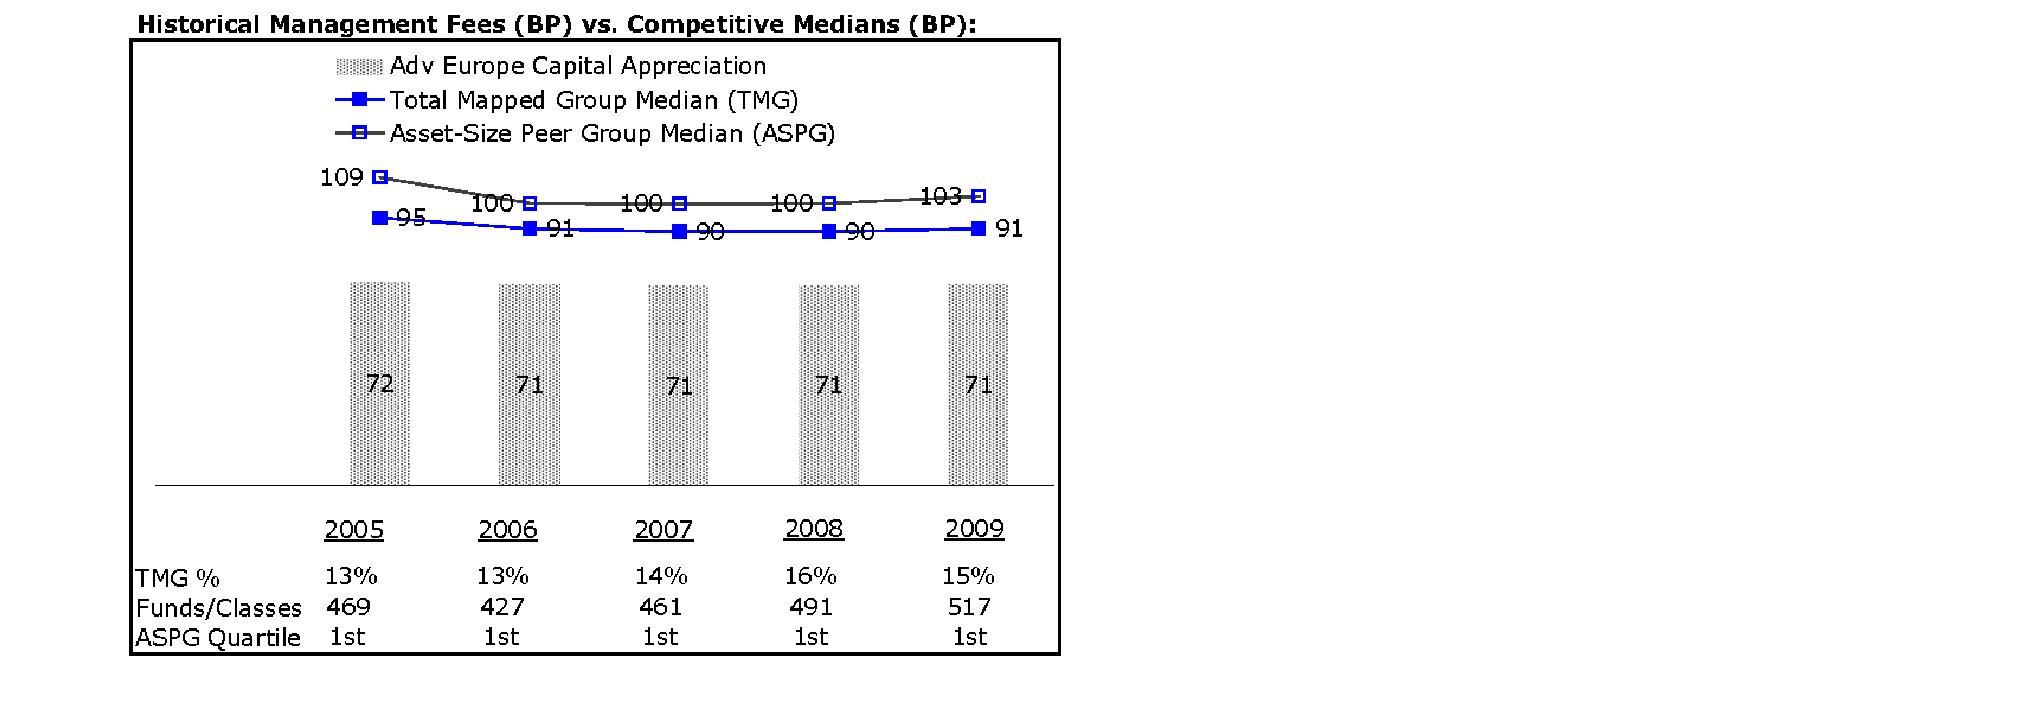
The Board noted that the fund's management fee ranked below the median of its Total Mapped Group and below the median of its ASPG for 2009.
Annual Report
Based on its review, the Board concluded that the fund's management fee is fair and reasonable in light of the services that the fund receives and the other factors considered.
Total Expenses. In its review of each class's total expenses, the Board considered the fund's management fee as well as other fund or class expenses, as applicable, such as transfer agent fees, pricing and bookkeeping fees, fund-paid 12b-1 fees, and custodial, legal, and audit fees. The Board also noted the effects of any waivers and reimbursements on fees and expenses. As part of its review, the Board also considered current and historical total expenses of each class of the fund compared to competitive fund median expenses. Each class of the fund is compared to those funds and classes in the Total Mapped Group (used by the Board for management fee comparisons) that have a similar sales load structure.
The Board noted that the total expenses of Class A ranked below its competitive median for 2009, the total expenses of Class B ranked equal to its competitive median for 2009, and the total expenses of each of Class T, Class C, and Institutional Class ranked above its competitive median for 2009. The Board considered that the total expenses for Class T were above the median primarily because its 12b-1 fee is higher than the typical front-end load class. The Board noted that the fund offers multiple classes, each of which has a different sales load and 12b-1 fee structure, and that the multiple structures are intended to offer a range of pricing options for the intermediary market. The Board also noted that the total expenses of the classes vary primarily by the level of their 12b-1 fees, although differences in transfer agent fees may also cause expenses to vary from class to class.
Fees Charged to Other Fidelity Clients. The Board also considered Fidelity fee structures and other information with respect to clients of FMR and its affiliates, such as other mutual funds advised or subadvised by FMR or its affiliates, pension plan clients, and other institutional clients. In March 2010, the Board created an ad hoc joint committee with the board of other Fidelity funds (the Committee) to review and compare Fidelity's institutional investment advisory business with its business of providing services to the Fidelity funds, including the differences in services provided, fees charged, and costs incurred, as well as competition in their respective marketplaces.
Based on its review of total expenses and fees charged to other Fidelity clients, the Board concluded that the total expenses of each class of the fund were reasonable, although in some cases above the median of the universe presented for comparison, in light of the services that the fund and its shareholders receive and the other factors considered, including the findings of the Committee.
Costs of the Services and Profitability. The Board considered the revenues earned and the expenses incurred by Fidelity in conducting the business of developing, marketing, distributing, managing, administering and servicing the fund and its shareholders. The Board also considered the level of Fidelity's profits in respect of all the Fidelity funds.
Annual Report
Board Approval of Investment Advisory Contracts and
Management Fees - continued
On an annual basis, FMR presents to the Board Fidelity's profitability for the fund. Fidelity calculates the profitability for each fund, as well as aggregate profitability for groups of Fidelity funds and all Fidelity funds, using a series of detailed revenue and cost allocation methodologies which originate with the audited books and records of Fidelity. The Audit Committee of the Board reviews any significant changes from the prior year's methodologies.
PricewaterhouseCoopers LLP (PwC), independent registered public accounting firm and auditor to Fidelity and certain Fidelity funds, has been engaged annually by the Board as part of the Board's assessment of Fidelity's profitability analysis. PwC's engagement includes the review and assessment of Fidelity's methodologies used in determining the revenues and expenses attributable to Fidelity's mutual fund business, and completion of agreed-upon procedures surrounding the mathematical accuracy of fund profitability and its conformity to allocation methodologies. After considering PwC's reports issued under the engagement and information provided by Fidelity, the Board believes that while other allocation methods may also be reasonable, Fidelity's profitability methodologies are reasonable in all material respects.
The Board has also reviewed Fidelity's non-fund businesses and fall-out benefits related to the mutual fund business as well as cases where Fidelity's affiliates may benefit from or be related to the fund's business.
The Board considered the costs of the services provided by and the profits realized by Fidelity in connection with the operation of the fund and were satisfied that the profitability was not excessive in the circumstances.
Economies of Scale. The Board considered whether there have been economies of scale in respect of the management of the Fidelity funds, whether the Fidelity funds (including the fund) have appropriately benefited from any such economies of scale, and whether there is potential for realization of any further economies of scale. The Board considered the extent to which the fund will benefit from economies of scale through increased services to the fund, through waivers or reimbursements, or through fee or expense reductions.
In February 2009, the Board and the board of other Fidelity funds created an ad hoc committee (the Economies of Scale Committee) to analyze whether FMR attains economies of scale in respect of the management and servicing of the Fidelity funds, whether the Fidelity funds have appropriately benefited from such economies of scale, and whether there is potential for realization of any further economies of scale.
The Board recognized that the fund's management contract incorporates a "group fee" structure, which provides for lower group fee rates as total fund assets under FMR's management increase, and for higher group fee rates as total fund assets under FMR's management decrease. FMR calculates the group fee rates based on a tiered asset "breakpoint" schedule that varies based on asset class. The Board considered that the group fee is designed to deliver the benefits of economies of scale to fund shareholders when total Fidelity fund assets increase, even if assets of any particular fund are unchanged or have declined, because some portion of Fidelity's costs are attributable to services provided to all Fidelity funds, and all funds benefit if those costs can be allocated among more assets. The Board concluded that, given the group fee structure, fund shareholders will benefit from lower management fees as assets under FMR's management increase at the fund complex level, regardless of whether Fidelity achieves any such economies of scale.
Annual Report
The Board concluded, considering the findings of the Economies of Scale Committee, that any potential economies of scale are being appropriately shared between fund shareholders and Fidelity.
Additional Information Requested by the Board. In order to develop fully the factual basis for consideration of the Fidelity funds' Advisory Contracts, the Board requested and received additional information on certain topics, including (i) fund performance trends, actions to be taken by FMR to improve certain funds' overall performance, and Fidelity's long-term strategies for certain funds; (ii) portfolio manager changes that have occurred during the past year and length of portfolio manager tenure for different categories of funds over time; (iii) Fidelity's compensation structure for portfolio managers, research analysts, and other key personnel, the rationale for the compensation structure, and how the compensation structure provides appropriate performance incentives; (iv) the amount of the investment that each portfolio manager has made in the Fidelity fund(s) that he or she manages; (v) management and other fees paid by FMR to affiliated sub-advisers on behalf of the Fidelity funds; (vi) Fidelity's fee structures and rationale for recommending different fees among different categories of funds; (vii) Fidelity's rationale for recommending which funds should have a performance adjustment component as part of their management fees; (viii) the rationale for any differences between fund fee structures and fee structures in place for other Fidelity clients; and (ix) explanations regarding the relative total expenses borne by certain funds and classes, total expense competitive trends, and actions that might be taken by FMR to reduce total expenses for certain funds and classes.
Based on its evaluation of all of the conclusions noted above, and after considering all factors it believed relevant, the Board ultimately concluded that the advisory fee structures are fair and reasonable, and that the fund's Advisory Contracts should be renewed.
Annual Report
Investment Adviser
Fidelity Management & Research Company
Boston, MA
Investment Sub-Advisers
FMR Co., Inc.
Fidelity Management & Research
(U.K.) Inc.
Fidelity Research & Analysis Company
FIL Investment Advisors
FIL Investment Advisors (U.K.) Limited
Fidelity Management & Research
(Hong Kong) Limited
Fidelity Management & Research
(Japan) Inc.
General Distributor
Fidelity Distributors Corporation
Boston, MA
Transfer and Service Agents
Fidelity Investments Institutional Operations Company, Inc.
Boston, MA
Fidelity Service Company, Inc.
Boston, MA
Custodian
State Street Bank and Trust Company
Quincy, MA
AEUR-UANN-1210
1.784739.107
(Fidelity Investment logo)(registered trademark)
Fidelity AdvisorSM
Europe Capital Appreciation
Fund - Institutional Class
Annual Report
October 31, 2010
(2_fidelity_logos) (Registered_Trademark)
Contents
Chairman's Message | <Click Here> | The Chairman's message to shareholders. |
Performance | <Click Here> | How the fund has done over time. |
Management's Discussion of Fund Performance | <Click Here> | The Portfolio Manager's review of fund performance and strategy. |
Shareholder Expense Example | <Click Here> | An example of shareholder expenses. |
Investment Changes | <Click Here> | A summary of major shifts in the fund's investments over the past six months. |
Investments | <Click Here> | A complete list of the fund's investments with their market values. |
Financial Statements | <Click Here> | Statements of assets and liabilities, operations, and changes in net assets,
as well as financial highlights. |
Notes | <Click Here> | Notes to financial statements. |
Report of Independent Registered Public Accounting Firm | <Click Here> | |
Trustees and Officers | <Click Here> | |
Distributions | <Click Here> | |
Board Approval of Investment Advisory Contracts and Management Fees | <Click Here> | |
To view a fund's proxy voting guidelines and proxy voting record for the 12-month period ended June 30, visit http://www.fidelity.com/proxyvotingresults or visit the Securities and Exchange Commission's (SEC) web site at http://www.sec.gov. You may also call 1-877-208-0098 to request a free copy of the proxy voting guidelines.
Standard & Poor's, S&P and S&P 500 are registered service marks of The McGraw-Hill Companies, Inc. and have been licensed for use by Fidelity Distributors Corporation.
Other third party marks appearing herein are the property of their respective owners.
All other marks appearing herein are registered or unregistered trademarks or service marks of FMR LLC or an affiliated company.
Annual Report
This report and the financial statements contained herein are submitted for the general information of the shareholders of the fund. This report is not authorized for distribution to prospective investors in the fund unless preceded or accompanied by an effective prospectus.
A fund files its complete schedule of portfolio holdings with the SEC for the first and third quarters of each fiscal year on Form N-Q. Forms N-Q are available on the SEC's web site at http://www.sec.gov. A fund's Forms N-Q may be reviewed and copied at the SEC's Public Reference Room in Washington, DC. Information regarding the operation of the SEC's Public Reference Room may be obtained by calling 1-800-SEC-0330. For a complete list of a fund's portfolio holdings, view the most recent holdings listing, semiannual report, or annual report on Fidelity's web site at http://www.fidelity.com or http://www.advisor.fidelity.com, as applicable.
NOT FDIC INSURED • MAY LOSE VALUE • NO BANK GUARANTEE
Neither the fund nor Fidelity Distributors Corporation is a bank.
Annual Report
(photo_of_Edward_C_Johnson_3d)
Dear Shareholder:
Equities have staged a rally in the second half of 2010, shaking off concerns about the European debt crisis and the possibility of a double-dip recession in the U.S. Although the short-term surge pushed major equity indexes back into positive territory for the year, several questions remain about the longer-term outlook, including lackluster economic growth and persistently high unemployment. Financial markets are always unpredictable, of course, but there also are several time-tested investment principles that can help put the odds in your favor.
One of the basic tenets is to invest for the long term. Over time, riding out the markets' inevitable ups and downs has proven much more effective than selling into panic or chasing the hottest trend. Even missing only a few of the markets' best days can significantly diminish investor returns. Patience also affords the benefits of compounding - of earning interest on additional income or reinvested dividends and capital gains. There can be tax advantages and cost benefits to consider as well. While staying the course doesn't eliminate risk, it can considerably lessen the effect of short-term declines.
You can further manage your investing risk through diversification. And today, more than ever, geographic diversification should be taken into account. Studies indicate that asset allocation is the single most important determinant of a portfolio's long-term success. The right mix of stocks, bonds and cash - aligned to your particular risk tolerance and investment objective - is very important. Age-appropriate rebalancing is also an essential aspect of asset allocation. For younger investors, an emphasis on equities - which historically have been the best-performing asset class over time - is encouraged. As investors near their specific goal, such as retirement or sending a child to college, consideration may be given to replacing volatile assets (e.g. common stocks) with more-stable fixed investments (bonds or savings plans).
A third principle - investing regularly - can help lower the average cost of your purchases. Investing a certain amount of money each month or quarter helps ensure you won't pay for all your shares at market highs. This strategy - known as dollar cost averaging - also reduces "emotion" from investing, helping shareholders avoid selling weak performers just prior to an upswing, or chasing a hot performer just before a correction.
We invite you to contact us via the Internet, through our Investor Centers or by phone. It is our privilege to provide you the information you need to make the investments that are right for you.
Sincerely,
(The chairman's signature appears here.)
Edward C. Johnson 3d
Annual Report
Average annual total return reflects the change in the value of an investment, assuming reinvestment of the class' distributions from dividend income and capital gains (the profits earned upon the sale of securities that have grown in value, if any) and assuming a constant rate of performance each year. The $10,000 table and the fund's returns do not reflect the deduction of taxes that a shareholder would pay on fund distributions or the redemption of fund shares. During periods of reimbursement by Fidelity, a fund's total return will be greater than it would be had the reimbursement not occurred. How a fund did yesterday is no guarantee of how it will do tomorrow.
Average Annual Total Returns
Periods ended October 31, 2010 | Past 1
year | Past 5
years | Past 10
years |
Institutional Class | 10.00% | 3.80% | 4.11% |
$10,000 Over 10 Years
Let's say hypothetically that $10,000 was invested in Fidelity AdvisorSM Europe Capital Appreciation Fund - Institutional Class on October 31, 2000. The chart shows how the value of your investment would have changed, and also shows how the MSCI® Europe Index performed over the same period.
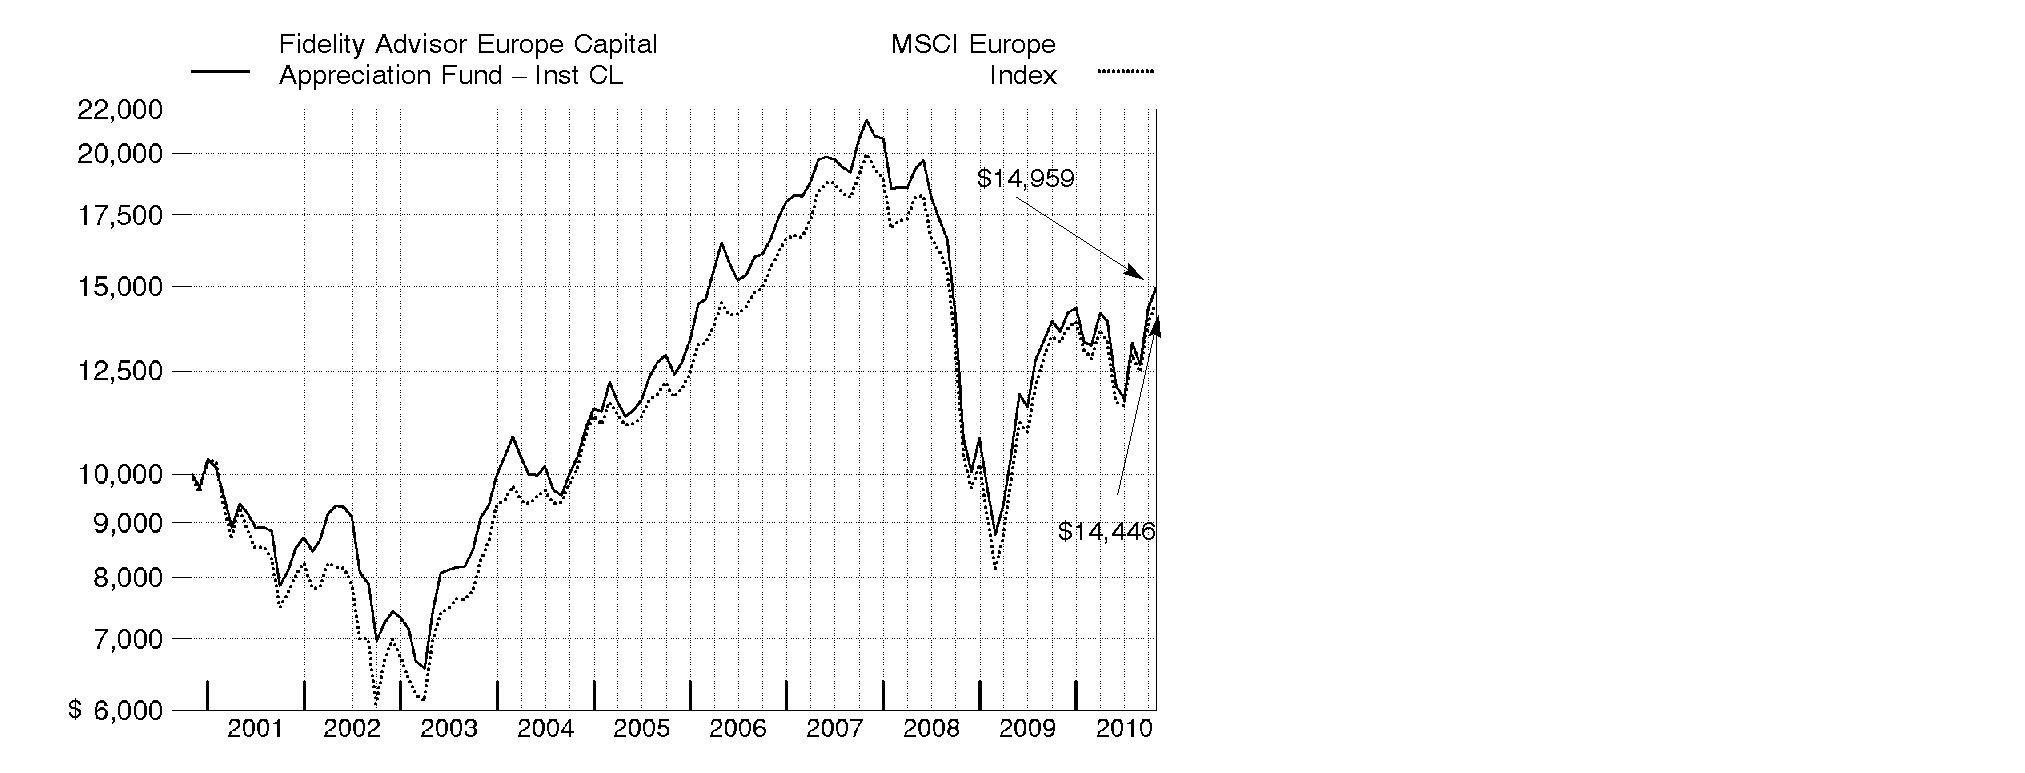
Annual Report
Market Recap: International stocks rode a wave of volatility similar to that of their U.S. counterparts during the 12 months ending October 31, 2010. Stocks gained modestly in the first half of the period, despite growing concerns about the European debt crisis. Sentiment turned decidedly negative in May and June, however, and the market suffered a precipitous decline. These losses were more than offset during the last four months of the period, when signs of economic growth and subsiding debt fears helped propel international stocks about 21%. For the full year, the MSCI® ACWI® (All Country World Index) ex USA Index gained 12.76%, boosted in part by a generally depreciating U.S. dollar. Within the index, Canada and emerging markets were standouts, returning 23% and 24%, respectively. Results in the latter group were led by strong-performing India, Mexico and South Africa, while China fell short of the MSCI benchmark due to cooling economic growth. The developed Asia ex Japan segment rose 16% for the period, lifted by solid results from Singapore and Hong Kong. Meanwhile, Europe rose just 9%, held back mainly by debt-riddled Spain and Italy, as well as lagging major constituent France. Japan returned only 5%, a result of that nation's continued weak economy.
Comments from Melissa Reilly, Portfolio Manager of Fidelity AdvisorSM Europe Capital Appreciation Fund: For the 12 months ending October 31, 2010, the fund's Institutional Class shares advanced 10.00%, outpacing the 8.60% increase of the MSCI Europe Index. Stock selection and a significant overweighting in consumer discretionary contributed the most. The fund's media holdings - Germany's ProSiebenSat.1 Media, U.S.-based Virgin Media and Sweden's Modern Times Group - were beneficial, as advertising spending increased during the period. ProSiebenSat.1 Media and Virgin Media were out-of-index positions. The fund's positioning in industrials, particularly among capital goods names, and security selection in technology helped. Danish pharmaceutical company Novo Nordisk and materials firm Umicore in Belgium also aided results. Geographically, the fund's holdings in Germany and Denmark notably contributed, as did out-of-index stakes in the U.S., China and South Africa. Conversely, investments in the U.K., Spain and the Netherlands detracted. On a sector basis, the fund's positioning in telecommunication services, materials and consumer staples hurt, while several underweightings among individual stocks detracted, including AstraZeneca, a British biopharmaceutical firm, and telecom companies U.K.-based Vodafone and Telefonica in Spain. I sold Telefonica by period end. British oil company BP also hurt.
The views expressed above reflect those of the portfolio manager(s) only through the end of the period as stated on the cover of this report and do not necessarily represent the views of Fidelity or any other person in the Fidelity organization. Any such views are subject to change at any time based upon market or other conditions and Fidelity disclaims any responsibility to update such views. These views may not be relied on as investment advice and, because investment decisions for a Fidelity fund are based on numerous factors, may not be relied on as an indication of trading intent on behalf of any Fidelity fund.
Annual Report
Shareholder Expense Example
As a shareholder of the Fund, you incur two types of costs: (1) transaction costs, including sales charges (loads) on purchase payments or redemption proceeds, redemption fees, and (2) ongoing costs, including management fees, distribution and/or service (12b-1) fees and other Fund expenses. This Example is intended to help you understand your ongoing costs (in dollars) of investing in the Fund and to compare these costs with the ongoing costs of investing in other mutual funds.
The Example is based on an investment of $1,000 invested at the beginning of the period and held for the entire period (May 1, 2010 to October 31, 2010).
Actual Expenses
The first line of the accompanying table for each class of the Fund provides information about actual account values and actual expenses. You may use the information in this line, together with the amount you invested, to estimate the expenses that you paid over the period. Simply divide your account value by $1,000.00 (for example, an $8,600 account value divided by $1,000.00 = 8.6), then multiply the result by the number in the first line for a class of the Fund under the heading entitled "Expenses Paid During Period" to estimate the expenses you paid on your account during this period. In addition, the Fund, as a shareholder in the underlying Fidelity Central Funds, will indirectly bear its pro-rata share of the fees and expenses incurred by the underlying Fidelity Central Funds. These fees and expenses are not included in the Fund's annualized expense ratio used to calculate the expense estimate in the table below.
Hypothetical Example for Comparison Purposes
The second line of the accompanying table for each class of the Fund provides information about hypothetical account values and hypothetical expenses based on a Class' actual expense ratio and an assumed rate of return of 5% per year before expenses, which is not the Class' actual return. The hypothetical account values and expenses may not be used to estimate the actual ending account balance or expenses you paid for the period. You may use this information to compare the ongoing costs of investing in the Fund and other funds. To do so, compare this 5% hypothetical example with the 5% hypothetical examples that appear in the shareholder reports of the other funds. In addition, the Fund, as a shareholder in the underlying Fidelity Central Funds, will indirectly bear its pro-rata share of the fees and expenses incurred by the underlying Fidelity Central Funds. These fees and expenses are not included in the Fund's annualized expense ratio used to calculate the expense estimate in the table below.
Please note that the expenses shown in the table are meant to highlight your ongoing costs only and do not reflect any transaction costs. Therefore, the second line of the table is useful in comparing ongoing costs only, and will not help you determine the relative total costs of owning different funds. In addition, if these transactional costs were included, your costs would have been higher.
Annual Report
Shareholder Expense Example - continued
|
Annualized
Expense Ratio
|
Beginning
Account Value
May 1, 2010
|
Ending
Account Value
October 31, 2010
| Expenses Paid
During Period*
May 1, 2010 to
October 31, 2010 |
Class A | 1.50%** | | | |
Actual | | $ 1,000.00 | $ 1,074.10 | $ 7.84** |
HypotheticalA | | $ 1,000.00 | $ 1,017.64 | $ 7.63** |
Class T | 1.75%** | | | |
Actual | | $ 1,000.00 | $ 1,072.50 | $ 9.14** |
HypotheticalA | | $ 1,000.00 | $ 1,016.38 | $ 8.89** |
Class B | 2.25%** | | | |
Actual | | $ 1,000.00 | $ 1,069.70 | $ 11.74** |
HypotheticalA | | $ 1,000.00 | $ 1,013.86 | $ 11.42** |
Class C | 2.25%** | | | |
Actual | | $ 1,000.00 | $ 1,070.10 | $ 11.74** |
HypotheticalA | | $ 1,000.00 | $ 1,013.86 | $ 11.42** |
Institutional Class | 1.25%** | | | |
Actual | | $ 1,000.00 | $ 1,075.40 | $ 6.54** |
HypotheticalA | | $ 1,000.00 | $ 1,018.90 | $ 6.36** |
A 5% return per year before expenses
* Expenses are equal to each Class' annualized expense ratio, multiplied by the average account value over the period, multiplied by 184/365 (to reflect the one-half year period).
** If changes to voluntary expense limitations, effective November 1, 2010 had been in effect during the entire period, the annualized expense ratios and the expenses paid in the actual and hypothetical examples above would have been as follows:
| Annualized
Expense Ratio |
Expenses Paid
|
Class A | 1.45% | |
Actual | | $ 7.58 |
HypotheticalA | | $ 7.38 |
Class T | 1.70% | |
Actual | | $ 8.88 |
HypotheticalA | | $ 8.64 |
Class B | 2.20% | |
Actual | | $ 11.48 |
HypotheticalA | | $ 11.17 |
Class C | 2.20% | |
Actual | | $ 11.48 |
HypotheticalA | | $ 11.17 |
Institutional Class | 1.20% | |
Actual | | $ 6.28 |
HypotheticalA | | $ 6.11 |
A 5% return per year before expenses
Annual Report
Investment Changes (Unaudited)
Top Five Stocks as of October 31, 2010 |
| % of fund's
net assets | % of fund's net assets
6 months ago |
BP PLC (United Kingdom, Oil, Gas & Consumable Fuels) | 3.5 | 1.8 |
Royal Dutch Shell PLC Class A (United Kingdom) (United Kingdom, Oil, Gas & Consumable Fuels) | 3.2 | 4.2 |
Vodafone Group PLC (United Kingdom, Wireless Telecommunication Services) | 2.5 | 0.3 |
Novartis AG (Switzerland, Pharmaceuticals) | 2.4 | 1.7 |
HSBC Holdings PLC sponsored ADR (United Kingdom, Commercial Banks) | 2.3 | 2.9 |
| 13.9 | |
Top Five Market Sectors as of October 31, 2010 |
| % of fund's
net assets | % of fund's net assets
6 months ago |
Consumer Discretionary | 21.2 | 12.7 |
Financials | 18.9 | 23.7 |
Industrials | 11.3 | 14.0 |
Energy | 11.2 | 11.2 |
Materials | 10.0 | 9.6 |
Top Five Countries as of October 31, 2010 |
(excluding cash equivalents) | % of fund's
net assets | % of fund's net assets
6 months ago |
United Kingdom | 30.0 | 29.1 |
France | 13.0 | 12.2 |
Germany | 10.0 | 10.0 |
Switzerland | 9.5 | 11.4 |
Spain | 4.8 | 6.0 |
Percentages are adjusted for the effect of open futures contracts, if applicable. |
Asset Allocation (% of fund's net assets) |
As of October 31, 2010 | As of April 30, 2010 |
| Stocks 99.6% | | | Stocks 99.6% | |
| Short-Term
Investments and
Net Other Assets 0.4% | | | Short-Term
Investments and
Net Other Assets 0.4% | |

Annual Report
Investments October 31, 2010
Showing Percentage of Net Assets
Common Stocks - 96.1% |
| Shares | | Value |
Austria - 0.7% |
Erste Bank AG | 3,500 | | $ 157,937 |
Bailiwick of Jersey - 2.9% |
Experian PLC | 15,600 | | 181,328 |
Randgold Resources Ltd. sponsored ADR | 3,300 | | 309,936 |
Shire PLC | 7,490 | | 175,747 |
TOTAL BAILIWICK OF JERSEY | | 667,011 |
Belgium - 3.1% |
Ageas | 51,300 | | 157,681 |
Anheuser-Busch InBev SA NV | 5,433 | | 340,453 |
Anheuser-Busch InBev SA NV (strip VVPR) (a) | 6,080 | | 25 |
Umicore SA | 4,564 | | 214,777 |
TOTAL BELGIUM | | 712,936 |
Bermuda - 0.4% |
Huabao International Holdings Ltd. | 62,000 | | 93,425 |
British Virgin Islands - 0.3% |
Playtech Ltd. | 9,825 | | 70,481 |
Canada - 1.6% |
First Quantum Minerals Ltd. | 1,400 | | 122,594 |
Niko Resources Ltd. | 500 | | 47,701 |
Petrobank Energy & Resources Ltd. (a) | 1,600 | | 63,677 |
Uranium One, Inc. (a) | 32,600 | | 133,290 |
TOTAL CANADA | | 367,262 |
Cayman Islands - 0.7% |
Hengdeli Holdings Ltd. | 284,000 | | 157,549 |
China - 1.3% |
Baidu.com, Inc. sponsored ADR (a) | 900 | | 99,009 |
China Merchants Bank Co. Ltd. (H Shares) | 48,000 | | 136,236 |
Home Inns & Hotels Management, Inc. sponsored ADR (a) | 1,300 | | 66,508 |
TOTAL CHINA | | 301,753 |
Denmark - 3.1% |
Carlsberg AS Series B | 1,700 | | 185,889 |
Novo Nordisk AS Series B | 3,147 | | 330,379 |
Novozymes AS Series B | 1,000 | | 133,231 |
Pandora A/S | 1,500 | | 72,773 |
TOTAL DENMARK | | 722,272 |
Finland - 1.1% |
Nokia Corp. | 23,550 | | 252,849 |
Common Stocks - continued |
| Shares | | Value |
France - 13.0% |
Accor SA | 4,462 | | $ 182,938 |
Alstom SA | 2,192 | | 110,595 |
Atos Origin SA (a) | 3,116 | | 144,056 |
BNP Paribas SA | 5,069 | | 370,649 |
Essilor International SA | 1,397 | | 93,266 |
Iliad Group SA | 1,650 | | 185,738 |
L'Oreal SA | 2,200 | | 258,242 |
LVMH Moet Hennessy - Louis Vuitton | 1,912 | | 299,567 |
Natixis SA (a) | 34,500 | | 211,558 |
PPR SA | 1,300 | | 213,087 |
Publicis Groupe SA | 3,300 | | 164,340 |
Remy Cointreau SA | 1,423 | | 99,913 |
Safran SA | 5,100 | | 161,656 |
Schneider Electric SA | 1,637 | | 232,336 |
Societe Generale Series A | 2,155 | | 129,014 |
Vallourec SA | 1,604 | | 166,432 |
TOTAL FRANCE | | 3,023,387 |
Germany - 6.5% |
Bayerische Motoren Werke AG (BMW) | 3,554 | | 254,728 |
Fresenius Medical Care AG & Co. KGaA | 2,200 | | 140,111 |
Linde AG | 1,133 | | 163,090 |
MAN SE | 2,262 | | 248,649 |
Rheinmetall AG | 1,800 | | 129,639 |
SAP AG | 2,911 | | 151,773 |
Siemens AG | 3,782 | | 431,943 |
TOTAL GERMANY | | 1,519,933 |
Italy - 1.5% |
Mediaset SpA | 21,100 | | 155,606 |
Saipem SpA | 4,218 | | 187,402 |
TOTAL ITALY | | 343,008 |
Netherlands - 2.5% |
AEGON NV (a) | 19,000 | | 120,387 |
ASML Holding NV (Netherlands) | 4,500 | | 149,137 |
ING Groep NV (Certificaten Van Aandelen) unit (a) | 14,700 | | 157,231 |
Randstad Holdings NV (a) | 3,153 | | 150,044 |
TOTAL NETHERLANDS | | 576,799 |
Norway - 2.4% |
Aker Solutions ASA | 5,400 | | 82,208 |
DnB NOR ASA | 11,800 | | 161,917 |
Common Stocks - continued |
| Shares | | Value |
Norway - continued |
Storebrand ASA (A Shares) (a) | 28,500 | | $ 207,258 |
Telenor ASA | 6,200 | | 99,942 |
TOTAL NORWAY | | 551,325 |
Qatar - 0.3% |
Commercial Bank of Qatar GDR (Reg. S) | 17,849 | | 81,787 |
Russia - 2.0% |
Magnit OJSC GDR (Reg. S) | 4,600 | | 123,004 |
Mechel Steel Group OAO sponsored ADR | 5,000 | | 117,750 |
OJSC MMC Norilsk Nickel sponsored ADR | 6,400 | | 119,360 |
Uralkali JSC GDR (Reg. S) | 4,800 | | 118,800 |
TOTAL RUSSIA | | 478,914 |
South Africa - 0.9% |
Clicks Group Ltd. | 31,999 | | 208,757 |
Spain - 4.8% |
Banco Santander SA | 40,891 | | 524,726 |
Gestevision Telecinco SA | 27,700 | | 353,287 |
Inditex SA | 2,853 | | 238,228 |
TOTAL SPAIN | | 1,116,241 |
Sweden - 3.9% |
Elekta AB (B Shares) | 1,800 | | 68,103 |
H&M Hennes & Mauritz AB (B Shares) | 7,374 | | 259,794 |
Modern Times Group MTG AB (B Shares) | 1,500 | | 107,557 |
Sandvik AB | 11,400 | | 171,812 |
SKF AB (B Shares) | 3,700 | | 95,524 |
Swedbank AB (A Shares) (a) | 15,005 | | 209,413 |
TOTAL SWEDEN | | 912,203 |
Switzerland - 9.5% |
Clariant AG (Reg.) (a) | 7,670 | | 129,658 |
Compagnie Financiere Richemont SA Series A | 4,622 | | 230,454 |
Julius Baer Group Ltd. | 2,170 | | 91,575 |
Nestle SA | 8,426 | | 461,382 |
Novartis AG | 9,515 | | 551,157 |
Schindler Holding AG (participation certificate) | 1,591 | | 170,519 |
The Swatch Group AG (Bearer) | 500 | | 191,040 |
Transocean Ltd. (a) | 1,000 | | 63,360 |
UBS AG (a) | 18,294 | | 310,675 |
TOTAL SWITZERLAND | | 2,199,820 |
Common Stocks - continued |
| Shares | | Value |
Turkey - 0.8% |
Boyner Buyuk Magazacilik AS (a) | 25,000 | | $ 58,217 |
Turkiye Garanti Bankasi AS | 21,000 | | 128,843 |
TOTAL TURKEY | | 187,060 |
United Kingdom - 30.0% |
Aegis Group PLC | 30,624 | | 61,674 |
AstraZeneca PLC (United Kingdom) | 2,934 | | 147,567 |
BG Group PLC | 17,699 | | 344,673 |
BHP Billiton PLC | 5,413 | | 191,732 |
BP PLC | 43,400 | | 294,960 |
BP PLC sponsored ADR | 12,500 | | 510,375 |
British Airways PLC (a)(d) | 44,600 | | 193,431 |
Britvic PLC | 13,700 | | 105,884 |
Burberry Group PLC | 11,400 | | 186,115 |
Capita Group PLC | 8,500 | | 104,384 |
Carphone Warehouse Group PLC | 28,950 | | 141,234 |
Fresnillo PLC | 8,200 | | 164,220 |
GlaxoSmithKline PLC | 22,700 | | 443,220 |
HSBC Holdings PLC sponsored ADR | 10,262 | | 534,753 |
ITV PLC (a) | 138,600 | | 151,555 |
Kazakhmys PLC | 4,200 | | 88,554 |
Kesa Electricals PLC | 31,400 | | 79,737 |
Lloyds Banking Group PLC (a) | 227,200 | | 249,690 |
Micro Focus International PLC | 18,400 | | 112,553 |
Misys PLC (a) | 26,100 | | 117,671 |
Morgan Crucible Co. PLC | 25,800 | | 94,658 |
Next PLC | 2,300 | | 84,201 |
Reckitt Benckiser Group PLC | 4,200 | | 234,910 |
Royal Dutch Shell PLC Class A (United Kingdom) | 23,017 | | 747,120 |
Sage Group PLC | 19,900 | | 85,892 |
Schroders PLC | 4,700 | | 118,900 |
Standard Chartered PLC (United Kingdom) | 10,738 | | 310,616 |
TalkTalk Telecom Group PLC (a) | 43,600 | | 92,137 |
Vodafone Group PLC | 216,500 | | 591,751 |
Wolfson Microelectronics PLC (a) | 26,100 | | 106,422 |
Xstrata PLC | 13,800 | | 267,416 |
TOTAL UNITED KINGDOM | | 6,958,005 |
United States of America - 2.8% |
Allergan, Inc. | 1,500 | | 108,615 |
Anadarko Petroleum Corp. | 1,400 | | 86,198 |
Apple, Inc. (a) | 400 | | 120,348 |
Common Stocks - continued |
| Shares | | Value |
United States of America - continued |
CF Industries Holdings, Inc. | 700 | | $ 85,771 |
Google, Inc. Class A (a) | 100 | | 61,299 |
Virgin Media, Inc. (d) | 7,300 | | 185,639 |
TOTAL UNITED STATES OF AMERICA | | 647,870 |
TOTAL COMMON STOCKS (Cost $19,694,713) | 22,308,584 |
Nonconvertible Preferred Stocks - 3.5% |
| | | |
Germany - 3.5% |
ProSiebenSat.1 Media AG | 14,200 | | 375,216 |
Volkswagen AG | 2,800 | | 420,774 |
TOTAL NONCONVERTIBLE PREFERRED STOCKS (Cost $513,231) | 795,990 |
Money Market Funds - 2.9% |
| | | |
Fidelity Cash Central Fund, 0.23% (b) | 333,865 | | 333,865 |
Fidelity Securities Lending Cash Central Fund, 0.24% (b)(c) | 342,135 | | 342,135 |
TOTAL MONEY MARKET FUNDS (Cost $676,000) | 676,000 |
TOTAL INVESTMENT PORTFOLIO - 102.5% (Cost $20,883,944) | | 23,780,574 |
NET OTHER ASSETS (LIABILITIES) - (2.5)% | | (570,806) |
NET ASSETS - 100% | $ 23,209,768 |
Legend |
(a) Non-income producing |
(b) Affiliated fund that is available only to investment companies and other accounts managed by Fidelity Investments. The rate quoted is the annualized seven-day yield of the fund at period end. A complete unaudited listing of the fund's holdings as of its most recent quarter end is available upon request. In addition, each Fidelity Central Fund's financial statements, which are not covered by the Fund's report of Independent Registered Public Accounting Firm, are available on the SEC's website or upon request. |
(c) Investment made with cash collateral received from securities on loan. |
(d) Security or a portion of the security is on loan at period end. |
Affiliated Central Funds |
Information regarding fiscal year to date income earned by the Fund from investments in Fidelity Central Funds is as follows: |
Fund | Income earned |
Fidelity Cash Central Fund | $ 450 |
Fidelity Securities Lending Cash Central Fund | 9,407 |
Total | $ 9,857 |
Other Information |
The following is a summary of the inputs used, as of October 31, 2010, involving the Fund's assets and liabilities carried at fair value. The inputs or methodology used for valuing securities may not be an indication of the risk associated with investing in those securities. For more information on valuation inputs, and their aggregation into the levels used in the table below, please refer to the Security Valuation section in the accompanying Notes to Financial Statements. |
Valuation Inputs at Reporting Date: |
Description | Total | Level 1 | Level 2 | Level 3 |
Investments in Securities: | | | | |
Equities: | | | | |
United Kingdom | $ 6,958,005 | $ 5,039,085 | $ 1,918,920 | $ - |
France | 3,023,387 | 3,023,387 | - | - |
Germany | 2,315,923 | 1,592,096 | 723,827 | - |
Switzerland | 2,199,820 | 1,337,988 | 861,832 | - |
Spain | 1,116,241 | 591,515 | 524,726 | - |
Sweden | 912,203 | 912,203 | - | - |
Denmark | 722,272 | 391,893 | 330,379 | - |
Belgium | 712,936 | 712,936 | - | - |
Bailiwick of Jersey | 667,011 | 491,264 | 175,747 | - |
Other | 4,476,776 | 3,797,172 | 679,604 | - |
Money Market Funds | 676,000 | 676,000 | - | - |
Total Investments in Securities: | $ 23,780,574 | $ 18,565,539 | $ 5,215,035 | $ - |
Income Tax Information |
At October 31, 2010, the Fund had a capital loss carryforward of approximately $19,126,506 of which $11,081,881 and $8,044,625 will expire on October 31, 2016 and 2017, respectively. Capital loss carryforwards are only available to offset future capital gains of the Fund to the extent provided by regulations and may be limited. |
See accompanying notes which are an integral part of the financial statements.
Annual Report
Statement of Assets and Liabilities
| October 31, 2010 |
| | |
Assets | | |
Investment in securities, at value (including securities loaned of $327,596) - See accompanying schedule: Unaffiliated issuers (cost $20,207,944) | $ 23,104,574 | |
Fidelity Central Funds (cost $676,000) | 676,000 | |
Total Investments (cost $20,883,944) | | $ 23,780,574 |
Foreign currency held at value (cost $262) | | 265 |
Receivable for investments sold | | 54,248 |
Receivable for fund shares sold | | 2,794 |
Dividends receivable | | 48,491 |
Distributions receivable from Fidelity Central Funds | | 462 |
Receivable from investment adviser for expense reductions | | 5,159 |
Other receivables | | 7,976 |
Total assets | | 23,899,969 |
| | |
Liabilities | | |
Payable for investments purchased | $ 200,260 | |
Payable for fund shares redeemed | 50,189 | |
Accrued management fee | 13,678 | |
Distribution and service plan fees payable | 9,516 | |
Other affiliated payables | 6,430 | |
Other payables and accrued expenses | 67,993 | |
Collateral on securities loaned, at value | 342,135 | |
Total liabilities | | 690,201 |
| | |
Net Assets | | $ 23,209,768 |
Net Assets consist of: | | |
Paid in capital | | $ 39,801,000 |
Undistributed net investment income | | 65,823 |
Accumulated undistributed net realized gain (loss) on investments and foreign currency transactions | | (19,538,320) |
Net unrealized appreciation (depreciation) on investments and assets and liabilities in foreign currencies | | 2,881,265 |
Net Assets | | $ 23,209,768 |
See accompanying notes which are an integral part of the financial statements.
Annual Report
Statement of Assets and Liabilities - continued
| October 31, 2010 |
| | |
Calculation of Maximum Offering Price Class A:
Net Asset Value and redemption price per share ($10,276,439 ÷ 875,292 shares) | | $ 11.74 |
| | |
Maximum offering price per share (100/94.25 of $11.74) | | $ 12.46 |
Class T:
Net Asset Value and redemption price per share ($7,495,557 ÷ 641,620 shares) | | $ 11.68 |
| | |
Maximum offering price per share (100/96.50 of $11.68) | | $ 12.10 |
Class B:
Net Asset Value and offering price per share ($1,935,324 ÷ 170,496 shares)A | | $ 11.35 |
| | |
Class C:
Net Asset Value and offering price per share ($3,166,392 ÷ 280,323 shares)A | | $ 11.30 |
| | |
Institutional Class:
Net Asset Value, offering price and redemption price per share ($336,056 ÷ 28,048 shares) | | $ 11.98 |
A Redemption price per share is equal to net asset value less any applicable contingent deferred sales charge.
See accompanying notes which are an integral part of the financial statements.
Annual Report
Financial Statements - continued
Statement of Operations
| Year ended October 31, 2010 |
| | |
Investment Income | | |
Dividends | | $ 534,770 |
Interest | | 5 |
Income from Fidelity Central Funds | | 9,857 |
Income before foreign taxes withheld | | 544,632 |
Less foreign taxes withheld | | (57,960) |
Total income | | 486,672 |
| | |
Expenses | | |
Management fee | $ 169,951 | |
Transfer agent fees | 77,941 | |
Distribution and service plan fees | 120,721 | |
Accounting and security lending fees | 12,630 | |
Custodian fees and expenses | 67,520 | |
Independent trustees' compensation | 137 | |
Registration fees | 56,048 | |
Audit | 50,421 | |
Legal | 130 | |
Miscellaneous | 313 | |
Total expenses before reductions | 555,812 | |
Expense reductions | (154,128) | 401,684 |
Net investment income (loss) | | 84,988 |
Realized and Unrealized Gain (Loss) Net realized gain (loss) on: | | |
Investment securities: | | |
Unaffiliated issuers | 331,258 | |
Foreign currency transactions | (9,206) | |
Total net realized gain (loss) | | 322,052 |
Change in net unrealized appreciation (depreciation) on: Investment securities | 1,504,855 | |
Assets and liabilities in foreign currencies | 2,278 | |
Total change in net unrealized appreciation (depreciation) | | 1,507,133 |
Net gain (loss) | | 1,829,185 |
Net increase (decrease) in net assets resulting from operations | | $ 1,914,173 |
See accompanying notes which are an integral part of the financial statements.
Annual Report
Statement of Changes in Net Assets
| Year ended
October 31,
2010 | Year ended
October 31,
2009 |
Increase (Decrease) in Net Assets | | |
Operations | | |
Net investment income (loss) | $ 84,988 | $ 334,809 |
Net realized gain (loss) | 322,052 | (7,981,840) |
Change in net unrealized appreciation (depreciation) | 1,507,133 | 12,335,064 |
Net increase (decrease) in net assets resulting
from operations | 1,914,173 | 4,688,033 |
Distributions to shareholders from net investment income | (281,171) | (713,757) |
Share transactions - net increase (decrease) | (4,178,483) | (4,078,182) |
Redemption fees | 436 | 558 |
Total increase (decrease) in net assets | (2,545,045) | (103,348) |
| | |
Net Assets | | |
Beginning of period | 25,754,813 | 25,858,161 |
End of period (including undistributed net investment income of $65,823 and undistributed net investment income of $271,133, respectively) | $ 23,209,768 | $ 25,754,813 |
See accompanying notes which are an integral part of the financial statements.
Annual Report
Financial Highlights - Class A
Years ended October 31, | 2010 | 2009 | 2008 | 2007 | 2006 |
Selected Per-Share Data | | | | | |
Net asset value, beginning of period | $ 10.82 | $ 8.98 | $ 20.94 | $ 17.49 | $ 13.47 |
Income from Investment Operations | | | | | |
Net investment income (loss) C | .06 | .15 | .25 | .32 | .19 F |
Net realized and unrealized gain (loss) | .99 | 1.99 | (9.22) | 4.48 | 4.18 |
Total from investment operations | 1.05 | 2.14 | (8.97) | 4.80 | 4.37 |
Distributions from net investment income | (.13) | (.30) | (.31) | (.12) | (.13) |
Distributions from net realized gain | - | - | (2.68) | (1.23) | (.22) |
Total distributions | (.13) | (.30) | (2.99) | (1.35) | (.35) |
Redemption fees added to paid in capital C, H | - | - | - | - | - |
Net asset value, end of period | $ 11.74 | $ 10.82 | $ 8.98 | $ 20.94 | $ 17.49 |
Total Return A, B | 9.74% | 25.27% | (49.77)% | 29.16% | 33.17% |
Ratios to Average Net Assets D, G | | | | | |
Expenses before reductions | 2.05% | 2.00% | 1.63% | 1.53% | 1.81% |
Expenses net of fee waivers, if any | 1.50% | 1.50% | 1.50% | 1.50% | 1.50% |
Expenses net of all reductions | 1.43% | 1.46% | 1.46% | 1.46% | 1.40% |
Net investment income (loss) | .61% | 1.73% | 1.65% | 1.69% | 1.16% F |
Supplemental Data | | | | | |
Net assets, end of period (000 omitted) | $ 10,276 | $ 10,904 | $ 10,286 | $ 29,273 | $ 18,972 |
Portfolio turnover rate E | 143% | 109% | 112% | 173% | 173% |
A Total returns would have been lower had certain expenses not been reduced during the periods shown.
B Total returns do not include the effect of the sales charges.
C Calculated based on average shares outstanding during the period.
D Fees and expenses of the underlying Fidelity Central Funds are not included in the Fund's expense ratio. The Fund indirectly bears its proportionate share of the expenses of any underlying Fidelity Central Funds.
E Amount does not include the portfolio activity of any underlying Fidelity Central Funds.
F Investment income per share reflects a special dividend which amounted to $.08 per share. Excluding the special dividend, the ratio of net investment income (loss) to average net assets would have been .68%.
G Expense ratios reflect operating expenses of the class. Expenses before reductions do not reflect amounts reimbursed by the investment adviser or reductions from brokerage service arrangements or reductions from other expense offset arrangements and do not represent the amount paid by the class during periods when reimbursements or reductions occur. Expenses net of fee waivers reflect expenses after reimbursement by the investment adviser but prior to reductions from brokerage service arrangements or other expense offset arrangements. Expenses net of all reductions represent the net expenses paid by the class.
H Amount represents less than $.01 per share.
See accompanying notes which are an integral part of the financial statements.
Annual Report
Financial Highlights - Class T
Years ended October 31, | 2010 | 2009 | 2008 | 2007 | 2006 |
Selected Per-Share Data | | | | | |
Net asset value, beginning of period | $ 10.78 | $ 8.92 | $ 20.75 | $ 17.35 | $ 13.34 |
Income from Investment Operations | | | | | |
Net investment income (loss) C | .04 | .13 | .21 | .27 | .14 F |
Net realized and unrealized gain (loss) | .97 | 1.99 | (9.17) | 4.44 | 4.17 |
Total from investment operations | 1.01 | 2.12 | (8.96) | 4.71 | 4.31 |
Distributions from net investment income | (.11) | (.26) | (.19) | (.08) | (.08) |
Distributions from net realized gain | - | - | (2.68) | (1.23) | (.22) |
Total distributions | (.11) | (.26) | (2.87) | (1.31) | (.30) |
Redemption fees added to paid in capital C, H | - | - | - | - | - |
Net asset value, end of period | $ 11.68 | $ 10.78 | $ 8.92 | $ 20.75 | $ 17.35 |
Total Return A, B | 9.42% | 24.99% | (49.91)% | 28.86% | 32.95% |
Ratios to Average Net Assets D, G | | | | | |
Expenses before reductions | 2.34% | 2.28% | 1.88% | 1.80% | 2.07% |
Expenses net of fee waivers, if any | 1.75% | 1.75% | 1.75% | 1.75% | 1.75% |
Expenses net of all reductions | 1.67% | 1.71% | 1.71% | 1.71% | 1.65% |
Net investment income (loss) | .36% | 1.48% | 1.40% | 1.44% | .91% F |
Supplemental Data | | | | | |
Net assets, end of period (000 omitted) | $ 7,496 | $ 8,014 | $ 7,866 | $ 21,357 | $ 24,643 |
Portfolio turnover rate E | 143% | 109% | 112% | 173% | 173% |
A Total returns would have been lower had certain expenses not been reduced during the periods shown.
B Total returns do not include the effect of the sales charges.
C Calculated based on average shares outstanding during the period.
D Fees and expenses of the underlying Fidelity Central Funds are not included in the Fund's expense ratio. The Fund indirectly bears its proportionate share of the expenses of any underlying Fidelity Central Funds.
E Amount does not include the portfolio activity of any underlying Fidelity Central Funds.
F Investment income per share reflects a special dividend which amounted to $.08 per share. Excluding the special dividend, the ratio of net investment income (loss) to average net assets would have been .43%.
G Expense ratios reflect operating expenses of the class. Expenses before reductions do not reflect amounts reimbursed by the investment adviser or reductions from brokerage service arrangements or reductions from other expense offset arrangements and do not represent the amount paid by the class during periods when reimbursements or reductions occur. Expenses net of fee waivers reflect expenses after reimbursement by the investment adviser but prior to reductions from brokerage service arrangements or other expense offset arrangements. Expenses net of all reductions represent the net expenses paid by the class.
H Amount represents less than $.01 per share.
See accompanying notes which are an integral part of the financial statements.
Annual Report
Financial Highlights - Class B
Years ended October 31, | 2010 | 2009 | 2008 | 2007 | 2006 |
Selected Per-Share Data | | | | | |
Net asset value, beginning of period | $ 10.48 | $ 8.61 | $ 20.16 | $ 16.91 | $ 12.98 |
Income from Investment Operations | | | | | |
Net investment income (loss) C | (.01) | .08 | .13 | .17 | .06 F |
Net realized and unrealized gain (loss) | .94 | 1.95 | (8.86) | 4.34 | 4.10 |
Total from investment operations | .93 | 2.03 | (8.73) | 4.51 | 4.16 |
Distributions from net investment income | (.06) | (.16) | (.14) | (.03) | (.01) |
Distributions from net realized gain | - | - | (2.68) | (1.23) | (.22) |
Total distributions | (.06) | (.16) | (2.82) | (1.26) | (.23) |
Redemption fees added to paid in capital C, H | - | - | - | - | - |
Net asset value, end of period | $ 11.35 | $ 10.48 | $ 8.61 | $ 20.16 | $ 16.91 |
Total Return A, B | 8.87% | 24.34% | (50.13)% | 28.29% | 32.49% |
Ratios to Average Net Assets D, G | | | | | |
Expenses before reductions | 2.82% | 2.77% | 2.39% | 2.31% | �� 2.69% |
Expenses net of fee waivers, if any | 2.25% | 2.25% | 2.25% | 2.25% | 2.25% |
Expenses net of all reductions | 2.18% | 2.21% | 2.21% | 2.21% | 2.15% |
Net investment income (loss) | (.14)% | .98% | .90% | .94% | .41% F |
Supplemental Data | | | | | |
Net assets, end of period (000 omitted) | $ 1,935 | $ 2,490 | $ 2,806 | $ 11,206 | $ 8,529 |
Portfolio turnover rate E | 143% | 109% | 112% | 173% | 173% |
A Total returns would have been lower had certain expenses not been reduced during the periods shown.
B Total returns do not include the effect of the contingent deferred sales charge.
C Calculated based on average shares outstanding during the period.
D Fees and expenses of the underlying Fidelity Central Funds are not included in the Fund's expense ratio. The Fund indirectly bears its proportionate share of the expenses of any underlying Fidelity Central Funds.
E Amount does not include the portfolio activity of any underlying Fidelity Central Funds.
F Investment income per share reflects a special dividend which amounted to $.07 per share. Excluding the special dividend, the ratio of net investment income (loss) to average net assets would have been (.07)%.
G Expense ratios reflect operating expenses of the class. Expenses before reductions do not reflect amounts reimbursed by the investment adviser or reductions from brokerage service arrangements or reductions from other expense offset arrangements and do not represent the amount paid by the class during periods when reimbursements or reductions occur. Expenses net of fee waivers reflect expenses after reimbursement by the investment adviser but prior to reductions from brokerage service arrangements or other expense offset arrangements. Expenses net of all reductions represent the net expenses paid by the class.
H Amount represents less than $.01 per share.
See accompanying notes which are an integral part of the financial statements.
Annual Report
Financial Highlights - Class C
Years ended October 31, | 2010 | 2009 | 2008 | 2007 | 2006 |
Selected Per-Share Data | | | | | |
Net asset value, beginning of period | $ 10.43 | $ 8.58 | $ 20.10 | $ 16.89 | $ 13.00 |
Income from Investment Operations | | | | | |
Net investment income (loss) C | (.01) | .08 | .13 | .17 | .06 F |
Net realized and unrealized gain (loss) | .94 | 1.94 | (8.82) | 4.32 | 4.07 |
Total from investment operations | .93 | 2.02 | (8.69) | 4.49 | 4.13 |
Distributions from net investment income | (.06) | (.17) | (.15) | (.05) | (.02) |
Distributions from net realized gain | - | - | (2.68) | (1.23) | (.22) |
Total distributions | (.06) | (.17) | (2.83) | (1.28) | (.24) |
Redemption fees added to paid in capital C, H | - | - | - | - | - |
Net asset value, end of period | $ 11.30 | $ 10.43 | $ 8.58 | $ 20.10 | $ 16.89 |
Total Return A, B | 8.92% | 24.29% | (50.11)% | 28.21% | 32.25% |
Ratios to Average Net Assets D, G | | | | | |
Expenses before reductions | 2.82% | 2.77% | 2.38% | 2.26% | 2.57% |
Expenses net of fee waivers, if any | 2.25% | 2.25% | 2.25% | 2.25% | 2.25% |
Expenses net of all reductions | 2.18% | 2.21% | 2.21% | 2.21% | 2.15% |
Net investment income (loss) | (.14)% | .98% | .90% | .94% | .41% F |
Supplemental Data | | | | | |
Net assets, end of period (000 omitted) | $ 3,166 | $ 3,913 | $ 4,522 | $ 16,084 | $ 9,173 |
Portfolio turnover rate E | 143% | 109% | 112% | 173% | 173% |
A Total returns would have been lower had certain expenses not been reduced during the periods shown.
B Total returns do not include the effect of the contingent deferred sales charge.
C Calculated based on average shares outstanding during the period.
D Fees and expenses of the underlying Fidelity Central Funds are not included in the Fund's expense ratio. The Fund indirectly bears its proportionate share of the expenses of any underlying Fidelity Central Funds.
E Amount does not include the portfolio activity of any underlying Fidelity Central Funds.
F Investment income per share reflects a special dividend which amounted to $.07 per share. Excluding the special dividend, the ratio of net investment income (loss) to average net assets would have been (.07)%.
G Expense ratios reflect operating expenses of the class. Expenses before reductions do not reflect amounts reimbursed by the investment adviser or reductions from brokerage service arrangements or reductions from other expense offset arrangements and do not represent the amount paid by the class during periods when reimbursements or reductions occur. Expenses net of fee waivers reflect expenses after reimbursement by the investment adviser but prior to reductions from brokerage service arrangements or other expense offset arrangements. Expenses net of all reductions represent the net expenses paid by the class.
H Amount represents less than $.01 per share.
See accompanying notes which are an integral part of the financial statements.
Annual Report
Financial Highlights - Institutional Class
Years ended October 31, | 2010 | 2009 | 2008 | 2007 | 2006 |
Selected Per-Share Data | | | | | |
Net asset value, beginning of period | $ 11.03 | $ 9.13 | $ 21.27 | $ 17.72 | $ 13.63 |
Income from Investment Operations | | | | | |
Net investment income (loss) B | .09 | .18 | .30 | .38 | .23 E |
Net realized and unrealized gain (loss) | 1.01 | 2.03 | (9.38) | 4.54 | 4.25 |
Total from investment operations | 1.10 | 2.21 | (9.08) | 4.92 | 4.48 |
Distributions from net investment income | (.15) | (.31) | (.38) | (.14) | (.17) |
Distributions from net realized gain | - | - | (2.68) | (1.23) | (.22) |
Total distributions | (.15) | (.31) | (3.06) | (1.37) | (.39) |
Redemption fees added to paid in capital B, G | - | - | - | - | - |
Net asset value, end of period | $ 11.98 | $ 11.03 | $ 9.13 | $ 21.27 | $ 17.72 |
Total Return A | 10.00% | 25.57% | (49.63)% | 29.57% | 33.68% |
Ratios to Average Net Assets C, F | | | | | |
Expenses before reductions | 1.80% | 1.68% | 1.27% | 1.19% | 1.46% |
Expenses net of fee waivers, if any | 1.25% | 1.25% | 1.25% | 1.19% | 1.25% |
Expenses net of all reductions | 1.17% | 1.21% | 1.21% | 1.15% | 1.15% |
Net investment income (loss) | .86% | 1.98% | 1.90% | 2.00% | 1.41% E |
Supplemental Data | | | | | |
Net assets, end of period (000 omitted) | $ 336 | $ 434 | $ 378 | $ 1,738 | $ 1,331 |
Portfolio turnover rate D | 143% | 109% | 112% | 173% | 173% |
A Total returns would have been lower had certain expenses not been reduced during the periods shown.
B Calculated based on average shares outstanding during the period.
C Fees and expenses of the underlying Fidelity Central Funds are not included in the Fund's expense ratio. The Fund indirectly bears its proportionate share of the expenses of any underlying Fidelity Central Funds.
D Amount does not include the portfolio activity of any underlying Fidelity Central Funds.
E Investment income per share reflects a special dividend which amounted to $.08 per share. Excluding the special dividend, the ratio of net investment income (loss) to average net assets would have been .93%.
F Expense ratios reflect operating expenses of the class. Expenses before reductions do not reflect amounts reimbursed by the investment adviser or reductions from brokerage service arrangements or reductions from other expense offset arrangements and do not represent the amount paid by the class during periods when reimbursements or reductions occur. Expenses net of fee waivers reflect expenses after reimbursement by the investment adviser but prior to reductions from brokerage service arrangements or other expense offset arrangements. Expenses net of all reductions represent the net expenses paid by the class.
G Amount represents less than $.01 per share.
See accompanying notes which are an integral part of the financial statements.
Annual Report
Notes to Financial Statements
For the period ended October 31, 2010
1. Organization.
Fidelity Advisor Europe Capital Appreciation Fund (the Fund) is a fund of Fidelity Advisor Series VIII (the Trust) and is authorized to issue an unlimited number of shares. The Trust is registered under the Investment Company Act of 1940, as amended (the 1940 Act), as an open-end management investment company organized as a Massachusetts business trust. The Fund offers Class A, Class T, Class C and Institutional Class shares, each of which has equal rights as to assets and voting privileges. Effective after the close of business on September 1, 2010, Class B shares were closed to new accounts and additional purchases by existing shareholders. Each class has exclusive voting rights with respect to matters that affect that class. Class B shares will automatically convert to Class A shares after a holding period of seven years from the initial date of purchase. Investment income, realized and unrealized capital gains and losses, the common expenses of the Fund, and certain fund-level expense reductions, if any, are allocated on a pro-rata basis to each class based on the relative net assets of each class to the total net assets of the Fund. Each class differs with respect to transfer agent and distribution and service plan fees incurred. Certain expense reductions also differ by class.
2. Investments in Fidelity Central Funds.
The Fund may invest in Fidelity Central Funds, which are open-end investment companies available only to other investment companies and accounts managed by Fidelity Management & Research Company (FMR) and its affiliates. The Fund's Schedule of Investments lists each of the Fidelity Central Funds held as of period end, if any, as an investment of the Fund, but does not include the underlying holdings of each Fidelity Central Fund. As an Investing Fund, the Fund indirectly bears its proportionate share of the expenses of the underlying Fidelity Central Funds.
The Money Market Central Funds seek preservation of capital and current income and are managed by Fidelity Investments Money Management, Inc. (FIMM), an affiliate of FMR.
A complete unaudited list of holdings for each Fidelity Central Fund is available upon request or at the Securities and Exchange Commission (the SEC) web site at www.sec.gov. In addition, the financial statements of the Fidelity Central Funds, which are not covered by the Fund's Report of Independent Registered Public Accounting Firm, are available on the SEC web site or upon request.
3. Significant Accounting Policies.
The financial statements have been prepared in conformity with accounting principles generally accepted in the United States of America (GAAP), which require management to make certain estimates and assumptions at the date of the financial statements. Actual results could differ from those estimates. The following summarizes the significant accounting policies of the Fund:
Annual Report
3. Significant Accounting Policies - continued
Security Valuation. Investments are valued as of 4:00 p.m. Eastern time on the last calendar day of the period. The Fund uses independent pricing services approved by the Board of Trustees to value its investments. When current market prices or quotations are not readily available or reliable, valuations may be determined in good faith in accordance with procedures adopted by the Board of Trustees. Factors used in determining value may include market or security specific events. The frequency with which these procedures are used cannot be predicted and they may be utilized to a significant extent. The value used for net asset value (NAV) calculation under these procedures may differ from published prices for the same securities.
The Fund categorizes the inputs to valuation techniques used to value its investments into a disclosure hierarchy consisting of three levels as shown below.
Level 1 - quoted prices in active markets for identical investments
Level 2 - other significant observable inputs (including quoted prices for similar investments, interest rates, prepayment speeds, etc.)
Level 3 - unobservable inputs (including the fund's own assumptions based on the best information available)
Changes in valuation techniques may result in transfers in or out of an assigned level within the disclosure hierarchy. The aggregate value of investments by input level, as of October 31, 2010 is included at the end of the Fund's Schedule of Investments. Valuation techniques used to value the Fund's investments by major category are as follows.
Equity securities, including restricted securities, for which market quotations are readily available, are valued at the last reported sale price or official closing price as reported by an independent pricing service on the primary market or exchange on which they are traded and are categorized as Level 1 in the hierarchy. In the event there were no sales during the day or closing prices are not available, securities are valued at the last quoted bid price or may be valued using the last available price and are generally categorized as Level 2 in the hierarchy. For foreign equity securities, when significant market or security specific events arise, comparisons to the valuation of American Depositary Receipts (ADRs), futures contracts, Exchange-traded funds (ETFs) and certain indexes as well as quoted prices for similar securities are used and are categorized as Level 2 in the hierarchy in these circumstances. Utilizing these techniques may result in transfers between Level 1 and Level 2. For restricted equity securities and private placements where observable inputs are limited, assumptions about market activity and risk are used and are categorized as Level 3 in the hierarchy.
Investments in open-end mutual funds, including the Fidelity Central Funds, are valued at their closing net asset value each business day and are categorized as Level 1 in the
Annual Report
Notes to Financial Statements - continued
3. Significant Accounting Policies - continued
Security Valuation - continued
hierarchy. Short-term securities with remaining maturities of sixty days or less for which quotations are not readily available are valued at amortized cost, which approximates fair value and are categorized as Level 2 in the hierarchy.
Foreign Currency. The Fund uses foreign currency contracts to facilitate transactions in foreign-denominated securities. Gains and losses from these transactions may arise from changes in the value of the foreign currency or if the counterparties do not perform under the contracts' terms.
Foreign-denominated assets, including investment securities, and liabilities are translated into U.S. dollars at the exchange rate at period end. Purchases and sales of investment securities, income and dividends received and expenses denominated in foreign currencies are translated into U.S. dollars at the exchange rate in effect on the transaction date.
The effects of exchange rate fluctuations on investments are included with the net realized and unrealized gain (loss) on investment securities. Other foreign currency transactions resulting in realized and unrealized gain (loss) are disclosed separately.
Investment Transactions and Income. For financial reporting purposes, the Fund's investment holdings and NAV include trades executed through the end of the last business day of the period. The NAV per share for processing shareholder transactions is calculated as of the close of business of the New York Stock Exchange (NYSE), normally 4:00 p.m. Eastern time and includes trades executed through the end of the prior business day. Gains and losses on securities sold are determined on the basis of identified cost and may include proceeds received from litigation. Dividend income is recorded on the ex-dividend date, except for certain dividends from foreign securities where the ex-dividend date may have passed, which are recorded as soon as the Fund is informed of the ex-dividend date. Non-cash dividends included in dividend income, if any, are recorded at the fair market value of the securities received. Distributions received on securities that represent a return of capital or capital gain are recorded as a reduction of cost of investments and/or as a realized gain. The Fund estimates the components of distributions received that may be considered return of capital distributions or capital gain distributions. Interest income and distributions from the Fidelity Central Funds are accrued as earned. Interest income includes coupon interest and amortization of premium and accretion of discount on debt securities. Investment income is recorded net of foreign taxes withheld where recovery of such taxes is uncertain.
Expenses. Most expenses of the Trust can be directly attributed to a fund. Expenses which cannot be directly attributed are apportioned amongst each fund in the Trust. Expense estimates are accrued in the period to which they relate and adjustments are made when actual amounts are known.
Annual Report
3. Significant Accounting Policies - continued
Income Tax Information and Distributions to Shareholders. Each year the Fund intends to qualify as a regulated investment company, including distributing substantially all of its taxable income and realized gains under Subchapter M of the Internal Revenue Code and filing its U.S. federal tax return. As a result, no provision for income taxes is required. As of October 31, 2010, the Fund did not have any unrecognized tax benefits in the accompanying financial statements. A fund's federal tax return is subject to examination by the Internal Revenue Service (IRS) for a period of three years. Foreign taxes are provided for based on the Fund's understanding of the tax rules and rates that exist in the foreign markets in which it invests.
Distributions are declared and recorded on the ex-dividend date. Income dividends and capital gain distributions are declared separately for each class. Income and capital gain distributions are determined in accordance with income tax regulations, which may differ from GAAP.
Capital accounts within the financial statements are adjusted for permanent book-tax differences. These adjustments have no impact on net assets or the results of operations. Temporary book-tax differences will reverse in a subsequent period.
Book-tax differences are primarily due to the short-term gain distributions from the Fidelity Central Funds, foreign currency transactions, capital loss carryforwards and losses deferred due to wash sales.
The federal tax cost of investment securities and unrealized appreciation (depreciation) as of period end were as follows:
Gross unrealized appreciation | $ 3,479,732 |
Gross unrealized depreciation | (994,917) |
Net unrealized appreciation (depreciation) | $ 2,484,815 |
| |
Tax Cost | $ 21,295,759 |
The tax-based components of distributable earnings as of period end were as follows:
Undistributed ordinary income | $ 65,823 |
Capital loss carryforward | $ (19,126,506) |
Net unrealized appreciation (depreciation) | $ 2,469,450 |
The tax character of distributions paid was as follows:
| October 31, 2010 | October 31, 2009 |
Ordinary Income | $ 281,171 | $ 713,757 |
Annual Report
Notes to Financial Statements - continued
3. Significant Accounting Policies - continued
Short-Term Trading (Redemption) Fees. Shares held by investors in the Fund less than 30 days are subject to a redemption fee equal to 1.00% of the net asset value of shares redeemed. All redemption fees, which reduce the proceeds of the shareholder redemption, are retained by the Fund and accounted for as an addition to paid in capital.
4. Purchases and Sales of Investments.
Purchases and sales of securities, other than short-term securities, aggregated $33,563,180 and $37,753,503, respectively.
5. Fees and Other Transactions with Affiliates.
Management Fee. FMR and its affiliates provide the Fund with investment management related services for which the Fund pays a monthly management fee. The management fee is the sum of an individual fund fee rate that is based on an annual rate of .45% of the Fund's average net assets and a group fee rate that averaged .26% during the period. The group fee rate is based upon the average net assets of all the mutual funds advised by FMR. The group fee rate decreases as assets under management increase and increases as assets under management decrease. For the period, the total annual management fee rate was .71% of the Fund's average net assets.
Distribution and Service Plan Fees. In accordance with Rule 12b-1 of the 1940 Act, the Fund has adopted separate Distribution and Service Plans for each class of shares. Certain classes pay Fidelity Distributors Corporation (FDC), an affiliate of FMR, separate Distribution and Service Fees, each of which is based on an annual percentage of each class' average net assets. In addition, FDC may pay financial intermediaries for selling shares of the Fund and providing shareholder support services. For the period, the Distribution and Service Fee rates, total fees and amounts retained by FDC were as follows:
| Distribution
Fee | Service
Fee | Total Fees | Retained
by FDC |
Class A | 0% | .25% | $ 25,560 | $ 117 |
Class T | .25% | .25% | 38,808 | 0 |
Class B | .75% | .25% | 21,598 | 16,277 |
Class C | .75% | .25% | 34,755 | 3,072 |
| | | $ 120,721 | $ 19,466 |
Sales Load. FDC receives a front-end sales charge of up to 5.75% for selling Class A shares, and 3.50% for selling Class T shares, some of which is paid to financial intermediaries for selling shares of the Fund. FDC receives the proceeds of contingent deferred sales charges levied on Class A, Class T, Class B, and Class C redemptions. These charges
Annual Report
5. Fees and Other Transactions with Affiliates - continued
Sales Load - continued
depend on the holding period. The deferred sales charges range from 5% to 1% for Class B, 1% for Class C, 1.00% for certain purchases of Class A shares (1.00% to .50% prior to July 12, 2010) and .25% for certain purchases of Class T shares.
For the period, sales charge amounts retained by FDC were as follows:
| Retained
by FDC |
Class A | $ 3,042 |
Class T | 1,572 |
Class B* | 3,926 |
Class C* | 534 |
| $ 9,074 |
* When Class B and Class C shares are initially sold, FDC pays commissions from its own resources to financial intermediaries through which the sales are made.
Transfer Agent Fees. Fidelity Investments Institutional Operations Company, Inc. (FIIOC), an affiliate of FMR, is the transfer, dividend disbursing and shareholder servicing agent for each class of the Fund. FIIOC receives account fees and asset-based fees that vary according to the account size and type of account of the shareholders of the respective classes of the Fund. FIIOC pays for typesetting, printing and mailing of shareholder reports, except proxy statements. For the period, transfer agent fees for each class were as follows:
| Amount | % of
Average
Net Assets |
Class A | $ 32,600 | .32 |
Class T | 26,299 | .34 |
Class B | 6,947 | .32 |
Class C | 11,137 | .32 |
Institutional Class | 958 | .28 |
| $ 77,941 | |
Accounting and Security Lending Fees. Fidelity Service Company, Inc. (FSC), an affiliate of FMR, maintains the Fund's accounting records. The accounting fee is based on the level of average net assets for the month. Under a separate contract, FSC administers the security lending program. The security lending fee is based on the number and duration of lending transactions.
Brokerage Commissions. The Fund placed a portion of its portfolio transactions with brokerage firms which are affiliates of the investment adviser. The commissions paid to these affiliated firms were $164 for the period.
Annual Report
Notes to Financial Statements - continued
6. Committed Line of Credit.
The Fund participates with other funds managed by FMR or an affiliate in a $3.75 billion credit facility (the "line of credit") to be utilized for temporary or emergency purposes to fund shareholder redemptions or for other short-term liquidity purposes. The Fund has agreed to pay commitment fees on its pro-rata portion of the line of credit, which amounted to $96 and is reflected in Miscellaneous expenses on the Statement of Operations. During the period, there were no borrowings on this line of credit.
7. Security Lending.
The Fund lends portfolio securities through a lending agent from time to time in order to earn additional income. The lending agent may loan securities to certain qualified borrowers, including Fidelity Capital Markets (FCM), a broker-dealer affiliated with the Fund. On the settlement date of the loan, the Fund receives collateral (in the form of U.S. Treasury obligations, letters of credit and/or cash) against the loaned securities and maintains collateral in an amount not less than 100% of the market value of the loaned securities during the period of the loan. The market value of the loaned securities is determined at the close of business of the Fund and any additional required collateral is delivered to the Fund on the next business day. If the borrower defaults on its obligation to return the securities loaned because of insolvency or other reasons, a fund could experience delays and costs in recovering the securities loaned or in gaining access to the collateral. Any cash collateral received is invested in the Fidelity Securities Lending Cash Central Fund. The value of loaned securities and cash collateral at period end are disclosed on the Fund's Statement of Assets and Liabilities. Security lending income represents the income earned on investing cash collateral, less rebates paid to borrowers and lending agent fees associated with the loan, plus any premium payments received for lending certain types of securities. Security lending income is presented in the Statement of Operations as a component of income from Fidelity Central Funds. Total security lending income during the period amounted to $9,407.
Annual Report
8. Expense Reductions.
FMR voluntarily agreed to reimburse each class to the extent annual operating expenses exceeded certain levels of average net assets as noted in the table below. Some expenses, for example interest expense, including commitment fees, are excluded from this reimbursement.
The following classes were in reimbursement during the period:
| Expense
Limitations | Reimbursement
from adviser |
Class A | 1.50% | $ 56,108 |
Class T | 1.75% | 46,246 |
Class B | 2.25% | 12,183 |
Class C | 2.25% | 19,521 |
Institutional Class | 1.25% | 1,897 |
| | $ 135,955 |
Effective November 1, 2010, the expense limitation will be changed to 1.45%, 1.70%, 2.20%, 2.20% and 1.20% for Class A, T, B, C and Institutional, respectively.
Many of the brokers with whom FMR places trades on behalf of the Fund provided services to the Fund in addition to trade execution. These services included payments of certain expenses on behalf of the Fund totaling $18,173 for the period.
9. Distributions to Shareholders.
Distributions to shareholders of each class were as follows:
Years ended October 31, | 2010 | 2009 |
From net investment income | | |
Class A | $ 132,405 | $ 340,910 |
Class T | 105,744 | 225,684 |
Class B | 13,563 | 51,025 |
Class C | 22,327 | 84,088 |
Institutional Class | 7,132 | 12,050 |
Total | $ 281,171 | $ 713,757 |
Annual Report
Notes to Financial Statements - continued
10. Share Transactions.
Transactions for each class of shares were as follows:
| Shares | Dollars |
Years ended October 31, | 2010 | 2009 | 2010 | 2009 |
Class A | | | | |
Shares sold | 127,568 | 177,631 | $ 1,411,611 | $ 1,639,370 |
Reinvestment of distributions | 10,457 | 39,468 | 119,629 | 302,323 |
Shares redeemed | (270,495) | (354,257) | (2,873,077) | (3,023,659) |
Net increase (decrease) | (132,470) | (137,158) | $ (1,341,837) | $ (1,081,966) |
Class T | | | | |
Shares sold | 285,617 | 87,906 | $ 3,265,728 | $ 796,657 |
Reinvestment of distributions | 8,986 | 28,519 | 102,440 | 218,168 |
Shares redeemed | (396,557) | (254,291) | (4,398,721) | (2,158,253) |
Net increase (decrease) | (101,954) | (137,866) | $ (1,030,553) | $ (1,143,428) |
Class B | | | | |
Shares sold | 16,071 | 34,740 | $ 167,235 | $ 327,679 |
Reinvestment of distributions | 1,085 | 6,019 | 12,073 | 44,965 |
Shares redeemed | (84,324) | (129,030) | (867,232) | (1,025,502) |
Net increase (decrease) | (67,168) | (88,271) | $ (687,924) | $ (652,858) |
Class C | | | | |
Shares sold | 36,176 | 42,669 | $ 385,078 | $ 369,138 |
Reinvestment of distributions | 1,719 | 9,756 | 19,047 | 72,489 |
Shares redeemed | (132,930) | (204,327) | (1,389,265) | (1,641,385) |
Net increase (decrease) | (95,035) | (151,902) | $ (985,140) | $ (1,199,758) |
Institutional Class | | | | |
Shares sold | 21,917 | 14,526 | $ 240,660 | $ 135,955 |
Reinvestment of distributions | 430 | 886 | 5,009 | 6,899 |
Shares redeemed | (33,643) | (17,475) | (378,698) | (143,026) |
Net increase (decrease) | (11,296) | (2,063) | $ (133,029) | $ (172) |
11. Other.
The Fund's organizational documents provide former and current trustees and officers with a limited indemnification against liabilities arising in connection with the performance of their duties to the Fund. In the normal course of business, the Fund may also enter into contracts that provide general indemnifications. The Fund's maximum exposure under these arrangements is unknown as this would be dependent on future claims that may be made against the Fund. The risk of material loss from such claims is considered remote.
Annual Report
To the Trustees of Fidelity Advisor Series VIII and Shareholders of Fidelity Advisor Europe Capital Appreciation Fund:
We have audited the accompanying statement of assets and liabilities of Fidelity Advisor Europe Capital Appreciation Fund (the Fund), a fund of Fidelity Advisor Series VIII, including the schedule of investments, as of October 31, 2010, and the related statement of operations for the year then ended, the statement of changes in net assets for each of the two years in the period then ended, and the financial highlights for each of the five years in the period then ended. These financial statements and financial highlights are the responsibility of the Fund's management. Our responsibility is to express an opinion on these financial statements and financial highlights based on our audits.
We conducted our audits in accordance with standards of the Public Company Accounting Oversight Board (United States). Those standards require that we plan and perform the audit to obtain reasonable assurance about whether the financial statements and financial highlights are free of material misstatement. The Fund is not required to have, nor were we engaged to perform, an audit of its internal control over financial reporting. Our audits included consideration of internal control over financial reporting as a basis for designing audit procedures that are appropriate in the circumstances, but not for the purpose of expressing an opinion on the effectiveness of the Fund's internal control over financial reporting. Accordingly, we express no such opinion. An audit also includes examining, on a test basis, evidence supporting the amounts and disclosures in the financial statements, assessing the accounting principles used and significant estimates made by management, as well as evaluating the overall financial statement presentation. Our procedures included confirmation of securities owned as of October 31, 2010, by correspondence with the custodians and brokers; where replies were not received from brokers, we performed other auditing procedures. We believe that our audits provide a reasonable basis for our opinion.
In our opinion, the financial statements and financial highlights referred to above present fairly, in all material respects, the financial position of Fidelity Advisor Europe Capital Appreciation Fund as of October 31, 2010, the results of its operations for the year then ended, the changes in its net assets for each of the two years in the period then ended, and the financial highlights for each of the five years in the period then ended, in conformity with accounting principles generally accepted in the United States of America.
/s/ Deloitte & Touche LLP
DELOITTE & TOUCHE LLP
Boston, Massachusetts
December 13, 2010
Annual Report
The Trustees, Member of the Advisory Board, and executive officers of the trust and fund, as applicable, are listed below. The Board of Trustees governs the fund and is responsible for protecting the interests of shareholders. The Trustees are experienced executives who meet periodically throughout the year to oversee the fund's activities, review contractual arrangements with companies that provide services to the fund, oversee management of the risks associated with such activities and contractual arrangements, and review the fund's performance. Except for James C. Curvey, each of the Trustees oversees 221 funds advised by FMR or an affiliate. Mr. Curvey oversees 410 funds advised by FMR or an affiliate.
The Trustees hold office without limit in time except that (a) any Trustee may resign; (b) any Trustee may be removed by written instrument, signed by at least two-thirds of the number of Trustees prior to such removal; (c) any Trustee who requests to be retired or who has become incapacitated by illness or injury may be retired by written instrument signed by a majority of the other Trustees; and (d) any Trustee may be removed at any special meeting of shareholders by a two-thirds vote of the outstanding voting securities of the trust. Each Trustee who is not an interested person (as defined in the 1940 Act) (Independent Trustee), shall retire not later than the last day of the calendar year in which his or her 72nd birthday occurs. The Independent Trustees may waive this mandatory retirement age policy with respect to individual Trustees. The executive officers and Advisory Board Member hold office without limit in time, except that any officer and Advisory Board Member may resign or may be removed by a vote of a majority of the Trustees at any regular meeting or any special meeting of the Trustees. Except as indicated, each individual has held the office shown or other offices in the same company for the past five years.
Experience, Skills, Attributes, and Qualifications of the Fund's Trustees. The Governance and Nominating Committee has adopted a statement of policy that describes the experience, qualifications, attributes, and skills that are necessary and desirable for potential Independent Trustee candidates (Statement of Policy). The Board believes that each Trustee satisfied at the time he or she was initially elected or appointed a Trustee, and continues to satisfy, the standards contemplated by the Statement of Policy. The Governance and Nominating Committee also engages professional search firms to help identify potential Independent Trustee candidates who have the experience, qualifications, attributes, and skills consistent with the Statement of Policy. From time to time, additional criteria based on the composition and skills of the current Independent Trustees, as well as experience or skills that may be appropriate in light of future changes to board composition, business conditions, and regulatory or other developments, have also been considered by the professional search firms and the Governance and Nominating Committee. In addition, the Board takes into account the Trustees' commitment and participation in Board and committee meetings, as well as their leadership of standing and ad hoc committees throughout their tenure.
In determining that a particular Trustee was and continues to be qualified to serve as a Trustee, the Board has considered a variety of criteria, none of which, in isolation, was controlling. The Board believes that, collectively, the Trustees have balanced and diverse experience, qualifications, attributes, and skills, which allow the Board to operate effectively in governing the fund and protecting the interests of shareholders. Information about the specific experience, skills, attributes, and qualifications of each Trustee, which in each case led to the Board's conclusion that the Trustee should serve (or continue to serve) as a trustee of the fund, is provided below.
Annual Report
Trustees and Officers - continued
Board Structure and Oversight Function. Edward C. Johnson 3d is an interested person (as defined in the 1940 Act) and currently serves as Chairman. The Trustees have determined that an interested Chairman is appropriate and benefits shareholders because an interested Chairman has a personal and professional stake in the quality and continuity of services provided to the fund. Independent Trustees exercise their informed business judgment to appoint an individual of their choosing to serve as Chairman, regardless of whether the Trustee happens to be independent or a member of management. The Independent Trustees have determined that they can act independently and effectively without having an Independent Trustee serve as Chairman and that a key structural component for assuring that they are in a position to do so is for the Independent Trustees to constitute a substantial majority for the Board. The Independent Trustees also regularly meet in executive session. Ned C. Lautenbach serves as Chairman of the Independent Trustees and as such (i) acts as a liaison between the Independent Trustees and management with respect to matters important to the Independent Trustees and (ii) with management prepares agendas for Board meetings.
Fidelity funds are overseen by different Boards of Trustees. The fund's Board oversees Fidelity's equity and high income funds and another Board oversees Fidelity's investment-grade bond, money market, and asset allocation funds. The asset allocation funds may invest in Fidelity funds overseen by the fund's Board. The use of separate Boards, each with its own committee structure, allows the Trustees of each group of Fidelity funds to focus on the unique issues of the funds they oversee, including common research, investment, and operational issues. On occasion, the separate Boards establish joint committees to address issues of overlapping consequences for the Fidelity funds overseen by each Board.
The Trustees operate using a system of committees to facilitate the timely and efficient consideration of all matters of importance to the Trustees, the fund, and fund shareholders and to facilitate compliance with legal and regulatory requirements and oversight of the fund's activities and associated risks. The Board, acting through its committees, has charged FMR and its affiliates with (i) identifying events or circumstances the occurrence of which could have demonstrably adverse effects on the fund's business and/or reputation; (ii) implementing processes and controls to lessen the possibility that such events or circumstances occur or to mitigate the effects of such events or circumstances if they do occur; and (iii) creating and maintaining a system designed to evaluate continuously business and market conditions in order to facilitate the identification and implementation processes described in (i) and (ii) above. Because the day-to-day operations and activities of the fund are carried out by or through FMR, its affiliates and other service providers, the fund's exposure to risks is mitigated but not eliminated by the processes overseen by the Trustees. While each of the Board's committees has responsibility for overseeing different aspects of the fund's activities, oversight is exercised primarily through the Operations, Audit, and Compliance Committees. Appropriate personnel, including but not limited to the fund's Chief Compliance Officer (CCO), FMR's internal auditor, the independent accountants, the fund's Treasurer and portfolio management personnel, make periodic reports to the Board's committees, as appropriate. The responsibilities of each committee, including their oversight responsibilities, are described further under "Standing Committees of the Fund's Trustees."
Annual Report
The fund's Statement of Additional Information (SAI) includes more information about the Trustees. To request a free copy, call Fidelity at 1-877-208-0098.
Interested Trustees*:
Correspondence intended for each Trustee who is an interested person may be sent to Fidelity Investments, 82 Devonshire Street, Boston, Massachusetts 02109.
Name, Age; Principal Occupations and Other Relevant Experience+ |
Edward C. Johnson 3d (80) |
| Year of Election or Appointment: 1983 Mr. Johnson is Trustee and Chairman of the Board of Trustees of certain Trusts. Mr. Johnson serves as Chief Executive Officer, Chairman, and a Director of FMR LLC; Chairman and a Director of FMR; Chairman and a Director of Fidelity Research & Analysis Company (FRAC); Chairman and a Director of Fidelity Investments Money Management, Inc.; and Chairman and a Director of FMR Co., Inc. In addition, Mr. Johnson serves as Chairman and Director of FIL Limited. Previously, Mr. Johnson served as President of FMR LLC (2006-2007). |
James C. Curvey (75) |
| Year of Election or Appointment: 2007 Mr. Curvey also serves as Trustee (2007-present) of other investment companies advised by FMR. Mr. Curvey is a Director of Fidelity Investments Money Management, Inc. (2009-present), Director of Fidelity Research & Analysis Co. (2009-present) and Director of FMR and FMR Co., Inc. (2007-present). Mr. Curvey is also Vice Chairman (2007-present) and Director of FMR LLC. In addition, Mr. Curvey serves as an Overseer for the Boston Symphony Orchestra and a member of the Trustees of Villanova University. Previously, Mr. Curvey was the Vice Chairman (2006-2007) and Director (2000-2007) of FMR Corp. |
* Trustees have been determined to be "Interested Trustees" by virtue of, among other things, their affiliation with the trust or various entities under common control with FMR.
+ The information above includes each Trustee's principal occupation during the last five years and other information relating to the experience, attributes, and skills relevant to each Trustee's qualifications to serve as a Trustee, which led to the conclusion that each Trustee should serve as a Trustee for the fund.
Independent Trustees:
Correspondence intended for each Independent Trustee (that is, the Trustees other than the Interested Trustees) may be sent to Fidelity Investments, P.O. Box 55235, Boston, Massachusetts 02205-5235.
Name, Age; Principal Occupations and Other Relevant Experience+ |
Dennis J. Dirks (62) |
| Year of Election or Appointment: 2005 Prior to his retirement in May 2003, Mr. Dirks was Chief Operating Officer and a member of the Board of The Depository Trust & Clearing Corporation (DTCC). He also served as President, Chief Operating Officer, and Board member of The Depository Trust Company (DTC) and President and Board member of the National Securities Clearing Corporation (NSCC). In addition, Mr. Dirks served as Chief Executive Officer and Board member of the Government Securities Clearing Corporation, Chief Executive Officer and Board member of the Mortgage-Backed Securities Clearing Corporation, as a Trustee and a member of the Finance Committee of Manhattan College (2005-2008), and as a Trustee and a member of the Finance Committee of AHRC of Nassau County (2006-2008). Mr. Dirks is a member of the Independent Directors Council (IDC) Governing Council (2010-Present) and Board of Directors for The Brookville Center for Children's Services, Inc. (2009-present). |
Alan J. Lacy (57) |
| Year of Election or Appointment: 2008 Mr. Lacy serves as Senior Adviser (2007-present) of Oak Hill Capital Partners, L.P. (private equity). Mr. Lacy also served as Chief Executive Officer (2000-2005) and Vice Chairman (2005-2006) of Sears Holdings Corporation and Sears, Roebuck and Co. (retail). In addition, Mr. Lacy serves as a member of the Board of Directors of The Western Union Company (global money transfer, 2006-present) and Bristol-Myers Squibb Company (global pharmaceuticals, 2007-present). Mr. Lacy is Chairman (2008-present) and a member (2006-present) of the Board of Trustees of The National Parks Conservation Association. |
Ned C. Lautenbach (66) |
| Year of Election or Appointment: 2000 Mr. Lautenbach is Chairman of the Independent Trustees of the Equity and High Income Funds (2006-present). Mr. Lautenbach currently serves as the Lead Director of the Eaton Corporation Board of Directors (diversified industrial, 1997-present). Mr. Lautenbach is also a member of the Board of Directors of the Philharmonic Center for the Arts in Naples, Florida (1999 - present); a member of the Board of Trustees of Fairfield University (2005-present); and a member of the Council on Foreign Relations (1994 - present). Previously, Mr. Lautenbach was a Partner/Advisory Partner at Clayton, Dubilier & Rice, Inc. (private equity investment, 1998-2010), as well as a Director of Sony Corporation (2006-2007). |
Joseph Mauriello (66) |
| Year of Election or Appointment: 2008 Prior to his retirement in January 2006, Mr. Mauriello served in numerous senior management positions including Deputy Chairman and Chief Operating Officer (2004-2005), and Vice Chairman of Financial Services (2002-2004) of KPMG LLP US (professional services, 1965-2005). Mr. Mauriello currently serves as a member of the Board of Directors of XL Group plc. (global insurance and re-insurance, 2006-present) and of Arcadia Resources Inc. (health care services and products, 2007-present). Previously, Mr. Mauriello served as a Director of the Hamilton Funds of the Bank of New York (2006-2007). |
Cornelia M. Small (66) |
| Year of Election or Appointment: 2005 Ms. Small is a member of the Board of Directors of the Teagle Foundation (2009-present). Ms. Small is also a member of the Investment Committee, and Chair (2008-present) and a member of the Board of Trustees of Smith College. In addition, Ms. Small serves on the Investment Committee of the Berkshire Taconic Community Foundation (2008-present). Previously, Ms. Small served as Chairperson of the Investment Committee (2002-2008) of Smith College. In addition, Ms. Small served as Chief Investment Officer, Director of Global Equity Investments, and a member of the Board of Directors of Scudder, Stevens & Clark and Scudder Kemper Investments. |
William S. Stavropoulos (71) |
| Year of Election or Appointment: 2001 Mr. Stavropoulos is Vice Chairman of the Independent Trustees of the Equity and High Income Funds (2006-present). Mr. Stavropoulos serves as President and Founder of the Michigan Baseball Foundation, the Great Lakes Loons (2007-present). Mr. Stavropoulos is Chairman Emeritus of the Board of Directors of The Dow Chemical Company, where he previously served in numerous senior management positions, including President, CEO (1995-2000; 2002-2004), Chairman of the Executive Committee (2000-2006), and as a member of the Board of Directors (1990-2006). Currently, Mr. Stavropoulos is Chairman of Univar (global distributor of commodity and specialty chemicals, 2010-present), a Director of Teradata Corporation (data warehousing and technology solutions, 2008-present), Chemical Financial Corporation, Maersk Inc. (industrial conglomerate), Tyco International, Inc. (multinational manufacturing and services, 2007-present), and a member of the Advisory Board for Metalmark Capital (private equity investment, 2005-present). Mr. Stavropoulos is a special advisor to Clayton, Dubilier & Rice, Inc. (private equity investment). In addition, Mr. Stavropoulos is a member of the University of Notre Dame Advisory Council for the College of Science. |
David M. Thomas (61) |
| Year of Election or Appointment: 2008 Previously, Mr. Thomas served as Executive Chairman (2005-2006) and Chairman and Chief Executive Officer (2000-2005) of IMS Health, Inc. (pharmaceutical and healthcare information solutions). In addition, Mr. Thomas serves as a member of the Board of Directors of Fortune Brands, Inc. (consumer products), and Interpublic Group of Companies, Inc. (marketing communication, 2004-present). |
Michael E. Wiley (60) |
| Year of Election or Appointment: 2008 Mr. Wiley also serves as a Director of Asia Pacific Exploration Consolidated (international oil and gas exploration and production, 2008-present). Mr. Wiley serves as a Director of Tesoro Corporation (independent oil refiner and marketer, 2005-present), and a Director of Bill Barrett Corporation (exploration and production, 2005-present). In addition, Mr. Wiley also serves as a Director of Post Oak Bank (privately-held bank, 2004-present). Previously, Mr. Wiley served as a member of the Board of Trustees of the University of Tulsa (2000-2006; 2007-2010), as a Senior Energy Advisor of Katzenbach Partners, LLC (consulting, 2006-2007), as an Advisory Director of Riverstone Holdings (private investment), Chairman, President, and CEO of Baker Hughes, Inc. (oilfield services, 2000-2004), and as Director of Spinnaker Exploration Company (exploration and production, 2001-2005). |
+ The information above includes each Trustee's principal occupation during the last five years and other information relating to the experience, attributes, and skills relevant to each Trustee's qualifications to serve as a Trustee, which led to the conclusion that each Trustee should serve as a Trustee for the fund.
Advisory Board Member and Executive Officers:
Correspondence intended for each executive officer and Peter S. Lynch may be sent to Fidelity Investments, 82 Devonshire Street, Boston, Massachusetts 02109.
Name, Age; Principal Occupation |
Peter S. Lynch (66) |
| Year of Election or Appointment: 2003 Member of the Advisory Board of Fidelity's Equity and High Income Funds. Mr. Lynch is Vice Chairman and a Director of FMR and FMR Co., Inc. In addition, Mr. Lynch serves as a Trustee of Boston College and as the Chairman of the Inner-City Scholarship Fund. Previously, Mr. Lynch served on the Special Olympics International Board of Directors (1997-2006). |
Kenneth B. Robins (41) |
| Year of Election or Appointment: 2008 President and Treasurer of Fidelity's Equity and High Income Funds. Mr. Robins also serves as President and Treasurer (2010-present) and Assistant Treasurer (2009-present) of other Fidelity funds and is an employee of Fidelity Investments (2004-present). Previously, Mr. Robins served as Deputy Treasurer of the Fidelity funds (2005-2008) and Treasurer and Chief Financial Officer of The North Carolina Capital Management Trust: Cash and Term Portfolios (2006-2008). |
Bruce T. Herring (45) |
| Year of Election or Appointment: 2006 Vice President of certain Equity Funds. Mr. Herring also serves as Chief Investment Officer and Director of Fidelity Management & Research (U.K.) Inc. (2010-present) and Group Chief Investments Officer of FMR. Previously, Mr. Herring served as Vice President (2005-2006) and Senior Vice President (2006-2007) of Fidelity Management & Research Company, Vice President of FMR Co., Inc. (2001-2007) and as a portfolio manager for Fidelity U.S. Equity Funds. |
Brian B. Hogan (46) |
| Year of Election or Appointment: 2009 Vice President of certain Equity Funds and Vice President of Sector Funds. Mr. Hogan also serves as President of FMR's Equity Division (2009-present). Previously, Mr. Hogan served as Senior Vice President, Equity Research of FMR (2006-2009) and as a portfolio manager. |
Scott C. Goebel (42) |
| Year of Election or Appointment: 2008 Secretary and Chief Legal Officer (CLO) of the Fidelity funds. Mr. Goebel also serves as Secretary and CLO of The North Carolina Capital Management Trust: Cash and Term Portfolio (2008-present); General Counsel, Secretary, and Senior Vice President of FMR (2008-present) and FMR Co., Inc. (2008-present); Deputy General Counsel of FMR LLC; Chief Legal Officer of Fidelity Management & Research (Hong Kong) Limited (2008-present) and Assistant Secretary of Fidelity Management & Research (Japan) Inc. (2008-present), Fidelity Investments Money Management, Inc. (2008-present), Fidelity Management & Research (U.K.) Inc. (2008-present), and Fidelity Research and Analysis Company (2008-present). Previously, Mr. Goebel served as Assistant Secretary of the Funds (2007-2008) and as Vice President and Secretary of Fidelity Distributors Corporation (FDC) (2005-2007). |
William C. Coffey (41) |
| Year of Election or Appointment: 2009 Assistant Secretary of Fidelity's Equity and High Income Funds. Mr. Coffey also serves as Senior Vice President and Deputy General Counsel of FMR LLC (2010-present), and is an employee of Fidelity Investments. Previously, Mr. Coffey served as Vice President and Associate General Counsel of FMR LLC (2005-2009). |
Holly C. Laurent (56) |
| Year of Election or Appointment: 2008 Anti-Money Laundering (AML) Officer of the Fidelity funds. Ms. Laurent also serves as AML Officer of The North Carolina Capital Management Trust: Cash and Term Portfolio (2008-present) and is an employee of Fidelity Investments. Previously, Ms. Laurent was Senior Vice President and Head of Legal for Fidelity Business Services India Pvt. Ltd. (2006-2008), and Senior Vice President, Deputy General Counsel and Group Head for FMR LLC (2005-2006). |
Christine Reynolds (52) |
| Year of Election or Appointment: 2008 Chief Financial Officer of the Fidelity funds. Ms. Reynolds became President of Fidelity Pricing and Cash Management Services (FPCMS) in August 2008. Ms. Reynolds served as Chief Operating Officer of FPCMS (2007-2008). Previously, Ms. Reynolds served as President, Treasurer, and Anti-Money Laundering officer of the Fidelity funds (2004-2007). |
Kenneth A. Rathgeber (63) |
| Year of Election or Appointment: 2004 Chief Compliance Officer of Fidelity's Equity and High Income Funds. Mr. Rathgeber is Chief Compliance Officer of Fidelity Management & Research (Hong Kong) Limited (2008-present), Fidelity Management & Research (Japan) Inc. (2008-present), FMR (2005-present), FMR Co., Inc. (2005-present), Fidelity Management & Research (U.K.) Inc. (2005-present), Fidelity Research & Analysis Company (2005-present), Fidelity Investments Money Management, Inc. (2005-present), Pyramis Global Advisors, LLC (2005-present), and Strategic Advisers, Inc. (2005-present). |
Jeffrey S. Christian (49) |
| Year of Election or Appointment: 2009 Deputy Treasurer of the Fidelity funds. Mr. Christian is an employee of Fidelity Investments. Previously, Mr. Christian served as Chief Financial Officer (2008-2009) of certain Fidelity funds and Senior Vice President of Fidelity Pricing and Cash Management Services (FPCMS) (2004-2009). |
Bryan A. Mehrmann (49) |
| Year of Election or Appointment: 2005 Deputy Treasurer of the Fidelity funds. Mr. Mehrmann is an employee of Fidelity Investments. |
Adrien E. Deberghes (43) |
| Year of Election or Appointment: 2008 Deputy Treasurer of Fidelity's Equity and High Income Funds. Mr. Deberghes also serves as Assistant Treasurer of other Fidelity funds (2010-present) and is an employee of Fidelity Investments (2008-present). Previously, Mr. Deberghes served as Senior Vice President of Mutual Fund Administration at State Street Corporation (2007-2008), Senior Director of Mutual Fund Administration at Investors Bank & Trust (2005-2007), and Director of Finance for Dunkin' Brands (2000-2005). |
Stephanie J. Dorsey (41) |
| Year of Election or Appointment: 2010 Assistant Treasurer of Fidelity's Equity and High Income Funds. Ms. Dorsey also serves as Deputy Treasurer of other Fidelity funds (2008-present) and is an employee of Fidelity Investments (2008-present). Previously, Ms. Dorsey served as Treasurer (2004-2008) of the JPMorgan Mutual Funds and Vice President (2004-2008) of JPMorgan Chase Bank. |
John R. Hebble (52) |
| Year of Election or Appointment: 2009 Assistant Treasurer of Fidelity's Equity and High Income Funds. Mr. Hebble also serves as Treasurer and Chief Financial Officer of The North Carolina Capital Management Trust: Cash and Term Portfolio (2008-present), President and Treasurer of other Fidelity funds (2008-present) and is an employee of Fidelity Investments. |
Gary W. Ryan (52) |
| Year of Election or Appointment: 2005 Assistant Treasurer of the Fidelity funds. Mr. Ryan is an employee of Fidelity Investments. Previously, Mr. Ryan served as Vice President of Fund Reporting in Fidelity Pricing and Cash Management Services (FPCMS) (1999-2005). |
Jonathan Davis (42) |
| Year of Election or Appointment: 2010 Assistant Treasurer of the Fidelity funds. Mr. Davis is an employee of Fidelity Investments. Previously, Mr. Davis served as Vice President and Associate General Counsel of FMR LLC (2003-2010). |
Annual Report
Institutional Class designates 100% of the dividends distributed during the fiscal year as amounts which may be taken into account as a dividend for purposes of the maximum rate under section 1(h)(11) of the Internal Revenue Code.
The amounts per share which represent income derived from sources within, and taxes paid to, foreign countries or possessions of the United States are as follows:
| Pay Date | Income | Taxes |
| 12/7/09 | $0.171 | $0.0216 |
The fund will notify shareholders in January 2011 of amounts for use in preparing 2010 income tax returns.
Annual Report
Board Approval of Investment Advisory Contracts and Management Fees
Fidelity Advisor Europe Capital Appreciation Fund
Each year, the Board of Trustees, including the Independent Trustees (together, the Board), votes on the renewal of the management contract and sub-advisory agreements (together, the Advisory Contracts) for the fund. The Board, assisted by the advice of fund counsel and Independent Trustees' counsel, requests and considers a broad range of information relevant to the renewal of the Advisory Contracts throughout the year.
The Board meets regularly and considers at each of its meetings factors that are relevant to its annual consideration of the renewal of the fund's Advisory Contracts, including the services and support provided to the fund and its shareholders. The Board has established various standing committees, each composed of Independent Trustees with varying backgrounds, to which the Board has assigned specific subject matter responsibilities in order to enhance effective decision-making by the Board. The Board, acting directly and through its Committees, requests and receives information concerning the annual consideration of the renewal of the fund's Advisory Contracts. The Board also meets as needed to consider matters specifically related to the Board's annual consideration of the renewal of Advisory Contracts. Members of the Board may also meet with trustees of other Fidelity funds through ad hoc joint committees to discuss certain matters relevant to the Fidelity funds.
At its July 2010 meeting, the Board of Trustees, including the Independent Trustees, unanimously determined to renew the fund's Advisory Contracts. In reaching its determination, the Board considered all factors it believed relevant, including (i) the nature, extent, and quality of the services to be provided to the fund and its shareholders (including the investment performance of the fund); (ii) the competitiveness of the fund's management fee and total expenses; (iii) the total costs of the services to be provided by and the profits to be realized by Fidelity from its relationship with the fund; (iv) the extent to which economies of scale would be realized as the fund grows; and (v) whether fee levels reflect these economies of scale, if any, for the benefit of fund shareholders.
In considering whether to renew the Advisory Contracts for the fund, the Board reached a determination, with the assistance of fund counsel and Independent Trustees' counsel and through the exercise of its business judgment, that the renewal of the Advisory Contracts is in the best interests of fund shareholders and that the compensation to be received by Fidelity under the management contract is fair and reasonable. The Board's decision to renew the Advisory Contracts was not based on any single factor noted above, but rather was based on a comprehensive consideration of all the information provided to the Board at its meetings throughout the year. The Board, in reaching its determination to renew the Advisory Contracts, is aware that shareholders in the fund have a broad range of investment choices available to them, including a wide choice among mutual funds offered by Fidelity's competitors, and that the fund's shareholders, with the opportunity to review and weigh the disclosure provided by the fund in its prospectus and other public disclosures, have chosen to invest in this fund, managed by Fidelity.
Annual Report
Board Approval of Investment Advisory Contracts and
Management Fees - continued
Nature, Extent, and Quality of Services Provided. The Board considered the staffing within the investment adviser, FMR, and the sub-advisers (together, the Investment Advisers), including the backgrounds of the fund's investment personnel and the fund's investment objective and discipline. The Independent Trustees also had discussions with senior management of Fidelity's investment operations and investment groups. The Board considered the structure of the portfolio manager compensation program and whether this structure provides appropriate incentives to act in the best interest of the fund.
Resources Dedicated to Investment Management and Support Services. The Board and the equity research subcommittee of the Board's Fund Oversight Committee reviewed the size, education, and experience of the Investment Advisers' investment staff, their use of technology, and the Investment Advisers' approach to recruiting, training, and retaining portfolio managers and other research, advisory, and management personnel. The Board noted that Fidelity's analysts have access to a variety of technological tools and market and securities data that enable them to perform both fundamental and quantitative analysis and to specialize in various disciplines. The Board considered Fidelity's extensive global research capabilities that enable the Investment Advisers to aggregate data from various sources in an effort to produce positive investment results. The Board also considered that Fidelity's portfolio managers and analysts have access to daily portfolio attribution that allows for monitoring of a fund's portfolio, as well as an electronic communication system that provides immediate real-time access to research concerning issuers and credit enhancers. The Board noted FMR's continued focus on strengthening the organization and discipline of equity portfolio management and research.
Shareholder and Administrative Services. The Board considered (i) the nature, extent, quality, and cost of advisory, administrative, and shareholder services performed by the Investment Advisers and their affiliates under the Advisory Contracts and under separate agreements covering transfer agency, pricing and bookkeeping, and securities lending services for the fund; (ii) the nature and extent of the investment adviser's supervision of third party service providers, principally custodians and subcustodians; and (iii) the resources devoted to, and the record of compliance with, the fund's compliance policies and procedures. The Board also reviewed the allocation of fund brokerage, including allocations to brokers affiliated with the Investment Advisers, the use of brokerage commissions to pay fund expenses, and the use of "soft" commission dollars to pay for research services.
The Board noted that the growth of fund assets over time across the complex allows Fidelity to reinvest in the development of services designed to enhance the value or convenience of the Fidelity funds as investment vehicles. These services include 24-hour access to account information and market information through phone representatives and over the Internet, and investor education materials and asset allocation tools.
Annual Report
Investment in a Large Fund Family. The Board considered the benefits to shareholders of investing in a Fidelity fund, including the benefits of investing in a fund that is part of a large family of funds offering a variety of investment disciplines and providing a large variety of mutual fund investor services. The Board noted that Fidelity had taken, or had made recommendations that resulted in the Fidelity funds taking, a number of actions over the previous year that benefited particular funds, including (i) dedicating additional resources to investment research and restructuring and broadening the focus of the investment research teams; (ii) bolstering the senior management team that oversees asset management; (iii) launching Class F of certain funds as a lower-fee class available to Freedom K and Freedom Index Funds; (iv) lowering the initial investment minimums and ongoing balance requirements for Real Estate High Income Fund; (v) eliminating subsequent purchase minimums for all funds and adding a waiver of the investment minimum requirement for new accounts opened with the proceeds of a systematic withdrawal plan; (vi) eliminating the withdrawal minimum and maximum limits for systematic withdrawals from Advisor funds; (vii) expanding sales load waivers on Class A shares for Destiny Planholders and expanding Institutional Class eligibility for Class O Destiny Planholders; and (viii) changing certain Class A and Class T sales charge structures to further align them with industry practices.
Investment Performance. The Board considered whether the fund has operated in accordance with its investment objective, as well as its record of compliance with its investment restrictions. It also reviewed the fund's absolute investment performance for each class, as well as the fund's relative investment performance for each class measured over multiple periods against (i) a broad-based securities market index, and (ii) a peer group of mutual funds deemed appropriate by Fidelity and reviewed by the Board. The following charts considered by the Board show, over the one-, three-, and five-year periods ended December 31, 2009, the cumulative total returns of Institutional Class (Class I) and Class C of the fund, the cumulative total returns of a broad-based securities market index ("benchmark"), and a range of cumulative total returns of a peer group of mutual funds identified by Morningstar, Inc. as having an investment style similar to that of the fund based on underlying portfolio holdings. The returns of Institutional Class (Class I) and Class C show the performance of the highest and lowest performing classes, respectively (based on five-year performance). The box within each chart shows the 25th percentile return (bottom of box) and the 75th percentile return (top of box) of the peer group. Returns shown above the box are in the first quartile and returns shown below the box are in the fourth quartile. The percentage beaten numbers noted below each chart correspond to the percentile box and represent the percentage of funds in the peer group whose performance was equal to or lower than that of the class indicated.
Annual Report
Board Approval of Investment Advisory Contracts and
Management Fees - continued
Fidelity Advisor Europe Capital Appreciation Fund
The Board reviewed the fund's relative investment performance against its peer group and noted that the performance of Institutional Class (Class I) of the fund was in the second quartile for the one- and five-year periods and the third quartile for the three-year period. The Board also noted that the investment performance of the fund was lower than its benchmark for the one- and three-year periods, although the five-year cumulative total return of Institutional Class (Class I) compared favorably to its benchmark. The Board considered that the variations in performance among the fund's classes reflect the variations in class expenses, which result in lower performance for higher expense classes. The Board also reviewed the fund's performance since inception as well as performance in the current year.
Based on its review, and giving particular weight to the nature and quality of the resources dedicated by the Investment Advisers to maintain and improve relative performance and factoring in the unprecedented market events in recent years, the Board concluded that the nature, extent, and quality of investment management and support services and of shareholder and administrative services provided to the fund will benefit the fund's shareholders, particularly in light of the Board's view that the fund's shareholders benefit from investing in a fund that is part of a large family of funds offering a variety of investment disciplines and services.
Competitiveness of Management Fee and Total Fund Expenses. The Board considered the fund's management fee and total expenses compared to "mapped groups" of competitive funds and classes. Fidelity creates "mapped groups" by combining similar Lipper investment objective categories that have comparable management fee characteristics. Combining Lipper investment objective categories aids the Board's management fee and total expense comparisons by broadening the competitive group used for comparison and by reducing the number of universes to which various Fidelity funds are compared.
Annual Report
Management Fee. The Board considered two proprietary management fee comparisons for the 12-month periods shown in the chart below. The group of Lipper funds used by the Board for management fee comparisons is referred to below as the "Total Mapped Group." The Total Mapped Group comparison focuses on a fund's standing relative to the total universe of comparable funds available to investors, in terms of gross management fees before expense reimbursements or caps. "TMG %" represents the percentage of funds in the Total Mapped Group that had management fees that were lower than the fund's. For example, a TMG % of 15% means that 85% of the funds in the Total Mapped Group had higher management fees than the fund. The "Asset-Size Peer Group" (ASPG) comparison focuses on a fund's standing relative to non-Fidelity funds similar in size to the fund within the Total Mapped Group. The ASPG represents at least 15% of the funds in the Total Mapped Group with comparable asset size and management fee characteristics, subject to a minimum of 50 funds (or all funds in the Total Mapped Group if fewer than 50). Additional information, such as the ASPG quartile in which the fund's management fee ranked, is also included in the chart and considered by the Board.
Fidelity Advisor Europe Capital Appreciation Fund
The Board noted that the fund's management fee ranked below the median of its Total Mapped Group and below the median of its ASPG for 2009.
Annual Report
Board Approval of Investment Advisory Contracts and
Management Fees - continued
Based on its review, the Board concluded that the fund's management fee is fair and reasonable in light of the services that the fund receives and the other factors considered.
Total Expenses. In its review of each class's total expenses, the Board considered the fund's management fee as well as other fund or class expenses, as applicable, such as transfer agent fees, pricing and bookkeeping fees, fund-paid 12b-1 fees, and custodial, legal, and audit fees. The Board also noted the effects of any waivers and reimbursements on fees and expenses. As part of its review, the Board also considered current and historical total expenses of each class of the fund compared to competitive fund median expenses. Each class of the fund is compared to those funds and classes in the Total Mapped Group (used by the Board for management fee comparisons) that have a similar sales load structure.
The Board noted that the total expenses of Class A ranked below its competitive median for 2009, the total expenses of Class B ranked equal to its competitive median for 2009, and the total expenses of each of Class T, Class C, and Institutional Class ranked above its competitive median for 2009. The Board considered that the total expenses for Class T were above the median primarily because its 12b-1 fee is higher than the typical front-end load class. The Board noted that the fund offers multiple classes, each of which has a different sales load and 12b-1 fee structure, and that the multiple structures are intended to offer a range of pricing options for the intermediary market. The Board also noted that the total expenses of the classes vary primarily by the level of their 12b-1 fees, although differences in transfer agent fees may also cause expenses to vary from class to class.
Fees Charged to Other Fidelity Clients. The Board also considered Fidelity fee structures and other information with respect to clients of FMR and its affiliates, such as other mutual funds advised or subadvised by FMR or its affiliates, pension plan clients, and other institutional clients. In March 2010, the Board created an ad hoc joint committee with the board of other Fidelity funds (the Committee) to review and compare Fidelity's institutional investment advisory business with its business of providing services to the Fidelity funds, including the differences in services provided, fees charged, and costs incurred, as well as competition in their respective marketplaces.
Based on its review of total expenses and fees charged to other Fidelity clients, the Board concluded that the total expenses of each class of the fund were reasonable, although in some cases above the median of the universe presented for comparison, in light of the services that the fund and its shareholders receive and the other factors considered, including the findings of the Committee.
Costs of the Services and Profitability. The Board considered the revenues earned and the expenses incurred by Fidelity in conducting the business of developing, marketing, distributing, managing, administering and servicing the fund and its shareholders. The Board also considered the level of Fidelity's profits in respect of all the Fidelity funds.
Annual Report
On an annual basis, FMR presents to the Board Fidelity's profitability for the fund. Fidelity calculates the profitability for each fund, as well as aggregate profitability for groups of Fidelity funds and all Fidelity funds, using a series of detailed revenue and cost allocation methodologies which originate with the audited books and records of Fidelity. The Audit Committee of the Board reviews any significant changes from the prior year's methodologies.
PricewaterhouseCoopers LLP (PwC), independent registered public accounting firm and auditor to Fidelity and certain Fidelity funds, has been engaged annually by the Board as part of the Board's assessment of Fidelity's profitability analysis. PwC's engagement includes the review and assessment of Fidelity's methodologies used in determining the revenues and expenses attributable to Fidelity's mutual fund business, and completion of agreed-upon procedures surrounding the mathematical accuracy of fund profitability and its conformity to allocation methodologies. After considering PwC's reports issued under the engagement and information provided by Fidelity, the Board believes that while other allocation methods may also be reasonable, Fidelity's profitability methodologies are reasonable in all material respects.
The Board has also reviewed Fidelity's non-fund businesses and fall-out benefits related to the mutual fund business as well as cases where Fidelity's affiliates may benefit from or be related to the fund's business.
The Board considered the costs of the services provided by and the profits realized by Fidelity in connection with the operation of the fund and were satisfied that the profitability was not excessive in the circumstances.
Economies of Scale. The Board considered whether there have been economies of scale in respect of the management of the Fidelity funds, whether the Fidelity funds (including the fund) have appropriately benefited from any such economies of scale, and whether there is potential for realization of any further economies of scale. The Board considered the extent to which the fund will benefit from economies of scale through increased services to the fund, through waivers or reimbursements, or through fee or expense reductions.
In February 2009, the Board and the board of other Fidelity funds created an ad hoc committee (the Economies of Scale Committee) to analyze whether FMR attains economies of scale in respect of the management and servicing of the Fidelity funds, whether the Fidelity funds have appropriately benefited from such economies of scale, and whether there is potential for realization of any further economies of scale.
The Board recognized that the fund's management contract incorporates a "group fee" structure, which provides for lower group fee rates as total fund assets under FMR's management increase, and for higher group fee rates as total fund assets under FMR's management decrease. FMR calculates the group fee rates based on a tiered asset "breakpoint" schedule that varies based on asset class. The Board considered that the group fee is designed to deliver the benefits of economies of scale to fund shareholders when total Fidelity fund assets increase, even if assets of any particular fund are unchanged or have declined, because some portion of Fidelity's costs are attributable to services provided to all Fidelity funds, and all funds benefit if those costs can be allocated among more assets. The Board concluded that, given the group fee structure, fund shareholders will benefit from lower management fees as assets under FMR's management increase at the fund complex level, regardless of whether Fidelity achieves any such economies of scale.
Annual Report
Board Approval of Investment Advisory Contracts and
Management Fees - continued
The Board concluded, considering the findings of the Economies of Scale Committee, that any potential economies of scale are being appropriately shared between fund shareholders and Fidelity.
Additional Information Requested by the Board. In order to develop fully the factual basis for consideration of the Fidelity funds' Advisory Contracts, the Board requested and received additional information on certain topics, including (i) fund performance trends, actions to be taken by FMR to improve certain funds' overall performance, and Fidelity's long-term strategies for certain funds; (ii) portfolio manager changes that have occurred during the past year and length of portfolio manager tenure for different categories of funds over time; (iii) Fidelity's compensation structure for portfolio managers, research analysts, and other key personnel, the rationale for the compensation structure, and how the compensation structure provides appropriate performance incentives; (iv) the amount of the investment that each portfolio manager has made in the Fidelity fund(s) that he or she manages; (v) management and other fees paid by FMR to affiliated sub-advisers on behalf of the Fidelity funds; (vi) Fidelity's fee structures and rationale for recommending different fees among different categories of funds; (vii) Fidelity's rationale for recommending which funds should have a performance adjustment component as part of their management fees; (viii) the rationale for any differences between fund fee structures and fee structures in place for other Fidelity clients; and (ix) explanations regarding the relative total expenses borne by certain funds and classes, total expense competitive trends, and actions that might be taken by FMR to reduce total expenses for certain funds and classes.
Based on its evaluation of all of the conclusions noted above, and after considering all factors it believed relevant, the Board ultimately concluded that the advisory fee structures are fair and reasonable, and that the fund's Advisory Contracts should be renewed.
Annual Report
Investment Adviser
Fidelity Management & Research Company
Boston, MA
Investment Sub-Advisers
FMR Co., Inc.
Fidelity Management & Research
(U.K.) Inc.
Fidelity Research & Analysis Company
FIL Investment Advisors
FIL Investment Advisors (U.K.) Limited
Fidelity Management & Research
(Hong Kong) Limited
Fidelity Management & Research
(Japan) Inc.
General Distributor
Fidelity Distributors Corporation
Boston, MA
Transfer and Service Agents
Fidelity Investments Institutional Operations Company, Inc.
Boston, MA
Fidelity Service Company, Inc.
Boston, MA
Custodian
State Street Bank and Trust Company
Quincy, MA
AEURI-UANN-1210
1.784740.107
(Fidelity Investment logo)(registered trademark)
Fidelity AdvisorSM
Global Capital Appreciation
Fund - Class A, Class T, Class B
and Class C
Annual Report
October 31, 2010
(2_fidelity_logos) (Registered_Trademark)
Contents
Chairman's Message | <Click Here> | The Chairman's message to shareholders. |
Performance | <Click Here> | How the fund has done over time. |
Management's Discussion
of Fund Performance | <Click Here> | The Portfolio Manager's review of fund performance, strategy and outlook. |
Shareholder Expense Example | <Click Here> | An example of shareholder expenses. |
Investment Changes | <Click Here> | A summary of major shifts in the fund's investments over the past six months. |
Investments | <Click Here> | A complete list of the fund's investments with their market values. |
Financial Statements | <Click Here> | Statements of assets and liabilities, operations, and changes in net assets, as well as financial highlights. |
Notes | <Click Here> | Notes to financial statements. |
Report of Independent Registered Public Accounting Firm | <Click Here> | |
Trustees and Officers | <Click Here> | |
Distributions | <Click Here> | |
Board Approval of Investment Advisory Contracts and Management Fees | <Click Here> | |
To view a fund's proxy voting guidelines and proxy voting record for the 12-month period ended June 30, visit http://www.fidelity.com/proxyvotingresults or visit the Securities and Exchange Commission's (SEC) web site at http://www.sec.gov. You may also call 1-877-208-0098 to request a free copy of the proxy voting guidelines.
Standard & Poor's, S&P and S&P 500 are registered service marks of The McGraw-Hill Companies, Inc. and have been licensed for use by Fidelity Distributors Corporation.
Other third party marks appearing herein are the property of their respective owners.
All other marks appearing herein are registered or unregistered trademarks or service marks of FMR LLC or an affiliated company.
Annual Report
This report and the financial statements contained herein are submitted for the general information of the shareholders of the fund. This report is not authorized for distribution to prospective investors in the fund unless preceded or accompanied by an effective prospectus.
A fund files its complete schedule of portfolio holdings with the SEC for the first and third quarters of each fiscal year on Form N-Q. Forms N-Q are available on the SEC's web site at http://www.sec.gov. A fund's Forms N-Q may be reviewed and copied at the SEC's Public Reference Room in Washington, DC. Information regarding the operation of the SEC's Public Reference Room may be obtained by calling 1-800-SEC-0330. For a complete list of a fund's portfolio holdings, view the most recent holdings listing, semiannual report, or annual report on Fidelity's web site at http://www.fidelity.com or http://www.advisor.fidelity.com, as applicable.
NOT FDIC INSURED • MAY LOSE VALUE • NO BANK GUARANTEE
Neither the fund nor Fidelity Distributors Corporation is a bank.
Annual Report
(photo_of_Edward_C_Johnson_3d)
Dear Shareholder:
Equities have staged a rally in the second half of 2010, shaking off concerns about the European debt crisis and the possibility of a double-dip recession in the U.S. Although the short-term surge pushed major equity indexes back into positive territory for the year, several questions remain about the longer-term outlook, including lackluster economic growth and persistently high unemployment. Financial markets are always unpredictable, of course, but there also are several time-tested investment principles that can help put the odds in your favor.
One of the basic tenets is to invest for the long term. Over time, riding out the markets' inevitable ups and downs has proven much more effective than selling into panic or chasing the hottest trend. Even missing only a few of the markets' best days can significantly diminish investor returns. Patience also affords the benefits of compounding - of earning interest on additional income or reinvested dividends and capital gains. There can be tax advantages and cost benefits to consider as well. While staying the course doesn't eliminate risk, it can considerably lessen the effect of short-term declines.
You can further manage your investing risk through diversification. And today, more than ever, geographic diversification should be taken into account. Studies indicate that asset allocation is the single most important determinant of a portfolio's long-term success. The right mix of stocks, bonds and cash - aligned to your particular risk tolerance and investment objective - is very important. Age-appropriate rebalancing is also an essential aspect of asset allocation. For younger investors, an emphasis on equities - which historically have been the best-performing asset class over time - is encouraged. As investors near their specific goal, such as retirement or sending a child to college, consideration may be given to replacing volatile assets (e.g. common stocks) with more-stable fixed investments (bonds or savings plans).
A third principle - investing regularly - can help lower the average cost of your purchases. Investing a certain amount of money each month or quarter helps ensure you won't pay for all your shares at market highs. This strategy - known as dollar cost averaging - also reduces "emotion" from investing, helping shareholders avoid selling weak performers just prior to an upswing, or chasing a hot performer just before a correction.
We invite you to contact us via the Internet, through our Investor Centers or by phone. It is our privilege to provide you the information you need to make the investments that are right for you.
Sincerely,
(The chairman's signature appears here.)
Edward C. Johnson 3d
Annual Report
Average annual total return reflects the change in the value of an investment, assuming reinvestment of the class' distributions from dividend income and capital gains (the profits earned upon the sale of securities that have grown in value, if any) and assuming a constant rate of performance each year. The $10,000 table and the fund's returns do not reflect the deduction of taxes that a shareholder would pay on fund distributions or the redemption of fund shares. During periods of reimbursement by Fidelity, a fund's total return will be greater than it would be had the reimbursement not occurred. How a fund did yesterday is no guarantee of how it will do tomorrow. Returns reflect the conversion of Class B shares to Class A shares after a maximum of seven years.
Average Annual Total Returns
Periods ended October 31, 2010 | Past 1
year | Past 5
years | Past 10
years |
Class A (incl. 5.75% sales charge) | 20.34% | 1.18% | 1.40% |
Class T (incl. 3.50% sales charge) | 22.75% | 1.41% | 1.37% |
Class B (incl. contingent deferred sales charge)A | 21.64% | 1.32% | 1.46% |
Class C (incl. contingent deferred sales charge)B | 25.68% | 1.63% | 1.23% |
A Class B shares' contingent deferred sales charges included in the past one year, past five years, and past ten years total return figures are 5%, 2%, and 0%, respectively.
B Class C shares' contingent deferred sales charges included in the past one year, past five years, and past ten years total return figures are 1%, 0%, and 0%, respectively.
Annual Report
$10,000 Over 10 Years
Let's say hypothetically that $10,000 was invested in Fidelity AdvisorSM Global Capital Appreciation Fund - Class A on October 31, 2000, and the current 5.75% sales charge was paid. The chart shows how the value of your investment would have changed, and also shows how the MSCI® ACWI® (All Country World Index) Index performed over the same period. Index values for periods prior to 2010 have been restated from prior years' reports.
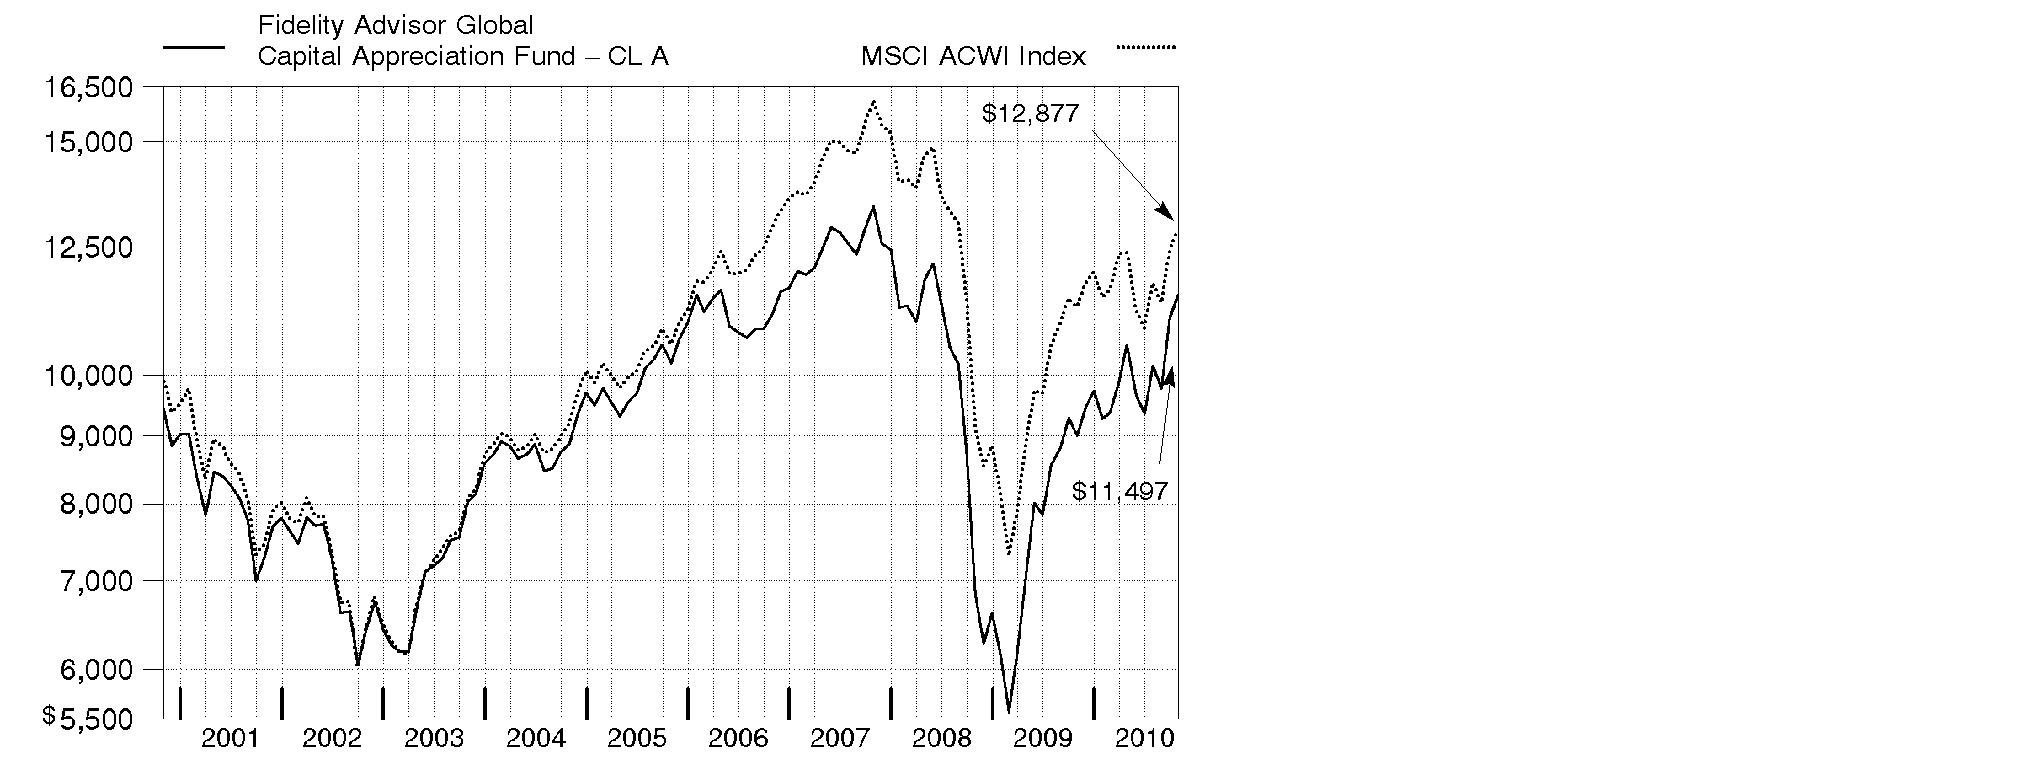
Annual Report
Market Recap: International stocks rode a wave of volatility similar to that of their U.S. counterparts during the 12 months ending October 31, 2010. Stocks gained modestly in the first half of the period, despite growing concerns about the European debt crisis. Sentiment turned decidedly negative in May and June, however, and the market suffered a precipitous decline. These losses were more than offset during the last four months of the period, when signs of economic growth and subsiding debt fears helped propel international stocks about 21%. For the full year, the MSCI® ACWI® (All Country World Index) ex USA Index gained 12.76%, boosted in part by a generally depreciating U.S. dollar. Within the index, Canada and emerging markets were standouts, returning 23% and 24%, respectively. Results in the latter group were led by strong-performing India, Mexico and South Africa, while China fell short of the MSCI benchmark due to cooling economic growth. The developed Asia ex Japan segment rose 16% for the period, lifted by solid results from Singapore and Hong Kong. Meanwhile, Europe rose just 9%, held back mainly by debt-riddled Spain and Italy, as well as lagging major constituent France. Japan returned only 5%, a result of that nation's continued weak economy.
Comments from Thomas Allen, who became Portfolio Manager of Fidelity AdvisorSM Global Capital Appreciation Fund on February 17, 2010: During the year, the fund's Class A, Class T, Class B and Class C shares returned 27.68%, 27.20%, 26.64% and 26.68%, respectively (excluding sales charges), almost doubling the 14.47% return of the MSCI ACWI (All Country World Index) Index. Relative performance was particularly aided by stock picking in technology, consumer staples, health care and several other sectors, as well as an underweighting in financials. Geographically, my picks in Japan, China, Taiwan, South Africa and India added value, as did a large overweighting in India. China-based Kingdee International Software Group was our top individual contributor, as the provider of accounting software for smaller companies benefited from significantly growing its market share. Other key contributors were Taiwanese smart phone maker HTC, South Africa's Blue Label Telecoms and ICRA, an Indian bond-rating agency. Conversely, our cash position detracted, as did weak picks in capital goods and real estate, along with an overweighting in technology and an underweighting in materials. China Pharma Holdings was the largest relative detractor, followed by U.S.-based MasTec, which installs utility and telecom infrastructure, and online retailer drugstore.com. All of the stocks I've mentioned, except for HTC, were out of index. I sold China Pharma and MasTec during the period.
The views expressed above reflect those of the portfolio manager(s) only through the end of the period as stated on the cover of this report and do not necessarily represent the views of Fidelity or any other person in the Fidelity organization. Any such views are subject to change at any time based upon market or other conditions and Fidelity disclaims any responsibility to update such views. These views may not be relied on as investment advice and, because investment decisions for a Fidelity fund are based on numerous factors, may not be relied on as an indication of trading intent on behalf of any Fidelity fund.
Annual Report
Shareholder Expense Example
As a shareholder of the Fund, you incur two types of costs: (1) transaction costs, including sales charges (loads) on purchase payments or redemption proceeds, redemption fees, and (2) ongoing costs, including management fees, distribution and/or service (12b-1) fees and other Fund expenses. This Example is intended to help you understand your ongoing costs (in dollars) of investing in the Fund and to compare these costs with the ongoing costs of investing in other mutual funds.
The Example is based on an investment of $1,000 invested at the beginning of the period and held for the entire period (May 1, 2010 to October 31, 2010).
Actual Expenses
The first line of the accompanying table for each class of the Fund provides information about actual account values and actual expenses. You may use the information in this line, together with the amount you invested, to estimate the expenses that you paid over the period. Simply divide your account value by $1,000.00 (for example, an $8,600 account value divided by $1,000.00 = 8.6), then multiply the result by the number in the first line for a class of the Fund under the heading entitled "Expenses Paid During Period" to estimate the expenses you paid on your account during this period. In addition, the Fund, as a shareholder in the underlying Fidelity Central Funds, will indirectly bear its pro-rata share of the fees and expenses incurred by the underlying Fidelity Central Funds. These fees and expenses are not included in the Fund's annualized expense ratio used to calculate the expense estimate in the table below.
Hypothetical Example for Comparison Purposes
The second line of the accompanying table for each class of the Fund provides information about hypothetical account values and hypothetical expenses based on a Class' actual expense ratio and an assumed rate of return of 5% per year before expenses, which is not the Class' actual return. The hypothetical account values and expenses may not be used to estimate the actual ending account balance or expenses you paid for the period. You may use this information to compare the ongoing costs of investing in the Fund and other funds. To do so, compare this 5% hypothetical example with the 5% hypothetical examples that appear in the shareholder reports of the other funds. In addition, the Fund, as a shareholder in the underlying Fidelity Central Funds, will indirectly bear its pro-rata share of the fees and expenses incurred by the underlying Fidelity Central Funds. These fees and expenses are not included in the Fund's annualized expense ratio used to calculate the expense estimate in the table below.
Please note that the expenses shown in the table are meant to highlight your ongoing costs only and do not reflect any transaction costs. Therefore, the second line of the table is useful in comparing ongoing costs only, and will not help you determine the relative total costs of owning different funds. In addition, if these transactional costs were included, your costs would have been higher.
Annual Report
| Annualized
Expense Ratio | Beginning
Account Value
May 1, 2010 | Ending
Account Value
October 31, 2010 | Expenses Paid
During Period*
May 1, 2010 to
October 31, 2010 |
Class A | 1.50% | | | |
Actual | | $ 1,000.00 | $ 1,089.80 | $ 7.90** |
HypotheticalA | | $ 1,000.00 | $ 1,017.64 | $ 7.63** |
Class T | 1.75% | | | |
Actual | | $ 1,000.00 | $ 1,088.10 | $ 9.21** |
HypotheticalA | | $ 1,000.00 | $ 1,016.38 | $ 8.89** |
Class B | 2.25% | | | |
Actual | | $ 1,000.00 | $ 1,085.10 | $ 11.83** |
HypotheticalA | | $ 1,000.00 | $ 1,013.86 | $ 11.42** |
Class C | 2.25% | | | |
Actual | | $ 1,000.00 | $ 1,085.10 | $ 11.83** |
HypotheticalA | | $ 1,000.00 | $ 1,013.86 | $ 11.42** |
Institutional Class | 1.25% | | | |
Actual | | $ 1,000.00 | $ 1,090.90 | $ 6.59** |
HypotheticalA | | $ 1,000.00 | $ 1,018.90 | $ 6.36** |
A 5% return per year before expenses
* Expenses are equal to each Class' annualized expense ratio, multiplied by the average account value over the period, multiplied by 184/365 (to reflect the one-half year period).
Annual Report
Shareholder Expense Example - continued
** If changes to voluntary expense limitations, effective November 1, 2010, had been in effect during the entire period, the annualized expense ratios and the expenses paid in the actual and hypothetical examples above would have been as follows:
| Annualized
Expense Ratio | Expenses Paid |
Class A | 1.45% | |
Actual | | $ 7.64 |
HypotheticalA | | $ 7.38 |
Class T | 1.70% | |
Actual | | $ 8.95 |
HypotheticalA | | $ 8.64 |
Class B | 2.20% | |
Actual | | $ 11.56 |
HypotheticalA | | $ 11.17 |
Class C | 2.20% | |
Actual | | $ 11.56 |
HypotheticalA | | $ 11.17 |
Institutional Class | 1.20% | |
Actual | | $ 6.33 |
HypotheticalA | | $ 6.11 |
A 5% return per year before expenses
Annual Report
Investment Changes (Unaudited)
Top Five Stocks as of October 31, 2010 |
| % of fund's
net assets | % of fund's net assets
6 months ago |
China Valves Technology, Inc. (United States of America, Machinery) | 5.0 | 0.0 |
Kenedix, Inc. (Japan, Real Estate Management & Development) | 4.7 | 4.2 |
Blue Label Telecoms Ltd. (South Africa, Commercial Services & Supplies) | 4.6 | 3.6 |
EnergyO Solutions AB (Sweden, Electric Utilities) | 4.3 | 0.5 |
Proto Corp. (Japan, Media) | 3.0 | 5.0 |
| 21.6 | |
Top Five Market Sectors as of October 31, 2010 |
| % of fund's
net assets | % of fund's net assets
6 months ago |
Information Technology | 22.1 | 35.3 |
Health Care | 13.8 | 10.2 |
Financials | 12.6 | 13.4 |
Consumer Discretionary | 11.9 | 15.7 |
Industrials | 11.5 | 10.9 |
Top Five Countries as of October 31, 2010 |
(excluding cash equivalents) | % of fund's
net assets | % of fund's net assets
6 months ago |
United States of America | 19.8 | 33.0 |
India | 16.0 | 15.5 |
Japan | 12.6 | 14.5 |
Cayman Islands | 7.9 | 10.0 |
South Africa | 6.2 | 6.6 |
Percentages are adjusted for the effect of open futures contracts, if applicable. |
Asset Allocation (% of fund's net assets) |
As of October 31, 2010 | As of April 30, 2010 |
| Stocks 84.8% | | | Stocks 99.3% | |
| Short-Term
Investments and
Net Other Assets 15.2% | | | Short-Term
Investments and
Net Other Assets 0.7% | |

Annual Report
Investments October 31, 2010
Showing Percentage of Net Assets
Common Stocks - 84.8% |
| Shares | | Value |
Australia - 0.3% |
Newcrest Mining Ltd. | 6,340 | | $ 248,191 |
Bermuda - 1.0% |
Fairwood Holdings Ltd. | 578,000 | | 794,901 |
Brazil - 0.5% |
Brasil Insurance Participacoes e Administracao SA (a) | 100 | | 79,356 |
Tegma Gestao Logistica | 27,200 | | 337,042 |
TOTAL BRAZIL | | 416,398 |
British Virgin Islands - 1.3% |
HLS Systems International Ltd. (a)(d) | 78,400 | | 990,976 |
Kingtone Wirelessinfo Solution Holding Ltd. sponsored ADR (a)(d) | 4,100 | | 13,653 |
TOTAL BRITISH VIRGIN ISLANDS | | 1,004,629 |
Canada - 1.9% |
Computer Modelling Group Ltd. | 48,200 | | 917,308 |
Kinross Gold Corp. | 22,300 | | 401,221 |
Kinross Gold Corp. warrants 9/17/14 (a) | 396 | | 1,627 |
Petrobank Energy & Resources Ltd. (a) | 1,700 | | 67,657 |
Yamana Gold, Inc. | 3,500 | | 38,504 |
TOTAL CANADA | | 1,426,317 |
Cayman Islands - 7.9% |
China Real Estate Information Corp. ADR (d) | 152,500 | | 1,511,275 |
Daphne International Holdings Ltd. | 1,390,000 | | 1,552,962 |
Kingdee International Software Group Co. Ltd. | 3,824,000 | | 2,017,760 |
Longtop Financial Technologies Ltd. ADR (a) | 18,300 | | 665,022 |
Tianyi Fruit Holdings Ltd. | 884,000 | | 315,908 |
Xinyi Glass Holdings Co. Ltd. | 30,000 | | 23,803 |
TOTAL CAYMAN ISLANDS | | 6,086,730 |
Denmark - 0.6% |
Vestas Wind Systems AS (a)(d) | 15,300 | | 488,198 |
France - 2.6% |
AXA SA | 30,000 | | 546,005 |
Ubisoft Entertainment SA (a) | 112,626 | | 1,465,114 |
TOTAL FRANCE | | 2,011,119 |
Germany - 0.3% |
Kontron AG | 20,200 | | 195,908 |
Hong Kong - 0.4% |
Wharf Holdings Ltd. | 45,000 | | 295,501 |
Common Stocks - continued |
| Shares | | Value |
India - 16.0% |
Cadila Healthcare Ltd. | 10,818 | | $ 170,416 |
FDC Ltd. | 828,819 | | 1,943,728 |
Hawkins Cookers Ltd. | 12,376 | | 298,336 |
ICRA Ltd. | 55,449 | | 1,715,197 |
Indoco Remedies Ltd. | 102,728 | | 1,162,860 |
INFO Edge India Ltd. | 51,457 | | 789,820 |
MIC Electronics Ltd. | 1,590,610 | | 1,424,641 |
NIIT Ltd. | 109,800 | | 162,873 |
NIIT Technologies Ltd. | 270,921 | | 1,341,005 |
Opto Circuits India Ltd. | 187,108 | | 1,213,828 |
Prakash Industries Ltd. (a) | 26,482 | | 86,123 |
REI Six Ten Retail Ltd. | 166,449 | | 275,256 |
Strides Arcolab Ltd. | 61,930 | | 587,933 |
Unichem Laboratories Ltd. | 233,125 | | 1,208,621 |
TOTAL INDIA | | 12,380,637 |
Japan - 12.6% |
Aozora Bank Ltd. | 795,000 | | 1,333,727 |
DeNA Co. Ltd. | 38,200 | | 988,348 |
Kakaku.com, Inc. | 93 | | 449,571 |
Kenedix, Inc. (a)(d) | 18,158 | | 3,662,288 |
Park24 Co. Ltd. | 39,900 | | 385,761 |
Proto Corp. | 55,900 | | 2,275,040 |
Tokyo Electron Ltd. | 1,800 | | 101,562 |
Tsutsumi Jewelry Co. Ltd. | 22,000 | | 518,081 |
TOTAL JAPAN | | 9,714,378 |
Korea (South) - 1.2% |
Able C&C Ltd. | 44,755 | | 961,168 |
Netherlands - 0.9% |
Gemalto NV | 15,000 | | 682,924 |
Russia - 2.8% |
Pharmstandard OJSC (a) | 3,700 | | 324,241 |
Sollers OJSC (a) | 17,950 | | 305,672 |
Veropharm (a) | 37,300 | | 1,504,667 |
TOTAL RUSSIA | | 2,134,580 |
South Africa - 6.2% |
Aspen Pharmacare Holdings Ltd. | 56,300 | | 751,465 |
Common Stocks - continued |
| Shares | | Value |
South Africa - continued |
Blue Label Telecoms Ltd. | 3,438,177 | | $ 3,533,861 |
Clicks Group Ltd. | 72,842 | | 475,211 |
TOTAL SOUTH AFRICA | | 4,760,537 |
Sweden - 4.3% |
EnergyO Solutions AB (a) | 498,352 | | 3,319,065 |
Switzerland - 0.5% |
Nobel Biocare Holding AG (Switzerland) | 8,380 | | 138,510 |
Weatherford International Ltd. (a) | 16,100 | | 270,641 |
TOTAL SWITZERLAND | | 409,151 |
Taiwan - 2.9% |
HTC Corp. | 91,350 | | 2,062,501 |
Tong Yang Industry Co. Ltd. | 94,000 | | 149,423 |
TOTAL TAIWAN | | 2,211,924 |
United Kingdom - 0.8% |
Barclays PLC Sponsored ADR | 18,300 | | 322,995 |
Ensco International Ltd. ADR | 7,100 | | 329,014 |
TOTAL UNITED KINGDOM | | 652,009 |
United States of America - 19.8% |
Advance Auto Parts, Inc. | 23,900 | | 1,553,022 |
Altera Corp. | 32,600 | | 1,017,446 |
China Biologic Products, Inc. (a)(d) | 60,300 | | 590,337 |
China Jo-Jo Drugstores, Inc. (a)(d) | 344,100 | | 1,703,295 |
China Valves Technology, Inc. (a)(d) | 441,397 | | 3,848,981 |
Computer Task Group, Inc. (a) | 168,100 | | 1,341,438 |
DG FastChannel, Inc. (a) | 12,895 | | 303,677 |
drugstore.com, Inc. (a) | 132,100 | | 211,360 |
eBay, Inc. (a) | 1,300 | | 38,753 |
Genomic Health, Inc. (a) | 680 | | 9,629 |
Market Leader, Inc. (a) | 36,101 | | 70,397 |
Nanosphere, Inc. (a) | 200,814 | | 911,696 |
Northern Trust Corp. | 6,600 | | 327,558 |
NVE Corp. (a) | 11,421 | | 549,693 |
PowerSecure International, Inc. (a)(d) | 33,900 | | 318,999 |
Support.com, Inc. (a) | 82,500 | | 467,775 |
Uranium Energy Corp. (a)(d) | 9,900 | | 38,313 |
Common Stocks - continued |
| Shares | | Value |
United States of America - continued |
USANA Health Sciences, Inc. (a) | 42,995 | | $ 1,888,340 |
Zoltek Companies, Inc. (a)(d) | 10,948 | | 105,101 |
TOTAL UNITED STATES OF AMERICA | | 15,295,810 |
TOTAL COMMON STOCKS (Cost $56,153,805) | 65,490,075 |
Money Market Funds - 20.2% |
| | | |
Fidelity Cash Central Fund, 0.23% (b) | 11,023,213 | | 11,023,213 |
Fidelity Securities Lending Cash Central Fund, 0.24% (b)(c) | 4,585,262 | | 4,585,262 |
TOTAL MONEY MARKET FUNDS (Cost $15,608,475) | 15,608,475 |
TOTAL INVESTMENT PORTFOLIO - 105.0% (Cost $71,762,280) | | 81,098,550 |
NET OTHER ASSETS (LIABILITIES) - (5.0)% | | (3,825,817) |
NET ASSETS - 100% | $ 77,272,733 |
Legend |
(a) Non-income producing |
(b) Affiliated fund that is available only to investment companies and other accounts managed by Fidelity Investments. The rate quoted is the annualized seven-day yield of the fund at period end. A complete unaudited listing of the fund's holdings as of its most recent quarter end is available upon request. In addition, each Fidelity Central Fund's financial statements, which are not covered by the Fund's report of Independent Registered Public Accounting Firm, are available on the SEC's website or upon request. |
(c) Investment made with cash collateral received from securities on loan. |
(d) Security or a portion of the security is on loan at period end. |
Affiliated Central Funds |
Information regarding fiscal year to date income earned by the Fund from investments in Fidelity Central Funds is as follows: |
Fund | Income earned |
Fidelity Cash Central Fund | $ 3,314 |
Fidelity Securities Lending Cash Central Fund | 23,119 |
Total | $ 26,433 |
Other Information |
The following is a summary of the inputs used, as of October 31, 2010, involving the Fund's assets and liabilities carried at fair value. The inputs or methodology used for valuing securities may not be an indication of the risk associated with investing in those securities. For more information on valuation inputs, and their aggregation into the levels used in the table below, please refer to the Security Valuation section in the accompanying Notes to Financial Statements. |
Valuation Inputs at Reporting Date: |
Description | Total | Level 1 | Level 2 | Level 3 |
Investments in Securities: | | | | |
Equities: | | | | |
United States of America | $ 15,295,810 | $ 15,295,810 | $ - | $ - |
India | 12,380,637 | 12,380,637 | - | - |
Japan | 9,714,378 | 9,612,816 | 101,562 | - |
Cayman Islands | 6,086,730 | 6,086,730 | - | - |
South Africa | 4,760,537 | 4,760,537 | - | - |
Sweden | 3,319,065 | 3,319,065 | - | - |
Taiwan | 2,211,924 | 2,211,924 | - | - |
Russia | 2,134,580 | 2,134,580 | - | - |
France | 2,011,119 | 2,011,119 | - | - |
Other | 7,575,295 | 7,495,939 | 79,356 | - |
Money Market Funds | 15,608,475 | 15,608,475 | - | - |
Total Investments in Securities: | $ 81,098,550 | $ 80,917,632 | $ 180,918 | $ - |
Income Tax Information |
At October 31, 2010, the Fund had a capital loss carryforward of approximately $10,598,573 of which $7,580,172 and $3,018,401 will expire on October 31, 2016 and 2017, respectively. Capital loss carryforwards are only available to offset future capital gains of the Fund to the extent provided by regulations and may be limited. |
See accompanying notes which are an integral part of the financial statements.
Annual Report
Statement of Assets and Liabilities
| October 31, 2010 |
| | |
Assets | | |
Investment in securities, at value (including securities loaned of $4,434,372) - See accompanying schedule: Unaffiliated issuers (cost $56,153,805) | $ 65,490,075 | |
Fidelity Central Funds (cost $15,608,475) | 15,608,475 | |
Total Investments (cost $71,762,280) | | $ 81,098,550 |
Cash | | 363,628 |
Foreign currency held at value (cost $96,517) | | 96,590 |
Receivable for fund shares sold | | 1,523,742 |
Dividends receivable | | 73,967 |
Distributions receivable from Fidelity Central Funds | | 11,495 |
Receivable from investment adviser for expense reductions | | 2,714 |
Other receivables | | 25,277 |
Total assets | | 83,195,963 |
| | |
Liabilities | | |
Payable for investments purchased | $ 1,008,938 | |
Payable for fund shares redeemed | 63,088 | |
Accrued management fee | 41,023 | |
Distribution and service plan fees payable | 21,091 | |
Other affiliated payables | 13,283 | |
Other payables and accrued expenses | 190,545 | |
Collateral on securities loaned, at value | 4,585,262 | |
Total liabilities | | 5,923,230 |
| | |
Net Assets | | $ 77,272,733 |
Net Assets consist of: | | |
Paid in capital | | $ 78,726,227 |
Accumulated undistributed net realized gain (loss) on investments and foreign currency transactions | | (10,645,349) |
Net unrealized appreciation (depreciation) on investments and assets and liabilities in foreign currencies | | 9,191,855 |
Net Assets | | $ 77,272,733 |
See accompanying notes which are an integral part of the financial statements.
Annual Report
Statement of Assets and Liabilities - continued
| October 31, 2010 |
| | |
Calculation of Maximum Offering Price Class A:
Net Asset Value and redemption price per share ($30,382,527 ÷ 2,663,596 shares) | | $ 11.41 |
| | |
Maximum offering price per share (100/94.25 of $11.41) | | $ 12.11 |
Class T:
Net Asset Value and redemption price per share ($23,236,913 ÷ 2,091,542 shares) | | $ 11.11 |
| | |
Maximum offering price per share (100/96.50 of $11.11) | | $ 11.51 |
Class B:
Net Asset Value and offering price per share ($2,731,290 ÷ 261,103 shares) A | | $ 10.46 |
| | |
Class C:
Net Asset Value and offering price per share ($7,986,448 ÷ 763,411 shares) A | | $ 10.46 |
| | |
Institutional Class:
Net Asset Value, offering price and redemption price per share ($12,935,555 ÷ 1,100,250 shares) | | $ 11.76 |
A Redemption price per share is equal to net asset value less any applicable contingent deferred sales charge.
See accompanying notes which are an integral part of the financial statements.
Annual Report
Financial Statements - continued
Statement of Operations
| Year ended October 31, 2010 |
| | |
Investment Income | | |
Dividends | | $ 528,445 |
Interest | | 3,256 |
Income from Fidelity Central Funds | | 26,433 |
Income before foreign taxes withheld | | 558,134 |
Less foreign taxes withheld | | (34,225) |
Total income | | 523,909 |
| | |
Expenses | | |
Management fee
Basic fee | $ 236,878 | |
Performance adjustment | (245) | |
Transfer agent fees | 99,419 | |
Distribution and service plan fees | 156,797 | |
Accounting and security lending fees | 17,484 | |
Custodian fees and expenses | 97,566 | |
Independent trustees' compensation | 170 | |
Registration fees | 56,274 | |
Audit | 65,917 | |
Legal | 139 | |
Miscellaneous | 348 | |
Total expenses before reductions | 730,747 | |
Expense reductions | (175,676) | 555,071 |
Net investment income (loss) | | (31,162) |
Realized and Unrealized Gain (Loss) Net realized gain (loss) on: | | |
Investment securities: | | |
Unaffiliated issuers (net of foreign taxes of $56,746) | 2,235,107 | |
Foreign currency transactions | 3,552 | |
Total net realized gain (loss) | | 2,238,659 |
Change in net unrealized appreciation (depreciation) on: Investment securities (net of increase in deferred foreign taxes of $141,556) | 7,403,884 | |
Assets and liabilities in foreign currencies | 3,941 | |
Total change in net unrealized appreciation (depreciation) | | 7,407,825 |
Net gain (loss) | | 9,646,484 |
Net increase (decrease) in net assets resulting from operations | | $ 9,615,322 |
See accompanying notes which are an integral part of the financial statements.
Annual Report
Statement of Changes in Net Assets
| Year ended
October 31,
2010 | Year ended
October 31,
2009 |
Increase (Decrease) in Net Assets | | |
Operations | | |
Net investment income (loss) | $ (31,162) | $ 50,948 |
Net realized gain (loss) | 2,238,659 | (2,896,694) |
Change in net unrealized appreciation (depreciation) | 7,407,825 | 8,195,238 |
Net increase (decrease) in net assets resulting
from operations | 9,615,322 | 5,349,492 |
Distributions to shareholders from net investment income | (45,039) | (30,547) |
Distributions to shareholders from net realized gain | (205,342) | - |
Total distributions | (250,381) | (30,547) |
Share transactions - net increase (decrease) | 43,722,613 | (1,928,677) |
Redemption fees | 5,493 | 261 |
Total increase (decrease) in net assets | 53,093,047 | 3,390,529 |
| | |
Net Assets | | |
Beginning of period | 24,179,686 | 20,789,157 |
End of period (including undistributed net investment income of $0 and $21,196, respectively) | $ 77,272,733 | $ 24,179,686 |
See accompanying notes which are an integral part of the financial statements.
Annual Report
Financial Highlights - Class A
Years ended October 31, | 2010 | 2009 | 2008 | 2007 | 2006 |
Selected Per-Share Data | | | | | |
Net asset value, beginning of period | $ 9.04 | $ 6.88 | $ 15.38 | $ 14.83 | $ 13.68 |
Income from Investment Operations | | | | | |
Net investment income (loss) C | .01 | .04 | .04 | .01 | .01 |
Net realized and unrealized gain (loss) | 2.47 | 2.13 | (6.74) | 2.69 | 1.20 |
Total from investment operations | 2.48 | 2.17 | (6.70) | 2.70 | 1.21 |
Distributions from net investment income | (.03) | (.01) | - | - | (.04) |
Distributions from net realized gain | (.08) | - | (1.80) | (2.15) | (.02) |
Total distributions | (.11) | (.01) | (1.80) | (2.15) | (.06) |
Redemption fees added to paid in capital C, G | - | - | - | - | - |
Net asset value, end of period | $ 11.41 | $ 9.04 | $ 6.88 | $ 15.38 | $ 14.83 |
Total Return A, B | 27.68% | 31.68% | (48.99)% | 20.55% | 8.86% |
Ratios to Average Net Assets D, F | | | | | |
Expenses before reductions | 1.89% | 2.22% | 1.90% | 1.81% | 1.69% |
Expenses net of fee waivers, if any | 1.50% | 1.50% | 1.50% | 1.50% | 1.50% |
Expenses net of all reductions | 1.44% | 1.43% | 1.41% | 1.45% | 1.46% |
Net investment income (loss) | .13% | .53% | .38% | .06% | .06% |
Supplemental Data | | | | | |
Net assets, end of period (000 omitted) | $ 30,383 | $ 6,997 | $ 6,904 | $ 14,000 | $ 10,956 |
Portfolio turnover rate E | 179% | 258% | 257% | 102% | 251% |
A Total returns would have been lower had certain expenses not been reduced during the periods shown.
B Total returns do not include the effect of the sales charges.
C Calculated based on average shares outstanding during the period.
D Fees and expenses of the underlying Fidelity Central Funds are not included in the Fund's expense ratio. The Fund indirectly bears its proportionate share of the expenses of any underlying Fidelity Central Funds.
E Amount does not include the portfolio activity of any underlying Fidelity Central Funds.
F Expense ratios reflect operating expenses of the class. Expenses before reductions do not reflect amounts reimbursed by the investment adviser or reductions from brokerage service arrangements or reductions from other expense offset arrangements and do not represent the amount paid by the class during periods when reimbursements or reductions occur. Expenses net of fee waivers reflect expenses after reimbursement by the investment adviser but prior to reductions from brokerage service arrangements or other expense offset arrangements. Expenses net of all reductions represent the net expenses paid by the class.
G Amount represents less than $.01 per share.
See accompanying notes which are an integral part of the financial statements.
Annual Report
Financial Highlights - Class T
Years ended October 31, | 2010 | 2009 | 2008 | 2007 | 2006 |
Selected Per-Share Data | | | | | |
Net asset value, beginning of period | $ 8.82 | $ 6.72 | $ 15.05 | $ 14.59 | $ 13.46 |
Income from Investment Operations | | | | | |
Net investment income (loss) C | (.01) | .02 | .01 | (.03) | (.03) |
Net realized and unrealized gain (loss) | 2.39 | 2.09 | (6.59) | 2.64 | 1.19 |
Total from investment operations | 2.38 | 2.11 | (6.58) | 2.61 | 1.16 |
Distributions from net investment income | (.01) | (.01) | - | - | (.01) |
Distributions from net realized gain | (.08) | - | (1.75) | (2.15) | (.02) |
Total distributions | (.09) | (.01) | (1.75) | (2.15) | (.03) |
Redemption fees added to paid in capital C, G | - | - | - | - | - |
Net asset value, end of period | $ 11.11 | $ 8.82 | $ 6.72 | $ 15.05 | $ 14.59 |
Total Return A, B | 27.20% | 31.50% | (49.12)% | 20.24% | 8.62% |
Ratios to Average Net Assets D, F | | | | | |
Expenses before reductions | 2.32% | 2.50% | 2.17% | 2.08% | 1.99% |
Expenses net of fee waivers, if any | 1.75% | 1.75% | 1.75% | 1.75% | 1.75% |
Expenses net of all reductions | 1.70% | 1.69% | 1.66% | 1.71% | 1.71% |
Net investment income (loss) | (.13)% | .27% | .13% | (.19)% | (.19)% |
Supplemental Data | | | | | |
Net assets, end of period (000 omitted) | $ 23,237 | $ 10,494 | $ 8,104 | $ 22,039 | $ 26,780 |
Portfolio turnover rate E | 179% | 258% | 257% | 102% | 251% |
A Total returns would have been lower had certain expenses not been reduced during the periods shown.
B Total returns do not include the effect of the sales charges.
C Calculated based on average shares outstanding during the period.
D Fees and expenses of the underlying Fidelity Central Funds are not included in the Fund's expense ratio. The Fund indirectly bears its proportionate share of the expenses of any underlying Fidelity Central Funds.
E Amount does not include the portfolio activity of any underlying Fidelity Central Funds.
F Expense ratios reflect operating expenses of the class. Expenses before reductions do not reflect amounts reimbursed by the investment adviser or reductions from brokerage service arrangements or reductions from other expense offset arrangements and do not represent the amount paid by the class during periods when reimbursements or reductions occur. Expenses net of fee waivers reflect expenses after reimbursement by the investment adviser but prior to reductions from brokerage service arrangements or other expense offset arrangements. Expenses net of all reductions represent the net expenses paid by the class.
G Amount represents less than $.01 per share.
See accompanying notes which are an integral part of the financial statements.
Annual Report
Financial Highlights - Class B
Years ended October 31, | 2010 | 2009 | 2008 | 2007 | 2006 |
Selected Per-Share Data | | | | | |
Net asset value, beginning of period | $ 8.31 | $ 6.37 | $ 14.34 | $ 14.06 | $ 13.01 |
Income from Investment Operations | | | | | |
Net investment income (loss) C | (.06) | (.02) | (.04) | (.09) | (.10) |
Net realized and unrealized gain (loss) | 2.26 | 1.97 | (6.25) | 2.52 | 1.15 |
Total from investment operations | 2.20 | 1.95 | (6.29) | 2.43 | 1.05 |
Distributions from net investment income | - | (.01) | - | - | - |
Distributions from net realized gain | (.05) | - | (1.68) | (2.15) | - |
Total distributions | (.05) | (.01) | (1.68) | (2.15) | - |
Redemption fees added to paid in capital C, G | - | - | - | - | - |
Net asset value, end of period | $ 10.46 | $ 8.31 | $ 6.37 | $ 14.34 | $ 14.06 |
Total Return A, B | 26.64% | 30.62% | (49.33)% | 19.65% | 8.07% |
Ratios to Average Net Assets D, F | | | | | |
Expenses before reductions | 2.82% | 2.98% | 2.66% | 2.57% | 2.52% |
Expenses net of fee waivers, if any | 2.25% | 2.25% | 2.25% | 2.25% | 2.25% |
Expenses net of all reductions | 2.19% | 2.18% | 2.16% | 2.20% | 2.22% |
Net investment income (loss) | (.62)% | (.22)% | (.37)% | (.69)% | (.69)% |
Supplemental Data | | | | | |
Net assets, end of period (000 omitted) | $ 2,731 | $ 2,162 | $ 1,918 | $ 5,029 | $ 5,788 |
Portfolio turnover rate E | 179% | 258% | 257% | 102% | 251% |
A Total returns would have been lower had certain expenses not been reduced during the periods shown.
B Total returns do not include the effect of the contingent deferred sales charge.
C Calculated based on average shares outstanding during the period.
D Fees and expenses of the underlying Fidelity Central Funds are not included in the Fund's expense ratio. The Fund indirectly bears its proportionate share of the expenses of any underlying Fidelity Central Funds.
E Amount does not include the portfolio activity of any underlying Fidelity Central Funds.
F Expense ratios reflect operating expenses of the class. Expenses before reductions do not reflect amounts reimbursed by the investment adviser or reductions from brokerage service arrangements or reductions from other expense offset arrangements and do not represent the amount paid by the class during periods when reimbursements or reductions occur. Expenses net of fee waivers reflect expenses after reimbursement by the investment adviser but prior to reductions from brokerage service arrangements or other expense offset arrangements. Expenses net of all reductions represent the net expenses paid by the class.
G Amount represents less than $.01 per share.
See accompanying notes which are an integral part of the financial statements.
Annual Report
Financial Highlights - Class C
Years ended October 31, | 2010 | 2009 | 2008 | 2007 | 2006 |
Selected Per-Share Data | | | | | |
Net asset value, beginning of period | $ 8.31 | $ 6.37 | $ 14.36 | $ 14.08 | $ 13.02 |
Income from Investment Operations | | | | | |
Net investment income (loss) C | (.06) | (.02) | (.04) | (.09) | (.10) |
Net realized and unrealized gain (loss) | 2.27 | 1.97 | (6.26) | 2.52 | 1.16 |
Total from investment operations | 2.21 | 1.95 | (6.30) | 2.43 | 1.06 |
Distributions from net investment income | - | (.01) | - | - | - |
Distributions from net realized gain | (.06) | - | (1.69) | (2.15) | - |
Total distributions | (.06) | (.01) | (1.69) | (2.15) | - |
Redemption fees added to paid in capital C, G | - | - | - | - | - |
Net asset value, end of period | $ 10.46 | $ 8.31 | $ 6.37 | $ 14.36 | $ 14.08 |
Total Return A, B | 26.68% | 30.62% | (49.35)% | 19.62% | 8.14% |
Ratios to Average Net Assets D, F | | | | | |
Expenses before reductions | 2.77% | 2.97% | 2.63% | 2.57% | 2.50% |
Expenses net of fee waivers, if any | 2.25% | 2.25% | 2.25% | 2.25% | 2.25% |
Expenses net of all reductions | 2.20% | 2.18% | 2.16% | 2.20% | 2.21% |
Net investment income (loss) | (.63)% | (.22)% | (.37)% | (.69)% | (.69)% |
Supplemental Data | | | | | |
Net assets, end of period (000 omitted) | $ 7,986 | $ 3,378 | $ 2,697 | $ 5,352 | $ 5,348 |
Portfolio turnover rate E | 179% | 258% | 257% | 102% | 251% |
A Total returns would have been lower had certain expenses not been reduced during the periods shown.
B Total returns do not include the effect of the contingent deferred sales charge.
C Calculated based on average shares outstanding during the period.
D Fees and expenses of the underlying Fidelity Central Funds are not included in the Fund's expense ratio. The Fund indirectly bears its proportionate share of the expenses of any underlying Fidelity Central Funds.
E Amount does not include the portfolio activity of any underlying Fidelity Central Funds.
F Expense ratios reflect operating expenses of the class. Expenses before reductions do not reflect amounts reimbursed by the investment adviser or reductions from brokerage service arrangements or reductions from other expense offset arrangements and do not represent the amount paid by the class during periods when reimbursements or reductions occur. Expenses net of fee waivers reflect expenses after reimbursement by the investment adviser but prior to reductions from brokerage service arrangements or other expense offset arrangements. Expenses net of all reductions represent the net expenses paid by the class.
G Amount represents less than $.01 per share.
See accompanying notes which are an integral part of the financial statements.
Annual Report
Financial Highlights - Institutional Class
Years ended October 31, | 2010 | 2009 | 2008 | 2007 | 2006 |
Selected Per-Share Data | | | | | |
Net asset value, beginning of period | $ 9.31 | $ 7.07 | $ 15.76 | $ 15.11 | $ 13.93 |
Income from Investment Operations | | | | | |
Net investment income (loss) B | .04 | .06 | .07 | .05 | .05 |
Net realized and unrealized gain (loss) | 2.54 | 2.20 | (6.93) | 2.75 | 1.22 |
Total from investment operations | 2.58 | 2.26 | (6.86) | 2.80 | 1.27 |
Distributions from net investment income | (.05) | (.02) | - | - | (.07) |
Distributions from net realized gain | (.08) | - | (1.83) | (2.15) | (.02) |
Total distributions | (.13) | (.02) | (1.83) | (2.15) | (.09) |
Redemption fees added to paid in capital B, F | - | - | - | - | - |
Net asset value, end of period | $ 11.76 | $ 9.31 | $ 7.07 | $ 15.76 | $ 15.11 |
Total Return A | 28.00% | 32.03% | (48.89)% | 20.88% | 9.15% |
Ratios to Average Net Assets C, E | | | | | |
Expenses before reductions | 1.43% | 1.88% | 1.51% | 1.43% | 1.29% |
Expenses net of fee waivers, if any | 1.25% | 1.25% | 1.25% | 1.25% | 1.25% |
Expenses net of all reductions | 1.19% | 1.18% | 1.16% | 1.20% | 1.21% |
Net investment income (loss) | .38% | .78% | .63% | .31% | .31% |
Supplemental Data | | | | | |
Net assets, end of period (000 omitted) | $ 12,936 | $ 1,148 | $ 1,166 | $ 2,476 | $ 2,464 |
Portfolio turnover rate D | 179% | 258% | 257% | 102% | 251% |
A Total returns would have been lower had certain expenses not been reduced during the periods shown.
B Calculated based on average shares outstanding during the period.
C Fees and expenses of the underlying Fidelity Central Funds are not included in the Fund's expense ratio. The Fund indirectly bears its proportionate share of the expenses of any underlying Fidelity Central Funds.
D Amount does not include the portfolio activity of any underlying Fidelity Central Funds.
E Expense ratios reflect operating expenses of the class. Expenses before reductions do not reflect amounts reimbursed by the investment adviser or reductions from brokerage service arrangements or reductions from other expense offset arrangements and do not represent the amount paid by the class during periods when reimbursements or reductions occur. Expenses net of fee waivers reflect expenses after reimbursement by the investment adviser but prior to reductions from brokerage service arrangements or other expense offset arrangements. Expenses net of all reductions represent the net expenses paid by the class.
F Amount represents less than $.01 per share.
See accompanying notes which are an integral part of the financial statements.
Annual Report
Notes to Financial Statements
For the period ended October 31, 2010
1. Organization.
Fidelity Advisor Global Capital Appreciation Fund (the Fund) is a fund of Fidelity Advisor Series VIII (the Trust) and is authorized to issue an unlimited number of shares. The Trust is registered under the Investment Company Act of 1940, as amended (the 1940 Act), as an open-end management investment company organized as a Massachusetts business trust. The Fund offers Class A, Class T, Class C, and Institutional Class shares, each of which has equal rights as to assets and voting privileges. Each class has exclusive voting rights with respect to matters that affect that class. Class B shares will automatically convert to Class A shares after a holding period of seven years from the initial date of purchase. Investment income, realized and unrealized capital gains and losses, the common expenses of the Fund, and certain fund-level expense reductions, if any, are allocated on a pro-rata basis to each class based on the relative net assets of each class to the total net assets of the Fund. Each class differs with respect to transfer agent and distribution and service plan fees incurred. Certain expense reductions also differ by class. The Fund's investments in emerging markets can be subject to social, economic, regulatory, and political uncertainties and can be extremely volatile.
2. Investments in Fidelity Central Funds.
The Fund may invest in Fidelity Central Funds, which are open-end investment companies available only to other investment companies and accounts managed by Fidelity Management & Research Company (FMR) and its affiliates. The Fund's Schedule of Investments lists each of the Fidelity Central Funds held as of period end, if any, as an investment of the Fund, but does not include the underlying holdings of each Fidelity Central Fund. As an Investing Fund, the Fund indirectly bears its proportionate share of the expenses of the underlying Fidelity Central Funds.
The Money Market Central Funds seek preservation of capital and current income and are managed by Fidelity Investments Money Management, Inc. (FIMM), an affiliate of FMR.
A complete unaudited list of holdings for each Fidelity Central Fund is available upon request or at the Securities and Exchange Commission (the SEC) web site at www.sec.gov. In addition, the financial statements of the Fidelity Central Funds which are not covered by the Fund's Report of Independent Registered Public Accounting Firm, are available on the SEC web site or upon request.
Annual Report
Notes to Financial Statements - continued
3. Significant Accounting Policies.
The financial statements have been prepared in conformity with accounting principles generally accepted in the United States of America (GAAP), which require management to make certain estimates and assumptions at the date of the financial statements. Actual results could differ from those estimates. The following summarizes the significant accounting policies of the Fund:
Security Valuation. Investments are valued as of 4:00 p.m. Eastern time on the last calendar day of the period. The Fund uses independent pricing services approved by the Board of Trustees to value its investments. When current market prices or quotations are not readily available or reliable, valuations may be determined in good faith in accordance with procedures adopted by the Board of Trustees. Factors used in determining value may include market or security specific events,. The frequency with which these procedures are used cannot be predicted and they may be utilized to a significant extent. The value used for net asset value (NAV) calculation under these procedures may differ from published prices for the same securities.
The Fund categorizes the inputs to valuation techniques used to value its investments into a disclosure hierarchy consisting of three levels as shown below.
Level 1 - quoted prices in active markets for identical investments
Level 2 - other significant observable inputs (including quoted prices for similar investments, interest rates, prepayment speeds, etc.)
Level 3 - unobservable inputs (including the fund's own assumptions based on the best information available)
Changes in valuation techniques may result in transfers in or out of an assigned level within the disclosure hierarchy. The aggregate value of investments by input level, as of October 31, 2010 is included at the end of the Fund's Schedule of Investments. Valuation techniques used to value the Fund's investments by major category are as follows.
Equity securities, including restricted securities, for which market quotations are readily available, are valued at the last reported sale price or official closing price as reported by an independent pricing service on the primary market or exchange on which they are traded and are categorized as Level 1 in the hierarchy. In the event there were no sales during the day or closing prices are not available, securities are valued at the last quoted bid price or may be valued using the last available price and are generally categorized as Level 2 in the hierarchy. For foreign equity securities, when significant market or security specific events arise, comparisons to the valuation of American Depositary Receipts (ADRs), futures contracts, Exchange-traded funds (ETFs) and certain indexes as well as quoted prices for similar securities are used and are categorized as Level 2 in the hierarchy in these circumstances. Utilizing these techniques may result in transfers between
Annual Report
3. Significant Accounting Policies - continued
Security Valuation - continued
Level 1 and Level 2. For restricted equity securities and private placements where observable inputs are limited, assumptions about market activity and risk are used and are categorized as Level 3 in the hierarchy.
Investments in open-end mutual funds, including the Fidelity Central Funds, are valued at their closing net asset value each business day and are categorized as Level 1 in the hierarchy. Short-term securities with remaining maturities of sixty days or less for which quotations are not readily available are valued at amortized cost, which approximates fair value and are categorized as Level 2 in the hierarchy.
Foreign Currency. The Fund uses foreign currency contracts to facilitate transactions in foreign-denominated securities. Gains and losses from these transactions may arise from changes in the value of the foreign currency or if the counterparties do not perform under the contracts' terms.
Foreign-denominated assets, including investment securities, and liabilities are translated into U.S. dollars at the exchange rate at period end. Purchases and sales of investment securities, income and dividends received and expenses denominated in foreign currencies are translated into U.S. dollars at the exchange rate in effect on the transaction date.
The effects of exchange rate fluctuations on investments are included with the net realized and unrealized gain (loss) on investment securities. Other foreign currency transactions resulting in realized and unrealized gain (loss) are disclosed separately.
Investment Transactions and Income. For financial reporting purposes, the Fund's investment holdings and NAV include trades executed through the end of the last business day of the period. The NAV per share for processing shareholder transactions is calculated as of the close of business of the New York Stock Exchange (NYSE), normally 4:00 p.m. Eastern time and includes trades executed through the end of the prior business day. Gains and losses on securities sold are determined on the basis of identified cost and may include proceeds received from litigation. Dividend income is recorded on the ex-dividend date, except for certain dividends from foreign securities where the ex-dividend date may have passed, which are recorded as soon as the Fund is informed of the ex-dividend date. Non-cash dividends included in dividend income, if any, are recorded at the fair market value of the securities received. Distributions received on securities that represent a return of capital or capital gain are recorded as a reduction of cost of investments and/or as a realized gain. The Fund estimates the components of distributions received that may be considered return of capital distributions or capital gain distributions. Interest income and distributions from the Fidelity Central Funds are
Annual Report
Notes to Financial Statements - continued
3. Significant Accounting Policies - continued
Investment Transactions and Income - continued
accrued as earned. Interest income includes coupon interest and amortization of premium and accretion of discount on debt securities. Investment income is recorded net of foreign taxes withheld where recovery of such taxes is uncertain.
Expenses. Most expenses of the Trust can be directly attributed to a fund. Expenses which cannot be directly attributed are apportioned amongst each fund in the Trust. Expense estimates are accrued in the period to which they relate and adjustments are made when actual amounts are known.
Income Tax Information and Distributions to Shareholders. Each year the Fund intends to qualify as a regulated investment company, including distributing substantially all of its taxable income and realized gains under Subchapter M of the Internal Revenue Code and filing its U.S. federal tax return. As a result, no provision for income taxes is required. As of October 31, 2010, the Fund did not have any unrecognized tax benefits in the accompanying financial statements. A fund's federal tax return is subject to examination by the Internal Revenue Service (IRS) for a period of three years. Foreign taxes are provided for based on the Fund's understanding of the tax rules and rates that exist in the foreign markets in which it invests. The Fund is subject to a tax imposed on short term capital gains on securities of certain issuers domiciled in India. The Fund records an estimated deferred tax liability included in Other payables and accrued expenses in the accompanying Statement of Assets & Liabilities for net unrealized gains on these securities in an amount that would be payable if the securities were disposed of at period end.
Distributions are declared and recorded on the ex-dividend date. Income dividends and capital gain distributions are declared separately for each class. Income and capital gain distributions are determined in accordance with income tax regulations, which may differ from GAAP.
Capital accounts within the financial statements are adjusted for permanent book-tax differences. These adjustments have no impact on net assets or the results of operations. Temporary book-tax differences will reverse in a subsequent period.
Book-tax differences are primarily due to the short-term gain distributions from the Fidelity Central Funds, foreign currency transactions, certain foreign taxes, passive foreign investment companies (PFIC), market discount, partnerships, capital loss carryforwards and losses deferred due to wash sales.
Annual Report
3. Significant Accounting Policies - continued
Income Tax Information and Distributions to Shareholders - continued
The federal tax cost of investment securities and unrealized appreciation (depreciation) as of period end were as follows:
Gross unrealized appreciation | $ 10,616,625 |
Gross unrealized depreciation | (1,620,826) |
Net unrealized appreciation (depreciation) | $ 8,995,799 |
| |
Tax Cost | $ 72,102,751 |
The tax-based components of distributable earnings as of period end were as follows:
Undistributed ordinary income | $ 293,696 |
Capital loss carryforward | $ (10,598,573) |
Net unrealized appreciation (depreciation) | $ 8,996,900 |
The tax character of distributions paid was as follows:
| October 31, 2010 | October 31, 2009 |
Ordinary Income | $ 250,381 | $ 30,547 |
Short-Term Trading (Redemption) Fees. Shares held by investors in the Fund less than 30 days are subject to a redemption fee equal to 1.00% of the net asset value of shares redeemed. All redemption fees, which reduce the proceeds of the shareholder redemption, are retained by the Fund and accounted for as an addition to paid in capital.
4. Purchases and Sales of Investments.
Purchases and sales of securities, other than short-term securities, aggregated $90,878,912 and $59,054,389, respectively.
5. Fees and Other Transactions with Affiliates.
Management Fee. FMR and its affiliates provide the Fund with investment management related services for which the Fund pays a monthly management fee. The management fee is the sum of an individual fund fee rate that is based on an annual rate of .45% of the Fund's average net assets and a group fee rate that averaged .26% during the period. The group fee rate is based upon the average net assets of all the mutual funds advised by FMR. The group fee rate decreases as assets under management increase and increases as assets under management decrease. In addition, the management fee is subject to a performance adjustment (up to a maximum of ± .20% of the Fund's average net assets over a 36 month performance period). The upward or downward adjustment to
Annual Report
Notes to Financial Statements - continued
5. Fees and Other Transactions with Affiliates - continued
Management Fee - continued
the management fee is based on the relative investment performance of the Institutional class of the Fund, as compared to an appropriate benchmark index. For the period, the total annual management fee rate, including the performance adjustment, was .71% of the Fund's average net assets.
Distribution and Service Plan Fees. In accordance with Rule 12b-1 of the 1940 Act, the Fund has adopted separate Distribution and Service Plans for each class of shares. Certain classes pay Fidelity Distributors Corporation (FDC), an affiliate of FMR, separate Distribution and Service Fees, each of which is based on an annual percentage of each class' average net assets. In addition, FDC may pay financial intermediaries for selling shares of the Fund and providing shareholder support services. For the period, the Distribution and Service Fee rates, total fees and amounts retained by FDC were as follows:
| Distribution
Fee | Service
Fee | Total Fees | Retained
by FDC |
Class A | -% | .25% | $ 30,551 | $ 5,093 |
Class T | .25% | .25% | 60,860 | - |
Class B | .75% | .25% | 23,323 | 17,503 |
Class C | .75% | .25% | 42,063 | 8,529 |
| | | $ 156,797 | $ 31,125 |
Sales Load. FDC receives a front-end sales charge of up to 5.75% for selling Class A shares, and 3.50% for selling Class T shares, some of which is paid to financial intermediaries for selling shares of the Fund. FDC receives the proceeds of contingent deferred sales charges levied on Class A, Class T, Class B, and Class C redemptions. These charges depend on the holding period. The deferred sales charges range from 5% to 1% for Class B, 1% for Class C, 1.00% for certain purchases of Class A shares (1.00% to .50% prior to July 12, 2010) and .25% for certain purchases of Class T shares.
For the period, sales charge amounts retained by FDC were as follows:
| Retained
by FDC |
Class A | $ 24,244 |
Class T | 5,056 |
Class B* | 2,846 |
Class C* | 127 |
| $ 32,273 |
* When Class B and Class C shares are initially sold, FDC pays commissions from its own resources to financial intermediaries through which the sales are made.
Annual Report
5. Fees and Other Transactions with Affiliates - continued
Transfer Agent Fees. Fidelity Investments Institutional Operations Company, Inc. (FIIOC), an affiliate of FMR, is the transfer, dividend disbursing and shareholder servicing agent for each class of the Fund. FIIOC receives account fees and asset-based fees that vary according to the account size and type of account of the shareholders of the respective classes of the Fund. FIIOC pays for typesetting, printing and mailing of shareholder reports, except proxy statements. For the period, transfer agent fees for each class were as follows:
| Amount | % of
Average
Net Assets |
Class A | $ 36,166 | .30 |
Class T | 39,638 | .33 |
Class B | 7,434 | .32 |
Class C | 12,983 | .31 |
Institutional Class | 3,198 | .13 |
| $ 99,419 | |
Accounting and Security Lending Fees. Fidelity Service Company, Inc. (FSC), an affiliate of FMR, maintains the Fund's accounting records. The accounting fee is based on the level of average net assets for the month. Under a separate contract, FSC administers the security lending program. The security lending fee is based on the number and duration of lending transactions.
Brokerage Commissions. The Fund placed a portion of its portfolio transactions with brokerage firms which are affiliates of the investment adviser. The commissions paid to these affiliated firms were $2,884 for the period.
6. Committed Line of Credit.
The Fund participates with other funds managed by FMR or an affiliate in a $3.75 billion credit facility (the "line of credit") to be utilized for temporary or emergency purposes to fund shareholder redemptions or for other short-term liquidity purposes. The Fund has agreed to pay commitment fees on its pro-rata portion of the line of credit, which amounted to $118 and is reflected in Miscellaneous expenses on the Statement of Operations. During the period, there were no borrowings on this line of credit.
7. Security Lending.
The Fund lends portfolio securities through a lending agent from time to time in order to earn additional income. The lending agent may loan securities to certain qualified borrowers, including Fidelity Capital Markets (FCM), a broker-dealer affiliated with the Fund. On the settlement date of the loan, the Fund receives collateral (in the form of
Annual Report
Notes to Financial Statements - continued
7. Security Lending - continued
U.S. Treasury obligations, letters of credit and/or cash) against the loaned securities and maintains collateral in an amount not less than 100% of the market value of the loaned securities during the period of the loan. The market value of the loaned securities is determined at the close of business of the Fund and any additional required collateral is delivered to the Fund on the next business day. If the borrower defaults on its obligation to return the securities loaned because of insolvency or other reasons, a fund could experience delays and costs in recovering the securities loaned or in gaining access to the collateral. Any cash collateral received is invested in the Fidelity Securities Lending Cash Central Fund. The value of loaned securities and cash collateral at period end are disclosed on the Fund's Statement of Assets and Liabilities. Security lending income represents the income earned on investing cash collateral, less rebates paid to borrowers and lending agent fees associated with the loan, plus any premium payments received for lending certain types of securities. Security lending income is presented in the Statement of Operations as a component of income from Fidelity Central Funds. Total security lending income during the period amounted to $23,119. During the period, there were no securities loaned to FCM.
8. Expense Reductions.
FMR voluntarily agreed to reimburse each class to the extent annual operating expenses exceeded certain levels of average net assets as noted in the table below. Some expenses, for example interest expense, including commitment fees, are excluded from this reimbursement.
The following classes were in reimbursement during the period:
| Expense
Limitations * | Reimbursement
from adviser |
| | |
Class A | 1.50% | $ 48,068 |
Class T | 1.75% | 69,048 |
Class B | 2.25% | 13,462 |
Class C | 2.25% | 21,747 |
Institutional Class | 1.25% | 4,433 |
| | $ 156,758 |
* Expense limitation in effect at period end.
Effective November 1, 2010 the expense limitation will be changed to 1.45%, 1.70%, 2.20%, 2.20% and 1.20% for Class A, T, B, C and Institutional, respectively.
Annual Report
8. Expense Reductions - continued
Many of the brokers with whom FMR places trades on behalf of the Fund provided services to the Fund in addition to trade execution. These services included payments of certain expenses on behalf of the Fund totaling $18,918 for the period.
9. Distributions to Shareholders.
Distributions to shareholders of each class were as follows:
Years ended October 31, | 2010 | 2009 |
From net investment income | | |
Class A | $ 24,148 | $ 9,964 |
Class T | 14,394 | 12,905 |
Class B | - | 2,090 |
Class C | - | 2,937 |
Institutional Class | 6,497 | 2,651 |
Total | $ 45,039 | $ 30,547 |
From net realized gain | | |
Class A | $ 62,317 | $ - |
Class T | 95,962 | - |
Class B | 13,694 | - |
Class C | 23,177 | - |
Institutional Class | 10,192 | - |
Total | $ 205,342 | $ - |
10. Share Transactions.
Transactions for each class of shares were as follows:
| Shares | Dollars |
Years ended October 31, | 2010 | 2009 | 2010 | 2009 |
Class A | | | | |
Shares sold | 2,107,781 | 202,494 | $ 21,885,164 | $ 1,551,596 |
Reinvestment of distributions | 8,588 | 1,584 | 82,276 | 9,506 |
Shares redeemed | (226,391) | (433,602) | (2,293,965) | (2,853,060) |
Net increase (decrease) | 1,889,978 | (229,524) | $ 19,673,475 | $ (1,291,958) |
Class T | | | | |
Shares sold | 1,253,117 | 218,150 | $ 13,010,370 | $ 1,562,039 |
Reinvestment of distributions | 11,592 | 2,148 | 108,388 | 12,590 |
Shares redeemed | (363,578) | (235,220) | (3,522,646) | (1,618,407) |
Net increase (decrease) | 901,131 | (14,922) | $ 9,596,112 | $ (43,778) |
Annual Report
Notes to Financial Statements - continued
10. Share Transactions - continued
| Shares | Dollars |
Years ended October 31, | 2010 | 2009 | 2010 | 2009 |
Class B | | | | |
Shares sold | 87,120 | 54,249 | $ 802,164 | $ 377,037 |
Reinvestment of distributions | 1,450 | 341 | 12,817 | 1,894 |
Shares redeemed | (87,578) | (95,791) | (796,786) | (611,596) |
Net increase (decrease) | 992 | (41,201) | $ 18,195 | $ (232,665) |
Class C | | | | |
Shares sold | 501,896 | 77,779 | $ 4,858,487 | $ 549,994 |
Reinvestment of distributions | 2,379 | 477 | 21,027 | 2,645 |
Shares redeemed | (147,177) | (95,347) | (1,345,064) | (616,538) |
Net increase (decrease) | 357,098 | (17,091) | $ 3,534,450 | $ (63,899) |
Institutional Class | | | | |
Shares sold | 986,043 | 23,710 | $ 11,001,071 | $ 163,841 |
Reinvestment of distributions | 415 | 221 | 4,092 | 1,361 |
Shares redeemed | (9,490) | (65,564) | (104,782) | (461,579) |
Net increase (decrease) | 976,968 | (41,633) | $ 10,900,381 | $ (296,377) |
11. Other.
The Fund's organizational documents provide former and current trustees and officers with a limited indemnification against liabilities arising in connection with the performance of their duties to the Fund. In the normal course of business, the Fund may also enter into contracts that provide general indemnifications. The Fund's maximum exposure under these arrangements is unknown as this would be dependent on future claims that may be made against the Fund. The risk of material loss from such claims is considered remote.
Annual Report
To the Trustees of Fidelity Advisor Series VIII and the Shareholders of Fidelity Advisor Global Capital Appreciation Fund:
In our opinion, the accompanying statement of assets and liabilities, including the schedule of investments, and the related statements of operations and of changes in net assets and the financial highlights present fairly, in all material respects, the financial position of Fidelity Advisor Global Capital Appreciation Fund (a fund of Fidelity Advisor Series VIII) at October 31, 2010, the results of its operations for the year then ended, the changes in its net assets for each of the two years in the period then ended and the financial highlights for each of the five years in the period then ended, in conformity with accounting principles generally accepted in the United States of America. These financial statements and financial highlights (hereafter referred to as "financial statements") are the responsibility of the Fidelity Advisor Global Capital Appreciation Fund's management. Our responsibility is to express an opinion on these financial statements based on our audits. We conducted our audits of these financial statements in accordance with the standards of the Public Company Accounting Oversight Board (United States). Those standards require that we plan and perform the audit to obtain reasonable assurance about whether the financial statements are free of material misstatement. An audit includes examining, on a test basis, evidence supporting the amounts and disclosures in the financial statements, assessing the accounting principles used and significant estimates made by management, and evaluating the overall financial statement presentation. We believe that our audits, which included confirmation of securities at October 31, 2010 by correspondence with the custodian and brokers, provide a reasonable basis for our opinion.
/s/ PricewaterhouseCoopers LLP
PricewaterhouseCoopers LLP
Boston, Massachusetts
December 17, 2010
Annual Report
The Trustees, Member of the Advisory Board, and executive officers of the trust and fund, as applicable, are listed below. The Board of Trustees governs the fund and is responsible for protecting the interests of shareholders. The Trustees are experienced executives who meet periodically throughout the year to oversee the fund's activities, review contractual arrangements with companies that provide services to the fund, oversee management of the risks associated with such activities and contractual arrangements, and review the fund's performance. Except for James C. Curvey, each of the Trustees oversees 221 funds advised by FMR or an affiliate. Mr. Curvey oversees 410 funds advised by FMR or an affiliate.
The Trustees hold office without limit in time except that (a) any Trustee may resign; (b) any Trustee may be removed by written instrument, signed by at least two-thirds of the number of Trustees prior to such removal; (c) any Trustee who requests to be retired or who has become incapacitated by illness or injury may be retired by written instrument signed by a majority of the other Trustees; and (d) any Trustee may be removed at any special meeting of shareholders by a two-thirds vote of the outstanding voting securities of the trust. Each Trustee who is not an interested person (as defined in the 1940 Act) (Independent Trustee), shall retire not later than the last day of the calendar year in which his or her 72nd birthday occurs. The Independent Trustees may waive this mandatory retirement age policy with respect to individual Trustees. The executive officers and Advisory Board Member hold office without limit in time, except that any officer and Advisory Board Member may resign or may be removed by a vote of a majority of the Trustees at any regular meeting or any special meeting of the Trustees. Except as indicated, each individual has held the office shown or other offices in the same company for the past five years.
Experience, Skills, Attributes, and Qualifications of the Fund's Trustees. The Governance and Nominating Committee has adopted a statement of policy that describes the experience, qualifications, attributes, and skills that are necessary and desirable for potential Independent Trustee candidates (Statement of Policy). The Board believes that each Trustee satisfied at the time he or she was initially elected or appointed a Trustee, and continues to satisfy, the standards contemplated by the Statement of Policy. The Governance and Nominating Committee also engages professional search firms to help identify potential Independent Trustee candidates who have the experience, qualifications, attributes, and skills consistent with the Statement of Policy. From time to time, additional criteria based on the composition and skills of the current Independent Trustees, as well as experience or skills that may be appropriate in light of future changes to board composition, business conditions, and regulatory or other developments, have also been considered by the professional search firms and the Governance and Nominating Committee. In addition, the Board takes into account the Trustees' commitment and participation in Board and committee meetings, as well as their leadership of standing and ad hoc committees throughout their tenure.
In determining that a particular Trustee was and continues to be qualified to serve as a Trustee, the Board has considered a variety of criteria, none of which, in isolation, was controlling. The Board believes that, collectively, the Trustees have balanced and diverse experience, qualifications, attributes, and skills, which allow the Board to operate effectively in governing the fund and protecting the interests of shareholders. Information about the specific experience, skills, attributes, and qualifications of each Trustee, which in each case led to the Board's conclusion that the Trustee should serve (or continue to serve) as a trustee of the fund, is provided below.
Annual Report
Board Structure and Oversight Function. Edward C. Johnson 3d is an interested person (as defined in the 1940 Act) and currently serves as Chairman. The Trustees have determined that an interested Chairman is appropriate and benefits shareholders because an interested Chairman has a personal and professional stake in the quality and continuity of services provided to the fund. Independent Trustees exercise their informed business judgment to appoint an individual of their choosing to serve as Chairman, regardless of whether the Trustee happens to be independent or a member of management. The Independent Trustees have determined that they can act independently and effectively without having an Independent Trustee serve as Chairman and that a key structural component for assuring that they are in a position to do so is for the Independent Trustees to constitute a substantial majority for the Board. The Independent Trustees also regularly meet in executive session. Ned C. Lautenbach serves as Chairman of the Independent Trustees and as such (i) acts as a liaison between the Independent Trustees and management with respect to matters important to the Independent Trustees and (ii) with management prepares agendas for Board meetings.
Fidelity funds are overseen by different Boards of Trustees. The fund's Board oversees Fidelity's equity and high income funds and another Board oversees Fidelity's investment-grade bond, money market, and asset allocation funds. The asset allocation funds may invest in Fidelity funds overseen by the fund's Board. The use of separate Boards, each with its own committee structure, allows the Trustees of each group of Fidelity funds to focus on the unique issues of the funds they oversee, including common research, investment, and operational issues. On occasion, the separate Boards establish joint committees to address issues of overlapping consequences for the Fidelity funds overseen by each Board.
The Trustees operate using a system of committees to facilitate the timely and efficient consideration of all matters of importance to the Trustees, the fund, and fund shareholders and to facilitate compliance with legal and regulatory requirements and oversight of the fund's activities and associated risks. The Board, acting through its committees, has charged FMR and its affiliates with (i) identifying events or circumstances the occurrence of which could have demonstrably adverse effects on the fund's business and/or reputation; (ii) implementing processes and controls to lessen the possibility that such events or circumstances occur or to mitigate the effects of such events or circumstances if they do occur; and (iii) creating and maintaining a system designed to evaluate continuously business and market conditions in order to facilitate the identification and implementation processes described in (i) and (ii) above. Because the day-to-day operations and activities of the fund are carried out by or through FMR, its affiliates and other service providers, the fund's exposure to risks is mitigated but not eliminated by the processes overseen by the Trustees. While each of the Board's committees has responsibility for overseeing different aspects of the fund's activities, oversight is exercised primarily through the Operations, Audit, and Compliance Committees. Appropriate personnel, including but not limited to the fund's Chief Compliance Officer (CCO), FMR's internal auditor, the independent accountants, the fund's Treasurer and portfolio management personnel, make periodic reports to the Board's committees, as appropriate. The responsibilities of each committee, including their oversight responsibilities, are described further under "Standing Committees of the Fund's Trustees."
Annual Report
Trustees and Officers - continued
The fund's Statement of Additional Information (SAI) includes more information about the Trustees. To request a free copy, call Fidelity at 1-877-208-0098.
Interested Trustees*:
Correspondence intended for each Trustee who is an interested person may be sent to Fidelity Investments, 82 Devonshire Street, Boston, Massachusetts 02109.
Name, Age; Principal Occupations and Other Relevant Experience+ |
Edward C. Johnson 3d (80) |
| Year of Election or Appointment: 1983 Mr. Johnson is Trustee and Chairman of the Board of Trustees of certain Trusts. Mr. Johnson serves as Chief Executive Officer, Chairman, and a Director of FMR LLC; Chairman and a Director of FMR; Chairman and a Director of Fidelity Research & Analysis Company (FRAC); Chairman and a Director of Fidelity Investments Money Management, Inc.; and Chairman and a Director of FMR Co., Inc. In addition, Mr. Johnson serves as Chairman and Director of FIL Limited. Previously, Mr. Johnson served as President of FMR LLC (2006-2007). |
James C. Curvey (75) |
| Year of Election or Appointment: 2007 Mr. Curvey also serves as Trustee (2007-present) of other investment companies advised by FMR. Mr. Curvey is a Director of Fidelity Investments Money Management, Inc. (2009-present), Director of Fidelity Research & Analysis Co. (2009-present) and Director of FMR and FMR Co., Inc. (2007-present). Mr. Curvey is also Vice Chairman (2007-present) and Director of FMR LLC. In addition, Mr. Curvey serves as an Overseer for the Boston Symphony Orchestra and a member of the Trustees of Villanova University. Previously, Mr. Curvey was the Vice Chairman (2006-2007) and Director (2000-2007) of FMR Corp. |
* Trustees have been determined to be "Interested Trustees" by virtue of, among other things, their affiliation with the trust or various entities under common control with FMR.
Annual Report
+ The information above includes each Trustee's principal occupation during the last five years and other information relating to the experience, attributes, and skills relevant to each Trustee's qualifications to serve as a Trustee, which led to the conclusion that each Trustee should serve as a Trustee for the fund.
Independent Trustees:
Correspondence intended for each Independent Trustee (that is, the Trustees other than the Interested Trustees) may be sent to Fidelity Investments, P.O. Box 55235, Boston, Massachusetts 02205-5235.
Name, Age; Principal Occupations and Other Relevant Experience+ |
Dennis J. Dirks (62) |
| Year of Election or Appointment: 2005 Prior to his retirement in May 2003, Mr. Dirks was Chief Operating Officer and a member of the Board of The Depository Trust & Clearing Corporation (DTCC). He also served as President, Chief Operating Officer, and Board member of The Depository Trust Company (DTC) and President and Board member of the National Securities Clearing Corporation (NSCC). In addition, Mr. Dirks served as Chief Executive Officer and Board member of the Government Securities Clearing Corporation, Chief Executive Officer and Board member of the Mortgage-Backed Securities Clearing Corporation, as a Trustee and a member of the Finance Committee of Manhattan College (2005-2008), and as a Trustee and a member of the Finance Committee of AHRC of Nassau County (2006-2008). Mr. Dirks is a member of the Independent Directors Council (IDC) Governing Council (2010-Present) and Board of Directors for The Brookville Center for Children's Services, Inc. (2009-present). |
Alan J. Lacy (57) |
| Year of Election or Appointment: 2008 Mr. Lacy serves as Senior Adviser (2007-present) of Oak Hill Capital Partners, L.P. (private equity). Mr. Lacy also served as Chief Executive Officer (2000-2005) and Vice Chairman (2005-2006) of Sears Holdings Corporation and Sears, Roebuck and Co. (retail). In addition, Mr. Lacy serves as a member of the Board of Directors of The Western Union Company (global money transfer, 2006-present) and Bristol-Myers Squibb Company (global pharmaceuticals, 2007-present). Mr. Lacy is Chairman (2008-present) and a member (2006-present) of the Board of Trustees of The National Parks Conservation Association. |
Ned C. Lautenbach (66) |
| Year of Election or Appointment: 2000 Mr. Lautenbach is Chairman of the Independent Trustees of the Equity and High Income Funds (2006-present). Mr. Lautenbach currently serves as the Lead Director of the Eaton Corporation Board of Directors (diversified industrial, 1997-present). Mr. Lautenbach is also a member of the Board of Directors of the Philharmonic Center for the Arts in Naples, Florida (1999-present); a member of the Board of Trustees of Fairfield University (2005-present); and a member of the Council on Foreign Relations (1994-present). Previously, Mr. Lautenbach was a Partner/Advisory Partner at Clayton, Dubilier & Rice, Inc. (private equity investment, 1998-2010), as well as a Director of Sony Corporation (2006-2007). |
Joseph Mauriello (66) |
| Year of Election or Appointment: 2008 Prior to his retirement in January 2006, Mr. Mauriello served in numerous senior management positions including Deputy Chairman and Chief Operating Officer (2004-2005), and Vice Chairman of Financial Services (2002-2004) of KPMG LLP US (professional services, 1965-2005). Mr. Mauriello currently serves as a member of the Board of Directors of XL Group plc. (global insurance and re-insurance, 2006-present) and of Arcadia Resources Inc. (health care services and products, 2007-present). Previously, Mr. Mauriello served as a Director of the Hamilton Funds of the Bank of New York (2006-2007). |
Cornelia M. Small (66) |
| Year of Election or Appointment: 2005 Ms. Small is a member of the Board of Directors of the Teagle Foundation (2009-present). Ms. Small is also a member of the Investment Committee, and Chair (2008-present) and a member of the Board of Trustees of Smith College. In addition, Ms. Small serves on the Investment Committee of the Berkshire Taconic Community Foundation (2008-present). Previously, Ms. Small served as Chairperson of the Investment Committee (2002-2008) of Smith College. In addition, Ms. Small served as Chief Investment Officer, Director of Global Equity Investments, and a member of the Board of Directors of Scudder, Stevens & Clark and Scudder Kemper Investments. |
William S. Stavropoulos (71) |
| Year of Election or Appointment: 2001 Mr. Stavropoulos is Vice Chairman of the Independent Trustees of the Equity and High Income Funds (2006-present). Mr. Stavropoulos serves as President and Founder of the Michigan Baseball Foundation, the Great Lakes Loons (2007-present). Mr. Stavropoulos is Chairman Emeritus of the Board of Directors of The Dow Chemical Company, where he previously served in numerous senior management positions, including President, CEO (1995-2000; 2002-2004), Chairman of the Executive Committee (2000-2006), and as a member of the Board of Directors (1990-2006). Currently, Mr. Stavropoulos is Chairman of Univar (global distributor of commodity and specialty chemicals, 2010-present), a Director of Teradata Corporation (data warehousing and technology solutions, 2008-present), Chemical Financial Corporation, Maersk Inc. (industrial conglomerate), Tyco International, Inc. (multinational manufacturing and services, 2007-present), and a member of the Advisory Board for Metalmark Capital (private equity investment, 2005-
present). Mr. Stavropoulos is a special advisor to Clayton, Dubilier & Rice, Inc. (private equity investment). In addition, Mr. Stavropoulos is a member of the University of Notre Dame Advisory Council for the College of Science. |
David M. Thomas (61) |
| Year of Election or Appointment: 2008 Previously, Mr. Thomas served as Executive Chairman (2005-2006) and Chairman and Chief Executive Officer (2000-2005) of IMS Health, Inc. (pharmaceutical and healthcare information solutions). In addition, Mr. Thomas serves as a member of the Board of Directors of Fortune Brands, Inc. (consumer products), and Interpublic Group of Companies, Inc. (marketing communication, 2004-present). |
Michael E. Wiley (60) |
| Year of Election or Appointment: 2008 Mr. Wiley also serves as a Director of Asia Pacific Exploration Consolidated (international oil and gas exploration and production, 2008-present). Mr. Wiley serves as a Director of Tesoro Corporation (independent oil refiner and marketer, 2005-present), and a Director of Bill Barrett Corporation (exploration and production, 2005-present). In addition, Mr. Wiley also serves as a Director of Post Oak Bank (privately-held bank, 2004-present). Previously, Mr. Wiley served as a member of the Board of Trustees of the University of Tulsa (2000-2006; 2007-2010), as a Senior Energy Advisor of Katzenbach Partners, LLC (consulting, 2006-2007), as an Advisory Director of Riverstone Holdings (private investment), Chairman, President, and CEO of Baker Hughes, Inc. (oilfield services, 2000-2004), and as Director of Spinnaker Exploration Company (exploration and production, 2001-2005). |
Annual Report
Trustees and Officers - continued
+ The information above includes each Trustee's principal occupation during the last five years and other information relating to the experience, attributes, and skills relevant to each Trustee's qualifications to serve as a Trustee, which led to the conclusion that each Trustee should serve as a Trustee for the fund.
Advisory Board Member and Executive Officers:
Correspondence intended for each executive officer and Peter S. Lynch may be sent to Fidelity Investments, 82 Devonshire Street, Boston, Massachusetts 02109.
Name, Age; Principal Occupation |
Peter S. Lynch (66) |
| Year of Election or Appointment: 2003 Member of the Advisory Board of Fidelity's Equity and High Income Funds. Mr. Lynch is Vice Chairman and a Director of FMR and FMR Co., Inc. In addition, Mr. Lynch serves as a Trustee of Boston College and as the Chairman of the Inner-City Scholarship Fund. Previously, Mr. Lynch served on the Special Olympics International Board of Directors (1997-2006). |
Kenneth B. Robins (41) |
| Year of Election or Appointment: 2008 President and Treasurer of Fidelity's Equity and High Income Funds. Mr. Robins also serves as President and Treasurer (2010-present) and Assistant Treasurer (2009-present) of other Fidelity funds and is an employee of Fidelity Investments (2004-present). Previously, Mr. Robins served as Deputy Treasurer of the Fidelity funds (2005-2008) and Treasurer and Chief Financial Officer of The North Carolina Capital Management Trust: Cash and Term Portfolios (2006-2008). |
Bruce T. Herring (45) |
| Year of Election or Appointment: 2006 Vice President of certain Equity Funds. Mr. Herring also serves as Chief Investment Officer and Director of Fidelity Management & Research (U.K.) Inc. (2010-present) and Group Chief Investments Officer of FMR. Previously, Mr. Herring served as Vice President (2005-2006) and Senior Vice President (2006-2007) of Fidelity Management & Research Company, Vice President of FMR Co., Inc. (2001-2007) and as a portfolio manager for Fidelity U.S. Equity Funds. |
Brian B. Hogan (46) |
| Year of Election or Appointment: 2009 Vice President of certain Equity Funds and Vice President of Sector Funds. Mr. Hogan also serves as President of FMR's Equity Division (2009-present). Previously, Mr. Hogan served as Senior Vice President, Equity Research of FMR (2006-2009) and as a portfolio manager. |
Scott C. Goebel (42) |
| Year of Election or Appointment: 2008 Secretary and Chief Legal Officer (CLO) of the Fidelity funds. Mr. Goebel also serves as Secretary and CLO of The North Carolina Capital Management Trust: Cash and Term Portfolio (2008-present); General Counsel, Secretary, and Senior Vice President of FMR (2008-present) and FMR Co., Inc. (2008-present); Deputy General Counsel of FMR LLC; Chief Legal Officer of Fidelity Management & Research (Hong Kong) Limited (2008-present) and Assistant Secretary of Fidelity Management & Research (Japan) Inc. (2008-present), Fidelity Investments Money Management, Inc. (2008-present), Fidelity Management & Research (U.K.) Inc. (2008-present), and Fidelity Research and Analysis Company (2008-present). Previously, Mr. Goebel served as Assistant Secretary of the Funds (2007-2008) and as Vice President and Secretary of Fidelity Distributors Corporation (FDC) (2005-2007). |
William C. Coffey (41) |
| Year of Election or Appointment: 2009 Assistant Secretary of Fidelity's Equity and High Income Funds. Mr. Coffey also serves as Senior Vice President and Deputy General Counsel of FMR LLC (2010-present), and is an employee of Fidelity Investments. Previously, Mr. Coffey served as Vice President and Associate General Counsel of FMR LLC (2005-2009). |
Holly C. Laurent (56) |
| Year of Election or Appointment: 2008 Anti-Money Laundering (AML) Officer of the Fidelity funds. Ms. Laurent also serves as AML Officer of The North Carolina Capital Management Trust: Cash and Term Portfolio (2008-present) and is an employee of Fidelity Investments. Previously, Ms. Laurent was Senior Vice President and Head of Legal for Fidelity Business Services India Pvt. Ltd. (2006-2008), and Senior Vice President, Deputy General Counsel and Group Head for FMR LLC (2005-2006). |
Christine Reynolds (52) |
| Year of Election or Appointment: 2008 Chief Financial Officer of the Fidelity funds. Ms. Reynolds became President of Fidelity Pricing and Cash Management Services (FPCMS) in August 2008. Ms. Reynolds served as Chief Operating Officer of FPCMS (2007-2008). Previously, Ms. Reynolds served as President, Treasurer, and Anti-Money Laundering officer of the Fidelity funds (2004-2007). |
Kenneth A. Rathgeber (63) |
| Year of Election or Appointment: 2004 Chief Compliance Officer of Fidelity's Equity and High Income Funds. Mr. Rathgeber is Chief Compliance Officer of Fidelity Management & Research (Hong Kong) Limited (2008-present), Fidelity Management & Research (Japan) Inc. (2008-present), FMR (2005-present), FMR Co., Inc. (2005-present), Fidelity Management & Research (U.K.) Inc. (2005-present), Fidelity Research & Analysis Company (2005-present), Fidelity Investments Money Management, Inc. (2005-present), Pyramis Global Advisors, LLC (2005-present), and Strategic Advisers, Inc. (2005-present). |
Jeffrey S. Christian (49) |
| Year of Election or Appointment: 2009 Deputy Treasurer of the Fidelity funds. Mr. Christian is an employee of Fidelity Investments. Previously, Mr. Christian served as Chief Financial Officer (2008-2009) of certain Fidelity funds and Senior Vice President of Fidelity Pricing and Cash Management Services (FPCMS) (2004-2009). |
Bryan A. Mehrmann (49) |
| Year of Election or Appointment: 2005 Deputy Treasurer of the Fidelity funds. Mr. Mehrmann is an employee of Fidelity Investments. |
Adrien E. Deberghes (43) |
| Year of Election or Appointment: 2008 Deputy Treasurer of Fidelity's Equity and High Income Funds. Mr. Deberghes also serves as Assistant Treasurer of other Fidelity funds (2010-present) and is an employee of Fidelity Investments (2008-present). Previously, Mr. Deberghes served as Senior Vice President of Mutual Fund Administration at State Street Corporation (2007-2008), Senior Director of Mutual Fund Administration at Investors Bank & Trust (2005-2007), and Director of Finance for Dunkin' Brands (2000-2005). |
Stephanie J. Dorsey (41) |
| Year of Election or Appointment: 2010 Assistant Treasurer of Fidelity's Equity and High Income Funds. Ms. Dorsey also serves as Deputy Treasurer of other Fidelity funds (2008-present) and is an employee of Fidelity Investments (2008-present). Previously, Ms. Dorsey served as Treasurer (2004-2008) of the JPMorgan Mutual Funds and Vice President (2004-2008) of JPMorgan Chase Bank. |
Name, Age; Principal Occupation |
John R. Hebble (52) |
| Year of Election or Appointment: 2009 Assistant Treasurer of Fidelity's Equity and High Income Funds. Mr. Hebble also serves as Treasurer and Chief Financial Officer of The North Carolina Capital Management Trust: Cash and Term Portfolio (2008-present), President and Treasurer of other Fidelity funds (2008-present) and is an employee of Fidelity Investments. |
Gary W. Ryan (52) |
| Year of Election or Appointment: 2005 Assistant Treasurer of the Fidelity funds. Mr. Ryan is an employee of Fidelity Investments. Previously, Mr. Ryan served as Vice President of Fund Reporting in Fidelity Pricing and Cash Management Services (FPCMS) (1999-2005). |
Jonathan Davis (42) |
| Year of Election or Appointment: 2010 Assistant Treasurer of the Fidelity funds. Mr. Davis is an employee of Fidelity Investments. Previously, Mr. Davis served as Vice President and Associate General Counsel of FMR LLC (2003-2010). |
Annual Report
The Board of Trustees of Advisor Global Capital Appreciation Fund voted to pay to shareholders of record at the opening of business on record date, the following distributions per share derived from capital gains realized from sales of portfolio securities, and dividends derived from net investment income:
| Pay Date | Record Date | Dividends | Capital Gains |
Class A | 12/06/10 | 12/03/10 | $0.000 | $0.042 |
Class T | 12/06/10 | 12/03/10 | $0.000 | $0.029 |
Class B | 12/06/10 | 12/03/10 | $0.000 | $0.000 |
Class C | 12/06/10 | 12/03/10 | $0.000 | $0.017 |
Class A designates 30%, Class T designates 36%, Class B designates 56%, and Class C designates 53% of the dividends distributed during the fiscal year as qualifying for the dividends-received deduction for corporate shareholders.
Class A, Class T, Class B and Class C designates 100% of the dividends distributed during the fiscal year as amounts which may be taken into account as a dividend for purposes of the maximum rate under section 1(h)(11) of the Internal Revenue Code.
The amounts per share which represent income derived from sources within, and taxes paid to, foreign countries or possessions of the United States are as follows:
| Pay Date | Income | Taxes |
Class A | 12/07/09 | $0.071 | $0.0127 |
Class T | 12/07/09 | $0.060 | $0.0127 |
Class B | 12/07/09 | $0.039 | $0.0127 |
Class C | 12/07/09 | $0.040 | $0.0127 |
The fund will notify shareholders in January 2011 of amounts for use in preparing 2010 income tax returns.
Annual Report
Board Approval of Investment Advisory Contracts and Management Fees
Fidelity Advisor Global Capital Appreciation Fund
Each year, the Board of Trustees, including the Independent Trustees (together, the Board), votes on the renewal of the management contract and sub-advisory agreements (together, the Advisory Contracts) for the fund. The Board, assisted by the advice of fund counsel and Independent Trustees' counsel, requests and considers a broad range of information relevant to the renewal of the Advisory Contracts throughout the year.
The Board meets regularly and considers at each of its meetings factors that are relevant to its annual consideration of the renewal of the fund's Advisory Contracts, including the services and support provided to the fund and its shareholders. The Board has established various standing committees, each composed of Independent Trustees with varying backgrounds, to which the Board has assigned specific subject matter responsibilities in order to enhance effective decision-making by the Board. The Board, acting directly and through its Committees, requests and receives information concerning the annual consideration of the renewal of the fund's Advisory Contracts. The Board also meets as needed to consider matters specifically related to the Board's annual consideration of the renewal of Advisory Contracts. Members of the Board may also meet with trustees of other Fidelity funds through ad hoc joint committees to discuss certain matters relevant to the Fidelity funds.
At its July 2010 meeting, the Board of Trustees, including the Independent Trustees, unanimously determined to renew the fund's Advisory Contracts. In reaching its determination, the Board considered all factors it believed relevant, including (i) the nature, extent, and quality of the services to be provided to the fund and its shareholders (including the investment performance of the fund); (ii) the competitiveness of the fund's management fee and total expenses; (iii) the total costs of the services to be provided by and the profits to be realized by Fidelity from its relationship with the fund; (iv) the extent to which economies of scale would be realized as the fund grows; and (v) whether fee levels reflect these economies of scale, if any, for the benefit of fund shareholders.
In considering whether to renew the Advisory Contracts for the fund, the Board reached a determination, with the assistance of fund counsel and Independent Trustees' counsel and through the exercise of its business judgment, that the renewal of the Advisory Contracts is in the best interests of fund shareholders and that the compensation to be received by Fidelity under the management contract is fair and reasonable. The Board's decision to renew the Advisory Contracts was not based on any single factor noted above, but rather was based on a comprehensive consideration of all the information provided to the Board at its meetings throughout the year. The Board, in reaching its determination to renew the Advisory Contracts, is aware that shareholders in the fund have a broad range of investment choices available to them, including a wide choice among mutual funds offered by Fidelity's competitors, and that the fund's shareholders, with the opportunity to review and weigh the disclosure provided by the fund in its prospectus and other public disclosures, have chosen to invest in this fund, managed by Fidelity.
Annual Report
Board Approval of Investment Advisory Contracts and
Management Fees - continued
Nature, Extent, and Quality of Services Provided. The Board considered the staffing within the investment adviser, FMR, and the sub-advisers (together, the Investment Advisers), including the backgrounds of the fund's investment personnel and the fund's investment objective and discipline. The Independent Trustees also had discussions with senior management of Fidelity's investment operations and investment groups. The Board considered the structure of the portfolio manager compensation program and whether this structure provides appropriate incentives to act in the best interest of the fund.
Resources Dedicated to Investment Management and Support Services. The Board and the equity research subcommittee of the Board's Fund Oversight Committee reviewed the size, education, and experience of the Investment Advisers' investment staff, their use of technology, and the Investment Advisers' approach to recruiting, training, and retaining portfolio managers and other research, advisory, and management personnel. The Board noted that Fidelity's analysts have access to a variety of technological tools and market and securities data that enable them to perform both fundamental and quantitative analysis and to specialize in various disciplines. The Board considered Fidelity's extensive global research capabilities that enable the Investment Advisers to aggregate data from various sources in an effort to produce positive investment results. The Board also considered that Fidelity's portfolio managers and analysts have access to daily portfolio attribution that allows for monitoring of a fund's portfolio, as well as an electronic communication system that provides immediate real-time access to research concerning issuers and credit enhancers. The Board noted FMR's continued focus on strengthening the organization and discipline of equity portfolio management and research.
Shareholder and Administrative Services. The Board considered (i) the nature, extent, quality, and cost of advisory, administrative, and shareholder services performed by the Investment Advisers and their affiliates under the Advisory Contracts and under separate agreements covering transfer agency, pricing and bookkeeping, and securities lending services for the fund; (ii) the nature and extent of the investment adviser's supervision of third party service providers, principally custodians and subcustodians; and (iii) the resources devoted to, and the record of compliance with, the fund's compliance policies and procedures. The Board also reviewed the allocation of fund brokerage, including allocations to brokers affiliated with the Investment Advisers, the use of brokerage commissions to pay fund expenses, and the use of "soft" commission dollars to pay for research services.
The Board noted that the growth of fund assets over time across the complex allows Fidelity to reinvest in the development of services designed to enhance the value or convenience of the Fidelity funds as investment vehicles. These services include 24-hour access to account information and market information through phone representatives and over the Internet, and investor education materials and asset allocation tools.
Annual Report
Investment in a Large Fund Family. The Board considered the benefits to shareholders of investing in a Fidelity fund, including the benefits of investing in a fund that is part of a large family of funds offering a variety of investment disciplines and providing a large variety of mutual fund investor services. The Board noted that Fidelity had taken, or had made recommendations that resulted in the Fidelity funds taking, a number of actions over the previous year that benefited particular funds, including (i) dedicating additional resources to investment research and restructuring and broadening the focus of the investment research teams; (ii) bolstering the senior management team that oversees asset management; (iii) launching Class F of certain funds as a lower-fee class available to Freedom K and Freedom Index Funds; (iv) lowering the initial investment minimums and ongoing balance requirements for Real Estate High Income Fund; (v) eliminating subsequent purchase minimums for all funds and adding a waiver of the investment minimum requirement for new accounts opened with the proceeds of a systematic withdrawal plan; (vi) eliminating the withdrawal minimum and maximum limits for systematic withdrawals from Advisor funds; (vii) expanding sales load waivers on Class A shares for Destiny Planholders and expanding Institutional Class eligibility for Class O Destiny Planholders; and (viii) changing certain Class A and Class T sales charge structures to further align them with industry practices.
Investment Performance. The Board considered whether the fund has operated in accordance with its investment objective, as well as its record of compliance with its investment restrictions. It also reviewed the fund's absolute investment performance for each class, as well as the fund's relative investment performance for each class measured over multiple periods against (i) a broad-based securities market index, and (ii) a peer group of mutual funds deemed appropriate by Fidelity and reviewed by the Board. The following charts considered by the Board show, over the one-, three-, and five-year periods ended December 31, 2009, the cumulative total returns of Institutional Class (Class I) and Class C of the fund, the cumulative total returns of a broad-based securities market index ("benchmark"), and a range of cumulative total returns of a peer group of mutual funds identified by Morningstar, Inc. as having an investment style similar to that of the fund based on underlying portfolio holdings. The returns of Institutional Class (Class I) and Class C show the performance of the highest and lowest performing classes, respectively (based on five-year performance). The box within each chart shows the 25th percentile return (bottom of box) and the 75th percentile return (top of box) of the peer group. Returns shown above the box are in the first quartile and returns shown below the box are in the fourth quartile. The percentage beaten numbers noted below each chart correspond to the percentile box and represent the percentage of funds in the peer group whose performance was equal to or lower than that of the class indicated.
Annual Report
Board Approval of Investment Advisory Contracts and
Management Fees - continued
Fidelity Advisor Global Capital Appreciation Fund
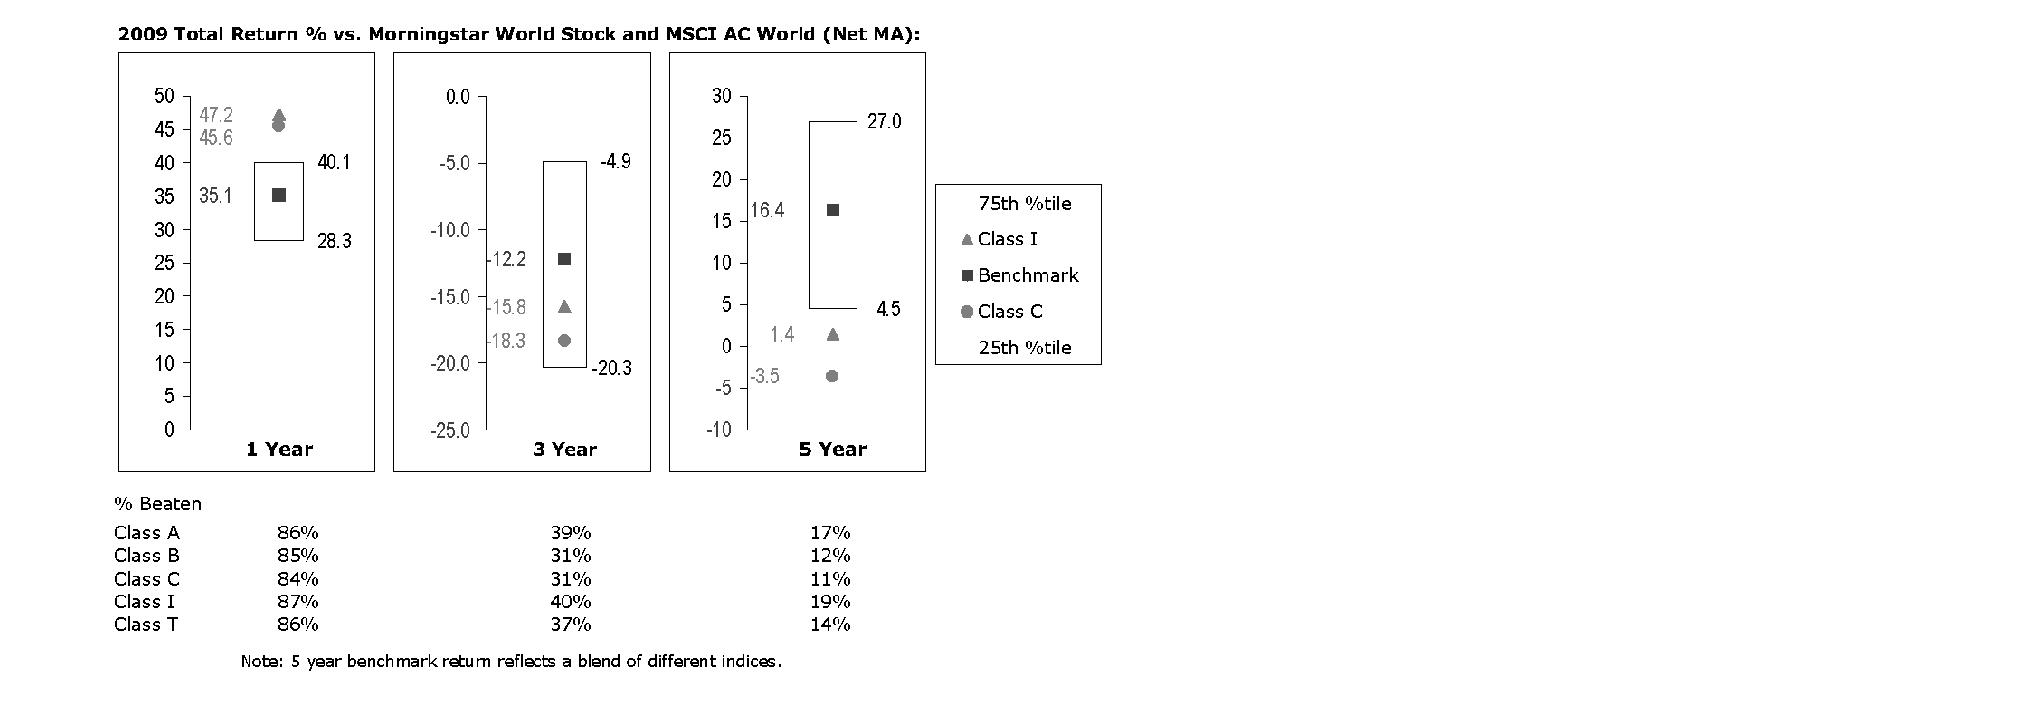
The Board reviewed the fund's relative investment performance against its peer group and noted that the performance of Institutional Class (Class I) of the fund was in the first quartile for the one-year period, the third quartile for the three-year period, and the fourth quartile for the five-year period. The Board also noted that the investment performance of the fund was lower than its benchmark for the three- and five-year periods, although the one-year cumulative total return of Institutional Class (Class I) compared favorably to its benchmark. The Board considered that the variations in performance among the fund's classes reflect the variations in class expenses, which result in lower performance for higher expense classes. The Board also reviewed the fund's performance since inception as well as performance in the current year.
The Board also considered that the fund's management fee is subject to upward or downward adjustment depending upon whether, and to what extent, the fund's investment performance for the performance period exceeds, or is exceeded by, the record (over the same period) of a Board-approved performance adjustment index. The Board realizes that the performance adjustment provides FMR with a strong economic incentive to seek to achieve superior performance for the fund's shareholders and helps to more closely align the interests of FMR and the fund's shareholders.
Based on its review, and giving particular weight to the nature and quality of the resources dedicated by the Investment Advisers to maintain and improve relative performance and factoring in the unprecedented market events in recent years, the Board concluded that the nature, extent, and quality of investment management and support services and of shareholder and administrative services provided to the fund will benefit the fund's shareholders, particularly in light of the Board's view that the fund's shareholders benefit from investing in a fund that is part of a large family of funds offering a variety of investment disciplines and services.
Annual Report
Competitiveness of Management Fee and Total Fund Expenses. The Board considered the fund's management fee and total expenses compared to "mapped groups" of competitive funds and classes. Fidelity creates "mapped groups" by combining similar Lipper investment objective categories that have comparable management fee characteristics. Combining Lipper investment objective categories aids the Board's management fee and total expense comparisons by broadening the competitive group used for comparison and by reducing the number of universes to which various Fidelity funds are compared.
Management Fee. The Board considered two proprietary management fee comparisons for the 12-month periods shown in the chart below. The group of Lipper funds used by the Board for management fee comparisons is referred to below as the "Total Mapped Group." The Total Mapped Group comparison focuses on a fund's standing relative to the total universe of comparable funds available to investors, in terms of gross management fees before expense reimbursements or caps, and without giving effect to the fund's performance adjustment. "TMG %" represents the percentage of funds in the Total Mapped Group that had management fees that were lower than the fund's. For example, a TMG % of 15% means that 85% of the funds in the Total Mapped Group had higher management fees than the fund. The "Asset-Size Peer Group" (ASPG) comparison focuses on a fund's standing relative to non-Fidelity funds similar in size to the fund within the Total Mapped Group. The ASPG represents at least 15% of the funds in the Total Mapped Group with comparable asset size and management fee characteristics, subject to a minimum of 50 funds (or all funds in the Total Mapped Group if fewer than 50). Additional information, such as the ASPG quartile in which the fund's management fee ranked and the impact of the fund's performance adjustment, is also included in the chart and considered by the Board.
Annual Report
Board Approval of Investment Advisory Contracts and
Management Fees - continued
Fidelity Advisor Global Capital Appreciation Fund

The Board noted that the fund's management fee ranked below the median of its Total Mapped Group and below the median of its ASPG for 2009. The Board also noted the effect of the fund's negative performance adjustment on the fund's management fee ranking. The Board noted that the performance adjustment for each year represents calculations for performance periods that differ from the periods shown in the performance charts above.
Based on its review, the Board concluded that the fund's management fee is fair and reasonable in light of the services that the fund receives and the other factors considered.
Total Expenses. In its review of each class's total expenses, the Board considered the fund's management fee as well as other fund or class expenses, as applicable, such as transfer agent fees, pricing and bookkeeping fees, fund-paid 12b-1 fees, and custodial, legal, and audit fees. The Board also noted the effects of any waivers and reimbursements on fees and expenses, as well as the impact of the fund's performance adjustment. As part of its review, the Board also considered current and historical total expenses of each class of the fund compared to competitive fund median expenses. Each class of the fund is compared to those funds and classes in the Total Mapped Group (used by the Board for management fee comparisons) that have a similar sales load structure.
The Board noted that the total expenses of Class A ranked below its competitive median for 2009, the total expenses of Class B ranked equal to its competitive median for 2009, and the total expenses of each of Class T, Class C, and Institutional Class ranked above its competitive median for 2009. The Board considered that the total expenses for Class T were above the median primarily because its 12b-1 fee is higher than the typical front-end load class. The Board noted that the fund offers multiple classes, each of which has a different sales load and 12b-1 fee structure, and that the multiple structures are intended to offer a range of pricing options for the intermediary market. The Board also noted that the total expenses of the classes vary primarily by the level of their 12b-1 fees, although differences in transfer agent fees may also cause expenses to vary from class to class.
Annual Report
Fees Charged to Other Fidelity Clients. The Board also considered Fidelity fee structures and other information with respect to clients of FMR and its affiliates, such as other mutual funds advised or subadvised by FMR or its affiliates, pension plan clients, and other institutional clients. In March 2010, the Board created an ad hoc joint committee with the board of other Fidelity funds (the Committee) to review and compare Fidelity's institutional investment advisory business with its business of providing services to the Fidelity funds, including the differences in services provided, fees charged, and costs incurred, as well as competition in their respective marketplaces.
Based on its review of total expenses and fees charged to other Fidelity clients, the Board concluded that the total expenses of each class of the fund were reasonable, although in some cases above the median of the universe presented for comparison, in light of the services that the fund and its shareholders receive and the other factors considered, including the findings of the Committee.
Costs of the Services and Profitability. The Board considered the revenues earned and the expenses incurred by Fidelity in conducting the business of developing, marketing, distributing, managing, administering and servicing the fund and its shareholders. The Board also considered the level of Fidelity's profits in respect of all the Fidelity funds.
On an annual basis, FMR presents to the Board Fidelity's profitability for the fund. Fidelity calculates the profitability for each fund, as well as aggregate profitability for groups of Fidelity funds and all Fidelity funds, using a series of detailed revenue and cost allocation methodologies which originate with the audited books and records of Fidelity. The Audit Committee of the Board reviews any significant changes from the prior year's methodologies.
PricewaterhouseCoopers LLP (PwC), independent registered public accounting firm and auditor to Fidelity and certain Fidelity funds, has been engaged annually by the Board as part of the Board's assessment of Fidelity's profitability analysis. PwC's engagement includes the review and assessment of Fidelity's methodologies used in determining the revenues and expenses attributable to Fidelity's mutual fund business, and completion of agreed-upon procedures surrounding the mathematical accuracy of fund profitability and its conformity to allocation methodologies. After considering PwC's reports issued under the engagement and information provided by Fidelity, the Board believes that while other allocation methods may also be reasonable, Fidelity's profitability methodologies are reasonable in all material respects.
Annual Report
Board Approval of Investment Advisory Contracts and
Management Fees - continued
The Board has also reviewed Fidelity's non-fund businesses and fall-out benefits related to the mutual fund business as well as cases where Fidelity's affiliates may benefit from or be related to the fund's business.
The Board considered the costs of the services provided by and the profits realized by Fidelity in connection with the operation of the fund and were satisfied that the profitability was not excessive in the circumstances.
Economies of Scale. The Board considered whether there have been economies of scale in respect of the management of the Fidelity funds, whether the Fidelity funds (including the fund) have appropriately benefited from any such economies of scale, and whether there is potential for realization of any further economies of scale. The Board considered the extent to which the fund will benefit from economies of scale through increased services to the fund, through waivers or reimbursements, or through fee or expense reductions.
In February 2009, the Board and the board of other Fidelity funds created an ad hoc committee (the Economies of Scale Committee) to analyze whether FMR attains economies of scale in respect of the management and servicing of the Fidelity funds, whether the Fidelity funds have appropriately benefited from such economies of scale, and whether there is potential for realization of any further economies of scale.
The Board recognized that the fund's management contract incorporates a "group fee" structure, which provides for lower group fee rates as total fund assets under FMR's management increase, and for higher group fee rates as total fund assets under FMR's management decrease. FMR calculates the group fee rates based on a tiered asset "breakpoint" schedule that varies based on asset class. The Board considered that the group fee is designed to deliver the benefits of economies of scale to fund shareholders when total Fidelity fund assets increase, even if assets of any particular fund are unchanged or have declined, because some portion of Fidelity's costs are attributable to services provided to all Fidelity funds, and all funds benefit if those costs can be allocated among more assets. The Board concluded that, given the group fee structure, fund shareholders will benefit from lower management fees as assets under FMR's management increase at the fund complex level, regardless of whether Fidelity achieves any such economies of scale.
The Board concluded, considering the findings of the Economies of Scale Committee, that any potential economies of scale are being appropriately shared between fund shareholders and Fidelity.
Additional Information Requested by the Board. In order to develop fully the factual basis for consideration of the Fidelity funds' Advisory Contracts, the Board requested and received additional information on certain topics, including (i) fund performance trends, actions to be taken by FMR to improve certain funds' overall performance, and Fidelity's long-term strategies for certain funds; (ii) portfolio manager changes that have occurred during the past year and length of portfolio manager tenure for different categories of funds over time; (iii) Fidelity's compensation structure for portfolio managers, research analysts, and other key personnel, the rationale for the compensation structure, and how the compensation structure provides appropriate performance incentives; (iv) the amount of the investment that each portfolio manager has made in the Fidelity fund(s) that he or she manages; (v) management and other fees paid by FMR to affiliated sub-advisers on behalf of the Fidelity funds; (vi) Fidelity's fee structures and rationale for recommending different fees among different categories of funds; (vii) Fidelity's rationale for recommending which funds should have a performance adjustment component as part of their management fees; (viii) the rationale for any differences between fund fee structures and fee structures in place for other Fidelity clients; and (ix) explanations regarding the relative total expenses borne by certain funds and classes, total expense competitive trends, and actions that might be taken by FMR to reduce total expenses for certain funds and classes.
Annual Report
Based on its evaluation of all of the conclusions noted above, and after considering all factors it believed relevant, the Board ultimately concluded that the advisory fee structures are fair and reasonable, and that the fund's Advisory Contracts should be renewed.
Annual Report
Investment Adviser
Fidelity Management & Research Company
Boston, MA
Investment Sub-Advisers
FMR Co., Inc.
Fidelity Management & Research
(U.K.) Inc.
Fidelity Research & Analysis Company
FIL Investment Advisors
FIL Investments (Japan) Limited
FIL Investment Advisors (UK) Limited
Fidelity Management & Research
(Hong Kong) Limited
Fidelity Management & Research
(Japan) Inc.
General Distributor
Fidelity Distributors Corporation
Boston, MA
Transfer and Service Agents
Fidelity Investments Institutional Operations Company, Inc.
Boston, MA
Fidelity Service Company, Inc.
Boston, MA
Custodian
State Street Bank and Trust Company
Quincy, MA
AGLO-UANN-1210
1.784744.107
(Fidelity Investment logo)(registered trademark)
Fidelity AdvisorSM
Global Capital Appreciation
Fund - Institutional Class
Annual Report
October 31, 2010
(2_fidelity_logos) (Registered_Trademark)
Contents
Chairman's Message | <Click Here> | The Chairman's message to shareholders. |
Performance | <Click Here> | How the fund has done over time. |
Management's Discussion
of Fund Performance | <Click Here> | The Portfolio Manager's review of fund performance, strategy and outlook. |
Shareholder Expense Example | <Click Here> | An example of shareholder expenses. |
Investment Changes | <Click Here> | A summary of major shifts in the fund's investments over the past six months. |
Investments | <Click Here> | A complete list of the fund's investments with their market values. |
Financial Statements | <Click Here> | Statements of assets and liabilities, operations, and changes in net assets, as well as financial highlights. |
Notes | <Click Here> | Notes to financial statements. |
Report of Independent Registered Public Accounting Firm | <Click Here> | |
Trustees and Officers | <Click Here> | |
Distributions | <Click Here> | |
Board Approval of Investment Advisory Contracts and Management Fees | <Click Here> | |
To view a fund's proxy voting guidelines and proxy voting record for the 12-month period ended June 30, visit http://www.fidelity.com/proxyvotingresults or visit the Securities and Exchange Commission's (SEC) web site at http://www.sec.gov. You may also call 1-877-208-0098 to request a free copy of the proxy voting guidelines.
Standard & Poor's, S&P and S&P 500 are registered service marks of The McGraw-Hill Companies, Inc. and have been licensed for use by Fidelity Distributors Corporation.
Other third party marks appearing herein are the property of their respective owners.
All other marks appearing herein are registered or unregistered trademarks or service marks of FMR LLC or an affiliated company.
Annual Report
This report and the financial statements contained herein are submitted for the general information of the shareholders of the fund. This report is not authorized for distribution to prospective investors in the fund unless preceded or accompanied by an effective prospectus.
A fund files its complete schedule of portfolio holdings with the SEC for the first and third quarters of each fiscal year on Form N-Q. Forms N-Q are available on the SEC's web site at http://www.sec.gov. A fund's Forms N-Q may be reviewed and copied at the SEC's Public Reference Room in Washington, DC. Information regarding the operation of the SEC's Public Reference Room may be obtained by calling 1-800-SEC-0330. For a complete list of a fund's portfolio holdings, view the most recent holdings listing, semiannual report, or annual report on Fidelity's web site at http://www.fidelity.com or http://www.advisor.fidelity.com, as applicable.
NOT FDIC INSURED • MAY LOSE VALUE • NO BANK GUARANTEE
Neither the fund nor Fidelity Distributors Corporation is a bank.
Annual Report
(photo_of_Edward_C_Johnson_3d)
Dear Shareholder:
Equities have staged a rally in the second half of 2010, shaking off concerns about the European debt crisis and the possibility of a double-dip recession in the U.S. Although the short-term surge pushed major equity indexes back into positive territory for the year, several questions remain about the longer-term outlook, including lackluster economic growth and persistently high unemployment. Financial markets are always unpredictable, of course, but there also are several time-tested investment principles that can help put the odds in your favor.
One of the basic tenets is to invest for the long term. Over time, riding out the markets' inevitable ups and downs has proven much more effective than selling into panic or chasing the hottest trend. Even missing only a few of the markets' best days can significantly diminish investor returns. Patience also affords the benefits of compounding - of earning interest on additional income or reinvested dividends and capital gains. There can be tax advantages and cost benefits to consider as well. While staying the course doesn't eliminate risk, it can considerably lessen the effect of short-term declines.
You can further manage your investing risk through diversification. And today, more than ever, geographic diversification should be taken into account. Studies indicate that asset allocation is the single most important determinant of a portfolio's long-term success. The right mix of stocks, bonds and cash - aligned to your particular risk tolerance and investment objective - is very important. Age-appropriate rebalancing is also an essential aspect of asset allocation. For younger investors, an emphasis on equities - which historically have been the best-performing asset class over time - is encouraged. As investors near their specific goal, such as retirement or sending a child to college, consideration may be given to replacing volatile assets (e.g. common stocks) with more-stable fixed investments (bonds or savings plans).
A third principle - investing regularly - can help lower the average cost of your purchases. Investing a certain amount of money each month or quarter helps ensure you won't pay for all your shares at market highs. This strategy - known as dollar cost averaging - also reduces "emotion" from investing, helping shareholders avoid selling weak performers just prior to an upswing, or chasing a hot performer just before a correction.
We invite you to contact us via the Internet, through our Investor Centers or by phone. It is our privilege to provide you the information you need to make the investments that are right for you.
Sincerely,
(The chairman's signature appears here.)
Edward C. Johnson 3d
Annual Report
Average annual total return reflects the change in the value of an investment, assuming reinvestment of the class' distributions from dividend income and capital gains (the profits earned upon the sale of securities that have grown in value, if any) and assuming a constant rate of performance each year. The $10,000 table and the fund's returns do not reflect the deduction of taxes that a shareholder would pay on fund distributions or the redemption of fund shares. During periods of reimbursement by Fidelity, a fund's total return will be greater than it would be had the reimbursement not occurred. How a fund did yesterday is no guarantee of how it will do tomorrow.
Average Annual Total Returns
Periods ended October 31, 2010 | Past 1
year | Past 5
years | Past 10
years |
Institutional Class | 28.00% | 2.65% | 2.27% |
$10,000 Over 10 Years
Let's say hypothetically that $10,000 was invested in Fidelity AdvisorSM Global Capital Appreciation Fund - Institutional Class on October 31, 2000. The chart shows how the value of your investment would have changed, and also shows how the MSCI® ACWI® (All Country World Index) Index performed over the same period. Index values for periods prior to 2010 have been restated from prior years' reports.
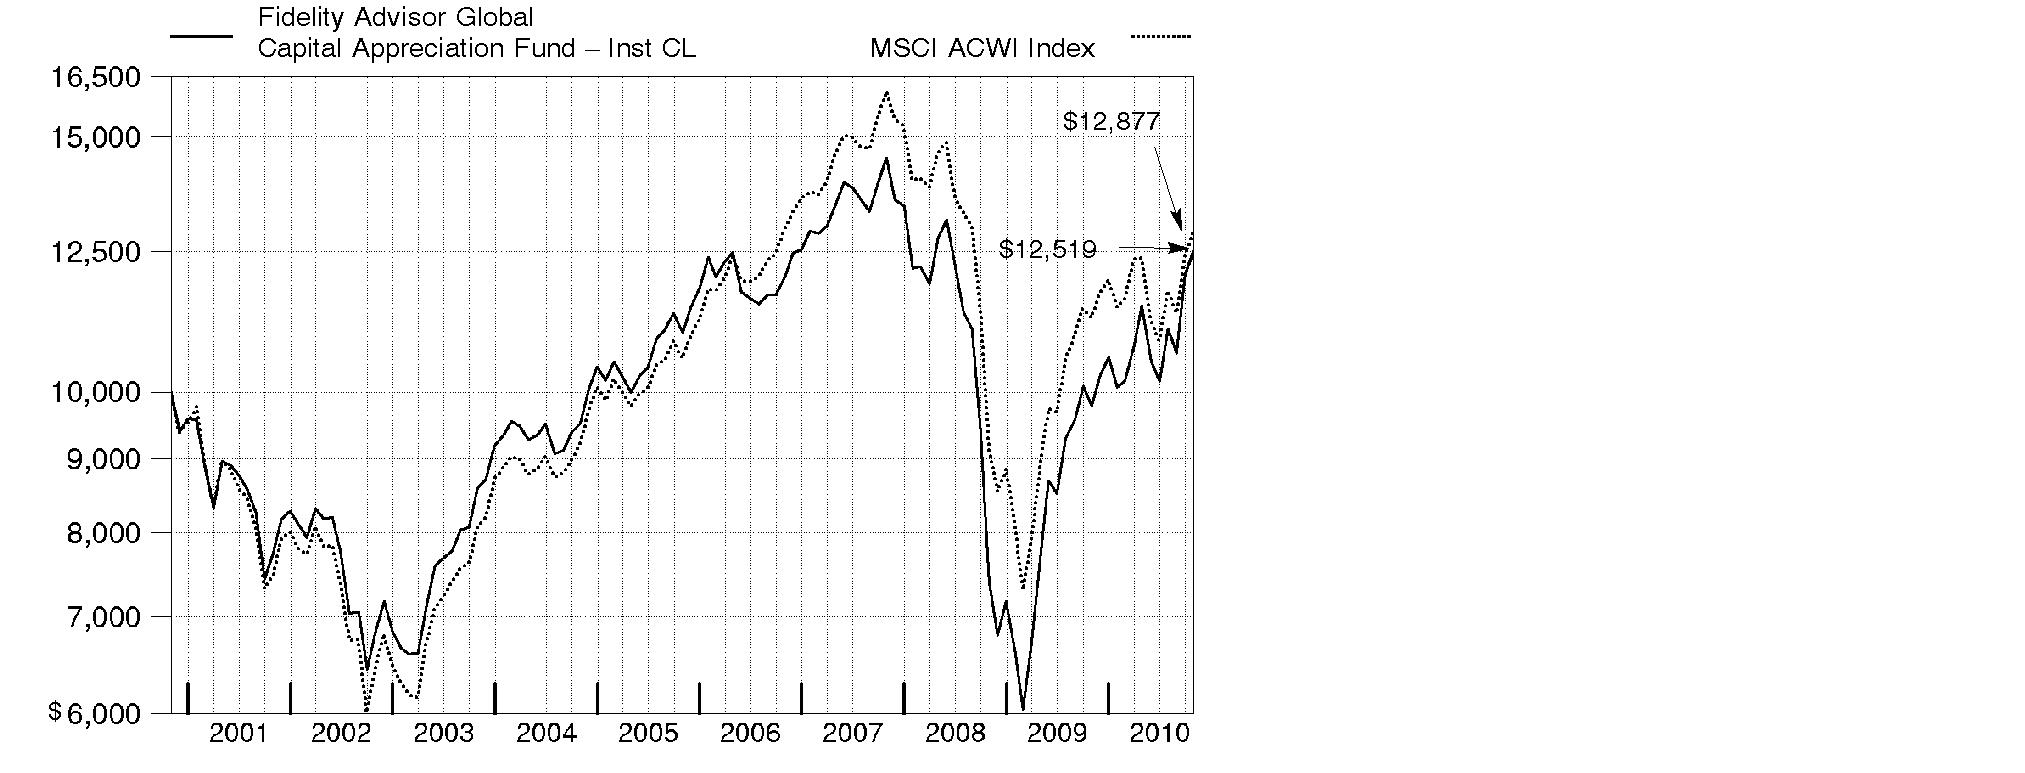
Annual Report
Market Recap: International stocks rode a wave of volatility similar to that of their U.S. counterparts during the 12 months ending October 31, 2010. Stocks gained modestly in the first half of the period, despite growing concerns about the European debt crisis. Sentiment turned decidedly negative in May and June, however, and the market suffered a precipitous decline. These losses were more than offset during the last four months of the period, when signs of economic growth and subsiding debt fears helped propel international stocks about 21%. For the full year, the MSCI® ACWI® (All Country World Index) ex USA Index gained 12.76%, boosted in part by a generally depreciating U.S. dollar. Within the index, Canada and emerging markets were standouts, returning 23% and 24%, respectively. Results in the latter group were led by strong-performing India, Mexico and South Africa, while China fell short of the MSCI benchmark due to cooling economic growth. The developed Asia ex Japan segment rose 16% for the period, lifted by solid results from Singapore and Hong Kong. Meanwhile, Europe rose just 9%, held back mainly by debt-riddled Spain and Italy, as well as lagging major constituent France. Japan returned only 5%, a result of that nation's continued weak economy.
Comments from Thomas Allen, who became Portfolio Manager of Fidelity AdvisorSM Global Capital Appreciation Fund on February 17, 2010: During the past year, the fund's Institutional Class shares returned 28.00%, almost doubling the 14.47% return of the MSCI ACWI (All Country World Index) Index. Relative performance was particularly aided by stock picking in technology, consumer staples, health care and several other sectors, as well as an underweighting in financials. Geographically, my picks in Japan, China, Taiwan, South Africa and India added value, as did a large overweighting in India. China-based Kingdee International Software Group was our top individual contributor, as the provider of accounting software for smaller companies benefited from significantly growing its market share. Other key contributors were Taiwanese smart phone maker HTC, South Africa's Blue Label Telecoms and ICRA, an Indian bond-rating agency. Conversely, our cash position detracted, as did weak picks in capital goods and real estate, along with an overweighting in technology and an underweighting in materials. China Pharma Holdings was the largest relative detractor, followed by U.S.-based MasTec, which installs utility and telecom infrastructure, and online retailer drugstore.com. All of the stocks I've mentioned, except for HTC, were out of index. I sold China Pharma and MasTec during the period.
The views expressed above reflect those of the portfolio manager(s) only through the end of the period as stated on the cover of this report and do not necessarily represent the views of Fidelity or any other person in the Fidelity organization. Any such views are subject to change at any time based upon market or other conditions and Fidelity disclaims any responsibility to update such views. These views may not be relied on as investment advice and, because investment decisions for a Fidelity fund are based on numerous factors, may not be relied on as an indication of trading intent on behalf of any Fidelity fund.
Annual Report
Shareholder Expense Example
As a shareholder of the Fund, you incur two types of costs: (1) transaction costs, including sales charges (loads) on purchase payments or redemption proceeds, redemption fees, and (2) ongoing costs, including management fees, distribution and/or service (12b-1) fees and other Fund expenses. This Example is intended to help you understand your ongoing costs (in dollars) of investing in the Fund and to compare these costs with the ongoing costs of investing in other mutual funds.
The Example is based on an investment of $1,000 invested at the beginning of the period and held for the entire period (May 1, 2010 to October 31, 2010).
Actual Expenses
The first line of the accompanying table for each class of the Fund provides information about actual account values and actual expenses. You may use the information in this line, together with the amount you invested, to estimate the expenses that you paid over the period. Simply divide your account value by $1,000.00 (for example, an $8,600 account value divided by $1,000.00 = 8.6), then multiply the result by the number in the first line for a class of the Fund under the heading entitled "Expenses Paid During Period" to estimate the expenses you paid on your account during this period. In addition, the Fund, as a shareholder in the underlying Fidelity Central Funds, will indirectly bear its pro-rata share of the fees and expenses incurred by the underlying Fidelity Central Funds. These fees and expenses are not included in the Fund's annualized expense ratio used to calculate the expense estimate in the table below.
Hypothetical Example for Comparison Purposes
The second line of the accompanying table for each class of the Fund provides information about hypothetical account values and hypothetical expenses based on a Class' actual expense ratio and an assumed rate of return of 5% per year before expenses, which is not the Class' actual return. The hypothetical account values and expenses may not be used to estimate the actual ending account balance or expenses you paid for the period. You may use this information to compare the ongoing costs of investing in the Fund and other funds. To do so, compare this 5% hypothetical example with the 5% hypothetical examples that appear in the shareholder reports of the other funds. In addition, the Fund, as a shareholder in the underlying Fidelity Central Funds, will indirectly bear its pro-rata share of the fees and expenses incurred by the underlying Fidelity Central Funds. These fees and expenses are not included in the Fund's annualized expense ratio used to calculate the expense estimate in the table below.
Please note that the expenses shown in the table are meant to highlight your ongoing costs only and do not reflect any transaction costs. Therefore, the second line of the table is useful in comparing ongoing costs only, and will not help you determine the relative total costs of owning different funds. In addition, if these transactional costs were included, your costs would have been higher.
Annual Report
Shareholder Expense Example - continued
| Annualized
Expense Ratio | Beginning
Account Value
May 1, 2010 | Ending
Account Value
October 31, 2010 | Expenses Paid
During Period*
May 1, 2010 to
October 31, 2010 |
Class A | 1.50% | | | |
Actual | | $ 1,000.00 | $ 1,089.80 | $ 7.90** |
HypotheticalA | | $ 1,000.00 | $ 1,017.64 | $ 7.63** |
Class T | 1.75% | | | |
Actual | | $ 1,000.00 | $ 1,088.10 | $ 9.21** |
HypotheticalA | | $ 1,000.00 | $ 1,016.38 | $ 8.89** |
Class B | 2.25% | | | |
Actual | | $ 1,000.00 | $ 1,085.10 | $ 11.83** |
HypotheticalA | | $ 1,000.00 | $ 1,013.86 | $ 11.42** |
Class C | 2.25% | | | |
Actual | | $ 1,000.00 | $ 1,085.10 | $ 11.83** |
HypotheticalA | | $ 1,000.00 | $ 1,013.86 | $ 11.42** |
Institutional Class | 1.25% | | | |
Actual | | $ 1,000.00 | $ 1,090.90 | $ 6.59** |
HypotheticalA | | $ 1,000.00 | $ 1,018.90 | $ 6.36** |
A 5% return per year before expenses
* Expenses are equal to each Class' annualized expense ratio, multiplied by the average account value over the period, multiplied by 184/365 (to reflect the one-half year period).
Annual Report
** If changes to voluntary expense limitations, effective November 1, 2010, had been in effect during the entire period, the annualized expense ratios and the expenses paid in the actual and hypothetical examples above would have been as follows:
| Annualized
Expense Ratio | Expenses Paid |
Class A | 1.45% | |
Actual | | $ 7.64 |
HypotheticalA | | $ 7.38 |
Class T | 1.70% | |
Actual | | $ 8.95 |
HypotheticalA | | $ 8.64 |
Class B | 2.20% | |
Actual | | $ 11.56 |
HypotheticalA | | $ 11.17 |
Class C | 2.20% | |
Actual | | $ 11.56 |
HypotheticalA | | $ 11.17 |
Institutional Class | 1.20% | |
Actual | | $ 6.33 |
HypotheticalA | | $ 6.11 |
A 5% return per year before expenses
Annual Report
Investment Changes (Unaudited)
Top Five Stocks as of October 31, 2010 |
| % of fund's
net assets | % of fund's net assets
6 months ago |
China Valves Technology, Inc. (United States of America, Machinery) | 5.0 | 0.0 |
Kenedix, Inc. (Japan, Real Estate Management & Development) | 4.7 | 4.2 |
Blue Label Telecoms Ltd. (South Africa, Commercial Services & Supplies) | 4.6 | 3.6 |
EnergyO Solutions AB (Sweden, Electric Utilities) | 4.3 | 0.5 |
Proto Corp. (Japan, Media) | 3.0 | 5.0 |
| 21.6 | |
Top Five Market Sectors as of October 31, 2010 |
| % of fund's
net assets | % of fund's net assets
6 months ago |
Information Technology | 22.1 | 35.3 |
Health Care | 13.8 | 10.2 |
Financials | 12.6 | 13.4 |
Consumer Discretionary | 11.9 | 15.7 |
Industrials | 11.5 | 10.9 |
Top Five Countries as of October 31, 2010 |
(excluding cash equivalents) | % of fund's
net assets | % of fund's net assets
6 months ago |
United States of America | 19.8 | 33.0 |
India | 16.0 | 15.5 |
Japan | 12.6 | 14.5 |
Cayman Islands | 7.9 | 10.0 |
South Africa | 6.2 | 6.6 |
Percentages are adjusted for the effect of open futures contracts, if applicable. |
Asset Allocation (% of fund's net assets) |
As of October 31, 2010 | As of April 30, 2010 |
| Stocks 84.8% | | | Stocks 99.3% | |
| Short-Term
Investments and
Net Other Assets 15.2% | | | Short-Term
Investments and
Net Other Assets 0.7% | |

Annual Report
Investments October 31, 2010
Showing Percentage of Net Assets
Common Stocks - 84.8% |
| Shares | | Value |
Australia - 0.3% |
Newcrest Mining Ltd. | 6,340 | | $ 248,191 |
Bermuda - 1.0% |
Fairwood Holdings Ltd. | 578,000 | | 794,901 |
Brazil - 0.5% |
Brasil Insurance Participacoes e Administracao SA (a) | 100 | | 79,356 |
Tegma Gestao Logistica | 27,200 | | 337,042 |
TOTAL BRAZIL | | 416,398 |
British Virgin Islands - 1.3% |
HLS Systems International Ltd. (a)(d) | 78,400 | | 990,976 |
Kingtone Wirelessinfo Solution Holding Ltd. sponsored ADR (a)(d) | 4,100 | | 13,653 |
TOTAL BRITISH VIRGIN ISLANDS | | 1,004,629 |
Canada - 1.9% |
Computer Modelling Group Ltd. | 48,200 | | 917,308 |
Kinross Gold Corp. | 22,300 | | 401,221 |
Kinross Gold Corp. warrants 9/17/14 (a) | 396 | | 1,627 |
Petrobank Energy & Resources Ltd. (a) | 1,700 | | 67,657 |
Yamana Gold, Inc. | 3,500 | | 38,504 |
TOTAL CANADA | | 1,426,317 |
Cayman Islands - 7.9% |
China Real Estate Information Corp. ADR (d) | 152,500 | | 1,511,275 |
Daphne International Holdings Ltd. | 1,390,000 | | 1,552,962 |
Kingdee International Software Group Co. Ltd. | 3,824,000 | | 2,017,760 |
Longtop Financial Technologies Ltd. ADR (a) | 18,300 | | 665,022 |
Tianyi Fruit Holdings Ltd. | 884,000 | | 315,908 |
Xinyi Glass Holdings Co. Ltd. | 30,000 | | 23,803 |
TOTAL CAYMAN ISLANDS | | 6,086,730 |
Denmark - 0.6% |
Vestas Wind Systems AS (a)(d) | 15,300 | | 488,198 |
France - 2.6% |
AXA SA | 30,000 | | 546,005 |
Ubisoft Entertainment SA (a) | 112,626 | | 1,465,114 |
TOTAL FRANCE | | 2,011,119 |
Germany - 0.3% |
Kontron AG | 20,200 | | 195,908 |
Hong Kong - 0.4% |
Wharf Holdings Ltd. | 45,000 | | 295,501 |
Common Stocks - continued |
| Shares | | Value |
India - 16.0% |
Cadila Healthcare Ltd. | 10,818 | | $ 170,416 |
FDC Ltd. | 828,819 | | 1,943,728 |
Hawkins Cookers Ltd. | 12,376 | | 298,336 |
ICRA Ltd. | 55,449 | | 1,715,197 |
Indoco Remedies Ltd. | 102,728 | | 1,162,860 |
INFO Edge India Ltd. | 51,457 | | 789,820 |
MIC Electronics Ltd. | 1,590,610 | | 1,424,641 |
NIIT Ltd. | 109,800 | | 162,873 |
NIIT Technologies Ltd. | 270,921 | | 1,341,005 |
Opto Circuits India Ltd. | 187,108 | | 1,213,828 |
Prakash Industries Ltd. (a) | 26,482 | | 86,123 |
REI Six Ten Retail Ltd. | 166,449 | | 275,256 |
Strides Arcolab Ltd. | 61,930 | | 587,933 |
Unichem Laboratories Ltd. | 233,125 | | 1,208,621 |
TOTAL INDIA | | 12,380,637 |
Japan - 12.6% |
Aozora Bank Ltd. | 795,000 | | 1,333,727 |
DeNA Co. Ltd. | 38,200 | | 988,348 |
Kakaku.com, Inc. | 93 | | 449,571 |
Kenedix, Inc. (a)(d) | 18,158 | | 3,662,288 |
Park24 Co. Ltd. | 39,900 | | 385,761 |
Proto Corp. | 55,900 | | 2,275,040 |
Tokyo Electron Ltd. | 1,800 | | 101,562 |
Tsutsumi Jewelry Co. Ltd. | 22,000 | | 518,081 |
TOTAL JAPAN | | 9,714,378 |
Korea (South) - 1.2% |
Able C&C Ltd. | 44,755 | | 961,168 |
Netherlands - 0.9% |
Gemalto NV | 15,000 | | 682,924 |
Russia - 2.8% |
Pharmstandard OJSC (a) | 3,700 | | 324,241 |
Sollers OJSC (a) | 17,950 | | 305,672 |
Veropharm (a) | 37,300 | | 1,504,667 |
TOTAL RUSSIA | | 2,134,580 |
South Africa - 6.2% |
Aspen Pharmacare Holdings Ltd. | 56,300 | | 751,465 |
Common Stocks - continued |
| Shares | | Value |
South Africa - continued |
Blue Label Telecoms Ltd. | 3,438,177 | | $ 3,533,861 |
Clicks Group Ltd. | 72,842 | | 475,211 |
TOTAL SOUTH AFRICA | | 4,760,537 |
Sweden - 4.3% |
EnergyO Solutions AB (a) | 498,352 | | 3,319,065 |
Switzerland - 0.5% |
Nobel Biocare Holding AG (Switzerland) | 8,380 | | 138,510 |
Weatherford International Ltd. (a) | 16,100 | | 270,641 |
TOTAL SWITZERLAND | | 409,151 |
Taiwan - 2.9% |
HTC Corp. | 91,350 | | 2,062,501 |
Tong Yang Industry Co. Ltd. | 94,000 | | 149,423 |
TOTAL TAIWAN | | 2,211,924 |
United Kingdom - 0.8% |
Barclays PLC Sponsored ADR | 18,300 | | 322,995 |
Ensco International Ltd. ADR | 7,100 | | 329,014 |
TOTAL UNITED KINGDOM | | 652,009 |
United States of America - 19.8% |
Advance Auto Parts, Inc. | 23,900 | | 1,553,022 |
Altera Corp. | 32,600 | | 1,017,446 |
China Biologic Products, Inc. (a)(d) | 60,300 | | 590,337 |
China Jo-Jo Drugstores, Inc. (a)(d) | 344,100 | | 1,703,295 |
China Valves Technology, Inc. (a)(d) | 441,397 | | 3,848,981 |
Computer Task Group, Inc. (a) | 168,100 | | 1,341,438 |
DG FastChannel, Inc. (a) | 12,895 | | 303,677 |
drugstore.com, Inc. (a) | 132,100 | | 211,360 |
eBay, Inc. (a) | 1,300 | | 38,753 |
Genomic Health, Inc. (a) | 680 | | 9,629 |
Market Leader, Inc. (a) | 36,101 | | 70,397 |
Nanosphere, Inc. (a) | 200,814 | | 911,696 |
Northern Trust Corp. | 6,600 | | 327,558 |
NVE Corp. (a) | 11,421 | | 549,693 |
PowerSecure International, Inc. (a)(d) | 33,900 | | 318,999 |
Support.com, Inc. (a) | 82,500 | | 467,775 |
Uranium Energy Corp. (a)(d) | 9,900 | | 38,313 |
Common Stocks - continued |
| Shares | | Value |
United States of America - continued |
USANA Health Sciences, Inc. (a) | 42,995 | | $ 1,888,340 |
Zoltek Companies, Inc. (a)(d) | 10,948 | | 105,101 |
TOTAL UNITED STATES OF AMERICA | | 15,295,810 |
TOTAL COMMON STOCKS (Cost $56,153,805) | 65,490,075 |
Money Market Funds - 20.2% |
| | | |
Fidelity Cash Central Fund, 0.23% (b) | 11,023,213 | | 11,023,213 |
Fidelity Securities Lending Cash Central Fund, 0.24% (b)(c) | 4,585,262 | | 4,585,262 |
TOTAL MONEY MARKET FUNDS (Cost $15,608,475) | 15,608,475 |
TOTAL INVESTMENT PORTFOLIO - 105.0% (Cost $71,762,280) | | 81,098,550 |
NET OTHER ASSETS (LIABILITIES) - (5.0)% | | (3,825,817) |
NET ASSETS - 100% | $ 77,272,733 |
Legend |
(a) Non-income producing |
(b) Affiliated fund that is available only to investment companies and other accounts managed by Fidelity Investments. The rate quoted is the annualized seven-day yield of the fund at period end. A complete unaudited listing of the fund's holdings as of its most recent quarter end is available upon request. In addition, each Fidelity Central Fund's financial statements, which are not covered by the Fund's report of Independent Registered Public Accounting Firm, are available on the SEC's website or upon request. |
(c) Investment made with cash collateral received from securities on loan. |
(d) Security or a portion of the security is on loan at period end. |
Affiliated Central Funds |
Information regarding fiscal year to date income earned by the Fund from investments in Fidelity Central Funds is as follows: |
Fund | Income earned |
Fidelity Cash Central Fund | $ 3,314 |
Fidelity Securities Lending Cash Central Fund | 23,119 |
Total | $ 26,433 |
Other Information |
The following is a summary of the inputs used, as of October 31, 2010, involving the Fund's assets and liabilities carried at fair value. The inputs or methodology used for valuing securities may not be an indication of the risk associated with investing in those securities. For more information on valuation inputs, and their aggregation into the levels used in the table below, please refer to the Security Valuation section in the accompanying Notes to Financial Statements. |
Valuation Inputs at Reporting Date: |
Description | Total | Level 1 | Level 2 | Level 3 |
Investments in Securities: | | | | |
Equities: | | | | |
United States of America | $ 15,295,810 | $ 15,295,810 | $ - | $ - |
India | 12,380,637 | 12,380,637 | - | - |
Japan | 9,714,378 | 9,612,816 | 101,562 | - |
Cayman Islands | 6,086,730 | 6,086,730 | - | - |
South Africa | 4,760,537 | 4,760,537 | - | - |
Sweden | 3,319,065 | 3,319,065 | - | - |
Taiwan | 2,211,924 | 2,211,924 | - | - |
Russia | 2,134,580 | 2,134,580 | - | - |
France | 2,011,119 | 2,011,119 | - | - |
Other | 7,575,295 | 7,495,939 | 79,356 | - |
Money Market Funds | 15,608,475 | 15,608,475 | - | - |
Total Investments in Securities: | $ 81,098,550 | $ 80,917,632 | $ 180,918 | $ - |
Income Tax Information |
At October 31, 2010, the Fund had a capital loss carryforward of approximately $10,598,573 of which $7,580,172 and $3,018,401 will expire on October 31, 2016 and 2017, respectively. Capital loss carryforwards are only available to offset future capital gains of the Fund to the extent provided by regulations and may be limited. |
See accompanying notes which are an integral part of the financial statements.
Annual Report
Statement of Assets and Liabilities
| October 31, 2010 |
| | |
Assets | | |
Investment in securities, at value (including securities loaned of $4,434,372) - See accompanying schedule: Unaffiliated issuers (cost $56,153,805) | $ 65,490,075 | |
Fidelity Central Funds (cost $15,608,475) | 15,608,475 | |
Total Investments (cost $71,762,280) | | $ 81,098,550 |
Cash | | 363,628 |
Foreign currency held at value (cost $96,517) | | 96,590 |
Receivable for fund shares sold | | 1,523,742 |
Dividends receivable | | 73,967 |
Distributions receivable from Fidelity Central Funds | | 11,495 |
Receivable from investment adviser for expense reductions | | 2,714 |
Other receivables | | 25,277 |
Total assets | | 83,195,963 |
| | |
Liabilities | | |
Payable for investments purchased | $ 1,008,938 | |
Payable for fund shares redeemed | 63,088 | |
Accrued management fee | 41,023 | |
Distribution and service plan fees payable | 21,091 | |
Other affiliated payables | 13,283 | |
Other payables and accrued expenses | 190,545 | |
Collateral on securities loaned, at value | 4,585,262 | |
Total liabilities | | 5,923,230 |
| | |
Net Assets | | $ 77,272,733 |
Net Assets consist of: | | |
Paid in capital | | $ 78,726,227 |
Accumulated undistributed net realized gain (loss) on investments and foreign currency transactions | | (10,645,349) |
Net unrealized appreciation (depreciation) on investments and assets and liabilities in foreign currencies | | 9,191,855 |
Net Assets | | $ 77,272,733 |
See accompanying notes which are an integral part of the financial statements.
Annual Report
Financial Statements - continued
Statement of Assets and Liabilities - continued
| October 31, 2010 |
| | |
Calculation of Maximum Offering Price Class A:
Net Asset Value and redemption price per share ($30,382,527 ÷ 2,663,596 shares) | | $ 11.41 |
| | |
Maximum offering price per share (100/94.25 of $11.41) | | $ 12.11 |
Class T:
Net Asset Value and redemption price per share ($23,236,913 ÷ 2,091,542 shares) | | $ 11.11 |
| | |
Maximum offering price per share (100/96.50 of $11.11) | | $ 11.51 |
Class B:
Net Asset Value and offering price per share ($2,731,290 ÷ 261,103 shares) A | | $ 10.46 |
| | |
Class C:
Net Asset Value and offering price per share ($7,986,448 ÷ 763,411 shares) A | | $ 10.46 |
| | |
Institutional Class:
Net Asset Value, offering price and redemption price per share ($12,935,555 ÷ 1,100,250 shares) | | $ 11.76 |
A Redemption price per share is equal to net asset value less any applicable contingent deferred sales charge.
See accompanying notes which are an integral part of the financial statements.
Annual Report
Statement of Operations
| Year ended October 31, 2010 |
| | |
Investment Income | | |
Dividends | | $ 528,445 |
Interest | | 3,256 |
Income from Fidelity Central Funds | | 26,433 |
Income before foreign taxes withheld | | 558,134 |
Less foreign taxes withheld | | (34,225) |
Total income | | 523,909 |
| | |
Expenses | | |
Management fee
Basic fee | $ 236,878 | |
Performance adjustment | (245) | |
Transfer agent fees | 99,419 | |
Distribution and service plan fees | 156,797 | |
Accounting and security lending fees | 17,484 | |
Custodian fees and expenses | 97,566 | |
Independent trustees' compensation | 170 | |
Registration fees | 56,274 | |
Audit | 65,917 | |
Legal | 139 | |
Miscellaneous | 348 | |
Total expenses before reductions | 730,747 | |
Expense reductions | (175,676) | 555,071 |
Net investment income (loss) | | (31,162) |
Realized and Unrealized Gain (Loss) Net realized gain (loss) on: | | |
Investment securities: | | |
Unaffiliated issuers (net of foreign taxes of $56,746) | 2,235,107 | |
Foreign currency transactions | 3,552 | |
Total net realized gain (loss) | | 2,238,659 |
Change in net unrealized appreciation (depreciation) on: Investment securities (net of increase in deferred foreign taxes of $141,556) | 7,403,884 | |
Assets and liabilities in foreign currencies | 3,941 | |
Total change in net unrealized appreciation (depreciation) | | 7,407,825 |
Net gain (loss) | | 9,646,484 |
Net increase (decrease) in net assets resulting from operations | | $ 9,615,322 |
See accompanying notes which are an integral part of the financial statements.
Annual Report
Financial Statements - continued
Statement of Changes in Net Assets
| Year ended
October 31,
2010 | Year ended
October 31,
2009 |
Increase (Decrease) in Net Assets | | |
Operations | | |
Net investment income (loss) | $ (31,162) | $ 50,948 |
Net realized gain (loss) | 2,238,659 | (2,896,694) |
Change in net unrealized appreciation (depreciation) | 7,407,825 | 8,195,238 |
Net increase (decrease) in net assets resulting
from operations | 9,615,322 | 5,349,492 |
Distributions to shareholders from net investment income | (45,039) | (30,547) |
Distributions to shareholders from net realized gain | (205,342) | - |
Total distributions | (250,381) | (30,547) |
Share transactions - net increase (decrease) | 43,722,613 | (1,928,677) |
Redemption fees | 5,493 | 261 |
Total increase (decrease) in net assets | 53,093,047 | 3,390,529 |
| | |
Net Assets | | |
Beginning of period | 24,179,686 | 20,789,157 |
End of period (including undistributed net investment income of $0 and $21,196, respectively) | $ 77,272,733 | $ 24,179,686 |
See accompanying notes which are an integral part of the financial statements.
Annual Report
Financial Highlights - Class A
Years ended October 31, | 2010 | 2009 | 2008 | 2007 | 2006 |
Selected Per-Share Data | | | | | |
Net asset value, beginning of period | $ 9.04 | $ 6.88 | $ 15.38 | $ 14.83 | $ 13.68 |
Income from Investment Operations | | | | | |
Net investment income (loss) C | .01 | .04 | .04 | .01 | .01 |
Net realized and unrealized gain (loss) | 2.47 | 2.13 | (6.74) | 2.69 | 1.20 |
Total from investment operations | 2.48 | 2.17 | (6.70) | 2.70 | 1.21 |
Distributions from net investment income | (.03) | (.01) | - | - | (.04) |
Distributions from net realized gain | (.08) | - | (1.80) | (2.15) | (.02) |
Total distributions | (.11) | (.01) | (1.80) | (2.15) | (.06) |
Redemption fees added to paid in capital C, G | - | - | - | - | - |
Net asset value, end of period | $ 11.41 | $ 9.04 | $ 6.88 | $ 15.38 | $ 14.83 |
Total Return A, B | 27.68% | 31.68% | (48.99)% | 20.55% | 8.86% |
Ratios to Average Net Assets D, F | | | | | |
Expenses before reductions | 1.89% | 2.22% | 1.90% | 1.81% | 1.69% |
Expenses net of fee waivers, if any | 1.50% | 1.50% | 1.50% | 1.50% | 1.50% |
Expenses net of all reductions | 1.44% | 1.43% | 1.41% | 1.45% | 1.46% |
Net investment income (loss) | .13% | .53% | .38% | .06% | .06% |
Supplemental Data | | | | | |
Net assets, end of period (000 omitted) | $ 30,383 | $ 6,997 | $ 6,904 | $ 14,000 | $ 10,956 |
Portfolio turnover rate E | 179% | 258% | 257% | 102% | 251% |
A Total returns would have been lower had certain expenses not been reduced during the periods shown.
B Total returns do not include the effect of the sales charges.
C Calculated based on average shares outstanding during the period.
D Fees and expenses of the underlying Fidelity Central Funds are not included in the Fund's expense ratio. The Fund indirectly bears its proportionate share of the expenses of any underlying Fidelity Central Funds.
E Amount does not include the portfolio activity of any underlying Fidelity Central Funds.
F Expense ratios reflect operating expenses of the class. Expenses before reductions do not reflect amounts reimbursed by the investment adviser or reductions from brokerage service arrangements or reductions from other expense offset arrangements and do not represent the amount paid by the class during periods when reimbursements or reductions occur. Expenses net of fee waivers reflect expenses after reimbursement by the investment adviser but prior to reductions from brokerage service arrangements or other expense offset arrangements. Expenses net of all reductions represent the net expenses paid by the class.
G Amount represents less than $.01 per share.
See accompanying notes which are an integral part of the financial statements.
Annual Report
Financial Highlights - Class T
Years ended October 31, | 2010 | 2009 | 2008 | 2007 | 2006 |
Selected Per-Share Data | | | | | |
Net asset value, beginning of period | $ 8.82 | $ 6.72 | $ 15.05 | $ 14.59 | $ 13.46 |
Income from Investment Operations | | | | | |
Net investment income (loss) C | (.01) | .02 | .01 | (.03) | (.03) |
Net realized and unrealized gain (loss) | 2.39 | 2.09 | (6.59) | 2.64 | 1.19 |
Total from investment operations | 2.38 | 2.11 | (6.58) | 2.61 | 1.16 |
Distributions from net investment income | (.01) | (.01) | - | - | (.01) |
Distributions from net realized gain | (.08) | - | (1.75) | (2.15) | (.02) |
Total distributions | (.09) | (.01) | (1.75) | (2.15) | (.03) |
Redemption fees added to paid in capital C, G | - | - | - | - | - |
Net asset value, end of period | $ 11.11 | $ 8.82 | $ 6.72 | $ 15.05 | $ 14.59 |
Total Return A, B | 27.20% | 31.50% | (49.12)% | 20.24% | 8.62% |
Ratios to Average Net Assets D, F | | | | | |
Expenses before reductions | 2.32% | 2.50% | 2.17% | 2.08% | 1.99% |
Expenses net of fee waivers, if any | 1.75% | 1.75% | 1.75% | 1.75% | 1.75% |
Expenses net of all reductions | 1.70% | 1.69% | 1.66% | 1.71% | 1.71% |
Net investment income (loss) | (.13)% | .27% | .13% | (.19)% | (.19)% |
Supplemental Data | | | | | |
Net assets, end of period (000 omitted) | $ 23,237 | $ 10,494 | $ 8,104 | $ 22,039 | $ 26,780 |
Portfolio turnover rate E | 179% | 258% | 257% | 102% | 251% |
A Total returns would have been lower had certain expenses not been reduced during the periods shown.
B Total returns do not include the effect of the sales charges.
C Calculated based on average shares outstanding during the period.
D Fees and expenses of the underlying Fidelity Central Funds are not included in the Fund's expense ratio. The Fund indirectly bears its proportionate share of the expenses of any underlying Fidelity Central Funds.
E Amount does not include the portfolio activity of any underlying Fidelity Central Funds.
F Expense ratios reflect operating expenses of the class. Expenses before reductions do not reflect amounts reimbursed by the investment adviser or reductions from brokerage service arrangements or reductions from other expense offset arrangements and do not represent the amount paid by the class during periods when reimbursements or reductions occur. Expenses net of fee waivers reflect expenses after reimbursement by the investment adviser but prior to reductions from brokerage service arrangements or other expense offset arrangements. Expenses net of all reductions represent the net expenses paid by the class.
G Amount represents less than $.01 per share.
See accompanying notes which are an integral part of the financial statements.
Annual Report
Financial Highlights - Class B
Years ended October 31, | 2010 | 2009 | 2008 | 2007 | 2006 |
Selected Per-Share Data | | | | | |
Net asset value, beginning of period | $ 8.31 | $ 6.37 | $ 14.34 | $ 14.06 | $ 13.01 |
Income from Investment Operations | | | | | |
Net investment income (loss) C | (.06) | (.02) | (.04) | (.09) | (.10) |
Net realized and unrealized gain (loss) | 2.26 | 1.97 | (6.25) | 2.52 | 1.15 |
Total from investment operations | 2.20 | 1.95 | (6.29) | 2.43 | 1.05 |
Distributions from net investment income | - | (.01) | - | - | - |
Distributions from net realized gain | (.05) | - | (1.68) | (2.15) | - |
Total distributions | (.05) | (.01) | (1.68) | (2.15) | - |
Redemption fees added to paid in capital C, G | - | - | - | - | - |
Net asset value, end of period | $ 10.46 | $ 8.31 | $ 6.37 | $ 14.34 | $ 14.06 |
Total Return A, B | 26.64% | 30.62% | (49.33)% | 19.65% | 8.07% |
Ratios to Average Net Assets D, F | | | | | |
Expenses before reductions | 2.82% | 2.98% | 2.66% | 2.57% | 2.52% |
Expenses net of fee waivers, if any | 2.25% | 2.25% | 2.25% | 2.25% | 2.25% |
Expenses net of all reductions | 2.19% | 2.18% | 2.16% | 2.20% | 2.22% |
Net investment income (loss) | (.62)% | (.22)% | (.37)% | (.69)% | (.69)% |
Supplemental Data | | | | | |
Net assets, end of period (000 omitted) | $ 2,731 | $ 2,162 | $ 1,918 | $ 5,029 | $ 5,788 |
Portfolio turnover rate E | 179% | 258% | 257% | 102% | 251% |
A Total returns would have been lower had certain expenses not been reduced during the periods shown.
B Total returns do not include the effect of the contingent deferred sales charge.
C Calculated based on average shares outstanding during the period.
D Fees and expenses of the underlying Fidelity Central Funds are not included in the Fund's expense ratio. The Fund indirectly bears its proportionate share of the expenses of any underlying Fidelity Central Funds.
E Amount does not include the portfolio activity of any underlying Fidelity Central Funds.
F Expense ratios reflect operating expenses of the class. Expenses before reductions do not reflect amounts reimbursed by the investment adviser or reductions from brokerage service arrangements or reductions from other expense offset arrangements and do not represent the amount paid by the class during periods when reimbursements or reductions occur. Expenses net of fee waivers reflect expenses after reimbursement by the investment adviser but prior to reductions from brokerage service arrangements or other expense offset arrangements. Expenses net of all reductions represent the net expenses paid by the class.
G Amount represents less than $.01 per share.
See accompanying notes which are an integral part of the financial statements.
Annual Report
Financial Highlights - Class C
Years ended October 31, | 2010 | 2009 | 2008 | 2007 | 2006 |
Selected Per-Share Data | | | | | |
Net asset value, beginning of period | $ 8.31 | $ 6.37 | $ 14.36 | $ 14.08 | $ 13.02 |
Income from Investment Operations | | | | | |
Net investment income (loss) C | (.06) | (.02) | (.04) | (.09) | (.10) |
Net realized and unrealized gain (loss) | 2.27 | 1.97 | (6.26) | 2.52 | 1.16 |
Total from investment operations | 2.21 | 1.95 | (6.30) | 2.43 | 1.06 |
Distributions from net investment income | - | (.01) | - | - | - |
Distributions from net realized gain | (.06) | - | (1.69) | (2.15) | - |
Total distributions | (.06) | (.01) | (1.69) | (2.15) | - |
Redemption fees added to paid in capital C, G | - | - | - | - | - |
Net asset value, end of period | $ 10.46 | $ 8.31 | $ 6.37 | $ 14.36 | $ 14.08 |
Total Return A, B | 26.68% | 30.62% | (49.35)% | 19.62% | 8.14% |
Ratios to Average Net Assets D, F | | | | | |
Expenses before reductions | 2.77% | 2.97% | 2.63% | 2.57% | 2.50% |
Expenses net of fee waivers, if any | 2.25% | 2.25% | 2.25% | 2.25% | 2.25% |
Expenses net of all reductions | 2.20% | 2.18% | 2.16% | 2.20% | 2.21% |
Net investment income (loss) | (.63)% | (.22)% | (.37)% | (.69)% | (.69)% |
Supplemental Data | | | | | |
Net assets, end of period (000 omitted) | $ 7,986 | $ 3,378 | $ 2,697 | $ 5,352 | $ 5,348 |
Portfolio turnover rate E | 179% | 258% | 257% | 102% | 251% |
A Total returns would have been lower had certain expenses not been reduced during the periods shown.
B Total returns do not include the effect of the contingent deferred sales charge.
C Calculated based on average shares outstanding during the period.
D Fees and expenses of the underlying Fidelity Central Funds are not included in the Fund's expense ratio. The Fund indirectly bears its proportionate share of the expenses of any underlying Fidelity Central Funds.
E Amount does not include the portfolio activity of any underlying Fidelity Central Funds.
F Expense ratios reflect operating expenses of the class. Expenses before reductions do not reflect amounts reimbursed by the investment adviser or reductions from brokerage service arrangements or reductions from other expense offset arrangements and do not represent the amount paid by the class during periods when reimbursements or reductions occur. Expenses net of fee waivers reflect expenses after reimbursement by the investment adviser but prior to reductions from brokerage service arrangements or other expense offset arrangements. Expenses net of all reductions represent the net expenses paid by the class.
G Amount represents less than $.01 per share.
See accompanying notes which are an integral part of the financial statements.
Annual Report
Financial Highlights - Institutional Class
Years ended October 31, | 2010 | 2009 | 2008 | 2007 | 2006 |
Selected Per-Share Data | | | | | |
Net asset value, beginning of period | $ 9.31 | $ 7.07 | $ 15.76 | $ 15.11 | $ 13.93 |
Income from Investment Operations | | | | | |
Net investment income (loss) B | .04 | .06 | .07 | .05 | .05 |
Net realized and unrealized gain (loss) | 2.54 | 2.20 | (6.93) | 2.75 | 1.22 |
Total from investment operations | 2.58 | 2.26 | (6.86) | 2.80 | 1.27 |
Distributions from net investment income | (.05) | (.02) | - | - | (.07) |
Distributions from net realized gain | (.08) | - | (1.83) | (2.15) | (.02) |
Total distributions | (.13) | (.02) | (1.83) | (2.15) | (.09) |
Redemption fees added to paid in capital B, F | - | - | - | - | - |
Net asset value, end of period | $ 11.76 | $ 9.31 | $ 7.07 | $ 15.76 | $ 15.11 |
Total Return A | 28.00% | 32.03% | (48.89)% | 20.88% | 9.15% |
Ratios to Average Net Assets C, E | | | | | |
Expenses before reductions | 1.43% | 1.88% | 1.51% | 1.43% | 1.29% |
Expenses net of fee waivers, if any | 1.25% | 1.25% | 1.25% | 1.25% | 1.25% |
Expenses net of all reductions | 1.19% | 1.18% | 1.16% | 1.20% | 1.21% |
Net investment income (loss) | .38% | .78% | .63% | .31% | .31% |
Supplemental Data | | | | | |
Net assets, end of period (000 omitted) | $ 12,936 | $ 1,148 | $ 1,166 | $ 2,476 | $ 2,464 |
Portfolio turnover rate D | 179% | 258% | 257% | 102% | 251% |
A Total returns would have been lower had certain expenses not been reduced during the periods shown.
B Calculated based on average shares outstanding during the period.
C Fees and expenses of the underlying Fidelity Central Funds are not included in the Fund's expense ratio. The Fund indirectly bears its proportionate share of the expenses of any underlying Fidelity Central Funds.
D Amount does not include the portfolio activity of any underlying Fidelity Central Funds.
E Expense ratios reflect operating expenses of the class. Expenses before reductions do not reflect amounts reimbursed by the investment adviser or reductions from brokerage service arrangements or reductions from other expense offset arrangements and do not represent the amount paid by the class during periods when reimbursements or reductions occur. Expenses net of fee waivers reflect expenses after reimbursement by the investment adviser but prior to reductions from brokerage service arrangements or other expense offset arrangements. Expenses net of all reductions represent the net expenses paid by the class.
F Amount represents less than $.01 per share.
See accompanying notes which are an integral part of the financial statements.
Annual Report
Notes to Financial Statements
For the period ended October 31, 2010
1. Organization.
Fidelity Advisor Global Capital Appreciation Fund (the Fund) is a fund of Fidelity Advisor Series VIII (the Trust) and is authorized to issue an unlimited number of shares. The Trust is registered under the Investment Company Act of 1940, as amended (the 1940 Act), as an open-end management investment company organized as a Massachusetts business trust. The Fund offers Class A, Class T, Class C, and Institutional Class shares, each of which has equal rights as to assets and voting privileges. Each class has exclusive voting rights with respect to matters that affect that class. Class B shares will automatically convert to Class A shares after a holding period of seven years from the initial date of purchase. Investment income, realized and unrealized capital gains and losses, the common expenses of the Fund, and certain fund-level expense reductions, if any, are allocated on a pro-rata basis to each class based on the relative net assets of each class to the total net assets of the Fund. Each class differs with respect to transfer agent and distribution and service plan fees incurred. Certain expense reductions also differ by class. The Fund's investments in emerging markets can be subject to social, economic, regulatory, and political uncertainties and can be extremely volatile.
2. Investments in Fidelity Central Funds.
The Fund may invest in Fidelity Central Funds, which are open-end investment companies available only to other investment companies and accounts managed by Fidelity Management & Research Company (FMR) and its affiliates. The Fund's Schedule of Investments lists each of the Fidelity Central Funds held as of period end, if any, as an investment of the Fund, but does not include the underlying holdings of each Fidelity Central Fund. As an Investing Fund, the Fund indirectly bears its proportionate share of the expenses of the underlying Fidelity Central Funds.
The Money Market Central Funds seek preservation of capital and current income and are managed by Fidelity Investments Money Management, Inc. (FIMM), an affiliate of FMR.
A complete unaudited list of holdings for each Fidelity Central Fund is available upon request or at the Securities and Exchange Commission (the SEC) web site at www.sec.gov. In addition, the financial statements of the Fidelity Central Funds which are not covered by the Fund's Report of Independent Registered Public Accounting Firm, are available on the SEC web site or upon request.
Annual Report
Notes to Financial Statements - continued
3. Significant Accounting Policies.
The financial statements have been prepared in conformity with accounting principles generally accepted in the United States of America (GAAP), which require management to make certain estimates and assumptions at the date of the financial statements. Actual results could differ from those estimates. The following summarizes the significant accounting policies of the Fund:
Security Valuation. Investments are valued as of 4:00 p.m. Eastern time on the last calendar day of the period. The Fund uses independent pricing services approved by the Board of Trustees to value its investments. When current market prices or quotations are not readily available or reliable, valuations may be determined in good faith in accordance with procedures adopted by the Board of Trustees. Factors used in determining value may include market or security specific events,. The frequency with which these procedures are used cannot be predicted and they may be utilized to a significant extent. The value used for net asset value (NAV) calculation under these procedures may differ from published prices for the same securities.
The Fund categorizes the inputs to valuation techniques used to value its investments into a disclosure hierarchy consisting of three levels as shown below.
Level 1 - quoted prices in active markets for identical investments
Level 2 - other significant observable inputs (including quoted prices for similar investments, interest rates, prepayment speeds, etc.)
Level 3 - unobservable inputs (including the fund's own assumptions based on the best information available)
Changes in valuation techniques may result in transfers in or out of an assigned level within the disclosure hierarchy. The aggregate value of investments by input level, as of October 31, 2010 is included at the end of the Fund's Schedule of Investments. Valuation techniques used to value the Fund's investments by major category are as follows.
Equity securities, including restricted securities, for which market quotations are readily available, are valued at the last reported sale price or official closing price as reported by an independent pricing service on the primary market or exchange on which they are traded and are categorized as Level 1 in the hierarchy. In the event there were no sales during the day or closing prices are not available, securities are valued at the last quoted bid price or may be valued using the last available price and are generally categorized as Level 2 in the hierarchy. For foreign equity securities, when significant market or security specific events arise, comparisons to the valuation of American Depositary Receipts (ADRs), futures contracts, Exchange-traded funds (ETFs) and certain indexes as well as quoted prices for similar securities are used and are categorized as Level 2 in the hierarchy in these circumstances. Utilizing these techniques may result in transfers between
Annual Report
3. Significant Accounting Policies - continued
Security Valuation - continued
Level 1 and Level 2. For restricted equity securities and private placements where observable inputs are limited, assumptions about market activity and risk are used and are categorized as Level 3 in the hierarchy.
Investments in open-end mutual funds, including the Fidelity Central Funds, are valued at their closing net asset value each business day and are categorized as Level 1 in the hierarchy. Short-term securities with remaining maturities of sixty days or less for which quotations are not readily available are valued at amortized cost, which approximates fair value and are categorized as Level 2 in the hierarchy.
Foreign Currency. The Fund uses foreign currency contracts to facilitate transactions in foreign-denominated securities. Gains and losses from these transactions may arise from changes in the value of the foreign currency or if the counterparties do not perform under the contracts' terms.
Foreign-denominated assets, including investment securities, and liabilities are translated into U.S. dollars at the exchange rate at period end. Purchases and sales of investment securities, income and dividends received and expenses denominated in foreign currencies are translated into U.S. dollars at the exchange rate in effect on the transaction date.
The effects of exchange rate fluctuations on investments are included with the net realized and unrealized gain (loss) on investment securities. Other foreign currency transactions resulting in realized and unrealized gain (loss) are disclosed separately.
Investment Transactions and Income. For financial reporting purposes, the Fund's investment holdings and NAV include trades executed through the end of the last business day of the period. The NAV per share for processing shareholder transactions is calculated as of the close of business of the New York Stock Exchange (NYSE), normally 4:00 p.m. Eastern time and includes trades executed through the end of the prior business day. Gains and losses on securities sold are determined on the basis of identified cost and may include proceeds received from litigation. Dividend income is recorded on the ex-dividend date, except for certain dividends from foreign securities where the ex-dividend date may have passed, which are recorded as soon as the Fund is informed of the ex-dividend date. Non-cash dividends included in dividend income, if any, are recorded at the fair market value of the securities received. Distributions received on securities that represent a return of capital or capital gain are recorded as a reduction of cost of investments and/or as a realized gain. The Fund estimates the components of distributions received that may be considered return of capital distributions or capital gain distributions. Interest income and distributions from the Fidelity Central Funds are
Annual Report
Notes to Financial Statements - continued
3. Significant Accounting Policies - continued
Investment Transactions and Income - continued
accrued as earned. Interest income includes coupon interest and amortization of premium and accretion of discount on debt securities. Investment income is recorded net of foreign taxes withheld where recovery of such taxes is uncertain.
Expenses. Most expenses of the Trust can be directly attributed to a fund. Expenses which cannot be directly attributed are apportioned amongst each fund in the Trust. Expense estimates are accrued in the period to which they relate and adjustments are made when actual amounts are known.
Income Tax Information and Distributions to Shareholders. Each year the Fund intends to qualify as a regulated investment company, including distributing substantially all of its taxable income and realized gains under Subchapter M of the Internal Revenue Code and filing its U.S. federal tax return. As a result, no provision for income taxes is required. As of October 31, 2010, the Fund did not have any unrecognized tax benefits in the accompanying financial statements. A fund's federal tax return is subject to examination by the Internal Revenue Service (IRS) for a period of three years. Foreign taxes are provided for based on the Fund's understanding of the tax rules and rates that exist in the foreign markets in which it invests. The Fund is subject to a tax imposed on short term capital gains on securities of certain issuers domiciled in India. The Fund records an estimated deferred tax liability included in Other payables and accrued expenses in the accompanying Statement of Assets & Liabilities for net unrealized gains on these securities in an amount that would be payable if the securities were disposed of at period end.
Distributions are declared and recorded on the ex-dividend date. Income dividends and capital gain distributions are declared separately for each class. Income and capital gain distributions are determined in accordance with income tax regulations, which may differ from GAAP.
Capital accounts within the financial statements are adjusted for permanent book-tax differences. These adjustments have no impact on net assets or the results of operations. Temporary book-tax differences will reverse in a subsequent period.
Book-tax differences are primarily due to the short-term gain distributions from the Fidelity Central Funds, foreign currency transactions, certain foreign taxes, passive foreign investment companies (PFIC), market discount, partnerships, capital loss carryforwards and losses deferred due to wash sales.
Annual Report
3. Significant Accounting Policies - continued
Income Tax Information and Distributions to Shareholders - continued
The federal tax cost of investment securities and unrealized appreciation (depreciation) as of period end were as follows:
Gross unrealized appreciation | $ 10,616,625 |
Gross unrealized depreciation | (1,620,826) |
Net unrealized appreciation (depreciation) | $ 8,995,799 |
| |
Tax Cost | $ 72,102,751 |
The tax-based components of distributable earnings as of period end were as follows:
Undistributed ordinary income | $ 293,696 |
Capital loss carryforward | $ (10,598,573) |
Net unrealized appreciation (depreciation) | $ 8,996,900 |
The tax character of distributions paid was as follows:
| October 31, 2010 | October 31, 2009 |
Ordinary Income | $ 250,381 | $ 30,547 |
Short-Term Trading (Redemption) Fees. Shares held by investors in the Fund less than 30 days are subject to a redemption fee equal to 1.00% of the net asset value of shares redeemed. All redemption fees, which reduce the proceeds of the shareholder redemption, are retained by the Fund and accounted for as an addition to paid in capital.
4. Purchases and Sales of Investments.
Purchases and sales of securities, other than short-term securities, aggregated $90,878,912 and $59,054,389, respectively.
5. Fees and Other Transactions with Affiliates.
Management Fee. FMR and its affiliates provide the Fund with investment management related services for which the Fund pays a monthly management fee. The management fee is the sum of an individual fund fee rate that is based on an annual rate of .45% of the Fund's average net assets and a group fee rate that averaged .26% during the period. The group fee rate is based upon the average net assets of all the mutual funds advised by FMR. The group fee rate decreases as assets under management increase and increases as assets under management decrease. In addition, the management fee is subject to a performance adjustment (up to a maximum of ± .20% of the Fund's average net assets over a 36 month performance period). The upward or downward adjustment to
Annual Report
Notes to Financial Statements - continued
5. Fees and Other Transactions with Affiliates - continued
Management Fee - continued
the management fee is based on the relative investment performance of the Institutional class of the Fund, as compared to an appropriate benchmark index. For the period, the total annual management fee rate, including the performance adjustment, was .71% of the Fund's average net assets.
Distribution and Service Plan Fees. In accordance with Rule 12b-1 of the 1940 Act, the Fund has adopted separate Distribution and Service Plans for each class of shares. Certain classes pay Fidelity Distributors Corporation (FDC), an affiliate of FMR, separate Distribution and Service Fees, each of which is based on an annual percentage of each class' average net assets. In addition, FDC may pay financial intermediaries for selling shares of the Fund and providing shareholder support services. For the period, the Distribution and Service Fee rates, total fees and amounts retained by FDC were as follows:
| Distribution
Fee | Service
Fee | Total Fees | Retained
by FDC |
Class A | -% | .25% | $ 30,551 | $ 5,093 |
Class T | .25% | .25% | 60,860 | - |
Class B | .75% | .25% | 23,323 | 17,503 |
Class C | .75% | .25% | 42,063 | 8,529 |
| | | $ 156,797 | $ 31,125 |
Sales Load. FDC receives a front-end sales charge of up to 5.75% for selling Class A shares, and 3.50% for selling Class T shares, some of which is paid to financial intermediaries for selling shares of the Fund. FDC receives the proceeds of contingent deferred sales charges levied on Class A, Class T, Class B, and Class C redemptions. These charges depend on the holding period. The deferred sales charges range from 5% to 1% for Class B, 1% for Class C, 1.00% for certain purchases of Class A shares (1.00% to .50% prior to July 12, 2010) and .25% for certain purchases of Class T shares.
For the period, sales charge amounts retained by FDC were as follows:
| Retained
by FDC |
Class A | $ 24,244 |
Class T | 5,056 |
Class B* | 2,846 |
Class C* | 127 |
| $ 32,273 |
* When Class B and Class C shares are initially sold, FDC pays commissions from its own resources to financial intermediaries through which the sales are made.
Annual Report
5. Fees and Other Transactions with Affiliates - continued
Transfer Agent Fees. Fidelity Investments Institutional Operations Company, Inc. (FIIOC), an affiliate of FMR, is the transfer, dividend disbursing and shareholder servicing agent for each class of the Fund. FIIOC receives account fees and asset-based fees that vary according to the account size and type of account of the shareholders of the respective classes of the Fund. FIIOC pays for typesetting, printing and mailing of shareholder reports, except proxy statements. For the period, transfer agent fees for each class were as follows:
| Amount | % of
Average
Net Assets |
Class A | $ 36,166 | .30 |
Class T | 39,638 | .33 |
Class B | 7,434 | .32 |
Class C | 12,983 | .31 |
Institutional Class | 3,198 | .13 |
| $ 99,419 | |
Accounting and Security Lending Fees. Fidelity Service Company, Inc. (FSC), an affiliate of FMR, maintains the Fund's accounting records. The accounting fee is based on the level of average net assets for the month. Under a separate contract, FSC administers the security lending program. The security lending fee is based on the number and duration of lending transactions.
Brokerage Commissions. The Fund placed a portion of its portfolio transactions with brokerage firms which are affiliates of the investment adviser. The commissions paid to these affiliated firms were $2,884 for the period.
6. Committed Line of Credit.
The Fund participates with other funds managed by FMR or an affiliate in a $3.75 billion credit facility (the "line of credit") to be utilized for temporary or emergency purposes to fund shareholder redemptions or for other short-term liquidity purposes. The Fund has agreed to pay commitment fees on its pro-rata portion of the line of credit, which amounted to $118 and is reflected in Miscellaneous expenses on the Statement of Operations. During the period, there were no borrowings on this line of credit.
7. Security Lending.
The Fund lends portfolio securities through a lending agent from time to time in order to earn additional income. The lending agent may loan securities to certain qualified borrowers, including Fidelity Capital Markets (FCM), a broker-dealer affiliated with the Fund. On the settlement date of the loan, the Fund receives collateral (in the form of
Annual Report
Notes to Financial Statements - continued
7. Security Lending - continued
U.S. Treasury obligations, letters of credit and/or cash) against the loaned securities and maintains collateral in an amount not less than 100% of the market value of the loaned securities during the period of the loan. The market value of the loaned securities is determined at the close of business of the Fund and any additional required collateral is delivered to the Fund on the next business day. If the borrower defaults on its obligation to return the securities loaned because of insolvency or other reasons, a fund could experience delays and costs in recovering the securities loaned or in gaining access to the collateral. Any cash collateral received is invested in the Fidelity Securities Lending Cash Central Fund. The value of loaned securities and cash collateral at period end are disclosed on the Fund's Statement of Assets and Liabilities. Security lending income represents the income earned on investing cash collateral, less rebates paid to borrowers and lending agent fees associated with the loan, plus any premium payments received for lending certain types of securities. Security lending income is presented in the Statement of Operations as a component of income from Fidelity Central Funds. Total security lending income during the period amounted to $23,119. During the period, there were no securities loaned to FCM.
8. Expense Reductions.
FMR voluntarily agreed to reimburse each class to the extent annual operating expenses exceeded certain levels of average net assets as noted in the table below. Some expenses, for example interest expense, including commitment fees, are excluded from this reimbursement.
The following classes were in reimbursement during the period:
| Expense
Limitations * | Reimbursement
from adviser |
| | |
Class A | 1.50% | $ 48,068 |
Class T | 1.75% | 69,048 |
Class B | 2.25% | 13,462 |
Class C | 2.25% | 21,747 |
Institutional Class | 1.25% | 4,433 |
| | $ 156,758 |
* Expense limitation in effect at period end.
Effective November 1, 2010 the expense limitation will be changed to 1.45%, 1.70%, 2.20%, 2.20% and 1.20% for Class A, T, B, C and Institutional, respectively.
Annual Report
8. Expense Reductions - continued
Many of the brokers with whom FMR places trades on behalf of the Fund provided services to the Fund in addition to trade execution. These services included payments of certain expenses on behalf of the Fund totaling $18,918 for the period.
9. Distributions to Shareholders.
Distributions to shareholders of each class were as follows:
Years ended October 31, | 2010 | 2009 |
From net investment income | | |
Class A | $ 24,148 | $ 9,964 |
Class T | 14,394 | 12,905 |
Class B | - | 2,090 |
Class C | - | 2,937 |
Institutional Class | 6,497 | 2,651 |
Total | $ 45,039 | $ 30,547 |
From net realized gain | | |
Class A | $ 62,317 | $ - |
Class T | 95,962 | - |
Class B | 13,694 | - |
Class C | 23,177 | - |
Institutional Class | 10,192 | - |
Total | $ 205,342 | $ - |
10. Share Transactions.
Transactions for each class of shares were as follows:
| Shares | Dollars |
Years ended October 31, | 2010 | 2009 | 2010 | 2009 |
Class A | | | | |
Shares sold | 2,107,781 | 202,494 | $ 21,885,164 | $ 1,551,596 |
Reinvestment of distributions | 8,588 | 1,584 | 82,276 | 9,506 |
Shares redeemed | (226,391) | (433,602) | (2,293,965) | (2,853,060) |
Net increase (decrease) | 1,889,978 | (229,524) | $ 19,673,475 | $ (1,291,958) |
Class T | | | | |
Shares sold | 1,253,117 | 218,150 | $ 13,010,370 | $ 1,562,039 |
Reinvestment of distributions | 11,592 | 2,148 | 108,388 | 12,590 |
Shares redeemed | (363,578) | (235,220) | (3,522,646) | (1,618,407) |
Net increase (decrease) | 901,131 | (14,922) | $ 9,596,112 | $ (43,778) |
Annual Report
Notes to Financial Statements - continued
10. Share Transactions - continued
| Shares | Dollars |
Years ended October 31, | 2010 | 2009 | 2010 | 2009 |
Class B | | | | |
Shares sold | 87,120 | 54,249 | $ 802,164 | $ 377,037 |
Reinvestment of distributions | 1,450 | 341 | 12,817 | 1,894 |
Shares redeemed | (87,578) | (95,791) | (796,786) | (611,596) |
Net increase (decrease) | 992 | (41,201) | $ 18,195 | $ (232,665) |
Class C | | | | |
Shares sold | 501,896 | 77,779 | $ 4,858,487 | $ 549,994 |
Reinvestment of distributions | 2,379 | 477 | 21,027 | 2,645 |
Shares redeemed | (147,177) | (95,347) | (1,345,064) | (616,538) |
Net increase (decrease) | 357,098 | (17,091) | $ 3,534,450 | $ (63,899) |
Institutional Class | | | | |
Shares sold | 986,043 | 23,710 | $ 11,001,071 | $ 163,841 |
Reinvestment of distributions | 415 | 221 | 4,092 | 1,361 |
Shares redeemed | (9,490) | (65,564) | (104,782) | (461,579) |
Net increase (decrease) | 976,968 | (41,633) | $ 10,900,381 | $ (296,377) |
11. Other.
The Fund's organizational documents provide former and current trustees and officers with a limited indemnification against liabilities arising in connection with the performance of their duties to the Fund. In the normal course of business, the Fund may also enter into contracts that provide general indemnifications. The Fund's maximum exposure under these arrangements is unknown as this would be dependent on future claims that may be made against the Fund. The risk of material loss from such claims is considered remote.
Annual Report
To the Trustees of Fidelity Advisor Series VIII and the Shareholders of Fidelity Advisor Global Capital Appreciation Fund:
In our opinion, the accompanying statement of assets and liabilities, including the schedule of investments, and the related statements of operations and of changes in net assets and the financial highlights present fairly, in all material respects, the financial position of Fidelity Advisor Global Capital Appreciation Fund (a fund of Fidelity Advisor Series VIII) at October 31, 2010, the results of its operations for the year then ended, the changes in its net assets for each of the two years in the period then ended and the financial highlights for each of the five years in the period then ended, in conformity with accounting principles generally accepted in the United States of America. These financial statements and financial highlights (hereafter referred to as "financial statements") are the responsibility of the Fidelity Advisor Global Capital Appreciation Fund's management. Our responsibility is to express an opinion on these financial statements based on our audits. We conducted our audits of these financial statements in accordance with the standards of the Public Company Accounting Oversight Board (United States). Those standards require that we plan and perform the audit to obtain reasonable assurance about whether the financial statements are free of material misstatement. An audit includes examining, on a test basis, evidence supporting the amounts and disclosures in the financial statements, assessing the accounting principles used and significant estimates made by management, and evaluating the overall financial statement presentation. We believe that our audits, which included confirmation of securities at October 31, 2010 by correspondence with the custodian and brokers, provide a reasonable basis for our opinion.
/s/ PricewaterhouseCoopers LLP
PricewaterhouseCoopers LLP
Boston, Massachusetts
December 17, 2010
Annual Report
The Trustees, Member of the Advisory Board, and executive officers of the trust and fund, as applicable, are listed below. The Board of Trustees governs the fund and is responsible for protecting the interests of shareholders. The Trustees are experienced executives who meet periodically throughout the year to oversee the fund's activities, review contractual arrangements with companies that provide services to the fund, oversee management of the risks associated with such activities and contractual arrangements, and review the fund's performance. Except for James C. Curvey, each of the Trustees oversees 221 funds advised by FMR or an affiliate. Mr. Curvey oversees 410 funds advised by FMR or an affiliate.
The Trustees hold office without limit in time except that (a) any Trustee may resign; (b) any Trustee may be removed by written instrument, signed by at least two-thirds of the number of Trustees prior to such removal; (c) any Trustee who requests to be retired or who has become incapacitated by illness or injury may be retired by written instrument signed by a majority of the other Trustees; and (d) any Trustee may be removed at any special meeting of shareholders by a two-thirds vote of the outstanding voting securities of the trust. Each Trustee who is not an interested person (as defined in the 1940 Act) (Independent Trustee), shall retire not later than the last day of the calendar year in which his or her 72nd birthday occurs. The Independent Trustees may waive this mandatory retirement age policy with respect to individual Trustees. The executive officers and Advisory Board Member hold office without limit in time, except that any officer and Advisory Board Member may resign or may be removed by a vote of a majority of the Trustees at any regular meeting or any special meeting of the Trustees. Except as indicated, each individual has held the office shown or other offices in the same company for the past five years.
Experience, Skills, Attributes, and Qualifications of the Fund's Trustees. The Governance and Nominating Committee has adopted a statement of policy that describes the experience, qualifications, attributes, and skills that are necessary and desirable for potential Independent Trustee candidates (Statement of Policy). The Board believes that each Trustee satisfied at the time he or she was initially elected or appointed a Trustee, and continues to satisfy, the standards contemplated by the Statement of Policy. The Governance and Nominating Committee also engages professional search firms to help identify potential Independent Trustee candidates who have the experience, qualifications, attributes, and skills consistent with the Statement of Policy. From time to time, additional criteria based on the composition and skills of the current Independent Trustees, as well as experience or skills that may be appropriate in light of future changes to board composition, business conditions, and regulatory or other developments, have also been considered by the professional search firms and the Governance and Nominating Committee. In addition, the Board takes into account the Trustees' commitment and participation in Board and committee meetings, as well as their leadership of standing and ad hoc committees throughout their tenure.
In determining that a particular Trustee was and continues to be qualified to serve as a Trustee, the Board has considered a variety of criteria, none of which, in isolation, was controlling. The Board believes that, collectively, the Trustees have balanced and diverse experience, qualifications, attributes, and skills, which allow the Board to operate effectively in governing the fund and protecting the interests of shareholders. Information about the specific experience, skills, attributes, and qualifications of each Trustee, which in each case led to the Board's conclusion that the Trustee should serve (or continue to serve) as a trustee of the fund, is provided below.
Annual Report
Board Structure and Oversight Function. Edward C. Johnson 3d is an interested person (as defined in the 1940 Act) and currently serves as Chairman. The Trustees have determined that an interested Chairman is appropriate and benefits shareholders because an interested Chairman has a personal and professional stake in the quality and continuity of services provided to the fund. Independent Trustees exercise their informed business judgment to appoint an individual of their choosing to serve as Chairman, regardless of whether the Trustee happens to be independent or a member of management. The Independent Trustees have determined that they can act independently and effectively without having an Independent Trustee serve as Chairman and that a key structural component for assuring that they are in a position to do so is for the Independent Trustees to constitute a substantial majority for the Board. The Independent Trustees also regularly meet in executive session. Ned C. Lautenbach serves as Chairman of the Independent Trustees and as such (i) acts as a liaison between the Independent Trustees and management with respect to matters important to the Independent Trustees and (ii) with management prepares agendas for Board meetings.
Fidelity funds are overseen by different Boards of Trustees. The fund's Board oversees Fidelity's equity and high income funds and another Board oversees Fidelity's investment-grade bond, money market, and asset allocation funds. The asset allocation funds may invest in Fidelity funds overseen by the fund's Board. The use of separate Boards, each with its own committee structure, allows the Trustees of each group of Fidelity funds to focus on the unique issues of the funds they oversee, including common research, investment, and operational issues. On occasion, the separate Boards establish joint committees to address issues of overlapping consequences for the Fidelity funds overseen by each Board.
The Trustees operate using a system of committees to facilitate the timely and efficient consideration of all matters of importance to the Trustees, the fund, and fund shareholders and to facilitate compliance with legal and regulatory requirements and oversight of the fund's activities and associated risks. The Board, acting through its committees, has charged FMR and its affiliates with (i) identifying events or circumstances the occurrence of which could have demonstrably adverse effects on the fund's business and/or reputation; (ii) implementing processes and controls to lessen the possibility that such events or circumstances occur or to mitigate the effects of such events or circumstances if they do occur; and (iii) creating and maintaining a system designed to evaluate continuously business and market conditions in order to facilitate the identification and implementation processes described in (i) and (ii) above. Because the day-to-day operations and activities of the fund are carried out by or through FMR, its affiliates and other service providers, the fund's exposure to risks is mitigated but not eliminated by the processes overseen by the Trustees. While each of the Board's committees has responsibility for overseeing different aspects of the fund's activities, oversight is exercised primarily through the Operations, Audit, and Compliance Committees. Appropriate personnel, including but not limited to the fund's Chief Compliance Officer (CCO), FMR's internal auditor, the independent accountants, the fund's Treasurer and portfolio management personnel, make periodic reports to the Board's committees, as appropriate. The responsibilities of each committee, including their oversight responsibilities, are described further under "Standing Committees of the Fund's Trustees."
Annual Report
Trustees and Officers - continued
The fund's Statement of Additional Information (SAI) includes more information about the Trustees. To request a free copy, call Fidelity at 1-877-208-0098.
Interested Trustees*:
Correspondence intended for each Trustee who is an interested person may be sent to Fidelity Investments, 82 Devonshire Street, Boston, Massachusetts 02109.
Name, Age; Principal Occupations and Other Relevant Experience+ |
Edward C. Johnson 3d (80) |
| Year of Election or Appointment: 1983 Mr. Johnson is Trustee and Chairman of the Board of Trustees of certain Trusts. Mr. Johnson serves as Chief Executive Officer, Chairman, and a Director of FMR LLC; Chairman and a Director of FMR; Chairman and a Director of Fidelity Research & Analysis Company (FRAC); Chairman and a Director of Fidelity Investments Money Management, Inc.; and Chairman and a Director of FMR Co., Inc. In addition, Mr. Johnson serves as Chairman and Director of FIL Limited. Previously, Mr. Johnson served as President of FMR LLC (2006-2007). |
James C. Curvey (75) |
| Year of Election or Appointment: 2007 Mr. Curvey also serves as Trustee (2007-present) of other investment companies advised by FMR. Mr. Curvey is a Director of Fidelity Investments Money Management, Inc. (2009-present), Director of Fidelity Research & Analysis Co. (2009-present) and Director of FMR and FMR Co., Inc. (2007-present). Mr. Curvey is also Vice Chairman (2007-present) and Director of FMR LLC. In addition, Mr. Curvey serves as an Overseer for the Boston Symphony Orchestra and a member of the Trustees of Villanova University. Previously, Mr. Curvey was the Vice Chairman (2006-2007) and Director (2000-2007) of FMR Corp. |
* Trustees have been determined to be "Interested Trustees" by virtue of, among other things, their affiliation with the trust or various entities under common control with FMR.
Annual Report
+ The information above includes each Trustee's principal occupation during the last five years and other information relating to the experience, attributes, and skills relevant to each Trustee's qualifications to serve as a Trustee, which led to the conclusion that each Trustee should serve as a Trustee for the fund.
Independent Trustees:
Correspondence intended for each Independent Trustee (that is, the Trustees other than the Interested Trustees) may be sent to Fidelity Investments, P.O. Box 55235, Boston, Massachusetts 02205-5235.
Name, Age; Principal Occupations and Other Relevant Experience+ |
Dennis J. Dirks (62) |
| Year of Election or Appointment: 2005 Prior to his retirement in May 2003, Mr. Dirks was Chief Operating Officer and a member of the Board of The Depository Trust & Clearing Corporation (DTCC). He also served as President, Chief Operating Officer, and Board member of The Depository Trust Company (DTC) and President and Board member of the National Securities Clearing Corporation (NSCC). In addition, Mr. Dirks served as Chief Executive Officer and Board member of the Government Securities Clearing Corporation, Chief Executive Officer and Board member of the Mortgage-Backed Securities Clearing Corporation, as a Trustee and a member of the Finance Committee of Manhattan College (2005-2008), and as a Trustee and a member of the Finance Committee of AHRC of Nassau County (2006-2008). Mr. Dirks is a member of the Independent Directors Council (IDC) Governing Council (2010-Present) and Board of Directors for The Brookville Center for Children's Services, Inc. (2009-present). |
Alan J. Lacy (57) |
| Year of Election or Appointment: 2008 Mr. Lacy serves as Senior Adviser (2007-present) of Oak Hill Capital Partners, L.P. (private equity). Mr. Lacy also served as Chief Executive Officer (2000-2005) and Vice Chairman (2005-2006) of Sears Holdings Corporation and Sears, Roebuck and Co. (retail). In addition, Mr. Lacy serves as a member of the Board of Directors of The Western Union Company (global money transfer, 2006-present) and Bristol-Myers Squibb Company (global pharmaceuticals, 2007-present). Mr. Lacy is Chairman (2008-present) and a member (2006-present) of the Board of Trustees of The National Parks Conservation Association. |
Ned C. Lautenbach (66) |
| Year of Election or Appointment: 2000 Mr. Lautenbach is Chairman of the Independent Trustees of the Equity and High Income Funds (2006-present). Mr. Lautenbach currently serves as the Lead Director of the Eaton Corporation Board of Directors (diversified industrial, 1997-present). Mr. Lautenbach is also a member of the Board of Directors of the Philharmonic Center for the Arts in Naples, Florida (1999-present); a member of the Board of Trustees of Fairfield University (2005-present); and a member of the Council on Foreign Relations (1994-present). Previously, Mr. Lautenbach was a Partner/Advisory Partner at Clayton, Dubilier & Rice, Inc. (private equity investment, 1998-2010), as well as a Director of Sony Corporation (2006-2007). |
Joseph Mauriello (66) |
| Year of Election or Appointment: 2008 Prior to his retirement in January 2006, Mr. Mauriello served in numerous senior management positions including Deputy Chairman and Chief Operating Officer (2004-2005), and Vice Chairman of Financial Services (2002-2004) of KPMG LLP US (professional services, 1965-2005). Mr. Mauriello currently serves as a member of the Board of Directors of XL Group plc. (global insurance and re-insurance, 2006-present) and of Arcadia Resources Inc. (health care services and products, 2007-present). Previously, Mr. Mauriello served as a Director of the Hamilton Funds of the Bank of New York (2006-2007). |
Cornelia M. Small (66) |
| Year of Election or Appointment: 2005 Ms. Small is a member of the Board of Directors of the Teagle Foundation (2009-present). Ms. Small is also a member of the Investment Committee, and Chair (2008-present) and a member of the Board of Trustees of Smith College. In addition, Ms. Small serves on the Investment Committee of the Berkshire Taconic Community Foundation (2008-present). Previously, Ms. Small served as Chairperson of the Investment Committee (2002-2008) of Smith College. In addition, Ms. Small served as Chief Investment Officer, Director of Global Equity Investments, and a member of the Board of Directors of Scudder, Stevens & Clark and Scudder Kemper Investments. |
William S. Stavropoulos (71) |
| Year of Election or Appointment: 2001 Mr. Stavropoulos is Vice Chairman of the Independent Trustees of the Equity and High Income Funds (2006-present). Mr. Stavropoulos serves as President and Founder of the Michigan Baseball Foundation, the Great Lakes Loons (2007-present). Mr. Stavropoulos is Chairman Emeritus of the Board of Directors of The Dow Chemical Company, where he previously served in numerous senior management positions, including President, CEO (1995-2000; 2002-2004), Chairman of the Executive Committee (2000-2006), and as a member of the Board of Directors (1990-2006). Currently, Mr. Stavropoulos is Chairman of Univar (global distributor of commodity and specialty chemicals, 2010-present), a Director of Teradata Corporation (data warehousing and technology solutions, 2008-present), Chemical Financial Corporation, Maersk Inc. (industrial conglomerate), Tyco International, Inc. (multinational manufacturing and services, 2007-present), and a member of the Advisory Board for Metalmark Capital (private equity investment, 2005-
present). Mr. Stavropoulos is a special advisor to Clayton, Dubilier & Rice, Inc. (private equity investment). In addition, Mr. Stavropoulos is a member of the University of Notre Dame Advisory Council for the College of Science. |
David M. Thomas (61) |
| Year of Election or Appointment: 2008 Previously, Mr. Thomas served as Executive Chairman (2005-2006) and Chairman and Chief Executive Officer (2000-2005) of IMS Health, Inc. (pharmaceutical and healthcare information solutions). In addition, Mr. Thomas serves as a member of the Board of Directors of Fortune Brands, Inc. (consumer products), and Interpublic Group of Companies, Inc. (marketing communication, 2004-present). |
Michael E. Wiley (60) |
| Year of Election or Appointment: 2008 Mr. Wiley also serves as a Director of Asia Pacific Exploration Consolidated (international oil and gas exploration and production, 2008-present). Mr. Wiley serves as a Director of Tesoro Corporation (independent oil refiner and marketer, 2005-present), and a Director of Bill Barrett Corporation (exploration and production, 2005-present). In addition, Mr. Wiley also serves as a Director of Post Oak Bank (privately-held bank, 2004-present). Previously, Mr. Wiley served as a member of the Board of Trustees of the University of Tulsa (2000-2006; 2007-2010), as a Senior Energy Advisor of Katzenbach Partners, LLC (consulting, 2006-2007), as an Advisory Director of Riverstone Holdings (private investment), Chairman, President, and CEO of Baker Hughes, Inc. (oilfield services, 2000-2004), and as Director of Spinnaker Exploration Company (exploration and production, 2001-2005). |
Annual Report
Trustees and Officers - continued
+ The information above includes each Trustee's principal occupation during the last five years and other information relating to the experience, attributes, and skills relevant to each Trustee's qualifications to serve as a Trustee, which led to the conclusion that each Trustee should serve as a Trustee for the fund.
Advisory Board Member and Executive Officers:
Correspondence intended for each executive officer and Peter S. Lynch may be sent to Fidelity Investments, 82 Devonshire Street, Boston, Massachusetts 02109.
Name, Age; Principal Occupation |
Peter S. Lynch (66) |
| Year of Election or Appointment: 2003 Member of the Advisory Board of Fidelity's Equity and High Income Funds. Mr. Lynch is Vice Chairman and a Director of FMR and FMR Co., Inc. In addition, Mr. Lynch serves as a Trustee of Boston College and as the Chairman of the Inner-City Scholarship Fund. Previously, Mr. Lynch served on the Special Olympics International Board of Directors (1997-2006). |
Kenneth B. Robins (41) |
| Year of Election or Appointment: 2008 President and Treasurer of Fidelity's Equity and High Income Funds. Mr. Robins also serves as President and Treasurer (2010-present) and Assistant Treasurer (2009-present) of other Fidelity funds and is an employee of Fidelity Investments (2004-present). Previously, Mr. Robins served as Deputy Treasurer of the Fidelity funds (2005-2008) and Treasurer and Chief Financial Officer of The North Carolina Capital Management Trust: Cash and Term Portfolios (2006-2008). |
Bruce T. Herring (45) |
| Year of Election or Appointment: 2006 Vice President of certain Equity Funds. Mr. Herring also serves as Chief Investment Officer and Director of Fidelity Management & Research (U.K.) Inc. (2010-present) and Group Chief Investments Officer of FMR. Previously, Mr. Herring served as Vice President (2005-2006) and Senior Vice President (2006-2007) of Fidelity Management & Research Company, Vice President of FMR Co., Inc. (2001-2007) and as a portfolio manager for Fidelity U.S. Equity Funds. |
Brian B. Hogan (46) |
| Year of Election or Appointment: 2009 Vice President of certain Equity Funds and Vice President of Sector Funds. Mr. Hogan also serves as President of FMR's Equity Division (2009-present). Previously, Mr. Hogan served as Senior Vice President, Equity Research of FMR (2006-2009) and as a portfolio manager. |
Scott C. Goebel (42) |
| Year of Election or Appointment: 2008 Secretary and Chief Legal Officer (CLO) of the Fidelity funds. Mr. Goebel also serves as Secretary and CLO of The North Carolina Capital Management Trust: Cash and Term Portfolio (2008-present); General Counsel, Secretary, and Senior Vice President of FMR (2008-present) and FMR Co., Inc. (2008-present); Deputy General Counsel of FMR LLC; Chief Legal Officer of Fidelity Management & Research (Hong Kong) Limited (2008-present) and Assistant Secretary of Fidelity Management & Research (Japan) Inc. (2008-present), Fidelity Investments Money Management, Inc. (2008-present), Fidelity Management & Research (U.K.) Inc. (2008-present), and Fidelity Research and Analysis Company (2008-present). Previously, Mr. Goebel served as Assistant Secretary of the Funds (2007-2008) and as Vice President and Secretary of Fidelity Distributors Corporation (FDC) (2005-2007). |
William C. Coffey (41) |
| Year of Election or Appointment: 2009 Assistant Secretary of Fidelity's Equity and High Income Funds. Mr. Coffey also serves as Senior Vice President and Deputy General Counsel of FMR LLC (2010-present), and is an employee of Fidelity Investments. Previously, Mr. Coffey served as Vice President and Associate General Counsel of FMR LLC (2005-2009). |
Holly C. Laurent (56) |
| Year of Election or Appointment: 2008 Anti-Money Laundering (AML) Officer of the Fidelity funds. Ms. Laurent also serves as AML Officer of The North Carolina Capital Management Trust: Cash and Term Portfolio (2008-present) and is an employee of Fidelity Investments. Previously, Ms. Laurent was Senior Vice President and Head of Legal for Fidelity Business Services India Pvt. Ltd. (2006-2008), and Senior Vice President, Deputy General Counsel and Group Head for FMR LLC (2005-2006). |
Christine Reynolds (52) |
| Year of Election or Appointment: 2008 Chief Financial Officer of the Fidelity funds. Ms. Reynolds became President of Fidelity Pricing and Cash Management Services (FPCMS) in August 2008. Ms. Reynolds served as Chief Operating Officer of FPCMS (2007-2008). Previously, Ms. Reynolds served as President, Treasurer, and Anti-Money Laundering officer of the Fidelity funds (2004-2007). |
Kenneth A. Rathgeber (63) |
| Year of Election or Appointment: 2004 Chief Compliance Officer of Fidelity's Equity and High Income Funds. Mr. Rathgeber is Chief Compliance Officer of Fidelity Management & Research (Hong Kong) Limited (2008-present), Fidelity Management & Research (Japan) Inc. (2008-present), FMR (2005-present), FMR Co., Inc. (2005-present), Fidelity Management & Research (U.K.) Inc. (2005-present), Fidelity Research & Analysis Company (2005-present), Fidelity Investments Money Management, Inc. (2005-present), Pyramis Global Advisors, LLC (2005-present), and Strategic Advisers, Inc. (2005-present). |
Jeffrey S. Christian (49) |
| Year of Election or Appointment: 2009 Deputy Treasurer of the Fidelity funds. Mr. Christian is an employee of Fidelity Investments. Previously, Mr. Christian served as Chief Financial Officer (2008-2009) of certain Fidelity funds and Senior Vice President of Fidelity Pricing and Cash Management Services (FPCMS) (2004-2009). |
Bryan A. Mehrmann (49) |
| Year of Election or Appointment: 2005 Deputy Treasurer of the Fidelity funds. Mr. Mehrmann is an employee of Fidelity Investments. |
Adrien E. Deberghes (43) |
| Year of Election or Appointment: 2008 Deputy Treasurer of Fidelity's Equity and High Income Funds. Mr. Deberghes also serves as Assistant Treasurer of other Fidelity funds (2010-present) and is an employee of Fidelity Investments (2008-present). Previously, Mr. Deberghes served as Senior Vice President of Mutual Fund Administration at State Street Corporation (2007-2008), Senior Director of Mutual Fund Administration at Investors Bank & Trust (2005-2007), and Director of Finance for Dunkin' Brands (2000-2005). |
Stephanie J. Dorsey (41) |
| Year of Election or Appointment: 2010 Assistant Treasurer of Fidelity's Equity and High Income Funds. Ms. Dorsey also serves as Deputy Treasurer of other Fidelity funds (2008-present) and is an employee of Fidelity Investments (2008-present). Previously, Ms. Dorsey served as Treasurer (2004-2008) of the JPMorgan Mutual Funds and Vice President (2004-2008) of JPMorgan Chase Bank. |
Name, Age; Principal Occupation |
John R. Hebble (52) |
| Year of Election or Appointment: 2009 Assistant Treasurer of Fidelity's Equity and High Income Funds. Mr. Hebble also serves as Treasurer and Chief Financial Officer of The North Carolina Capital Management Trust: Cash and Term Portfolio (2008-present), President and Treasurer of other Fidelity funds (2008-present) and is an employee of Fidelity Investments. |
Gary W. Ryan (52) |
| Year of Election or Appointment: 2005 Assistant Treasurer of the Fidelity funds. Mr. Ryan is an employee of Fidelity Investments. Previously, Mr. Ryan served as Vice President of Fund Reporting in Fidelity Pricing and Cash Management Services (FPCMS) (1999-2005). |
Jonathan Davis (42) |
| Year of Election or Appointment: 2010 Assistant Treasurer of the Fidelity funds. Mr. Davis is an employee of Fidelity Investments. Previously, Mr. Davis served as Vice President and Associate General Counsel of FMR LLC (2003-2010). |
Annual Report
The Board of Trustees of Advisor Global Capital Appreciation Fund voted to pay to shareholders of record at the opening of business on record date, the following distributions per share derived from capital gains realized from sales of portfolio securities:
| Pay Date | Record Date | Dividends | Capital Gains |
Institutional Class | 12/06/10 | 12/03/10 | $0.000 | $0.053 |
Institutional Class designates 26% of the dividends distributed during the fiscal year as qualifying for the dividends-received deduction for corporate shareholders.
Institutional Class designates 100% of the dividends distributed during the fiscal year as amounts which may be taken into account as a dividend for purposes of the maximum rate under section 1(h)(11) of the Internal Revenue Code.
The amounts per share which represent income derived from sources within, and taxes paid to, foreign countries or possessions of the United States are as follows:
| Pay Date | Income | Taxes |
Institutional Class | 12/07/09 | $0.083 | $0.0127 |
The fund will notify shareholders in January 2011 of amounts for use in preparing 2010 income tax returns.
Annual Report
Board Approval of Investment Advisory Contracts and Management Fees
Fidelity Advisor Global Capital Appreciation Fund
Each year, the Board of Trustees, including the Independent Trustees (together, the Board), votes on the renewal of the management contract and sub-advisory agreements (together, the Advisory Contracts) for the fund. The Board, assisted by the advice of fund counsel and Independent Trustees' counsel, requests and considers a broad range of information relevant to the renewal of the Advisory Contracts throughout the year.
The Board meets regularly and considers at each of its meetings factors that are relevant to its annual consideration of the renewal of the fund's Advisory Contracts, including the services and support provided to the fund and its shareholders. The Board has established various standing committees, each composed of Independent Trustees with varying backgrounds, to which the Board has assigned specific subject matter responsibilities in order to enhance effective decision-making by the Board. The Board, acting directly and through its Committees, requests and receives information concerning the annual consideration of the renewal of the fund's Advisory Contracts. The Board also meets as needed to consider matters specifically related to the Board's annual consideration of the renewal of Advisory Contracts. Members of the Board may also meet with trustees of other Fidelity funds through ad hoc joint committees to discuss certain matters relevant to the Fidelity funds.
At its July 2010 meeting, the Board of Trustees, including the Independent Trustees, unanimously determined to renew the fund's Advisory Contracts. In reaching its determination, the Board considered all factors it believed relevant, including (i) the nature, extent, and quality of the services to be provided to the fund and its shareholders (including the investment performance of the fund); (ii) the competitiveness of the fund's management fee and total expenses; (iii) the total costs of the services to be provided by and the profits to be realized by Fidelity from its relationship with the fund; (iv) the extent to which economies of scale would be realized as the fund grows; and (v) whether fee levels reflect these economies of scale, if any, for the benefit of fund shareholders.
In considering whether to renew the Advisory Contracts for the fund, the Board reached a determination, with the assistance of fund counsel and Independent Trustees' counsel and through the exercise of its business judgment, that the renewal of the Advisory Contracts is in the best interests of fund shareholders and that the compensation to be received by Fidelity under the management contract is fair and reasonable. The Board's decision to renew the Advisory Contracts was not based on any single factor noted above, but rather was based on a comprehensive consideration of all the information provided to the Board at its meetings throughout the year. The Board, in reaching its determination to renew the Advisory Contracts, is aware that shareholders in the fund have a broad range of investment choices available to them, including a wide choice among mutual funds offered by Fidelity's competitors, and that the fund's shareholders, with the opportunity to review and weigh the disclosure provided by the fund in its prospectus and other public disclosures, have chosen to invest in this fund, managed by Fidelity.
Annual Report
Board Approval of Investment Advisory Contracts and
Management Fees - continued
Nature, Extent, and Quality of Services Provided. The Board considered the staffing within the investment adviser, FMR, and the sub-advisers (together, the Investment Advisers), including the backgrounds of the fund's investment personnel and the fund's investment objective and discipline. The Independent Trustees also had discussions with senior management of Fidelity's investment operations and investment groups. The Board considered the structure of the portfolio manager compensation program and whether this structure provides appropriate incentives to act in the best interest of the fund.
Resources Dedicated to Investment Management and Support Services. The Board and the equity research subcommittee of the Board's Fund Oversight Committee reviewed the size, education, and experience of the Investment Advisers' investment staff, their use of technology, and the Investment Advisers' approach to recruiting, training, and retaining portfolio managers and other research, advisory, and management personnel. The Board noted that Fidelity's analysts have access to a variety of technological tools and market and securities data that enable them to perform both fundamental and quantitative analysis and to specialize in various disciplines. The Board considered Fidelity's extensive global research capabilities that enable the Investment Advisers to aggregate data from various sources in an effort to produce positive investment results. The Board also considered that Fidelity's portfolio managers and analysts have access to daily portfolio attribution that allows for monitoring of a fund's portfolio, as well as an electronic communication system that provides immediate real-time access to research concerning issuers and credit enhancers. The Board noted FMR's continued focus on strengthening the organization and discipline of equity portfolio management and research.
Shareholder and Administrative Services. The Board considered (i) the nature, extent, quality, and cost of advisory, administrative, and shareholder services performed by the Investment Advisers and their affiliates under the Advisory Contracts and under separate agreements covering transfer agency, pricing and bookkeeping, and securities lending services for the fund; (ii) the nature and extent of the investment adviser's supervision of third party service providers, principally custodians and subcustodians; and (iii) the resources devoted to, and the record of compliance with, the fund's compliance policies and procedures. The Board also reviewed the allocation of fund brokerage, including allocations to brokers affiliated with the Investment Advisers, the use of brokerage commissions to pay fund expenses, and the use of "soft" commission dollars to pay for research services.
The Board noted that the growth of fund assets over time across the complex allows Fidelity to reinvest in the development of services designed to enhance the value or convenience of the Fidelity funds as investment vehicles. These services include 24-hour access to account information and market information through phone representatives and over the Internet, and investor education materials and asset allocation tools.
Annual Report
Investment in a Large Fund Family. The Board considered the benefits to shareholders of investing in a Fidelity fund, including the benefits of investing in a fund that is part of a large family of funds offering a variety of investment disciplines and providing a large variety of mutual fund investor services. The Board noted that Fidelity had taken, or had made recommendations that resulted in the Fidelity funds taking, a number of actions over the previous year that benefited particular funds, including (i) dedicating additional resources to investment research and restructuring and broadening the focus of the investment research teams; (ii) bolstering the senior management team that oversees asset management; (iii) launching Class F of certain funds as a lower-fee class available to Freedom K and Freedom Index Funds; (iv) lowering the initial investment minimums and ongoing balance requirements for Real Estate High Income Fund; (v) eliminating subsequent purchase minimums for all funds and adding a waiver of the investment minimum requirement for new accounts opened with the proceeds of a systematic withdrawal plan; (vi) eliminating the withdrawal minimum and maximum limits for systematic withdrawals from Advisor funds; (vii) expanding sales load waivers on Class A shares for Destiny Planholders and expanding Institutional Class eligibility for Class O Destiny Planholders; and (viii) changing certain Class A and Class T sales charge structures to further align them with industry practices.
Investment Performance. The Board considered whether the fund has operated in accordance with its investment objective, as well as its record of compliance with its investment restrictions. It also reviewed the fund's absolute investment performance for each class, as well as the fund's relative investment performance for each class measured over multiple periods against (i) a broad-based securities market index, and (ii) a peer group of mutual funds deemed appropriate by Fidelity and reviewed by the Board. The following charts considered by the Board show, over the one-, three-, and five-year periods ended December 31, 2009, the cumulative total returns of Institutional Class (Class I) and Class C of the fund, the cumulative total returns of a broad-based securities market index ("benchmark"), and a range of cumulative total returns of a peer group of mutual funds identified by Morningstar, Inc. as having an investment style similar to that of the fund based on underlying portfolio holdings. The returns of Institutional Class (Class I) and Class C show the performance of the highest and lowest performing classes, respectively (based on five-year performance). The box within each chart shows the 25th percentile return (bottom of box) and the 75th percentile return (top of box) of the peer group. Returns shown above the box are in the first quartile and returns shown below the box are in the fourth quartile. The percentage beaten numbers noted below each chart correspond to the percentile box and represent the percentage of funds in the peer group whose performance was equal to or lower than that of the class indicated.
Annual Report
Board Approval of Investment Advisory Contracts and
Management Fees - continued
Fidelity Advisor Global Capital Appreciation Fund
The Board reviewed the fund's relative investment performance against its peer group and noted that the performance of Institutional Class (Class I) of the fund was in the first quartile for the one-year period, the third quartile for the three-year period, and the fourth quartile for the five-year period. The Board also noted that the investment performance of the fund was lower than its benchmark for the three- and five-year periods, although the one-year cumulative total return of Institutional Class (Class I) compared favorably to its benchmark. The Board considered that the variations in performance among the fund's classes reflect the variations in class expenses, which result in lower performance for higher expense classes. The Board also reviewed the fund's performance since inception as well as performance in the current year.
The Board also considered that the fund's management fee is subject to upward or downward adjustment depending upon whether, and to what extent, the fund's investment performance for the performance period exceeds, or is exceeded by, the record (over the same period) of a Board-approved performance adjustment index. The Board realizes that the performance adjustment provides FMR with a strong economic incentive to seek to achieve superior performance for the fund's shareholders and helps to more closely align the interests of FMR and the fund's shareholders.
Based on its review, and giving particular weight to the nature and quality of the resources dedicated by the Investment Advisers to maintain and improve relative performance and factoring in the unprecedented market events in recent years, the Board concluded that the nature, extent, and quality of investment management and support services and of shareholder and administrative services provided to the fund will benefit the fund's shareholders, particularly in light of the Board's view that the fund's shareholders benefit from investing in a fund that is part of a large family of funds offering a variety of investment disciplines and services.
Annual Report
Competitiveness of Management Fee and Total Fund Expenses. The Board considered the fund's management fee and total expenses compared to "mapped groups" of competitive funds and classes. Fidelity creates "mapped groups" by combining similar Lipper investment objective categories that have comparable management fee characteristics. Combining Lipper investment objective categories aids the Board's management fee and total expense comparisons by broadening the competitive group used for comparison and by reducing the number of universes to which various Fidelity funds are compared.
Management Fee. The Board considered two proprietary management fee comparisons for the 12-month periods shown in the chart below. The group of Lipper funds used by the Board for management fee comparisons is referred to below as the "Total Mapped Group." The Total Mapped Group comparison focuses on a fund's standing relative to the total universe of comparable funds available to investors, in terms of gross management fees before expense reimbursements or caps, and without giving effect to the fund's performance adjustment. "TMG %" represents the percentage of funds in the Total Mapped Group that had management fees that were lower than the fund's. For example, a TMG % of 15% means that 85% of the funds in the Total Mapped Group had higher management fees than the fund. The "Asset-Size Peer Group" (ASPG) comparison focuses on a fund's standing relative to non-Fidelity funds similar in size to the fund within the Total Mapped Group. The ASPG represents at least 15% of the funds in the Total Mapped Group with comparable asset size and management fee characteristics, subject to a minimum of 50 funds (or all funds in the Total Mapped Group if fewer than 50). Additional information, such as the ASPG quartile in which the fund's management fee ranked and the impact of the fund's performance adjustment, is also included in the chart and considered by the Board.
Annual Report
Board Approval of Investment Advisory Contracts and
Management Fees - continued
Fidelity Advisor Global Capital Appreciation Fund
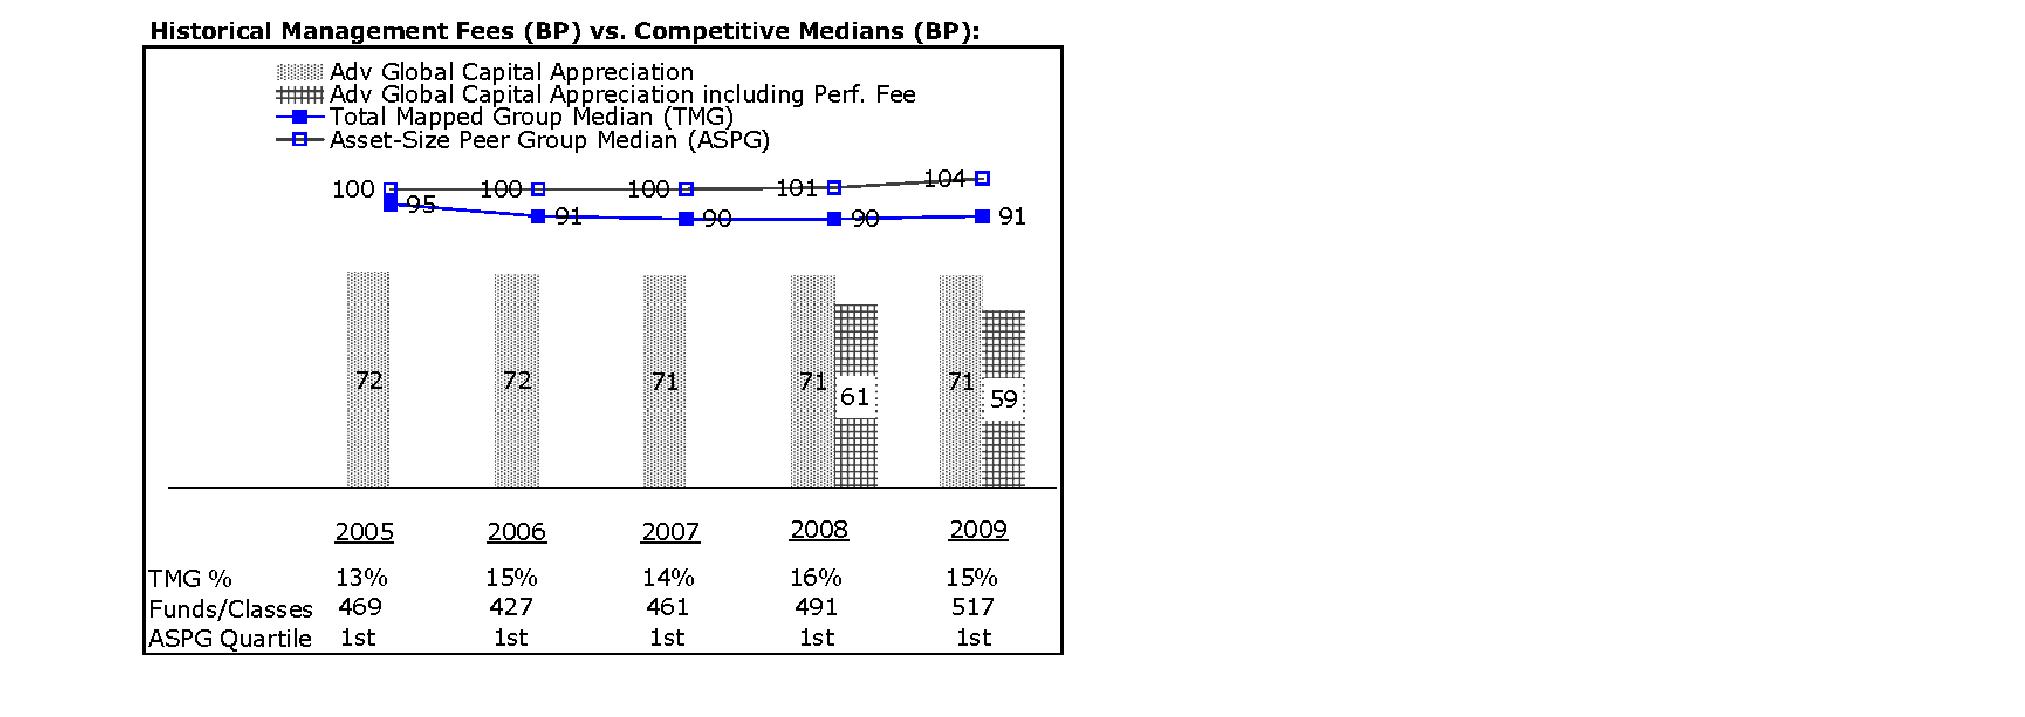
The Board noted that the fund's management fee ranked below the median of its Total Mapped Group and below the median of its ASPG for 2009. The Board also noted the effect of the fund's negative performance adjustment on the fund's management fee ranking. The Board noted that the performance adjustment for each year represents calculations for performance periods that differ from the periods shown in the performance charts above.
Based on its review, the Board concluded that the fund's management fee is fair and reasonable in light of the services that the fund receives and the other factors considered.
Total Expenses. In its review of each class's total expenses, the Board considered the fund's management fee as well as other fund or class expenses, as applicable, such as transfer agent fees, pricing and bookkeeping fees, fund-paid 12b-1 fees, and custodial, legal, and audit fees. The Board also noted the effects of any waivers and reimbursements on fees and expenses, as well as the impact of the fund's performance adjustment. As part of its review, the Board also considered current and historical total expenses of each class of the fund compared to competitive fund median expenses. Each class of the fund is compared to those funds and classes in the Total Mapped Group (used by the Board for management fee comparisons) that have a similar sales load structure.
The Board noted that the total expenses of Class A ranked below its competitive median for 2009, the total expenses of Class B ranked equal to its competitive median for 2009, and the total expenses of each of Class T, Class C, and Institutional Class ranked above its competitive median for 2009. The Board considered that the total expenses for Class T were above the median primarily because its 12b-1 fee is higher than the typical front-end load class. The Board noted that the fund offers multiple classes, each of which has a different sales load and 12b-1 fee structure, and that the multiple structures are intended to offer a range of pricing options for the intermediary market. The Board also noted that the total expenses of the classes vary primarily by the level of their 12b-1 fees, although differences in transfer agent fees may also cause expenses to vary from class to class.
Annual Report
Fees Charged to Other Fidelity Clients. The Board also considered Fidelity fee structures and other information with respect to clients of FMR and its affiliates, such as other mutual funds advised or subadvised by FMR or its affiliates, pension plan clients, and other institutional clients. In March 2010, the Board created an ad hoc joint committee with the board of other Fidelity funds (the Committee) to review and compare Fidelity's institutional investment advisory business with its business of providing services to the Fidelity funds, including the differences in services provided, fees charged, and costs incurred, as well as competition in their respective marketplaces.
Based on its review of total expenses and fees charged to other Fidelity clients, the Board concluded that the total expenses of each class of the fund were reasonable, although in some cases above the median of the universe presented for comparison, in light of the services that the fund and its shareholders receive and the other factors considered, including the findings of the Committee.
Costs of the Services and Profitability. The Board considered the revenues earned and the expenses incurred by Fidelity in conducting the business of developing, marketing, distributing, managing, administering and servicing the fund and its shareholders. The Board also considered the level of Fidelity's profits in respect of all the Fidelity funds.
On an annual basis, FMR presents to the Board Fidelity's profitability for the fund. Fidelity calculates the profitability for each fund, as well as aggregate profitability for groups of Fidelity funds and all Fidelity funds, using a series of detailed revenue and cost allocation methodologies which originate with the audited books and records of Fidelity. The Audit Committee of the Board reviews any significant changes from the prior year's methodologies.
PricewaterhouseCoopers LLP (PwC), independent registered public accounting firm and auditor to Fidelity and certain Fidelity funds, has been engaged annually by the Board as part of the Board's assessment of Fidelity's profitability analysis. PwC's engagement includes the review and assessment of Fidelity's methodologies used in determining the revenues and expenses attributable to Fidelity's mutual fund business, and completion of agreed-upon procedures surrounding the mathematical accuracy of fund profitability and its conformity to allocation methodologies. After considering PwC's reports issued under the engagement and information provided by Fidelity, the Board believes that while other allocation methods may also be reasonable, Fidelity's profitability methodologies are reasonable in all material respects.
Annual Report
Board Approval of Investment Advisory Contracts and
Management Fees - continued
The Board has also reviewed Fidelity's non-fund businesses and fall-out benefits related to the mutual fund business as well as cases where Fidelity's affiliates may benefit from or be related to the fund's business.
The Board considered the costs of the services provided by and the profits realized by Fidelity in connection with the operation of the fund and were satisfied that the profitability was not excessive in the circumstances.
Economies of Scale. The Board considered whether there have been economies of scale in respect of the management of the Fidelity funds, whether the Fidelity funds (including the fund) have appropriately benefited from any such economies of scale, and whether there is potential for realization of any further economies of scale. The Board considered the extent to which the fund will benefit from economies of scale through increased services to the fund, through waivers or reimbursements, or through fee or expense reductions.
In February 2009, the Board and the board of other Fidelity funds created an ad hoc committee (the Economies of Scale Committee) to analyze whether FMR attains economies of scale in respect of the management and servicing of the Fidelity funds, whether the Fidelity funds have appropriately benefited from such economies of scale, and whether there is potential for realization of any further economies of scale.
The Board recognized that the fund's management contract incorporates a "group fee" structure, which provides for lower group fee rates as total fund assets under FMR's management increase, and for higher group fee rates as total fund assets under FMR's management decrease. FMR calculates the group fee rates based on a tiered asset "breakpoint" schedule that varies based on asset class. The Board considered that the group fee is designed to deliver the benefits of economies of scale to fund shareholders when total Fidelity fund assets increase, even if assets of any particular fund are unchanged or have declined, because some portion of Fidelity's costs are attributable to services provided to all Fidelity funds, and all funds benefit if those costs can be allocated among more assets. The Board concluded that, given the group fee structure, fund shareholders will benefit from lower management fees as assets under FMR's management increase at the fund complex level, regardless of whether Fidelity achieves any such economies of scale.
The Board concluded, considering the findings of the Economies of Scale Committee, that any potential economies of scale are being appropriately shared between fund shareholders and Fidelity.
Additional Information Requested by the Board. In order to develop fully the factual basis for consideration of the Fidelity funds' Advisory Contracts, the Board requested and received additional information on certain topics, including (i) fund performance trends, actions to be taken by FMR to improve certain funds' overall performance, and Fidelity's long-term strategies for certain funds; (ii) portfolio manager changes that have occurred during the past year and length of portfolio manager tenure for different categories of funds over time; (iii) Fidelity's compensation structure for portfolio managers, research analysts, and other key personnel, the rationale for the compensation structure, and how the compensation structure provides appropriate performance incentives; (iv) the amount of the investment that each portfolio manager has made in the Fidelity fund(s) that he or she manages; (v) management and other fees paid by FMR to affiliated sub-advisers on behalf of the Fidelity funds; (vi) Fidelity's fee structures and rationale for recommending different fees among different categories of funds; (vii) Fidelity's rationale for recommending which funds should have a performance adjustment component as part of their management fees; (viii) the rationale for any differences between fund fee structures and fee structures in place for other Fidelity clients; and (ix) explanations regarding the relative total expenses borne by certain funds and classes, total expense competitive trends, and actions that might be taken by FMR to reduce total expenses for certain funds and classes.
Annual Report
Based on its evaluation of all of the conclusions noted above, and after considering all factors it believed relevant, the Board ultimately concluded that the advisory fee structures are fair and reasonable, and that the fund's Advisory Contracts should be renewed.
Annual Report
Investment Adviser
Fidelity Management & Research Company
Boston, MA
Investment Sub-Advisers
FMR Co., Inc.
Fidelity Management & Research
(U.K.) Inc.
Fidelity Research & Analysis Company
FIL Investment Advisors
FIL Investments (Japan) Limited
FIL Investment Advisors (UK) Limited
Fidelity Management & Research
(Hong Kong) Limited
Fidelity Management & Research
(Japan) Inc.
General Distributor
Fidelity Distributors Corporation
Boston, MA
Transfer and Service Agents
Fidelity Investments Institutional Operations Company, Inc.
Boston, MA
Fidelity Service Company, Inc.
Boston, MA
Custodian
State Street Bank and Trust Company
Quincy, MA
AGLOI-UANN-1210
1.784745.107
(Fidelity Investment logo)(registered trademark)
Fidelity AdvisorSM
International
Capital Appreciation
Fund - Class A, Class T, Class B
and Class C
Annual Report
October 31, 2010
(2_fidelity_logos) (Registered_Trademark)
Contents
Chairman's Message | <Click Here> | The Chairman's message to shareholders. |
Performance | <Click Here> | How the fund has done over time. |
Management's Discussion of Fund Performance | <Click Here> | The Portfolio Manager's review of fund performance and strategy. |
Shareholder Expense Example | <Click Here> | An example of shareholder expenses. |
Investment Changes | <Click Here> | A summary of major shifts in the fund's investments over the past six months. |
Investments | <Click Here> | A complete list of the fund's investments with their market values. |
Financial Statements | <Click Here> | Statements of assets and liabilities, operations, and changes in net assets,
as well as financial highlights. |
Notes | <Click Here> | Notes to the financial statements. |
Report of Independent Registered Public Accounting Firm | <Click Here> | |
Trustees and Officers | <Click Here> | |
Distributions | <Click Here> | |
Board Approval of Investment Advisory Contracts and Management Fees | <Click Here> | |
To view a fund's proxy voting guidelines and proxy voting record for the 12-month period ended June 30, visit http://www.fidelity.com/proxyvotingresults or visit the Securities and Exchange Commission's (SEC) web site at http://www.sec.gov. You may also call 1-877-208-0098 to request a free copy of the proxy voting guidelines.
Standard & Poor's, S&P and S&P 500 are registered service marks of The McGraw-Hill Companies, Inc. and have been licensed for use by Fidelity Distributors Corporation.
Other third party marks appearing herein are the property of their respective owners.
All other marks appearing herein are registered or unregistered trademarks or service marks of FMR LLC or an affiliated company.
Annual Report
This report and the financial statements contained herein are submitted for the general information of the shareholders of the fund. This report is not authorized for distribution to prospective investors in the fund unless preceded or accompanied by an effective prospectus.
A fund files its complete schedule of portfolio holdings with the SEC for the first and third quarters of each fiscal year on Form N-Q. Forms N-Q are available on the SEC's web site at http://www.sec.gov. A fund's Forms N-Q may be reviewed and copied at the SEC's Public Reference Room in Washington, DC. Information regarding the operation of the SEC's Public Reference Room may be obtained by calling 1-800-SEC-0330. For a complete list of a fund's portfolio holdings, view the most recent holdings listing, semiannual report, or annual report on Fidelity's web site at http://www.fidelity.com or http://www.advisor.fidelity.com, as applicable.
NOT FDIC INSURED • MAY LOSE VALUE • NO BANK GUARANTEE
Neither the fund nor Fidelity Distributors Corporation is a bank.
Annual Report
(photo_of_Edward_C_Johnson_3d)
Dear Shareholder:
Equities have staged a rally in the second half of 2010, shaking off concerns about the European debt crisis and the possibility of a double-dip recession in the U.S. Although the short-term surge pushed major equity indexes back into positive territory for the year, several questions remain about the longer-term outlook, including lackluster economic growth and persistently high unemployment. Financial markets are always unpredictable, of course, but there also are several time-tested investment principles that can help put the odds in your favor.
One of the basic tenets is to invest for the long term. Over time, riding out the markets' inevitable ups and downs has proven much more effective than selling into panic or chasing the hottest trend. Even missing only a few of the markets' best days can significantly diminish investor returns. Patience also affords the benefits of compounding - of earning interest on additional income or reinvested dividends and capital gains. There can be tax advantages and cost benefits to consider as well. While staying the course doesn't eliminate risk, it can considerably lessen the effect of short-term declines.
You can further manage your investing risk through diversification. And today, more than ever, geographic diversification should be taken into account. Studies indicate that asset allocation is the single most important determinant of a portfolio's long-term success. The right mix of stocks, bonds and cash - aligned to your particular risk tolerance and investment objective - is very important. Age-appropriate rebalancing is also an essential aspect of asset allocation. For younger investors, an emphasis on equities - which historically have been the best-performing asset class over time - is encouraged. As investors near their specific goal, such as retirement or sending a child to college, consideration may be given to replacing volatile assets (e.g. common stocks) with more-stable fixed investments (bonds or savings plans).
A third principle - investing regularly - can help lower the average cost of your purchases. Investing a certain amount of money each month or quarter helps ensure you won't pay for all your shares at market highs. This strategy - known as dollar cost averaging - also reduces "emotion" from investing, helping shareholders avoid selling weak performers just prior to an upswing, or chasing a hot performer just before a correction.
We invite you to contact us via the Internet, through our Investor Centers or by phone. It is our privilege to provide you the information you need to make the investments that are right for you.
Sincerely,
(The chairman's signature appears here.)
Edward C. Johnson 3d
Annual Report
Average annual total return reflects the change in the value of an investment, assuming reinvestment of the class' distributions from dividend income and capital gains (the profits earned upon the sale of securities that have grown in value, if any) and assuming a constant rate of performance each year. The $10,000 table and the fund's returns do not reflect the deduction of taxes that a shareholder would pay on fund distributions or the redemption of fund shares. During periods of reimbursement by Fidelity, a fund's total return will be greater than it would be had the reimbursement not occurred. How a fund did yesterday is no guarantee of how it will do tomorrow. Returns reflect the conversion of Class B shares to Class A shares after a maximum of seven years.
Average Annual Total Returns
Periods ended October 31, 2010 | Past 1
year | Past 5
years | Past 10
years |
Class A (incl. 5.75% sales charge) | 12.14% | 1.34% | 2.29% |
Class T (incl. 3.50% sales charge) | 14.50% | 1.58% | 2.30% |
Class B (incl. contingent deferred sales charge) A | 13.03% | 1.53% | 2.32% |
Class C (incl. contingent deferred sales charge) B | 17.12% | 1.79% | 2.16% |
A Class B shares' contingent deferred sales charges included in the past one year, past five years, and past ten years total return figures are 5%, 2%, and 0%, respectively.
B Class C shares' contingent deferred sales charges included in the past one year, past five years, and past ten years total return figures are 1%, 0%, and 0%, respectively.
Annual Report
$10,000 Over 10 Years
Let's say hypothetically that $10,000 was invested in Fidelity AdvisorSM International Capital Appreciation Fund - Class A on October 31, 2000, and the current 5.75% sales charge was paid. The chart shows how the value of your investment would have changed, and also shows how the MSCI® ACWI® (All Country World Index) ex USA Index performed over the same period.
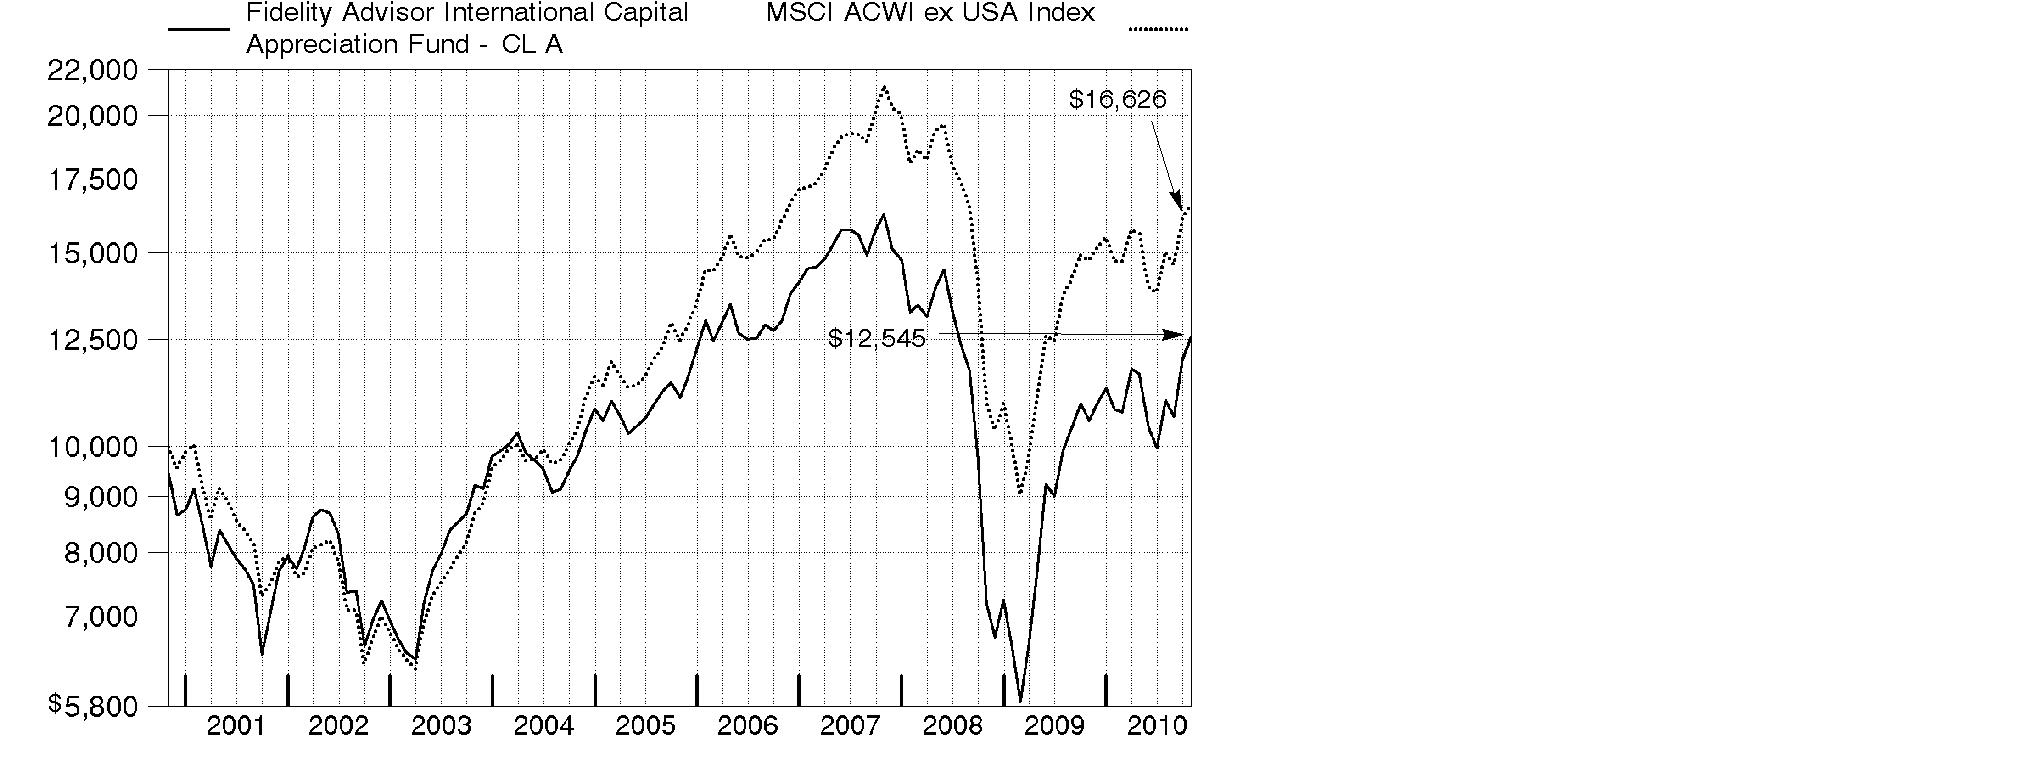
Annual Report
Market Recap: International stocks rode a wave of volatility similar to that of their U.S. counterparts during the 12 months ending October 31, 2010. Stocks gained modestly in the first half of the period, despite growing concerns about the European debt crisis. Sentiment turned decidedly negative in May and June, however, and the market suffered a precipitous decline. These losses were more than offset during the last four months of the period, when signs of economic growth and subsiding debt fears helped propel international stocks about 21%. For the full year, the MSCI® ACWI® (All Country World Index) ex USA Index gained 12.76%, boosted in part by a generally depreciating U.S. dollar. Within the index, Canada and emerging markets were standouts, returning 23% and 24%, respectively. Results in the latter group were led by strong-performing India, Mexico and South Africa, while China fell short of the MSCI benchmark due to cooling economic growth. The developed Asia ex Japan segment rose 16% for the period, lifted by solid results from Singapore and Hong Kong. Meanwhile, Europe rose just 9%, held back mainly by debt-riddled Spain and Italy, as well as lagging major constituent France. Japan returned only 5%, a result of that nation's continued weak economy.
Comments from Sammy Simnegar, Portfolio Manager of Fidelity AdvisorSM International Capital Appreciation Fund: During the year, the fund's Class A, Class T, Class B and Class C shares returned 18.98%, 18.65%, 18.03% and 18.12%, respectively (excluding sales charges), well ahead of the MSCI index. Stock selection and an overweighting in consumer discretionary added the most value, followed by favorable picks in information technology and several other sectors. Geographically, an underweighting and strong stock picks in Japan lifted performance, as did security selection in Brazil and South Korea. A meaningful stake in strong-performing U.S. stocks also helped. Grande Cache Coal and Western Coal, two Canadian producers of metallurgical coal, were key contributors to performance, along with casino operator Las Vegas Sands, minimal exposure to energy giant BP, and two LED (light-emitting diode) plays, Rubicon Technology and Veeco Instruments. Conversely, stock picking in financials and telecommunication services modestly detracted, while at the country level our positioning in Greece and Belgium was lackluster. First Uranium, a Canadian mining company with assets in South Africa, was hampered by its weak balance sheet. National Bank of Greece, Belgian insurer Ageas and OPTI Canada, a small Canadian oil company, also detracted. Many of the stocks I've mentioned were out-of-benchmark positions, and a number of them were sold during the period.
The views expressed above reflect those of the portfolio manager(s) only through the end of the period as stated on the cover of this report and do not necessarily represent the views of Fidelity or any other person in the Fidelity organization. Any such views are subject to change at any time based upon market or other conditions and Fidelity disclaims any responsibility to update such views. These views may not be relied on as investment advice and, because investment decisions for a Fidelity fund are based on numerous factors, may not be relied on as an indication of trading intent on behalf of any Fidelity fund.
Annual Report
Shareholder Expense Example
As a shareholder of the Fund, you incur two types of costs: (1) transaction costs, including sales charges (loads) on purchase payments or redemption proceeds, redemption fees, and (2) ongoing costs, including management fees, distribution and/or service (12b-1) fees and other Fund expenses. This Example is intended to help you understand your ongoing costs (in dollars) of investing in the Fund and to compare these costs with the ongoing costs of investing in other mutual funds.
The Example is based on an investment of $1,000 invested at the beginning of the period and held for the entire period (May 1, 2010 to October 31, 2010).
Actual Expenses
The first line of the accompanying table for each class of the Fund provides information about actual account values and actual expenses. You may use the information in this line, together with the amount you invested, to estimate the expenses that you paid over the period. Simply divide your account value by $1,000.00 (for example, an $8,600 account value divided by $1,000.00 = 8.6), then multiply the result by the number in the first line for a class of the Fund under the heading entitled "Expenses Paid During Period" to estimate the expenses you paid on your account during this period. In addition, the Fund, as a shareholder in the underlying Fidelity Central Funds, will indirectly bear its pro-rata share of the fees and expenses incurred by the underlying Fidelity Central Funds. These fees and expenses are not included in the Fund's annualized expense ratio used to calculate the expense estimate in the table below.
Hypothetical Example for Comparison Purposes
The second line of the accompanying table for each class of the Fund provides information about hypothetical account values and hypothetical expenses based on a Class' actual expense ratio and an assumed rate of return of 5% per year before expenses, which is not the Class' actual return. The hypothetical account values and expenses may not be used to estimate the actual ending account balance or expenses you paid for the period. You may use this information to compare the ongoing costs of investing in the Fund and other funds. To do so, compare this 5% hypothetical example with the 5% hypothetical examples that appear in the shareholder reports of the other funds. In addition, the Fund, as a shareholder in the underlying Fidelity Central Funds, will indirectly bear its pro-rata share of the fees and expenses incurred by the underlying Fidelity Central Funds. These fees and expenses are not included in the Fund's annualized expense ratio used to calculate the expense estimate in the table below.
Please note that the expenses shown in the table are meant to highlight your ongoing costs only and do not reflect any transaction costs. Therefore, the second line of the table is useful in comparing ongoing costs only, and will not help you determine the relative total costs of owning different funds. In addition, if these transactional costs were included, your costs would have been higher.
Annual Report
| Annualized
Expense Ratio | Beginning
Account Value
May 1, 2010 | Ending
Account Value
October 31, 2010 | Expenses Paid
During Period*
May 1, 2010 to
October 31, 2010 |
Class A | 1.44% | | | |
Actual | | $ 1,000.00 | $ 1,078.50 | $ 7.54 |
HypotheticalA | | $ 1,000.00 | $ 1,017.95 | $ 7.32 |
Class T | 1.69% | | | |
Actual | | $ 1,000.00 | $ 1,077.00 | $ 8.85 |
HypotheticalA | | $ 1,000.00 | $ 1,016.69 | $ 8.59 |
Class B | 2.19% | | | |
Actual | | $ 1,000.00 | $ 1,074.20 | $ 11.45 |
HypotheticalA | | $ 1,000.00 | $ 1,014.17 | $ 11.12 |
Class C | 2.19% | | | |
Actual | | $ 1,000.00 | $ 1,074.20 | $ 11.45 |
HypotheticalA | | $ 1,000.00 | $ 1,014.17 | $ 11.12 |
Institutional Class | 1.19% | | | |
Actual | | $ 1,000.00 | $ 1,078.50 | $ 6.23 |
HypotheticalA | | $ 1,000.00 | $ 1,019.21 | $ 6.06 |
A 5% return per year before expenses
* Expenses are equal to each Class' annualized expense ratio, multiplied by the average account value over the period, multiplied by 184/365 (to reflect the one-half year period).
Annual Report
Investment Changes (Unaudited)
Top Five Stocks as of October 31, 2010 |
| % of fund's
net assets | % of fund's net assets
6 months ago |
Royal Dutch Shell PLC Class B (United Kingdom, Oil, Gas & Consumable Fuels) | 1.8 | 1.8 |
Telefonica SA sponsored ADR (Spain, Diversified Telecommunication Services) | 1.2 | 1.1 |
Banco Santander SA sponsored ADR (Spain, Commercial Banks) | 1.1 | 1.3 |
British American Tobacco PLC (United Kingdom) (United Kingdom, Tobacco) | 1.0 | 0.9 |
BG Group PLC (United Kingdom, Oil, Gas & Consumable Fuels) | 1.0 | 0.9 |
| 6.1 | |
Top Five Market Sectors as of October 31, 2010 |
| % of fund's
net assets | % of fund's net assets
6 months ago |
Consumer Discretionary | 21.9 | 12.4 |
Financials | 21.9 | 24.4 |
Materials | 12.0 | 9.7 |
Consumer Staples | 11.3 | 9.0 |
Information Technology | 9.1 | 8.3 |
Top Five Countries as of October 31, 2010 |
(excluding cash equivalents) | % of fund's
net assets | % of fund's net assets
6 months ago |
United Kingdom | 10.7 | 10.3 |
India | 8.1 | 1.6 |
United States of America | 8.1 | 6.9 |
Japan | 7.5 | 14.4 |
France | 7.0 | 7.8 |
Percentages are adjusted for the effect of open futures contracts, if applicable. |
Asset Allocation (% of fund's net assets) |
As of October 31, 2010 | As of April 30, 2010 |
| Stocks 99.3% | | | Stocks 98.6% | |
 | Bonds 0.0% | |  | Bonds 0.6% | |
| Short-Term
Investments and
Net Other Assets 0.7% | | | Short-Term
Investments and
Net Other Assets 0.8% | |

Annual Report
Investments October 31, 2010
Showing Percentage of Net Assets
Common Stocks - 98.1% |
| Shares | | Value |
Australia - 1.7% |
Fortescue Metals Group Ltd. (a) | 137,041 | | $ 839,076 |
JB Hi-Fi Ltd. (d) | 40,408 | | 786,964 |
Newcrest Mining Ltd. | 27,902 | | 1,092,274 |
TOTAL AUSTRALIA | | 2,718,314 |
Austria - 0.5% |
Erste Bank AG | 19,738 | | 890,672 |
Bailiwick of Jersey - 0.5% |
Randgold Resources Ltd. sponsored ADR | 9,500 | | 892,240 |
Belgium - 1.3% |
Anheuser-Busch InBev SA NV | 19,454 | | 1,219,064 |
KBC Groupe SA (a) | 19,585 | | 851,747 |
TOTAL BELGIUM | | 2,070,811 |
Bermuda - 1.1% |
China Yurun Food Group Ltd. | 207,000 | | 805,167 |
Petra Diamonds Ltd. (a) | 630,600 | | 916,862 |
TOTAL BERMUDA | | 1,722,029 |
Brazil - 5.6% |
Anhanguera Educacional Participacoes SA unit | 45,763 | | 906,544 |
Banco do Brasil SA | 47,400 | | 922,255 |
BR Malls Participacoes SA | 84,900 | | 810,972 |
Cia Hering SA | 15,500 | | 763,064 |
Iguatemi Empresa de Shopping Centers SA | 33,800 | | 788,773 |
Itau Unibanco Banco Multiplo SA ADR (a)(e) | 54,600 | | 1,340,976 |
Lojas Renner SA | 22,200 | | 876,934 |
Mills Estruturas e Servicos de Engenharia SA (a) | 75,900 | | 915,958 |
Natura Cosmeticos SA | 29,400 | | 841,629 |
TIM Participacoes SA sponsored ADR (non-vtg.) | 24,900 | | 803,274 |
TOTAL BRAZIL | | 8,970,379 |
Canada - 5.6% |
Cline Mining Corp. (a) | 126,000 | | 332,327 |
Cline Mining Corp. (a)(e)(f) | 155,100 | | 409,078 |
Consolidated Thompson Iron Mines Ltd. (a) | 83,000 | | 804,040 |
Goldcorp, Inc. | 26,200 | | 1,169,868 |
Grande Cache Coal Corp. (a) | 115,000 | | 789,293 |
Niko Resources Ltd. | 8,700 | | 829,993 |
Petrobank Energy & Resources Ltd. (a) | 21,300 | | 847,698 |
Suncor Energy, Inc. | 40,200 | | 1,288,103 |
Teck Resources Ltd. Class B (sub. vtg.) | 22,500 | | 1,005,981 |
Common Stocks - continued |
| Shares | | Value |
Canada - continued |
Uranium One, Inc. (a) | 193,500 | | $ 791,151 |
Western Coal Corp. (a) | 111,500 | | 754,339 |
TOTAL CANADA | | 9,021,871 |
Cayman Islands - 4.6% |
Belle International Holdings Ltd. | 465,000 | | 839,865 |
Bosideng International Holdings Ltd. | 1,658,000 | | 838,492 |
Ctrip.com International Ltd. sponsored ADR (a) | 16,100 | | 838,327 |
Hengan International Group Co. Ltd. | 93,000 | | 875,859 |
Hengdeli Holdings Ltd. | 1,512,000 | | 838,781 |
Kingdee International Software Group Co. Ltd. | 1,422,000 | | 750,328 |
Maoye International Holdings Ltd. (d) | 1,777,000 | | 765,706 |
Shenguan Holdings Group Ltd. | 610,000 | | 794,840 |
Trina Solar Ltd. ADR (a)(d) | 30,980 | | 829,025 |
TOTAL CAYMAN ISLANDS | | 7,371,223 |
China - 3.6% |
Agricultural Bank of China (H Shares) | 1,763,000 | | 930,259 |
Baidu.com, Inc. sponsored ADR (a) | 7,100 | | 781,071 |
China Life Insurance Co. Ltd. (H Shares) | 246,000 | | 1,081,486 |
Digital China Holdings Ltd. (H Shares) | 200,000 | | 361,232 |
Golden Eagle Retail Group Ltd. (H Shares) | 326,000 | | 866,389 |
Shandong Weigao Group Medical Polymer Co. Ltd. (H Shares) | 320,000 | | 848,379 |
Tingyi (Cayman Islands) Holding Corp. | 320,000 | | 871,085 |
TOTAL CHINA | | 5,739,901 |
Cyprus - 0.5% |
AFI Development PLC: | | | |
(B Shares) (a) | 524,000 | | 585,570 |
GDR (Reg. S) | 167,100 | | 197,178 |
TOTAL CYPRUS | | 782,748 |
Denmark - 1.9% |
Carlsberg AS Series B | 8,300 | | 907,578 |
Novo Nordisk AS Series B sponsored ADR | 12,200 | | 1,278,560 |
Pandora A/S | 16,900 | | 819,914 |
TOTAL DENMARK | | 3,006,052 |
France - 7.0% |
Atos Origin SA (a) | 16,188 | | 748,386 |
BNP Paribas SA | 19,704 | | 1,440,770 |
Carrefour SA | 20,950 | | 1,130,471 |
Christian Dior SA | 6,300 | | 911,240 |
Common Stocks - continued |
| Shares | | Value |
France - continued |
Credit Agricole SA | 59,100 | | $ 968,314 |
Edenred (a) | 40,400 | | 846,029 |
Iliad Group SA | 7,231 | | 813,981 |
LVMH Moet Hennessy - Louis Vuitton | 7,713 | | 1,208,452 |
PPR SA | 5,600 | | 917,912 |
Schneider Electric SA | 8,175 | | 1,160,261 |
Societe Generale Series A | 18,927 | | 1,133,105 |
TOTAL FRANCE | | 11,278,921 |
Germany - 2.7% |
Bayerische Motoren Werke AG (BMW) | 15,359 | | 1,100,835 |
Daimler AG (Germany) (a) | 21,342 | | 1,408,497 |
HeidelbergCement AG | 18,238 | | 953,805 |
MAN SE | 8,555 | | 940,405 |
TOTAL GERMANY | | 4,403,542 |
Hong Kong - 1.2% |
AIA Group Ltd. | 84,800 | | 252,171 |
China Unicom (Hong Kong) Ltd. sponsored ADR | 60,200 | | 842,800 |
Emperor Watch & Jewellery Ltd. | 5,880,000 | | 842,032 |
TOTAL HONG KONG | | 1,937,003 |
India - 8.1% |
Adani Enterprises Ltd. | 52,895 | | 840,652 |
Asian Paints India Ltd. | 13,299 | | 806,416 |
Bank of Baroda | 34,758 | | 824,683 |
Crompton Greaves Ltd. | 113,269 | | 812,496 |
Gitanjali Gems Ltd. | 128,389 | | 858,678 |
Housing Development Finance Corp. Ltd. | 60,305 | | 935,629 |
INFO Edge India Ltd. | 52,967 | | 812,997 |
Infrastructure Development Finance Co. Ltd. | 176,320 | | 795,777 |
ITC Ltd. | 222,246 | | 858,399 |
Jain Irrigation Systems Ltd. | 165,385 | | 865,636 |
LIC Housing Finance Ltd. | 25,214 | | 762,564 |
Rural Electrification Corp. Ltd. | 95,782 | | 800,938 |
Sun TV Ltd. | 67,818 | | 763,937 |
Titan Industries Ltd. | 10,076 | | 807,478 |
United Spirits Ltd. | 21,795 | | 735,179 |
Voltas Ltd. | 150,773 | | 834,056 |
TOTAL INDIA | | 13,115,515 |
Indonesia - 1.2% |
PT Bank Rakyat Indonesia Tbk | 712,000 | | 908,173 |
Common Stocks - continued |
| Shares | | Value |
Indonesia - continued |
PT Mayora Indah Tbk | 79,000 | | $ 106,512 |
PT Mitra Adiperkasa Tbk | 3,003,500 | | 856,942 |
TOTAL INDONESIA | | 1,871,627 |
Italy - 0.6% |
Saipem SpA | 21,359 | | 948,959 |
Japan - 7.5% |
Canon, Inc. sponsored ADR | 27,800 | | 1,278,800 |
eAccess Ltd. | 1,106 | | 806,788 |
Fanuc Ltd. | 7,500 | | 1,085,773 |
Itochu Corp. | 104,100 | | 912,362 |
Komatsu Ltd. | 44,600 | | 1,090,088 |
Marubeni Corp. | 147,000 | | 923,442 |
Mitsubishi Corp. | 45,100 | | 1,083,287 |
Mitsui & Co. Ltd. | 68,200 | | 1,072,609 |
Nitori Holdings Co. Ltd. | 10,650 | | 937,020 |
ORIX Corp. | 10,620 | | 968,694 |
Rakuten, Inc. | 1,176 | | 906,077 |
SOFTBANK CORP. | 31,000 | | 995,566 |
TOTAL JAPAN | | 12,060,506 |
Korea (South) - 1.2% |
Hyundai Motor Co. | 7,243 | | 1,094,984 |
Lock & Lock Co. Ltd. | 23,560 | | 779,397 |
TOTAL KOREA (SOUTH) | | 1,874,381 |
Malaysia - 1.1% |
Genting Bhd | 263,600 | | 884,598 |
QSR Brands Bhd | 514,100 | | 872,532 |
TOTAL MALAYSIA | | 1,757,130 |
Mexico - 1.8% |
Fomento Economico Mexicano SAB de CV sponsored ADR | 16,100 | | 884,051 |
Grupo Mexico SA de CV Series B | 293,500 | | 965,065 |
Wal-Mart de Mexico SA de CV Series V | 364,400 | | 996,675 |
TOTAL MEXICO | | 2,845,791 |
Netherlands - 3.1% |
ASM International NV (Netherlands) (a) | 30,800 | | 785,991 |
ING Groep NV sponsored ADR (a) | 111,026 | | 1,196,860 |
Koninklijke KPN NV | 66,873 | | 1,116,605 |
Common Stocks - continued |
| Shares | | Value |
Netherlands - continued |
Koninklijke Philips Electronics NV | 36,359 | | $ 1,108,755 |
X5 Retail Group NV GDR (Reg. S) (a) | 18,600 | | 779,340 |
TOTAL NETHERLANDS | | 4,987,551 |
Nigeria - 0.5% |
Guaranty Trust Bank PLC GDR (Reg. S) | 115,800 | | 840,708 |
Norway - 0.5% |
Aker Solutions ASA | 55,600 | | 846,436 |
Qatar - 0.5% |
Commercial Bank of Qatar GDR (Reg. S) | 168,313 | | 771,238 |
Russia - 3.3% |
LSR Group OJSC GDR (Reg. S) (a) | 94,700 | | 804,950 |
Magnit OJSC GDR (Reg. S) | 32,800 | | 877,072 |
Mechel Steel Group OAO sponsored ADR (a) | 111,000 | | 874,680 |
OAO NOVATEK GDR | 9,500 | | 908,675 |
Sberbank (Savings Bank of the Russian Federation) GDR | 2,800 | | 1,051,936 |
TNK-BP Holding (a) | 387,500 | | 792,438 |
TOTAL RUSSIA | | 5,309,751 |
South Africa - 2.7% |
AngloGold Ashanti Ltd. sponsored ADR | 21,700 | | 1,022,287 |
Clicks Group Ltd. | 119,093 | | 776,947 |
Mr Price Group Ltd. | 89,000 | | 808,808 |
Naspers Ltd. Class N | 19,700 | | 1,034,404 |
Shoprite Holdings Ltd. | 56,800 | | 802,897 |
TOTAL SOUTH AFRICA | | 4,445,343 |
Spain - 2.9% |
Banco Santander SA sponsored ADR | 140,759 | | 1,803,123 |
Inditex SA (d) | 11,884 | | 992,325 |
Telefonica SA sponsored ADR (d) | 23,100 | | 1,874,334 |
TOTAL SPAIN | | 4,669,782 |
Sweden - 1.7% |
Elekta AB (B Shares) | 21,307 | | 806,156 |
EnergyO Solutions AB (a) | 126,017 | | 839,283 |
H&M Hennes & Mauritz AB (B Shares) | 32,181 | | 1,133,771 |
TOTAL SWEDEN | | 2,779,210 |
Switzerland - 3.1% |
Compagnie Financiere Richemont SA Series A | 22,010 | | 1,097,426 |
Credit Suisse Group sponsored ADR | 31,100 | | 1,290,650 |
Common Stocks - continued |
| Shares | | Value |
Switzerland - continued |
Dufry AG (a) | 7,140 | | $ 829,077 |
Lonza Group AG | 9,127 | | 798,792 |
The Swatch Group AG (Bearer) | 2,470 | | 943,736 |
TOTAL SWITZERLAND | | 4,959,681 |
Taiwan - 1.1% |
HTC Corp. | 43,350 | | 978,757 |
Ruentex Development Co. Ltd. | 501,000 | | 831,590 |
TOTAL TAIWAN | | 1,810,347 |
Turkey - 0.6% |
Turkiye Garanti Bankasi AS | 148,000 | | 908,039 |
United Kingdom - 10.7% |
Anglo American PLC (United Kingdom) | 30,400 | | 1,416,352 |
Associated British Foods PLC | 49,800 | | 835,371 |
Barclays PLC Sponsored ADR (d) | 75,430 | | 1,331,340 |
BG Group PLC | 78,819 | | 1,534,932 |
British American Tobacco PLC (United Kingdom) | 41,100 | | 1,565,562 |
Britvic PLC | 112,400 | | 868,714 |
Burberry Group PLC | 53,800 | | 878,334 |
Imperial Tobacco Group PLC | 35,785 | | 1,146,085 |
Lloyds Banking Group PLC (a) | 1,226,100 | | 1,347,467 |
Royal Dutch Shell PLC Class B | 88,638 | | 2,836,199 |
Standard Chartered PLC: | | | |
rights 11/5/10 (a) | 6,023 | | 50,709 |
(United Kingdom) | 48,186 | | 1,393,868 |
Vedanta Resources PLC | 26,300 | | 874,333 |
Xstrata PLC | 61,012 | | 1,182,291 |
TOTAL UNITED KINGDOM | | 17,261,557 |
United States of America - 8.1% |
Apple, Inc. (a) | 2,500 | | 752,175 |
AsiaInfo Holdings, Inc. (a)(d) | 37,900 | | 842,138 |
Citigroup, Inc. (a) | 187,364 | | 781,308 |
First Cash Financial Services, Inc. (a) | 30,116 | | 875,472 |
Google, Inc. Class A (a) | 1,320 | | 809,147 |
JPMorgan Chase & Co. | 21,495 | | 808,857 |
Juniper Networks, Inc. (a) | 26,636 | | 862,740 |
Las Vegas Sands Corp. (a) | 17,400 | | 798,312 |
MasterCard, Inc. Class A | 3,260 | | 782,596 |
Mercadolibre, Inc. (a)(d) | 12,600 | | 833,238 |
Morgan Stanley | 34,100 | | 848,067 |
Common Stocks - continued |
| Shares | | Value |
United States of America - continued |
Motorola, Inc. (a) | 91,800 | | $ 748,170 |
Tiffany & Co., Inc. | 15,700 | | 832,100 |
Visa, Inc. Class A | 9,740 | | 761,376 |
Walter Energy, Inc. | 9,900 | | 870,804 |
Wells Fargo & Co. | 33,940 | | 885,155 |
TOTAL UNITED STATES OF AMERICA | | 13,091,655 |
TOTAL COMMON STOCKS (Cost $139,435,035) | 157,960,913 |
Nonconvertible Preferred Stocks - 1.2% |
| | | |
Germany - 0.7% |
Volkswagen AG | 7,300 | | 1,097,019 |
Italy - 0.5% |
Fiat SpA (Risparmio Shares) | 74,862 | | 879,688 |
TOTAL NONCONVERTIBLE PREFERRED STOCKS (Cost $1,387,893) | 1,976,707 |
Money Market Funds - 5.2% |
| | | |
Fidelity Cash Central Fund, 0.23% (b) | 2,774,848 | | 2,774,848 |
Fidelity Securities Lending Cash Central Fund, 0.24% (b)(c) | 5,481,695 | | 5,481,695 |
TOTAL MONEY MARKET FUNDS (Cost $8,256,543) | 8,256,543 |
TOTAL INVESTMENT PORTFOLIO - 104.5% (Cost $149,079,471) | | 168,194,163 |
NET OTHER ASSETS (LIABILITIES) - (4.5)% | | (7,189,782) |
NET ASSETS - 100% | $ 161,004,381 |
Legend |
(a) Non-income producing |
(b) Affiliated fund that is available only to investment companies and other accounts managed by Fidelity Investments. The rate quoted is the annualized seven-day yield of the fund at period end. A complete unaudited listing of the fund's holdings as of its most recent quarter end is available upon request. In addition, each Fidelity Central Fund's financial statements, which are not covered by the Fund's report of Independent Registered Public Accounting Firm, are available on the SEC's website or upon request. |
(c) Investment made with cash collateral received from securities on loan. |
(d) Security or a portion of the security is on loan at period end. |
(e) Security exempt from registration under Rule 144A of the Securities Act of 1933. These securities may be resold in transactions exempt from registration, normally to qualified institutional buyers. At the end of the period, the value of these securities amounted to $1,750,054 or 1.1% of net assets. |
(f) Security or a portion of the security purchased on a delayed delivery or when-issued basis. |
Affiliated Central Funds |
Information regarding fiscal year to date income earned by the Fund from investments in Fidelity Central Funds is as follows: |
Fund | Income earned |
Fidelity Cash Central Fund | $ 1,545 |
Fidelity Securities Lending Cash Central Fund | 106,588 |
Total | $ 108,133 |
Other Information |
The following is a summary of the inputs used, as of October 31, 2010, involving the Fund's assets and liabilities carried at fair value. The inputs or methodology used for valuing securities may not be an indication of the risk associated with investing in those securities. For more information on valuation inputs, and their aggregation into the levels used in the table below, please refer to the Security Valuation section in the accompanying Notes to Financial Statements. |
Valuation Inputs at Reporting Date: |
Description | Total | Level 1 | Level 2 | Level 3 |
Investments in Securities: | | | | |
Equities: | | | | |
United Kingdom | $ 17,261,557 | $ 11,512,329 | $ 5,749,228 | $ - |
India | 13,115,515 | 12,290,832 | 824,683 | - |
United States of America | 13,091,655 | 13,091,655 | - | - |
Japan | 12,060,506 | 4,897,379 | 7,163,127 | - |
France | 11,278,921 | 11,278,921 | - | - |
Canada | 9,021,871 | 9,021,871 | - | - |
Brazil | 8,970,379 | 8,970,379 | - | - |
Cayman Islands | 7,371,223 | 7,371,223 | - | - |
China | 5,739,901 | 4,658,415 | 1,081,486 | - |
Other | 62,026,092 | 60,917,337 | 1,108,755 | - |
Money Market Funds | 8,256,543 | 8,256,543 | - | - |
Total Investments in Securities: | $ 168,194,163 | $ 152,266,884 | $ 15,927,279 | $ - |
Income Tax Information |
At October 31, 2010, the Fund had a capital loss carryforward of approximately $112,999,916 of which $89,032,044 and $23,967,872 will expire on October 31, 2016 and 2017, respectively. Capital loss carryforwards are only available to offset future capital gains of the Fund to the extent provided by regulations and may be limited. |
See accompanying notes which are an integral part of the financial statements.
Annual Report
Statement of Assets and Liabilities
| October 31, 2010 |
| | |
Assets | | |
Investment in securities, at value (including securities loaned of $5,302,992) - See accompanying schedule: Unaffiliated issuers (cost $140,822,928) | $ 159,937,620 | |
Fidelity Central Funds (cost $8,256,543) | 8,256,543 | |
Total Investments (cost $149,079,471) | | $ 168,194,163 |
Foreign currency held at value (cost $280,591) | | 279,691 |
Receivable for investments sold | | 4,885,526 |
Receivable for fund shares sold | | 126,686 |
Dividends receivable | | 458,362 |
Distributions receivable from Fidelity Central Funds | | 2,124 |
Other receivables | | 328,727 |
Total assets | | 174,275,279 |
| | |
Liabilities | | |
Payable for investments purchased
Regular delivery | $ 6,298,414 | |
Delayed delivery | 296,544 | |
Payable for fund shares redeemed | 648,839 | |
Accrued management fee | 93,467 | |
Distribution and service plan fees payable | 68,837 | |
Other affiliated payables | 44,938 | |
Other payables and accrued expenses | 338,164 | |
Collateral on securities loaned, at value | 5,481,695 | |
Total liabilities | | 13,270,898 |
| | |
Net Assets | | $ 161,004,381 |
Net Assets consist of: | | |
Paid in capital | | $ 256,411,712 |
Undistributed net investment income | | 577,824 |
Accumulated undistributed net realized gain (loss) on investments and foreign currency transactions | | (114,842,842) |
Net unrealized appreciation (depreciation) on investments and assets and liabilities in foreign currencies | | 18,857,687 |
Net Assets | | $ 161,004,381 |
See accompanying notes which are an integral part of the financial statements.
Annual Report
Financial Statements - continued
Statement of Assets and Liabilities - continued
| October 31, 2010 |
| | |
Calculation of Maximum Offering Price Class A:
Net Asset Value and redemption price per share ($49,058,152 ÷ 4,522,281 shares) | | $ 10.85 |
| | |
Maximum offering price per share (100/94.25 of $10.85) | | $ 11.51 |
Class T:
Net Asset Value and redemption price per share ($74,055,523 ÷ 6,967,533 shares) | | $ 10.63 |
| | |
Maximum offering price per share (100/96.50 of $10.63) | | $ 11.02 |
Class B:
Net Asset Value and offering price per share ($8,736,578 ÷ 887,975 shares)A | | $ 9.84 |
| | |
Class C:
Net Asset Value and offering price per share ($24,808,899 ÷ 2,522,008 shares)A | | $ 9.84 |
| | |
| | |
Institutional Class:
Net Asset Value, offering price and redemption price per share ($4,345,229 ÷ 376,443 shares) | | $ 11.54 |
A Redemption price per share is equal to net asset value less any applicable contingent deferred sales charge.
See accompanying notes which are an integral part of the financial statements.
Annual Report
Statement of Operations
| Year ended October 31, 2010 |
| | |
Investment Income | | |
Dividends | | $ 3,178,222 |
Interest | | 22,949 |
Income from Fidelity Central Funds | | 108,133 |
Income before foreign taxes withheld | | 3,309,304 |
Less foreign taxes withheld | | (277,249) |
Total income | | 3,032,055 |
| | |
Expenses | | |
Management fee
Basic fee | $ 1,113,044 | |
Performance adjustment | (252,535) | |
Transfer agent fees | 484,056 | |
Distribution and service plan fees | 822,347 | |
Accounting and security lending fees | 83,142 | |
Custodian fees and expenses | 301,813 | |
Independent trustees' compensation | 893 | |
Registration fees | 64,819 | |
Audit | 79,647 | |
Legal | 851 | |
Interest | 526 | |
Miscellaneous | 2,025 | |
Total expenses before reductions | 2,700,628 | |
Expense reductions | (283,831) | 2,416,797 |
Net investment income (loss) | | 615,258 |
Realized and Unrealized Gain (Loss) Net realized gain (loss) on: | | |
Investment securities: | | |
Unaffiliated issuers (net of foreign taxes of $99,659) | 14,072,505 | |
Foreign currency transactions | (622,420) | |
Total net realized gain (loss) | | 13,450,085 |
Change in net unrealized appreciation (depreciation) on: Investment securities (net of increase in deferred foreign taxes of $211,504) | 12,317,447 | |
Assets and liabilities in foreign currencies | 15,965 | |
Total change in net unrealized appreciation (depreciation) | | 12,333,412 |
Net gain (loss) | | 25,783,497 |
Net increase (decrease) in net assets resulting from operations | | $ 26,398,755 |
See accompanying notes which are an integral part of the financial statements.
Annual Report
Financial Statements - continued
Statement of Changes in Net Assets
| Year ended
October 31,
2010 | Year ended
October 31,
2009 |
Increase (Decrease) in Net Assets | | |
Operations | | |
Net investment income (loss) | $ 615,258 | $ 1,239,787 |
Net realized gain (loss) | 13,450,085 | (23,334,071) |
Change in net unrealized appreciation (depreciation) | 12,333,412 | 73,135,078 |
Net increase (decrease) in net assets resulting
from operations | 26,398,755 | 51,040,794 |
Distributions to shareholders from net investment income | (1,027,978) | (277,587) |
Distributions to shareholders from net realized gain | (2,639,506) | - |
Total distributions | (3,667,484) | (277,587) |
Share transactions - net increase (decrease) | (21,653,630) | (18,914,139) |
Redemption fees | 4,947 | 2,824 |
Total increase (decrease) in net assets | 1,082,588 | 31,851,892 |
| | |
Net Assets | | |
Beginning of period | 159,921,793 | 128,069,901 |
End of period (including undistributed net investment income of $577,824 and undistributed net investment income of $962,200, respectively) | $ 161,004,381 | $ 159,921,793 |
See accompanying notes which are an integral part of the financial statements.
Annual Report
Financial Highlights - Class A
Years ended October 31, | 2010 | 2009 | 2008 | 2007 | 2006 |
Selected Per-Share Data | | | | |
Net asset value, beginning of period | $ 9.34 | $ 6.39 | $ 18.64 | $ 17.79 | $ 17.38 |
Income from Investment Operations | | | | | |
Net investment income (loss) C | .06 | .09 | .11 | .07 | .12 |
Net realized and unrealized gain (loss) | 1.69 | 2.88 | (8.42) | 3.81 | 2.73 |
Total from investment operations | 1.75 | 2.97 | (8.31) | 3.88 | 2.85 |
Distributions from net investment income | (.08) | (.02) | (.05) | (.12) | (.20) |
Distributions from net realized gain | (.16) | - | (3.89) | (2.90) | (2.24) |
Total distributions | (.24) | (.02) | (3.94) | (3.03) H | (2.44) |
Redemption fees added to paid in capital C, G | - | - | - | - | - |
Net asset value, end of period | $ 10.85 | $ 9.34 | $ 6.39 | $ 18.64 | $ 17.79 |
Total Return A, B | 18.98% | 46.61% | (55.70)% | 24.76% | 17.62% |
Ratios to Average Net Assets D, F | | | | |
Expenses before reductions | 1.45% | 1.27% | 1.42% | 1.47% | 1.43% |
Expenses net of fee waivers, if any | 1.45% | 1.27% | 1.42% | 1.47% | 1.43% |
Expenses net of all reductions | 1.27% | 1.15% | 1.25% | 1.39% | 1.32% |
Net investment income (loss) | .66% | 1.22% | .95% | .39% | .70% |
Supplemental Data | | | | |
Net assets, end of period (000 omitted) | $ 49,058 | $ 43,389 | $ 35,517 | $ 113,579 | $ 110,240 |
Portfolio turnover rate E | 490% | 414% | 394% | 146% | 170% |
A Total returns would have been lower had certain expenses not been reduced during the periods shown.
B Total returns do not include the effect of the sales charges.
C Calculated based on average shares outstanding during the period.
D Fees and expenses of the underlying Fidelity Central Funds are not included in the Fund's expense ratio. The Fund indirectly bears its proportionate share of the expenses of any underlying Fidelity Central Funds.
E Amount does not include the portfolio activity of any underlying Fidelity Central Funds.
F Expense ratios reflect operating expenses of the class. Expenses before reductions do not reflect amounts reimbursed by the investment adviser or reductions from brokerage service arrangements or reductions from other expense offset arrangements and do not represent the amount paid by the class during periods when reimbursements or reductions occur. Expenses net of fee waivers reflect expenses after reimbursement by the investment adviser but prior to reductions from brokerage service arrangements or other expense offset arrangements. Expenses net of all reductions represent the net expenses paid by the class.
G Amount represents less than $.01 per share.
H Total distributions of $3.03 per share is comprised of distributions from net investment income of $.123 and distributions from net realized gain of $2.903 per share.
See accompanying notes which are an integral part of the financial statements.
Annual Report
Financial Highlights - Class T
Years ended October 31, | 2010 | 2009 | 2008 | 2007 | 2006 |
Selected Per-Share Data | | | | |
Net asset value, beginning of period | $ 9.16 | $ 6.28 | $ 18.38 | $ 17.57 | $ 17.18 |
Income from Investment Operations | | | | | |
Net investment income (loss) C | .04 | .07 | .08 | .03 | .08 |
Net realized and unrealized gain (loss) | 1.65 | 2.82 | (8.28) | 3.76 | 2.70 |
Total from investment operations | 1.69 | 2.89 | (8.20) | 3.79 | 2.78 |
Distributions from net investment income | (.06) | (.01) | (.01) | (.07) | (.15) |
Distributions from net realized gain | (.16) | - | (3.89) | (2.90) | (2.24) |
Total distributions | (.22) | (.01) | (3.90) | (2.98) H | (2.39) |
Redemption fees added to paid in capital C, G | - | - | - | - | - |
Net asset value, end of period | $ 10.63 | $ 9.16 | $ 6.28 | $ 18.38 | $ 17.57 |
Total Return A, B | 18.65% | 46.23% | (55.79)% | 24.47% | 17.38% |
Ratios to Average Net Assets D, F | | | | |
Expenses before reductions | 1.69% | 1.52% | 1.65% | 1.69% | 1.65% |
Expenses net of fee waivers, if any | 1.69% | 1.52% | 1.65% | 1.69% | 1.65% |
Expenses net of all reductions | 1.51% | 1.41% | 1.48% | 1.61% | 1.54% |
Net investment income (loss) | .42% | .96% | .71% | .18% | .48% |
Supplemental Data | | | | |
Net assets, end of period (000 omitted) | $ 74,056 | $ 78,005 | $ 57,603 | $ 179,990 | $ 188,320 |
Portfolio turnover rate E | 490% | 414% | 394% | 146% | 170% |
A Total returns would have been lower had certain expenses not been reduced during the periods shown.
B Total returns do not include the effect of the sales charges.
C Calculated based on average shares outstanding during the period.
D Fees and expenses of the underlying Fidelity Central Funds are not included in the Fund's expense ratio. The Fund indirectly bears its proportionate share of the expenses of any underlying Fidelity Central Funds.
E Amount does not include the portfolio activity of any underlying Fidelity Central Funds.
F Expense ratios reflect operating expenses of the class. Expenses before reductions do not reflect amounts reimbursed by the investment adviser or reductions from brokerage service arrangements or reductions from other expense offset arrangements and do not represent the amount paid by the class during periods when reimbursements or reductions occur. Expenses net of fee waivers reflect expenses after reimbursement by the investment adviser but prior to reductions from brokerage service arrangements or other expense offset arrangements. Expenses net of all reductions represent the net expenses paid by the class.
G Amount represents less than $.01 per share.
H Total distributions of $2.98 per share is comprised of distributions from net investment income of $.074 and distributions from net realized gain of $2.903 per share.
See accompanying notes which are an integral part of the financial statements.
Annual Report
Financial Highlights - Class B
Years ended October 31, | 2010 | 2009 | 2008 | 2007 | 2006 |
Selected Per-Share Data | | | | |
Net asset value, beginning of period | $ 8.51 | $ 5.86 | $ 17.36 | $ 16.72 | $ 16.46 |
Income from Investment Operations | | | | | |
Net investment income (loss) C | (.01) | .03 | .02 | (.06) | (.02) |
Net realized and unrealized gain (loss) | 1.53 | 2.63 | (7.75) | 3.57 | 2.57 |
Total from investment operations | 1.52 | 2.66 | (7.73) | 3.51 | 2.55 |
Distributions from net investment income | (.03) | (.01) | - | - | (.05) |
Distributions from net realized gain | (.16) | - | (3.77) | (2.87) | (2.24) |
Total distributions | (.19) | (.01) | (3.77) | (2.87) H | (2.29) |
Redemption fees added to paid in capital C, G | - | - | - | - | - |
Net asset value, end of period | $ 9.84 | $ 8.51 | $ 5.86 | $ 17.36 | $ 16.72 |
Total Return A, B | 18.03% | 45.50% | (56.02)% | 23.85% | 16.58% |
Ratios to Average Net Assets D, F | | | | |
Expenses before reductions | 2.20% | 2.02% | 2.17% | 2.24% | 2.26% |
Expenses net of fee waivers, if any | 2.20% | 2.02% | 2.17% | 2.24% | 2.25% |
Expenses net of all reductions | 2.02% | 1.90% | 2.01% | 2.17% | 2.14% |
Net investment income (loss) | (.09)% | .47% | .19% | (.38)% | (.13)% |
Supplemental Data | | | | |
Net assets, end of period (000 omitted) | $ 8,737 | $ 10,661 | $ 10,356 | $ 40,013 | $ 51,661 |
Portfolio turnover rate E | 490% | 414% | 394% | 146% | 170% |
A Total returns would have been lower had certain expenses not been reduced during the periods shown.
B Total returns do not include the effect of the contingent deferred sales charge.
C Calculated based on average shares outstanding during the period.
D Fees and expenses of the underlying Fidelity Central Funds are not included in the Fund's expense ratio. The Fund indirectly bears its proportionate share of the expenses of any underlying Fidelity Central Funds.
E Amount does not include the portfolio activity of any underlying Fidelity Central Funds.
F Expense ratios reflect operating expenses of the class. Expenses before reductions do not reflect amounts reimbursed by the investment adviser or reductions from brokerage service arrangements or reductions from other expense offset arrangements and do not represent the amount paid by the class during periods when reimbursements or reductions occur. Expenses net of fee waivers reflect expenses after reimbursement by the investment adviser but prior to reductions from brokerage service arrangements or other expense offset arrangements. Expenses net of all reductions represent the net expenses paid by the class.
G Amount represents less than $.01 per share.
H Total distributions of $2.87 per share is comprised of distributions from net realized gain of $2.869 per share.
See accompanying notes which are an integral part of the financial statements.
Annual Report
Financial Highlights - Class C
Years ended October 31, | 2010 | 2009 | 2008 | 2007 | 2006 |
Selected Per-Share Data | | | | |
Net asset value, beginning of period | $ 8.51 | $ 5.87 | $ 17.42 | $ 16.80 | $ 16.52 |
Income from Investment Operations | | | | | |
Net investment income (loss) C | (.01) | .03 | .02 | (.05) | (.01) |
Net realized and unrealized gain (loss) | 1.53 | 2.62 | (7.75) | 3.57 | 2.60 |
Total from investment operations | 1.52 | 2.65 | (7.73) | 3.52 | 2.59 |
Distributions from net investment income | (.04) | (.01) | - | - | (.07) |
Distributions from net realized gain | (.16) | - | (3.82) | (2.90) | (2.24) |
Total distributions | (.19) I | (.01) | (3.82) | (2.90) H | (2.31) |
Redemption fees added to paid in capital C, G | - | - | - | - | - |
Net asset value, end of period | $ 9.84 | $ 8.51 | $ 5.87 | $ 17.42 | $ 16.80 |
Total Return A, B | 18.12% | 45.26% | (55.95)% | 23.85% | 16.75% |
Ratios to Average Net Assets D, F | | | | |
Expenses before reductions | 2.20% | 2.02% | 2.16% | 2.19% | 2.16% |
Expenses net of fee waivers, if any | 2.20% | 2.02% | 2.16% | 2.19% | 2.16% |
Expenses net of all reductions | 2.02% | 1.90% | 2.00% | 2.12% | 2.05% |
Net investment income (loss) | (.09)% | .47% | .20% | (.33)% | (.03)% |
Supplemental Data | | | | |
Net assets, end of period (000 omitted) | $ 24,809 | $ 24,575 | $ 20,973 | $ 66,298 | $ 66,162 |
Portfolio turnover rate E | 490% | 414% | 394% | 146% | 170% |
A Total returns would have been lower had certain expenses not been reduced during the periods shown.
B Total returns do not include the effect of the contingent deferred sales charge.
C Calculated based on average shares outstanding during the period.
D Fees and expenses of the underlying Fidelity Central Funds are not included in the Fund's expense ratio. The Fund indirectly bears its proportionate share of the expenses of any underlying Fidelity Central Funds.
E Amount does not include the portfolio activity of any underlying Fidelity Central Funds.
F Expense ratios reflect operating expenses of the class. Expenses before reductions do not reflect amounts reimbursed by the investment adviser or reductions from brokerage service arrangements or reductions from other expense offset arrangements and do not represent the amount paid by the class during periods when reimbursements or reductions occur. Expenses net of fee waivers reflect expenses after reimbursement by the investment adviser but prior to reductions from brokerage service arrangements or other expense offset arrangements. Expenses net of all reductions represent the net expenses paid by the class.
G Amount represents less than $.01 per share.
H Total distributions of $2.90 per share is comprised of distributions from net realized gain of $2.903 per share.
I Total distributions of $.19 per share is comprised of distributions from net investment income of $.037 and distributions from net realized gain of $.155 per share.
See accompanying notes which are an integral part of the financial statements.
Annual Report
Financial Highlights - Institutional Class
Years ended October 31, | 2010 | 2009 | 2008 | 2007 | 2006 |
Selected Per-Share Data | | | | |
Net asset value, beginning of period | $ 9.91 | $ 6.77 | $ 19.49 | $ 18.46 | $ 17.70 |
Income from Investment Operations | | | | | |
Net investment income (loss) B | .10 | .11 | .16 | .13 | .20 |
Net realized and unrealized gain (loss) | 1.78 | 3.05 | (8.88) | 3.97 | 2.80 |
Total from investment operations | 1.88 | 3.16 | (8.72) | 4.10 | 3.00 |
Distributions from net investment income | (.09) | (.02) | (.11) | (.17) | - |
Distributions from net realized gain | (.16) | - | (3.89) | (2.90) | (2.24) |
Total distributions | (.25) | (.02) | (4.00) | (3.07) G | (2.24) |
Redemption fees added to paid in capital B, F | - | - | - | - | - |
Net asset value, end of period | $ 11.54 | $ 9.91 | $ 6.77 | $ 19.49 | $ 18.46 |
Total Return A | 19.22% | 46.85% | (55.51)% | 25.16% | 18.09% |
Ratios to Average Net Assets C, E | | | | |
Expenses before reductions | 1.19% | 1.00% | 1.12% | 1.14% | 1.04% |
Expenses net of fee waivers, if any | 1.19% | 1.00% | 1.12% | 1.14% | 1.04% |
Expenses net of all reductions | 1.01% | .89% | .95% | 1.07% | .93% |
Net investment income (loss) | .93% | 1.48% | 1.24% | .72% | 1.08% |
Supplemental Data | | | | |
Net assets, end of period (000 omitted) | $ 4,345 | $ 3,292 | $ 3,620 | $ 17,463 | $ 24,536 |
Portfolio turnover rate D | 490% | 414% | 394% | 146% | 170% |
A Total returns would have been lower had certain expenses not been reduced during the periods shown.
B Calculated based on average shares outstanding during the period.
C Fees and expenses of the underlying Fidelity Central Funds are not included in the Fund's expense ratio. The Fund indirectly bears its proportionate share of the expenses of any underlying Fidelity Central Funds.
D Amount does not include the portfolio activity of any underlying Fidelity Central Funds.
E Expense ratios reflect operating expenses of the class. Expenses before reductions do not reflect amounts reimbursed by the investment adviser or reductions from brokerage service arrangements or reductions from other expense offset arrangements and do not represent the amount paid by the class during periods when reimbursements or reductions occur. Expenses net of fee waivers reflect expenses after reimbursement by the investment adviser but prior to reductions from brokerage service arrangements or other expense offset arrangements. Expenses net of all reductions represent the net expenses paid by the class.
F Amount represents less than $.01 per share.
G Total distributions of $3.07 per share is comprised of distributions from net investment income of $.166 and distributions from net realized gain of $2.903 per share.
See accompanying notes which are an integral part of the financial statements.
Annual Report
Notes to Financial Statements
For the period ended October 31, 2010
1. Organization.
Fidelity Advisor International Capital Appreciation Fund (the Fund) is a fund of Fidelity Advisor Series VIII (the Trust) and is authorized to issue an unlimited number of shares. The Trust is registered under the Investment Company Act of 1940, as amended (the 1940 Act), as an open-end management investment company organized as a Massachusetts business trust. The Fund offers Class A, Class T, Class C, and Institutional Class shares, each of which has equal rights as to assets and voting privileges. Effective after the close of business on September 1, 2010, Class B shares were closed to new accounts and additional purchases by existing shareholders. Each class has exclusive voting rights with respect to matters that affect that class. Class B shares will automatically convert to Class A shares after a holding period of seven years from the initial date of purchase. Investment income, realized and unrealized capital gains and losses, the common expenses of the Fund, and certain fund-level expense reductions, if any, are allocated on a pro-rata basis to each class based on the relative net assets of each class to the total net assets of the Fund. Each class differs with respect to transfer agent and distribution and service plan fees incurred. Certain expense reductions also differ by class. The Fund's investments in emerging markets can be subject to social, economic, regulatory, and political uncertainties and can be extremely volatile.
2. Investments in Fidelity Central Funds.
The Fund may invest in Fidelity Central Funds, which are open-end investment companies available only to other investment companies and accounts managed by Fidelity Management & Research Company (FMR) and its affiliates. The Fund's Schedule of Investments lists each of the Fidelity Central Funds held as of period end, if any, as an investment of the Fund, but does not include the underlying holdings of each Fidelity Central Fund. As an Investing Fund, the Fund indirectly bears its proportionate share of the expenses of the underlying Fidelity Central Funds.
The Money Market Central Funds seek preservation of capital and current income and are managed by Fidelity Investments Money Management, Inc. (FIMM), an affiliate of FMR.
A complete unaudited list of holdings for each Fidelity Central Fund is available upon request or at the Securities and Exchange Commission (the SEC) web site at www.sec.gov. In addition, the financial statements of the Fidelity Central Funds which are not covered by the Fund's Report of Independent Registered Public Accounting Firm, are available on the SEC web site or upon request.
3. Significant Accounting Policies.
The financial statements have been prepared in conformity with accounting principles generally accepted in the United States of America (GAAP), which require management
Annual Report
3. Significant Accounting Policies - continued
to make certain estimates and assumptions at the date of the financial statements. Actual results could differ from those estimates. The following summarizes the significant accounting policies of the Fund:
Security Valuation. Investments are valued as of 4:00 p.m. Eastern time on the last calendar day of the period. The Fund uses independent pricing services approved by the Board of Trustees to value its investments. When current market prices or quotations are not readily available or reliable, valuations may be determined in good faith in accordance with procedures adopted by the Board of Trustees. Factors used in determining value may include market or security specific events. The frequency with which these procedures are used cannot be predicted and they may be utilized to a significant extent. The value used for net asset value (NAV) calculation under these procedures may differ from published prices for the same securities.
The Fund categorizes the inputs to valuation techniques used to value its investments into a disclosure hierarchy consisting of three levels as shown below.
Level 1 - quoted prices in active markets for identical investments
Level 2 - other significant observable inputs (including quoted prices for similar investments, interest rates, prepayment speeds, etc.)
Level 3 - unobservable inputs (including the fund's own assumptions based on the best information available)
Changes in valuation techniques may result in transfers in or out of an assigned level within the disclosure hierarchy. The aggregate value of investments by input level, as of October 31, 2010 is included at the end of the Fund's Schedule of Investments. Valuation techniques used to value the Fund's investments by major category are as follows.
Equity securities, including restricted securities, for which market quotations are readily available, are valued at the last reported sale price or official closing price as reported by an independent pricing service on the primary market or exchange on which they are traded and are categorized as Level 1 in the hierarchy. In the event there were no sales during the day or closing prices are not available, securities are valued at the last quoted bid price or may be valued using the last available price and are generally categorized as Level 2 in the hierarchy. For foreign equity securities, when significant market or security specific events arise, comparisons to the valuation of American Depositary Receipts (ADRs), futures contracts, Exchange-traded funds (ETFs) and certain indexes as well as quoted prices for similar securities are used and are categorized as Level 2 in the hierarchy in these circumstances. Utilizing these techniques may result in transfers between Level 1 and Level 2. For restricted equity securities and private
Annual Report
Notes to Financial Statements - continued
3. Significant Accounting Policies - continued
Security Valuation - continued
placements where observable inputs are limited, assumptions about market activity and risk are used and are categorized as Level 3 in the hierarchy.
Investments in open-end mutual funds, including the Fidelity Central Funds, are valued at their closing net asset value each business day and are categorized as Level 1 in the hierarchy. Short-term securities with remaining maturities of sixty days or less for which quotations are not readily available are valued at amortized cost, which approximates fair value and are categorized as Level 2 in the hierarchy.
Foreign Currency. The Fund uses foreign currency contracts to facilitate transactions in foreign-denominated securities. Gains and losses from these transactions may arise from changes in the value of the foreign currency or if the counterparties do not perform under the contracts' terms.
Foreign-denominated assets, including investment securities, and liabilities are translated into U.S. dollars at the exchange rate at period end. Purchases and sales of investment securities, income and dividends received and expenses denominated in foreign currencies are translated into U.S. dollars at the exchange rate in effect on the transaction date.
The effects of exchange rate fluctuations on investments are included with the net realized and unrealized gain (loss) on investment securities. Other foreign currency transactions resulting in realized and unrealized gain (loss) are disclosed separately.
Investment Transactions and Income. For financial reporting purposes, the Fund's investment holdings and NAV include trades executed through the end of the last business day of the period. The NAV per share for processing shareholder transactions is calculated as of the close of business of the New York Stock Exchange (NYSE), normally 4:00 p.m. Eastern time and includes trades executed through the end of the prior business day. Gains and losses on securities sold are determined on the basis of identified cost and may include proceeds received from litigation. Dividend income is recorded on the ex-dividend date, except for certain dividends from foreign securities where the ex-dividend date may have passed, which are recorded as soon as the Fund is informed of the ex-dividend date. Non-cash dividends included in dividend income, if any, are recorded at the fair market value of the securities received. Distributions received on securities that represent a return of capital or capital gain are recorded as a reduction of cost of investments and/or as a realized gain. The Fund estimates the components of distributions received that may be considered return of capital distributions or capital gain distributions. Interest income and distributions from the Fidelity Central Funds are accrued as earned. Interest income includes coupon interest and amortization of
Annual Report
3. Significant Accounting Policies - continued
Investment Transactions and Income - continued
premium and accretion of discount on debt securities. Investment income is recorded net of foreign taxes withheld where recovery of such taxes is uncertain.
Expenses. Most expenses of the Trust can be directly attributed to a fund. Expenses which cannot be directly attributed are apportioned amongst each fund in the Trust. Expense estimates are accrued in the period to which they relate and adjustments are made when actual amounts are known.
Income Tax Information and Distributions to Shareholders. Each year the Fund intends to qualify as a regulated investment company, including distributing substantially all of its taxable income and realized gains under Subchapter M of the Internal Revenue Code and filing its U.S. federal tax return. As a result, no provision for income taxes is required. As of October 31, 2010, the Fund did not have any unrecognized tax benefits in the accompanying financial statements. A fund's federal tax return is subject to examination by the Internal Revenue Service (IRS) for a period of three years. Foreign taxes are provided for based on the Fund's understanding of the tax rules and rates that exist in the foreign markets in which it invests. The Fund is subject to a tax imposed on short term capital gains on securities of certain issuers domiciled in India. The Fund records an estimated deferred tax liability included in Other payables and accrued expenses in the accompanying Statement of Assets & Liabilities for net unrealized gains on these securities in an amount that would be payable if the securities were disposed of at period end.
Distributions are declared and recorded on the ex-dividend date. Income dividends and capital gain distributions are declared separately for each class. Income and capital gain distributions are determined in accordance with income tax regulations, which may differ from GAAP.
Capital accounts within the financial statements are adjusted for permanent book-tax differences. These adjustments have no impact on net assets or the results of operations. Temporary book-tax differences will reverse in a subsequent period.
Book-tax differences are primarily due to the short-term gain distributions from the Fidelity Central Funds, foreign currency transactions, certain foreign taxes, passive foreign investment companies (PFIC), market discount, capital loss carryforwards and losses deferred due to wash sales.
Annual Report
Notes to Financial Statements - continued
3. Significant Accounting Policies - continued
Income Tax Information and Distributions to Shareholders - continued
The federal tax cost of investment securities and unrealized appreciation (depreciation) as of period end were as follows:
Gross unrealized appreciation | $ 19,156,556 |
Gross unrealized depreciation | (3,573,077) |
Net unrealized appreciation (depreciation) | $ 15,583,479 |
| |
Tax Cost | $ 152,610,684 |
The tax-based components of distributable earnings as of period end were as follows:
Undistributed ordinary income | $ 2,266,112 |
Capital loss carryforward | $ (112,999,916) |
Net unrealized appreciation (depreciation) | $ 15,568,426 |
The tax character of distributions paid was as follows:
| October 31, 2010 | October 31, 2009 |
Ordinary Income | $ 3,667,484 | $ 277,587 |
Short-Term Trading (Redemption) Fees. Shares held by investors in the Fund less than 30 days are subject to a redemption fee equal to 1.00% of the net asset value of shares redeemed. All redemption fees, which reduce the proceeds of the shareholder redemption, are retained by the Fund and accounted for as an addition to paid in capital.
4. Operating Policies.
Delayed Delivery Transactions and When-Issued Securities. The Fund may purchase or sell securities on a delayed delivery or when-issued basis. Payment and delivery may take place after the customary settlement period for that security. The price of the underlying securities and the date when the securities will be delivered and paid for are fixed at the time the transaction is negotiated. During the time a delayed delivery sell is outstanding, the contract is marked-to-market daily and equivalent deliverable securities are held for the transaction. The securities purchased on a delayed delivery or when-issued basis are identified as such in the Fund's Schedule of Investments. The Fund may receive compensation for interest forgone in the purchase of a delayed delivery or when-issued security. With respect to purchase commitments, the Fund identifies securities as segregated in its records with a value at least equal to the amount of the commitment. Losses may arise due to changes in the value of the underlying securities or
Annual Report
4. Operating Policies - continued
Delayed Delivery Transactions and When-Issued Securities - continued
if the counterparty does not perform under the contract's terms, or if the issuer does not issue the securities due to political, economic, or other factors.
Restricted Securities. The Fund may invest in securities that are subject to legal or contractual restrictions on resale. These securities generally may be resold in transactions exempt from registration or to the public if the securities are registered. Disposal of these securities may involve time-consuming negotiations and expense, and prompt sale at an acceptable price may be difficult. Information regarding restricted securities is included at the end of the Fund's Schedule of Investments.
5. Purchases and Sales of Investments.
Purchases and sales of securities, other than short-term securities, aggregated $756,826,118 and $783,847,056, respectively.
6. Fees and Other Transactions with Affiliates.
Management Fee. FMR and its affiliates provide the Fund with investment management related services for which the Fund pays a monthly management fee. The management fee is the sum of an individual fund fee rate that is based on an annual rate of .45% of the Fund's average net assets and a group fee rate that averaged .26% during the period. The group fee rate is based upon the average net assets of all the mutual funds advised by FMR. The group fee rate decreases as assets under management increase and increases as assets under management decrease. In addition, the management fee is subject to a performance adjustment (up to a maximum of ± .20% of the Fund's average net assets over a 36 month performance period). The upward or downward adjustment to the management fee is based on the relative investment performance of the Institutional Class of the Fund, as compared to an appropriate benchmark index. For the period, the total annual management fee rate, including the performance adjustment, was .55% of the Fund's average net assets.
Distribution and Service Plan Fees. In accordance with Rule 12b-1 of the 1940 Act, the Fund has adopted separate Distribution and Service Plans for each class of shares. Certain classes pay Fidelity Distributors Corporation (FDC), an affiliate of FMR, separate Distribution and Service Fees, each of which is based on an annual percentage of each class' average net assets. In addition, FDC may pay financial intermediaries for selling shares of the Fund and providing shareholder support services.
Annual Report
Notes to Financial Statements - continued
6. Fees and Other Transactions with Affiliates - continued
Distribution and Service Plan Fees - continued
For the period, the Distribution and Service Fee rates, total fees and amounts retained by FDC were as follows:
| Distribution
Fee | Service
Fee | Total Fees | Retained
by FDC |
Class A | -% | .25% | $ 114,586 | $ 1,917 |
Class T | .25% | .25% | 366,636 | 757 |
Class B | .75% | .25% | 96,280 | 72,364 |
Class C | .75% | .25% | 244,845 | 11,198 |
| | | $ 822,347 | $ 86,236 |
Sales Load. FDC receives a front-end sales charge of up to 5.75% for selling Class A shares, and 3.50% for selling Class T shares, some of which is paid to financial intermediaries for selling shares of the Fund. FDC receives the proceeds of contingent deferred sales charges levied on Class A, Class T, Class B, and Class C redemptions. These charges depend on the holding period. The deferred sales charges range from 5% to 1% for Class B, 1% for Class C, 1.00% for certain purchases of Class A shares (1.00% to .50% prior to July 12, 2010) and .25% for certain purchases of Class T shares.
For the period, sales charge amounts retained by FDC were as follows:
| Retained
by FDC |
Class A | $ 12,335 |
Class T | 5,598 |
Class B * | 9,591 |
Class C * | 700 |
| 28,224 |
* When Class B and Class C shares are initially sold, FDC pays commissions from its own resources to financial intermediaries through which the sales are made.
Transfer Agent Fees. Fidelity Investments Institutional Operations Company, Inc. (FIIOC), an affiliate of FMR, is the transfer, dividend disbursing and shareholder servicing agent for each class of the Fund. FIIOC receives account fees and asset-based fees that vary according to the account size and type of account of the shareholders of the respective classes of the Fund. FIIOC pays for typesetting, printing and mailing of shareholder reports, except proxy statements.
Annual Report
6. Fees and Other Transactions with Affiliates - continued
Transfer Agent Fees - continued
For the period, transfer agent fees for each class were as follows:
| Amount | % of
Average
Net Assets |
Class A | $ 142,682 | .31 |
Class T | 223,816 | .31 |
Class B | 30,252 | .31 |
Class C | 76,310 | .31 |
Institutional Class | 10,996 | .30 |
| $ 484,056 | |
Accounting and Security Lending Fees. Fidelity Service Company, Inc. (FSC), an affiliate of FMR, maintains the Fund's accounting records. The accounting fee is based on the level of average net assets for the month. Under a separate contract, FSC administers the security lending program. The security lending fee is based on the number and duration of lending transactions.
Brokerage Commissions. The Fund placed a portion of its portfolio transactions with brokerage firms which are affiliates of the investment adviser. The commissions paid to these affiliated firms were $6,564 for the period.
Interfund Lending Program. Pursuant to an Exemptive Order issued by the SEC, the Fund, along with other registered investment companies having management contracts with FMR, may participate in an interfund lending program. This program provides an alternative credit facility allowing the funds to borrow from, or lend money to, other participating affiliated funds. At period end, there were no interfund loans outstanding. The Fund's activity in this program during the period for which loans were outstanding was as follows:
Borrower or Lender | Average Daily
Loan Balance | Weighted Average Interest Rate | Interest
Expense |
Borrower | $ 4,904,700 | .39% | $ 526 |
Annual Report
Notes to Financial Statements - continued
7. Committed Line of Credit.
The Fund participates with other funds managed by FMR or an affiliate in a $3.75 billion credit facility (the "line of credit") to be utilized for temporary or emergency purposes to fund shareholder redemptions or for other short-term liquidity purposes. The Fund has agreed to pay commitment fees on its pro-rata portion of the line of credit, which amounted to $622 and is reflected in Miscellaneous expenses on the Statement of Operations. During the period, there were no borrowings on this line of credit.
8. Security Lending.
The Fund lends portfolio securities through a lending agent from time to time in order to earn additional income. The lending agent may loan securities to certain qualified borrowers, including Fidelity Capital Markets (FCM), a broker-dealer affiliated with the Fund. On the settlement date of the loan, the Fund receives collateral (in the form of U.S. Treasury obligations, letters of credit and/or cash) against the loaned securities and maintains collateral in an amount not less than 100% of the market value of the loaned securities during the period of the loan. The market value of the loaned securities is determined at the close of business of the Fund and any additional required collateral is delivered to the Fund on the next business day. If the borrower defaults on its obligation to return the securities loaned because of insolvency or other reasons, a fund could experience delays and costs in recovering the securities loaned or in gaining access to the collateral. Any cash collateral received is invested in the Fidelity Securities Lending Cash Central Fund. The value of loaned securities and cash collateral at period end are disclosed on the Fund's Statement of Assets and Liabilities. Security lending income represents the income earned on investing cash collateral, less rebates paid to borrowers and lending agent fees associated with the loan, plus any premium payments received for lending certain types of securities. Security lending income is presented in the Statement of Operations as a component of income from Fidelity Central Funds. Total security lending income during the period amounted to $106,588. During the period, there were no securities loaned to FCM.
9. Expense Reductions.
Many of the brokers with whom FMR places trades on behalf of the Fund provided services to the Fund in addition to trade execution. These services included payments of certain expenses on behalf of the Fund totaling $283,831 for the period.
Annual Report
10. Distributions to Shareholders.
Distributions to shareholders of each class were as follows:
Years ended October 31, | 2010 | 2009 |
From net investment income | | |
Class A | $ 383,536 | $ 90,651 |
Class T | 471,584 | 125,926 |
Class B | 36,781 | 16,994 |
Class C | 106,805 | 34,453 |
Institutional Class | 29,272 | 9,563 |
Total | $ 1,027,978 | $ 277,587 |
From net realized gain | | |
Class A | $ 733,929 | $ - |
Class T | 1,218,258 | - |
Class B | 190,036 | - |
Class C | 447,425 | - |
Institutional Class | 49,858 | - |
Total | $ 2,639,506 | $ - |
11. Share Transactions.
Transactions for each class of shares were as follows:
| Shares | Dollars |
Years ended October 31, | 2010 | 2009 | 2010 | 2009 |
Class A | | | | |
Shares sold | 1,168,786 | 1,129,010 | $ 11,452,442 | $ 8,639,569 |
Reinvestment of distributions | 106,693 | 15,048 | 1,040,260 | 84,718 |
Shares redeemed | (1,397,227) | (2,053,924) | (13,480,819) | (14,153,371) |
Net increase (decrease) | (121,748) | (909,866) | $ (988,117) | $ (5,429,084) |
Class T | | | | |
Shares sold | 1,177,459 | 2,801,470 | $ 11,400,103 | $ 19,344,738 |
Reinvestment of distributions | 172,890 | 22,238 | 1,656,289 | 122,972 |
Shares redeemed | (2,898,040) | (3,476,400) | (27,789,326) | (24,109,988) |
Net increase (decrease) | (1,547,691) | (652,692) | $ (14,732,934) | $ (4,642,278) |
Class B | | | | |
Shares sold | 77,104 | 121,733 | $ 688,128 | $ 814,350 |
Reinvestment of distributions | 23,836 | 2,955 | 212,377 | 15,248 |
Shares redeemed | (465,893) | (638,553) | (4,121,865) | (4,025,209) |
Net increase (decrease) | (364,953) | (513,865) | $ (3,221,360) | $ (3,195,611) |
Class C | | | | |
Shares sold | 282,999 | 347,098 | $ 2,536,029 | $ 2,336,196 |
Reinvestment of distributions | 55,698 | 5,910 | 495,715 | 30,494 |
Shares redeemed | (703,110) | (1,042,577) | (6,197,225) | (6,402,136) |
Net increase (decrease) | (364,413) | (689,569) | $ (3,165,481) | $ (4,035,446) |
Annual Report
Notes to Financial Statements - continued
11. Share Transactions - continued
| Shares | Dollars |
Years ended October 31, | 2010 | 2009 | 2010 | 2009 |
Institutional Class | | | | |
Shares sold | 151,567 | 52,991 | $ 1,532,760 | $ 417,607 |
Reinvestment of distributions | 5,962 | 1,321 | 61,704 | 7,870 |
Shares redeemed | (113,282) | (257,103) | (1,140,202) | (2,037,197) |
Net increase (decrease) | 44,247 | (202,791) | $ 454,262 | $ (1,611,720) |
12. Other.
The Fund's organizational documents provide former and current trustees and officers with a limited indemnification against liabilities arising in connection with the performance of their duties to the Fund. In the normal course of business, the Fund may also enter into contracts that provide general indemnifications. The Fund's maximum exposure under these arrangements is unknown as this would be dependent on future claims that may be made against the Fund. The risk of material loss from such claims is considered remote.
Annual Report
To the Trustees of Fidelity Advisor Series VIII and Shareholders of Fidelity Advisor International Capital Appreciation Fund:
We have audited the accompanying statement of assets and liabilities of Fidelity Advisor International Capital Appreciation Fund (the Fund), a fund of Fidelity Advisor Series VIII, including the schedule of investments, as of October 31, 2010, and the related statement of operations for the year then ended, the statement of changes in net assets for each of the two years in the period then ended, and the financial highlights for each of the five years in the period then ended. These financial statements and financial highlights are the responsibility of the Fund's management. Our responsibility is to express an opinion on these financial statements and financial highlights based on our audits.
We conducted our audits in accordance with standards of the Public Company Accounting Oversight Board (United States). Those standards require that we plan and perform the audit to obtain reasonable assurance about whether the financial statements and financial highlights are free of material misstatement. The Fund is not required to have, nor were we engaged to perform, an audit of its internal control over financial reporting. Our audits included consideration of internal control over financial reporting as a basis for designing audit procedures that are appropriate in the circumstances, but not for the purpose of expressing an opinion on the effectiveness of the Fund's internal control over financial reporting. Accordingly, we express no such opinion. An audit also includes examining, on a test basis, evidence supporting the amounts and disclosures in the financial statements, assessing the accounting principles used and significant estimates made by management, as well as evaluating the overall financial statement presentation. Our procedures included confirmation of securities owned as of October 31, 2010, by correspondence with the custodian and brokers; where replies were not received from brokers, we performed other auditing procedures. We believe that our audits provide a reasonable basis for our opinion.
In our opinion, the financial statements and financial highlights referred to above present fairly, in all material respects, the financial position of Fidelity Advisor International Capital Appreciation Fund as of October 31, 2010, the results of its operations for the year then ended, the changes in its net assets for each of the two years in the period then ended, and its financial highlights for each of the five years in the period then ended, in conformity with accounting principles generally accepted in the United States of America.
/s/ Deloitte & Touche LLP
DELOITTE & TOUCHE LLP
Boston, Massachusetts
December 13, 2010
Annual Report
The Trustees, Member of the Advisory Board, and executive officers of the trust and fund, as applicable, are listed below. The Board of Trustees governs the fund and is responsible for protecting the interests of shareholders. The Trustees are experienced executives who meet periodically throughout the year to oversee the fund's activities, review contractual arrangements with companies that provide services to the fund, oversee management of the risks associated with such activities and contractual arrangements, and review the fund's performance. Except for James C. Curvey, each of the Trustees oversees 221 funds advised by FMR or an affiliate. Mr. Curvey oversees 410 funds advised by FMR or an affiliate.
The Trustees hold office without limit in time except that (a) any Trustee may resign; (b) any Trustee may be removed by written instrument, signed by at least two-thirds of the number of Trustees prior to such removal; (c) any Trustee who requests to be retired or who has become incapacitated by illness or injury may be retired by written instrument signed by a majority of the other Trustees; and (d) any Trustee may be removed at any special meeting of shareholders by a two-thirds vote of the outstanding voting securities of the trust. Each Trustee who is not an interested person (as defined in the 1940 Act) (Independent Trustee), shall retire not later than the last day of the calendar year in which his or her 72nd birthday occurs. The Independent Trustees may waive this mandatory retirement age policy with respect to individual Trustees. The executive officers and Advisory Board Member hold office without limit in time, except that any officer and Advisory Board Member may resign or may be removed by a vote of a majority of the Trustees at any regular meeting or any special meeting of the Trustees. Except as indicated, each individual has held the office shown or other offices in the same company for the past five years.
Experience, Skills, Attributes, and Qualifications of the Fund's Trustees. The Governance and Nominating Committee has adopted a statement of policy that describes the experience, qualifications, attributes, and skills that are necessary and desirable for potential Independent Trustee candidates (Statement of Policy). The Board believes that each Trustee satisfied at the time he or she was initially elected or appointed a Trustee, and continues to satisfy, the standards contemplated by the Statement of Policy. The Governance and Nominating Committee also engages professional search firms to help identify potential Independent Trustee candidates who have the experience, qualifications, attributes, and skills consistent with the Statement of Policy. From time to time, additional criteria based on the composition and skills of the current Independent Trustees, as well as experience or skills that may be appropriate in light of future changes to board composition, business conditions, and regulatory or other developments, have also been considered by the professional search firms and the Governance and Nominating Committee. In addition, the Board takes into account the Trustees' commitment and participation in Board and committee meetings, as well as their leadership of standing and ad hoc committees throughout their tenure.
In determining that a particular Trustee was and continues to be qualified to serve as a Trustee, the Board has considered a variety of criteria, none of which, in isolation, was controlling. The Board believes that, collectively, the Trustees have balanced and diverse experience, qualifications, attributes, and skills, which allow the Board to operate effectively in governing the fund and protecting the interests of shareholders. Information about the specific experience, skills, attributes, and qualifications of each Trustee, which in each case led to the Board's conclusion that the Trustee should serve (or continue to serve) as a trustee of the fund, is provided below.
Annual Report
Board Structure and Oversight Function. Edward C. Johnson 3d is an interested person (as defined in the 1940 Act) and currently serves as Chairman. The Trustees have determined that an interested Chairman is appropriate and benefits shareholders because an interested Chairman has a personal and professional stake in the quality and continuity of services provided to the fund. Independent Trustees exercise their informed business judgment to appoint an individual of their choosing to serve as Chairman, regardless of whether the Trustee happens to be independent or a member of management. The Independent Trustees have determined that they can act independently and effectively without having an Independent Trustee serve as Chairman and that a key structural component for assuring that they are in a position to do so is for the Independent Trustees to constitute a substantial majority for the Board. The Independent Trustees also regularly meet in executive session. Ned C. Lautenbach serves as Chairman of the Independent Trustees and as such (i) acts as a liaison between the Independent Trustees and management with respect to matters important to the Independent Trustees and (ii) with management prepares agendas for Board meetings.
Fidelity funds are overseen by different Boards of Trustees. The fund's Board oversees Fidelity's equity and high income funds and another Board oversees Fidelity's investment-grade bond, money market, and asset allocation funds. The asset allocation funds may invest in Fidelity funds overseen by the fund's Board. The use of separate Boards, each with its own committee structure, allows the Trustees of each group of Fidelity funds to focus on the unique issues of the funds they oversee, including common research, investment, and operational issues. On occasion, the separate Boards establish joint committees to address issues of overlapping consequences for the Fidelity funds overseen by each Board.
The Trustees operate using a system of committees to facilitate the timely and efficient consideration of all matters of importance to the Trustees, the fund, and fund shareholders and to facilitate compliance with legal and regulatory requirements and oversight of the fund's activities and associated risks. The Board, acting through its committees, has charged FMR and its affiliates with (i) identifying events or circumstances the occurrence of which could have demonstrably adverse effects on the fund's business and/or reputation; (ii) implementing processes and controls to lessen the possibility that such events or circumstances occur or to mitigate the effects of such events or circumstances if they do occur; and (iii) creating and maintaining a system designed to evaluate continuously business and market conditions in order to facilitate the identification and implementation processes described in (i) and (ii) above. Because the day-to-day operations and activities of the fund are carried out by or through FMR, its affiliates and other service providers, the fund's exposure to risks is mitigated but not eliminated by the processes overseen by the Trustees. While each of the Board's committees has responsibility for overseeing different aspects of the fund's activities, oversight is exercised primarily through the Operations, Audit, and Compliance Committees. Appropriate personnel, including but not limited to the fund's Chief Compliance Officer (CCO), FMR's internal auditor, the independent accountants, the fund's Treasurer and portfolio management personnel, make periodic reports to the Board's committees, as appropriate. The responsibilities of each committee, including their oversight responsibilities, are described further under "Standing Committees of the Fund's Trustees."
Annual Report
Trustees and Officers - continued
The fund's Statement of Additional Information (SAI) includes more information about the Trustees. To request a free copy, call Fidelity at 1-877-208-0098.
Interested Trustees*:
Correspondence intended for each Trustee who is an interested person may be sent to Fidelity Investments, 82 Devonshire Street, Boston, Massachusetts 02109.
Name, Age; Principal Occupations and Other Relevant Experience+ |
Edward C. Johnson 3d (80) |
| Year of Election or Appointment: 1983 Mr. Johnson is Trustee and Chairman of the Board of Trustees of certain Trusts. Mr. Johnson serves as Chief Executive Officer, Chairman, and a Director of FMR LLC; Chairman and a Director of FMR; Chairman and a Director of Fidelity Research & Analysis Company (FRAC); Chairman and a Director of Fidelity Investments Money Management, Inc.; and Chairman and a Director of FMR Co., Inc. In addition, Mr. Johnson serves as Chairman and Director of FIL Limited. Previously, Mr. Johnson served as President of FMR LLC (2006-2007). |
James C. Curvey (75) |
| Year of Election or Appointment: 2007 Mr. Curvey also serves as Trustee (2007-present) of other investment companies advised by FMR. Mr. Curvey is a Director of Fidelity Investments Money Management, Inc. (2009-present), Director of Fidelity Research & Analysis Co. (2009-present) and Director of FMR and FMR Co., Inc. (2007-present). Mr. Curvey is also Vice Chairman (2007-present) and Director of FMR LLC. In addition, Mr. Curvey serves as an Overseer for the Boston Symphony Orchestra and a member of the Trustees of Villanova University. Previously, Mr. Curvey was the Vice Chairman (2006-2007) and Director (2000-2007) of FMR Corp. |
* Trustees have been determined to be "Interested Trustees" by virtue of, among other things, their affiliation with the trust or various entities under common control with FMR.
Annual Report
+ The information above includes each Trustee's principal occupation during the last five years and other information relating to the experience, attributes, and skills relevant to each Trustee's qualifications to serve as a Trustee, which led to the conclusion that each Trustee should serve as a Trustee for the fund.
Independent Trustees:
Correspondence intended for each Independent Trustee (that is, the Trustees other than the Interested Trustees) may be sent to Fidelity Investments, P.O. Box 55235, Boston, Massachusetts 02205-5235.
Name, Age; Principal Occupations and Other Relevant Experience+ |
Dennis J. Dirks (62) |
| Year of Election or Appointment: 2005 Prior to his retirement in May 2003, Mr. Dirks was Chief Operating Officer and a member of the Board of The Depository Trust & Clearing Corporation (DTCC). He also served as President, Chief Operating Officer, and Board member of The Depository Trust Company (DTC) and President and Board member of the National Securities Clearing Corporation (NSCC). In addition, Mr. Dirks served as Chief Executive Officer and Board member of the Government Securities Clearing Corporation, Chief Executive Officer and Board member of the Mortgage-Backed Securities Clearing Corporation, as a Trustee and a member of the Finance Committee of Manhattan College (2005-2008), and as a Trustee and a member of the Finance Committee of AHRC of Nassau County (2006-2008). Mr. Dirks is a member of the Independent Directors Council (IDC) Governing Council (2010-Present) and Board of Directors for The Brookville Center for Children's Services, Inc. (2009-present). |
Alan J. Lacy (57) |
| Year of Election or Appointment: 2008 Mr. Lacy serves as Senior Adviser (2007-present) of Oak Hill Capital Partners, L.P. (private equity). Mr. Lacy also served as Chief Executive Officer (2000-2005) and Vice Chairman (2005-2006) of Sears Holdings Corporation and Sears, Roebuck and Co. (retail). In addition, Mr. Lacy serves as a member of the Board of Directors of The Western Union Company (global money transfer, 2006-present) and Bristol-Myers Squibb Company (global pharmaceuticals, 2007-present). Mr. Lacy is Chairman (2008-present) and a member (2006-present) of the Board of Trustees of The National Parks Conservation Association. |
Ned C. Lautenbach (66) |
| Year of Election or Appointment: 2000 Mr. Lautenbach is Chairman of the Independent Trustees of the Equity and High Income Funds (2006-present). Mr. Lautenbach currently serves as the Lead Director of the Eaton Corporation Board of Directors (diversified industrial, 1997-present). Mr. Lautenbach is also a member of the Board of Directors of the Philharmonic Center for the Arts in Naples, Florida (1999-present); a member of the Board of Trustees of Fairfield University (2005-present); and a member of the Council on Foreign Relations (1994-present). Previously, Mr. Lautenbach was a Partner/Advisory Partner at Clayton, Dubilier & Rice, Inc. (private equity investment, 1998-2010), as well as a Director of Sony Corporation (2006-2007). |
Joseph Mauriello (66) |
| Year of Election or Appointment: 2008 Prior to his retirement in January 2006, Mr. Mauriello served in numerous senior management positions including Deputy Chairman and Chief Operating Officer (2004-2005), and Vice Chairman of Financial Services (2002-2004) of KPMG LLP US (professional services, 1965-2005). Mr. Mauriello currently serves as a member of the Board of Directors of XL Group plc. (global insurance and re-insurance, 2006-present) and of Arcadia Resources Inc. (health care services and products, 2007-present). Previously, Mr. Mauriello served as a Director of the Hamilton Funds of the Bank of New York (2006-2007). |
Cornelia M. Small (66) |
| Year of Election or Appointment: 2005 Ms. Small is a member of the Board of Directors of the Teagle Foundation (2009-present). Ms. Small is also a member of the Investment Committee, and Chair (2008-present) and a member of the Board of Trustees of Smith College. In addition, Ms. Small serves on the Investment Committee of the Berkshire Taconic Community Foundation (2008-present). Previously, Ms. Small served as Chairperson of the Investment Committee (2002-2008) of Smith College. In addition, Ms. Small served as Chief Investment Officer, Director of Global Equity Investments, and a member of the Board of Directors of Scudder, Stevens & Clark and Scudder Kemper Investments. |
William S. Stavropoulos (71) |
| Year of Election or Appointment: 2001 Mr. Stavropoulos is Vice Chairman of the Independent Trustees of the Equity and High Income Funds (2006-present). Mr. Stavropoulos serves as President and Founder of the Michigan Baseball Foundation, the Great Lakes Loons (2007-present). Mr. Stavropoulos is Chairman Emeritus of the Board of Directors of The Dow Chemical Company, where he previously served in numerous senior management positions, including President, CEO (1995-2000; 2002-2004), Chairman of the Executive Committee (2000-2006), and as a member of the Board of Directors (1990-2006). Currently, Mr. Stavropoulos is Chairman of Univar (global distributor of commodity and specialty chemicals, 2010-present), a Director of Teradata Corporation (data warehousing and technology solutions, 2008-present), Chemical Financial Corporation, Maersk Inc. (industrial conglomerate), Tyco International, Inc. (multinational manufacturing and services, 2007-present), and a member of the Advisory Board for Metalmark Capital (private equity investment, 2005-present). Mr. Stavropoulos is a special advisor to Clayton, Dubilier & Rice, Inc. (private equity investment). In addition, Mr. Stavropoulos is a member of the University of Notre Dame Advisory Council for the College of Science. |
David M. Thomas (61) |
| Year of Election or Appointment: 2008 Previously, Mr. Thomas served as Executive Chairman (2005-2006) and Chairman and Chief Executive Officer (2000-2005) of IMS Health, Inc. (pharmaceutical and healthcare information solutions). In addition, Mr. Thomas serves as a member of the Board of Directors of Fortune Brands, Inc. (consumer products), and Interpublic Group of Companies, Inc. (marketing communication, 2004-present). |
Michael E. Wiley (60) |
| Year of Election or Appointment: 2008 Mr. Wiley also serves as a Director of Asia Pacific Exploration Consolidated (international oil and gas exploration and production, 2008-present). Mr. Wiley serves as a Director of Tesoro Corporation (independent oil refiner and marketer, 2005-present), and a Director of Bill Barrett Corporation (exploration and production, 2005-present). In addition, Mr. Wiley also serves as a Director of Post Oak Bank (privately-held bank, 2004-present). Previously, Mr. Wiley served as a member of the Board of Trustees of the University of Tulsa (2000-2006; 2007-2010), as a Senior Energy Advisor of Katzenbach Partners, LLC (consulting, 2006-2007), as an Advisory Director of Riverstone Holdings (private investment), Chairman, President, and CEO of Baker Hughes, Inc. (oilfield services, 2000-2004), and as Director of Spinnaker Exploration Company (exploration and production, 2001-2005). |
Annual Report
Trustees and Officers - continued
+ The information above includes each Trustee's principal occupation during the last five years and other information relating to the experience, attributes, and skills relevant to each Trustee's qualifications to serve as a Trustee, which led to the conclusion that each Trustee should serve as a Trustee for the fund.
Advisory Board Member and Executive Officers:
Correspondence intended for each executive officer and Peter S. Lynch may be sent to Fidelity Investments, 82 Devonshire Street, Boston, Massachusetts 02109.
Name, Age; Principal Occupation |
Peter S. Lynch (66) |
| Year of Election or Appointment: 2003 Member of the Advisory Board of Fidelity's Equity and High Income Funds. Mr. Lynch is Vice Chairman and a Director of FMR and FMR Co., Inc. In addition, Mr. Lynch serves as a Trustee of Boston College and as the Chairman of the Inner-City Scholarship Fund. Previously, Mr. Lynch served on the Special Olympics International Board of Directors (1997-2006). |
Kenneth B. Robins (41) |
| Year of Election or Appointment: 2008 President and Treasurer of Fidelity's Equity and High Income Funds. Mr. Robins also serves as President and Treasurer (2010-present) and Assistant Treasurer (2009-present) of other Fidelity funds and is an employee of Fidelity Investments (2004-present). Previously, Mr. Robins served as Deputy Treasurer of the Fidelity funds (2005-2008) and Treasurer and Chief Financial Officer of The North Carolina Capital Management Trust: Cash and Term Portfolios (2006-2008). |
Bruce T. Herring (45) |
| Year of Election or Appointment: 2006 Vice President of certain Equity Funds. Mr. Herring also serves as Chief Investment Officer and Director of Fidelity Management & Research (U.K.) Inc. (2010-present) and Group Chief Investments Officer of FMR. Previously, Mr. Herring served as Vice President (2005-2006) and Senior Vice President (2006-2007) of Fidelity Management & Research Company, Vice President of FMR Co., Inc. (2001-2007) and as a portfolio manager for Fidelity U.S. Equity Funds. |
Brian B. Hogan (46) |
| Year of Election or Appointment: 2009 Vice President of certain Equity Funds and Vice President of Sector Funds. Mr. Hogan also serves as President of FMR's Equity Division (2009-present). Previously, Mr. Hogan served as Senior Vice President, Equity Research of FMR (2006-2009) and as a portfolio manager. |
Scott C. Goebel (42) |
| Year of Election or Appointment: 2008 Secretary and Chief Legal Officer (CLO) of the Fidelity funds. Mr. Goebel also serves as Secretary and CLO of The North Carolina Capital Management Trust: Cash and Term Portfolio (2008-present); General Counsel, Secretary, and Senior Vice President of FMR (2008-present) and FMR Co., Inc. (2008-present); Deputy General Counsel of FMR LLC; Chief Legal Officer of Fidelity Management & Research (Hong Kong) Limited (2008-present) and Assistant Secretary of Fidelity Management & Research (Japan) Inc. (2008-present), Fidelity Investments Money Management, Inc. (2008-present), Fidelity Management & Research (U.K.) Inc. (2008-present), and Fidelity Research and Analysis Company (2008-present). Previously, Mr. Goebel served as Assistant Secretary of the Funds (2007-2008) and as Vice President and Secretary of Fidelity Distributors Corporation (FDC) (2005-2007). |
William C. Coffey (41) |
| Year of Election or Appointment: 2009 Assistant Secretary of Fidelity's Equity and High Income Funds. Mr. Coffey also serves as Senior Vice President and Deputy General Counsel of FMR LLC (2010-present), and is an employee of Fidelity Investments. Previously, Mr. Coffey served as Vice President and Associate General Counsel of FMR LLC (2005-2009). |
Holly C. Laurent (56) |
| Year of Election or Appointment: 2008 Anti-Money Laundering (AML) Officer of the Fidelity funds. Ms. Laurent also serves as AML Officer of The North Carolina Capital Management Trust: Cash and Term Portfolio (2008-present) and is an employee of Fidelity Investments. Previously, Ms. Laurent was Senior Vice President and Head of Legal for Fidelity Business Services India Pvt. Ltd. (2006-2008), and Senior Vice President, Deputy General Counsel and Group Head for FMR LLC (2005-2006). |
Christine Reynolds (52) |
| Year of Election or Appointment: 2008 Chief Financial Officer of the Fidelity funds. Ms. Reynolds became President of Fidelity Pricing and Cash Management Services (FPCMS) in August 2008. Ms. Reynolds served as Chief Operating Officer of FPCMS (2007-2008). Previously, Ms. Reynolds served as President, Treasurer, and Anti-Money Laundering officer of the Fidelity funds (2004-2007). |
Kenneth A. Rathgeber (63) |
| Year of Election or Appointment: 2004 Chief Compliance Officer of Fidelity's Equity and High Income Funds. Mr. Rathgeber is Chief Compliance Officer of Fidelity Management & Research (Hong Kong) Limited (2008-present), Fidelity Management & Research (Japan) Inc. (2008-present), FMR (2005-present), FMR Co., Inc. (2005-present), Fidelity Management & Research (U.K.) Inc. (2005-present), Fidelity Research & Analysis Company (2005-present), Fidelity Investments Money Management, Inc. (2005-present), Pyramis Global Advisors, LLC (2005-present), and Strategic Advisers, Inc. (2005-present). |
Jeffrey S. Christian (49) |
| Year of Election or Appointment: 2009 Deputy Treasurer of the Fidelity funds. Mr. Christian is an employee of Fidelity Investments. Previously, Mr. Christian served as Chief Financial Officer (2008-2009) of certain Fidelity funds and Senior Vice President of Fidelity Pricing and Cash Management Services (FPCMS) (2004-2009). |
Bryan A. Mehrmann (49) |
| Year of Election or Appointment: 2005 Deputy Treasurer of the Fidelity funds. Mr. Mehrmann is an employee of Fidelity Investments. |
Adrien E. Deberghes (43) |
| Year of Election or Appointment: 2008 Deputy Treasurer of Fidelity's Equity and High Income Funds. Mr. Deberghes also serves as Assistant Treasurer of other Fidelity funds (2010-present) and is an employee of Fidelity Investments (2008-present). Previously, Mr. Deberghes served as Senior Vice President of Mutual Fund Administration at State Street Corporation (2007-2008), Senior Director of Mutual Fund Administration at Investors Bank & Trust (2005-2007), and Director of Finance for Dunkin' Brands (2000-2005). |
Stephanie J. Dorsey (41) |
| Year of Election or Appointment: 2010 Assistant Treasurer of Fidelity's Equity and High Income Funds. Ms. Dorsey also serves as Deputy Treasurer of other Fidelity funds (2008-present) and is an employee of Fidelity Investments (2008-present). Previously, Ms. Dorsey served as Treasurer (2004-2008) of the JPMorgan Mutual Funds and Vice President (2004-2008) of JPMorgan Chase Bank. |
John R. Hebble (52) |
| Year of Election or Appointment: 2009 Assistant Treasurer of Fidelity's Equity and High Income Funds. Mr. Hebble also serves as Treasurer and Chief Financial Officer of The North Carolina Capital Management Trust: Cash and Term Portfolio (2008-present), President and Treasurer of other Fidelity funds (2008-present) and is an employee of Fidelity Investments. |
Gary W. Ryan (52) |
| Year of Election or Appointment: 2005 Assistant Treasurer of the Fidelity funds. Mr. Ryan is an employee of Fidelity Investments. Previously, Mr. Ryan served as Vice President of Fund Reporting in Fidelity Pricing and Cash Management Services (FPCMS) (1999-2005). |
Jonathan Davis (42) |
| Year of Election or Appointment: 2010 Assistant Treasurer of the Fidelity funds. Mr. Davis is an employee of Fidelity Investments. Previously, Mr. Davis served as Vice President and Associate General Counsel of FMR LLC (2003-2010). |
Annual Report
The Board of Trustees of Fidelity Advisor International Capital Appreciation Fund voted to pay to shareholders of record at the opening of business on record date, the following distributions per share derived from capital gains realized from sales of portfolio securities, and dividends derived from net investment income:
| Pay Date | Record Date | Dividends | Capital Gains |
Class A | 12/06/10 | 12/03/10 | $0.065 | $0.116 |
Class T | 12/06/10 | 12/03/10 | $0.035 | $0.116 |
Class B | 12/06/10 | 12/03/10 | $- | $0.085 |
Class C | 12/06/10 | 12/03/10 | $- | $0.109 |
Class A designates 37%, Class T designates 40%, Class B designates 46%, and Class C designates 45% of the dividends distributed during the fiscal year as amounts which may be taken into account as a dividend for purposes of the maximum rate under section 1(h)(11) of the Internal Revenue Code.
The amounts per share which represent income derived from sources within, and taxes paid to, foreign countries or possessions of the United States are as follows:
| Pay Date | Income | Taxes |
Class A | 12/07/09 | $0.1399 | $0.0219 |
Class T | 12/07/09 | $0.1285 | $0.0219 |
Class B | 12/07/09 | $0.1122 | $0.0219 |
Class C | 12/07/09 | $0.1160 | $0.0219 |
The fund will notify shareholders in January 2011 of amounts for use in preparing 2010 income tax returns.
Annual Report
Board Approval of Investment Advisory Contracts and Management Fees
Fidelity Advisor International Capital Appreciation Fund
Each year, the Board of Trustees, including the Independent Trustees (together, the Board), votes on the renewal of the management contract and sub-advisory agreements (together, the Advisory Contracts) for the fund. The Board, assisted by the advice of fund counsel and Independent Trustees' counsel, requests and considers a broad range of information relevant to the renewal of the Advisory Contracts throughout the year.
The Board meets regularly and considers at each of its meetings factors that are relevant to its annual consideration of the renewal of the fund's Advisory Contracts, including the services and support provided to the fund and its shareholders. The Board has established various standing committees, each composed of Independent Trustees with varying backgrounds, to which the Board has assigned specific subject matter responsibilities in order to enhance effective decision-making by the Board. The Board, acting directly and through its Committees, requests and receives information concerning the annual consideration of the renewal of the fund's Advisory Contracts. The Board also meets as needed to consider matters specifically related to the Board's annual consideration of the renewal of Advisory Contracts. Members of the Board may also meet with trustees of other Fidelity funds through ad hoc joint committees to discuss certain matters relevant to the Fidelity funds.
At its July 2010 meeting, the Board of Trustees, including the Independent Trustees, unanimously determined to renew the fund's Advisory Contracts. In reaching its determination, the Board considered all factors it believed relevant, including (i) the nature, extent, and quality of the services to be provided to the fund and its shareholders (including the investment performance of the fund); (ii) the competitiveness of the fund's management fee and total expenses; (iii) the total costs of the services to be provided by and the profits to be realized by Fidelity from its relationship with the fund; (iv) the extent to which economies of scale would be realized as the fund grows; and (v) whether fee levels reflect these economies of scale, if any, for the benefit of fund shareholders.
In considering whether to renew the Advisory Contracts for the fund, the Board reached a determination, with the assistance of fund counsel and Independent Trustees' counsel and through the exercise of its business judgment, that the renewal of the Advisory Contracts is in the best interests of fund shareholders and that the compensation to be received by Fidelity under the management contract is fair and reasonable. The Board's decision to renew the Advisory Contracts was not based on any single factor noted above, but rather was based on a comprehensive consideration of all the information provided to the Board at its meetings throughout the year. The Board, in reaching its determination to renew the Advisory Contracts, is aware that shareholders in the fund have a broad range of investment choices available to them, including a wide choice among mutual funds offered by Fidelity's competitors, and that the fund's shareholders, with the opportunity to review and weigh the disclosure provided by the fund in its prospectus and other public disclosures, have chosen to invest in this fund, managed by Fidelity.
Annual Report
Nature, Extent, and Quality of Services Provided. The Board considered the staffing within the investment adviser, FMR, and the sub-advisers (together, the Investment Advisers), including the backgrounds of the fund's investment personnel and the fund's investment objective and discipline. The Independent Trustees also had discussions with senior management of Fidelity's investment operations and investment groups. The Board considered the structure of the portfolio manager compensation program and whether this structure provides appropriate incentives to act in the best interest of the fund.
Resources Dedicated to Investment Management and Support Services. The Board and the equity research subcommittee of the Board's Fund Oversight Committee reviewed the size, education, and experience of the Investment Advisers' investment staff, their use of technology, and the Investment Advisers' approach to recruiting, training, and retaining portfolio managers and other research, advisory, and management personnel. The Board noted that Fidelity's analysts have access to a variety of technological tools and market and securities data that enable them to perform both fundamental and quantitative analysis and to specialize in various disciplines. The Board considered Fidelity's extensive global research capabilities that enable the Investment Advisers to aggregate data from various sources in an effort to produce positive investment results. The Board also considered that Fidelity's portfolio managers and analysts have access to daily portfolio attribution that allows for monitoring of a fund's portfolio, as well as an electronic communication system that provides immediate real-time access to research concerning issuers and credit enhancers. The Board noted FMR's continued focus on strengthening the organization and discipline of equity portfolio management and research.
Shareholder and Administrative Services. The Board considered (i) the nature, extent, quality, and cost of advisory, administrative, and shareholder services performed by the Investment Advisers and their affiliates under the Advisory Contracts and under separate agreements covering transfer agency, pricing and bookkeeping, and securities lending services for the fund; (ii) the nature and extent of the investment adviser's supervision of third party service providers, principally custodians and subcustodians; and (iii) the resources devoted to, and the record of compliance with, the fund's compliance policies and procedures. The Board also reviewed the allocation of fund brokerage, including allocations to brokers affiliated with the Investment Advisers, the use of brokerage commissions to pay fund expenses, and the use of "soft" commission dollars to pay for research services.
The Board noted that the growth of fund assets over time across the complex allows Fidelity to reinvest in the development of services designed to enhance the value or convenience of the Fidelity funds as investment vehicles. These services include 24-hour access to account information and market information through phone representatives and over the Internet, and investor education materials and asset allocation tools.
Annual Report
Board Approval of Investment Advisory Contracts and
Management Fees - continued
Investment in a Large Fund Family. The Board considered the benefits to shareholders of investing in a Fidelity fund, including the benefits of investing in a fund that is part of a large family of funds offering a variety of investment disciplines and providing a large variety of mutual fund investor services. The Board noted that Fidelity had taken, or had made recommendations that resulted in the Fidelity funds taking, a number of actions over the previous year that benefited particular funds, including (i) dedicating additional resources to investment research and restructuring and broadening the focus of the investment research teams; (ii) bolstering the senior management team that oversees asset management; (iii) launching Class F of certain funds as a lower-fee class available to Freedom K and Freedom Index Funds; (iv) lowering the initial investment minimums and ongoing balance requirements for Real Estate High Income Fund; (v) eliminating subsequent purchase minimums for all funds and adding a waiver of the investment minimum requirement for new accounts opened with the proceeds of a systematic withdrawal plan; (vi) eliminating the withdrawal minimum and maximum limits for systematic withdrawals from Advisor funds; (vii) expanding sales load waivers on Class A shares for Destiny Planholders and expanding Institutional Class eligibility for Class O Destiny Planholders; and (viii) changing certain Class A and Class T sales charge structures to further align them with industry practices.
Investment Performance. The Board considered whether the fund has operated in accordance with its investment objective, as well as its record of compliance with its investment restrictions. It also reviewed the fund's absolute investment performance for each class, as well as the fund's relative investment performance for each class measured over multiple periods against (i) a broad-based securities market index, and (ii) a custom peer group of mutual funds deemed appropriate by Fidelity and reviewed by the Board. The following charts considered by the Board show, over the one-, three-, and five-year periods ended December 31, 2009, the cumulative total returns of Institutional Class (Class I) and Class B of the fund, the cumulative total returns of a broad-based securities market index ("benchmark"), and a range of cumulative total returns of a custom peer group of mutual funds defined by FMR based on categories assigned by Morningstar, Inc. The returns of Institutional Class (Class I) and Class B show the performance of the highest and lowest performing classes, respectively (based on five-year performance). The box within each chart shows the 25th percentile return (bottom of box) and the 75th percentile return (top of box) of the peer group. Returns shown above the box are in the first quartile and returns shown below the box are in the fourth quartile. The percentage beaten numbers noted below each chart correspond to the percentile box and represent the percentage of funds in the peer group whose performance was equal to or lower than that of the class indicated. The fund's custom peer group, defined by FMR, is a peer group that FMR believes provides a more meaningful performance comparison than the peer group assigned by Morningstar, Inc., which assigns mutual funds to categories based on their investment styles as measured by their underlying portfolio holdings.
Annual Report
Fidelity Advisor International Capital Appreciation Fund
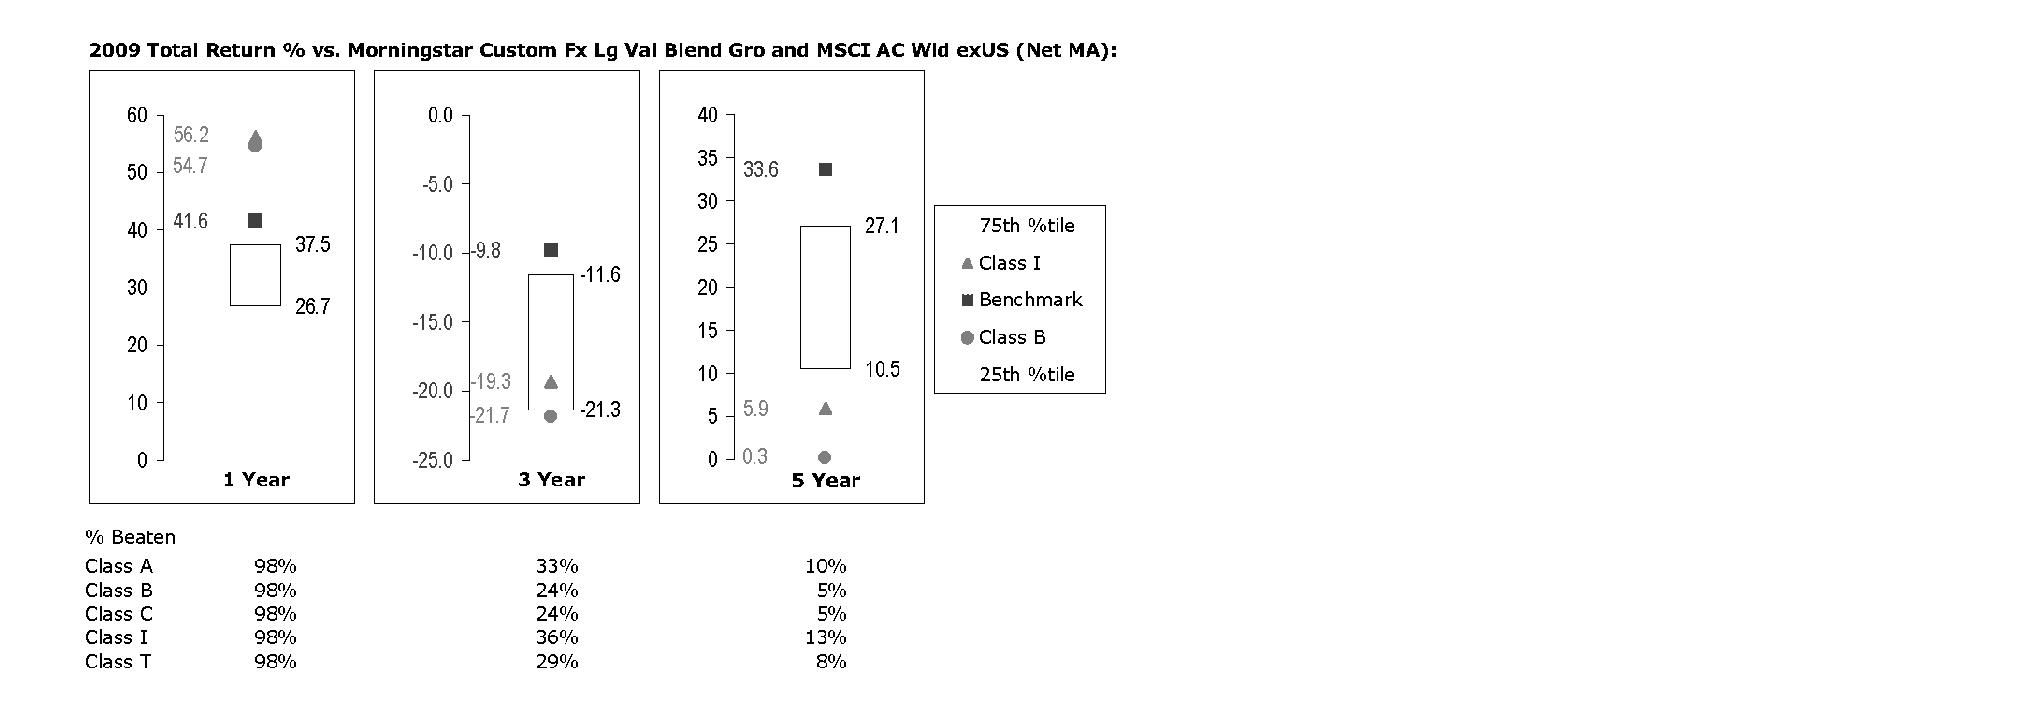
The Board reviewed the fund's relative investment performance against its peer group and noted that the performance of Institutional Class (Class I) of the fund was in the first quartile for the one-year period, the third quartile for the three-year period, and the fourth quartile for the five-year period. The Board also noted that the investment performance of the fund was lower than its benchmark for the three- and five-year periods, although the one-year cumulative total return of Institutional Class (Class I) compared favorably to its benchmark. The Board considered that the variations in performance among the fund's classes reflect the variations in class expenses, which result in lower performance for higher expense classes. The Board also reviewed the fund's performance since inception as well as performance in the current year.
The Board also considered that the fund's management fee is subject to upward or downward adjustment depending upon whether, and to what extent, the fund's investment performance for the performance period exceeds, or is exceeded by, the record (over the same period) of a Board-approved performance adjustment index. The Board realizes that the performance adjustment provides FMR with a strong economic incentive to seek to achieve superior performance for the fund's shareholders and helps to more closely align the interests of FMR and the fund's shareholders.
Annual Report
Board Approval of Investment Advisory Contracts and
Management Fees - continued
Based on its review, and giving particular weight to the nature and quality of the resources dedicated by the Investment Advisers to maintain and improve relative performance and factoring in the unprecedented market events in recent years, the Board concluded that the nature, extent, and quality of investment management and support services and of shareholder and administrative services provided to the fund will benefit the fund's shareholders, particularly in light of the Board's view that the fund's shareholders benefit from investing in a fund that is part of a large family of funds offering a variety of investment disciplines and services.
Competitiveness of Management Fee and Total Fund Expenses. The Board considered the fund's management fee and total expenses compared to "mapped groups" of competitive funds and classes. Fidelity creates "mapped groups" by combining similar Lipper investment objective categories that have comparable management fee characteristics. Combining Lipper investment objective categories aids the Board's management fee and total expense comparisons by broadening the competitive group used for comparison and by reducing the number of universes to which various Fidelity funds are compared.
Management Fee. The Board considered two proprietary management fee comparisons for the 12-month periods shown in the chart below. The group of Lipper funds used by the Board for management fee comparisons is referred to below as the "Total Mapped Group." The Total Mapped Group comparison focuses on a fund's standing relative to the total universe of comparable funds available to investors, in terms of gross management fees before expense reimbursements or caps, and without giving effect to the fund's performance adjustment. "TMG %" represents the percentage of funds in the Total Mapped Group that had management fees that were lower than the fund's. For example, a TMG % of 15% means that 85% of the funds in the Total Mapped Group had higher management fees than the fund. The "Asset-Size Peer Group" (ASPG) comparison focuses on a fund's standing relative to non-Fidelity funds similar in size to the fund within the Total Mapped Group. The ASPG represents at least 15% of the funds in the Total Mapped Group with comparable asset size and management fee characteristics, subject to a minimum of 50 funds (or all funds in the Total Mapped Group if fewer than 50). Additional information, such as the ASPG quartile in which the fund's management fee ranked and the impact of the fund's performance adjustment, is also included in the chart and considered by the Board.
Annual Report
Fidelity Advisor International Capital Appreciation Fund
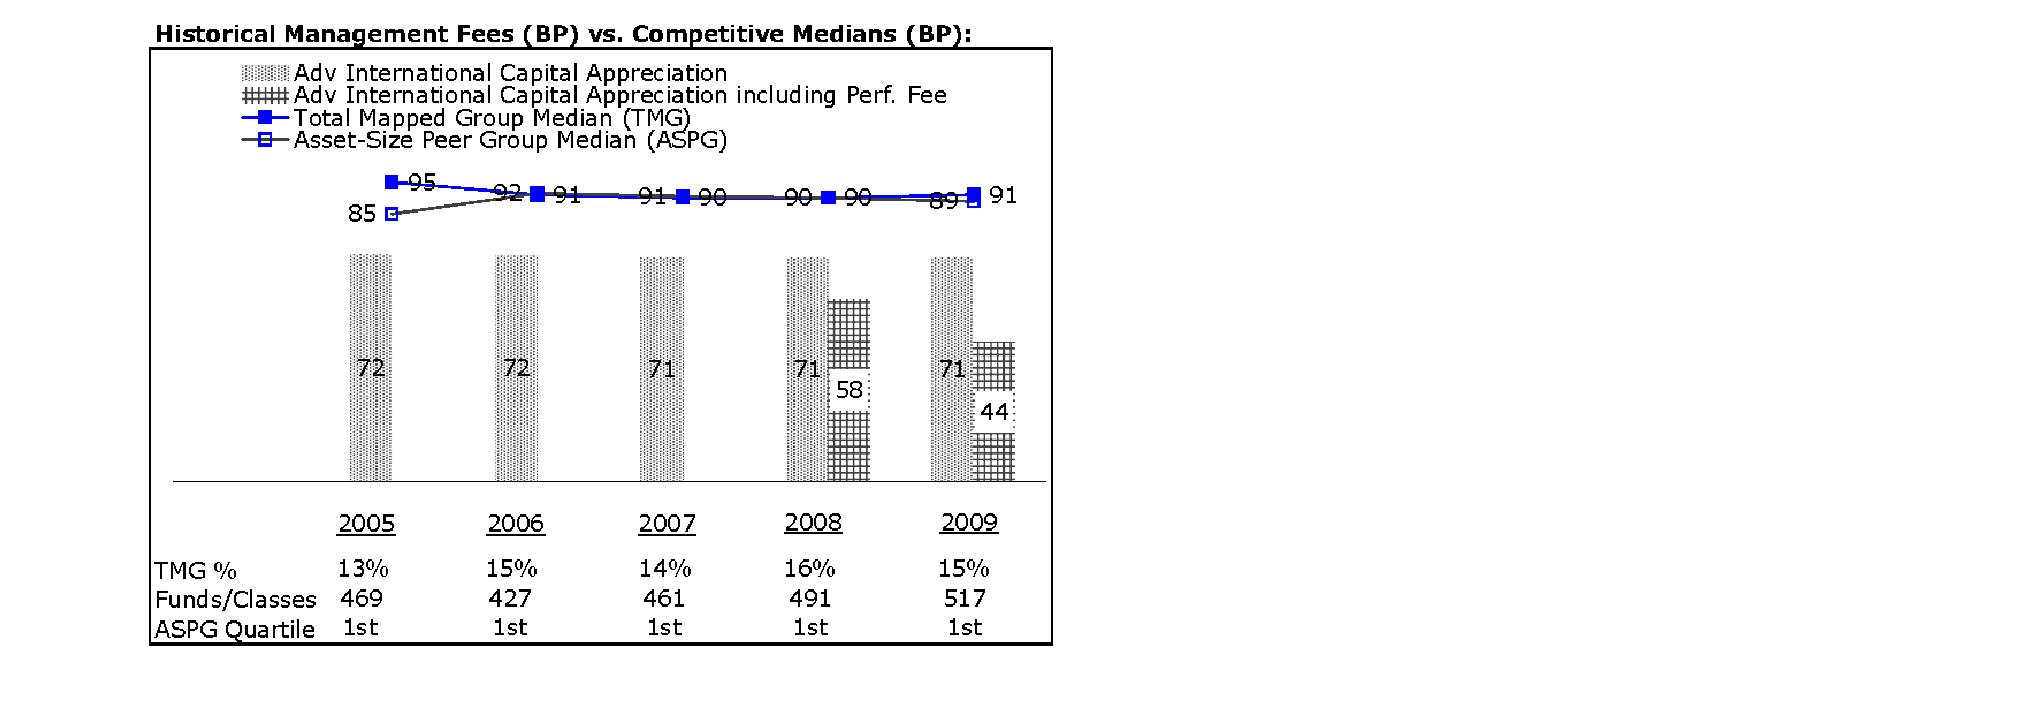
The Board noted that the fund's management fee ranked below the median of its Total Mapped Group and below the median of its ASPG for 2009. The Board also noted the effect of the fund's negative performance adjustment on the fund's management fee ranking. The Board noted that the performance adjustment for each year represents calculations for performance periods that differ from the periods shown in the performance charts above.
Based on its review, the Board concluded that the fund's management fee is fair and reasonable in light of the services that the fund receives and the other factors considered.
Total Expenses. In its review of each class's total expenses, the Board considered the fund's management fee as well as other fund or class expenses, as applicable, such as transfer agent fees, pricing and bookkeeping fees, fund-paid 12b-1 fees, and custodial, legal, and audit fees. The Board also noted the effects of any waivers and reimbursements on fees and expenses, as well as the impact of the fund's performance adjustment. As part of its review, the Board also considered current and historical total expenses of each class of the fund compared to competitive fund median expenses. Each class of the fund is compared to those funds and classes in the Total Mapped Group (used by the Board for management fee comparisons) that have a similar sales load structure.
The Board noted that the total expenses of each of Class A, Class B, Class C, and Institutional Class ranked below its competitive median for 2009 and the total expenses of Class T ranked above its competitive median for 2009. The Board considered that the total expenses for Class T were above the median primarily because its 12b-1 fee is higher than the typical front-end load class. The Board noted that the fund offers multiple classes, each of which has a different sales load and 12b-1 fee structure, and that the multiple structures are intended to offer a range of pricing options for the intermediary market. The Board also noted that the total expenses of the classes vary primarily by the level of their 12b-1 fees, although differences in transfer agent fees may also cause expenses to vary from class to class.
Annual Report
Board Approval of Investment Advisory Contracts and
Management Fees - continued
Fees Charged to Other Fidelity Clients. The Board also considered Fidelity fee structures and other information with respect to clients of FMR and its affiliates, such as other mutual funds advised or subadvised by FMR or its affiliates, pension plan clients, and other institutional clients. In March 2010, the Board created an ad hoc joint committee with the board of other Fidelity funds (the Committee) to review and compare Fidelity's institutional investment advisory business with its business of providing services to the Fidelity funds, including the differences in services provided, fees charged, and costs incurred, as well as competition in their respective marketplaces.
Based on its review of total expenses and fees charged to other Fidelity clients, the Board concluded that the total expenses of each class of the fund were reasonable, although in one case above the median of the universe presented for comparison, in light of the services that the fund and its shareholders receive and the other factors considered, including the findings of the Committee.
Costs of the Services and Profitability. The Board considered the revenues earned and the expenses incurred by Fidelity in conducting the business of developing, marketing, distributing, managing, administering and servicing the fund and its shareholders. The Board also considered the level of Fidelity's profits in respect of all the Fidelity funds.
On an annual basis, FMR presents to the Board Fidelity's profitability for the fund. Fidelity calculates the profitability for each fund, as well as aggregate profitability for groups of Fidelity funds and all Fidelity funds, using a series of detailed revenue and cost allocation methodologies which originate with the audited books and records of Fidelity. The Audit Committee of the Board reviews any significant changes from the prior year's methodologies.
PricewaterhouseCoopers LLP (PwC), independent registered public accounting firm and auditor to Fidelity and certain Fidelity funds, has been engaged annually by the Board as part of the Board's assessment of Fidelity's profitability analysis. PwC's engagement includes the review and assessment of Fidelity's methodologies used in determining the revenues and expenses attributable to Fidelity's mutual fund business, and completion of agreed-upon procedures surrounding the mathematical accuracy of fund profitability and its conformity to allocation methodologies. After considering PwC's reports issued under the engagement and information provided by Fidelity, the Board believes that while other allocation methods may also be reasonable, Fidelity's profitability methodologies are reasonable in all material respects.
Annual Report
The Board has also reviewed Fidelity's non-fund businesses and fall-out benefits related to the mutual fund business as well as cases where Fidelity's affiliates may benefit from or be related to the fund's business.
The Board considered the costs of the services provided by and the profits realized by Fidelity in connection with the operation of the fund and were satisfied that the profitability was not excessive in the circumstances.
Economies of Scale. The Board considered whether there have been economies of scale in respect of the management of the Fidelity funds, whether the Fidelity funds (including the fund) have appropriately benefited from any such economies of scale, and whether there is potential for realization of any further economies of scale. The Board considered the extent to which the fund will benefit from economies of scale through increased services to the fund, through waivers or reimbursements, or through fee or expense reductions.
In February 2009, the Board and the board of other Fidelity funds created an ad hoc committee (the Economies of Scale Committee) to analyze whether FMR attains economies of scale in respect of the management and servicing of the Fidelity funds, whether the Fidelity funds have appropriately benefited from such economies of scale, and whether there is potential for realization of any further economies of scale.
The Board recognized that the fund's management contract incorporates a "group fee" structure, which provides for lower group fee rates as total fund assets under FMR's management increase, and for higher group fee rates as total fund assets under FMR's management decrease. FMR calculates the group fee rates based on a tiered asset "breakpoint" schedule that varies based on asset class. The Board considered that the group fee is designed to deliver the benefits of economies of scale to fund shareholders when total Fidelity fund assets increase, even if assets of any particular fund are unchanged or have declined, because some portion of Fidelity's costs are attributable to services provided to all Fidelity funds, and all funds benefit if those costs can be allocated among more assets. The Board concluded that, given the group fee structure, fund shareholders will benefit from lower management fees as assets under FMR's management increase at the fund complex level, regardless of whether Fidelity achieves any such economies of scale.
The Board concluded, considering the findings of the Economies of Scale Committee, that any potential economies of scale are being appropriately shared between fund shareholders and Fidelity.
Additional Information Requested by the Board. In order to develop fully the factual basis for consideration of the Fidelity funds' Advisory Contracts, the Board requested and received additional information on certain topics, including (i) fund performance trends, actions to be taken by FMR to improve certain funds' overall performance, and Fidelity's long-term strategies for certain funds; (ii) portfolio manager changes that have occurred during the past year and length of portfolio manager tenure for different categories of funds over time; (iii) Fidelity's compensation structure for portfolio managers, research analysts, and other key personnel, the rationale for the compensation structure, and how the compensation structure provides appropriate performance incentives; (iv) the amount of the investment that each portfolio manager has made in the Fidelity fund(s) that he or she manages; (v) management and other fees paid by FMR to affiliated sub-advisers on behalf of the Fidelity funds; (vi) Fidelity's fee structures and rationale for recommending different fees among different categories of funds; (vii) Fidelity's rationale for recommending which funds should have a performance adjustment component as part of their management fees; (viii) the rationale for any differences between fund fee structures and fee structures in place for other Fidelity clients; and (ix) explanations regarding the relative total expenses borne by certain funds and classes, total expense competitive trends, and actions that might be taken by FMR to reduce total expenses for certain funds and classes.
Annual Report
Board Approval of Investment Advisory Contracts and
Management Fees - continued
Based on its evaluation of all of the conclusions noted above, and after considering all factors it believed relevant, the Board ultimately concluded that the advisory fee structures are fair and reasonable, and that the fund's Advisory Contracts should be renewed.
Annual Report
Investment Adviser
Fidelity Management & Research Company
Boston, MA
Investment Sub-Advisers
FMR Co., Inc.
Fidelity Management & Research
(U.K.) Inc.
Fidelity Management & Research
(Hong Kong) Limited
Fidelity Management & Research
(Japan) Inc.
Fidelity Research & Analysis Company
FIL Investment Advisors
FIL Investments (Japan) Limited
FIL Investment Advisors (UK) Limited
General Distributor
Fidelity Distributors Corporation
Boston, MA
Transfer and Service Agents
Fidelity Investments Institutional Operations Company, Inc.
Boston, MA
Fidelity Service Company, Inc.
Boston, MA
Custodian
Brown Brothers Harriman & Co.
Boston, MA
AICAP-UANN-1210
1.784754.107
(Fidelity Investment logo)(registered trademark)
Fidelity AdvisorSM
International
Capital Appreciation
Fund - Institutional Class
Annual Report
October 31, 2010
(2_fidelity_logos) (Registered_Trademark)
Contents
Chairman's Message | <Click Here> | The Chairman's message to shareholders. |
Performance | <Click Here> | How the fund has done over time. |
Management's Discussion of Fund Performance | <Click Here> | The Portfolio Manager's review of fund performance and strategy. |
Shareholder Expense Example | <Click Here> | An example of shareholder expenses. |
Investment Changes | <Click Here> | A summary of major shifts in the fund's investments over the past six months. |
Investments | <Click Here> | A complete list of the fund's investments with their market values. |
Financial Statements | <Click Here> | Statements of assets and liabilities, operations, and changes in net assets,
as well as financial highlights. |
Notes | <Click Here> | Notes to the financial statements. |
Report of Independent Registered Public Accounting Firm | <Click Here> | |
Trustees and Officers | <Click Here> | |
Distributions | <Click Here> | |
Board Approval of Investment Advisory Contracts and Management Fees | <Click Here> | |
To view a fund's proxy voting guidelines and proxy voting record for the 12-month period ended June 30, visit http://www.fidelity.com/proxyvotingresults or visit the Securities and Exchange Commission's (SEC) web site at http://www.sec.gov. You may also call 1-877-208-0098 to request a free copy of the proxy voting guidelines.
Standard & Poor's, S&P and S&P 500 are registered service marks of The McGraw-Hill Companies, Inc. and have been licensed for use by Fidelity Distributors Corporation.
Other third party marks appearing herein are the property of their respective owners.
All other marks appearing herein are registered or unregistered trademarks or service marks of FMR LLC or an affiliated company.
Annual Report
This report and the financial statements contained herein are submitted for the general information of the shareholders of the fund. This report is not authorized for distribution to prospective investors in the fund unless preceded or accompanied by an effective prospectus.
A fund files its complete schedule of portfolio holdings with the SEC for the first and third quarters of each fiscal year on Form N-Q. Forms N-Q are available on the SEC's web site at http://www.sec.gov. A fund's Forms N-Q may be reviewed and copied at the SEC's Public Reference Room in Washington, DC. Information regarding the operation of the SEC's Public Reference Room may be obtained by calling 1-800-SEC-0330. For a complete list of a fund's portfolio holdings, view the most recent holdings listing, semiannual report, or annual report on Fidelity's web site at http://www.fidelity.com or http://www.advisor.fidelity.com, as applicable.
NOT FDIC INSURED • MAY LOSE VALUE • NO BANK GUARANTEE
Neither the fund nor Fidelity Distributors Corporation is a bank.
Annual Report
(photo_of_Edward_C_Johnson_3d)
Dear Shareholder:
Equities have staged a rally in the second half of 2010, shaking off concerns about the European debt crisis and the possibility of a double-dip recession in the U.S. Although the short-term surge pushed major equity indexes back into positive territory for the year, several questions remain about the longer-term outlook, including lackluster economic growth and persistently high unemployment. Financial markets are always unpredictable, of course, but there also are several time-tested investment principles that can help put the odds in your favor.
One of the basic tenets is to invest for the long term. Over time, riding out the markets' inevitable ups and downs has proven much more effective than selling into panic or chasing the hottest trend. Even missing only a few of the markets' best days can significantly diminish investor returns. Patience also affords the benefits of compounding - of earning interest on additional income or reinvested dividends and capital gains. There can be tax advantages and cost benefits to consider as well. While staying the course doesn't eliminate risk, it can considerably lessen the effect of short-term declines.
You can further manage your investing risk through diversification. And today, more than ever, geographic diversification should be taken into account. Studies indicate that asset allocation is the single most important determinant of a portfolio's long-term success. The right mix of stocks, bonds and cash - aligned to your particular risk tolerance and investment objective - is very important. Age-appropriate rebalancing is also an essential aspect of asset allocation. For younger investors, an emphasis on equities - which historically have been the best-performing asset class over time - is encouraged. As investors near their specific goal, such as retirement or sending a child to college, consideration may be given to replacing volatile assets (e.g. common stocks) with more-stable fixed investments (bonds or savings plans).
A third principle - investing regularly - can help lower the average cost of your purchases. Investing a certain amount of money each month or quarter helps ensure you won't pay for all your shares at market highs. This strategy - known as dollar cost averaging - also reduces "emotion" from investing, helping shareholders avoid selling weak performers just prior to an upswing, or chasing a hot performer just before a correction.
We invite you to contact us via the Internet, through our Investor Centers or by phone. It is our privilege to provide you the information you need to make the investments that are right for you.
Sincerely,
(The chairman's signature appears here.)
Edward C. Johnson 3d
Annual Report
Average annual total return reflects the change in the value of an investment, assuming reinvestment of the class' distributions from dividend income and capital gains (the profits earned upon the sale of securities that have grown in value, if any) and assuming a constant rate of performance each year. The $10,000 table and the fund's returns do not reflect the deduction of taxes that a shareholder would pay on fund distributions or the redemption of fund shares. During periods of reimbursement by Fidelity, a fund's total return will be greater than it would be had the reimbursement not occurred. How a fund did yesterday is no guarantee of how it will do tomorrow.
Average Annual Total Returns
Periods ended October 31, 2010 | | Past 1
year | Past 5
years | Past 10
years |
Institutional Class | | 19.22% | 2.86% | 3.25% |
$10,000 Over 10 Years
Let's say hypothetically that $10,000 was invested in Fidelity AdvisorSM International Capital Appreciation Fund - Institutional Class on October 31, 2000. The chart shows how the value of your investment would have changed, and also shows how the MSCI® ACWI® (All Country World Index) ex USA Index performed over the same period.

Annual Report
Market Recap: International stocks rode a wave of volatility similar to that of their U.S. counterparts during the 12 months ending October 31, 2010. Stocks gained modestly in the first half of the period, despite growing concerns about the European debt crisis. Sentiment turned decidedly negative in May and June, however, and the market suffered a precipitous decline. These losses were more than offset during the last four months of the period, when signs of economic growth and subsiding debt fears helped propel international stocks about 21%. For the full year, the MSCI® ACWI® (All Country World Index) ex USA Index gained 12.76%, boosted in part by a generally depreciating U.S. dollar. Within the index, Canada and emerging markets were standouts, returning 23% and 24%, respectively. Results in the latter group were led by strong-performing India, Mexico and South Africa, while China fell short of the MSCI benchmark due to cooling economic growth. The developed Asia ex Japan segment rose 16% for the period, lifted by solid results from Singapore and Hong Kong. Meanwhile, Europe rose just 9%, held back mainly by debt-riddled Spain and Italy, as well as lagging major constituent France. Japan returned only 5%, a result of that nation's continued weak economy.
Comments from Sammy Simnegar, Portfolio Manager of Fidelity AdvisorSM International Capital Appreciation Fund: During the year, the fund's Institutional Class shares returned 19.22%, well ahead of the MSCI index. Stock selection and an overweighting in consumer discretionary added the most value, followed by favorable picks in information technology and several other sectors. Geographically, an underweighting and strong stock picks in Japan lifted performance, as did security selection in Brazil and South Korea. A meaningful stake in strong-performing U.S. stocks also helped. Grande Cache Coal and Western Coal, two Canadian producers of metallurgical coal, were key contributors to performance, along with casino operator Las Vegas Sands, minimal exposure to energy giant BP, and two LED (light-emitting diode) plays, Rubicon Technology and Veeco Instruments. Conversely, stock picking in financials and telecommunication services modestly detracted, while at the country level our positioning in Greece and Belgium was lackluster. First Uranium, a Canadian mining company with assets in South Africa, was hampered by its weak balance sheet. National Bank of Greece, Belgian insurer Ageas and OPTI Canada, a small Canadian oil company, also detracted. Many of the stocks I've mentioned were out-of-benchmark positions, and a number of them were sold during the period.
The views expressed above reflect those of the portfolio manager(s) only through the end of the period as stated on the cover of this report and do not necessarily represent the views of Fidelity or any other person in the Fidelity organization. Any such views are subject to change at any time based upon market or other conditions and Fidelity disclaims any responsibility to update such views. These views may not be relied on as investment advice and, because investment decisions for a Fidelity fund are based on numerous factors, may not be relied on as an indication of trading intent on behalf of any Fidelity fund.
Annual Report
Shareholder Expense Example
As a shareholder of the Fund, you incur two types of costs: (1) transaction costs, including sales charges (loads) on purchase payments or redemption proceeds, redemption fees, and (2) ongoing costs, including management fees, distribution and/or service (12b-1) fees and other Fund expenses. This Example is intended to help you understand your ongoing costs (in dollars) of investing in the Fund and to compare these costs with the ongoing costs of investing in other mutual funds.
The Example is based on an investment of $1,000 invested at the beginning of the period and held for the entire period (May 1, 2010 to October 31, 2010).
Actual Expenses
The first line of the accompanying table for each class of the Fund provides information about actual account values and actual expenses. You may use the information in this line, together with the amount you invested, to estimate the expenses that you paid over the period. Simply divide your account value by $1,000.00 (for example, an $8,600 account value divided by $1,000.00 = 8.6), then multiply the result by the number in the first line for a class of the Fund under the heading entitled "Expenses Paid During Period" to estimate the expenses you paid on your account during this period. In addition, the Fund, as a shareholder in the underlying Fidelity Central Funds, will indirectly bear its pro-rata share of the fees and expenses incurred by the underlying Fidelity Central Funds. These fees and expenses are not included in the Fund's annualized expense ratio used to calculate the expense estimate in the table below.
Hypothetical Example for Comparison Purposes
The second line of the accompanying table for each class of the Fund provides information about hypothetical account values and hypothetical expenses based on a Class' actual expense ratio and an assumed rate of return of 5% per year before expenses, which is not the Class' actual return. The hypothetical account values and expenses may not be used to estimate the actual ending account balance or expenses you paid for the period. You may use this information to compare the ongoing costs of investing in the Fund and other funds. To do so, compare this 5% hypothetical example with the 5% hypothetical examples that appear in the shareholder reports of the other funds. In addition, the Fund, as a shareholder in the underlying Fidelity Central Funds, will indirectly bear its pro-rata share of the fees and expenses incurred by the underlying Fidelity Central Funds. These fees and expenses are not included in the Fund's annualized expense ratio used to calculate the expense estimate in the table below.
Please note that the expenses shown in the table are meant to highlight your ongoing costs only and do not reflect any transaction costs. Therefore, the second line of the table is useful in comparing ongoing costs only, and will not help you determine the relative total costs of owning different funds. In addition, if these transactional costs were included, your costs would have been higher.
Annual Report
| Annualized
Expense Ratio | Beginning
Account Value
May 1, 2010 | Ending
Account Value
October 31, 2010 | Expenses Paid
During Period*
May 1, 2010 to
October 31, 2010 |
Class A | 1.44% | | | |
Actual | | $ 1,000.00 | $ 1,078.50 | $ 7.54 |
HypotheticalA | | $ 1,000.00 | $ 1,017.95 | $ 7.32 |
Class T | 1.69% | | | |
Actual | | $ 1,000.00 | $ 1,077.00 | $ 8.85 |
HypotheticalA | | $ 1,000.00 | $ 1,016.69 | $ 8.59 |
Class B | 2.19% | | | |
Actual | | $ 1,000.00 | $ 1,074.20 | $ 11.45 |
HypotheticalA | | $ 1,000.00 | $ 1,014.17 | $ 11.12 |
Class C | 2.19% | | | |
Actual | | $ 1,000.00 | $ 1,074.20 | $ 11.45 |
HypotheticalA | | $ 1,000.00 | $ 1,014.17 | $ 11.12 |
Institutional Class | 1.19% | | | |
Actual | | $ 1,000.00 | $ 1,078.50 | $ 6.23 |
HypotheticalA | | $ 1,000.00 | $ 1,019.21 | $ 6.06 |
A 5% return per year before expenses
* Expenses are equal to each Class' annualized expense ratio, multiplied by the average account value over the period, multiplied by 184/365 (to reflect the one-half year period).
Annual Report
Investment Changes (Unaudited)
Top Five Stocks as of October 31, 2010 |
| % of fund's
net assets | % of fund's net assets
6 months ago |
Royal Dutch Shell PLC Class B (United Kingdom, Oil, Gas & Consumable Fuels) | 1.8 | 1.8 |
Telefonica SA sponsored ADR (Spain, Diversified Telecommunication Services) | 1.2 | 1.1 |
Banco Santander SA sponsored ADR (Spain, Commercial Banks) | 1.1 | 1.3 |
British American Tobacco PLC (United Kingdom) (United Kingdom, Tobacco) | 1.0 | 0.9 |
BG Group PLC (United Kingdom, Oil, Gas & Consumable Fuels) | 1.0 | 0.9 |
| 6.1 | |
Top Five Market Sectors as of October 31, 2010 |
| % of fund's
net assets | % of fund's net assets
6 months ago |
Consumer Discretionary | 21.9 | 12.4 |
Financials | 21.9 | 24.4 |
Materials | 12.0 | 9.7 |
Consumer Staples | 11.3 | 9.0 |
Information Technology | 9.1 | 8.3 |
Top Five Countries as of October 31, 2010 |
(excluding cash equivalents) | % of fund's
net assets | % of fund's net assets
6 months ago |
United Kingdom | 10.7 | 10.3 |
India | 8.1 | 1.6 |
United States of America | 8.1 | 6.9 |
Japan | 7.5 | 14.4 |
France | 7.0 | 7.8 |
Percentages are adjusted for the effect of open futures contracts, if applicable. |
Asset Allocation (% of fund's net assets) |
As of October 31, 2010 | As of April 30, 2010 |
| Stocks 99.3% | | | Stocks 98.6% | |
| Bonds 0.0% | | | Bonds 0.6% | |
| Short-Term
Investments and
Net Other Assets 0.7% | | | Short-Term
Investments and
Net Other Assets 0.8% | |

Annual Report
Investments October 31, 2010
Showing Percentage of Net Assets
Common Stocks - 98.1% |
| Shares | | Value |
Australia - 1.7% |
Fortescue Metals Group Ltd. (a) | 137,041 | | $ 839,076 |
JB Hi-Fi Ltd. (d) | 40,408 | | 786,964 |
Newcrest Mining Ltd. | 27,902 | | 1,092,274 |
TOTAL AUSTRALIA | | 2,718,314 |
Austria - 0.5% |
Erste Bank AG | 19,738 | | 890,672 |
Bailiwick of Jersey - 0.5% |
Randgold Resources Ltd. sponsored ADR | 9,500 | | 892,240 |
Belgium - 1.3% |
Anheuser-Busch InBev SA NV | 19,454 | | 1,219,064 |
KBC Groupe SA (a) | 19,585 | | 851,747 |
TOTAL BELGIUM | | 2,070,811 |
Bermuda - 1.1% |
China Yurun Food Group Ltd. | 207,000 | | 805,167 |
Petra Diamonds Ltd. (a) | 630,600 | | 916,862 |
TOTAL BERMUDA | | 1,722,029 |
Brazil - 5.6% |
Anhanguera Educacional Participacoes SA unit | 45,763 | | 906,544 |
Banco do Brasil SA | 47,400 | | 922,255 |
BR Malls Participacoes SA | 84,900 | | 810,972 |
Cia Hering SA | 15,500 | | 763,064 |
Iguatemi Empresa de Shopping Centers SA | 33,800 | | 788,773 |
Itau Unibanco Banco Multiplo SA ADR (a)(e) | 54,600 | | 1,340,976 |
Lojas Renner SA | 22,200 | | 876,934 |
Mills Estruturas e Servicos de Engenharia SA (a) | 75,900 | | 915,958 |
Natura Cosmeticos SA | 29,400 | | 841,629 |
TIM Participacoes SA sponsored ADR (non-vtg.) | 24,900 | | 803,274 |
TOTAL BRAZIL | | 8,970,379 |
Canada - 5.6% |
Cline Mining Corp. (a) | 126,000 | | 332,327 |
Cline Mining Corp. (a)(e)(f) | 155,100 | | 409,078 |
Consolidated Thompson Iron Mines Ltd. (a) | 83,000 | | 804,040 |
Goldcorp, Inc. | 26,200 | | 1,169,868 |
Grande Cache Coal Corp. (a) | 115,000 | | 789,293 |
Niko Resources Ltd. | 8,700 | | 829,993 |
Petrobank Energy & Resources Ltd. (a) | 21,300 | | 847,698 |
Suncor Energy, Inc. | 40,200 | | 1,288,103 |
Teck Resources Ltd. Class B (sub. vtg.) | 22,500 | | 1,005,981 |
Common Stocks - continued |
| Shares | | Value |
Canada - continued |
Uranium One, Inc. (a) | 193,500 | | $ 791,151 |
Western Coal Corp. (a) | 111,500 | | 754,339 |
TOTAL CANADA | | 9,021,871 |
Cayman Islands - 4.6% |
Belle International Holdings Ltd. | 465,000 | | 839,865 |
Bosideng International Holdings Ltd. | 1,658,000 | | 838,492 |
Ctrip.com International Ltd. sponsored ADR (a) | 16,100 | | 838,327 |
Hengan International Group Co. Ltd. | 93,000 | | 875,859 |
Hengdeli Holdings Ltd. | 1,512,000 | | 838,781 |
Kingdee International Software Group Co. Ltd. | 1,422,000 | | 750,328 |
Maoye International Holdings Ltd. (d) | 1,777,000 | | 765,706 |
Shenguan Holdings Group Ltd. | 610,000 | | 794,840 |
Trina Solar Ltd. ADR (a)(d) | 30,980 | | 829,025 |
TOTAL CAYMAN ISLANDS | | 7,371,223 |
China - 3.6% |
Agricultural Bank of China (H Shares) | 1,763,000 | | 930,259 |
Baidu.com, Inc. sponsored ADR (a) | 7,100 | | 781,071 |
China Life Insurance Co. Ltd. (H Shares) | 246,000 | | 1,081,486 |
Digital China Holdings Ltd. (H Shares) | 200,000 | | 361,232 |
Golden Eagle Retail Group Ltd. (H Shares) | 326,000 | | 866,389 |
Shandong Weigao Group Medical Polymer Co. Ltd. (H Shares) | 320,000 | | 848,379 |
Tingyi (Cayman Islands) Holding Corp. | 320,000 | | 871,085 |
TOTAL CHINA | | 5,739,901 |
Cyprus - 0.5% |
AFI Development PLC: | | | |
(B Shares) (a) | 524,000 | | 585,570 |
GDR (Reg. S) | 167,100 | | 197,178 |
TOTAL CYPRUS | | 782,748 |
Denmark - 1.9% |
Carlsberg AS Series B | 8,300 | | 907,578 |
Novo Nordisk AS Series B sponsored ADR | 12,200 | | 1,278,560 |
Pandora A/S | 16,900 | | 819,914 |
TOTAL DENMARK | | 3,006,052 |
France - 7.0% |
Atos Origin SA (a) | 16,188 | | 748,386 |
BNP Paribas SA | 19,704 | | 1,440,770 |
Carrefour SA | 20,950 | | 1,130,471 |
Christian Dior SA | 6,300 | | 911,240 |
Common Stocks - continued |
| Shares | | Value |
France - continued |
Credit Agricole SA | 59,100 | | $ 968,314 |
Edenred (a) | 40,400 | | 846,029 |
Iliad Group SA | 7,231 | | 813,981 |
LVMH Moet Hennessy - Louis Vuitton | 7,713 | | 1,208,452 |
PPR SA | 5,600 | | 917,912 |
Schneider Electric SA | 8,175 | | 1,160,261 |
Societe Generale Series A | 18,927 | | 1,133,105 |
TOTAL FRANCE | | 11,278,921 |
Germany - 2.7% |
Bayerische Motoren Werke AG (BMW) | 15,359 | | 1,100,835 |
Daimler AG (Germany) (a) | 21,342 | | 1,408,497 |
HeidelbergCement AG | 18,238 | | 953,805 |
MAN SE | 8,555 | | 940,405 |
TOTAL GERMANY | | 4,403,542 |
Hong Kong - 1.2% |
AIA Group Ltd. | 84,800 | | 252,171 |
China Unicom (Hong Kong) Ltd. sponsored ADR | 60,200 | | 842,800 |
Emperor Watch & Jewellery Ltd. | 5,880,000 | | 842,032 |
TOTAL HONG KONG | | 1,937,003 |
India - 8.1% |
Adani Enterprises Ltd. | 52,895 | | 840,652 |
Asian Paints India Ltd. | 13,299 | | 806,416 |
Bank of Baroda | 34,758 | | 824,683 |
Crompton Greaves Ltd. | 113,269 | | 812,496 |
Gitanjali Gems Ltd. | 128,389 | | 858,678 |
Housing Development Finance Corp. Ltd. | 60,305 | | 935,629 |
INFO Edge India Ltd. | 52,967 | | 812,997 |
Infrastructure Development Finance Co. Ltd. | 176,320 | | 795,777 |
ITC Ltd. | 222,246 | | 858,399 |
Jain Irrigation Systems Ltd. | 165,385 | | 865,636 |
LIC Housing Finance Ltd. | 25,214 | | 762,564 |
Rural Electrification Corp. Ltd. | 95,782 | | 800,938 |
Sun TV Ltd. | 67,818 | | 763,937 |
Titan Industries Ltd. | 10,076 | | 807,478 |
United Spirits Ltd. | 21,795 | | 735,179 |
Voltas Ltd. | 150,773 | | 834,056 |
TOTAL INDIA | | 13,115,515 |
Indonesia - 1.2% |
PT Bank Rakyat Indonesia Tbk | 712,000 | | 908,173 |
Common Stocks - continued |
| Shares | | Value |
Indonesia - continued |
PT Mayora Indah Tbk | 79,000 | | $ 106,512 |
PT Mitra Adiperkasa Tbk | 3,003,500 | | 856,942 |
TOTAL INDONESIA | | 1,871,627 |
Italy - 0.6% |
Saipem SpA | 21,359 | | 948,959 |
Japan - 7.5% |
Canon, Inc. sponsored ADR | 27,800 | | 1,278,800 |
eAccess Ltd. | 1,106 | | 806,788 |
Fanuc Ltd. | 7,500 | | 1,085,773 |
Itochu Corp. | 104,100 | | 912,362 |
Komatsu Ltd. | 44,600 | | 1,090,088 |
Marubeni Corp. | 147,000 | | 923,442 |
Mitsubishi Corp. | 45,100 | | 1,083,287 |
Mitsui & Co. Ltd. | 68,200 | | 1,072,609 |
Nitori Holdings Co. Ltd. | 10,650 | | 937,020 |
ORIX Corp. | 10,620 | | 968,694 |
Rakuten, Inc. | 1,176 | | 906,077 |
SOFTBANK CORP. | 31,000 | | 995,566 |
TOTAL JAPAN | | 12,060,506 |
Korea (South) - 1.2% |
Hyundai Motor Co. | 7,243 | | 1,094,984 |
Lock & Lock Co. Ltd. | 23,560 | | 779,397 |
TOTAL KOREA (SOUTH) | | 1,874,381 |
Malaysia - 1.1% |
Genting Bhd | 263,600 | | 884,598 |
QSR Brands Bhd | 514,100 | | 872,532 |
TOTAL MALAYSIA | | 1,757,130 |
Mexico - 1.8% |
Fomento Economico Mexicano SAB de CV sponsored ADR | 16,100 | | 884,051 |
Grupo Mexico SA de CV Series B | 293,500 | | 965,065 |
Wal-Mart de Mexico SA de CV Series V | 364,400 | | 996,675 |
TOTAL MEXICO | | 2,845,791 |
Netherlands - 3.1% |
ASM International NV (Netherlands) (a) | 30,800 | | 785,991 |
ING Groep NV sponsored ADR (a) | 111,026 | | 1,196,860 |
Koninklijke KPN NV | 66,873 | | 1,116,605 |
Common Stocks - continued |
| Shares | | Value |
Netherlands - continued |
Koninklijke Philips Electronics NV | 36,359 | | $ 1,108,755 |
X5 Retail Group NV GDR (Reg. S) (a) | 18,600 | | 779,340 |
TOTAL NETHERLANDS | | 4,987,551 |
Nigeria - 0.5% |
Guaranty Trust Bank PLC GDR (Reg. S) | 115,800 | | 840,708 |
Norway - 0.5% |
Aker Solutions ASA | 55,600 | | 846,436 |
Qatar - 0.5% |
Commercial Bank of Qatar GDR (Reg. S) | 168,313 | | 771,238 |
Russia - 3.3% |
LSR Group OJSC GDR (Reg. S) (a) | 94,700 | | 804,950 |
Magnit OJSC GDR (Reg. S) | 32,800 | | 877,072 |
Mechel Steel Group OAO sponsored ADR (a) | 111,000 | | 874,680 |
OAO NOVATEK GDR | 9,500 | | 908,675 |
Sberbank (Savings Bank of the Russian Federation) GDR | 2,800 | | 1,051,936 |
TNK-BP Holding (a) | 387,500 | | 792,438 |
TOTAL RUSSIA | | 5,309,751 |
South Africa - 2.7% |
AngloGold Ashanti Ltd. sponsored ADR | 21,700 | | 1,022,287 |
Clicks Group Ltd. | 119,093 | | 776,947 |
Mr Price Group Ltd. | 89,000 | | 808,808 |
Naspers Ltd. Class N | 19,700 | | 1,034,404 |
Shoprite Holdings Ltd. | 56,800 | | 802,897 |
TOTAL SOUTH AFRICA | | 4,445,343 |
Spain - 2.9% |
Banco Santander SA sponsored ADR | 140,759 | | 1,803,123 |
Inditex SA (d) | 11,884 | | 992,325 |
Telefonica SA sponsored ADR (d) | 23,100 | | 1,874,334 |
TOTAL SPAIN | | 4,669,782 |
Sweden - 1.7% |
Elekta AB (B Shares) | 21,307 | | 806,156 |
EnergyO Solutions AB (a) | 126,017 | | 839,283 |
H&M Hennes & Mauritz AB (B Shares) | 32,181 | | 1,133,771 |
TOTAL SWEDEN | | 2,779,210 |
Switzerland - 3.1% |
Compagnie Financiere Richemont SA Series A | 22,010 | | 1,097,426 |
Credit Suisse Group sponsored ADR | 31,100 | | 1,290,650 |
Common Stocks - continued |
| Shares | | Value |
Switzerland - continued |
Dufry AG (a) | 7,140 | | $ 829,077 |
Lonza Group AG | 9,127 | | 798,792 |
The Swatch Group AG (Bearer) | 2,470 | | 943,736 |
TOTAL SWITZERLAND | | 4,959,681 |
Taiwan - 1.1% |
HTC Corp. | 43,350 | | 978,757 |
Ruentex Development Co. Ltd. | 501,000 | | 831,590 |
TOTAL TAIWAN | | 1,810,347 |
Turkey - 0.6% |
Turkiye Garanti Bankasi AS | 148,000 | | 908,039 |
United Kingdom - 10.7% |
Anglo American PLC (United Kingdom) | 30,400 | | 1,416,352 |
Associated British Foods PLC | 49,800 | | 835,371 |
Barclays PLC Sponsored ADR (d) | 75,430 | | 1,331,340 |
BG Group PLC | 78,819 | | 1,534,932 |
British American Tobacco PLC (United Kingdom) | 41,100 | | 1,565,562 |
Britvic PLC | 112,400 | | 868,714 |
Burberry Group PLC | 53,800 | | 878,334 |
Imperial Tobacco Group PLC | 35,785 | | 1,146,085 |
Lloyds Banking Group PLC (a) | 1,226,100 | | 1,347,467 |
Royal Dutch Shell PLC Class B | 88,638 | | 2,836,199 |
Standard Chartered PLC: | | | |
rights 11/5/10 (a) | 6,023 | | 50,709 |
(United Kingdom) | 48,186 | | 1,393,868 |
Vedanta Resources PLC | 26,300 | | 874,333 |
Xstrata PLC | 61,012 | | 1,182,291 |
TOTAL UNITED KINGDOM | | 17,261,557 |
United States of America - 8.1% |
Apple, Inc. (a) | 2,500 | | 752,175 |
AsiaInfo Holdings, Inc. (a)(d) | 37,900 | | 842,138 |
Citigroup, Inc. (a) | 187,364 | | 781,308 |
First Cash Financial Services, Inc. (a) | 30,116 | | 875,472 |
Google, Inc. Class A (a) | 1,320 | | 809,147 |
JPMorgan Chase & Co. | 21,495 | | 808,857 |
Juniper Networks, Inc. (a) | 26,636 | | 862,740 |
Las Vegas Sands Corp. (a) | 17,400 | | 798,312 |
MasterCard, Inc. Class A | 3,260 | | 782,596 |
Mercadolibre, Inc. (a)(d) | 12,600 | | 833,238 |
Morgan Stanley | 34,100 | | 848,067 |
Common Stocks - continued |
| Shares | | Value |
United States of America - continued |
Motorola, Inc. (a) | 91,800 | | $ 748,170 |
Tiffany & Co., Inc. | 15,700 | | 832,100 |
Visa, Inc. Class A | 9,740 | | 761,376 |
Walter Energy, Inc. | 9,900 | | 870,804 |
Wells Fargo & Co. | 33,940 | | 885,155 |
TOTAL UNITED STATES OF AMERICA | | 13,091,655 |
TOTAL COMMON STOCKS (Cost $139,435,035) | 157,960,913 |
Nonconvertible Preferred Stocks - 1.2% |
| | | |
Germany - 0.7% |
Volkswagen AG | 7,300 | | 1,097,019 |
Italy - 0.5% |
Fiat SpA (Risparmio Shares) | 74,862 | | 879,688 |
TOTAL NONCONVERTIBLE PREFERRED STOCKS (Cost $1,387,893) | 1,976,707 |
Money Market Funds - 5.2% |
| | | |
Fidelity Cash Central Fund, 0.23% (b) | 2,774,848 | | 2,774,848 |
Fidelity Securities Lending Cash Central Fund, 0.24% (b)(c) | 5,481,695 | | 5,481,695 |
TOTAL MONEY MARKET FUNDS (Cost $8,256,543) | 8,256,543 |
TOTAL INVESTMENT PORTFOLIO - 104.5% (Cost $149,079,471) | | 168,194,163 |
NET OTHER ASSETS (LIABILITIES) - (4.5)% | | (7,189,782) |
NET ASSETS - 100% | $ 161,004,381 |
Legend |
(a) Non-income producing |
(b) Affiliated fund that is available only to investment companies and other accounts managed by Fidelity Investments. The rate quoted is the annualized seven-day yield of the fund at period end. A complete unaudited listing of the fund's holdings as of its most recent quarter end is available upon request. In addition, each Fidelity Central Fund's financial statements, which are not covered by the Fund's report of Independent Registered Public Accounting Firm, are available on the SEC's website or upon request. |
(c) Investment made with cash collateral received from securities on loan. |
(d) Security or a portion of the security is on loan at period end. |
(e) Security exempt from registration under Rule 144A of the Securities Act of 1933. These securities may be resold in transactions exempt from registration, normally to qualified institutional buyers. At the end of the period, the value of these securities amounted to $1,750,054 or 1.1% of net assets. |
(f) Security or a portion of the security purchased on a delayed delivery or when-issued basis. |
Affiliated Central Funds |
Information regarding fiscal year to date income earned by the Fund from investments in Fidelity Central Funds is as follows: |
Fund | Income earned |
Fidelity Cash Central Fund | $ 1,545 |
Fidelity Securities Lending Cash Central Fund | 106,588 |
Total | $ 108,133 |
Other Information |
The following is a summary of the inputs used, as of October 31, 2010, involving the Fund's assets and liabilities carried at fair value. The inputs or methodology used for valuing securities may not be an indication of the risk associated with investing in those securities. For more information on valuation inputs, and their aggregation into the levels used in the table below, please refer to the Security Valuation section in the accompanying Notes to Financial Statements. |
Valuation Inputs at Reporting Date: |
Description | Total | Level 1 | Level 2 | Level 3 |
Investments in Securities: | | | | |
Equities: | | | | |
United Kingdom | $ 17,261,557 | $ 11,512,329 | $ 5,749,228 | $ - |
India | 13,115,515 | 12,290,832 | 824,683 | - |
United States of America | 13,091,655 | 13,091,655 | - | - |
Japan | 12,060,506 | 4,897,379 | 7,163,127 | - |
France | 11,278,921 | 11,278,921 | - | - |
Canada | 9,021,871 | 9,021,871 | - | - |
Brazil | 8,970,379 | 8,970,379 | - | - |
Cayman Islands | 7,371,223 | 7,371,223 | - | - |
China | 5,739,901 | 4,658,415 | 1,081,486 | - |
Other | 62,026,092 | 60,917,337 | 1,108,755 | - |
Money Market Funds | 8,256,543 | 8,256,543 | - | - |
Total Investments in Securities: | $ 168,194,163 | $ 152,266,884 | $ 15,927,279 | $ - |
Income Tax Information |
At October 31, 2010, the Fund had a capital loss carryforward of approximately $112,999,916 of which $89,032,044 and $23,967,872 will expire on October 31, 2016 and 2017, respectively. Capital loss carryforwards are only available to offset future capital gains of the Fund to the extent provided by regulations and may be limited. |
See accompanying notes which are an integral part of the financial statements.
Annual Report
Statement of Assets and Liabilities
| October 31, 2010 |
| | |
Assets | | |
Investment in securities, at value (including securities loaned of $5,302,992) - See accompanying schedule: Unaffiliated issuers (cost $140,822,928) | $ 159,937,620 | |
Fidelity Central Funds (cost $8,256,543) | 8,256,543 | |
Total Investments (cost $149,079,471) | | $ 168,194,163 |
Foreign currency held at value (cost $280,591) | | 279,691 |
Receivable for investments sold | | 4,885,526 |
Receivable for fund shares sold | | 126,686 |
Dividends receivable | | 458,362 |
Distributions receivable from Fidelity Central Funds | | 2,124 |
Other receivables | | 328,727 |
Total assets | | 174,275,279 |
| | |
Liabilities | | |
Payable for investments purchased
Regular delivery | $ 6,298,414 | |
Delayed delivery | 296,544 | |
Payable for fund shares redeemed | 648,839 | |
Accrued management fee | 93,467 | |
Distribution and service plan fees payable | 68,837 | |
Other affiliated payables | 44,938 | |
Other payables and accrued expenses | 338,164 | |
Collateral on securities loaned, at value | 5,481,695 | |
Total liabilities | | 13,270,898 |
| | |
Net Assets | | $ 161,004,381 |
Net Assets consist of: | | |
Paid in capital | | $ 256,411,712 |
Undistributed net investment income | | 577,824 |
Accumulated undistributed net realized gain (loss) on investments and foreign currency transactions | | (114,842,842) |
Net unrealized appreciation (depreciation) on investments and assets and liabilities in foreign currencies | | 18,857,687 |
Net Assets | | $ 161,004,381 |
See accompanying notes which are an integral part of the financial statements.
Annual Report
Financial Statements - continued
Statement of Assets and Liabilities - continued
| October 31, 2010 |
| | |
Calculation of Maximum Offering Price Class A:
Net Asset Value and redemption price per share ($49,058,152 ÷ 4,522,281 shares) | | $ 10.85 |
| | |
Maximum offering price per share (100/94.25 of $10.85) | | $ 11.51 |
Class T:
Net Asset Value and redemption price per share ($74,055,523 ÷ 6,967,533 shares) | | $ 10.63 |
| | |
Maximum offering price per share (100/96.50 of $10.63) | | $ 11.02 |
Class B:
Net Asset Value and offering price per share ($8,736,578 ÷ 887,975 shares)A | | $ 9.84 |
| | |
Class C:
Net Asset Value and offering price per share ($24,808,899 ÷ 2,522,008 shares)A | | $ 9.84 |
| | |
| | |
Institutional Class:
Net Asset Value, offering price and redemption price per share ($4,345,229 ÷ 376,443 shares) | | $ 11.54 |
A Redemption price per share is equal to net asset value less any applicable contingent deferred sales charge.
See accompanying notes which are an integral part of the financial statements.
Annual Report
Statement of Operations
| Year ended October 31, 2010 |
| | |
Investment Income | | |
Dividends | | $ 3,178,222 |
Interest | | 22,949 |
Income from Fidelity Central Funds | | 108,133 |
Income before foreign taxes withheld | | 3,309,304 |
Less foreign taxes withheld | | (277,249) |
Total income | | 3,032,055 |
| | |
Expenses | | |
Management fee
Basic fee | $ 1,113,044 | |
Performance adjustment | (252,535) | |
Transfer agent fees | 484,056 | |
Distribution and service plan fees | 822,347 | |
Accounting and security lending fees | 83,142 | |
Custodian fees and expenses | 301,813 | |
Independent trustees' compensation | 893 | |
Registration fees | 64,819 | |
Audit | 79,647 | |
Legal | 851 | |
Interest | 526 | |
Miscellaneous | 2,025 | |
Total expenses before reductions | 2,700,628 | |
Expense reductions | (283,831) | 2,416,797 |
Net investment income (loss) | | 615,258 |
Realized and Unrealized Gain (Loss) Net realized gain (loss) on: | | |
Investment securities: | | |
Unaffiliated issuers (net of foreign taxes of $99,659) | 14,072,505 | |
Foreign currency transactions | (622,420) | |
Total net realized gain (loss) | | 13,450,085 |
Change in net unrealized appreciation (depreciation) on: Investment securities (net of increase in deferred foreign taxes of $211,504) | 12,317,447 | |
Assets and liabilities in foreign currencies | 15,965 | |
Total change in net unrealized appreciation (depreciation) | | 12,333,412 |
Net gain (loss) | | 25,783,497 |
Net increase (decrease) in net assets resulting from operations | | $ 26,398,755 |
See accompanying notes which are an integral part of the financial statements.
Annual Report
Financial Statements - continued
Statement of Changes in Net Assets
| Year ended
October 31,
2010 | Year ended
October 31,
2009 |
Increase (Decrease) in Net Assets | | |
Operations | | |
Net investment income (loss) | $ 615,258 | $ 1,239,787 |
Net realized gain (loss) | 13,450,085 | (23,334,071) |
Change in net unrealized appreciation (depreciation) | 12,333,412 | 73,135,078 |
Net increase (decrease) in net assets resulting
from operations | 26,398,755 | 51,040,794 |
Distributions to shareholders from net investment income | (1,027,978) | (277,587) |
Distributions to shareholders from net realized gain | (2,639,506) | - |
Total distributions | (3,667,484) | (277,587) |
Share transactions - net increase (decrease) | (21,653,630) | (18,914,139) |
Redemption fees | 4,947 | 2,824 |
Total increase (decrease) in net assets | 1,082,588 | 31,851,892 |
| | |
Net Assets | | |
Beginning of period | 159,921,793 | 128,069,901 |
End of period (including undistributed net investment income of $577,824 and undistributed net investment income of $962,200, respectively) | $ 161,004,381 | $ 159,921,793 |
See accompanying notes which are an integral part of the financial statements.
Annual Report
Financial Highlights - Class A
Years ended October 31, | 2010 | 2009 | 2008 | 2007 | 2006 |
Selected Per-Share Data | | | | |
Net asset value, beginning of period | $ 9.34 | $ 6.39 | $ 18.64 | $ 17.79 | $ 17.38 |
Income from Investment Operations | | | | | |
Net investment income (loss) C | .06 | .09 | .11 | .07 | .12 |
Net realized and unrealized gain (loss) | 1.69 | 2.88 | (8.42) | 3.81 | 2.73 |
Total from investment operations | 1.75 | 2.97 | (8.31) | 3.88 | 2.85 |
Distributions from net investment income | (.08) | (.02) | (.05) | (.12) | (.20) |
Distributions from net realized gain | (.16) | - | (3.89) | (2.90) | (2.24) |
Total distributions | (.24) | (.02) | (3.94) | (3.03) H | (2.44) |
Redemption fees added to paid in capital C, G | - | - | - | - | - |
Net asset value, end of period | $ 10.85 | $ 9.34 | $ 6.39 | $ 18.64 | $ 17.79 |
Total Return A, B | 18.98% | 46.61% | (55.70)% | 24.76% | 17.62% |
Ratios to Average Net Assets D, F | | | | |
Expenses before reductions | 1.45% | 1.27% | 1.42% | 1.47% | 1.43% |
Expenses net of fee waivers, if any | 1.45% | 1.27% | 1.42% | 1.47% | 1.43% |
Expenses net of all reductions | 1.27% | 1.15% | 1.25% | 1.39% | 1.32% |
Net investment income (loss) | .66% | 1.22% | .95% | .39% | .70% |
Supplemental Data | | | | |
Net assets, end of period (000 omitted) | $ 49,058 | $ 43,389 | $ 35,517 | $ 113,579 | $ 110,240 |
Portfolio turnover rate E | 490% | 414% | 394% | 146% | 170% |
A Total returns would have been lower had certain expenses not been reduced during the periods shown.
B Total returns do not include the effect of the sales charges.
C Calculated based on average shares outstanding during the period.
D Fees and expenses of the underlying Fidelity Central Funds are not included in the Fund's expense ratio. The Fund indirectly bears its proportionate share of the expenses of any underlying Fidelity Central Funds.
E Amount does not include the portfolio activity of any underlying Fidelity Central Funds.
F Expense ratios reflect operating expenses of the class. Expenses before reductions do not reflect amounts reimbursed by the investment adviser or reductions from brokerage service arrangements or reductions from other expense offset arrangements and do not represent the amount paid by the class during periods when reimbursements or reductions occur. Expenses net of fee waivers reflect expenses after reimbursement by the investment adviser but prior to reductions from brokerage service arrangements or other expense offset arrangements. Expenses net of all reductions represent the net expenses paid by the class.
G Amount represents less than $.01 per share.
H Total distributions of $3.03 per share is comprised of distributions from net investment income of $.123 and distributions from net realized gain of $2.903 per share.
See accompanying notes which are an integral part of the financial statements.
Annual Report
Financial Highlights - Class T
Years ended October 31, | 2010 | 2009 | 2008 | 2007 | 2006 |
Selected Per-Share Data | | | | |
Net asset value, beginning of period | $ 9.16 | $ 6.28 | $ 18.38 | $ 17.57 | $ 17.18 |
Income from Investment Operations | | | | | |
Net investment income (loss) C | .04 | .07 | .08 | .03 | .08 |
Net realized and unrealized gain (loss) | 1.65 | 2.82 | (8.28) | 3.76 | 2.70 |
Total from investment operations | 1.69 | 2.89 | (8.20) | 3.79 | 2.78 |
Distributions from net investment income | (.06) | (.01) | (.01) | (.07) | (.15) |
Distributions from net realized gain | (.16) | - | (3.89) | (2.90) | (2.24) |
Total distributions | (.22) | (.01) | (3.90) | (2.98) H | (2.39) |
Redemption fees added to paid in capital C, G | - | - | - | - | - |
Net asset value, end of period | $ 10.63 | $ 9.16 | $ 6.28 | $ 18.38 | $ 17.57 |
Total Return A, B | 18.65% | 46.23% | (55.79)% | 24.47% | 17.38% |
Ratios to Average Net Assets D, F | | | | |
Expenses before reductions | 1.69% | 1.52% | 1.65% | 1.69% | 1.65% |
Expenses net of fee waivers, if any | 1.69% | 1.52% | 1.65% | 1.69% | 1.65% |
Expenses net of all reductions | 1.51% | 1.41% | 1.48% | 1.61% | 1.54% |
Net investment income (loss) | .42% | .96% | .71% | .18% | .48% |
Supplemental Data | | | | |
Net assets, end of period (000 omitted) | $ 74,056 | $ 78,005 | $ 57,603 | $ 179,990 | $ 188,320 |
Portfolio turnover rate E | 490% | 414% | 394% | 146% | 170% |
A Total returns would have been lower had certain expenses not been reduced during the periods shown.
B Total returns do not include the effect of the sales charges.
C Calculated based on average shares outstanding during the period.
D Fees and expenses of the underlying Fidelity Central Funds are not included in the Fund's expense ratio. The Fund indirectly bears its proportionate share of the expenses of any underlying Fidelity Central Funds.
E Amount does not include the portfolio activity of any underlying Fidelity Central Funds.
F Expense ratios reflect operating expenses of the class. Expenses before reductions do not reflect amounts reimbursed by the investment adviser or reductions from brokerage service arrangements or reductions from other expense offset arrangements and do not represent the amount paid by the class during periods when reimbursements or reductions occur. Expenses net of fee waivers reflect expenses after reimbursement by the investment adviser but prior to reductions from brokerage service arrangements or other expense offset arrangements. Expenses net of all reductions represent the net expenses paid by the class.
G Amount represents less than $.01 per share.
H Total distributions of $2.98 per share is comprised of distributions from net investment income of $.074 and distributions from net realized gain of $2.903 per share.
See accompanying notes which are an integral part of the financial statements.
Annual Report
Financial Highlights - Class B
Years ended October 31, | 2010 | 2009 | 2008 | 2007 | 2006 |
Selected Per-Share Data | | | | |
Net asset value, beginning of period | $ 8.51 | $ 5.86 | $ 17.36 | $ 16.72 | $ 16.46 |
Income from Investment Operations | | | | | |
Net investment income (loss) C | (.01) | .03 | .02 | (.06) | (.02) |
Net realized and unrealized gain (loss) | 1.53 | 2.63 | (7.75) | 3.57 | 2.57 |
Total from investment operations | 1.52 | 2.66 | (7.73) | 3.51 | 2.55 |
Distributions from net investment income | (.03) | (.01) | - | - | (.05) |
Distributions from net realized gain | (.16) | - | (3.77) | (2.87) | (2.24) |
Total distributions | (.19) | (.01) | (3.77) | (2.87) H | (2.29) |
Redemption fees added to paid in capital C, G | - | - | - | - | - |
Net asset value, end of period | $ 9.84 | $ 8.51 | $ 5.86 | $ 17.36 | $ 16.72 |
Total Return A, B | 18.03% | 45.50% | (56.02)% | 23.85% | 16.58% |
Ratios to Average Net Assets D, F | | | | |
Expenses before reductions | 2.20% | 2.02% | 2.17% | 2.24% | 2.26% |
Expenses net of fee waivers, if any | 2.20% | 2.02% | 2.17% | 2.24% | 2.25% |
Expenses net of all reductions | 2.02% | 1.90% | 2.01% | 2.17% | 2.14% |
Net investment income (loss) | (.09)% | .47% | .19% | (.38)% | (.13)% |
Supplemental Data | | | | |
Net assets, end of period (000 omitted) | $ 8,737 | $ 10,661 | $ 10,356 | $ 40,013 | $ 51,661 |
Portfolio turnover rate E | 490% | 414% | 394% | 146% | 170% |
A Total returns would have been lower had certain expenses not been reduced during the periods shown.
B Total returns do not include the effect of the contingent deferred sales charge.
C Calculated based on average shares outstanding during the period.
D Fees and expenses of the underlying Fidelity Central Funds are not included in the Fund's expense ratio. The Fund indirectly bears its proportionate share of the expenses of any underlying Fidelity Central Funds.
E Amount does not include the portfolio activity of any underlying Fidelity Central Funds.
F Expense ratios reflect operating expenses of the class. Expenses before reductions do not reflect amounts reimbursed by the investment adviser or reductions from brokerage service arrangements or reductions from other expense offset arrangements and do not represent the amount paid by the class during periods when reimbursements or reductions occur. Expenses net of fee waivers reflect expenses after reimbursement by the investment adviser but prior to reductions from brokerage service arrangements or other expense offset arrangements. Expenses net of all reductions represent the net expenses paid by the class.
G Amount represents less than $.01 per share.
H Total distributions of $2.87 per share is comprised of distributions from net realized gain of $2.869 per share.
See accompanying notes which are an integral part of the financial statements.
Annual Report
Financial Highlights - Class C
Years ended October 31, | 2010 | 2009 | 2008 | 2007 | 2006 |
Selected Per-Share Data | | | | |
Net asset value, beginning of period | $ 8.51 | $ 5.87 | $ 17.42 | $ 16.80 | $ 16.52 |
Income from Investment Operations | | | | | |
Net investment income (loss) C | (.01) | .03 | .02 | (.05) | (.01) |
Net realized and unrealized gain (loss) | 1.53 | 2.62 | (7.75) | 3.57 | 2.60 |
Total from investment operations | 1.52 | 2.65 | (7.73) | 3.52 | 2.59 |
Distributions from net investment income | (.04) | (.01) | - | - | (.07) |
Distributions from net realized gain | (.16) | - | (3.82) | (2.90) | (2.24) |
Total distributions | (.19) I | (.01) | (3.82) | (2.90) H | (2.31) |
Redemption fees added to paid in capital C, G | - | - | - | - | - |
Net asset value, end of period | $ 9.84 | $ 8.51 | $ 5.87 | $ 17.42 | $ 16.80 |
Total Return A, B | 18.12% | 45.26% | (55.95)% | 23.85% | 16.75% |
Ratios to Average Net Assets D, F | | | | |
Expenses before reductions | 2.20% | 2.02% | 2.16% | 2.19% | 2.16% |
Expenses net of fee waivers, if any | 2.20% | 2.02% | 2.16% | 2.19% | 2.16% |
Expenses net of all reductions | 2.02% | 1.90% | 2.00% | 2.12% | 2.05% |
Net investment income (loss) | (.09)% | .47% | .20% | (.33)% | (.03)% |
Supplemental Data | | | | |
Net assets, end of period (000 omitted) | $ 24,809 | $ 24,575 | $ 20,973 | $ 66,298 | $ 66,162 |
Portfolio turnover rate E | 490% | 414% | 394% | 146% | 170% |
A Total returns would have been lower had certain expenses not been reduced during the periods shown.
B Total returns do not include the effect of the contingent deferred sales charge.
C Calculated based on average shares outstanding during the period.
D Fees and expenses of the underlying Fidelity Central Funds are not included in the Fund's expense ratio. The Fund indirectly bears its proportionate share of the expenses of any underlying Fidelity Central Funds.
E Amount does not include the portfolio activity of any underlying Fidelity Central Funds.
F Expense ratios reflect operating expenses of the class. Expenses before reductions do not reflect amounts reimbursed by the investment adviser or reductions from brokerage service arrangements or reductions from other expense offset arrangements and do not represent the amount paid by the class during periods when reimbursements or reductions occur. Expenses net of fee waivers reflect expenses after reimbursement by the investment adviser but prior to reductions from brokerage service arrangements or other expense offset arrangements. Expenses net of all reductions represent the net expenses paid by the class.
G Amount represents less than $.01 per share.
H Total distributions of $2.90 per share is comprised of distributions from net realized gain of $2.903 per share.
I Total distributions of $.19 per share is comprised of distributions from net investment income of $.037 and distributions from net realized gain of $.155 per share.
See accompanying notes which are an integral part of the financial statements.
Annual Report
Financial Highlights - Institutional Class
Years ended October 31, | 2010 | 2009 | 2008 | 2007 | 2006 |
Selected Per-Share Data | | | | |
Net asset value, beginning of period | $ 9.91 | $ 6.77 | $ 19.49 | $ 18.46 | $ 17.70 |
Income from Investment Operations | | | | | |
Net investment income (loss) B | .10 | .11 | .16 | .13 | .20 |
Net realized and unrealized gain (loss) | 1.78 | 3.05 | (8.88) | 3.97 | 2.80 |
Total from investment operations | 1.88 | 3.16 | (8.72) | 4.10 | 3.00 |
Distributions from net investment income | (.09) | (.02) | (.11) | (.17) | - |
Distributions from net realized gain | (.16) | - | (3.89) | (2.90) | (2.24) |
Total distributions | (.25) | (.02) | (4.00) | (3.07) G | (2.24) |
Redemption fees added to paid in capital B, F | - | - | - | - | - |
Net asset value, end of period | $ 11.54 | $ 9.91 | $ 6.77 | $ 19.49 | $ 18.46 |
Total Return A | 19.22% | 46.85% | (55.51)% | 25.16% | 18.09% |
Ratios to Average Net Assets C, E | | | | |
Expenses before reductions | 1.19% | 1.00% | 1.12% | 1.14% | 1.04% |
Expenses net of fee waivers, if any | 1.19% | 1.00% | 1.12% | 1.14% | 1.04% |
Expenses net of all reductions | 1.01% | .89% | .95% | 1.07% | .93% |
Net investment income (loss) | .93% | 1.48% | 1.24% | .72% | 1.08% |
Supplemental Data | | | | |
Net assets, end of period (000 omitted) | $ 4,345 | $ 3,292 | $ 3,620 | $ 17,463 | $ 24,536 |
Portfolio turnover rate D | 490% | 414% | 394% | 146% | 170% |
A Total returns would have been lower had certain expenses not been reduced during the periods shown.
B Calculated based on average shares outstanding during the period.
C Fees and expenses of the underlying Fidelity Central Funds are not included in the Fund's expense ratio. The Fund indirectly bears its proportionate share of the expenses of any underlying Fidelity Central Funds.
D Amount does not include the portfolio activity of any underlying Fidelity Central Funds.
E Expense ratios reflect operating expenses of the class. Expenses before reductions do not reflect amounts reimbursed by the investment adviser or reductions from brokerage service arrangements or reductions from other expense offset arrangements and do not represent the amount paid by the class during periods when reimbursements or reductions occur. Expenses net of fee waivers reflect expenses after reimbursement by the investment adviser but prior to reductions from brokerage service arrangements or other expense offset arrangements. Expenses net of all reductions represent the net expenses paid by the class.
F Amount represents less than $.01 per share.
G Total distributions of $3.07 per share is comprised of distributions from net investment income of $.166 and distributions from net realized gain of $2.903 per share.
See accompanying notes which are an integral part of the financial statements.
Annual Report
Notes to Financial Statements
For the period ended October 31, 2010
1. Organization.
Fidelity Advisor International Capital Appreciation Fund (the Fund) is a fund of Fidelity Advisor Series VIII (the Trust) and is authorized to issue an unlimited number of shares. The Trust is registered under the Investment Company Act of 1940, as amended (the 1940 Act), as an open-end management investment company organized as a Massachusetts business trust. The Fund offers Class A, Class T, Class C, and Institutional Class shares, each of which has equal rights as to assets and voting privileges. Effective after the close of business on September 1, 2010, Class B shares were closed to new accounts and additional purchases by existing shareholders. Each class has exclusive voting rights with respect to matters that affect that class. Class B shares will automatically convert to Class A shares after a holding period of seven years from the initial date of purchase. Investment income, realized and unrealized capital gains and losses, the common expenses of the Fund, and certain fund-level expense reductions, if any, are allocated on a pro-rata basis to each class based on the relative net assets of each class to the total net assets of the Fund. Each class differs with respect to transfer agent and distribution and service plan fees incurred. Certain expense reductions also differ by class. The Fund's investments in emerging markets can be subject to social, economic, regulatory, and political uncertainties and can be extremely volatile.
2. Investments in Fidelity Central Funds.
The Fund may invest in Fidelity Central Funds, which are open-end investment companies available only to other investment companies and accounts managed by Fidelity Management & Research Company (FMR) and its affiliates. The Fund's Schedule of Investments lists each of the Fidelity Central Funds held as of period end, if any, as an investment of the Fund, but does not include the underlying holdings of each Fidelity Central Fund. As an Investing Fund, the Fund indirectly bears its proportionate share of the expenses of the underlying Fidelity Central Funds.
The Money Market Central Funds seek preservation of capital and current income and are managed by Fidelity Investments Money Management, Inc. (FIMM), an affiliate of FMR.
A complete unaudited list of holdings for each Fidelity Central Fund is available upon request or at the Securities and Exchange Commission (the SEC) web site at www.sec.gov. In addition, the financial statements of the Fidelity Central Funds which are not covered by the Fund's Report of Independent Registered Public Accounting Firm, are available on the SEC web site or upon request.
3. Significant Accounting Policies.
The financial statements have been prepared in conformity with accounting principles generally accepted in the United States of America (GAAP), which require management
Annual Report
3. Significant Accounting Policies - continued
to make certain estimates and assumptions at the date of the financial statements. Actual results could differ from those estimates. The following summarizes the significant accounting policies of the Fund:
Security Valuation. Investments are valued as of 4:00 p.m. Eastern time on the last calendar day of the period. The Fund uses independent pricing services approved by the Board of Trustees to value its investments. When current market prices or quotations are not readily available or reliable, valuations may be determined in good faith in accordance with procedures adopted by the Board of Trustees. Factors used in determining value may include market or security specific events. The frequency with which these procedures are used cannot be predicted and they may be utilized to a significant extent. The value used for net asset value (NAV) calculation under these procedures may differ from published prices for the same securities.
The Fund categorizes the inputs to valuation techniques used to value its investments into a disclosure hierarchy consisting of three levels as shown below.
Level 1 - quoted prices in active markets for identical investments
Level 2 - other significant observable inputs (including quoted prices for similar investments, interest rates, prepayment speeds, etc.)
Level 3 - unobservable inputs (including the fund's own assumptions based on the best information available)
Changes in valuation techniques may result in transfers in or out of an assigned level within the disclosure hierarchy. The aggregate value of investments by input level, as of October 31, 2010 is included at the end of the Fund's Schedule of Investments. Valuation techniques used to value the Fund's investments by major category are as follows.
Equity securities, including restricted securities, for which market quotations are readily available, are valued at the last reported sale price or official closing price as reported by an independent pricing service on the primary market or exchange on which they are traded and are categorized as Level 1 in the hierarchy. In the event there were no sales during the day or closing prices are not available, securities are valued at the last quoted bid price or may be valued using the last available price and are generally categorized as Level 2 in the hierarchy. For foreign equity securities, when significant market or security specific events arise, comparisons to the valuation of American Depositary Receipts (ADRs), futures contracts, Exchange-traded funds (ETFs) and certain indexes as well as quoted prices for similar securities are used and are categorized as Level 2 in the hierarchy in these circumstances. Utilizing these techniques may result in transfers between Level 1 and Level 2. For restricted equity securities and private
Annual Report
Notes to Financial Statements - continued
3. Significant Accounting Policies - continued
Security Valuation - continued
placements where observable inputs are limited, assumptions about market activity and risk are used and are categorized as Level 3 in the hierarchy.
Investments in open-end mutual funds, including the Fidelity Central Funds, are valued at their closing net asset value each business day and are categorized as Level 1 in the hierarchy. Short-term securities with remaining maturities of sixty days or less for which quotations are not readily available are valued at amortized cost, which approximates fair value and are categorized as Level 2 in the hierarchy.
Foreign Currency. The Fund uses foreign currency contracts to facilitate transactions in foreign-denominated securities. Gains and losses from these transactions may arise from changes in the value of the foreign currency or if the counterparties do not perform under the contracts' terms.
Foreign-denominated assets, including investment securities, and liabilities are translated into U.S. dollars at the exchange rate at period end. Purchases and sales of investment securities, income and dividends received and expenses denominated in foreign currencies are translated into U.S. dollars at the exchange rate in effect on the transaction date.
The effects of exchange rate fluctuations on investments are included with the net realized and unrealized gain (loss) on investment securities. Other foreign currency transactions resulting in realized and unrealized gain (loss) are disclosed separately.
Investment Transactions and Income. For financial reporting purposes, the Fund's investment holdings and NAV include trades executed through the end of the last business day of the period. The NAV per share for processing shareholder transactions is calculated as of the close of business of the New York Stock Exchange (NYSE), normally 4:00 p.m. Eastern time and includes trades executed through the end of the prior business day. Gains and losses on securities sold are determined on the basis of identified cost and may include proceeds received from litigation. Dividend income is recorded on the ex-dividend date, except for certain dividends from foreign securities where the ex-dividend date may have passed, which are recorded as soon as the Fund is informed of the ex-dividend date. Non-cash dividends included in dividend income, if any, are recorded at the fair market value of the securities received. Distributions received on securities that represent a return of capital or capital gain are recorded as a reduction of cost of investments and/or as a realized gain. The Fund estimates the components of distributions received that may be considered return of capital distributions or capital gain distributions. Interest income and distributions from the Fidelity Central Funds are accrued as earned. Interest income includes coupon interest and amortization of
Annual Report
3. Significant Accounting Policies - continued
Investment Transactions and Income - continued
premium and accretion of discount on debt securities. Investment income is recorded net of foreign taxes withheld where recovery of such taxes is uncertain.
Expenses. Most expenses of the Trust can be directly attributed to a fund. Expenses which cannot be directly attributed are apportioned amongst each fund in the Trust. Expense estimates are accrued in the period to which they relate and adjustments are made when actual amounts are known.
Income Tax Information and Distributions to Shareholders. Each year the Fund intends to qualify as a regulated investment company, including distributing substantially all of its taxable income and realized gains under Subchapter M of the Internal Revenue Code and filing its U.S. federal tax return. As a result, no provision for income taxes is required. As of October 31, 2010, the Fund did not have any unrecognized tax benefits in the accompanying financial statements. A fund's federal tax return is subject to examination by the Internal Revenue Service (IRS) for a period of three years. Foreign taxes are provided for based on the Fund's understanding of the tax rules and rates that exist in the foreign markets in which it invests. The Fund is subject to a tax imposed on short term capital gains on securities of certain issuers domiciled in India. The Fund records an estimated deferred tax liability included in Other payables and accrued expenses in the accompanying Statement of Assets & Liabilities for net unrealized gains on these securities in an amount that would be payable if the securities were disposed of at period end.
Distributions are declared and recorded on the ex-dividend date. Income dividends and capital gain distributions are declared separately for each class. Income and capital gain distributions are determined in accordance with income tax regulations, which may differ from GAAP.
Capital accounts within the financial statements are adjusted for permanent book-tax differences. These adjustments have no impact on net assets or the results of operations. Temporary book-tax differences will reverse in a subsequent period.
Book-tax differences are primarily due to the short-term gain distributions from the Fidelity Central Funds, foreign currency transactions, certain foreign taxes, passive foreign investment companies (PFIC), market discount, capital loss carryforwards and losses deferred due to wash sales.
Annual Report
Notes to Financial Statements - continued
3. Significant Accounting Policies - continued
Income Tax Information and Distributions to Shareholders - continued
The federal tax cost of investment securities and unrealized appreciation (depreciation) as of period end were as follows:
Gross unrealized appreciation | $ 19,156,556 |
Gross unrealized depreciation | (3,573,077) |
Net unrealized appreciation (depreciation) | $ 15,583,479 |
| |
Tax Cost | $ 152,610,684 |
The tax-based components of distributable earnings as of period end were as follows:
Undistributed ordinary income | $ 2,266,112 |
Capital loss carryforward | $ (112,999,916) |
Net unrealized appreciation (depreciation) | $ 15,568,426 |
The tax character of distributions paid was as follows:
| October 31, 2010 | October 31, 2009 |
Ordinary Income | $ 3,667,484 | $ 277,587 |
Short-Term Trading (Redemption) Fees. Shares held by investors in the Fund less than 30 days are subject to a redemption fee equal to 1.00% of the net asset value of shares redeemed. All redemption fees, which reduce the proceeds of the shareholder redemption, are retained by the Fund and accounted for as an addition to paid in capital.
4. Operating Policies.
Delayed Delivery Transactions and When-Issued Securities. The Fund may purchase or sell securities on a delayed delivery or when-issued basis. Payment and delivery may take place after the customary settlement period for that security. The price of the underlying securities and the date when the securities will be delivered and paid for are fixed at the time the transaction is negotiated. During the time a delayed delivery sell is outstanding, the contract is marked-to-market daily and equivalent deliverable securities are held for the transaction. The securities purchased on a delayed delivery or when-issued basis are identified as such in the Fund's Schedule of Investments. The Fund may receive compensation for interest forgone in the purchase of a delayed delivery or when-issued security. With respect to purchase commitments, the Fund identifies securities as segregated in its records with a value at least equal to the amount of the commitment. Losses may arise due to changes in the value of the underlying securities or
Annual Report
4. Operating Policies - continued
Delayed Delivery Transactions and When-Issued Securities - continued
if the counterparty does not perform under the contract's terms, or if the issuer does not issue the securities due to political, economic, or other factors.
Restricted Securities. The Fund may invest in securities that are subject to legal or contractual restrictions on resale. These securities generally may be resold in transactions exempt from registration or to the public if the securities are registered. Disposal of these securities may involve time-consuming negotiations and expense, and prompt sale at an acceptable price may be difficult. Information regarding restricted securities is included at the end of the Fund's Schedule of Investments.
5. Purchases and Sales of Investments.
Purchases and sales of securities, other than short-term securities, aggregated $756,826,118 and $783,847,056, respectively.
6. Fees and Other Transactions with Affiliates.
Management Fee. FMR and its affiliates provide the Fund with investment management related services for which the Fund pays a monthly management fee. The management fee is the sum of an individual fund fee rate that is based on an annual rate of .45% of the Fund's average net assets and a group fee rate that averaged .26% during the period. The group fee rate is based upon the average net assets of all the mutual funds advised by FMR. The group fee rate decreases as assets under management increase and increases as assets under management decrease. In addition, the management fee is subject to a performance adjustment (up to a maximum of ± .20% of the Fund's average net assets over a 36 month performance period). The upward or downward adjustment to the management fee is based on the relative investment performance of the Institutional Class of the Fund, as compared to an appropriate benchmark index. For the period, the total annual management fee rate, including the performance adjustment, was .55% of the Fund's average net assets.
Distribution and Service Plan Fees. In accordance with Rule 12b-1 of the 1940 Act, the Fund has adopted separate Distribution and Service Plans for each class of shares. Certain classes pay Fidelity Distributors Corporation (FDC), an affiliate of FMR, separate Distribution and Service Fees, each of which is based on an annual percentage of each class' average net assets. In addition, FDC may pay financial intermediaries for selling shares of the Fund and providing shareholder support services.
Annual Report
Notes to Financial Statements - continued
6. Fees and Other Transactions with Affiliates - continued
Distribution and Service Plan Fees - continued
For the period, the Distribution and Service Fee rates, total fees and amounts retained by FDC were as follows:
| Distribution
Fee | Service
Fee | Total Fees | Retained
by FDC |
Class A | -% | .25% | $ 114,586 | $ 1,917 |
Class T | .25% | .25% | 366,636 | 757 |
Class B | .75% | .25% | 96,280 | 72,364 |
Class C | .75% | .25% | 244,845 | 11,198 |
| | | $ 822,347 | $ 86,236 |
Sales Load. FDC receives a front-end sales charge of up to 5.75% for selling Class A shares, and 3.50% for selling Class T shares, some of which is paid to financial intermediaries for selling shares of the Fund. FDC receives the proceeds of contingent deferred sales charges levied on Class A, Class T, Class B, and Class C redemptions. These charges depend on the holding period. The deferred sales charges range from 5% to 1% for Class B, 1% for Class C, 1.00% for certain purchases of Class A shares (1.00% to .50% prior to July 12, 2010) and .25% for certain purchases of Class T shares.
For the period, sales charge amounts retained by FDC were as follows:
| Retained
by FDC |
Class A | $ 12,335 |
Class T | 5,598 |
Class B * | 9,591 |
Class C * | 700 |
| 28,224 |
* When Class B and Class C shares are initially sold, FDC pays commissions from its own resources to financial intermediaries through which the sales are made.
Transfer Agent Fees. Fidelity Investments Institutional Operations Company, Inc. (FIIOC), an affiliate of FMR, is the transfer, dividend disbursing and shareholder servicing agent for each class of the Fund. FIIOC receives account fees and asset-based fees that vary according to the account size and type of account of the shareholders of the respective classes of the Fund. FIIOC pays for typesetting, printing and mailing of shareholder reports, except proxy statements.
Annual Report
6. Fees and Other Transactions with Affiliates - continued
Transfer Agent Fees - continued
For the period, transfer agent fees for each class were as follows:
| Amount | % of
Average
Net Assets |
Class A | $ 142,682 | .31 |
Class T | 223,816 | .31 |
Class B | 30,252 | .31 |
Class C | 76,310 | .31 |
Institutional Class | 10,996 | .30 |
| $ 484,056 | |
Accounting and Security Lending Fees. Fidelity Service Company, Inc. (FSC), an affiliate of FMR, maintains the Fund's accounting records. The accounting fee is based on the level of average net assets for the month. Under a separate contract, FSC administers the security lending program. The security lending fee is based on the number and duration of lending transactions.
Brokerage Commissions. The Fund placed a portion of its portfolio transactions with brokerage firms which are affiliates of the investment adviser. The commissions paid to these affiliated firms were $6,564 for the period.
Interfund Lending Program. Pursuant to an Exemptive Order issued by the SEC, the Fund, along with other registered investment companies having management contracts with FMR, may participate in an interfund lending program. This program provides an alternative credit facility allowing the funds to borrow from, or lend money to, other participating affiliated funds. At period end, there were no interfund loans outstanding. The Fund's activity in this program during the period for which loans were outstanding was as follows:
Borrower or Lender | Average Daily
Loan Balance | Weighted Average Interest Rate | Interest
Expense |
Borrower | $ 4,904,700 | .39% | $ 526 |
Annual Report
Notes to Financial Statements - continued
7. Committed Line of Credit.
The Fund participates with other funds managed by FMR or an affiliate in a $3.75 billion credit facility (the "line of credit") to be utilized for temporary or emergency purposes to fund shareholder redemptions or for other short-term liquidity purposes. The Fund has agreed to pay commitment fees on its pro-rata portion of the line of credit, which amounted to $622 and is reflected in Miscellaneous expenses on the Statement of Operations. During the period, there were no borrowings on this line of credit.
8. Security Lending.
The Fund lends portfolio securities through a lending agent from time to time in order to earn additional income. The lending agent may loan securities to certain qualified borrowers, including Fidelity Capital Markets (FCM), a broker-dealer affiliated with the Fund. On the settlement date of the loan, the Fund receives collateral (in the form of U.S. Treasury obligations, letters of credit and/or cash) against the loaned securities and maintains collateral in an amount not less than 100% of the market value of the loaned securities during the period of the loan. The market value of the loaned securities is determined at the close of business of the Fund and any additional required collateral is delivered to the Fund on the next business day. If the borrower defaults on its obligation to return the securities loaned because of insolvency or other reasons, a fund could experience delays and costs in recovering the securities loaned or in gaining access to the collateral. Any cash collateral received is invested in the Fidelity Securities Lending Cash Central Fund. The value of loaned securities and cash collateral at period end are disclosed on the Fund's Statement of Assets and Liabilities. Security lending income represents the income earned on investing cash collateral, less rebates paid to borrowers and lending agent fees associated with the loan, plus any premium payments received for lending certain types of securities. Security lending income is presented in the Statement of Operations as a component of income from Fidelity Central Funds. Total security lending income during the period amounted to $106,588. During the period, there were no securities loaned to FCM.
9. Expense Reductions.
Many of the brokers with whom FMR places trades on behalf of the Fund provided services to the Fund in addition to trade execution. These services included payments of certain expenses on behalf of the Fund totaling $283,831 for the period.
Annual Report
10. Distributions to Shareholders.
Distributions to shareholders of each class were as follows:
Years ended October 31, | 2010 | 2009 |
From net investment income | | |
Class A | $ 383,536 | $ 90,651 |
Class T | 471,584 | 125,926 |
Class B | 36,781 | 16,994 |
Class C | 106,805 | 34,453 |
Institutional Class | 29,272 | 9,563 |
Total | $ 1,027,978 | $ 277,587 |
From net realized gain | | |
Class A | $ 733,929 | $ - |
Class T | 1,218,258 | - |
Class B | 190,036 | - |
Class C | 447,425 | - |
Institutional Class | 49,858 | - |
Total | $ 2,639,506 | $ - |
11. Share Transactions.
Transactions for each class of shares were as follows:
| Shares | Dollars |
Years ended October 31, | 2010 | 2009 | 2010 | 2009 |
Class A | | | | |
Shares sold | 1,168,786 | 1,129,010 | $ 11,452,442 | $ 8,639,569 |
Reinvestment of distributions | 106,693 | 15,048 | 1,040,260 | 84,718 |
Shares redeemed | (1,397,227) | (2,053,924) | (13,480,819) | (14,153,371) |
Net increase (decrease) | (121,748) | (909,866) | $ (988,117) | $ (5,429,084) |
Class T | | | | |
Shares sold | 1,177,459 | 2,801,470 | $ 11,400,103 | $ 19,344,738 |
Reinvestment of distributions | 172,890 | 22,238 | 1,656,289 | 122,972 |
Shares redeemed | (2,898,040) | (3,476,400) | (27,789,326) | (24,109,988) |
Net increase (decrease) | (1,547,691) | (652,692) | $ (14,732,934) | $ (4,642,278) |
Class B | | | | |
Shares sold | 77,104 | 121,733 | $ 688,128 | $ 814,350 |
Reinvestment of distributions | 23,836 | 2,955 | 212,377 | 15,248 |
Shares redeemed | (465,893) | (638,553) | (4,121,865) | (4,025,209) |
Net increase (decrease) | (364,953) | (513,865) | $ (3,221,360) | $ (3,195,611) |
Class C | | | | |
Shares sold | 282,999 | 347,098 | $ 2,536,029 | $ 2,336,196 |
Reinvestment of distributions | 55,698 | 5,910 | 495,715 | 30,494 |
Shares redeemed | (703,110) | (1,042,577) | (6,197,225) | (6,402,136) |
Net increase (decrease) | (364,413) | (689,569) | $ (3,165,481) | $ (4,035,446) |
Annual Report
Notes to Financial Statements - continued
11. Share Transactions - continued
| Shares | Dollars |
Years ended October 31, | 2010 | 2009 | 2010 | 2009 |
Institutional Class | | | | |
Shares sold | 151,567 | 52,991 | $ 1,532,760 | $ 417,607 |
Reinvestment of distributions | 5,962 | 1,321 | 61,704 | 7,870 |
Shares redeemed | (113,282) | (257,103) | (1,140,202) | (2,037,197) |
Net increase (decrease) | 44,247 | (202,791) | $ 454,262 | $ (1,611,720) |
12. Other.
The Fund's organizational documents provide former and current trustees and officers with a limited indemnification against liabilities arising in connection with the performance of their duties to the Fund. In the normal course of business, the Fund may also enter into contracts that provide general indemnifications. The Fund's maximum exposure under these arrangements is unknown as this would be dependent on future claims that may be made against the Fund. The risk of material loss from such claims is considered remote.
Annual Report
To the Trustees of Fidelity Advisor Series VIII and Shareholders of Fidelity Advisor International Capital Appreciation Fund:
We have audited the accompanying statement of assets and liabilities of Fidelity Advisor International Capital Appreciation Fund (the Fund), a fund of Fidelity Advisor Series VIII, including the schedule of investments, as of October 31, 2010, and the related statement of operations for the year then ended, the statement of changes in net assets for each of the two years in the period then ended, and the financial highlights for each of the five years in the period then ended. These financial statements and financial highlights are the responsibility of the Fund's management. Our responsibility is to express an opinion on these financial statements and financial highlights based on our audits.
We conducted our audits in accordance with standards of the Public Company Accounting Oversight Board (United States). Those standards require that we plan and perform the audit to obtain reasonable assurance about whether the financial statements and financial highlights are free of material misstatement. The Fund is not required to have, nor were we engaged to perform, an audit of its internal control over financial reporting. Our audits included consideration of internal control over financial reporting as a basis for designing audit procedures that are appropriate in the circumstances, but not for the purpose of expressing an opinion on the effectiveness of the Fund's internal control over financial reporting. Accordingly, we express no such opinion. An audit also includes examining, on a test basis, evidence supporting the amounts and disclosures in the financial statements, assessing the accounting principles used and significant estimates made by management, as well as evaluating the overall financial statement presentation. Our procedures included confirmation of securities owned as of October 31, 2010, by correspondence with the custodian and brokers; where replies were not received from brokers, we performed other auditing procedures. We believe that our audits provide a reasonable basis for our opinion.
In our opinion, the financial statements and financial highlights referred to above present fairly, in all material respects, the financial position of Fidelity Advisor International Capital Appreciation Fund as of October 31, 2010, the results of its operations for the year then ended, the changes in its net assets for each of the two years in the period then ended, and its financial highlights for each of the five years in the period then ended, in conformity with accounting principles generally accepted in the United States of America.
/s/ Deloitte & Touche LLP
DELOITTE & TOUCHE LLP
Boston, Massachusetts
December 13, 2010
Annual Report
The Trustees, Member of the Advisory Board, and executive officers of the trust and fund, as applicable, are listed below. The Board of Trustees governs the fund and is responsible for protecting the interests of shareholders. The Trustees are experienced executives who meet periodically throughout the year to oversee the fund's activities, review contractual arrangements with companies that provide services to the fund, oversee management of the risks associated with such activities and contractual arrangements, and review the fund's performance. Except for James C. Curvey, each of the Trustees oversees 221 funds advised by FMR or an affiliate. Mr. Curvey oversees 410 funds advised by FMR or an affiliate.
The Trustees hold office without limit in time except that (a) any Trustee may resign; (b) any Trustee may be removed by written instrument, signed by at least two-thirds of the number of Trustees prior to such removal; (c) any Trustee who requests to be retired or who has become incapacitated by illness or injury may be retired by written instrument signed by a majority of the other Trustees; and (d) any Trustee may be removed at any special meeting of shareholders by a two-thirds vote of the outstanding voting securities of the trust. Each Trustee who is not an interested person (as defined in the 1940 Act) (Independent Trustee), shall retire not later than the last day of the calendar year in which his or her 72nd birthday occurs. The Independent Trustees may waive this mandatory retirement age policy with respect to individual Trustees. The executive officers and Advisory Board Member hold office without limit in time, except that any officer and Advisory Board Member may resign or may be removed by a vote of a majority of the Trustees at any regular meeting or any special meeting of the Trustees. Except as indicated, each individual has held the office shown or other offices in the same company for the past five years.
Experience, Skills, Attributes, and Qualifications of the Fund's Trustees. The Governance and Nominating Committee has adopted a statement of policy that describes the experience, qualifications, attributes, and skills that are necessary and desirable for potential Independent Trustee candidates (Statement of Policy). The Board believes that each Trustee satisfied at the time he or she was initially elected or appointed a Trustee, and continues to satisfy, the standards contemplated by the Statement of Policy. The Governance and Nominating Committee also engages professional search firms to help identify potential Independent Trustee candidates who have the experience, qualifications, attributes, and skills consistent with the Statement of Policy. From time to time, additional criteria based on the composition and skills of the current Independent Trustees, as well as experience or skills that may be appropriate in light of future changes to board composition, business conditions, and regulatory or other developments, have also been considered by the professional search firms and the Governance and Nominating Committee. In addition, the Board takes into account the Trustees' commitment and participation in Board and committee meetings, as well as their leadership of standing and ad hoc committees throughout their tenure.
In determining that a particular Trustee was and continues to be qualified to serve as a Trustee, the Board has considered a variety of criteria, none of which, in isolation, was controlling. The Board believes that, collectively, the Trustees have balanced and diverse experience, qualifications, attributes, and skills, which allow the Board to operate effectively in governing the fund and protecting the interests of shareholders. Information about the specific experience, skills, attributes, and qualifications of each Trustee, which in each case led to the Board's conclusion that the Trustee should serve (or continue to serve) as a trustee of the fund, is provided below.
Annual Report
Board Structure and Oversight Function. Edward C. Johnson 3d is an interested person (as defined in the 1940 Act) and currently serves as Chairman. The Trustees have determined that an interested Chairman is appropriate and benefits shareholders because an interested Chairman has a personal and professional stake in the quality and continuity of services provided to the fund. Independent Trustees exercise their informed business judgment to appoint an individual of their choosing to serve as Chairman, regardless of whether the Trustee happens to be independent or a member of management. The Independent Trustees have determined that they can act independently and effectively without having an Independent Trustee serve as Chairman and that a key structural component for assuring that they are in a position to do so is for the Independent Trustees to constitute a substantial majority for the Board. The Independent Trustees also regularly meet in executive session. Ned C. Lautenbach serves as Chairman of the Independent Trustees and as such (i) acts as a liaison between the Independent Trustees and management with respect to matters important to the Independent Trustees and (ii) with management prepares agendas for Board meetings.
Fidelity funds are overseen by different Boards of Trustees. The fund's Board oversees Fidelity's equity and high income funds and another Board oversees Fidelity's investment-grade bond, money market, and asset allocation funds. The asset allocation funds may invest in Fidelity funds overseen by the fund's Board. The use of separate Boards, each with its own committee structure, allows the Trustees of each group of Fidelity funds to focus on the unique issues of the funds they oversee, including common research, investment, and operational issues. On occasion, the separate Boards establish joint committees to address issues of overlapping consequences for the Fidelity funds overseen by each Board.
The Trustees operate using a system of committees to facilitate the timely and efficient consideration of all matters of importance to the Trustees, the fund, and fund shareholders and to facilitate compliance with legal and regulatory requirements and oversight of the fund's activities and associated risks. The Board, acting through its committees, has charged FMR and its affiliates with (i) identifying events or circumstances the occurrence of which could have demonstrably adverse effects on the fund's business and/or reputation; (ii) implementing processes and controls to lessen the possibility that such events or circumstances occur or to mitigate the effects of such events or circumstances if they do occur; and (iii) creating and maintaining a system designed to evaluate continuously business and market conditions in order to facilitate the identification and implementation processes described in (i) and (ii) above. Because the day-to-day operations and activities of the fund are carried out by or through FMR, its affiliates and other service providers, the fund's exposure to risks is mitigated but not eliminated by the processes overseen by the Trustees. While each of the Board's committees has responsibility for overseeing different aspects of the fund's activities, oversight is exercised primarily through the Operations, Audit, and Compliance Committees. Appropriate personnel, including but not limited to the fund's Chief Compliance Officer (CCO), FMR's internal auditor, the independent accountants, the fund's Treasurer and portfolio management personnel, make periodic reports to the Board's committees, as appropriate. The responsibilities of each committee, including their oversight responsibilities, are described further under "Standing Committees of the Fund's Trustees."
Annual Report
Trustees and Officers - continued
The fund's Statement of Additional Information (SAI) includes more information about the Trustees. To request a free copy, call Fidelity at 1-877-208-0098.
Interested Trustees*:
Correspondence intended for each Trustee who is an interested person may be sent to Fidelity Investments, 82 Devonshire Street, Boston, Massachusetts 02109.
Name, Age; Principal Occupations and Other Relevant Experience+ |
Edward C. Johnson 3d (80) |
| Year of Election or Appointment: 1983 Mr. Johnson is Trustee and Chairman of the Board of Trustees of certain Trusts. Mr. Johnson serves as Chief Executive Officer, Chairman, and a Director of FMR LLC; Chairman and a Director of FMR; Chairman and a Director of Fidelity Research & Analysis Company (FRAC); Chairman and a Director of Fidelity Investments Money Management, Inc.; and Chairman and a Director of FMR Co., Inc. In addition, Mr. Johnson serves as Chairman and Director of FIL Limited. Previously, Mr. Johnson served as President of FMR LLC (2006-2007). |
James C. Curvey (75) |
| Year of Election or Appointment: 2007 Mr. Curvey also serves as Trustee (2007-present) of other investment companies advised by FMR. Mr. Curvey is a Director of Fidelity Investments Money Management, Inc. (2009-present), Director of Fidelity Research & Analysis Co. (2009-present) and Director of FMR and FMR Co., Inc. (2007-present). Mr. Curvey is also Vice Chairman (2007-present) and Director of FMR LLC. In addition, Mr. Curvey serves as an Overseer for the Boston Symphony Orchestra and a member of the Trustees of Villanova University. Previously, Mr. Curvey was the Vice Chairman (2006-2007) and Director (2000-2007) of FMR Corp. |
* Trustees have been determined to be "Interested Trustees" by virtue of, among other things, their affiliation with the trust or various entities under common control with FMR.
Annual Report
+ The information above includes each Trustee's principal occupation during the last five years and other information relating to the experience, attributes, and skills relevant to each Trustee's qualifications to serve as a Trustee, which led to the conclusion that each Trustee should serve as a Trustee for the fund.
Independent Trustees:
Correspondence intended for each Independent Trustee (that is, the Trustees other than the Interested Trustees) may be sent to Fidelity Investments, P.O. Box 55235, Boston, Massachusetts 02205-5235.
Name, Age; Principal Occupations and Other Relevant Experience+ |
Dennis J. Dirks (62) |
| Year of Election or Appointment: 2005 Prior to his retirement in May 2003, Mr. Dirks was Chief Operating Officer and a member of the Board of The Depository Trust & Clearing Corporation (DTCC). He also served as President, Chief Operating Officer, and Board member of The Depository Trust Company (DTC) and President and Board member of the National Securities Clearing Corporation (NSCC). In addition, Mr. Dirks served as Chief Executive Officer and Board member of the Government Securities Clearing Corporation, Chief Executive Officer and Board member of the Mortgage-Backed Securities Clearing Corporation, as a Trustee and a member of the Finance Committee of Manhattan College (2005-2008), and as a Trustee and a member of the Finance Committee of AHRC of Nassau County (2006-2008). Mr. Dirks is a member of the Independent Directors Council (IDC) Governing Council (2010-Present) and Board of Directors for The Brookville Center for Children's Services, Inc. (2009-present). |
Alan J. Lacy (57) |
| Year of Election or Appointment: 2008 Mr. Lacy serves as Senior Adviser (2007-present) of Oak Hill Capital Partners, L.P. (private equity). Mr. Lacy also served as Chief Executive Officer (2000-2005) and Vice Chairman (2005-2006) of Sears Holdings Corporation and Sears, Roebuck and Co. (retail). In addition, Mr. Lacy serves as a member of the Board of Directors of The Western Union Company (global money transfer, 2006-present) and Bristol-Myers Squibb Company (global pharmaceuticals, 2007-present). Mr. Lacy is Chairman (2008-present) and a member (2006-present) of the Board of Trustees of The National Parks Conservation Association. |
Ned C. Lautenbach (66) |
| Year of Election or Appointment: 2000 Mr. Lautenbach is Chairman of the Independent Trustees of the Equity and High Income Funds (2006-present). Mr. Lautenbach currently serves as the Lead Director of the Eaton Corporation Board of Directors (diversified industrial, 1997-present). Mr. Lautenbach is also a member of the Board of Directors of the Philharmonic Center for the Arts in Naples, Florida (1999-present); a member of the Board of Trustees of Fairfield University (2005-present); and a member of the Council on Foreign Relations (1994-present). Previously, Mr. Lautenbach was a Partner/Advisory Partner at Clayton, Dubilier & Rice, Inc. (private equity investment, 1998-2010), as well as a Director of Sony Corporation (2006-2007). |
Joseph Mauriello (66) |
| Year of Election or Appointment: 2008 Prior to his retirement in January 2006, Mr. Mauriello served in numerous senior management positions including Deputy Chairman and Chief Operating Officer (2004-2005), and Vice Chairman of Financial Services (2002-2004) of KPMG LLP US (professional services, 1965-2005). Mr. Mauriello currently serves as a member of the Board of Directors of XL Group plc. (global insurance and re-insurance, 2006-present) and of Arcadia Resources Inc. (health care services and products, 2007-present). Previously, Mr. Mauriello served as a Director of the Hamilton Funds of the Bank of New York (2006-2007). |
Cornelia M. Small (66) |
| Year of Election or Appointment: 2005 Ms. Small is a member of the Board of Directors of the Teagle Foundation (2009-present). Ms. Small is also a member of the Investment Committee, and Chair (2008-present) and a member of the Board of Trustees of Smith College. In addition, Ms. Small serves on the Investment Committee of the Berkshire Taconic Community Foundation (2008-present). Previously, Ms. Small served as Chairperson of the Investment Committee (2002-2008) of Smith College. In addition, Ms. Small served as Chief Investment Officer, Director of Global Equity Investments, and a member of the Board of Directors of Scudder, Stevens & Clark and Scudder Kemper Investments. |
William S. Stavropoulos (71) |
| Year of Election or Appointment: 2001 Mr. Stavropoulos is Vice Chairman of the Independent Trustees of the Equity and High Income Funds (2006-present). Mr. Stavropoulos serves as President and Founder of the Michigan Baseball Foundation, the Great Lakes Loons (2007-present). Mr. Stavropoulos is Chairman Emeritus of the Board of Directors of The Dow Chemical Company, where he previously served in numerous senior management positions, including President, CEO (1995-2000; 2002-2004), Chairman of the Executive Committee (2000-2006), and as a member of the Board of Directors (1990-2006). Currently, Mr. Stavropoulos is Chairman of Univar (global distributor of commodity and specialty chemicals, 2010-present), a Director of Teradata Corporation (data warehousing and technology solutions, 2008-present), Chemical Financial Corporation, Maersk Inc. (industrial conglomerate), Tyco International, Inc. (multinational manufacturing and services, 2007-present), and a member of the Advisory Board for Metalmark Capital (private equity investment, 2005-present). Mr. Stavropoulos is a special advisor to Clayton, Dubilier & Rice, Inc. (private equity investment). In addition, Mr. Stavropoulos is a member of the University of Notre Dame Advisory Council for the College of Science. |
David M. Thomas (61) |
| Year of Election or Appointment: 2008 Previously, Mr. Thomas served as Executive Chairman (2005-2006) and Chairman and Chief Executive Officer (2000-2005) of IMS Health, Inc. (pharmaceutical and healthcare information solutions). In addition, Mr. Thomas serves as a member of the Board of Directors of Fortune Brands, Inc. (consumer products), and Interpublic Group of Companies, Inc. (marketing communication, 2004-present). |
Michael E. Wiley (60) |
| Year of Election or Appointment: 2008 Mr. Wiley also serves as a Director of Asia Pacific Exploration Consolidated (international oil and gas exploration and production, 2008-present). Mr. Wiley serves as a Director of Tesoro Corporation (independent oil refiner and marketer, 2005-present), and a Director of Bill Barrett Corporation (exploration and production, 2005-present). In addition, Mr. Wiley also serves as a Director of Post Oak Bank (privately-held bank, 2004-present). Previously, Mr. Wiley served as a member of the Board of Trustees of the University of Tulsa (2000-2006; 2007-2010), as a Senior Energy Advisor of Katzenbach Partners, LLC (consulting, 2006-2007), as an Advisory Director of Riverstone Holdings (private investment), Chairman, President, and CEO of Baker Hughes, Inc. (oilfield services, 2000-2004), and as Director of Spinnaker Exploration Company (exploration and production, 2001-2005). |
Annual Report
Trustees and Officers - continued
+ The information above includes each Trustee's principal occupation during the last five years and other information relating to the experience, attributes, and skills relevant to each Trustee's qualifications to serve as a Trustee, which led to the conclusion that each Trustee should serve as a Trustee for the fund.
Advisory Board Member and Executive Officers:
Correspondence intended for each executive officer and Peter S. Lynch may be sent to Fidelity Investments, 82 Devonshire Street, Boston, Massachusetts 02109.
Name, Age; Principal Occupation |
Peter S. Lynch (66) |
| Year of Election or Appointment: 2003 Member of the Advisory Board of Fidelity's Equity and High Income Funds. Mr. Lynch is Vice Chairman and a Director of FMR and FMR Co., Inc. In addition, Mr. Lynch serves as a Trustee of Boston College and as the Chairman of the Inner-City Scholarship Fund. Previously, Mr. Lynch served on the Special Olympics International Board of Directors (1997-2006). |
Kenneth B. Robins (41) |
| Year of Election or Appointment: 2008 President and Treasurer of Fidelity's Equity and High Income Funds. Mr. Robins also serves as President and Treasurer (2010-present) and Assistant Treasurer (2009-present) of other Fidelity funds and is an employee of Fidelity Investments (2004-present). Previously, Mr. Robins served as Deputy Treasurer of the Fidelity funds (2005-2008) and Treasurer and Chief Financial Officer of The North Carolina Capital Management Trust: Cash and Term Portfolios (2006-2008). |
Bruce T. Herring (45) |
| Year of Election or Appointment: 2006 Vice President of certain Equity Funds. Mr. Herring also serves as Chief Investment Officer and Director of Fidelity Management & Research (U.K.) Inc. (2010-present) and Group Chief Investments Officer of FMR. Previously, Mr. Herring served as Vice President (2005-2006) and Senior Vice President (2006-2007) of Fidelity Management & Research Company, Vice President of FMR Co., Inc. (2001-2007) and as a portfolio manager for Fidelity U.S. Equity Funds. |
Brian B. Hogan (46) |
| Year of Election or Appointment: 2009 Vice President of certain Equity Funds and Vice President of Sector Funds. Mr. Hogan also serves as President of FMR's Equity Division (2009-present). Previously, Mr. Hogan served as Senior Vice President, Equity Research of FMR (2006-2009) and as a portfolio manager. |
Scott C. Goebel (42) |
| Year of Election or Appointment: 2008 Secretary and Chief Legal Officer (CLO) of the Fidelity funds. Mr. Goebel also serves as Secretary and CLO of The North Carolina Capital Management Trust: Cash and Term Portfolio (2008-present); General Counsel, Secretary, and Senior Vice President of FMR (2008-present) and FMR Co., Inc. (2008-present); Deputy General Counsel of FMR LLC; Chief Legal Officer of Fidelity Management & Research (Hong Kong) Limited (2008-present) and Assistant Secretary of Fidelity Management & Research (Japan) Inc. (2008-present), Fidelity Investments Money Management, Inc. (2008-present), Fidelity Management & Research (U.K.) Inc. (2008-present), and Fidelity Research and Analysis Company (2008-present). Previously, Mr. Goebel served as Assistant Secretary of the Funds (2007-2008) and as Vice President and Secretary of Fidelity Distributors Corporation (FDC) (2005-2007). |
William C. Coffey (41) |
| Year of Election or Appointment: 2009 Assistant Secretary of Fidelity's Equity and High Income Funds. Mr. Coffey also serves as Senior Vice President and Deputy General Counsel of FMR LLC (2010-present), and is an employee of Fidelity Investments. Previously, Mr. Coffey served as Vice President and Associate General Counsel of FMR LLC (2005-2009). |
Holly C. Laurent (56) |
| Year of Election or Appointment: 2008 Anti-Money Laundering (AML) Officer of the Fidelity funds. Ms. Laurent also serves as AML Officer of The North Carolina Capital Management Trust: Cash and Term Portfolio (2008-present) and is an employee of Fidelity Investments. Previously, Ms. Laurent was Senior Vice President and Head of Legal for Fidelity Business Services India Pvt. Ltd. (2006-2008), and Senior Vice President, Deputy General Counsel and Group Head for FMR LLC (2005-2006). |
Christine Reynolds (52) |
| Year of Election or Appointment: 2008 Chief Financial Officer of the Fidelity funds. Ms. Reynolds became President of Fidelity Pricing and Cash Management Services (FPCMS) in August 2008. Ms. Reynolds served as Chief Operating Officer of FPCMS (2007-2008). Previously, Ms. Reynolds served as President, Treasurer, and Anti-Money Laundering officer of the Fidelity funds (2004-2007). |
Kenneth A. Rathgeber (63) |
| Year of Election or Appointment: 2004 Chief Compliance Officer of Fidelity's Equity and High Income Funds. Mr. Rathgeber is Chief Compliance Officer of Fidelity Management & Research (Hong Kong) Limited (2008-present), Fidelity Management & Research (Japan) Inc. (2008-present), FMR (2005-present), FMR Co., Inc. (2005-present), Fidelity Management & Research (U.K.) Inc. (2005-present), Fidelity Research & Analysis Company (2005-present), Fidelity Investments Money Management, Inc. (2005-present), Pyramis Global Advisors, LLC (2005-present), and Strategic Advisers, Inc. (2005-present). |
Jeffrey S. Christian (49) |
| Year of Election or Appointment: 2009 Deputy Treasurer of the Fidelity funds. Mr. Christian is an employee of Fidelity Investments. Previously, Mr. Christian served as Chief Financial Officer (2008-2009) of certain Fidelity funds and Senior Vice President of Fidelity Pricing and Cash Management Services (FPCMS) (2004-2009). |
Bryan A. Mehrmann (49) |
| Year of Election or Appointment: 2005 Deputy Treasurer of the Fidelity funds. Mr. Mehrmann is an employee of Fidelity Investments. |
Adrien E. Deberghes (43) |
| Year of Election or Appointment: 2008 Deputy Treasurer of Fidelity's Equity and High Income Funds. Mr. Deberghes also serves as Assistant Treasurer of other Fidelity funds (2010-present) and is an employee of Fidelity Investments (2008-present). Previously, Mr. Deberghes served as Senior Vice President of Mutual Fund Administration at State Street Corporation (2007-2008), Senior Director of Mutual Fund Administration at Investors Bank & Trust (2005-2007), and Director of Finance for Dunkin' Brands (2000-2005). |
Stephanie J. Dorsey (41) |
| Year of Election or Appointment: 2010 Assistant Treasurer of Fidelity's Equity and High Income Funds. Ms. Dorsey also serves as Deputy Treasurer of other Fidelity funds (2008-present) and is an employee of Fidelity Investments (2008-present). Previously, Ms. Dorsey served as Treasurer (2004-2008) of the JPMorgan Mutual Funds and Vice President (2004-2008) of JPMorgan Chase Bank. |
John R. Hebble (52) |
| Year of Election or Appointment: 2009 Assistant Treasurer of Fidelity's Equity and High Income Funds. Mr. Hebble also serves as Treasurer and Chief Financial Officer of The North Carolina Capital Management Trust: Cash and Term Portfolio (2008-present), President and Treasurer of other Fidelity funds (2008-present) and is an employee of Fidelity Investments. |
Gary W. Ryan (52) |
| Year of Election or Appointment: 2005 Assistant Treasurer of the Fidelity funds. Mr. Ryan is an employee of Fidelity Investments. Previously, Mr. Ryan served as Vice President of Fund Reporting in Fidelity Pricing and Cash Management Services (FPCMS) (1999-2005). |
Jonathan Davis (42) |
| Year of Election or Appointment: 2010 Assistant Treasurer of the Fidelity funds. Mr. Davis is an employee of Fidelity Investments. Previously, Mr. Davis served as Vice President and Associate General Counsel of FMR LLC (2003-2010). |
Annual Report
The Board of Trustees of Fidelity Advisor International Capital Appreciation Fund voted to pay to shareholders of record at the opening of business on record date, the following distributions per share derived from capital gains realized from sales of portfolio securities, and dividends derived from net investment income:
| Pay Date | Record Date | Dividends | Capital Gains |
Institutional Class | 12/06/10 | 12/03/10 | $0.095 | $0.116 |
Institutional Class designates 36% of the dividend distributed during the fiscal year as amounts which may be taken into account as a dividend for purposes of the maximum rate under section 1(h)(11) of the Internal Revenue Code.
The amounts per share which represent income derived from sources within, and taxes paid to, foreign countries or possessions of the United States are as follows:
| Pay Date | Income | Taxes |
Institutional Class | 12/07/09 | $0.1453 | $0.0219 |
The fund will notify shareholders in January 2011 of amounts for use in preparing 2010 income tax returns.
Annual Report
Board Approval of Investment Advisory Contracts and Management Fees
Fidelity Advisor International Capital Appreciation Fund
Each year, the Board of Trustees, including the Independent Trustees (together, the Board), votes on the renewal of the management contract and sub-advisory agreements (together, the Advisory Contracts) for the fund. The Board, assisted by the advice of fund counsel and Independent Trustees' counsel, requests and considers a broad range of information relevant to the renewal of the Advisory Contracts throughout the year.
The Board meets regularly and considers at each of its meetings factors that are relevant to its annual consideration of the renewal of the fund's Advisory Contracts, including the services and support provided to the fund and its shareholders. The Board has established various standing committees, each composed of Independent Trustees with varying backgrounds, to which the Board has assigned specific subject matter responsibilities in order to enhance effective decision-making by the Board. The Board, acting directly and through its Committees, requests and receives information concerning the annual consideration of the renewal of the fund's Advisory Contracts. The Board also meets as needed to consider matters specifically related to the Board's annual consideration of the renewal of Advisory Contracts. Members of the Board may also meet with trustees of other Fidelity funds through ad hoc joint committees to discuss certain matters relevant to the Fidelity funds.
At its July 2010 meeting, the Board of Trustees, including the Independent Trustees, unanimously determined to renew the fund's Advisory Contracts. In reaching its determination, the Board considered all factors it believed relevant, including (i) the nature, extent, and quality of the services to be provided to the fund and its shareholders (including the investment performance of the fund); (ii) the competitiveness of the fund's management fee and total expenses; (iii) the total costs of the services to be provided by and the profits to be realized by Fidelity from its relationship with the fund; (iv) the extent to which economies of scale would be realized as the fund grows; and (v) whether fee levels reflect these economies of scale, if any, for the benefit of fund shareholders.
In considering whether to renew the Advisory Contracts for the fund, the Board reached a determination, with the assistance of fund counsel and Independent Trustees' counsel and through the exercise of its business judgment, that the renewal of the Advisory Contracts is in the best interests of fund shareholders and that the compensation to be received by Fidelity under the management contract is fair and reasonable. The Board's decision to renew the Advisory Contracts was not based on any single factor noted above, but rather was based on a comprehensive consideration of all the information provided to the Board at its meetings throughout the year. The Board, in reaching its determination to renew the Advisory Contracts, is aware that shareholders in the fund have a broad range of investment choices available to them, including a wide choice among mutual funds offered by Fidelity's competitors, and that the fund's shareholders, with the opportunity to review and weigh the disclosure provided by the fund in its prospectus and other public disclosures, have chosen to invest in this fund, managed by Fidelity.
Annual Report
Nature, Extent, and Quality of Services Provided. The Board considered the staffing within the investment adviser, FMR, and the sub-advisers (together, the Investment Advisers), including the backgrounds of the fund's investment personnel and the fund's investment objective and discipline. The Independent Trustees also had discussions with senior management of Fidelity's investment operations and investment groups. The Board considered the structure of the portfolio manager compensation program and whether this structure provides appropriate incentives to act in the best interest of the fund.
Resources Dedicated to Investment Management and Support Services. The Board and the equity research subcommittee of the Board's Fund Oversight Committee reviewed the size, education, and experience of the Investment Advisers' investment staff, their use of technology, and the Investment Advisers' approach to recruiting, training, and retaining portfolio managers and other research, advisory, and management personnel. The Board noted that Fidelity's analysts have access to a variety of technological tools and market and securities data that enable them to perform both fundamental and quantitative analysis and to specialize in various disciplines. The Board considered Fidelity's extensive global research capabilities that enable the Investment Advisers to aggregate data from various sources in an effort to produce positive investment results. The Board also considered that Fidelity's portfolio managers and analysts have access to daily portfolio attribution that allows for monitoring of a fund's portfolio, as well as an electronic communication system that provides immediate real-time access to research concerning issuers and credit enhancers. The Board noted FMR's continued focus on strengthening the organization and discipline of equity portfolio management and research.
Shareholder and Administrative Services. The Board considered (i) the nature, extent, quality, and cost of advisory, administrative, and shareholder services performed by the Investment Advisers and their affiliates under the Advisory Contracts and under separate agreements covering transfer agency, pricing and bookkeeping, and securities lending services for the fund; (ii) the nature and extent of the investment adviser's supervision of third party service providers, principally custodians and subcustodians; and (iii) the resources devoted to, and the record of compliance with, the fund's compliance policies and procedures. The Board also reviewed the allocation of fund brokerage, including allocations to brokers affiliated with the Investment Advisers, the use of brokerage commissions to pay fund expenses, and the use of "soft" commission dollars to pay for research services.
The Board noted that the growth of fund assets over time across the complex allows Fidelity to reinvest in the development of services designed to enhance the value or convenience of the Fidelity funds as investment vehicles. These services include 24-hour access to account information and market information through phone representatives and over the Internet, and investor education materials and asset allocation tools.
Annual Report
Board Approval of Investment Advisory Contracts and
Management Fees - continued
Investment in a Large Fund Family. The Board considered the benefits to shareholders of investing in a Fidelity fund, including the benefits of investing in a fund that is part of a large family of funds offering a variety of investment disciplines and providing a large variety of mutual fund investor services. The Board noted that Fidelity had taken, or had made recommendations that resulted in the Fidelity funds taking, a number of actions over the previous year that benefited particular funds, including (i) dedicating additional resources to investment research and restructuring and broadening the focus of the investment research teams; (ii) bolstering the senior management team that oversees asset management; (iii) launching Class F of certain funds as a lower-fee class available to Freedom K and Freedom Index Funds; (iv) lowering the initial investment minimums and ongoing balance requirements for Real Estate High Income Fund; (v) eliminating subsequent purchase minimums for all funds and adding a waiver of the investment minimum requirement for new accounts opened with the proceeds of a systematic withdrawal plan; (vi) eliminating the withdrawal minimum and maximum limits for systematic withdrawals from Advisor funds; (vii) expanding sales load waivers on Class A shares for Destiny Planholders and expanding Institutional Class eligibility for Class O Destiny Planholders; and (viii) changing certain Class A and Class T sales charge structures to further align them with industry practices.
Investment Performance. The Board considered whether the fund has operated in accordance with its investment objective, as well as its record of compliance with its investment restrictions. It also reviewed the fund's absolute investment performance for each class, as well as the fund's relative investment performance for each class measured over multiple periods against (i) a broad-based securities market index, and (ii) a custom peer group of mutual funds deemed appropriate by Fidelity and reviewed by the Board. The following charts considered by the Board show, over the one-, three-, and five-year periods ended December 31, 2009, the cumulative total returns of Institutional Class (Class I) and Class B of the fund, the cumulative total returns of a broad-based securities market index ("benchmark"), and a range of cumulative total returns of a custom peer group of mutual funds defined by FMR based on categories assigned by Morningstar, Inc. The returns of Institutional Class (Class I) and Class B show the performance of the highest and lowest performing classes, respectively (based on five-year performance). The box within each chart shows the 25th percentile return (bottom of box) and the 75th percentile return (top of box) of the peer group. Returns shown above the box are in the first quartile and returns shown below the box are in the fourth quartile. The percentage beaten numbers noted below each chart correspond to the percentile box and represent the percentage of funds in the peer group whose performance was equal to or lower than that of the class indicated. The fund's custom peer group, defined by FMR, is a peer group that FMR believes provides a more meaningful performance comparison than the peer group assigned by Morningstar, Inc., which assigns mutual funds to categories based on their investment styles as measured by their underlying portfolio holdings.
Annual Report
Fidelity Advisor International Capital Appreciation Fund
The Board reviewed the fund's relative investment performance against its peer group and noted that the performance of Institutional Class (Class I) of the fund was in the first quartile for the one-year period, the third quartile for the three-year period, and the fourth quartile for the five-year period. The Board also noted that the investment performance of the fund was lower than its benchmark for the three- and five-year periods, although the one-year cumulative total return of Institutional Class (Class I) compared favorably to its benchmark. The Board considered that the variations in performance among the fund's classes reflect the variations in class expenses, which result in lower performance for higher expense classes. The Board also reviewed the fund's performance since inception as well as performance in the current year.
The Board also considered that the fund's management fee is subject to upward or downward adjustment depending upon whether, and to what extent, the fund's investment performance for the performance period exceeds, or is exceeded by, the record (over the same period) of a Board-approved performance adjustment index. The Board realizes that the performance adjustment provides FMR with a strong economic incentive to seek to achieve superior performance for the fund's shareholders and helps to more closely align the interests of FMR and the fund's shareholders.
Annual Report
Board Approval of Investment Advisory Contracts and
Management Fees - continued
Based on its review, and giving particular weight to the nature and quality of the resources dedicated by the Investment Advisers to maintain and improve relative performance and factoring in the unprecedented market events in recent years, the Board concluded that the nature, extent, and quality of investment management and support services and of shareholder and administrative services provided to the fund will benefit the fund's shareholders, particularly in light of the Board's view that the fund's shareholders benefit from investing in a fund that is part of a large family of funds offering a variety of investment disciplines and services.
Competitiveness of Management Fee and Total Fund Expenses. The Board considered the fund's management fee and total expenses compared to "mapped groups" of competitive funds and classes. Fidelity creates "mapped groups" by combining similar Lipper investment objective categories that have comparable management fee characteristics. Combining Lipper investment objective categories aids the Board's management fee and total expense comparisons by broadening the competitive group used for comparison and by reducing the number of universes to which various Fidelity funds are compared.
Management Fee. The Board considered two proprietary management fee comparisons for the 12-month periods shown in the chart below. The group of Lipper funds used by the Board for management fee comparisons is referred to below as the "Total Mapped Group." The Total Mapped Group comparison focuses on a fund's standing relative to the total universe of comparable funds available to investors, in terms of gross management fees before expense reimbursements or caps, and without giving effect to the fund's performance adjustment. "TMG %" represents the percentage of funds in the Total Mapped Group that had management fees that were lower than the fund's. For example, a TMG % of 15% means that 85% of the funds in the Total Mapped Group had higher management fees than the fund. The "Asset-Size Peer Group" (ASPG) comparison focuses on a fund's standing relative to non-Fidelity funds similar in size to the fund within the Total Mapped Group. The ASPG represents at least 15% of the funds in the Total Mapped Group with comparable asset size and management fee characteristics, subject to a minimum of 50 funds (or all funds in the Total Mapped Group if fewer than 50). Additional information, such as the ASPG quartile in which the fund's management fee ranked and the impact of the fund's performance adjustment, is also included in the chart and considered by the Board.
Annual Report
Fidelity Advisor International Capital Appreciation Fund
The Board noted that the fund's management fee ranked below the median of its Total Mapped Group and below the median of its ASPG for 2009. The Board also noted the effect of the fund's negative performance adjustment on the fund's management fee ranking. The Board noted that the performance adjustment for each year represents calculations for performance periods that differ from the periods shown in the performance charts above.
Based on its review, the Board concluded that the fund's management fee is fair and reasonable in light of the services that the fund receives and the other factors considered.
Total Expenses. In its review of each class's total expenses, the Board considered the fund's management fee as well as other fund or class expenses, as applicable, such as transfer agent fees, pricing and bookkeeping fees, fund-paid 12b-1 fees, and custodial, legal, and audit fees. The Board also noted the effects of any waivers and reimbursements on fees and expenses, as well as the impact of the fund's performance adjustment. As part of its review, the Board also considered current and historical total expenses of each class of the fund compared to competitive fund median expenses. Each class of the fund is compared to those funds and classes in the Total Mapped Group (used by the Board for management fee comparisons) that have a similar sales load structure.
The Board noted that the total expenses of each of Class A, Class B, Class C, and Institutional Class ranked below its competitive median for 2009 and the total expenses of Class T ranked above its competitive median for 2009. The Board considered that the total expenses for Class T were above the median primarily because its 12b-1 fee is higher than the typical front-end load class. The Board noted that the fund offers multiple classes, each of which has a different sales load and 12b-1 fee structure, and that the multiple structures are intended to offer a range of pricing options for the intermediary market. The Board also noted that the total expenses of the classes vary primarily by the level of their 12b-1 fees, although differences in transfer agent fees may also cause expenses to vary from class to class.
Annual Report
Board Approval of Investment Advisory Contracts and
Management Fees - continued
Fees Charged to Other Fidelity Clients. The Board also considered Fidelity fee structures and other information with respect to clients of FMR and its affiliates, such as other mutual funds advised or subadvised by FMR or its affiliates, pension plan clients, and other institutional clients. In March 2010, the Board created an ad hoc joint committee with the board of other Fidelity funds (the Committee) to review and compare Fidelity's institutional investment advisory business with its business of providing services to the Fidelity funds, including the differences in services provided, fees charged, and costs incurred, as well as competition in their respective marketplaces.
Based on its review of total expenses and fees charged to other Fidelity clients, the Board concluded that the total expenses of each class of the fund were reasonable, although in one case above the median of the universe presented for comparison, in light of the services that the fund and its shareholders receive and the other factors considered, including the findings of the Committee.
Costs of the Services and Profitability. The Board considered the revenues earned and the expenses incurred by Fidelity in conducting the business of developing, marketing, distributing, managing, administering and servicing the fund and its shareholders. The Board also considered the level of Fidelity's profits in respect of all the Fidelity funds.
On an annual basis, FMR presents to the Board Fidelity's profitability for the fund. Fidelity calculates the profitability for each fund, as well as aggregate profitability for groups of Fidelity funds and all Fidelity funds, using a series of detailed revenue and cost allocation methodologies which originate with the audited books and records of Fidelity. The Audit Committee of the Board reviews any significant changes from the prior year's methodologies.
PricewaterhouseCoopers LLP (PwC), independent registered public accounting firm and auditor to Fidelity and certain Fidelity funds, has been engaged annually by the Board as part of the Board's assessment of Fidelity's profitability analysis. PwC's engagement includes the review and assessment of Fidelity's methodologies used in determining the revenues and expenses attributable to Fidelity's mutual fund business, and completion of agreed-upon procedures surrounding the mathematical accuracy of fund profitability and its conformity to allocation methodologies. After considering PwC's reports issued under the engagement and information provided by Fidelity, the Board believes that while other allocation methods may also be reasonable, Fidelity's profitability methodologies are reasonable in all material respects.
Annual Report
The Board has also reviewed Fidelity's non-fund businesses and fall-out benefits related to the mutual fund business as well as cases where Fidelity's affiliates may benefit from or be related to the fund's business.
The Board considered the costs of the services provided by and the profits realized by Fidelity in connection with the operation of the fund and were satisfied that the profitability was not excessive in the circumstances.
Economies of Scale. The Board considered whether there have been economies of scale in respect of the management of the Fidelity funds, whether the Fidelity funds (including the fund) have appropriately benefited from any such economies of scale, and whether there is potential for realization of any further economies of scale. The Board considered the extent to which the fund will benefit from economies of scale through increased services to the fund, through waivers or reimbursements, or through fee or expense reductions.
In February 2009, the Board and the board of other Fidelity funds created an ad hoc committee (the Economies of Scale Committee) to analyze whether FMR attains economies of scale in respect of the management and servicing of the Fidelity funds, whether the Fidelity funds have appropriately benefited from such economies of scale, and whether there is potential for realization of any further economies of scale.
The Board recognized that the fund's management contract incorporates a "group fee" structure, which provides for lower group fee rates as total fund assets under FMR's management increase, and for higher group fee rates as total fund assets under FMR's management decrease. FMR calculates the group fee rates based on a tiered asset "breakpoint" schedule that varies based on asset class. The Board considered that the group fee is designed to deliver the benefits of economies of scale to fund shareholders when total Fidelity fund assets increase, even if assets of any particular fund are unchanged or have declined, because some portion of Fidelity's costs are attributable to services provided to all Fidelity funds, and all funds benefit if those costs can be allocated among more assets. The Board concluded that, given the group fee structure, fund shareholders will benefit from lower management fees as assets under FMR's management increase at the fund complex level, regardless of whether Fidelity achieves any such economies of scale.
The Board concluded, considering the findings of the Economies of Scale Committee, that any potential economies of scale are being appropriately shared between fund shareholders and Fidelity.
Additional Information Requested by the Board. In order to develop fully the factual basis for consideration of the Fidelity funds' Advisory Contracts, the Board requested and received additional information on certain topics, including (i) fund performance trends, actions to be taken by FMR to improve certain funds' overall performance, and Fidelity's long-term strategies for certain funds; (ii) portfolio manager changes that have occurred during the past year and length of portfolio manager tenure for different categories of funds over time; (iii) Fidelity's compensation structure for portfolio managers, research analysts, and other key personnel, the rationale for the compensation structure, and how the compensation structure provides appropriate performance incentives; (iv) the amount of the investment that each portfolio manager has made in the Fidelity fund(s) that he or she manages; (v) management and other fees paid by FMR to affiliated sub-advisers on behalf of the Fidelity funds; (vi) Fidelity's fee structures and rationale for recommending different fees among different categories of funds; (vii) Fidelity's rationale for recommending which funds should have a performance adjustment component as part of their management fees; (viii) the rationale for any differences between fund fee structures and fee structures in place for other Fidelity clients; and (ix) explanations regarding the relative total expenses borne by certain funds and classes, total expense competitive trends, and actions that might be taken by FMR to reduce total expenses for certain funds and classes.
Annual Report
Board Approval of Investment Advisory Contracts and
Management Fees - continued
Based on its evaluation of all of the conclusions noted above, and after considering all factors it believed relevant, the Board ultimately concluded that the advisory fee structures are fair and reasonable, and that the fund's Advisory Contracts should be renewed.
Annual Report
Investment Adviser
Fidelity Management & Research Company
Boston, MA
Investment Sub-Advisers
FMR Co., Inc.
Fidelity Management & Research
(U.K.) Inc.
Fidelity Management & Research
(Hong Kong) Limited
Fidelity Management & Research
(Japan) Inc.
Fidelity Research & Analysis Company
FIL Investment Advisors
FIL Investments (Japan) Limited
FIL Investment Advisors (UK) Limited
General Distributor
Fidelity Distributors Corporation
Boston, MA
Transfer and Service Agents
Fidelity Investments Institutional Operations Company, Inc.
Boston, MA
Fidelity Service Company, Inc.
Boston, MA
Custodian
Brown Brothers Harriman & Co.
Boston, MA
AICAPI-UANN-1210
1.784755.107
(Fidelity Investment logo)(registered trademark)
Fidelity AdvisorSM
Japan
Fund - Class A, Class T, Class B
and Class C
Annual Report
October 31, 2010
(2_fidelity_logos) (Registered_Trademark)
Contents
Chairman's Message | <Click Here> | The Chairman's message to shareholders. |
Note to shareholders | <Click Here> | An explanation of the changes to the fund. |
Performance | <Click Here> | How the fund has done over time. |
Management's Discussion of Fund Performance | <Click Here> | The Portfolio Manager's review of fundperformance and strategy. |
Shareholder Expense Example | <Click Here> | An example of shareholder expenses. |
Investment Changes | <Click Here> | A summary of major shifts in the fund's investments over the past six months. |
Investments | <Click Here> | A complete list of the fund's investments with their market values. |
Financial Statements | <Click Here> | Statements of assets and liabilities, operations, and changes in net assets,
as well as financial highlights. |
Notes | <Click Here> | Notes to financial statements. |
Report of Independent Registered Public Accounting Firm | <Click Here> | |
Trustees and Officers | <Click Here> | |
Distributions | <Click Here> | |
Proxy Voting Results | <Click Here> | |
Board Approval of Investment Advisory Contracts and Management Fees | <Click Here> | |
To view a fund's proxy voting guidelines and proxy voting record for the 12-month period ended June 30, visit http://www.fidelity.com/proxyvotingresults or visit the Securities and Exchange Commission's (SEC) web site at http://www.sec.gov. You may also call 1-877-208-0098 to request a free copy of the proxy voting guidelines.
Standard & Poor's, S&P and S&P 500 are registered service marks of The McGraw-Hill Companies, Inc. and have been licensed for use by Fidelity Distributors Corporation.
Other third party marks appearing herein are the property of their respective owners.
All other marks appearing herein are registered or unregistered trademarks or service marks of FMR LLC or an affiliated company.
Annual Report
This report and the financial statements contained herein are submitted for the general information of the shareholders of the fund. This report is not authorized for distribution to prospective investors in the fund unless preceded or accompanied by an effective prospectus.
A fund files its complete schedule of portfolio holdings with the SEC for the first and third quarters of each fiscal year on Form N-Q. Forms N-Q are available on the SEC's web site at http://www.sec.gov. A fund's Forms N-Q may be reviewed and copied at the SEC's Public Reference Room in Washington, DC. Information regarding the operation of the SEC's Public Reference Room may be obtained by calling 1-800-SEC-0330. For a complete list of a fund's portfolio holdings, view the most recent holdings listing, semiannual report, or annual report on Fidelity's web site at http://www.fidelity.com or http://www.advisor.fidelity.com, as applicable.
NOT FDIC INSURED • MAY LOSE VALUE • NO BANK GUARANTEE
Neither the fund nor Fidelity Distributors Corporation is a bank.
Annual Report
(photo_of_Edward_C_Johnson_3d)
Dear Shareholder:
Equities have staged a rally in the second half of 2010, shaking off concerns about the European debt crisis and the possibility of a double-dip recession in the U.S. Although the short-term surge pushed major equity indexes back into positive territory for the year, several questions remain about the longer-term outlook, including lackluster economic growth and persistently high unemployment. Financial markets are always unpredictable, of course, but there also are several time-tested investment principles that can help put the odds in your favor.
One of the basic tenets is to invest for the long term. Over time, riding out the markets' inevitable ups and downs has proven much more effective than selling into panic or chasing the hottest trend. Even missing only a few of the markets' best days can significantly diminish investor returns. Patience also affords the benefits of compounding - of earning interest on additional income or reinvested dividends and capital gains. There can be tax advantages and cost benefits to consider as well. While staying the course doesn't eliminate risk, it can considerably lessen the effect of short-term declines.
You can further manage your investing risk through diversification. And today, more than ever, geographic diversification should be taken into account. Studies indicate that asset allocation is the single most important determinant of a portfolio's long-term success. The right mix of stocks, bonds and cash - aligned to your particular risk tolerance and investment objective - is very important. Age-appropriate rebalancing is also an essential aspect of asset allocation. For younger investors, an emphasis on equities - which historically have been the best-performing asset class over time - is encouraged. As investors near their specific goal, such as retirement or sending a child to college, consideration may be given to replacing volatile assets (e.g. common stocks) with more-stable fixed investments (bonds or savings plans).
A third principle - investing regularly - can help lower the average cost of your purchases. Investing a certain amount of money each month or quarter helps ensure you won't pay for all your shares at market highs. This strategy - known as dollar cost averaging - also reduces "emotion" from investing, helping shareholders avoid selling weak performers just prior to an upswing, or chasing a hot performer just before a correction.
We invite you to contact us via the Internet, through our Investor Centers or by phone. It is our privilege to provide you the information you need to make the investments that are right for you.
Sincerely,
(The chairman's signature appears here.)
Edward C. Johnson 3d
Annual Report
Note to Shareholders
On November 16, 2010, shareholders of Fidelity AdvisorSM Japan Fund approved the merger of Advisor Japan into Fidelity® Japan Fund. The merger will be effective on December 17, 2010.
Annual Report
Average annual total return reflects the change in the value of an investment, assuming reinvestment of the class' distributions from dividend income and capital gains (the profits earned upon the sale of securities that have grown in value, if any) and assuming a constant rate of performance each year. The $10,000 table and the fund's returns do not reflect the deduction of taxes that a shareholder would pay on fund distributions or the redemption of fund shares. During periods of reimbursement by Fidelity, a fund's total return will be greater than it would be had the reimbursement not occurred. How a fund did yesterday is no guarantee of how it will do tomorrow. Returns reflect the conversion of Class B shares to Class A shares after a maximum of seven years.
Average Annual Total Returns
Periods ended October 31, 2010 | Past 1
year | Past 5
years | Past 10
years |
Class A (incl. sales charge) | 0.19% | -7.31% | -4.19% |
Class T (incl. sales charge) | 2.36% | -7.11% | -4.24% |
Class B (incl. contingent deferred sales charge) A | 0.55% | -7.26% | -4.15% |
Class C (incl. contingent deferred sales charge) B | 4.58% | -6.88% | -4.33% |
A Class B shares' contingent deferred sales charges included in the past one year, past five years, and past 10 years total return figures are 5%, 2%, and 0%, respectively.
B Class C shares' contingent deferred sales charge included in the past one year, past five years, and past 10 years total return figures are 1%, 0%, and 0%, respectively.
Annual Report
Performance - continued
$10,000 Over 10 Years
Let's say hypothetically that $10,000 was invested in Fidelity AdvisorSM Japan Fund - Class A on October 31, 2000, and the current 5.75% sales charge was paid. The chart shows how the value of your investment would have changed, and also shows how the Tokyo Stock Price Index (TOPIX) performed over the same period.
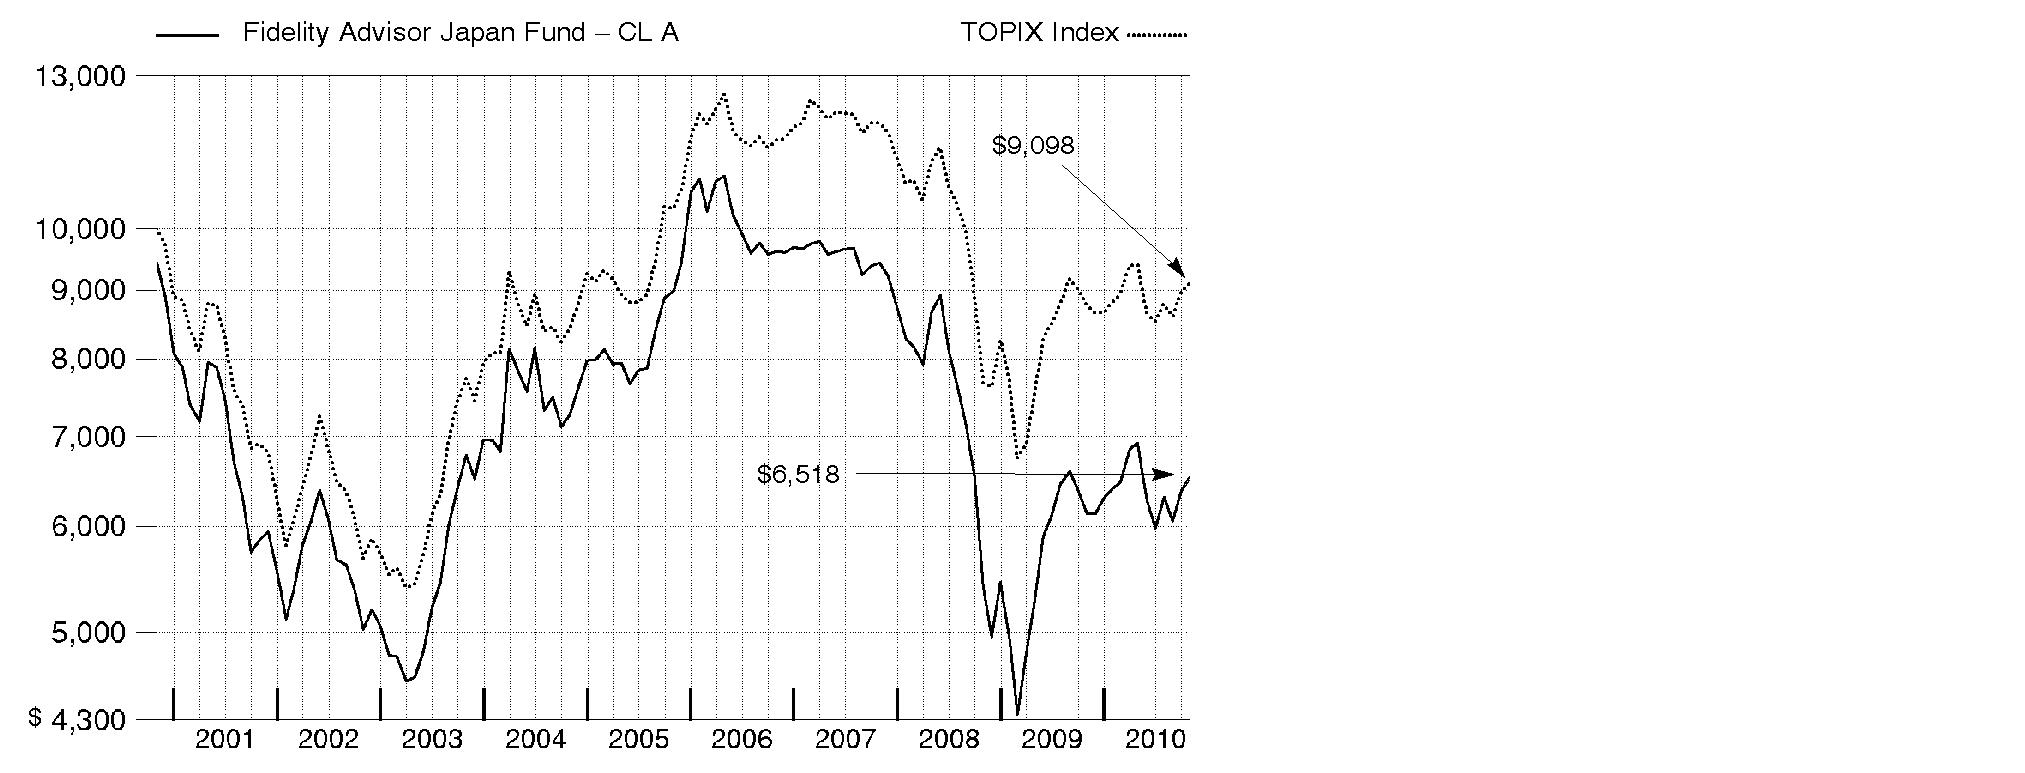
Annual Report
Market Recap: Despite solid gains in many world equity markets, Japanese stocks only managed a modest advance during the past year amid continued sluggishness in the nation's economy. For the 12 months ending October 31, 2010, the Tokyo Stock Price Index (TOPIX) returned 3.70%, a gain entirely attributable to U.S. dollar weakness versus the yen. Telecommunication services was by far the index's top-performing sector, posting a gain of almost 17%. Utilities and industrials were next, returning roughly 10% and 8%, respectively. Two sectors, financials and energy, ended the period with negative returns, at approximately -9% and -4%, respectively. During the second quarter of 2010, Japan's economy grew at a tepid 0.4% annualized pace, while in September the country experienced its 19th consecutive month of falling consumer prices - a sign of deeply entrenched deflation - - as measured by the year-over-year change in its consumer price index. Domestic consumer spending remained weak, while demand for Japanese exports was dampened by strong currency appreciation, despite the Japanese government's bold move in September to weaken the surging yen.
Comments from Robert Rowland, Portfolio Manager of Fidelity AdvisorSM Japan Fund: During the past year, the fund's Class A, Class T, Class B and Class C shares returned 6.31%, 6.07%, 5.55% and 5.58%, respectively (excluding sales charges), handily beating the TOPIX. Strong stock picking in financials - particularly the diversified financials group - lifted the fund's results, as did favorable stock selection in industrials, consumer discretionary and information technology. Against a backdrop of improved credit conditions and a rebound in global equity markets, our holdings in non-bank financials, including Orix, Sompo Japan Insurance - which merged with NipponKoa Insurance to form NKSJ Holdings - and Credit Saison, were among the leading contributors to performance. Other contributors included imaging and optical products manufacturer Canon, automaker Honda Motor, LCD (liquid-crystal display) component suppliers Nippon Electric Glass and Nitto Denko, and wireless telecommunication services and hardware provider NTT DoCoMo. Conversely, a large overweighting in financials, the benchmark's weakest-performing sector, undercut the benefit of favorable security selection in that group. Life insurer T&D Holdings detracted from performance, as did synthetic rubber/resin producer JSR and printed circuit board manufacturer Ibiden. Stanley Electric and Toyoda Gosei, makers of LED (light-emitting-diode) auto parts, also hurt.
The views expressed above reflect those of the portfolio manager(s) only through the end of the period as stated on the cover of this report and do not necessarily represent the views of Fidelity or any other person in the Fidelity organization. Any such views are subject to change at any time based upon market or other conditions and Fidelity disclaims any responsibility to update such views. These views may not be relied on as investment advice and, because investment decisions for a Fidelity fund are based on numerous factors, may not be relied on as an indication of trading intent on behalf of any Fidelity fund.
Annual Report
Shareholder Expense Example
As a shareholder of the Fund, you incur two types of costs: (1) transaction costs, including sales charges (loads) on purchase payments or redemption proceeds, redemption fees, and (2) ongoing costs, including management fees, distribution and/or service (12b-1) fees and other Fund expenses. This Example is intended to help you understand your ongoing costs (in dollars) of investing in the Fund and to compare these costs with the ongoing costs of investing in other mutual funds.
The Example is based on an investment of $1,000 invested at the beginning of the period and held for the entire period (May 1, 2010 to October 31, 2010).
Actual Expenses
The first line of the accompanying table for each class of the Fund provides information about actual account values and actual expenses. You may use the information in this line, together with the amount you invested, to estimate the expenses that you paid over the period. Simply divide your account value by $1,000.00 (for example, an $8,600 account value divided by $1,000.00 = 8.6), then multiply the result by the number in the first line for a class of the Fund under the heading entitled "Expenses Paid During Period" to estimate the expenses you paid on your account during this period. In addition, the Fund, as a shareholder in the underlying Fidelity Central Funds, will indirectly bear its pro-rata share of the fees and expenses incurred by the underlying Fidelity Central Funds. These fees and expenses are not included in the Fund's annualized expense ratio used to calculate the expense estimate in the table below.
Hypothetical Example for Comparison Purposes
The second line of the accompanying table for each class of the Fund provides information about hypothetical account values and hypothetical expenses based on a Class' actual expense ratio and an assumed rate of return of 5% per year before expenses, which is not the Class' actual return. The hypothetical account values and expenses may not be used to estimate the actual ending account balance or expenses you paid for the period. You may use this information to compare the ongoing costs of investing in the Fund and other funds. To do so, compare this 5% hypothetical example with the 5% hypothetical examples that appear in the shareholder reports of the other funds. In addition, the Fund, as a shareholder in the underlying Fidelity Central Funds, will indirectly bear its pro-rata share of the fees and expenses incurred by the underlying Fidelity Central Funds. These fees and expenses are not included in the Fund's annualized expense ratio used to calculate the expense estimate in the table below.
Please note that the expenses shown in the table are meant to highlight your ongoing costs only and do not reflect any transaction costs. Therefore, the second line of the table is useful in comparing ongoing costs only, and will not help you determine the relative total costs of owning different funds. In addition, if these transactional costs were included, your costs would have been higher.
Annual Report
Shareholder Expense Example - continued
|
Annualized
Expense Ratio
|
Beginning
Account Value
May 1, 2010
|
Ending
Account Value
October 31, 2010
| Expenses Paid
During Period*
May 1, 2010 to
October 31, 2010 |
Class A | 1.50%** | | | |
Actual | | $ 1,000.00 | $ 942.40 | $ 7.34** |
Hypothetical A | | $ 1,000.00 | $ 1,017.64 | $ 7.63** |
Class T | 1.75%** | | | |
Actual | | $ 1,000.00 | $ 940.60 | $ 8.56** |
Hypothetical A | | $ 1,000.00 | $ 1,016.38 | $ 8.89** |
Class B | 2.25%** | | | |
Actual | | $ 1,000.00 | $ 938.60 | $ 10.99** |
Hypothetical A | | $ 1,000.00 | $ 1,013.86 | $ 11.42** |
Class C | 2.25%** | | | |
Actual | | $ 1,000.00 | $ 939.00 | $ 11.00** |
Hypothetical A | | $ 1,000.00 | $ 1,013.86 | $ 11.42** |
Institutional Class | 1.19% | | | |
Actual | | $ 1,000.00 | $ 943.20 | $ 5.83 |
Hypothetical A | | $ 1,000.00 | $ 1,019.21 | $ 6.06 |
A 5% return per year before expenses
* Expenses are equal to each Class' annualized expense ratio, multiplied by the average account value over the period, multiplied by 184/365 (to reflect the one-half year period).
** If changes to the voluntary expense limitations effective November 1, 2010, had been in effect during the entire period, the annualized expense ratios and the expenses paid in the actual and hypothetical examples above would have been as follows:
| Annualized
Expense Ratio |
Expenses Paid
|
Class A | 1.45% | |
Actual | | $ 7.10 |
HypotheticalA | | $ 7.38 |
Class T | 1.70% | |
Actual | | $ 8.32 |
HypotheticalA | | $ 8.64 |
Class B | 2.20% | |
Actual | | $ 10.75 |
HypotheticalA | | $ 11.17 |
Class C | 2.20% | |
Actual | | $ 10.75 |
HypotheticalA | | $ 11.17 |
A 5% return per year before expenses
Annual Report
Investment Changes (Unaudited)
Top Ten Stocks as of October 31, 2010 |
| % of fund's
net assets | % of fund's net assets
6 months ago |
Mitsubishi UFJ Financial Group, Inc. | 4.0 | 3.8 |
Sumitomo Mitsui Financial Group, Inc. | 3.4 | 4.2 |
Canon, Inc. | 3.3 | 3.6 |
ORIX Corp. | 3.3 | 2.8 |
NTT DoCoMo, Inc. | 3.0 | 5.5 |
Sumitomo Trust & Banking Co. Ltd. | 2.9 | 2.5 |
Denso Corp. | 2.6 | 1.8 |
Mitsubishi Estate Co. Ltd. | 2.6 | 2.2 |
Honda Motor Co. Ltd. | 2.4 | 3.0 |
Toyota Motor Corp. | 2.4 | 1.3 |
| 29.9 | |
Top Five Market Sectors as of October 31, 2010 |
| % of fund's
net assets | % of fund's net assets
6 months ago |
Financials | 31.0 | 31.7 |
Consumer Discretionary | 19.9 | 18.3 |
Industrials | 17.2 | 15.8 |
Information Technology | 11.2 | 14.0 |
Materials | 6.7 | 7.2 |
Asset Allocation (% of fund's net assets) |
As of October 31, 2010 | As of April 30, 2010 |
| Stocks 95.4% | | | Stocks 95.9% | |
| Short-Term
Investments and
Net Other Assets 4.6% | | | Short-Term
Investments and
Net Other Assets 4.1% | |

Annual Report
Investments October 31, 2010
Showing Percentage of Net Assets
Common Stocks - 95.4% |
| Shares | | Value |
CONSUMER DISCRETIONARY - 19.9% |
Auto Components - 7.4% |
Bridgestone Corp. | 8,000 | | $ 143,210 |
Denso Corp. | 29,100 | | 904,955 |
NOK Corp. | 22,400 | | 400,010 |
Stanley Electric Co. Ltd. | 33,800 | | 567,464 |
Toyoda Gosei Co. Ltd. | 26,500 | | 571,033 |
| | 2,586,672 |
Automobiles - 4.8% |
Honda Motor Co. Ltd. | 23,400 | | 843,542 |
Toyota Motor Corp. | 23,800 | | 843,002 |
| | 1,686,544 |
Household Durables - 1.5% |
Sekisui House Ltd. | 55,000 | | 516,911 |
Leisure Equipment & Products - 1.7% |
Nikon Corp. | 16,800 | | 317,281 |
Sega Sammy Holdings, Inc. | 17,000 | | 277,594 |
| | 594,875 |
Media - 1.2% |
Fuji Media Holdings, Inc. | 308 | | 408,013 |
Multiline Retail - 1.5% |
Isetan Mitsukoshi Holdings Ltd. | 21,200 | | 233,917 |
Ryohin Keikaku Co. Ltd. | 2,600 | | 92,278 |
Takashimaya Co. Ltd. | 27,000 | | 203,247 |
| | 529,442 |
Specialty Retail - 1.8% |
Nishimatsuya Chain Co. Ltd. | 20,400 | | 196,471 |
Shimachu Co. Ltd. | 5,300 | | 108,872 |
Xebio Co. Ltd. | 4,800 | | 94,246 |
Yamada Denki Co. Ltd. | 3,330 | | 216,427 |
| | 616,016 |
TOTAL CONSUMER DISCRETIONARY | | 6,938,473 |
CONSUMER STAPLES - 4.0% |
Beverages - 1.1% |
Coca-Cola West Co. Ltd. | 3,600 | | 55,071 |
Kirin Holdings Co. Ltd. | 24,000 | | 328,889 |
| | 383,960 |
Food & Staples Retailing - 2.0% |
FamilyMart Co. Ltd. | 7,400 | | 262,637 |
Common Stocks - continued |
| Shares | | Value |
CONSUMER STAPLES - continued |
Food & Staples Retailing - continued |
Lawson, Inc. | 6,500 | | $ 295,638 |
Seven & i Holdings Co., Ltd. | 6,000 | | 139,278 |
| | 697,553 |
Personal Products - 0.9% |
Kao Corp. | 8,100 | | 205,877 |
Kose Corp. | 3,900 | | 93,490 |
| | 299,367 |
TOTAL CONSUMER STAPLES | | 1,380,880 |
FINANCIALS - 31.0% |
Capital Markets - 0.9% |
Matsui Securities Co. Ltd. | 30,300 | | 171,377 |
Nomura Holdings, Inc. | 27,200 | | 139,775 |
| | 311,152 |
Commercial Banks - 13.3% |
Chiba Bank Ltd. | 61,000 | | 376,604 |
Mitsubishi UFJ Financial Group, Inc. | 302,900 | | 1,405,758 |
Mizuho Financial Group, Inc. | 264,000 | | 382,884 |
Seven Bank Ltd. | 160 | | 288,107 |
Sumitomo Mitsui Financial Group, Inc. | 39,200 | | 1,170,032 |
Sumitomo Trust & Banking Co. Ltd. | 184,000 | | 1,004,604 |
| | 4,627,989 |
Consumer Finance - 4.7% |
Credit Saison Co. Ltd. | 33,900 | | 480,827 |
ORIX Corp. | 12,530 | | 1,142,913 |
| | 1,623,740 |
Insurance - 5.5% |
MS&AD Insurance Group Holdings, Inc. | 10,900 | | 261,130 |
NKSJ Holdings, Inc. (a) | 100,000 | | 687,213 |
Sony Financial Holdings, Inc. | 87 | | 302,722 |
T&D Holdings, Inc. | 33,350 | | 680,987 |
| | 1,932,052 |
Real Estate Investment Trusts - 2.2% |
Japan Prime Realty Investment Corp. | 64 | | 158,986 |
Japan Real Estate Investment Corp. | 35 | | 337,082 |
Nomura Real Estate Office Fund, Inc. | 47 | | 288,822 |
| | 784,890 |
Common Stocks - continued |
| Shares | | Value |
FINANCIALS - continued |
Real Estate Management & Development - 4.4% |
Mitsubishi Estate Co. Ltd. | 51,000 | | $ 893,440 |
Mitsui Fudosan Co. Ltd. | 33,000 | | 624,039 |
| | 1,517,479 |
TOTAL FINANCIALS | | 10,797,302 |
HEALTH CARE - 0.7% |
Health Care Providers & Services - 0.7% |
Alfresa Holdings Corp. | 5,600 | | 235,566 |
INDUSTRIALS - 17.2% |
Air Freight & Logistics - 0.8% |
Yamato Holdings Co. Ltd. | 20,400 | | 257,180 |
Building Products - 1.0% |
Asahi Glass Co. Ltd. | 11,000 | | 105,521 |
Daikin Industries Ltd. | 6,900 | | 240,059 |
| | 345,580 |
Construction & Engineering - 0.3% |
Kandenko Co. Ltd. | 19,000 | | 110,737 |
Electrical Equipment - 2.4% |
Mitsubishi Electric Corp. | 56,000 | | 524,841 |
Sumitomo Electric Industries Ltd. | 24,700 | | 314,301 |
| | 839,142 |
Machinery - 2.5% |
Fanuc Ltd. | 2,300 | | 332,970 |
Kubota Corp. | 33,000 | | 292,646 |
NSK Ltd. | 34,000 | | 257,055 |
| | 882,671 |
Marine - 0.5% |
Iino Kaiun Kaisha Ltd. | 18,200 | | 81,422 |
Mitsui OSK Lines Ltd. | 15,000 | | 95,930 |
| | 177,352 |
Road & Rail - 1.6% |
East Japan Railway Co. | 9,000 | | 555,782 |
Trading Companies & Distributors - 6.1% |
Itochu Corp. | 61,000 | | 534,621 |
Mitsubishi Corp. | 25,600 | | 614,904 |
Common Stocks - continued |
| Shares | | Value |
INDUSTRIALS - continued |
Trading Companies & Distributors - continued |
Mitsui & Co. Ltd. | 45,800 | | $ 720,315 |
Sumitomo Corp. | 18,800 | | 238,023 |
| | 2,107,863 |
Transportation Infrastructure - 2.0% |
The Sumitomo Warehouse Co. Ltd. | 134,000 | | 696,061 |
TOTAL INDUSTRIALS | | 5,972,368 |
INFORMATION TECHNOLOGY - 11.2% |
Computers & Peripherals - 0.7% |
Fujitsu Ltd. | 35,000 | | 238,751 |
Electronic Equipment & Components - 4.0% |
Ibiden Co. Ltd. | 14,800 | | 364,528 |
Nippon Electric Glass Co. Ltd. | 13,500 | | 173,527 |
Yamatake Corp. | 23,100 | | 562,357 |
Yaskawa Electric Corp. | 38,000 | | 297,030 |
| | 1,397,442 |
Office Electronics - 4.2% |
Canon, Inc. | 24,900 | | 1,146,229 |
Konica Minolta Holdings, Inc. | 34,500 | | 333,372 |
| | 1,479,601 |
Semiconductors & Semiconductor Equipment - 1.5% |
ROHM Co. Ltd. | 2,800 | | 174,674 |
Tokyo Electron Ltd. | 5,900 | | 332,898 |
| | 507,572 |
Software - 0.8% |
Nintendo Co. Ltd. | 1,100 | | 285,013 |
TOTAL INFORMATION TECHNOLOGY | | 3,908,379 |
MATERIALS - 6.7% |
Chemicals - 5.0% |
JSR Corp. | 28,800 | | 498,551 |
Mitsubishi Chemical Holdings Corp. | 27,500 | | 141,448 |
Nissan Chemical Industries Co. Ltd. | 22,000 | | 252,615 |
Nitto Denko Corp. | 7,100 | | 265,577 |
Shin-Etsu Chemical Co., Ltd. | 7,100 | | 359,019 |
Tokai Carbon Co. Ltd. | 36,000 | | 212,267 |
| | 1,729,477 |
Common Stocks - continued |
| Shares | | Value |
MATERIALS - continued |
Containers & Packaging - 0.1% |
Toyo Seikan Kaisha Ltd. | 2,000 | | $ 34,128 |
Metals & Mining - 1.6% |
Nippon Steel Corp. | 43,000 | | 135,154 |
Sumitomo Metal Industries Ltd. | 109,000 | | 252,987 |
Yamato Kogyo Co. Ltd. | 6,900 | | 176,980 |
| | 565,121 |
TOTAL MATERIALS | | 2,328,726 |
TELECOMMUNICATION SERVICES - 3.7% |
Wireless Telecommunication Services - 3.7% |
KDDI Corp. | 42 | | 226,415 |
NTT DoCoMo, Inc. | 621 | | 1,046,805 |
| | 1,273,220 |
UTILITIES - 1.0% |
Electric Utilities - 1.0% |
Tokyo Electric Power Co. | 15,100 | | 360,560 |
TOTAL COMMON STOCKS (Cost $38,087,918) | 33,195,474 |
Money Market Funds - 4.1% |
| | | |
Fidelity Cash Central Fund, 0.23% (b)
(Cost $1,438,671) | 1,438,671 | | 1,438,671 |
TOTAL INVESTMENT PORTFOLIO - 99.5% (Cost $39,526,589) | | 34,634,145 |
NET OTHER ASSETS (LIABILITIES) - 0.5% | | 185,238 |
NET ASSETS - 100% | $ 34,819,383 |
Legend |
(a) Non-income producing |
(b) Affiliated fund that is available only to investment companies and other accounts managed by Fidelity Investments. The rate quoted is the annualized seven-day yield of the fund at period end. A complete unaudited listing of the fund's holdings as of its most recent quarter end is available upon request. In addition, each Fidelity Central Fund's financial statements, which are not covered by the Fund's report of Independent Registered Public Accounting Firm, are available on the SEC's website or upon request. |
Affiliated Central Funds |
Information regarding fiscal year to date income earned by the Fund from investments in Fidelity Central Funds is as follows: |
Fund | Income earned |
Fidelity Cash Central Fund | $ 3,889 |
Fidelity Securities Lending Cash Central Fund | 352 |
Total | $ 4,241 |
Other Information |
The following is a summary of the inputs used, as of October 31, 2010, involving the Fund's assets and liabilities carried at fair value. The inputs or methodology used for valuing securities may not be an indication of the risk associated with investing in those securities. For more information on valuation inputs, and their aggregation into the levels used in the table below, please refer to the Security Valuation section in the accompanying Notes to Financial Statements. |
Valuation Inputs at Reporting Date: |
Description | Total | Level 1 | Level 2 | Level 3 |
Investments in Securities: | | | | |
Equities: | | | | |
Consumer Discretionary | $ 6,938,473 | $ 2,932,408 | $ 4,006,065 | $ - |
Consumer Staples | 1,380,880 | 706,836 | 674,044 | - |
Financials | 10,797,302 | 3,205,845 | 7,591,457 | - |
Health Care | 235,566 | 235,566 | - | - |
Industrials | 5,972,368 | 888,220 | 5,084,148 | - |
Information Technology | 3,908,379 | 1,683,602 | 2,224,777 | - |
Materials | 2,328,726 | 941,108 | 1,387,618 | - |
Telecommunication Services | 1,273,220 | - | 1,273,220 | - |
Utilities | 360,560 | - | 360,560 | - |
Money Market Funds | 1,438,671 | 1,438,671 | - | - |
Total Investments in Securities: | $ 34,634,145 | $ 12,032,256 | $ 22,601,889 | $ - |
Income Tax Information |
At October 31, 2010, the Fund had a capital loss carryforward of approximately $25,985,158 of which $6,651,966, $7,706,742, $10,009,147 and $1,617,303 will expire on October 31, 2015, 2016, 2017 and 2018, respectively. Capital loss carryforwards are only available to offset future capital gains of the Fund to the extent provided by regulations and may be limited. |
See accompanying notes which are an integral part of the financial statements.
Annual Report
Statement of Assets and Liabilities
| October 31, 2010 |
| | |
Assets | | |
Investment in securities, at value - See accompanying schedule: Unaffiliated issuers (cost $38,087,918) | $ 33,195,474 | |
Fidelity Central Funds (cost $1,438,671) | 1,438,671 | |
Total Investments (cost $39,526,589) | | $ 34,634,145 |
Cash | | 17,240 |
Receivable for investments sold | | 90,583 |
Receivable for fund shares sold | | 41,792 |
Dividends receivable | | 280,453 |
Distributions receivable from Fidelity Central Funds | | 293 |
Other receivables | | 21 |
Total assets | | 35,064,527 |
| | |
Liabilities | | |
Payable for investments purchased | $ 95,201 | |
Payable for fund shares redeemed | 36,783 | |
Accrued management fee | 19,361 | |
Distribution and service plan fees payable | 14,937 | |
Other affiliated payables | 9,672 | |
Other payables and accrued expenses | 69,190 | |
Total liabilities | | 245,144 |
| | |
Net Assets | | $ 34,819,383 |
Net Assets consist of: | | |
Paid in capital | | $ 66,547,210 |
Undistributed net investment income | | 62,304 |
Accumulated undistributed net realized gain (loss) on investments and foreign currency transactions | | (26,910,091) |
Net unrealized appreciation (depreciation) on investments and assets and liabilities in foreign currencies | | (4,880,040) |
Net Assets | | $ 34,819,383 |
See accompanying notes which are an integral part of the financial statements.
Annual Report
Financial Statements - continued
Statement of Assets and Liabilities - continued
| October 31, 2010 |
| | |
Calculation of Maximum Offering Price Class A:
Net Asset Value and redemption price per share ($13,966,669 ÷ 1,254,694 shares) | | $ 11.13 |
| | |
Maximum offering price per share (100/94.25 of $11.13) | | $ 11.81 |
Class T:
Net Asset Value and redemption price per share ($5,012,970 ÷ 458,925 shares) | | $ 10.92 |
| | |
Maximum offering price per share (100/96.50 of $10.92) | | $ 11.32 |
Class B:
Net Asset Value and offering price per share ($2,361,952 ÷ 227,367 shares)A | | $ 10.39 |
| | |
Class C:
Net Asset Value and offering price per share ($9,266,675 ÷ 885,937 shares)A | | $ 10.46 |
| | |
Institutional Class:
Net Asset Value, offering price and redemption price per share ($4,211,117 ÷ 367,400 shares) | | $ 11.46 |
A Redemption price per share is equal to net asset value less any applicable contingent deferred sales charge.
See accompanying notes which are an integral part of the financial statements.
Annual Report
Statement of Operations
| Year ended October 31, 2010 |
| | |
Investment Income | | |
Dividends | | $ 745,248 |
Interest | | 5 |
Income from Fidelity Central Funds | | 4,241 |
Income before foreign taxes withheld | | 749,494 |
Less foreign taxes withheld | | (52,167) |
Total income | | 697,327 |
| | |
Expenses | | |
Management fee
Basic fee | $ 255,779 | |
Performance adjustment | (55,152) | |
Transfer agent fees | 109,506 | |
Distribution and service plan fees | 185,214 | |
Accounting and security lending fees | 18,708 | |
Custodian fees and expenses | 20,069 | |
Independent trustees' compensation | 204 | |
Registration fees | 54,428 | |
Audit | 52,542 | |
Legal | 183 | |
Miscellaneous | 25,258 | |
Total expenses before reductions | 666,739 | |
Expense reductions | (31,720) | 635,019 |
Net investment income (loss) | | 62,308 |
Realized and Unrealized Gain (Loss) Net realized gain (loss) on: | | |
Investment securities: | | |
Unaffiliated issuers | (957,356) | |
Foreign currency transactions | 19,954 | |
Total net realized gain (loss) | | (937,402) |
Change in net unrealized appreciation (depreciation) on: Investment securities | 2,404,289 | |
Assets and liabilities in foreign currencies | 10,653 | |
Total change in net unrealized appreciation (depreciation) | | 2,414,942 |
Net gain (loss) | | 1,477,540 |
Net increase (decrease) in net assets resulting from operations | | $ 1,539,848 |
See accompanying notes which are an integral part of the financial statements.
Annual Report
Financial Statements - continued
Statement of Changes in Net Assets
| Year ended
October 31,
2010 | Year ended
October 31,
2009 |
Increase (Decrease) in Net Assets | | |
Operations | | |
Net investment income (loss) | $ 62,308 | $ 5,019 |
Net realized gain (loss) | (937,402) | (10,515,725) |
Change in net unrealized appreciation (depreciation) | 2,414,942 | 13,536,737 |
Net increase (decrease) in net assets resulting
from operations | 1,539,848 | 3,026,031 |
Distributions to shareholders from net realized gain | (376,323) | - |
Share transactions - net increase (decrease) | (483,817) | (8,304,847) |
Redemption fees | 9,997 | 12,477 |
Total increase (decrease) in net assets | 689,705 | (5,266,339) |
| | |
Net Assets | | |
Beginning of period | 34,129,678 | 39,396,017 |
End of period (including undistributed net investment income of $62,304 and undistributed net investment income of $5,019, respectively) | $ 34,819,383 | $ 34,129,678 |
See accompanying notes which are an integral part of the financial statements.
Annual Report
Financial Highlights - Class A
Years ended October 31, | 2010 | 2009 | 2008 | 2007 | 2006 |
Selected Per-Share Data | | | | | |
Net asset value, beginning of period | $ 10.62 | $ 9.37 | $ 16.41 | $ 16.72 | $ 15.61 |
Income from Investment Operations | | | | | |
Net investment income (loss) C | .05 | .03 | .03 | (.04) | (.07) |
Net realized and unrealized gain (loss) | .62 | 1.22 | (7.02) | (.27) | 1.17 |
Total from investment operations | .67 | 1.25 | (6.99) | (.31) | 1.10 |
Distributions from net realized gain | (.16) | - | (.06) | - | - |
Redemption fees added to paid in capital C | - G | - G | .01 | - G | .01 |
Net asset value, end of period | $ 11.13 | $ 10.62 | $ 9.37 | $ 16.41 | $ 16.72 |
Total Return A, B | 6.31% | 13.34% | (42.68)% | (1.85)% | 7.11% |
Ratios to Average Net Assets D, F | | | | | |
Expenses before reductions | 1.59% | 1.50% | 1.54% | 1.70% | 1.52% |
Expenses net of fee waivers, if any | 1.50% | 1.50% | 1.50% | 1.50% | 1.50% |
Expenses net of all reductions | 1.50% | 1.49% | 1.49% | 1.48% | 1.48% |
Net investment income (loss) | .43% | .30% | .24% | (.22)% | (.42)% |
Supplemental Data | | | | | |
Net assets, end of period (000 omitted) | $ 13,967 | $ 12,798 | $ 14,133 | $ 32,945 | $ 41,876 |
Portfolio turnover rate E | 52% | 63% | 63% | 138% | 83% |
A Total returns would have been lower had certain expenses not been reduced during the periods shown.
B Total returns do not include the effect of the sales charges.
C Calculated based on average shares outstanding during the period.
D Fees and expenses of the underlying Fidelity Central Funds are not included in the Fund's expense ratio. The Fund indirectly bears its proportionate share of the expenses of any underlying Fidelity Central Funds.
E Amount does not include the portfolio activity of any underlying Fidelity Central Funds.
F Expense ratios reflect operating expenses of the class. Expenses before reductions do not reflect amounts reimbursed by the investment adviser or reductions from brokerage service arrangements or reductions from other expense offset arrangements and do not represent the amount paid by the class during periods when reimbursements or reductions occur. Expenses net of fee waivers reflect expenses after reimbursement by the investment adviser but prior to reductions from brokerage service arrangements or other expense offset arrangements. Expenses net of all reductions represent the net expenses paid by the class.
G Amount represents less than $.01 per share.
See accompanying notes which are an integral part of the financial statements.
Annual Report
Financial Highlights - Class T
Years ended October 31, | 2010 | 2009 | 2008 | 2007 | 2006 |
Selected Per-Share Data | | | | | |
Net asset value, beginning of period | $ 10.41 | $ 9.21 | $ 16.11 | $ 16.46 | $ 15.41 |
Income from Investment Operations | | | | | |
Net investment income (loss) C | .02 | - G | - G | (.08) | (.12) |
Net realized and unrealized gain (loss) | .61 | 1.20 | (6.91) | (.27) | 1.16 |
Total from investment operations | .63 | 1.20 | (6.91) | (.35) | 1.04 |
Distributions from net realized gain | (.12) | - | - G | - | - |
Redemption fees added to paid in capital C | - G | - G | .01 | - G | .01 |
Net asset value, end of period | $ 10.92 | $ 10.41 | $ 9.21 | $ 16.11 | $ 16.46 |
Total Return A, B | 6.07% | 13.03% | (42.82)% | (2.13)% | 6.81% |
Ratios to Average Net Assets D, F | | | | | |
Expenses before reductions | 1.89% | 1.80% | 1.81% | 1.96% | 1.82% |
Expenses net of fee waivers, if any | 1.75% | 1.75% | 1.75% | 1.75% | 1.75% |
Expenses net of all reductions | 1.75% | 1.74% | 1.74% | 1.73% | 1.73% |
Net investment income (loss) | .18% | .05% | (.01)% | (.47)% | (.67)% |
Supplemental Data | | | | | |
Net assets, end of period (000 omitted) | $ 5,013 | $ 5,487 | $ 6,752 | $ 14,303 | $ 21,039 |
Portfolio turnover rate E | 52% | 63% | 63% | 138% | 83% |
A Total returns would have been lower had certain expenses not been reduced during the periods shown.
B Total returns do not include the effect of the sales charges.
C Calculated based on average shares outstanding during the period.
D Fees and expenses of the underlying Fidelity Central Funds are not included in the Fund's expense ratio. The Fund indirectly bears its proportionate share of the expenses of any underlying Fidelity Central Funds.
E Amount does not include the portfolio activity of any underlying Fidelity Central Funds.
F Expense ratios reflect operating expenses of the class. Expenses before reductions do not reflect amounts reimbursed by the investment adviser or reductions from brokerage service arrangements or reductions from other expense offset arrangements and do not represent the amount paid by the class during periods when reimbursements or reductions occur. Expenses net of fee waivers reflect expenses after reimbursement by the investment adviser but prior to reductions from brokerage service arrangements or other expense offset arrangements. Expenses net of all reductions represent the net expenses paid by the class.
G Amount represents less than $.01 per share.
See accompanying notes which are an integral part of the financial statements.
Annual Report
Financial Highlights - Class B
Years ended October 31, | 2010 | 2009 | 2008 | 2007 | 2006 |
Selected Per-Share Data | | | | | |
Net asset value, beginning of period | $ 9.92 | $ 8.82 | $ 15.50 | $ 15.91 | $ 14.96 |
Income from Investment Operations | | | | | |
Net investment income (loss) C | (.03) | (.04) | (.07) | (.15) | (.20) |
Net realized and unrealized gain (loss) | .58 | 1.14 | (6.61) | (.26) | 1.14 |
Total from investment operations | .55 | 1.10 | (6.68) | (.41) | .94 |
Distributions from net realized gain | (.08) | - | - | - | - |
Redemption fees added to paid in capital C | - G | - G | - G | - G | .01 |
Net asset value, end of period | $ 10.39 | $ 9.92 | $ 8.82 | $ 15.50 | $ 15.91 |
Total Return A, B | 5.55% | 12.47% | (43.10)% | (2.58)% | 6.35% |
Ratios to Average Net Assets D, F | | | | | |
Expenses before reductions | 2.36% | 2.26% | 2.29% | 2.45% | 2.33% |
Expenses net of fee waivers, if any | 2.25% | 2.25% | 2.25% | 2.25% | 2.25% |
Expenses net of all reductions | 2.25% | 2.24% | 2.24% | 2.23% | 2.23% |
Net investment income (loss) | (.32)% | (.45)% | (.51)% | (.97)% | (1.17)% |
Supplemental Data | | | | | |
Net assets, end of period (000 omitted) | $ 2,362 | $ 2,564 | $ 3,079 | $ 7,874 | $ 16,120 |
Portfolio turnover rate E | 52% | 63% | 63% | 138% | 83% |
A Total returns would have been lower had certain expenses not been reduced during the periods shown.
B Total returns do not include the effect of the contingent deferred sales charge.
C Calculated based on average shares outstanding during the period.
D Fees and expenses of the underlying Fidelity Central Funds are not included in the Fund's expense ratio. The Fund indirectly bears its proportionate share of the expenses of any underlying Fidelity Central Funds.
E Amount does not include the portfolio activity of any underlying Fidelity Central Funds.
F Expense ratios reflect operating expenses of the class. Expenses before reductions do not reflect amounts reimbursed by the investment adviser or reductions from brokerage service arrangements or reductions from other expense offset arrangements and do not represent the amount paid by the class during periods when reimbursements or reductions occur. Expenses net of fee waivers reflect expenses after reimbursement by the investment adviser but prior to reductions from brokerage service arrangements or other expense offset arrangements. Expenses net of all reductions represent the net expenses paid by the class.
G Amount represents less than $.01 per share.
See accompanying notes which are an integral part of the financial statements.
Annual Report
Financial Highlights - Class C
Years ended October 31, | 2010 | 2009 | 2008 | 2007 | 2006 |
Selected Per-Share Data | | | | | |
Net asset value, beginning of period | $ 9.98 | $ 8.88 | $ 15.60 | $ 16.01 | $ 15.05 |
Income from Investment Operations | | | | | |
Net investment income (loss) C | (.03) | (.04) | (.07) | (.15) | (.18) |
Net realized and unrealized gain (loss) | .59 | 1.14 | (6.65) | (.26) | 1.13 |
Total from investment operations | .56 | 1.10 | (6.72) | (.41) | .95 |
Distributions from net realized gain | (.08) | - | - | - | - |
Redemption fees added to paid in capital C | - G | - G | - G | - G | .01 |
Net asset value, end of period | $ 10.46 | $ 9.98 | $ 8.88 | $ 15.60 | $ 16.01 |
Total Return A, B | 5.58% | 12.39% | (43.08)% | (2.56)% | 6.38% |
Ratios to Average Net Assets D, F | | | | | |
Expenses before reductions | 2.35% | 2.25% | 2.26% | 2.37% | 2.18% |
Expenses net of fee waivers, if any | 2.25% | 2.25% | 2.25% | 2.25% | 2.18% |
Expenses net of all reductions | 2.25% | 2.24% | 2.24% | 2.23% | 2.16% |
Net investment income (loss) | (.32)% | (.45)% | (.51)% | (.97)% | (1.10)% |
Supplemental Data | | | | | |
Net assets, end of period (000 omitted) | $ 9,267 | $ 9,286 | $ 11,612 | $ 33,957 | $ 53,846 |
Portfolio turnover rate E | 52% | 63% | 63% | 138% | 83% |
A Total returns would have been lower had certain expenses not been reduced during the periods shown.
B Total returns do not include the effect of the contingent deferred sales charge.
C Calculated based on average shares outstanding during the period.
D Fees and expenses of the underlying Fidelity Central Funds are not included in the Fund's expense ratio. The Fund indirectly bears its proportionate share of the expenses of any underlying Fidelity Central Funds.
E Amount does not include the portfolio activity of any underlying Fidelity Central Funds.
F Expense ratios reflect operating expenses of the class. Expenses before reductions do not reflect amounts reimbursed by the investment adviser or reductions from brokerage service arrangements or reductions from other expense offset arrangements and do not represent the amount paid by the class during periods when reimbursements or reductions occur. Expenses net of fee waivers reflect expenses after reimbursement by the investment adviser but prior to reductions from brokerage service arrangements or other expense offset arrangements. Expenses net of all reductions represent the net expenses paid by the class.
G Amount represents less than $.01 per share.
See accompanying notes which are an integral part of the financial statements.
Annual Report
Financial Highlights - Institutional Class
Years ended October 31, | 2010 | 2009 | 2008 | 2007 | 2006 |
Selected Per-Share Data | | | | | |
Net asset value, beginning of period | $ 10.93 | $ 9.62 | $ 16.82 | $ 17.10 | $ 15.90 |
Income from Investment Operations | | | | | |
Net investment income (loss) B | .08 | .06 | .08 | .01 | (.01) |
Net realized and unrealized gain (loss) | .64 | 1.25 | (7.19) | (.29) | 1.19 |
Total from investment operations | .72 | 1.31 | (7.11) | (.28) | 1.18 |
Distributions from net realized gain | (.19) | - | (.10) | - | - |
Redemption fees added to paid in capital B | - F | - F | .01 | - F | .02 |
Net asset value, end of period | $ 11.46 | $ 10.93 | $ 9.62 | $ 16.82 | $ 17.10 |
Total Return A | 6.65% | 13.62% | (42.45)% | (1.64)% | 7.55% |
Ratios to Average Net Assets C, E | | | | | |
Expenses before reductions | 1.22% | 1.19% | 1.16% | 1.31% | 1.12% |
Expenses net of fee waivers, if any | 1.22% | 1.19% | 1.16% | 1.25% | 1.12% |
Expenses net of all reductions | 1.22% | 1.17% | 1.15% | 1.23% | 1.10% |
Net investment income (loss) | .72% | .61% | .58% | .03% | (.04)% |
Supplemental Data | | | | | |
Net assets, end of period (000 omitted) | $ 4,211 | $ 3,995 | $ 3,820 | $ 8,440 | $ 13,773 |
Portfolio turnover rate D | 52% | 63% | 63% | 138% | 83% |
A Total returns would have been lower had certain expenses not been reduced during the periods shown.
B Calculated based on average shares outstanding during the period.
C Fees and expenses of the underlying Fidelity Central Funds are not included in the Fund's expense ratio. The Fund indirectly bears its proportionate share of the expenses of any underlying Fidelity Central Funds.
D Amount does not include the portfolio activity of any underlying Fidelity Central Funds.
E Expense ratios reflect operating expenses of the class. Expenses before reductions do not reflect amounts reimbursed by the investment adviser or reductions from brokerage service arrangements or reductions from other expense offset arrangements and do not represent the amount paid by the class during periods when reimbursements or reductions occur. Expenses net of fee waivers reflect expenses after reimbursement by the investment adviser but prior to reductions from brokerage service arrangements or other expense offset arrangements. Expenses net of all reductions represent the net expenses paid by the class.
F Amount represents less than $.01 per share.
See accompanying notes which are an integral part of the financial statements.
Annual Report
Notes to Financial Statements
For the period ended October 31, 2010
1. Organization.
Fidelity Advisor Japan Fund (the Fund) is a fund of Fidelity Advisor Series VIII (the Trust) and is authorized to issue an unlimited number of shares. The Trust is registered under the Investment Company Act of 1940, as amended (the 1940 Act), as an open-end management investment company organized as a Massachusetts business trust. The Fund offers Class A, Class T, Class C, and Institutional Class shares, each of which has equal rights as to assets and voting privileges. Effective after the close of business on September 1, 2010, Class B shares were closed to new accounts and additional purchases by existing shareholders. Each class has exclusive voting rights with respect to matters that affect that class. Class B shares will automatically convert to Class A shares after a holding period of seven years from the initial date of purchase. Investment income, realized and unrealized capital gains and losses, the common expenses of the Fund, and certain fund-level expense reductions, if any, are allocated on a pro-rata basis to each class based on the relative net assets of each class to the total net assets of the Fund. Each class differs with respect to transfer agent and distribution and service plan fees incurred. Certain expense reductions also differ by class.
2. Investments in Fidelity Central Funds.
The Fund may invest in Fidelity Central Funds, which are open-end investment companies available only to other investment companies and accounts managed by Fidelity Management & Research Company (FMR) and its affiliates. The Fund's Schedule of Investments lists each of the Fidelity Central Funds held as of period end, if any, as an investment of the Fund, but does not include the underlying holdings of each Fidelity Central Fund. As an Investing Fund, the Fund indirectly bears its proportionate share of the expenses of the underlying Fidelity Central Funds.
The Money Market Central Funds seek preservation of capital and current income and are managed by Fidelity Investments Money Management, Inc. (FIMM), an affiliate of FMR.
A complete unaudited list of holdings for each Fidelity Central Fund is available upon request or at the Securities and Exchange Commission (the SEC) web site at www.sec.gov. In addition, the financial statements of the Fidelity Central Funds which are not covered by the Fund's Report of Independent Registered Public Accounting Firm, are available on the SEC web site or upon request.
3. Significant Accounting Policies.
The financial statements have been prepared in conformity with accounting principles generally accepted in the United States of America (GAAP), which require management to make certain estimates and assumptions at the date of the financial statements. Actual results could differ from those estimates. The following summarizes the significant accounting policies of the Fund:
Annual Report
3. Significant Accounting Policies - continued
Security Valuation. Investments are valued as of 4:00 p.m. Eastern time on the last calendar day of the period. The Fund uses independent pricing services approved by the Board of Trustees to value its investments. When current market prices or quotations are not readily available or reliable, valuations may be determined in good faith in accordance with procedures adopted by the Board of Trustees. Factors used in determining value may include market or security specific events. The frequency with which these procedures are used cannot be predicted and they may be utilized to a significant extent. The value used for net asset value (NAV) calculation under these procedures may differ from published prices for the same securities.
The Fund categorizes the inputs to valuation techniques used to value its investments into a disclosure hierarchy consisting of three levels as shown below.
Level 1 - quoted prices in active markets for identical investments
Level 2 - other significant observable inputs (including quoted prices for similar investments, interest rates, prepayment speeds, etc.)
Level 3 - unobservable inputs (including the fund's own assumptions based on the best information available)
Changes in valuation techniques may result in transfers in or out of an assigned level within the disclosure hierarchy. The aggregate value of investments by input level, as of October 31, 2010, is included at the end of the Fund's Schedule of Investments. Valuation techniques used to value the Fund's investments by major category are as follows.
Equity securities, including restricted securities, for which market quotations are readily available, are valued at the last reported sale price or official closing price as reported by an independent pricing service on the primary market or exchange on which they are traded and are categorized as Level 1 in the hierarchy. In the event there were no sales during the day or closing prices are not available, securities are valued at the last quoted bid price or may be valued using the last available price and are generally categorized as Level 2 in the hierarchy. For foreign equity securities, when significant market or security specific events arise, comparisons to the valuation of American Depositary Receipts (ADRs), futures contracts, Exchange-traded funds (ETFs) and certain indexes as well as quoted prices for similar securities are used and are categorized as Level 2 in the hierarchy in these circumstances. Utilizing these techniques may result in significant transfers between Level 1 and Level 2. For restricted equity securities and private placements where observable inputs are limited, assumptions about market activity and risk are used and are categorized as Level 3 in the hierarchy.
Investments in open-end mutual funds, including the Fidelity Central Funds, are valued at their closing net asset value each business day and are categorized as Level 1 in the
Annual Report
Notes to Financial Statements - continued
3. Significant Accounting Policies - continued
Security Valuation - continued
hierarchy. Short-term securities with remaining maturities of sixty days or less for which quotations are not readily available are valued at amortized cost, which approximates fair value and are categorized as Level 2 in the hierarchy.
Foreign Currency. The Fund uses foreign currency contracts to facilitate transactions in foreign-denominated securities. Gains and losses from these transactions may arise from changes in the value of the foreign currency or if the counterparties do not perform under the contracts' terms.
Foreign-denominated assets, including investment securities, and liabilities are translated into U.S. dollars at the exchange rate at period end. Purchases and sales of investment securities, income and dividends received and expenses denominated in foreign currencies are translated into U.S. dollars at the exchange rate in effect on the transaction date.
The effects of exchange rate fluctuations on investments are included with the net realized and unrealized gain (loss) on investment securities. Other foreign currency transactions resulting in realized and unrealized gain (loss) are disclosed separately.
Investment Transactions and Income. For financial reporting purposes, the Fund's investment holdings and NAV include trades executed through the end of the last business day of the period. The NAV per share for processing shareholder transactions is calculated as of the close of business of the New York Stock Exchange (NYSE), normally 4:00 p.m. Eastern time and includes trades executed through the end of the prior business day. Gains and losses on securities sold are determined on the basis of identified cost. Dividend income is recorded on the ex-dividend date, except for certain dividends from foreign securities where the ex-dividend date may have passed, which are recorded as soon as the Fund is informed of the ex-dividend date. Non-cash dividends included in dividend income, if any, are recorded at the fair market value of the securities received. Interest income and distributions from the Fidelity Central Funds are accrued as earned. Interest income includes coupon interest and amortization of premium and accretion of discount on debt securities. Investment income is recorded net of foreign taxes withheld where recovery of such taxes is uncertain.
Expenses. Most expenses of the Trust can be directly attributed to a fund. Expenses which cannot be directly attributed are apportioned amongst each fund in the Trust. Expense estimates are accrued in the period to which they relate and adjustments are made when actual amounts are known.
Income Tax Information and Distributions to Shareholders. Each year the Fund intends to qualify as a regulated investment company, including distributing substantially all of its taxable income and realized gains under Subchapter M of the Internal
Annual Report
3. Significant Accounting Policies - continued
Income Tax Information and Distributions to Shareholders - continued
Revenue Code and filing its U.S. federal tax return. As a result, no provision for income taxes is required. As of October 31, 2010, the Fund did not have any unrecognized tax benefits in the accompanying financial statements. A fund's federal tax return is subject to examination by the Internal Revenue Service (IRS) for a period of three years. Foreign taxes are provided for based on the Fund's understanding of the tax rules and rates that exist in the foreign markets in which it invests.
Distributions are declared and recorded on the ex-dividend date. Income dividends and capital gain distributions are declared separately for each class. Income and capital gain distributions are determined in accordance with income tax regulations, which may differ from GAAP.
Capital accounts within the financial statements are adjusted for permanent book-tax differences. These adjustments have no impact on net assets or the results of operations. Temporary book-tax differences will reverse in a subsequent period.
Book-tax differences are primarily due to the short-term gain distributions from the Fidelity Central Funds, foreign currency transactions, passive foreign investment companies (PFIC), capital loss carryforwards, expiring capital loss carryforwards and losses deferred due to wash sales.
The federal tax cost of investment securities and unrealized appreciation (depreciation) as of period end were as follows:
Gross unrealized appreciation | $ 1,393,464 |
Gross unrealized depreciation | (7,587,369) |
Net unrealized appreciation (depreciation) | $ (6,193,905) |
| |
Tax Cost | $ 40,828,050 |
The tax-based components of distributable earnings as of period end were as follows:
Undistributed ordinary income | $ 438,831 |
Capital loss carryforward | $ (25,985,158) |
Net unrealized appreciation (depreciation) | $ (6,181,501) |
The tax character of distributions paid was as follows:
| October 31, 2010 | October 31, 2009 |
Ordinary Income | $ 376,323 | $ - |
Annual Report
Notes to Financial Statements - continued
3. Significant Accounting Policies - continued
Short-Term Trading (Redemption) Fees. Shares held by investors in the Fund less than 90 days are subject to a redemption fee equal to 1.50% of the net asset value of shares redeemed. All redemption fees, which reduce the proceeds of the shareholder redemption, are retained by the Fund and accounted for as an addition to paid in capital.
4. Purchases and Sales of Investments.
Purchases and sales of securities, other than short-term securities, aggregated $17,440,273 and $18,229,788, respectively.
5. Fees and Other Transactions with Affiliates.
Management Fee. FMR and its affiliates provide the Fund with investment management related services for which the Fund pays a monthly management fee. The management fee is the sum of an individual fund fee rate that is based on an annual rate of .45% of the Fund's average net assets and a group fee rate that averaged .26% during the period. The group fee rate is based upon the average net assets of all the mutual funds advised by FMR. The group fee rate decreases as assets under management increase and increases as assets under management decrease. In addition, the management fee is subject to a performance adjustment (up to a maximum of ± .20% of the Fund's average net assets over a 36 month performance period). The upward or downward adjustment to the management fee is based on the relative investment performance of the Institutional class of the Fund, as compared to an appropriate benchmark index. For the period, the total annual management fee rate, including the performance adjustment, was .56% of the Fund's average net assets.
Distribution and Service Plan Fees. In accordance with Rule 12b-1 of the 1940 Act, the Fund has adopted separate Distribution and Service Plans for each class of shares. Certain classes pay Fidelity Distributors Corporation (FDC), an affiliate of FMR, separate Distribution and Service Fees, each of which is based on an annual percentage of each class' average net assets. In addition, FDC may pay financial intermediaries for selling shares of the Fund and providing shareholder support services. For the period, the Distribution and Service Fee rates, total fees and amounts retained by FDC were as follows:
| Distribution
Fee | Service
Fee | Total Fees | Retained
by FDC |
Class A | -% | .25% | $ 35,299 | $ 1,649 |
Class T | .25% | .25% | 26,408 | 44 |
Class B | .75% | .25% | 26,095 | 19,592 |
Class C | .75% | .25% | 97,412 | 22,002 |
| | | $ 185,214 | $ 43,287 |
Annual Report
5. Fees and Other Transactions with Affiliates - continued
Sales Load. FDC receives a front-end sales charge of up to 5.75% for selling Class A shares, and 3.50% for selling Class T shares, some of which is paid to financial intermediaries for selling shares of the Fund. FDC receives the proceeds of contingent deferred sales charges levied on Class A, Class T, Class B, and Class C redemptions. These charges depend on the holding period. The deferred sales charges range from 5% to 1% for Class B, 1% for Class C, 1.00% for certain purchases of Class A shares (1.00% to .50% prior to July 12, 2010) and .25% for certain purchases of Class T shares.
For the period, sales charge amounts retained by FDC were as follows:
| Retained
by FDC |
Class A | $ 6,389 |
Class T | 1,601 |
Class B* | 5,333 |
Class C* | 2,588 |
| $ 15,911 |
* When Class B and Class C shares are initially sold, FDC pays commissions from its own resources to financial intermediaries through which the sales are made.
Transfer Agent Fees. Fidelity Investments Institutional Operations Company, Inc. (FIIOC), an affiliate of FMR, is the transfer, dividend disbursing and shareholder servicing agent for each class of the Fund. FIIOC receives account fees and asset-based fees that vary according to the account size and type of account of the shareholders of the respective classes of the Fund. FIIOC pays for typesetting, printing and mailing of shareholder reports, except proxy statements. For the period, transfer agent fees for each class were as follows:
| Amount | % of
Average
Net Assets |
Class A | $ 44,291 | .31 |
Class T | 18,350 | .35 |
Class B | 8,250 | .32 |
Class C | 30,433 | .31 |
Institutional Class | 8,182 | .19 |
| $ 109,506 | |
Accounting and Security Lending Fees. Fidelity Service Company, Inc. (FSC), an affiliate of FMR, maintains the Fund's accounting records. The accounting fee is based on the level of average net assets for the month. Under a separate contract, FSC administers the security lending program. The security lending fee is based on the number and duration of lending transactions.
Annual Report
Notes to Financial Statements - continued
6. Committed Line of Credit.
The Fund participates with other funds managed by FMR or an affiliate in a $3.75 billion credit facility (the "line of credit") to be utilized for temporary or emergency purposes to fund shareholder redemptions or for other short-term liquidity purposes. The Fund has agreed to pay commitment fees on its pro-rata portion of the line of credit, which amounted to $142 and is reflected in Miscellaneous expenses on the Statement of Operations. During the period, there were no borrowings on this line of credit.
7. Security Lending.
The Fund lends portfolio securities through a lending agent from time to time in order to earn additional income. The lending agent may loan securities to certain qualified borrowers, including Fidelity Capital Markets (FCM), a broker-dealer affiliated with the Fund. On the settlement date of the loan, the Fund receives collateral (in the form of U.S. Treasury obligations, letters of credit and/or cash) against the loaned securities and maintains collateral in an amount not less than 100% of the market value of the loaned securities during the period of the loan. The market value of the loaned securities is determined at the close of business of the Fund and any additional required collateral is delivered to the Fund on the next business day. If the borrower defaults on its obligation to return the securities loaned because of insolvency or other reasons, a fund could experience delays and costs in recovering the securities loaned or in gaining access to the collateral. Any cash collateral received is invested in the Fidelity Securities Lending Cash Central Fund. At period end, there were no security loans outstanding. Security lending income represents the income earned on investing cash collateral, less rebates paid to borrowers and lending agent fees associated with the loan, plus any premium payments received for lending certain types of securities. Security lending income is presented in the Statement of Operations as a component of income from Fidelity Central Funds. Total security lending income during the period amounted to $352. During the period, there were no securities loaned to FCM.
8. Expense Reductions.
FMR voluntarily agreed to reimburse each class to the extent annual operating expenses exceeded certain levels of average net assets as noted in the table below. Some expenses, for example interest expense, including commitment fees, are excluded from this reimbursement.
Annual Report
8. Expense Reductions - continued
The following classes were in reimbursement during the period:
| Expense
Limitations | Reimbursement
from adviser |
Class A | 1.50% | $ 12,287 |
Class T | 1.75% | 7,230 |
Class B | 2.25% | 2,764 |
Class C | 2.25% | 9,436 |
| | $ 31,717 |
Effective November 1, 2010 the expense limitations will be changed to 1.45%, 1.70%, 2.20%, 2.20% and 1.20%, for Class A, Class T, Class B, Class C and Institutional Class, respectively.
In addition, through arrangements with the Fund's custodian, credits realized as a result of uninvested cash balances were used to reduce the Fund's expenses. During the period, these credits reduced the Fund's custody expenses by $3.
9. Distributions to Shareholders.
Distributions to shareholders of each class were as follows:
Years ended October 31, | 2010 | 2009 |
From net realized gain | | |
Class A | $ 169,692 | $ - |
Class T | 56,316 | - |
Class B | 19,672 | - |
Class C | 68,018 | - |
Institutional Class | 62,625 | - |
Total | $ 376,323 | $ - |
Annual Report
Notes to Financial Statements - continued
10. Share Transactions.
Transactions for each class of shares were as follows:
| Shares | Dollars |
Years ended October 31, | 2010 | 2009 | 2010 | 2009 |
Class A | | | | |
Shares sold | 748,157 | 387,815 | $ 8,391,879 | $ 3,955,890 |
Reinvestment of distributions | 12,486 | - | 136,600 | - |
Shares redeemed | (711,427) | (690,213) | (7,898,774) | (6,443,696) |
Net increase (decrease) | 49,216 | (302,398) | $ 629,705 | $ (2,487,806) |
Class T | | | | |
Shares sold | 100,270 | 85,871 | $ 1,118,342 | $ 821,641 |
Reinvestment of distributions | 4,803 | - | 51,676 | - |
Shares redeemed | (173,139) | (291,704) | (1,856,581) | (2,612,466) |
Net increase (decrease) | (68,066) | (205,833) | $ (686,563) | $ (1,790,825) |
Class B | | | | |
Shares sold | 95,243 | 33,684 | $ 1,007,461 | $ 311,723 |
Reinvestment of distributions | 1,391 | - | 14,289 | - |
Shares redeemed | (127,802) | (124,191) | (1,327,780) | (1,068,104) |
Net increase (decrease) | (31,168) | (90,507) | $ (306,030) | $ (756,381) |
Class C | | | | |
Shares sold | 319,999 | 185,921 | $ 3,427,507 | $ 1,754,348 |
Reinvestment of distributions | 4,614 | - | 47,750 | - |
Shares redeemed | (369,025) | (563,483) | (3,805,333) | (4,904,518) |
Net increase (decrease) | (44,412) | (377,562) | $ (330,076) | $ (3,150,170) |
Institutional Class | | | | |
Shares sold | 283,408 | 90,905 | $ 3,342,911 | $ 979,010 |
Reinvestment of distributions | 1,088 | - | 12,214 | - |
Shares redeemed | (282,547) | (122,531) | (3,145,978) | (1,098,675) |
Net increase (decrease) | 1,949 | (31,626) | $ 209,147 | $ (119,665) |
11. Other.
The Fund's organizational documents provide former and current trustees and officers with a limited indemnification against liabilities arising in connection with the performance of their duties to the Fund. In the normal course of business, the Fund may also enter into contracts that provide general indemnifications. The Fund's maximum exposure under these arrangements is unknown as this would be dependent on future claims that may be made against the Fund. The risk of material loss from such claims is considered remote.
Annual Report
12. Proposed Reorganization.
The Board of Trustees of the Fund has approved an Agreement and Plan of Reorganization between the Fund and Fidelity Japan Fund. The agreement provides for the transfer of all of the assets and the assumption of all the liabilities of the Fund in exchange solely for the number of equivalent shares of Fidelity Japan Fund having the same aggregate net asset value as the outstanding shares of the corresponding classes of the Fund on the day the reorganization is effective.
The reorganization was approved by the shareholders and is expected to become effective on or about December 17, 2010. The reorganization is expected to qualify as a tax-free transaction with no gain or loss recognized by the Funds or their shareholders.
Annual Report
To the Trustees of Fidelity Advisor Series VIII and the Shareholders of Fidelity Advisor Japan Fund:
In our opinion, the accompanying statement of assets and liabilities, including the schedule of investments, and the related statements of operations and of changes in net assets and the financial highlights present fairly, in all material respects, the financial position of Fidelity Advisor Japan Fund (a fund of Fidelity Advisor Series VIII) at October 31, 2010, the results of its operations for the year then ended, the changes in its net assets for each of the two years in the period then ended and the financial highlights for each of the five years in the period then ended, in conformity with accounting principles generally accepted in the United States of America. These financial statements and financial highlights (hereafter referred to as "financial statements") are the responsibility of the Fidelity Advisor Japan Fund's management. Our responsibility is to express an opinion on these financial statements based on our audits. We conducted our audits of these financial statements in accordance with the standards of the Public Company Accounting Oversight Board (United States). Those standards require that we plan and perform the audit to obtain reasonable assurance about whether the financial statements are free of material misstatement. An audit includes examining, on a test basis, evidence supporting the amounts and disclosures in the financial statements, assessing the accounting principles used and significant estimates made by management, and evaluating the overall financial statement presentation. We believe that our audits, which included confirmation of securities at October 31, 2010 by correspondence with the custodian and brokers, provide a reasonable basis for our opinion.
/s/ PricewaterhouseCoopers LLP
PricewaterhouseCoopers LLP
Boston, Massachusetts
December 13, 2010
Annual Report
The Trustees, Member of the Advisory Board, and executive officers of the trust and fund, as applicable, are listed below. The Board of Trustees governs the fund and is responsible for protecting the interests of shareholders. The Trustees are experienced executives who meet periodically throughout the year to oversee the fund's activities, review contractual arrangements with companies that provide services to the fund, oversee management of the risks associated with such activities and contractual arrangements, and review the fund's performance. Except for James C. Curvey, each of the Trustees oversees 221 funds advised by FMR or an affiliate. Mr. Curvey oversees 410 funds advised by FMR or an affiliate.
The Trustees hold office without limit in time except that (a) any Trustee may resign; (b) any Trustee may be removed by written instrument, signed by at least two-thirds of the number of Trustees prior to such removal; (c) any Trustee who requests to be retired or who has become incapacitated by illness or injury may be retired by written instrument signed by a majority of the other Trustees; and (d) any Trustee may be removed at any special meeting of shareholders by a two-thirds vote of the outstanding voting securities of the trust. Each Trustee who is not an interested person (as defined in the 1940 Act) (Independent Trustee), shall retire not later than the last day of the calendar year in which his or her 72nd birthday occurs. The Independent Trustees may waive this mandatory retirement age policy with respect to individual Trustees. The executive officers and Advisory Board Member hold office without limit in time, except that any officer and Advisory Board Member may resign or may be removed by a vote of a majority of the Trustees at any regular meeting or any special meeting of the Trustees. Except as indicated, each individual has held the office shown or other offices in the same company for the past five years.
Experience, Skills, Attributes, and Qualifications of the Fund's Trustees. The Governance and Nominating Committee has adopted a statement of policy that describes the experience, qualifications, attributes, and skills that are necessary and desirable for potential Independent Trustee candidates (Statement of Policy). The Board believes that each Trustee satisfied at the time he or she was initially elected or appointed a Trustee, and continues to satisfy, the standards contemplated by the Statement of Policy. The Governance and Nominating Committee also engages professional search firms to help identify potential Independent Trustee candidates who have the experience, qualifications, attributes, and skills consistent with the Statement of Policy. From time to time, additional criteria based on the composition and skills of the current Independent Trustees, as well as experience or skills that may be appropriate in light of future changes to board composition, business conditions, and regulatory or other developments, have also been considered by the professional search firms and the Governance and Nominating Committee. In addition, the Board takes into account the Trustees' commitment and participation in Board and committee meetings, as well as their leadership of standing and ad hoc committees throughout their tenure.
In determining that a particular Trustee was and continues to be qualified to serve as a Trustee, the Board has considered a variety of criteria, none of which, in isolation, was controlling. The Board believes that, collectively, the Trustees have balanced and diverse experience, qualifications, attributes, and skills, which allow the Board to operate effectively in governing the fund and protecting the interests of shareholders. Information about the specific experience, skills, attributes, and qualifications of each Trustee, which in each case led to the Board's conclusion that the Trustee should serve (or continue to serve) as a trustee of the fund, is provided below.
Annual Report
Board Structure and Oversight Function. Edward C. Johnson 3d is an interested person (as defined in the 1940 Act) and currently serves as Chairman. The Trustees have determined that an interested Chairman is appropriate and benefits shareholders because an interested Chairman has a personal and professional stake in the quality and continuity of services provided to the fund. Independent Trustees exercise their informed business judgment to appoint an individual of their choosing to serve as Chairman, regardless of whether the Trustee happens to be independent or a member of management. The Independent Trustees have determined that they can act independently and effectively without having an Independent Trustee serve as Chairman and that a key structural component for assuring that they are in a position to do so is for the Independent Trustees to constitute a substantial majority for the Board. The Independent Trustees also regularly meet in executive session. Ned C. Lautenbach serves as Chairman of the Independent Trustees and as such (i) acts as a liaison between the Independent Trustees and management with respect to matters important to the Independent Trustees and (ii) with management prepares agendas for Board meetings.
Fidelity funds are overseen by different Boards of Trustees. The fund's Board oversees Fidelity's equity and high income funds and another Board oversees Fidelity's investment-grade bond, money market, and asset allocation funds. The asset allocation funds may invest in Fidelity funds overseen by the fund's Board. The use of separate Boards, each with its own committee structure, allows the Trustees of each group of Fidelity funds to focus on the unique issues of the funds they oversee, including common research, investment, and operational issues. On occasion, the separate Boards establish joint committees to address issues of overlapping consequences for the Fidelity funds overseen by each Board.
The Trustees operate using a system of committees to facilitate the timely and efficient consideration of all matters of importance to the Trustees, the fund, and fund shareholders and to facilitate compliance with legal and regulatory requirements and oversight of the fund's activities and associated risks. The Board, acting through its committees, has charged FMR and its affiliates with (i) identifying events or circumstances the occurrence of which could have demonstrably adverse effects on the fund's business and/or reputation; (ii) implementing processes and controls to lessen the possibility that such events or circumstances occur or to mitigate the effects of such events or circumstances if they do occur; and (iii) creating and maintaining a system designed to evaluate continuously business and market conditions in order to facilitate the identification and implementation processes described in (i) and (ii) above. Because the day-to-day operations and activities of the fund are carried out by or through FMR, its affiliates and other service providers, the fund's exposure to risks is mitigated but not eliminated by the processes overseen by the Trustees. While each of the Board's committees has responsibility for overseeing different aspects of the fund's activities, oversight is exercised primarily through the Operations, Audit, and Compliance Committees. Appropriate personnel, including but not limited to the fund's Chief Compliance Officer (CCO), FMR's internal auditor, the independent accountants, the fund's Treasurer and portfolio management personnel, make periodic reports to the Board's committees, as appropriate. The responsibilities of each committee, including their oversight responsibilities, are described further under "Standing Committees of the Fund's Trustees."
Annual Report
Trustees and Officers - continued
The fund's Statement of Additional Information (SAI) includes more information about the Trustees. To request a free copy, call Fidelity at 1-877-208-0098.
Interested Trustees*:
Correspondence intended for each Trustee who is an interested person may be sent to Fidelity Investments, 82 Devonshire Street, Boston, Massachusetts 02109.
Name, Age; Principal Occupations and Other Relevant Experience+ |
Edward C. Johnson 3d (80) |
| Year of Election or Appointment: 1984 Mr. Johnson is Trustee and Chairman of the Board of Trustees of certain Trusts. Mr. Johnson serves as Chief Executive Officer, Chairman, and a Director of FMR LLC; Chairman and a Director of FMR; Chairman and a Director of Fidelity Research & Analysis Company (FRAC); Chairman and a Director of Fidelity Investments Money Management, Inc.; and Chairman and a Director of FMR Co., Inc. In addition, Mr. Johnson serves as Chairman and Director of FIL Limited. Previously, Mr. Johnson served as President of FMR LLC (2006-2007). |
James C. Curvey (75) |
| Year of Election or Appointment: 2007 Mr. Curvey also serves as Trustee (2007-present) of other investment companies advised by FMR. Mr. Curvey is a Director of Fidelity Investments Money Management, Inc. (2009-present), Director of Fidelity Research & Analysis Co. (2009-present) and Director of FMR and FMR Co., Inc. (2007-present). Mr. Curvey is also Vice Chairman (2007-present) and Director of FMR LLC. In addition, Mr. Curvey serves as an Overseer for the Boston Symphony Orchestra and a member of the Trustees of Villanova University. Previously, Mr. Curvey was the Vice Chairman (2006-2007) and Director (2000-2007) of FMR Corp. |
* Trustees have been determined to be "Interested Trustees" by virtue of, among other things, their affiliation with the trust or various entities under common control with FMR.
+ The information above includes each Trustee's principal occupation during the last five years and other information relating to the experience, attributes, and skills relevant to each Trustee's qualifications to serve as a Trustee, which led to the conclusion that each Trustee should serve as a Trustee for the fund.
Independent Trustees:
Correspondence intended for each Independent Trustee (that is, the Trustees other than the Interested Trustees) may be sent to Fidelity Investments, P.O. Box 55235, Boston, Massachusetts 02205-5235.
Name, Age; Principal Occupations and Other Relevant Experience+ |
Dennis J. Dirks (62) |
| Year of Election or Appointment: 2005 Prior to his retirement in May 2003, Mr. Dirks was Chief Operating Officer and a member of the Board of The Depository Trust & Clearing Corporation (DTCC). He also served as President, Chief Operating Officer, and Board member of The Depository Trust Company (DTC) and President and Board member of the National Securities Clearing Corporation (NSCC). In addition, Mr. Dirks served as Chief Executive Officer and Board member of the Government Securities Clearing Corporation, Chief Executive Officer and Board member of the Mortgage-Backed Securities Clearing Corporation, as a Trustee and a member of the Finance Committee of Manhattan College (2005-2008), and as a Trustee and a member of the Finance Committee of AHRC of Nassau County (2006-2008). Mr. Dirks is a member of the Independent Directors Council (IDC) Governing Council (2010-Present) and Board of Directors for The Brookville Center for Children's Services, Inc. (2009-present). |
Alan J. Lacy (57) |
| Year of Election or Appointment: 2008 Mr. Lacy serves as Senior Adviser (2007-present) of Oak Hill Capital Partners, L.P. (private equity). Mr. Lacy also served as Chief Executive Officer (2000-2005) and Vice Chairman (2005-2006) of Sears Holdings Corporation and Sears, Roebuck and Co. (retail). In addition, Mr. Lacy serves as a member of the Board of Directors of The Western Union Company (global money transfer, 2006-present) and Bristol-Myers Squibb Company (global pharmaceuticals, 2007-present). Mr. Lacy is Chairman (2008-present) and a member (2006-present) of the Board of Trustees of The National Parks Conservation Association. |
Ned C. Lautenbach (66) |
| Year of Election or Appointment: 2000 Mr. Lautenbach is Chairman of the Independent Trustees of the Equity and High Income Funds (2006-present). Mr. Lautenbach currently serves as the Lead Director of the Eaton Corporation Board of Directors (diversified industrial, 1997-present). Mr. Lautenbach is also a member of the Board of Directors of the Philharmonic Center for the Arts in Naples, Florida (1999-present); a member of the Board of Trustees of Fairfield University (2005-present); and a member of the Council on Foreign Relations (1994-present). Previously, Mr. Lautenbach was a Partner/Advisory Partner at Clayton, Dubilier & Rice, Inc. (private equity investment, 1998-2010), as well as a Director of Sony Corporation (2006-2007). |
Joseph Mauriello (66) |
| Year of Election or Appointment: 2008 Prior to his retirement in January 2006, Mr. Mauriello served in numerous senior management positions including Deputy Chairman and Chief Operating Officer (2004-2005), and Vice Chairman of Financial Services (2002-2004) of KPMG LLP US (professional services, 1965-2005). Mr. Mauriello currently serves as a member of the Board of Directors of XL Group plc. (global insurance and re-insurance, 2006-present) and of Arcadia Resources Inc. (health care services and products, 2007-present). Previously, Mr. Mauriello served as a Director of the Hamilton Funds of the Bank of New York (2006-2007). |
Cornelia M. Small (66) |
| Year of Election or Appointment: 2005 Ms. Small is a member of the Board of Directors of the Teagle Foundation (2009-present). Ms. Small is also a member of the Investment Committee, and Chair (2008-present) and a member of the Board of Trustees of Smith College. In addition, Ms. Small serves on the Investment Committee of the Berkshire Taconic Community Foundation (2008-present). Previously, Ms. Small served as Chairperson of the Investment Committee (2002-2008) of Smith College. In addition, Ms. Small served as Chief Investment Officer, Director of Global Equity Investments, and a member of the Board of Directors of Scudder, Stevens & Clark and Scudder Kemper Investments. |
William S. Stavropoulos (71) |
| Year of Election or Appointment: 2001 Mr. Stavropoulos is Vice Chairman of the Independent Trustees of the Equity and High Income Funds (2006-present). Mr. Stavropoulos serves as President and Founder of the Michigan Baseball Foundation, the Great Lakes Loons (2007-present). Mr. Stavropoulos is Chairman Emeritus of the Board of Directors of The Dow Chemical Company, where he previously served in numerous senior management positions, including President, CEO (1995-2000; 2002-2004), Chairman of the Executive Committee (2000-2006), and as a member of the Board of Directors (1990-2006). Currently, Mr. Stavropoulos is Chairman of Univar (global distributor of commodity and specialty chemicals, 2010-present), a Director of Teradata Corporation (data warehousing and technology solutions, 2008-present), Chemical Financial Corporation, Maersk Inc. (industrial conglomerate), Tyco International, Inc. (multinational manufacturing and services, 2007-present), and a member of the Advisory Board for Metalmark Capital (private equity investment, 2005-present). Mr. Stavropoulos is a special advisor to Clayton, Dubilier & Rice, Inc. (private equity investment). In addition, Mr. Stavropoulos is a member of the University of Notre Dame Advisory Council for the College of Science. |
David M. Thomas (61) |
| Year of Election or Appointment: 2008 Previously, Mr. Thomas served as Executive Chairman (2005-2006) and Chairman and Chief Executive Officer (2000-2005) of IMS Health, Inc. (pharmaceutical and healthcare information solutions). In addition, Mr. Thomas serves as a member of the Board of Directors of Fortune Brands, Inc. (consumer products), and Interpublic Group of Companies, Inc. (marketing communication, 2004-present). |
Michael E. Wiley (60) |
| Year of Election or Appointment: 2008 Mr. Wiley also serves as a Director of Asia Pacific Exploration Consolidated (international oil and gas exploration and production, 2008-present). Mr. Wiley serves as a Director of Tesoro Corporation (independent oil refiner and marketer, 2005-present), and a Director of Bill Barrett Corporation (exploration and production, 2005-present). In addition, Mr. Wiley also serves as a Director of Post Oak Bank (privately-held bank, 2004-present). Previously, Mr. Wiley served as a member of the Board of Trustees of the University of Tulsa (2000-2006; 2007-2010), as a Senior Energy Advisor of Katzenbach Partners, LLC (consulting, 2006-2007), as an Advisory Director of Riverstone Holdings (private investment), Chairman, President, and CEO of Baker Hughes, Inc. (oilfield services, 2000-2004), and as Director of Spinnaker Exploration Company (exploration and production, 2001-2005). |
+ The information above includes each Trustee's principal occupation during the last five years and other information relating to the experience, attributes, and skills relevant to each Trustee's qualifications to serve as a Trustee, which led to the conclusion that each Trustee should serve as a Trustee for the fund.
Advisory Board Member and Executive Officers:
Correspondence intended for each executive officer and Peter S. Lynch may be sent to Fidelity Investments, 82 Devonshire Street, Boston, Massachusetts 02109.
Name, Age; Principal Occupation |
Peter S. Lynch (66) |
| Year of Election or Appointment: 2003 Member of the Advisory Board of Fidelity's Equity and High Income Funds. Mr. Lynch is Vice Chairman and a Director of FMR and FMR Co., Inc. In addition, Mr. Lynch serves as a Trustee of Boston College and as the Chairman of the Inner-City Scholarship Fund. Previously, Mr. Lynch served on the Special Olympics International Board of Directors (1997-2006). |
Kenneth B. Robins (41) |
| Year of Election or Appointment: 2008 President and Treasurer of Fidelity's Equity and High Income Funds. Mr. Robins also serves as President and Treasurer (2010-present) and Assistant Treasurer (2009-present) of other Fidelity funds and is an employee of Fidelity Investments (2004-present). Previously, Mr. Robins served as Deputy Treasurer of the Fidelity funds (2005-2008) and Treasurer and Chief Financial Officer of The North Carolina Capital Management Trust: Cash and Term Portfolios (2006-2008). |
Bruce T. Herring (45) |
| Year of Election or Appointment: 2006 Vice President of certain Equity Funds. Mr. Herring also serves as Chief Investment Officer and Director of Fidelity Management & Research (U.K.) Inc. (2010-present) and Group Chief Investments Officer of FMR. Previously, Mr. Herring served as Vice President (2005-2006) and Senior Vice President (2006-2007) of Fidelity Management & Research Company, Vice President of FMR Co., Inc. (2001-2007) and as a portfolio manager for Fidelity U.S. Equity Funds. |
Brian B. Hogan (46) |
| Year of Election or Appointment: 2009 Vice President of certain Equity Funds and Vice President of Sector Funds. Mr. Hogan also serves as President of FMR's Equity Division (2009-present). Previously, Mr. Hogan served as Senior Vice President, Equity Research of FMR (2006-2009) and as a portfolio manager. |
Scott C. Goebel (42) |
| Year of Election or Appointment: 2008 Secretary and Chief Legal Officer (CLO) of the Fidelity funds. Mr. Goebel also serves as Secretary and CLO of The North Carolina Capital Management Trust: Cash and Term Portfolio (2008-present); General Counsel, Secretary, and Senior Vice President of FMR (2008-present) and FMR Co., Inc. (2008-present); Deputy General Counsel of FMR LLC; Chief Legal Officer of Fidelity Management & Research (Hong Kong) Limited (2008-present) and Assistant Secretary of Fidelity Management & Research (Japan) Inc. (2008-present), Fidelity Investments Money Management, Inc. (2008-present), Fidelity Management & Research (U.K.) Inc. (2008-present), and Fidelity Research and Analysis Company (2008-present). Previously, Mr. Goebel served as Assistant Secretary of the Funds (2007-2008) and as Vice President and Secretary of Fidelity Distributors Corporation (FDC) (2005-2007). |
William C. Coffey (41) |
| Year of Election or Appointment: 2009 Assistant Secretary of Fidelity's Equity and High Income Funds. Mr. Coffey also serves as Senior Vice President and Deputy General Counsel of FMR LLC (2010-present), and is an employee of Fidelity Investments. Previously, Mr. Coffey served as Vice President and Associate General Counsel of FMR LLC (2005-2009). |
Holly C. Laurent (56) |
| Year of Election or Appointment: 2008 Anti-Money Laundering (AML) Officer of the Fidelity funds. Ms. Laurent also serves as AML Officer of The North Carolina Capital Management Trust: Cash and Term Portfolio (2008-present) and is an employee of Fidelity Investments. Previously, Ms. Laurent was Senior Vice President and Head of Legal for Fidelity Business Services India Pvt. Ltd. (2006-2008), and Senior Vice President, Deputy General Counsel and Group Head for FMR LLC (2005-2006). |
Christine Reynolds (52) |
| Year of Election or Appointment: 2008 Chief Financial Officer of the Fidelity funds. Ms. Reynolds became President of Fidelity Pricing and Cash Management Services (FPCMS) in August 2008. Ms. Reynolds served as Chief Operating Officer of FPCMS (2007-2008). Previously, Ms. Reynolds served as President, Treasurer, and Anti-Money Laundering officer of the Fidelity funds (2004-2007). |
Kenneth A. Rathgeber (63) |
| Year of Election or Appointment: 2004 Chief Compliance Officer of Fidelity's Equity and High Income Funds. Mr. Rathgeber is Chief Compliance Officer of Fidelity Management & Research (Hong Kong) Limited (2008-present), Fidelity Management & Research (Japan) Inc. (2008-present), FMR (2005-present), FMR Co., Inc. (2005-present), Fidelity Management & Research (U.K.) Inc. (2005-present), Fidelity Research & Analysis Company (2005-present), Fidelity Investments Money Management, Inc. (2005-present), Pyramis Global Advisors, LLC (2005-present), and Strategic Advisers, Inc. (2005-present). |
Jeffrey S. Christian (49) |
| Year of Election or Appointment: 2009 Deputy Treasurer of the Fidelity funds. Mr. Christian is an employee of Fidelity Investments. Previously, Mr. Christian served as Chief Financial Officer (2008-2009) of certain Fidelity funds and Senior Vice President of Fidelity Pricing and Cash Management Services (FPCMS) (2004-2009). |
Bryan A. Mehrmann (49) |
| Year of Election or Appointment: 2005 Deputy Treasurer of the Fidelity funds. Mr. Mehrmann is an employee of Fidelity Investments. |
Adrien E. Deberghes (43) |
| Year of Election or Appointment: 2008 Deputy Treasurer of Fidelity's Equity and High Income Funds. Mr. Deberghes also serves as Assistant Treasurer of other Fidelity funds (2010-present) and is an employee of Fidelity Investments (2008-present). Previously, Mr. Deberghes served as Senior Vice President of Mutual Fund Administration at State Street Corporation (2007-2008), Senior Director of Mutual Fund Administration at Investors Bank & Trust (2005-2007), and Director of Finance for Dunkin' Brands (2000-2005). |
Stephanie J. Dorsey (41) |
| Year of Election or Appointment: 2010 Assistant Treasurer of Fidelity's Equity and High Income Funds. Ms. Dorsey also serves as Deputy Treasurer of other Fidelity funds (2008-present) and is an employee of Fidelity Investments (2008-present). Previously, Ms. Dorsey served as Treasurer (2004-2008) of the JPMorgan Mutual Funds and Vice President (2004-2008) of JPMorgan Chase Bank. |
John R. Hebble (52) |
| Year of Election or Appointment: 2009 Assistant Treasurer of Fidelity's Equity and High Income Funds. Mr. Hebble also serves as Treasurer and Chief Financial Officer of The North Carolina Capital Management Trust: Cash and Term Portfolio (2008-present), President and Treasurer of other Fidelity funds (2008-present) and is an employee of Fidelity Investments. |
Gary W. Ryan (52) |
| Year of Election or Appointment: 2005 Assistant Treasurer of the Fidelity funds. Mr. Ryan is an employee of Fidelity Investments. Previously, Mr. Ryan served as Vice President of Fund Reporting in Fidelity Pricing and Cash Management Services (FPCMS) (1999-2005). |
Jonathan Davis (42) |
| Year of Election or Appointment: 2010 Assistant Treasurer of the Fidelity funds. Mr. Davis is an employee of Fidelity Investments. Previously, Mr. Davis served as Vice President and Associate General Counsel of FMR LLC (2003-2010). |
Annual Report
The Board of Trustees of Advisor Japan Fund voted to pay to shareholders of record at the opening of business on record date, the following distributions per share derived from capital gains realized from sales of portfolio securities and dividends derived from net investment income:
| Pay Date | Record Date | Dividends | Capital Gains |
Class A | 12/13/2010 | 12/10/2010 | $0.030 | $0.139 |
| | | | |
Class T | 12/13/2010 | 12/10/2010 | $0.000 | $0.137 |
| | | | |
Class B | 12/13/2010 | 12/10/2010 | $0.000 | $0.076 |
| | | | |
Class C | 12/13/2010 | 12/10/2010 | $0.000 | $0.080 |
Class A, Class T, Class B, and Class C designate 100% of the dividends distributed during the fiscal year as amounts which may be taken into account as a dividend for purposes of the maximum rate under section 1(h)(11) of the Internal Revenue Code.
The amounts per share which represent income derived from sources within, and taxes paid to foreign countries or possessions of the United States are as follows:
| Pay Date | Income | Taxes |
Class A | 12/07/09 | $0.086 | $0.0145 |
| | | |
Class T | 12/07/09 | $0.067 | $0.0145 |
| | | |
Class B | 12/07/09 | $0.047 | $0.0145 |
| | | |
Class C | 12/07/09 | $0.045 | $0.0145 |
The fund will notify shareholders in January 2011 of amounts for use in preparing 2010 income tax returns.
Annual Report
A special meeting of the fund's shareholders was held on November 16, 2010. The results of votes taken among shareholders on the proposal before them are reported below. Each vote reported represents one dollar of net asset value held on the record date for the meeting.
PROPOSAL 1 |
To approve an Agreement and Plan of Reorganization providing for the transfer of all of the assets of Fidelity Advisor Japan Fund to Fidelity Japan Fund in exchange solely for shares of beneficial interest of Fidelity Japan Fund and the assumption by Fidelity Japan Fund of Fidelity Advisor Japan Fund's liabilities,
in complete liquidation of Fidelity
Advisor Japan Fund. |
| # of
Votes | % of
Votes |
Affirmative | 14,992,935.07 | 76.146 |
Against | 1,290,989.63 | 6.557 |
Abstain | 554,934.61 | 2.819 |
Uninstructed | 2,850,752.40 | 14.478 |
TOTAL | 19,689,611.71 | 100.000 |
Annual Report
Board Approval of Investment Advisory Contracts and Management Fees
Fidelity Advisor Japan Fund
Each year, the Board of Trustees, including the Independent Trustees (together, the Board), votes on the renewal of the management contract and sub-advisory agreements (together, the Advisory Contracts) for the fund. The Board, assisted by the advice of fund counsel and Independent Trustees' counsel, requests and considers a broad range of information relevant to the renewal of the Advisory Contracts throughout the year.
The Board meets regularly and considers at each of its meetings factors that are relevant to its annual consideration of the renewal of the fund's Advisory Contracts, including the services and support provided to the fund and its shareholders. The Board has established various standing committees, each composed of Independent Trustees with varying backgrounds, to which the Board has assigned specific subject matter responsibilities in order to enhance effective decision-making by the Board. The Board, acting directly and through its Committees, requests and receives information concerning the annual consideration of the renewal of the fund's Advisory Contracts. The Board also meets as needed to consider matters specifically related to the Board's annual consideration of the renewal of Advisory Contracts. Members of the Board may also meet with trustees of other Fidelity funds through ad hoc joint committees to discuss certain matters relevant to the Fidelity funds.
At its July 2010 meeting, the Board of Trustees, including the Independent Trustees, unanimously determined to renew the fund's Advisory Contracts. In reaching its determination, the Board considered all factors it believed relevant, including (i) the nature, extent, and quality of the services to be provided to the fund and its shareholders (including the investment performance of the fund); (ii) the competitiveness of the fund's management fee and total expenses; (iii) the total costs of the services to be provided by and the profits to be realized by Fidelity from its relationship with the fund; (iv) the extent to which economies of scale would be realized as the fund grows; and (v) whether fee levels reflect these economies of scale, if any, for the benefit of fund shareholders.
In considering whether to renew the Advisory Contracts for the fund, the Board reached a determination, with the assistance of fund counsel and Independent Trustees' counsel and through the exercise of its business judgment, that the renewal of the Advisory Contracts is in the best interests of fund shareholders and that the compensation to be received by Fidelity under the management contract is fair and reasonable. The Board's decision to renew the Advisory Contracts was not based on any single factor noted above, but rather was based on a comprehensive consideration of all the information provided to the Board at its meetings throughout the year. The Board, in reaching its determination to renew the Advisory Contracts, is aware that shareholders in the fund have a broad range of investment choices available to them, including a wide choice among mutual funds offered by Fidelity's competitors, and that the fund's shareholders, with the opportunity to review and weigh the disclosure provided by the fund in its prospectus and other public disclosures, have chosen to invest in this fund, managed by Fidelity.
Annual Report
Board Approval of Investment Advisory Contracts and
Management Fees - continued
Nature, Extent, and Quality of Services Provided. The Board considered the staffing within the investment adviser, FMR, and the sub-advisers (together, the Investment Advisers), including the backgrounds of the fund's investment personnel and the fund's investment objective and discipline. The Independent Trustees also had discussions with senior management of Fidelity's investment operations and investment groups. The Board considered the structure of the portfolio manager compensation program and whether this structure provides appropriate incentives to act in the best interest of the fund.
Resources Dedicated to Investment Management and Support Services. The Board and the equity research subcommittee of the Board's Fund Oversight Committee reviewed the size, education, and experience of the Investment Advisers' investment staff, their use of technology, and the Investment Advisers' approach to recruiting, training, and retaining portfolio managers and other research, advisory, and management personnel. The Board noted that Fidelity's analysts have access to a variety of technological tools and market and securities data that enable them to perform both fundamental and quantitative analysis and to specialize in various disciplines. The Board considered Fidelity's extensive global research capabilities that enable the Investment Advisers to aggregate data from various sources in an effort to produce positive investment results. The Board also considered that Fidelity's portfolio managers and analysts have access to daily portfolio attribution that allows for monitoring of a fund's portfolio, as well as an electronic communication system that provides immediate real-time access to research concerning issuers and credit enhancers. The Board noted FMR's continued focus on strengthening the organization and discipline of equity portfolio management and research.
Shareholder and Administrative Services. The Board considered (i) the nature, extent, quality, and cost of advisory, administrative, and shareholder services performed by the Investment Advisers and their affiliates under the Advisory Contracts and under separate agreements covering transfer agency, pricing and bookkeeping, and securities lending services for the fund; (ii) the nature and extent of the investment adviser's supervision of third party service providers, principally custodians and subcustodians; and (iii) the resources devoted to, and the record of compliance with, the fund's compliance policies and procedures. The Board also reviewed the allocation of fund brokerage, including allocations to brokers affiliated with the Investment Advisers, the use of brokerage commissions to pay fund expenses, and the use of "soft" commission dollars to pay for research services.
The Board noted that the growth of fund assets over time across the complex allows Fidelity to reinvest in the development of services designed to enhance the value or convenience of the Fidelity funds as investment vehicles. These services include 24-hour access to account information and market information through phone representatives and over the Internet, and investor education materials and asset allocation tools.
Annual Report
Investment in a Large Fund Family. The Board considered the benefits to shareholders of investing in a Fidelity fund, including the benefits of investing in a fund that is part of a large family of funds offering a variety of investment disciplines and providing a large variety of mutual fund investor services. The Board noted that Fidelity had taken, or had made recommendations that resulted in the Fidelity funds taking, a number of actions over the previous year that benefited particular funds, including (i) dedicating additional resources to investment research and restructuring and broadening the focus of the investment research teams; (ii) bolstering the senior management team that oversees asset management; (iii) launching Class F of certain funds as a lower-fee class available to Freedom K and Freedom Index Funds; (iv) lowering the initial investment minimums and ongoing balance requirements for Real Estate High Income Fund; (v) eliminating subsequent purchase minimums for all funds and adding a waiver of the investment minimum requirement for new accounts opened with the proceeds of a systematic withdrawal plan; (vi) eliminating the withdrawal minimum and maximum limits for systematic withdrawals from Advisor funds; (vii) expanding sales load waivers on Class A shares for Destiny Planholders and expanding Institutional Class eligibility for Class O Destiny Planholders; and (viii) changing certain Class A and Class T sales charge structures to further align them with industry practices.
Investment Performance. The Board considered whether the fund has operated in accordance with its investment objective, as well as its record of compliance with its investment restrictions. It also reviewed the fund's absolute investment performance for each class, as well as the fund's relative investment performance for each class measured over multiple periods against (i) a broad-based securities market index, and (ii) a peer group of mutual funds deemed appropriate by Fidelity and reviewed by the Board. The following charts considered by the Board show, over the one-, three-, and five-year periods ended December 31, 2009, the cumulative total returns of Institutional Class (Class I) and Class B of the fund, the cumulative total returns of a broad-based securities market index ("benchmark"), and a range of cumulative total returns of a peer group of mutual funds identified by Lipper Inc. as having an investment objective similar to that of the fund. The returns of Institutional Class (Class I) and Class B show the performance of the highest and lowest performing classes, respectively (based on five-year performance). The box within each chart shows the 25th percentile return (bottom of box) and the 75th percentile return (top of box) of the peer group. Returns shown above the box are in the first quartile and returns shown below the box are in the fourth quartile. The percentage beaten numbers noted below each chart correspond to the percentile box and represent the percentage of funds in the peer group whose performance was equal to or lower than that of the class indicated.
Annual Report
Board Approval of Investment Advisory Contracts and
Management Fees - continued
Fidelity Advisor Japan Fund
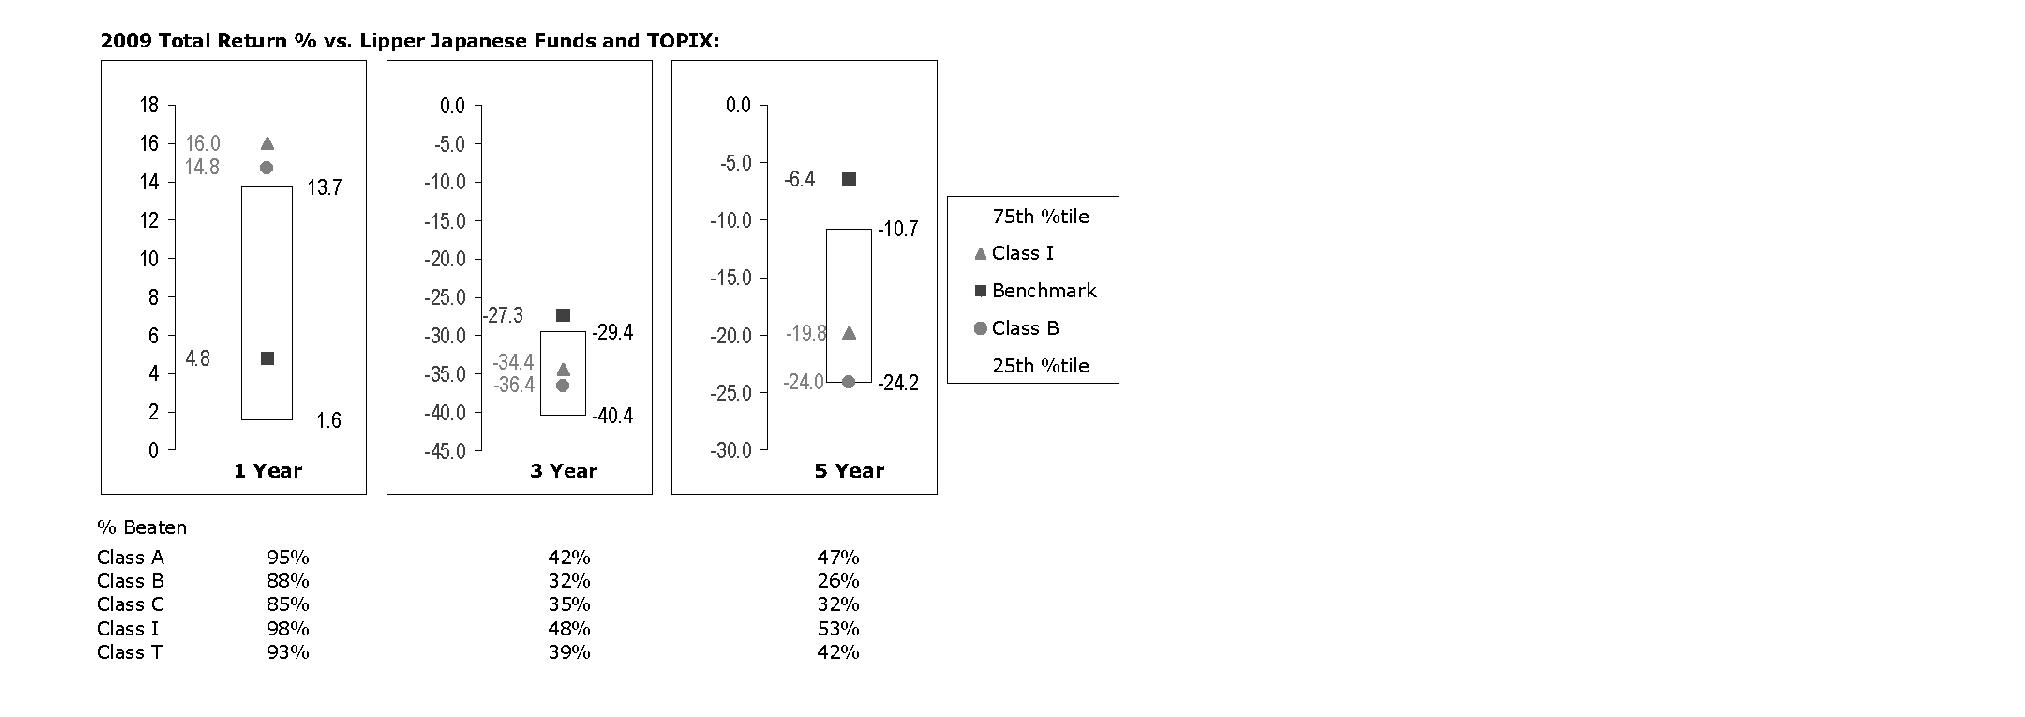
The Board reviewed the fund's relative investment performance against its peer group and noted that the performance of Institutional Class (Class I) of the fund was in the first quartile for the one-year period, the third quartile for the three-year period, and the second quartile for the five-year period. The Board also noted that the investment performance of the fund was lower than its benchmark for the three- and five-year periods, although the one-year cumulative total return of Institutional Class (Class I) compared favorably to its benchmark. The Board considered that the variations in performance among the fund's classes reflect the variations in class expenses, which result in lower performance for higher expense classes. The Board also reviewed the fund's performance since inception as well as performance in the current year.
The Board also considered that the fund's management fee is subject to upward or downward adjustment depending upon whether, and to what extent, the fund's investment performance for the performance period exceeds, or is exceeded by, the record (over the same period) of a Board-approved performance adjustment index. The Board realizes that the performance adjustment provides FMR with a strong economic incentive to seek to achieve superior performance for the fund's shareholders and helps to more closely align the interests of FMR and the fund's shareholders.
Furthermore, the Board considered that, on July 13, 2010, it had approved a proposal, subject to shareholder approval, to merge the fund into Fidelity Japan Fund. If shareholders approve the merger at a special meeting scheduled to be held in November 2010, it is expected to take place in December 2010.
Annual Report
Based on its review, and giving particular weight to the nature and quality of the resources dedicated by the Investment Advisers to maintain and improve relative performance and factoring in the unprecedented market events in recent years, the Board concluded that the nature, extent, and quality of investment management and support services and of shareholder and administrative services provided to the fund will benefit the fund's shareholders, particularly in light of the Board's view that the fund's shareholders benefit from investing in a fund that is part of a large family of funds offering a variety of investment disciplines and services.
Competitiveness of Management Fee and Total Fund Expenses. The Board considered the fund's management fee and total expenses compared to "mapped groups" of competitive funds and classes. Fidelity creates "mapped groups" by combining similar Lipper investment objective categories that have comparable management fee characteristics. Combining Lipper investment objective categories aids the Board's management fee and total expense comparisons by broadening the competitive group used for comparison and by reducing the number of universes to which various Fidelity funds are compared.
Management Fee. The Board considered two proprietary management fee comparisons for the 12-month periods shown in the chart below. The group of Lipper funds used by the Board for management fee comparisons is referred to below as the "Total Mapped Group." The Total Mapped Group is broader than the Lipper peer group used by the Board for performance comparisons because the Total Mapped Group combines several Lipper investment objective categories while the Lipper peer group does not. The Total Mapped Group comparison focuses on a fund's standing relative to the total universe of comparable funds available to investors, in terms of gross management fees before expense reimbursements or caps, and without giving effect to the fund's performance adjustment. "TMG %" represents the percentage of funds in the Total Mapped Group that had management fees that were lower than the fund's. For example, a TMG % of 15% means that 85% of the funds in the Total Mapped Group had higher management fees than the fund. The "Asset-Size Peer Group" (ASPG) comparison focuses on a fund's standing relative to non-Fidelity funds similar in size to the fund within the Total Mapped Group. The ASPG represents at least 15% of the funds in the Total Mapped Group with comparable asset size and management fee characteristics, subject to a minimum of 50 funds (or all funds in the Total Mapped Group if fewer than 50). Additional information, such as the ASPG quartile in which the fund's management fee ranked and the impact of the fund's performance adjustment, is also included in the chart and considered by the Board.
Annual Report
Board Approval of Investment Advisory Contracts and
Management Fees - continued
Fidelity Advisor Japan Fund
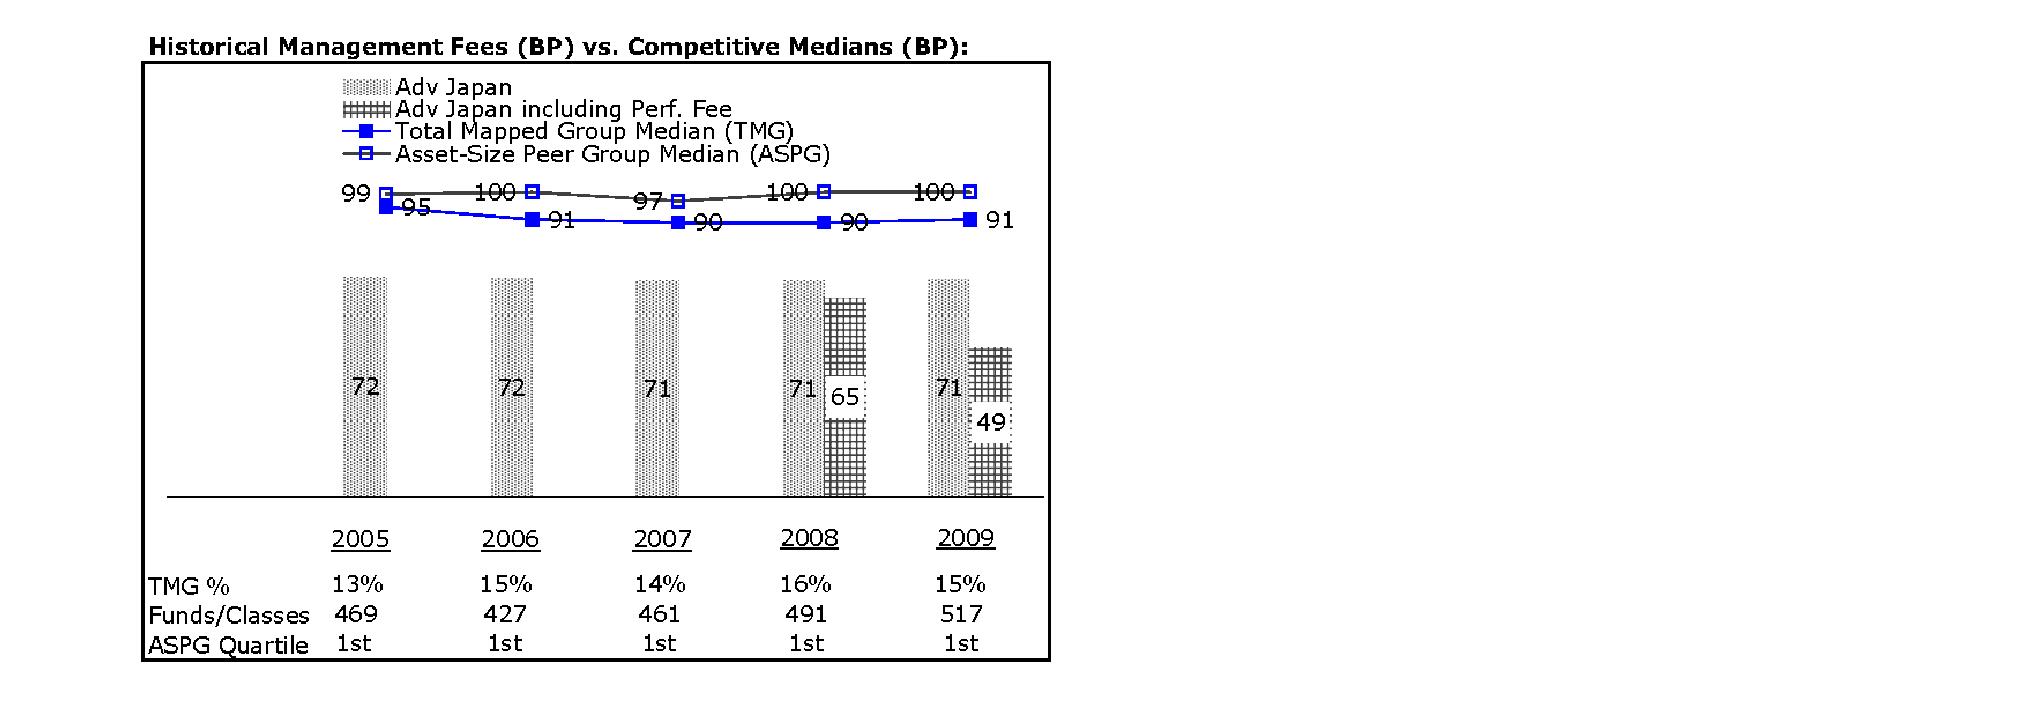
The Board noted that the fund's management fee ranked below the median of its Total Mapped Group and below the median of its ASPG for 2009. The Board also noted the effect of the fund's negative performance adjustment on the fund's management fee ranking. The Board noted that the performance adjustment for each year represents calculations for performance periods that differ from the periods shown in the performance charts above.
Based on its review, the Board concluded that the fund's management fee is fair and reasonable in light of the services that the fund receives and the other factors considered.
Total Expenses. In its review of each class's total expenses, the Board considered the fund's management fee as well as other fund or class expenses, as applicable, such as transfer agent fees, pricing and bookkeeping fees, fund-paid 12b-1 fees, and custodial, legal, and audit fees. The Board also noted the effects of any waivers and reimbursements on fees and expenses, as well as the impact of the fund's performance adjustment. As part of its review, the Board also considered current and historical total expenses of each class of the fund compared to competitive fund median expenses. Each class of the fund is compared to those funds and classes in the Total Mapped Group (used by the Board for management fee comparisons) that have a similar sales load structure.
The Board noted that the total expenses of Class A ranked below its competitive median for 2009, the total expenses of Class B ranked equal to its competitive median for 2009, and the total expenses of each of Class T, Class C, and Institutional Class ranked above its competitive median for 2009. The Board considered that the total expenses for Class T were above the median primarily because its 12b-1 fee is higher than the typical front-end load class. The Board noted that the fund offers multiple classes, each of which has a different sales load and 12b-1 fee structure, and that the multiple structures are intended to offer a range of pricing options for the intermediary market. The Board also noted that the total expenses of the classes vary primarily by the level of their 12b-1 fees, although differences in transfer agent fees may also cause expenses to vary from class to class.
Annual Report
Fees Charged to Other Fidelity Clients. The Board also considered Fidelity fee structures and other information with respect to clients of FMR and its affiliates, such as other mutual funds advised or subadvised by FMR or its affiliates, pension plan clients, and other institutional clients. In March 2010, the Board created an ad hoc joint committee with the board of other Fidelity funds (the Committee) to review and compare Fidelity's institutional investment advisory business with its business of providing services to the Fidelity funds, including the differences in services provided, fees charged, and costs incurred, as well as competition in their respective marketplaces.
Based on its review of total expenses and fees charged to other Fidelity clients, the Board concluded that the total expenses of each class of the fund were reasonable, although in some cases above the median of the universe presented for comparison, in light of the services that the fund and its shareholders receive and the other factors considered, including the findings of the Committee.
Costs of the Services and Profitability. The Board considered the revenues earned and the expenses incurred by Fidelity in conducting the business of developing, marketing, distributing, managing, administering and servicing the fund and its shareholders. The Board also considered the level of Fidelity's profits in respect of all the Fidelity funds.
On an annual basis, FMR presents to the Board Fidelity's profitability for the fund. Fidelity calculates the profitability for each fund, as well as aggregate profitability for groups of Fidelity funds and all Fidelity funds, using a series of detailed revenue and cost allocation methodologies which originate with the audited books and records of Fidelity. The Audit Committee of the Board reviews any significant changes from the prior year's methodologies.
PricewaterhouseCoopers LLP (PwC), independent registered public accounting firm and auditor to Fidelity and certain Fidelity funds, has been engaged annually by the Board as part of the Board's assessment of Fidelity's profitability analysis. PwC's engagement includes the review and assessment of Fidelity's methodologies used in determining the revenues and expenses attributable to Fidelity's mutual fund business, and completion of agreed-upon procedures surrounding the mathematical accuracy of fund profitability and its conformity to allocation methodologies. After considering PwC's reports issued under the engagement and information provided by Fidelity, the Board believes that while other allocation methods may also be reasonable, Fidelity's profitability methodologies are reasonable in all material respects.
Annual Report
Board Approval of Investment Advisory Contracts and
Management Fees - continued
The Board has also reviewed Fidelity's non-fund businesses and fall-out benefits related to the mutual fund business as well as cases where Fidelity's affiliates may benefit from or be related to the fund's business.
The Board considered the costs of the services provided by and the profits realized by Fidelity in connection with the operation of the fund and were satisfied that the profitability was not excessive in the circumstances.
Economies of Scale. The Board considered whether there have been economies of scale in respect of the management of the Fidelity funds, whether the Fidelity funds (including the fund) have appropriately benefited from any such economies of scale, and whether there is potential for realization of any further economies of scale. The Board considered the extent to which the fund will benefit from economies of scale through increased services to the fund, through waivers or reimbursements, or through fee or expense reductions.
In February 2009, the Board and the board of other Fidelity funds created an ad hoc committee (the Economies of Scale Committee) to analyze whether FMR attains economies of scale in respect of the management and servicing of the Fidelity funds, whether the Fidelity funds have appropriately benefited from such economies of scale, and whether there is potential for realization of any further economies of scale.
The Board recognized that the fund's management contract incorporates a "group fee" structure, which provides for lower group fee rates as total fund assets under FMR's management increase, and for higher group fee rates as total fund assets under FMR's management decrease. FMR calculates the group fee rates based on a tiered asset "breakpoint" schedule that varies based on asset class. The Board considered that the group fee is designed to deliver the benefits of economies of scale to fund shareholders when total Fidelity fund assets increase, even if assets of any particular fund are unchanged or have declined, because some portion of Fidelity's costs are attributable to services provided to all Fidelity funds, and all funds benefit if those costs can be allocated among more assets. The Board concluded that, given the group fee structure, fund shareholders will benefit from lower management fees as assets under FMR's management increase at the fund complex level, regardless of whether Fidelity achieves any such economies of scale.
The Board concluded, considering the findings of the Economies of Scale Committee, that any potential economies of scale are being appropriately shared between fund shareholders and Fidelity.
Additional Information Requested by the Board. In order to develop fully the factual basis for consideration of the Fidelity funds' Advisory Contracts, the Board requested and received additional information on certain topics, including (i) fund performance trends, actions to be taken by FMR to improve certain funds' overall performance, and Fidelity's long-term strategies for certain funds; (ii) portfolio manager changes that have occurred during the past year and length of portfolio manager tenure for different categories of funds over time; (iii) Fidelity's compensation structure for portfolio managers, research analysts, and other key personnel, the rationale for the compensation structure, and how the compensation structure provides appropriate performance incentives; (iv) the amount of the investment that each portfolio manager has made in the Fidelity fund(s) that he or she manages; (v) management and other fees paid by FMR to affiliated sub-advisers on behalf of the Fidelity funds; (vi) Fidelity's fee structures and rationale for recommending different fees among different categories of funds; (vii) Fidelity's rationale for recommending which funds should have a performance adjustment component as part of their management fees; (viii) the rationale for any differences between fund fee structures and fee structures in place for other Fidelity clients; and (ix) explanations regarding the relative total expenses borne by certain funds and classes, total expense competitive trends, and actions that might be taken by FMR to reduce total expenses for certain funds and classes.
Annual Report
Based on its evaluation of all of the conclusions noted above, and after considering all factors it believed relevant, the Board ultimately concluded that the advisory fee structures are fair and reasonable, and that the fund's Advisory Contracts should be renewed.
Annual Report
Investment Adviser
Fidelity Management & Research Company
Boston, MA
Investment Sub-Advisers
FMR Co., Inc.
Fidelity Management & Research
(U.K.) Inc.
Fidelity Management & Research
(Hong Kong) Limited
Fidelity Management & Research
(Japan) Inc.
Fidelity Research & Analysis Company
FIL Investment Advisors
FIL Investments (Japan) Limited
FIL Investment Advisors (U.K.) Limited
General Distributor
Fidelity Distributors Corporation
Boston, MA
Transfer and Service Agents
Fidelity Investments Institutional Operations Company, Inc.
Boston, MA
Fidelity Service Company, Inc.
Boston, MA
Custodian
State Street Bank and Trust Company
Quincy, MA
AJAF-UANN-1210
1.784756.107
(Fidelity Investment logo)(registered trademark)
Fidelity AdvisorSM
Japan
Fund - Institutional Class
Annual Report
October 31, 2010
(2_fidelity_logos) (Registered_Trademark)
Contents
Chairman's Message | <Click Here> | The Chairman's message to shareholders. |
Note to shareholders | <Click Here> | An explanation of the changes to the fund. |
Performance | <Click Here> | How the fund has done over time. |
Management's Discussion of Fund Performance | <Click Here> | The Portfolio Manager's review of fundperformance and strategy. |
Shareholder Expense Example | <Click Here> | An example of shareholder expenses. |
Investment Changes | <Click Here> | A summary of major shifts in the fund's investments over the past six months. |
Investments | <Click Here> | A complete list of the fund's investments with their market values. |
Financial Statements | <Click Here> | Statements of assets and liabilities, operations, and changes in net assets,
as well as financial highlights. |
Notes | <Click Here> | Notes to financial statements. |
Report of Independent Registered Public Accounting Firm | <Click Here> | |
Trustees and Officers | <Click Here> | |
Distributions | <Click Here> | |
Proxy Voting Results | <Click Here> | |
Board Approval of Investment Advisory Contracts and Management Fees | <Click Here> | |
To view a fund's proxy voting guidelines and proxy voting record for the 12-month period ended June 30, visit http://www.fidelity.com/proxyvotingresults or visit the Securities and Exchange Commission's (SEC) web site at http://www.sec.gov. You may also call 1-877-208-0098 to request a free copy of the proxy voting guidelines.
Standard & Poor's, S&P and S&P 500 are registered service marks of The McGraw-Hill Companies, Inc. and have been licensed for use by Fidelity Distributors Corporation.
Other third party marks appearing herein are the property of their respective owners.
All other marks appearing herein are registered or unregistered trademarks or service marks of FMR LLC or an affiliated company.
Annual Report
This report and the financial statements contained herein are submitted for the general information of the shareholders of the fund. This report is not authorized for distribution to prospective investors in the fund unless preceded or accompanied by an effective prospectus.
A fund files its complete schedule of portfolio holdings with the SEC for the first and third quarters of each fiscal year on Form N-Q. Forms N-Q are available on the SEC's web site at http://www.sec.gov. A fund's Forms N-Q may be reviewed and copied at the SEC's Public Reference Room in Washington, DC. Information regarding the operation of the SEC's Public Reference Room may be obtained by calling 1-800-SEC-0330. For a complete list of a fund's portfolio holdings, view the most recent holdings listing, semiannual report, or annual report on Fidelity's web site at http://www.fidelity.com or http://www.advisor.fidelity.com, as applicable.
NOT FDIC INSURED • MAY LOSE VALUE • NO BANK GUARANTEE
Neither the fund nor Fidelity Distributors Corporation is a bank.
Annual Report
(photo_of_Edward_C_Johnson_3d)
Dear Shareholder:
Equities have staged a rally in the second half of 2010, shaking off concerns about the European debt crisis and the possibility of a double-dip recession in the U.S. Although the short-term surge pushed major equity indexes back into positive territory for the year, several questions remain about the longer-term outlook, including lackluster economic growth and persistently high unemployment. Financial markets are always unpredictable, of course, but there also are several time-tested investment principles that can help put the odds in your favor.
One of the basic tenets is to invest for the long term. Over time, riding out the markets' inevitable ups and downs has proven much more effective than selling into panic or chasing the hottest trend. Even missing only a few of the markets' best days can significantly diminish investor returns. Patience also affords the benefits of compounding - of earning interest on additional income or reinvested dividends and capital gains. There can be tax advantages and cost benefits to consider as well. While staying the course doesn't eliminate risk, it can considerably lessen the effect of short-term declines.
You can further manage your investing risk through diversification. And today, more than ever, geographic diversification should be taken into account. Studies indicate that asset allocation is the single most important determinant of a portfolio's long-term success. The right mix of stocks, bonds and cash - aligned to your particular risk tolerance and investment objective - is very important. Age-appropriate rebalancing is also an essential aspect of asset allocation. For younger investors, an emphasis on equities - which historically have been the best-performing asset class over time - is encouraged. As investors near their specific goal, such as retirement or sending a child to college, consideration may be given to replacing volatile assets (e.g. common stocks) with more-stable fixed investments (bonds or savings plans).
A third principle - investing regularly - can help lower the average cost of your purchases. Investing a certain amount of money each month or quarter helps ensure you won't pay for all your shares at market highs. This strategy - known as dollar cost averaging - also reduces "emotion" from investing, helping shareholders avoid selling weak performers just prior to an upswing, or chasing a hot performer just before a correction.
We invite you to contact us via the Internet, through our Investor Centers or by phone. It is our privilege to provide you the information you need to make the investments that are right for you.
Sincerely,
(The chairman's signature appears here.)
Edward C. Johnson 3d
Annual Report
Note to Shareholders
On November 16, 2010, shareholders of Fidelity AdvisorSM Japan Fund approved the merger of Advisor Japan into Fidelity® Japan Fund. The merger will be effective on December 17, 2010.
Annual Report
Average annual total return reflects the change in the value of an investment, assuming reinvestment of the class' distributions from dividend income and capital gains (the profits earned upon the sale of securities that have grown in value, if any) and assuming a constant rate of performance each year. The $10,000 table and the fund's returns do not reflect the deduction of taxes that a shareholder would pay on fund distributions or the redemption of fund shares. During periods of reimbursement by Fidelity, a fund's total return will be greater than it would be had the reimbursement not occurred. How a fund did yesterday is no guarantee of how it will do tomorrow.
Average Annual Total Returns
Periods ended October 31, 2010 | Past 1
year | Past 5
years | Past 10
years |
Institutional Class | 6.65% | -5.90% | -3.32% |
$10,000 Over 10 Years
Let's say hypothetically that $10,000 was invested in Fidelity Advisor Japan Fund - Institutional Class on October 31, 2000. The chart shows how the value of your investment would have changed, and also shows how the Tokyo Stock Price Index (TOPIX) performed over the same period.
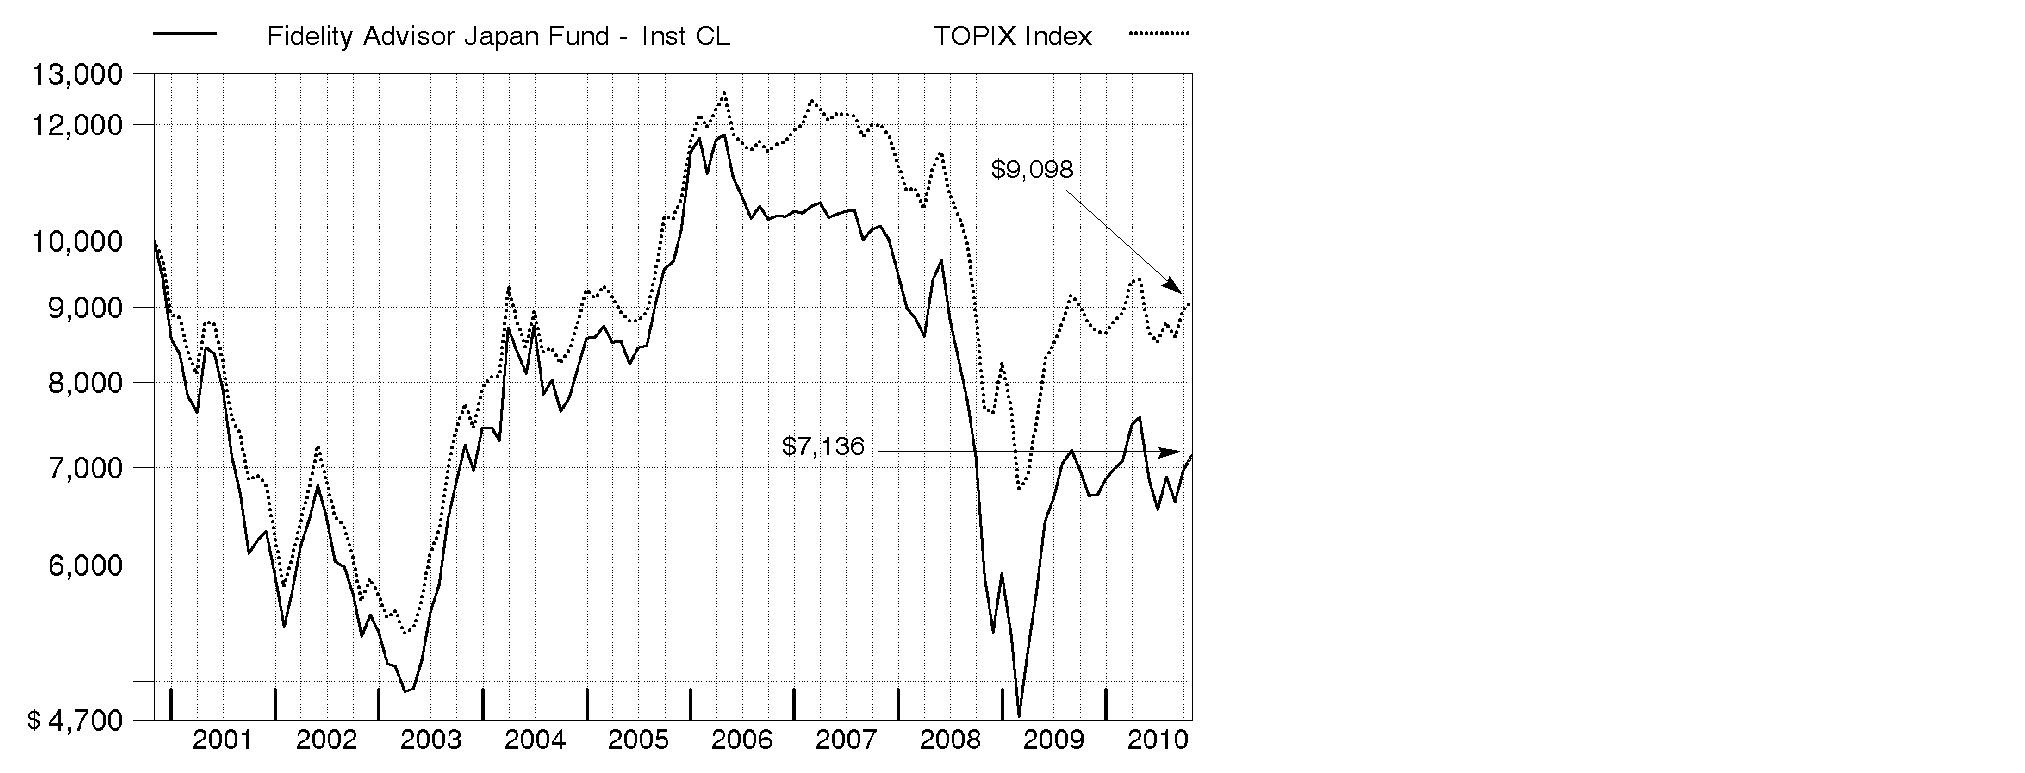
Annual Report
Market Recap: Despite solid gains in many world equity markets, Japanese stocks only managed a modest advance during the past year amid continued sluggishness in the nation's economy. For the 12 months ending October 31, 2010, the Tokyo Stock Price Index (TOPIX) returned 3.70%, a gain entirely attributable to U.S. dollar weakness versus the yen. Telecommunication services was by far the index's top-performing sector, posting a gain of almost 17%. Utilities and industrials were next, returning roughly 10% and 8%, respectively. Two sectors, financials and energy, ended the period with negative returns, at approximately -9% and -4%, respectively. During the second quarter of 2010, Japan's economy grew at a tepid 0.4% annualized pace, while in September the country experienced its 19th consecutive month of falling consumer prices - a sign of deeply entrenched deflation - - as measured by the year-over-year change in its consumer price index. Domestic consumer spending remained weak, while demand for Japanese exports was dampened by strong currency appreciation, despite the Japanese government's bold move in September to weaken the surging yen.
Comments from Robert Rowland, Portfolio Manager of Fidelity AdvisorSM Japan Fund: During the past year, the fund's Institutional Class shares returned 6.65%, handily beating the TOPIX. Strong stock picking in financials - particularly the diversified financials group - lifted the fund's results, as did favorable stock selection in industrials, consumer discretionary and information technology. Against a backdrop of improved credit conditions and a rebound in global equity markets, our holdings in non-bank financials, including Orix, Sompo Japan Insurance - which merged with NipponKoa Insurance to form NKSJ Holdings - and Credit Saison, were among the leading contributors to performance. Other contributors included imaging and optical products manufacturer Canon, automaker Honda Motor, LCD (liquid-crystal display) component suppliers Nippon Electric Glass and Nitto Denko, and wireless telecommunication services and hardware provider NTT DoCoMo. Conversely, a large overweighting in financials, the benchmark's weakest-performing sector, undercut the benefit of favorable security selection in that group. Life insurer T&D Holdings detracted from performance, as did synthetic rubber/resin producer JSR and printed circuit board manufacturer Ibiden. Stanley Electric and Toyoda Gosei, makers of LED (light-emitting-diode) auto parts, also hurt.
The views expressed above reflect those of the portfolio manager(s) only through the end of the period as stated on the cover of this report and do not necessarily represent the views of Fidelity or any other person in the Fidelity organization. Any such views are subject to change at any time based upon market or other conditions and Fidelity disclaims any responsibility to update such views. These views may not be relied on as investment advice and, because investment decisions for a Fidelity fund are based on numerous factors, may not be relied on as an indication of trading intent on behalf of any Fidelity fund.
Annual Report
Shareholder Expense Example
As a shareholder of the Fund, you incur two types of costs: (1) transaction costs, including sales charges (loads) on purchase payments or redemption proceeds, redemption fees, and (2) ongoing costs, including management fees, distribution and/or service (12b-1) fees and other Fund expenses. This Example is intended to help you understand your ongoing costs (in dollars) of investing in the Fund and to compare these costs with the ongoing costs of investing in other mutual funds.
The Example is based on an investment of $1,000 invested at the beginning of the period and held for the entire period (May 1, 2010 to October 31, 2010).
Actual Expenses
The first line of the accompanying table for each class of the Fund provides information about actual account values and actual expenses. You may use the information in this line, together with the amount you invested, to estimate the expenses that you paid over the period. Simply divide your account value by $1,000.00 (for example, an $8,600 account value divided by $1,000.00 = 8.6), then multiply the result by the number in the first line for a class of the Fund under the heading entitled "Expenses Paid During Period" to estimate the expenses you paid on your account during this period. In addition, the Fund, as a shareholder in the underlying Fidelity Central Funds, will indirectly bear its pro-rata share of the fees and expenses incurred by the underlying Fidelity Central Funds. These fees and expenses are not included in the Fund's annualized expense ratio used to calculate the expense estimate in the table below.
Hypothetical Example for Comparison Purposes
The second line of the accompanying table for each class of the Fund provides information about hypothetical account values and hypothetical expenses based on a Class' actual expense ratio and an assumed rate of return of 5% per year before expenses, which is not the Class' actual return. The hypothetical account values and expenses may not be used to estimate the actual ending account balance or expenses you paid for the period. You may use this information to compare the ongoing costs of investing in the Fund and other funds. To do so, compare this 5% hypothetical example with the 5% hypothetical examples that appear in the shareholder reports of the other funds. In addition, the Fund, as a shareholder in the underlying Fidelity Central Funds, will indirectly bear its pro-rata share of the fees and expenses incurred by the underlying Fidelity Central Funds. These fees and expenses are not included in the Fund's annualized expense ratio used to calculate the expense estimate in the table below.
Please note that the expenses shown in the table are meant to highlight your ongoing costs only and do not reflect any transaction costs. Therefore, the second line of the table is useful in comparing ongoing costs only, and will not help you determine the relative total costs of owning different funds. In addition, if these transactional costs were included, your costs would have been higher.
Annual Report
Shareholder Expense Example - continued
|
Annualized
Expense Ratio
|
Beginning
Account Value
May 1, 2010
|
Ending
Account Value
October 31, 2010
| Expenses Paid
During Period*
May 1, 2010 to
October 31, 2010 |
Class A | 1.50%** | | | |
Actual | | $ 1,000.00 | $ 942.40 | $ 7.34** |
Hypothetical A | | $ 1,000.00 | $ 1,017.64 | $ 7.63** |
Class T | 1.75%** | | | |
Actual | | $ 1,000.00 | $ 940.60 | $ 8.56** |
Hypothetical A | | $ 1,000.00 | $ 1,016.38 | $ 8.89** |
Class B | 2.25%** | | | |
Actual | | $ 1,000.00 | $ 938.60 | $ 10.99** |
Hypothetical A | | $ 1,000.00 | $ 1,013.86 | $ 11.42** |
Class C | 2.25%** | | | |
Actual | | $ 1,000.00 | $ 939.00 | $ 11.00** |
Hypothetical A | | $ 1,000.00 | $ 1,013.86 | $ 11.42** |
Institutional Class | 1.19% | | | |
Actual | | $ 1,000.00 | $ 943.20 | $ 5.83 |
Hypothetical A | | $ 1,000.00 | $ 1,019.21 | $ 6.06 |
A 5% return per year before expenses
* Expenses are equal to each Class' annualized expense ratio, multiplied by the average account value over the period, multiplied by 184/365 (to reflect the one-half year period).
** If changes to the voluntary expense limitations effective November 1, 2010, had been in effect during the entire period, the annualized expense ratios and the expenses paid in the actual and hypothetical examples above would have been as follows:
| Annualized
Expense Ratio |
Expenses Paid
|
Class A | 1.45% | |
Actual | | $ 7.10 |
HypotheticalA | | $ 7.38 |
Class T | 1.70% | |
Actual | | $ 8.32 |
HypotheticalA | | $ 8.64 |
Class B | 2.20% | |
Actual | | $ 10.75 |
HypotheticalA | | $ 11.17 |
Class C | 2.20% | |
Actual | | $ 10.75 |
HypotheticalA | | $ 11.17 |
A 5% return per year before expenses
Annual Report
Investment Changes (Unaudited)
Top Ten Stocks as of October 31, 2010 |
| % of fund's
net assets | % of fund's net assets
6 months ago |
Mitsubishi UFJ Financial Group, Inc. | 4.0 | 3.8 |
Sumitomo Mitsui Financial Group, Inc. | 3.4 | 4.2 |
Canon, Inc. | 3.3 | 3.6 |
ORIX Corp. | 3.3 | 2.8 |
NTT DoCoMo, Inc. | 3.0 | 5.5 |
Sumitomo Trust & Banking Co. Ltd. | 2.9 | 2.5 |
Denso Corp. | 2.6 | 1.8 |
Mitsubishi Estate Co. Ltd. | 2.6 | 2.2 |
Honda Motor Co. Ltd. | 2.4 | 3.0 |
Toyota Motor Corp. | 2.4 | 1.3 |
| 29.9 | |
Top Five Market Sectors as of October 31, 2010 |
| % of fund's
net assets | % of fund's net assets
6 months ago |
Financials | 31.0 | 31.7 |
Consumer Discretionary | 19.9 | 18.3 |
Industrials | 17.2 | 15.8 |
Information Technology | 11.2 | 14.0 |
Materials | 6.7 | 7.2 |
Asset Allocation (% of fund's net assets) |
As of October 31, 2010 | As of April 30, 2010 |
| Stocks 95.4% | | | Stocks 95.9% | |
| Short-Term
Investments and
Net Other Assets 4.6% | | | Short-Term
Investments and
Net Other Assets 4.1% | |

Annual Report
Investments October 31, 2010
Showing Percentage of Net Assets
Common Stocks - 95.4% |
| Shares | | Value |
CONSUMER DISCRETIONARY - 19.9% |
Auto Components - 7.4% |
Bridgestone Corp. | 8,000 | | $ 143,210 |
Denso Corp. | 29,100 | | 904,955 |
NOK Corp. | 22,400 | | 400,010 |
Stanley Electric Co. Ltd. | 33,800 | | 567,464 |
Toyoda Gosei Co. Ltd. | 26,500 | | 571,033 |
| | 2,586,672 |
Automobiles - 4.8% |
Honda Motor Co. Ltd. | 23,400 | | 843,542 |
Toyota Motor Corp. | 23,800 | | 843,002 |
| | 1,686,544 |
Household Durables - 1.5% |
Sekisui House Ltd. | 55,000 | | 516,911 |
Leisure Equipment & Products - 1.7% |
Nikon Corp. | 16,800 | | 317,281 |
Sega Sammy Holdings, Inc. | 17,000 | | 277,594 |
| | 594,875 |
Media - 1.2% |
Fuji Media Holdings, Inc. | 308 | | 408,013 |
Multiline Retail - 1.5% |
Isetan Mitsukoshi Holdings Ltd. | 21,200 | | 233,917 |
Ryohin Keikaku Co. Ltd. | 2,600 | | 92,278 |
Takashimaya Co. Ltd. | 27,000 | | 203,247 |
| | 529,442 |
Specialty Retail - 1.8% |
Nishimatsuya Chain Co. Ltd. | 20,400 | | 196,471 |
Shimachu Co. Ltd. | 5,300 | | 108,872 |
Xebio Co. Ltd. | 4,800 | | 94,246 |
Yamada Denki Co. Ltd. | 3,330 | | 216,427 |
| | 616,016 |
TOTAL CONSUMER DISCRETIONARY | | 6,938,473 |
CONSUMER STAPLES - 4.0% |
Beverages - 1.1% |
Coca-Cola West Co. Ltd. | 3,600 | | 55,071 |
Kirin Holdings Co. Ltd. | 24,000 | | 328,889 |
| | 383,960 |
Food & Staples Retailing - 2.0% |
FamilyMart Co. Ltd. | 7,400 | | 262,637 |
Common Stocks - continued |
| Shares | | Value |
CONSUMER STAPLES - continued |
Food & Staples Retailing - continued |
Lawson, Inc. | 6,500 | | $ 295,638 |
Seven & i Holdings Co., Ltd. | 6,000 | | 139,278 |
| | 697,553 |
Personal Products - 0.9% |
Kao Corp. | 8,100 | | 205,877 |
Kose Corp. | 3,900 | | 93,490 |
| | 299,367 |
TOTAL CONSUMER STAPLES | | 1,380,880 |
FINANCIALS - 31.0% |
Capital Markets - 0.9% |
Matsui Securities Co. Ltd. | 30,300 | | 171,377 |
Nomura Holdings, Inc. | 27,200 | | 139,775 |
| | 311,152 |
Commercial Banks - 13.3% |
Chiba Bank Ltd. | 61,000 | | 376,604 |
Mitsubishi UFJ Financial Group, Inc. | 302,900 | | 1,405,758 |
Mizuho Financial Group, Inc. | 264,000 | | 382,884 |
Seven Bank Ltd. | 160 | | 288,107 |
Sumitomo Mitsui Financial Group, Inc. | 39,200 | | 1,170,032 |
Sumitomo Trust & Banking Co. Ltd. | 184,000 | | 1,004,604 |
| | 4,627,989 |
Consumer Finance - 4.7% |
Credit Saison Co. Ltd. | 33,900 | | 480,827 |
ORIX Corp. | 12,530 | | 1,142,913 |
| | 1,623,740 |
Insurance - 5.5% |
MS&AD Insurance Group Holdings, Inc. | 10,900 | | 261,130 |
NKSJ Holdings, Inc. (a) | 100,000 | | 687,213 |
Sony Financial Holdings, Inc. | 87 | | 302,722 |
T&D Holdings, Inc. | 33,350 | | 680,987 |
| | 1,932,052 |
Real Estate Investment Trusts - 2.2% |
Japan Prime Realty Investment Corp. | 64 | | 158,986 |
Japan Real Estate Investment Corp. | 35 | | 337,082 |
Nomura Real Estate Office Fund, Inc. | 47 | | 288,822 |
| | 784,890 |
Common Stocks - continued |
| Shares | | Value |
FINANCIALS - continued |
Real Estate Management & Development - 4.4% |
Mitsubishi Estate Co. Ltd. | 51,000 | | $ 893,440 |
Mitsui Fudosan Co. Ltd. | 33,000 | | 624,039 |
| | 1,517,479 |
TOTAL FINANCIALS | | 10,797,302 |
HEALTH CARE - 0.7% |
Health Care Providers & Services - 0.7% |
Alfresa Holdings Corp. | 5,600 | | 235,566 |
INDUSTRIALS - 17.2% |
Air Freight & Logistics - 0.8% |
Yamato Holdings Co. Ltd. | 20,400 | | 257,180 |
Building Products - 1.0% |
Asahi Glass Co. Ltd. | 11,000 | | 105,521 |
Daikin Industries Ltd. | 6,900 | | 240,059 |
| | 345,580 |
Construction & Engineering - 0.3% |
Kandenko Co. Ltd. | 19,000 | | 110,737 |
Electrical Equipment - 2.4% |
Mitsubishi Electric Corp. | 56,000 | | 524,841 |
Sumitomo Electric Industries Ltd. | 24,700 | | 314,301 |
| | 839,142 |
Machinery - 2.5% |
Fanuc Ltd. | 2,300 | | 332,970 |
Kubota Corp. | 33,000 | | 292,646 |
NSK Ltd. | 34,000 | | 257,055 |
| | 882,671 |
Marine - 0.5% |
Iino Kaiun Kaisha Ltd. | 18,200 | | 81,422 |
Mitsui OSK Lines Ltd. | 15,000 | | 95,930 |
| | 177,352 |
Road & Rail - 1.6% |
East Japan Railway Co. | 9,000 | | 555,782 |
Trading Companies & Distributors - 6.1% |
Itochu Corp. | 61,000 | | 534,621 |
Mitsubishi Corp. | 25,600 | | 614,904 |
Common Stocks - continued |
| Shares | | Value |
INDUSTRIALS - continued |
Trading Companies & Distributors - continued |
Mitsui & Co. Ltd. | 45,800 | | $ 720,315 |
Sumitomo Corp. | 18,800 | | 238,023 |
| | 2,107,863 |
Transportation Infrastructure - 2.0% |
The Sumitomo Warehouse Co. Ltd. | 134,000 | | 696,061 |
TOTAL INDUSTRIALS | | 5,972,368 |
INFORMATION TECHNOLOGY - 11.2% |
Computers & Peripherals - 0.7% |
Fujitsu Ltd. | 35,000 | | 238,751 |
Electronic Equipment & Components - 4.0% |
Ibiden Co. Ltd. | 14,800 | | 364,528 |
Nippon Electric Glass Co. Ltd. | 13,500 | | 173,527 |
Yamatake Corp. | 23,100 | | 562,357 |
Yaskawa Electric Corp. | 38,000 | | 297,030 |
| | 1,397,442 |
Office Electronics - 4.2% |
Canon, Inc. | 24,900 | | 1,146,229 |
Konica Minolta Holdings, Inc. | 34,500 | | 333,372 |
| | 1,479,601 |
Semiconductors & Semiconductor Equipment - 1.5% |
ROHM Co. Ltd. | 2,800 | | 174,674 |
Tokyo Electron Ltd. | 5,900 | | 332,898 |
| | 507,572 |
Software - 0.8% |
Nintendo Co. Ltd. | 1,100 | | 285,013 |
TOTAL INFORMATION TECHNOLOGY | | 3,908,379 |
MATERIALS - 6.7% |
Chemicals - 5.0% |
JSR Corp. | 28,800 | | 498,551 |
Mitsubishi Chemical Holdings Corp. | 27,500 | | 141,448 |
Nissan Chemical Industries Co. Ltd. | 22,000 | | 252,615 |
Nitto Denko Corp. | 7,100 | | 265,577 |
Shin-Etsu Chemical Co., Ltd. | 7,100 | | 359,019 |
Tokai Carbon Co. Ltd. | 36,000 | | 212,267 |
| | 1,729,477 |
Common Stocks - continued |
| Shares | | Value |
MATERIALS - continued |
Containers & Packaging - 0.1% |
Toyo Seikan Kaisha Ltd. | 2,000 | | $ 34,128 |
Metals & Mining - 1.6% |
Nippon Steel Corp. | 43,000 | | 135,154 |
Sumitomo Metal Industries Ltd. | 109,000 | | 252,987 |
Yamato Kogyo Co. Ltd. | 6,900 | | 176,980 |
| | 565,121 |
TOTAL MATERIALS | | 2,328,726 |
TELECOMMUNICATION SERVICES - 3.7% |
Wireless Telecommunication Services - 3.7% |
KDDI Corp. | 42 | | 226,415 |
NTT DoCoMo, Inc. | 621 | | 1,046,805 |
| | 1,273,220 |
UTILITIES - 1.0% |
Electric Utilities - 1.0% |
Tokyo Electric Power Co. | 15,100 | | 360,560 |
TOTAL COMMON STOCKS (Cost $38,087,918) | 33,195,474 |
Money Market Funds - 4.1% |
| | | |
Fidelity Cash Central Fund, 0.23% (b)
(Cost $1,438,671) | 1,438,671 | | 1,438,671 |
TOTAL INVESTMENT PORTFOLIO - 99.5% (Cost $39,526,589) | | 34,634,145 |
NET OTHER ASSETS (LIABILITIES) - 0.5% | | 185,238 |
NET ASSETS - 100% | $ 34,819,383 |
Legend |
(a) Non-income producing |
(b) Affiliated fund that is available only to investment companies and other accounts managed by Fidelity Investments. The rate quoted is the annualized seven-day yield of the fund at period end. A complete unaudited listing of the fund's holdings as of its most recent quarter end is available upon request. In addition, each Fidelity Central Fund's financial statements, which are not covered by the Fund's report of Independent Registered Public Accounting Firm, are available on the SEC's website or upon request. |
Affiliated Central Funds |
Information regarding fiscal year to date income earned by the Fund from investments in Fidelity Central Funds is as follows: |
Fund | Income earned |
Fidelity Cash Central Fund | $ 3,889 |
Fidelity Securities Lending Cash Central Fund | 352 |
Total | $ 4,241 |
Other Information |
The following is a summary of the inputs used, as of October 31, 2010, involving the Fund's assets and liabilities carried at fair value. The inputs or methodology used for valuing securities may not be an indication of the risk associated with investing in those securities. For more information on valuation inputs, and their aggregation into the levels used in the table below, please refer to the Security Valuation section in the accompanying Notes to Financial Statements. |
Valuation Inputs at Reporting Date: |
Description | Total | Level 1 | Level 2 | Level 3 |
Investments in Securities: | | | | |
Equities: | | | | |
Consumer Discretionary | $ 6,938,473 | $ 2,932,408 | $ 4,006,065 | $ - |
Consumer Staples | 1,380,880 | 706,836 | 674,044 | - |
Financials | 10,797,302 | 3,205,845 | 7,591,457 | - |
Health Care | 235,566 | 235,566 | - | - |
Industrials | 5,972,368 | 888,220 | 5,084,148 | - |
Information Technology | 3,908,379 | 1,683,602 | 2,224,777 | - |
Materials | 2,328,726 | 941,108 | 1,387,618 | - |
Telecommunication Services | 1,273,220 | - | 1,273,220 | - |
Utilities | 360,560 | - | 360,560 | - |
Money Market Funds | 1,438,671 | 1,438,671 | - | - |
Total Investments in Securities: | $ 34,634,145 | $ 12,032,256 | $ 22,601,889 | $ - |
Income Tax Information |
At October 31, 2010, the Fund had a capital loss carryforward of approximately $25,985,158 of which $6,651,966, $7,706,742, $10,009,147 and $1,617,303 will expire on October 31, 2015, 2016, 2017 and 2018, respectively. Capital loss carryforwards are only available to offset future capital gains of the Fund to the extent provided by regulations and may be limited. |
See accompanying notes which are an integral part of the financial statements.
Annual Report
Statement of Assets and Liabilities
| October 31, 2010 |
| | |
Assets | | |
Investment in securities, at value - See accompanying schedule: Unaffiliated issuers (cost $38,087,918) | $ 33,195,474 | |
Fidelity Central Funds (cost $1,438,671) | 1,438,671 | |
Total Investments (cost $39,526,589) | | $ 34,634,145 |
Cash | | 17,240 |
Receivable for investments sold | | 90,583 |
Receivable for fund shares sold | | 41,792 |
Dividends receivable | | 280,453 |
Distributions receivable from Fidelity Central Funds | | 293 |
Other receivables | | 21 |
Total assets | | 35,064,527 |
| | |
Liabilities | | |
Payable for investments purchased | $ 95,201 | |
Payable for fund shares redeemed | 36,783 | |
Accrued management fee | 19,361 | |
Distribution and service plan fees payable | 14,937 | |
Other affiliated payables | 9,672 | |
Other payables and accrued expenses | 69,190 | |
Total liabilities | | 245,144 |
| | |
Net Assets | | $ 34,819,383 |
Net Assets consist of: | | |
Paid in capital | | $ 66,547,210 |
Undistributed net investment income | | 62,304 |
Accumulated undistributed net realized gain (loss) on investments and foreign currency transactions | | (26,910,091) |
Net unrealized appreciation (depreciation) on investments and assets and liabilities in foreign currencies | | (4,880,040) |
Net Assets | | $ 34,819,383 |
See accompanying notes which are an integral part of the financial statements.
Annual Report
Financial Statements - continued
Statement of Assets and Liabilities - continued
| October 31, 2010 |
| | |
Calculation of Maximum Offering Price Class A:
Net Asset Value and redemption price per share ($13,966,669 ÷ 1,254,694 shares) | | $ 11.13 |
| | |
Maximum offering price per share (100/94.25 of $11.13) | | $ 11.81 |
Class T:
Net Asset Value and redemption price per share ($5,012,970 ÷ 458,925 shares) | | $ 10.92 |
| | |
Maximum offering price per share (100/96.50 of $10.92) | | $ 11.32 |
Class B:
Net Asset Value and offering price per share ($2,361,952 ÷ 227,367 shares)A | | $ 10.39 |
| | |
Class C:
Net Asset Value and offering price per share ($9,266,675 ÷ 885,937 shares)A | | $ 10.46 |
| | |
Institutional Class:
Net Asset Value, offering price and redemption price per share ($4,211,117 ÷ 367,400 shares) | | $ 11.46 |
A Redemption price per share is equal to net asset value less any applicable contingent deferred sales charge.
See accompanying notes which are an integral part of the financial statements.
Annual Report
Statement of Operations
| Year ended October 31, 2010 |
| | |
Investment Income | | |
Dividends | | $ 745,248 |
Interest | | 5 |
Income from Fidelity Central Funds | | 4,241 |
Income before foreign taxes withheld | | 749,494 |
Less foreign taxes withheld | | (52,167) |
Total income | | 697,327 |
| | |
Expenses | | |
Management fee
Basic fee | $ 255,779 | |
Performance adjustment | (55,152) | |
Transfer agent fees | 109,506 | |
Distribution and service plan fees | 185,214 | |
Accounting and security lending fees | 18,708 | |
Custodian fees and expenses | 20,069 | |
Independent trustees' compensation | 204 | |
Registration fees | 54,428 | |
Audit | 52,542 | |
Legal | 183 | |
Miscellaneous | 25,258 | |
Total expenses before reductions | 666,739 | |
Expense reductions | (31,720) | 635,019 |
Net investment income (loss) | | 62,308 |
Realized and Unrealized Gain (Loss) Net realized gain (loss) on: | | |
Investment securities: | | |
Unaffiliated issuers | (957,356) | |
Foreign currency transactions | 19,954 | |
Total net realized gain (loss) | | (937,402) |
Change in net unrealized appreciation (depreciation) on: Investment securities | 2,404,289 | |
Assets and liabilities in foreign currencies | 10,653 | |
Total change in net unrealized appreciation (depreciation) | | 2,414,942 |
Net gain (loss) | | 1,477,540 |
Net increase (decrease) in net assets resulting from operations | | $ 1,539,848 |
See accompanying notes which are an integral part of the financial statements.
Annual Report
Financial Statements - continued
Statement of Changes in Net Assets
| Year ended
October 31,
2010 | Year ended
October 31,
2009 |
Increase (Decrease) in Net Assets | | |
Operations | | |
Net investment income (loss) | $ 62,308 | $ 5,019 |
Net realized gain (loss) | (937,402) | (10,515,725) |
Change in net unrealized appreciation (depreciation) | 2,414,942 | 13,536,737 |
Net increase (decrease) in net assets resulting
from operations | 1,539,848 | 3,026,031 |
Distributions to shareholders from net realized gain | (376,323) | - |
Share transactions - net increase (decrease) | (483,817) | (8,304,847) |
Redemption fees | 9,997 | 12,477 |
Total increase (decrease) in net assets | 689,705 | (5,266,339) |
| | |
Net Assets | | |
Beginning of period | 34,129,678 | 39,396,017 |
End of period (including undistributed net investment income of $62,304 and undistributed net investment income of $5,019, respectively) | $ 34,819,383 | $ 34,129,678 |
See accompanying notes which are an integral part of the financial statements.
Annual Report
Financial Highlights - Class A
Years ended October 31, | 2010 | 2009 | 2008 | 2007 | 2006 |
Selected Per-Share Data | | | | | |
Net asset value, beginning of period | $ 10.62 | $ 9.37 | $ 16.41 | $ 16.72 | $ 15.61 |
Income from Investment Operations | | | | | |
Net investment income (loss) C | .05 | .03 | .03 | (.04) | (.07) |
Net realized and unrealized gain (loss) | .62 | 1.22 | (7.02) | (.27) | 1.17 |
Total from investment operations | .67 | 1.25 | (6.99) | (.31) | 1.10 |
Distributions from net realized gain | (.16) | - | (.06) | - | - |
Redemption fees added to paid in capital C | - G | - G | .01 | - G | .01 |
Net asset value, end of period | $ 11.13 | $ 10.62 | $ 9.37 | $ 16.41 | $ 16.72 |
Total Return A, B | 6.31% | 13.34% | (42.68)% | (1.85)% | 7.11% |
Ratios to Average Net Assets D, F | | | | | |
Expenses before reductions | 1.59% | 1.50% | 1.54% | 1.70% | 1.52% |
Expenses net of fee waivers, if any | 1.50% | 1.50% | 1.50% | 1.50% | 1.50% |
Expenses net of all reductions | 1.50% | 1.49% | 1.49% | 1.48% | 1.48% |
Net investment income (loss) | .43% | .30% | .24% | (.22)% | (.42)% |
Supplemental Data | | | | | |
Net assets, end of period (000 omitted) | $ 13,967 | $ 12,798 | $ 14,133 | $ 32,945 | $ 41,876 |
Portfolio turnover rate E | 52% | 63% | 63% | 138% | 83% |
A Total returns would have been lower had certain expenses not been reduced during the periods shown.
B Total returns do not include the effect of the sales charges.
C Calculated based on average shares outstanding during the period.
D Fees and expenses of the underlying Fidelity Central Funds are not included in the Fund's expense ratio. The Fund indirectly bears its proportionate share of the expenses of any underlying Fidelity Central Funds.
E Amount does not include the portfolio activity of any underlying Fidelity Central Funds.
F Expense ratios reflect operating expenses of the class. Expenses before reductions do not reflect amounts reimbursed by the investment adviser or reductions from brokerage service arrangements or reductions from other expense offset arrangements and do not represent the amount paid by the class during periods when reimbursements or reductions occur. Expenses net of fee waivers reflect expenses after reimbursement by the investment adviser but prior to reductions from brokerage service arrangements or other expense offset arrangements. Expenses net of all reductions represent the net expenses paid by the class.
G Amount represents less than $.01 per share.
See accompanying notes which are an integral part of the financial statements.
Annual Report
Financial Highlights - Class T
Years ended October 31, | 2010 | 2009 | 2008 | 2007 | 2006 |
Selected Per-Share Data | | | | | |
Net asset value, beginning of period | $ 10.41 | $ 9.21 | $ 16.11 | $ 16.46 | $ 15.41 |
Income from Investment Operations | | | | | |
Net investment income (loss) C | .02 | - G | - G | (.08) | (.12) |
Net realized and unrealized gain (loss) | .61 | 1.20 | (6.91) | (.27) | 1.16 |
Total from investment operations | .63 | 1.20 | (6.91) | (.35) | 1.04 |
Distributions from net realized gain | (.12) | - | - G | - | - |
Redemption fees added to paid in capital C | - G | - G | .01 | - G | .01 |
Net asset value, end of period | $ 10.92 | $ 10.41 | $ 9.21 | $ 16.11 | $ 16.46 |
Total Return A, B | 6.07% | 13.03% | (42.82)% | (2.13)% | 6.81% |
Ratios to Average Net Assets D, F | | | | | |
Expenses before reductions | 1.89% | 1.80% | 1.81% | 1.96% | 1.82% |
Expenses net of fee waivers, if any | 1.75% | 1.75% | 1.75% | 1.75% | 1.75% |
Expenses net of all reductions | 1.75% | 1.74% | 1.74% | 1.73% | 1.73% |
Net investment income (loss) | .18% | .05% | (.01)% | (.47)% | (.67)% |
Supplemental Data | | | | | |
Net assets, end of period (000 omitted) | $ 5,013 | $ 5,487 | $ 6,752 | $ 14,303 | $ 21,039 |
Portfolio turnover rate E | 52% | 63% | 63% | 138% | 83% |
A Total returns would have been lower had certain expenses not been reduced during the periods shown.
B Total returns do not include the effect of the sales charges.
C Calculated based on average shares outstanding during the period.
D Fees and expenses of the underlying Fidelity Central Funds are not included in the Fund's expense ratio. The Fund indirectly bears its proportionate share of the expenses of any underlying Fidelity Central Funds.
E Amount does not include the portfolio activity of any underlying Fidelity Central Funds.
F Expense ratios reflect operating expenses of the class. Expenses before reductions do not reflect amounts reimbursed by the investment adviser or reductions from brokerage service arrangements or reductions from other expense offset arrangements and do not represent the amount paid by the class during periods when reimbursements or reductions occur. Expenses net of fee waivers reflect expenses after reimbursement by the investment adviser but prior to reductions from brokerage service arrangements or other expense offset arrangements. Expenses net of all reductions represent the net expenses paid by the class.
G Amount represents less than $.01 per share.
See accompanying notes which are an integral part of the financial statements.
Annual Report
Financial Highlights - Class B
Years ended October 31, | 2010 | 2009 | 2008 | 2007 | 2006 |
Selected Per-Share Data | | | | | |
Net asset value, beginning of period | $ 9.92 | $ 8.82 | $ 15.50 | $ 15.91 | $ 14.96 |
Income from Investment Operations | | | | | |
Net investment income (loss) C | (.03) | (.04) | (.07) | (.15) | (.20) |
Net realized and unrealized gain (loss) | .58 | 1.14 | (6.61) | (.26) | 1.14 |
Total from investment operations | .55 | 1.10 | (6.68) | (.41) | .94 |
Distributions from net realized gain | (.08) | - | - | - | - |
Redemption fees added to paid in capital C | - G | - G | - G | - G | .01 |
Net asset value, end of period | $ 10.39 | $ 9.92 | $ 8.82 | $ 15.50 | $ 15.91 |
Total Return A, B | 5.55% | 12.47% | (43.10)% | (2.58)% | 6.35% |
Ratios to Average Net Assets D, F | | | | | |
Expenses before reductions | 2.36% | 2.26% | 2.29% | 2.45% | 2.33% |
Expenses net of fee waivers, if any | 2.25% | 2.25% | 2.25% | 2.25% | 2.25% |
Expenses net of all reductions | 2.25% | 2.24% | 2.24% | 2.23% | 2.23% |
Net investment income (loss) | (.32)% | (.45)% | (.51)% | (.97)% | (1.17)% |
Supplemental Data | | | | | |
Net assets, end of period (000 omitted) | $ 2,362 | $ 2,564 | $ 3,079 | $ 7,874 | $ 16,120 |
Portfolio turnover rate E | 52% | 63% | 63% | 138% | 83% |
A Total returns would have been lower had certain expenses not been reduced during the periods shown.
B Total returns do not include the effect of the contingent deferred sales charge.
C Calculated based on average shares outstanding during the period.
D Fees and expenses of the underlying Fidelity Central Funds are not included in the Fund's expense ratio. The Fund indirectly bears its proportionate share of the expenses of any underlying Fidelity Central Funds.
E Amount does not include the portfolio activity of any underlying Fidelity Central Funds.
F Expense ratios reflect operating expenses of the class. Expenses before reductions do not reflect amounts reimbursed by the investment adviser or reductions from brokerage service arrangements or reductions from other expense offset arrangements and do not represent the amount paid by the class during periods when reimbursements or reductions occur. Expenses net of fee waivers reflect expenses after reimbursement by the investment adviser but prior to reductions from brokerage service arrangements or other expense offset arrangements. Expenses net of all reductions represent the net expenses paid by the class.
G Amount represents less than $.01 per share.
See accompanying notes which are an integral part of the financial statements.
Annual Report
Financial Highlights - Class C
Years ended October 31, | 2010 | 2009 | 2008 | 2007 | 2006 |
Selected Per-Share Data | | | | | |
Net asset value, beginning of period | $ 9.98 | $ 8.88 | $ 15.60 | $ 16.01 | $ 15.05 |
Income from Investment Operations | | | | | |
Net investment income (loss) C | (.03) | (.04) | (.07) | (.15) | (.18) |
Net realized and unrealized gain (loss) | .59 | 1.14 | (6.65) | (.26) | 1.13 |
Total from investment operations | .56 | 1.10 | (6.72) | (.41) | .95 |
Distributions from net realized gain | (.08) | - | - | - | - |
Redemption fees added to paid in capital C | - G | - G | - G | - G | .01 |
Net asset value, end of period | $ 10.46 | $ 9.98 | $ 8.88 | $ 15.60 | $ 16.01 |
Total Return A, B | 5.58% | 12.39% | (43.08)% | (2.56)% | 6.38% |
Ratios to Average Net Assets D, F | | | | | |
Expenses before reductions | 2.35% | 2.25% | 2.26% | 2.37% | 2.18% |
Expenses net of fee waivers, if any | 2.25% | 2.25% | 2.25% | 2.25% | 2.18% |
Expenses net of all reductions | 2.25% | 2.24% | 2.24% | 2.23% | 2.16% |
Net investment income (loss) | (.32)% | (.45)% | (.51)% | (.97)% | (1.10)% |
Supplemental Data | | | | | |
Net assets, end of period (000 omitted) | $ 9,267 | $ 9,286 | $ 11,612 | $ 33,957 | $ 53,846 |
Portfolio turnover rate E | 52% | 63% | 63% | 138% | 83% |
A Total returns would have been lower had certain expenses not been reduced during the periods shown.
B Total returns do not include the effect of the contingent deferred sales charge.
C Calculated based on average shares outstanding during the period.
D Fees and expenses of the underlying Fidelity Central Funds are not included in the Fund's expense ratio. The Fund indirectly bears its proportionate share of the expenses of any underlying Fidelity Central Funds.
E Amount does not include the portfolio activity of any underlying Fidelity Central Funds.
F Expense ratios reflect operating expenses of the class. Expenses before reductions do not reflect amounts reimbursed by the investment adviser or reductions from brokerage service arrangements or reductions from other expense offset arrangements and do not represent the amount paid by the class during periods when reimbursements or reductions occur. Expenses net of fee waivers reflect expenses after reimbursement by the investment adviser but prior to reductions from brokerage service arrangements or other expense offset arrangements. Expenses net of all reductions represent the net expenses paid by the class.
G Amount represents less than $.01 per share.
See accompanying notes which are an integral part of the financial statements.
Annual Report
Financial Highlights - Institutional Class
Years ended October 31, | 2010 | 2009 | 2008 | 2007 | 2006 |
Selected Per-Share Data | | | | | |
Net asset value, beginning of period | $ 10.93 | $ 9.62 | $ 16.82 | $ 17.10 | $ 15.90 |
Income from Investment Operations | | | | | |
Net investment income (loss) B | .08 | .06 | .08 | .01 | (.01) |
Net realized and unrealized gain (loss) | .64 | 1.25 | (7.19) | (.29) | 1.19 |
Total from investment operations | .72 | 1.31 | (7.11) | (.28) | 1.18 |
Distributions from net realized gain | (.19) | - | (.10) | - | - |
Redemption fees added to paid in capital B | - F | - F | .01 | - F | .02 |
Net asset value, end of period | $ 11.46 | $ 10.93 | $ 9.62 | $ 16.82 | $ 17.10 |
Total Return A | 6.65% | 13.62% | (42.45)% | (1.64)% | 7.55% |
Ratios to Average Net Assets C, E | | | | | |
Expenses before reductions | 1.22% | 1.19% | 1.16% | 1.31% | 1.12% |
Expenses net of fee waivers, if any | 1.22% | 1.19% | 1.16% | 1.25% | 1.12% |
Expenses net of all reductions | 1.22% | 1.17% | 1.15% | 1.23% | 1.10% |
Net investment income (loss) | .72% | .61% | .58% | .03% | (.04)% |
Supplemental Data | | | | | |
Net assets, end of period (000 omitted) | $ 4,211 | $ 3,995 | $ 3,820 | $ 8,440 | $ 13,773 |
Portfolio turnover rate D | 52% | 63% | 63% | 138% | 83% |
A Total returns would have been lower had certain expenses not been reduced during the periods shown.
B Calculated based on average shares outstanding during the period.
C Fees and expenses of the underlying Fidelity Central Funds are not included in the Fund's expense ratio. The Fund indirectly bears its proportionate share of the expenses of any underlying Fidelity Central Funds.
D Amount does not include the portfolio activity of any underlying Fidelity Central Funds.
E Expense ratios reflect operating expenses of the class. Expenses before reductions do not reflect amounts reimbursed by the investment adviser or reductions from brokerage service arrangements or reductions from other expense offset arrangements and do not represent the amount paid by the class during periods when reimbursements or reductions occur. Expenses net of fee waivers reflect expenses after reimbursement by the investment adviser but prior to reductions from brokerage service arrangements or other expense offset arrangements. Expenses net of all reductions represent the net expenses paid by the class.
F Amount represents less than $.01 per share.
See accompanying notes which are an integral part of the financial statements.
Annual Report
Notes to Financial Statements
For the period ended October 31, 2010
1. Organization.
Fidelity Advisor Japan Fund (the Fund) is a fund of Fidelity Advisor Series VIII (the Trust) and is authorized to issue an unlimited number of shares. The Trust is registered under the Investment Company Act of 1940, as amended (the 1940 Act), as an open-end management investment company organized as a Massachusetts business trust. The Fund offers Class A, Class T, Class C, and Institutional Class shares, each of which has equal rights as to assets and voting privileges. Effective after the close of business on September 1, 2010, Class B shares were closed to new accounts and additional purchases by existing shareholders. Each class has exclusive voting rights with respect to matters that affect that class. Class B shares will automatically convert to Class A shares after a holding period of seven years from the initial date of purchase. Investment income, realized and unrealized capital gains and losses, the common expenses of the Fund, and certain fund-level expense reductions, if any, are allocated on a pro-rata basis to each class based on the relative net assets of each class to the total net assets of the Fund. Each class differs with respect to transfer agent and distribution and service plan fees incurred. Certain expense reductions also differ by class.
2. Investments in Fidelity Central Funds.
The Fund may invest in Fidelity Central Funds, which are open-end investment companies available only to other investment companies and accounts managed by Fidelity Management & Research Company (FMR) and its affiliates. The Fund's Schedule of Investments lists each of the Fidelity Central Funds held as of period end, if any, as an investment of the Fund, but does not include the underlying holdings of each Fidelity Central Fund. As an Investing Fund, the Fund indirectly bears its proportionate share of the expenses of the underlying Fidelity Central Funds.
The Money Market Central Funds seek preservation of capital and current income and are managed by Fidelity Investments Money Management, Inc. (FIMM), an affiliate of FMR.
A complete unaudited list of holdings for each Fidelity Central Fund is available upon request or at the Securities and Exchange Commission (the SEC) web site at www.sec.gov. In addition, the financial statements of the Fidelity Central Funds which are not covered by the Fund's Report of Independent Registered Public Accounting Firm, are available on the SEC web site or upon request.
3. Significant Accounting Policies.
The financial statements have been prepared in conformity with accounting principles generally accepted in the United States of America (GAAP), which require management to make certain estimates and assumptions at the date of the financial statements. Actual results could differ from those estimates. The following summarizes the significant accounting policies of the Fund:
Annual Report
3. Significant Accounting Policies - continued
Security Valuation. Investments are valued as of 4:00 p.m. Eastern time on the last calendar day of the period. The Fund uses independent pricing services approved by the Board of Trustees to value its investments. When current market prices or quotations are not readily available or reliable, valuations may be determined in good faith in accordance with procedures adopted by the Board of Trustees. Factors used in determining value may include market or security specific events. The frequency with which these procedures are used cannot be predicted and they may be utilized to a significant extent. The value used for net asset value (NAV) calculation under these procedures may differ from published prices for the same securities.
The Fund categorizes the inputs to valuation techniques used to value its investments into a disclosure hierarchy consisting of three levels as shown below.
Level 1 - quoted prices in active markets for identical investments
Level 2 - other significant observable inputs (including quoted prices for similar investments, interest rates, prepayment speeds, etc.)
Level 3 - unobservable inputs (including the fund's own assumptions based on the best information available)
Changes in valuation techniques may result in transfers in or out of an assigned level within the disclosure hierarchy. The aggregate value of investments by input level, as of October 31, 2010, is included at the end of the Fund's Schedule of Investments. Valuation techniques used to value the Fund's investments by major category are as follows.
Equity securities, including restricted securities, for which market quotations are readily available, are valued at the last reported sale price or official closing price as reported by an independent pricing service on the primary market or exchange on which they are traded and are categorized as Level 1 in the hierarchy. In the event there were no sales during the day or closing prices are not available, securities are valued at the last quoted bid price or may be valued using the last available price and are generally categorized as Level 2 in the hierarchy. For foreign equity securities, when significant market or security specific events arise, comparisons to the valuation of American Depositary Receipts (ADRs), futures contracts, Exchange-traded funds (ETFs) and certain indexes as well as quoted prices for similar securities are used and are categorized as Level 2 in the hierarchy in these circumstances. Utilizing these techniques may result in significant transfers between Level 1 and Level 2. For restricted equity securities and private placements where observable inputs are limited, assumptions about market activity and risk are used and are categorized as Level 3 in the hierarchy.
Investments in open-end mutual funds, including the Fidelity Central Funds, are valued at their closing net asset value each business day and are categorized as Level 1 in the
Annual Report
Notes to Financial Statements - continued
3. Significant Accounting Policies - continued
Security Valuation - continued
hierarchy. Short-term securities with remaining maturities of sixty days or less for which quotations are not readily available are valued at amortized cost, which approximates fair value and are categorized as Level 2 in the hierarchy.
Foreign Currency. The Fund uses foreign currency contracts to facilitate transactions in foreign-denominated securities. Gains and losses from these transactions may arise from changes in the value of the foreign currency or if the counterparties do not perform under the contracts' terms.
Foreign-denominated assets, including investment securities, and liabilities are translated into U.S. dollars at the exchange rate at period end. Purchases and sales of investment securities, income and dividends received and expenses denominated in foreign currencies are translated into U.S. dollars at the exchange rate in effect on the transaction date.
The effects of exchange rate fluctuations on investments are included with the net realized and unrealized gain (loss) on investment securities. Other foreign currency transactions resulting in realized and unrealized gain (loss) are disclosed separately.
Investment Transactions and Income. For financial reporting purposes, the Fund's investment holdings and NAV include trades executed through the end of the last business day of the period. The NAV per share for processing shareholder transactions is calculated as of the close of business of the New York Stock Exchange (NYSE), normally 4:00 p.m. Eastern time and includes trades executed through the end of the prior business day. Gains and losses on securities sold are determined on the basis of identified cost. Dividend income is recorded on the ex-dividend date, except for certain dividends from foreign securities where the ex-dividend date may have passed, which are recorded as soon as the Fund is informed of the ex-dividend date. Non-cash dividends included in dividend income, if any, are recorded at the fair market value of the securities received. Interest income and distributions from the Fidelity Central Funds are accrued as earned. Interest income includes coupon interest and amortization of premium and accretion of discount on debt securities. Investment income is recorded net of foreign taxes withheld where recovery of such taxes is uncertain.
Expenses. Most expenses of the Trust can be directly attributed to a fund. Expenses which cannot be directly attributed are apportioned amongst each fund in the Trust. Expense estimates are accrued in the period to which they relate and adjustments are made when actual amounts are known.
Income Tax Information and Distributions to Shareholders. Each year the Fund intends to qualify as a regulated investment company, including distributing substantially all of its taxable income and realized gains under Subchapter M of the Internal
Annual Report
3. Significant Accounting Policies - continued
Income Tax Information and Distributions to Shareholders - continued
Revenue Code and filing its U.S. federal tax return. As a result, no provision for income taxes is required. As of October 31, 2010, the Fund did not have any unrecognized tax benefits in the accompanying financial statements. A fund's federal tax return is subject to examination by the Internal Revenue Service (IRS) for a period of three years. Foreign taxes are provided for based on the Fund's understanding of the tax rules and rates that exist in the foreign markets in which it invests.
Distributions are declared and recorded on the ex-dividend date. Income dividends and capital gain distributions are declared separately for each class. Income and capital gain distributions are determined in accordance with income tax regulations, which may differ from GAAP.
Capital accounts within the financial statements are adjusted for permanent book-tax differences. These adjustments have no impact on net assets or the results of operations. Temporary book-tax differences will reverse in a subsequent period.
Book-tax differences are primarily due to the short-term gain distributions from the Fidelity Central Funds, foreign currency transactions, passive foreign investment companies (PFIC), capital loss carryforwards, expiring capital loss carryforwards and losses deferred due to wash sales.
The federal tax cost of investment securities and unrealized appreciation (depreciation) as of period end were as follows:
Gross unrealized appreciation | $ 1,393,464 |
Gross unrealized depreciation | (7,587,369) |
Net unrealized appreciation (depreciation) | $ (6,193,905) |
| |
Tax Cost | $ 40,828,050 |
The tax-based components of distributable earnings as of period end were as follows:
Undistributed ordinary income | $ 438,831 |
Capital loss carryforward | $ (25,985,158) |
Net unrealized appreciation (depreciation) | $ (6,181,501) |
The tax character of distributions paid was as follows:
| October 31, 2010 | October 31, 2009 |
Ordinary Income | $ 376,323 | $ - |
Annual Report
Notes to Financial Statements - continued
3. Significant Accounting Policies - continued
Short-Term Trading (Redemption) Fees. Shares held by investors in the Fund less than 90 days are subject to a redemption fee equal to 1.50% of the net asset value of shares redeemed. All redemption fees, which reduce the proceeds of the shareholder redemption, are retained by the Fund and accounted for as an addition to paid in capital.
4. Purchases and Sales of Investments.
Purchases and sales of securities, other than short-term securities, aggregated $17,440,273 and $18,229,788, respectively.
5. Fees and Other Transactions with Affiliates.
Management Fee. FMR and its affiliates provide the Fund with investment management related services for which the Fund pays a monthly management fee. The management fee is the sum of an individual fund fee rate that is based on an annual rate of .45% of the Fund's average net assets and a group fee rate that averaged .26% during the period. The group fee rate is based upon the average net assets of all the mutual funds advised by FMR. The group fee rate decreases as assets under management increase and increases as assets under management decrease. In addition, the management fee is subject to a performance adjustment (up to a maximum of ± .20% of the Fund's average net assets over a 36 month performance period). The upward or downward adjustment to the management fee is based on the relative investment performance of the Institutional class of the Fund, as compared to an appropriate benchmark index. For the period, the total annual management fee rate, including the performance adjustment, was .56% of the Fund's average net assets.
Distribution and Service Plan Fees. In accordance with Rule 12b-1 of the 1940 Act, the Fund has adopted separate Distribution and Service Plans for each class of shares. Certain classes pay Fidelity Distributors Corporation (FDC), an affiliate of FMR, separate Distribution and Service Fees, each of which is based on an annual percentage of each class' average net assets. In addition, FDC may pay financial intermediaries for selling shares of the Fund and providing shareholder support services. For the period, the Distribution and Service Fee rates, total fees and amounts retained by FDC were as follows:
| Distribution
Fee | Service
Fee | Total Fees | Retained
by FDC |
Class A | -% | .25% | $ 35,299 | $ 1,649 |
Class T | .25% | .25% | 26,408 | 44 |
Class B | .75% | .25% | 26,095 | 19,592 |
Class C | .75% | .25% | 97,412 | 22,002 |
| | | $ 185,214 | $ 43,287 |
Annual Report
5. Fees and Other Transactions with Affiliates - continued
Sales Load. FDC receives a front-end sales charge of up to 5.75% for selling Class A shares, and 3.50% for selling Class T shares, some of which is paid to financial intermediaries for selling shares of the Fund. FDC receives the proceeds of contingent deferred sales charges levied on Class A, Class T, Class B, and Class C redemptions. These charges depend on the holding period. The deferred sales charges range from 5% to 1% for Class B, 1% for Class C, 1.00% for certain purchases of Class A shares (1.00% to .50% prior to July 12, 2010) and .25% for certain purchases of Class T shares.
For the period, sales charge amounts retained by FDC were as follows:
| Retained
by FDC |
Class A | $ 6,389 |
Class T | 1,601 |
Class B* | 5,333 |
Class C* | 2,588 |
| $ 15,911 |
* When Class B and Class C shares are initially sold, FDC pays commissions from its own resources to financial intermediaries through which the sales are made.
Transfer Agent Fees. Fidelity Investments Institutional Operations Company, Inc. (FIIOC), an affiliate of FMR, is the transfer, dividend disbursing and shareholder servicing agent for each class of the Fund. FIIOC receives account fees and asset-based fees that vary according to the account size and type of account of the shareholders of the respective classes of the Fund. FIIOC pays for typesetting, printing and mailing of shareholder reports, except proxy statements. For the period, transfer agent fees for each class were as follows:
| Amount | % of
Average
Net Assets |
Class A | $ 44,291 | .31 |
Class T | 18,350 | .35 |
Class B | 8,250 | .32 |
Class C | 30,433 | .31 |
Institutional Class | 8,182 | .19 |
| $ 109,506 | |
Accounting and Security Lending Fees. Fidelity Service Company, Inc. (FSC), an affiliate of FMR, maintains the Fund's accounting records. The accounting fee is based on the level of average net assets for the month. Under a separate contract, FSC administers the security lending program. The security lending fee is based on the number and duration of lending transactions.
Annual Report
Notes to Financial Statements - continued
6. Committed Line of Credit.
The Fund participates with other funds managed by FMR or an affiliate in a $3.75 billion credit facility (the "line of credit") to be utilized for temporary or emergency purposes to fund shareholder redemptions or for other short-term liquidity purposes. The Fund has agreed to pay commitment fees on its pro-rata portion of the line of credit, which amounted to $142 and is reflected in Miscellaneous expenses on the Statement of Operations. During the period, there were no borrowings on this line of credit.
7. Security Lending.
The Fund lends portfolio securities through a lending agent from time to time in order to earn additional income. The lending agent may loan securities to certain qualified borrowers, including Fidelity Capital Markets (FCM), a broker-dealer affiliated with the Fund. On the settlement date of the loan, the Fund receives collateral (in the form of U.S. Treasury obligations, letters of credit and/or cash) against the loaned securities and maintains collateral in an amount not less than 100% of the market value of the loaned securities during the period of the loan. The market value of the loaned securities is determined at the close of business of the Fund and any additional required collateral is delivered to the Fund on the next business day. If the borrower defaults on its obligation to return the securities loaned because of insolvency or other reasons, a fund could experience delays and costs in recovering the securities loaned or in gaining access to the collateral. Any cash collateral received is invested in the Fidelity Securities Lending Cash Central Fund. At period end, there were no security loans outstanding. Security lending income represents the income earned on investing cash collateral, less rebates paid to borrowers and lending agent fees associated with the loan, plus any premium payments received for lending certain types of securities. Security lending income is presented in the Statement of Operations as a component of income from Fidelity Central Funds. Total security lending income during the period amounted to $352. During the period, there were no securities loaned to FCM.
8. Expense Reductions.
FMR voluntarily agreed to reimburse each class to the extent annual operating expenses exceeded certain levels of average net assets as noted in the table below. Some expenses, for example interest expense, including commitment fees, are excluded from this reimbursement.
Annual Report
8. Expense Reductions - continued
The following classes were in reimbursement during the period:
| Expense
Limitations | Reimbursement
from adviser |
Class A | 1.50% | $ 12,287 |
Class T | 1.75% | 7,230 |
Class B | 2.25% | 2,764 |
Class C | 2.25% | 9,436 |
| | $ 31,717 |
Effective November 1, 2010 the expense limitations will be changed to 1.45%, 1.70%, 2.20%, 2.20% and 1.20%, for Class A, Class T, Class B, Class C and Institutional Class, respectively.
In addition, through arrangements with the Fund's custodian, credits realized as a result of uninvested cash balances were used to reduce the Fund's expenses. During the period, these credits reduced the Fund's custody expenses by $3.
9. Distributions to Shareholders.
Distributions to shareholders of each class were as follows:
Years ended October 31, | 2010 | 2009 |
From net realized gain | | |
Class A | $ 169,692 | $ - |
Class T | 56,316 | - |
Class B | 19,672 | - |
Class C | 68,018 | - |
Institutional Class | 62,625 | - |
Total | $ 376,323 | $ - |
Annual Report
Notes to Financial Statements - continued
10. Share Transactions.
Transactions for each class of shares were as follows:
| Shares | Dollars |
Years ended October 31, | 2010 | 2009 | 2010 | 2009 |
Class A | | | | |
Shares sold | 748,157 | 387,815 | $ 8,391,879 | $ 3,955,890 |
Reinvestment of distributions | 12,486 | - | 136,600 | - |
Shares redeemed | (711,427) | (690,213) | (7,898,774) | (6,443,696) |
Net increase (decrease) | 49,216 | (302,398) | $ 629,705 | $ (2,487,806) |
Class T | | | | |
Shares sold | 100,270 | 85,871 | $ 1,118,342 | $ 821,641 |
Reinvestment of distributions | 4,803 | - | 51,676 | - |
Shares redeemed | (173,139) | (291,704) | (1,856,581) | (2,612,466) |
Net increase (decrease) | (68,066) | (205,833) | $ (686,563) | $ (1,790,825) |
Class B | | | | |
Shares sold | 95,243 | 33,684 | $ 1,007,461 | $ 311,723 |
Reinvestment of distributions | 1,391 | - | 14,289 | - |
Shares redeemed | (127,802) | (124,191) | (1,327,780) | (1,068,104) |
Net increase (decrease) | (31,168) | (90,507) | $ (306,030) | $ (756,381) |
Class C | | | | |
Shares sold | 319,999 | 185,921 | $ 3,427,507 | $ 1,754,348 |
Reinvestment of distributions | 4,614 | - | 47,750 | - |
Shares redeemed | (369,025) | (563,483) | (3,805,333) | (4,904,518) |
Net increase (decrease) | (44,412) | (377,562) | $ (330,076) | $ (3,150,170) |
Institutional Class | | | | |
Shares sold | 283,408 | 90,905 | $ 3,342,911 | $ 979,010 |
Reinvestment of distributions | 1,088 | - | 12,214 | - |
Shares redeemed | (282,547) | (122,531) | (3,145,978) | (1,098,675) |
Net increase (decrease) | 1,949 | (31,626) | $ 209,147 | $ (119,665) |
11. Other.
The Fund's organizational documents provide former and current trustees and officers with a limited indemnification against liabilities arising in connection with the performance of their duties to the Fund. In the normal course of business, the Fund may also enter into contracts that provide general indemnifications. The Fund's maximum exposure under these arrangements is unknown as this would be dependent on future claims that may be made against the Fund. The risk of material loss from such claims is considered remote.
Annual Report
12. Proposed Reorganization.
The Board of Trustees of the Fund has approved an Agreement and Plan of Reorganization between the Fund and Fidelity Japan Fund. The agreement provides for the transfer of all of the assets and the assumption of all the liabilities of the Fund in exchange solely for the number of equivalent shares of Fidelity Japan Fund having the same aggregate net asset value as the outstanding shares of the corresponding classes of the Fund on the day the reorganization is effective.
The reorganization was approved by the shareholders and is expected to become effective on or about December 17, 2010. The reorganization is expected to qualify as a tax-free transaction with no gain or loss recognized by the Funds or their shareholders.
Annual Report
To the Trustees of Fidelity Advisor Series VIII and the Shareholders of Fidelity Advisor Japan Fund:
In our opinion, the accompanying statement of assets and liabilities, including the schedule of investments, and the related statements of operations and of changes in net assets and the financial highlights present fairly, in all material respects, the financial position of Fidelity Advisor Japan Fund (a fund of Fidelity Advisor Series VIII) at October 31, 2010, the results of its operations for the year then ended, the changes in its net assets for each of the two years in the period then ended and the financial highlights for each of the five years in the period then ended, in conformity with accounting principles generally accepted in the United States of America. These financial statements and financial highlights (hereafter referred to as "financial statements") are the responsibility of the Fidelity Advisor Japan Fund's management. Our responsibility is to express an opinion on these financial statements based on our audits. We conducted our audits of these financial statements in accordance with the standards of the Public Company Accounting Oversight Board (United States). Those standards require that we plan and perform the audit to obtain reasonable assurance about whether the financial statements are free of material misstatement. An audit includes examining, on a test basis, evidence supporting the amounts and disclosures in the financial statements, assessing the accounting principles used and significant estimates made by management, and evaluating the overall financial statement presentation. We believe that our audits, which included confirmation of securities at October 31, 2010 by correspondence with the custodian and brokers, provide a reasonable basis for our opinion.
/s/ PricewaterhouseCoopers LLP
PricewaterhouseCoopers LLP
Boston, Massachusetts
December 13, 2010
Annual Report
The Trustees, Member of the Advisory Board, and executive officers of the trust and fund, as applicable, are listed below. The Board of Trustees governs the fund and is responsible for protecting the interests of shareholders. The Trustees are experienced executives who meet periodically throughout the year to oversee the fund's activities, review contractual arrangements with companies that provide services to the fund, oversee management of the risks associated with such activities and contractual arrangements, and review the fund's performance. Except for James C. Curvey, each of the Trustees oversees 221 funds advised by FMR or an affiliate. Mr. Curvey oversees 410 funds advised by FMR or an affiliate.
The Trustees hold office without limit in time except that (a) any Trustee may resign; (b) any Trustee may be removed by written instrument, signed by at least two-thirds of the number of Trustees prior to such removal; (c) any Trustee who requests to be retired or who has become incapacitated by illness or injury may be retired by written instrument signed by a majority of the other Trustees; and (d) any Trustee may be removed at any special meeting of shareholders by a two-thirds vote of the outstanding voting securities of the trust. Each Trustee who is not an interested person (as defined in the 1940 Act) (Independent Trustee), shall retire not later than the last day of the calendar year in which his or her 72nd birthday occurs. The Independent Trustees may waive this mandatory retirement age policy with respect to individual Trustees. The executive officers and Advisory Board Member hold office without limit in time, except that any officer and Advisory Board Member may resign or may be removed by a vote of a majority of the Trustees at any regular meeting or any special meeting of the Trustees. Except as indicated, each individual has held the office shown or other offices in the same company for the past five years.
Experience, Skills, Attributes, and Qualifications of the Fund's Trustees. The Governance and Nominating Committee has adopted a statement of policy that describes the experience, qualifications, attributes, and skills that are necessary and desirable for potential Independent Trustee candidates (Statement of Policy). The Board believes that each Trustee satisfied at the time he or she was initially elected or appointed a Trustee, and continues to satisfy, the standards contemplated by the Statement of Policy. The Governance and Nominating Committee also engages professional search firms to help identify potential Independent Trustee candidates who have the experience, qualifications, attributes, and skills consistent with the Statement of Policy. From time to time, additional criteria based on the composition and skills of the current Independent Trustees, as well as experience or skills that may be appropriate in light of future changes to board composition, business conditions, and regulatory or other developments, have also been considered by the professional search firms and the Governance and Nominating Committee. In addition, the Board takes into account the Trustees' commitment and participation in Board and committee meetings, as well as their leadership of standing and ad hoc committees throughout their tenure.
In determining that a particular Trustee was and continues to be qualified to serve as a Trustee, the Board has considered a variety of criteria, none of which, in isolation, was controlling. The Board believes that, collectively, the Trustees have balanced and diverse experience, qualifications, attributes, and skills, which allow the Board to operate effectively in governing the fund and protecting the interests of shareholders. Information about the specific experience, skills, attributes, and qualifications of each Trustee, which in each case led to the Board's conclusion that the Trustee should serve (or continue to serve) as a trustee of the fund, is provided below.
Annual Report
Board Structure and Oversight Function. Edward C. Johnson 3d is an interested person (as defined in the 1940 Act) and currently serves as Chairman. The Trustees have determined that an interested Chairman is appropriate and benefits shareholders because an interested Chairman has a personal and professional stake in the quality and continuity of services provided to the fund. Independent Trustees exercise their informed business judgment to appoint an individual of their choosing to serve as Chairman, regardless of whether the Trustee happens to be independent or a member of management. The Independent Trustees have determined that they can act independently and effectively without having an Independent Trustee serve as Chairman and that a key structural component for assuring that they are in a position to do so is for the Independent Trustees to constitute a substantial majority for the Board. The Independent Trustees also regularly meet in executive session. Ned C. Lautenbach serves as Chairman of the Independent Trustees and as such (i) acts as a liaison between the Independent Trustees and management with respect to matters important to the Independent Trustees and (ii) with management prepares agendas for Board meetings.
Fidelity funds are overseen by different Boards of Trustees. The fund's Board oversees Fidelity's equity and high income funds and another Board oversees Fidelity's investment-grade bond, money market, and asset allocation funds. The asset allocation funds may invest in Fidelity funds overseen by the fund's Board. The use of separate Boards, each with its own committee structure, allows the Trustees of each group of Fidelity funds to focus on the unique issues of the funds they oversee, including common research, investment, and operational issues. On occasion, the separate Boards establish joint committees to address issues of overlapping consequences for the Fidelity funds overseen by each Board.
The Trustees operate using a system of committees to facilitate the timely and efficient consideration of all matters of importance to the Trustees, the fund, and fund shareholders and to facilitate compliance with legal and regulatory requirements and oversight of the fund's activities and associated risks. The Board, acting through its committees, has charged FMR and its affiliates with (i) identifying events or circumstances the occurrence of which could have demonstrably adverse effects on the fund's business and/or reputation; (ii) implementing processes and controls to lessen the possibility that such events or circumstances occur or to mitigate the effects of such events or circumstances if they do occur; and (iii) creating and maintaining a system designed to evaluate continuously business and market conditions in order to facilitate the identification and implementation processes described in (i) and (ii) above. Because the day-to-day operations and activities of the fund are carried out by or through FMR, its affiliates and other service providers, the fund's exposure to risks is mitigated but not eliminated by the processes overseen by the Trustees. While each of the Board's committees has responsibility for overseeing different aspects of the fund's activities, oversight is exercised primarily through the Operations, Audit, and Compliance Committees. Appropriate personnel, including but not limited to the fund's Chief Compliance Officer (CCO), FMR's internal auditor, the independent accountants, the fund's Treasurer and portfolio management personnel, make periodic reports to the Board's committees, as appropriate. The responsibilities of each committee, including their oversight responsibilities, are described further under "Standing Committees of the Fund's Trustees."
Annual Report
Trustees and Officers - continued
The fund's Statement of Additional Information (SAI) includes more information about the Trustees. To request a free copy, call Fidelity at 1-877-208-0098.
Interested Trustees*:
Correspondence intended for each Trustee who is an interested person may be sent to Fidelity Investments, 82 Devonshire Street, Boston, Massachusetts 02109.
Name, Age; Principal Occupations and Other Relevant Experience+ |
Edward C. Johnson 3d (80) |
| Year of Election or Appointment: 1984 Mr. Johnson is Trustee and Chairman of the Board of Trustees of certain Trusts. Mr. Johnson serves as Chief Executive Officer, Chairman, and a Director of FMR LLC; Chairman and a Director of FMR; Chairman and a Director of Fidelity Research & Analysis Company (FRAC); Chairman and a Director of Fidelity Investments Money Management, Inc.; and Chairman and a Director of FMR Co., Inc. In addition, Mr. Johnson serves as Chairman and Director of FIL Limited. Previously, Mr. Johnson served as President of FMR LLC (2006-2007). |
James C. Curvey (75) |
| Year of Election or Appointment: 2007 Mr. Curvey also serves as Trustee (2007-present) of other investment companies advised by FMR. Mr. Curvey is a Director of Fidelity Investments Money Management, Inc. (2009-present), Director of Fidelity Research & Analysis Co. (2009-present) and Director of FMR and FMR Co., Inc. (2007-present). Mr. Curvey is also Vice Chairman (2007-present) and Director of FMR LLC. In addition, Mr. Curvey serves as an Overseer for the Boston Symphony Orchestra and a member of the Trustees of Villanova University. Previously, Mr. Curvey was the Vice Chairman (2006-2007) and Director (2000-2007) of FMR Corp. |
* Trustees have been determined to be "Interested Trustees" by virtue of, among other things, their affiliation with the trust or various entities under common control with FMR.
+ The information above includes each Trustee's principal occupation during the last five years and other information relating to the experience, attributes, and skills relevant to each Trustee's qualifications to serve as a Trustee, which led to the conclusion that each Trustee should serve as a Trustee for the fund.
Independent Trustees:
Correspondence intended for each Independent Trustee (that is, the Trustees other than the Interested Trustees) may be sent to Fidelity Investments, P.O. Box 55235, Boston, Massachusetts 02205-5235.
Name, Age; Principal Occupations and Other Relevant Experience+ |
Dennis J. Dirks (62) |
| Year of Election or Appointment: 2005 Prior to his retirement in May 2003, Mr. Dirks was Chief Operating Officer and a member of the Board of The Depository Trust & Clearing Corporation (DTCC). He also served as President, Chief Operating Officer, and Board member of The Depository Trust Company (DTC) and President and Board member of the National Securities Clearing Corporation (NSCC). In addition, Mr. Dirks served as Chief Executive Officer and Board member of the Government Securities Clearing Corporation, Chief Executive Officer and Board member of the Mortgage-Backed Securities Clearing Corporation, as a Trustee and a member of the Finance Committee of Manhattan College (2005-2008), and as a Trustee and a member of the Finance Committee of AHRC of Nassau County (2006-2008). Mr. Dirks is a member of the Independent Directors Council (IDC) Governing Council (2010-Present) and Board of Directors for The Brookville Center for Children's Services, Inc. (2009-present). |
Alan J. Lacy (57) |
| Year of Election or Appointment: 2008 Mr. Lacy serves as Senior Adviser (2007-present) of Oak Hill Capital Partners, L.P. (private equity). Mr. Lacy also served as Chief Executive Officer (2000-2005) and Vice Chairman (2005-2006) of Sears Holdings Corporation and Sears, Roebuck and Co. (retail). In addition, Mr. Lacy serves as a member of the Board of Directors of The Western Union Company (global money transfer, 2006-present) and Bristol-Myers Squibb Company (global pharmaceuticals, 2007-present). Mr. Lacy is Chairman (2008-present) and a member (2006-present) of the Board of Trustees of The National Parks Conservation Association. |
Ned C. Lautenbach (66) |
| Year of Election or Appointment: 2000 Mr. Lautenbach is Chairman of the Independent Trustees of the Equity and High Income Funds (2006-present). Mr. Lautenbach currently serves as the Lead Director of the Eaton Corporation Board of Directors (diversified industrial, 1997-present). Mr. Lautenbach is also a member of the Board of Directors of the Philharmonic Center for the Arts in Naples, Florida (1999-present); a member of the Board of Trustees of Fairfield University (2005-present); and a member of the Council on Foreign Relations (1994-present). Previously, Mr. Lautenbach was a Partner/Advisory Partner at Clayton, Dubilier & Rice, Inc. (private equity investment, 1998-2010), as well as a Director of Sony Corporation (2006-2007). |
Joseph Mauriello (66) |
| Year of Election or Appointment: 2008 Prior to his retirement in January 2006, Mr. Mauriello served in numerous senior management positions including Deputy Chairman and Chief Operating Officer (2004-2005), and Vice Chairman of Financial Services (2002-2004) of KPMG LLP US (professional services, 1965-2005). Mr. Mauriello currently serves as a member of the Board of Directors of XL Group plc. (global insurance and re-insurance, 2006-present) and of Arcadia Resources Inc. (health care services and products, 2007-present). Previously, Mr. Mauriello served as a Director of the Hamilton Funds of the Bank of New York (2006-2007). |
Cornelia M. Small (66) |
| Year of Election or Appointment: 2005 Ms. Small is a member of the Board of Directors of the Teagle Foundation (2009-present). Ms. Small is also a member of the Investment Committee, and Chair (2008-present) and a member of the Board of Trustees of Smith College. In addition, Ms. Small serves on the Investment Committee of the Berkshire Taconic Community Foundation (2008-present). Previously, Ms. Small served as Chairperson of the Investment Committee (2002-2008) of Smith College. In addition, Ms. Small served as Chief Investment Officer, Director of Global Equity Investments, and a member of the Board of Directors of Scudder, Stevens & Clark and Scudder Kemper Investments. |
William S. Stavropoulos (71) |
| Year of Election or Appointment: 2001 Mr. Stavropoulos is Vice Chairman of the Independent Trustees of the Equity and High Income Funds (2006-present). Mr. Stavropoulos serves as President and Founder of the Michigan Baseball Foundation, the Great Lakes Loons (2007-present). Mr. Stavropoulos is Chairman Emeritus of the Board of Directors of The Dow Chemical Company, where he previously served in numerous senior management positions, including President, CEO (1995-2000; 2002-2004), Chairman of the Executive Committee (2000-2006), and as a member of the Board of Directors (1990-2006). Currently, Mr. Stavropoulos is Chairman of Univar (global distributor of commodity and specialty chemicals, 2010-present), a Director of Teradata Corporation (data warehousing and technology solutions, 2008-present), Chemical Financial Corporation, Maersk Inc. (industrial conglomerate), Tyco International, Inc. (multinational manufacturing and services, 2007-present), and a member of the Advisory Board for Metalmark Capital (private equity investment, 2005-present). Mr. Stavropoulos is a special advisor to Clayton, Dubilier & Rice, Inc. (private equity investment). In addition, Mr. Stavropoulos is a member of the University of Notre Dame Advisory Council for the College of Science. |
David M. Thomas (61) |
| Year of Election or Appointment: 2008 Previously, Mr. Thomas served as Executive Chairman (2005-2006) and Chairman and Chief Executive Officer (2000-2005) of IMS Health, Inc. (pharmaceutical and healthcare information solutions). In addition, Mr. Thomas serves as a member of the Board of Directors of Fortune Brands, Inc. (consumer products), and Interpublic Group of Companies, Inc. (marketing communication, 2004-present). |
Michael E. Wiley (60) |
| Year of Election or Appointment: 2008 Mr. Wiley also serves as a Director of Asia Pacific Exploration Consolidated (international oil and gas exploration and production, 2008-present). Mr. Wiley serves as a Director of Tesoro Corporation (independent oil refiner and marketer, 2005-present), and a Director of Bill Barrett Corporation (exploration and production, 2005-present). In addition, Mr. Wiley also serves as a Director of Post Oak Bank (privately-held bank, 2004-present). Previously, Mr. Wiley served as a member of the Board of Trustees of the University of Tulsa (2000-2006; 2007-2010), as a Senior Energy Advisor of Katzenbach Partners, LLC (consulting, 2006-2007), as an Advisory Director of Riverstone Holdings (private investment), Chairman, President, and CEO of Baker Hughes, Inc. (oilfield services, 2000-2004), and as Director of Spinnaker Exploration Company (exploration and production, 2001-2005). |
+ The information above includes each Trustee's principal occupation during the last five years and other information relating to the experience, attributes, and skills relevant to each Trustee's qualifications to serve as a Trustee, which led to the conclusion that each Trustee should serve as a Trustee for the fund.
Advisory Board Member and Executive Officers:
Correspondence intended for each executive officer and Peter S. Lynch may be sent to Fidelity Investments, 82 Devonshire Street, Boston, Massachusetts 02109.
Name, Age; Principal Occupation |
Peter S. Lynch (66) |
| Year of Election or Appointment: 2003 Member of the Advisory Board of Fidelity's Equity and High Income Funds. Mr. Lynch is Vice Chairman and a Director of FMR and FMR Co., Inc. In addition, Mr. Lynch serves as a Trustee of Boston College and as the Chairman of the Inner-City Scholarship Fund. Previously, Mr. Lynch served on the Special Olympics International Board of Directors (1997-2006). |
Kenneth B. Robins (41) |
| Year of Election or Appointment: 2008 President and Treasurer of Fidelity's Equity and High Income Funds. Mr. Robins also serves as President and Treasurer (2010-present) and Assistant Treasurer (2009-present) of other Fidelity funds and is an employee of Fidelity Investments (2004-present). Previously, Mr. Robins served as Deputy Treasurer of the Fidelity funds (2005-2008) and Treasurer and Chief Financial Officer of The North Carolina Capital Management Trust: Cash and Term Portfolios (2006-2008). |
Bruce T. Herring (45) |
| Year of Election or Appointment: 2006 Vice President of certain Equity Funds. Mr. Herring also serves as Chief Investment Officer and Director of Fidelity Management & Research (U.K.) Inc. (2010-present) and Group Chief Investments Officer of FMR. Previously, Mr. Herring served as Vice President (2005-2006) and Senior Vice President (2006-2007) of Fidelity Management & Research Company, Vice President of FMR Co., Inc. (2001-2007) and as a portfolio manager for Fidelity U.S. Equity Funds. |
Brian B. Hogan (46) |
| Year of Election or Appointment: 2009 Vice President of certain Equity Funds and Vice President of Sector Funds. Mr. Hogan also serves as President of FMR's Equity Division (2009-present). Previously, Mr. Hogan served as Senior Vice President, Equity Research of FMR (2006-2009) and as a portfolio manager. |
Scott C. Goebel (42) |
| Year of Election or Appointment: 2008 Secretary and Chief Legal Officer (CLO) of the Fidelity funds. Mr. Goebel also serves as Secretary and CLO of The North Carolina Capital Management Trust: Cash and Term Portfolio (2008-present); General Counsel, Secretary, and Senior Vice President of FMR (2008-present) and FMR Co., Inc. (2008-present); Deputy General Counsel of FMR LLC; Chief Legal Officer of Fidelity Management & Research (Hong Kong) Limited (2008-present) and Assistant Secretary of Fidelity Management & Research (Japan) Inc. (2008-present), Fidelity Investments Money Management, Inc. (2008-present), Fidelity Management & Research (U.K.) Inc. (2008-present), and Fidelity Research and Analysis Company (2008-present). Previously, Mr. Goebel served as Assistant Secretary of the Funds (2007-2008) and as Vice President and Secretary of Fidelity Distributors Corporation (FDC) (2005-2007). |
William C. Coffey (41) |
| Year of Election or Appointment: 2009 Assistant Secretary of Fidelity's Equity and High Income Funds. Mr. Coffey also serves as Senior Vice President and Deputy General Counsel of FMR LLC (2010-present), and is an employee of Fidelity Investments. Previously, Mr. Coffey served as Vice President and Associate General Counsel of FMR LLC (2005-2009). |
Holly C. Laurent (56) |
| Year of Election or Appointment: 2008 Anti-Money Laundering (AML) Officer of the Fidelity funds. Ms. Laurent also serves as AML Officer of The North Carolina Capital Management Trust: Cash and Term Portfolio (2008-present) and is an employee of Fidelity Investments. Previously, Ms. Laurent was Senior Vice President and Head of Legal for Fidelity Business Services India Pvt. Ltd. (2006-2008), and Senior Vice President, Deputy General Counsel and Group Head for FMR LLC (2005-2006). |
Christine Reynolds (52) |
| Year of Election or Appointment: 2008 Chief Financial Officer of the Fidelity funds. Ms. Reynolds became President of Fidelity Pricing and Cash Management Services (FPCMS) in August 2008. Ms. Reynolds served as Chief Operating Officer of FPCMS (2007-2008). Previously, Ms. Reynolds served as President, Treasurer, and Anti-Money Laundering officer of the Fidelity funds (2004-2007). |
Kenneth A. Rathgeber (63) |
| Year of Election or Appointment: 2004 Chief Compliance Officer of Fidelity's Equity and High Income Funds. Mr. Rathgeber is Chief Compliance Officer of Fidelity Management & Research (Hong Kong) Limited (2008-present), Fidelity Management & Research (Japan) Inc. (2008-present), FMR (2005-present), FMR Co., Inc. (2005-present), Fidelity Management & Research (U.K.) Inc. (2005-present), Fidelity Research & Analysis Company (2005-present), Fidelity Investments Money Management, Inc. (2005-present), Pyramis Global Advisors, LLC (2005-present), and Strategic Advisers, Inc. (2005-present). |
Jeffrey S. Christian (49) |
| Year of Election or Appointment: 2009 Deputy Treasurer of the Fidelity funds. Mr. Christian is an employee of Fidelity Investments. Previously, Mr. Christian served as Chief Financial Officer (2008-2009) of certain Fidelity funds and Senior Vice President of Fidelity Pricing and Cash Management Services (FPCMS) (2004-2009). |
Bryan A. Mehrmann (49) |
| Year of Election or Appointment: 2005 Deputy Treasurer of the Fidelity funds. Mr. Mehrmann is an employee of Fidelity Investments. |
Adrien E. Deberghes (43) |
| Year of Election or Appointment: 2008 Deputy Treasurer of Fidelity's Equity and High Income Funds. Mr. Deberghes also serves as Assistant Treasurer of other Fidelity funds (2010-present) and is an employee of Fidelity Investments (2008-present). Previously, Mr. Deberghes served as Senior Vice President of Mutual Fund Administration at State Street Corporation (2007-2008), Senior Director of Mutual Fund Administration at Investors Bank & Trust (2005-2007), and Director of Finance for Dunkin' Brands (2000-2005). |
Stephanie J. Dorsey (41) |
| Year of Election or Appointment: 2010 Assistant Treasurer of Fidelity's Equity and High Income Funds. Ms. Dorsey also serves as Deputy Treasurer of other Fidelity funds (2008-present) and is an employee of Fidelity Investments (2008-present). Previously, Ms. Dorsey served as Treasurer (2004-2008) of the JPMorgan Mutual Funds and Vice President (2004-2008) of JPMorgan Chase Bank. |
John R. Hebble (52) |
| Year of Election or Appointment: 2009 Assistant Treasurer of Fidelity's Equity and High Income Funds. Mr. Hebble also serves as Treasurer and Chief Financial Officer of The North Carolina Capital Management Trust: Cash and Term Portfolio (2008-present), President and Treasurer of other Fidelity funds (2008-present) and is an employee of Fidelity Investments. |
Gary W. Ryan (52) |
| Year of Election or Appointment: 2005 Assistant Treasurer of the Fidelity funds. Mr. Ryan is an employee of Fidelity Investments. Previously, Mr. Ryan served as Vice President of Fund Reporting in Fidelity Pricing and Cash Management Services (FPCMS) (1999-2005). |
Jonathan Davis (42) |
| Year of Election or Appointment: 2010 Assistant Treasurer of the Fidelity funds. Mr. Davis is an employee of Fidelity Investments. Previously, Mr. Davis served as Vice President and Associate General Counsel of FMR LLC (2003-2010). |
Annual Report
The Board of Trustees of Advisor Japan Fund voted to pay to shareholders of record at the opening of business on record date, the following distributions per share derived from capital gains realized from sales of portfolio securities and dividends derived from net investment income:
| Pay Date | Record Date | Dividends | Capital Gains |
Institutional Class | 12/13/10 | 12/10/10 | $0.059 | $0.139 |
Institutional class designates 100% of the dividends distributed during the fiscal year as amounts which may be taken into account as a dividend for purposes of the maximum rate under section 1(h)(11) of the Internal Revenue Code.
The amounts per share which represent income derived from sources within, and taxes paid to foreign countries or possessions of the United States are as follows:
| Pay Date | Income | Taxes |
Institutional Class | 12/07/09 | $0.104 | $0.0145 |
The fund will notify shareholders in January 2011 of amounts for use in preparing 2010 income tax returns.
Annual Report
A special meeting of the fund's shareholders was held on November 16, 2010. The results of votes taken among shareholders on the proposal before them are reported below. Each vote reported represents one dollar of net asset value held on the record date for the meeting.
PROPOSAL 1 |
To approve an Agreement and Plan of Reorganization providing for the transfer of all of the assets of Fidelity Advisor Japan Fund to Fidelity Japan Fund in exchange solely for shares of beneficial interest of Fidelity Japan Fund and the assumption by Fidelity Japan Fund of Fidelity Advisor Japan Fund's liabilities,
in complete liquidation of Fidelity
Advisor Japan Fund. |
| # of
Votes | % of
Votes |
Affirmative | 14,992,935.07 | 76.146 |
Against | 1,290,989.63 | 6.557 |
Abstain | 554,934.61 | 2.819 |
Uninstructed | 2,850,752.40 | 14.478 |
TOTAL | 19,689,611.71 | 100.000 |
Annual Report
Board Approval of Investment Advisory Contracts and Management Fees
Fidelity Advisor Japan Fund
Each year, the Board of Trustees, including the Independent Trustees (together, the Board), votes on the renewal of the management contract and sub-advisory agreements (together, the Advisory Contracts) for the fund. The Board, assisted by the advice of fund counsel and Independent Trustees' counsel, requests and considers a broad range of information relevant to the renewal of the Advisory Contracts throughout the year.
The Board meets regularly and considers at each of its meetings factors that are relevant to its annual consideration of the renewal of the fund's Advisory Contracts, including the services and support provided to the fund and its shareholders. The Board has established various standing committees, each composed of Independent Trustees with varying backgrounds, to which the Board has assigned specific subject matter responsibilities in order to enhance effective decision-making by the Board. The Board, acting directly and through its Committees, requests and receives information concerning the annual consideration of the renewal of the fund's Advisory Contracts. The Board also meets as needed to consider matters specifically related to the Board's annual consideration of the renewal of Advisory Contracts. Members of the Board may also meet with trustees of other Fidelity funds through ad hoc joint committees to discuss certain matters relevant to the Fidelity funds.
At its July 2010 meeting, the Board of Trustees, including the Independent Trustees, unanimously determined to renew the fund's Advisory Contracts. In reaching its determination, the Board considered all factors it believed relevant, including (i) the nature, extent, and quality of the services to be provided to the fund and its shareholders (including the investment performance of the fund); (ii) the competitiveness of the fund's management fee and total expenses; (iii) the total costs of the services to be provided by and the profits to be realized by Fidelity from its relationship with the fund; (iv) the extent to which economies of scale would be realized as the fund grows; and (v) whether fee levels reflect these economies of scale, if any, for the benefit of fund shareholders.
In considering whether to renew the Advisory Contracts for the fund, the Board reached a determination, with the assistance of fund counsel and Independent Trustees' counsel and through the exercise of its business judgment, that the renewal of the Advisory Contracts is in the best interests of fund shareholders and that the compensation to be received by Fidelity under the management contract is fair and reasonable. The Board's decision to renew the Advisory Contracts was not based on any single factor noted above, but rather was based on a comprehensive consideration of all the information provided to the Board at its meetings throughout the year. The Board, in reaching its determination to renew the Advisory Contracts, is aware that shareholders in the fund have a broad range of investment choices available to them, including a wide choice among mutual funds offered by Fidelity's competitors, and that the fund's shareholders, with the opportunity to review and weigh the disclosure provided by the fund in its prospectus and other public disclosures, have chosen to invest in this fund, managed by Fidelity.
Annual Report
Board Approval of Investment Advisory Contracts and
Management Fees - continued
Nature, Extent, and Quality of Services Provided. The Board considered the staffing within the investment adviser, FMR, and the sub-advisers (together, the Investment Advisers), including the backgrounds of the fund's investment personnel and the fund's investment objective and discipline. The Independent Trustees also had discussions with senior management of Fidelity's investment operations and investment groups. The Board considered the structure of the portfolio manager compensation program and whether this structure provides appropriate incentives to act in the best interest of the fund.
Resources Dedicated to Investment Management and Support Services. The Board and the equity research subcommittee of the Board's Fund Oversight Committee reviewed the size, education, and experience of the Investment Advisers' investment staff, their use of technology, and the Investment Advisers' approach to recruiting, training, and retaining portfolio managers and other research, advisory, and management personnel. The Board noted that Fidelity's analysts have access to a variety of technological tools and market and securities data that enable them to perform both fundamental and quantitative analysis and to specialize in various disciplines. The Board considered Fidelity's extensive global research capabilities that enable the Investment Advisers to aggregate data from various sources in an effort to produce positive investment results. The Board also considered that Fidelity's portfolio managers and analysts have access to daily portfolio attribution that allows for monitoring of a fund's portfolio, as well as an electronic communication system that provides immediate real-time access to research concerning issuers and credit enhancers. The Board noted FMR's continued focus on strengthening the organization and discipline of equity portfolio management and research.
Shareholder and Administrative Services. The Board considered (i) the nature, extent, quality, and cost of advisory, administrative, and shareholder services performed by the Investment Advisers and their affiliates under the Advisory Contracts and under separate agreements covering transfer agency, pricing and bookkeeping, and securities lending services for the fund; (ii) the nature and extent of the investment adviser's supervision of third party service providers, principally custodians and subcustodians; and (iii) the resources devoted to, and the record of compliance with, the fund's compliance policies and procedures. The Board also reviewed the allocation of fund brokerage, including allocations to brokers affiliated with the Investment Advisers, the use of brokerage commissions to pay fund expenses, and the use of "soft" commission dollars to pay for research services.
The Board noted that the growth of fund assets over time across the complex allows Fidelity to reinvest in the development of services designed to enhance the value or convenience of the Fidelity funds as investment vehicles. These services include 24-hour access to account information and market information through phone representatives and over the Internet, and investor education materials and asset allocation tools.
Annual Report
Investment in a Large Fund Family. The Board considered the benefits to shareholders of investing in a Fidelity fund, including the benefits of investing in a fund that is part of a large family of funds offering a variety of investment disciplines and providing a large variety of mutual fund investor services. The Board noted that Fidelity had taken, or had made recommendations that resulted in the Fidelity funds taking, a number of actions over the previous year that benefited particular funds, including (i) dedicating additional resources to investment research and restructuring and broadening the focus of the investment research teams; (ii) bolstering the senior management team that oversees asset management; (iii) launching Class F of certain funds as a lower-fee class available to Freedom K and Freedom Index Funds; (iv) lowering the initial investment minimums and ongoing balance requirements for Real Estate High Income Fund; (v) eliminating subsequent purchase minimums for all funds and adding a waiver of the investment minimum requirement for new accounts opened with the proceeds of a systematic withdrawal plan; (vi) eliminating the withdrawal minimum and maximum limits for systematic withdrawals from Advisor funds; (vii) expanding sales load waivers on Class A shares for Destiny Planholders and expanding Institutional Class eligibility for Class O Destiny Planholders; and (viii) changing certain Class A and Class T sales charge structures to further align them with industry practices.
Investment Performance. The Board considered whether the fund has operated in accordance with its investment objective, as well as its record of compliance with its investment restrictions. It also reviewed the fund's absolute investment performance for each class, as well as the fund's relative investment performance for each class measured over multiple periods against (i) a broad-based securities market index, and (ii) a peer group of mutual funds deemed appropriate by Fidelity and reviewed by the Board. The following charts considered by the Board show, over the one-, three-, and five-year periods ended December 31, 2009, the cumulative total returns of Institutional Class (Class I) and Class B of the fund, the cumulative total returns of a broad-based securities market index ("benchmark"), and a range of cumulative total returns of a peer group of mutual funds identified by Lipper Inc. as having an investment objective similar to that of the fund. The returns of Institutional Class (Class I) and Class B show the performance of the highest and lowest performing classes, respectively (based on five-year performance). The box within each chart shows the 25th percentile return (bottom of box) and the 75th percentile return (top of box) of the peer group. Returns shown above the box are in the first quartile and returns shown below the box are in the fourth quartile. The percentage beaten numbers noted below each chart correspond to the percentile box and represent the percentage of funds in the peer group whose performance was equal to or lower than that of the class indicated.
Annual Report
Board Approval of Investment Advisory Contracts and
Management Fees - continued
Fidelity Advisor Japan Fund
The Board reviewed the fund's relative investment performance against its peer group and noted that the performance of Institutional Class (Class I) of the fund was in the first quartile for the one-year period, the third quartile for the three-year period, and the second quartile for the five-year period. The Board also noted that the investment performance of the fund was lower than its benchmark for the three- and five-year periods, although the one-year cumulative total return of Institutional Class (Class I) compared favorably to its benchmark. The Board considered that the variations in performance among the fund's classes reflect the variations in class expenses, which result in lower performance for higher expense classes. The Board also reviewed the fund's performance since inception as well as performance in the current year.
The Board also considered that the fund's management fee is subject to upward or downward adjustment depending upon whether, and to what extent, the fund's investment performance for the performance period exceeds, or is exceeded by, the record (over the same period) of a Board-approved performance adjustment index. The Board realizes that the performance adjustment provides FMR with a strong economic incentive to seek to achieve superior performance for the fund's shareholders and helps to more closely align the interests of FMR and the fund's shareholders.
Furthermore, the Board considered that, on July 13, 2010, it had approved a proposal, subject to shareholder approval, to merge the fund into Fidelity Japan Fund. If shareholders approve the merger at a special meeting scheduled to be held in November 2010, it is expected to take place in December 2010.
Annual Report
Based on its review, and giving particular weight to the nature and quality of the resources dedicated by the Investment Advisers to maintain and improve relative performance and factoring in the unprecedented market events in recent years, the Board concluded that the nature, extent, and quality of investment management and support services and of shareholder and administrative services provided to the fund will benefit the fund's shareholders, particularly in light of the Board's view that the fund's shareholders benefit from investing in a fund that is part of a large family of funds offering a variety of investment disciplines and services.
Competitiveness of Management Fee and Total Fund Expenses. The Board considered the fund's management fee and total expenses compared to "mapped groups" of competitive funds and classes. Fidelity creates "mapped groups" by combining similar Lipper investment objective categories that have comparable management fee characteristics. Combining Lipper investment objective categories aids the Board's management fee and total expense comparisons by broadening the competitive group used for comparison and by reducing the number of universes to which various Fidelity funds are compared.
Management Fee. The Board considered two proprietary management fee comparisons for the 12-month periods shown in the chart below. The group of Lipper funds used by the Board for management fee comparisons is referred to below as the "Total Mapped Group." The Total Mapped Group is broader than the Lipper peer group used by the Board for performance comparisons because the Total Mapped Group combines several Lipper investment objective categories while the Lipper peer group does not. The Total Mapped Group comparison focuses on a fund's standing relative to the total universe of comparable funds available to investors, in terms of gross management fees before expense reimbursements or caps, and without giving effect to the fund's performance adjustment. "TMG %" represents the percentage of funds in the Total Mapped Group that had management fees that were lower than the fund's. For example, a TMG % of 15% means that 85% of the funds in the Total Mapped Group had higher management fees than the fund. The "Asset-Size Peer Group" (ASPG) comparison focuses on a fund's standing relative to non-Fidelity funds similar in size to the fund within the Total Mapped Group. The ASPG represents at least 15% of the funds in the Total Mapped Group with comparable asset size and management fee characteristics, subject to a minimum of 50 funds (or all funds in the Total Mapped Group if fewer than 50). Additional information, such as the ASPG quartile in which the fund's management fee ranked and the impact of the fund's performance adjustment, is also included in the chart and considered by the Board.
Annual Report
Board Approval of Investment Advisory Contracts and
Management Fees - continued
Fidelity Advisor Japan Fund
The Board noted that the fund's management fee ranked below the median of its Total Mapped Group and below the median of its ASPG for 2009. The Board also noted the effect of the fund's negative performance adjustment on the fund's management fee ranking. The Board noted that the performance adjustment for each year represents calculations for performance periods that differ from the periods shown in the performance charts above.
Based on its review, the Board concluded that the fund's management fee is fair and reasonable in light of the services that the fund receives and the other factors considered.
Total Expenses. In its review of each class's total expenses, the Board considered the fund's management fee as well as other fund or class expenses, as applicable, such as transfer agent fees, pricing and bookkeeping fees, fund-paid 12b-1 fees, and custodial, legal, and audit fees. The Board also noted the effects of any waivers and reimbursements on fees and expenses, as well as the impact of the fund's performance adjustment. As part of its review, the Board also considered current and historical total expenses of each class of the fund compared to competitive fund median expenses. Each class of the fund is compared to those funds and classes in the Total Mapped Group (used by the Board for management fee comparisons) that have a similar sales load structure.
The Board noted that the total expenses of Class A ranked below its competitive median for 2009, the total expenses of Class B ranked equal to its competitive median for 2009, and the total expenses of each of Class T, Class C, and Institutional Class ranked above its competitive median for 2009. The Board considered that the total expenses for Class T were above the median primarily because its 12b-1 fee is higher than the typical front-end load class. The Board noted that the fund offers multiple classes, each of which has a different sales load and 12b-1 fee structure, and that the multiple structures are intended to offer a range of pricing options for the intermediary market. The Board also noted that the total expenses of the classes vary primarily by the level of their 12b-1 fees, although differences in transfer agent fees may also cause expenses to vary from class to class.
Annual Report
Fees Charged to Other Fidelity Clients. The Board also considered Fidelity fee structures and other information with respect to clients of FMR and its affiliates, such as other mutual funds advised or subadvised by FMR or its affiliates, pension plan clients, and other institutional clients. In March 2010, the Board created an ad hoc joint committee with the board of other Fidelity funds (the Committee) to review and compare Fidelity's institutional investment advisory business with its business of providing services to the Fidelity funds, including the differences in services provided, fees charged, and costs incurred, as well as competition in their respective marketplaces.
Based on its review of total expenses and fees charged to other Fidelity clients, the Board concluded that the total expenses of each class of the fund were reasonable, although in some cases above the median of the universe presented for comparison, in light of the services that the fund and its shareholders receive and the other factors considered, including the findings of the Committee.
Costs of the Services and Profitability. The Board considered the revenues earned and the expenses incurred by Fidelity in conducting the business of developing, marketing, distributing, managing, administering and servicing the fund and its shareholders. The Board also considered the level of Fidelity's profits in respect of all the Fidelity funds.
On an annual basis, FMR presents to the Board Fidelity's profitability for the fund. Fidelity calculates the profitability for each fund, as well as aggregate profitability for groups of Fidelity funds and all Fidelity funds, using a series of detailed revenue and cost allocation methodologies which originate with the audited books and records of Fidelity. The Audit Committee of the Board reviews any significant changes from the prior year's methodologies.
PricewaterhouseCoopers LLP (PwC), independent registered public accounting firm and auditor to Fidelity and certain Fidelity funds, has been engaged annually by the Board as part of the Board's assessment of Fidelity's profitability analysis. PwC's engagement includes the review and assessment of Fidelity's methodologies used in determining the revenues and expenses attributable to Fidelity's mutual fund business, and completion of agreed-upon procedures surrounding the mathematical accuracy of fund profitability and its conformity to allocation methodologies. After considering PwC's reports issued under the engagement and information provided by Fidelity, the Board believes that while other allocation methods may also be reasonable, Fidelity's profitability methodologies are reasonable in all material respects.
Annual Report
Board Approval of Investment Advisory Contracts and
Management Fees - continued
The Board has also reviewed Fidelity's non-fund businesses and fall-out benefits related to the mutual fund business as well as cases where Fidelity's affiliates may benefit from or be related to the fund's business.
The Board considered the costs of the services provided by and the profits realized by Fidelity in connection with the operation of the fund and were satisfied that the profitability was not excessive in the circumstances.
Economies of Scale. The Board considered whether there have been economies of scale in respect of the management of the Fidelity funds, whether the Fidelity funds (including the fund) have appropriately benefited from any such economies of scale, and whether there is potential for realization of any further economies of scale. The Board considered the extent to which the fund will benefit from economies of scale through increased services to the fund, through waivers or reimbursements, or through fee or expense reductions.
In February 2009, the Board and the board of other Fidelity funds created an ad hoc committee (the Economies of Scale Committee) to analyze whether FMR attains economies of scale in respect of the management and servicing of the Fidelity funds, whether the Fidelity funds have appropriately benefited from such economies of scale, and whether there is potential for realization of any further economies of scale.
The Board recognized that the fund's management contract incorporates a "group fee" structure, which provides for lower group fee rates as total fund assets under FMR's management increase, and for higher group fee rates as total fund assets under FMR's management decrease. FMR calculates the group fee rates based on a tiered asset "breakpoint" schedule that varies based on asset class. The Board considered that the group fee is designed to deliver the benefits of economies of scale to fund shareholders when total Fidelity fund assets increase, even if assets of any particular fund are unchanged or have declined, because some portion of Fidelity's costs are attributable to services provided to all Fidelity funds, and all funds benefit if those costs can be allocated among more assets. The Board concluded that, given the group fee structure, fund shareholders will benefit from lower management fees as assets under FMR's management increase at the fund complex level, regardless of whether Fidelity achieves any such economies of scale.
The Board concluded, considering the findings of the Economies of Scale Committee, that any potential economies of scale are being appropriately shared between fund shareholders and Fidelity.
Additional Information Requested by the Board. In order to develop fully the factual basis for consideration of the Fidelity funds' Advisory Contracts, the Board requested and received additional information on certain topics, including (i) fund performance trends, actions to be taken by FMR to improve certain funds' overall performance, and Fidelity's long-term strategies for certain funds; (ii) portfolio manager changes that have occurred during the past year and length of portfolio manager tenure for different categories of funds over time; (iii) Fidelity's compensation structure for portfolio managers, research analysts, and other key personnel, the rationale for the compensation structure, and how the compensation structure provides appropriate performance incentives; (iv) the amount of the investment that each portfolio manager has made in the Fidelity fund(s) that he or she manages; (v) management and other fees paid by FMR to affiliated sub-advisers on behalf of the Fidelity funds; (vi) Fidelity's fee structures and rationale for recommending different fees among different categories of funds; (vii) Fidelity's rationale for recommending which funds should have a performance adjustment component as part of their management fees; (viii) the rationale for any differences between fund fee structures and fee structures in place for other Fidelity clients; and (ix) explanations regarding the relative total expenses borne by certain funds and classes, total expense competitive trends, and actions that might be taken by FMR to reduce total expenses for certain funds and classes.
Annual Report
Based on its evaluation of all of the conclusions noted above, and after considering all factors it believed relevant, the Board ultimately concluded that the advisory fee structures are fair and reasonable, and that the fund's Advisory Contracts should be renewed.
Annual Report
Investment Adviser
Fidelity Management & Research Company
Boston, MA
Investment Sub-Advisers
FMR Co., Inc.
Fidelity Management & Research
(U.K.) Inc.
Fidelity Management & Research
(Hong Kong) Limited
Fidelity Management & Research
(Japan) Inc.
Fidelity Research & Analysis Company
FIL Investment Advisors
FIL Investments (Japan) Limited
FIL Investment Advisors (U.K.) Limited
General Distributor
Fidelity Distributors Corporation
Boston, MA
Transfer and Service Agents
Fidelity Investments Institutional Operations Company, Inc.
Boston, MA
Fidelity Service Company, Inc.
Boston, MA
Custodian
State Street Bank and Trust Company
Quincy, MA
AJAFI-UANN-1210
1.784757.107
(Fidelity Investment logo)(registered trademark)
Fidelity AdvisorSM
Overseas
Fund - Class A, Class T, Class B and Class C
Annual Report
October 31, 2010
(2_fidelity_logos) (Registered_Trademark)
Contents
Chairman's Message | <Click Here> | The Chairman's message to shareholders. |
Performance | <Click Here> | How the fund has done over time. |
Management's Discussion of Fund Performance | <Click Here> | The Portfolio Manager's review of fund performance and strategy. |
Shareholder Expense Example | <Click Here> | An example of shareholder expenses. |
Investment Changes | <Click Here> | A summary of major shifts in the fund's investments over the past six months. |
Investments | <Click Here> | A complete list of the fund's investments with their market values. |
Financial Statements | <Click Here> | Statements of assets and liabilities, operations, and changes in net assets,
as well as financial highlights. |
Notes | <Click Here> | Notes to the financial statements. |
Report of Independent Registered Public Accounting Firm | <Click Here> | |
Trustees and Officers | <Click Here> | |
Distributions | <Click Here> | |
Board Approval of Investment Advisory Contracts and Management Fees | <Click Here> | |
To view a fund's proxy voting guidelines and proxy voting record for the 12-month period ended June 30, visit http://www.fidelity.com/proxyvotingresults or visit the Securities and Exchange Commission's (SEC) web site at http://www.sec.gov. You may also call 1-877-208-0098 to request a free copy of the proxy voting guidelines.
Standard & Poor's, S&P and S&P 500 are registered service marks of The McGraw-Hill Companies, Inc. and have been licensed for use by Fidelity Distributors Corporation.
Other third party marks appearing herein are the property of their respective owners.
All other marks appearing herein are registered or unregistered trademarks or service marks of FMR LLC or an affiliated company.
Annual Report
This report and the financial statements contained herein are submitted for the general information of the shareholders of the fund. This report is not authorized for distribution to prospective investors in the fund unless preceded or accompanied by an effective prospectus.
A fund files its complete schedule of portfolio holdings with the SEC for the first and third quarters of each fiscal year on Form N-Q. Forms N-Q are available on the SEC's web site at http://www.sec.gov. A fund's Forms N-Q may be reviewed and copied at the SEC's Public Reference Room in Washington, DC. Information regarding the operation of the SEC's Public Reference Room may be obtained by calling 1-800-SEC-0330. For a complete list of a fund's portfolio holdings, view the most recent holdings listing, semiannual report, or annual report on Fidelity's web site at http://www.fidelity.com or http://www.advisor.fidelity.com, as applicable.
NOT FDIC INSURED • MAY LOSE VALUE • NO BANK GUARANTEE
Neither the fund nor Fidelity Distributors Corporation is a bank.
Annual Report
(photo_of_Edward_C_Johnson_3d)
Dear Shareholder:
Equities have staged a rally in the second half of 2010, shaking off concerns about the European debt crisis and the possibility of a double-dip recession in the U.S. Although the short-term surge pushed major equity indexes back into positive territory for the year, several questions remain about the longer-term outlook, including lackluster economic growth and persistently high unemployment. Financial markets are always unpredictable, of course, but there also are several time-tested investment principles that can help put the odds in your favor.
One of the basic tenets is to invest for the long term. Over time, riding out the markets' inevitable ups and downs has proven much more effective than selling into panic or chasing the hottest trend. Even missing only a few of the markets' best days can significantly diminish investor returns. Patience also affords the benefits of compounding - of earning interest on additional income or reinvested dividends and capital gains. There can be tax advantages and cost benefits to consider as well. While staying the course doesn't eliminate risk, it can considerably lessen the effect of short-term declines.
You can further manage your investing risk through diversification. And today, more than ever, geographic diversification should be taken into account. Studies indicate that asset allocation is the single most important determinant of a portfolio's long-term success. The right mix of stocks, bonds and cash - aligned to your particular risk tolerance and investment objective - is very important. Age-appropriate rebalancing is also an essential aspect of asset allocation. For younger investors, an emphasis on equities - which historically have been the best-performing asset class over time - is encouraged. As investors near their specific goal, such as retirement or sending a child to college, consideration may be given to replacing volatile assets (e.g. common stocks) with more-stable fixed investments (bonds or savings plans).
A third principle - investing regularly - can help lower the average cost of your purchases. Investing a certain amount of money each month or quarter helps ensure you won't pay for all your shares at market highs. This strategy - known as dollar cost averaging - also reduces "emotion" from investing, helping shareholders avoid selling weak performers just prior to an upswing, or chasing a hot performer just before a correction.
We invite you to contact us via the Internet, through our Investor Centers or by phone. It is our privilege to provide you the information you need to make the investments that are right for you.
Sincerely,
(The chairman's signature appears here.)
Edward C. Johnson 3d
Annual Report
Average annual total return reflects the change in the value of an investment, assuming reinvestment of the class' distributions from dividend income and capital gains (the profits earned upon the sale of securities that have grown in value, if any) and assuming a constant rate of performance each year. The $10,000 table and the fund's returns do not reflect the deduction of taxes that a shareholder would pay on fund distributions or the redemption of fund shares. During periods of reimbursement by Fidelity, a fund's total return will be greater than it would be had the reimbursement not occurred. How a fund did yesterday is no guarantee of how it will do tomorrow. Returns reflect the conversion of Class B shares to Class A shares after a maximum of seven years.
Average Annual Total Returns
Periods ended October 31, 2010 | Past 1
year | Past 5
years | Past 10
years |
Class A (incl. 5.75% sales charge) | 8.38% | 2.26% | 1.64% |
Class T (incl. 3.50% sales charge) | 10.86% | 2.57% | 1.72% |
Class B (incl. contingent deferred sales charge) A | 9.15% | 2.33% | 1.64% |
Class C (incl. contingent deferred sales charge) B | 13.17% | 2.70% | 1.47% |
A Class B shares' contingent deferred sales charges included in the past one year, past five year, and past ten year total return figures are 5%, 2% and 0%, respectively.
B Class C shares' contingent deferred sales charge included in the past one year, past five year, and past ten year total return figures are 1%, 0%, and 0%, respectively.
Annual Report
$10,000 Over 10 Years
Let's say hypothetically that $10,000 was invested in Fidelity AdvisorSM Overseas Fund - Class A on October 31, 2000, and the current 5.75% sales charge was paid. The chart shows how the value of your investment would have changed, and also shows how the MSCI® EAFE® (Europe, Australasia, Far East) Index performed over the same period.
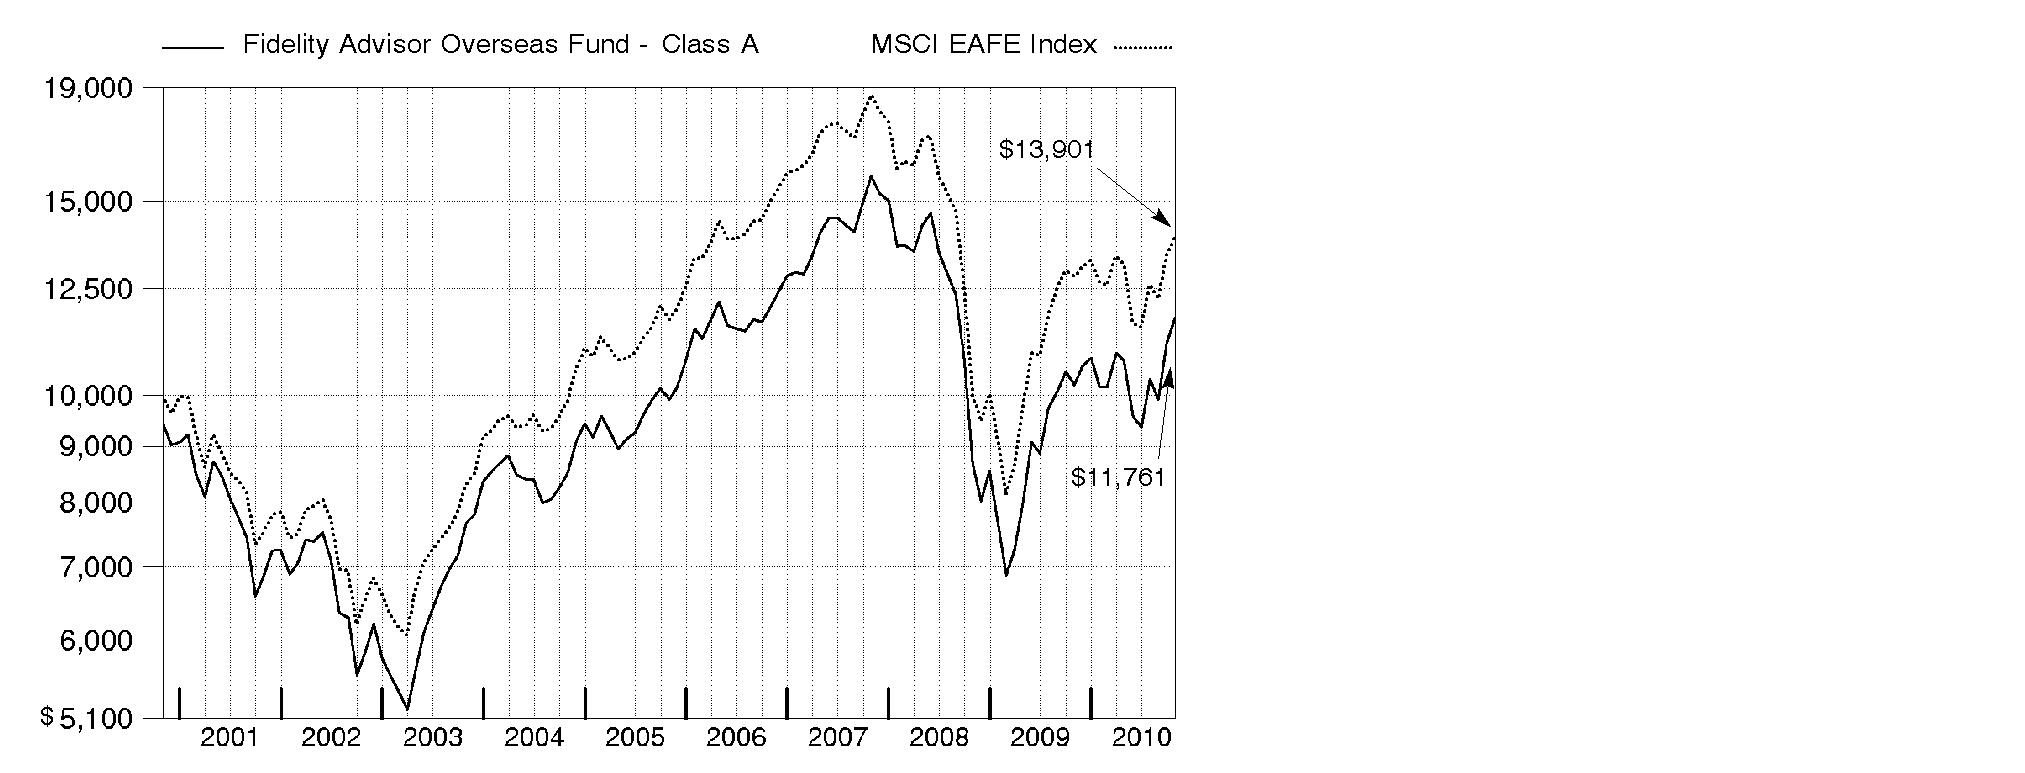
Annual Report
Market Recap: International stocks rode a wave of volatility similar to that of their U.S. counterparts during the 12 months ending October 31, 2010. Stocks gained modestly in the first half of the period, despite growing concerns about the European debt crisis. Sentiment turned decidedly negative in May and June, however, and the market suffered a precipitous decline. These losses were more than offset during the last four months of the period, when signs of economic growth and subsiding debt fears helped propel international stocks about 21%. For the full year, the MSCI® ACWI® (All Country World Index) ex USA Index gained 12.76%, boosted in part by a generally depreciating U.S. dollar. Within the index, Canada and emerging markets were standouts, each returning 24%. Results in the latter group were led by strong-performing India, Mexico and South Africa, while China fell short of the MSCI benchmark due to cooling economic growth. The developed Asia ex Japan segment rose 16% for the period, lifted by solid results from Singapore and Hong Kong. Meanwhile, Europe rose just 9%, held back mainly by debt-riddled Spain and Italy, as well as lagging major constituent France. Japan returned only 5%, a result of that nation's continued weak economy.
Comments from Graeme Rockett, Portfolio Manager of Fidelity AdvisorSM Overseas Fund: For the 12 months ending October 31, 2010, the fund's Class A, Class T, Class B and Class C shares returned 14.99%, 14.88%, 14.15% and 14.17%, respectively (excluding sales charges), outperforming the MSCI EAFE® Index, which rose 8.49%. Stock picking was especially effective in consumer discretionary, where an overweighting also helped, and in information technology, health care and consumer staples. However, underweightings in consumer staples and telecommunication services detracted. Contributing stocks included luxury goods companies, such as France's LVMH (leather goods, champagne) and Switzerland's Swatch Group (watches). Four out-of-benchmark investments also helped: Baidu, the dominant Internet search provider in China; Clicks Group, a South African health and beauty retailer; Bosideng International Holding, a Chinese clothing company; and Elekta, a Swedish medical equipment firm. Detractors included Scientific Games, a U.S. gaming company; Ireland-based CRH, a supplier of building materials; and Nestle, a Swiss food giant that we underweighted. Central European Media Enterprises, a Bermuda-listed broadcaster, also hurt performance. Some of the above stocks were sold during the period.
The views expressed above reflect those of the portfolio manager(s) only through the end of the period as stated on the cover of this report and do not necessarily represent the views of Fidelity or any other person in the Fidelity organization. Any such views are subject to change at any time based upon market or other conditions and Fidelity disclaims any responsibility to update such views. These views may not be relied on as investment advice and, because investment decisions for a Fidelity fund are based on numerous factors, may not be relied on as an indication of trading intent on behalf of any Fidelity fund.
Annual Report
Shareholder Expense Example
As a shareholder of the Fund, you incur two types of costs: (1) transaction costs, including sales charges (loads) on purchase payments or redemption proceeds, redemption fees, and (2) ongoing costs, including management fees, distribution and/or service (12b-1) fees and other Fund expenses. This Example is intended to help you understand your ongoing costs (in dollars) of investing in the Fund and to compare these costs with the ongoing costs of investing in other mutual funds.
The Example is based on an investment of $1,000 invested at the beginning of the period and held for the entire period (May 1, 2010 to October 31, 2010).
Actual Expenses
The first line of the accompanying table for each class of the Fund provides information about actual account values and actual expenses. You may use the information in this line, together with the amount you invested, to estimate the expenses that you paid over the period. Simply divide your account value by $1,000.00 (for example, an $8,600 account value divided by $1,000.00 = 8.6), then multiply the result by the number in the first line for a class of the Fund under the heading entitled "Expenses Paid During Period" to estimate the expenses you paid on your account during this period. In addition, the Fund, as a shareholder in the underlying Fidelity Central Funds, will indirectly bear its pro-rata share of the fees and expenses incurred by the underlying Fidelity Central Funds. These fees and expenses are not included in the Fund's annualized expense ratio used to calculate the expense estimate in the table below.
Hypothetical Example for Comparison Purposes
The second line of the accompanying table for each class of the Fund provides information about hypothetical account values and hypothetical expenses based on a Class' actual expense ratio and an assumed rate of return of 5% per year before expenses, which is not the Class' actual return. The hypothetical account values and expenses may not be used to estimate the actual ending account balance or expenses you paid for the period. You may use this information to compare the ongoing costs of investing in the Fund and other funds. To do so, compare this 5% hypothetical example with the 5% hypothetical examples that appear in the shareholder reports of the other funds. In addition, the Fund, as a shareholder in the underlying Fidelity Central Funds, will indirectly bear its pro-rata share of the fees and expenses incurred by the underlying Fidelity Central Funds. These fees and expenses are not included in the Fund's annualized expense ratio used to calculate the expense estimate in the table below.
Please note that the expenses shown in the table are meant to highlight your ongoing costs only and do not reflect any transaction costs. Therefore, the second line of the table is useful in comparing ongoing costs only, and will not help you determine the relative total costs of owning different funds. In addition, if these transactional costs were included, your costs would have been higher.
Annual Report
| Annualized
Expense Ratio | Beginning
Account Value
May 1, 2010 | Ending
Account Value
October 31, 2010 | Expenses Paid
During Period*
May 1, 2010 to
October 31, 2010 |
Class A | 1.33% | | | |
Actual | | $ 1,000.00 | $ 1,094.20 | $ 7.02 |
HypotheticalA | | $ 1,000.00 | $ 1,018.50 | $ 6.77 |
Class T | 1.52% | | | |
Actual | | $ 1,000.00 | $ 1,093.90 | $ 8.02 |
HypotheticalA | | $ 1,000.00 | $ 1,017.54 | $ 7.73 |
Class B | 2.09% | | | |
Actual | | $ 1,000.00 | $ 1,090.10 | $ 11.01 |
HypotheticalA | | $ 1,000.00 | $ 1,014.67 | $ 10.61 |
Class C | 2.09% | | | |
Actual | | $ 1,000.00 | $ 1,090.30 | $ 11.01 |
HypotheticalA | | $ 1,000.00 | $ 1,014.67 | $ 10.61 |
Institutional Class | 1.00% | | | |
Actual | | $ 1,000.00 | $ 1,097.00 | $ 5.29 |
HypotheticalA | | $ 1,000.00 | $ 1,020.16 | $ 5.09 |
A 5% return per year before expenses
* Expenses are equal to each Class' annualized expense ratio, multiplied by the average account value over the period, multiplied by 184/365 (to reflect the one-half year period).
Annual Report
Investment Changes (Unaudited)
Top Five Stocks as of October 31, 2010 |
| % of fund's
net assets | % of fund's net assets
6 months ago |
LVMH Moet Hennessy - Louis Vuitton (France, Textiles, Apparel & Luxury Goods) | 3.2 | 2.0 |
The Swatch Group AG (Bearer) (Switzerland, Textiles, Apparel & Luxury Goods) | 2.2 | 1.3 |
HSBC Holdings PLC (United Kingdom, Commercial Banks) | 2.2 | 2.4 |
Novo Nordisk AS Series B (Denmark, Pharmaceuticals) | 1.8 | 1.1 |
BHP Billiton PLC (United Kingdom, Metals & Mining) | 1.5 | 1.2 |
| 10.9 | |
Top Five Market Sectors as of October 31, 2010 |
| % of fund's
net assets | % of fund's net assets
6 months ago |
Consumer Discretionary | 28.4 | 19.5 |
Financials | 22.7 | 25.6 |
Materials | 9.4 | 9.5 |
Industrials | 9.0 | 10.2 |
Information Technology | 8.9 | 9.9 |
Top Five Countries as of October 31, 2010 |
(excluding cash equivalents) | % of fund's
net assets | % of fund's net assets
6 months ago |
United Kingdom | 17.4 | 20.0 |
Japan | 15.0 | 19.9 |
France | 11.2 | 9.9 |
Germany | 9.9 | 7.0 |
Switzerland | 6.1 | 6.4 |
Percentages are adjusted for the effect of open futures contracts, if applicable. |
Asset Allocation (% of fund's net assets) |
As of October 31, 2010 | As of April 30, 2010 |
| Stocks 99.6% | | | Stocks 98.7% | |
| Short-Term
Investments and
Net Other Assets 0.4% | | | Short-Term
Investments and
Net Other Assets 1.3% | |

Annual Report
Investments October 31, 2010
Showing Percentage of Net Assets
Common Stocks - 97.4% |
| Shares | | Value (000s) |
Australia - 2.8% |
AMP Ltd. | 359,117 | | $ 1,879 |
Aristocrat Leisure Ltd. | 1,361,699 | | 4,682 |
Australia & New Zealand Banking Group Ltd. | 138,019 | | 3,355 |
BHP Billiton Ltd. | 211,768 | | 8,751 |
Navitas Ltd. | 635,200 | | 2,383 |
Newcrest Mining Ltd. | 167,129 | | 6,543 |
Westfield Group unit | 380,879 | | 4,619 |
TOTAL AUSTRALIA | | 32,212 |
Austria - 0.5% |
Wienerberger AG (a) | 352,040 | | 5,927 |
Bailiwick of Jersey - 0.7% |
WPP PLC | 670,816 | | 7,795 |
Belgium - 1.5% |
Ageas | 707,600 | | 2,175 |
Anheuser-Busch InBev SA NV | 204,143 | | 12,792 |
Hamon & Compagnie International SA | 60,300 | | 2,182 |
TOTAL BELGIUM | | 17,149 |
Bermuda - 1.1% |
GOME Electrical Appliances Holdings Ltd. (a) | 11,545,000 | | 3,887 |
Huabao International Holdings Ltd. | 1,892,000 | | 2,851 |
Signet Jewelers Ltd. (a) | 179,100 | | 6,301 |
TOTAL BERMUDA | | 13,039 |
Brazil - 0.0% |
Drogasil SA | 15,900 | | 402 |
Canada - 0.9% |
Barrick Gold Corp. | 52,100 | | 2,509 |
Suncor Energy, Inc. | 179,100 | | 5,739 |
Yamana Gold, Inc. | 205,600 | | 2,262 |
TOTAL CANADA | | 10,510 |
Cayman Islands - 5.8% |
Ajisen (China) Holdings Ltd. | 3,332,000 | | 5,992 |
Bosideng International Holdings Ltd. | 18,848,000 | | 9,532 |
China Dongxiang Group Co. Ltd. | 3,317,000 | | 1,857 |
China High Speed Transmission Equipment Group Co. Ltd. | 1,283,000 | | 2,622 |
China Shanshui Cement Group Ltd. | 3,898,000 | | 2,776 |
CNinsure, Inc. ADR (d) | 106,000 | | 2,724 |
Ctrip.com International Ltd. sponsored ADR (a) | 71,500 | | 3,723 |
Daphne International Holdings Ltd. | 3,902,000 | | 4,359 |
Common Stocks - continued |
| Shares | | Value (000s) |
Cayman Islands - continued |
Evergreen International Holdings Ltd. (a) | 60,000 | | $ 36 |
Hengdeli Holdings Ltd. (d) | 21,266,000 | | 11,797 |
Little Sheep Group Ltd. | 3,710,000 | | 2,417 |
Natural Beauty Bio-Technology Ltd. | 6,200,000 | | 1,840 |
Peak Sport Products Co. Ltd. (d) | 5,943,000 | | 4,738 |
Shenguan Holdings Group Ltd. | 2,864,000 | | 3,732 |
Silver Base Group Holdings Ltd. | 11,757,000 | | 8,585 |
TOTAL CAYMAN ISLANDS | | 66,730 |
China - 1.3% |
Baidu.com, Inc. sponsored ADR (a) | 111,100 | | 12,222 |
Tencent Holdings Ltd. | 109,700 | | 2,512 |
TOTAL CHINA | | 14,734 |
Denmark - 2.9% |
Carlsberg AS Series B | 62,100 | | 6,790 |
Danske Bank AS (a) | 61,600 | | 1,638 |
Novo Nordisk AS: | | | |
Series B | 19,863 | | 2,085 |
Series B sponsored ADR | 175,200 | | 18,361 |
Pandora A/S | 16,700 | | 810 |
William Demant Holding AS (a) | 44,800 | | 3,358 |
TOTAL DENMARK | | 33,042 |
France - 11.2% |
Alstom SA | 90,185 | | 4,550 |
Atos Origin SA (a) | 53,518 | | 2,474 |
AXA SA | 144,258 | | 2,626 |
AXA SA sponsored ADR | 101,800 | | 1,856 |
BNP Paribas SA | 156,322 | | 11,430 |
Carrefour SA | 63,941 | | 3,450 |
Compagnie Generale de Geophysique SA (a) | 204,200 | | 4,769 |
Credit Agricole SA | 216,900 | | 3,554 |
Danone | 95,722 | | 6,057 |
Iliad Group SA | 18,000 | | 2,026 |
Ingenico SA | 103,555 | | 3,124 |
Ipsos SA | 58,500 | | 2,813 |
Laurent-Perrier Group | 21,000 | | 2,367 |
LVMH Moet Hennessy - Louis Vuitton | 235,548 | | 36,908 |
Sanofi-Aventis | 32,879 | | 2,303 |
Sanofi-Aventis sponsored ADR | 339,100 | | 11,906 |
Schneider Electric SA | 69,287 | | 9,834 |
Societe Generale Series A | 123,224 | | 7,377 |
Common Stocks - continued |
| Shares | | Value (000s) |
France - continued |
Total SA | 110,788 | | $ 6,029 |
Vallourec SA (d) | 35,330 | | 3,666 |
TOTAL FRANCE | | 129,119 |
Germany - 7.7% |
Allianz AG | 43,050 | | 5,394 |
BASF AG | 65,800 | | 4,787 |
Bayerische Motoren Werke AG (BMW) | 203,463 | | 14,583 |
Deutsche Bank AG | 53,600 | | 3,089 |
Deutsche Boerse AG | 78,369 | | 5,513 |
Deutsche Lufthansa AG (a) | 159,900 | | 3,421 |
Deutsche Post AG | 183,500 | | 3,421 |
Deutsche Postbank AG (a) | 41,400 | | 1,441 |
Fresenius Medical Care AG & Co. KGaA | 175,200 | | 11,158 |
Hugo Boss AG | 46,900 | | 2,663 |
Kabel Deutschland Holding AG | 71,700 | | 3,228 |
Linde AG | 45,093 | | 6,491 |
MAN SE | 46,471 | | 5,108 |
Munich Re Group | 13,555 | | 2,119 |
Puma AG | 11,423 | | 3,797 |
SAP AG | 103,500 | | 5,396 |
SAP AG sponsored ADR (d) | 97,700 | | 5,054 |
Tom Tailor Holding AG | 72,700 | | 1,543 |
TOTAL GERMANY | | 88,206 |
Greece - 0.2% |
Folli Follie SA | 89,300 | | 2,174 |
Hong Kong - 2.8% |
Cathay Pacific Airways Ltd. | 1,767,000 | | 4,753 |
China Unicom (Hong Kong) Ltd. sponsored ADR | 242,000 | | 3,388 |
Emperor Watch & Jewellery Ltd. (d) | 24,650,000 | | 3,530 |
Hang Seng Bank Ltd. | 77,200 | | 1,129 |
Henderson Land Development Co. Ltd. | 510,334 | | 3,624 |
Henderson Land Development Co. Ltd. warrants 6/1/11 (a) | 88,600 | | 34 |
Hong Kong Exchanges and Clearing Ltd. | 229,200 | | 5,045 |
I.T Ltd. (d) | 3,754,000 | | 3,167 |
Television Broadcasts Ltd. | 643,000 | | 3,426 |
Wharf Holdings Ltd. | 645,000 | | 4,236 |
TOTAL HONG KONG | | 32,332 |
Common Stocks - continued |
| Shares | | Value (000s) |
Ireland - 1.1% |
CRH PLC | 397,098 | | $ 6,857 |
Kingspan Group PLC (United Kingdom) | 671,700 | | 5,585 |
TOTAL IRELAND | | 12,442 |
Israel - 0.2% |
Teva Pharmaceutical Industries Ltd. sponsored ADR | 41,800 | | 2,169 |
Italy - 3.4% |
Bulgari SpA | 489,300 | | 5,239 |
Intesa Sanpaolo SpA | 2,192,336 | | 7,710 |
Saipem SpA | 370,543 | | 16,463 |
Tod's SpA | 27,600 | | 2,676 |
UniCredit SpA | 1,782,294 | | 4,645 |
Unione di Banche Italiane SCpA | 174,755 | | 1,844 |
TOTAL ITALY | | 38,577 |
Japan - 15.0% |
Aozora Bank Ltd. | 1,265,000 | | 2,122 |
Canon, Inc. | 139,300 | | 6,412 |
Canon, Inc. sponsored ADR | 78,700 | | 3,620 |
eAccess Ltd. | 2,580 | | 1,882 |
Fanuc Ltd. | 40,700 | | 5,892 |
Fuji Media Holdings, Inc. | 775 | | 1,027 |
Hoya Corp. | 51,100 | | 1,195 |
Japan Retail Fund Investment Corp. | 1,514 | | 2,365 |
Japan Tobacco, Inc. | 525 | | 1,631 |
JFE Holdings, Inc. | 72,700 | | 2,267 |
JSR Corp. | 81,000 | | 1,402 |
Keyence Corp. | 15,900 | | 3,942 |
Mazda Motor Corp. | 3,185,000 | | 8,095 |
Mitsubishi Corp. | 145,600 | | 3,497 |
Mitsubishi Electric Corp. | 624,000 | | 5,848 |
Mitsubishi Estate Co. Ltd. | 140,000 | | 2,453 |
Mitsubishi UFJ Financial Group, Inc. | 1,618,300 | | 7,511 |
Mitsubishi UFJ Financial Group, Inc. sponsored ADR | 489,700 | | 2,282 |
Mitsui & Co. Ltd. | 399,700 | | 6,286 |
Mizuho Financial Group, Inc. | 1,276,800 | | 1,852 |
Mizuho Financial Group, Inc. ADR (d) | 353,200 | | 1,024 |
MS&AD Insurance Group Holdings, Inc. | 97,800 | | 2,343 |
Murata Manufacturing Co. Ltd. | 44,800 | | 2,519 |
NKSJ Holdings, Inc. | 276,000 | | 1,897 |
Nomura Holdings, Inc. | 393,000 | | 2,020 |
NSK Ltd. | 426,000 | | 3,221 |
Common Stocks - continued |
| Shares | | Value (000s) |
Japan - continued |
Omron Corp. | 104,500 | | $ 2,426 |
ORIX Corp. | 71,420 | | 6,515 |
Rakuten, Inc. | 7,412 | | 5,711 |
Ricoh Co. Ltd. | 458,000 | | 6,407 |
Shin-Etsu Chemical Co., Ltd. | 68,000 | | 3,438 |
Shiseido Co. Ltd. | 92,900 | | 1,940 |
SMC Corp. | 41,400 | | 6,328 |
SOFTBANK CORP. | 361,100 | | 11,597 |
Sony Corp. | 56,600 | | 1,912 |
Sony Corp. sponsored ADR | 26,500 | | 897 |
Sumitomo Corp. | 335,300 | | 4,245 |
Sumitomo Mitsui Financial Group, Inc. | 219,000 | | 6,537 |
Tokio Marine Holdings, Inc. | 82,100 | | 2,308 |
Tokyo Electron Ltd. | 87,500 | | 4,937 |
Toshiba Corp. (a) | 825,000 | | 4,129 |
Toyota Motor Corp. | 259,400 | | 9,188 |
Toyota Motor Corp. sponsored ADR (d) | 105,700 | | 7,486 |
Yahoo! Japan Corp. | 6,187 | | 2,160 |
TOTAL JAPAN | | 172,766 |
Korea (South) - 0.4% |
Samsung Electronics Co. Ltd. | 6,717 | | 4,450 |
Luxembourg - 0.3% |
ArcelorMittal SA Class A unit (d) | 104,100 | | 3,371 |
Netherlands - 1.6% |
AEGON NV (a) | 212,400 | | 1,346 |
ASML Holding NV | 90,000 | | 2,987 |
ING Groep NV: | | | |
(Certificaten Van Aandelen) unit (a) | 398,910 | | 4,267 |
sponsored ADR (a) | 118,800 | | 1,281 |
Koninklijke Philips Electronics NV | 183,406 | | 5,593 |
Koninklijke Philips Electronics NV unit | 81,700 | | 2,488 |
TOTAL NETHERLANDS | | 17,962 |
Norway - 1.2% |
Aker Solutions ASA | 304,600 | | 4,637 |
DnB NOR ASA | 287,800 | | 3,949 |
Sevan Marine ASA (a) | 301,000 | | 406 |
StatoilHydro ASA sponsored ADR (d) | 228,500 | | 4,988 |
TOTAL NORWAY | | 13,980 |
Common Stocks - continued |
| Shares | | Value (000s) |
Singapore - 0.1% |
United Overseas Bank Ltd. | 122,234 | | $ 1,760 |
South Africa - 2.2% |
Aspen Pharmacare Holdings Ltd. | 425,600 | | 5,681 |
Clicks Group Ltd. | 1,771,835 | | 11,559 |
Mr Price Group Ltd. | 919,900 | | 8,360 |
TOTAL SOUTH AFRICA | | 25,600 |
Spain - 3.3% |
Antena 3 Television SA (d) | 374,000 | | 3,820 |
Banco Bilbao Vizcaya Argentaria SA | 468,629 | | 6,172 |
Banco Santander SA | 974,660 | | 12,507 |
Banco Santander SA sponsored ADR | 89,800 | | 1,150 |
EDP Renovaveis SA (a) | 451,605 | | 2,620 |
Inditex SA (d) | 23,365 | | 1,951 |
NH Hoteles SA (a)(d) | 573,700 | | 3,006 |
Telefonica SA | 229,682 | | 6,205 |
TOTAL SPAIN | | 37,431 |
Sweden - 1.7% |
Elekta AB (B Shares) | 295,900 | | 11,195 |
H&M Hennes & Mauritz AB (B Shares) | 114,140 | | 4,021 |
Svenska Handelsbanken AB (A Shares) | 63,500 | | 2,076 |
Swedbank AB (A Shares) (a) | 125,912 | | 1,757 |
TOTAL SWEDEN | | 19,049 |
Switzerland - 6.1% |
Compagnie Financiere Richemont SA Series A | 342,144 | | 17,059 |
Credit Suisse Group | 50,181 | | 2,077 |
Credit Suisse Group sponsored ADR | 92,500 | | 3,839 |
Julius Baer Group Ltd. | 128,460 | | 5,421 |
Kuehne & Nagel International AG | 24,000 | | 2,967 |
Swiss Reinsurance Co. | 28,450 | | 1,367 |
The Swatch Group AG (Bearer) | 67,570 | | 25,817 |
UBS AG (a) | 195,078 | | 3,313 |
UBS AG (NY Shares) (a) | 313,277 | | 5,332 |
Zurich Financial Services AG | 9,723 | | 2,380 |
TOTAL SWITZERLAND | | 69,572 |
Taiwan - 1.3% |
Hon Hai Precision Industry Co. Ltd. (Foxconn) | 394,424 | | 1,495 |
Common Stocks - continued |
| Shares | | Value (000s) |
Taiwan - continued |
HTC Corp. | 469,400 | | $ 10,598 |
Taiwan Semiconductor Manufacturing Co. Ltd. sponsored ADR | 231,485 | | 2,526 |
TOTAL TAIWAN | | 14,619 |
Turkey - 0.8% |
Boyner Buyuk Magazacilik AS (a) | 1,418,000 | | 3,302 |
Dogus Otomotiv Servis ve Ticaret AS (a) | 321,000 | | 2,417 |
Turkcell Iletisim Hizmet AS sponsored ADR | 190,600 | | 3,417 |
TOTAL TURKEY | | 9,136 |
United Kingdom - 17.4% |
Anglo American PLC: | | | |
ADR | 195,246 | | 4,539 |
(United Kingdom) | 177,859 | | 8,287 |
Aviva PLC | 334,000 | | 2,130 |
Barclays PLC | 1,270,156 | | 5,581 |
Barclays PLC Sponsored ADR | 343,200 | | 6,057 |
BG Group PLC | 344,048 | | 6,700 |
BHP Billiton PLC | 495,034 | | 17,534 |
BP PLC sponsored ADR | 246,800 | | 10,077 |
Burberry Group PLC | 283,100 | | 4,622 |
Centrica PLC | 898,550 | | 4,782 |
Dunelm Group PLC | 190,100 | | 1,467 |
Great Portland Estates PLC | 573,900 | | 3,177 |
Hays PLC | 1,126,800 | | 1,995 |
Hikma Pharmaceuticals PLC | 142,400 | | 1,793 |
HSBC Holdings PLC: | | | |
(United Kingdom) | 116,944 | | 1,217 |
sponsored ADR | 463,533 | | 24,155 |
Imperial Tobacco Group PLC | 201,757 | | 6,462 |
InterContinental Hotel Group PLC | 325,695 | | 6,289 |
Intertek Group PLC | 116,200 | | 3,453 |
ITV PLC (a) | 4,242,800 | | 4,639 |
Johnson Matthey PLC | 133,254 | | 4,086 |
Legal & General Group PLC | 813,369 | | 1,308 |
Lloyds Banking Group PLC (a) | 3,032,699 | | 3,333 |
Lloyds Banking Group PLC sponsored ADR | 381,800 | | 1,672 |
M&C Saatchi | 773,305 | | 1,450 |
Man Group PLC | 825,945 | | 3,451 |
Prudential PLC | 467,573 | | 4,728 |
Rio Tinto PLC | 141,832 | | 9,211 |
Rio Tinto PLC sponsored ADR | 95,900 | | 6,245 |
Common Stocks - continued |
| Shares | | Value (000s) |
United Kingdom - continued |
Royal Bank of Scotland Group PLC (a) | 1,162,200 | | $ 831 |
Royal Dutch Shell PLC: | | | |
Class A (United Kingdom) | 92,200 | | 2,993 |
Class B | 113,022 | | 3,616 |
Schroders PLC | 212,800 | | 5,383 |
Standard Chartered PLC (United Kingdom) | 161,560 | | 4,673 |
Sthree PLC | 190,600 | | 895 |
SuperGroup PLC | 201,800 | | 3,653 |
Vodafone Group PLC | 2,846,069 | | 7,779 |
Vodafone Group PLC sponsored ADR | 179,700 | | 4,944 |
Xstrata PLC | 237,400 | | 4,600 |
TOTAL UNITED KINGDOM | | 199,807 |
United States of America - 1.9% |
Apple, Inc. (a) | 12,300 | | 3,701 |
Deckers Outdoor Corp. (a) | 116,300 | | 6,757 |
Google, Inc. Class A (a) | 9,500 | | 5,823 |
Philip Morris International, Inc. | 51,900 | | 3,036 |
Scientific Games Corp. Class A (a) | 296,800 | | 2,345 |
TOTAL UNITED STATES OF AMERICA | | 21,662 |
TOTAL COMMON STOCKS (Cost $948,466) | 1,117,724 |
Nonconvertible Preferred Stocks - 2.2% |
| | | |
Germany - 2.2% |
Hugo Boss AG (non-vtg.) | 109,800 | | 7,273 |
ProSiebenSat.1 Media AG | 85,100 | | 2,249 |
Volkswagen AG | 106,200 | | 15,959 |
TOTAL NONCONVERTIBLE PREFERRED STOCKS (Cost $16,684) | 25,481 |
Money Market Funds - 3.1% |
| Shares | | Value (000s) |
Fidelity Cash Central Fund, 0.23% (b) | 4,721,668 | | $ 4,722 |
Fidelity Securities Lending Cash Central Fund, 0.24% (b)(c) | 30,544,560 | | 30,545 |
TOTAL MONEY MARKET FUNDS (Cost $35,267) | 35,267 |
TOTAL INVESTMENT PORTFOLIO - 102.7% (Cost $1,000,417) | | 1,178,472 |
NET OTHER ASSETS (LIABILITIES) - (2.7)% | | (30,854) |
NET ASSETS - 100% | $ 1,147,618 |
Legend |
(a) Non-income producing |
(b) Affiliated fund that is available only to investment companies and other accounts managed by Fidelity Investments. The rate quoted is the annualized seven-day yield of the fund at period end. A complete unaudited listing of the fund's holdings as of its most recent quarter end is available upon request. In addition, each Fidelity Central Fund's financial statements, which are not covered by the Fund's report of Independent Registered Public Accounting Firm, are available on the SEC's website or upon request. |
(c) Investment made with cash collateral received from securities on loan. |
(d) Security or a portion of the security is on loan at period end. |
Affiliated Central Funds |
Information regarding fiscal year to date income earned by the Fund from investments in Fidelity Central Funds is as follows: |
Fund | Income earned
(Amounts in thousands) |
Fidelity Cash Central Fund | $ 18 |
Fidelity Securities Lending Cash Central Fund | 850 |
Total | $ 868 |
Other Information |
The following is a summary of the inputs used, as of October 31, 2010, involving the Fund's assets and liabilities carried at fair value. The inputs or methodology used for valuing securities may not be an indication of the risk associated with investing in those securities. For more information on valuation inputs, and their aggregation into the levels used in the table below, please refer to the Security Valuation section in the accompanying Notes to Financial Statements. |
Valuation Inputs at Reporting Date: |
Description
(Amounts in thousands) | Total | Level 1 | Level 2 | Level 3 |
Investments in Securities: | | | | |
Equities: | | | | |
United Kingdom | $ 199,807 | $ 137,558 | $ 62,249 | $ - |
Japan | 172,766 | 54,640 | 118,126 | - |
France | 129,119 | 116,018 | 13,101 | - |
Germany | 113,687 | 94,044 | 19,643 | - |
Switzerland | 69,572 | 64,182 | 5,390 | - |
Cayman Islands | 66,730 | 66,694 | 36 | - |
Italy | 38,577 | 38,577 | - | - |
Spain | 37,431 | 12,547 | 24,884 | - |
Denmark | 33,042 | 30,957 | 2,085 | - |
Other | 282,474 | 247,865 | 34,609 | - |
Money Market Funds | 35,267 | 35,267 | - | - |
Total Investments in Securities: | $ 1,178,472 | $ 898,349 | $ 280,123 | $ - |
Income Tax Information |
At October 31, 2010, the Fund had a capital loss carryforward of approximately $241,539,000 of which $14,313,000 and $227,226,000 will expire on October 31, 2016 and 2017, respectively. Capital loss carryforwards are only available to offset future capital gains of the Fund to the extent provided by regulations and may be limited. |
See accompanying notes which are an integral part of the financial statements.
Annual Report
Statement of Assets and Liabilities
Amounts in thousands (except per-share amounts) | October 31, 2010 |
| | |
Assets | | |
Investment in securities, at value (including securities loaned of $29,509) - See accompanying schedule: Unaffiliated issuers (cost $965,150) | $ 1,143,205 | |
Fidelity Central Funds (cost $35,267) | 35,267 | |
Total Investments (cost $1,000,417) | | $ 1,178,472 |
Foreign currency held at value (cost $103) | | 102 |
Receivable for investments sold | | 2,292 |
Receivable for fund shares sold | | 1,096 |
Dividends receivable | | 2,731 |
Distributions receivable from Fidelity Central Funds | | 37 |
Other receivables | | 196 |
Total assets | | 1,184,926 |
| | |
Liabilities | | |
Payable for investments purchased | $ 3,982 | |
Payable for fund shares redeemed | 1,547 | |
Accrued management fee | 696 | |
Distribution and service plan fees payable | 192 | |
Other affiliated payables | 254 | |
Other payables and accrued expenses | 92 | |
Collateral on securities loaned, at value | 30,545 | |
Total liabilities | | 37,308 |
| | |
Net Assets | | $ 1,147,618 |
Net Assets consist of: | | |
Paid in capital | | $ 1,213,935 |
Undistributed net investment income | | 12,989 |
Accumulated undistributed net realized gain (loss) on investments and foreign currency transactions | | (257,468) |
Net unrealized appreciation (depreciation) on investments and assets and liabilities in foreign currencies | | 178,162 |
Net Assets | | $ 1,147,618 |
See accompanying notes which are an integral part of the financial statements.
Annual Report
Financial Statements - continued
Statement of Assets and Liabilities - continued
Amounts in thousands (except per-share amounts) | October 31, 2010 |
| | |
Calculation of Maximum Offering Price Class A:
Net Asset Value and redemption price per share ($70,046 ÷ 3,941.1 shares) | | $ 17.77 |
| | |
Maximum offering price per share (100/94.25 of $17.77) | | $ 18.85 |
Class T:
Net Asset Value and redemption price per share ($370,770 ÷ 20,399.7 shares) | | $ 18.18 |
| | |
Maximum offering price per share (100/96.50 of $18.18) | | $ 18.84 |
Class B:
Net Asset Value and offering price per share ($6,817 ÷ 396.8 shares)A | | $ 17.18 |
| | |
Class C:
Net Asset Value and offering price per share ($22,376 ÷ 1,286.5 shares)A | | $ 17.39 |
| | |
| | |
Institutional Class:
Net Asset Value, offering price and redemption price per share ($677,609 ÷ 37,444.9 shares) | | $ 18.10 |
A Redemption price per share is equal to net asset value less any applicable contingent deferred sales charge.
See accompanying notes which are an integral part of the financial statements.
Annual Report
Statement of Operations
Amounts in thousands | Year ended October 31, 2010 |
| | |
Investment Income | | |
Dividends | | $ 29,863 |
Income from Fidelity Central Funds | | 868 |
Income before foreign taxes withheld | | 30,731 |
Less foreign taxes withheld | | (2,365) |
Total income | | 28,366 |
| | |
Expenses | | |
Management fee
Basic fee | $ 8,497 | |
Performance adjustment | 71 | |
Transfer agent fees | 2,710 | |
Distribution and service plan fees | 2,242 | |
Accounting and security lending fees | 560 | |
Custodian fees and expenses | 207 | |
Independent trustees' compensation | 7 | |
Registration fees | 69 | |
Audit | 79 | |
Legal | 7 | |
Interest | 1 | |
Miscellaneous | 17 | |
Total expenses before reductions | 14,467 | |
Expense reductions | (299) | 14,168 |
Net investment income (loss) | | 14,198 |
Realized and Unrealized Gain (Loss) Net realized gain (loss) on: | | |
Investment securities: | | |
Unaffiliated issuers | 74,134 | |
Foreign currency transactions | (400) | |
Capital gain distributions from Fidelity Central Funds | 3 | |
Total net realized gain (loss) | | 73,737 |
Change in net unrealized appreciation (depreciation) on: Investment securities | 72,011 | |
Assets and liabilities in foreign currencies | 66 | |
Total change in net unrealized appreciation (depreciation) | | 72,077 |
Net gain (loss) | | 145,814 |
Net increase (decrease) in net assets resulting from operations | | $ 160,012 |
See accompanying notes which are an integral part of the financial statements.
Annual Report
Financial Statements - continued
Statement of Changes in Net Assets
Amounts in thousands | Year ended
October 31,
2010 | Year ended
October 31,
2009 |
Increase (Decrease) in Net Assets | | |
Operations | | |
Net investment income (loss) | $ 14,198 | $ 18,837 |
Net realized gain (loss) | 73,737 | (232,788) |
Change in net unrealized appreciation (depreciation) | 72,077 | 399,538 |
Net increase (decrease) in net assets resulting
from operations | 160,012 | 185,587 |
Distributions to shareholders from net investment income | (17,905) | (18,118) |
Distributions to shareholders from net realized gain | (2,268) | - |
Total distributions | (20,173) | (18,118) |
Share transactions - net increase (decrease) | (188,997) | 28,251 |
Redemption fees | 22 | 29 |
Total increase (decrease) in net assets | (49,136) | 195,749 |
| | |
Net Assets | | |
Beginning of period | 1,196,754 | 1,001,005 |
End of period (including undistributed net investment income of $12,989 and undistributed net investment income of $16,696, respectively) | $ 1,147,618 | $ 1,196,754 |
See accompanying notes which are an integral part of the financial statements.
Annual Report
Financial Highlights - Class A
Years ended October 31, | 2010 | 2009 | 2008 | 2007 | 2006 |
Selected Per-Share Data | | | | |
Net asset value, beginning of period | $ 15.68 | $ 13.56 | $ 26.85 | $ 21.67 | $ 18.36 |
Income from Investment Operations | | | | | |
Net investment income (loss) C | .17 | .24 | .38 | .31 | .27 |
Net realized and unrealized gain (loss) | 2.16 | 2.12 | (11.56) | 6.16 | 3.53 |
Total from investment operations | 2.33 | 2.36 | (11.18) | 6.47 | 3.80 |
Distributions from net investment income | (.21) | (.24) | (.33) | (.23) | (.19) |
Distributions from net realized gain | (.03) | - | (1.78) | (1.06) | (.30) |
Total distributions | (.24) | (.24) | (2.11) | (1.29) | (.49) |
Redemption fees added to paid in capital C, G | - | - | - | - | - |
Net asset value, end of period | $ 17.77 | $ 15.68 | $ 13.56 | $ 26.85 | $ 21.67 |
Total Return A, B | 14.99% | 17.97% | (45.08)% | 31.44% | 21.12% |
Ratios to Average Net Assets D, F | | | | |
Expenses before reductions | 1.36% | 1.36% | 1.35% | 1.17% | 1.24% |
Expenses net of fee waivers, if any | 1.36% | 1.36% | 1.35% | 1.17% | 1.24% |
Expenses net of all reductions | 1.33% | 1.33% | 1.32% | 1.13% | 1.17% |
Net investment income (loss) | 1.04% | 1.79% | 1.83% | 1.34% | 1.31% |
Supplemental Data | | | | |
Net assets, end of period (in millions) | $ 70 | $ 72 | $ 73 | $ 147 | $ 113 |
Portfolio turnover rate E | 53% | 83% | 79% | 66% | 65% |
A Total returns would have been lower had certain expenses not been reduced during the periods shown.
B Total returns do not include the effect of the sales charges.
C Calculated based on average shares outstanding during the period.
D Fees and expenses of the underlying Fidelity Central Funds are not included in the Fund's expense ratio. The Fund indirectly bears its proportionate share of the expenses of any underlying Fidelity Central Funds.
E Amount does not include the portfolio activity of any underlying Fidelity Central Funds.
F Expense ratios reflect operating expenses of the class. Expenses before reductions do not reflect amounts reimbursed by the investment adviser or reductions from brokerage service arrangements or reductions from other expense offset arrangements and do not represent the amount paid by the class during periods when reimbursements or reductions occur. Expenses net of fee waivers reflect expenses after reimbursement by the investment adviser but prior to reductions from brokerage service arrangements or other expense offset arrangements. Expenses net of all reductions represent the net expenses paid by the class.
G Amount represents less than $.01 per share.
See accompanying notes which are an integral part of the financial statements.
Annual Report
Financial Highlights - Class T
Years ended October 31, | 2010 | 2009 | 2008 | 2007 | 2006 |
Selected Per-Share Data | | | | |
Net asset value, beginning of period | $ 16.03 | $ 13.84 | $ 27.35 | $ 22.05 | $ 18.64 |
Income from Investment Operations | | | | | |
Net investment income (loss) C | .14 | .22 | .36 | .28 | .24 |
Net realized and unrealized gain (loss) | 2.23 | 2.17 | (11.82) | 6.27 | 3.59 |
Total from investment operations | 2.37 | 2.39 | (11.46) | 6.55 | 3.83 |
Distributions from net investment income | (.19) | (.20) | (.27) | (.19) | (.12) |
Distributions from net realized gain | (.03) | - | (1.78) | (1.06) | (.30) |
Total distributions | (.22) | (.20) | (2.05) | (1.25) | (.42) |
Redemption fees added to paid in capital C, G | - | - | - | - | - |
Net asset value, end of period | $ 18.18 | $ 16.03 | $ 13.84 | $ 27.35 | $ 22.05 |
Total Return A, B | 14.88% | 17.70% | (45.18)% | 31.24% | 20.92% |
Ratios to Average Net Assets D, F | | | | |
Expenses before reductions | 1.53% | 1.57% | 1.51% | 1.33% | 1.39% |
Expenses net of fee waivers, if any | 1.53% | 1.57% | 1.51% | 1.33% | 1.39% |
Expenses net of all reductions | 1.50% | 1.54% | 1.48% | 1.30% | 1.33% |
Net investment income (loss) | .86% | 1.58% | 1.67% | 1.17% | 1.15% |
Supplemental Data | | | | |
Net assets, end of period (in millions) | $ 371 | $ 367 | $ 345 | $ 710 | $ 602 |
Portfolio turnover rate E | 53% | 83% | 79% | 66% | 65% |
A Total returns would have been lower had certain expenses not been reduced during the periods shown.
B Total returns do not include the effect of the sales charges.
C Calculated based on average shares outstanding during the period.
D Fees and expenses of the underlying Fidelity Central Funds are not included in the Fund's expense ratio. The Fund indirectly bears its proportionate share of the expenses of any underlying Fidelity Central Funds.
E Amount does not include the portfolio activity of any underlying Fidelity Central Funds.
F Expense ratios reflect operating expenses of the class. Expenses before reductions do not reflect amounts reimbursed by the investment adviser or reductions from brokerage service arrangements or reductions from other expense offset arrangements and do not represent the amount paid by the class during periods when reimbursements or reductions occur. Expenses net of fee waivers reflect expenses after reimbursement by the investment adviser but prior to reductions from brokerage service arrangements or other expense offset arrangements. Expenses net of all reductions represent the net expenses paid by the class.
G Amount represents less than $.01 per share.
See accompanying notes which are an integral part of the financial statements.
Annual Report
Financial Highlights - Class B
Years ended October 31, | 2010 | 2009 | 2008 | 2007 | 2006 |
Selected Per-Share Data | | | | |
Net asset value, beginning of period | $ 15.16 | $ 13.02 | $ 25.79 | $ 20.81 | $ 17.63 |
Income from Investment Operations | | | | | |
Net investment income (loss) C | .04 | .13 | .22 | .12 | .10 |
Net realized and unrealized gain (loss) | 2.10 | 2.08 | (11.14) | 5.94 | 3.40 |
Total from investment operations | 2.14 | 2.21 | (10.92) | 6.06 | 3.50 |
Distributions from net investment income | (.09) | (.07) | (.07) | (.02) | (.02) |
Distributions from net realized gain | (.03) | - | (1.78) | (1.06) | (.30) |
Total distributions | (.12) | (.07) | (1.85) | (1.08) | (.32) |
Redemption fees added to paid in capital C, G | - | - | - | - | - |
Net asset value, end of period | $ 17.18 | $ 15.16 | $ 13.02 | $ 25.79 | $ 20.81 |
Total Return A, B | 14.15% | 17.09% | (45.50)% | 30.45% | 20.12% |
Ratios to Average Net Assets D, F | | | | |
Expenses before reductions | 2.11% | 2.12% | 2.10% | 1.94% | 2.05% |
Expenses net of fee waivers, if any | 2.11% | 2.12% | 2.10% | 1.94% | 2.05% |
Expenses net of all reductions | 2.09% | 2.08% | 2.08% | 1.91% | 1.99% |
Net investment income (loss) | .28% | 1.04% | 1.07% | .56% | .49% |
Supplemental Data | | | | |
Net assets, end of period (in millions) | $ 7 | $ 8 | $ 10 | $ 27 | $ 37 |
Portfolio turnover rate E | 53% | 83% | 79% | 66% | 65% |
A Total returns would have been lower had certain expenses not been reduced during the periods shown.
B Total returns do not include the effect of the contingent deferred sales charge.
C Calculated based on average shares outstanding during the period.
D Fees and expenses of the underlying Fidelity Central Funds are not included in the Fund's expense ratio. The Fund indirectly bears its proportionate share of the expenses of any underlying Fidelity Central Funds.
E Amount does not include the portfolio activity of any underlying Fidelity Central Funds.
F Expense ratios reflect operating expenses of the class. Expenses before reductions do not reflect amounts reimbursed by the investment adviser or reductions from brokerage service arrangements or reductions from other expense offset arrangements and do not represent the amount paid by the class during periods when reimbursements or reductions occur. Expenses net of fee waivers reflect expenses after reimbursement by the investment adviser but prior to reductions from brokerage service arrangements or other expense offset arrangements. Expenses net of all reductions represent the net expenses paid by the class.
G Amount represents less than $.01 per share.
See accompanying notes which are an integral part of the financial statements.
Annual Report
Financial Highlights - Class C
Years ended October 31, | 2010 | 2009 | 2008 | 2007 | 2006 |
Selected Per-Share Data | | | | |
Net asset value, beginning of period | $ 15.36 | $ 13.22 | $ 26.22 | $ 21.19 | $ 17.95 |
Income from Investment Operations | | | | | |
Net investment income (loss) C | .05 | .14 | .22 | .14 | .11 |
Net realized and unrealized gain (loss) | 2.12 | 2.09 | (11.31) | 6.02 | 3.47 |
Total from investment operations | 2.17 | 2.23 | (11.09) | 6.16 | 3.58 |
Distributions from net investment income | (.11) | (.09) | (.13) | (.07) | (.04) |
Distributions from net realized gain | (.03) | - | (1.78) | (1.06) | (.30) |
Total distributions | (.14) | (.09) | (1.91) | (1.13) | (.34) |
Redemption fees added to paid in capital C, G | - | - | - | - | - |
Net asset value, end of period | $ 17.39 | $ 15.36 | $ 13.22 | $ 26.22 | $ 21.19 |
Total Return A, B | 14.17% | 17.06% | (45.50)% | 30.48% | 20.22% |
Ratios to Average Net Assets D, F | | | | |
Expenses before reductions | 2.10% | 2.11% | 2.09% | 1.91% | 1.98% |
Expenses net of fee waivers, if any | 2.10% | 2.11% | 2.09% | 1.91% | 1.98% |
Expenses net of all reductions | 2.08% | 2.08% | 2.07% | 1.87% | 1.92% |
Net investment income (loss) | .29% | 1.05% | 1.08% | .60% | .56% |
Supplemental Data | | | | |
Net assets, end of period (in millions) | $ 22 | $ 23 | $ 22 | $ 46 | $ 41 |
Portfolio turnover rate E | 53% | 83% | 79% | 66% | 65% |
A Total returns would have been lower had certain expenses not been reduced during the periods shown.
B Total returns do not include the effect of the contingent deferred sales charge.
C Calculated based on average shares outstanding during the period.
D Fees and expenses of the underlying Fidelity Central Funds are not included in the Fund's expense ratio. The Fund indirectly bears its proportionate share of the expenses of any underlying Fidelity Central Funds.
E Amount does not include the portfolio activity of any underlying Fidelity Central Funds.
F Expense ratios reflect operating expenses of the class. Expenses before reductions do not reflect amounts reimbursed by the investment adviser or reductions from brokerage service arrangements or reductions from other expense offset arrangements and do not represent the amount paid by the class during periods when reimbursements or reductions occur. Expenses net of fee waivers reflect expenses after reimbursement by the investment adviser but prior to reductions from brokerage service arrangements or other expense offset arrangements. Expenses net of all reductions represent the net expenses paid by the class.
G Amount represents less than $.01 per share.
See accompanying notes which are an integral part of the financial statements.
Annual Report
Financial Highlights - Institutional Class
Years ended October 31, | 2010 | 2009 | 2008 | 2007 | 2006 |
Selected Per-Share Data | | | | |
Net asset value, beginning of period | $ 15.95 | $ 13.83 | $ 27.35 | $ 22.06 | $ 18.64 |
Income from Investment Operations | | | | | |
Net investment income (loss) B | .22 | .29 | .45 | .40 | .35 |
Net realized and unrealized gain (loss) | 2.23 | 2.14 | (11.78) | 6.26 | 3.58 |
Total from investment operations | 2.45 | 2.43 | (11.33) | 6.66 | 3.93 |
Distributions from net investment income | (.27) | (.31) | (.41) | (.31) | (.21) |
Distributions from net realized gain | (.03) | - | (1.78) | (1.06) | (.30) |
Total distributions | (.30) | (.31) | (2.19) | (1.37) | (.51) |
Redemption fees added to paid in capital B, F | - | - | - | - | - |
Net asset value, end of period | $ 18.10 | $ 15.95 | $ 13.83 | $ 27.35 | $ 22.06 |
Total Return A | 15.49% | 18.32% | (44.92)% | 31.88% | 21.55% |
Ratios to Average Net Assets C, E | | | | |
Expenses before reductions | 1.01% | 1.06% | 1.01% | .84% | .87% |
Expenses net of fee waivers, if any | 1.01% | 1.06% | 1.01% | .84% | .87% |
Expenses net of all reductions | .98% | 1.02% | .98% | .81% | .81% |
Net investment income (loss) | 1.39% | 2.10% | 2.17% | 1.66% | 1.67% |
Supplemental Data | | | | |
Net assets, end of period (in millions) | $ 678 | $ 727 | $ 551 | $ 609 | $ 354 |
Portfolio turnover rate D | 53% | 83% | 79% | 66% | 65% |
A Total returns would have been lower had certain expenses not been reduced during the periods shown.
B Calculated based on average shares outstanding during the period.
C Fees and expenses of the underlying Fidelity Central Funds are not included in the Fund's expense ratio. The Fund indirectly bears its proportionate share of the expenses of any underlying Fidelity Central Funds.
D Amount does not include the portfolio activity of any underlying Fidelity Central Funds.
E Expense ratios reflect operating expenses of the class. Expenses before reductions do not reflect amounts reimbursed by the investment adviser or reductions from brokerage service arrangements or reductions from other expense offset arrangements and do not represent the amount paid by the class during periods when reimbursements or reductions occur. Expenses net of fee waivers reflect expenses after reimbursement by the investment adviser but prior to reductions from brokerage service arrangements or other expense offset arrangements. Expenses net of all reductions represent the net expenses paid by the class.
F Amount represents less than $.01 per share.
See accompanying notes which are an integral part of the financial statements.
Annual Report
Notes to Financial Statements
For the period ended October 31, 2010
(Amounts in thousands except ratios)
1. Organization.
Fidelity Advisor Overseas Fund (the Fund) is a fund of Fidelity Advisor Series VIII (the Trust) and is authorized to issue an unlimited number of shares. The Trust is registered under the Investment Company Act of 1940, as amended (the 1940 Act), as an open-end management investment company organized as a Massachusetts business trust. The Fund offers Class A, Class T, Class C, and Institutional Class shares, each of which has equal rights as to assets and voting privileges. Effective after the close of business on September 1, 2010, Class B shares were closed to new accounts and additional purchases by existing shareholders. Each class has exclusive voting rights with respect to matters that affect that class. Class B shares will automatically convert to Class A shares after a holding period of seven years from the initial date of purchase. Investment income, realized and unrealized capital gains and losses, the common expenses of the Fund, and certain fund-level expense reductions, if any, are allocated on a pro-rata basis to each class based on the relative net assets of each class to the total net assets of the Fund. Each class differs with respect to transfer agent and distribution and service plan fees incurred. Certain expense reductions also differ by class. The Fund's investments in emerging markets can be subject to social, economic, regulatory, and political uncertainties and can be extremely volatile.
2. Investments in Fidelity Central Funds.
The Fund may invest in Fidelity Central Funds, which are open-end investment companies available only to other investment companies and accounts managed by Fidelity Management & Research Company (FMR) and its affiliates. The Fund's Schedule of Investments lists each of the Fidelity Central Funds held as of period end, if any, as an investment of the Fund, but does not include the underlying holdings of each Fidelity Central Fund. As an Investing Fund, the Fund indirectly bears its proportionate share of the expenses of the underlying Fidelity Central Funds.
The Money Market Central Funds seek preservation of capital and current income and are managed by Fidelity Investments Money Management, Inc. (FIMM), an affiliate of FMR.
A complete unaudited list of holdings for each Fidelity Central Fund is available upon request or at the Securities and Exchange Commission (the SEC) web site at www.sec.gov. In addition, the financial statements of the Fidelity Central Funds which are not covered by the Fund's Report of Independent Registered Public Accounting Firm, are available on the SEC web site or upon request.
Annual Report
Notes to Financial Statements - continued
(Amounts in thousands except ratios)
3. Significant Accounting Policies.
The financial statements have been prepared in conformity with accounting principles generally accepted in the United States of America (GAAP), which require management to make certain estimates and assumptions at the date of the financial statements. Actual results could differ from those estimates. The following summarizes the significant accounting policies of the Fund:
Security Valuation. Investments are valued as of 4:00 p.m. Eastern time on the last calendar day of the period. The Fund uses independent pricing services approved by the Board of Trustees to value its investments. When current market prices or quotations are not readily available or reliable, valuations may be determined in good faith in accordance with procedures adopted by the Board of Trustees. Factors used in determining value may include market or security specific events. The frequency with which these procedures are used cannot be predicted and they may be utilized to a significant extent. The value used for net asset value (NAV) calculation under these procedures may differ from published prices for the same securities.
The Fund categorizes the inputs to valuation techniques used to value its investments into a disclosure hierarchy consisting of three levels as shown below.
Level 1 - quoted prices in active markets for identical investments
Level 2 - other significant observable inputs (including quoted prices for similar investments, interest rates, prepayment speeds, etc.)
Level 3 - unobservable inputs (including the fund's own assumptions based on the best information available)
Changes in valuation techniques may result in transfers in or out of an assigned level within the disclosure hierarchy. The aggregate value of investments by input level, as of October 31, 2010 is included at the end of the Fund's Schedule of Investments. Valuation techniques used to value the Fund's investments by major category are as follows.
Equity securities, including restricted securities, for which market quotations are readily available, are valued at the last reported sale price or official closing price as reported by an independent pricing service on the primary market or exchange on which they are traded and are categorized as Level 1 in the hierarchy. In the event there were no sales during the day or closing prices are not available, securities are valued at the last quoted bid price or may be valued using the last available price and are generally categorized as Level 2 in the hierarchy. For foreign equity securities, when significant market or security specific events arise, comparisons to the valuation of American Depositary Receipts (ADRs), futures contracts, Exchange-traded funds (ETFs) and certain indexes as well as quoted prices for similar securities are used and are categorized as Level 2 in the hierarchy in these circumstances. Utilizing these techniques may result in significant
Annual Report
3. Significant Accounting Policies - continued
Security Valuation - continued
transfers between Level 1 and Level 2. For restricted equity securities and private placements where observable inputs are limited, assumptions about market activity and risk are used and are categorized as Level 3 in the hierarchy.
Investments in open-end mutual funds, including the Fidelity Central Funds, are valued at their closing net asset value each business day and are categorized as Level 1 in the hierarchy. Short-term securities with remaining maturities of sixty days or less for which quotations are not readily available are valued at amortized cost, which approximates fair value and are categorized as Level 2 in the hierarchy.
Foreign Currency. The Fund uses foreign currency contracts to facilitate transactions in foreign-denominated securities. Gains and losses from these transactions may arise from changes in the value of the foreign currency or if the counterparties do not perform under the contracts' terms.
Foreign-denominated assets, including investment securities, and liabilities are translated into U.S. dollars at the exchange rate at period end. Purchases and sales of investment securities, income and dividends received and expenses denominated in foreign currencies are translated into U.S. dollars at the exchange rate in effect on the transaction date.
The effects of exchange rate fluctuations on investments are included with the net realized and unrealized gain (loss) on investment securities. Other foreign currency transactions resulting in realized and unrealized gain (loss) are disclosed separately.
Investment Transactions and Income. For financial reporting purposes, the Fund's investment holdings and NAV include trades executed through the end of the last business day of the period. The NAV per share for processing shareholder transactions is calculated as of the close of business of the New York Stock Exchange (NYSE), normally 4:00 p.m. Eastern time and includes trades executed through the end of the prior business day. Gains and losses on securities sold are determined on the basis of identified cost and may include proceeds received from litigation. Dividend income is recorded on the ex-dividend date, except for certain dividends from foreign securities where the ex-dividend date may have passed, which are recorded as soon as the Fund is informed of the ex-dividend date. Non-cash dividends included in dividend income, if any, are recorded at the fair market value of the securities received. Distributions received on securities that represent a return of capital or capital gain are recorded as a reduction of cost of investments and/or as a realized gain. The Fund estimates the components of distributions received that may be considered return of capital distributions or capital gain distributions. Interest income and distributions from the Fidelity Central Funds are
Annual Report
Notes to Financial Statements - continued
(Amounts in thousands except ratios)
3. Significant Accounting Policies - continued
Investment Transactions and Income - continued
accrued as earned. Interest income includes coupon interest and amortization of premium and accretion of discount on debt securities. Investment income is recorded net of foreign taxes withheld where recovery of such taxes is uncertain.
Expenses. Most expenses of the Trust can be directly attributed to a fund. Expenses which cannot be directly attributed are apportioned amongst each fund in the Trust. Expense estimates are accrued in the period to which they relate and adjustments are made when actual amounts are known.
Income Tax Information and Distributions to Shareholders. Each year the Fund intends to qualify as a regulated investment company, including distributing substantially all of its taxable income and realized gains under Subchapter M of the Internal Revenue Code and filing its U.S. federal tax return. As a result, no provision for income taxes is required. As of October 31, 2010, the Fund did not have any unrecognized tax benefits in the accompanying financial statements. A fund's federal tax return is subject to examination by the Internal Revenue Service (IRS) for a period of three years. Foreign taxes are provided for based on the Fund's understanding of the tax rules and rates that exist in the foreign markets in which it invests.
Distributions are declared and recorded on the ex-dividend date. Income dividends and capital gain distributions are declared separately for each class. Income and capital gain distributions are determined in accordance with income tax regulations, which may differ from GAAP.
Capital accounts within the financial statements are adjusted for permanent book-tax differences. These adjustments have no impact on net assets or the results of operations. Temporary book-tax differences will reverse in a subsequent period.
Book-tax differences are primarily due to the short-term gain distributions from the Fidelity Central Funds, foreign currency transactions, passive foreign investment companies (PFIC), deferred trustees compensation, capital loss carryforwards and losses deferred due to wash sales.
The federal tax cost of investment securities and unrealized appreciation (depreciation) as of period end were as follows:
Gross unrealized appreciation | $ 244,454 |
Gross unrealized depreciation | (84,904) |
Net unrealized appreciation (depreciation) | $ 159,550 |
| |
Tax Cost | $ 1,018,922 |
Annual Report
3. Significant Accounting Policies - continued
Income Tax Information and Distributions to Shareholders - continued
The tax-based components of distributable earnings as of period end were as follows:
Undistributed ordinary income | $ 15,566 |
Capital loss carryforward | $ (241,539) |
Net unrealized appreciation (depreciation) | $ 159,658 |
The tax character of distributions paid was as follows:
| October 31, 2010 | October 31, 2009 |
Ordinary Income | $ 20,173 | $ 18,118 |
Short-Term Trading (Redemption) Fees. Shares held by investors in the Fund less than 30 days are subject to a redemption fee equal to 1.00% of the net asset value of shares redeemed. All redemption fees, which reduce the proceeds of the shareholder redemption, are retained by the Fund and accounted for as an addition to paid in capital.
4. Purchases and Sales of Investments.
Purchases and sales of securities, other than short-term securities, aggregated $622,100 and $817,350, respectively.
5. Fees and Other Transactions with Affiliates.
Management Fee. FMR and its affiliates provide the Fund with investment management related services for which the Fund pays a monthly management fee. The management fee is the sum of an individual fund fee rate that is based on an annual rate of .45% of the Fund's average net assets and a group fee rate that averaged .26% during the period. The group fee rate is based upon the average net assets of all the mutual funds advised by FMR. The group fee rate decreases as assets under management increase and increases as assets under management decrease. In addition, the management fee is subject to a performance adjustment (up to a maximum of ± .20% of the Fund's average net assets over a 36 month performance period). The upward or downward adjustment to the management fee is based on the investment performance of the asset-weighted return of all classes as compared to an appropriate benchmark index. For the period, the total annual management fee rate, including the performance adjustment, was .72% of the Fund's average net assets.
Distribution and Service Plan Fees. In accordance with Rule 12b-1 of the 1940 Act, the Fund has adopted separate Distribution and Service Plans for each class of shares. Certain classes pay Fidelity Distributors Corporation (FDC), an affiliate of FMR,
Annual Report
Notes to Financial Statements - continued
(Amounts in thousands except ratios)
5. Fees and Other Transactions with Affiliates - continued
Distribution and Service Plan Fees - continued
separate Distribution and Service Fees, each of which is based on an annual percentage of each class' average net assets. In addition, FDC may pay financial intermediaries for selling shares of the Fund and providing shareholder support services. For the period, the Distribution and Service Fee rates, total fees and amounts retained by FDC were as follows:
| Distribution
Fee | Service
Fee | Total Fees | Retained
by FDC |
Class A | -% | .25% | $ 169 | $ 10 |
Class T | .25% | .25% | 1,782 | 21 |
Class B | .75% | .25% | 72 | 54 |
Class C | .75% | .25% | 219 | 12 |
| | | $ 2,242 | $ 97 |
Sales Load. FDC receives a front-end sales charge of up to 5.75% for selling Class A shares, and 3.50% for selling Class T shares, some of which is paid to financial intermediaries for selling shares of the Fund. FDC receives the proceeds of contingent deferred sales charges levied on Class A, Class T, Class B, and Class C redemptions. These charges depend on the holding period. The deferred sales charges range from 5% to 1% for Class B, 1% for Class C, 1.00% for certain purchases of Class A shares (1.00% to .50% prior to July 12, 2010) and .25% for certain purchases of Class T shares.
For the period, sales charge amounts retained by FDC were as follows:
| Retained
by FDC |
Class A | $ 6 |
Class T | 5 |
Class B* | 9 |
Class C* | -** |
| $ 21 |
* When Class B and Class C shares are initially sold, FDC pays commissions from its own resources to financial intermediaries through which the sales are made.
** Amount represents less than $500.
Transfer Agent Fees. Fidelity Investments Institutional Operations Company, Inc. (FIIOC), an affiliate of FMR, is the transfer, dividend disbursing and shareholder servicing agent for each class of the Fund. FIIOC receives account fees and asset-based fees that vary according to the account size and type of account of the shareholders of the respective classes of the Fund. FIIOC pays for typesetting, printing and mailing of
Annual Report
5. Fees and Other Transactions with Affiliates - continued
Transfer Agent Fees - continued
shareholder reports, except proxy statements. For the period, transfer agent fees for each class were as follows:
| Amount | % of
Average
Net Assets |
Class A | $ 211 | .31 |
Class T | 834 | .23 |
Class B | 23 | .32 |
Class C | 68 | .31 |
Institutional Class | 1,574 | .21 |
| $ 2,710 | |
Accounting and Security Lending Fees. Fidelity Service Company, Inc. (FSC), an affiliate of FMR, maintains the Fund's accounting records. The accounting fee is based on the level of average net assets for the month. Under a separate contract, FSC administers the security lending program. The security lending fee is based on the number and duration of lending transactions.
Brokerage Commissions. The Fund placed a portion of its portfolio transactions with brokerage firms which are affiliates of the investment adviser. The commissions paid to these affiliated firms were $1 for the period.
Interfund Lending Program. Pursuant to an Exemptive Order issued by the SEC, the Fund, along with other registered investment companies having management contracts with FMR, may participate in an interfund lending program. This program provides an alternative credit facility allowing the funds to borrow from, or lend money to, other participating affiliated funds. The interest expense amounted to three hundred thirty-six dollars. At period end, there were no interfund loans outstanding. The Fund's activity in this program during the period for which loans were outstanding was as follows:
Borrower or Lender | Average Daily
Loan Balance | Weighted Average Interest Rate |
Borrower | $ 3,309 | .46% |
6. Committed Line of Credit.
The Fund participates with other funds managed by FMR or an affiliate in a $3.75 billion credit facility (the "line of credit") to be utilized for temporary or emergency purposes to fund shareholder redemptions or for other short-term liquidity purposes. The Fund has
Annual Report
Notes to Financial Statements - continued
(Amounts in thousands except ratios)
6. Committed Line of Credit - continued
agreed to pay commitment fees on its pro-rata portion of the line of credit, which amounted to $5 and is reflected in Miscellaneous expenses on the Statement of Operations. During the period, there were no borrowings on this line of credit.
7. Security Lending.
The Fund lends portfolio securities through a lending agent from time to time in order to earn additional income. The lending agent may loan securities to certain qualified borrowers, including Fidelity Capital Markets (FCM), a broker-dealer affiliated with the Fund. On the settlement date of the loan, the Fund receives collateral (in the form of U.S. Treasury obligations, letters of credit and/or cash) against the loaned securities and maintains collateral in an amount not less than 100% of the market value of the loaned securities during the period of the loan. The market value of the loaned securities is determined at the close of business of the Fund and any additional required collateral is delivered to the Fund on the next business day. If the borrower defaults on its obligation to return the securities loaned because of insolvency or other reasons, a fund could experience delays and costs in recovering the securities loaned or in gaining access to the collateral. Any cash collateral received is invested in the Fidelity Securities Lending Cash Central Fund. The value of loaned securities and cash collateral at period end are disclosed on the Fund's Statement of Assets and Liabilities. Security lending income represents the income earned on investing cash collateral, less rebates paid to borrowers and lending agent fees associated with the loan, plus any premium payments received for lending certain types of securities. Security lending income is presented in the Statement of Operations as a component of income from Fidelity Central Funds. During the period, there were no securities loaned to FCM. Total security lending income during the period amounted to $850.
8. Bank Borrowings.
The Fund is permitted to have bank borrowings for temporary or emergency purposes to fund shareholder redemptions. The Fund has established borrowing arrangements with certain banks. The interest rate on the borrowings is the bank's base rate, as revised from time to time. The average daily loan balance during the period for which loans were outstanding amounted to $4,478. The weighted average interest rate was .66%. The interest expense amounted to four hundred eleven dollars under the bank borrowing program. At period end, there were no bank borrowings outstanding.
Annual Report
9. Expense Reductions.
Many of the brokers with whom FMR places trades on behalf of the Fund provided services to the Fund in addition to trade execution. These services included payments of certain expenses on behalf of the Fund totaling $299 for the period.
10. Distributions to Shareholders.
Distributions to shareholders of each class were as follows:
Years ended October 31, | 2010 | 2009 |
From net investment income | | |
Class A | $ 950 | $ 1,238 |
Class T | 4,334 | 4,849 |
Class B | 45 | 48 |
Class C | 160 | 144 |
Institutional Class | 12,416 | 11,839 |
Total | $ 17,905 | $ 18,118 |
From net realized gain | | |
Class A | $ 134 | $ - |
Class T | 684 | - |
Class B | 15 | - |
Class C | 44 | - |
Institutional Class | 1,391 | - |
Total | $ 2,268 | $ - |
11. Share Transactions.
Transactions for each class of shares were as follows:
| Shares | Dollars |
Years ended October 31, | 2010 | 2009 | 2010 | 2009 |
Class A | | | | |
Shares sold | 475 | 855 | $ 7,655 | $ 11,113 |
Reinvestment of distributions | 61 | 87 | 1,012 | 1,028 |
Shares redeemed | (1,167) | (1,729) | (18,467) | (22,509) |
Net increase (decrease) | (631) | (787) | $ (9,800) | $ (10,368) |
Class T | | | | |
Shares sold | 4,009 | 5,593 | $ 65,721 | $ 75,113 |
Reinvestment of distributions | 288 | 387 | 4,889 | 4,696 |
Shares redeemed | (6,821) | (8,015) | (111,516) | (106,238) |
Net increase (decrease) | (2,524) | (2,035) | $ (40,906) | $ (26,429) |
Annual Report
Notes to Financial Statements - continued
(Amounts in thousands except ratios)
11. Share Transactions - continued
| Shares | Dollars |
Years ended October 31, | 2010 | 2009 | 2010 | 2009 |
Class B | | | | |
Shares sold | 48 | 92 | $ 740 | $ 1,164 |
Reinvestment of distributions | 3 | 4 | 54 | 43 |
Shares redeemed | (174) | (341) | (2,691) | (4,276) |
Net increase (decrease) | (123) | (245) | $ (1,897) | $ (3,069) |
Class C | | | | |
Shares sold | 120 | 330 | $ 1,913 | $ 4,291 |
Reinvestment of distributions | 11 | 10 | 176 | 119 |
Shares redeemed | (337) | (515) | (5,265) | (6,428) |
Net increase (decrease) | (206) | (175) | $ (3,176) | $ (2,018) |
Institutional Class | | | | |
Shares sold | 12,645 | 12,044 | $ 202,633 | $ 158,122 |
Reinvestment of distributions | 818 | 979 | 13,738 | 11,749 |
Shares redeemed | (21,576) | (7,282) | (349,589) | (99,736) |
Net increase (decrease) | (8,113) | 5,741 | $ (133,218) | $ 70,135 |
12. Other.
The Fund's organizational documents provide former and current trustees and officers with a limited indemnification against liabilities arising in connection with the performance of their duties to the Fund. In the normal course of business, the Fund may also enter into contracts that provide general indemnifications. The Fund's maximum exposure under these arrangements is unknown as this would be dependent on future claims that may be made against the Fund. The risk of material loss from such claims is considered remote.
At the end of the period, the Fidelity Advisor Freedom Funds were owners of record, in the aggregate, of approximately 33% of the total outstanding shares of the Fund.
Annual Report
To the Trustees of Fidelity Advisor Series VIII and the Shareholders of Fidelity Advisor Overseas Fund:
In our opinion, the accompanying statement of assets and liabilities, including the schedule of investments, and the related statements of operations and of changes in net assets and the financial highlights present fairly, in all material respects, the financial position of Fidelity Advisor Overseas Fund (a fund of Fidelity Advisor Series VIII) at October 31, 2010, the results of its operations for the year then ended, the changes in its net assets for each of the two years in the period then ended and the financial highlights for each of the five years in the period then ended, in conformity with accounting principles generally accepted in the United States of America. These financial statements and financial highlights (hereafter referred to as "financial statements") are the responsibility of the Fidelity Advisor Overseas Fund's management. Our responsibility is to express an opinion on these financial statements based on our audits. We conducted our audits of these financial statements in accordance with the standards of the Public Company Accounting Oversight Board (United States). Those standards require that we plan and perform the audit to obtain reasonable assurance about whether the financial statements are free of material misstatement. An audit includes examining, on a test basis, evidence supporting the amounts and disclosures in the financial statements, assessing the accounting principles used and significant estimates made by management, and evaluating the overall financial statement presentation. We believe that our audits, which included confirmation of securities at October 31, 2010 by correspondence with the custodian and brokers, provide a reasonable basis for our opinion.
/s/ PricewaterhouseCoopers LLP
PricewaterhouseCoopers LLP
Boston, Massachusetts
December 17, 2010
Annual Report
The Trustees, Member of the Advisory Board, and executive officers of the trust and fund, as applicable, are listed below. The Board of Trustees governs the fund and is responsible for protecting the interests of shareholders. The Trustees are experienced executives who meet periodically throughout the year to oversee the fund's activities, review contractual arrangements with companies that provide services to the fund, oversee management of the risks associated with such activities and contractual arrangements, and review the fund's performance. Except for James C. Curvey, each of the Trustees oversees 221 funds advised by FMR or an affiliate. Mr. Curvey oversees 410 funds advised by FMR or an affiliate.
The Trustees hold office without limit in time except that (a) any Trustee may resign; (b) any Trustee may be removed by written instrument, signed by at least two-thirds of the number of Trustees prior to such removal; (c) any Trustee who requests to be retired or who has become incapacitated by illness or injury may be retired by written instrument signed by a majority of the other Trustees; and (d) any Trustee may be removed at any special meeting of shareholders by a two-thirds vote of the outstanding voting securities of the trust. Each Trustee who is not an interested person (as defined in the 1940 Act) (Independent Trustee), shall retire not later than the last day of the calendar year in which his or her 72nd birthday occurs. The Independent Trustees may waive this mandatory retirement age policy with respect to individual Trustees. The executive officers and Advisory Board Member hold office without limit in time, except that any officer and Advisory Board Member may resign or may be removed by a vote of a majority of the Trustees at any regular meeting or any special meeting of the Trustees. Except as indicated, each individual has held the office shown or other offices in the same company for the past five years.
Experience, Skills, Attributes, and Qualifications of the Fund's Trustees. The Governance and Nominating Committee has adopted a statement of policy that describes the experience, qualifications, attributes, and skills that are necessary and desirable for potential Independent Trustee candidates (Statement of Policy). The Board believes that each Trustee satisfied at the time he or she was initially elected or appointed a Trustee, and continues to satisfy, the standards contemplated by the Statement of Policy. The Governance and Nominating Committee also engages professional search firms to help identify potential Independent Trustee candidates who have the experience, qualifications, attributes, and skills consistent with the Statement of Policy. From time to time, additional criteria based on the composition and skills of the current Independent Trustees, as well as experience or skills that may be appropriate in light of future changes to board composition, business conditions, and regulatory or other developments, have also been considered by the professional search firms and the Governance and Nominating Committee. In addition, the Board takes into account the Trustees' commitment and participation in Board and committee meetings, as well as their leadership of standing and ad hoc committees throughout their tenure.
In determining that a particular Trustee was and continues to be qualified to serve as a Trustee, the Board has considered a variety of criteria, none of which, in isolation, was controlling. The Board believes that, collectively, the Trustees have balanced and diverse experience, qualifications, attributes, and skills, which allow the Board to operate effectively in governing the fund and protecting the interests of shareholders. Information about the specific experience, skills, attributes, and qualifications of each Trustee, which in each case led to the Board's conclusion that the Trustee should serve (or continue to serve) as a trustee of the fund, is provided below.
Annual Report
Trustees and Officers - continued
Board Structure and Oversight Function. Edward C. Johnson 3d is an interested person (as defined in the 1940 Act) and currently serves as Chairman. The Trustees have determined that an interested Chairman is appropriate and benefits shareholders because an interested Chairman has a personal and professional stake in the quality and continuity of services provided to the fund. Independent Trustees exercise their informed business judgment to appoint an individual of their choosing to serve as Chairman, regardless of whether the Trustee happens to be independent or a member of management. The Independent Trustees have determined that they can act independently and effectively without having an Independent Trustee serve as Chairman and that a key structural component for assuring that they are in a position to do so is for the Independent Trustees to constitute a substantial majority for the Board. The Independent Trustees also regularly meet in executive session. Ned C. Lautenbach serves as Chairman of the Independent Trustees and as such (i) acts as a liaison between the Independent Trustees and management with respect to matters important to the Independent Trustees and (ii) with management prepares agendas for Board meetings.
Fidelity funds are overseen by different Boards of Trustees. The fund's Board oversees Fidelity's equity and high income funds and another Board oversees Fidelity's investment-grade bond, money market, and asset allocation funds. The asset allocation funds may invest in Fidelity funds overseen by the fund's Board. The use of separate Boards, each with its own committee structure, allows the Trustees of each group of Fidelity funds to focus on the unique issues of the funds they oversee, including common research, investment, and operational issues. On occasion, the separate Boards establish joint committees to address issues of overlapping consequences for the Fidelity funds overseen by each Board.
The Trustees operate using a system of committees to facilitate the timely and efficient consideration of all matters of importance to the Trustees, the fund, and fund shareholders and to facilitate compliance with legal and regulatory requirements and oversight of the fund's activities and associated risks. The Board, acting through its committees, has charged FMR and its affiliates with (i) identifying events or circumstances the occurrence of which could have demonstrably adverse effects on the fund's business and/or reputation; (ii) implementing processes and controls to lessen the possibility that such events or circumstances occur or to mitigate the effects of such events or circumstances if they do occur; and (iii) creating and maintaining a system designed to evaluate continuously business and market conditions in order to facilitate the identification and implementation processes described in (i) and (ii) above. Because the day-to-day operations and activities of the fund are carried out by or through FMR, its affiliates and other service providers, the fund's exposure to risks is mitigated but not eliminated by the processes overseen by the Trustees. While each of the Board's committees has responsibility for overseeing different aspects of the fund's activities, oversight is exercised primarily through the Operations, Audit, and Compliance Committees. Appropriate personnel, including but not limited to the fund's Chief Compliance Officer (CCO), FMR's internal auditor, the independent accountants, the fund's Treasurer and portfolio management personnel, make periodic reports to the Board's committees, as appropriate. The responsibilities of each committee, including their oversight responsibilities, are described further under "Standing Committees of the Fund's Trustees."
Annual Report
The fund's Statement of Additional Information (SAI) includes more information about the Trustees. To request a free copy, call Fidelity at 1-877-208-0098.
Interested Trustees*
Correspondence intended for each Trustee who is an interested person may be sent to Fidelity Investments, 82 Devonshire Street, Boston, Massachusetts 02109.
Name, Age; Principal Occupations and Other Relevant Experience+ |
Edward C. Johnson 3d (80) |
| Year of Election or Appointment: 1983 Mr. Johnson is Trustee and Chairman of the Board of Trustees of certain Trusts. Mr. Johnson serves as Chief Executive Officer, Chairman, and a Director of FMR LLC; Chairman and a Director of FMR; Chairman and a Director of Fidelity Research & Analysis Company (FRAC); Chairman and a Director of Fidelity Investments Money Management, Inc.; and Chairman and a Director of FMR Co., Inc. In addition, Mr. Johnson serves as Chairman and Director of FIL Limited. Previously, Mr. Johnson served as President of FMR LLC (2006-2007). |
James C. Curvey (75) |
| Year of Election or Appointment: 2007 Mr. Curvey also serves as Trustee (2007-present) of other investment companies advised by FMR. Mr. Curvey is a Director of Fidelity Investments Money Management, Inc. (2009-present), Director of Fidelity Research & Analysis Co. (2009-present) and Director of FMR and FMR Co., Inc. (2007-present). Mr. Curvey is also Vice Chairman (2007-present) and Director of FMR LLC. In addition, Mr. Curvey serves as an Overseer for the Boston Symphony Orchestra and a member of the Trustees of Villanova University. Previously, Mr. Curvey was the Vice Chairman (2006-2007) and Director (2000-2007) of FMR Corp. |
* Trustees have been determined to be "Interested Trustees" by virtue of, among other things, their affiliation with the trust or various entities under common control with FMR.
Annual Report
Trustees and Officers - continued
+ The information above includes each Trustee's principal occupation during the last five years and other information relating to the experience, attributes, and skills relevant to each Trustee's qualifications to serve as a Trustee, which led to the conclusion that each Trustee should serve as a Trustee for the fund.
Independent Trustees:
Correspondence intended for each Independent Trustee (that is, the Trustees other than the Interested Trustees) may be sent to Fidelity Investments, P.O. Box 55235, Boston, Massachusetts 02205-5235.
Name, Age; Principal Occupations and Other Relevant Experience+ |
Dennis J. Dirks (62) |
| Year of Election or Appointment: 2005 Prior to his retirement in May 2003, Mr. Dirks was Chief Operating Officer and a member of the Board of The Depository Trust & Clearing Corporation (DTCC). He also served as President, Chief Operating Officer, and Board member of The Depository Trust Company (DTC) and President and Board member of the National Securities Clearing Corporation (NSCC). In addition, Mr. Dirks served as Chief Executive Officer and Board member of the Government Securities Clearing Corporation, Chief Executive Officer and Board member of the Mortgage-Backed Securities Clearing Corporation, as a Trustee and a member of the Finance Committee of Manhattan College (2005-2008), and as a Trustee and a member of the Finance Committee of AHRC of Nassau County (2006-2008). Mr. Dirks is a member of the Independent Directors Council (IDC) Governing Council (2010-Present) and Board of Directors for The Brookville Center for Children's Services, Inc. (2009-present). |
Alan J. Lacy (57) |
| Year of Election or Appointment: 2008 Mr. Lacy serves as Senior Adviser (2007-present) of Oak Hill Capital Partners, L.P. (private equity). Mr. Lacy also served as Chief Executive Officer (2000-2005) and Vice Chairman (2005-2006) of Sears Holdings Corporation and Sears, Roebuck and Co. (retail). In addition, Mr. Lacy serves as a member of the Board of Directors of The Western Union Company (global money transfer, 2006-present) and Bristol-Myers Squibb Company (global pharmaceuticals, 2007-present). Mr. Lacy is Chairman (2008-present) and a member (2006-present) of the Board of Trustees of The National Parks Conservation Association. |
Ned C. Lautenbach (66) |
| Year of Election or Appointment: 2000 Mr. Lautenbach is Chairman of the Independent Trustees of the Equity and High Income Funds (2006-present). Mr. Lautenbach currently serves as the Lead Director of the Eaton Corporation Board of Directors (diversified industrial, 1997-present). Mr. Lautenbach is also a member of the Board of Directors of the Philharmonic Center for the Arts in Naples, Florida (1999-present); a member of the Board of Trustees of Fairfield University (2005-present); and a member of the Council on Foreign Relations (1994-present). Previously, Mr. Lautenbach was a Partner/Advisory Partner at Clayton, Dubilier & Rice, Inc. (private equity investment, 1998-2010), as well as a Director of Sony Corporation (2006-2007). |
Joseph Mauriello (66) |
| Year of Election or Appointment: 2008 Prior to his retirement in January 2006, Mr. Mauriello served in numerous senior management positions including Deputy Chairman and Chief Operating Officer (2004-2005), and Vice Chairman of Financial Services (2002-2004) of KPMG LLP US (professional services, 1965-2005). Mr. Mauriello currently serves as a member of the Board of Directors of XL Group plc. (global insurance and re-insurance, 2006-present) and of Arcadia Resources Inc. (health care services and products, 2007-present). Previously, Mr. Mauriello served as a Director of the Hamilton Funds of the Bank of New York (2006-2007). |
Cornelia M. Small (66) |
| Year of Election or Appointment: 2005 Ms. Small is a member of the Board of Directors of the Teagle Foundation (2009-present). Ms. Small is also a member of the Investment Committee, and Chair (2008-present) and a member of the Board of Trustees of Smith College. In addition, Ms. Small serves on the Investment Committee of the Berkshire Taconic Community Foundation (2008-present). Previously, Ms. Small served as Chairperson of the Investment Committee (2002-2008) of Smith College. In addition, Ms. Small served as Chief Investment Officer, Director of Global Equity Investments, and a member of the Board of Directors of Scudder, Stevens & Clark and Scudder Kemper Investments. |
William S. Stavropoulos (71) |
| Year of Election or Appointment: 2001 Mr. Stavropoulos is Vice Chairman of the Independent Trustees of the Equity and High Income Funds (2006-present). Mr. Stavropoulos serves as President and Founder of the Michigan Baseball Foundation, the Great Lakes Loons (2007-present). Mr. Stavropoulos is Chairman Emeritus of the Board of Directors of The Dow Chemical Company, where he previously served in numerous senior management positions, including President, CEO (1995-2000; 2002-2004), Chairman of the Executive Committee (2000-2006), and as a member of the Board of Directors (1990-2006). Currently, Mr. Stavropoulos is Chairman of Univar (global distributor of commodity and specialty chemicals, 2010-present), a Director of Teradata Corporation (data warehousing and technology solutions, 2008-present), Chemical Financial Corporation, Maersk Inc. (industrial conglomerate), Tyco International, Inc. (multinational manufacturing and services, 2007-present), and a member of the Advisory Board for Metalmark Capital (private equity investment, 2005- present). Mr. Stavropoulos is a special advisor to Clayton, Dubilier & Rice, Inc. (private equity investment). In addition, Mr. Stavropoulos is a member of the University of Notre Dame Advisory Council for the College of Science. |
David M. Thomas (61) |
| Year of Election or Appointment: 2008 Previously, Mr. Thomas served as Executive Chairman (2005-2006) and Chairman and Chief Executive Officer (2000-2005) of IMS Health, Inc. (pharmaceutical and healthcare information solutions). In addition, Mr. Thomas serves as a member of the Board of Directors of Fortune Brands, Inc. (consumer products), and Interpublic Group of Companies, Inc. (marketing communication, 2004-present). |
Michael E. Wiley (60) |
| Year of Election or Appointment: 2008 Mr. Wiley also serves as a Director of Asia Pacific Exploration Consolidated (international oil and gas exploration and production, 2008-present). Mr. Wiley serves as a Director of Tesoro Corporation (independent oil refiner and marketer, 2005-present), and a Director of Bill Barrett Corporation (exploration and production, 2005-present). In addition, Mr. Wiley also serves as a Director of Post Oak Bank (privately-held bank, 2004-present). Previously, Mr. Wiley served as a member of the Board of Trustees of the University of Tulsa (2000-2006; 2007-2010), as a Senior Energy Advisor of Katzenbach Partners, LLC (consulting, 2006-2007), as an Advisory Director of Riverstone Holdings (private investment), Chairman, President, and CEO of Baker Hughes, Inc. (oilfield services, 2000-2004), and as Director of Spinnaker Exploration Company (exploration and production, 2001-2005). |
Annual Report
+ The information above includes each Trustee's principal occupation during the last five years and other information relating to the experience, attributes, and skills relevant to each Trustee's qualifications to serve as a Trustee, which led to the conclusion that each Trustee should serve as a Trustee for the fund.
Advisory Board Member and Executive Officers:
Correspondence intended for each executive officer and Peter S. Lynch may be sent to Fidelity Investments, 82 Devonshire Street, Boston, Massachusetts 02109.
Name, Age; Principal Occupation |
Peter S. Lynch (66) |
| Year of Election or Appointment: 2003 Member of the Advisory Board of Fidelity's Equity and High Income Funds. Mr. Lynch is Vice Chairman and a Director of FMR and FMR Co., Inc. In addition, Mr. Lynch serves as a Trustee of Boston College and as the Chairman of the Inner-City Scholarship Fund. Previously, Mr. Lynch served on the Special Olympics International Board of Directors (1997-2006). |
Kenneth B. Robins (41) |
| Year of Election or Appointment: 2008 President and Treasurer of Fidelity's Equity and High Income Funds. Mr. Robins also serves as President and Treasurer (2010-present) and Assistant Treasurer (2009-present) of other Fidelity funds and is an employee of Fidelity Investments (2004-present). Previously, Mr. Robins served as Deputy Treasurer of the Fidelity funds (2005-2008) and Treasurer and Chief Financial Officer of The North Carolina Capital Management Trust: Cash and Term Portfolios (2006-2008). |
Bruce T. Herring (45) |
| Year of Election or Appointment: 2006 Vice President of certain Equity Funds. Mr. Herring also serves as Chief Investment Officer and Director of Fidelity Management & Research (U.K.) Inc. (2010-present) and Group Chief Investments Officer of FMR. Previously, Mr. Herring served as Vice President (2005-2006) and Senior Vice President (2006-2007) of Fidelity Management & Research Company, Vice President of FMR Co., Inc. (2001-2007) and as a portfolio manager for Fidelity U.S. Equity Funds. |
Brian B. Hogan (46) |
| Year of Election or Appointment: 2009 Vice President of certain Equity Funds and Vice President of Sector Funds. Mr. Hogan also serves as President of FMR's Equity Division (2009-present). Previously, Mr. Hogan served as Senior Vice President, Equity Research of FMR (2006-2009) and as a portfolio manager. |
Scott C. Goebel (42) |
| Year of Election or Appointment: 2008 Secretary and Chief Legal Officer (CLO) of the Fidelity funds. Mr. Goebel also serves as Secretary and CLO of The North Carolina Capital Management Trust: Cash and Term Portfolio (2008-present); General Counsel, Secretary, and Senior Vice President of FMR (2008-present) and FMR Co., Inc. (2008-present); Deputy General Counsel of FMR LLC; Chief Legal Officer of Fidelity Management & Research (Hong Kong) Limited (2008-present) and Assistant Secretary of Fidelity Management & Research (Japan) Inc. (2008-present), Fidelity Investments Money Management, Inc. (2008-present), Fidelity Management & Research (U.K.) Inc. (2008-present), and Fidelity Research and Analysis Company (2008-present). Previously, Mr. Goebel served as Assistant Secretary of the Funds (2007-2008) and as Vice President and Secretary of Fidelity Distributors Corporation (FDC) (2005-2007). |
William C. Coffey (41) |
| Year of Election or Appointment: 2009 Assistant Secretary of Fidelity's Equity and High Income Funds. Mr. Coffey also serves as Senior Vice President and Deputy General Counsel of FMR LLC (2010-present), and is an employee of Fidelity Investments. Previously, Mr. Coffey served as Vice President and Associate General Counsel of FMR LLC (2005-2009). |
Holly C. Laurent (56) |
| Year of Election or Appointment: 2008 Anti-Money Laundering (AML) Officer of the Fidelity funds. Ms. Laurent also serves as AML Officer of The North Carolina Capital Management Trust: Cash and Term Portfolio (2008-present) and is an employee of Fidelity Investments. Previously, Ms. Laurent was Senior Vice President and Head of Legal for Fidelity Business Services India Pvt. Ltd. (2006-2008), and Senior Vice President, Deputy General Counsel and Group Head for FMR LLC (2005-2006). |
Christine Reynolds (52) |
| Year of Election or Appointment: 2008 Chief Financial Officer of the Fidelity funds. Ms. Reynolds became President of Fidelity Pricing and Cash Management Services (FPCMS) in August 2008. Ms. Reynolds served as Chief Operating Officer of FPCMS (2007-2008). Previously, Ms. Reynolds served as President, Treasurer, and Anti-Money Laundering officer of the Fidelity funds (2004-2007). |
Kenneth A. Rathgeber (63) |
| Year of Election or Appointment: 2004 Chief Compliance Officer of Fidelity's Equity and High Income Funds. Mr. Rathgeber is Chief Compliance Officer of Fidelity Management & Research (Hong Kong) Limited (2008-present), Fidelity Management & Research (Japan) Inc. (2008-present), FMR (2005-present), FMR Co., Inc. (2005-present), Fidelity Management & Research (U.K.) Inc. (2005-present), Fidelity Research & Analysis Company (2005-present), Fidelity Investments Money Management, Inc. (2005-present), Pyramis Global Advisors, LLC (2005-present), and Strategic Advisers, Inc. (2005-present). |
Jeffrey S. Christian (49) |
| Year of Election or Appointment: 2009 Deputy Treasurer of the Fidelity funds. Mr. Christian is an employee of Fidelity Investments. Previously, Mr. Christian served as Chief Financial Officer (2008-2009) of certain Fidelity funds and Senior Vice President of Fidelity Pricing and Cash Management Services (FPCMS) (2004-2009). |
Bryan A. Mehrmann (49) |
| Year of Election or Appointment: 2005 Deputy Treasurer of the Fidelity funds. Mr. Mehrmann is an employee of Fidelity Investments. |
Adrien E. Deberghes (43) |
| Year of Election or Appointment: 2008 Deputy Treasurer of Fidelity's Equity and High Income Funds. Mr. Deberghes also serves as Assistant Treasurer of other Fidelity funds (2010-present) and is an employee of Fidelity Investments (2008-present). Previously, Mr. Deberghes served as Senior Vice President of Mutual Fund Administration at State Street Corporation (2007-2008), Senior Director of Mutual Fund Administration at Investors Bank & Trust (2005-2007), and Director of Finance for Dunkin' Brands (2000-2005). |
Stephanie J. Dorsey (41) |
| Year of Election or Appointment: 2010 Assistant Treasurer of Fidelity's Equity and High Income Funds. Ms. Dorsey also serves as Deputy Treasurer of other Fidelity funds (2008-present) and is an employee of Fidelity Investments (2008-present). Previously, Ms. Dorsey served as Treasurer (2004-2008) of the JPMorgan Mutual Funds and Vice President (2004-2008) of JPMorgan Chase Bank. |
John R. Hebble (52) |
| Year of Election or Appointment: 2009 Assistant Treasurer of Fidelity's Equity and High Income Funds. Mr. Hebble also serves as Treasurer and Chief Financial Officer of The North Carolina Capital Management Trust: Cash and Term Portfolio (2008-present), President and Treasurer of other Fidelity funds (2008-present) and is an employee of Fidelity Investments. |
Gary W. Ryan (52) |
| Year of Election or Appointment: 2005 Assistant Treasurer of the Fidelity funds. Mr. Ryan is an employee of Fidelity Investments. Previously, Mr. Ryan served as Vice President of Fund Reporting in Fidelity Pricing and Cash Management Services (FPCMS) (1999-2005). |
Jonathan Davis (42) |
| Year of Election or Appointment: 2010 Assistant Treasurer of the Fidelity funds. Mr. Davis is an employee of Fidelity Investments. Previously, Mr. Davis served as Vice President and Associate General Counsel of FMR LLC (2003-2010). |
Annual Report
The Board of Trustees of Fidelity Advisor Overseas Fund voted to pay to shareholders of record at the opening of business on record date, the following distributions per share derived from capital gains realized from sales of portfolio securities, and dividends derived from net investment income:
| Pay Date | Record Date | Dividends | Capital Gains |
Class A | 12/06/10 | 12/03/10 | $.210 | $.045 |
Class T | 12/06/10 | 12/03/10 | $.173 | $.045 |
Class B | 12/06/10 | 12/03/10 | $.079 | $.045 |
Class C | 12/06/10 | 12/03/10 | $.070 | $.045 |
Class A designates 100%, Class T designates 100%, Class B designates 100%, and Class C designates 100% of the dividends distributed during the fiscal year as amounts which may be taken into account as a dividend for purposes of the maximum rate under section 1(h)(11) of the Internal Revenue Code.
The amounts per share which represent income derived from sources within, and taxes paid to, foreign countries or possessions of the United States are as follows:
| Pay Date | Income | Taxes |
Class A | 12/07/09 | $.200 | $.0190 |
Class T | 12/07/09 | $.182 | $.0190 |
Class B | 12/07/09 | $.104 | $.0190 |
Class C | 12/07/09 | $.120 | $.0190 |
The fund will notify shareholders in January 2011 of amounts for use in preparing 2010 income tax returns.
Annual Report
Board Approval of Investment Advisory Contracts and Management Fees
Fidelity Advisor Overseas Fund
Each year, the Board of Trustees, including the Independent Trustees (together, the Board), votes on the renewal of the management contract and sub-advisory agreements (together, the Advisory Contracts) for the fund. The Board, assisted by the advice of fund counsel and Independent Trustees' counsel, requests and considers a broad range of information relevant to the renewal of the Advisory Contracts throughout the year.
The Board meets regularly and considers at each of its meetings factors that are relevant to its annual consideration of the renewal of the fund's Advisory Contracts, including the services and support provided to the fund and its shareholders. The Board has established various standing committees, each composed of Independent Trustees with varying backgrounds, to which the Board has assigned specific subject matter responsibilities in order to enhance effective decision-making by the Board. The Board, acting directly and through its Committees, requests and receives information concerning the annual consideration of the renewal of the fund's Advisory Contracts. The Board also meets as needed to consider matters specifically related to the Board's annual consideration of the renewal of Advisory Contracts. Members of the Board may also meet with trustees of other Fidelity funds through ad hoc joint committees to discuss certain matters relevant to the Fidelity funds.
At its July 2010 meeting, the Board of Trustees, including the Independent Trustees, unanimously determined to renew the fund's Advisory Contracts. In reaching its determination, the Board considered all factors it believed relevant, including (i) the nature, extent, and quality of the services to be provided to the fund and its shareholders (including the investment performance of the fund); (ii) the competitiveness of the fund's management fee and total expenses; (iii) the total costs of the services to be provided by and the profits to be realized by Fidelity from its relationship with the fund; (iv) the extent to which economies of scale would be realized as the fund grows; and (v) whether fee levels reflect these economies of scale, if any, for the benefit of fund shareholders.
In considering whether to renew the Advisory Contracts for the fund, the Board reached a determination, with the assistance of fund counsel and Independent Trustees' counsel and through the exercise of its business judgment, that the renewal of the Advisory Contracts is in the best interests of fund shareholders and that the compensation to be received by Fidelity under the management contract is fair and reasonable. The Board's decision to renew the Advisory Contracts was not based on any single factor noted above, but rather was based on a comprehensive consideration of all the information provided to the Board at its meetings throughout the year. The Board, in reaching its determination to renew the Advisory Contracts, is aware that shareholders in the fund have a broad range of investment choices available to them, including a wide choice among mutual funds offered by Fidelity's competitors, and that the fund's shareholders, with the opportunity to review and weigh the disclosure provided by the fund in its prospectus and other public disclosures, have chosen to invest in this fund, managed by Fidelity.
Annual Report
Nature, Extent, and Quality of Services Provided. The Board considered the staffing within the investment adviser, FMR, and the sub-advisers (together, the Investment Advisers), including the backgrounds of the fund's investment personnel and the fund's investment objective and discipline. The Independent Trustees also had discussions with senior management of Fidelity's investment operations and investment groups. The Board considered the structure of the portfolio manager compensation program and whether this structure provides appropriate incentives to act in the best interest of the fund.
Resources Dedicated to Investment Management and Support Services. The Board and the equity research subcommittee of the Board's Fund Oversight Committee reviewed the size, education, and experience of the Investment Advisers' investment staff, their use of technology, and the Investment Advisers' approach to recruiting, training, and retaining portfolio managers and other research, advisory, and management personnel. The Board noted that Fidelity's analysts have access to a variety of technological tools and market and securities data that enable them to perform both fundamental and quantitative analysis and to specialize in various disciplines. The Board considered Fidelity's extensive global research capabilities that enable the Investment Advisers to aggregate data from various sources in an effort to produce positive investment results. The Board also considered that Fidelity's portfolio managers and analysts have access to daily portfolio attribution that allows for monitoring of a fund's portfolio, as well as an electronic communication system that provides immediate real-time access to research concerning issuers and credit enhancers. The Board noted FMR's continued focus on strengthening the organization and discipline of equity portfolio management and research.
Shareholder and Administrative Services. The Board considered (i) the nature, extent, quality, and cost of advisory, administrative, and shareholder services performed by the Investment Advisers and their affiliates under the Advisory Contracts and under separate agreements covering transfer agency, pricing and bookkeeping, and securities lending services for the fund; (ii) the nature and extent of the investment adviser's supervision of third party service providers, principally custodians and subcustodians; and (iii) the resources devoted to, and the record of compliance with, the fund's compliance policies and procedures. The Board also reviewed the allocation of fund brokerage, including allocations to brokers affiliated with the Investment Advisers, the use of brokerage commissions to pay fund expenses, and the use of "soft" commission dollars to pay for research services.
The Board noted that the growth of fund assets over time across the complex allows Fidelity to reinvest in the development of services designed to enhance the value or convenience of the Fidelity funds as investment vehicles. These services include 24-hour access to account information and market information through phone representatives and over the Internet, and investor education materials and asset allocation tools.
Annual Report
Board Approval of Investment Advisory Contracts and
Management Fees - continued
Investment in a Large Fund Family. The Board considered the benefits to shareholders of investing in a Fidelity fund, including the benefits of investing in a fund that is part of a large family of funds offering a variety of investment disciplines and providing a large variety of mutual fund investor services. The Board noted that Fidelity had taken, or had made recommendations that resulted in the Fidelity funds taking, a number of actions over the previous year that benefited particular funds, including (i) dedicating additional resources to investment research and restructuring and broadening the focus of the investment research teams; (ii) bolstering the senior management team that oversees asset management; (iii) launching Class F of certain funds as a lower-fee class available to Freedom K and Freedom Index Funds; (iv) lowering the initial investment minimums and ongoing balance requirements for Real Estate High Income Fund; (v) eliminating subsequent purchase minimums for all funds and adding a waiver of the investment minimum requirement for new accounts opened with the proceeds of a systematic withdrawal plan; (vi) eliminating the withdrawal minimum and maximum limits for systematic withdrawals from Advisor funds; (vii) expanding sales load waivers on Class A shares for Destiny Planholders and expanding Institutional Class eligibility for Class O Destiny Planholders; and (viii) changing certain Class A and Class T sales charge structures to further align them with industry practices.
Investment Performance. The Board considered whether the fund has operated in accordance with its investment objective, as well as its record of compliance with its investment restrictions. It also reviewed the fund's absolute investment performance for each class, as well as the fund's relative investment performance for each class measured over multiple periods against (i) a broad-based securities market index, and (ii) a peer group of mutual funds deemed appropriate by Fidelity and reviewed by the Board. The following charts considered by the Board show, over the one-, three-, and five-year periods ended December 31, 2009, the cumulative total returns of Institutional Class (Class I) and Class B of the fund, the cumulative total returns of a broad-based securities market index ("benchmark"), and a range of cumulative total returns of a peer group of mutual funds identified by Morningstar, Inc. as having an investment style similar to that of the fund based on underlying portfolio holdings. The returns of Institutional Class (Class I) and Class B show the performance of the highest and lowest performing classes, respectively (based on five-year performance). The box within each chart shows the 25th percentile return (bottom of box) and the 75th percentile return (top of box) of the peer group. Returns shown above the box are in the first quartile and returns shown below the box are in the fourth quartile. The percentage beaten numbers noted below each chart correspond to the percentile box and represent the percentage of funds in the peer group whose performance was equal to or lower than that of the class indicated.
Annual Report
Fidelity Advisor Overseas Fund
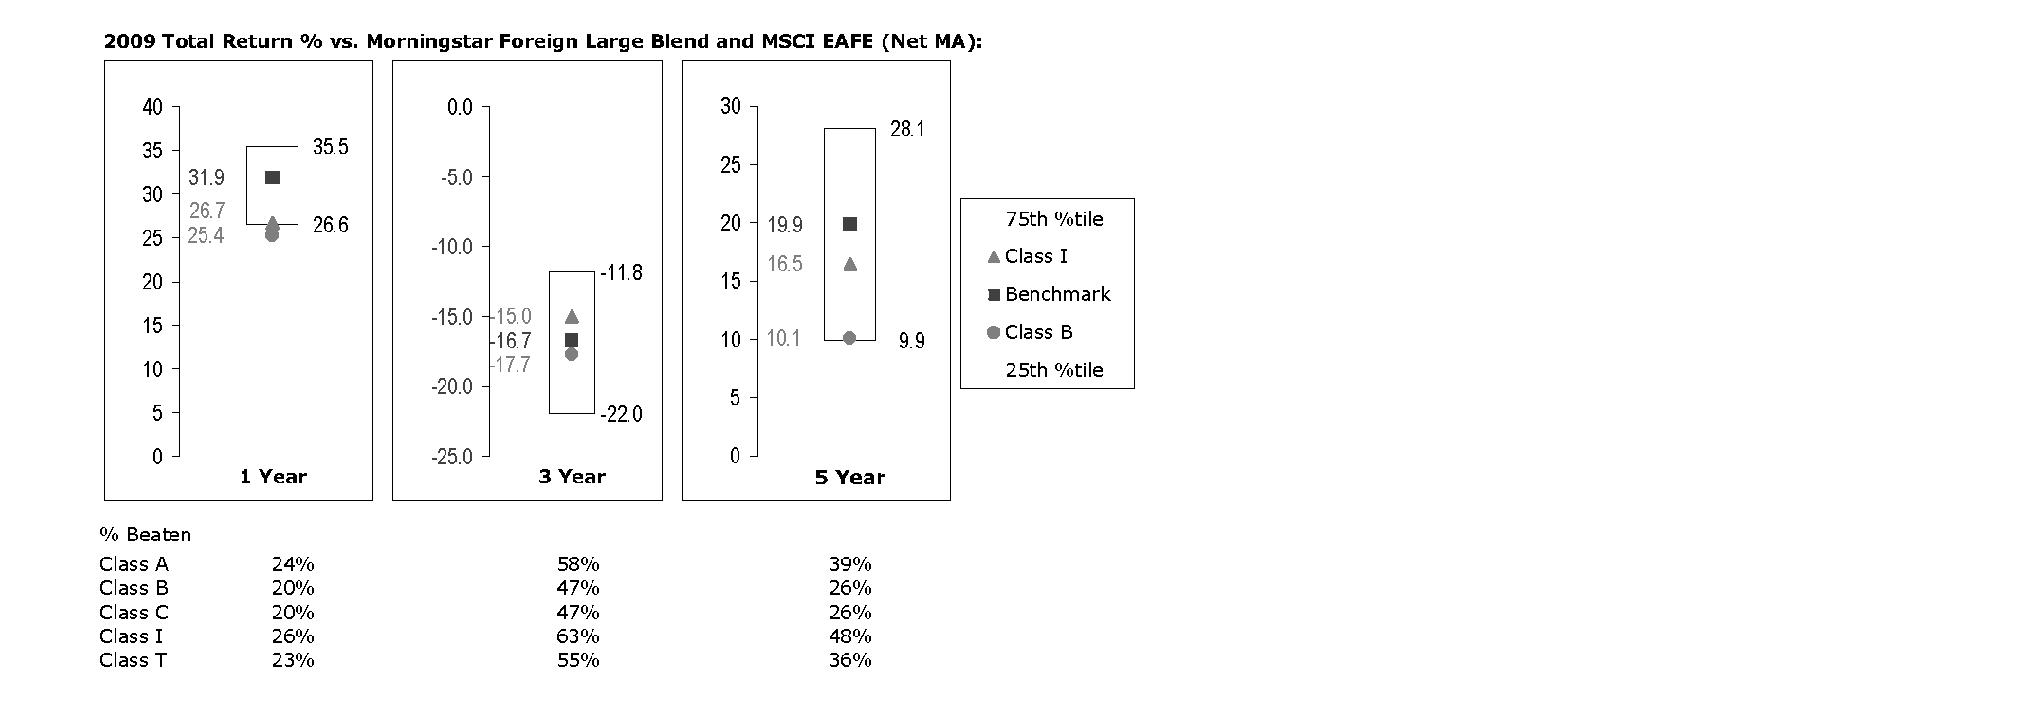
The Board reviewed the fund's relative investment performance against its peer group and noted that the performance of Institutional Class (Class I) of the fund was in the third quartile for the one- and five-year periods and the second quartile for the three-year period. The Board also noted that the investment performance of the fund was lower than its benchmark for the one- and five-year periods, although the three-year cumulative total return of Institutional Class (Class I) compared favorably to its benchmark. The Board considered that the variations in performance among the fund's classes reflect the variations in class expenses, which result in lower performance for higher expense classes. The Board also reviewed the fund's performance since inception as well as performance in the current year.
The Board also considered that the fund's management fee is subject to upward or downward adjustment depending upon whether, and to what extent, the fund's investment performance for the performance period exceeds, or is exceeded by, the record (over the same period) of a Board-approved performance adjustment index. The Board realizes that the performance adjustment provides FMR with a strong economic incentive to seek to achieve superior performance for the fund's shareholders and helps to more closely align the interests of FMR and the fund's shareholders.
Based on its review, and giving particular weight to the nature and quality of the resources dedicated by the Investment Advisers to maintain and improve relative performance and factoring in the unprecedented market events in recent years, the Board concluded that the nature, extent, and quality of investment management and support services and of shareholder and administrative services provided to the fund will benefit the fund's shareholders, particularly in light of the Board's view that the fund's shareholders benefit from investing in a fund that is part of a large family of funds offering a variety of investment disciplines and services.
Annual Report
Board Approval of Investment Advisory Contracts and
Management Fees - continued
Competitiveness of Management Fee and Total Fund Expenses. The Board considered the fund's management fee and total expenses compared to "mapped groups" of competitive funds and classes. Fidelity creates "mapped groups" by combining similar Lipper investment objective categories that have comparable management fee characteristics. Combining Lipper investment objective categories aids the Board's management fee and total expense comparisons by broadening the competitive group used for comparison and by reducing the number of universes to which various Fidelity funds are compared.
Management Fee. The Board considered two proprietary management fee comparisons for the 12-month periods shown in the chart below. The group of Lipper funds used by the Board for management fee comparisons is referred to below as the "Total Mapped Group." The Total Mapped Group comparison focuses on a fund's standing relative to the total universe of comparable funds available to investors, in terms of gross management fees before expense reimbursements or caps, and without giving effect to the fund's performance adjustment. "TMG %" represents the percentage of funds in the Total Mapped Group that had management fees that were lower than the fund's. For example, a TMG % of 15% means that 85% of the funds in the Total Mapped Group had higher management fees than the fund. The "Asset-Size Peer Group" (ASPG) comparison focuses on a fund's standing relative to non-Fidelity funds similar in size to the fund within the Total Mapped Group. The ASPG represents at least 15% of the funds in the Total Mapped Group with comparable asset size and management fee characteristics, subject to a minimum of 50 funds (or all funds in the Total Mapped Group if fewer than 50). Additional information, such as the ASPG quartile in which the fund's management fee ranked and the impact of the fund's performance adjustment, is also included in the chart and considered by the Board.
Annual Report
Fidelity Advisor Overseas Fund
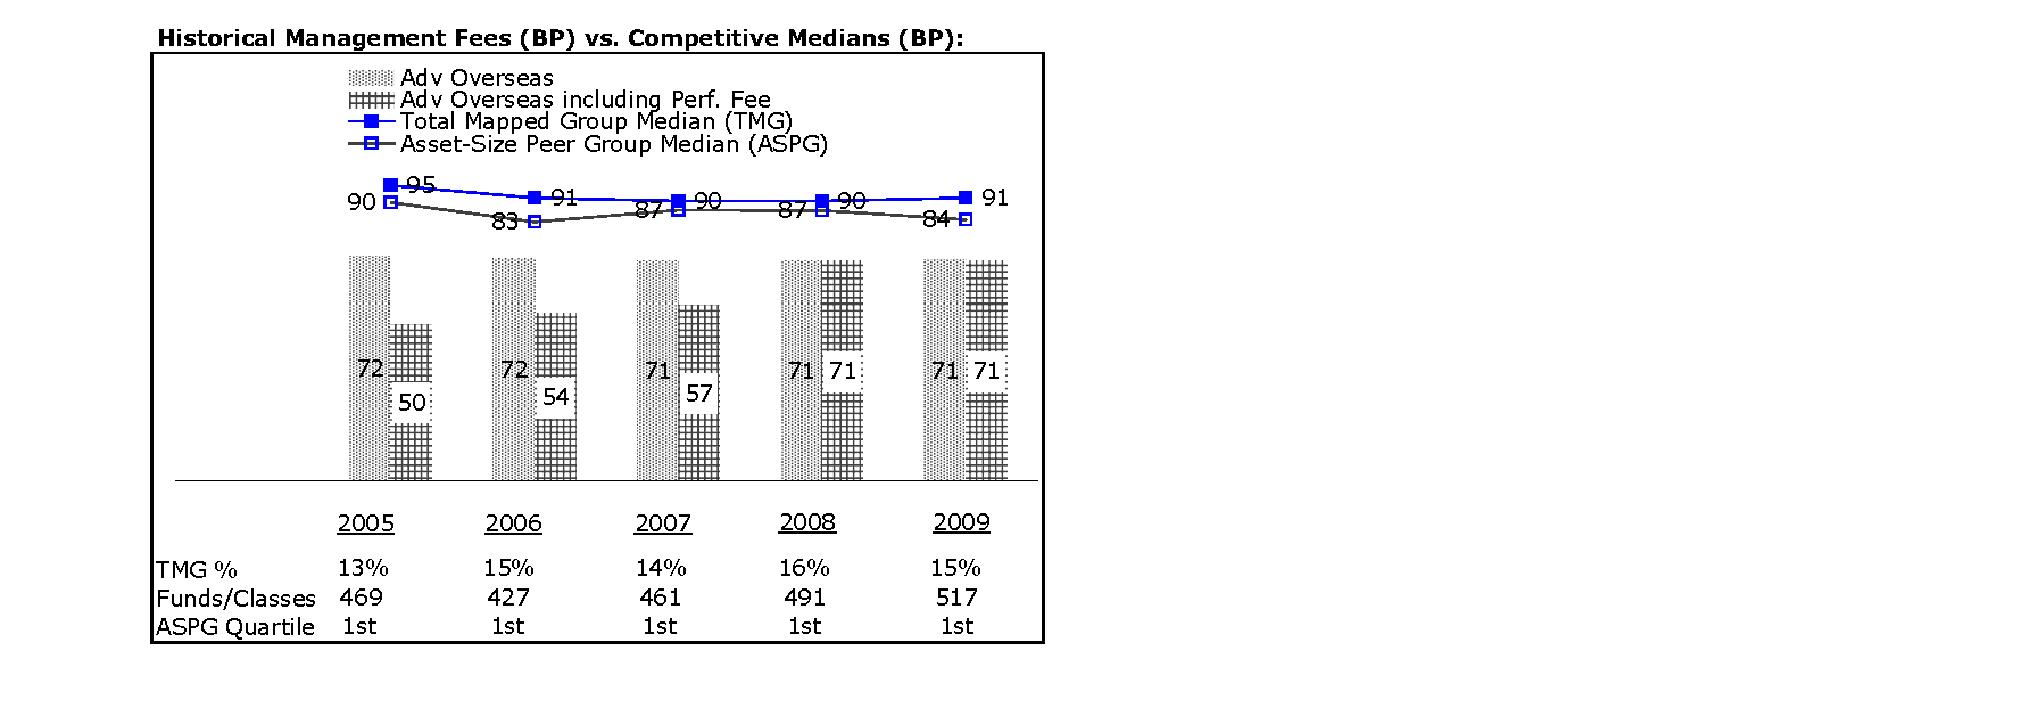
The Board noted that the fund's management fee ranked below the median of its Total Mapped Group and below the median of its ASPG for 2009. The Board also noted the effect of the fund's performance adjustment on the fund's management fee ranking. The Board noted that the performance adjustment for each year represents calculations for performance periods that differ from the periods shown in the performance charts above.
Based on its review, the Board concluded that the fund's management fee is fair and reasonable in light of the services that the fund receives and the other factors considered.
Total Expenses. In its review of each class's total expenses, the Board considered the fund's management fee as well as other fund or class expenses, as applicable, such as transfer agent fees, pricing and bookkeeping fees, fund-paid 12b-1 fees, and custodial, legal, and audit fees. The Board also noted the effects of any waivers and reimbursements on fees and expenses, as well as the impact of the fund's performance adjustment. As part of its review, the Board also considered current and historical total expenses of each class of the fund compared to competitive fund median expenses. Each class of the fund is compared to those funds and classes in the Total Mapped Group (used by the Board for management fee comparisons) that have a similar sales load structure.
The Board noted that the total expenses of each of Class A, Class B, Class C, and Institutional Class ranked below its competitive median for 2009 and the total expenses of Class T ranked above its competitive median for 2009. The Board considered that the total expenses for Class T were above the median primarily because its 12b-1 fee is higher than the typical front-end load class. The Board noted that the fund offers multiple classes, each of which has a different sales load and 12b-1 fee structure, and that the multiple structures are intended to offer a range of pricing options for the intermediary market. The Board also noted that the total expenses of the classes vary primarily by the level of their 12b-1 fees, although differences in transfer agent fees may also cause expenses to vary from class to class.
Annual Report
Board Approval of Investment Advisory Contracts and
Management Fees - continued
Fees Charged to Other Fidelity Clients. The Board also considered Fidelity fee structures and other information with respect to clients of FMR and its affiliates, such as other mutual funds advised or subadvised by FMR or its affiliates, pension plan clients, and other institutional clients. In March 2010, the Board created an ad hoc joint committee with the board of other Fidelity funds (the Committee) to review and compare Fidelity's institutional investment advisory business with its business of providing services to the Fidelity funds, including the differences in services provided, fees charged, and costs incurred, as well as competition in their respective marketplaces.
Based on its review of total expenses and fees charged to other Fidelity clients, the Board concluded that the total expenses of each class of the fund were reasonable, although in one case above the median of the universe presented for comparison, in light of the services that the fund and its shareholders receive and the other factors considered, including the findings of the Committee.
Costs of the Services and Profitability. The Board considered the revenues earned and the expenses incurred by Fidelity in conducting the business of developing, marketing, distributing, managing, administering and servicing the fund and its shareholders. The Board also considered the level of Fidelity's profits in respect of all the Fidelity funds.
On an annual basis, FMR presents to the Board Fidelity's profitability for the fund. Fidelity calculates the profitability for each fund, as well as aggregate profitability for groups of Fidelity funds and all Fidelity funds, using a series of detailed revenue and cost allocation methodologies which originate with the audited books and records of Fidelity. The Audit Committee of the Board reviews any significant changes from the prior year's methodologies.
PricewaterhouseCoopers LLP (PwC), independent registered public accounting firm and auditor to Fidelity and certain Fidelity funds, has been engaged annually by the Board as part of the Board's assessment of Fidelity's profitability analysis. PwC's engagement includes the review and assessment of Fidelity's methodologies used in determining the revenues and expenses attributable to Fidelity's mutual fund business, and completion of agreed-upon procedures surrounding the mathematical accuracy of fund profitability and its conformity to allocation methodologies. After considering PwC's reports issued under the engagement and information provided by Fidelity, the Board believes that while other allocation methods may also be reasonable, Fidelity's profitability methodologies are reasonable in all material respects.
Annual Report
The Board has also reviewed Fidelity's non-fund businesses and fall-out benefits related to the mutual fund business as well as cases where Fidelity's affiliates may benefit from or be related to the fund's business.
The Board considered the costs of the services provided by and the profits realized by Fidelity in connection with the operation of the fund and were satisfied that the profitability was not excessive in the circumstances.
Economies of Scale. The Board considered whether there have been economies of scale in respect of the management of the Fidelity funds, whether the Fidelity funds (including the fund) have appropriately benefited from any such economies of scale, and whether there is potential for realization of any further economies of scale. The Board considered the extent to which the fund will benefit from economies of scale through increased services to the fund, through waivers or reimbursements, or through fee or expense reductions.
In February 2009, the Board and the board of other Fidelity funds created an ad hoc committee (the Economies of Scale Committee) to analyze whether FMR attains economies of scale in respect of the management and servicing of the Fidelity funds, whether the Fidelity funds have appropriately benefited from such economies of scale, and whether there is potential for realization of any further economies of scale.
The Board recognized that the fund's management contract incorporates a "group fee" structure, which provides for lower group fee rates as total fund assets under FMR's management increase, and for higher group fee rates as total fund assets under FMR's management decrease. FMR calculates the group fee rates based on a tiered asset "breakpoint" schedule that varies based on asset class. The Board considered that the group fee is designed to deliver the benefits of economies of scale to fund shareholders when total Fidelity fund assets increase, even if assets of any particular fund are unchanged or have declined, because some portion of Fidelity's costs are attributable to services provided to all Fidelity funds, and all funds benefit if those costs can be allocated among more assets. The Board concluded that, given the group fee structure, fund shareholders will benefit from lower management fees as assets under FMR's management increase at the fund complex level, regardless of whether Fidelity achieves any such economies of scale.
The Board concluded, considering the findings of the Economies of Scale Committee, that any potential economies of scale are being appropriately shared between fund shareholders and Fidelity.
Additional Information Requested by the Board. In order to develop fully the factual basis for consideration of the Fidelity funds' Advisory Contracts, the Board requested and received additional information on certain topics, including (i) fund performance trends, actions to be taken by FMR to improve certain funds' overall performance, and Fidelity's long-term strategies for certain funds; (ii) portfolio manager changes that have occurred during the past year and length of portfolio manager tenure for different categories of funds over time; (iii) Fidelity's compensation structure for portfolio managers, research analysts, and other key personnel, the rationale for the compensation structure, and how the compensation structure provides appropriate performance incentives; (iv) the amount of the investment that each portfolio manager has made in the Fidelity fund(s) that he or she manages; (v) management and other fees paid by FMR to affiliated sub-advisers on behalf of the Fidelity funds; (vi) Fidelity's fee structures and rationale for recommending different fees among different categories of funds; (vii) Fidelity's rationale for recommending which funds should have a performance adjustment component as part of their management fees; (viii) the rationale for any differences between fund fee structures and fee structures in place for other Fidelity clients; and (ix) explanations regarding the relative total expenses borne by certain funds and classes, total expense competitive trends, and actions that might be taken by FMR to reduce total expenses for certain funds and classes.
Annual Report
Board Approval of Investment Advisory Contracts and
Management Fees - continued
Based on its evaluation of all of the conclusions noted above, and after considering all factors it believed relevant, the Board ultimately concluded that the advisory fee structures are fair and reasonable, and that the fund's Advisory Contracts should be renewed.
Annual Report
Investment Adviser
Fidelity Management & Research Company
Boston, MA
Investment Sub-Advisers
FMR Co., Inc.
Fidelity Management & Research
(U.K.) Inc.
Fidelity Research & Analysis Company
Fidelity Management & Research
(Hong Kong) Limited
FIL Investments (Japan) Limited
Fidelity Management & Research
(Japan) Inc.
FIL Investment Advisors (UK) Limited
FIL Investment Advisors
General Distributor
Fidelity Distributors Corporation
Boston, MA
Transfer and Service Agents
Fidelity Investments Institutional
Operations Company, Inc.
Boston, MA
Fidelity Service Company, Inc.
Boston, MA
Custodian
The Northern Trust Company
Chicago, IL
OS-UANN-1210
1.784767.107
(Fidelity Investment logo)(registered trademark)
Fidelity AdvisorSM
Overseas
Fund - Institutional Class
Annual Report
October 31, 2010
(2_fidelity_logos) (Registered_Trademark)
Contents
Chairman's Message | <Click Here> | The Chairman's message to shareholders. |
Performance | <Click Here> | How the fund has done over time. |
Management's Discussion of Fund Performance | <Click Here> | The Portfolio Manager's review of fundperformance and strategy. |
Shareholder Expense Example | <Click Here> | An example of shareholder expenses. |
Investment Changes | <Click Here> | A summary of major shifts in the fund's investments over the past six months. |
Investments | <Click Here> | A complete list of the fund's investments with their market values. |
Financial Statements | <Click Here> | Statements of assets and liabilities, operations, and changes in net assets,
as well as financial highlights. |
Notes | <Click Here> | Notes to the financial statements. |
Report of Independent Registered Public Accounting Firm | <Click Here> | |
Trustees and Officers | <Click Here> | |
Distributions | <Click Here> | |
Board Approval of Investment Advisory Contracts and Management Fees | <Click Here> | |
To view a fund's proxy voting guidelines and proxy voting record for the 12-month period ended June 30, visit http://www.fidelity.com/proxyvotingresults or visit the Securities and Exchange Commission's (SEC) web site at http://www.sec.gov. You may also call 1-877-208-0098 to request a free copy of the proxy voting guidelines.
Standard & Poor's, S&P and S&P 500 are registered service marks of The McGraw-Hill Companies, Inc. and have been licensed for use by Fidelity Distributors Corporation.
Other third party marks appearing herein are the property of their respective owners.
All other marks appearing herein are registered or unregistered trademarks or service marks of FMR LLC or an affiliated company.
Annual Report
This report and the financial statements contained herein are submitted for the general information of the shareholders of the fund. This report is not authorized for distribution to prospective investors in the fund unless preceded or accompanied by an effective prospectus.
A fund files its complete schedule of portfolio holdings with the SEC for the first and third quarters of each fiscal year on Form N-Q. Forms N-Q are available on the SEC's web site at http://www.sec.gov. A fund's Forms N-Q may be reviewed and copied at the SEC's Public Reference Room in Washington, DC. Information regarding the operation of the SEC's Public Reference Room may be obtained by calling 1-800-SEC-0330. For a complete list of a fund's portfolio holdings, view the most recent holdings listing, semiannual report, or annual report on Fidelity's web site at http://www.fidelity.com or http://www.advisor.fidelity.com, as applicable.
NOT FDIC INSURED • MAY LOSE VALUE • NO BANK GUARANTEE
Neither the fund nor Fidelity Distributors Corporation is a bank.
Annual Report
(photo_of_Edward_C_Johnson_3d)
Dear Shareholder:
Equities have staged a rally in the second half of 2010, shaking off concerns about the European debt crisis and the possibility of a double-dip recession in the U.S. Although the short-term surge pushed major equity indexes back into positive territory for the year, several questions remain about the longer-term outlook, including lackluster economic growth and persistently high unemployment. Financial markets are always unpredictable, of course, but there also are several time-tested investment principles that can help put the odds in your favor.
One of the basic tenets is to invest for the long term. Over time, riding out the markets' inevitable ups and downs has proven much more effective than selling into panic or chasing the hottest trend. Even missing only a few of the markets' best days can significantly diminish investor returns. Patience also affords the benefits of compounding - of earning interest on additional income or reinvested dividends and capital gains. There can be tax advantages and cost benefits to consider as well. While staying the course doesn't eliminate risk, it can considerably lessen the effect of short-term declines.
You can further manage your investing risk through diversification. And today, more than ever, geographic diversification should be taken into account. Studies indicate that asset allocation is the single most important determinant of a portfolio's long-term success. The right mix of stocks, bonds and cash - aligned to your particular risk tolerance and investment objective - is very important. Age-appropriate rebalancing is also an essential aspect of asset allocation. For younger investors, an emphasis on equities - which historically have been the best-performing asset class over time - is encouraged. As investors near their specific goal, such as retirement or sending a child to college, consideration may be given to replacing volatile assets (e.g. common stocks) with more-stable fixed investments (bonds or savings plans).
A third principle - investing regularly - can help lower the average cost of your purchases. Investing a certain amount of money each month or quarter helps ensure you won't pay for all your shares at market highs. This strategy - known as dollar cost averaging - also reduces "emotion" from investing, helping shareholders avoid selling weak performers just prior to an upswing, or chasing a hot performer just before a correction.
We invite you to contact us via the Internet, through our Investor Centers or by phone. It is our privilege to provide you the information you need to make the investments that are right for you.
Sincerely,
(The chairman's signature appears here.)
Edward C. Johnson 3d
Annual Report
Average annual total return reflects the change in the value of an investment, assuming reinvestment of the class' distributions from dividend income and capital gains (the profits earned upon the sale of securities that have grown in value, if any) and assuming a constant rate of performance each year. The $10,000 table and the fund's returns do not reflect the deduction of taxes that a shareholder would pay on fund distributions or the redemption of fund shares. During periods of reimbursement by Fidelity, a fund's total return will be greater than it would be had the reimbursement not occurred. How a fund did yesterday is no guarantee of how it will do tomorrow.
Average Annual Total Returns
Periods ended October 31, 2010 | | Past 1
year | Past 5
years | Past 10
years |
Institutional Class | | 15.49% | 3.83% | 2.61% |
$10,000 Over 10 Years
Let's say hypothetically that $10,000 was invested in Fidelity AdvisorSM Overseas Fund - Institutional Class on October 31, 2000. The chart shows how the value of your investment would have changed, and also shows how the MSCI® EAFE® Index (Europe, Australasia, Far East) performed over the same period.
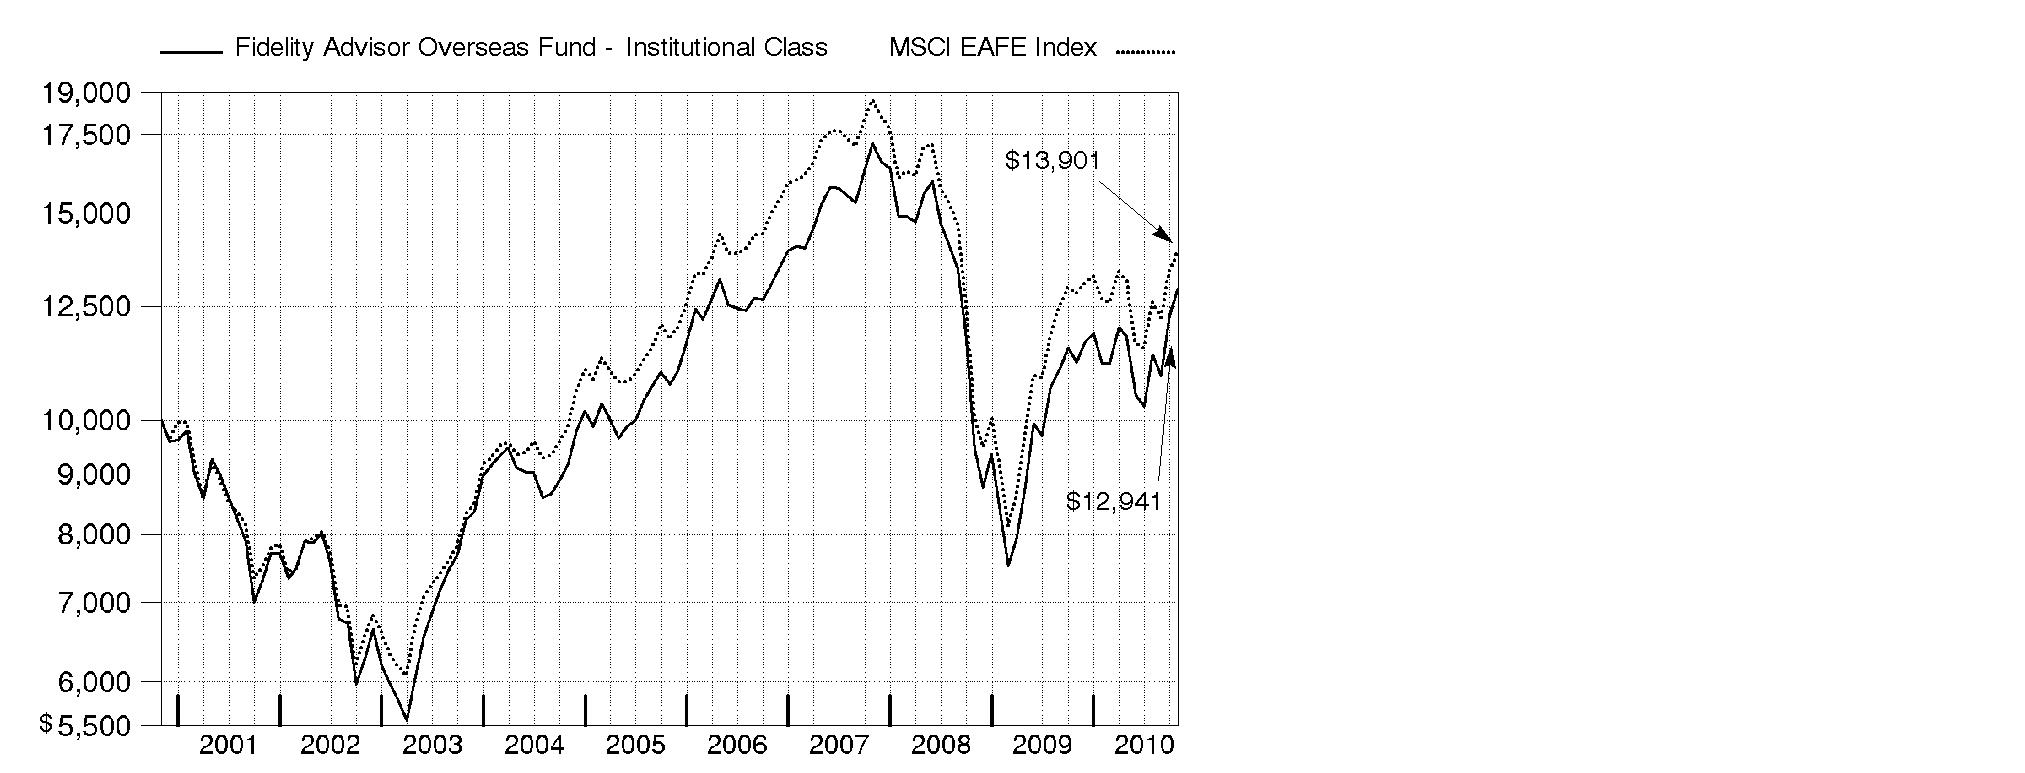
Annual Report
Market Recap: International stocks rode a wave of volatility similar to that of their U.S. counterparts during the 12 months ending October 31, 2010. Stocks gained modestly in the first half of the period, despite growing concerns about the European debt crisis. Sentiment turned decidedly negative in May and June, however, and the market suffered a precipitous decline. These losses were more than offset during the last four months of the period, when signs of economic growth and subsiding debt fears helped propel international stocks about 21%. For the full year, the MSCI® ACWI® (All Country World Index) ex USA Index gained 12.76%, boosted in part by a generally depreciating U.S. dollar. Within the index, Canada and emerging markets were standouts, each returning 24%. Results in the latter group were led by strong-performing India, Mexico and South Africa, while China fell short of the MSCI benchmark due to cooling economic growth. The developed Asia ex Japan segment rose 16% for the period, lifted by solid results from Singapore and Hong Kong. Meanwhile, Europe rose just 9%, held back mainly by debt-riddled Spain and Italy, as well as lagging major constituent France. Japan returned only 5%, a result of that nation's continued weak economy.
Comments from Graeme Rockett, Portfolio Manager of Fidelity AdvisorSM Overseas Fund: For the 12 months ending October 31, 2010, the fund's Institutional Class shares returned 15.49%, outperforming the MSCI EAFE® Index, which rose 8.49%. Stock picking was especially effective in consumer discretionary, where an overweighting also helped, and in information technology, health care and consumer staples. However, underweightings in consumer staples and telecommunication services detracted. Contributing stocks included luxury goods companies, such as France's LVMH (leather goods, champagne) and Switzerland's Swatch Group (watches). Four out-of-benchmark investments also helped: Baidu, the dominant Internet search provider in China; Clicks Group, a South African health and beauty retailer; Bosideng International Holding, a Chinese clothing company; and Elekta, a Swedish medical equipment firm. Detractors included Scientific Games, a U.S. gaming company; Ireland-based CRH, a supplier of building materials; and Nestle, a Swiss food giant that we underweighted. Central European Media Enterprises, a Bermuda-listed broadcaster, also hurt performance. Some of the above stocks were sold during the period.
The views expressed above reflect those of the portfolio manager(s) only through the end of the period as stated on the cover of this report and do not necessarily represent the views of Fidelity or any other person in the Fidelity organization. Any such views are subject to change at any time based upon market or other conditions and Fidelity disclaims any responsibility to update such views. These views may not be relied on as investment advice and, because investment decisions for a Fidelity fund are based on numerous factors, may not be relied on as an indication of trading intent on behalf of any Fidelity fund.
Annual Report
Shareholder Expense Example
As a shareholder of the Fund, you incur two types of costs: (1) transaction costs, including sales charges (loads) on purchase payments or redemption proceeds, redemption fees, and (2) ongoing costs, including management fees, distribution and/or service (12b-1) fees and other Fund expenses. This Example is intended to help you understand your ongoing costs (in dollars) of investing in the Fund and to compare these costs with the ongoing costs of investing in other mutual funds.
The Example is based on an investment of $1,000 invested at the beginning of the period and held for the entire period (May 1, 2010 to October 31, 2010).
Actual Expenses
The first line of the accompanying table for each class of the Fund provides information about actual account values and actual expenses. You may use the information in this line, together with the amount you invested, to estimate the expenses that you paid over the period. Simply divide your account value by $1,000.00 (for example, an $8,600 account value divided by $1,000.00 = 8.6), then multiply the result by the number in the first line for a class of the Fund under the heading entitled "Expenses Paid During Period" to estimate the expenses you paid on your account during this period. In addition, the Fund, as a shareholder in the underlying Fidelity Central Funds, will indirectly bear its pro-rata share of the fees and expenses incurred by the underlying Fidelity Central Funds. These fees and expenses are not included in the Fund's annualized expense ratio used to calculate the expense estimate in the table below.
Hypothetical Example for Comparison Purposes
The second line of the accompanying table for each class of the Fund provides information about hypothetical account values and hypothetical expenses based on a Class' actual expense ratio and an assumed rate of return of 5% per year before expenses, which is not the Class' actual return. The hypothetical account values and expenses may not be used to estimate the actual ending account balance or expenses you paid for the period. You may use this information to compare the ongoing costs of investing in the Fund and other funds. To do so, compare this 5% hypothetical example with the 5% hypothetical examples that appear in the shareholder reports of the other funds. In addition, the Fund, as a shareholder in the underlying Fidelity Central Funds, will indirectly bear its pro-rata share of the fees and expenses incurred by the underlying Fidelity Central Funds. These fees and expenses are not included in the Fund's annualized expense ratio used to calculate the expense estimate in the table below.
Please note that the expenses shown in the table are meant to highlight your ongoing costs only and do not reflect any transaction costs. Therefore, the second line of the table is useful in comparing ongoing costs only, and will not help you determine the relative total costs of owning different funds. In addition, if these transactional costs were included, your costs would have been higher.
Annual Report
| Annualized
Expense Ratio | Beginning
Account Value
May 1, 2010 | Ending
Account Value
October 31, 2010 | Expenses Paid
During Period*
May 1, 2010 to
October 31, 2010 |
Class A | 1.33% | | | |
Actual | | $ 1,000.00 | $ 1,094.20 | $ 7.02 |
HypotheticalA | | $ 1,000.00 | $ 1,018.50 | $ 6.77 |
Class T | 1.52% | | | |
Actual | | $ 1,000.00 | $ 1,093.90 | $ 8.02 |
HypotheticalA | | $ 1,000.00 | $ 1,017.54 | $ 7.73 |
Class B | 2.09% | | | |
Actual | | $ 1,000.00 | $ 1,090.10 | $ 11.01 |
HypotheticalA | | $ 1,000.00 | $ 1,014.67 | $ 10.61 |
Class C | 2.09% | | | |
Actual | | $ 1,000.00 | $ 1,090.30 | $ 11.01 |
HypotheticalA | | $ 1,000.00 | $ 1,014.67 | $ 10.61 |
Institutional Class | 1.00% | | | |
Actual | | $ 1,000.00 | $ 1,097.00 | $ 5.29 |
HypotheticalA | | $ 1,000.00 | $ 1,020.16 | $ 5.09 |
A 5% return per year before expenses
* Expenses are equal to each Class' annualized expense ratio, multiplied by the average account value over the period, multiplied by 184/365 (to reflect the one-half year period).
Annual Report
Investment Changes (Unaudited)
Top Five Stocks as of October 31, 2010 |
| % of fund's
net assets | % of fund's net assets
6 months ago |
LVMH Moet Hennessy - Louis Vuitton (France, Textiles, Apparel & Luxury Goods) | 3.2 | 2.0 |
The Swatch Group AG (Bearer) (Switzerland, Textiles, Apparel & Luxury Goods) | 2.2 | 1.3 |
HSBC Holdings PLC (United Kingdom, Commercial Banks) | 2.2 | 2.4 |
Novo Nordisk AS Series B (Denmark, Pharmaceuticals) | 1.8 | 1.1 |
BHP Billiton PLC (United Kingdom, Metals & Mining) | 1.5 | 1.2 |
| 10.9 | |
Top Five Market Sectors as of October 31, 2010 |
| % of fund's
net assets | % of fund's net assets
6 months ago |
Consumer Discretionary | 28.4 | 19.5 |
Financials | 22.7 | 25.6 |
Materials | 9.4 | 9.5 |
Industrials | 9.0 | 10.2 |
Information Technology | 8.9 | 9.9 |
Top Five Countries as of October 31, 2010 |
(excluding cash equivalents) | % of fund's
net assets | % of fund's net assets
6 months ago |
United Kingdom | 17.4 | 20.0 |
Japan | 15.0 | 19.9 |
France | 11.2 | 9.9 |
Germany | 9.9 | 7.0 |
Switzerland | 6.1 | 6.4 |
Percentages are adjusted for the effect of open futures contracts, if applicable. |
Asset Allocation (% of fund's net assets) |
As of October 31, 2010 | As of April 30, 2010 |
| Stocks 99.6% | | | Stocks 98.7% | |
| Short-Term
Investments and
Net Other Assets 0.4% | | | Short-Term
Investments and
Net Other Assets 1.3% | |

Annual Report
Investments October 31, 2010
Showing Percentage of Net Assets
Common Stocks - 97.4% |
| Shares | | Value (000s) |
Australia - 2.8% |
AMP Ltd. | 359,117 | | $ 1,879 |
Aristocrat Leisure Ltd. | 1,361,699 | | 4,682 |
Australia & New Zealand Banking Group Ltd. | 138,019 | | 3,355 |
BHP Billiton Ltd. | 211,768 | | 8,751 |
Navitas Ltd. | 635,200 | | 2,383 |
Newcrest Mining Ltd. | 167,129 | | 6,543 |
Westfield Group unit | 380,879 | | 4,619 |
TOTAL AUSTRALIA | | 32,212 |
Austria - 0.5% |
Wienerberger AG (a) | 352,040 | | 5,927 |
Bailiwick of Jersey - 0.7% |
WPP PLC | 670,816 | | 7,795 |
Belgium - 1.5% |
Ageas | 707,600 | | 2,175 |
Anheuser-Busch InBev SA NV | 204,143 | | 12,792 |
Hamon & Compagnie International SA | 60,300 | | 2,182 |
TOTAL BELGIUM | | 17,149 |
Bermuda - 1.1% |
GOME Electrical Appliances Holdings Ltd. (a) | 11,545,000 | | 3,887 |
Huabao International Holdings Ltd. | 1,892,000 | | 2,851 |
Signet Jewelers Ltd. (a) | 179,100 | | 6,301 |
TOTAL BERMUDA | | 13,039 |
Brazil - 0.0% |
Drogasil SA | 15,900 | | 402 |
Canada - 0.9% |
Barrick Gold Corp. | 52,100 | | 2,509 |
Suncor Energy, Inc. | 179,100 | | 5,739 |
Yamana Gold, Inc. | 205,600 | | 2,262 |
TOTAL CANADA | | 10,510 |
Cayman Islands - 5.8% |
Ajisen (China) Holdings Ltd. | 3,332,000 | | 5,992 |
Bosideng International Holdings Ltd. | 18,848,000 | | 9,532 |
China Dongxiang Group Co. Ltd. | 3,317,000 | | 1,857 |
China High Speed Transmission Equipment Group Co. Ltd. | 1,283,000 | | 2,622 |
China Shanshui Cement Group Ltd. | 3,898,000 | | 2,776 |
CNinsure, Inc. ADR (d) | 106,000 | | 2,724 |
Ctrip.com International Ltd. sponsored ADR (a) | 71,500 | | 3,723 |
Daphne International Holdings Ltd. | 3,902,000 | | 4,359 |
Common Stocks - continued |
| Shares | | Value (000s) |
Cayman Islands - continued |
Evergreen International Holdings Ltd. (a) | 60,000 | | $ 36 |
Hengdeli Holdings Ltd. (d) | 21,266,000 | | 11,797 |
Little Sheep Group Ltd. | 3,710,000 | | 2,417 |
Natural Beauty Bio-Technology Ltd. | 6,200,000 | | 1,840 |
Peak Sport Products Co. Ltd. (d) | 5,943,000 | | 4,738 |
Shenguan Holdings Group Ltd. | 2,864,000 | | 3,732 |
Silver Base Group Holdings Ltd. | 11,757,000 | | 8,585 |
TOTAL CAYMAN ISLANDS | | 66,730 |
China - 1.3% |
Baidu.com, Inc. sponsored ADR (a) | 111,100 | | 12,222 |
Tencent Holdings Ltd. | 109,700 | | 2,512 |
TOTAL CHINA | | 14,734 |
Denmark - 2.9% |
Carlsberg AS Series B | 62,100 | | 6,790 |
Danske Bank AS (a) | 61,600 | | 1,638 |
Novo Nordisk AS: | | | |
Series B | 19,863 | | 2,085 |
Series B sponsored ADR | 175,200 | | 18,361 |
Pandora A/S | 16,700 | | 810 |
William Demant Holding AS (a) | 44,800 | | 3,358 |
TOTAL DENMARK | | 33,042 |
France - 11.2% |
Alstom SA | 90,185 | | 4,550 |
Atos Origin SA (a) | 53,518 | | 2,474 |
AXA SA | 144,258 | | 2,626 |
AXA SA sponsored ADR | 101,800 | | 1,856 |
BNP Paribas SA | 156,322 | | 11,430 |
Carrefour SA | 63,941 | | 3,450 |
Compagnie Generale de Geophysique SA (a) | 204,200 | | 4,769 |
Credit Agricole SA | 216,900 | | 3,554 |
Danone | 95,722 | | 6,057 |
Iliad Group SA | 18,000 | | 2,026 |
Ingenico SA | 103,555 | | 3,124 |
Ipsos SA | 58,500 | | 2,813 |
Laurent-Perrier Group | 21,000 | | 2,367 |
LVMH Moet Hennessy - Louis Vuitton | 235,548 | | 36,908 |
Sanofi-Aventis | 32,879 | | 2,303 |
Sanofi-Aventis sponsored ADR | 339,100 | | 11,906 |
Schneider Electric SA | 69,287 | | 9,834 |
Societe Generale Series A | 123,224 | | 7,377 |
Common Stocks - continued |
| Shares | | Value (000s) |
France - continued |
Total SA | 110,788 | | $ 6,029 |
Vallourec SA (d) | 35,330 | | 3,666 |
TOTAL FRANCE | | 129,119 |
Germany - 7.7% |
Allianz AG | 43,050 | | 5,394 |
BASF AG | 65,800 | | 4,787 |
Bayerische Motoren Werke AG (BMW) | 203,463 | | 14,583 |
Deutsche Bank AG | 53,600 | | 3,089 |
Deutsche Boerse AG | 78,369 | | 5,513 |
Deutsche Lufthansa AG (a) | 159,900 | | 3,421 |
Deutsche Post AG | 183,500 | | 3,421 |
Deutsche Postbank AG (a) | 41,400 | | 1,441 |
Fresenius Medical Care AG & Co. KGaA | 175,200 | | 11,158 |
Hugo Boss AG | 46,900 | | 2,663 |
Kabel Deutschland Holding AG | 71,700 | | 3,228 |
Linde AG | 45,093 | | 6,491 |
MAN SE | 46,471 | | 5,108 |
Munich Re Group | 13,555 | | 2,119 |
Puma AG | 11,423 | | 3,797 |
SAP AG | 103,500 | | 5,396 |
SAP AG sponsored ADR (d) | 97,700 | | 5,054 |
Tom Tailor Holding AG | 72,700 | | 1,543 |
TOTAL GERMANY | | 88,206 |
Greece - 0.2% |
Folli Follie SA | 89,300 | | 2,174 |
Hong Kong - 2.8% |
Cathay Pacific Airways Ltd. | 1,767,000 | | 4,753 |
China Unicom (Hong Kong) Ltd. sponsored ADR | 242,000 | | 3,388 |
Emperor Watch & Jewellery Ltd. (d) | 24,650,000 | | 3,530 |
Hang Seng Bank Ltd. | 77,200 | | 1,129 |
Henderson Land Development Co. Ltd. | 510,334 | | 3,624 |
Henderson Land Development Co. Ltd. warrants 6/1/11 (a) | 88,600 | | 34 |
Hong Kong Exchanges and Clearing Ltd. | 229,200 | | 5,045 |
I.T Ltd. (d) | 3,754,000 | | 3,167 |
Television Broadcasts Ltd. | 643,000 | | 3,426 |
Wharf Holdings Ltd. | 645,000 | | 4,236 |
TOTAL HONG KONG | | 32,332 |
Common Stocks - continued |
| Shares | | Value (000s) |
Ireland - 1.1% |
CRH PLC | 397,098 | | $ 6,857 |
Kingspan Group PLC (United Kingdom) | 671,700 | | 5,585 |
TOTAL IRELAND | | 12,442 |
Israel - 0.2% |
Teva Pharmaceutical Industries Ltd. sponsored ADR | 41,800 | | 2,169 |
Italy - 3.4% |
Bulgari SpA | 489,300 | | 5,239 |
Intesa Sanpaolo SpA | 2,192,336 | | 7,710 |
Saipem SpA | 370,543 | | 16,463 |
Tod's SpA | 27,600 | | 2,676 |
UniCredit SpA | 1,782,294 | | 4,645 |
Unione di Banche Italiane SCpA | 174,755 | | 1,844 |
TOTAL ITALY | | 38,577 |
Japan - 15.0% |
Aozora Bank Ltd. | 1,265,000 | | 2,122 |
Canon, Inc. | 139,300 | | 6,412 |
Canon, Inc. sponsored ADR | 78,700 | | 3,620 |
eAccess Ltd. | 2,580 | | 1,882 |
Fanuc Ltd. | 40,700 | | 5,892 |
Fuji Media Holdings, Inc. | 775 | | 1,027 |
Hoya Corp. | 51,100 | | 1,195 |
Japan Retail Fund Investment Corp. | 1,514 | | 2,365 |
Japan Tobacco, Inc. | 525 | | 1,631 |
JFE Holdings, Inc. | 72,700 | | 2,267 |
JSR Corp. | 81,000 | | 1,402 |
Keyence Corp. | 15,900 | | 3,942 |
Mazda Motor Corp. | 3,185,000 | | 8,095 |
Mitsubishi Corp. | 145,600 | | 3,497 |
Mitsubishi Electric Corp. | 624,000 | | 5,848 |
Mitsubishi Estate Co. Ltd. | 140,000 | | 2,453 |
Mitsubishi UFJ Financial Group, Inc. | 1,618,300 | | 7,511 |
Mitsubishi UFJ Financial Group, Inc. sponsored ADR | 489,700 | | 2,282 |
Mitsui & Co. Ltd. | 399,700 | | 6,286 |
Mizuho Financial Group, Inc. | 1,276,800 | | 1,852 |
Mizuho Financial Group, Inc. ADR (d) | 353,200 | | 1,024 |
MS&AD Insurance Group Holdings, Inc. | 97,800 | | 2,343 |
Murata Manufacturing Co. Ltd. | 44,800 | | 2,519 |
NKSJ Holdings, Inc. | 276,000 | | 1,897 |
Nomura Holdings, Inc. | 393,000 | | 2,020 |
NSK Ltd. | 426,000 | | 3,221 |
Common Stocks - continued |
| Shares | | Value (000s) |
Japan - continued |
Omron Corp. | 104,500 | | $ 2,426 |
ORIX Corp. | 71,420 | | 6,515 |
Rakuten, Inc. | 7,412 | | 5,711 |
Ricoh Co. Ltd. | 458,000 | | 6,407 |
Shin-Etsu Chemical Co., Ltd. | 68,000 | | 3,438 |
Shiseido Co. Ltd. | 92,900 | | 1,940 |
SMC Corp. | 41,400 | | 6,328 |
SOFTBANK CORP. | 361,100 | | 11,597 |
Sony Corp. | 56,600 | | 1,912 |
Sony Corp. sponsored ADR | 26,500 | | 897 |
Sumitomo Corp. | 335,300 | | 4,245 |
Sumitomo Mitsui Financial Group, Inc. | 219,000 | | 6,537 |
Tokio Marine Holdings, Inc. | 82,100 | | 2,308 |
Tokyo Electron Ltd. | 87,500 | | 4,937 |
Toshiba Corp. (a) | 825,000 | | 4,129 |
Toyota Motor Corp. | 259,400 | | 9,188 |
Toyota Motor Corp. sponsored ADR (d) | 105,700 | | 7,486 |
Yahoo! Japan Corp. | 6,187 | | 2,160 |
TOTAL JAPAN | | 172,766 |
Korea (South) - 0.4% |
Samsung Electronics Co. Ltd. | 6,717 | | 4,450 |
Luxembourg - 0.3% |
ArcelorMittal SA Class A unit (d) | 104,100 | | 3,371 |
Netherlands - 1.6% |
AEGON NV (a) | 212,400 | | 1,346 |
ASML Holding NV | 90,000 | | 2,987 |
ING Groep NV: | | | |
(Certificaten Van Aandelen) unit (a) | 398,910 | | 4,267 |
sponsored ADR (a) | 118,800 | | 1,281 |
Koninklijke Philips Electronics NV | 183,406 | | 5,593 |
Koninklijke Philips Electronics NV unit | 81,700 | | 2,488 |
TOTAL NETHERLANDS | | 17,962 |
Norway - 1.2% |
Aker Solutions ASA | 304,600 | | 4,637 |
DnB NOR ASA | 287,800 | | 3,949 |
Sevan Marine ASA (a) | 301,000 | | 406 |
StatoilHydro ASA sponsored ADR (d) | 228,500 | | 4,988 |
TOTAL NORWAY | | 13,980 |
Common Stocks - continued |
| Shares | | Value (000s) |
Singapore - 0.1% |
United Overseas Bank Ltd. | 122,234 | | $ 1,760 |
South Africa - 2.2% |
Aspen Pharmacare Holdings Ltd. | 425,600 | | 5,681 |
Clicks Group Ltd. | 1,771,835 | | 11,559 |
Mr Price Group Ltd. | 919,900 | | 8,360 |
TOTAL SOUTH AFRICA | | 25,600 |
Spain - 3.3% |
Antena 3 Television SA (d) | 374,000 | | 3,820 |
Banco Bilbao Vizcaya Argentaria SA | 468,629 | | 6,172 |
Banco Santander SA | 974,660 | | 12,507 |
Banco Santander SA sponsored ADR | 89,800 | | 1,150 |
EDP Renovaveis SA (a) | 451,605 | | 2,620 |
Inditex SA (d) | 23,365 | | 1,951 |
NH Hoteles SA (a)(d) | 573,700 | | 3,006 |
Telefonica SA | 229,682 | | 6,205 |
TOTAL SPAIN | | 37,431 |
Sweden - 1.7% |
Elekta AB (B Shares) | 295,900 | | 11,195 |
H&M Hennes & Mauritz AB (B Shares) | 114,140 | | 4,021 |
Svenska Handelsbanken AB (A Shares) | 63,500 | | 2,076 |
Swedbank AB (A Shares) (a) | 125,912 | | 1,757 |
TOTAL SWEDEN | | 19,049 |
Switzerland - 6.1% |
Compagnie Financiere Richemont SA Series A | 342,144 | | 17,059 |
Credit Suisse Group | 50,181 | | 2,077 |
Credit Suisse Group sponsored ADR | 92,500 | | 3,839 |
Julius Baer Group Ltd. | 128,460 | | 5,421 |
Kuehne & Nagel International AG | 24,000 | | 2,967 |
Swiss Reinsurance Co. | 28,450 | | 1,367 |
The Swatch Group AG (Bearer) | 67,570 | | 25,817 |
UBS AG (a) | 195,078 | | 3,313 |
UBS AG (NY Shares) (a) | 313,277 | | 5,332 |
Zurich Financial Services AG | 9,723 | | 2,380 |
TOTAL SWITZERLAND | | 69,572 |
Taiwan - 1.3% |
Hon Hai Precision Industry Co. Ltd. (Foxconn) | 394,424 | | 1,495 |
Common Stocks - continued |
| Shares | | Value (000s) |
Taiwan - continued |
HTC Corp. | 469,400 | | $ 10,598 |
Taiwan Semiconductor Manufacturing Co. Ltd. sponsored ADR | 231,485 | | 2,526 |
TOTAL TAIWAN | | 14,619 |
Turkey - 0.8% |
Boyner Buyuk Magazacilik AS (a) | 1,418,000 | | 3,302 |
Dogus Otomotiv Servis ve Ticaret AS (a) | 321,000 | | 2,417 |
Turkcell Iletisim Hizmet AS sponsored ADR | 190,600 | | 3,417 |
TOTAL TURKEY | | 9,136 |
United Kingdom - 17.4% |
Anglo American PLC: | | | |
ADR | 195,246 | | 4,539 |
(United Kingdom) | 177,859 | | 8,287 |
Aviva PLC | 334,000 | | 2,130 |
Barclays PLC | 1,270,156 | | 5,581 |
Barclays PLC Sponsored ADR | 343,200 | | 6,057 |
BG Group PLC | 344,048 | | 6,700 |
BHP Billiton PLC | 495,034 | | 17,534 |
BP PLC sponsored ADR | 246,800 | | 10,077 |
Burberry Group PLC | 283,100 | | 4,622 |
Centrica PLC | 898,550 | | 4,782 |
Dunelm Group PLC | 190,100 | | 1,467 |
Great Portland Estates PLC | 573,900 | | 3,177 |
Hays PLC | 1,126,800 | | 1,995 |
Hikma Pharmaceuticals PLC | 142,400 | | 1,793 |
HSBC Holdings PLC: | | | |
(United Kingdom) | 116,944 | | 1,217 |
sponsored ADR | 463,533 | | 24,155 |
Imperial Tobacco Group PLC | 201,757 | | 6,462 |
InterContinental Hotel Group PLC | 325,695 | | 6,289 |
Intertek Group PLC | 116,200 | | 3,453 |
ITV PLC (a) | 4,242,800 | | 4,639 |
Johnson Matthey PLC | 133,254 | | 4,086 |
Legal & General Group PLC | 813,369 | | 1,308 |
Lloyds Banking Group PLC (a) | 3,032,699 | | 3,333 |
Lloyds Banking Group PLC sponsored ADR | 381,800 | | 1,672 |
M&C Saatchi | 773,305 | | 1,450 |
Man Group PLC | 825,945 | | 3,451 |
Prudential PLC | 467,573 | | 4,728 |
Rio Tinto PLC | 141,832 | | 9,211 |
Rio Tinto PLC sponsored ADR | 95,900 | | 6,245 |
Common Stocks - continued |
| Shares | | Value (000s) |
United Kingdom - continued |
Royal Bank of Scotland Group PLC (a) | 1,162,200 | | $ 831 |
Royal Dutch Shell PLC: | | | |
Class A (United Kingdom) | 92,200 | | 2,993 |
Class B | 113,022 | | 3,616 |
Schroders PLC | 212,800 | | 5,383 |
Standard Chartered PLC (United Kingdom) | 161,560 | | 4,673 |
Sthree PLC | 190,600 | | 895 |
SuperGroup PLC | 201,800 | | 3,653 |
Vodafone Group PLC | 2,846,069 | | 7,779 |
Vodafone Group PLC sponsored ADR | 179,700 | | 4,944 |
Xstrata PLC | 237,400 | | 4,600 |
TOTAL UNITED KINGDOM | | 199,807 |
United States of America - 1.9% |
Apple, Inc. (a) | 12,300 | | 3,701 |
Deckers Outdoor Corp. (a) | 116,300 | | 6,757 |
Google, Inc. Class A (a) | 9,500 | | 5,823 |
Philip Morris International, Inc. | 51,900 | | 3,036 |
Scientific Games Corp. Class A (a) | 296,800 | | 2,345 |
TOTAL UNITED STATES OF AMERICA | | 21,662 |
TOTAL COMMON STOCKS (Cost $948,466) | 1,117,724 |
Nonconvertible Preferred Stocks - 2.2% |
| | | |
Germany - 2.2% |
Hugo Boss AG (non-vtg.) | 109,800 | | 7,273 |
ProSiebenSat.1 Media AG | 85,100 | | 2,249 |
Volkswagen AG | 106,200 | | 15,959 |
TOTAL NONCONVERTIBLE PREFERRED STOCKS (Cost $16,684) | 25,481 |
Money Market Funds - 3.1% |
| Shares | | Value (000s) |
Fidelity Cash Central Fund, 0.23% (b) | 4,721,668 | | $ 4,722 |
Fidelity Securities Lending Cash Central Fund, 0.24% (b)(c) | 30,544,560 | | 30,545 |
TOTAL MONEY MARKET FUNDS (Cost $35,267) | 35,267 |
TOTAL INVESTMENT PORTFOLIO - 102.7% (Cost $1,000,417) | | 1,178,472 |
NET OTHER ASSETS (LIABILITIES) - (2.7)% | | (30,854) |
NET ASSETS - 100% | $ 1,147,618 |
Legend |
(a) Non-income producing |
(b) Affiliated fund that is available only to investment companies and other accounts managed by Fidelity Investments. The rate quoted is the annualized seven-day yield of the fund at period end. A complete unaudited listing of the fund's holdings as of its most recent quarter end is available upon request. In addition, each Fidelity Central Fund's financial statements, which are not covered by the Fund's report of Independent Registered Public Accounting Firm, are available on the SEC's website or upon request. |
(c) Investment made with cash collateral received from securities on loan. |
(d) Security or a portion of the security is on loan at period end. |
Affiliated Central Funds |
Information regarding fiscal year to date income earned by the Fund from investments in Fidelity Central Funds is as follows: |
Fund | Income earned
(Amounts in thousands) |
Fidelity Cash Central Fund | $ 18 |
Fidelity Securities Lending Cash Central Fund | 850 |
Total | $ 868 |
Other Information |
The following is a summary of the inputs used, as of October 31, 2010, involving the Fund's assets and liabilities carried at fair value. The inputs or methodology used for valuing securities may not be an indication of the risk associated with investing in those securities. For more information on valuation inputs, and their aggregation into the levels used in the table below, please refer to the Security Valuation section in the accompanying Notes to Financial Statements. |
Valuation Inputs at Reporting Date: |
Description
(Amounts in thousands) | Total | Level 1 | Level 2 | Level 3 |
Investments in Securities: | | | | |
Equities: | | | | |
United Kingdom | $ 199,807 | $ 137,558 | $ 62,249 | $ - |
Japan | 172,766 | 54,640 | 118,126 | - |
France | 129,119 | 116,018 | 13,101 | - |
Germany | 113,687 | 94,044 | 19,643 | - |
Switzerland | 69,572 | 64,182 | 5,390 | - |
Cayman Islands | 66,730 | 66,694 | 36 | - |
Italy | 38,577 | 38,577 | - | - |
Spain | 37,431 | 12,547 | 24,884 | - |
Denmark | 33,042 | 30,957 | 2,085 | - |
Other | 282,474 | 247,865 | 34,609 | - |
Money Market Funds | 35,267 | 35,267 | - | - |
Total Investments in Securities: | $ 1,178,472 | $ 898,349 | $ 280,123 | $ - |
Income Tax Information |
At October 31, 2010, the Fund had a capital loss carryforward of approximately $241,539,000 of which $14,313,000 and $227,226,000 will expire on October 31, 2016 and 2017, respectively. Capital loss carryforwards are only available to offset future capital gains of the Fund to the extent provided by regulations and may be limited. |
See accompanying notes which are an integral part of the financial statements.
Annual Report
Statement of Assets and Liabilities
Amounts in thousands (except per-share amounts) | October 31, 2010 |
| | |
Assets | | |
Investment in securities, at value (including securities loaned of $29,509) - See accompanying schedule: Unaffiliated issuers (cost $965,150) | $ 1,143,205 | |
Fidelity Central Funds (cost $35,267) | 35,267 | |
Total Investments (cost $1,000,417) | | $ 1,178,472 |
Foreign currency held at value (cost $103) | | 102 |
Receivable for investments sold | | 2,292 |
Receivable for fund shares sold | | 1,096 |
Dividends receivable | | 2,731 |
Distributions receivable from Fidelity Central Funds | | 37 |
Other receivables | | 196 |
Total assets | | 1,184,926 |
| | |
Liabilities | | |
Payable for investments purchased | $ 3,982 | |
Payable for fund shares redeemed | 1,547 | |
Accrued management fee | 696 | |
Distribution and service plan fees payable | 192 | |
Other affiliated payables | 254 | |
Other payables and accrued expenses | 92 | |
Collateral on securities loaned, at value | 30,545 | |
Total liabilities | | 37,308 |
| | |
Net Assets | | $ 1,147,618 |
Net Assets consist of: | | |
Paid in capital | | $ 1,213,935 |
Undistributed net investment income | | 12,989 |
Accumulated undistributed net realized gain (loss) on investments and foreign currency transactions | | (257,468) |
Net unrealized appreciation (depreciation) on investments and assets and liabilities in foreign currencies | | 178,162 |
Net Assets | | $ 1,147,618 |
See accompanying notes which are an integral part of the financial statements.
Annual Report
Financial Statements - continued
Statement of Assets and Liabilities - continued
Amounts in thousands (except per-share amounts) | October 31, 2010 |
| | |
Calculation of Maximum Offering Price Class A:
Net Asset Value and redemption price per share ($70,046 ÷ 3,941.1 shares) | | $ 17.77 |
| | |
Maximum offering price per share (100/94.25 of $17.77) | | $ 18.85 |
Class T:
Net Asset Value and redemption price per share ($370,770 ÷ 20,399.7 shares) | | $ 18.18 |
| | |
Maximum offering price per share (100/96.50 of $18.18) | | $ 18.84 |
Class B:
Net Asset Value and offering price per share ($6,817 ÷ 396.8 shares)A | | $ 17.18 |
| | |
Class C:
Net Asset Value and offering price per share ($22,376 ÷ 1,286.5 shares)A | | $ 17.39 |
| | |
| | |
Institutional Class:
Net Asset Value, offering price and redemption price per share ($677,609 ÷ 37,444.9 shares) | | $ 18.10 |
A Redemption price per share is equal to net asset value less any applicable contingent deferred sales charge.
See accompanying notes which are an integral part of the financial statements.
Annual Report
Statement of Operations
Amounts in thousands | Year ended October 31, 2010 |
| | |
Investment Income | | |
Dividends | | $ 29,863 |
Income from Fidelity Central Funds | | 868 |
Income before foreign taxes withheld | | 30,731 |
Less foreign taxes withheld | | (2,365) |
Total income | | 28,366 |
| | |
Expenses | | |
Management fee
Basic fee | $ 8,497 | |
Performance adjustment | 71 | |
Transfer agent fees | 2,710 | |
Distribution and service plan fees | 2,242 | |
Accounting and security lending fees | 560 | |
Custodian fees and expenses | 207 | |
Independent trustees' compensation | 7 | |
Registration fees | 69 | |
Audit | 79 | |
Legal | 7 | |
Interest | 1 | |
Miscellaneous | 17 | |
Total expenses before reductions | 14,467 | |
Expense reductions | (299) | 14,168 |
Net investment income (loss) | | 14,198 |
Realized and Unrealized Gain (Loss) Net realized gain (loss) on: | | |
Investment securities: | | |
Unaffiliated issuers | 74,134 | |
Foreign currency transactions | (400) | |
Capital gain distributions from Fidelity Central Funds | 3 | |
Total net realized gain (loss) | | 73,737 |
Change in net unrealized appreciation (depreciation) on: Investment securities | 72,011 | |
Assets and liabilities in foreign currencies | 66 | |
Total change in net unrealized appreciation (depreciation) | | 72,077 |
Net gain (loss) | | 145,814 |
Net increase (decrease) in net assets resulting from operations | | $ 160,012 |
See accompanying notes which are an integral part of the financial statements.
Annual Report
Financial Statements - continued
Statement of Changes in Net Assets
Amounts in thousands | Year ended
October 31,
2010 | Year ended
October 31,
2009 |
Increase (Decrease) in Net Assets | | |
Operations | | |
Net investment income (loss) | $ 14,198 | $ 18,837 |
Net realized gain (loss) | 73,737 | (232,788) |
Change in net unrealized appreciation (depreciation) | 72,077 | 399,538 |
Net increase (decrease) in net assets resulting
from operations | 160,012 | 185,587 |
Distributions to shareholders from net investment income | (17,905) | (18,118) |
Distributions to shareholders from net realized gain | (2,268) | - |
Total distributions | (20,173) | (18,118) |
Share transactions - net increase (decrease) | (188,997) | 28,251 |
Redemption fees | 22 | 29 |
Total increase (decrease) in net assets | (49,136) | 195,749 |
| | |
Net Assets | | |
Beginning of period | 1,196,754 | 1,001,005 |
End of period (including undistributed net investment income of $12,989 and undistributed net investment income of $16,696, respectively) | $ 1,147,618 | $ 1,196,754 |
See accompanying notes which are an integral part of the financial statements.
Annual Report
Financial Highlights - Class A
Years ended October 31, | 2010 | 2009 | 2008 | 2007 | 2006 |
Selected Per-Share Data | | | | |
Net asset value, beginning of period | $ 15.68 | $ 13.56 | $ 26.85 | $ 21.67 | $ 18.36 |
Income from Investment Operations | | | | | |
Net investment income (loss) C | .17 | .24 | .38 | .31 | .27 |
Net realized and unrealized gain (loss) | 2.16 | 2.12 | (11.56) | 6.16 | 3.53 |
Total from investment operations | 2.33 | 2.36 | (11.18) | 6.47 | 3.80 |
Distributions from net investment income | (.21) | (.24) | (.33) | (.23) | (.19) |
Distributions from net realized gain | (.03) | - | (1.78) | (1.06) | (.30) |
Total distributions | (.24) | (.24) | (2.11) | (1.29) | (.49) |
Redemption fees added to paid in capital C, G | - | - | - | - | - |
Net asset value, end of period | $ 17.77 | $ 15.68 | $ 13.56 | $ 26.85 | $ 21.67 |
Total Return A, B | 14.99% | 17.97% | (45.08)% | 31.44% | 21.12% |
Ratios to Average Net Assets D, F | | | | |
Expenses before reductions | 1.36% | 1.36% | 1.35% | 1.17% | 1.24% |
Expenses net of fee waivers, if any | 1.36% | 1.36% | 1.35% | 1.17% | 1.24% |
Expenses net of all reductions | 1.33% | 1.33% | 1.32% | 1.13% | 1.17% |
Net investment income (loss) | 1.04% | 1.79% | 1.83% | 1.34% | 1.31% |
Supplemental Data | | | | |
Net assets, end of period (in millions) | $ 70 | $ 72 | $ 73 | $ 147 | $ 113 |
Portfolio turnover rate E | 53% | 83% | 79% | 66% | 65% |
A Total returns would have been lower had certain expenses not been reduced during the periods shown.
B Total returns do not include the effect of the sales charges.
C Calculated based on average shares outstanding during the period.
D Fees and expenses of the underlying Fidelity Central Funds are not included in the Fund's expense ratio. The Fund indirectly bears its proportionate share of the expenses of any underlying Fidelity Central Funds.
E Amount does not include the portfolio activity of any underlying Fidelity Central Funds.
F Expense ratios reflect operating expenses of the class. Expenses before reductions do not reflect amounts reimbursed by the investment adviser or reductions from brokerage service arrangements or reductions from other expense offset arrangements and do not represent the amount paid by the class during periods when reimbursements or reductions occur. Expenses net of fee waivers reflect expenses after reimbursement by the investment adviser but prior to reductions from brokerage service arrangements or other expense offset arrangements. Expenses net of all reductions represent the net expenses paid by the class.
G Amount represents less than $.01 per share.
See accompanying notes which are an integral part of the financial statements.
Annual Report
Financial Highlights - Class T
Years ended October 31, | 2010 | 2009 | 2008 | 2007 | 2006 |
Selected Per-Share Data | | | | |
Net asset value, beginning of period | $ 16.03 | $ 13.84 | $ 27.35 | $ 22.05 | $ 18.64 |
Income from Investment Operations | | | | | |
Net investment income (loss) C | .14 | .22 | .36 | .28 | .24 |
Net realized and unrealized gain (loss) | 2.23 | 2.17 | (11.82) | 6.27 | 3.59 |
Total from investment operations | 2.37 | 2.39 | (11.46) | 6.55 | 3.83 |
Distributions from net investment income | (.19) | (.20) | (.27) | (.19) | (.12) |
Distributions from net realized gain | (.03) | - | (1.78) | (1.06) | (.30) |
Total distributions | (.22) | (.20) | (2.05) | (1.25) | (.42) |
Redemption fees added to paid in capital C, G | - | - | - | - | - |
Net asset value, end of period | $ 18.18 | $ 16.03 | $ 13.84 | $ 27.35 | $ 22.05 |
Total Return A, B | 14.88% | 17.70% | (45.18)% | 31.24% | 20.92% |
Ratios to Average Net Assets D, F | | | | |
Expenses before reductions | 1.53% | 1.57% | 1.51% | 1.33% | 1.39% |
Expenses net of fee waivers, if any | 1.53% | 1.57% | 1.51% | 1.33% | 1.39% |
Expenses net of all reductions | 1.50% | 1.54% | 1.48% | 1.30% | 1.33% |
Net investment income (loss) | .86% | 1.58% | 1.67% | 1.17% | 1.15% |
Supplemental Data | | | | |
Net assets, end of period (in millions) | $ 371 | $ 367 | $ 345 | $ 710 | $ 602 |
Portfolio turnover rate E | 53% | 83% | 79% | 66% | 65% |
A Total returns would have been lower had certain expenses not been reduced during the periods shown.
B Total returns do not include the effect of the sales charges.
C Calculated based on average shares outstanding during the period.
D Fees and expenses of the underlying Fidelity Central Funds are not included in the Fund's expense ratio. The Fund indirectly bears its proportionate share of the expenses of any underlying Fidelity Central Funds.
E Amount does not include the portfolio activity of any underlying Fidelity Central Funds.
F Expense ratios reflect operating expenses of the class. Expenses before reductions do not reflect amounts reimbursed by the investment adviser or reductions from brokerage service arrangements or reductions from other expense offset arrangements and do not represent the amount paid by the class during periods when reimbursements or reductions occur. Expenses net of fee waivers reflect expenses after reimbursement by the investment adviser but prior to reductions from brokerage service arrangements or other expense offset arrangements. Expenses net of all reductions represent the net expenses paid by the class.
G Amount represents less than $.01 per share.
See accompanying notes which are an integral part of the financial statements.
Annual Report
Financial Highlights - Class B
Years ended October 31, | 2010 | 2009 | 2008 | 2007 | 2006 |
Selected Per-Share Data | | | | |
Net asset value, beginning of period | $ 15.16 | $ 13.02 | $ 25.79 | $ 20.81 | $ 17.63 |
Income from Investment Operations | | | | | |
Net investment income (loss) C | .04 | .13 | .22 | .12 | .10 |
Net realized and unrealized gain (loss) | 2.10 | 2.08 | (11.14) | 5.94 | 3.40 |
Total from investment operations | 2.14 | 2.21 | (10.92) | 6.06 | 3.50 |
Distributions from net investment income | (.09) | (.07) | (.07) | (.02) | (.02) |
Distributions from net realized gain | (.03) | - | (1.78) | (1.06) | (.30) |
Total distributions | (.12) | (.07) | (1.85) | (1.08) | (.32) |
Redemption fees added to paid in capital C, G | - | - | - | - | - |
Net asset value, end of period | $ 17.18 | $ 15.16 | $ 13.02 | $ 25.79 | $ 20.81 |
Total Return A, B | 14.15% | 17.09% | (45.50)% | 30.45% | 20.12% |
Ratios to Average Net Assets D, F | | | | |
Expenses before reductions | 2.11% | 2.12% | 2.10% | 1.94% | 2.05% |
Expenses net of fee waivers, if any | 2.11% | 2.12% | 2.10% | 1.94% | 2.05% |
Expenses net of all reductions | 2.09% | 2.08% | 2.08% | 1.91% | 1.99% |
Net investment income (loss) | .28% | 1.04% | 1.07% | .56% | .49% |
Supplemental Data | | | | |
Net assets, end of period (in millions) | $ 7 | $ 8 | $ 10 | $ 27 | $ 37 |
Portfolio turnover rate E | 53% | 83% | 79% | 66% | 65% |
A Total returns would have been lower had certain expenses not been reduced during the periods shown.
B Total returns do not include the effect of the contingent deferred sales charge.
C Calculated based on average shares outstanding during the period.
D Fees and expenses of the underlying Fidelity Central Funds are not included in the Fund's expense ratio. The Fund indirectly bears its proportionate share of the expenses of any underlying Fidelity Central Funds.
E Amount does not include the portfolio activity of any underlying Fidelity Central Funds.
F Expense ratios reflect operating expenses of the class. Expenses before reductions do not reflect amounts reimbursed by the investment adviser or reductions from brokerage service arrangements or reductions from other expense offset arrangements and do not represent the amount paid by the class during periods when reimbursements or reductions occur. Expenses net of fee waivers reflect expenses after reimbursement by the investment adviser but prior to reductions from brokerage service arrangements or other expense offset arrangements. Expenses net of all reductions represent the net expenses paid by the class.
G Amount represents less than $.01 per share.
See accompanying notes which are an integral part of the financial statements.
Annual Report
Financial Highlights - Class C
Years ended October 31, | 2010 | 2009 | 2008 | 2007 | 2006 |
Selected Per-Share Data | | | | |
Net asset value, beginning of period | $ 15.36 | $ 13.22 | $ 26.22 | $ 21.19 | $ 17.95 |
Income from Investment Operations | | | | | |
Net investment income (loss) C | .05 | .14 | .22 | .14 | .11 |
Net realized and unrealized gain (loss) | 2.12 | 2.09 | (11.31) | 6.02 | 3.47 |
Total from investment operations | 2.17 | 2.23 | (11.09) | 6.16 | 3.58 |
Distributions from net investment income | (.11) | (.09) | (.13) | (.07) | (.04) |
Distributions from net realized gain | (.03) | - | (1.78) | (1.06) | (.30) |
Total distributions | (.14) | (.09) | (1.91) | (1.13) | (.34) |
Redemption fees added to paid in capital C, G | - | - | - | - | - |
Net asset value, end of period | $ 17.39 | $ 15.36 | $ 13.22 | $ 26.22 | $ 21.19 |
Total Return A, B | 14.17% | 17.06% | (45.50)% | 30.48% | 20.22% |
Ratios to Average Net Assets D, F | | | | |
Expenses before reductions | 2.10% | 2.11% | 2.09% | 1.91% | 1.98% |
Expenses net of fee waivers, if any | 2.10% | 2.11% | 2.09% | 1.91% | 1.98% |
Expenses net of all reductions | 2.08% | 2.08% | 2.07% | 1.87% | 1.92% |
Net investment income (loss) | .29% | 1.05% | 1.08% | .60% | .56% |
Supplemental Data | | | | |
Net assets, end of period (in millions) | $ 22 | $ 23 | $ 22 | $ 46 | $ 41 |
Portfolio turnover rate E | 53% | 83% | 79% | 66% | 65% |
A Total returns would have been lower had certain expenses not been reduced during the periods shown.
B Total returns do not include the effect of the contingent deferred sales charge.
C Calculated based on average shares outstanding during the period.
D Fees and expenses of the underlying Fidelity Central Funds are not included in the Fund's expense ratio. The Fund indirectly bears its proportionate share of the expenses of any underlying Fidelity Central Funds.
E Amount does not include the portfolio activity of any underlying Fidelity Central Funds.
F Expense ratios reflect operating expenses of the class. Expenses before reductions do not reflect amounts reimbursed by the investment adviser or reductions from brokerage service arrangements or reductions from other expense offset arrangements and do not represent the amount paid by the class during periods when reimbursements or reductions occur. Expenses net of fee waivers reflect expenses after reimbursement by the investment adviser but prior to reductions from brokerage service arrangements or other expense offset arrangements. Expenses net of all reductions represent the net expenses paid by the class.
G Amount represents less than $.01 per share.
See accompanying notes which are an integral part of the financial statements.
Annual Report
Financial Highlights - Institutional Class
Years ended October 31, | 2010 | 2009 | 2008 | 2007 | 2006 |
Selected Per-Share Data | | | | |
Net asset value, beginning of period | $ 15.95 | $ 13.83 | $ 27.35 | $ 22.06 | $ 18.64 |
Income from Investment Operations | | | | | |
Net investment income (loss) B | .22 | .29 | .45 | .40 | .35 |
Net realized and unrealized gain (loss) | 2.23 | 2.14 | (11.78) | 6.26 | 3.58 |
Total from investment operations | 2.45 | 2.43 | (11.33) | 6.66 | 3.93 |
Distributions from net investment income | (.27) | (.31) | (.41) | (.31) | (.21) |
Distributions from net realized gain | (.03) | - | (1.78) | (1.06) | (.30) |
Total distributions | (.30) | (.31) | (2.19) | (1.37) | (.51) |
Redemption fees added to paid in capital B, F | - | - | - | - | - |
Net asset value, end of period | $ 18.10 | $ 15.95 | $ 13.83 | $ 27.35 | $ 22.06 |
Total Return A | 15.49% | 18.32% | (44.92)% | 31.88% | 21.55% |
Ratios to Average Net Assets C, E | | | | |
Expenses before reductions | 1.01% | 1.06% | 1.01% | .84% | .87% |
Expenses net of fee waivers, if any | 1.01% | 1.06% | 1.01% | .84% | .87% |
Expenses net of all reductions | .98% | 1.02% | .98% | .81% | .81% |
Net investment income (loss) | 1.39% | 2.10% | 2.17% | 1.66% | 1.67% |
Supplemental Data | | | | |
Net assets, end of period (in millions) | $ 678 | $ 727 | $ 551 | $ 609 | $ 354 |
Portfolio turnover rate D | 53% | 83% | 79% | 66% | 65% |
A Total returns would have been lower had certain expenses not been reduced during the periods shown.
B Calculated based on average shares outstanding during the period.
C Fees and expenses of the underlying Fidelity Central Funds are not included in the Fund's expense ratio. The Fund indirectly bears its proportionate share of the expenses of any underlying Fidelity Central Funds.
D Amount does not include the portfolio activity of any underlying Fidelity Central Funds.
E Expense ratios reflect operating expenses of the class. Expenses before reductions do not reflect amounts reimbursed by the investment adviser or reductions from brokerage service arrangements or reductions from other expense offset arrangements and do not represent the amount paid by the class during periods when reimbursements or reductions occur. Expenses net of fee waivers reflect expenses after reimbursement by the investment adviser but prior to reductions from brokerage service arrangements or other expense offset arrangements. Expenses net of all reductions represent the net expenses paid by the class.
F Amount represents less than $.01 per share.
See accompanying notes which are an integral part of the financial statements.
Annual Report
Notes to Financial Statements
For the period ended October 31, 2010
(Amounts in thousands except ratios)
1. Organization.
Fidelity Advisor Overseas Fund (the Fund) is a fund of Fidelity Advisor Series VIII (the Trust) and is authorized to issue an unlimited number of shares. The Trust is registered under the Investment Company Act of 1940, as amended (the 1940 Act), as an open-end management investment company organized as a Massachusetts business trust. The Fund offers Class A, Class T, Class C, and Institutional Class shares, each of which has equal rights as to assets and voting privileges. Effective after the close of business on September 1, 2010, Class B shares were closed to new accounts and additional purchases by existing shareholders. Each class has exclusive voting rights with respect to matters that affect that class. Class B shares will automatically convert to Class A shares after a holding period of seven years from the initial date of purchase. Investment income, realized and unrealized capital gains and losses, the common expenses of the Fund, and certain fund-level expense reductions, if any, are allocated on a pro-rata basis to each class based on the relative net assets of each class to the total net assets of the Fund. Each class differs with respect to transfer agent and distribution and service plan fees incurred. Certain expense reductions also differ by class. The Fund's investments in emerging markets can be subject to social, economic, regulatory, and political uncertainties and can be extremely volatile.
2. Investments in Fidelity Central Funds.
The Fund may invest in Fidelity Central Funds, which are open-end investment companies available only to other investment companies and accounts managed by Fidelity Management & Research Company (FMR) and its affiliates. The Fund's Schedule of Investments lists each of the Fidelity Central Funds held as of period end, if any, as an investment of the Fund, but does not include the underlying holdings of each Fidelity Central Fund. As an Investing Fund, the Fund indirectly bears its proportionate share of the expenses of the underlying Fidelity Central Funds.
The Money Market Central Funds seek preservation of capital and current income and are managed by Fidelity Investments Money Management, Inc. (FIMM), an affiliate of FMR.
A complete unaudited list of holdings for each Fidelity Central Fund is available upon request or at the Securities and Exchange Commission (the SEC) web site at www.sec.gov. In addition, the financial statements of the Fidelity Central Funds which are not covered by the Fund's Report of Independent Registered Public Accounting Firm, are available on the SEC web site or upon request.
Annual Report
Notes to Financial Statements - continued
(Amounts in thousands except ratios)
3. Significant Accounting Policies.
The financial statements have been prepared in conformity with accounting principles generally accepted in the United States of America (GAAP), which require management to make certain estimates and assumptions at the date of the financial statements. Actual results could differ from those estimates. The following summarizes the significant accounting policies of the Fund:
Security Valuation. Investments are valued as of 4:00 p.m. Eastern time on the last calendar day of the period. The Fund uses independent pricing services approved by the Board of Trustees to value its investments. When current market prices or quotations are not readily available or reliable, valuations may be determined in good faith in accordance with procedures adopted by the Board of Trustees. Factors used in determining value may include market or security specific events. The frequency with which these procedures are used cannot be predicted and they may be utilized to a significant extent. The value used for net asset value (NAV) calculation under these procedures may differ from published prices for the same securities.
The Fund categorizes the inputs to valuation techniques used to value its investments into a disclosure hierarchy consisting of three levels as shown below.
Level 1 - quoted prices in active markets for identical investments
Level 2 - other significant observable inputs (including quoted prices for similar investments, interest rates, prepayment speeds, etc.)
Level 3 - unobservable inputs (including the fund's own assumptions based on the best information available)
Changes in valuation techniques may result in transfers in or out of an assigned level within the disclosure hierarchy. The aggregate value of investments by input level, as of October 31, 2010 is included at the end of the Fund's Schedule of Investments. Valuation techniques used to value the Fund's investments by major category are as follows.
Equity securities, including restricted securities, for which market quotations are readily available, are valued at the last reported sale price or official closing price as reported by an independent pricing service on the primary market or exchange on which they are traded and are categorized as Level 1 in the hierarchy. In the event there were no sales during the day or closing prices are not available, securities are valued at the last quoted bid price or may be valued using the last available price and are generally categorized as Level 2 in the hierarchy. For foreign equity securities, when significant market or security specific events arise, comparisons to the valuation of American Depositary Receipts (ADRs), futures contracts, Exchange-traded funds (ETFs) and certain indexes as well as quoted prices for similar securities are used and are categorized as Level 2 in the hierarchy in these circumstances. Utilizing these techniques may result in significant
Annual Report
3. Significant Accounting Policies - continued
Security Valuation - continued
transfers between Level 1 and Level 2. For restricted equity securities and private placements where observable inputs are limited, assumptions about market activity and risk are used and are categorized as Level 3 in the hierarchy.
Investments in open-end mutual funds, including the Fidelity Central Funds, are valued at their closing net asset value each business day and are categorized as Level 1 in the hierarchy. Short-term securities with remaining maturities of sixty days or less for which quotations are not readily available are valued at amortized cost, which approximates fair value and are categorized as Level 2 in the hierarchy.
Foreign Currency. The Fund uses foreign currency contracts to facilitate transactions in foreign-denominated securities. Gains and losses from these transactions may arise from changes in the value of the foreign currency or if the counterparties do not perform under the contracts' terms.
Foreign-denominated assets, including investment securities, and liabilities are translated into U.S. dollars at the exchange rate at period end. Purchases and sales of investment securities, income and dividends received and expenses denominated in foreign currencies are translated into U.S. dollars at the exchange rate in effect on the transaction date.
The effects of exchange rate fluctuations on investments are included with the net realized and unrealized gain (loss) on investment securities. Other foreign currency transactions resulting in realized and unrealized gain (loss) are disclosed separately.
Investment Transactions and Income. For financial reporting purposes, the Fund's investment holdings and NAV include trades executed through the end of the last business day of the period. The NAV per share for processing shareholder transactions is calculated as of the close of business of the New York Stock Exchange (NYSE), normally 4:00 p.m. Eastern time and includes trades executed through the end of the prior business day. Gains and losses on securities sold are determined on the basis of identified cost and may include proceeds received from litigation. Dividend income is recorded on the ex-dividend date, except for certain dividends from foreign securities where the ex-dividend date may have passed, which are recorded as soon as the Fund is informed of the ex-dividend date. Non-cash dividends included in dividend income, if any, are recorded at the fair market value of the securities received. Distributions received on securities that represent a return of capital or capital gain are recorded as a reduction of cost of investments and/or as a realized gain. The Fund estimates the components of distributions received that may be considered return of capital distributions or capital gain distributions. Interest income and distributions from the Fidelity Central Funds are
Annual Report
Notes to Financial Statements - continued
(Amounts in thousands except ratios)
3. Significant Accounting Policies - continued
Investment Transactions and Income - continued
accrued as earned. Interest income includes coupon interest and amortization of premium and accretion of discount on debt securities. Investment income is recorded net of foreign taxes withheld where recovery of such taxes is uncertain.
Expenses. Most expenses of the Trust can be directly attributed to a fund. Expenses which cannot be directly attributed are apportioned amongst each fund in the Trust. Expense estimates are accrued in the period to which they relate and adjustments are made when actual amounts are known.
Income Tax Information and Distributions to Shareholders. Each year the Fund intends to qualify as a regulated investment company, including distributing substantially all of its taxable income and realized gains under Subchapter M of the Internal Revenue Code and filing its U.S. federal tax return. As a result, no provision for income taxes is required. As of October 31, 2010, the Fund did not have any unrecognized tax benefits in the accompanying financial statements. A fund's federal tax return is subject to examination by the Internal Revenue Service (IRS) for a period of three years. Foreign taxes are provided for based on the Fund's understanding of the tax rules and rates that exist in the foreign markets in which it invests.
Distributions are declared and recorded on the ex-dividend date. Income dividends and capital gain distributions are declared separately for each class. Income and capital gain distributions are determined in accordance with income tax regulations, which may differ from GAAP.
Capital accounts within the financial statements are adjusted for permanent book-tax differences. These adjustments have no impact on net assets or the results of operations. Temporary book-tax differences will reverse in a subsequent period.
Book-tax differences are primarily due to the short-term gain distributions from the Fidelity Central Funds, foreign currency transactions, passive foreign investment companies (PFIC), deferred trustees compensation, capital loss carryforwards and losses deferred due to wash sales.
The federal tax cost of investment securities and unrealized appreciation (depreciation) as of period end were as follows:
Gross unrealized appreciation | $ 244,454 |
Gross unrealized depreciation | (84,904) |
Net unrealized appreciation (depreciation) | $ 159,550 |
| |
Tax Cost | $ 1,018,922 |
Annual Report
3. Significant Accounting Policies - continued
Income Tax Information and Distributions to Shareholders - continued
The tax-based components of distributable earnings as of period end were as follows:
Undistributed ordinary income | $ 15,566 |
Capital loss carryforward | $ (241,539) |
Net unrealized appreciation (depreciation) | $ 159,658 |
The tax character of distributions paid was as follows:
| October 31, 2010 | October 31, 2009 |
Ordinary Income | $ 20,173 | $ 18,118 |
Short-Term Trading (Redemption) Fees. Shares held by investors in the Fund less than 30 days are subject to a redemption fee equal to 1.00% of the net asset value of shares redeemed. All redemption fees, which reduce the proceeds of the shareholder redemption, are retained by the Fund and accounted for as an addition to paid in capital.
4. Purchases and Sales of Investments.
Purchases and sales of securities, other than short-term securities, aggregated $622,100 and $817,350, respectively.
5. Fees and Other Transactions with Affiliates.
Management Fee. FMR and its affiliates provide the Fund with investment management related services for which the Fund pays a monthly management fee. The management fee is the sum of an individual fund fee rate that is based on an annual rate of .45% of the Fund's average net assets and a group fee rate that averaged .26% during the period. The group fee rate is based upon the average net assets of all the mutual funds advised by FMR. The group fee rate decreases as assets under management increase and increases as assets under management decrease. In addition, the management fee is subject to a performance adjustment (up to a maximum of ± .20% of the Fund's average net assets over a 36 month performance period). The upward or downward adjustment to the management fee is based on the investment performance of the asset-weighted return of all classes as compared to an appropriate benchmark index. For the period, the total annual management fee rate, including the performance adjustment, was .72% of the Fund's average net assets.
Distribution and Service Plan Fees. In accordance with Rule 12b-1 of the 1940 Act, the Fund has adopted separate Distribution and Service Plans for each class of shares. Certain classes pay Fidelity Distributors Corporation (FDC), an affiliate of FMR,
Annual Report
Notes to Financial Statements - continued
(Amounts in thousands except ratios)
5. Fees and Other Transactions with Affiliates - continued
Distribution and Service Plan Fees - continued
separate Distribution and Service Fees, each of which is based on an annual percentage of each class' average net assets. In addition, FDC may pay financial intermediaries for selling shares of the Fund and providing shareholder support services. For the period, the Distribution and Service Fee rates, total fees and amounts retained by FDC were as follows:
| Distribution
Fee | Service
Fee | Total Fees | Retained
by FDC |
Class A | -% | .25% | $ 169 | $ 10 |
Class T | .25% | .25% | 1,782 | 21 |
Class B | .75% | .25% | 72 | 54 |
Class C | .75% | .25% | 219 | 12 |
| | | $ 2,242 | $ 97 |
Sales Load. FDC receives a front-end sales charge of up to 5.75% for selling Class A shares, and 3.50% for selling Class T shares, some of which is paid to financial intermediaries for selling shares of the Fund. FDC receives the proceeds of contingent deferred sales charges levied on Class A, Class T, Class B, and Class C redemptions. These charges depend on the holding period. The deferred sales charges range from 5% to 1% for Class B, 1% for Class C, 1.00% for certain purchases of Class A shares (1.00% to .50% prior to July 12, 2010) and .25% for certain purchases of Class T shares.
For the period, sales charge amounts retained by FDC were as follows:
| Retained
by FDC |
Class A | $ 6 |
Class T | 5 |
Class B* | 9 |
Class C* | -** |
| $ 21 |
* When Class B and Class C shares are initially sold, FDC pays commissions from its own resources to financial intermediaries through which the sales are made.
** Amount represents less than $500.
Transfer Agent Fees. Fidelity Investments Institutional Operations Company, Inc. (FIIOC), an affiliate of FMR, is the transfer, dividend disbursing and shareholder servicing agent for each class of the Fund. FIIOC receives account fees and asset-based fees that vary according to the account size and type of account of the shareholders of the respective classes of the Fund. FIIOC pays for typesetting, printing and mailing of
Annual Report
5. Fees and Other Transactions with Affiliates - continued
Transfer Agent Fees - continued
shareholder reports, except proxy statements. For the period, transfer agent fees for each class were as follows:
| Amount | % of
Average
Net Assets |
Class A | $ 211 | .31 |
Class T | 834 | .23 |
Class B | 23 | .32 |
Class C | 68 | .31 |
Institutional Class | 1,574 | .21 |
| $ 2,710 | |
Accounting and Security Lending Fees. Fidelity Service Company, Inc. (FSC), an affiliate of FMR, maintains the Fund's accounting records. The accounting fee is based on the level of average net assets for the month. Under a separate contract, FSC administers the security lending program. The security lending fee is based on the number and duration of lending transactions.
Brokerage Commissions. The Fund placed a portion of its portfolio transactions with brokerage firms which are affiliates of the investment adviser. The commissions paid to these affiliated firms were $1 for the period.
Interfund Lending Program. Pursuant to an Exemptive Order issued by the SEC, the Fund, along with other registered investment companies having management contracts with FMR, may participate in an interfund lending program. This program provides an alternative credit facility allowing the funds to borrow from, or lend money to, other participating affiliated funds. The interest expense amounted to three hundred thirty-six dollars. At period end, there were no interfund loans outstanding. The Fund's activity in this program during the period for which loans were outstanding was as follows:
Borrower or Lender | Average Daily
Loan Balance | Weighted Average Interest Rate |
Borrower | $ 3,309 | .46% |
6. Committed Line of Credit.
The Fund participates with other funds managed by FMR or an affiliate in a $3.75 billion credit facility (the "line of credit") to be utilized for temporary or emergency purposes to fund shareholder redemptions or for other short-term liquidity purposes. The Fund has
Annual Report
Notes to Financial Statements - continued
(Amounts in thousands except ratios)
6. Committed Line of Credit - continued
agreed to pay commitment fees on its pro-rata portion of the line of credit, which amounted to $5 and is reflected in Miscellaneous expenses on the Statement of Operations. During the period, there were no borrowings on this line of credit.
7. Security Lending.
The Fund lends portfolio securities through a lending agent from time to time in order to earn additional income. The lending agent may loan securities to certain qualified borrowers, including Fidelity Capital Markets (FCM), a broker-dealer affiliated with the Fund. On the settlement date of the loan, the Fund receives collateral (in the form of U.S. Treasury obligations, letters of credit and/or cash) against the loaned securities and maintains collateral in an amount not less than 100% of the market value of the loaned securities during the period of the loan. The market value of the loaned securities is determined at the close of business of the Fund and any additional required collateral is delivered to the Fund on the next business day. If the borrower defaults on its obligation to return the securities loaned because of insolvency or other reasons, a fund could experience delays and costs in recovering the securities loaned or in gaining access to the collateral. Any cash collateral received is invested in the Fidelity Securities Lending Cash Central Fund. The value of loaned securities and cash collateral at period end are disclosed on the Fund's Statement of Assets and Liabilities. Security lending income represents the income earned on investing cash collateral, less rebates paid to borrowers and lending agent fees associated with the loan, plus any premium payments received for lending certain types of securities. Security lending income is presented in the Statement of Operations as a component of income from Fidelity Central Funds. During the period, there were no securities loaned to FCM. Total security lending income during the period amounted to $850.
8. Bank Borrowings.
The Fund is permitted to have bank borrowings for temporary or emergency purposes to fund shareholder redemptions. The Fund has established borrowing arrangements with certain banks. The interest rate on the borrowings is the bank's base rate, as revised from time to time. The average daily loan balance during the period for which loans were outstanding amounted to $4,478. The weighted average interest rate was .66%. The interest expense amounted to four hundred eleven dollars under the bank borrowing program. At period end, there were no bank borrowings outstanding.
Annual Report
9. Expense Reductions.
Many of the brokers with whom FMR places trades on behalf of the Fund provided services to the Fund in addition to trade execution. These services included payments of certain expenses on behalf of the Fund totaling $299 for the period.
10. Distributions to Shareholders.
Distributions to shareholders of each class were as follows:
Years ended October 31, | 2010 | 2009 |
From net investment income | | |
Class A | $ 950 | $ 1,238 |
Class T | 4,334 | 4,849 |
Class B | 45 | 48 |
Class C | 160 | 144 |
Institutional Class | 12,416 | 11,839 |
Total | $ 17,905 | $ 18,118 |
From net realized gain | | |
Class A | $ 134 | $ - |
Class T | 684 | - |
Class B | 15 | - |
Class C | 44 | - |
Institutional Class | 1,391 | - |
Total | $ 2,268 | $ - |
11. Share Transactions.
Transactions for each class of shares were as follows:
| Shares | Dollars |
Years ended October 31, | 2010 | 2009 | 2010 | 2009 |
Class A | | | | |
Shares sold | 475 | 855 | $ 7,655 | $ 11,113 |
Reinvestment of distributions | 61 | 87 | 1,012 | 1,028 |
Shares redeemed | (1,167) | (1,729) | (18,467) | (22,509) |
Net increase (decrease) | (631) | (787) | $ (9,800) | $ (10,368) |
Class T | | | | |
Shares sold | 4,009 | 5,593 | $ 65,721 | $ 75,113 |
Reinvestment of distributions | 288 | 387 | 4,889 | 4,696 |
Shares redeemed | (6,821) | (8,015) | (111,516) | (106,238) |
Net increase (decrease) | (2,524) | (2,035) | $ (40,906) | $ (26,429) |
Annual Report
Notes to Financial Statements - continued
(Amounts in thousands except ratios)
11. Share Transactions - continued
| Shares | Dollars |
Years ended October 31, | 2010 | 2009 | 2010 | 2009 |
Class B | | | | |
Shares sold | 48 | 92 | $ 740 | $ 1,164 |
Reinvestment of distributions | 3 | 4 | 54 | 43 |
Shares redeemed | (174) | (341) | (2,691) | (4,276) |
Net increase (decrease) | (123) | (245) | $ (1,897) | $ (3,069) |
Class C | | | | |
Shares sold | 120 | 330 | $ 1,913 | $ 4,291 |
Reinvestment of distributions | 11 | 10 | 176 | 119 |
Shares redeemed | (337) | (515) | (5,265) | (6,428) |
Net increase (decrease) | (206) | (175) | $ (3,176) | $ (2,018) |
Institutional Class | | | | |
Shares sold | 12,645 | 12,044 | $ 202,633 | $ 158,122 |
Reinvestment of distributions | 818 | 979 | 13,738 | 11,749 |
Shares redeemed | (21,576) | (7,282) | (349,589) | (99,736) |
Net increase (decrease) | (8,113) | 5,741 | $ (133,218) | $ 70,135 |
12. Other.
The Fund's organizational documents provide former and current trustees and officers with a limited indemnification against liabilities arising in connection with the performance of their duties to the Fund. In the normal course of business, the Fund may also enter into contracts that provide general indemnifications. The Fund's maximum exposure under these arrangements is unknown as this would be dependent on future claims that may be made against the Fund. The risk of material loss from such claims is considered remote.
At the end of the period, the Fidelity Advisor Freedom Funds were owners of record, in the aggregate, of approximately 33% of the total outstanding shares of the Fund.
Annual Report
To the Trustees of Fidelity Advisor Series VIII and the Shareholders of Fidelity Advisor Overseas Fund:
In our opinion, the accompanying statement of assets and liabilities, including the schedule of investments, and the related statements of operations and of changes in net assets and the financial highlights present fairly, in all material respects, the financial position of Fidelity Advisor Overseas Fund (a fund of Fidelity Advisor Series VIII) at October 31, 2010, the results of its operations for the year then ended, the changes in its net assets for each of the two years in the period then ended and the financial highlights for each of the five years in the period then ended, in conformity with accounting principles generally accepted in the United States of America. These financial statements and financial highlights (hereafter referred to as "financial statements") are the responsibility of the Fidelity Advisor Overseas Fund's management. Our responsibility is to express an opinion on these financial statements based on our audits. We conducted our audits of these financial statements in accordance with the standards of the Public Company Accounting Oversight Board (United States). Those standards require that we plan and perform the audit to obtain reasonable assurance about whether the financial statements are free of material misstatement. An audit includes examining, on a test basis, evidence supporting the amounts and disclosures in the financial statements, assessing the accounting principles used and significant estimates made by management, and evaluating the overall financial statement presentation. We believe that our audits, which included confirmation of securities at October 31, 2010 by correspondence with the custodian and brokers, provide a reasonable basis for our opinion.
/s/ PricewaterhouseCoopers LLP
PricewaterhouseCoopers LLP
Boston, Massachusetts
December 17, 2010
Annual Report
The Trustees, Member of the Advisory Board, and executive officers of the trust and fund, as applicable, are listed below. The Board of Trustees governs the fund and is responsible for protecting the interests of shareholders. The Trustees are experienced executives who meet periodically throughout the year to oversee the fund's activities, review contractual arrangements with companies that provide services to the fund, oversee management of the risks associated with such activities and contractual arrangements, and review the fund's performance. Except for James C. Curvey, each of the Trustees oversees 221 funds advised by FMR or an affiliate. Mr. Curvey oversees 410 funds advised by FMR or an affiliate.
The Trustees hold office without limit in time except that (a) any Trustee may resign; (b) any Trustee may be removed by written instrument, signed by at least two-thirds of the number of Trustees prior to such removal; (c) any Trustee who requests to be retired or who has become incapacitated by illness or injury may be retired by written instrument signed by a majority of the other Trustees; and (d) any Trustee may be removed at any special meeting of shareholders by a two-thirds vote of the outstanding voting securities of the trust. Each Trustee who is not an interested person (as defined in the 1940 Act) (Independent Trustee), shall retire not later than the last day of the calendar year in which his or her 72nd birthday occurs. The Independent Trustees may waive this mandatory retirement age policy with respect to individual Trustees. The executive officers and Advisory Board Member hold office without limit in time, except that any officer and Advisory Board Member may resign or may be removed by a vote of a majority of the Trustees at any regular meeting or any special meeting of the Trustees. Except as indicated, each individual has held the office shown or other offices in the same company for the past five years.
Experience, Skills, Attributes, and Qualifications of the Fund's Trustees. The Governance and Nominating Committee has adopted a statement of policy that describes the experience, qualifications, attributes, and skills that are necessary and desirable for potential Independent Trustee candidates (Statement of Policy). The Board believes that each Trustee satisfied at the time he or she was initially elected or appointed a Trustee, and continues to satisfy, the standards contemplated by the Statement of Policy. The Governance and Nominating Committee also engages professional search firms to help identify potential Independent Trustee candidates who have the experience, qualifications, attributes, and skills consistent with the Statement of Policy. From time to time, additional criteria based on the composition and skills of the current Independent Trustees, as well as experience or skills that may be appropriate in light of future changes to board composition, business conditions, and regulatory or other developments, have also been considered by the professional search firms and the Governance and Nominating Committee. In addition, the Board takes into account the Trustees' commitment and participation in Board and committee meetings, as well as their leadership of standing and ad hoc committees throughout their tenure.
In determining that a particular Trustee was and continues to be qualified to serve as a Trustee, the Board has considered a variety of criteria, none of which, in isolation, was controlling. The Board believes that, collectively, the Trustees have balanced and diverse experience, qualifications, attributes, and skills, which allow the Board to operate effectively in governing the fund and protecting the interests of shareholders. Information about the specific experience, skills, attributes, and qualifications of each Trustee, which in each case led to the Board's conclusion that the Trustee should serve (or continue to serve) as a trustee of the fund, is provided below.
Annual Report
Trustees and Officers - continued
Board Structure and Oversight Function. Edward C. Johnson 3d is an interested person (as defined in the 1940 Act) and currently serves as Chairman. The Trustees have determined that an interested Chairman is appropriate and benefits shareholders because an interested Chairman has a personal and professional stake in the quality and continuity of services provided to the fund. Independent Trustees exercise their informed business judgment to appoint an individual of their choosing to serve as Chairman, regardless of whether the Trustee happens to be independent or a member of management. The Independent Trustees have determined that they can act independently and effectively without having an Independent Trustee serve as Chairman and that a key structural component for assuring that they are in a position to do so is for the Independent Trustees to constitute a substantial majority for the Board. The Independent Trustees also regularly meet in executive session. Ned C. Lautenbach serves as Chairman of the Independent Trustees and as such (i) acts as a liaison between the Independent Trustees and management with respect to matters important to the Independent Trustees and (ii) with management prepares agendas for Board meetings.
Fidelity funds are overseen by different Boards of Trustees. The fund's Board oversees Fidelity's equity and high income funds and another Board oversees Fidelity's investment-grade bond, money market, and asset allocation funds. The asset allocation funds may invest in Fidelity funds overseen by the fund's Board. The use of separate Boards, each with its own committee structure, allows the Trustees of each group of Fidelity funds to focus on the unique issues of the funds they oversee, including common research, investment, and operational issues. On occasion, the separate Boards establish joint committees to address issues of overlapping consequences for the Fidelity funds overseen by each Board.
The Trustees operate using a system of committees to facilitate the timely and efficient consideration of all matters of importance to the Trustees, the fund, and fund shareholders and to facilitate compliance with legal and regulatory requirements and oversight of the fund's activities and associated risks. The Board, acting through its committees, has charged FMR and its affiliates with (i) identifying events or circumstances the occurrence of which could have demonstrably adverse effects on the fund's business and/or reputation; (ii) implementing processes and controls to lessen the possibility that such events or circumstances occur or to mitigate the effects of such events or circumstances if they do occur; and (iii) creating and maintaining a system designed to evaluate continuously business and market conditions in order to facilitate the identification and implementation processes described in (i) and (ii) above. Because the day-to-day operations and activities of the fund are carried out by or through FMR, its affiliates and other service providers, the fund's exposure to risks is mitigated but not eliminated by the processes overseen by the Trustees. While each of the Board's committees has responsibility for overseeing different aspects of the fund's activities, oversight is exercised primarily through the Operations, Audit, and Compliance Committees. Appropriate personnel, including but not limited to the fund's Chief Compliance Officer (CCO), FMR's internal auditor, the independent accountants, the fund's Treasurer and portfolio management personnel, make periodic reports to the Board's committees, as appropriate. The responsibilities of each committee, including their oversight responsibilities, are described further under "Standing Committees of the Fund's Trustees."
Annual Report
The fund's Statement of Additional Information (SAI) includes more information about the Trustees. To request a free copy, call Fidelity at 1-877-208-0098.
Interested Trustees*
Correspondence intended for each Trustee who is an interested person may be sent to Fidelity Investments, 82 Devonshire Street, Boston, Massachusetts 02109.
Name, Age; Principal Occupations and Other Relevant Experience+ |
Edward C. Johnson 3d (80) |
| Year of Election or Appointment: 1983 Mr. Johnson is Trustee and Chairman of the Board of Trustees of certain Trusts. Mr. Johnson serves as Chief Executive Officer, Chairman, and a Director of FMR LLC; Chairman and a Director of FMR; Chairman and a Director of Fidelity Research & Analysis Company (FRAC); Chairman and a Director of Fidelity Investments Money Management, Inc.; and Chairman and a Director of FMR Co., Inc. In addition, Mr. Johnson serves as Chairman and Director of FIL Limited. Previously, Mr. Johnson served as President of FMR LLC (2006-2007). |
James C. Curvey (75) |
| Year of Election or Appointment: 2007 Mr. Curvey also serves as Trustee (2007-present) of other investment companies advised by FMR. Mr. Curvey is a Director of Fidelity Investments Money Management, Inc. (2009-present), Director of Fidelity Research & Analysis Co. (2009-present) and Director of FMR and FMR Co., Inc. (2007-present). Mr. Curvey is also Vice Chairman (2007-present) and Director of FMR LLC. In addition, Mr. Curvey serves as an Overseer for the Boston Symphony Orchestra and a member of the Trustees of Villanova University. Previously, Mr. Curvey was the Vice Chairman (2006-2007) and Director (2000-2007) of FMR Corp. |
* Trustees have been determined to be "Interested Trustees" by virtue of, among other things, their affiliation with the trust or various entities under common control with FMR.
Annual Report
Trustees and Officers - continued
+ The information above includes each Trustee's principal occupation during the last five years and other information relating to the experience, attributes, and skills relevant to each Trustee's qualifications to serve as a Trustee, which led to the conclusion that each Trustee should serve as a Trustee for the fund.
Independent Trustees:
Correspondence intended for each Independent Trustee (that is, the Trustees other than the Interested Trustees) may be sent to Fidelity Investments, P.O. Box 55235, Boston, Massachusetts 02205-5235.
Name, Age; Principal Occupations and Other Relevant Experience+ |
Dennis J. Dirks (62) |
| Year of Election or Appointment: 2005 Prior to his retirement in May 2003, Mr. Dirks was Chief Operating Officer and a member of the Board of The Depository Trust & Clearing Corporation (DTCC). He also served as President, Chief Operating Officer, and Board member of The Depository Trust Company (DTC) and President and Board member of the National Securities Clearing Corporation (NSCC). In addition, Mr. Dirks served as Chief Executive Officer and Board member of the Government Securities Clearing Corporation, Chief Executive Officer and Board member of the Mortgage-Backed Securities Clearing Corporation, as a Trustee and a member of the Finance Committee of Manhattan College (2005-2008), and as a Trustee and a member of the Finance Committee of AHRC of Nassau County (2006-2008). Mr. Dirks is a member of the Independent Directors Council (IDC) Governing Council (2010-Present) and Board of Directors for The Brookville Center for Children's Services, Inc. (2009-present). |
Alan J. Lacy (57) |
| Year of Election or Appointment: 2008 Mr. Lacy serves as Senior Adviser (2007-present) of Oak Hill Capital Partners, L.P. (private equity). Mr. Lacy also served as Chief Executive Officer (2000-2005) and Vice Chairman (2005-2006) of Sears Holdings Corporation and Sears, Roebuck and Co. (retail). In addition, Mr. Lacy serves as a member of the Board of Directors of The Western Union Company (global money transfer, 2006-present) and Bristol-Myers Squibb Company (global pharmaceuticals, 2007-present). Mr. Lacy is Chairman (2008-present) and a member (2006-present) of the Board of Trustees of The National Parks Conservation Association. |
Ned C. Lautenbach (66) |
| Year of Election or Appointment: 2000 Mr. Lautenbach is Chairman of the Independent Trustees of the Equity and High Income Funds (2006-present). Mr. Lautenbach currently serves as the Lead Director of the Eaton Corporation Board of Directors (diversified industrial, 1997-present). Mr. Lautenbach is also a member of the Board of Directors of the Philharmonic Center for the Arts in Naples, Florida (1999-present); a member of the Board of Trustees of Fairfield University (2005-present); and a member of the Council on Foreign Relations (1994-present). Previously, Mr. Lautenbach was a Partner/Advisory Partner at Clayton, Dubilier & Rice, Inc. (private equity investment, 1998-2010), as well as a Director of Sony Corporation (2006-2007). |
Joseph Mauriello (66) |
| Year of Election or Appointment: 2008 Prior to his retirement in January 2006, Mr. Mauriello served in numerous senior management positions including Deputy Chairman and Chief Operating Officer (2004-2005), and Vice Chairman of Financial Services (2002-2004) of KPMG LLP US (professional services, 1965-2005). Mr. Mauriello currently serves as a member of the Board of Directors of XL Group plc. (global insurance and re-insurance, 2006-present) and of Arcadia Resources Inc. (health care services and products, 2007-present). Previously, Mr. Mauriello served as a Director of the Hamilton Funds of the Bank of New York (2006-2007). |
Cornelia M. Small (66) |
| Year of Election or Appointment: 2005 Ms. Small is a member of the Board of Directors of the Teagle Foundation (2009-present). Ms. Small is also a member of the Investment Committee, and Chair (2008-present) and a member of the Board of Trustees of Smith College. In addition, Ms. Small serves on the Investment Committee of the Berkshire Taconic Community Foundation (2008-present). Previously, Ms. Small served as Chairperson of the Investment Committee (2002-2008) of Smith College. In addition, Ms. Small served as Chief Investment Officer, Director of Global Equity Investments, and a member of the Board of Directors of Scudder, Stevens & Clark and Scudder Kemper Investments. |
William S. Stavropoulos (71) |
| Year of Election or Appointment: 2001 Mr. Stavropoulos is Vice Chairman of the Independent Trustees of the Equity and High Income Funds (2006-present). Mr. Stavropoulos serves as President and Founder of the Michigan Baseball Foundation, the Great Lakes Loons (2007-present). Mr. Stavropoulos is Chairman Emeritus of the Board of Directors of The Dow Chemical Company, where he previously served in numerous senior management positions, including President, CEO (1995-2000; 2002-2004), Chairman of the Executive Committee (2000-2006), and as a member of the Board of Directors (1990-2006). Currently, Mr. Stavropoulos is Chairman of Univar (global distributor of commodity and specialty chemicals, 2010-present), a Director of Teradata Corporation (data warehousing and technology solutions, 2008-present), Chemical Financial Corporation, Maersk Inc. (industrial conglomerate), Tyco International, Inc. (multinational manufacturing and services, 2007-present), and a member of the Advisory Board for Metalmark Capital (private equity investment, 2005- present). Mr. Stavropoulos is a special advisor to Clayton, Dubilier & Rice, Inc. (private equity investment). In addition, Mr. Stavropoulos is a member of the University of Notre Dame Advisory Council for the College of Science. |
David M. Thomas (61) |
| Year of Election or Appointment: 2008 Previously, Mr. Thomas served as Executive Chairman (2005-2006) and Chairman and Chief Executive Officer (2000-2005) of IMS Health, Inc. (pharmaceutical and healthcare information solutions). In addition, Mr. Thomas serves as a member of the Board of Directors of Fortune Brands, Inc. (consumer products), and Interpublic Group of Companies, Inc. (marketing communication, 2004-present). |
Michael E. Wiley (60) |
| Year of Election or Appointment: 2008 Mr. Wiley also serves as a Director of Asia Pacific Exploration Consolidated (international oil and gas exploration and production, 2008-present). Mr. Wiley serves as a Director of Tesoro Corporation (independent oil refiner and marketer, 2005-present), and a Director of Bill Barrett Corporation (exploration and production, 2005-present). In addition, Mr. Wiley also serves as a Director of Post Oak Bank (privately-held bank, 2004-present). Previously, Mr. Wiley served as a member of the Board of Trustees of the University of Tulsa (2000-2006; 2007-2010), as a Senior Energy Advisor of Katzenbach Partners, LLC (consulting, 2006-2007), as an Advisory Director of Riverstone Holdings (private investment), Chairman, President, and CEO of Baker Hughes, Inc. (oilfield services, 2000-2004), and as Director of Spinnaker Exploration Company (exploration and production, 2001-2005). |
Annual Report
+ The information above includes each Trustee's principal occupation during the last five years and other information relating to the experience, attributes, and skills relevant to each Trustee's qualifications to serve as a Trustee, which led to the conclusion that each Trustee should serve as a Trustee for the fund.
Advisory Board Member and Executive Officers:
Correspondence intended for each executive officer and Peter S. Lynch may be sent to Fidelity Investments, 82 Devonshire Street, Boston, Massachusetts 02109.
Name, Age; Principal Occupation |
Peter S. Lynch (66) |
| Year of Election or Appointment: 2003 Member of the Advisory Board of Fidelity's Equity and High Income Funds. Mr. Lynch is Vice Chairman and a Director of FMR and FMR Co., Inc. In addition, Mr. Lynch serves as a Trustee of Boston College and as the Chairman of the Inner-City Scholarship Fund. Previously, Mr. Lynch served on the Special Olympics International Board of Directors (1997-2006). |
Kenneth B. Robins (41) |
| Year of Election or Appointment: 2008 President and Treasurer of Fidelity's Equity and High Income Funds. Mr. Robins also serves as President and Treasurer (2010-present) and Assistant Treasurer (2009-present) of other Fidelity funds and is an employee of Fidelity Investments (2004-present). Previously, Mr. Robins served as Deputy Treasurer of the Fidelity funds (2005-2008) and Treasurer and Chief Financial Officer of The North Carolina Capital Management Trust: Cash and Term Portfolios (2006-2008). |
Bruce T. Herring (45) |
| Year of Election or Appointment: 2006 Vice President of certain Equity Funds. Mr. Herring also serves as Chief Investment Officer and Director of Fidelity Management & Research (U.K.) Inc. (2010-present) and Group Chief Investments Officer of FMR. Previously, Mr. Herring served as Vice President (2005-2006) and Senior Vice President (2006-2007) of Fidelity Management & Research Company, Vice President of FMR Co., Inc. (2001-2007) and as a portfolio manager for Fidelity U.S. Equity Funds. |
Brian B. Hogan (46) |
| Year of Election or Appointment: 2009 Vice President of certain Equity Funds and Vice President of Sector Funds. Mr. Hogan also serves as President of FMR's Equity Division (2009-present). Previously, Mr. Hogan served as Senior Vice President, Equity Research of FMR (2006-2009) and as a portfolio manager. |
Scott C. Goebel (42) |
| Year of Election or Appointment: 2008 Secretary and Chief Legal Officer (CLO) of the Fidelity funds. Mr. Goebel also serves as Secretary and CLO of The North Carolina Capital Management Trust: Cash and Term Portfolio (2008-present); General Counsel, Secretary, and Senior Vice President of FMR (2008-present) and FMR Co., Inc. (2008-present); Deputy General Counsel of FMR LLC; Chief Legal Officer of Fidelity Management & Research (Hong Kong) Limited (2008-present) and Assistant Secretary of Fidelity Management & Research (Japan) Inc. (2008-present), Fidelity Investments Money Management, Inc. (2008-present), Fidelity Management & Research (U.K.) Inc. (2008-present), and Fidelity Research and Analysis Company (2008-present). Previously, Mr. Goebel served as Assistant Secretary of the Funds (2007-2008) and as Vice President and Secretary of Fidelity Distributors Corporation (FDC) (2005-2007). |
William C. Coffey (41) |
| Year of Election or Appointment: 2009 Assistant Secretary of Fidelity's Equity and High Income Funds. Mr. Coffey also serves as Senior Vice President and Deputy General Counsel of FMR LLC (2010-present), and is an employee of Fidelity Investments. Previously, Mr. Coffey served as Vice President and Associate General Counsel of FMR LLC (2005-2009). |
Holly C. Laurent (56) |
| Year of Election or Appointment: 2008 Anti-Money Laundering (AML) Officer of the Fidelity funds. Ms. Laurent also serves as AML Officer of The North Carolina Capital Management Trust: Cash and Term Portfolio (2008-present) and is an employee of Fidelity Investments. Previously, Ms. Laurent was Senior Vice President and Head of Legal for Fidelity Business Services India Pvt. Ltd. (2006-2008), and Senior Vice President, Deputy General Counsel and Group Head for FMR LLC (2005-2006). |
Christine Reynolds (52) |
| Year of Election or Appointment: 2008 Chief Financial Officer of the Fidelity funds. Ms. Reynolds became President of Fidelity Pricing and Cash Management Services (FPCMS) in August 2008. Ms. Reynolds served as Chief Operating Officer of FPCMS (2007-2008). Previously, Ms. Reynolds served as President, Treasurer, and Anti-Money Laundering officer of the Fidelity funds (2004-2007). |
Kenneth A. Rathgeber (63) |
| Year of Election or Appointment: 2004 Chief Compliance Officer of Fidelity's Equity and High Income Funds. Mr. Rathgeber is Chief Compliance Officer of Fidelity Management & Research (Hong Kong) Limited (2008-present), Fidelity Management & Research (Japan) Inc. (2008-present), FMR (2005-present), FMR Co., Inc. (2005-present), Fidelity Management & Research (U.K.) Inc. (2005-present), Fidelity Research & Analysis Company (2005-present), Fidelity Investments Money Management, Inc. (2005-present), Pyramis Global Advisors, LLC (2005-present), and Strategic Advisers, Inc. (2005-present). |
Jeffrey S. Christian (49) |
| Year of Election or Appointment: 2009 Deputy Treasurer of the Fidelity funds. Mr. Christian is an employee of Fidelity Investments. Previously, Mr. Christian served as Chief Financial Officer (2008-2009) of certain Fidelity funds and Senior Vice President of Fidelity Pricing and Cash Management Services (FPCMS) (2004-2009). |
Bryan A. Mehrmann (49) |
| Year of Election or Appointment: 2005 Deputy Treasurer of the Fidelity funds. Mr. Mehrmann is an employee of Fidelity Investments. |
Adrien E. Deberghes (43) |
| Year of Election or Appointment: 2008 Deputy Treasurer of Fidelity's Equity and High Income Funds. Mr. Deberghes also serves as Assistant Treasurer of other Fidelity funds (2010-present) and is an employee of Fidelity Investments (2008-present). Previously, Mr. Deberghes served as Senior Vice President of Mutual Fund Administration at State Street Corporation (2007-2008), Senior Director of Mutual Fund Administration at Investors Bank & Trust (2005-2007), and Director of Finance for Dunkin' Brands (2000-2005). |
Stephanie J. Dorsey (41) |
| Year of Election or Appointment: 2010 Assistant Treasurer of Fidelity's Equity and High Income Funds. Ms. Dorsey also serves as Deputy Treasurer of other Fidelity funds (2008-present) and is an employee of Fidelity Investments (2008-present). Previously, Ms. Dorsey served as Treasurer (2004-2008) of the JPMorgan Mutual Funds and Vice President (2004-2008) of JPMorgan Chase Bank. |
John R. Hebble (52) |
| Year of Election or Appointment: 2009 Assistant Treasurer of Fidelity's Equity and High Income Funds. Mr. Hebble also serves as Treasurer and Chief Financial Officer of The North Carolina Capital Management Trust: Cash and Term Portfolio (2008-present), President and Treasurer of other Fidelity funds (2008-present) and is an employee of Fidelity Investments. |
Gary W. Ryan (52) |
| Year of Election or Appointment: 2005 Assistant Treasurer of the Fidelity funds. Mr. Ryan is an employee of Fidelity Investments. Previously, Mr. Ryan served as Vice President of Fund Reporting in Fidelity Pricing and Cash Management Services (FPCMS) (1999-2005). |
Jonathan Davis (42) |
| Year of Election or Appointment: 2010 Assistant Treasurer of the Fidelity funds. Mr. Davis is an employee of Fidelity Investments. Previously, Mr. Davis served as Vice President and Associate General Counsel of FMR LLC (2003-2010). |
Annual Report
The Board of Trustees of Fidelity Advisor Overseas Fund voted to pay to shareholders of record at the opening of business on record date, the following distributions per share derived from capital gains realized from sales of portfolio securities, and dividends derived from net investment income:
| Pay Date | Record Date | Dividends | Capital Gains |
Institutional Class | 12/06/10 | 12/03/10 | $.241 | $.045 |
Institutional Class designates 100% of the dividend distributed during the fiscal year as amounts which may be taken into account as a dividend for purposes of the maximum rate under section 1(h)(11) of the Internal Revenue Code.
The amounts per share which represent income derived from sources within, and taxes paid to, foreign countries or possessions of the United States are as follows:
| Pay Date | Income | Taxes |
Institutional Class | 12/07/09 | $.242 | $.0190 |
The fund will notify shareholders in January 2011 of amounts for use in preparing 2010 income tax returns.
Annual Report
Board Approval of Investment Advisory Contracts and Management Fees
Fidelity Advisor Overseas Fund
Each year, the Board of Trustees, including the Independent Trustees (together, the Board), votes on the renewal of the management contract and sub-advisory agreements (together, the Advisory Contracts) for the fund. The Board, assisted by the advice of fund counsel and Independent Trustees' counsel, requests and considers a broad range of information relevant to the renewal of the Advisory Contracts throughout the year.
The Board meets regularly and considers at each of its meetings factors that are relevant to its annual consideration of the renewal of the fund's Advisory Contracts, including the services and support provided to the fund and its shareholders. The Board has established various standing committees, each composed of Independent Trustees with varying backgrounds, to which the Board has assigned specific subject matter responsibilities in order to enhance effective decision-making by the Board. The Board, acting directly and through its Committees, requests and receives information concerning the annual consideration of the renewal of the fund's Advisory Contracts. The Board also meets as needed to consider matters specifically related to the Board's annual consideration of the renewal of Advisory Contracts. Members of the Board may also meet with trustees of other Fidelity funds through ad hoc joint committees to discuss certain matters relevant to the Fidelity funds.
At its July 2010 meeting, the Board of Trustees, including the Independent Trustees, unanimously determined to renew the fund's Advisory Contracts. In reaching its determination, the Board considered all factors it believed relevant, including (i) the nature, extent, and quality of the services to be provided to the fund and its shareholders (including the investment performance of the fund); (ii) the competitiveness of the fund's management fee and total expenses; (iii) the total costs of the services to be provided by and the profits to be realized by Fidelity from its relationship with the fund; (iv) the extent to which economies of scale would be realized as the fund grows; and (v) whether fee levels reflect these economies of scale, if any, for the benefit of fund shareholders.
In considering whether to renew the Advisory Contracts for the fund, the Board reached a determination, with the assistance of fund counsel and Independent Trustees' counsel and through the exercise of its business judgment, that the renewal of the Advisory Contracts is in the best interests of fund shareholders and that the compensation to be received by Fidelity under the management contract is fair and reasonable. The Board's decision to renew the Advisory Contracts was not based on any single factor noted above, but rather was based on a comprehensive consideration of all the information provided to the Board at its meetings throughout the year. The Board, in reaching its determination to renew the Advisory Contracts, is aware that shareholders in the fund have a broad range of investment choices available to them, including a wide choice among mutual funds offered by Fidelity's competitors, and that the fund's shareholders, with the opportunity to review and weigh the disclosure provided by the fund in its prospectus and other public disclosures, have chosen to invest in this fund, managed by Fidelity.
Annual Report
Nature, Extent, and Quality of Services Provided. The Board considered the staffing within the investment adviser, FMR, and the sub-advisers (together, the Investment Advisers), including the backgrounds of the fund's investment personnel and the fund's investment objective and discipline. The Independent Trustees also had discussions with senior management of Fidelity's investment operations and investment groups. The Board considered the structure of the portfolio manager compensation program and whether this structure provides appropriate incentives to act in the best interest of the fund.
Resources Dedicated to Investment Management and Support Services. The Board and the equity research subcommittee of the Board's Fund Oversight Committee reviewed the size, education, and experience of the Investment Advisers' investment staff, their use of technology, and the Investment Advisers' approach to recruiting, training, and retaining portfolio managers and other research, advisory, and management personnel. The Board noted that Fidelity's analysts have access to a variety of technological tools and market and securities data that enable them to perform both fundamental and quantitative analysis and to specialize in various disciplines. The Board considered Fidelity's extensive global research capabilities that enable the Investment Advisers to aggregate data from various sources in an effort to produce positive investment results. The Board also considered that Fidelity's portfolio managers and analysts have access to daily portfolio attribution that allows for monitoring of a fund's portfolio, as well as an electronic communication system that provides immediate real-time access to research concerning issuers and credit enhancers. The Board noted FMR's continued focus on strengthening the organization and discipline of equity portfolio management and research.
Shareholder and Administrative Services. The Board considered (i) the nature, extent, quality, and cost of advisory, administrative, and shareholder services performed by the Investment Advisers and their affiliates under the Advisory Contracts and under separate agreements covering transfer agency, pricing and bookkeeping, and securities lending services for the fund; (ii) the nature and extent of the investment adviser's supervision of third party service providers, principally custodians and subcustodians; and (iii) the resources devoted to, and the record of compliance with, the fund's compliance policies and procedures. The Board also reviewed the allocation of fund brokerage, including allocations to brokers affiliated with the Investment Advisers, the use of brokerage commissions to pay fund expenses, and the use of "soft" commission dollars to pay for research services.
The Board noted that the growth of fund assets over time across the complex allows Fidelity to reinvest in the development of services designed to enhance the value or convenience of the Fidelity funds as investment vehicles. These services include 24-hour access to account information and market information through phone representatives and over the Internet, and investor education materials and asset allocation tools.
Annual Report
Board Approval of Investment Advisory Contracts and
Management Fees - continued
Investment in a Large Fund Family. The Board considered the benefits to shareholders of investing in a Fidelity fund, including the benefits of investing in a fund that is part of a large family of funds offering a variety of investment disciplines and providing a large variety of mutual fund investor services. The Board noted that Fidelity had taken, or had made recommendations that resulted in the Fidelity funds taking, a number of actions over the previous year that benefited particular funds, including (i) dedicating additional resources to investment research and restructuring and broadening the focus of the investment research teams; (ii) bolstering the senior management team that oversees asset management; (iii) launching Class F of certain funds as a lower-fee class available to Freedom K and Freedom Index Funds; (iv) lowering the initial investment minimums and ongoing balance requirements for Real Estate High Income Fund; (v) eliminating subsequent purchase minimums for all funds and adding a waiver of the investment minimum requirement for new accounts opened with the proceeds of a systematic withdrawal plan; (vi) eliminating the withdrawal minimum and maximum limits for systematic withdrawals from Advisor funds; (vii) expanding sales load waivers on Class A shares for Destiny Planholders and expanding Institutional Class eligibility for Class O Destiny Planholders; and (viii) changing certain Class A and Class T sales charge structures to further align them with industry practices.
Investment Performance. The Board considered whether the fund has operated in accordance with its investment objective, as well as its record of compliance with its investment restrictions. It also reviewed the fund's absolute investment performance for each class, as well as the fund's relative investment performance for each class measured over multiple periods against (i) a broad-based securities market index, and (ii) a peer group of mutual funds deemed appropriate by Fidelity and reviewed by the Board. The following charts considered by the Board show, over the one-, three-, and five-year periods ended December 31, 2009, the cumulative total returns of Institutional Class (Class I) and Class B of the fund, the cumulative total returns of a broad-based securities market index ("benchmark"), and a range of cumulative total returns of a peer group of mutual funds identified by Morningstar, Inc. as having an investment style similar to that of the fund based on underlying portfolio holdings. The returns of Institutional Class (Class I) and Class B show the performance of the highest and lowest performing classes, respectively (based on five-year performance). The box within each chart shows the 25th percentile return (bottom of box) and the 75th percentile return (top of box) of the peer group. Returns shown above the box are in the first quartile and returns shown below the box are in the fourth quartile. The percentage beaten numbers noted below each chart correspond to the percentile box and represent the percentage of funds in the peer group whose performance was equal to or lower than that of the class indicated.
Annual Report
Fidelity Advisor Overseas Fund
The Board reviewed the fund's relative investment performance against its peer group and noted that the performance of Institutional Class (Class I) of the fund was in the third quartile for the one- and five-year periods and the second quartile for the three-year period. The Board also noted that the investment performance of the fund was lower than its benchmark for the one- and five-year periods, although the three-year cumulative total return of Institutional Class (Class I) compared favorably to its benchmark. The Board considered that the variations in performance among the fund's classes reflect the variations in class expenses, which result in lower performance for higher expense classes. The Board also reviewed the fund's performance since inception as well as performance in the current year.
The Board also considered that the fund's management fee is subject to upward or downward adjustment depending upon whether, and to what extent, the fund's investment performance for the performance period exceeds, or is exceeded by, the record (over the same period) of a Board-approved performance adjustment index. The Board realizes that the performance adjustment provides FMR with a strong economic incentive to seek to achieve superior performance for the fund's shareholders and helps to more closely align the interests of FMR and the fund's shareholders.
Based on its review, and giving particular weight to the nature and quality of the resources dedicated by the Investment Advisers to maintain and improve relative performance and factoring in the unprecedented market events in recent years, the Board concluded that the nature, extent, and quality of investment management and support services and of shareholder and administrative services provided to the fund will benefit the fund's shareholders, particularly in light of the Board's view that the fund's shareholders benefit from investing in a fund that is part of a large family of funds offering a variety of investment disciplines and services.
Annual Report
Board Approval of Investment Advisory Contracts and
Management Fees - continued
Competitiveness of Management Fee and Total Fund Expenses. The Board considered the fund's management fee and total expenses compared to "mapped groups" of competitive funds and classes. Fidelity creates "mapped groups" by combining similar Lipper investment objective categories that have comparable management fee characteristics. Combining Lipper investment objective categories aids the Board's management fee and total expense comparisons by broadening the competitive group used for comparison and by reducing the number of universes to which various Fidelity funds are compared.
Management Fee. The Board considered two proprietary management fee comparisons for the 12-month periods shown in the chart below. The group of Lipper funds used by the Board for management fee comparisons is referred to below as the "Total Mapped Group." The Total Mapped Group comparison focuses on a fund's standing relative to the total universe of comparable funds available to investors, in terms of gross management fees before expense reimbursements or caps, and without giving effect to the fund's performance adjustment. "TMG %" represents the percentage of funds in the Total Mapped Group that had management fees that were lower than the fund's. For example, a TMG % of 15% means that 85% of the funds in the Total Mapped Group had higher management fees than the fund. The "Asset-Size Peer Group" (ASPG) comparison focuses on a fund's standing relative to non-Fidelity funds similar in size to the fund within the Total Mapped Group. The ASPG represents at least 15% of the funds in the Total Mapped Group with comparable asset size and management fee characteristics, subject to a minimum of 50 funds (or all funds in the Total Mapped Group if fewer than 50). Additional information, such as the ASPG quartile in which the fund's management fee ranked and the impact of the fund's performance adjustment, is also included in the chart and considered by the Board.
Annual Report
Fidelity Advisor Overseas Fund
The Board noted that the fund's management fee ranked below the median of its Total Mapped Group and below the median of its ASPG for 2009. The Board also noted the effect of the fund's performance adjustment on the fund's management fee ranking. The Board noted that the performance adjustment for each year represents calculations for performance periods that differ from the periods shown in the performance charts above.
Based on its review, the Board concluded that the fund's management fee is fair and reasonable in light of the services that the fund receives and the other factors considered.
Total Expenses. In its review of each class's total expenses, the Board considered the fund's management fee as well as other fund or class expenses, as applicable, such as transfer agent fees, pricing and bookkeeping fees, fund-paid 12b-1 fees, and custodial, legal, and audit fees. The Board also noted the effects of any waivers and reimbursements on fees and expenses, as well as the impact of the fund's performance adjustment. As part of its review, the Board also considered current and historical total expenses of each class of the fund compared to competitive fund median expenses. Each class of the fund is compared to those funds and classes in the Total Mapped Group (used by the Board for management fee comparisons) that have a similar sales load structure.
The Board noted that the total expenses of each of Class A, Class B, Class C, and Institutional Class ranked below its competitive median for 2009 and the total expenses of Class T ranked above its competitive median for 2009. The Board considered that the total expenses for Class T were above the median primarily because its 12b-1 fee is higher than the typical front-end load class. The Board noted that the fund offers multiple classes, each of which has a different sales load and 12b-1 fee structure, and that the multiple structures are intended to offer a range of pricing options for the intermediary market. The Board also noted that the total expenses of the classes vary primarily by the level of their 12b-1 fees, although differences in transfer agent fees may also cause expenses to vary from class to class.
Annual Report
Board Approval of Investment Advisory Contracts and
Management Fees - continued
Fees Charged to Other Fidelity Clients. The Board also considered Fidelity fee structures and other information with respect to clients of FMR and its affiliates, such as other mutual funds advised or subadvised by FMR or its affiliates, pension plan clients, and other institutional clients. In March 2010, the Board created an ad hoc joint committee with the board of other Fidelity funds (the Committee) to review and compare Fidelity's institutional investment advisory business with its business of providing services to the Fidelity funds, including the differences in services provided, fees charged, and costs incurred, as well as competition in their respective marketplaces.
Based on its review of total expenses and fees charged to other Fidelity clients, the Board concluded that the total expenses of each class of the fund were reasonable, although in one case above the median of the universe presented for comparison, in light of the services that the fund and its shareholders receive and the other factors considered, including the findings of the Committee.
Costs of the Services and Profitability. The Board considered the revenues earned and the expenses incurred by Fidelity in conducting the business of developing, marketing, distributing, managing, administering and servicing the fund and its shareholders. The Board also considered the level of Fidelity's profits in respect of all the Fidelity funds.
On an annual basis, FMR presents to the Board Fidelity's profitability for the fund. Fidelity calculates the profitability for each fund, as well as aggregate profitability for groups of Fidelity funds and all Fidelity funds, using a series of detailed revenue and cost allocation methodologies which originate with the audited books and records of Fidelity. The Audit Committee of the Board reviews any significant changes from the prior year's methodologies.
PricewaterhouseCoopers LLP (PwC), independent registered public accounting firm and auditor to Fidelity and certain Fidelity funds, has been engaged annually by the Board as part of the Board's assessment of Fidelity's profitability analysis. PwC's engagement includes the review and assessment of Fidelity's methodologies used in determining the revenues and expenses attributable to Fidelity's mutual fund business, and completion of agreed-upon procedures surrounding the mathematical accuracy of fund profitability and its conformity to allocation methodologies. After considering PwC's reports issued under the engagement and information provided by Fidelity, the Board believes that while other allocation methods may also be reasonable, Fidelity's profitability methodologies are reasonable in all material respects.
Annual Report
The Board has also reviewed Fidelity's non-fund businesses and fall-out benefits related to the mutual fund business as well as cases where Fidelity's affiliates may benefit from or be related to the fund's business.
The Board considered the costs of the services provided by and the profits realized by Fidelity in connection with the operation of the fund and were satisfied that the profitability was not excessive in the circumstances.
Economies of Scale. The Board considered whether there have been economies of scale in respect of the management of the Fidelity funds, whether the Fidelity funds (including the fund) have appropriately benefited from any such economies of scale, and whether there is potential for realization of any further economies of scale. The Board considered the extent to which the fund will benefit from economies of scale through increased services to the fund, through waivers or reimbursements, or through fee or expense reductions.
In February 2009, the Board and the board of other Fidelity funds created an ad hoc committee (the Economies of Scale Committee) to analyze whether FMR attains economies of scale in respect of the management and servicing of the Fidelity funds, whether the Fidelity funds have appropriately benefited from such economies of scale, and whether there is potential for realization of any further economies of scale.
The Board recognized that the fund's management contract incorporates a "group fee" structure, which provides for lower group fee rates as total fund assets under FMR's management increase, and for higher group fee rates as total fund assets under FMR's management decrease. FMR calculates the group fee rates based on a tiered asset "breakpoint" schedule that varies based on asset class. The Board considered that the group fee is designed to deliver the benefits of economies of scale to fund shareholders when total Fidelity fund assets increase, even if assets of any particular fund are unchanged or have declined, because some portion of Fidelity's costs are attributable to services provided to all Fidelity funds, and all funds benefit if those costs can be allocated among more assets. The Board concluded that, given the group fee structure, fund shareholders will benefit from lower management fees as assets under FMR's management increase at the fund complex level, regardless of whether Fidelity achieves any such economies of scale.
The Board concluded, considering the findings of the Economies of Scale Committee, that any potential economies of scale are being appropriately shared between fund shareholders and Fidelity.
Additional Information Requested by the Board. In order to develop fully the factual basis for consideration of the Fidelity funds' Advisory Contracts, the Board requested and received additional information on certain topics, including (i) fund performance trends, actions to be taken by FMR to improve certain funds' overall performance, and Fidelity's long-term strategies for certain funds; (ii) portfolio manager changes that have occurred during the past year and length of portfolio manager tenure for different categories of funds over time; (iii) Fidelity's compensation structure for portfolio managers, research analysts, and other key personnel, the rationale for the compensation structure, and how the compensation structure provides appropriate performance incentives; (iv) the amount of the investment that each portfolio manager has made in the Fidelity fund(s) that he or she manages; (v) management and other fees paid by FMR to affiliated sub-advisers on behalf of the Fidelity funds; (vi) Fidelity's fee structures and rationale for recommending different fees among different categories of funds; (vii) Fidelity's rationale for recommending which funds should have a performance adjustment component as part of their management fees; (viii) the rationale for any differences between fund fee structures and fee structures in place for other Fidelity clients; and (ix) explanations regarding the relative total expenses borne by certain funds and classes, total expense competitive trends, and actions that might be taken by FMR to reduce total expenses for certain funds and classes.
Annual Report
Board Approval of Investment Advisory Contracts and
Management Fees - continued
Based on its evaluation of all of the conclusions noted above, and after considering all factors it believed relevant, the Board ultimately concluded that the advisory fee structures are fair and reasonable, and that the fund's Advisory Contracts should be renewed.
Annual Report
Investment Adviser
Fidelity Management & Research Company
Boston, MA
Investment Sub-Advisers
FMR Co., Inc.
Fidelity Management & Research
(U.K.) Inc.
Fidelity Research & Analysis Company
Fidelity Management & Research
(Hong Kong) Limited
FIL Investments (Japan) Limited
Fidelity Management & Research (Japan) Inc.
FIL Investment Advisors (UK) Limited
FIL Investment Advisors
General Distributor
Fidelity Distributors Corporation
Boston, MA
Transfer and Service Agents
Fidelity Investments Institutional Operations Company, Inc.
Boston, MA
Fidelity Service Company, Inc.
Boston, MA
Custodian
The Northern Trust Company
Chicago, IL
OSI-UANN-1210
1.784768.107
(Fidelity Investment logo)(registered trademark)
Fidelity AdvisorSM
Value Leaders
Fund - Class A, Class T, Class B
and Class C
Annual Report
October 31, 2010
(2_fidelity_logos) (Registered_Trademark)
Contents
Chairman's Message | <Click Here> | The Chairman's message to shareholders. |
Performance | <Click Here> | How the fund has done over time. |
Management's Discussion of Fund Performance | <Click Here> | The Portfolio Manager's review of fundperformance and strategy. |
Shareholder Expense Example | <Click Here> | An example of shareholder expenses. |
Investment Changes | <Click Here> | A summary of major shifts in the fund's investments over the past six months. |
Investments | <Click Here> | A complete list of the fund's investments with their market values. |
Financial Statements | <Click Here> | Statements of assets and liabilities, operations, and changes in net assets, as well as financial highlights. |
Notes | <Click Here> | Notes to the financial statements. |
Report of Independent Registered Public Accounting Firm | <Click Here> | |
Trustees and Officers | <Click Here> | |
Distributions | <Click Here> | |
Board Approval of Investment Advisory Contracts and Management Fees | <Click Here> | |
To view a fund's proxy voting guidelines and proxy voting record for the 12-month period ended June 30, visit http://www.fidelity.com/proxyvotingresults or visit the Securities and Exchange Commission's (SEC) web site at http://www.sec.gov. You may also call 1-877-208-0098 to request a free copy of the proxy voting guidelines.
Standard & Poor's, S&P and S&P 500 are registered service marks of The McGraw-Hill Companies, Inc. and have been licensed for use by Fidelity Distributors Corporation.
Other third party marks appearing herein are the property of their respective owners.
All other marks appearing herein are registered or unregistered trademarks or service marks of FMR LLC or an affiliated company.
Annual Report
This report and the financial statements contained herein are submitted for the general information of the shareholders of the fund. This report is not authorized for distribution to prospective investors in the fund unless preceded or accompanied by an effective prospectus.
A fund files its complete schedule of portfolio holdings with the SEC for the first and third quarters of each fiscal year on Form N-Q. Forms N-Q are available on the SEC's web site at http://www.sec.gov. A fund's Forms N-Q may be reviewed and copied at the SEC's Public Reference Room in Washington, DC. Information regarding the operation of the SEC's Public Reference Room may be obtained by calling 1-800-SEC-0330. For a complete list of a fund's portfolio holdings, view the most recent holdings listing, semiannual report, or annual report on Fidelity's web site at http://www.fidelity.com or http://www.advisor.fidelity.com, as applicable.
NOT FDIC INSURED • MAY LOSE VALUE • NO BANK GUARANTEE
Neither the fund nor Fidelity Distributors Corporation is a bank.
Annual Report
(photo_of_Edward_C_Johnson_3d)
Dear Shareholder:
Equities have staged a rally in the second half of 2010, shaking off concerns about the European debt crisis and the possibility of a double-dip recession in the U.S. Although the short-term surge pushed major equity indexes back into positive territory for the year, several questions remain about the longer-term outlook, including lackluster economic growth and persistently high unemployment. Financial markets are always unpredictable, of course, but there also are several time-tested investment principles that can help put the odds in your favor.
One of the basic tenets is to invest for the long term. Over time, riding out the markets' inevitable ups and downs has proven much more effective than selling into panic or chasing the hottest trend. Even missing only a few of the markets' best days can significantly diminish investor returns. Patience also affords the benefits of compounding - of earning interest on additional income or reinvested dividends and capital gains. There can be tax advantages and cost benefits to consider as well. While staying the course doesn't eliminate risk, it can considerably lessen the effect of short-term declines.
You can further manage your investing risk through diversification. And today, more than ever, geographic diversification should be taken into account. Studies indicate that asset allocation is the single most important determinant of a portfolio's long-term success. The right mix of stocks, bonds and cash - aligned to your particular risk tolerance and investment objective - is very important. Age-appropriate rebalancing is also an essential aspect of asset allocation. For younger investors, an emphasis on equities - which historically have been the best-performing asset class over time - is encouraged. As investors near their specific goal, such as retirement or sending a child to college, consideration may be given to replacing volatile assets (e.g. common stocks) with more-stable fixed investments (bonds or savings plans).
A third principle - investing regularly - can help lower the average cost of your purchases. Investing a certain amount of money each month or quarter helps ensure you won't pay for all your shares at market highs. This strategy - known as dollar cost averaging - also reduces "emotion" from investing, helping shareholders avoid selling weak performers just prior to an upswing, or chasing a hot performer just before a correction.
We invite you to contact us via the Internet, through our Investor Centers or by phone. It is our privilege to provide you the information you need to make the investments that are right for you.
Sincerely,
(The chairman's signature appears here.)
Edward C. Johnson 3d
Annual Report
Average annual total return reflects the change in the value of an investment, assuming reinvestment of the class' distributions from dividend income and capital gains (the profits earned upon the sale of securities that have grown in value, if any) and assuming a constant rate of performance each year. The $10,000 table and the fund's returns do not reflect the deduction of taxes that a shareholder would pay on fund distributions or the redemption of fund shares. During periods of reimbursement by Fidelity, a fund's total return will be greater than it would be had the reimbursement not occurred. How a fund did yesterday is no guarantee of how it will do tomorrow. Returns reflect the conversion of Class B shares to Class A shares after a maximum of seven years.
Average Annual Total Returns
Periods ended October 31, 2010 | Past 1
year | Past 5
years | Life of
fund A |
Class A (incl. 5.75% sales charge) | 3.59% | -3.16% | 1.67% |
Class T (incl. 3.50% sales charge) | 5.78% | -2.94% | 1.74% |
Class B (incl. contingent deferred sales charge) B | 4.11% | -3.08% | 1.75% |
Class C (incl. contingent deferred sales charge) C | 8.12% | -2.74% | 1.71% |
A From June 17, 2003.
B Class B shares' contingent deferred sales charges included in the past one year, past 5 years, and life of fund total return figures are 5%, 2%, and 0%, respectively.
C Class C shares' contingent deferred sales charges included in the past one year, past 5 years, and life of fund total return figures are 1%, 0%, and 0%, respectively.
Annual Report
$10,000 Over Life of Fund
Let's say hypothetically that $10,000 was invested in Fidelity AdvisorSM Value Leaders Fund - Class A on June 17, 2003, when the fund started, and the current 5.75% sales charge was paid. The chart shows how the value of your investment would have changed, and also shows how the Russell 1000® Value Index performed over the same period.
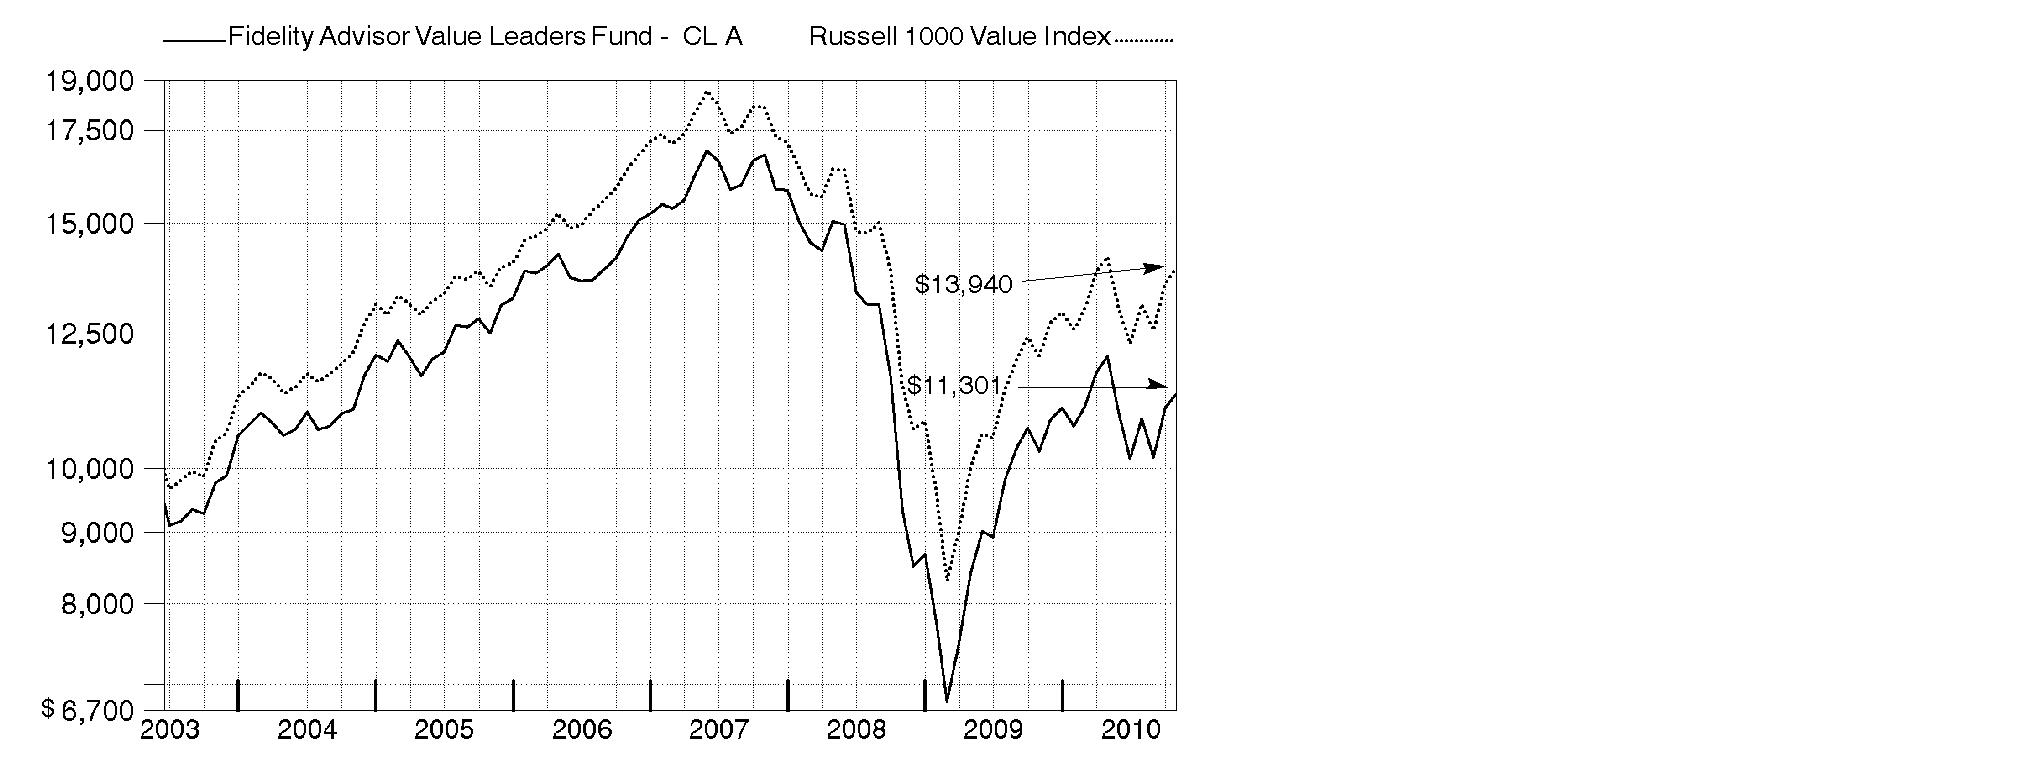
Annual Report
Market Recap: Amid bouts of volatility, major U.S. stock market indexes recorded double-digit gains for the year ending October 31, 2010, lifted by economic optimism, encouraging earnings reports and a wave of corporate mergers. Aside from a January dip, stocks trended upward for the first half of the period amid indications the Great Recession was over. However, in April, lingering high unemployment and heightened concern over European debt sent equities falling. Markets regrouped in July, but fell again in August on mixed economic data. The final two months of the period brought renewed optimism, with the large-cap S&P 500® Index posting its best September/October performance since 1998. For the full 12 months, the S&P 500® rose 16.52%, while the blue-chip-laden Dow Jones Industrial AverageSM added 17.62% and the technology-heavy Nasdaq Composite® Index rose 23.72%. Among market segments, all 10 sectors in the S&P 500 posted gains, with more than half outperforming the broad-market index. Stocks of mid- and small-sized companies surged, with the Russell Midcap® Index adding 27.71% and Russell 2000® Index climbing 26.58%. Looking abroad, debt problems in several European countries cooled gains in developed markets, and yet the MSCI® EAFE® (Europe, Australasia, Far East) Index still rose 8.49%.
Comments from Charles Hebard, Portfolio Manager of Fidelity AdvisorSM Value Leaders Fund during the period covered by this report: During the year, the fund's Class A, Class T, Class B and Class C shares gained 9.91%, 9.62%, 9.11% and 9.12%, respectively (excluding sales charges), lagging the 15.71% gain of the Russell 1000® Value Index. Positioning in financials led the underperformance, with stakes in Bank of America, JPMorgan Chase and Morgan Stanley suffering from fears of increased government regulation. The fund's positioning in consumer discretionary also detracted, including ownership of homebuilder KB Home. Overweighting technology hardware/equipment firm Hewlett-Packard hurt when the firm's chief executive unexpectedly departed in August. Underweighting consumer staples and poor stock selection in energy also detracted. On the positive side, we had strong picks in industrials, including truck engine manufacturer Cummins and rail operator Union Pacific. Within energy, significantly underweighting integrated oil giant and major index component Exxon Mobil helped, as the stock lagged during the period. Despite financials' drag on performance, we had good results from an out-of-index position in commercial real estate broker CB Richard Ellis Group.
Note to shareholders: Michael Chren will become Portfolio Manager of the fund on November 1, 2010.
The views expressed above reflect those of the portfolio manager(s) only through the end of the period as stated on the cover of this report and do not necessarily represent the views of Fidelity or any other person in the Fidelity organization. Any such views are subject to change at any time based upon market or other conditions and Fidelity disclaims any responsibility to update such views. These views may not be relied on as investment advice and, because investment decisions for a Fidelity fund are based on numerous factors, may not be relied on as an indication of trading intent on behalf of any Fidelity fund.
Annual Report
Shareholder Expense Example
As a shareholder of the Fund, you incur two types of costs: (1) transaction costs, including sales charges (loads) on purchase payments or redemption proceeds, and (2) ongoing costs, including management fees, distribution and/or service (12b-1) fees and other Fund expenses. This Example is intended to help you understand your ongoing costs (in dollars) of investing in the Fund and to compare these costs with the ongoing costs of investing in other mutual funds.
The Example is based on an investment of $1,000 invested at the beginning of the period and held for the entire period (May 1, 2010 to October 31, 2010).
Actual Expenses
The first line of the accompanying table for each class of the Fund provides information about actual account values and actual expenses. You may use the information in this line, together with the amount you invested, to estimate the expenses that you paid over the period. Simply divide your account value by $1,000.00 (for example, an $8,600 account value divided by $1,000.00 = 8.6), then multiply the result by the number in the first line for a class of the Fund under the heading entitled "Expenses Paid During Period" to estimate the expenses you paid on your account during this period. In addition, the Fund, as a shareholder in the underlying Fidelity Central Funds, will indirectly bear its pro-rata share of the fees and expenses incurred by the underlying Fidelity Central Funds. These fees and expenses are not included in the Fund's annualized expense ratio used to calculate the expense estimate in the table below.
Hypothetical Example for Comparison Purposes
The second line of the accompanying table for each class of the Fund provides information about hypothetical account values and hypothetical expenses based on a Class' actual expense ratio and an assumed rate of return of 5% per year before expenses, which is not the Class' actual return. The hypothetical account values and expenses may not be used to estimate the actual ending account balance or expenses you paid for the period. You may use this information to compare the ongoing costs of investing in the Fund and other funds. To do so, compare this 5% hypothetical example with the 5% hypothetical examples that appear in the shareholder reports of the other funds. In addition, the Fund, as a shareholder in the underlying Fidelity Central Funds, will indirectly bear its pro-rata share of the fees and expenses incurred by the underlying Fidelity Central Funds. These fees and expenses are not included in the Fund's annualized expense ratio used to calculate the expense estimate in the table below.
Please note that the expenses shown in the table are meant to highlight your ongoing costs only and do not reflect any transaction costs. Therefore, the second line of the table is useful in comparing ongoing costs only, and will not help you determine the relative total costs of owning different funds. In addition, if these transactional costs were included, your costs would have been higher.
Annual Report
| Annualized
Expense Ratio | Beginning
Account Value
May 1, 2010 | Ending
Account Value
October 31, 2010 | Expenses Paid
During Period*
May 1, 2010
to October 31, 2010 |
Class A | 1.18% | | | |
Actual | | $ 1,000.00 | $ 939.60 | $ 5.77 |
HypotheticalA | | $ 1,000.00 | $ 1,019.26 | $ 6.01 |
Class T | 1.40% | | | |
Actual | | $ 1,000.00 | $ 938.50 | $ 6.84 |
HypotheticalA | | $ 1,000.00 | $ 1,018.15 | $ 7.12 |
Class B | 1.94% | | | |
Actual | | $ 1,000.00 | $ 936.30 | $ 9.47 |
HypotheticalA | | $ 1,000.00 | $ 1,015.43 | $ 9.86 |
Class C | 1.94% | | | |
Actual | | $ 1,000.00 | $ 935.80 | $ 9.47 |
HypotheticalA | | $ 1,000.00 | $ 1,015.43 | $ 9.86 |
Institutional Class | .94% | | | |
Actual | | $ 1,000.00 | $ 940.90 | $ 4.60 |
HypotheticalA | | $ 1,000.00 | $ 1,020.47 | $ 4.79 |
A 5% return per year before expenses
* Expenses are equal to each Class' annualized expense ratio, multiplied by the average account value over the period, multiplied by 184/365 (to reflect the one-half year period).
Annual Report
Investment Changes (Unaudited)
Top Ten Stocks as of October 31, 2010 |
| % of fund's
net assets | % of fund's net assets
6 months ago |
JPMorgan Chase & Co. | 4.7 | 4.3 |
Wells Fargo & Co. | 4.6 | 4.9 |
Pfizer, Inc. | 3.6 | 3.2 |
Chevron Corp. | 3.4 | 3.6 |
Merck & Co., Inc. | 3.0 | 2.0 |
Johnson & Johnson | 3.0 | 0.0 |
Bank of America Corp. | 2.9 | 4.4 |
Citigroup, Inc. | 2.2 | 0.0 |
Verizon Communications, Inc. | 2.0 | 2.6 |
Exxon Mobil Corp. | 1.6 | 2.3 |
| 31.0 | |
Top Five Market Sectors as of October 31, 2010 |
| % of fund's
net assets | % of fund's net assets
6 months ago |
Financials | 28.0 | 27.9 |
Health Care | 15.2 | 9.7 |
Energy | 14.9 | 19.2 |
Industrials | 12.5 | 11.3 |
Information Technology | 7.8 | 7.7 |
Asset Allocation (% of fund's net assets) |
As of October 31, 2010* | As of April 30, 2010** |
| Stocks 100.3% | | | Stocks 99.5% | |
| Short-Term
Investments and
Net Other Assets† (0.3)% | | | Short-Term
Investments and
Net Other Assets 0.5% | |
* Foreign investments | 9.7% | | ** Foreign investments | 8.9% | |

† Short-Term Investments and Net Other Assets are not included in pie chart. |
Annual Report
Investments October 31, 2010
Showing Percentage of Net Assets
Common Stocks - 100.3% |
| Shares | | Value |
CONSUMER DISCRETIONARY - 5.7% |
Auto Components - 0.5% |
Johnson Controls, Inc. | 6,100 | | $ 214,232 |
Household Durables - 2.2% |
KB Home (d) | 46,300 | | 486,613 |
PulteGroup, Inc. (a) | 30,430 | | 238,876 |
Stanley Black & Decker, Inc. | 4,272 | | 264,736 |
| | 990,225 |
Media - 1.8% |
Time Warner Cable, Inc. | 8,167 | | 472,624 |
Time Warner, Inc. | 10,600 | | 344,606 |
| | 817,230 |
Specialty Retail - 1.2% |
Best Buy Co., Inc. | 3,000 | | 128,940 |
Lowe's Companies, Inc. | 12,300 | | 262,359 |
Staples, Inc. | 6,900 | | 141,243 |
| | 532,542 |
TOTAL CONSUMER DISCRETIONARY | | 2,554,229 |
CONSUMER STAPLES - 6.0% |
Beverages - 2.2% |
Anheuser-Busch InBev SA NV | 2,968 | | 185,987 |
Grupo Modelo SAB de CV Series C | 22,100 | | 123,755 |
The Coca-Cola Co. | 10,900 | | 668,388 |
| | 978,130 |
Food & Staples Retailing - 1.7% |
CVS Caremark Corp. | 14,200 | | 427,704 |
Kroger Co. | 6,800 | | 149,600 |
Walgreen Co. | 4,900 | | 166,012 |
| | 743,316 |
Food Products - 0.7% |
Nestle SA | 6,047 | | 331,115 |
Personal Products - 0.4% |
Avon Products, Inc. | 5,700 | | 173,565 |
Common Stocks - continued |
| Shares | | Value |
CONSUMER STAPLES - continued |
Tobacco - 1.0% |
British American Tobacco PLC sponsored ADR | 2,800 | | $ 213,444 |
Philip Morris International, Inc. | 4,400 | | 257,400 |
| | 470,844 |
TOTAL CONSUMER STAPLES | | 2,696,970 |
ENERGY - 14.9% |
Energy Equipment & Services - 4.0% |
Baker Hughes, Inc. | 8,590 | | 397,975 |
Ensco International Ltd. ADR | 4,500 | | 208,530 |
Halliburton Co. | 15,085 | | 480,608 |
Noble Corp. | 5,100 | | 176,103 |
Transocean Ltd. (a) | 2,600 | | 164,736 |
Weatherford International Ltd. (a) | 21,000 | | 353,010 |
| | 1,780,962 |
Oil, Gas & Consumable Fuels - 10.9% |
Alpha Natural Resources, Inc. (a) | 4,500 | | 203,265 |
Apache Corp. | 700 | | 70,714 |
BP PLC sponsored ADR | 5,500 | | 224,565 |
Chevron Corp. | 18,400 | | 1,520,024 |
Cimarex Energy Co. | 1,900 | | 145,825 |
Exxon Mobil Corp. | 10,420 | | 692,617 |
Marathon Oil Corp. | 17,700 | | 629,589 |
Massey Energy Co. | 5,100 | | 214,557 |
Occidental Petroleum Corp. | 6,984 | | 549,152 |
Petrohawk Energy Corp. (a) | 11,700 | | 199,017 |
Royal Dutch Shell PLC Class B ADR | 3,400 | | 218,688 |
Southwestern Energy Co. (a) | 5,900 | | 199,715 |
| | 4,867,728 |
TOTAL ENERGY | | 6,648,690 |
FINANCIALS - 28.0% |
Capital Markets - 2.6% |
Franklin Resources, Inc. | 1,800 | | 206,460 |
Morgan Stanley | 26,200 | | 651,594 |
State Street Corp. | 7,300 | | 304,848 |
| | 1,162,902 |
Commercial Banks - 8.7% |
BB&T Corp. | 13,200 | | 309,012 |
Common Stocks - continued |
| Shares | | Value |
FINANCIALS - continued |
Commercial Banks - continued |
Huntington Bancshares, Inc. | 21,900 | | $ 124,173 |
PNC Financial Services Group, Inc. | 7,677 | | 413,790 |
Regions Financial Corp. | 32,392 | | 204,070 |
SunTrust Banks, Inc. | 3,600 | | 90,072 |
SVB Financial Group (a) | 3,100 | | 134,354 |
U.S. Bancorp, Delaware | 22,694 | | 548,741 |
Wells Fargo & Co. | 79,485 | | 2,072,969 |
| | 3,897,181 |
Consumer Finance - 0.4% |
Capital One Financial Corp. | 5,038 | | 187,766 |
Diversified Financial Services - 10.5% |
Bank of America Corp. | 115,120 | | 1,316,973 |
Citigroup, Inc. (a) | 234,800 | | 979,116 |
JPMorgan Chase & Co. | 56,140 | | 2,112,548 |
KKR Financial Holdings LLC | 17,800 | | 156,462 |
Moody's Corp. | 5,300 | | 143,418 |
| | 4,708,517 |
Insurance - 3.5% |
Allstate Corp. | 9,015 | | 274,867 |
Everest Re Group Ltd. | 1,000 | | 84,280 |
Genworth Financial, Inc. Class A (a) | 28,000 | | 317,520 |
Lincoln National Corp. | 6,300 | | 154,224 |
MetLife, Inc. | 6,300 | | 254,079 |
Old Republic International Corp. | 8,200 | | 108,240 |
Unum Group | 6,600 | | 147,972 |
XL Capital Ltd. Class A | 9,768 | | 206,593 |
| | 1,547,775 |
Real Estate Investment Trusts - 1.4% |
ProLogis Trust | 7,100 | | 96,915 |
Public Storage | 1,900 | | 188,518 |
SL Green Realty Corp. | 3,000 | | 197,160 |
Weyerhaeuser Co. | 9,341 | | 151,511 |
| | 634,104 |
Real Estate Management & Development - 0.6% |
CB Richard Ellis Group, Inc. Class A (a) | 15,390 | | 282,407 |
Thrifts & Mortgage Finance - 0.3% |
Radian Group, Inc. | 15,400 | | 116,886 |
TOTAL FINANCIALS | | 12,537,538 |
Common Stocks - continued |
| Shares | | Value |
HEALTH CARE - 15.2% |
Biotechnology - 2.1% |
Amgen, Inc. (a) | 9,700 | | $ 554,743 |
Biogen Idec, Inc. (a) | 4,700 | | 294,737 |
Gilead Sciences, Inc. (a) | 3,100 | | 122,977 |
| | 972,457 |
Health Care Equipment & Supplies - 1.4% |
C. R. Bard, Inc. | 2,000 | | 166,240 |
Covidien PLC | 8,775 | | 349,859 |
Stryker Corp. | 2,200 | | 108,878 |
| | 624,977 |
Health Care Providers & Services - 1.8% |
Brookdale Senior Living, Inc. (a) | 9,700 | | 182,166 |
CIGNA Corp. | 6,200 | | 218,178 |
Humana, Inc. (a) | 6,800 | | 396,372 |
| | 796,716 |
Pharmaceuticals - 9.9% |
Johnson & Johnson | 21,200 | | 1,349,804 |
Merck & Co., Inc. | 37,400 | | 1,356,872 |
Pfizer, Inc. | 91,752 | | 1,596,485 |
Teva Pharmaceutical Industries Ltd. sponsored ADR | 2,300 | | 119,370 |
| | 4,422,531 |
TOTAL HEALTH CARE | | 6,816,681 |
INDUSTRIALS - 12.5% |
Aerospace & Defense - 2.2% |
Goodrich Corp. | 2,400 | | 196,968 |
Honeywell International, Inc. | 4,440 | | 209,168 |
Precision Castparts Corp. | 1,000 | | 136,580 |
United Technologies Corp. | 5,900 | | 441,143 |
| | 983,859 |
Building Products - 1.1% |
Masco Corp. | 29,050 | | 309,673 |
Owens Corning (a) | 6,800 | | 183,872 |
| | 493,545 |
Commercial Services & Supplies - 0.7% |
Avery Dennison Corp. | 3,500 | | 127,225 |
Republic Services, Inc. | 6,030 | | 179,754 |
| | 306,979 |
Common Stocks - continued |
| Shares | | Value |
INDUSTRIALS - continued |
Construction & Engineering - 0.8% |
Fluor Corp. | 4,900 | | $ 236,131 |
Jacobs Engineering Group, Inc. (a) | 3,800 | | 146,718 |
| | 382,849 |
Electrical Equipment - 0.3% |
Regal-Beloit Corp. | 2,109 | | 121,710 |
Industrial Conglomerates - 1.9% |
General Electric Co. | 36,100 | | 578,322 |
Textron, Inc. | 13,760 | | 286,483 |
| | 864,805 |
Machinery - 2.8% |
Caterpillar, Inc. | 2,900 | | 227,940 |
Cummins, Inc. | 1,219 | | 107,394 |
Dover Corp. | 1,700 | | 90,270 |
Ingersoll-Rand Co. Ltd. | 17,300 | | 680,063 |
Navistar International Corp. (a) | 2,780 | | 133,940 |
| | 1,239,607 |
Road & Rail - 2.5% |
CSX Corp. | 7,400 | | 454,730 |
Union Pacific Corp. | 7,576 | | 664,264 |
| | 1,118,994 |
Trading Companies & Distributors - 0.2% |
WESCO International, Inc. (a) | 2,200 | | 94,204 |
TOTAL INDUSTRIALS | | 5,606,552 |
INFORMATION TECHNOLOGY - 7.8% |
Communications Equipment - 1.2% |
Cisco Systems, Inc. (a) | 16,300 | | 372,129 |
Juniper Networks, Inc. (a) | 4,600 | | 148,994 |
| | 521,123 |
Computers & Peripherals - 1.1% |
Hewlett-Packard Co. | 11,850 | | 498,411 |
Electronic Equipment & Components - 2.1% |
Agilent Technologies, Inc. (a) | 4,700 | | 163,560 |
Avnet, Inc. (a) | 11,000 | | 327,580 |
Flextronics International Ltd. (a) | 20,700 | | 148,212 |
Tyco Electronics Ltd. | 8,475 | | 268,488 |
| | 907,840 |
Common Stocks - continued |
| Shares | | Value |
INFORMATION TECHNOLOGY - continued |
Internet Software & Services - 0.8% |
eBay, Inc. (a) | 12,000 | | $ 357,720 |
IT Services - 0.3% |
International Business Machines Corp. | 1,000 | | 143,600 |
Semiconductors & Semiconductor Equipment - 2.3% |
Applied Materials, Inc. | 12,400 | | 153,264 |
KLA-Tencor Corp. | 11,500 | | 410,780 |
Lam Research Corp. (a) | 10,300 | | 471,637 |
| | 1,035,681 |
TOTAL INFORMATION TECHNOLOGY | | 3,464,375 |
MATERIALS - 2.6% |
Chemicals - 1.4% |
Celanese Corp. Class A | 3,900 | | 139,035 |
Dow Chemical Co. | 15,900 | | 490,197 |
| | 629,232 |
Construction Materials - 0.4% |
HeidelbergCement AG | 3,301 | | 172,635 |
Containers & Packaging - 0.3% |
Owens-Illinois, Inc. (a) | 5,334 | | 149,512 |
Metals & Mining - 0.5% |
Alcoa, Inc. | 7,800 | | 102,414 |
Newcrest Mining Ltd. | 2,464 | | 96,458 |
| | 198,872 |
TOTAL MATERIALS | | 1,150,251 |
TELECOMMUNICATION SERVICES - 3.0% |
Diversified Telecommunication Services - 2.3% |
Qwest Communications International, Inc. | 18,400 | | 121,440 |
Verizon Communications, Inc. | 28,165 | | 914,518 |
| | 1,035,958 |
Wireless Telecommunication Services - 0.7% |
Sprint Nextel Corp. (a) | 74,655 | | 307,579 |
TOTAL TELECOMMUNICATION SERVICES | | 1,343,537 |
Common Stocks - continued |
| Shares | | Value |
UTILITIES - 4.6% |
Electric Utilities - 3.6% |
American Electric Power Co., Inc. | 8,000 | | $ 299,520 |
Edison International | 3,800 | | 140,220 |
Entergy Corp. | 3,100 | | 231,043 |
FirstEnergy Corp. | 6,900 | | 250,608 |
NextEra Energy, Inc. | 7,027 | | 386,766 |
PPL Corp. | 10,700 | | 287,830 |
| | 1,595,987 |
Independent Power Producers & Energy Traders - 0.2% |
AES Corp. (a) | 9,600 | | 114,624 |
Multi-Utilities - 0.8% |
CMS Energy Corp. | 13,000 | | 238,940 |
PG&E Corp. | 2,400 | | 114,768 |
| | 353,708 |
TOTAL UTILITIES | | 2,064,319 |
TOTAL COMMON STOCKS (Cost $47,641,541) | 44,883,142 |
Money Market Funds - 1.2% |
| | | |
Fidelity Cash Central Fund, 0.23% (b) | 207,319 | | 207,319 |
Fidelity Securities Lending Cash Central Fund, 0.24% (b)(c) | 350,900 | | 350,900 |
TOTAL MONEY MARKET FUNDS (Cost $558,219) | 558,219 |
TOTAL INVESTMENT PORTFOLIO - 101.5% (Cost $48,199,760) | | 45,441,361 |
NET OTHER ASSETS (LIABILITIES) - (1.5)% | | (690,036) |
NET ASSETS - 100% | $ 44,751,325 |
Legend |
(a) Non-income producing |
(b) Affiliated fund that is available only to investment companies and other accounts managed by Fidelity Investments. The rate quoted is the annualized seven-day yield of the fund at period end. A complete unaudited listing of the fund's holdings as of its most recent quarter end is available upon request. In addition, each Fidelity Central Fund's financial statements, which are not covered by the Fund's report of Independent Registered Public Accounting Firm, are available on the SEC's website or upon request. |
(c) Investment made with cash collateral received from securities on loan. |
(d) Security or a portion of the security is on loan at period end. |
Affiliated Central Funds |
Information regarding fiscal year to date income earned by the Fund from investments in Fidelity Central Funds is as follows: |
Fund | Income earned |
Fidelity Cash Central Fund | $ 475 |
Fidelity Securities Lending Cash Central Fund | 830 |
Total | $ 1,305 |
Other Information |
All investments are categorized as Level 1 under the Fair Value Hierarchy. The inputs or methodology used for valuing securities may not be an indication of the risk associated with investing in those securities. For more information on valuation inputs, please refer to the Security Valuation section in the accompanying Notes to Financial Statements. |
Income Tax Information |
At October 31, 2010, the Fund had a capital loss carryforward of approximately $34,021,859 of which $19,202,191 and $14,819,668 will expire on October 31, 2016 and 2017, respectively. Capital loss carryforwards are only available to offset future capital gains of the Fund to the extent provided by regulations and may be limited. |
See accompanying notes which are an integral part of the financial statements.
Annual Report
Statement of Assets and Liabilities
| October 31, 2010 |
| | |
Assets | | |
Investment in securities, at value (including securities loaned of $335,269) - See accompanying schedule: Unaffiliated issuers (cost $47,641,541) | $ 44,883,142 | |
Fidelity Central Funds (cost $558,219) | 558,219 | |
Total Investments (cost $48,199,760) | | $ 45,441,361 |
Receivable for investments sold | | 23,462 |
Receivable for fund shares sold | | 18,958 |
Dividends receivable | | 38,503 |
Distributions receivable from Fidelity Central Funds | | 90 |
Other receivables | | 235 |
Total assets | | 45,522,609 |
| | |
Liabilities | | |
Payable for fund shares redeemed | 309,598 | |
Accrued management fee | 11,470 | |
Distribution and service plan fees payable | 16,548 | |
Other affiliated payables | 14,190 | |
Other payables and accrued expenses | 68,578 | |
Collateral on securities loaned, at value | 350,900 | |
Total liabilities | | 771,284 |
| | |
Net Assets | | $ 44,751,325 |
Net Assets consist of: | | |
Paid in capital | | $ 82,892,458 |
Undistributed net investment income | | 270,130 |
Accumulated undistributed net realized gain (loss) on investments and foreign currency transactions | | (35,622,073) |
Net unrealized appreciation (depreciation) on investments and assets and liabilities in foreign currencies | | (2,789,190) |
Net Assets | | $ 44,751,325 |
See accompanying notes which are an integral part of the financial statements.
Annual Report
Statement of Assets and Liabilities - continued
| October 31, 2010 |
| | |
Calculation of Maximum Offering Price
Class A:
Net Asset Value and redemption price per share
($25,431,427 ÷ 2,512,723 shares) | | $ 10.12 |
| | |
Maximum offering price per share (100/94.25 of $10.12) | | $ 10.74 |
Class T:
Net Asset Value and redemption price per share ($12,734,933 ÷ 1,262,881 shares) | | $ 10.08 |
| | |
Maximum offering price per share (100/96.50 of $10.08) | | $ 10.45 |
Class B:
Net Asset Value and offering price per share ($1,604,902 ÷ 160,584 shares)A | | $ 9.99 |
| | |
Class C:
Net Asset Value and offering price per share ($4,139,165 ÷ 417,119 shares)A | | $ 9.92 |
| | |
Institutional Class:
Net Asset Value, offering price and redemption price per share ($840,898 ÷ 82,554 shares) | | $ 10.19 |
A Redemption price per share is equal to net asset value less any applicable contingent deferred sales charge.
See accompanying notes which are an integral part of the financial statements.
Annual Report
Financial Statements - continued
Statement of Operations
| Year ended October 31, 2010 |
| | |
Investment Income | | |
Dividends | | $ 991,809 |
Special dividends | | 103,207 |
Interest | | 4 |
Income from Fidelity Central Funds | | 1,305 |
Total income | | 1,096,325 |
| | |
Expenses | | |
Management fee
Basic fee | $ 312,514 | |
Performance adjustment | (88,542) | |
Transfer agent fees | 169,814 | |
Distribution and service plan fees | 230,382 | |
Accounting and security lending fees | 21,853 | |
Custodian fees and expenses | 14,087 | |
Independent trustees' compensation | 323 | |
Registration fees | 57,633 | |
Audit | 47,888 | |
Legal | 297 | |
Miscellaneous | 768 | |
Total expenses before reductions | 767,017 | |
Expense reductions | (2,243) | 764,774 |
Net investment income (loss) | | 331,551 |
Realized and Unrealized Gain (Loss) Net realized gain (loss) on: | | |
Investment securities: | | |
Unaffiliated issuers | 3,335,570 | |
Foreign currency transactions | (984) | |
Total net realized gain (loss) | | 3,334,586 |
Change in net unrealized appreciation (depreciation) on: Investment securities | 1,707,544 | |
Assets and liabilities in foreign currencies | 69 | |
Total change in net unrealized appreciation (depreciation) | | 1,707,613 |
Net gain (loss) | | 5,042,199 |
Net increase (decrease) in net assets resulting from operations | | $ 5,373,750 |
See accompanying notes which are an integral part of the financial statements.
Annual Report
Statement of Changes in Net Assets
| Year ended
October 31,
2010 | Year ended
October 31,
2009 |
Increase (Decrease) in Net Assets | | |
Operations | | |
Net investment income (loss) | $ 331,551 | $ 533,586 |
Net realized gain (loss) | 3,334,586 | (14,320,559) |
Change in net unrealized appreciation (depreciation) | 1,707,613 | 18,267,263 |
Net increase (decrease) in net assets resulting
from operations | 5,373,750 | 4,480,290 |
Distributions to shareholders from net investment income | (478,174) | (1,108,886) |
Distributions to shareholders from net realized gain | (30,375) | - |
Total distributions | (508,549) | (1,108,886) |
Share transactions - net increase (decrease) | (17,770,134) | (13,293,951) |
Total increase (decrease) in net assets | (12,904,933) | (9,922,547) |
| | |
Net Assets | | |
Beginning of period | 57,656,258 | 67,578,805 |
End of period (including undistributed net investment income of $270,130 and undistributed net investment income of $406,445, respectively) | $ 44,751,325 | $ 57,656,258 |
See accompanying notes which are an integral part of the financial statements.
Annual Report
Financial Highlights - Class A
Years ended October 31, | 2010 | 2009 | 2008 | 2007 | 2006 |
Selected Per-Share Data | | | | | |
Net asset value, beginning of period | $ 9.30 | $ 8.63 | $ 16.40 | $ 15.08 | $ 13.22 |
Income from Investment Operations | | | | | |
Net investment income (loss) C | .07H | .09 | .16 | .13 | .08 |
Net realized and unrealized gain (loss) | .85 | .75 | (7.09) | 1.99 | 2.15 |
Total from investment operations | .92 | .84 | (6.93) | 2.12 | 2.23 |
Distributions from net investment income | (.09) | (.17) | (.12) | (.09) | (.04) |
Distributions from net realized gain | (.01) | - | (.72) | (.71) | (.33) |
Total distributions | (.10) | (.17) | (.84) G | (.80) | (.37) |
Net asset value, end of period | $ 10.12 | $ 9.30 | $ 8.63 | $ 16.40 | $ 15.08 |
Total Return A, B | 9.91% | 10.13% | (44.43)% | 14.64% | 17.20% |
Ratios to Average Net Assets D, F | | | | | |
Expenses before reductions | 1.22% | 1.25% | 1.26% | 1.28% | 1.41% |
Expenses net of fee waivers,
if any | 1.22% | 1.25% | 1.25% | 1.25% | 1.25% |
Expenses net of all reductions | 1.21% | 1.25% | 1.25% | 1.24% | 1.24% |
Net investment income (loss) | .75%H | 1.10% | 1.21% | .85% | .54% |
Supplemental Data | | | | | |
Net assets, end of period
(000 omitted) | $ 25,431 | $ 28,585 | $ 34,864 | $ 67,434 | $ 15,398 |
Portfolio turnover rate E | 51% | 56% | 74% | 76% | 91% |
A Total returns would have been lower had certain expenses not been reduced during the periods shown.
B Total returns do not include the effect of the sales charges.
C Calculated based on average shares outstanding during the period.
D Fees and expenses of the underlying Fidelity Central Funds are not included in the Fund's expense ratio. The Fund indirectly bears its proportionate share of the expenses of any underlying Fidelity Central Funds.
E Amount does not include the portfolio activity of any underlying Fidelity Central Funds.
F Expense ratios reflect operating expenses of the class. Expenses before reductions do not reflect amounts reimbursed by the investment adviser or reductions from brokerage service arrangements or reductions from other expense offset arrangements and do not represent the amount paid by the class during periods when reimbursements or reductions occur. Expenses net of fee waivers reflect expenses after reimbursement by the investment adviser but prior to reductions from brokerage service arrangements or other expense offset arrangements. Expenses net of all reductions represent the net expenses paid by the class.
G Total distributions of $.839 per share is comprised of distributions from net investment income of $.117 and distributions from net realized gain of $.722 per share.
H Investment income per share reflects a special dividend which amounted to $.02 per share. Excluding the special dividend, the ratio of net investment income (loss) to average net assets would have been .57%.
See accompanying notes which are an integral part of the financial statements.
Annual Report
Financial Highlights - Class T
Years ended October 31, | 2010 | 2009 | 2008 | 2007 | 2006 |
Selected Per-Share Data | | | | | |
Net asset value, beginning of period | $ 9.27 | $ 8.58 | $ 16.30 | $ 14.99 | $ 13.14 |
Income from Investment Operations | | | | | |
Net investment income (loss) C | .05H | .07 | .13 | .09 | .04 |
Net realized and unrealized gain (loss) | .84 | .75 | (7.06) | 1.97 | 2.15 |
Total from investment operations | .89 | .82 | (6.93) | 2.06 | 2.19 |
Distributions from net investment income | (.07) | (.13) | (.07) | (.04) | (.01) |
Distributions from net realized gain | (.01) | - | (.72) | (.71) | (.33) |
Total distributions | (.08) | (.13) | (.79) G | (.75) | (.34) |
Net asset value, end of period | $ 10.08 | $ 9.27 | $ 8.58 | $ 16.30 | $ 14.99 |
Total Return A, B | 9.62% | 9.90% | (44.57)% | 14.31% | 16.93% |
Ratios to Average Net Assets D, F | | | | | |
Expenses before reductions | 1.45% | 1.50% | 1.49% | 1.53% | 1.65% |
Expenses net of fee waivers,
if any | 1.45% | 1.50% | 1.49% | 1.50% | 1.50% |
Expenses net of all reductions | 1.45% | 1.49% | 1.49% | 1.49% | 1.49% |
Net investment income (loss) | .52%H | .85% | .97% | .60% | .29% |
Supplemental Data | | | | | |
Net assets, end of period
(000 omitted) | $ 12,735 | $ 20,652 | $ 22,720 | $ 50,998 | $ 30,607 |
Portfolio turnover rate E | 51% | 56% | 74% | 76% | 91% |
A Total returns would have been lower had certain expenses not been reduced during the periods shown.
B Total returns do not include the effect of the sales charges.
C Calculated based on average shares outstanding during the period.
D Fees and expenses of the underlying Fidelity Central Funds are not included in the Fund's expense ratio. The Fund indirectly bears its proportionate share of the expenses of any underlying Fidelity Central Funds.
E Amount does not include the portfolio activity of any underlying Fidelity Central Funds.
F Expense ratios reflect operating expenses of the class. Expenses before reductions do not reflect amounts reimbursed or waived by the investment adviser or reductions from brokerage service arrangements or reductions from other expense offset arrangements and do not represent the amount paid by the class during periods when reimbursements, waivers or reductions occur. Expenses net of fee waivers reflect expenses after reimbursement and waivers by the investment adviser but prior to reductions from brokerage service arrangements or other expense offset arrangements. Expenses net of all reductions represent the net expenses paid by the class.
G Total distributions of $.790 per share is comprised of distributions from net investment income of $.068 and distributions from net realized gain of $.722 per share.
H Investment income per share reflects a special dividend which amounted to $.02 per share. Excluding the special dividend, the ratio of net investment income (loss) to average net assets would have been .33%.
See accompanying notes which are an integral part of the financial statements.
Annual Report
Financial Highlights - Class B
Years ended October 31, | 2010 | 2009 | 2008 | 2007 | 2006 |
Selected Per-Share Data | | | | | |
Net asset value, beginning of period | $ 9.18 | $ 8.47 | $ 16.07 | $ 14.81 | $ 12.99 |
Income from Investment Operations | | | | | |
Net investment income (loss) C | - G, I | .03 | .06 | .01 | (.03) |
Net realized and unrealized gain (loss) | .84 | .74 | (6.96) | 1.95 | 2.13 |
Total from investment operations | .84 | .77 | (6.90) | 1.96 | 2.10 |
Distributions from net investment income | (.02) | (.06) | - | - | - |
Distributions from net realized gain | (.01) | - | (.70) | (.70) | (.28) |
Total distributions | (.03) | (.06) | (.70) H | (.70) | (.28) |
Net asset value, end of period | $ 9.99 | $ 9.18 | $ 8.47 | $ 16.07 | $ 14.81 |
Total Return A, B | 9.11% | 9.19% | (44.80)% | 13.74% | 16.38% |
Ratios to Average Net Assets D, F | | | | | |
Expenses before reductions | 1.97% | 2.00% | 2.03% | 2.10% | 2.23% |
Expenses net of fee waivers,
if any | 1.97% | 2.00% | 2.00% | 2.00% | 2.00% |
Expenses net of all reductions | 1.97% | 2.00% | 2.00% | 1.99% | 1.99% |
Net investment income (loss) | (.01)%I | .35% | .45% | .10% | (.21)% |
Supplemental Data | | | | | |
Net assets, end of period
(000 omitted) | $ 1,605 | $ 1,989 | $ 2,615 | $ 6,734 | $ 5,734 |
Portfolio turnover rate E | 51% | 56% | 74% | 76% | 91% |
A Total returns would have been lower had certain expenses not been reduced during the periods shown.
B Total returns do not include the effect of the contingent deferred sales charge.
C Calculated based on average shares outstanding during the period.
D Fees and expenses of the underlying Fidelity Central Funds are not included in the Fund's expense ratio. The Fund indirectly bears its proportionate share of the expenses of any underlying Fidelity Central Funds.
E Amount does not include the portfolio activity of any underlying Fidelity Central Funds.
F Expense ratios reflect operating expenses of the class. Expenses before reductions do not reflect amounts reimbursed by the investment adviser or reductions from brokerage service arrangements or reductions from other expense offset arrangements and do not represent the amount paid by the class during periods when reimbursements or reductions occur. Expenses net of fee waivers reflect expenses after reimbursement by the investment adviser but prior to reductions from brokerage service arrangements or other expense offset arrangements. Expenses net of all reductions represent the net expenses paid by the class.
G Amount represents less than $.01 per share.
H Total distributions of $.698 per share is comprised of distributions from net investment income of $.000 and distributions from net realized gain of $.698 per share.
I Investment income per share reflects a special dividend which amounted to $.02 per share. Excluding the special dividend, the ratio of net investment income (loss) to average net assets would have been (.19)%.
See accompanying notes which are an integral part of the financial statements.
Annual Report
Financial Highlights - Class C
Years ended October 31, | 2010 | 2009 | 2008 | 2007 | 2006 |
Selected Per-Share Data | | | | | |
Net asset value, beginning of period | $ 9.11 | $ 8.44 | $ 16.04 | $ 14.80 | $ 12.99 |
Income from Investment Operations | | | | | |
Net investment income (loss) C | -H, K | .03 | .06 | .02 | (.03) |
Net realized and unrealized gain (loss) | .83 | .73 | (6.95) | 1.93 | 2.13 |
Total from investment operations | .83 | .76 | (6.89) | 1.95 | 2.10 |
Distributions from net investment income | (.02) | (.09) | - | - | - |
Distributions from net realized gain | (.01) | - | (.71) | (.71) | (.29) |
Total distributions | (.02) J | (.09) | (.71) I | (.71) | (.29) |
Net asset value, end of period | $ 9.92 | $ 9.11 | $ 8.44 | $ 16.04 | $ 14.80 |
Total Return A, B | 9.12% | 9.28% | (44.84)% | 13.69% | 16.38% |
Ratios to Average Net Assets D, G | | | | | |
Expenses before reductions | 1.97% | 2.01% | 2.03% | 2.09% | 2.22% |
Expenses net of fee waivers,
if any | 1.97% | 2.00% | 2.00% | 2.00% | 2.00% |
Expenses net of all reductions | 1.97% | 2.00% | 2.00% | 1.99% | 1.99% |
Net investment income (loss) | -% F, K | .35% | .45% | .10% | (.21)% |
Supplemental Data | | | | | |
Net assets, end of period
(000 omitted) | $ 4,139 | $ 4,088 | $ 5,358 | $ 9,718 | $ 7,004 |
Portfolio turnover rate E | 51% | 56% | 74% | 76% | 91% |
A Total returns would have been lower had certain expenses not been reduced during the periods shown.
B Total returns do not include the effect of the contingent deferred sales charge.
C Calculated based on average shares outstanding during the period.
D Fees and expenses of the underlying Fidelity Central Funds are not included in the Fund's expense ratio. The Fund indirectly bears its proportionate share of the expenses of any underlying Fidelity Central Funds.
E Amount does not include the portfolio activity of any underlying Fidelity Central Funds.
F Amount represents less than .01%.
G Expense ratios reflect operating expenses of the class. Expenses before reductions do not reflect amounts reimbursed by the investment adviser or reductions from brokerage service arrangements or reductions from other expense offset arrangements and do not represent the amount paid by the class during periods when reimbursements or reductions occur. Expenses net of fee waivers reflect expenses after reimbursement by the investment adviser but prior to reductions from brokerage service arrangements or other expense offset arrangements. Expenses net of all reductions represent the net expenses paid by the class.
H Amount represents less than $.01 per share.
I Total distributions of $.712 per share is comprised of distributions from net investment income of $.000 and distributions from net realized gain of $.712 per share.
J Total distributions of $.02 per share is comprised of distributions from net investment income of $.015 and distributions from net realized gain of $.005 per share.
K Investment income per share reflects a special dividend which amounted to $.02 per share. Excluding the special dividend, the ratio of net investment income (loss) to average net assets would have been (.19)%.
See accompanying notes which are an integral part of the financial statements.
Annual Report
Financial Highlights - Institutional Class
Years ended October 31, | 2010 | 2009 | 2008 | 2007 | 2006 |
Selected Per-Share Data | | | | | |
Net asset value, beginning of period | $ 9.35 | $ 8.70 | $ 16.51 | $ 15.17 | $ 13.28 |
Income from Investment Operations | | | | | |
Net investment income (loss) B | .10G | .11 | .20 | .17 | .11 |
Net realized and unrealized gain (loss) | .86 | .74 | (7.13) | 1.99 | 2.18 |
Total from investment operations | .96 | .85 | (6.93) | 2.16 | 2.29 |
Distributions from net investment income | (.11) | (.20) | (.15) | (.11) | (.07) |
Distributions from net realized gain | (.01) | - | (.72) | (.71) | (.33) |
Total distributions | (.12) | (.20) | (.88) F | (.82) | (.40) |
Net asset value, end of period | $ 10.19 | $ 9.35 | $ 8.70 | $ 16.51 | $ 15.17 |
Total Return A | 10.28% | 10.26% | (44.24)% | 14.89% | 17.58% |
Ratios to Average Net Assets C, E | | | | | |
Expenses before reductions | .98% | 1.00% | .98% | 1.00% | 1.04% |
Expenses net of fee waivers,
if any | .98% | 1.00% | .98% | 1.00% | 1.00% |
Expenses net of all reductions | .97% | 1.00% | .97% | .99% | .99% |
Net investment income (loss) | .99%G | 1.35% | 1.48% | 1.10% | .79% |
Supplemental Data | | | | | |
Net assets, end of period
(000 omitted) | $ 841 | $ 2,341 | $ 2,021 | $ 6,833 | $ 2,201 |
Portfolio turnover rate D | 51% | 56% | 74% | 76% | 91% |
A Total returns would have been lower had certain expenses not been reduced during the periods shown.
B Calculated based on average shares outstanding during the period.
C Fees and expenses of the underlying Fidelity Central Funds are not included in the Fund's expense ratio. The Fund indirectly bears its proportionate share of the expenses of any underlying Fidelity Central Funds.
D Amount does not include the portfolio activity of any underlying Fidelity Central Funds.
E Expense ratios reflect operating expenses of the class. Expenses before reductions do not reflect amounts reimbursed or waived by the investment adviser or reductions from brokerage service arrangements or reductions from other expense offset arrangements and do not represent the amount paid by the class during periods when reimbursements, waivers or reductions occur. Expenses net of fee waivers reflect expenses after reimbursement and waivers by the investment adviser but prior to reductions from brokerage service arrangements or other expense offset arrangements. Expenses net of all reductions represent the net expenses paid by the class.
F Total distributions of $.876 per share is comprised of distributions from net investment income of $.154 and distributions from net realized gain of $.722 per share.
G Investment income per share reflects a special dividend which amounted to $.02 per share. Excluding the special dividend, the ratio of net investment income (loss) to average net assets would have been .81%.
See accompanying notes which are an integral part of the financial statements.
Annual Report
Notes to Financial Statements
For the period ended October 31, 2010
1. Organization.
Fidelity Advisor Value Leaders Fund (the Fund) is a fund of Fidelity Advisor Series VIII (the Trust) and is authorized to issue an unlimited number of shares. The Trust is registered under the Investment Company Act of 1940, as amended (the 1940 Act), as an open-end management investment company organized as a Massachusetts business trust. The Fund offers Class A, Class T, Class C, and Institutional Class shares, each of which has equal rights as to assets and voting privileges. Effective after the close of business on September 1, 2010, Class B shares were closed to new accounts and additional purchases by existing shareholders. Each class has exclusive voting rights with respect to matters that affect that class. Class B shares will automatically convert to Class A shares after a holding period of seven years from the initial date of purchase. Investment income, realized and unrealized capital gains and losses, the common expenses of the Fund, and certain fund-level expense reductions, if any, are allocated on a pro-rata basis to each class based on the relative net assets of each class to the total net assets of the Fund. Each class differs with respect to transfer agent and distribution and service plan fees incurred. Certain expense reductions also differ by class.
2. Investments in Fidelity Central Funds.
The Funds may invest in Fidelity Central Funds, which are open-end investment companies available only to other investment companies and accounts managed by Fidelity Management & Research Company (FMR) and its affiliates. The Funds' Schedules of Investments list each of the Fidelity Central Funds as an investment of each Fund, but does not include the underlying holdings of each Fidelity Central Fund. As an Investing Fund, the Funds indirectly bear their proportionate share of the expenses of the underlying Fidelity Central Funds.
The Money Market Central Funds seek preservation of capital and current income and are managed by Fidelity Investments Money Management, Inc. (FIMM), an affiliate of FMR.
A complete unaudited list of holdings for each Fidelity Central Fund is available upon request or at the Securities and Exchange Commission (the SEC) web site at www.sec.gov. In addition, the financial statements of the Fidelity Central Funds, which are not covered by the Funds' Report of Independent Registered Public Accounting Firm, are available on the SEC web site or upon request.
Annual Report
Notes to Financial Statements - continued
3. Significant Accounting Policies.
The financial statements have been prepared in conformity with accounting principles generally accepted in the United States of America (GAAP), which require management to make certain estimates and assumptions at the date of the financial statements. Actual results could differ from those estimates. The following summarizes the significant accounting policies of the Fund:
Security Valuation. Investments are valued as of 4:00 p.m. Eastern time on the last calendar day of the period. The Fund uses independent pricing services approved by the Board of Trustees to value its investments. When current market prices or quotations are not readily available or reliable, valuations may be determined in good faith in accordance with procedures adopted by the Board of Trustees. Factors used in determining value may include market or security specific events. The frequency with which these procedures are used cannot be predicted and they may be utilized to a significant extent. The value used for net asset value (NAV) calculation under these procedures may differ from published prices for the same securities.
The Fund categorizes the inputs to valuation techniques used to value its investments into a disclosure hierarchy consisting of three levels as shown below.
Level 1 - quoted prices in active markets for identical investments
Level 2 - other significant observable inputs (including quoted prices for similar investments, interest rates, prepayment speeds, etc.)
Level 3 - unobservable inputs (including the fund's own assumptions based on the best information available)
Changes in valuation techniques may result in transfers in or out of an assigned level within the disclosure hierarchy. Valuation techniques used to value the Fund's investments by major category are as follows.
Equity securities, including restricted securities, for which market quotations are readily available, are valued at the last reported sale price or official closing price as reported by an independent pricing service on the primary market or exchange on which they are traded and are categorized as Level 1 in the hierarchy. In the event there were no sales during the day or closing prices are not available, securities are valued at the last quoted bid price or may be valued using the last available price and are generally categorized as Level 2 in the hierarchy. For foreign equity securities, when significant market or security specific events arise, comparisons to the valuation of American Depositary Receipts (ADRs), futures contracts, Exchange-traded funds (ETFs) and certain indexes as well as quoted prices for similar securities are used and are categorized as Level 2 in the hierarchy in these circumstances. Utilizing these techniques may result in transfers between
Annual Report
3. Significant Accounting Policies - continued
Security Valuation - continued
Level 1 and Level 2. For restricted equity securities and private placements where observable inputs are limited, assumptions about market activity and risk are used and are categorized as Level 3 in the hierarchy.
Investments in open-end mutual funds, including the Fidelity Central Funds, are valued at their closing net asset value each business day and are categorized as Level 1 in the hierarchy. Short-term securities with remaining maturities of sixty days or less for which quotations are not readily available are valued at amortized cost, which approximates fair value and are categorized as Level 2 in the hierarchy.
Foreign Currency. The Fund uses foreign currency contracts to facilitate transactions in foreign-denominated securities. Gains and losses from these transactions may arise from changes in the value of the foreign currency or if the counterparties do not perform under the contracts' terms.
Foreign-denominated assets, including investment securities, and liabilities are translated into U.S. dollars at the exchange rate at period end. Purchases and sales of investment securities, income and dividends received and expenses denominated in foreign currencies are translated into U.S. dollars at the exchange rate in effect on the transaction date.
The effects of exchange rate fluctuations on investments are included with the net realized and unrealized gain (loss) on investment securities. Other foreign currency transactions resulting in realized and unrealized gain (loss) are disclosed separately.
Investment Transactions and Income. For financial reporting purposes, the Fund's investment holdings and NAV include trades executed through the end of the last business day of the period. The NAV per share for processing shareholder transactions is calculated as of the close of business of the New York Stock Exchange (NYSE) normally 4:00 p.m. Eastern time and includes trades executed through the end of the prior business day. Gains and losses on securities sold are determined on the basis of identified cost and may include proceeds received from litigation. Dividend income is recorded on the ex-dividend date, except for certain dividends from foreign securities where the ex-dividend date may have passed, which are recorded as soon as the Fund is informed of the ex-dividend date. Non-cash dividends included in dividend income, if any, are recorded at the fair market value of the securities received. Distributions received on securities that represent a return of capital or capital gain are recorded as a reduction of cost of investments and/or as a realized gain. The Fund estimates the components of distributions received that may be considered return of capital distributions or capital gain distributions. Large, non-recurring dividends recognized by the Fund are presented separately on the Statement of Operations as "Special Dividends" and the impact of these dividends is presented in the Financial
Annual Report
Notes to Financial Statements - continued
3. Significant Accounting Policies - continued
Investment Transactions and Income - continued
Highlights. Interest income and distributions from the Fidelity Central Funds are accrued as earned. Interest income includes coupon interest and amortization of premium and accretion of discount on debt securities. Investment income is recorded net of foreign taxes withheld where recovery of such taxes is uncertain.
Expenses. Most expenses of the Trust can be directly attributed to a fund. Expenses which cannot be directly attributed are apportioned amongst each fund in the Trust. Expense estimates are accrued in the period to which they relate and adjustments are made when actual amounts are known.
Income Tax Information and Distributions to Shareholders. Each year the Fund intends to qualify as a regulated investment company, including distributing substantially all of its taxable income and realized gains under Subchapter M of the Internal Revenue Code and filing its U.S. federal tax return. As a result, no provision for income taxes is required. As of October 31, 2010, the Fund did not have any unrecognized tax benefits in the accompanying financial statements. A fund's federal tax return is subject to examination by the Internal Revenue Service (IRS) for a period of three years. Foreign taxes are provided for based on the Fund's understanding of the tax rules and rates that exist in the foreign markets in which it invests.
Distributions are declared and recorded on the ex-dividend date. Income dividends and capital gain distributions are declared separately for each class. Income and capital gain distributions are determined in accordance with income tax regulations, which may differ from GAAP.
Capital accounts within the financial statements are adjusted for permanent book-tax differences. These adjustments have no impact on net assets or the results of operations. Temporary book-tax differences will reverse in a subsequent period.
Book-tax differences are primarily due to short term gain distributions from the Fidelity Central Funds, foreign currency transactions, partnerships, capital loss carryforwards and losses deferred due to wash sales.
The federal tax cost of investment securities and unrealized appreciation (depreciation) as of period end were as follows:
Gross unrealized appreciation | $ 4,402,419 |
Gross unrealized depreciation | (8,774,270) |
Net unrealized appreciation (depreciation) | $ (4,371,851) |
| |
Tax Cost | $ 49,813,212 |
Annual Report
3. Significant Accounting Policies - continued
Income Tax Information and Distributions to Shareholders - continued
The tax-based components of distributable earnings as of period end were as follows:
Undistributed ordinary income | $ 283,369 |
Capital loss carry forward | $ (34,021,859) |
Net unrealized appreciation (depreciation) | $ (4,402,642) |
The tax character of distributions paid was as follows
| October 31, 2010 | October 31, 2009 |
Ordinary Income | $ 508,549 | $ 1,108,886 |
4. Purchase and Sale of Investments.
Purchase and sale of securities, other than short-term securities, aggregated 28,018,442 and 45,530,966, respectively.
5. Fees and Other Transactions with Affiliates.
Management Fee. Fidelity Management & Research Company (FMR) and its affiliates provide the Fund with investment management related services for which the Fund pays a monthly management fee. The management fee is the sum of an individual fund fee rate that is based on an annual rate of .30% of the Fund's average net assets and a group fee rate that averaged .26% during the period. The group fee rate is based upon the average net assets of all the mutual funds advised by FMR. The group fee rate decreases as assets under management increase and increases as assets under management decrease. In addition, the management fee is subject to a performance adjustment (up to a maximum of ± .20% of the Fund's average net assets over a 36 month performance period). The upward or downward adjustment to the management fee is based on the relative investment performance of the Institutional Class of the Fund as compared to an appropriate benchmark index. For the period, the total annual management fee rate, including the performance adjustment, was .40% of the Fund's average net assets.
Annual Report
Notes to Financial Statements - continued
5. Fees and Other Transactions with Affiliates - continued
Distribution and Service Plan Fees. In accordance with Rule 12b-1 of the 1940 Act, the Fund has adopted separate Distribution and Service Plans for each class of shares. Certain classes pay Fidelity Distributors Corporation (FDC), an affiliate of FMR, separate Distribution and Service Fees, each of which is based on an annual percentage of each class' average net assets. In addition, FDC may pay financial intermediaries for selling shares of the Fund and providing shareholder support services. For the period, the Distribution and Service Fee rates, total fees and amounts retained by FDC were as follows:
| Distribution
Fee | Service
Fee | Total Fees | Retained
by FDC |
Class A | -% | .25% | $ 72,284 | $ 281 |
Class T | .25% | .25% | 97,110 | 269 |
Class B | .75% | .25% | 18,697 | 14,039 |
Class C | .75% | .25% | 42,291 | 4,481 |
| | | $ 230,382 | $ 19,070 |
Sales Load. FDC receives a front-end sales charge of up to 5.75% for selling Class A shares, and 3.50% for selling Class T shares, some of which is paid to financial intermediaries for selling shares of the Fund. FDC receives the proceeds of contingent deferred sales charges levied on Class A, Class T, Class B, and Class C redemptions. These charges depend on the holding period. The deferred sales charges range from 5% to 1% for Class B, 1% for Class C, 1.00% for certain purchases of Class A shares (1.00% to .50% prior to July 12, 2010) and .25% for certain purchases of Class T shares.
For the period, sales charge amounts retained by FDC were as follows:
| Retained by FDC |
Class A | $ 2,782 |
Class T | 900 |
Class B* | 4,458 |
Class C* | 147 |
| $ 8,287 |
* When Class B and Class C shares are initially sold, FDC pays commissions from its own resources to financial intermediaries through which the sales
are made.
Transfer Agent Fees. Fidelity Investments Institutional Operations Company, Inc. (FIIOC), an affiliate of FMR, is the transfer, dividend disbursing and shareholder servicing agent for each class of the Fund. FIIOC receives account fees and asset-based fees that vary according to the account size and type of account of the shareholders of the respective classes of the Fund. FIIOC pays for typesetting, printing and mailing of
Annual Report
5. Fees and Other Transactions with Affiliates - continued
Transfer Agent Fees - continued
shareholder reports, except proxy statements. For the period, transfer agent fees for each class were as follows:
| Amount | % of
Average
Net Assets |
Class A | $ 89,413 | .31 |
Class T | 56,600 | .29 |
Class B | 5,893 | .32 |
Class C | 13,263 | .31 |
Institutional Class | 4,645 | .32 |
| $ 169,814 | |
Accounting and Security Lending Fees. Fidelity Service Company, Inc. (FSC), an affiliate of FMR, maintains the Fund's accounting records. The accounting fee is based on the level of average net assets for the month. Under a separate contract, FSC administers the security lending program. The security lending fee is based on the number and duration of lending transactions.
Brokerage Commissions. The Fund placed a portion of its portfolio transactions with brokerage firms which are affiliates of the investment adviser. The commissions paid to these affiliated firms were $2,178 for the period.
6. Committed Line of Credit.
The Fund participates with other funds managed by FMR or an affiliate in a $3.75 billion credit facility (the "line of credit") to be utilized for temporary or emergency purposes to fund shareholder redemptions or for other short-term liquidity purposes. The Fund has agreed to pay commitment fees on its pro-rata portion of the line of credit, which amounted to $225 and is reflected in Miscellaneous expenses on the Statement of Operations. During the period, there were no borrowings on this line of credit.
7. Security Lending.
The Fund lends portfolio securities through a lending agent from time to time in order to earn additional income. The lending agent may loan securities to certain qualified borrowers, including Fidelity Capital Market (FCM), a broker-dealer affiliated with the Fund. On the settlement date of the loan, the Fund receives collateral (in the form of U.S. Treasury obligations, letters of credit and/or cash) against the loaned securities and maintains collateral in an amount not less than 100% of the market value of the loaned securities during the period of the loan. The market value of the loaned securities is
Annual Report
Notes to Financial Statements - continued
7. Security Lending - continued
determined at the close of business of the Fund and any additional required collateral is delivered to the Fund on the next business day. If the borrower defaults on its obligation to return the securities loaned because of insolvency or other reasons, a fund could experience delays and costs in recovering the securities loaned or in gaining access to the collateral. Any cash collateral received is invested in the Fidelity Securities Lending Cash Central Fund. The value of loaned securities and cash collateral at period end are disclosed on the Fund's Statement of Assets and Liabilities. Security lending income represents the income earned on investing cash collateral, less rebates paid to borrowers and lending agent fees associated with the loan, plus any premium payments received for lending certain types of securities. Security lending income is presented in Statement of Operations as a component of income from Fidelity Central Funds. Total security lending income during the period amounted to $830. During the period, there were no securities loaned to FCM.
8. Expense Reductions.
Many of the brokers with whom FMR places trades on behalf of the Fund provided services in addition to trade execution. These services included payments of certain expenses on behalf of the Fund totaling $2,243 for the period.
9. Distributions to Shareholders.
Distributions to shareholders of each class were as follows:
Years ended October 31, | 2010 | 2009 |
From net investment income | | |
Class A | $ 284,681 | $ 651,492 |
Class T | 160,619 | 331,626 |
Class B | 4,372 | 16,855 |
Class C | 6,593 | 58,115 |
Institutional Class | 21,909 | 50,798 |
Total | $ 478,174 | $ 1,108,886 |
From net realized gain | | |
Class A | $ 15,305 | $ - |
Class T | 10,853 | - |
Class B | 1,041 | - |
Class C | 2,198 | - |
Institutional Class | 978 | - |
Total | $ 30,375 | $ - |
Annual Report
10. Share Transactions.
Transactions for each class of shares were as follows:
| Shares | Dollars |
Years ended October 31, | 2010 | 2009 | 2010 | 2009 |
Class A | | | | |
Shares sold | 402,871 | 726,745 | $ 4,034,369 | $ 5,639,090 |
Reinvestment of distributions | 29,667 | 83,555 | 290,443 | 628,332 |
Shares redeemed | (994,975) | (1,774,132) | (9,899,783) | (14,305,593) |
Net increase (decrease) | (562,437) | (963,832) | $ (5,574,971) | $ (8,038,171) |
Class T | | | | |
Shares sold | 129,419 | 296,628 | $ 1,299,211 | $ 2,194,950 |
Reinvestment of distributions | 17,388 | 43,233 | 169,877 | 324,683 |
Shares redeemed | (1,112,927) | (757,445) | (11,167,229) | (5,709,688) |
Net increase (decrease) | (966,120) | (417,584) | $ (9,698,141) | $ (3,190,055) |
Class B | | | | |
Shares sold | 21,226 | 27,365 | $ 215,795 | $ 212,586 |
Reinvestment of distributions | 524 | 2,093 | 5,094 | 15,659 |
Shares redeemed | (77,825) | (121,572) | (763,138) | (906,818) |
Net increase (decrease) | (56,075) | (92,114) | $ (542,249) | $ (678,573) |
Class C | | | | |
Shares sold | 78,869 | 121,314 | $ 774,653 | $ 940,578 |
Reinvestment of distributions | 834 | 6,675 | 8,059 | 49,531 |
Shares redeemed | (111,299) | (313,856) | (1,100,227) | (2,497,490) |
Net increase (decrease) | (31,596) | (185,867) | $ (317,515) | $ (1,507,381) |
Institutional Class | | | | |
Shares sold | 25,211 | 112,130 | $ 254,312 | $ 872,885 |
Reinvestment of distributions | 2,223 | 6,216 | 21,848 | 46,931 |
Shares redeemed | (195,256) | (100,375) | (1,913,418) | (799,587) |
Net increase (decrease) | (167,822) | 17,971 | $ (1,637,258) | $ 120,229 |
11. Other.
The Fund's organizational documents provide former and current trustees and officers with a limited indemnification against liabilities arising in connection with the performance of their duties to the Fund. In the normal course of business, the Fund may also enter into contracts that provide general indemnifications. The Fund's maximum exposure under these arrangements is unknown as this would be dependent on future claims that may be made against the Fund. The risk of material loss from such claims is considered remote.
Annual Report
To the Trustees of Fidelity Advisor Series VIII and the Shareholders of Fidelity Advisor Value Leaders Fund:
In our opinion, the accompanying statement of assets and liabilities, including the schedule of investments, and the related statements of operations and of changes in net assets and the financial highlights present fairly, in all material respects, the financial position of Fidelity Advisor Value Leaders Fund (a fund of Fidelity Advisor Series VIII) at October 31, 2010, the results of its operations for the year then ended, the changes in its net assets for each of the two years in the period then ended and the financial highlights for each of the five years in the period then ended, in conformity with accounting principles generally accepted in the United States of America. These financial statements and financial highlights (hereafter referred to as "financial statements") are the responsibility of the Fidelity Advisor Value Leaders Fund's management. Our responsibility is to express an opinion on these financial statements based on our audits. We conducted our audits of these financial statements in accordance with the standards of the Public Company Accounting Oversight Board (United States). Those standards require that we plan and perform the audit to obtain reasonable assurance about whether the financial statements are free of material misstatement. An audit includes examining, on a test basis, evidence supporting the amounts and disclosures in the financial statements, assessing the accounting principles used and significant estimates made by management, and evaluating the overall financial statement presentation. We believe that our audits, which included confirmation of securities at October 31, 2010 by correspondence with the custodian and brokers, provide a reasonable basis for our opinion.
/s/ PricewaterhouseCoopers LLP
PricewaterhouseCoopers LLP
Boston, Massachusetts
December 13, 2010
Annual Report
The Trustees, Member of the Advisory Board, and executive officers of the trust and fund, as applicable, are listed below. The Board of Trustees governs the fund and is responsible for protecting the interests of shareholders. The Trustees are experienced executives who meet periodically throughout the year to oversee the fund's activities, review contractual arrangements with companies that provide services to the fund, oversee management of the risks associated with such activities and contractual arrangements, and review the fund's performance. Except for James C. Curvey, each of the Trustees oversees 221 funds advised by FMR or an affiliate. Mr. Curvey oversees 410 funds advised by FMR or an affiliate.
The Trustees hold office without limit in time except that (a) any Trustee may resign; (b) any Trustee may be removed by written instrument, signed by at least two-thirds of the number of Trustees prior to such removal; (c) any Trustee who requests to be retired or who has become incapacitated by illness or injury may be retired by written instrument signed by a majority of the other Trustees; and (d) any Trustee may be removed at any special meeting of shareholders by a two-thirds vote of the outstanding voting securities of the trust. Each Trustee who is not an interested person (as defined in the 1940 Act) (Independent Trustee), shall retire not later than the last day of the calendar year in which his or her 72nd birthday occurs. The Independent Trustees may waive this mandatory retirement age policy with respect to individual Trustees. The executive officers and Advisory Board Member hold office without limit in time, except that any officer and Advisory Board Member may resign or may be removed by a vote of a majority of the Trustees at any regular meeting or any special meeting of the Trustees. Except as indicated, each individual has held the office shown or other offices in the same company for the past five years.
Experience, Skills, Attributes, and Qualifications of the Fund's Trustees. The Governance and Nominating Committee has adopted a statement of policy that describes the experience, qualifications, attributes, and skills that are necessary and desirable for potential Independent Trustee candidates (Statement of Policy). The Board believes that each Trustee satisfied at the time he or she was initially elected or appointed a Trustee, and continues to satisfy, the standards contemplated by the Statement of Policy. The Governance and Nominating Committee also engages professional search firms to help identify potential Independent Trustee candidates who have the experience, qualifications, attributes, and skills consistent with the Statement of Policy. From time to time, additional criteria based on the composition and skills of the current Independent Trustees, as well as experience or skills that may be appropriate in light of future changes to board composition, business conditions, and regulatory or other developments, have also been considered by the professional search firms and the Governance and Nominating Committee. In addition, the Board takes into account the Trustees' commitment and participation in Board and committee meetings, as well as their leadership of standing and ad hoc committees throughout their tenure.
In determining that a particular Trustee was and continues to be qualified to serve as a Trustee, the Board has considered a variety of criteria, none of which, in isolation, was controlling. The Board believes that, collectively, the Trustees have balanced and diverse experience, qualifications, attributes, and skills, which allow the Board to operate effectively in governing the fund and protecting the interests of shareholders. Information about the specific experience, skills, attributes, and qualifications of each Trustee, which in each case led to the Board's conclusion that the Trustee should serve (or continue to serve) as a trustee of the fund, is provided below.
Annual Report
Board Structure and Oversight Function. Edward C. Johnson 3d is an interested person (as defined in the 1940 Act) and currently serves as Chairman. The Trustees have determined that an interested Chairman is appropriate and benefits shareholders because an interested Chairman has a personal and professional stake in the quality and continuity of services provided to the fund. Independent Trustees exercise their informed business judgment to appoint an individual of their choosing to serve as Chairman, regardless of whether the Trustee happens to be independent or a member of management. The Independent Trustees have determined that they can act independently and effectively without having an Independent Trustee serve as Chairman and that a key structural component for assuring that they are in a position to do so is for the Independent Trustees to constitute a substantial majority for the Board. The Independent Trustees also regularly meet in executive session. Ned C. Lautenbach serves as Chairman of the Independent Trustees and as such (i) acts as a liaison between the Independent Trustees and management with respect to matters important to the Independent Trustees and (ii) with management prepares agendas for Board meetings.
Fidelity funds are overseen by different Boards of Trustees. The fund's Board oversees Fidelity's equity and high income funds and another Board oversees Fidelity's investment-grade bond, money market, and asset allocation funds. The asset allocation funds may invest in Fidelity funds overseen by the fund's Board. The use of separate Boards, each with its own committee structure, allows the Trustees of each group of Fidelity funds to focus on the unique issues of the funds they oversee, including common research, investment, and operational issues. On occasion, the separate Boards establish joint committees to address issues of overlapping consequences for the Fidelity funds overseen by each Board.
The Trustees operate using a system of committees to facilitate the timely and efficient consideration of all matters of importance to the Trustees, the fund, and fund shareholders and to facilitate compliance with legal and regulatory requirements and oversight of the fund's activities and associated risks. The Board, acting through its committees, has charged FMR and its affiliates with (i) identifying events or circumstances the occurrence of which could have demonstrably adverse effects on the fund's business and/or reputation; (ii) implementing processes and controls to lessen the possibility that such events or circumstances occur or to mitigate the effects of such events or circumstances if they do occur; and (iii) creating and maintaining a system designed to evaluate continuously business and market conditions in order to facilitate the identification and implementation processes described in (i) and (ii) above. Because the day-to-day operations and activities of the fund are carried out by or through FMR, its affiliates and other service providers, the fund's exposure to risks is mitigated but not eliminated by the processes overseen by the Trustees. While each of the Board's committees has responsibility for overseeing different aspects of the fund's activities, oversight is exercised primarily through the Operations, Audit, and Compliance Committees. Appropriate personnel, including but not limited to the fund's Chief Compliance Officer (CCO), FMR's internal auditor, the independent accountants, the fund's Treasurer and portfolio management personnel, make periodic reports to the Board's committees, as appropriate. The responsibilities of each committee, including their oversight responsibilities, are described further under "Standing Committees of the Fund's Trustees."
Annual Report
Trustees and Officers - continued
The fund's Statement of Additional Information (SAI) includes more information about the Trustees. To request a free copy, call Fidelity at 1-877-208-0098.
Interested Trustees*:
Correspondence intended for each Trustee who is an interested person may be sent to Fidelity Investments, 82 Devonshire Street, Boston, Massachusetts 02109.
Name, Age; Principal Occupations and Other Relevant Experience+ |
Edward C. Johnson 3d (80) |
| Year of Election or Appointment: 1983 Mr. Johnson is Trustee and Chairman of the Board of Trustees of certain Trusts. Mr. Johnson serves as Chief Executive Officer, Chairman, and a Director of FMR LLC; Chairman and a Director of FMR; Chairman and a Director of Fidelity Research & Analysis Company (FRAC); Chairman and a Director of Fidelity Investments Money Management, Inc.; and Chairman and a Director of FMR Co., Inc. In addition, Mr. Johnson serves as Chairman and Director of FIL Limited. Previously, Mr. Johnson served as President of FMR LLC (2006-2007). |
James C. Curvey (75) |
| Year of Election or Appointment: 2007 Mr. Curvey also serves as Trustee (2007-present) of other investment companies advised by FMR. Mr. Curvey is a Director of Fidelity Investments Money Management, Inc. (2009-present), Director of Fidelity Research & Analysis Co. (2009-present) and Director of FMR and FMR Co., Inc. (2007-present). Mr. Curvey is also Vice Chairman (2007-present) and Director of FMR LLC. In addition, Mr. Curvey serves as an Overseer for the Boston Symphony Orchestra and a member of the Trustees of Villanova University. Previously, Mr. Curvey was the Vice Chairman (2006-2007) and Director (2000-2007) of FMR Corp. |
* Trustees have been determined to be "Interested Trustees" by virtue of, among other things, their affiliation with the trust or various entities under common control with FMR.
Annual Report
+ The information above includes each Trustee's principal occupation during the last five years and other information relating to the experience, attributes, and skills relevant to each Trustee's qualifications to serve as a Trustee, which led to the conclusion that each Trustee should serve as a Trustee for the fund.
Independent Trustees:
Correspondence intended for each Independent Trustee (that is, the Trustees other than the Interested Trustees) may be sent to Fidelity Investments, P.O. Box 55235, Boston, Massachusetts 02205-5235.
Name, Age; Principal Occupations and Other Relevant Experience+ |
Dennis J. Dirks (62) |
| Year of Election or Appointment: 2005 Prior to his retirement in May 2003, Mr. Dirks was Chief Operating Officer and a member of the Board of The Depository Trust & Clearing Corporation (DTCC). He also served as President, Chief Operating Officer, and Board member of The Depository Trust Company (DTC) and President and Board member of the National Securities Clearing Corporation (NSCC). In addition, Mr. Dirks served as Chief Executive Officer and Board member of the Government Securities Clearing Corporation, Chief Executive Officer and Board member of the Mortgage-Backed Securities Clearing Corporation, as a Trustee and a member of the Finance Committee of Manhattan College (2005-2008), and as a Trustee and a member of the Finance Committee of AHRC of Nassau County (2006-2008). Mr. Dirks is a member of the Independent Directors Council (IDC) Governing Council (2010-Present) and Board of Directors for The Brookville Center for Children's Services, Inc. (2009-present). |
Alan J. Lacy (57) |
| Year of Election or Appointment: 2008 Mr. Lacy serves as Senior Adviser (2007-present) of Oak Hill Capital Partners, L.P. (private equity). Mr. Lacy also served as Chief Executive Officer (2000-2005) and Vice Chairman (2005-2006) of Sears Holdings Corporation and Sears, Roebuck and Co. (retail). In addition, Mr. Lacy serves as a member of the Board of Directors of The Western Union Company (global money transfer, 2006-present) and Bristol-Myers Squibb Company (global pharmaceuticals, 2007-present). Mr. Lacy is Chairman (2008-present) and a member (2006-present) of the Board of Trustees of The National Parks Conservation Association. |
Ned C. Lautenbach (66) |
| Year of Election or Appointment: 2000 Mr. Lautenbach is Chairman of the Independent Trustees of the Equity and High Income Funds (2006-present). Mr. Lautenbach currently serves as the Lead Director of the Eaton Corporation Board of Directors (diversified industrial, 1997-present). Mr. Lautenbach is also a member of the Board of Directors of the Philharmonic Center for the Arts in Naples, Florida (1999-present); a member of the Board of Trustees of Fairfield University (2005-present); and a member of the Council on Foreign Relations (1994-present). Previously, Mr. Lautenbach was a Partner/Advisory Partner at Clayton, Dubilier & Rice, Inc. (private equity investment, 1998-2010), as well as a Director of Sony Corporation (2006-2007). |
Joseph Mauriello (66) |
| Year of Election or Appointment: 2008 Prior to his retirement in January 2006, Mr. Mauriello served in numerous senior management positions including Deputy Chairman and Chief Operating Officer (2004-2005), and Vice Chairman of Financial Services (2002-2004) of KPMG LLP US (professional services, 1965-2005). Mr. Mauriello currently serves as a member of the Board of Directors of XL Group plc. (global insurance and re-insurance, 2006-present) and of Arcadia Resources Inc. (health care services and products, 2007-present). Previously, Mr. Mauriello served as a Director of the Hamilton Funds of the Bank of New York (2006-2007). |
Cornelia M. Small (66) |
| Year of Election or Appointment: 2005 Ms. Small is a member of the Board of Directors of the Teagle Foundation (2009-present). Ms. Small is also a member of the Investment Committee, and Chair (2008-present) and a member of the Board of Trustees of Smith College. In addition, Ms. Small serves on the Investment Committee of the Berkshire Taconic Community Foundation (2008-present). Previously, Ms. Small served as Chairperson of the Investment Committee (2002-2008) of Smith College. In addition, Ms. Small served as Chief Investment Officer, Director of Global Equity Investments, and a member of the Board of Directors of Scudder, Stevens & Clark and Scudder Kemper Investments. |
William S. Stavropoulos (71) |
| Year of Election or Appointment: 2001 Mr. Stavropoulos is Vice Chairman of the Independent Trustees of the Equity and High Income Funds (2006-present). Mr. Stavropoulos serves as President and Founder of the Michigan Baseball Foundation, the Great Lakes Loons (2007-present). Mr. Stavropoulos is Chairman Emeritus of the Board of Directors of The Dow Chemical Company, where he previously served in numerous senior management positions, including President, CEO (1995-2000; 2002-2004), Chairman of the Executive Committee (2000-2006), and as a member of the Board of Directors (1990-2006). Currently, Mr. Stavropoulos is Chairman of Univar (global distributor of commodity and specialty chemicals, 2010-present), a Director of Teradata Corporation (data warehousing and technology solutions, 2008-present), Chemical Financial Corporation, Maersk Inc. (industrial conglomerate), Tyco International, Inc. (multinational manufacturing and services, 2007-present), and a member of the Advisory Board for Metalmark Capital (private equity investment, 2005-present). Mr. Stavropoulos is a special advisor to Clayton, Dubilier & Rice, Inc. (private equity investment). In addition, Mr. Stavropoulos is a member of the University of Notre Dame Advisory Council for the College of Science. |
David M. Thomas (61) |
| Year of Election or Appointment: 2008 Previously, Mr. Thomas served as Executive Chairman (2005-2006) and Chairman and Chief Executive Officer (2000-2005) of IMS Health, Inc. (pharmaceutical and healthcare information solutions). In addition, Mr. Thomas serves as a member of the Board of Directors of Fortune Brands, Inc. (consumer products), and Interpublic Group of Companies, Inc. (marketing communication, 2004-present). |
Michael E. Wiley (60) |
| Year of Election or Appointment: 2008 Mr. Wiley also serves as a Director of Asia Pacific Exploration Consolidated (international oil and gas exploration and production, 2008-present). Mr. Wiley serves as a Director of Tesoro Corporation (independent oil refiner and marketer, 2005-present), and a Director of Bill Barrett Corporation (exploration and production, 2005-present). In addition, Mr. Wiley also serves as a Director of Post Oak Bank (privately-held bank, 2004-present). Previously, Mr. Wiley served as a member of the Board of Trustees of the University of Tulsa (2000-2006; 2007-2010), as a Senior Energy Advisor of Katzenbach Partners, LLC (consulting, 2006-2007), as an Advisory Director of Riverstone Holdings (private investment), Chairman, President, and CEO of Baker Hughes, Inc. (oilfield services, 2000-2004), and as Director of Spinnaker Exploration Company (exploration and production, 2001-2005). |
Annual Report
Trustees and Officers - continued
+ The information above includes each Trustee's principal occupation during the last five years and other information relating to the experience, attributes, and skills relevant to each Trustee's qualifications to serve as a Trustee, which led to the conclusion that each Trustee should serve as a Trustee for the fund.
Advisory Board Member and Executive Officers:
Correspondence intended for each executive officer and Peter S. Lynch may be sent to Fidelity Investments, 82 Devonshire Street, Boston, Massachusetts 02109.
Name, Age; Principal Occupation |
Peter S. Lynch (66) |
| Year of Election or Appointment: 2003 Member of the Advisory Board of Fidelity's Equity and High Income Funds. Mr. Lynch is Vice Chairman and a Director of FMR and FMR Co., Inc. In addition, Mr. Lynch serves as a Trustee of Boston College and as the Chairman of the Inner-City Scholarship Fund. Previously, Mr. Lynch served on the Special Olympics International Board of Directors (1997-2006). |
Kenneth B. Robins (41) |
| Year of Election or Appointment: 2008 President and Treasurer of Fidelity's Equity and High Income Funds. Mr. Robins also serves as President and Treasurer (2010-present) and Assistant Treasurer (2009-present) of other Fidelity funds and is an employee of Fidelity Investments (2004-present). Previously, Mr. Robins served as Deputy Treasurer of the Fidelity funds (2005-2008) and Treasurer and Chief Financial Officer of The North Carolina Capital Management Trust: Cash and Term Portfolios (2006-2008). |
Brian B. Hogan (46) |
| Year of Election or Appointment: 2009 Vice President of certain Equity Funds and Vice President of Sector Funds. Mr. Hogan also serves as President of FMR's Equity Division (2009-present). Previously, Mr. Hogan served as Senior Vice President, Equity Research of FMR (2006-2009) and as a portfolio manager. |
Thomas C. Hense (46) |
| Year of Election or Appointment: 2008 or 2010 Vice President of Fidelity's High Income (2008), Small Cap (2008), and Value (2010) Funds. Previously, Mr. Hense served as a portfolio manager for Fidelity's Institutional Money Management Group (Pyramis) (2003-2008). |
Scott C. Goebel (42) |
| Year of Election or Appointment: 2008 Secretary and Chief Legal Officer (CLO) of the Fidelity funds. Mr. Goebel also serves as Secretary and CLO of The North Carolina Capital Management Trust: Cash and Term Portfolio (2008-present); General Counsel, Secretary, and Senior Vice President of FMR (2008-present) and FMR Co., Inc. (2008-present); Deputy General Counsel of FMR LLC; Chief Legal Officer of Fidelity Management & Research (Hong Kong) Limited (2008-present) and Assistant Secretary of Fidelity Management & Research (Japan) Inc. (2008-present), Fidelity Investments Money Management, Inc. (2008-present), Fidelity Management & Research (U.K.) Inc. (2008-present), and Fidelity Research and Analysis Company (2008-present). Previously, Mr. Goebel served as Assistant Secretary of the Funds (2007-2008) and as Vice President and Secretary of Fidelity Distributors Corporation (FDC) (2005-2007). |
William C. Coffey (41) |
| Year of Election or Appointment: 2009 Assistant Secretary of Fidelity's Equity and High Income Funds. Mr. Coffey also serves as Senior Vice President and Deputy General Counsel of FMR LLC (2010-present), and is an employee of Fidelity Investments. Previously, Mr. Coffey served as Vice President and Associate General Counsel of FMR LLC (2005-2009). |
Holly C. Laurent (56) |
| Year of Election or Appointment: 2008 Anti-Money Laundering (AML) Officer of the Fidelity funds. Ms. Laurent also serves as AML Officer of The North Carolina Capital Management Trust: Cash and Term Portfolio (2008-present) and is an employee of Fidelity Investments. Previously, Ms. Laurent was Senior Vice President and Head of Legal for Fidelity Business Services India Pvt. Ltd. (2006-2008), and Senior Vice President, Deputy General Counsel and Group Head for FMR LLC (2005-2006). |
Christine Reynolds (52) |
| Year of Election or Appointment: 2008 Chief Financial Officer of the Fidelity funds. Ms. Reynolds became President of Fidelity Pricing and Cash Management Services (FPCMS) in August 2008. Ms. Reynolds served as Chief Operating Officer of FPCMS (2007-2008). Previously, Ms. Reynolds served as President, Treasurer, and Anti-Money Laundering officer of the Fidelity funds (2004-2007). |
Kenneth A. Rathgeber (63) |
| Year of Election or Appointment: 2004 Chief Compliance Officer of Fidelity's Equity and High Income Funds. Mr. Rathgeber is Chief Compliance Officer of Fidelity Management & Research (Hong Kong) Limited (2008-present), Fidelity Management & Research (Japan) Inc. (2008-present), FMR (2005-present), FMR Co., Inc. (2005-present), Fidelity Management & Research (U.K.) Inc. (2005-present), Fidelity Research & Analysis Company (2005-present), Fidelity Investments Money Management, Inc. (2005-present), Pyramis Global Advisors, LLC (2005-present), and Strategic Advisers, Inc. (2005-present). |
Jeffrey S. Christian (49) |
| Year of Election or Appointment: 2009 Deputy Treasurer of the Fidelity funds. Mr. Christian is an employee of Fidelity Investments. Previously, Mr. Christian served as Chief Financial Officer (2008-2009) of certain Fidelity funds and Senior Vice President of Fidelity Pricing and Cash Management Services (FPCMS) (2004-2009). |
Bryan A. Mehrmann (49) |
| Year of Election or Appointment: 2005 Deputy Treasurer of the Fidelity funds. Mr. Mehrmann is an employee of Fidelity Investments. |
Adrien E. Deberghes (43) |
| Year of Election or Appointment: 2008 Deputy Treasurer of Fidelity's Equity and High Income Funds. Mr. Deberghes also serves as Assistant Treasurer of other Fidelity funds (2010-present) and is an employee of Fidelity Investments (2008-present). Previously, Mr. Deberghes served as Senior Vice President of Mutual Fund Administration at State Street Corporation (2007-2008), Senior Director of Mutual Fund Administration at Investors Bank & Trust (2005-2007), and Director of Finance for Dunkin' Brands (2000-2005). |
Stephanie J. Dorsey (41) |
| Year of Election or Appointment: 2010 Assistant Treasurer of Fidelity's Equity and High Income Funds. Ms. Dorsey also serves as Deputy Treasurer of other Fidelity funds (2008-present) and is an employee of Fidelity Investments (2008-present). Previously, Ms. Dorsey served as Treasurer (2004-2008) of the JPMorgan Mutual Funds and Vice President (2004-2008) of JPMorgan Chase Bank. |
John R. Hebble (52) |
| Year of Election or Appointment: 2009 Assistant Treasurer of Fidelity's Equity and High Income Funds. Mr. Hebble also serves as Treasurer and Chief Financial Officer of The North Carolina Capital Management Trust: Cash and Term Portfolio (2008-present), President and Treasurer of other Fidelity funds (2008-present) and is an employee of Fidelity Investments. |
Gary W. Ryan (52) |
| Year of Election or Appointment: 2005 Assistant Treasurer of the Fidelity funds. Mr. Ryan is an employee of Fidelity Investments. Previously, Mr. Ryan served as Vice President of Fund Reporting in Fidelity Pricing and Cash Management Services (FPCMS) (1999-2005). |
Jonathan Davis (42) |
| Year of Election or Appointment: 2010 Assistant Treasurer of the Fidelity funds. Mr. Davis is an employee of Fidelity Investments. Previously, Mr. Davis served as Vice President and Associate General Counsel of FMR LLC (2003-2010). |
Annual Report
The Board of Trustees of Advisor Value Leaders voted to pay to shareholders of record at the opening of business on record date, the following distributions per share derived from capital gains realized from sales of portfolio securities, and dividends derived from net investment income:
| Pay Date | Record Date | Dividends | Capital Gains |
Class A | 12/06/10 | 12/03/10 | $0.113 | $0.010 |
| | | | |
Class T | 12/06/10 | 12/03/10 | $0.047 | $0.010 |
| | | | |
Class B | 12/06/10 | 12/03/10 | $0.027 | $0.010 |
| | | | |
Class C | 12/06/10 | 12/03/10 | $0.045 | $0.010 |
Class A, Class T, Class B and Class C designate 100% of the dividends distributed during the fiscal year as qualifying for the dividends-received deduction for corporate shareholders.
Class A, Class T, Class B and Class C designate 100% of the dividends distributed during the fiscal year as amounts which may be taken into account as a dividend for purposes of the maximum rate under section 1(h)(11) of the Internal Revenue Code.
The fund will notify shareholders in January 2011 of amounts for use in preparing 2010 income tax returns.
Annual Report
Board Approval of Investment Advisory Contracts and Management Fees
Fidelity Advisor Value Leaders Fund
Each year, the Board of Trustees, including the Independent Trustees (together, the Board), votes on the renewal of the management contract and sub-advisory agreements (together, the Advisory Contracts) for the fund. The Board, assisted by the advice of fund counsel and Independent Trustees' counsel, requests and considers a broad range of information relevant to the renewal of the Advisory Contracts throughout the year.
The Board meets regularly and considers at each of its meetings factors that are relevant to its annual consideration of the renewal of the fund's Advisory Contracts, including the services and support provided to the fund and its shareholders. The Board has established various standing committees, each composed of Independent Trustees with varying backgrounds, to which the Board has assigned specific subject matter responsibilities in order to enhance effective decision-making by the Board. The Board, acting directly and through its Committees, requests and receives information concerning the annual consideration of the renewal of the fund's Advisory Contracts. The Board also meets as needed to consider matters specifically related to the Board's annual consideration of the renewal of Advisory Contracts. Members of the Board may also meet with trustees of other Fidelity funds through ad hoc joint committees to discuss certain matters relevant to the Fidelity funds.
At its July 2010 meeting, the Board of Trustees, including the Independent Trustees, unanimously determined to renew the fund's Advisory Contracts. In reaching its determination, the Board considered all factors it believed relevant, including (i) the nature, extent, and quality of the services to be provided to the fund and its shareholders (including the investment performance of the fund); (ii) the competitiveness of the fund's management fee and total expenses; (iii) the total costs of the services to be provided by and the profits to be realized by Fidelity from its relationship with the fund; (iv) the extent to which economies of scale would be realized as the fund grows; and (v) whether fee levels reflect these economies of scale, if any, for the benefit of fund shareholders.
In considering whether to renew the Advisory Contracts for the fund, the Board reached a determination, with the assistance of fund counsel and Independent Trustees' counsel and through the exercise of its business judgment, that the renewal of the Advisory Contracts is in the best interests of fund shareholders and that the compensation to be received by Fidelity under the management contract is fair and reasonable. The Board's decision to renew the Advisory Contracts was not based on any single factor noted above, but rather was based on a comprehensive consideration of all the information provided to the Board at its meetings throughout the year. The Board, in reaching its determination to renew the Advisory Contracts, is aware that shareholders in the fund have a broad range of investment choices available to them, including a wide choice among mutual funds offered by Fidelity's competitors, and that the fund's shareholders, with the opportunity to review and weigh the disclosure provided by the fund in its prospectus and other public disclosures, have chosen to invest in this fund, managed by Fidelity.
Annual Report
Board Approval of Investment Advisory Contracts and
Management Fees - continued
Nature, Extent, and Quality of Services Provided. The Board considered the staffing within the investment adviser, FMR, and the sub-advisers (together, the Investment Advisers), including the backgrounds of the fund's investment personnel and the fund's investment objective and discipline. The Independent Trustees also had discussions with senior management of Fidelity's investment operations and investment groups. The Board considered the structure of the portfolio manager compensation program and whether this structure provides appropriate incentives to act in the best interest of the fund.
Resources Dedicated to Investment Management and Support Services. The Board and the equity research subcommittee of the Board's Fund Oversight Committee reviewed the size, education, and experience of the Investment Advisers' investment staff, their use of technology, and the Investment Advisers' approach to recruiting, training, and retaining portfolio managers and other research, advisory, and management personnel. The Board noted that Fidelity's analysts have access to a variety of technological tools and market and securities data that enable them to perform both fundamental and quantitative analysis and to specialize in various disciplines. The Board considered Fidelity's extensive global research capabilities that enable the Investment Advisers to aggregate data from various sources in an effort to produce positive investment results. The Board also considered that Fidelity's portfolio managers and analysts have access to daily portfolio attribution that allows for monitoring of a fund's portfolio, as well as an electronic communication system that provides immediate real-time access to research concerning issuers and credit enhancers. The Board noted FMR's continued focus on strengthening the organization and discipline of equity portfolio management and research.
Shareholder and Administrative Services. The Board considered (i) the nature, extent, quality, and cost of advisory, administrative, and shareholder services performed by the Investment Advisers and their affiliates under the Advisory Contracts and under separate agreements covering transfer agency, pricing and bookkeeping, and securities lending services for the fund; (ii) the nature and extent of the investment adviser's supervision of third party service providers, principally custodians and subcustodians; and (iii) the resources devoted to, and the record of compliance with, the fund's compliance policies and procedures. The Board also reviewed the allocation of fund brokerage, including allocations to brokers affiliated with the Investment Advisers, the use of brokerage commissions to pay fund expenses, and the use of "soft" commission dollars to pay for research services.
The Board noted that the growth of fund assets over time across the complex allows Fidelity to reinvest in the development of services designed to enhance the value or convenience of the Fidelity funds as investment vehicles. These services include 24-hour access to account information and market information through phone representatives and over the Internet, and investor education materials and asset allocation tools.
Annual Report
Investment in a Large Fund Family. The Board considered the benefits to shareholders of investing in a Fidelity fund, including the benefits of investing in a fund that is part of a large family of funds offering a variety of investment disciplines and providing a large variety of mutual fund investor services. The Board noted that Fidelity had taken, or had made recommendations that resulted in the Fidelity funds taking, a number of actions over the previous year that benefited particular funds, including (i) dedicating additional resources to investment research and restructuring and broadening the focus of the investment research teams; (ii) bolstering the senior management team that oversees asset management; (iii) launching Class F of certain funds as a lower-fee class available to Freedom K and Freedom Index Funds; (iv) lowering the initial investment minimums and ongoing balance requirements for Real Estate High Income Fund; (v) eliminating subsequent purchase minimums for all funds and adding a waiver of the investment minimum requirement for new accounts opened with the proceeds of a systematic withdrawal plan; (vi) eliminating the withdrawal minimum and maximum limits for systematic withdrawals from Advisor funds; (vii) expanding sales load waivers on Class A shares for Destiny Planholders and expanding Institutional Class eligibility for Class O Destiny Planholders; and (viii) changing certain Class A and Class T sales charge structures to further align them with industry practices.
Investment Performance. The Board considered whether the fund has operated in accordance with its investment objective, as well as its record of compliance with its investment restrictions. It also reviewed the fund's absolute investment performance for each class, as well as the fund's relative investment performance for each class measured over multiple periods against (i) a broad-based securities market index, and (ii) a peer group of mutual funds deemed appropriate by Fidelity and reviewed by the Board. The following charts considered by the Board show, over the one-, three-, and five-year periods ended December 31, 2009, the cumulative total returns of Institutional Class (Class I) and Class B of the fund, the cumulative total returns of a broad-based securities market index ("benchmark"), and a range of cumulative total returns of a peer group of mutual funds identified by Morningstar, Inc. as having an investment style similar to that of the fund based on underlying portfolio holdings. The returns of Institutional Class (Class I) and Class B show the performance of the highest and lowest performing classes, respectively (based on five-year performance). The box within each chart shows the 25th percentile return (bottom of box) and the 75th percentile return (top of box) of the peer group. Returns shown above the box are in the first quartile and returns shown below the box are in the fourth quartile. The percentage beaten numbers noted below each chart correspond to the percentile box and represent the percentage of funds in the peer group whose performance was equal to or lower than that of the class indicated.
Annual Report
Board Approval of Investment Advisory Contracts and
Management Fees - continued
Fidelity Advisor Value Leaders Fund
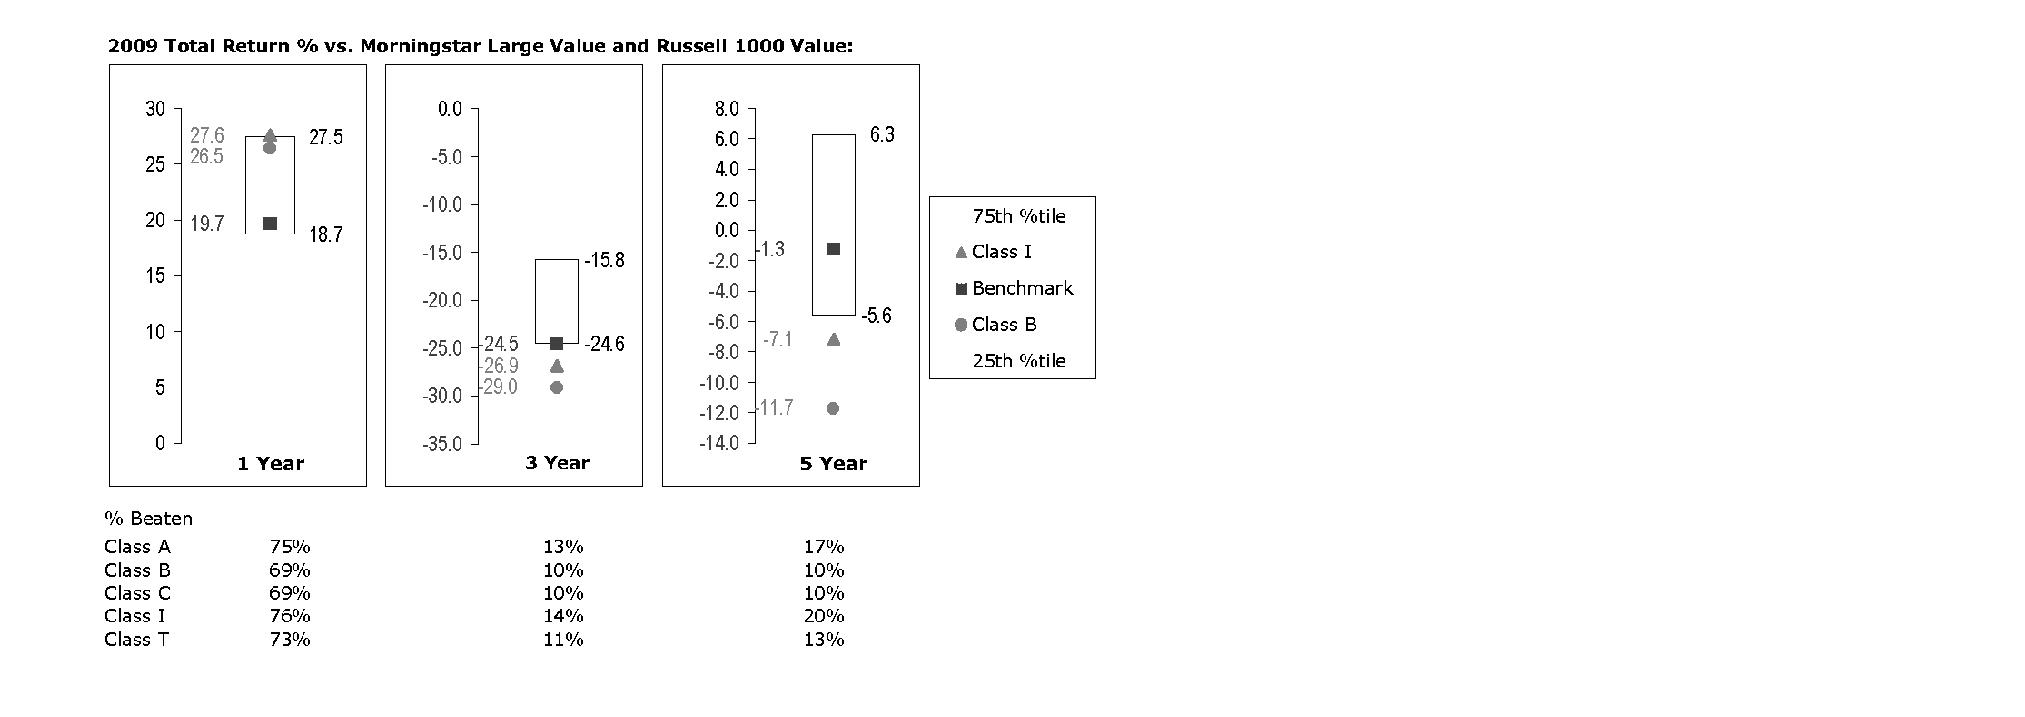
The Board reviewed the fund's relative investment performance against its peer group and noted that the performance of Institutional Class (Class I) of the fund was in the first quartile for the one-year period and the fourth quartile for the three- and five-year periods. The Board also noted that the investment performance of the fund was lower than its benchmark for the three- and five-year periods, although the one-year cumulative total return of Institutional Class (Class I) compared favorably to its benchmark. The Board considered that the variations in performance among the fund's classes reflect the variations in class expenses, which result in lower performance for higher expense classes. The Board also reviewed the fund's performance since inception as well as performance in the current year.
The Board also considered that the fund's management fee is subject to upward or downward adjustment depending upon whether, and to what extent, the fund's investment performance for the performance period exceeds, or is exceeded by, the record (over the same period) of a Board-approved performance adjustment index. The Board realizes that the performance adjustment provides FMR with a strong economic incentive to seek to achieve superior performance for the fund's shareholders and helps to more closely align the interests of FMR and the fund's shareholders.
Based on its review, and giving particular weight to the nature and quality of the resources dedicated by the Investment Advisers to maintain and improve relative performance and factoring in the unprecedented market events in recent years, the Board concluded that the nature, extent, and quality of investment management and support services and of shareholder and administrative services provided to the fund will benefit the fund's shareholders, particularly in light of the Board's view that the fund's shareholders benefit from investing in a fund that is part of a large family of funds offering a variety of investment disciplines and services.
Annual Report
Competitiveness of Management Fee and Total Fund Expenses. The Board considered the fund's management fee and total expenses compared to "mapped groups" of competitive funds and classes. Fidelity creates "mapped groups" by combining similar Lipper investment objective categories that have comparable management fee characteristics. Combining Lipper investment objective categories aids the Board's management fee and total expense comparisons by broadening the competitive group used for comparison and by reducing the number of universes to which various Fidelity funds are compared.
Management Fee. The Board considered two proprietary management fee comparisons for the 12-month periods shown in the chart below. The group of Lipper funds used by the Board for management fee comparisons is referred to below as the "Total Mapped Group." The Total Mapped Group comparison focuses on a fund's standing relative to the total universe of comparable funds available to investors, in terms of gross management fees before expense reimbursements or caps, and without giving effect to the fund's performance adjustment. "TMG %" represents the percentage of funds in the Total Mapped Group that had management fees that were lower than the fund's. For example, a TMG % of 10% means that 90% of the funds in the Total Mapped Group had higher management fees than the fund. The "Asset-Size Peer Group" (ASPG) comparison focuses on a fund's standing relative to non-Fidelity funds similar in size to the fund within the Total Mapped Group. The ASPG represents at least 15% of the funds in the Total Mapped Group with comparable asset size and management fee characteristics, subject to a minimum of 50 funds (or all funds in the Total Mapped Group if fewer than 50). Additional information, such as the ASPG quartile in which the fund's management fee ranked and the impact of the fund's performance adjustment, is also included in the chart and considered by the Board.
Annual Report
Board Approval of Investment Advisory Contracts and
Management Fees - continued
Fidelity Advisor Value Leaders Fund
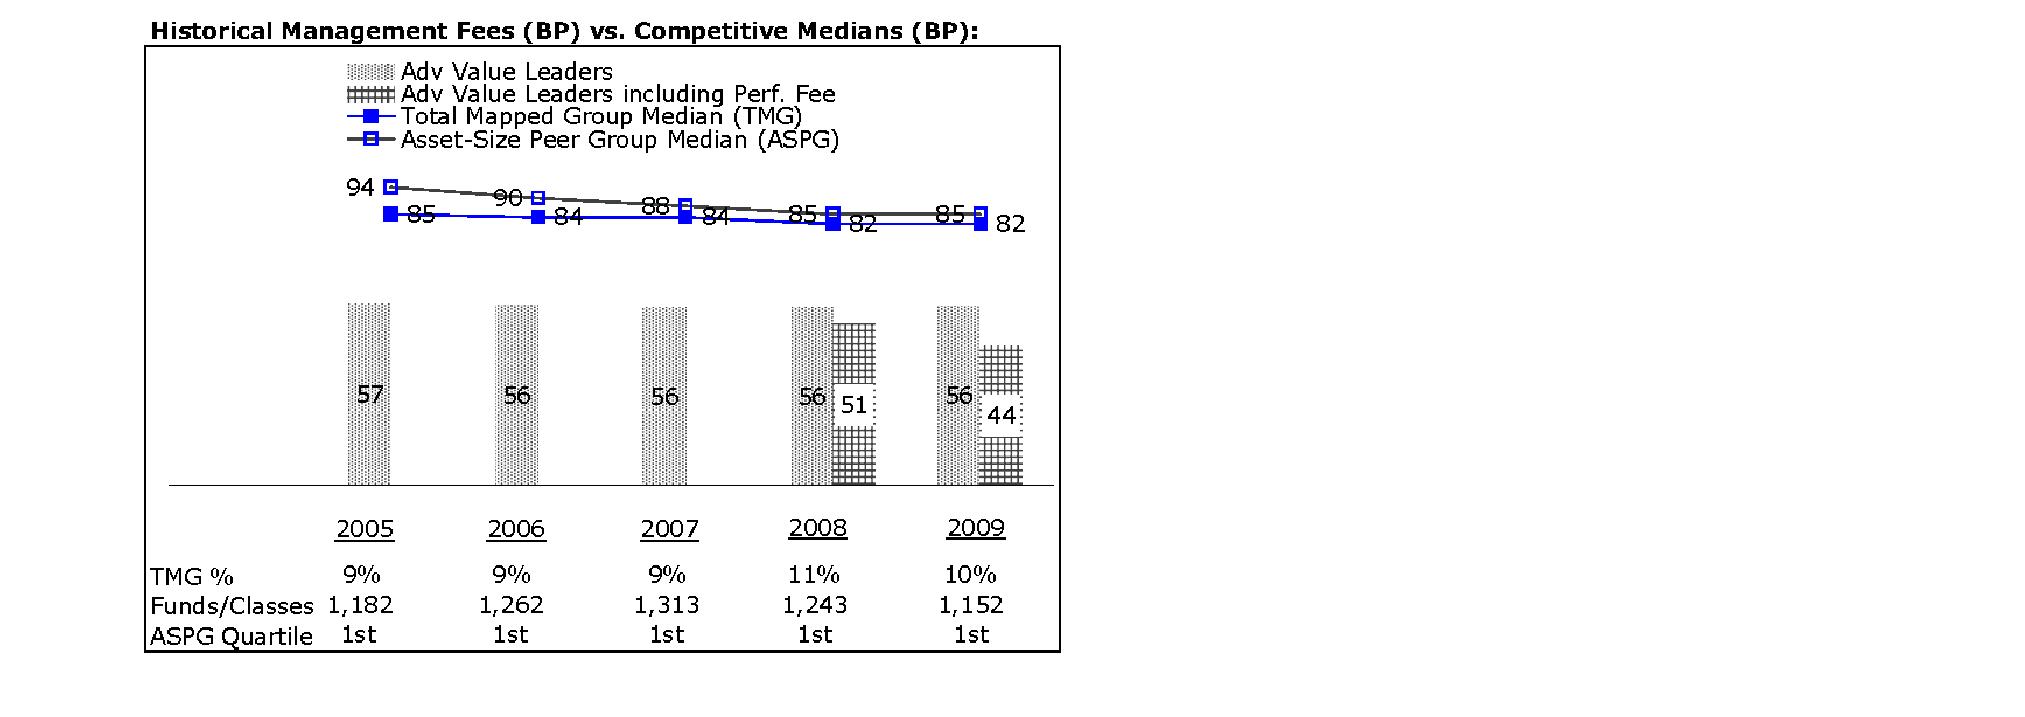
The Board noted that the fund's management fee ranked below the median of its Total Mapped Group and below the median of its ASPG for 2009. The Board also noted the effect of the fund's negative performance adjustment on the fund's management fee ranking. The Board noted that the performance adjustment for each year represents calculations for performance periods that differ from the periods shown in the performance charts above.
Based on its review, the Board concluded that the fund's management fee is fair and reasonable in light of the services that the fund receives and the other factors considered.
Total Expenses. In its review of each class's total expenses, the Board considered the fund's management fee as well as other fund or class expenses, as applicable, such as transfer agent fees, pricing and bookkeeping fees, fund-paid 12b-1 fees, and custodial, legal, and audit fees. The Board also noted the effects of any waivers and reimbursements on fees and expenses, as well as the impact of the fund's performance adjustment. As part of its review, the Board also considered current and historical total expenses of each class of the fund compared to competitive fund median expenses. Each class of the fund is compared to those funds and classes in the Total Mapped Group (used by the Board for management fee comparisons) that have a similar sales load structure.
The Board noted that the total expenses of each of Class A and Class B ranked below its competitive median for 2009, the total expenses of Class C ranked equal to its competitive median for 2009, and the total expenses of each of Class T and Institutional Class ranked above its competitive median for 2009. The Board considered that the total expenses for Class T were above the median primarily because its 12b-1 fee is higher than the typical front-end load class. The Board noted that the fund offers multiple classes, each of which has a different sales load and 12b-1 fee structure, and that the multiple structures are intended to offer a range of pricing options for the intermediary market. The Board also noted that the total expenses of the classes vary primarily by the level of their 12b-1 fees, although differences in transfer agent fees may also cause expenses to vary from class to class.
Annual Report
Fees Charged to Other Fidelity Clients. The Board also considered Fidelity fee structures and other information with respect to clients of FMR and its affiliates, such as other mutual funds advised or subadvised by FMR or its affiliates, pension plan clients, and other institutional clients. In March 2010, the Board created an ad hoc joint committee with the board of other Fidelity funds (the Committee) to review and compare Fidelity's institutional investment advisory business with its business of providing services to the Fidelity funds, including the differences in services provided, fees charged, and costs incurred, as well as competition in their respective marketplaces.
Based on its review of total expenses and fees charged to other Fidelity clients, the Board concluded that the total expenses of each class of the fund were reasonable, although in some cases above the median of the universe presented for comparison, in light of the services that the fund and its shareholders receive and the other factors considered, including the findings of the Committee.
Costs of the Services and Profitability. The Board considered the revenues earned and the expenses incurred by Fidelity in conducting the business of developing, marketing, distributing, managing, administering and servicing the fund and its shareholders. The Board also considered the level of Fidelity's profits in respect of all the Fidelity funds.
On an annual basis, FMR presents to the Board Fidelity's profitability for the fund. Fidelity calculates the profitability for each fund, as well as aggregate profitability for groups of Fidelity funds and all Fidelity funds, using a series of detailed revenue and cost allocation methodologies which originate with the audited books and records of Fidelity. The Audit Committee of the Board reviews any significant changes from the prior year's methodologies.
PricewaterhouseCoopers LLP (PwC), independent registered public accounting firm and auditor to Fidelity and certain Fidelity funds, has been engaged annually by the Board as part of the Board's assessment of Fidelity's profitability analysis. PwC's engagement includes the review and assessment of Fidelity's methodologies used in determining the revenues and expenses attributable to Fidelity's mutual fund business, and completion of agreed-upon procedures surrounding the mathematical accuracy of fund profitability and its conformity to allocation methodologies. After considering PwC's reports issued under the engagement and information provided by Fidelity, the Board believes that while other allocation methods may also be reasonable, Fidelity's profitability methodologies are reasonable in all material respects.
Annual Report
Board Approval of Investment Advisory Contracts and
Management Fees - continued
The Board has also reviewed Fidelity's non-fund businesses and fall-out benefits related to the mutual fund business as well as cases where Fidelity's affiliates may benefit from or be related to the fund's business.
The Board considered the costs of the services provided by and the profits realized by Fidelity in connection with the operation of the fund and were satisfied that the profitability was not excessive in the circumstances.
Economies of Scale. The Board considered whether there have been economies of scale in respect of the management of the Fidelity funds, whether the Fidelity funds (including the fund) have appropriately benefited from any such economies of scale, and whether there is potential for realization of any further economies of scale. The Board considered the extent to which the fund will benefit from economies of scale through increased services to the fund, through waivers or reimbursements, or through fee or expense reductions.
In February 2009, the Board and the board of other Fidelity funds created an ad hoc committee (the Economies of Scale Committee) to analyze whether FMR attains economies of scale in respect of the management and servicing of the Fidelity funds, whether the Fidelity funds have appropriately benefited from such economies of scale, and whether there is potential for realization of any further economies of scale.
The Board recognized that the fund's management contract incorporates a "group fee" structure, which provides for lower group fee rates as total fund assets under FMR's management increase, and for higher group fee rates as total fund assets under FMR's management decrease. FMR calculates the group fee rates based on a tiered asset "breakpoint" schedule that varies based on asset class. The Board considered that the group fee is designed to deliver the benefits of economies of scale to fund shareholders when total Fidelity fund assets increase, even if assets of any particular fund are unchanged or have declined, because some portion of Fidelity's costs are attributable to services provided to all Fidelity funds, and all funds benefit if those costs can be allocated among more assets. The Board concluded that, given the group fee structure, fund shareholders will benefit from lower management fees as assets under FMR's management increase at the fund complex level, regardless of whether Fidelity achieves any such economies of scale.
The Board concluded, considering the findings of the Economies of Scale Committee, that any potential economies of scale are being appropriately shared between fund shareholders and Fidelity.
Additional Information Requested by the Board. In order to develop fully the factual basis for consideration of the Fidelity funds' Advisory Contracts, the Board requested and received additional information on certain topics, including (i) fund performance trends, actions to be taken by FMR to improve certain funds' overall performance, and Fidelity's long-term strategies for certain funds; (ii) portfolio manager changes that have occurred during the past year and length of portfolio manager tenure for different categories of funds over time; (iii) Fidelity's compensation structure for portfolio managers, research analysts, and other key personnel, the rationale for the compensation structure, and how the compensation structure provides appropriate performance incentives; (iv) the amount of the investment that each portfolio manager has made in the Fidelity fund(s) that he or she manages; (v) management and other fees paid by FMR to affiliated sub-advisers on behalf of the Fidelity funds; (vi) Fidelity's fee structures and rationale for recommending different fees among different categories of funds; (vii) Fidelity's rationale for recommending which funds should have a performance adjustment component as part of their management fees; (viii) the rationale for any differences between fund fee structures and fee structures in place for other Fidelity clients; and (ix) explanations regarding the relative total expenses borne by certain funds and classes, total expense competitive trends, and actions that might be taken by FMR to reduce total expenses for certain funds and classes.
Annual Report
Based on its evaluation of all of the conclusions noted above, and after considering all factors it believed relevant, the Board ultimately concluded that the advisory fee structures are fair and reasonable, and that the fund's Advisory Contracts should be renewed.
Annual Report
Investment Adviser
Fidelity Management & Research Company
Boston, MA
Investment Sub-Advisers
FMR Co., Inc.
Fidelity Management & Research
(U.K.) Inc.
Fidelity Research & Analysis Company
Fidelity Management & Research
(Hong Kong) Limited
Fidelity Management & Research
(Japan) Inc.
General Distributor
Fidelity Distributors Corporation
Boston, MA
Transfer and Service Agents
Fidelity Investments Institutional Operations Company, Inc.
Boston, MA
Fidelity Service Company, Inc.
Boston, MA
Custodian
Brown Brothers Harriman & Company
Boston, MA
AVLF-UANN-1210
1.793576.107
(Fidelity Investment logo)(registered trademark)
Fidelity Advisor SM
Value Leaders
Fund - Institutional Class
Annual Report
October 31, 2010
(2_fidelity_logos) (Registered_Trademark)
Contents
Chairman's Message | <Click Here> | The Chairman's message to shareholders. |
Performance | <Click Here> | How the fund has done over time. |
Management's Discussion of Fund Performance | <Click Here> | The Portfolio Manager's review of fundperformance and strategy. |
Shareholder Expense Example | <Click Here> | An example of shareholder expenses. |
Investment Changes | <Click Here> | A summary of major shifts in the fund's investments over the past six months. |
Investments | <Click Here> | A complete list of the fund's investments with their market values. |
Financial Statements | <Click Here> | Statements of assets and liabilities, operations, and changes in net assets, as well as financial highlights. |
Notes | <Click Here> | Notes to the financial statements. |
Report of Independent Registered Public Accounting Firm | <Click Here> | |
Trustees and Officers | <Click Here> | |
Distributions | <Click Here> | |
Board Approval of Investment Advisory Contracts and Management Fees | <Click Here> | |
To view a fund's proxy voting guidelines and proxy voting record for the 12-month period ended June 30, visit http://www.fidelity.com/proxyvotingresults or visit the Securities and Exchange Commission's (SEC) web site at http://www.sec.gov. You may also call 1-877-208-0098 to request a free copy of the proxy voting guidelines.
Standard & Poor's, S&P and S&P 500 are registered service marks of The McGraw-Hill Companies, Inc. and have been licensed for use by Fidelity Distributors Corporation.
Other third party marks appearing herein are the property of their respective owners.
All other marks appearing herein are registered or unregistered trademarks or service marks of FMR LLC or an affiliated company.
Annual Report
This report and the financial statements contained herein are submitted for the general information of the shareholders of the fund. This report is not authorized for distribution to prospective investors in the fund unless preceded or accompanied by an effective prospectus.
A fund files its complete schedule of portfolio holdings with the SEC for the first and third quarters of each fiscal year on Form N-Q. Forms N-Q are available on the SEC's web site at http://www.sec.gov. A fund's Forms N-Q may be reviewed and copied at the SEC's Public Reference Room in Washington, DC. Information regarding the operation of the SEC's Public Reference Room may be obtained by calling 1-800-SEC-0330. For a complete list of a fund's portfolio holdings, view the most recent holdings listing, semiannual report, or annual report on Fidelity's web site at http://www.fidelity.com or http://www.advisor.fidelity.com, as applicable.
NOT FDIC INSURED • MAY LOSE VALUE • NO BANK GUARANTEE
Neither the fund nor Fidelity Distributors Corporation is a bank.
Annual Report
(photo_of_Edward_C_Johnson_3d)
Dear Shareholder:
Equities have staged a rally in the second half of 2010, shaking off concerns about the European debt crisis and the possibility of a double-dip recession in the U.S. Although the short-term surge pushed major equity indexes back into positive territory for the year, several questions remain about the longer-term outlook, including lackluster economic growth and persistently high unemployment. Financial markets are always unpredictable, of course, but there also are several time-tested investment principles that can help put the odds in your favor.
One of the basic tenets is to invest for the long term. Over time, riding out the markets' inevitable ups and downs has proven much more effective than selling into panic or chasing the hottest trend. Even missing only a few of the markets' best days can significantly diminish investor returns. Patience also affords the benefits of compounding - of earning interest on additional income or reinvested dividends and capital gains. There can be tax advantages and cost benefits to consider as well. While staying the course doesn't eliminate risk, it can considerably lessen the effect of short-term declines.
You can further manage your investing risk through diversification. And today, more than ever, geographic diversification should be taken into account. Studies indicate that asset allocation is the single most important determinant of a portfolio's long-term success. The right mix of stocks, bonds and cash - aligned to your particular risk tolerance and investment objective - is very important. Age-appropriate rebalancing is also an essential aspect of asset allocation. For younger investors, an emphasis on equities - which historically have been the best-performing asset class over time - is encouraged. As investors near their specific goal, such as retirement or sending a child to college, consideration may be given to replacing volatile assets (e.g. common stocks) with more-stable fixed investments (bonds or savings plans).
A third principle - investing regularly - can help lower the average cost of your purchases. Investing a certain amount of money each month or quarter helps ensure you won't pay for all your shares at market highs. This strategy - known as dollar cost averaging - also reduces "emotion" from investing, helping shareholders avoid selling weak performers just prior to an upswing, or chasing a hot performer just before a correction.
We invite you to contact us via the Internet, through our Investor Centers or by phone. It is our privilege to provide you the information you need to make the investments that are right for you.
Sincerely,
(The chairman's signature appears here.)
Edward C. Johnson 3d
Annual Report
Average annual total return reflects the change in the value of an investment, assuming reinvestment of the class' distributions from dividend income and capital gains (the profits earned upon the sale of securities that have grown in value, if any) and assuming a constant rate of performance each year. The $10,000 table and the fund's returns do not reflect the deduction of taxes that a shareholder would pay on fund distributions or the redemption of fund shares. During periods of reimbursement by Fidelity, a fund's total return will be greater than it would be had the reimbursement not occurred. How a fund did yesterday is no guarantee of how it will do tomorrow.
Average Annual Total Returns
Periods ended October 31, 2010 | Past 1
year | Past 5
years | Life of
fund A |
Institutional Class | 10.28% | -1.74% | 2.75% |
A From June 17, 2003.
$10,000 Over Life of Fund
Let's say hypothetically that $10,000 was invested in Fidelity AdvisorSM Value Leaders Fund - Institutional Class on June 17, 2003, when the fund started. The chart shows how the value of your investment would have changed, and also shows how the Russell 1000® Value Index performed over the same period.
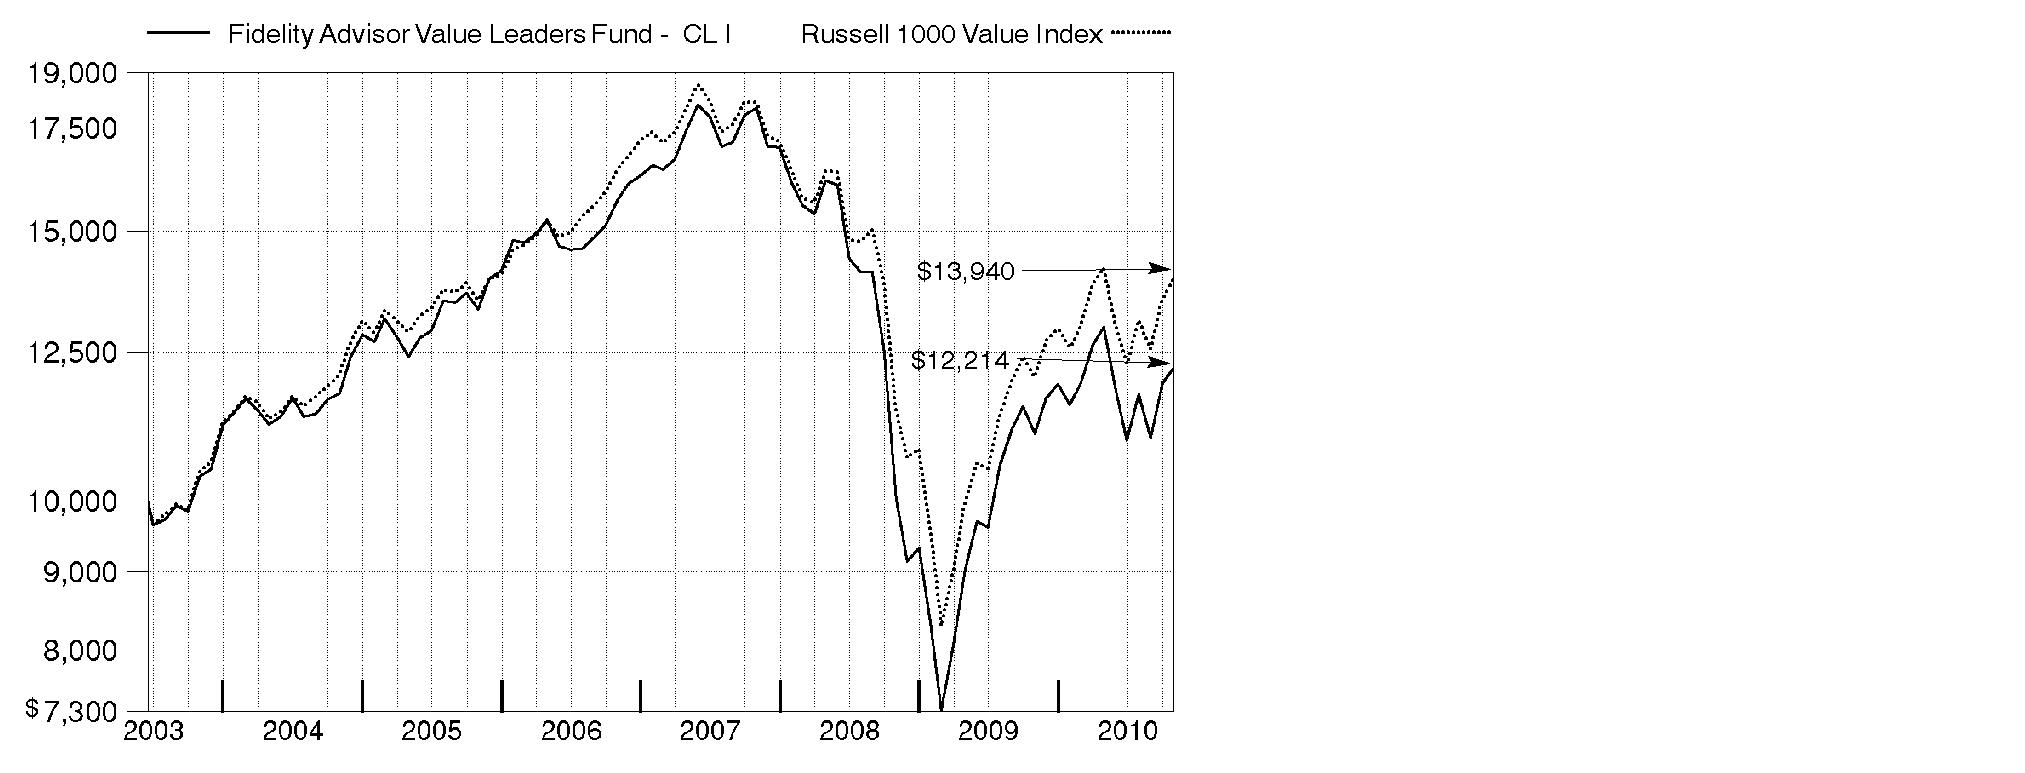
Annual Report
Market Recap: Amid bouts of volatility, major U.S. stock market indexes recorded double-digit gains for the year ending October 31, 2010, lifted by economic optimism, encouraging earnings reports and a wave of corporate mergers. Aside from a January dip, stocks trended upward for the first half of the period amid indications the Great Recession was over. However, in April, lingering high unemployment and heightened concern over European debt sent equities falling. Markets regrouped in July, but fell again in August on mixed economic data. The final two months of the period brought renewed optimism, with the large-cap S&P 500® Index posting its best September/October performance since 1998. For the full 12 months, the S&P 500® rose 16.52%, while the blue-chip-laden Dow Jones Industrial AverageSM added 17.62% and the technology-heavy Nasdaq Composite® Index rose 23.72%. Among market segments, all 10 sectors in the S&P 500 posted gains, with more than half outperforming the broad-market index. Stocks of mid- and small-sized companies surged, with the Russell Midcap® Index adding 27.71% and Russell 2000® Index climbing 26.58%. Looking abroad, debt problems in several European countries cooled gains in developed markets, and yet the MSCI® EAFE® (Europe, Australasia, Far East) Index still rose 8.49%.
Comments from Charles Hebard, Portfolio Manager of Fidelity AdvisorSM Value Leaders Fund during the period covered by this report: During the year, the fund's Institutional Class shares gained 10.28%, lagging the 15.71% gain of the Russell 1000® Value Index. Positioning in financials led the underperformance, with stakes in Bank of America, JPMorgan Chase and Morgan Stanley suffering from fears of increased government regulation. The fund's positioning in consumer discretionary also detracted, including ownership of homebuilder KB Home. Overweighting technology hardware/equipment firm Hewlett-Packard hurt when the firm's chief executive unexpectedly departed in August. Underweighting consumer staples and poor stock selection in energy also detracted. On the positive side, we had strong picks in industrials, including truck engine manufacturer Cummins and rail operator Union Pacific. Within energy, significantly underweighting integrated oil giant and major index component Exxon Mobil helped, as the stock lagged during the period. Despite financials' drag on performance, we had good results from an out-of-index position in commercial real estate broker CB Richard Ellis Group.
Note to shareholders: Michael Chren will become Portfolio Manager of the fund on November 1, 2010.
The views expressed above reflect those of the portfolio manager(s) only through the end of the period as stated on the cover of this report and do not necessarily represent the views of Fidelity or any other person in the Fidelity organization. Any such views are subject to change at any time based upon market or other conditions and Fidelity disclaims any responsibility to update such views. These views may not be relied on as investment advice and, because investment decisions for a Fidelity fund are based on numerous factors, may not be relied on as an indication of trading intent on behalf of any Fidelity fund.
Annual Report
Shareholder Expense Example
As a shareholder of the Fund, you incur two types of costs: (1) transaction costs, including sales charges (loads) on purchase payments or redemption proceeds, and (2) ongoing costs, including management fees, distribution and/or service (12b-1) fees and other Fund expenses. This Example is intended to help you understand your ongoing costs (in dollars) of investing in the Fund and to compare these costs with the ongoing costs of investing in other mutual funds.
The Example is based on an investment of $1,000 invested at the beginning of the period and held for the entire period (May 1, 2010 to October 31, 2010).
Actual Expenses
The first line of the accompanying table for each class of the Fund provides information about actual account values and actual expenses. You may use the information in this line, together with the amount you invested, to estimate the expenses that you paid over the period. Simply divide your account value by $1,000.00 (for example, an $8,600 account value divided by $1,000.00 = 8.6), then multiply the result by the number in the first line for a class of the Fund under the heading entitled "Expenses Paid During Period" to estimate the expenses you paid on your account during this period. In addition, the Fund, as a shareholder in the underlying Fidelity Central Funds, will indirectly bear its pro-rata share of the fees and expenses incurred by the underlying Fidelity Central Funds. These fees and expenses are not included in the Fund's annualized expense ratio used to calculate the expense estimate in the table below.
Hypothetical Example for Comparison Purposes
The second line of the accompanying table for each class of the Fund provides information about hypothetical account values and hypothetical expenses based on a Class' actual expense ratio and an assumed rate of return of 5% per year before expenses, which is not the Class' actual return. The hypothetical account values and expenses may not be used to estimate the actual ending account balance or expenses you paid for the period. You may use this information to compare the ongoing costs of investing in the Fund and other funds. To do so, compare this 5% hypothetical example with the 5% hypothetical examples that appear in the shareholder reports of the other funds. In addition, the Fund, as a shareholder in the underlying Fidelity Central Funds, will indirectly bear its pro-rata share of the fees and expenses incurred by the underlying Fidelity Central Funds. These fees and expenses are not included in the Fund's annualized expense ratio used to calculate the expense estimate in the table below.
Please note that the expenses shown in the table are meant to highlight your ongoing costs only and do not reflect any transaction costs. Therefore, the second line of the table is useful in comparing ongoing costs only, and will not help you determine the relative total costs of owning different funds. In addition, if these transactional costs were included, your costs would have been higher.
Annual Report
| Annualized
Expense Ratio | Beginning
Account Value
May 1, 2010 | Ending
Account Value
October 31, 2010 | Expenses Paid
During Period*
May 1, 2010
to October 31, 2010 |
Class A | 1.18% | | | |
Actual | | $ 1,000.00 | $ 939.60 | $ 5.77 |
HypotheticalA | | $ 1,000.00 | $ 1,019.26 | $ 6.01 |
Class T | 1.40% | | | |
Actual | | $ 1,000.00 | $ 938.50 | $ 6.84 |
HypotheticalA | | $ 1,000.00 | $ 1,018.15 | $ 7.12 |
Class B | 1.94% | | | |
Actual | | $ 1,000.00 | $ 936.30 | $ 9.47 |
HypotheticalA | | $ 1,000.00 | $ 1,015.43 | $ 9.86 |
Class C | 1.94% | | | |
Actual | | $ 1,000.00 | $ 935.80 | $ 9.47 |
HypotheticalA | | $ 1,000.00 | $ 1,015.43 | $ 9.86 |
Institutional Class | .94% | | | |
Actual | | $ 1,000.00 | $ 940.90 | $ 4.60 |
HypotheticalA | | $ 1,000.00 | $ 1,020.47 | $ 4.79 |
A 5% return per year before expenses
* Expenses are equal to each Class' annualized expense ratio, multiplied by the average account value over the period, multiplied by 184/365 (to reflect the one-half year period).
Annual Report
Investment Changes (Unaudited)
Top Ten Stocks as of October 31, 2010 |
| % of fund's
net assets | % of fund's net assets
6 months ago |
JPMorgan Chase & Co. | 4.7 | 4.3 |
Wells Fargo & Co. | 4.6 | 4.9 |
Pfizer, Inc. | 3.6 | 3.2 |
Chevron Corp. | 3.4 | 3.6 |
Merck & Co., Inc. | 3.0 | 2.0 |
Johnson & Johnson | 3.0 | 0.0 |
Bank of America Corp. | 2.9 | 4.4 |
Citigroup, Inc. | 2.2 | 0.0 |
Verizon Communications, Inc. | 2.0 | 2.6 |
Exxon Mobil Corp. | 1.6 | 2.3 |
| 31.0 | |
Top Five Market Sectors as of October 31, 2010 |
| % of fund's
net assets | % of fund's net assets
6 months ago |
Financials | 28.0 | 27.9 |
Health Care | 15.2 | 9.7 |
Energy | 14.9 | 19.2 |
Industrials | 12.5 | 11.3 |
Information Technology | 7.8 | 7.7 |
Asset Allocation (% of fund's net assets) |
As of October 31, 2010* | As of April 30, 2010** |
| Stocks 100.3% | | | Stocks 99.5% | |
| Short-Term
Investments and
Net Other Assets† (0.3)% | | | Short-Term
Investments and
Net Other Assets 0.5% | |
* Foreign investments | 9.7% | | ** Foreign investments | 8.9% | |

† Short-Term Investments and Net Other Assets are not included in pie chart. |
Annual Report
Investments October 31, 2010
Showing Percentage of Net Assets
Common Stocks - 100.3% |
| Shares | | Value |
CONSUMER DISCRETIONARY - 5.7% |
Auto Components - 0.5% |
Johnson Controls, Inc. | 6,100 | | $ 214,232 |
Household Durables - 2.2% |
KB Home (d) | 46,300 | | 486,613 |
PulteGroup, Inc. (a) | 30,430 | | 238,876 |
Stanley Black & Decker, Inc. | 4,272 | | 264,736 |
| | 990,225 |
Media - 1.8% |
Time Warner Cable, Inc. | 8,167 | | 472,624 |
Time Warner, Inc. | 10,600 | | 344,606 |
| | 817,230 |
Specialty Retail - 1.2% |
Best Buy Co., Inc. | 3,000 | | 128,940 |
Lowe's Companies, Inc. | 12,300 | | 262,359 |
Staples, Inc. | 6,900 | | 141,243 |
| | 532,542 |
TOTAL CONSUMER DISCRETIONARY | | 2,554,229 |
CONSUMER STAPLES - 6.0% |
Beverages - 2.2% |
Anheuser-Busch InBev SA NV | 2,968 | | 185,987 |
Grupo Modelo SAB de CV Series C | 22,100 | | 123,755 |
The Coca-Cola Co. | 10,900 | | 668,388 |
| | 978,130 |
Food & Staples Retailing - 1.7% |
CVS Caremark Corp. | 14,200 | | 427,704 |
Kroger Co. | 6,800 | | 149,600 |
Walgreen Co. | 4,900 | | 166,012 |
| | 743,316 |
Food Products - 0.7% |
Nestle SA | 6,047 | | 331,115 |
Personal Products - 0.4% |
Avon Products, Inc. | 5,700 | | 173,565 |
Common Stocks - continued |
| Shares | | Value |
CONSUMER STAPLES - continued |
Tobacco - 1.0% |
British American Tobacco PLC sponsored ADR | 2,800 | | $ 213,444 |
Philip Morris International, Inc. | 4,400 | | 257,400 |
| | 470,844 |
TOTAL CONSUMER STAPLES | | 2,696,970 |
ENERGY - 14.9% |
Energy Equipment & Services - 4.0% |
Baker Hughes, Inc. | 8,590 | | 397,975 |
Ensco International Ltd. ADR | 4,500 | | 208,530 |
Halliburton Co. | 15,085 | | 480,608 |
Noble Corp. | 5,100 | | 176,103 |
Transocean Ltd. (a) | 2,600 | | 164,736 |
Weatherford International Ltd. (a) | 21,000 | | 353,010 |
| | 1,780,962 |
Oil, Gas & Consumable Fuels - 10.9% |
Alpha Natural Resources, Inc. (a) | 4,500 | | 203,265 |
Apache Corp. | 700 | | 70,714 |
BP PLC sponsored ADR | 5,500 | | 224,565 |
Chevron Corp. | 18,400 | | 1,520,024 |
Cimarex Energy Co. | 1,900 | | 145,825 |
Exxon Mobil Corp. | 10,420 | | 692,617 |
Marathon Oil Corp. | 17,700 | | 629,589 |
Massey Energy Co. | 5,100 | | 214,557 |
Occidental Petroleum Corp. | 6,984 | | 549,152 |
Petrohawk Energy Corp. (a) | 11,700 | | 199,017 |
Royal Dutch Shell PLC Class B ADR | 3,400 | | 218,688 |
Southwestern Energy Co. (a) | 5,900 | | 199,715 |
| | 4,867,728 |
TOTAL ENERGY | | 6,648,690 |
FINANCIALS - 28.0% |
Capital Markets - 2.6% |
Franklin Resources, Inc. | 1,800 | | 206,460 |
Morgan Stanley | 26,200 | | 651,594 |
State Street Corp. | 7,300 | | 304,848 |
| | 1,162,902 |
Commercial Banks - 8.7% |
BB&T Corp. | 13,200 | | 309,012 |
Common Stocks - continued |
| Shares | | Value |
FINANCIALS - continued |
Commercial Banks - continued |
Huntington Bancshares, Inc. | 21,900 | | $ 124,173 |
PNC Financial Services Group, Inc. | 7,677 | | 413,790 |
Regions Financial Corp. | 32,392 | | 204,070 |
SunTrust Banks, Inc. | 3,600 | | 90,072 |
SVB Financial Group (a) | 3,100 | | 134,354 |
U.S. Bancorp, Delaware | 22,694 | | 548,741 |
Wells Fargo & Co. | 79,485 | | 2,072,969 |
| | 3,897,181 |
Consumer Finance - 0.4% |
Capital One Financial Corp. | 5,038 | | 187,766 |
Diversified Financial Services - 10.5% |
Bank of America Corp. | 115,120 | | 1,316,973 |
Citigroup, Inc. (a) | 234,800 | | 979,116 |
JPMorgan Chase & Co. | 56,140 | | 2,112,548 |
KKR Financial Holdings LLC | 17,800 | | 156,462 |
Moody's Corp. | 5,300 | | 143,418 |
| | 4,708,517 |
Insurance - 3.5% |
Allstate Corp. | 9,015 | | 274,867 |
Everest Re Group Ltd. | 1,000 | | 84,280 |
Genworth Financial, Inc. Class A (a) | 28,000 | | 317,520 |
Lincoln National Corp. | 6,300 | | 154,224 |
MetLife, Inc. | 6,300 | | 254,079 |
Old Republic International Corp. | 8,200 | | 108,240 |
Unum Group | 6,600 | | 147,972 |
XL Capital Ltd. Class A | 9,768 | | 206,593 |
| | 1,547,775 |
Real Estate Investment Trusts - 1.4% |
ProLogis Trust | 7,100 | | 96,915 |
Public Storage | 1,900 | | 188,518 |
SL Green Realty Corp. | 3,000 | | 197,160 |
Weyerhaeuser Co. | 9,341 | | 151,511 |
| | 634,104 |
Real Estate Management & Development - 0.6% |
CB Richard Ellis Group, Inc. Class A (a) | 15,390 | | 282,407 |
Thrifts & Mortgage Finance - 0.3% |
Radian Group, Inc. | 15,400 | | 116,886 |
TOTAL FINANCIALS | | 12,537,538 |
Common Stocks - continued |
| Shares | | Value |
HEALTH CARE - 15.2% |
Biotechnology - 2.1% |
Amgen, Inc. (a) | 9,700 | | $ 554,743 |
Biogen Idec, Inc. (a) | 4,700 | | 294,737 |
Gilead Sciences, Inc. (a) | 3,100 | | 122,977 |
| | 972,457 |
Health Care Equipment & Supplies - 1.4% |
C. R. Bard, Inc. | 2,000 | | 166,240 |
Covidien PLC | 8,775 | | 349,859 |
Stryker Corp. | 2,200 | | 108,878 |
| | 624,977 |
Health Care Providers & Services - 1.8% |
Brookdale Senior Living, Inc. (a) | 9,700 | | 182,166 |
CIGNA Corp. | 6,200 | | 218,178 |
Humana, Inc. (a) | 6,800 | | 396,372 |
| | 796,716 |
Pharmaceuticals - 9.9% |
Johnson & Johnson | 21,200 | | 1,349,804 |
Merck & Co., Inc. | 37,400 | | 1,356,872 |
Pfizer, Inc. | 91,752 | | 1,596,485 |
Teva Pharmaceutical Industries Ltd. sponsored ADR | 2,300 | | 119,370 |
| | 4,422,531 |
TOTAL HEALTH CARE | | 6,816,681 |
INDUSTRIALS - 12.5% |
Aerospace & Defense - 2.2% |
Goodrich Corp. | 2,400 | | 196,968 |
Honeywell International, Inc. | 4,440 | | 209,168 |
Precision Castparts Corp. | 1,000 | | 136,580 |
United Technologies Corp. | 5,900 | | 441,143 |
| | 983,859 |
Building Products - 1.1% |
Masco Corp. | 29,050 | | 309,673 |
Owens Corning (a) | 6,800 | | 183,872 |
| | 493,545 |
Commercial Services & Supplies - 0.7% |
Avery Dennison Corp. | 3,500 | | 127,225 |
Republic Services, Inc. | 6,030 | | 179,754 |
| | 306,979 |
Common Stocks - continued |
| Shares | | Value |
INDUSTRIALS - continued |
Construction & Engineering - 0.8% |
Fluor Corp. | 4,900 | | $ 236,131 |
Jacobs Engineering Group, Inc. (a) | 3,800 | | 146,718 |
| | 382,849 |
Electrical Equipment - 0.3% |
Regal-Beloit Corp. | 2,109 | | 121,710 |
Industrial Conglomerates - 1.9% |
General Electric Co. | 36,100 | | 578,322 |
Textron, Inc. | 13,760 | | 286,483 |
| | 864,805 |
Machinery - 2.8% |
Caterpillar, Inc. | 2,900 | | 227,940 |
Cummins, Inc. | 1,219 | | 107,394 |
Dover Corp. | 1,700 | | 90,270 |
Ingersoll-Rand Co. Ltd. | 17,300 | | 680,063 |
Navistar International Corp. (a) | 2,780 | | 133,940 |
| | 1,239,607 |
Road & Rail - 2.5% |
CSX Corp. | 7,400 | | 454,730 |
Union Pacific Corp. | 7,576 | | 664,264 |
| | 1,118,994 |
Trading Companies & Distributors - 0.2% |
WESCO International, Inc. (a) | 2,200 | | 94,204 |
TOTAL INDUSTRIALS | | 5,606,552 |
INFORMATION TECHNOLOGY - 7.8% |
Communications Equipment - 1.2% |
Cisco Systems, Inc. (a) | 16,300 | | 372,129 |
Juniper Networks, Inc. (a) | 4,600 | | 148,994 |
| | 521,123 |
Computers & Peripherals - 1.1% |
Hewlett-Packard Co. | 11,850 | | 498,411 |
Electronic Equipment & Components - 2.1% |
Agilent Technologies, Inc. (a) | 4,700 | | 163,560 |
Avnet, Inc. (a) | 11,000 | | 327,580 |
Flextronics International Ltd. (a) | 20,700 | | 148,212 |
Tyco Electronics Ltd. | 8,475 | | 268,488 |
| | 907,840 |
Common Stocks - continued |
| Shares | | Value |
INFORMATION TECHNOLOGY - continued |
Internet Software & Services - 0.8% |
eBay, Inc. (a) | 12,000 | | $ 357,720 |
IT Services - 0.3% |
International Business Machines Corp. | 1,000 | | 143,600 |
Semiconductors & Semiconductor Equipment - 2.3% |
Applied Materials, Inc. | 12,400 | | 153,264 |
KLA-Tencor Corp. | 11,500 | | 410,780 |
Lam Research Corp. (a) | 10,300 | | 471,637 |
| | 1,035,681 |
TOTAL INFORMATION TECHNOLOGY | | 3,464,375 |
MATERIALS - 2.6% |
Chemicals - 1.4% |
Celanese Corp. Class A | 3,900 | | 139,035 |
Dow Chemical Co. | 15,900 | | 490,197 |
| | 629,232 |
Construction Materials - 0.4% |
HeidelbergCement AG | 3,301 | | 172,635 |
Containers & Packaging - 0.3% |
Owens-Illinois, Inc. (a) | 5,334 | | 149,512 |
Metals & Mining - 0.5% |
Alcoa, Inc. | 7,800 | | 102,414 |
Newcrest Mining Ltd. | 2,464 | | 96,458 |
| | 198,872 |
TOTAL MATERIALS | | 1,150,251 |
TELECOMMUNICATION SERVICES - 3.0% |
Diversified Telecommunication Services - 2.3% |
Qwest Communications International, Inc. | 18,400 | | 121,440 |
Verizon Communications, Inc. | 28,165 | | 914,518 |
| | 1,035,958 |
Wireless Telecommunication Services - 0.7% |
Sprint Nextel Corp. (a) | 74,655 | | 307,579 |
TOTAL TELECOMMUNICATION SERVICES | | 1,343,537 |
Common Stocks - continued |
| Shares | | Value |
UTILITIES - 4.6% |
Electric Utilities - 3.6% |
American Electric Power Co., Inc. | 8,000 | | $ 299,520 |
Edison International | 3,800 | | 140,220 |
Entergy Corp. | 3,100 | | 231,043 |
FirstEnergy Corp. | 6,900 | | 250,608 |
NextEra Energy, Inc. | 7,027 | | 386,766 |
PPL Corp. | 10,700 | | 287,830 |
| | 1,595,987 |
Independent Power Producers & Energy Traders - 0.2% |
AES Corp. (a) | 9,600 | | 114,624 |
Multi-Utilities - 0.8% |
CMS Energy Corp. | 13,000 | | 238,940 |
PG&E Corp. | 2,400 | | 114,768 |
| | 353,708 |
TOTAL UTILITIES | | 2,064,319 |
TOTAL COMMON STOCKS (Cost $47,641,541) | 44,883,142 |
Money Market Funds - 1.2% |
| | | |
Fidelity Cash Central Fund, 0.23% (b) | 207,319 | | 207,319 |
Fidelity Securities Lending Cash Central Fund, 0.24% (b)(c) | 350,900 | | 350,900 |
TOTAL MONEY MARKET FUNDS (Cost $558,219) | 558,219 |
TOTAL INVESTMENT PORTFOLIO - 101.5% (Cost $48,199,760) | | 45,441,361 |
NET OTHER ASSETS (LIABILITIES) - (1.5)% | | (690,036) |
NET ASSETS - 100% | $ 44,751,325 |
Legend |
(a) Non-income producing |
(b) Affiliated fund that is available only to investment companies and other accounts managed by Fidelity Investments. The rate quoted is the annualized seven-day yield of the fund at period end. A complete unaudited listing of the fund's holdings as of its most recent quarter end is available upon request. In addition, each Fidelity Central Fund's financial statements, which are not covered by the Fund's report of Independent Registered Public Accounting Firm, are available on the SEC's website or upon request. |
(c) Investment made with cash collateral received from securities on loan. |
(d) Security or a portion of the security is on loan at period end. |
Affiliated Central Funds |
Information regarding fiscal year to date income earned by the Fund from investments in Fidelity Central Funds is as follows: |
Fund | Income earned |
Fidelity Cash Central Fund | $ 475 |
Fidelity Securities Lending Cash Central Fund | 830 |
Total | $ 1,305 |
Other Information |
All investments are categorized as Level 1 under the Fair Value Hierarchy. The inputs or methodology used for valuing securities may not be an indication of the risk associated with investing in those securities. For more information on valuation inputs, please refer to the Security Valuation section in the accompanying Notes to Financial Statements. |
Income Tax Information |
At October 31, 2010, the Fund had a capital loss carryforward of approximately $34,021,859 of which $19,202,191 and $14,819,668 will expire on October 31, 2016 and 2017, respectively. Capital loss carryforwards are only available to offset future capital gains of the Fund to the extent provided by regulations and may be limited. |
See accompanying notes which are an integral part of the financial statements.
Annual Report
Statement of Assets and Liabilities
| October 31, 2010 |
| | |
Assets | | |
Investment in securities, at value (including securities loaned of $335,269) - See accompanying schedule: Unaffiliated issuers (cost $47,641,541) | $ 44,883,142 | |
Fidelity Central Funds (cost $558,219) | 558,219 | |
Total Investments (cost $48,199,760) | | $ 45,441,361 |
Receivable for investments sold | | 23,462 |
Receivable for fund shares sold | | 18,958 |
Dividends receivable | | 38,503 |
Distributions receivable from Fidelity Central Funds | | 90 |
Other receivables | | 235 |
Total assets | | 45,522,609 |
| | |
Liabilities | | |
Payable for fund shares redeemed | 309,598 | |
Accrued management fee | 11,470 | |
Distribution and service plan fees payable | 16,548 | |
Other affiliated payables | 14,190 | |
Other payables and accrued expenses | 68,578 | |
Collateral on securities loaned, at value | 350,900 | |
Total liabilities | | 771,284 |
| | |
Net Assets | | $ 44,751,325 |
Net Assets consist of: | | |
Paid in capital | | $ 82,892,458 |
Undistributed net investment income | | 270,130 |
Accumulated undistributed net realized gain (loss) on investments and foreign currency transactions | | (35,622,073) |
Net unrealized appreciation (depreciation) on investments and assets and liabilities in foreign currencies | | (2,789,190) |
Net Assets | | $ 44,751,325 |
See accompanying notes which are an integral part of the financial statements.
Annual Report
Statement of Assets and Liabilities - continued
| October 31, 2010 |
| | |
Calculation of Maximum Offering Price
Class A:
Net Asset Value and redemption price per share
($25,431,427 ÷ 2,512,723 shares) | | $ 10.12 |
| | |
Maximum offering price per share (100/94.25 of $10.12) | | $ 10.74 |
Class T:
Net Asset Value and redemption price per share ($12,734,933 ÷ 1,262,881 shares) | | $ 10.08 |
| | |
Maximum offering price per share (100/96.50 of $10.08) | | $ 10.45 |
Class B:
Net Asset Value and offering price per share ($1,604,902 ÷ 160,584 shares)A | | $ 9.99 |
| | |
Class C:
Net Asset Value and offering price per share ($4,139,165 ÷ 417,119 shares)A | | $ 9.92 |
| | |
Institutional Class:
Net Asset Value, offering price and redemption price per share ($840,898 ÷ 82,554 shares) | | $ 10.19 |
A Redemption price per share is equal to net asset value less any applicable contingent deferred sales charge.
See accompanying notes which are an integral part of the financial statements.
Annual Report
Financial Statements - continued
Statement of Operations
| Year ended October 31, 2010 |
| | |
Investment Income | | |
Dividends | | $ 991,809 |
Special dividends | | 103,207 |
Interest | | 4 |
Income from Fidelity Central Funds | | 1,305 |
Total income | | 1,096,325 |
| | |
Expenses | | |
Management fee
Basic fee | $ 312,514 | |
Performance adjustment | (88,542) | |
Transfer agent fees | 169,814 | |
Distribution and service plan fees | 230,382 | |
Accounting and security lending fees | 21,853 | |
Custodian fees and expenses | 14,087 | |
Independent trustees' compensation | 323 | |
Registration fees | 57,633 | |
Audit | 47,888 | |
Legal | 297 | |
Miscellaneous | 768 | |
Total expenses before reductions | 767,017 | |
Expense reductions | (2,243) | 764,774 |
Net investment income (loss) | | 331,551 |
Realized and Unrealized Gain (Loss) Net realized gain (loss) on: | | |
Investment securities: | | |
Unaffiliated issuers | 3,335,570 | |
Foreign currency transactions | (984) | |
Total net realized gain (loss) | | 3,334,586 |
Change in net unrealized appreciation (depreciation) on: Investment securities | 1,707,544 | |
Assets and liabilities in foreign currencies | 69 | |
Total change in net unrealized appreciation (depreciation) | | 1,707,613 |
Net gain (loss) | | 5,042,199 |
Net increase (decrease) in net assets resulting from operations | | $ 5,373,750 |
See accompanying notes which are an integral part of the financial statements.
Annual Report
Statement of Changes in Net Assets
| Year ended
October 31,
2010 | Year ended
October 31,
2009 |
Increase (Decrease) in Net Assets | | |
Operations | | |
Net investment income (loss) | $ 331,551 | $ 533,586 |
Net realized gain (loss) | 3,334,586 | (14,320,559) |
Change in net unrealized appreciation (depreciation) | 1,707,613 | 18,267,263 |
Net increase (decrease) in net assets resulting
from operations | 5,373,750 | 4,480,290 |
Distributions to shareholders from net investment income | (478,174) | (1,108,886) |
Distributions to shareholders from net realized gain | (30,375) | - |
Total distributions | (508,549) | (1,108,886) |
Share transactions - net increase (decrease) | (17,770,134) | (13,293,951) |
Total increase (decrease) in net assets | (12,904,933) | (9,922,547) |
| | |
Net Assets | | |
Beginning of period | 57,656,258 | 67,578,805 |
End of period (including undistributed net investment income of $270,130 and undistributed net investment income of $406,445, respectively) | $ 44,751,325 | $ 57,656,258 |
See accompanying notes which are an integral part of the financial statements.
Annual Report
Financial Highlights - Class A
Years ended October 31, | 2010 | 2009 | 2008 | 2007 | 2006 |
Selected Per-Share Data | | | | | |
Net asset value, beginning of period | $ 9.30 | $ 8.63 | $ 16.40 | $ 15.08 | $ 13.22 |
Income from Investment Operations | | | | | |
Net investment income (loss) C | .07H | .09 | .16 | .13 | .08 |
Net realized and unrealized gain (loss) | .85 | .75 | (7.09) | 1.99 | 2.15 |
Total from investment operations | .92 | .84 | (6.93) | 2.12 | 2.23 |
Distributions from net investment income | (.09) | (.17) | (.12) | (.09) | (.04) |
Distributions from net realized gain | (.01) | - | (.72) | (.71) | (.33) |
Total distributions | (.10) | (.17) | (.84) G | (.80) | (.37) |
Net asset value, end of period | $ 10.12 | $ 9.30 | $ 8.63 | $ 16.40 | $ 15.08 |
Total Return A, B | 9.91% | 10.13% | (44.43)% | 14.64% | 17.20% |
Ratios to Average Net Assets D, F | | | | | |
Expenses before reductions | 1.22% | 1.25% | 1.26% | 1.28% | 1.41% |
Expenses net of fee waivers,
if any | 1.22% | 1.25% | 1.25% | 1.25% | 1.25% |
Expenses net of all reductions | 1.21% | 1.25% | 1.25% | 1.24% | 1.24% |
Net investment income (loss) | .75%H | 1.10% | 1.21% | .85% | .54% |
Supplemental Data | | | | | |
Net assets, end of period
(000 omitted) | $ 25,431 | $ 28,585 | $ 34,864 | $ 67,434 | $ 15,398 |
Portfolio turnover rate E | 51% | 56% | 74% | 76% | 91% |
A Total returns would have been lower had certain expenses not been reduced during the periods shown.
B Total returns do not include the effect of the sales charges.
C Calculated based on average shares outstanding during the period.
D Fees and expenses of the underlying Fidelity Central Funds are not included in the Fund's expense ratio. The Fund indirectly bears its proportionate share of the expenses of any underlying Fidelity Central Funds.
E Amount does not include the portfolio activity of any underlying Fidelity Central Funds.
F Expense ratios reflect operating expenses of the class. Expenses before reductions do not reflect amounts reimbursed by the investment adviser or reductions from brokerage service arrangements or reductions from other expense offset arrangements and do not represent the amount paid by the class during periods when reimbursements or reductions occur. Expenses net of fee waivers reflect expenses after reimbursement by the investment adviser but prior to reductions from brokerage service arrangements or other expense offset arrangements. Expenses net of all reductions represent the net expenses paid by the class.
G Total distributions of $.839 per share is comprised of distributions from net investment income of $.117 and distributions from net realized gain of $.722 per share.
H Investment income per share reflects a special dividend which amounted to $.02 per share. Excluding the special dividend, the ratio of net investment income (loss) to average net assets would have been .57%.
See accompanying notes which are an integral part of the financial statements.
Annual Report
Financial Highlights - Class T
Years ended October 31, | 2010 | 2009 | 2008 | 2007 | 2006 |
Selected Per-Share Data | | | | | |
Net asset value, beginning of period | $ 9.27 | $ 8.58 | $ 16.30 | $ 14.99 | $ 13.14 |
Income from Investment Operations | | | | | |
Net investment income (loss) C | .05H | .07 | .13 | .09 | .04 |
Net realized and unrealized gain (loss) | .84 | .75 | (7.06) | 1.97 | 2.15 |
Total from investment operations | .89 | .82 | (6.93) | 2.06 | 2.19 |
Distributions from net investment income | (.07) | (.13) | (.07) | (.04) | (.01) |
Distributions from net realized gain | (.01) | - | (.72) | (.71) | (.33) |
Total distributions | (.08) | (.13) | (.79) G | (.75) | (.34) |
Net asset value, end of period | $ 10.08 | $ 9.27 | $ 8.58 | $ 16.30 | $ 14.99 |
Total Return A, B | 9.62% | 9.90% | (44.57)% | 14.31% | 16.93% |
Ratios to Average Net Assets D, F | | | | | |
Expenses before reductions | 1.45% | 1.50% | 1.49% | 1.53% | 1.65% |
Expenses net of fee waivers,
if any | 1.45% | 1.50% | 1.49% | 1.50% | 1.50% |
Expenses net of all reductions | 1.45% | 1.49% | 1.49% | 1.49% | 1.49% |
Net investment income (loss) | .52%H | .85% | .97% | .60% | .29% |
Supplemental Data | | | | | |
Net assets, end of period
(000 omitted) | $ 12,735 | $ 20,652 | $ 22,720 | $ 50,998 | $ 30,607 |
Portfolio turnover rate E | 51% | 56% | 74% | 76% | 91% |
A Total returns would have been lower had certain expenses not been reduced during the periods shown.
B Total returns do not include the effect of the sales charges.
C Calculated based on average shares outstanding during the period.
D Fees and expenses of the underlying Fidelity Central Funds are not included in the Fund's expense ratio. The Fund indirectly bears its proportionate share of the expenses of any underlying Fidelity Central Funds.
E Amount does not include the portfolio activity of any underlying Fidelity Central Funds.
F Expense ratios reflect operating expenses of the class. Expenses before reductions do not reflect amounts reimbursed or waived by the investment adviser or reductions from brokerage service arrangements or reductions from other expense offset arrangements and do not represent the amount paid by the class during periods when reimbursements, waivers or reductions occur. Expenses net of fee waivers reflect expenses after reimbursement and waivers by the investment adviser but prior to reductions from brokerage service arrangements or other expense offset arrangements. Expenses net of all reductions represent the net expenses paid by the class.
G Total distributions of $.790 per share is comprised of distributions from net investment income of $.068 and distributions from net realized gain of $.722 per share.
H Investment income per share reflects a special dividend which amounted to $.02 per share. Excluding the special dividend, the ratio of net investment income (loss) to average net assets would have been .33%.
See accompanying notes which are an integral part of the financial statements.
Annual Report
Financial Highlights - Class B
Years ended October 31, | 2010 | 2009 | 2008 | 2007 | 2006 |
Selected Per-Share Data | | | | | |
Net asset value, beginning of period | $ 9.18 | $ 8.47 | $ 16.07 | $ 14.81 | $ 12.99 |
Income from Investment Operations | | | | | |
Net investment income (loss) C | - G, I | .03 | .06 | .01 | (.03) |
Net realized and unrealized gain (loss) | .84 | .74 | (6.96) | 1.95 | 2.13 |
Total from investment operations | .84 | .77 | (6.90) | 1.96 | 2.10 |
Distributions from net investment income | (.02) | (.06) | - | - | - |
Distributions from net realized gain | (.01) | - | (.70) | (.70) | (.28) |
Total distributions | (.03) | (.06) | (.70) H | (.70) | (.28) |
Net asset value, end of period | $ 9.99 | $ 9.18 | $ 8.47 | $ 16.07 | $ 14.81 |
Total Return A, B | 9.11% | 9.19% | (44.80)% | 13.74% | 16.38% |
Ratios to Average Net Assets D, F | | | | | |
Expenses before reductions | 1.97% | 2.00% | 2.03% | 2.10% | 2.23% |
Expenses net of fee waivers,
if any | 1.97% | 2.00% | 2.00% | 2.00% | 2.00% |
Expenses net of all reductions | 1.97% | 2.00% | 2.00% | 1.99% | 1.99% |
Net investment income (loss) | (.01)%I | .35% | .45% | .10% | (.21)% |
Supplemental Data | | | | | |
Net assets, end of period
(000 omitted) | $ 1,605 | $ 1,989 | $ 2,615 | $ 6,734 | $ 5,734 |
Portfolio turnover rate E | 51% | 56% | 74% | 76% | 91% |
A Total returns would have been lower had certain expenses not been reduced during the periods shown.
B Total returns do not include the effect of the contingent deferred sales charge.
C Calculated based on average shares outstanding during the period.
D Fees and expenses of the underlying Fidelity Central Funds are not included in the Fund's expense ratio. The Fund indirectly bears its proportionate share of the expenses of any underlying Fidelity Central Funds.
E Amount does not include the portfolio activity of any underlying Fidelity Central Funds.
F Expense ratios reflect operating expenses of the class. Expenses before reductions do not reflect amounts reimbursed by the investment adviser or reductions from brokerage service arrangements or reductions from other expense offset arrangements and do not represent the amount paid by the class during periods when reimbursements or reductions occur. Expenses net of fee waivers reflect expenses after reimbursement by the investment adviser but prior to reductions from brokerage service arrangements or other expense offset arrangements. Expenses net of all reductions represent the net expenses paid by the class.
G Amount represents less than $.01 per share.
H Total distributions of $.698 per share is comprised of distributions from net investment income of $.000 and distributions from net realized gain of $.698 per share.
I Investment income per share reflects a special dividend which amounted to $.02 per share. Excluding the special dividend, the ratio of net investment income (loss) to average net assets would have been (.19)%.
See accompanying notes which are an integral part of the financial statements.
Annual Report
Financial Highlights - Class C
Years ended October 31, | 2010 | 2009 | 2008 | 2007 | 2006 |
Selected Per-Share Data | | | | | |
Net asset value, beginning of period | $ 9.11 | $ 8.44 | $ 16.04 | $ 14.80 | $ 12.99 |
Income from Investment Operations | | | | | |
Net investment income (loss) C | -H, K | .03 | .06 | .02 | (.03) |
Net realized and unrealized gain (loss) | .83 | .73 | (6.95) | 1.93 | 2.13 |
Total from investment operations | .83 | .76 | (6.89) | 1.95 | 2.10 |
Distributions from net investment income | (.02) | (.09) | - | - | - |
Distributions from net realized gain | (.01) | - | (.71) | (.71) | (.29) |
Total distributions | (.02) J | (.09) | (.71) I | (.71) | (.29) |
Net asset value, end of period | $ 9.92 | $ 9.11 | $ 8.44 | $ 16.04 | $ 14.80 |
Total Return A, B | 9.12% | 9.28% | (44.84)% | 13.69% | 16.38% |
Ratios to Average Net Assets D, G | | | | | |
Expenses before reductions | 1.97% | 2.01% | 2.03% | 2.09% | 2.22% |
Expenses net of fee waivers,
if any | 1.97% | 2.00% | 2.00% | 2.00% | 2.00% |
Expenses net of all reductions | 1.97% | 2.00% | 2.00% | 1.99% | 1.99% |
Net investment income (loss) | -% F, K | .35% | .45% | .10% | (.21)% |
Supplemental Data | | | | | |
Net assets, end of period
(000 omitted) | $ 4,139 | $ 4,088 | $ 5,358 | $ 9,718 | $ 7,004 |
Portfolio turnover rate E | 51% | 56% | 74% | 76% | 91% |
A Total returns would have been lower had certain expenses not been reduced during the periods shown.
B Total returns do not include the effect of the contingent deferred sales charge.
C Calculated based on average shares outstanding during the period.
D Fees and expenses of the underlying Fidelity Central Funds are not included in the Fund's expense ratio. The Fund indirectly bears its proportionate share of the expenses of any underlying Fidelity Central Funds.
E Amount does not include the portfolio activity of any underlying Fidelity Central Funds.
F Amount represents less than .01%.
G Expense ratios reflect operating expenses of the class. Expenses before reductions do not reflect amounts reimbursed by the investment adviser or reductions from brokerage service arrangements or reductions from other expense offset arrangements and do not represent the amount paid by the class during periods when reimbursements or reductions occur. Expenses net of fee waivers reflect expenses after reimbursement by the investment adviser but prior to reductions from brokerage service arrangements or other expense offset arrangements. Expenses net of all reductions represent the net expenses paid by the class.
H Amount represents less than $.01 per share.
I Total distributions of $.712 per share is comprised of distributions from net investment income of $.000 and distributions from net realized gain of $.712 per share.
J Total distributions of $.02 per share is comprised of distributions from net investment income of $.015 and distributions from net realized gain of $.005 per share.
K Investment income per share reflects a special dividend which amounted to $.02 per share. Excluding the special dividend, the ratio of net investment income (loss) to average net assets would have been (.19)%.
See accompanying notes which are an integral part of the financial statements.
Annual Report
Financial Highlights - Institutional Class
Years ended October 31, | 2010 | 2009 | 2008 | 2007 | 2006 |
Selected Per-Share Data | | | | | |
Net asset value, beginning of period | $ 9.35 | $ 8.70 | $ 16.51 | $ 15.17 | $ 13.28 |
Income from Investment Operations | | | | | |
Net investment income (loss) B | .10G | .11 | .20 | .17 | .11 |
Net realized and unrealized gain (loss) | .86 | .74 | (7.13) | 1.99 | 2.18 |
Total from investment operations | .96 | .85 | (6.93) | 2.16 | 2.29 |
Distributions from net investment income | (.11) | (.20) | (.15) | (.11) | (.07) |
Distributions from net realized gain | (.01) | - | (.72) | (.71) | (.33) |
Total distributions | (.12) | (.20) | (.88) F | (.82) | (.40) |
Net asset value, end of period | $ 10.19 | $ 9.35 | $ 8.70 | $ 16.51 | $ 15.17 |
Total Return A | 10.28% | 10.26% | (44.24)% | 14.89% | 17.58% |
Ratios to Average Net Assets C, E | | | | | |
Expenses before reductions | .98% | 1.00% | .98% | 1.00% | 1.04% |
Expenses net of fee waivers,
if any | .98% | 1.00% | .98% | 1.00% | 1.00% |
Expenses net of all reductions | .97% | 1.00% | .97% | .99% | .99% |
Net investment income (loss) | .99%G | 1.35% | 1.48% | 1.10% | .79% |
Supplemental Data | | | | | |
Net assets, end of period
(000 omitted) | $ 841 | $ 2,341 | $ 2,021 | $ 6,833 | $ 2,201 |
Portfolio turnover rate D | 51% | 56% | 74% | 76% | 91% |
A Total returns would have been lower had certain expenses not been reduced during the periods shown.
B Calculated based on average shares outstanding during the period.
C Fees and expenses of the underlying Fidelity Central Funds are not included in the Fund's expense ratio. The Fund indirectly bears its proportionate share of the expenses of any underlying Fidelity Central Funds.
D Amount does not include the portfolio activity of any underlying Fidelity Central Funds.
E Expense ratios reflect operating expenses of the class. Expenses before reductions do not reflect amounts reimbursed or waived by the investment adviser or reductions from brokerage service arrangements or reductions from other expense offset arrangements and do not represent the amount paid by the class during periods when reimbursements, waivers or reductions occur. Expenses net of fee waivers reflect expenses after reimbursement and waivers by the investment adviser but prior to reductions from brokerage service arrangements or other expense offset arrangements. Expenses net of all reductions represent the net expenses paid by the class.
F Total distributions of $.876 per share is comprised of distributions from net investment income of $.154 and distributions from net realized gain of $.722 per share.
G Investment income per share reflects a special dividend which amounted to $.02 per share. Excluding the special dividend, the ratio of net investment income (loss) to average net assets would have been .81%.
See accompanying notes which are an integral part of the financial statements.
Annual Report
Notes to Financial Statements
For the period ended October 31, 2010
1. Organization.
Fidelity Advisor Value Leaders Fund (the Fund) is a fund of Fidelity Advisor Series VIII (the Trust) and is authorized to issue an unlimited number of shares. The Trust is registered under the Investment Company Act of 1940, as amended (the 1940 Act), as an open-end management investment company organized as a Massachusetts business trust. The Fund offers Class A, Class T, Class C, and Institutional Class shares, each of which has equal rights as to assets and voting privileges. Effective after the close of business on September 1, 2010, Class B shares were closed to new accounts and additional purchases by existing shareholders. Each class has exclusive voting rights with respect to matters that affect that class. Class B shares will automatically convert to Class A shares after a holding period of seven years from the initial date of purchase. Investment income, realized and unrealized capital gains and losses, the common expenses of the Fund, and certain fund-level expense reductions, if any, are allocated on a pro-rata basis to each class based on the relative net assets of each class to the total net assets of the Fund. Each class differs with respect to transfer agent and distribution and service plan fees incurred. Certain expense reductions also differ by class.
2. Investments in Fidelity Central Funds.
The Funds may invest in Fidelity Central Funds, which are open-end investment companies available only to other investment companies and accounts managed by Fidelity Management & Research Company (FMR) and its affiliates. The Funds' Schedules of Investments list each of the Fidelity Central Funds as an investment of each Fund, but does not include the underlying holdings of each Fidelity Central Fund. As an Investing Fund, the Funds indirectly bear their proportionate share of the expenses of the underlying Fidelity Central Funds.
The Money Market Central Funds seek preservation of capital and current income and are managed by Fidelity Investments Money Management, Inc. (FIMM), an affiliate of FMR.
A complete unaudited list of holdings for each Fidelity Central Fund is available upon request or at the Securities and Exchange Commission (the SEC) web site at www.sec.gov. In addition, the financial statements of the Fidelity Central Funds, which are not covered by the Funds' Report of Independent Registered Public Accounting Firm, are available on the SEC web site or upon request.
Annual Report
Notes to Financial Statements - continued
3. Significant Accounting Policies.
The financial statements have been prepared in conformity with accounting principles generally accepted in the United States of America (GAAP), which require management to make certain estimates and assumptions at the date of the financial statements. Actual results could differ from those estimates. The following summarizes the significant accounting policies of the Fund:
Security Valuation. Investments are valued as of 4:00 p.m. Eastern time on the last calendar day of the period. The Fund uses independent pricing services approved by the Board of Trustees to value its investments. When current market prices or quotations are not readily available or reliable, valuations may be determined in good faith in accordance with procedures adopted by the Board of Trustees. Factors used in determining value may include market or security specific events. The frequency with which these procedures are used cannot be predicted and they may be utilized to a significant extent. The value used for net asset value (NAV) calculation under these procedures may differ from published prices for the same securities.
The Fund categorizes the inputs to valuation techniques used to value its investments into a disclosure hierarchy consisting of three levels as shown below.
Level 1 - quoted prices in active markets for identical investments
Level 2 - other significant observable inputs (including quoted prices for similar investments, interest rates, prepayment speeds, etc.)
Level 3 - unobservable inputs (including the fund's own assumptions based on the best information available)
Changes in valuation techniques may result in transfers in or out of an assigned level within the disclosure hierarchy. Valuation techniques used to value the Fund's investments by major category are as follows.
Equity securities, including restricted securities, for which market quotations are readily available, are valued at the last reported sale price or official closing price as reported by an independent pricing service on the primary market or exchange on which they are traded and are categorized as Level 1 in the hierarchy. In the event there were no sales during the day or closing prices are not available, securities are valued at the last quoted bid price or may be valued using the last available price and are generally categorized as Level 2 in the hierarchy. For foreign equity securities, when significant market or security specific events arise, comparisons to the valuation of American Depositary Receipts (ADRs), futures contracts, Exchange-traded funds (ETFs) and certain indexes as well as quoted prices for similar securities are used and are categorized as Level 2 in the hierarchy in these circumstances. Utilizing these techniques may result in transfers between
Annual Report
3. Significant Accounting Policies - continued
Security Valuation - continued
Level 1 and Level 2. For restricted equity securities and private placements where observable inputs are limited, assumptions about market activity and risk are used and are categorized as Level 3 in the hierarchy.
Investments in open-end mutual funds, including the Fidelity Central Funds, are valued at their closing net asset value each business day and are categorized as Level 1 in the hierarchy. Short-term securities with remaining maturities of sixty days or less for which quotations are not readily available are valued at amortized cost, which approximates fair value and are categorized as Level 2 in the hierarchy.
Foreign Currency. The Fund uses foreign currency contracts to facilitate transactions in foreign-denominated securities. Gains and losses from these transactions may arise from changes in the value of the foreign currency or if the counterparties do not perform under the contracts' terms.
Foreign-denominated assets, including investment securities, and liabilities are translated into U.S. dollars at the exchange rate at period end. Purchases and sales of investment securities, income and dividends received and expenses denominated in foreign currencies are translated into U.S. dollars at the exchange rate in effect on the transaction date.
The effects of exchange rate fluctuations on investments are included with the net realized and unrealized gain (loss) on investment securities. Other foreign currency transactions resulting in realized and unrealized gain (loss) are disclosed separately.
Investment Transactions and Income. For financial reporting purposes, the Fund's investment holdings and NAV include trades executed through the end of the last business day of the period. The NAV per share for processing shareholder transactions is calculated as of the close of business of the New York Stock Exchange (NYSE) normally 4:00 p.m. Eastern time and includes trades executed through the end of the prior business day. Gains and losses on securities sold are determined on the basis of identified cost and may include proceeds received from litigation. Dividend income is recorded on the ex-dividend date, except for certain dividends from foreign securities where the ex-dividend date may have passed, which are recorded as soon as the Fund is informed of the ex-dividend date. Non-cash dividends included in dividend income, if any, are recorded at the fair market value of the securities received. Distributions received on securities that represent a return of capital or capital gain are recorded as a reduction of cost of investments and/or as a realized gain. The Fund estimates the components of distributions received that may be considered return of capital distributions or capital gain distributions. Large, non-recurring dividends recognized by the Fund are presented separately on the Statement of Operations as "Special Dividends" and the impact of these dividends is presented in the Financial
Annual Report
Notes to Financial Statements - continued
3. Significant Accounting Policies - continued
Investment Transactions and Income - continued
Highlights. Interest income and distributions from the Fidelity Central Funds are accrued as earned. Interest income includes coupon interest and amortization of premium and accretion of discount on debt securities. Investment income is recorded net of foreign taxes withheld where recovery of such taxes is uncertain.
Expenses. Most expenses of the Trust can be directly attributed to a fund. Expenses which cannot be directly attributed are apportioned amongst each fund in the Trust. Expense estimates are accrued in the period to which they relate and adjustments are made when actual amounts are known.
Income Tax Information and Distributions to Shareholders. Each year the Fund intends to qualify as a regulated investment company, including distributing substantially all of its taxable income and realized gains under Subchapter M of the Internal Revenue Code and filing its U.S. federal tax return. As a result, no provision for income taxes is required. As of October 31, 2010, the Fund did not have any unrecognized tax benefits in the accompanying financial statements. A fund's federal tax return is subject to examination by the Internal Revenue Service (IRS) for a period of three years. Foreign taxes are provided for based on the Fund's understanding of the tax rules and rates that exist in the foreign markets in which it invests.
Distributions are declared and recorded on the ex-dividend date. Income dividends and capital gain distributions are declared separately for each class. Income and capital gain distributions are determined in accordance with income tax regulations, which may differ from GAAP.
Capital accounts within the financial statements are adjusted for permanent book-tax differences. These adjustments have no impact on net assets or the results of operations. Temporary book-tax differences will reverse in a subsequent period.
Book-tax differences are primarily due to short term gain distributions from the Fidelity Central Funds, foreign currency transactions, partnerships, capital loss carryforwards and losses deferred due to wash sales.
The federal tax cost of investment securities and unrealized appreciation (depreciation) as of period end were as follows:
Gross unrealized appreciation | $ 4,402,419 |
Gross unrealized depreciation | (8,774,270) |
Net unrealized appreciation (depreciation) | $ (4,371,851) |
| |
Tax Cost | $ 49,813,212 |
Annual Report
3. Significant Accounting Policies - continued
Income Tax Information and Distributions to Shareholders - continued
The tax-based components of distributable earnings as of period end were as follows:
Undistributed ordinary income | $ 283,369 |
Capital loss carry forward | $ (34,021,859) |
Net unrealized appreciation (depreciation) | $ (4,402,642) |
The tax character of distributions paid was as follows
| October 31, 2010 | October 31, 2009 |
Ordinary Income | $ 508,549 | $ 1,108,886 |
4. Purchase and Sale of Investments.
Purchase and sale of securities, other than short-term securities, aggregated 28,018,442 and 45,530,966, respectively.
5. Fees and Other Transactions with Affiliates.
Management Fee. Fidelity Management & Research Company (FMR) and its affiliates provide the Fund with investment management related services for which the Fund pays a monthly management fee. The management fee is the sum of an individual fund fee rate that is based on an annual rate of .30% of the Fund's average net assets and a group fee rate that averaged .26% during the period. The group fee rate is based upon the average net assets of all the mutual funds advised by FMR. The group fee rate decreases as assets under management increase and increases as assets under management decrease. In addition, the management fee is subject to a performance adjustment (up to a maximum of ± .20% of the Fund's average net assets over a 36 month performance period). The upward or downward adjustment to the management fee is based on the relative investment performance of the Institutional Class of the Fund as compared to an appropriate benchmark index. For the period, the total annual management fee rate, including the performance adjustment, was .40% of the Fund's average net assets.
Annual Report
Notes to Financial Statements - continued
5. Fees and Other Transactions with Affiliates - continued
Distribution and Service Plan Fees. In accordance with Rule 12b-1 of the 1940 Act, the Fund has adopted separate Distribution and Service Plans for each class of shares. Certain classes pay Fidelity Distributors Corporation (FDC), an affiliate of FMR, separate Distribution and Service Fees, each of which is based on an annual percentage of each class' average net assets. In addition, FDC may pay financial intermediaries for selling shares of the Fund and providing shareholder support services. For the period, the Distribution and Service Fee rates, total fees and amounts retained by FDC were as follows:
| Distribution
Fee | Service
Fee | Total Fees | Retained
by FDC |
Class A | -% | .25% | $ 72,284 | $ 281 |
Class T | .25% | .25% | 97,110 | 269 |
Class B | .75% | .25% | 18,697 | 14,039 |
Class C | .75% | .25% | 42,291 | 4,481 |
| | | $ 230,382 | $ 19,070 |
Sales Load. FDC receives a front-end sales charge of up to 5.75% for selling Class A shares, and 3.50% for selling Class T shares, some of which is paid to financial intermediaries for selling shares of the Fund. FDC receives the proceeds of contingent deferred sales charges levied on Class A, Class T, Class B, and Class C redemptions. These charges depend on the holding period. The deferred sales charges range from 5% to 1% for Class B, 1% for Class C, 1.00% for certain purchases of Class A shares (1.00% to .50% prior to July 12, 2010) and .25% for certain purchases of Class T shares.
For the period, sales charge amounts retained by FDC were as follows:
| Retained by FDC |
Class A | $ 2,782 |
Class T | 900 |
Class B* | 4,458 |
Class C* | 147 |
| $ 8,287 |
* When Class B and Class C shares are initially sold, FDC pays commissions from its own resources to financial intermediaries through which the sales
are made.
Transfer Agent Fees. Fidelity Investments Institutional Operations Company, Inc. (FIIOC), an affiliate of FMR, is the transfer, dividend disbursing and shareholder servicing agent for each class of the Fund. FIIOC receives account fees and asset-based fees that vary according to the account size and type of account of the shareholders of the respective classes of the Fund. FIIOC pays for typesetting, printing and mailing of
Annual Report
5. Fees and Other Transactions with Affiliates - continued
Transfer Agent Fees - continued
shareholder reports, except proxy statements. For the period, transfer agent fees for each class were as follows:
| Amount | % of
Average
Net Assets |
Class A | $ 89,413 | .31 |
Class T | 56,600 | .29 |
Class B | 5,893 | .32 |
Class C | 13,263 | .31 |
Institutional Class | 4,645 | .32 |
| $ 169,814 | |
Accounting and Security Lending Fees. Fidelity Service Company, Inc. (FSC), an affiliate of FMR, maintains the Fund's accounting records. The accounting fee is based on the level of average net assets for the month. Under a separate contract, FSC administers the security lending program. The security lending fee is based on the number and duration of lending transactions.
Brokerage Commissions. The Fund placed a portion of its portfolio transactions with brokerage firms which are affiliates of the investment adviser. The commissions paid to these affiliated firms were $2,178 for the period.
6. Committed Line of Credit.
The Fund participates with other funds managed by FMR or an affiliate in a $3.75 billion credit facility (the "line of credit") to be utilized for temporary or emergency purposes to fund shareholder redemptions or for other short-term liquidity purposes. The Fund has agreed to pay commitment fees on its pro-rata portion of the line of credit, which amounted to $225 and is reflected in Miscellaneous expenses on the Statement of Operations. During the period, there were no borrowings on this line of credit.
7. Security Lending.
The Fund lends portfolio securities through a lending agent from time to time in order to earn additional income. The lending agent may loan securities to certain qualified borrowers, including Fidelity Capital Market (FCM), a broker-dealer affiliated with the Fund. On the settlement date of the loan, the Fund receives collateral (in the form of U.S. Treasury obligations, letters of credit and/or cash) against the loaned securities and maintains collateral in an amount not less than 100% of the market value of the loaned securities during the period of the loan. The market value of the loaned securities is
Annual Report
Notes to Financial Statements - continued
7. Security Lending - continued
determined at the close of business of the Fund and any additional required collateral is delivered to the Fund on the next business day. If the borrower defaults on its obligation to return the securities loaned because of insolvency or other reasons, a fund could experience delays and costs in recovering the securities loaned or in gaining access to the collateral. Any cash collateral received is invested in the Fidelity Securities Lending Cash Central Fund. The value of loaned securities and cash collateral at period end are disclosed on the Fund's Statement of Assets and Liabilities. Security lending income represents the income earned on investing cash collateral, less rebates paid to borrowers and lending agent fees associated with the loan, plus any premium payments received for lending certain types of securities. Security lending income is presented in Statement of Operations as a component of income from Fidelity Central Funds. Total security lending income during the period amounted to $830. During the period, there were no securities loaned to FCM.
8. Expense Reductions.
Many of the brokers with whom FMR places trades on behalf of the Fund provided services in addition to trade execution. These services included payments of certain expenses on behalf of the Fund totaling $2,243 for the period.
9. Distributions to Shareholders.
Distributions to shareholders of each class were as follows:
Years ended October 31, | 2010 | 2009 |
From net investment income | | |
Class A | $ 284,681 | $ 651,492 |
Class T | 160,619 | 331,626 |
Class B | 4,372 | 16,855 |
Class C | 6,593 | 58,115 |
Institutional Class | 21,909 | 50,798 |
Total | $ 478,174 | $ 1,108,886 |
From net realized gain | | |
Class A | $ 15,305 | $ - |
Class T | 10,853 | - |
Class B | 1,041 | - |
Class C | 2,198 | - |
Institutional Class | 978 | - |
Total | $ 30,375 | $ - |
Annual Report
10. Share Transactions.
Transactions for each class of shares were as follows:
| Shares | Dollars |
Years ended October 31, | 2010 | 2009 | 2010 | 2009 |
Class A | | | | |
Shares sold | 402,871 | 726,745 | $ 4,034,369 | $ 5,639,090 |
Reinvestment of distributions | 29,667 | 83,555 | 290,443 | 628,332 |
Shares redeemed | (994,975) | (1,774,132) | (9,899,783) | (14,305,593) |
Net increase (decrease) | (562,437) | (963,832) | $ (5,574,971) | $ (8,038,171) |
Class T | | | | |
Shares sold | 129,419 | 296,628 | $ 1,299,211 | $ 2,194,950 |
Reinvestment of distributions | 17,388 | 43,233 | 169,877 | 324,683 |
Shares redeemed | (1,112,927) | (757,445) | (11,167,229) | (5,709,688) |
Net increase (decrease) | (966,120) | (417,584) | $ (9,698,141) | $ (3,190,055) |
Class B | | | | |
Shares sold | 21,226 | 27,365 | $ 215,795 | $ 212,586 |
Reinvestment of distributions | 524 | 2,093 | 5,094 | 15,659 |
Shares redeemed | (77,825) | (121,572) | (763,138) | (906,818) |
Net increase (decrease) | (56,075) | (92,114) | $ (542,249) | $ (678,573) |
Class C | | | | |
Shares sold | 78,869 | 121,314 | $ 774,653 | $ 940,578 |
Reinvestment of distributions | 834 | 6,675 | 8,059 | 49,531 |
Shares redeemed | (111,299) | (313,856) | (1,100,227) | (2,497,490) |
Net increase (decrease) | (31,596) | (185,867) | $ (317,515) | $ (1,507,381) |
Institutional Class | | | | |
Shares sold | 25,211 | 112,130 | $ 254,312 | $ 872,885 |
Reinvestment of distributions | 2,223 | 6,216 | 21,848 | 46,931 |
Shares redeemed | (195,256) | (100,375) | (1,913,418) | (799,587) |
Net increase (decrease) | (167,822) | 17,971 | $ (1,637,258) | $ 120,229 |
11. Other.
The Fund's organizational documents provide former and current trustees and officers with a limited indemnification against liabilities arising in connection with the performance of their duties to the Fund. In the normal course of business, the Fund may also enter into contracts that provide general indemnifications. The Fund's maximum exposure under these arrangements is unknown as this would be dependent on future claims that may be made against the Fund. The risk of material loss from such claims is considered remote.
Annual Report
To the Trustees of Fidelity Advisor Series VIII and the Shareholders of Fidelity Advisor Value Leaders Fund:
In our opinion, the accompanying statement of assets and liabilities, including the schedule of investments, and the related statements of operations and of changes in net assets and the financial highlights present fairly, in all material respects, the financial position of Fidelity Advisor Value Leaders Fund (a fund of Fidelity Advisor Series VIII) at October 31, 2010, the results of its operations for the year then ended, the changes in its net assets for each of the two years in the period then ended and the financial highlights for each of the five years in the period then ended, in conformity with accounting principles generally accepted in the United States of America. These financial statements and financial highlights (hereafter referred to as "financial statements") are the responsibility of the Fidelity Advisor Value Leaders Fund's management. Our responsibility is to express an opinion on these financial statements based on our audits. We conducted our audits of these financial statements in accordance with the standards of the Public Company Accounting Oversight Board (United States). Those standards require that we plan and perform the audit to obtain reasonable assurance about whether the financial statements are free of material misstatement. An audit includes examining, on a test basis, evidence supporting the amounts and disclosures in the financial statements, assessing the accounting principles used and significant estimates made by management, and evaluating the overall financial statement presentation. We believe that our audits, which included confirmation of securities at October 31, 2010 by correspondence with the custodian and brokers, provide a reasonable basis for our opinion.
/s/ PricewaterhouseCoopers LLP
PricewaterhouseCoopers LLP
Boston, Massachusetts
December 13, 2010
Annual Report
The Trustees, Member of the Advisory Board, and executive officers of the trust and fund, as applicable, are listed below. The Board of Trustees governs the fund and is responsible for protecting the interests of shareholders. The Trustees are experienced executives who meet periodically throughout the year to oversee the fund's activities, review contractual arrangements with companies that provide services to the fund, oversee management of the risks associated with such activities and contractual arrangements, and review the fund's performance. Except for James C. Curvey, each of the Trustees oversees 221 funds advised by FMR or an affiliate. Mr. Curvey oversees 410 funds advised by FMR or an affiliate.
The Trustees hold office without limit in time except that (a) any Trustee may resign; (b) any Trustee may be removed by written instrument, signed by at least two-thirds of the number of Trustees prior to such removal; (c) any Trustee who requests to be retired or who has become incapacitated by illness or injury may be retired by written instrument signed by a majority of the other Trustees; and (d) any Trustee may be removed at any special meeting of shareholders by a two-thirds vote of the outstanding voting securities of the trust. Each Trustee who is not an interested person (as defined in the 1940 Act) (Independent Trustee), shall retire not later than the last day of the calendar year in which his or her 72nd birthday occurs. The Independent Trustees may waive this mandatory retirement age policy with respect to individual Trustees. The executive officers and Advisory Board Member hold office without limit in time, except that any officer and Advisory Board Member may resign or may be removed by a vote of a majority of the Trustees at any regular meeting or any special meeting of the Trustees. Except as indicated, each individual has held the office shown or other offices in the same company for the past five years.
Experience, Skills, Attributes, and Qualifications of the Fund's Trustees. The Governance and Nominating Committee has adopted a statement of policy that describes the experience, qualifications, attributes, and skills that are necessary and desirable for potential Independent Trustee candidates (Statement of Policy). The Board believes that each Trustee satisfied at the time he or she was initially elected or appointed a Trustee, and continues to satisfy, the standards contemplated by the Statement of Policy. The Governance and Nominating Committee also engages professional search firms to help identify potential Independent Trustee candidates who have the experience, qualifications, attributes, and skills consistent with the Statement of Policy. From time to time, additional criteria based on the composition and skills of the current Independent Trustees, as well as experience or skills that may be appropriate in light of future changes to board composition, business conditions, and regulatory or other developments, have also been considered by the professional search firms and the Governance and Nominating Committee. In addition, the Board takes into account the Trustees' commitment and participation in Board and committee meetings, as well as their leadership of standing and ad hoc committees throughout their tenure.
In determining that a particular Trustee was and continues to be qualified to serve as a Trustee, the Board has considered a variety of criteria, none of which, in isolation, was controlling. The Board believes that, collectively, the Trustees have balanced and diverse experience, qualifications, attributes, and skills, which allow the Board to operate effectively in governing the fund and protecting the interests of shareholders. Information about the specific experience, skills, attributes, and qualifications of each Trustee, which in each case led to the Board's conclusion that the Trustee should serve (or continue to serve) as a trustee of the fund, is provided below.
Annual Report
Board Structure and Oversight Function. Edward C. Johnson 3d is an interested person (as defined in the 1940 Act) and currently serves as Chairman. The Trustees have determined that an interested Chairman is appropriate and benefits shareholders because an interested Chairman has a personal and professional stake in the quality and continuity of services provided to the fund. Independent Trustees exercise their informed business judgment to appoint an individual of their choosing to serve as Chairman, regardless of whether the Trustee happens to be independent or a member of management. The Independent Trustees have determined that they can act independently and effectively without having an Independent Trustee serve as Chairman and that a key structural component for assuring that they are in a position to do so is for the Independent Trustees to constitute a substantial majority for the Board. The Independent Trustees also regularly meet in executive session. Ned C. Lautenbach serves as Chairman of the Independent Trustees and as such (i) acts as a liaison between the Independent Trustees and management with respect to matters important to the Independent Trustees and (ii) with management prepares agendas for Board meetings.
Fidelity funds are overseen by different Boards of Trustees. The fund's Board oversees Fidelity's equity and high income funds and another Board oversees Fidelity's investment-grade bond, money market, and asset allocation funds. The asset allocation funds may invest in Fidelity funds overseen by the fund's Board. The use of separate Boards, each with its own committee structure, allows the Trustees of each group of Fidelity funds to focus on the unique issues of the funds they oversee, including common research, investment, and operational issues. On occasion, the separate Boards establish joint committees to address issues of overlapping consequences for the Fidelity funds overseen by each Board.
The Trustees operate using a system of committees to facilitate the timely and efficient consideration of all matters of importance to the Trustees, the fund, and fund shareholders and to facilitate compliance with legal and regulatory requirements and oversight of the fund's activities and associated risks. The Board, acting through its committees, has charged FMR and its affiliates with (i) identifying events or circumstances the occurrence of which could have demonstrably adverse effects on the fund's business and/or reputation; (ii) implementing processes and controls to lessen the possibility that such events or circumstances occur or to mitigate the effects of such events or circumstances if they do occur; and (iii) creating and maintaining a system designed to evaluate continuously business and market conditions in order to facilitate the identification and implementation processes described in (i) and (ii) above. Because the day-to-day operations and activities of the fund are carried out by or through FMR, its affiliates and other service providers, the fund's exposure to risks is mitigated but not eliminated by the processes overseen by the Trustees. While each of the Board's committees has responsibility for overseeing different aspects of the fund's activities, oversight is exercised primarily through the Operations, Audit, and Compliance Committees. Appropriate personnel, including but not limited to the fund's Chief Compliance Officer (CCO), FMR's internal auditor, the independent accountants, the fund's Treasurer and portfolio management personnel, make periodic reports to the Board's committees, as appropriate. The responsibilities of each committee, including their oversight responsibilities, are described further under "Standing Committees of the Fund's Trustees."
Annual Report
Trustees and Officers - continued
The fund's Statement of Additional Information (SAI) includes more information about the Trustees. To request a free copy, call Fidelity at 1-877-208-0098.
Interested Trustees*:
Correspondence intended for each Trustee who is an interested person may be sent to Fidelity Investments, 82 Devonshire Street, Boston, Massachusetts 02109.
Name, Age; Principal Occupations and Other Relevant Experience+ |
Edward C. Johnson 3d (80) |
| Year of Election or Appointment: 1983 Mr. Johnson is Trustee and Chairman of the Board of Trustees of certain Trusts. Mr. Johnson serves as Chief Executive Officer, Chairman, and a Director of FMR LLC; Chairman and a Director of FMR; Chairman and a Director of Fidelity Research & Analysis Company (FRAC); Chairman and a Director of Fidelity Investments Money Management, Inc.; and Chairman and a Director of FMR Co., Inc. In addition, Mr. Johnson serves as Chairman and Director of FIL Limited. Previously, Mr. Johnson served as President of FMR LLC (2006-2007). |
James C. Curvey (75) |
| Year of Election or Appointment: 2007 Mr. Curvey also serves as Trustee (2007-present) of other investment companies advised by FMR. Mr. Curvey is a Director of Fidelity Investments Money Management, Inc. (2009-present), Director of Fidelity Research & Analysis Co. (2009-present) and Director of FMR and FMR Co., Inc. (2007-present). Mr. Curvey is also Vice Chairman (2007-present) and Director of FMR LLC. In addition, Mr. Curvey serves as an Overseer for the Boston Symphony Orchestra and a member of the Trustees of Villanova University. Previously, Mr. Curvey was the Vice Chairman (2006-2007) and Director (2000-2007) of FMR Corp. |
* Trustees have been determined to be "Interested Trustees" by virtue of, among other things, their affiliation with the trust or various entities under common control with FMR.
Annual Report
+ The information above includes each Trustee's principal occupation during the last five years and other information relating to the experience, attributes, and skills relevant to each Trustee's qualifications to serve as a Trustee, which led to the conclusion that each Trustee should serve as a Trustee for the fund.
Independent Trustees:
Correspondence intended for each Independent Trustee (that is, the Trustees other than the Interested Trustees) may be sent to Fidelity Investments, P.O. Box 55235, Boston, Massachusetts 02205-5235.
Name, Age; Principal Occupations and Other Relevant Experience+ |
Dennis J. Dirks (62) |
| Year of Election or Appointment: 2005 Prior to his retirement in May 2003, Mr. Dirks was Chief Operating Officer and a member of the Board of The Depository Trust & Clearing Corporation (DTCC). He also served as President, Chief Operating Officer, and Board member of The Depository Trust Company (DTC) and President and Board member of the National Securities Clearing Corporation (NSCC). In addition, Mr. Dirks served as Chief Executive Officer and Board member of the Government Securities Clearing Corporation, Chief Executive Officer and Board member of the Mortgage-Backed Securities Clearing Corporation, as a Trustee and a member of the Finance Committee of Manhattan College (2005-2008), and as a Trustee and a member of the Finance Committee of AHRC of Nassau County (2006-2008). Mr. Dirks is a member of the Independent Directors Council (IDC) Governing Council (2010-Present) and Board of Directors for The Brookville Center for Children's Services, Inc. (2009-present). |
Alan J. Lacy (57) |
| Year of Election or Appointment: 2008 Mr. Lacy serves as Senior Adviser (2007-present) of Oak Hill Capital Partners, L.P. (private equity). Mr. Lacy also served as Chief Executive Officer (2000-2005) and Vice Chairman (2005-2006) of Sears Holdings Corporation and Sears, Roebuck and Co. (retail). In addition, Mr. Lacy serves as a member of the Board of Directors of The Western Union Company (global money transfer, 2006-present) and Bristol-Myers Squibb Company (global pharmaceuticals, 2007-present). Mr. Lacy is Chairman (2008-present) and a member (2006-present) of the Board of Trustees of The National Parks Conservation Association. |
Ned C. Lautenbach (66) |
| Year of Election or Appointment: 2000 Mr. Lautenbach is Chairman of the Independent Trustees of the Equity and High Income Funds (2006-present). Mr. Lautenbach currently serves as the Lead Director of the Eaton Corporation Board of Directors (diversified industrial, 1997-present). Mr. Lautenbach is also a member of the Board of Directors of the Philharmonic Center for the Arts in Naples, Florida (1999-present); a member of the Board of Trustees of Fairfield University (2005-present); and a member of the Council on Foreign Relations (1994-present). Previously, Mr. Lautenbach was a Partner/Advisory Partner at Clayton, Dubilier & Rice, Inc. (private equity investment, 1998-2010), as well as a Director of Sony Corporation (2006-2007). |
Joseph Mauriello (66) |
| Year of Election or Appointment: 2008 Prior to his retirement in January 2006, Mr. Mauriello served in numerous senior management positions including Deputy Chairman and Chief Operating Officer (2004-2005), and Vice Chairman of Financial Services (2002-2004) of KPMG LLP US (professional services, 1965-2005). Mr. Mauriello currently serves as a member of the Board of Directors of XL Group plc. (global insurance and re-insurance, 2006-present) and of Arcadia Resources Inc. (health care services and products, 2007-present). Previously, Mr. Mauriello served as a Director of the Hamilton Funds of the Bank of New York (2006-2007). |
Cornelia M. Small (66) |
| Year of Election or Appointment: 2005 Ms. Small is a member of the Board of Directors of the Teagle Foundation (2009-present). Ms. Small is also a member of the Investment Committee, and Chair (2008-present) and a member of the Board of Trustees of Smith College. In addition, Ms. Small serves on the Investment Committee of the Berkshire Taconic Community Foundation (2008-present). Previously, Ms. Small served as Chairperson of the Investment Committee (2002-2008) of Smith College. In addition, Ms. Small served as Chief Investment Officer, Director of Global Equity Investments, and a member of the Board of Directors of Scudder, Stevens & Clark and Scudder Kemper Investments. |
William S. Stavropoulos (71) |
| Year of Election or Appointment: 2001 Mr. Stavropoulos is Vice Chairman of the Independent Trustees of the Equity and High Income Funds (2006-present). Mr. Stavropoulos serves as President and Founder of the Michigan Baseball Foundation, the Great Lakes Loons (2007-present). Mr. Stavropoulos is Chairman Emeritus of the Board of Directors of The Dow Chemical Company, where he previously served in numerous senior management positions, including President, CEO (1995-2000; 2002-2004), Chairman of the Executive Committee (2000-2006), and as a member of the Board of Directors (1990-2006). Currently, Mr. Stavropoulos is Chairman of Univar (global distributor of commodity and specialty chemicals, 2010-present), a Director of Teradata Corporation (data warehousing and technology solutions, 2008-present), Chemical Financial Corporation, Maersk Inc. (industrial conglomerate), Tyco International, Inc. (multinational manufacturing and services, 2007-present), and a member of the Advisory Board for Metalmark Capital (private equity investment, 2005-present). Mr. Stavropoulos is a special advisor to Clayton, Dubilier & Rice, Inc. (private equity investment). In addition, Mr. Stavropoulos is a member of the University of Notre Dame Advisory Council for the College of Science. |
David M. Thomas (61) |
| Year of Election or Appointment: 2008 Previously, Mr. Thomas served as Executive Chairman (2005-2006) and Chairman and Chief Executive Officer (2000-2005) of IMS Health, Inc. (pharmaceutical and healthcare information solutions). In addition, Mr. Thomas serves as a member of the Board of Directors of Fortune Brands, Inc. (consumer products), and Interpublic Group of Companies, Inc. (marketing communication, 2004-present). |
Michael E. Wiley (60) |
| Year of Election or Appointment: 2008 Mr. Wiley also serves as a Director of Asia Pacific Exploration Consolidated (international oil and gas exploration and production, 2008-present). Mr. Wiley serves as a Director of Tesoro Corporation (independent oil refiner and marketer, 2005-present), and a Director of Bill Barrett Corporation (exploration and production, 2005-present). In addition, Mr. Wiley also serves as a Director of Post Oak Bank (privately-held bank, 2004-present). Previously, Mr. Wiley served as a member of the Board of Trustees of the University of Tulsa (2000-2006; 2007-2010), as a Senior Energy Advisor of Katzenbach Partners, LLC (consulting, 2006-2007), as an Advisory Director of Riverstone Holdings (private investment), Chairman, President, and CEO of Baker Hughes, Inc. (oilfield services, 2000-2004), and as Director of Spinnaker Exploration Company (exploration and production, 2001-2005). |
Annual Report
Trustees and Officers - continued
+ The information above includes each Trustee's principal occupation during the last five years and other information relating to the experience, attributes, and skills relevant to each Trustee's qualifications to serve as a Trustee, which led to the conclusion that each Trustee should serve as a Trustee for the fund.
Advisory Board Member and Executive Officers:
Correspondence intended for each executive officer and Peter S. Lynch may be sent to Fidelity Investments, 82 Devonshire Street, Boston, Massachusetts 02109.
Name, Age; Principal Occupation |
Peter S. Lynch (66) |
| Year of Election or Appointment: 2003 Member of the Advisory Board of Fidelity's Equity and High Income Funds. Mr. Lynch is Vice Chairman and a Director of FMR and FMR Co., Inc. In addition, Mr. Lynch serves as a Trustee of Boston College and as the Chairman of the Inner-City Scholarship Fund. Previously, Mr. Lynch served on the Special Olympics International Board of Directors (1997-2006). |
Kenneth B. Robins (41) |
| Year of Election or Appointment: 2008 President and Treasurer of Fidelity's Equity and High Income Funds. Mr. Robins also serves as President and Treasurer (2010-present) and Assistant Treasurer (2009-present) of other Fidelity funds and is an employee of Fidelity Investments (2004-present). Previously, Mr. Robins served as Deputy Treasurer of the Fidelity funds (2005-2008) and Treasurer and Chief Financial Officer of The North Carolina Capital Management Trust: Cash and Term Portfolios (2006-2008). |
Brian B. Hogan (46) |
| Year of Election or Appointment: 2009 Vice President of certain Equity Funds and Vice President of Sector Funds. Mr. Hogan also serves as President of FMR's Equity Division (2009-present). Previously, Mr. Hogan served as Senior Vice President, Equity Research of FMR (2006-2009) and as a portfolio manager. |
Thomas C. Hense (46) |
| Year of Election or Appointment: 2008 or 2010 Vice President of Fidelity's High Income (2008), Small Cap (2008), and Value (2010) Funds. Previously, Mr. Hense served as a portfolio manager for Fidelity's Institutional Money Management Group (Pyramis) (2003-2008). |
Scott C. Goebel (42) |
| Year of Election or Appointment: 2008 Secretary and Chief Legal Officer (CLO) of the Fidelity funds. Mr. Goebel also serves as Secretary and CLO of The North Carolina Capital Management Trust: Cash and Term Portfolio (2008-present); General Counsel, Secretary, and Senior Vice President of FMR (2008-present) and FMR Co., Inc. (2008-present); Deputy General Counsel of FMR LLC; Chief Legal Officer of Fidelity Management & Research (Hong Kong) Limited (2008-present) and Assistant Secretary of Fidelity Management & Research (Japan) Inc. (2008-present), Fidelity Investments Money Management, Inc. (2008-present), Fidelity Management & Research (U.K.) Inc. (2008-present), and Fidelity Research and Analysis Company (2008-present). Previously, Mr. Goebel served as Assistant Secretary of the Funds (2007-2008) and as Vice President and Secretary of Fidelity Distributors Corporation (FDC) (2005-2007). |
William C. Coffey (41) |
| Year of Election or Appointment: 2009 Assistant Secretary of Fidelity's Equity and High Income Funds. Mr. Coffey also serves as Senior Vice President and Deputy General Counsel of FMR LLC (2010-present), and is an employee of Fidelity Investments. Previously, Mr. Coffey served as Vice President and Associate General Counsel of FMR LLC (2005-2009). |
Holly C. Laurent (56) |
| Year of Election or Appointment: 2008 Anti-Money Laundering (AML) Officer of the Fidelity funds. Ms. Laurent also serves as AML Officer of The North Carolina Capital Management Trust: Cash and Term Portfolio (2008-present) and is an employee of Fidelity Investments. Previously, Ms. Laurent was Senior Vice President and Head of Legal for Fidelity Business Services India Pvt. Ltd. (2006-2008), and Senior Vice President, Deputy General Counsel and Group Head for FMR LLC (2005-2006). |
Christine Reynolds (52) |
| Year of Election or Appointment: 2008 Chief Financial Officer of the Fidelity funds. Ms. Reynolds became President of Fidelity Pricing and Cash Management Services (FPCMS) in August 2008. Ms. Reynolds served as Chief Operating Officer of FPCMS (2007-2008). Previously, Ms. Reynolds served as President, Treasurer, and Anti-Money Laundering officer of the Fidelity funds (2004-2007). |
Kenneth A. Rathgeber (63) |
| Year of Election or Appointment: 2004 Chief Compliance Officer of Fidelity's Equity and High Income Funds. Mr. Rathgeber is Chief Compliance Officer of Fidelity Management & Research (Hong Kong) Limited (2008-present), Fidelity Management & Research (Japan) Inc. (2008-present), FMR (2005-present), FMR Co., Inc. (2005-present), Fidelity Management & Research (U.K.) Inc. (2005-present), Fidelity Research & Analysis Company (2005-present), Fidelity Investments Money Management, Inc. (2005-present), Pyramis Global Advisors, LLC (2005-present), and Strategic Advisers, Inc. (2005-present). |
Jeffrey S. Christian (49) |
| Year of Election or Appointment: 2009 Deputy Treasurer of the Fidelity funds. Mr. Christian is an employee of Fidelity Investments. Previously, Mr. Christian served as Chief Financial Officer (2008-2009) of certain Fidelity funds and Senior Vice President of Fidelity Pricing and Cash Management Services (FPCMS) (2004-2009). |
Bryan A. Mehrmann (49) |
| Year of Election or Appointment: 2005 Deputy Treasurer of the Fidelity funds. Mr. Mehrmann is an employee of Fidelity Investments. |
Adrien E. Deberghes (43) |
| Year of Election or Appointment: 2008 Deputy Treasurer of Fidelity's Equity and High Income Funds. Mr. Deberghes also serves as Assistant Treasurer of other Fidelity funds (2010-present) and is an employee of Fidelity Investments (2008-present). Previously, Mr. Deberghes served as Senior Vice President of Mutual Fund Administration at State Street Corporation (2007-2008), Senior Director of Mutual Fund Administration at Investors Bank & Trust (2005-2007), and Director of Finance for Dunkin' Brands (2000-2005). |
Stephanie J. Dorsey (41) |
| Year of Election or Appointment: 2010 Assistant Treasurer of Fidelity's Equity and High Income Funds. Ms. Dorsey also serves as Deputy Treasurer of other Fidelity funds (2008-present) and is an employee of Fidelity Investments (2008-present). Previously, Ms. Dorsey served as Treasurer (2004-2008) of the JPMorgan Mutual Funds and Vice President (2004-2008) of JPMorgan Chase Bank. |
John R. Hebble (52) |
| Year of Election or Appointment: 2009 Assistant Treasurer of Fidelity's Equity and High Income Funds. Mr. Hebble also serves as Treasurer and Chief Financial Officer of The North Carolina Capital Management Trust: Cash and Term Portfolio (2008-present), President and Treasurer of other Fidelity funds (2008-present) and is an employee of Fidelity Investments. |
Gary W. Ryan (52) |
| Year of Election or Appointment: 2005 Assistant Treasurer of the Fidelity funds. Mr. Ryan is an employee of Fidelity Investments. Previously, Mr. Ryan served as Vice President of Fund Reporting in Fidelity Pricing and Cash Management Services (FPCMS) (1999-2005). |
Jonathan Davis (42) |
| Year of Election or Appointment: 2010 Assistant Treasurer of the Fidelity funds. Mr. Davis is an employee of Fidelity Investments. Previously, Mr. Davis served as Vice President and Associate General Counsel of FMR LLC (2003-2010). |
Annual Report
The Board of Trustees of Advisor Value Leaders Fund voted to pay to shareholders of record at the opening of business on record date, the following distributions per share derived from capital gains realized from sales of portfolio securities, and dividends derived from net investment income:
| Pay Date | Record Date | Dividends | Capital Gains |
Institutional Class | 12/06/10 | 12/03/10 | $0.133 | $0.010 |
Institutional Class designates 100% of the dividend distributed during the fiscal year as qualifying for the dividends-received deduction for corporate shareholders.
Institutional Class designates 100% of the dividend distributed during the fiscal year as amounts which may be taken into account as a dividend for purposes of the maximum rate under section 1(h)(11) of the Internal Revenue Code.
The fund will notify shareholders in January 2011 of amounts for use in preparing 2010 income tax returns.
Annual Report
Board Approval of Investment Advisory Contracts and Management Fees
Fidelity Advisor Value Leaders Fund
Each year, the Board of Trustees, including the Independent Trustees (together, the Board), votes on the renewal of the management contract and sub-advisory agreements (together, the Advisory Contracts) for the fund. The Board, assisted by the advice of fund counsel and Independent Trustees' counsel, requests and considers a broad range of information relevant to the renewal of the Advisory Contracts throughout the year.
The Board meets regularly and considers at each of its meetings factors that are relevant to its annual consideration of the renewal of the fund's Advisory Contracts, including the services and support provided to the fund and its shareholders. The Board has established various standing committees, each composed of Independent Trustees with varying backgrounds, to which the Board has assigned specific subject matter responsibilities in order to enhance effective decision-making by the Board. The Board, acting directly and through its Committees, requests and receives information concerning the annual consideration of the renewal of the fund's Advisory Contracts. The Board also meets as needed to consider matters specifically related to the Board's annual consideration of the renewal of Advisory Contracts. Members of the Board may also meet with trustees of other Fidelity funds through ad hoc joint committees to discuss certain matters relevant to the Fidelity funds.
At its July 2010 meeting, the Board of Trustees, including the Independent Trustees, unanimously determined to renew the fund's Advisory Contracts. In reaching its determination, the Board considered all factors it believed relevant, including (i) the nature, extent, and quality of the services to be provided to the fund and its shareholders (including the investment performance of the fund); (ii) the competitiveness of the fund's management fee and total expenses; (iii) the total costs of the services to be provided by and the profits to be realized by Fidelity from its relationship with the fund; (iv) the extent to which economies of scale would be realized as the fund grows; and (v) whether fee levels reflect these economies of scale, if any, for the benefit of fund shareholders.
In considering whether to renew the Advisory Contracts for the fund, the Board reached a determination, with the assistance of fund counsel and Independent Trustees' counsel and through the exercise of its business judgment, that the renewal of the Advisory Contracts is in the best interests of fund shareholders and that the compensation to be received by Fidelity under the management contract is fair and reasonable. The Board's decision to renew the Advisory Contracts was not based on any single factor noted above, but rather was based on a comprehensive consideration of all the information provided to the Board at its meetings throughout the year. The Board, in reaching its determination to renew the Advisory Contracts, is aware that shareholders in the fund have a broad range of investment choices available to them, including a wide choice among mutual funds offered by Fidelity's competitors, and that the fund's shareholders, with the opportunity to review and weigh the disclosure provided by the fund in its prospectus and other public disclosures, have chosen to invest in this fund, managed by Fidelity.
Annual Report
Board Approval of Investment Advisory Contracts and
Management Fees - continued
Nature, Extent, and Quality of Services Provided. The Board considered the staffing within the investment adviser, FMR, and the sub-advisers (together, the Investment Advisers), including the backgrounds of the fund's investment personnel and the fund's investment objective and discipline. The Independent Trustees also had discussions with senior management of Fidelity's investment operations and investment groups. The Board considered the structure of the portfolio manager compensation program and whether this structure provides appropriate incentives to act in the best interest of the fund.
Resources Dedicated to Investment Management and Support Services. The Board and the equity research subcommittee of the Board's Fund Oversight Committee reviewed the size, education, and experience of the Investment Advisers' investment staff, their use of technology, and the Investment Advisers' approach to recruiting, training, and retaining portfolio managers and other research, advisory, and management personnel. The Board noted that Fidelity's analysts have access to a variety of technological tools and market and securities data that enable them to perform both fundamental and quantitative analysis and to specialize in various disciplines. The Board considered Fidelity's extensive global research capabilities that enable the Investment Advisers to aggregate data from various sources in an effort to produce positive investment results. The Board also considered that Fidelity's portfolio managers and analysts have access to daily portfolio attribution that allows for monitoring of a fund's portfolio, as well as an electronic communication system that provides immediate real-time access to research concerning issuers and credit enhancers. The Board noted FMR's continued focus on strengthening the organization and discipline of equity portfolio management and research.
Shareholder and Administrative Services. The Board considered (i) the nature, extent, quality, and cost of advisory, administrative, and shareholder services performed by the Investment Advisers and their affiliates under the Advisory Contracts and under separate agreements covering transfer agency, pricing and bookkeeping, and securities lending services for the fund; (ii) the nature and extent of the investment adviser's supervision of third party service providers, principally custodians and subcustodians; and (iii) the resources devoted to, and the record of compliance with, the fund's compliance policies and procedures. The Board also reviewed the allocation of fund brokerage, including allocations to brokers affiliated with the Investment Advisers, the use of brokerage commissions to pay fund expenses, and the use of "soft" commission dollars to pay for research services.
The Board noted that the growth of fund assets over time across the complex allows Fidelity to reinvest in the development of services designed to enhance the value or convenience of the Fidelity funds as investment vehicles. These services include 24-hour access to account information and market information through phone representatives and over the Internet, and investor education materials and asset allocation tools.
Annual Report
Investment in a Large Fund Family. The Board considered the benefits to shareholders of investing in a Fidelity fund, including the benefits of investing in a fund that is part of a large family of funds offering a variety of investment disciplines and providing a large variety of mutual fund investor services. The Board noted that Fidelity had taken, or had made recommendations that resulted in the Fidelity funds taking, a number of actions over the previous year that benefited particular funds, including (i) dedicating additional resources to investment research and restructuring and broadening the focus of the investment research teams; (ii) bolstering the senior management team that oversees asset management; (iii) launching Class F of certain funds as a lower-fee class available to Freedom K and Freedom Index Funds; (iv) lowering the initial investment minimums and ongoing balance requirements for Real Estate High Income Fund; (v) eliminating subsequent purchase minimums for all funds and adding a waiver of the investment minimum requirement for new accounts opened with the proceeds of a systematic withdrawal plan; (vi) eliminating the withdrawal minimum and maximum limits for systematic withdrawals from Advisor funds; (vii) expanding sales load waivers on Class A shares for Destiny Planholders and expanding Institutional Class eligibility for Class O Destiny Planholders; and (viii) changing certain Class A and Class T sales charge structures to further align them with industry practices.
Investment Performance. The Board considered whether the fund has operated in accordance with its investment objective, as well as its record of compliance with its investment restrictions. It also reviewed the fund's absolute investment performance for each class, as well as the fund's relative investment performance for each class measured over multiple periods against (i) a broad-based securities market index, and (ii) a peer group of mutual funds deemed appropriate by Fidelity and reviewed by the Board. The following charts considered by the Board show, over the one-, three-, and five-year periods ended December 31, 2009, the cumulative total returns of Institutional Class (Class I) and Class B of the fund, the cumulative total returns of a broad-based securities market index ("benchmark"), and a range of cumulative total returns of a peer group of mutual funds identified by Morningstar, Inc. as having an investment style similar to that of the fund based on underlying portfolio holdings. The returns of Institutional Class (Class I) and Class B show the performance of the highest and lowest performing classes, respectively (based on five-year performance). The box within each chart shows the 25th percentile return (bottom of box) and the 75th percentile return (top of box) of the peer group. Returns shown above the box are in the first quartile and returns shown below the box are in the fourth quartile. The percentage beaten numbers noted below each chart correspond to the percentile box and represent the percentage of funds in the peer group whose performance was equal to or lower than that of the class indicated.
Annual Report
Board Approval of Investment Advisory Contracts and
Management Fees - continued
Fidelity Advisor Value Leaders Fund
The Board reviewed the fund's relative investment performance against its peer group and noted that the performance of Institutional Class (Class I) of the fund was in the first quartile for the one-year period and the fourth quartile for the three- and five-year periods. The Board also noted that the investment performance of the fund was lower than its benchmark for the three- and five-year periods, although the one-year cumulative total return of Institutional Class (Class I) compared favorably to its benchmark. The Board considered that the variations in performance among the fund's classes reflect the variations in class expenses, which result in lower performance for higher expense classes. The Board also reviewed the fund's performance since inception as well as performance in the current year.
The Board also considered that the fund's management fee is subject to upward or downward adjustment depending upon whether, and to what extent, the fund's investment performance for the performance period exceeds, or is exceeded by, the record (over the same period) of a Board-approved performance adjustment index. The Board realizes that the performance adjustment provides FMR with a strong economic incentive to seek to achieve superior performance for the fund's shareholders and helps to more closely align the interests of FMR and the fund's shareholders.
Based on its review, and giving particular weight to the nature and quality of the resources dedicated by the Investment Advisers to maintain and improve relative performance and factoring in the unprecedented market events in recent years, the Board concluded that the nature, extent, and quality of investment management and support services and of shareholder and administrative services provided to the fund will benefit the fund's shareholders, particularly in light of the Board's view that the fund's shareholders benefit from investing in a fund that is part of a large family of funds offering a variety of investment disciplines and services.
Annual Report
Competitiveness of Management Fee and Total Fund Expenses. The Board considered the fund's management fee and total expenses compared to "mapped groups" of competitive funds and classes. Fidelity creates "mapped groups" by combining similar Lipper investment objective categories that have comparable management fee characteristics. Combining Lipper investment objective categories aids the Board's management fee and total expense comparisons by broadening the competitive group used for comparison and by reducing the number of universes to which various Fidelity funds are compared.
Management Fee. The Board considered two proprietary management fee comparisons for the 12-month periods shown in the chart below. The group of Lipper funds used by the Board for management fee comparisons is referred to below as the "Total Mapped Group." The Total Mapped Group comparison focuses on a fund's standing relative to the total universe of comparable funds available to investors, in terms of gross management fees before expense reimbursements or caps, and without giving effect to the fund's performance adjustment. "TMG %" represents the percentage of funds in the Total Mapped Group that had management fees that were lower than the fund's. For example, a TMG % of 10% means that 90% of the funds in the Total Mapped Group had higher management fees than the fund. The "Asset-Size Peer Group" (ASPG) comparison focuses on a fund's standing relative to non-Fidelity funds similar in size to the fund within the Total Mapped Group. The ASPG represents at least 15% of the funds in the Total Mapped Group with comparable asset size and management fee characteristics, subject to a minimum of 50 funds (or all funds in the Total Mapped Group if fewer than 50). Additional information, such as the ASPG quartile in which the fund's management fee ranked and the impact of the fund's performance adjustment, is also included in the chart and considered by the Board.
Annual Report
Board Approval of Investment Advisory Contracts and
Management Fees - continued
Fidelity Advisor Value Leaders Fund
The Board noted that the fund's management fee ranked below the median of its Total Mapped Group and below the median of its ASPG for 2009. The Board also noted the effect of the fund's negative performance adjustment on the fund's management fee ranking. The Board noted that the performance adjustment for each year represents calculations for performance periods that differ from the periods shown in the performance charts above.
Based on its review, the Board concluded that the fund's management fee is fair and reasonable in light of the services that the fund receives and the other factors considered.
Total Expenses. In its review of each class's total expenses, the Board considered the fund's management fee as well as other fund or class expenses, as applicable, such as transfer agent fees, pricing and bookkeeping fees, fund-paid 12b-1 fees, and custodial, legal, and audit fees. The Board also noted the effects of any waivers and reimbursements on fees and expenses, as well as the impact of the fund's performance adjustment. As part of its review, the Board also considered current and historical total expenses of each class of the fund compared to competitive fund median expenses. Each class of the fund is compared to those funds and classes in the Total Mapped Group (used by the Board for management fee comparisons) that have a similar sales load structure.
The Board noted that the total expenses of each of Class A and Class B ranked below its competitive median for 2009, the total expenses of Class C ranked equal to its competitive median for 2009, and the total expenses of each of Class T and Institutional Class ranked above its competitive median for 2009. The Board considered that the total expenses for Class T were above the median primarily because its 12b-1 fee is higher than the typical front-end load class. The Board noted that the fund offers multiple classes, each of which has a different sales load and 12b-1 fee structure, and that the multiple structures are intended to offer a range of pricing options for the intermediary market. The Board also noted that the total expenses of the classes vary primarily by the level of their 12b-1 fees, although differences in transfer agent fees may also cause expenses to vary from class to class.
Annual Report
Fees Charged to Other Fidelity Clients. The Board also considered Fidelity fee structures and other information with respect to clients of FMR and its affiliates, such as other mutual funds advised or subadvised by FMR or its affiliates, pension plan clients, and other institutional clients. In March 2010, the Board created an ad hoc joint committee with the board of other Fidelity funds (the Committee) to review and compare Fidelity's institutional investment advisory business with its business of providing services to the Fidelity funds, including the differences in services provided, fees charged, and costs incurred, as well as competition in their respective marketplaces.
Based on its review of total expenses and fees charged to other Fidelity clients, the Board concluded that the total expenses of each class of the fund were reasonable, although in some cases above the median of the universe presented for comparison, in light of the services that the fund and its shareholders receive and the other factors considered, including the findings of the Committee.
Costs of the Services and Profitability. The Board considered the revenues earned and the expenses incurred by Fidelity in conducting the business of developing, marketing, distributing, managing, administering and servicing the fund and its shareholders. The Board also considered the level of Fidelity's profits in respect of all the Fidelity funds.
On an annual basis, FMR presents to the Board Fidelity's profitability for the fund. Fidelity calculates the profitability for each fund, as well as aggregate profitability for groups of Fidelity funds and all Fidelity funds, using a series of detailed revenue and cost allocation methodologies which originate with the audited books and records of Fidelity. The Audit Committee of the Board reviews any significant changes from the prior year's methodologies.
PricewaterhouseCoopers LLP (PwC), independent registered public accounting firm and auditor to Fidelity and certain Fidelity funds, has been engaged annually by the Board as part of the Board's assessment of Fidelity's profitability analysis. PwC's engagement includes the review and assessment of Fidelity's methodologies used in determining the revenues and expenses attributable to Fidelity's mutual fund business, and completion of agreed-upon procedures surrounding the mathematical accuracy of fund profitability and its conformity to allocation methodologies. After considering PwC's reports issued under the engagement and information provided by Fidelity, the Board believes that while other allocation methods may also be reasonable, Fidelity's profitability methodologies are reasonable in all material respects.
Annual Report
Board Approval of Investment Advisory Contracts and
Management Fees - continued
The Board has also reviewed Fidelity's non-fund businesses and fall-out benefits related to the mutual fund business as well as cases where Fidelity's affiliates may benefit from or be related to the fund's business.
The Board considered the costs of the services provided by and the profits realized by Fidelity in connection with the operation of the fund and were satisfied that the profitability was not excessive in the circumstances.
Economies of Scale. The Board considered whether there have been economies of scale in respect of the management of the Fidelity funds, whether the Fidelity funds (including the fund) have appropriately benefited from any such economies of scale, and whether there is potential for realization of any further economies of scale. The Board considered the extent to which the fund will benefit from economies of scale through increased services to the fund, through waivers or reimbursements, or through fee or expense reductions.
In February 2009, the Board and the board of other Fidelity funds created an ad hoc committee (the Economies of Scale Committee) to analyze whether FMR attains economies of scale in respect of the management and servicing of the Fidelity funds, whether the Fidelity funds have appropriately benefited from such economies of scale, and whether there is potential for realization of any further economies of scale.
The Board recognized that the fund's management contract incorporates a "group fee" structure, which provides for lower group fee rates as total fund assets under FMR's management increase, and for higher group fee rates as total fund assets under FMR's management decrease. FMR calculates the group fee rates based on a tiered asset "breakpoint" schedule that varies based on asset class. The Board considered that the group fee is designed to deliver the benefits of economies of scale to fund shareholders when total Fidelity fund assets increase, even if assets of any particular fund are unchanged or have declined, because some portion of Fidelity's costs are attributable to services provided to all Fidelity funds, and all funds benefit if those costs can be allocated among more assets. The Board concluded that, given the group fee structure, fund shareholders will benefit from lower management fees as assets under FMR's management increase at the fund complex level, regardless of whether Fidelity achieves any such economies of scale.
The Board concluded, considering the findings of the Economies of Scale Committee, that any potential economies of scale are being appropriately shared between fund shareholders and Fidelity.
Additional Information Requested by the Board. In order to develop fully the factual basis for consideration of the Fidelity funds' Advisory Contracts, the Board requested and received additional information on certain topics, including (i) fund performance trends, actions to be taken by FMR to improve certain funds' overall performance, and Fidelity's long-term strategies for certain funds; (ii) portfolio manager changes that have occurred during the past year and length of portfolio manager tenure for different categories of funds over time; (iii) Fidelity's compensation structure for portfolio managers, research analysts, and other key personnel, the rationale for the compensation structure, and how the compensation structure provides appropriate performance incentives; (iv) the amount of the investment that each portfolio manager has made in the Fidelity fund(s) that he or she manages; (v) management and other fees paid by FMR to affiliated sub-advisers on behalf of the Fidelity funds; (vi) Fidelity's fee structures and rationale for recommending different fees among different categories of funds; (vii) Fidelity's rationale for recommending which funds should have a performance adjustment component as part of their management fees; (viii) the rationale for any differences between fund fee structures and fee structures in place for other Fidelity clients; and (ix) explanations regarding the relative total expenses borne by certain funds and classes, total expense competitive trends, and actions that might be taken by FMR to reduce total expenses for certain funds and classes.
Annual Report
Based on its evaluation of all of the conclusions noted above, and after considering all factors it believed relevant, the Board ultimately concluded that the advisory fee structures are fair and reasonable, and that the fund's Advisory Contracts should be renewed.
Annual Report
Investment Adviser
Fidelity Management & Research Company
Boston, MA
Investment Sub-Advisers
FMR Co., Inc.
Fidelity Management & Research
(U.K.) Inc.
Fidelity Research & Analysis Company
Fidelity Management & Research
(Japan) Inc.
Fidelity Management & Research
(Hong Kong) Limited
General Distributor
Fidelity Distributors Corporation
Boston, MA
Transfer and Service Agents
Fidelity Investments Institutional Operations Company, Inc.
Boston, MA
Fidelity Service Company, Inc.
Boston, MA
Custodian
Brown Brothers Harriman & Company
Boston, MA
AVLFI-UANN-1210
1.793580.107
Item 2. Code of Ethics
As of the end of the period, October 31, 2010, Fidelity Advisor Series VIII (the trust) has adopted a code of ethics, as defined in Item 2 of Form N-CSR, that applies to its President and Treasurer and its Chief Financial Officer. A copy of the code of ethics is filed as an exhibit to this Form N-CSR.
Item 3. Audit Committee Financial Expert
The Board of Trustees of the trust has determined that Joseph Mauriello is an audit committee financial expert, as defined in Item 3 of Form N-CSR. Mr. Mauriello is independent for purposes of Item 3 of Form N-CSR.
Item 4. Principal Accountant Fees and Services
Fees and Services
The following table presents fees billed by Deloitte & Touche LLP, the member firms of Deloitte Touche Tohmatsu, and their respective affiliates (collectively, "Deloitte Entities") in each of the last two fiscal years for services rendered to Fidelity Advisor Emerging Markets Fund, Fidelity Advisor Europe Capital Appreciation Fund, and Fidelity Advisor International Capital Appreciation Fund (the "Funds"):
Services Billed by Deloitte Entities
October 31, 2010 FeesA
| Audit Fees | Audit-Related Fees | Tax Fees | All Other Fees |
Fidelity Advisor Emerging Markets Fund | $38,000 | $- | $6,600 | $- |
Fidelity Advisor Europe Capital Appreciation Fund | $38,000 | $- | $5,600 | $- |
Fidelity Advisor International Capital Appreciation Fund | $48,000 | $- | $6,600 | $- |
October 31, 2009 FeesA
| Audit Fees | Audit-Related Fees | Tax Fees | All Other Fees |
Fidelity Advisor Emerging Markets Fund | $42,000 | $- | $6,600 | $- |
Fidelity Advisor Europe Capital Appreciation Fund | $38,000 | $- | $5,600 | $- |
Fidelity Advisor International Capital Appreciation Fund | $52,000 | $- | $6,600 | $- |
A Amounts may reflect rounding.
The following table presents fees billed by PricewaterhouseCoopers LLP ("PwC") in each of the last two fiscal years for services rendered to Fidelity Advisor Diversified International Fund, Fidelity Advisor Emerging Asia Fund, Fidelity Advisor Global Capital Appreciation Fund, Fidelity Advisor Japan Fund, Fidelity Advisor Overseas Fund, and Fidelity Advisor Value Leaders Fund (the "Funds"):
Services Billed by PwC
October 31, 2010 FeesA
| Audit Fees | Audit-Related Fees | Tax Fees | All Other Fees |
Fidelity Advisor Diversified International Fund | $59,000 | $- | $33,700 | $3,600 |
Fidelity Advisor Emerging Asia Fund | $60,000 | $- | $4,900 | $1,800 |
Fidelity Advisor Global Capital Appreciation Fund | $44,000 | $- | $4,900 | $1,700 |
Fidelity Advisor Japan Fund | $46,000 | $- | $4,900 | $1,700 |
Fidelity Advisor Overseas Fund | $61,000 | $- | $9,800 | $2,200 |
Fidelity Advisor Value Leaders Fund | $42,000 | $- | $4,100 | $1,700 |
October 31, 2009 FeesA
| Audit Fees | Audit-Related Fees | Tax Fees | All Other Fees |
Fidelity Advisor Diversified International Fund | $65,000 | $- | $8,800 | $5,100 |
Fidelity Advisor Emerging Asia Fund | $61,000 | $- | $12,300 | $1,600 |
Fidelity Advisor Global Capital Appreciation Fund | $44,000 | $- | $9,800 | $1,400 |
Fidelity Advisor Japan Fund | $47,000 | $- | $5,000 | $1,400 |
Fidelity Advisor Overseas Fund | $61,000 | $- | $5,200 | $2,200 |
Fidelity Advisor Value Leaders Fund | $41,000 | $- | $5,200 | $1,500 |
A Amounts may reflect rounding.
The following table presents fees billed by PwC and Deloitte Entities that were required to be approved by the Audit Committee for services that relate directly to the operations and financial reporting of the Funds and that are rendered on behalf of Fidelity Management & Research Company ("FMR") and entities controlling, controlled by, or under common control with FMR (not including any sub-adviser whose role is primarily portfolio management and is subcontracted with or overseen by another investment adviser) that provide ongoing services to the Funds ("Fund Service Providers"):
Services Billed by Deloitte Entities
| October 31, 2010A | October 31, 2009A |
Audit-Related Fees | $720,000 | $685,000 |
Tax Fees | $- | $2,000 |
All Other Fees | $790,000 | $215,000 |
A Amounts may reflect rounding.
Services Billed by PwC
| October 31, 2010A | October 31, 2009A |
Audit-Related Fees | $2,150,000 | $2,825,000 |
Tax Fees | $- | $2,000 |
All Other Fees | $510,000 | $- |
A Amounts may reflect rounding.
"Audit-Related Fees" represent fees billed for assurance and related services that are reasonably related to the performance of the fund audit or the review of the fund's financial statements and that are not reported under Audit Fees.
"Tax Fees" represent fees billed for tax compliance, tax advice or tax planning that relate directly to the operations and financial reporting of the fund.
"All Other Fees" represent fees billed for assurance services provided to the fund or Fund Service Provider that relate directly to the operations and financial reporting of the fund, excluding those services that are reported under Audit Fees, Audit-Related Fees or Tax Fees.
Assurance services must be performed by an independent public accountant.
* * *
The aggregate non-audit fees billed by PwC and Deloitte Entities for services rendered to the Funds, FMR (not including any sub-adviser whose role is primarily portfolio management and is subcontracted with or overseen by another investment adviser), and any Fund Service Provider for each of the last two fiscal years of the Funds are as follows:
Billed By | October 31, 2010 A | October 31, 2009 A |
PwC | $5,275,000 | $3,510,000 |
Deloitte Entities | $1,620,000 | $965,000 |
A Amounts may reflect rounding.
The trust's Audit Committee has considered non-audit services that were not pre-approved that were provided by PwC and Deloitte Entities to Fund Service Providers to be compatible with maintaining the independence of PwC and Deloitte Entities in their audits of the Funds, taking into account representations from PwC and Deloitte Entities, in accordance with Public Company Accounting Oversight Board rules, regarding their independence from the Funds and their related entities and FMR's review of the appropriateness and permissibility under applicable law of such non-audit services prior to their provision to the Fund Service Providers.
Audit Committee Pre-Approval Policies and Procedures
The trust's Audit Committee must pre-approve all audit and non-audit services provided by a fund's independent registered public accounting firm relating to the operations or financial reporting of the fund. Prior to the commencement of any audit or non-audit services to a fund, the Audit Committee reviews the services to determine whether they are appropriate and permissible under applicable law.
The Audit Committee has adopted policies and procedures to, among other purposes, provide a framework for the Committee's consideration of non-audit services by the audit firms that audit the Fidelity funds. The policies and procedures require that any non-audit service provided by a fund audit firm to a Fidelity fund and any non-audit service provided by a fund auditor to a Fund Service Provider that relates directly to the operations and financial reporting of a Fidelity fund ("Covered Service") are subject to approval by the Audit Committee before such service is provided.
All Covered Services must be approved in advance of provision of the service either: (i) by formal resolution of the Audit Committee, or (ii) by oral or written approval of the service by the Chair of the Audit Committee (or if the Chair is unavailable, such other member of the Audit Committee as may be designated by the Chair to act in the Chair's absence). The approval contemplated by (ii) above is permitted where the Treasurer determines that action on such an engagement is necessary before the next meeting of the Audit Committee.
Non-audit services provided by a fund audit firm to a Fund Service Provider that do not relate directly to the operations and financial reporting of a Fidelity fund are reported to the Audit Committee on a periodic basis.
Non-Audit Services Approved Pursuant to Rule 2-01(c)(7)(i)(C) and (ii) of Regulation S-X ("De Minimis Exception")
There were no non-audit services approved or required to be approved by the Audit Committee pursuant to the De Minimis Exception during the Funds' last two fiscal years relating to services provided to (i) the Funds or (ii) any Fund Service Provider that relate directly to the operations and financial reporting of the Funds.
Item 5. Audit Committee of Listed Registrants
Not applicable.
Item 6. Investments
(a) Not applicable.
(b) Not applicable
Item 7. Disclosure of Proxy Voting Policies and Procedures for Closed-End Management Investment Companies
Not applicable.
Item 8. Portfolio Managers of Closed-End Management Investment Companies
Not applicable.
Item 9. Purchase of Equity Securities by Closed-End Management Investment Company and Affiliated Purchasers
Not applicable.
Item 10. Submission of Matters to a Vote of Security Holders
There were no material changes to the procedures by which shareholders may recommend nominees to the trust's Board of Trustees.
Item 11. Controls and Procedures
(a)(i) The President and Treasurer and the Chief Financial Officer have concluded that the trust's disclosure controls and procedures (as defined in Rule 30a-3(c) under the Investment Company Act) provide reasonable assurances that material information relating to the trust is made known to them by the appropriate persons, based on their evaluation of these controls and procedures as of a date within 90 days of the filing date of this report.
(a)(ii) There was no change in the trust's internal control over financial reporting (as defined in Rule 30a-3(d) under the Investment Company Act) that occurred during the second fiscal quarter of the period covered by this report that has materially affected, or is reasonably likely to materially affect, the trust's internal control over financial reporting.
Item 12. Exhibits
(a) | (1) | Code of Ethics pursuant to Item 2 of Form N-CSR is filed and attached hereto as EX-99.CODE ETH. |
(a) | (2) | Certification pursuant to Rule 30a-2(a) under the Investment Company Act of 1940 (17 CFR 270.30a-2(a)) is filed and attached hereto as Exhibit 99.CERT. |
(a) | (3) | Not applicable. |
(b) | | Certification pursuant to Rule 30a-2(b) under the Investment Company Act of 1940 (17 CFR 270.30a-2(b)) is furnished and attached hereto as Exhibit 99.906CERT. |
SIGNATURES
Pursuant to the requirements of the Securities Exchange Act of 1934 and the Investment Company Act of 1940, the registrant has duly caused this report to be signed on its behalf by the undersigned, thereunto duly authorized.
Fidelity Advisor Series VIII
By: | /s/Kenneth B. Robins |
| Kenneth B. Robins |
| President and Treasurer |
| |
Date: | December 28, 2010 |
Pursuant to the requirements of the Securities Exchange Act of 1934 and the Investment Company Act of 1940, this report has been signed below by the following persons on behalf of the registrant and in the capacities and on the dates indicated.
By: | /s/Kenneth B. Robins |
| Kenneth B. Robins |
| President and Treasurer |
| |
Date: | December 28, 2010 |
By: | /s/Christine Reynolds |
| Christine Reynolds |
| Chief Financial Officer |
| |
Date: | December 28, 2010 |