UNITED STATES
SECURITIES AND EXCHANGE COMMISSION
Washington, D.C. 20549
FORM N-CSR
CERTIFIED SHAREHOLDER REPORT OF REGISTERED
MANAGEMENT INVESTMENT COMPANIES
Investment Company Act file number 811-3855
Fidelity Advisor Series VIII
(Exact name of registrant as specified in charter)
82 Devonshire St., Boston, Massachusetts 02109
(Address of principal executive offices) (Zip code)
Scott C. Goebel, Secretary
82 Devonshire St.
Boston, Massachusetts 02109
(Name and address of agent for service)
Registrant's telephone number, including area code: 617-563-7000
Date of fiscal year end: | October 31 |
| |
Date of reporting period: | October 31, 2011 |
Item 1. Reports to Stockholders
(Fidelity Investment logo)(registered trademark)
Fidelity Advisor®
Diversified International
Fund - Class A, Class T, Class B
and Class C
Annual Report
October 31, 2011

Contents
Chairman's Message | (Click Here) | The Chairman's message to shareholders. |
Performance | (Click Here) | How the fund has done over time. |
Management's Discussion of Fund Performance | (Click Here) | The Portfolio Manager's review of fund performance and strategy. |
Shareholder Expense Example | (Click Here) | An example of shareholder expenses. |
Investment Changes | (Click Here) | A summary of major shifts in the fund's investments over the past six months. |
Investments | (Click Here) | A complete list of the fund's investments with their market values. |
Financial Statements | (Click Here) | Statements of assets and liabilities, operations, and changes in net assets, as well as financial highlights. |
Notes | (Click Here) | Notes to the financial statements. |
Report of Independent Registered Public Accounting Firm | (Click Here) | |
Trustees and Officers | (Click Here) | |
Distributions | (Click Here) | |
Board Approval of Investment Advisory Contracts and Management Fees | (Click Here) | |
To view a fund's proxy voting guidelines and proxy voting record for the 12-month period ended June 30, visit http://www.fidelity.com/proxyvotingresults or visit the Securities and Exchange Commission's (SEC) web site at http://www.sec.gov. You may also call 1-877-208-0098 to request a free copy of the proxy voting guidelines.
Standard & Poor's, S&P and S&P 500 are registered service marks of The McGraw-Hill Companies, Inc. and have been licensed for use by Fidelity Distributors Corporation.
Other third party marks appearing herein are the property of their respective owners.
All other marks appearing herein are registered or unregistered trademarks or service marks of FMR LLC or an affiliated company.
Annual Report
This report and the financial statements contained herein are submitted for the general information of the shareholders of the fund. This report is not authorized for distribution to prospective investors in the fund unless preceded or accompanied by an effective prospectus.
A fund files its complete schedule of portfolio holdings with the SEC for the first and third quarters of each fiscal year on Form N-Q. Forms N-Q are available on the SEC's web site at http://www.sec.gov. A fund's Forms N-Q may be reviewed and copied at the SEC's Public Reference Room in Washington, DC. Information regarding the operation of the SEC's Public Reference Room may be obtained by calling 1-800-SEC-0330. For a complete list of a fund's portfolio holdings, view the most recent holdings listing, semiannual report, or annual report on Fidelity's web site at http://www.fidelity.com, http://www.advisor.fidelity.com, or http://www.401k.com, as applicable.
NOT FDIC INSURED • MAY LOSE VALUE • NO BANK GUARANTEE
Neither the fund nor Fidelity Distributors Corporation is a bank.
Annual Report
(photo_of_James_C_Curvey)
Dear Shareholder:
Global equity markets began the fourth quarter on a strong note, sharply reversing course in October amid strong corporate earnings, better-than-expected economic news and the promise of a resolution to the sovereign debt crisis in Europe. The mini rally followed a third quarter marked by a significant downturn in July and August, which heightened investor anxiety and set off a wave of volatility that hampered most major asset classes through the end of September. Financial markets are difficult to predict, of course, but you can help put the odds in your favor by following these time-tested investment principles.
One of the basic tenets is to invest according to your time horizon. For long-term investors, riding out the markets' inevitable ups and downs has proven much more effective than making decisions based on short-term developments. If your goal is approaching, you can also benefit from patience and restraint, rather than attempting to time the market. No matter your time horizon, missing only a few of the markets' best days can significantly diminish returns. Patience also affords the benefits of compounding - earning interest on additional income or reinvested dividends and capital gains. While staying the course doesn't eliminate risk, it can considerably lessen the negative impact of short-term downturns.
Asset allocation is another principle to manage risk. As you spread your portfolio among the asset classes, be sure to consider your time horizon, risk tolerance and investment objectives. Younger investors may be better served by emphasizing equities, which historically have been the best-performing asset class over time. Investors who are nearing a specific goal, such as retirement or sending a child to college, may choose to favor bonds and other investments that have tended to be more stable. Studies indicate that asset allocation is the single most important determinant of a portfolio's long-term success. After deciding on a suitable allocation strategy, make sure your portfolio is adequately diversified, with exposure to stocks of small-, mid- and large-cap companies in a range of sectors, for example. And today, more than ever, geographic diversification should be taken into account.
Lastly, investing a certain amount of money on a regular basis - a principle known as dollar-cost averaging - can help lower the average cost of your purchases, while also giving you the discipline to avoid selling weak performers just prior to an upswing, or chasing a hot performer just before a correction.
We invite you to learn more by visiting us on the Internet, dropping by one of our Investor Centers or calling us by phone. It is our privilege to provide the resources you need to choose investments that are right for you.
Sincerely,
(The acting chairman's signature appears here.)
James C. Curvey
Acting Chairman
Annual Report
Average annual total return reflects the change in the value of an investment, assuming reinvestment of the class' distributions from dividend income and capital gains (the profits earned upon the sale of securities that have grown in value, if any) and assuming a constant rate of performance each year. The $10,000 table and the fund's returns do not reflect the deduction of taxes that a shareholder would pay on fund distributions or the redemption of fund shares. During periods of reimbursement by Fidelity, a fund's total return will be greater than it would be had the reimbursement not occurred. How a fund did yesterday is no guarantee of how it will do tomorrow. Returns reflect the conversion of Class B shares to Class A shares after a maximum of seven years.
Average Annual Total Returns
Periods ended October 31, 2011 | Past 1
year | Past 5
years | Past 10
years |
Class A (incl. 5.75% sales charge) | -10.60% | -4.87% | 5.15% |
Class T (incl. 3.50% sales charge) | -8.66% | -4.65% | 5.13% |
Class B (incl. contingent deferred sales charge) A | -10.55% | -4.79% | 5.13% |
Class C (incl. contingent deferred sales charge) B | -6.76% | -4.45% | 4.97% |
A Class B shares' contingent deferred sales charges included in the past one year, past five years, and past ten years total return figures are 5%, 2%, and 0%, respectively.
B Class C shares' contingent deferred sales charges included in the past one year, past five years, and past ten years total return figures are 1%, 0%, and 0%, respectively.
Annual Report
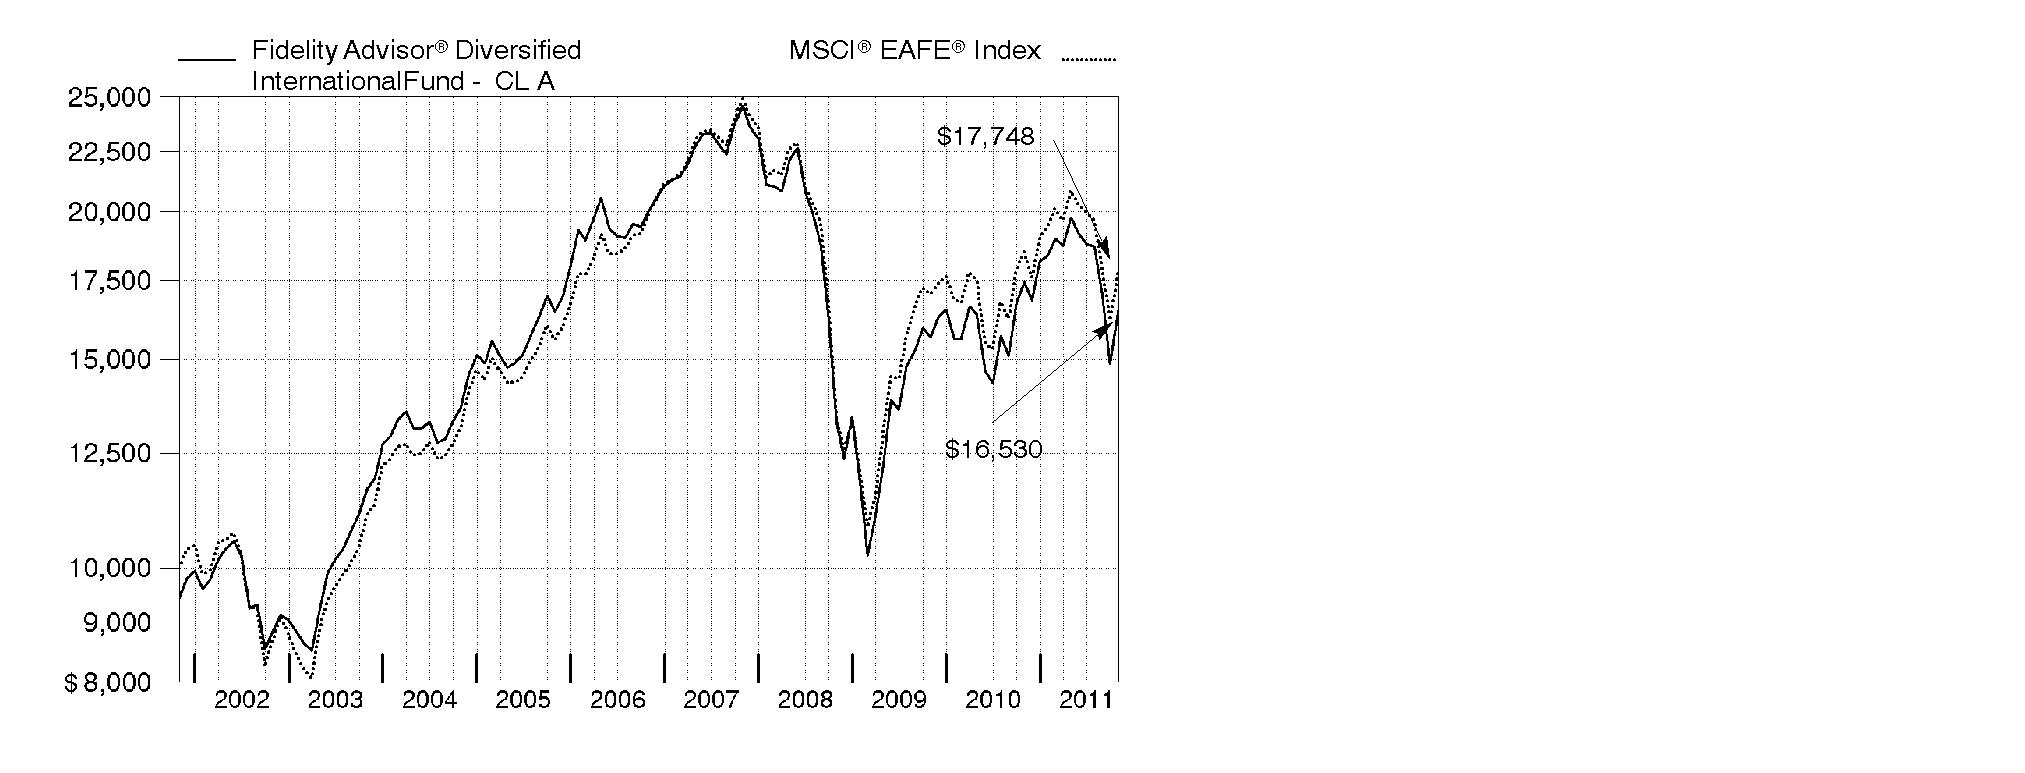
$10,000 Over Past 10 Years
Let's say hypothetically that $10,000 was invested in Fidelity Advisor® Diversified International Fund - Class A on October 31, 2001, and the current 5.75% sales charge was paid. The chart shows how the value of your investment would have changed, and also shows how the MSCI® EAFE® (Europe, Australasia, Far East) Index performed over the same period.
Annual Report
Market Recap: International equities were rocked by a number of headline events during the year ending October 31, 2011. Stocks posted a solid advance for the first half of the period, despite concern about the sovereign debt crisis in Europe, a devastating earthquake and tsunami in Japan, and political upheaval in the Middle East and North Africa. Sentiment turned decidedly negative in the second half, however, as fresh worries about Europe, inflation in China and a dimmed outlook for global growth caused foreign markets to suffer declines that intensified in August and September. October brought with it yet another dramatic swing, as eurozone policymakers appeared near a resolution to the debt debacle and buyers stormed back onto the scene in search of bargains. Still, those gains - along with favorable currency fluctuations overall - weren't enough to offset prior losses, and the MSCI® ACWI® (All Country World Index) ex USA Index finished the period down 4.56%. Within the MSCI index, Europe and emerging markets suffered the biggest declines, with many countries in these areas sustaining steep losses. By contrast, Japan showed resilience in the wake of its natural disasters, falling only 2%. Australia (+4%), Switzerland (+3%), the U.K. (+2%) and Canada, which produced a nominal return, were among the few major benchmark components to break into positive territory.
Comments from William Bower, Portfolio Manager of Fidelity Advisor® Diversified International Fund: For the year, the fund's Class A, Class T, Class B and Class C shares returned -5.15%, -5.35%, -5.89% and -5.83%, respectively (excluding sales charges), underperforming the -3.97% return of the MSCI® EAFE® (Europe, Australasia, Far East) Index. Fund performance versus the index was held back by security selection in energy, positioning in consumer staples, stock selection in financials and an underweighting in pharmaceuticals. Geographically, fund performance was curtailed by stock selection in the Asia-Pacific ex Japan region, China and Canada. Individual detractors included U.K.-based Lloyds Banking Group; out-of-benchmark positions in Canadian energy companies Niko Resources and Petrobank Energy & Resources; an underweighting in Swiss drug company Roche Holding - no longer held; Danish beer company Carlsberg; and Italy's Fiat Industrial. On the plus side, the fund benefited from an underweighting in the utilities sector, positioning in consumer discretionary and security selection in technology hardware/equipment. Regionally, positioning in continental Europe helped, as did stock picks in Japan. Top contributors included Japan Tobacco, U.K.-listed Royal Dutch Shell, an out-of-index position in Japanese online retailer Start Today, a lack of exposure to Tokyo Electric Power and a non-benchmark stake in technology giant Apple.
Annual Report
The views expressed above reflect those of the portfolio manager(s) only through the end of the period as stated on the cover of this report and do not necessarily represent the views of Fidelity or any other person in the Fidelity organization. Any such views are subject to change at any time based upon market or other conditions and Fidelity disclaims any responsibility to update such views. These views may not be relied on as investment advice and, because investment decisions for a Fidelity fund are based on numerous factors, may not be relied on as an indication of trading intent on behalf of any Fidelity fund.
Annual Report
Shareholder Expense Example
As a shareholder of the Fund, you incur two types of costs: (1) transaction costs, including sales charges (loads) on purchase payments or redemption proceeds, redemption fees, and (2) ongoing costs, including management fees, distribution and/or service (12b-1) fees and other Fund expenses. This Example is intended to help you understand your ongoing costs (in dollars) of investing in the Fund and to compare these costs with the ongoing costs of investing in other mutual funds.
The Example is based on an investment of $1,000 invested at the beginning of the period and held for the entire period (May 1, 2011 to October 31, 2011).
Actual Expenses
The first line of the accompanying table for each class of the Fund provides information about actual account values and actual expenses. You may use the information in this line, together with the amount you invested, to estimate the expenses that you paid over the period. Simply divide your account value by $1,000.00 (for example, an $8,600 account value divided by $1,000.00 = 8.6), then multiply the result by the number in the first line for a class of the Fund under the heading entitled "Expenses Paid During Period" to estimate the expenses you paid on your account during this period. In addition, the Fund, as a shareholder in the underlying Fidelity Central Funds, will indirectly bear its pro-rata share of the fees and expenses incurred by the underlying Fidelity Central Funds. These fees and expenses are not included in the Fund's annualized expense ratio used to calculate the expense estimate in the table below.
Hypothetical Example for Comparison Purposes
The second line of the accompanying table for each class of the Fund provides information about hypothetical account values and hypothetical expenses based on a Class' actual expense ratio and an assumed rate of return of 5% per year before expenses, which is not the Class' actual return. The hypothetical account values and expenses may not be used to estimate the actual ending account balance or expenses you paid for the period. You may use this information to compare the ongoing costs of investing in the Fund and other funds. To do so, compare this 5% hypothetical example with the 5% hypothetical examples that appear in the shareholder reports of the other funds. In addition, the Fund, as a shareholder in the underlying Fidelity Central Funds, will indirectly bear its pro-rata share of the fees and expenses incurred by the underlying Fidelity Central Funds. These fees and expenses are not included in the Fund's annualized expense ratio used to calculate the expense estimate in the table below.
Please note that the expenses shown in the table are meant to highlight your ongoing costs only and do not reflect any transaction costs. Therefore, the second line of the table is useful in comparing ongoing costs only, and will not help you determine the relative total costs of owning different funds. In addition, if these transactional costs were included, your costs would have been higher.
Annual Report
| Annualized Expense Ratio | Beginning
Account Value
May 1, 2011 | Ending
Account Value
October 31, 2011 | Expenses Paid
During Period*
May 1, 2011 to
October 31, 2011 |
Class A | 1.30% | | | |
Actual | | $ 1,000.00 | $ 836.30 | $ 6.02 |
Hypothetical A | | $ 1,000.00 | $ 1,018.65 | $ 6.61 |
Class T | 1.55% | | | |
Actual | | $ 1,000.00 | $ 835.40 | $ 7.17 |
Hypothetical A | | $ 1,000.00 | $ 1,017.39 | $ 7.88 |
Class B | 2.08% | | | |
Actual | | $ 1,000.00 | $ 832.90 | $ 9.61 |
Hypothetical A | | $ 1,000.00 | $ 1,014.72 | $ 10.56 |
Class C | 2.05% | | | |
Actual | | $ 1,000.00 | $ 833.30 | $ 9.47 |
Hypothetical A | | $ 1,000.00 | $ 1,014.87 | $ 10.41 |
Institutional Class | .99% | | | |
Actual | | $ 1,000.00 | $ 837.70 | $ 4.59 |
Hypothetical A | | $ 1,000.00 | $ 1,020.21 | $ 5.04 |
A 5% return per year before expenses
* Expenses are equal to each Class' annualized expense ratio, multiplied by the average account value over the period, multiplied by 184/365 (to reflect the one-half year period).
Annual Report
Investment Changes (Unaudited)
Top Five Stocks as of October 31, 2011 |
| % of fund's
net assets | % of fund's net assets
6 months ago |
Royal Dutch Shell PLC Class B (United Kingdom, Oil, Gas & Consumable Fuels) | 4.3 | 3.4 |
BHP Billiton Ltd. sponsored ADR (Australia, Metals & Mining) | 2.1 | 2.0 |
Novo Nordisk A/S Series B (Denmark, Pharmaceuticals) | 1.9 | 1.8 |
GlaxoSmithKline PLC (United Kingdom, Pharmaceuticals) | 1.7 | 1.2 |
Vodafone Group PLC sponsored ADR (United Kingdom, Wireless Telecommunication Services) | 1.7 | 1.2 |
| 11.7 | |
Top Five Market Sectors as of October 31, 2011 |
| % of fund's
net assets | % of fund's net assets
6 months ago |
Consumer Discretionary | 16.4 | 16.1 |
Financials | 15.7 | 20.6 |
Energy | 11.6 | 11.6 |
Consumer Staples | 10.6 | 7.1 |
Materials | 10.1 | 10.5 |
Top Five Countries as of October 31, 2011 |
(excluding cash equivalents) | % of fund's
net assets | % of fund's net assets
6 months ago |
United Kingdom | 18.2 | 17.0 |
Japan | 14.5 | 13.8 |
Germany | 8.4 | 7.9 |
France | 7.0 | 6.0 |
Canada | 5.7 | 5.0 |
Percentages are adjusted for the effect of open futures contracts, if applicable. |
Asset Allocation (% of fund's net assets) |
As of October 31, 2011 | As of April 30, 2011 |
 | Stocks 97.7% | | | Stocks 99.5% | |
 | Other
Investments 0.0%* | | | Other
Investments 0.0%* | |
| Short-Term
Investments and
Net Other Assets 2.3% | | | Short-Term
Investments and
Net Other Assets 0.5% | |

* Amount represents less than 0.1%. |
Annual Report
Investments October 31, 2011
Showing Percentage of Net Assets
Common Stocks - 96.2% |
| Shares | | Value (000s) |
Australia - 3.7% |
BHP Billiton Ltd. sponsored ADR (d) | 665,600 | | $ 51,970 |
Fortescue Metals Group Ltd. | 552,575 | | 2,776 |
Iluka Resources Ltd. | 215,410 | | 3,581 |
Newcrest Mining Ltd. | 714,443 | | 25,252 |
QBE Insurance Group Ltd. | 276,266 | | 4,253 |
WorleyParsons Ltd. | 49,933 | | 1,449 |
TOTAL AUSTRALIA | | 89,281 |
Bailiwick of Guernsey - 1.2% |
Amdocs Ltd. (a) | 176,500 | | 5,299 |
Ashmore Global Opportunities Ltd. (United Kingdom) | 80,098 | | 889 |
Resolution Ltd. | 5,147,282 | | 22,764 |
TOTAL BAILIWICK OF GUERNSEY | | 28,952 |
Bailiwick of Jersey - 2.0% |
Experian PLC | 1,380,600 | | 17,995 |
Randgold Resources Ltd. sponsored ADR | 90,400 | | 9,905 |
Shire PLC | 271,800 | | 8,532 |
WPP PLC | 1,160,845 | | 12,018 |
TOTAL BAILIWICK OF JERSEY | | 48,450 |
Belgium - 1.0% |
Anheuser-Busch InBev SA NV | 427,346 | | 23,702 |
Bermuda - 1.2% |
Assured Guaranty Ltd. | 290,700 | | 3,704 |
Clear Media Ltd. (a) | 11,132,000 | | 4,245 |
CNPC (Hong Kong) Ltd. | 1,736,000 | | 2,432 |
Huabao International Holdings Ltd. | 4,119,000 | | 2,617 |
Li & Fung Ltd. | 4,706,000 | | 9,069 |
Noble Group Ltd. | 6,197,000 | | 7,564 |
TOTAL BERMUDA | | 29,631 |
Brazil - 2.1% |
Anhanguera Educacional Participacoes SA | 193,600 | | 2,847 |
Banco Bradesco SA (PN) sponsored ADR | 340,000 | | 6,188 |
Droga Raia SA | 41,000 | | 581 |
Drogasil SA | 462,600 | | 2,909 |
Estacio Participacoes SA | 210,300 | | 2,454 |
Itau Unibanco Banco Multiplo SA sponsored ADR | 658,800 | | 12,596 |
Kroton Educacional SA unit (a) | 128,700 | | 1,439 |
Qualicorp SA | 333,000 | | 3,045 |
Souza Cruz Industria Comerico | 497,800 | | 6,105 |
Common Stocks - continued |
| Shares | | Value (000s) |
Brazil - continued |
T4F Entretenimento SA | 212,800 | | $ 1,487 |
Telefonica Brasil SA sponsored ADR (a) | 252,635 | | 7,331 |
Tractebel Energia SA | 181,600 | | 2,908 |
TOTAL BRAZIL | | 49,890 |
British Virgin Islands - 0.4% |
Arcos Dorados Holdings, Inc. | 177,300 | | 4,149 |
Camelot Information Systems, Inc. ADR (a)(d) | 225,500 | | 735 |
Mail.ru Group Ltd. GDR (Reg. S) | 105,400 | | 3,631 |
TOTAL BRITISH VIRGIN ISLANDS | | 8,515 |
Canada - 5.7% |
Barrick Gold Corp. | 95,000 | | 4,690 |
Canadian Natural Resources Ltd. | 503,500 | | 17,759 |
Fairfax Financial Holdings Ltd. (sub. vtg.) | 18,000 | | 7,524 |
Goldcorp, Inc. | 183,000 | | 8,904 |
InterOil Corp. (a)(d) | 26,200 | | 1,245 |
Ivanhoe Mines Ltd. (a) | 313,760 | | 6,421 |
Niko Resources Ltd. | 218,400 | | 12,013 |
Open Text Corp. (a) | 137,900 | | 8,440 |
Osisko Mining Corp. (a) | 281,100 | | 3,389 |
Painted Pony Petroleum Ltd. (a)(e) | 170,900 | | 2,090 |
Painted Pony Petroleum Ltd. Class A (a) | 900,000 | | 11,006 |
Penn West Petroleum Ltd. | 73,300 | | 1,310 |
Petrobank Energy & Resources Ltd. | 528,300 | | 4,754 |
Petrominerales Ltd. (d) | 313,514 | | 8,271 |
Potash Corp. of Saskatchewan, Inc. | 260,000 | | 12,306 |
Suncor Energy, Inc. | 256,900 | | 8,182 |
Talisman Energy, Inc. | 660,700 | | 9,372 |
Tourmaline Oil Corp. (a) | 150,000 | | 4,987 |
Tourmaline Oil Corp. (a)(e) | 32,900 | | 1,094 |
Uranium One, Inc. | 1,093,500 | | 3,291 |
Valeant Pharmaceuticals International, Inc. (Canada) | 75,000 | | 2,961 |
TOTAL CANADA | | 140,009 |
Cayman Islands - 0.8% |
China Automation Group Ltd. | 565,000 | | 196 |
China ZhengTong Auto Services Holdings Ltd. | 2,608,000 | | 2,824 |
Haitian International Holdings Ltd. | 2,822,000 | | 2,507 |
Hengan International Group Co. Ltd. | 914,500 | | 7,927 |
HiSoft Technology International Ltd. ADR (a)(d) | 178,100 | | 2,205 |
Common Stocks - continued |
| Shares | | Value (000s) |
Cayman Islands - continued |
NVC Lighting Holdings Ltd. | 4,004,000 | | $ 1,739 |
Sands China Ltd. (a) | 468,000 | | 1,406 |
TOTAL CAYMAN ISLANDS | | 18,804 |
China - 1.0% |
Baidu.com, Inc. sponsored ADR (a) | 131,300 | | 18,406 |
Changsha Zoomlion Heavy Industry Science & Technology Development Co. Ltd. (H Shares) | 2,303,640 | | 3,333 |
Shandong Weigao Group Medical Polymer Co. Ltd. (H Shares) | 2,108,000 | | 2,191 |
SINA Corp. (a) | 15,000 | | 1,219 |
TOTAL CHINA | | 25,149 |
Curacao - 0.6% |
Schlumberger Ltd. | 202,200 | | 14,856 |
Denmark - 2.6% |
Carlsberg A/S Series B | 147,600 | | 10,047 |
Novo Nordisk A/S Series B | 424,708 | | 45,097 |
William Demant Holding A/S (a) | 106,535 | | 8,500 |
TOTAL DENMARK | | 63,644 |
Finland - 0.1% |
Nokian Tyres PLC | 46,300 | | 1,701 |
France - 7.0% |
Alstom SA | 293,834 | | 11,020 |
Arkema SA | 33,900 | | 2,319 |
Atos Origin SA | 35,000 | | 1,696 |
AXA SA | 484,000 | | 7,884 |
BNP Paribas SA | 429,300 | | 19,516 |
Bureau Veritas SA | 47,700 | | 3,711 |
Danone | 257,800 | | 17,946 |
Essilor International SA | 173,646 | | 12,592 |
JC Decaux SA (a) | 87,700 | | 2,350 |
LVMH Moet Hennessy - Louis Vuitton | 175,327 | | 29,177 |
PPR SA | 196,700 | | 30,733 |
Publicis Groupe SA | 125,000 | | 6,061 |
Sanofi-aventis | 348,286 | | 24,920 |
TOTAL FRANCE | | 169,925 |
Germany - 6.9% |
adidas AG | 147,700 | | 10,457 |
Allianz AG | 79,246 | | 8,906 |
BASF AG | 219,303 | | 16,143 |
Common Stocks - continued |
| Shares | | Value (000s) |
Germany - continued |
Bayer AG | 184,652 | | $ 11,830 |
Bayerische Motoren Werke AG (BMW) | 60,177 | | 4,918 |
Deutsche Boerse AG | 93,200 | | 5,159 |
ElringKlinger AG | 81,300 | | 2,254 |
Fresenius Medical Care AG & Co. KGaA | 266,200 | | 19,394 |
Fresenius SE | 194,400 | | 19,185 |
Infineon Technologies AG | 269,600 | | 2,436 |
Kabel Deutschland Holding AG (a) | 88,700 | | 5,065 |
Linde AG | 117,847 | | 18,747 |
SAP AG | 272,836 | | 16,500 |
Siemens AG | 260,351 | | 27,294 |
TOTAL GERMANY | | 168,288 |
Hong Kong - 1.1% |
AIA Group Ltd. | 2,631,000 | | 8,045 |
China Mobile (Hong Kong) Ltd. sponsored ADR | 133,400 | | 6,345 |
China Resources Enterprise Ltd. | 326,000 | | 1,191 |
Henderson Land Development Co. Ltd. | 998,325 | | 5,457 |
Swire Pacific Ltd. (A Shares) | 537,000 | | 6,205 |
TOTAL HONG KONG | | 27,243 |
India - 2.2% |
Axis Bank Ltd. | 154,359 | | 3,648 |
Bajaj Auto Ltd. | 77,063 | | 2,726 |
Bharti Airtel Ltd. | 875,793 | | 7,014 |
Cummins India Ltd. | 60,573 | | 494 |
Dr. Reddy's Laboratories Ltd. | 15,851 | | 537 |
HDFC Bank Ltd. | 1,241,884 | | 12,385 |
Housing Development Finance Corp. Ltd. | 640,065 | | 9,008 |
Infrastructure Development Finance Co. Ltd. | 1,296,940 | | 3,501 |
ITC Ltd. | 504,101 | | 2,199 |
Lupin Ltd. | 49,561 | | 477 |
Mahindra & Mahindra Financial Services Ltd. | 231,785 | | 3,187 |
Shriram Transport Finance Co. Ltd. | 243,922 | | 3,054 |
State Bank of India | 121,560 | | 4,728 |
Wipro Ltd. | 140,264 | | 1,052 |
TOTAL INDIA | | 54,010 |
Ireland - 0.3% |
Accenture PLC Class A | 84,700 | | 5,104 |
Elan Corp. PLC sponsored ADR (a) | 252,900 | | 3,032 |
TOTAL IRELAND | | 8,136 |
Common Stocks - continued |
| Shares | | Value (000s) |
Italy - 1.8% |
ENI SpA | 89,400 | | $ 1,976 |
Fiat Industrial SpA (a) | 2,202,500 | | 19,218 |
Prada SpA | 701,200 | | 3,466 |
Saipem SpA | 428,501 | | 19,213 |
TOTAL ITALY | | 43,873 |
Japan - 14.5% |
ABC-Mart, Inc. | 124,400 | | 4,872 |
Aozora Bank Ltd. | 1,485,000 | | 3,755 |
Calbee, Inc. (d) | 112,000 | | 5,106 |
Cosmos Pharmaceutical Corp. | 151,100 | | 7,009 |
Denso Corp. | 185,900 | | 5,718 |
Dentsu, Inc. | 224,700 | | 6,767 |
Don Quijote Co. Ltd. | 154,600 | | 5,664 |
Fanuc Corp. | 81,900 | | 13,244 |
Hitachi Ltd. | 4,450,000 | | 23,847 |
Honda Motor Co. Ltd. sponsored ADR | 746,006 | | 22,306 |
Hoya Corp. | 244,500 | | 5,342 |
Itochu Corp. | 1,259,800 | | 12,462 |
Japan Retail Fund Investment Corp. | 358 | | 554 |
Japan Tobacco, Inc. | 6,256 | | 31,273 |
JSR Corp. | 349,200 | | 6,667 |
KDDI Corp. | 2,618 | | 19,180 |
Keyence Corp. | 63,800 | | 16,221 |
Mitsubishi Corp. | 301,600 | | 6,204 |
Mitsubishi UFJ Financial Group, Inc. | 1,783,800 | | 7,753 |
Mitsui & Co. Ltd. | 334,700 | | 4,885 |
Nitori Holdings Co. Ltd. | 45,400 | | 4,342 |
NTT DoCoMo, Inc. | 6,081 | | 10,801 |
ORIX Corp. | 374,570 | | 32,695 |
OSAKA Titanium technologies Co. Ltd. | 11,600 | | 639 |
Rakuten, Inc. | 21,801 | | 23,902 |
Seven & i Holdings Co., Ltd. | 392,600 | | 10,478 |
Shimadzu Corp. | 172,000 | | 1,464 |
SHIMANO, Inc. | 103,800 | | 5,132 |
SMC Corp. | 78,600 | | 12,227 |
SOFTBANK CORP. | 454,800 | | 14,763 |
Start Today Co. Ltd. | 791,600 | | 16,748 |
Sumitomo Mitsui Financial Group, Inc. | 93,900 | | 2,625 |
Yahoo! Japan Corp. | 25,684 | | 8,250 |
TOTAL JAPAN | | 352,895 |
Common Stocks - continued |
| Shares | | Value (000s) |
Korea (South) - 1.9% |
Amorepacific Corp. | 9,101 | | $ 10,262 |
LG Household & Health Care Ltd. | 5,491 | | 2,471 |
Orion Corp. | 23,346 | | 12,478 |
Samsung Electronics Co. Ltd. | 19,473 | | 16,701 |
Shinhan Financial Group Co. Ltd. | 134,470 | | 5,337 |
TOTAL KOREA (SOUTH) | | 47,249 |
Luxembourg - 0.3% |
Samsonite International SA | 2,545,800 | | 4,142 |
Ternium SA sponsored ADR | 141,900 | | 3,482 |
TOTAL LUXEMBOURG | | 7,624 |
Mexico - 0.9% |
America Movil SAB de CV Series L sponsored ADR | 305,200 | | 7,758 |
Grupo Televisa SA de CV (CPO) sponsored ADR | 230,100 | | 4,908 |
Wal-Mart de Mexico SA de CV Series V | 3,523,000 | | 9,101 |
TOTAL MEXICO | | 21,767 |
Netherlands - 2.8% |
AEGON NV (a) | 2,658,300 | | 12,679 |
ASML Holding NV (Netherlands) | 133,500 | | 5,601 |
Gemalto NV | 141,225 | | 6,444 |
ING Groep NV sponsored ADR (a)(d) | 1,888,600 | | 16,318 |
Koninklijke KPN NV | 1,077,782 | | 14,164 |
Koninklijke Philips Electronics NV (depositary receipt) (NY Reg.) | 392,500 | | 8,184 |
Unilever NV (Certificaten Van Aandelen) (Bearer) unit | 73,400 | | 2,534 |
Yandex NV | 45,000 | | 1,238 |
TOTAL NETHERLANDS | | 67,162 |
Norway - 1.6% |
DnB NOR ASA | 891,599 | | 10,401 |
Storebrand ASA (A Shares) | 600,000 | | 3,700 |
Telenor ASA | 1,365,000 | | 24,370 |
TOTAL NORWAY | | 38,471 |
Qatar - 0.2% |
Commercial Bank of Qatar GDR (Reg. S) | 1,100,000 | | 5,045 |
Russia - 0.3% |
Sberbank of Russia sponsored ADR | 320,000 | | 3,440 |
Uralkali JSC GDR (Reg. S) | 90,000 | | 3,906 |
TOTAL RUSSIA | | 7,346 |
Common Stocks - continued |
| Shares | | Value (000s) |
South Africa - 0.8% |
AngloGold Ashanti Ltd. sponsored ADR | 208,200 | | $ 9,413 |
Foschini Ltd. | 165,400 | | 2,087 |
Naspers Ltd. Class N | 84,300 | | 4,036 |
Shoprite Holdings Ltd. | 265,100 | | 3,885 |
Tiger Brands Ltd. | 37,200 | | 1,072 |
TOTAL SOUTH AFRICA | | 20,493 |
Spain - 2.6% |
Banco Bilbao Vizcaya Argentaria SA | 673,090 | | 6,059 |
Banco Santander SA (Spain) sponsored ADR (d) | 1,295,000 | | 11,085 |
Grifols SA ADR (a) | 938,900 | | 6,018 |
Inditex SA | 322,785 | | 29,375 |
Prosegur Compania de Seguridad SA (Reg.) | 176,100 | | 8,786 |
Repsol YPF SA | 95,491 | | 2,894 |
TOTAL SPAIN | | 64,217 |
Sweden - 0.4% |
H&M Hennes & Mauritz AB (B Shares) | 125,563 | | 4,158 |
Swedbank AB (A Shares) | 414,600 | | 5,841 |
TOTAL SWEDEN | | 9,999 |
Switzerland - 3.8% |
Clariant AG (Reg.) (a) | 474,195 | | 5,185 |
Kuehne & Nagel International AG | 149,610 | | 18,634 |
Nestle SA | 564,038 | | 32,716 |
Noble Corp. | 71,700 | | 2,577 |
Partners Group Holding | 5,000 | | 937 |
Transocean Ltd. (United States) | 163,000 | | 9,315 |
UBS AG (a) | 1,184,990 | | 14,980 |
Zurich Financial Services AG | 39,749 | | 9,231 |
TOTAL SWITZERLAND | | 93,575 |
Taiwan - 1.0% |
HTC Corp. | 392,800 | | 8,828 |
Taiwan Fertilizer Co. Ltd. | 368,000 | | 948 |
Taiwan Semiconductor Manufacturing Co. Ltd. sponsored ADR | 1,015,300 | | 12,813 |
Unified-President Enterprises Corp. | 696,420 | | 958 |
TOTAL TAIWAN | | 23,547 |
United Kingdom - 18.2% |
3Legs Resources PLC | 645,100 | | 1,401 |
Anglo American PLC (United Kingdom) | 328,300 | | 12,109 |
BG Group PLC | 1,116,992 | | 24,367 |
Common Stocks - continued |
| Shares | | Value (000s) |
United Kingdom - continued |
British American Tobacco PLC sponsored ADR | 182,100 | | $ 16,799 |
Burberry Group PLC | 582,600 | | 12,564 |
Capita Group PLC | 277,600 | | 3,243 |
Carphone Warehouse Group PLC | 1,801,600 | | 10,170 |
Filtrona PLC | 658,900 | | 4,208 |
GlaxoSmithKline PLC | 1,832,500 | | 41,133 |
HSBC Holdings PLC sponsored ADR | 831,900 | | 36,321 |
Imperial Tobacco Group PLC | 205,191 | | 7,504 |
Inchcape PLC | 1,639,100 | | 8,601 |
Intertek Group PLC | 241,700 | | 7,988 |
ITV PLC | 4,848,100 | | 4,994 |
Lloyds Banking Group PLC (a) | 21,916,100 | | 11,335 |
Misys PLC | 1,534,750 | | 7,202 |
Next PLC | 313,300 | | 12,878 |
Ocado Group PLC (a)(d) | 1,074,000 | | 1,618 |
Pearson PLC | 996,300 | | 18,306 |
Pz Cussons PLC Class L | 137,000 | | 811 |
Reckitt Benckiser Group PLC | 631,700 | | 32,488 |
Rolls-Royce Group PLC | 1,800,600 | | 20,342 |
Rolls-Royce Group PLC Class C | 124,241,400 | | 200 |
Royal Dutch Shell PLC Class B | 2,943,612 | | 105,633 |
SuperGroup PLC (a) | 155,800 | | 1,563 |
Vodafone Group PLC sponsored ADR | 1,447,300 | | 40,293 |
TOTAL UNITED KINGDOM | | 444,071 |
United States of America - 5.2% |
Apple, Inc. (a) | 63,500 | | 25,704 |
CF Industries Holdings, Inc. | 45,500 | | 7,383 |
Citigroup, Inc. | 488,880 | | 15,444 |
Cognizant Technology Solutions Corp. Class A (a) | 66,700 | | 4,852 |
Facebook, Inc. Class B (f) | 131,847 | | 3,296 |
Green Mountain Coffee Roasters, Inc. (a) | 26,900 | | 1,749 |
Nabors Industries Ltd. (a) | 153,200 | | 2,808 |
Newmont Mining Corp. | 125,000 | | 8,354 |
Noble Energy, Inc. | 75,600 | | 6,754 |
Polycom, Inc. (a) | 275,000 | | 4,546 |
PriceSmart, Inc. | 4,200 | | 319 |
SanDisk Corp. (a) | 194,000 | | 9,830 |
Schweitzer-Mauduit International, Inc. | 156,300 | | 10,991 |
The Mosaic Co. | 108,300 | | 6,342 |
Unisys Corp. (a) | 239,998 | | 6,238 |
Common Stocks - continued |
| Shares | | Value (000s) |
United States of America - continued |
Virgin Media, Inc. | 87,600 | | $ 2,136 |
Wells Fargo & Co. | 399,100 | | 10,341 |
TOTAL UNITED STATES OF AMERICA | | 127,087 |
TOTAL COMMON STOCKS (Cost $2,192,838) | 2,344,607 |
Nonconvertible Preferred Stocks - 1.5% |
| | | |
Germany - 1.5% |
ProSiebenSat.1 Media AG | 347,500 | | 7,454 |
Volkswagen AG | 169,700 | | 29,779 |
TOTAL NONCONVERTIBLE PREFERRED STOCKS (Cost $22,794) | 37,233 |
Master Notes - 0.0% |
| Principal Amount (000s) | | |
Canada - 0.0% |
OZ Optics Ltd. 5% 11/5/14 (f)
(Cost $15) | | $ 14 | | 14 |
Money Market Funds - 4.6% |
| Shares | | |
Fidelity Cash Central Fund, 0.12% (b) | 47,652,773 | | 47,653 |
Fidelity Securities Lending Cash Central Fund, 0.11% (b)(c) | 65,392,682 | | 65,393 |
TOTAL MONEY MARKET FUNDS (Cost $113,046) | 113,046 |
TOTAL INVESTMENT PORTFOLIO - 102.3% (Cost $2,328,693) | 2,494,900 |
NET OTHER ASSETS (LIABILITIES) - (2.3)% | (56,326) |
NET ASSETS - 100% | $ 2,438,574 |
Legend |
(a) Non-income producing |
(b) Affiliated fund that is available only to investment companies and other accounts managed by Fidelity Investments. The rate quoted is the annualized seven-day yield of the fund at period end. A complete unaudited listing of the fund's holdings as of its most recent quarter end is available upon request. In addition, each Fidelity Central Fund's financial statements, which are not covered by the Fund's Report of Independent Registered Public Accounting Firm, are available on the SEC's website or upon request. |
(c) Investment made with cash collateral received from securities on loan. |
(d) Security or a portion of the security is on loan at period end. |
(e) Security exempt from registration under Rule 144A of the Securities Act of 1933. These securities may be resold in transactions exempt from registration, normally to qualified institutional buyers. At the end of the period, the value of these securities amounted to $3,184,000 or 0.1% of net assets. |
(f) Restricted securities - Investment in securities not registered under the Securities Act of 1933 (excluding 144A issues). At the end of the period, the value of restricted securities (excluding 144A issues) amounted to $3,310,000 or 0.1% of net assets. |
Additional information on each restricted holding is as follows: |
Security | Acquisition Date | Acquisition Cost (000s) |
Facebook, Inc. Class B | 3/31/11 | $ 3,296 |
OZ Optics Ltd. 5% 11/5/14 | 11/5/10 | $ 15 |
Affiliated Central Funds |
Information regarding fiscal year to date income earned by the Fund from investments in Fidelity Central Funds is as follows: |
Fund | Income earned
(Amounts in thousands) |
Fidelity Cash Central Fund | $ 74 |
Fidelity Securities Lending Cash Central Fund | 2,043 |
Total | $ 2,117 |
Other Information |
The following is a summary of the inputs used, as of October 31, 2011, involving the Fund's assets and liabilities carried at fair value. The inputs or methodology used for valuing securities may not be an indication of the risk associated with investing in those securities. For more information on valuation inputs, and their aggregation into the levels used in the tables below, please refer to the Security Valuation section in the accompanying Notes to Financial Statements. |
Valuation Inputs at Reporting Date: |
Description
(Amounts in thousands) | Total | Level 1 | Level 2 | Level 3 |
Investments in Securities: | | | | |
Equities: | | | | |
United Kingdom | $ 444,071 | $ 267,664 | $ 176,407 | $ - |
Japan | 352,895 | 22,306 | 330,589 | - |
Germany | 205,521 | 142,333 | 63,188 | - |
France | 169,925 | 145,005 | 24,920 | - |
Canada | 140,009 | 140,009 | - | - |
United States of America | 127,087 | 123,791 | - | 3,296 |
Switzerland | 93,575 | 78,595 | 14,980 | - |
Australia | 89,281 | 51,970 | 37,311 | - |
Netherlands | 67,162 | 46,348 | 20,814 | - |
Other | 692,314 | 406,381 | 285,933 | - |
Master Notes | 14 | - | - | 14 |
Money Market Funds | 113,046 | 113,046 | - | - |
Total Investments in Securities: | $ 2,494,900 | $ 1,537,448 | $ 954,142 | $ 3,310 |
The following is a reconciliation of Investments in Securities for which Level 3 inputs were used in determining value: |
(Amounts in thousands) | |
Investments in Securities: | |
Beginning Balance | $ 24 |
Total Realized Gain (Loss) | (56) |
Total Unrealized Gain (Loss) | 54 |
Cost of Purchases | 3,321 |
Proceeds of Sales | (33) |
Amortization/Accretion | - |
Transfers in to Level 3 | - |
Transfers out of Level 3 | - |
Ending Balance | $ 3,310 |
The change in unrealized gain (loss) for the period attributable to Level 3 securities held at October 31, 2011 | $ - |
The information used in the above reconciliation represents fiscal year to date activity for any Investments in Securities identified as using Level 3 inputs at either the beginning or the end of the current fiscal period. Transfers in or out of Level 3 represent the beginning value of any Security or Instrument where a change in the pricing level occurred from the beginning to the end of the period. The cost of purchases and the proceeds of sales may include securities received or delivered through corporate actions or exchanges. Realized and unrealized gains (losses) disclosed in the reconciliation are included in Net Gain (Loss) on the Fund's Statement of Operations. |
Income Tax Information |
At October 31, 2011, the Fund had a capital loss carryforward of approximately $3,034,664,000 all of which will expire in fiscal 2017. Capital loss carryforwards are only available to offset future capital gains of the Fund to the extent provided by regulations and may be limited. |
See accompanying notes which are an integral part of the financial statements.
Annual Report
Statement of Assets and Liabilities
Amounts in thousands (except per-share amounts) | October 31, 2011 |
| | |
Assets | | |
Investment in securities, at value (including securities loaned of $59,345) - See accompanying schedule: Unaffiliated issuers (cost $2,215,647) | $ 2,381,854 | |
Fidelity Central Funds (cost $113,046) | 113,046 | |
Total Investments (cost $2,328,693) | | $ 2,494,900 |
Foreign currency held at value (cost $264) | | 264 |
Receivable for investments sold
Regular delivery | | 22,969 |
Delayed delivery | | 5 |
Receivable for fund shares sold | | 1,425 |
Dividends receivable | | 4,326 |
Interest receivable | | 1 |
Distributions receivable from Fidelity Central Funds | | 31 |
Prepaid expenses | | 9 |
Other receivables | | 271 |
Total assets | | 2,524,201 |
| | |
Liabilities | | |
Payable for investments purchased | $ 8,231 | |
Payable for fund shares redeemed | 6,721 | |
Accrued management fee | 1,404 | |
Distribution and service plan fees payable | 669 | |
Other affiliated payables | 640 | |
Other payables and accrued expenses | 2,569 | |
Collateral on securities loaned, at value | 65,393 | |
Total liabilities | | 85,627 |
| | |
Net Assets | | $ 2,438,574 |
Net Assets consist of: | | |
Paid in capital | | $ 5,303,272 |
Undistributed net investment income | | 26,393 |
Accumulated undistributed net realized gain (loss) on investments and foreign currency transactions | | (3,054,924) |
Net unrealized appreciation (depreciation) on investments and assets and liabilities in foreign currencies | | 163,833 |
Net Assets | | $ 2,438,574 |
See accompanying notes which are an integral part of the financial statements.
Annual Report
Financial Statements - continued
Statement of Assets and Liabilities - continued
Amounts in thousands (except per-share amounts) | October 31, 2011 |
| | |
Calculation of Maximum Offering Price Class A:
Net Asset Value and redemption price per share ($915,719 ÷ 62,674 shares) | | $ 14.61 |
| | |
Maximum offering price per share (100/94.25 of $14.61) | | $ 15.50 |
Class T:
Net Asset Value and redemption price per share ($404,046 ÷ 27,940 shares) | | $ 14.46 |
| | |
Maximum offering price per share (100/96.50 of $14.46) | | $ 14.98 |
Class B:
Net Asset Value and offering price per share ($93,512 ÷ 6,722 shares)A | | $ 13.91 |
| | |
Class C:
Net Asset Value and offering price per share ($301,931 ÷ 21,640 shares)A | | $ 13.95 |
| | |
| | |
Institutional Class:
Net Asset Value, offering price and redemption price per share ($723,366 ÷ 48,648 shares) | | $ 14.87 |
A Redemption price per share is equal to net asset value less any applicable contingent deferred sales charge.
See accompanying notes which are an integral part of the financial statements.
Annual Report
Statement of Operations
Amounts in thousands | Year ended October 31, 2011 |
| | |
Investment Income | | |
Dividends | | $ 76,910 |
Special dividends | | 12,968 |
Interest | | 2 |
Income from Fidelity Central Funds | | 2,117 |
Income before foreign taxes withheld | | 91,997 |
Less foreign taxes withheld | | (5,673) |
Total income | | 86,324 |
| | |
Expenses | | |
Management fee | $ 22,912 | |
Transfer agent fees | 8,313 | |
Distribution and service plan fees | 10,560 | |
Accounting and security lending fees | 1,390 | |
Custodian fees and expenses | 554 | |
Independent trustees' compensation | 18 | |
Registration fees | 120 | |
Audit | 113 | |
Legal | 14 | |
Interest | 1 | |
Miscellaneous | 25 | |
Total expenses before reductions | 44,020 | |
Expense reductions | (701) | 43,319 |
Net investment income (loss) | | 43,005 |
Realized and Unrealized Gain (Loss) Net realized gain (loss) on: | | |
Investment securities: | | |
Unaffiliated issuers | 251,964 | |
Foreign currency transactions | (496) | |
Total net realized gain (loss) | | 251,468 |
Change in net unrealized appreciation (depreciation) on: Investment securities (net of decrease in deferred foreign taxes of $228) | (391,817) | |
Assets and liabilities in foreign currencies | (295) | |
Total change in net unrealized appreciation (depreciation) | | (392,112) |
Net gain (loss) | | (140,644) |
Net increase (decrease) in net assets resulting from operations | | $ (97,639) |
See accompanying notes which are an integral part of the financial statements.
Annual Report
Financial Statements - continued
Statement of Changes in Net Assets
Amounts in thousands | Year ended October 31,
2011 | Year ended
October 31,
2010 |
Increase (Decrease) in Net Assets | | |
Operations | | |
Net investment income (loss) | $ 43,005 | $ 38,199 |
Net realized gain (loss) | 251,468 | 465,302 |
Change in net unrealized appreciation (depreciation) | (392,112) | (92,787) |
Net increase (decrease) in net assets resulting
from operations | (97,639) | 410,714 |
Distributions to shareholders from net investment income | (45,397) | (59,773) |
Distributions to shareholders from net realized gain | (8,026) | (3,252) |
Total distributions | (53,423) | (63,025) |
Share transactions - net increase (decrease) | (1,225,390) | (1,259,295) |
Redemption fees | 65 | 104 |
Total increase (decrease) in net assets | (1,376,387) | (911,502) |
| | |
Net Assets | | |
Beginning of period | 3,814,961 | 4,726,463 |
End of period (including undistributed net investment income of $26,393 and undistributed net investment income of $32,132, respectively) | $ 2,438,574 | $ 3,814,961 |
See accompanying notes which are an integral part of the financial statements.
Annual Report
Financial Highlights - Class A
Years ended October 31, | 2011 | 2010 | 2009 | 2008 | 2007 |
Selected Per-Share Data | | | | | |
Net asset value, beginning of period | $ 15.63 | $ 14.25 | $ 12.57 | $ 26.62 | $ 23.42 |
Income from Investment Operations | | | | | |
Net investment income (loss) C | .22 F | .14 | .17 | .36 | .31 |
Net realized and unrealized gain (loss) | (1.01) | 1.44 | 1.96 | (11.15) | 4.69 |
Total from investment operations | (.79) | 1.58 | 2.13 | (10.79) | 5.00 |
Distributions from net investment income | (.20) | (.19) | (.45) | (.24) | (.23) |
Distributions from net realized gain | (.03) | (.01) | - | (3.02) | (1.57) |
Total distributions | (.23) | (.20) | (.45) | (3.26) | (1.80) |
Redemption fees added to paid in capital C,H | - | - | - | - | - |
Net asset value, end of period | $ 14.61 | $ 15.63 | $ 14.25 | $ 12.57 | $ 26.62 |
Total Return A,B | (5.15)% | 11.17% | 18.16% | (45.95)% | 22.76% |
Ratios to Average Net Assets D,G | | | | | |
Expenses before reductions | 1.31% | 1.32% | 1.34% | 1.26% | 1.25% |
Expenses net of fee waivers, if any | 1.31% | 1.32% | 1.34% | 1.26% | 1.25% |
Expenses net of all reductions | 1.29% | 1.30% | 1.31% | 1.22% | 1.21% |
Net investment income (loss) | 1.38% F | .95% | 1.43% | 1.80% | 1.26% |
Supplemental Data | | | | | |
Net assets, end of period (in millions) | $ 916 | $ 1,302 | $ 1,662 | $ 2,004 | $ 5,774 |
Portfolio turnover rate E | 48% | 59% | 92% | 88% | 105% |
A Total returns would have been lower if certain expenses had not been reduced during the applicable periods shown.
B Total returns do not include the effect of the sales charges.
C Calculated based on average shares outstanding during the period.
D Fees and expenses of any underlying Fidelity Central Funds are not included in the Fund's expense ratio. The Fund indirectly bears its proportionate share of the expenses of any underlying Fidelity Central Funds.
E Amount does not include the portfolio activity of any underlying Fidelity Central Funds.
F Investment income per share reflects a special dividend which amounted to $.06 per share. Excluding the special dividend, the ratio of net investment income (loss) to average net assets would have been .98%.
G Expense ratios reflect operating expenses of the class. Expenses before reductions do not reflect amounts reimbursed by the investment adviser or reductions from brokerage service arrangements or reductions from other expense offset arrangements and do not represent the amount paid by the class during periods when reimbursements or reductions occur. Expenses net of fee waivers reflect expenses after reimbursement by the investment adviser but prior to reductions from brokerage service arrangements or other expense offset arrangements. Expenses net of all reductions represent the net expenses paid by the class.
H Amount represents less than $.01 per share.
See accompanying notes which are an integral part of the financial statements.
Annual Report
Financial Highlights - Class T
Years ended October 31, | 2011 | 2010 | 2009 | 2008 | 2007 |
Selected Per-Share Data | | | | | |
Net asset value, beginning of period | $ 15.47 | $ 14.11 | $ 12.42 | $ 26.30 | $ 23.17 |
Income from Investment Operations | | | | | |
Net investment income (loss) C | .18 F | .10 | .14 | .31 | .25 |
Net realized and unrealized gain (loss) | (.99) | 1.43 | 1.94 | (11.01) | 4.63 |
Total from investment operations | (.81) | 1.53 | 2.08 | (10.70) | 4.88 |
Distributions from net investment income | (.16) | (.16) | (.39) | (.16) | (.18) |
Distributions from net realized gain | (.03) | (.01) | - | (3.02) | (1.57) |
Total distributions | (.20) I | (.17) | (.39) | (3.18) | (1.75) |
Redemption fees added to paid in capital C,H | - | - | - | - | - |
Net asset value, end of period | $ 14.46 | $ 15.47 | $ 14.11 | $ 12.42 | $ 26.30 |
Total Return A,B | (5.35)% | 10.88% | 17.84% | (46.04)% | 22.43% |
Ratios to Average Net Assets D,G | | | | | |
Expenses before reductions | 1.55% | 1.55% | 1.58% | 1.49% | 1.47% |
Expenses net of fee waivers, if any | 1.55% | 1.55% | 1.58% | 1.49% | 1.47% |
Expenses net of all reductions | 1.53% | 1.53% | 1.55% | 1.44% | 1.43% |
Net investment income (loss) | 1.14% F | .71% | 1.19% | 1.57% | 1.04% |
Supplemental Data | | | | | |
Net assets, end of period (in millions) | $ 404 | $ 621 | $ 832 | $ 1,110 | $ 3,569 |
Portfolio turnover rate E | 48% | 59% | 92% | 88% | 105% |
A Total returns would have been lower if certain expenses had not been reduced during the applicable periods shown.
B Total returns do not include the effect of the sales charges.
C Calculated based on average shares outstanding during the period.
D Fees and expenses of any underlying Fidelity Central Funds are not included in the Fund's expense ratio. The Fund indirectly bears its proportionate share of the expenses of any underlying Fidelity Central Funds.
E Amount does not include the portfolio activity of any underlying Fidelity Central Funds.
F Investment income per share reflects a special dividend which amounted to $.06 per share. Excluding the special dividend, the ratio of net investment income (loss) to average net assets would have been .74%.
G Expense ratios reflect operating expenses of the class. Expenses before reductions do not reflect amounts reimbursed by the investment adviser or reductions from brokerage service arrangements or reductions from other expense offset arrangements and do not represent the amount paid by the class during periods when reimbursements or reductions occur. Expenses net of fee waivers reflect expenses after reimbursement by the investment adviser but prior to reductions from brokerage service arrangements or other expense offset arrangements. Expenses net of all reductions represent the net expenses paid by the class.
H Amount represents less than $.01 per share.
I Total distributions of $.20 per share is comprised of distributions from net investment income of $.164 and distributions from net realized gain of $.034 per share.
See accompanying notes which are an integral part of the financial statements.
Annual Report
Financial Highlights - Class B
Years ended October 31, | 2011 | 2010 | 2009 | 2008 | 2007 |
Selected Per-Share Data | | | | | |
Net asset value, beginning of period | $ 14.91 | $ 13.61 | $ 11.95 | $ 25.44 | $ 22.46 |
Income from Investment Operations | | | | | |
Net investment income (loss) C | .09 F | .02 | .08 | .18 | .10 |
Net realized and unrealized gain (loss) | (.96) | 1.38 | 1.88 | (10.62) | 4.50 |
Total from investment operations | (.87) | 1.40 | 1.96 | (10.44) | 4.60 |
Distributions from net investment income | (.10) | (.09) | (.30) | (.03) | (.05) |
Distributions from net realized gain | (.03) | (.01) | - | (3.02) | (1.57) |
Total distributions | (.13) | (.10) | (.30) | (3.05) | (1.62) |
Redemption fees added to paid in capital C,H | - | - | - | - | - |
Net asset value, end of period | $ 13.91 | $ 14.91 | $ 13.61 | $ 11.95 | $ 25.44 |
Total Return A,B | (5.89)% | 10.34% | 17.25% | (46.39)% | 21.73% |
Ratios to Average Net Assets D,G | | | | | |
Expenses before reductions | 2.08% | 2.09% | 2.10% | 2.08% | 2.08% |
Expenses net of fee waivers, if any | 2.08% | 2.09% | 2.10% | 2.08% | 2.08% |
Expenses net of all reductions | 2.06% | 2.07% | 2.07% | 2.04% | 2.04% |
Net investment income (loss) | .61% F | .18% | .67% | .97% | .42% |
Supplemental Data | | | | | |
Net assets, end of period (in millions) | $ 94 | $ 157 | $ 191 | $ 221 | $ 559 |
Portfolio turnover rate E | 48% | 59% | 92% | 88% | 105% |
A Total returns would have been lower if certain expenses had not been reduced during the applicable periods shown.
B Total returns do not include the effect of the contingent deferred sales charge.
C Calculated based on average shares outstanding during the period.
D Fees and expenses of any underlying Fidelity Central Funds are not included in the Fund's expense ratio. The Fund indirectly bears its proportionate share of the expenses of any underlying Fidelity Central Funds.
E Amount does not include the portfolio activity of any underlying Fidelity Central Funds.
F Investment income per share reflects a special dividend which amounted to $.06 per share. Excluding the special dividend, the ratio of net investment income (loss) to average net assets would have been .21%.
G Expense ratios reflect operating expenses of the class. Expenses before reductions do not reflect amounts reimbursed by the investment adviser or reductions from brokerage service arrangements or reductions from other expense offset arrangements and do not represent the amount paid by the class during periods when reimbursements or reductions occur. Expenses net of fee waivers reflect expenses after reimbursement by the investment adviser but prior to reductions from brokerage service arrangements or other expense offset arrangements. Expenses net of all reductions represent the net expenses paid by the class.
H Amount represents less than $.01 per share.
See accompanying notes which are an integral part of the financial statements.
Annual Report
Financial Highlights - Class C
Years ended October 31, | 2011 | 2010 | 2009 | 2008 | 2007 |
Selected Per-Share Data | | | | | |
Net asset value, beginning of period | $ 14.95 | $ 13.65 | $ 11.98 | $ 25.50 | $ 22.53 |
Income from Investment Operations | | | | | |
Net investment income (loss) C | .10 F | .03 | .08 | .20 | .12 |
Net realized and unrealized gain (loss) | (.96) | 1.38 | 1.89 | (10.64) | 4.50 |
Total from investment operations | (.86) | 1.41 | 1.97 | (10.44) | 4.62 |
Distributions from net investment income | (.11) | (.10) | (.30) | (.06) | (.08) |
Distributions from net realized gain | (.03) | (.01) | - | (3.02) | (1.57) |
Total distributions | (.14) | (.11) | (.30) | (3.08) | (1.65) |
Redemption fees added to paid in capital C,H | - | - | - | - | - |
Net asset value, end of period | $ 13.95 | $ 14.95 | $ 13.65 | $ 11.98 | $ 25.50 |
Total Return A,B | (5.83)% | 10.32% | 17.24% | (46.33)% | 21.81% |
Ratios to Average Net Assets D,G | | | | | |
Expenses before reductions | 2.05% | 2.06% | 2.09% | 2.01% | 2.00% |
Expenses net of fee waivers, if any | 2.05% | 2.06% | 2.09% | 2.01% | 2.00% |
Expenses net of all reductions | 2.03% | 2.04% | 2.06% | 1.97% | 1.96% |
Net investment income (loss) | .64% F | .21% | .68% | 1.04% | .51% |
Supplemental Data | | | | | |
Net assets, end of period (in millions) | $ 302 | $ 419 | $ 502 | $ 618 | $ 1,673 |
Portfolio turnover rate E | 48% | 59% | 92% | 88% | 105% |
A Total returns would have been lower if certain expenses had not been reduced during the applicable periods shown.
B Total returns do not include the effect of the contingent deferred sales charge.
C Calculated based on average shares outstanding during the period.
D Fees and expenses of any underlying Fidelity Central Funds are not included in the Fund's expense ratio. The Fund indirectly bears its proportionate share of the expenses of any underlying Fidelity Central Funds.
E Amount does not include the portfolio activity of any underlying Fidelity Central Funds.
F Investment income per share reflects a special dividend which amounted to $.06 per share. Excluding the special dividend, the ratio of net investment income (loss) to average net assets would have been .24%.
G Expense ratios reflect operating expenses of the class. Expenses before reductions do not reflect amounts reimbursed by the investment adviser or reductions from brokerage service arrangements or reductions from other expense offset arrangements and do not represent the amount paid by the class during periods when reimbursements or reductions occur. Expenses net of fee waivers reflect expenses after reimbursement by the investment adviser but prior to reductions from brokerage service arrangements or other expense offset arrangements. Expenses net of all reductions represent the net expenses paid by the class.
H Amount represents less than $.01 per share.
See accompanying notes which are an integral part of the financial statements.
Annual Report
Financial Highlights - Institutional Class
Years ended October 31, | 2011 | 2010 | 2009 | 2008 | 2007 |
Selected Per-Share Data | | | | | |
Net asset value, beginning of period | $ 15.90 | $ 14.48 | $ 12.81 | $ 27.06 | $ 23.78 |
Income from Investment Operations | | | | | |
Net investment income (loss) B | .28 E | .19 | .21 | .41 | .38 |
Net realized and unrealized gain (loss) | (1.03) | 1.47 | 1.98 | (11.34) | 4.76 |
Total from investment operations | (.75) | 1.66 | 2.19 | (10.93) | 5.14 |
Distributions from net investment income | (.25) | (.23) | (.52) | (.30) | (.29) |
Distributions from net realized gain | (.03) | (.01) | - | (3.02) | (1.57) |
Total distributions | (.28) | (.24) | (.52) | (3.32) | (1.86) |
Redemption fees added to paid in capital B,G | - | - | - | - | - |
Net asset value, end of period | $ 14.87 | $ 15.90 | $ 14.48 | $ 12.81 | $ 27.06 |
Total Return A | (4.85)% | 11.55% | 18.45% | (45.79)% | 23.07% |
Ratios to Average Net Assets C,F | | | | | |
Expenses before reductions | .99% | .99% | 1.07% | .99% | .98% |
Expenses net of fee waivers, if any | .99% | .99% | 1.07% | .99% | .98% |
Expenses net of all reductions | .97% | .97% | 1.04% | .94% | .94% |
Net investment income (loss) | 1.70% E | 1.28% | 1.70% | 2.07% | 1.53% |
Supplemental Data | | | | | |
Net assets, end of period (in millions) | $ 723 | $ 1,316 | $ 1,540 | $ 2,235 | $ 5,266 |
Portfolio turnover rate D | 48% | 59% | 92% | 88% | 105% |
A Total returns would have been lower if certain expenses had not been reduced during the applicable periods shown.
B Calculated based on average shares outstanding during the period.
C Fees and expenses of any underlying Fidelity Central Funds are not included in the Fund's expense ratio. The Fund indirectly bears its proportionate share of the expenses of any underlying Fidelity Central Funds.
D Amount does not include the portfolio activity of any underlying Fidelity Central Funds.
E Investment income per share reflects a special dividend which amounted to $.06 per share. Excluding the special dividend, the ratio of net investment income (loss) to average net assets would have been 1.30%.
F Expense ratios reflect operating expenses of the class. Expenses before reductions do not reflect amounts reimbursed by the investment adviser or reductions from brokerage service arrangements or reductions from other expense offset arrangements and do not represent the amount paid by the class during periods when reimbursements or reductions occur. Expenses net of fee waivers reflect expenses after reimbursement by the investment adviser but prior to reductions from brokerage service arrangements or other expense offset arrangements. Expenses net of all reductions represent the net expenses paid by the class.
G Amount represents less than $.01 per share.
See accompanying notes which are an integral part of the financial statements.
Annual Report
Notes to Financial Statements
For the period ended October 31, 2011
(Amounts in thousands except percentages)
1. Organization.
Fidelity Advisor Diversified International Fund (the Fund) is a fund of Fidelity Advisor Series VIII (the Trust) and is authorized to issue an unlimited number of shares. The Trust is registered under the Investment Company Act of 1940, as amended (the 1940 Act), as an open-end management investment company organized as a Massachusetts business trust.
The Fund offers Class A, Class T, Class C and Institutional Class shares, each of which, along with Class B shares, has equal rights as to assets and voting privileges. Effective after the close of business on September 1, 2010, Class B shares were closed to new accounts and additional purchases, except for exchanges and reinvestments by existing shareholders. Each class has exclusive voting rights with respect to matters that affect that class. Class B shares will automatically convert to Class A shares after a holding period of seven years from the initial date of purchase. Investment income, realized and unrealized capital gains and losses, the common expenses of the Fund, and certain fund-level expense reductions, if any, are allocated on a pro-rata basis to each class based on the relative net assets of each class to the total net assets of the Fund. Each class differs with respect to transfer agent and distribution and service plan fees incurred. Certain expense reductions may also differ by class.
2. Investments in Fidelity Central Funds.
The Fund invests in Fidelity Central Funds, which are open-end investment companies available only to other investment companies and accounts managed by Fidelity Management & Research Company (FMR) and its affiliates. The Fund's Schedule of Investments lists each of the Fidelity Central Funds held as of period end, if any, as an investment of the Fund, but does not include the underlying holdings of each Fidelity Central Fund. As an Investing Fund, the Fund indirectly bears its proportionate share of the expenses of the underlying Fidelity Central Funds.
The Money Market Central Funds seek preservation of capital and current income and are managed by Fidelity Investments Money Management, Inc. (FIMM), an affiliate of FMR.
A complete unaudited list of holdings for each Fidelity Central Fund is available upon request or at the Securities and Exchange Commission (the SEC) web site at www.sec.gov. In addition, the financial statements of the Fidelity Central Funds, which are not covered by the Fund's Report of Independent Registered Public Accounting Firm are available on the SEC web site or upon request.
Annual Report
Notes to Financial Statements - continued
(Amounts in thousands except percentages)
3. Significant Accounting Policies.
The financial statements have been prepared in conformity with accounting principles generally accepted in the United States of America (GAAP), which require management to make certain estimates and assumptions at the date of the financial statements. Actual results could differ from those estimates. Subsequent events, if any, through the date that the financial statements were issued have been evaluated in the preparation of the financial statements. The following summarizes the significant accounting policies of the Fund:
Security Valuation. Investments are valued as of 4:00 p.m. Eastern time on the last calendar day of the period. The Fund uses independent pricing services approved by the Board of Trustees to value its investments. When current market prices or quotations are not readily available or reliable, valuations may be determined in good faith in accordance with procedures adopted by the Board of Trustees. Factors used in determining value may include market or security specific events. The frequency with which these procedures are used cannot be predicted and they may be utilized to a significant extent. The value used for net asset value (NAV) calculation under these procedures may differ from published prices for the same securities.
The Fund categorizes the inputs to valuation techniques used to value its investments into a disclosure hierarchy consisting of three levels as shown below:
Level 1 - quoted prices in active markets for identical investments
Level 2 - other significant observable inputs (including quoted prices for similar investments, interest rates, prepayment speeds, etc.)
Level 3 - unobservable inputs (including the Fund's own assumptions based on the best information available)
Changes in valuation techniques may result in transfers in or out of an assigned level within the disclosure hierarchy. The aggregate value of investments by input level, as of October 31, 2011, as well as a roll forward of Level 3 securities, is included at the end of the Fund's Schedule of Investments. Valuation techniques used to value the Fund's investments by major category are as follows:
Equity securities, including restricted securities, for which market quotations are readily available, are valued at the last reported sale price or official closing price as reported by an independent pricing service on the primary market or exchange on which they are traded and are categorized as Level 1 in the hierarchy. In the event there were no sales during the day or closing prices are not available, securities are valued at the last quoted bid price or may be valued using the last available price and are generally categorized as Level 2 in the hierarchy. For foreign equity securities, when significant market or security specific events arise, comparisons to the valuation of American Depositary Receipts
Annual Report
3. Significant Accounting Policies - continued
Security Valuation - continued
(ADRs), futures contracts, Exchange-traded funds (ETFs) and certain indexes as well as quoted prices for similar securities are used and are categorized as Level 2 in the hierarchy in these circumstances. Utilizing these techniques may result in transfers between Level 1 and Level 2. For restricted equity securities and private placements where observable inputs are limited, assumptions about market activity and risk are used and are categorized as Level 3 in the hierarchy.
Debt securities, including restricted securities, are valued based on evaluated prices received from independent pricing services or from dealers who make markets in such securities. For master notes, pricing services utilize matrix pricing which considers yield or price of bonds of comparable quality, coupon, maturity and type as well as dealer supplied prices and are generally categorized as Level 2 in the hierarchy. When independent prices are unavailable or unreliable, debt securities may be valued utilizing pricing matrices which consider similar factors that would be used by independent pricing services. These are generally categorized as Level 2 in the hierarchy but may be Level 3 depending on the circumstances.
Investments in open-end mutual funds, including the Fidelity Central Funds, are valued at their closing net asset value each business day and are categorized as Level 1 in the hierarchy.
Foreign Currency. The Fund may use foreign currency contracts to facilitate transactions in foreign-denominated securities. Gains and losses from these transactions may arise from changes in the value of the foreign currency or if the counterparties do not perform under the contracts' terms.
Foreign-denominated assets, including investment securities, and liabilities are translated into U.S. dollars at the exchange rate at period end. Purchases and sales of investment securities, income and dividends received and expenses denominated in foreign currencies are translated into U.S. dollars at the exchange rate in effect on the transaction date.
The effects of exchange rate fluctuations on investments are included with the net realized and unrealized gain (loss) on investment securities. Other foreign currency transactions resulting in realized and unrealized gain (loss) are disclosed separately.
Annual Report
Notes to Financial Statements - continued
(Amounts in thousands except percentages)
3. Significant Accounting Policies - continued
Investment Transactions and Income. For financial reporting purposes, the Fund's investment holdings and NAV include trades executed through the end of the last business day of the period. The NAV per share for processing shareholder transactions is calculated as of the close of business of the New York Stock Exchange (NYSE), normally 4:00 p.m. Eastern time and includes trades executed through the end of the prior business day. Gains and losses on securities sold are determined on the basis of identified cost and may include proceeds received from litigation. Dividend income is recorded on the ex-dividend date, except for certain dividends from foreign securities where the ex-dividend date may have passed, which are recorded as soon as the Fund is informed of the ex-dividend date. Non-cash dividends included in dividend income, if any, are recorded at the fair market value of the securities received. Distributions received on securities that represent a return of capital or capital gain are recorded as a reduction of cost of investments and/or as a realized gain. The Fund estimates the components of distributions received that may be considered return of capital distributions or capital gain distributions. Large, non-recurring dividends recognized by the Fund are presented separately on the Statement of Operations as "Special Dividends" and the impact of these dividends is presented in the Financial Highlights. Interest income and distributions from the Fidelity Central Funds are accrued as earned. Interest income includes coupon interest and amortization of premium and accretion of discount on debt securities. Investment income is recorded net of foreign taxes withheld where recovery of such taxes is uncertain.
Expenses. Expenses directly attributable to a fund are charged to that fund. Expenses attributable to more than one fund are allocated among the respective funds on the basis of relative net assets or other appropriate methods. Expense estimates are accrued in the period to which they relate and adjustments are made when actual amounts are known.
Deferred Trustee Compensation. Under a Deferred Compensation Plan (the Plan), independent Trustees may elect to defer receipt of a portion of their annual compensation. Deferred amounts are invested in a cross-section of Fidelity funds, are marked-to-market and remain in the Fund until distributed in accordance with the Plan. The investment of deferred amounts and the offsetting payable to the Trustees are included in the accompanying Statement of Assets and Liabilities.
Income Tax Information and Distributions to Shareholders. Each year, the Fund intends to qualify as a regulated investment company, including distributing substantially all of its taxable income and realized gains under Subchapter M of the Internal Revenue Code and filing its U.S. federal tax return. As a result, no provision for income taxes is required. As of October 31, 2011, the Fund did not have any unrecognized tax benefits in the financial statements. A fund's federal tax return is subject to examination by the Internal Revenue Service (IRS) for a period of three years. Foreign taxes are provided for based on the Fund's understanding of the tax rules and rates that exist in the foreign markets in which it invests.
Annual Report
3. Significant Accounting Policies - continued
Income Tax Information and Distributions to Shareholders - continued
Distributions are declared and recorded on the ex-dividend date. Income dividends and capital gain distributions are declared separately for each class. Income and capital gain distributions are determined in accordance with income tax regulations, which may differ from GAAP.
Capital accounts within the financial statements are adjusted for permanent book-tax differences. These adjustments have no impact on net assets or the results of operations. Temporary book-tax differences will reverse in a subsequent period.
Book-tax differences are primarily due to foreign currency transactions, passive foreign investment companies (PFIC), deferred trustees compensation, capital loss carryforwards and losses deferred due to wash sales.
The federal tax cost of investment securities and unrealized appreciation (depreciation) as of period end were as follows:
Gross unrealized appreciation | $ 376,198 |
Gross unrealized depreciation | (230,250) |
Net unrealized appreciation (depreciation) on securities and other investments | $ 145,948 |
| |
Tax Cost | $ 2,348,952 |
The tax-based components of distributable earnings as of period end were as follows:
Undistributed ordinary income | $ 26,452 |
Capital loss carryforward | $ (3,034,664) |
Net unrealized appreciation (depreciation) | $ 145,969 |
Under the recently enacted Regulated Investment Company Modernization Act of 2010 (the Act), the Fund will be permitted to carry forward capital losses incurred in taxable years beginning after December 22, 2010 for an unlimited period. However, any losses incurred during those future taxable years will be required to be utilized prior to any losses incurred in pre-enactment taxable years, which generally expire after eight years from when they are incurred. Additionally, post-enactment capital losses that are carried forward will retain their character as either short-term or long-term capital losses rather than being considered all short-term as under previous law. The Fund's first fiscal year end subject to the Act will be October 31, 2012.
Annual Report
Notes to Financial Statements - continued
(Amounts in thousands except percentages)
3. Significant Accounting Policies - continued
Income Tax Information and Distributions to Shareholders - continued
The tax character of distributions paid was as follows:
| October 31, 2011 | October 31, 2010 |
Ordinary Income | $ 53,423 | $ 63,025 |
Short-Term Trading (Redemption) Fees. Shares held by investors in the Fund less than 30 days are subject to a redemption fee equal to 1.00% of the net asset value of shares redeemed. All redemption fees, which reduce the proceeds of the shareholder redemption, are retained by the Fund and accounted for as an addition to paid in capital.
New Accounting Pronouncement. In May 2011, the Financial Accounting Standards Board issued Accounting Standard Update No. 2011-04, Fair Value Measurement (Topic 820) - Amendments to Achieve Common Fair Value Measurement and Disclosure Requirements in U.S. GAAP and IFRSs. The update changes the wording used to describe the requirements in GAAP for measuring fair value and for disclosing information about fair value measurements. The update is effective during interim and annual periods beginning after December 15, 2011. Management is currently evaluating the impact of the update's adoption on the Fund's financial statement disclosures.
4. Operating Policies.
Delayed Delivery Transactions and When-Issued Securities. During the period, the Fund transacted in securities on a delayed delivery or when-issued basis. Payment and delivery may take place after the customary settlement period for that security. The price of the underlying securities and the date when the securities will be delivered and paid for are fixed at the time the transaction is negotiated. During the time a delayed delivery sell is outstanding, the contract is marked-to-market daily and equivalent deliverable securities are held for the transaction. The Fund may receive compensation for interest forgone in the purchase of a delayed delivery or when-issued security. With respect to purchase commitments, the Fund identifies securities as segregated in its records with a value at least equal to the amount of the commitment. Losses may arise due to changes in the value of the underlying securities or if the counterparty does not perform under the contract's terms, or if the issuer does not issue the securities due to political, economic, or other factors.
Restricted Securities. The Fund may invest in securities that are subject to legal or contractual restrictions on resale. These securities generally may be resold in transactions exempt from registration or to the public if the securities are registered. Disposal of these securities may involve time-consuming negotiations and expense, and prompt sale at an acceptable price may be difficult. Information regarding restricted securities is included at the end of the Fund's Schedule of Investments.
Annual Report
5. Purchases and Sales of Investments.
Purchases and sales of securities, other than short-term securities, aggregated $1,545,645 and $2,749,361, respectively.
6. Fees and Other Transactions with Affiliates.
Management Fee. FMR and its affiliates provide the Fund with investment management related services for which the Fund pays a monthly management fee. The management fee is the sum of an individual fund fee rate that is based on an annual rate of .45% of the Fund's average net assets and a group fee rate that averaged .26% during the period. The group fee rate is based upon the average net assets of all the mutual funds advised by FMR. The group fee rate decreases as assets under management increase and increases as assets under management decrease. For the period, the total annual management fee rate was .71% of the Fund's average net assets.
Distribution and Service Plan Fees. In accordance with Rule 12b-1 of the 1940 Act, the Fund has adopted separate Distribution and Service Plans for each class of shares, except for the Institutional Class. Certain classes pay Fidelity Distributors Corporation (FDC), an affiliate of FMR, separate Distribution and Service Fees, each of which is based on an annual percentage of each class' average net assets. In addition, FDC may pay financial intermediaries for selling shares of the Fund and providing shareholder support services. For the period, the Distribution and Service Fee rates, total fees and amounts retained by FDC were as follows:
| Distribution
Fee | Service
Fee | Total
Fees | Retained
by FDC |
Class A | -% | .25% | $ 2,863 | $ 48 |
Class T | .25% | .25% | 2,660 | 15 |
Class B | .75% | .25% | 1,285 | 965 |
Class C | .75% | .25% | 3,752 | 153 |
| | | $ 10,560 | $ 1,181 |
Sales Load. FDC may receive a front-end sales charge of up to 5.75% for selling Class A shares, and 3.50% for selling Class T shares, some of which is paid to financial intermediaries for selling shares of the Fund. Depending on the holding period, FDC may receive contingent deferred sales charges levied on Class A, Class T, Class B, and Class C redemptions. The deferred sales charges range from 5% to 1% for Class B, 1% for Class C, 1.00% for certain purchases of Class A shares and .25% for certain purchases of Class T shares.
Annual Report
Notes to Financial Statements - continued
(Amounts in thousands except percentages)
6. Fees and Other Transactions with Affiliates - continued
Sales Load - continued
For the period, sales charge amounts retained by FDC were as follows:
| Retained
by FDC |
Class A | $ 120 |
Class T | 32 |
Class B* | 208 |
Class C* | 15 |
| $ 375 |
* When Class B and Class C shares are initially sold, FDC pays commissions from its own resources to financial intermediaries through which the sales are made.
Transfer Agent Fees. Fidelity Investments Institutional Operations Company, Inc. (FIIOC), an affiliate of FMR, is the transfer, dividend disbursing and shareholder servicing agent for each class of the Fund. FIIOC receives account fees and asset-based fees that vary according to the account size and type of account of the shareholders of the respective classes of the Fund. FIIOC pays for typesetting, printing and mailing of shareholder reports, except proxy statements. For the period, transfer agent fees for each class were as follows:
| Amount | % of
Average
Net Assets |
Class A | $ 3,204 | .28 |
Class T | 1,482 | .28 |
Class B | 388 | .30 |
Class C | 1,004 | .27 |
Institutional Class | 2,235 | .21 |
| $ 8,313 | |
Accounting and Security Lending Fees. Fidelity Service Company, Inc. (FSC), an affiliate of FMR, maintains the Fund's accounting records. The accounting fee is based on the level of average net assets for the month. Under a separate contract, FSC administers the security lending program. The security lending fee is based on the number and duration of lending transactions.
Brokerage Commissions. The Fund placed a portion of its portfolio transactions with brokerage firms which are affiliates of the investment adviser. The commissions paid to these affiliated firms were $14 for the period.
Annual Report
6. Fees and Other Transactions with Affiliates - continued
Interfund Lending Program. Pursuant to an Exemptive Order issued by the SEC, the Fund, along with other registered investment companies having management contracts with FMR, may participate in an interfund lending program. This program provides an alternative credit facility allowing the funds to borrow from, or lend money to, other participating affiliated funds. At period end, there were no interfund loans outstanding. The Fund's activity in this program during the period for which loans were outstanding was as follows:
Borrower or Lender | Average Daily
Loan Balance | Weighted Average Interest Rate | Interest
Expense |
Borrower | $ 9,674 | .33% | $ 1 |
7. Committed Line of Credit.
The Fund participates with other funds managed by FMR or an affiliate in a $4.0 billion credit facility (the "line of credit") to be utilized for temporary or emergency purposes to fund shareholder redemptions or for other short-term liquidity purposes. The Fund has agreed to pay commitment fees on its pro-rata portion of the line of credit, which amounted to $10 and is reflected in Miscellaneous expenses on the Statement of Operations. During the period, there were no borrowings on this line of credit.
8. Security Lending.
The Fund lends portfolio securities through a lending agent from time to time in order to earn additional income. For equity securities, a lending agent is used and may loan securities to certain qualified borrowers, including Fidelity Capital Markets (FCM), a broker-dealer affiliated with the Fund. On the settlement date of the loan, the Fund receives collateral (in the form of U.S. Treasury obligations, letters of credit and/or cash) against the loaned securities and maintains collateral in an amount not less than 100% of the market value of the loaned securities during the period of the loan. The market value of the loaned securities is determined at the close of business of the Fund and any additional required collateral is delivered to the Fund on the next business day. If the borrower defaults on its obligation to return the securities loaned because of insolvency or other reasons, a fund could experience delays and costs in recovering the securities loaned or in gaining access to the collateral. Any cash collateral received is invested in the Fidelity Securities Lending Cash Central Fund. The value of loaned securities and cash collateral at period end are disclosed on the Fund's Statement of Assets and Liabilities. At period end, there were no security loans outstanding with FCM. Security lending income represents the income earned on investing cash collateral, less rebates paid to borrowers and any lending agent fees associated with the loan, plus any premium
Annual Report
Notes to Financial Statements - continued
(Amounts in thousands except percentages)
8. Security Lending - continued
payments received for lending certain types of securities. Security lending income is presented in the Statement of Operations as a component of income from Fidelity Central Funds. Total security lending income during the period amounted to $2,043, including eighty-eight dollars from securities loaned to FCM.
9. Expense Reductions.
Many of the brokers with whom FMR places trades on behalf of the Fund provided services to the Fund in addition to trade execution. These services included payments of certain expenses on behalf of the Fund totaling $700 for the period. In addition, through arrangements with the Fund's custodian, credits realized as a result of uninvested cash balances were used to reduce the Fund's expenses. During the period, these credits reduced the Fund's custody expenses by $1.
10. Distributions to Shareholders.
Distributions to shareholders of each class were as follows:
Years ended October 31, | 2011 | 2010 |
From net investment income | | |
Class A | $ 15,976 | $ 21,908 |
Class T | 6,296 | 9,175 |
Class B | 993 | 1,280 |
Class C | 2,886 | 3,424 |
Institutional Class | 19,246 | 23,986 |
Total | $ 45,397 | $ 59,773 |
From net realized gain | | |
Class A | $ 2,738 | $ 1,135 |
Class T | 1,311 | 581 |
Class B | 343 | 138 |
Class C | 927 | 360 |
Institutional Class | 2,707 | 1,038 |
Total | $ 8,026 | $ 3,252 |
Annual Report
11. Share Transactions.
Transactions for each class of shares were as follows:
| Shares | Dollars |
Years ended October 31, | 2011 | 2010 | 2011 | 2010 |
Class A | | | | |
Shares sold | 9,002 | 11,857 | $ 142,807 | $ 171,401 |
Reinvestment of distributions | 1,034 | 1,361 | 16,424 | 20,356 |
Shares redeemed | (30,677) | (46,493) | (486,880) | (670,244) |
Net increase (decrease) | (20,641) | (33,275) | $ (327,649) | $ (478,487) |
Class T | | | | |
Shares sold | 2,789 | 5,521 | $ 43,918 | $ 79,294 |
Reinvestment of distributions | 447 | 636 | 7,039 | 9,432 |
Shares redeemed | (15,458) | (24,938) | (243,511) | (355,762) |
Net increase (decrease) | (12,222) | (18,781) | $ (192,554) | $ (267,036) |
Class B | | | | |
Shares sold | 58 | 579 | $ 888 | $ 8,025 |
Reinvestment of distributions | 75 | 88 | 1,145 | 1,270 |
Shares redeemed | (3,940) | (4,186) | (60,055) | (57,671) |
Net increase (decrease) | (3,807) | (3,519) | $ (58,022) | $ (48,376) |
Class C | | | | |
Shares sold | 1,225 | 1,779 | $ 18,824 | $ 24,719 |
Reinvestment of distributions | 191 | 201 | 2,917 | 2,898 |
Shares redeemed | (7,773) | (10,773) | (118,247) | (148,900) |
Net increase (decrease) | (6,357) | (8,793) | $ (96,506) | $ (121,283) |
Institutional Class | | | | |
Shares sold | 10,009 | 22,171 | $ 160,916 | $ 322,782 |
Reinvestment of distributions | 1,047 | 1,330 | 16,863 | 20,174 |
Shares redeemed | (45,174) | (47,045) | (728,438) | (687,069) |
Net increase (decrease) | (34,118) | (23,544) | $ (550,659) | $ (344,113) |
12. Other.
The Fund's organizational documents provide former and current trustees and officers with a limited indemnification against liabilities arising in connection with the performance of their duties to the Fund. In the normal course of business, the Fund may also enter into contracts that provide general indemnifications. The Fund's maximum exposure under these arrangements is unknown as this would be dependent on future claims that may be made against the Fund. The risk of material loss from such claims is considered remote.
Annual Report
To the Trustees of Fidelity Advisor Series VIII and the Shareholders of Fidelity Advisor Diversified International Fund:
In our opinion, the accompanying statement of assets and liabilities, including the schedule of investments, and the related statements of operations and of changes in net assets and the financial highlights present fairly, in all material respects, the financial position of Fidelity Advisor Diversified International Fund (a fund of Fidelity Advisor Series VIII) at October 31, 2011, the results of its operations for the year then ended, the changes in its net assets for each of the two years in the period then ended and the financial highlights for each of the five years in the period then ended, in conformity with accounting principles generally accepted in the United States of America. These financial statements and financial highlights (hereafter referred to as "financial statements") are the responsibility of the Fidelity Advisor Diversified International Fund's management. Our responsibility is to express an opinion on these financial statements based on our audits. We conducted our audits of these financial statements in accordance with the standards of the Public Company Accounting Oversight Board (United States). Those standards require that we plan and perform the audit to obtain reasonable assurance about whether the financial statements are free of material misstatement. An audit includes examining, on a test basis, evidence supporting the amounts and disclosures in the financial statements, assessing the accounting principles used and significant estimates made by management, and evaluating the overall financial statement presentation. We believe that our audits, which included confirmation of securities at October 31, 2011 by correspondence with the custodian and brokers, provide a reasonable basis for our opinion.
/s/ PricewaterhouseCoopers LLP
PricewaterhouseCoopers LLP
Boston, Massachusetts
December 12, 2011
Annual Report
The Trustees, Members of the Advisory Board, and executive officers of the trust and fund, as applicable, are listed below. The Board of Trustees governs the fund and is responsible for protecting the interests of shareholders. The Trustees are experienced executives who meet periodically throughout the year to oversee the fund's activities, review contractual arrangements with companies that provide services to the fund, oversee management of the risks associated with such activities and contractual arrangements, and review the fund's performance. Except for James C. Curvey, each of the Trustees oversees 226 funds advised by FMR or an affiliate. Mr. Curvey oversees 429 funds advised by FMR or an affiliate.
The Trustees hold office without limit in time except that (a) any Trustee may resign; (b) any Trustee may be removed by written instrument, signed by at least two-thirds of the number of Trustees prior to such removal; (c) any Trustee who requests to be retired or who has become incapacitated by illness or injury may be retired by written instrument signed by a majority of the other Trustees; and (d) any Trustee may be removed at any special meeting of shareholders by a two-thirds vote of the outstanding voting securities of the trust. Each Trustee who is not an interested person (as defined in the 1940 Act) (Independent Trustee), shall retire not later than the last day of the calendar year in which his or her 75th birthday occurs. The Independent Trustees may waive this mandatory retirement age policy with respect to individual Trustees. The executive officers and Advisory Board Members hold office without limit in time, except that any officer and Advisory Board Member may resign or may be removed by a vote of a majority of the Trustees at any regular meeting or any special meeting of the Trustees. Except as indicated, each individual has held the office shown or other offices in the same company for the past five years.
Experience, Skills, Attributes, and Qualifications of the Fund's Trustees. The Governance and Nominating Committee has adopted a statement of policy that describes the experience, qualifications, attributes, and skills that are necessary and desirable for potential Independent Trustee candidates (Statement of Policy). The Board believes that each Trustee satisfied at the time he or she was initially elected or appointed a Trustee, and continues to satisfy, the standards contemplated by the Statement of Policy. The Governance and Nominating Committee also engages professional search firms to help identify potential Independent Trustee candidates who have the experience, qualifications, attributes, and skills consistent with the Statement of Policy. From time to time, additional criteria based on the composition and skills of the current Independent Trustees, as well as experience or skills that may be appropriate in light of future changes to board composition, business conditions, and regulatory or other developments, have also been considered by the professional search firms and the Governance and Nominating Committee. In addition, the Board takes into account the Trustees' commitment and participation in Board and committee meetings, as well as their leadership of standing and ad hoc committees throughout their tenure.
In determining that a particular Trustee was and continues to be qualified to serve as a Trustee, the Board has considered a variety of criteria, none of which, in isolation, was controlling. The Board believes that, collectively, the Trustees have balanced and diverse experience, qualifications, attributes, and skills, which allow the Board to operate effectively in governing the fund and protecting the interests of shareholders. Information about the specific experience, skills, attributes, and qualifications of each Trustee, which in each case led to the Board's conclusion that the Trustee should serve (or continue to serve) as a trustee of the fund, is provided below.
Annual Report
Trustees and Officers - continued
Board Structure and Oversight Function. James C. Curvey is an interested person (as defined in the 1940 Act) and currently serves as Acting Chairman. The Trustees have determined that an interested Chairman is appropriate and benefits shareholders because an interested Chairman has a personal and professional stake in the quality and continuity of services provided to the fund. Independent Trustees exercise their informed business judgment to appoint an individual of their choosing to serve as Chairman, regardless of whether the Trustee happens to be independent or a member of management. The Independent Trustees have determined that they can act independently and effectively without having an Independent Trustee serve as Chairman and that a key structural component for assuring that they are in a position to do so is for the Independent Trustees to constitute a substantial majority for the Board. The Independent Trustees also regularly meet in executive session. Ned C. Lautenbach serves as Chairman of the Independent Trustees and as such (i) acts as a liaison between the Independent Trustees and management with respect to matters important to the Independent Trustees and (ii) with management prepares agendas for Board meetings.
Fidelity funds are overseen by different Boards of Trustees. The fund's Board oversees Fidelity's equity and high income funds and another Board oversees Fidelity's investment-grade bond, money market, and asset allocation funds. The asset allocation funds may invest in Fidelity funds overseen by the fund's Board. The use of separate Boards, each with its own committee structure, allows the Trustees of each group of Fidelity funds to focus on the unique issues of the funds they oversee, including common research, investment, and operational issues. On occasion, the separate Boards establish joint committees to address issues of overlapping consequences for the Fidelity funds overseen by each Board.
The Trustees operate using a system of committees to facilitate the timely and efficient consideration of all matters of importance to the Trustees, the fund, and fund shareholders and to facilitate compliance with legal and regulatory requirements and oversight of the fund's activities and associated risks. The Board, acting through its committees, has charged FMR and its affiliates with (i) identifying events or circumstances the occurrence of which could have demonstrably adverse effects on the fund's business and/or reputation; (ii) implementing processes and controls to lessen the possibility that such events or circumstances occur or to mitigate the effects of such events or circumstances if they do occur; and (iii) creating and maintaining a system designed to evaluate continuously business and market conditions in order to facilitate the identification and implementation processes described in (i) and (ii) above. Because the day-to-day operations and activities of the fund are carried out by or through FMR, its affiliates and other service providers, the fund's exposure to risks is mitigated but not eliminated by the processes overseen by the Trustees. While each of the Board's committees has responsibility for overseeing different aspects of the fund's activities, oversight is exercised primarily through the Operations, Audit, and Compliance Committees. In addition, the Independent Trustees have worked with FMR to enhance the Board's oversight of investment and financial risks, legal and regulatory risks, technology risks, and operational risks, including the development of additional risk reporting to the Board. For example, a working group comprised of Independent Trustees and FMR has worked and continues to work to review the Fidelity funds' valuation-related activities, reporting and risk management. Appropriate personnel, including but not limited to the fund's Chief Compliance Officer (CCO), FMR's internal auditor, the independent accountants, the fund's Treasurer and portfolio management personnel, make periodic reports to the Board's committees, as appropriate, including an annual review of FMR's risk management program for the Fidelity funds. The responsibilities of each standing committee, including their oversight responsibilities, are described further under "Standing Committees of the Fund's Trustees."
Annual Report
The fund's Statement of Additional Information (SAI) includes more information about the Trustees. To request a free copy, call Fidelity at 1-877-208-0098.
Interested Trustees*:
Correspondence intended for each Trustee who is an interested person may be sent to Fidelity Investments, 82 Devonshire Street, Boston, Massachusetts 02109.
Name, Age; Principal Occupations and Other Relevant Experience+ |
James C. Curvey (76) |
| Year of Election or Appointment: 2007 Mr. Curvey is Trustee and Acting Chairman of the Board of Trustees of certain Trusts. Mr. Curvey also serves as Trustee (2007-present) of other investment companies advised by FMR. Mr. Curvey is a Director of Fidelity Investments Money Management, Inc. (2009-present), Director of Fidelity Research & Analysis Co. (2009-present) and Director of FMR and FMR Co., Inc. (2007-present). Mr. Curvey is also Vice Chairman (2007-present) and Director of FMR LLC. In addition, Mr. Curvey serves as an Overseer for the Boston Symphony Orchestra and a member of the Trustees of Villanova University. Previously, Mr. Curvey was the Vice Chairman (2006-2007) and Director (2000-2007) of FMR Corp. |
Ronald P. O'Hanley (54) |
| Year of Election or Appointment: 2011 Mr. O'Hanley is Director of FMR Co., Inc. (2010-present), Director of Fidelity Investments Money Management, Inc. (2010-present), Director of Fidelity Research & Analysis Company (2010-present), President of Fidelity Asset Management and Corporate Services and a member of Fidelity's Executive Committee (2010-present). Previously, Mr. O'Hanley served as President and Chief Executive Officer of BNY Mellon Asset Management (2007-2010). Mr. O'Hanley also served as Vice Chairman of Bank New York Mellon Corp. and a member of that firm's Executive Committee. Prior to the 2007 merger of The Bank of New York and Mellon Financial Corporation, he was Vice Chairman of Mellon Financial Corporation and President and Chief Executive Officer of Mellon Asset Management. He joined Mellon in February 1997. Mr. O'Hanley currently serves as Chairman of the Boston Public Library Foundation Board of Directors and sits on the Board of Directors of Beth Israel Deaconess Medical Center, the Board of Trustees of the Marine Biological Laboratory and the Advisory Board of the Maxwell School of Citizenship and Public Administration at Syracuse University. Mr. O'Hanley also chairs the Council on Asset Management for the Financial Services Roundtable and is a member of the Board of Directors of Institutional Investor's U.S. Institute. |
* Trustees have been determined to be "Interested Trustees" by virtue of, among other things, their affiliation with the trust or various entities under common control with FMR.
+ The information above includes each Trustee's principal occupation during the last five years and other information relating to the experience, attributes, and skills relevant to each Trustee's qualifications to serve as a Trustee, which led to the conclusion that each Trustee should serve as a Trustee for the fund.
Annual Report
Independent Trustees:
Correspondence intended for each Independent Trustee (that is, the Trustees other than the Interested Trustees) may be sent to Fidelity Investments, P.O. Box 55235, Boston, Massachusetts 02205-5235.
Name, Age; Principal Occupations and Other Relevant Experience+ |
Dennis J. Dirks (63) |
| Year of Election or Appointment: 2005 Prior to his retirement in May 2003, Mr. Dirks was Chief Operating Officer and a member of the Board of The Depository Trust & Clearing Corporation (DTCC). He also served as President, Chief Operating Officer, and Board member of The Depository Trust Company (DTC) and President and Board member of the National Securities Clearing Corporation (NSCC). In addition, Mr. Dirks served as Chief Executive Officer and Board member of the Government Securities Clearing Corporation, Chief Executive Officer and Board member of the Mortgage-Backed Securities Clearing Corporation, as a Trustee and a member of the Finance Committee of Manhattan College (2005-2008), and as a Trustee and a member of the Finance Committee of AHRC of Nassau County (2006-2008). Mr. Dirks is a member of the Independent Directors Council (IDC) Governing Council (2010-Present) and Board of Directors for The Brookville Center for Children's Services, Inc. (2009-present). |
Alan J. Lacy (58) |
| Year of Election or Appointment: 2008 Mr. Lacy serves as Senior Adviser (2007-present) of Oak Hill Capital Partners, L.P. (private equity). Mr. Lacy also served as Chief Executive Officer (2000-2005) and Vice Chairman (2005-2006) of Sears Holdings Corporation and Sears, Roebuck and Co. (retail). In addition, Mr. Lacy serves as a member of the Board of Directors of Dave & Buster's, Inc. (restaurant and entertainment complexes, 2010-present), The Hillman Companies, Inc. (hardware wholesalers, 2010-present), and Bristol-Myers Squibb Company (global pharmaceuticals, 2007-present). Mr. Lacy is a member of the Board of Trustees of The National Parks Conservation Association (2006-Present). Previously, Mr. Lacy served as Chairman of the Board of Trustees of the National Parks Conservation Association (2008-2011) and as a member of the Board of Directors for the Western Union Company (global money transfer, 2006-2011). |
Ned C. Lautenbach (67) |
| Year of Election or Appointment: 2000 Mr. Lautenbach is Chairman of the Independent Trustees of the Equity and High Income Funds (2006-present). Mr. Lautenbach currently serves as the Lead Director of the Eaton Corporation Board of Directors (diversified industrial, 1997-present). Mr. Lautenbach is also a member of the Board of Directors of the Philharmonic Center for the Arts in Naples, Florida (1999-present); a member of the Board of Trustees of Fairfield University (2005-present); and a member of the Council on Foreign Relations (1994-present). Previously, Mr. Lautenbach was a Partner/Advisory Partner at Clayton, Dubilier & Rice, LLC (private equity investment, 1998-2010), as well as a Director of Sony Corporation (2006-2007). |
Joseph Mauriello (67) |
| Year of Election or Appointment: 2008 Prior to his retirement in January 2006, Mr. Mauriello served in numerous senior management positions including Deputy Chairman and Chief Operating Officer (2004-2005), and Vice Chairman of Financial Services (2002-2004) of KPMG LLP US (professional services, 1965-2005). Mr. Mauriello currently serves as a member of the Board of Directors of XL Group plc. (global insurance and re-insurance, 2006-present) and of Arcadia Resources Inc. (health care services and products, 2007-present). Previously, Mr. Mauriello served as a Director of the Hamilton Funds of the Bank of New York (2006-2007). |
Robert W. Selander (61) |
| Year of Election or Appointment: 2011 Previously, Mr. Selander served as a Member of the Advisory Board of Fidelity's Equity and High Income Funds (2011), Executive Vice Chairman (2010), Chief Executive Officer (2009-2010), and President and Chief Executive Officer (1997-2009) of Mastercard, Inc. |
Cornelia M. Small (67) |
| Year of Election or Appointment: 2005 Ms. Small is a member of the Board of Directors of the Teagle Foundation (2009-present). Ms. Small is also a member of the Investment Committee, and Chair (2008-present) and a member of the Board of Trustees of Smith College. In addition, Ms. Small serves on the Investment Committee of the Berkshire Taconic Community Foundation (2008-present). Previously, Ms. Small served as Chairperson of the Investment Committee (2002-2008) of Smith College. In addition, Ms. Small served as Chief Investment Officer, Director of Global Equity Investments, and a member of the Board of Directors of Scudder, Stevens & Clark and Scudder Kemper Investments. |
William S. Stavropoulos (72) |
| Year of Election or Appointment: 2001 Mr. Stavropoulos is Vice Chairman of the Independent Trustees of the Equity and High Income Funds (2006-present). Mr. Stavropoulos serves as President and Founder of the Michigan Baseball Foundation, the Great Lakes Loons (2007-present). Mr. Stavropoulos is Chairman Emeritus of the Board of Directors of The Dow Chemical Company, where he previously served in numerous senior management positions, including President, CEO (1995-2000; 2002-2004), Chairman of the Executive Committee (2000-2006), and as a member of the Board of Directors (1990-2006). Currently, Mr. Stavropoulos is Chairman of Univar (global distributor of commodity and specialty chemicals, 2010-present), a Director of Teradata Corporation (data warehousing and technology solutions, 2008-present), Chemical Financial Corporation, Maersk Inc. (industrial conglomerate), Tyco International, Inc. (multinational manufacturing and services, 2007-present), and a member of the Advisory Board for Metalmark Capital (private equity investment, 2005-present). Mr. Stavropoulos is a special advisor to Clayton, Dubilier & Rice, LLC (private equity investment). In addition, Mr. Stavropoulos is a member of the University of Notre Dame Advisory Council for the College of Science. |
David M. Thomas (62) |
| Year of Election or Appointment: 2008 Previously, Mr. Thomas served as Executive Chairman (2005-2006) and Chairman and Chief Executive Officer (2000-2005) of IMS Health, Inc. (pharmaceutical and healthcare information solutions). In addition, Mr. Thomas serves as a member of the Board of Directors of Fortune Brands, Inc. (consumer products), and Interpublic Group of Companies, Inc. (marketing communication, 2004-present). |
Michael E. Wiley (61) |
| Year of Election or Appointment: 2008 Mr. Wiley also serves as a Director of Asia Pacific Exploration Consolidated (international oil and gas exploration and production, 2008-present). Mr. Wiley serves as a Director of Tesoro Corporation (independent oil refiner and marketer, 2005-present), and a Director of Bill Barrett Corporation (exploration and production, 2005-present). In addition, Mr. Wiley also serves as a Director of Post Oak Bank (privately-held bank, 2004-present). Previously, Mr. Wiley served as a member of the Board of Trustees of the University of Tulsa (2000-2006; 2007-2010), as a Senior Energy Advisor of Katzenbach Partners, LLC (consulting, 2006-2007), as an Advisory Director of Riverstone Holdings (private investment), Chairman, President, and CEO of Baker Hughes, Inc. (oilfield services, 2000-2004), and as Director of Spinnaker Exploration Company (exploration and production, 2001-2005). |
Annual Report
Trustees and Officers - continued
+ The information above includes each Trustee's principal occupation during the last five years and other information relating to the experience, attributes, and skills relevant to each Trustee's qualifications to serve as a Trustee, which led to the conclusion that each Trustee should serve as a Trustee for the fund.
Advisory Board Members and Executive Officers:
Correspondence intended for each executive officer, Edward C. Johnson 3d, and Peter S. Lynch may be sent to Fidelity Investments, 82 Devonshire Street, Boston, Massachusetts 02109.
Name, Age; Principal Occupation |
Edward C. Johnson 3d (81) |
| Year of Election or Appointment: 2011 Member of the Advisory Board of Fidelity's Equity and High Income Funds. Mr. Johnson serves as Chief Executive Officer, Chairman, and a Director of FMR LLC, and also serves as Chairman and Director of FIL Limited. Previously, Mr. Johnson served as a Trustee and Chairman of the Board of certain Fidelity Trusts, Chairman and a Director of FMR, Chairman and a Director of FMR Co., Inc., and President of FMR LLC (2006-2007). |
Peter S. Lynch (67) |
| Year of Election or Appointment: 2003 Member of the Advisory Board of Fidelity's Equity and High Income Funds. Mr. Lynch is Vice Chairman and a Director of FMR and FMR Co., Inc. In addition, Mr. Lynch serves as a Trustee of Boston College and as the Chairman of the Inner-City Scholarship Fund. Previously, Mr. Lynch served on the Special Olympics International Board of Directors (1997-2006). |
Kenneth B. Robins (42) |
| Year of Election or Appointment: 2008 President and Treasurer of Fidelity's Equity and High Income Funds. Mr. Robins also serves as President and Treasurer (2010-present) and Assistant Treasurer (2009-present) of other Fidelity funds and is an employee of Fidelity Investments (2004-present). Previously, Mr. Robins served as Deputy Treasurer of the Fidelity funds (2005-2008) and Treasurer and Chief Financial Officer of The North Carolina Capital Management Trust: Cash and Term Portfolios (2006-2008). |
Bruce T. Herring (46) |
| Year of Election or Appointment: 2006 Vice President of certain Equity Funds. Mr. Herring also serves as Chief Investment Officer and Director of Fidelity Management & Research (U.K.) Inc. (2010-present) and Group Chief Investments Officer of FMR. Previously, Mr. Herring served as Vice President (2005-2006) and Senior Vice President (2006-2007) of Fidelity Management & Research Company, Vice President of FMR Co., Inc. (2001-2007) and as a portfolio manager for Fidelity U.S. Equity Funds. |
Brian B. Hogan (47) |
| Year of Election or Appointment: 2009 Vice President of Equity and High Income Funds. Mr. Hogan also serves as President of FMR's Equity Division (2009-present). Previously, Mr. Hogan served as Senior Vice President, Equity Research of FMR (2006-2009) and as a portfolio manager. |
Scott C. Goebel (43) |
| Year of Election or Appointment: 2008 Secretary and Chief Legal Officer (CLO) of the Fidelity funds. Mr. Goebel also serves as Secretary of Fidelity Investments Money Management, Inc. (FIMM) (2010-present) and Fidelity Research and Analysis Company (FRAC) (2010-present); Secretary and CLO of The North Carolina Capital Management Trust: Cash and Term Portfolios (2008-present); General Counsel, Secretary, and Senior Vice President of FMR (2008-present) and FMR Co., Inc. (2008-present); employed by FMR LLC or an affiliate (2001-present); Chief Legal Officer of Fidelity Management & Research (Hong Kong) Limited (2008-present) and Assistant Secretary of Fidelity Management & Research (Japan) Inc. (2008-present), and Fidelity Management & Research (U.K.) Inc. (2008-present). Previously, Mr. Goebel served as Assistant Secretary of FIMM (2008-2010), FRAC (2008-2010), and the Funds (2007-2008) and as Vice President and Secretary of Fidelity Distributors Corporation (FDC) (2005-2007). |
William C. Coffey (42) |
| Year of Election or Appointment: 2009 Assistant Secretary of Fidelity's Equity and High Income Funds. Mr. Coffey also serves as Senior Vice President and Deputy General Counsel of FMR LLC (2010-present), and is an employee of Fidelity Investments. Previously, Mr. Coffey served as Vice President and Associate General Counsel of FMR LLC (2005-2009). |
Holly C. Laurent (57) |
| Year of Election or Appointment: 2008 Anti-Money Laundering (AML) Officer of the Fidelity funds. Ms. Laurent also serves as AML Officer of The North Carolina Capital Management Trust: Cash and Term Portfolios (2008-present) and is an employee of Fidelity Investments. Previously, Ms. Laurent was Senior Vice President and Head of Legal for Fidelity Business Services India Pvt. Ltd. (2006-2008), and Senior Vice President, Deputy General Counsel and Group Head for FMR LLC (2005-2006). |
Christine Reynolds (53) |
| Year of Election or Appointment: 2008 Chief Financial Officer of the Fidelity funds. Ms. Reynolds became President of Fidelity Pricing and Cash Management Services (FPCMS) in August 2008. Ms. Reynolds served as Chief Operating Officer of FPCMS (2007-2008). Previously, Ms. Reynolds served as President, Treasurer, and Anti-Money Laundering officer of the Fidelity funds (2004-2007). |
Kenneth A. Rathgeber (64) |
| Year of Election or Appointment: 2004 Chief Compliance Officer of Fidelity's Equity and High Income Funds. Mr. Rathgeber is Chief Compliance Officer of Fidelity Management & Research (Hong Kong) Limited (2008-present), Fidelity Management & Research (Japan) Inc. (2008-present), FMR (2005-present), FMR Co., Inc. (2005-present), Fidelity Management & Research (U.K.) Inc. (2005-present), Fidelity Research & Analysis Company (2005-present), Fidelity Investments Money Management, Inc. (2005-present), Pyramis Global Advisors, LLC (2005-present), and Strategic Advisers, Inc. (2005-present). |
Jeffrey S. Christian (50) |
| Year of Election or Appointment: 2009 Deputy Treasurer of the Fidelity funds. Mr. Christian is an employee of Fidelity Investments. Previously, Mr. Christian served as Chief Financial Officer (2008-2009) of certain Fidelity funds and Senior Vice President of Fidelity Pricing and Cash Management Services (FPCMS) (2004-2009). |
Joseph F. Zambello (54) |
| Year of Election or Appointment: 2011 Deputy Treasurer of the Fidelity funds. Mr. Zambello is an employee of Fidelity Investments. Previously, Mr. Zambello served as Vice President of FMR's Program Management Group (2009-2011) and Vice President of the Transfer Agent Oversight Group (2005-2009). |
Adrien E. Deberghes (44) |
| Year of Election or Appointment: 2008 Deputy Treasurer of Fidelity's Equity and High Income Funds. Mr. Deberghes also serves as Vice President and Assistant Treasurer of Fidelity Rutland Square Trust II and Fidelity Commonwealth Trust II (2011-present), Assistant Treasurer of other Fidelity funds (2010-present), and is an employee of Fidelity Investments (2008-present). Previously, Mr. Deberghes served as Senior Vice President of Mutual Fund Administration at State Street Corporation (2007-2008), Senior Director of Mutual Fund Administration at Investors Bank & Trust (2005-2007), and Director of Finance for Dunkin' Brands (2000-2005). |
Stephanie J. Dorsey (42) |
| Year of Election or Appointment: 2010 Assistant Treasurer of Fidelity's Equity and High Income Funds. Ms. Dorsey also serves as Deputy Treasurer of other Fidelity funds (2008-present) and is an employee of Fidelity Investments (2008-present). Previously, Ms. Dorsey served as Treasurer (2004-2008) of the JPMorgan Mutual Funds and Vice President (2004-2008) of JPMorgan Chase Bank. |
John R. Hebble (53) |
| Year of Election or Appointment: 2009 Assistant Treasurer of Fidelity's Equity and High Income Funds. Mr. Hebble also serves as President (2011-present), Treasurer, and Chief Financial Officer of The North Carolina Capital Management Trust: Cash and Term Portfolios (2008-present), President and Treasurer of other Fidelity funds (2008-present) and is an employee of Fidelity Investments. |
Gary W. Ryan (53) |
| Year of Election or Appointment: 2005 Assistant Treasurer of the Fidelity funds. Mr. Ryan is an employee of Fidelity Investments. Previously, Mr. Ryan served as Vice President of Fund Reporting in Fidelity Pricing and Cash Management Services (FPCMS) (1999-2005). |
Jonathan Davis (43) |
| Year of Election or Appointment: 2010 Assistant Treasurer of the Fidelity funds. Mr. Davis is also Assistant Treasurer of Fidelity Rutland Square Trust II and Fidelity Commonwealth Trust II. Mr. Davis is an employee of Fidelity Investments. Previously, Mr. Davis served as Vice President and Associate General Counsel of FMR LLC (2003-2010). |
Annual Report
Class A, Class T, Class B, and Class C designates 100% of each dividend distributed during the fiscal year as amounts which may be taken into account as a dividend for purposes of the maximum rate under section 1(h)(11) of the Internal Revenue Code.
The amounts per share which represent income derived from sources within, and taxes paid to, foreign countries or possessions of the United States are as follows:
| Pay Date | Income | Taxes |
Class A | 12/06/10 | $0.205 | $0.0303 |
Class A | 12/31/10 | $0.058 | $0.0000 |
Class T | 12/06/10 | $0.170 | $0.0303 |
Class T | 12/31/10 | $0.058 | $0.0000 |
Class B | 12/06/10 | $0.106 | $0.0303 |
Class B | 12/31/10 | $0.058 | $0.0000 |
Class C | 12/06/10 | $0.113 | $0.0303 |
Class C | 12/31/10 | $0.058 | $0.0000 |
The fund will notify shareholders in January 2012 of amounts for use in preparing 2011 income tax returns.
Annual Report
Board Approval of Investment Advisory Contracts and Management Fees
Fidelity Advisor Diversified International Fund
Each year, the Board of Trustees, including the Independent Trustees (together, the Board), votes on the renewal of the management contract and sub-advisory agreements (together, the Advisory Contracts) for the fund. The Board, assisted by the advice of fund counsel and Independent Trustees' counsel, requests and considers a broad range of information relevant to the renewal of the Advisory Contracts throughout the year.
The Board meets regularly and considers at each of its meetings factors that are relevant to its annual consideration of the renewal of the fund's Advisory Contracts, including the services and support provided to the fund and its shareholders. The Board has established various standing committees, each composed of Independent Trustees with varying backgrounds, to which the Board has assigned specific subject matter responsibilities in order to enhance effective decision-making by the Board. The Board, acting directly and through its Committees, requests and receives information concerning the annual consideration of the renewal of the fund's Advisory Contracts. The Board also meets as needed to consider matters specifically related to the Board's annual consideration of the renewal of Advisory Contracts. Members of the Board may also meet with trustees of other Fidelity funds through ad hoc joint committees to discuss certain matters relevant to the Fidelity funds.
At its July 2011 meeting, the Board of Trustees, including the Independent Trustees, unanimously determined to renew the fund's Advisory Contracts. In reaching its determination, the Board considered all factors it believed relevant, including (i) the nature, extent, and quality of the services to be provided to the fund and its shareholders (including the investment performance of the fund); (ii) the competitiveness of the fund's management fee and total expense ratio; (iii) the total costs of the services to be provided by and the profits to be realized by Fidelity from its relationship with the fund; (iv) the extent to which economies of scale would be realized as the fund grows; and (v) whether fee levels reflect these economies of scale, if any, for the benefit of fund shareholders.
In considering whether to renew the Advisory Contracts for the fund, the Board reached a determination, with the assistance of fund counsel and Independent Trustees' counsel and through the exercise of its business judgment, that the renewal of the Advisory Contracts is in the best interests of the fund and its shareholders and that the compensation payable under the Advisory Contracts is fair and reasonable. The Board's decision to renew the Advisory Contracts was not based on any single factor, but rather was based on a comprehensive consideration of all the information provided to the Board at its meetings throughout the year. The Board, in reaching its determination to renew the Advisory Contracts, is aware that shareholders in the fund have a broad range of investment choices available to them, including a wide choice among mutual funds offered by Fidelity's competitors, and that the fund's shareholders, who have the opportunity to review and weigh the disclosure provided by the fund in its prospectus and other public disclosures, have chosen to invest in this fund, managed by Fidelity.
Annual Report
Board Approval of Investment Advisory Contracts and
Management Fees - continued
Nature, Extent, and Quality of Services Provided. The Board considered the staffing within the investment adviser, FMR, and the sub-advisers (together, the Investment Advisers), including the backgrounds of the fund's investment personnel and the fund's investment objective and discipline. The Independent Trustees also had discussions with senior management of Fidelity's investment operations and investment groups. The Board considered the structure of the portfolio manager compensation program and whether this structure provides appropriate incentives to act in the best interests of the fund.
Resources Dedicated to Investment Management and Support Services. The Board and the Fund Oversight and Research Committees reviewed the general qualifications and capabilities of the Investment Advisers' investment staff, including its size, education, experience, and resources, as well as the Investment Advisers' approach to recruiting, training, managing, and compensating investment personnel. The Board also noted that FMR has devoted increased resources to non-U.S. offices. The Board noted that Fidelity's analysts have extensive resources, tools and capabilities which allow them to conduct sophisticated quantitative and fundamental analysis, as well as credit analysis of issuers, counterparties and enhancers. The Board also believes that Fidelity's investment professionals have sufficient access to global information and data so as to provide competitive investment results over time, and that those professionals also have access to sophisticated tools which permit them to assess portfolio construction and risk and performance attribution characteristics continuously, as well as to transmit new information and research conclusions rapidly around the world. Additionally, in their deliberations, the Board considered the Investment Advisers' trading capabilities and resources which are an integral part of the investment management process.
Shareholder and Administrative Services. The Board considered (i) the nature, extent, quality, and cost of advisory, administrative, and shareholder services performed by the Investment Advisers and their affiliates under the Advisory Contracts and under separate agreements covering transfer agency, pricing and bookkeeping, and securities lending services for the fund; (ii) the nature and extent of the investment adviser's supervision of third party service providers, principally custodians and subcustodians; and (iii) the resources devoted to, and the record of compliance with, the fund's compliance policies and procedures. The Board also reviewed the allocation of fund brokerage, including allocations to brokers affiliated with the Investment Advisers, the use of brokerage commissions to pay fund expenses, and the use of "soft" commission dollars to pay for research services.
The Board noted that the growth of fund assets over time across the complex allows Fidelity to reinvest in the development of services designed to enhance the value or convenience of the Fidelity funds as investment vehicles. These services include 24-hour access to account information and market information through telephone representatives and over the Internet, investor education materials and asset allocation tools, and the expanded availability of Fidelity Investor Centers, with 35 new branches opening since 2010.
Annual Report
Investment in a Large Fund Family. The Board considered the benefits to shareholders of investing in a Fidelity fund, including the benefits of investing in a fund that is part of a large family of funds offering a variety of investment disciplines and providing a large variety of mutual fund investor services. The Board noted that Fidelity had taken, or had made recommendations that resulted in the Fidelity funds taking, a number of actions over the previous year that benefited particular funds, including (i) continuing to dedicate additional resources to investment research and support of the senior management team that oversees asset management; (ii) rationalizing product lines through the mergers of six funds into other funds; (iii) continuing to migrate the Freedom Funds to dedicated lower cost underlying funds; (iv) obtaining shareholder approval to broaden the investment strategies for Fidelity Consumer Finance Portfolio, Fidelity Emerging Asia Fund, and Fidelity Environment and Alternative Energy Portfolio; (v) contractually agreeing to reduce the management fees and impose other expense limitations on Spartan 500 Index Fund and U.S. Bond Index Fund in connection with launching new institutional classes of these funds; (vi) changing the name, primary and supplemental benchmarks, and investment policies of Fidelity Global Strategies Fund to support the fund's flexible investment mandate and global orientation; and (vii) reducing the transfer agency account fee rates on certain accounts.
Investment Performance. The Board considered whether the fund has operated in accordance with its investment objective, as well as its record of compliance with its investment restrictions. It also reviewed the fund's absolute investment performance for each class, as well as the fund's relative investment performance for each class measured over multiple periods against (i) a broad-based securities market index, and (ii) a peer group of mutual funds deemed appropriate by Fidelity and reviewed by the Board. The following charts considered by the Board show, over the one-, three-, and five-year periods ended December 31, 2010, the cumulative total returns of Institutional Class (Class I) and Class B of the fund, the cumulative total returns of a broad-based securities market index ("benchmark"), and a range of cumulative total returns of a peer group of mutual funds identified by Morningstar, Inc. as having an investment style similar to that of the fund based on underlying portfolio holdings. The returns of Institutional Class (Class I) and Class B show the performance of the highest and lowest performing classes, respectively (based on five-year performance). The box within each chart shows the 25th percentile return (bottom of box) and the 75th percentile return (top of box) of the peer group. Returns shown above the box are in the first quartile and returns shown below the box are in the fourth quartile. The percentage beaten numbers noted below each chart correspond to the percentile box and represent the percentage of funds in the peer group whose performance was equal to or lower than that of the class indicated.
Annual Report
Board Approval of Investment Advisory Contracts and
Management Fees - continued
Fidelity Advisor Diversified International Fund
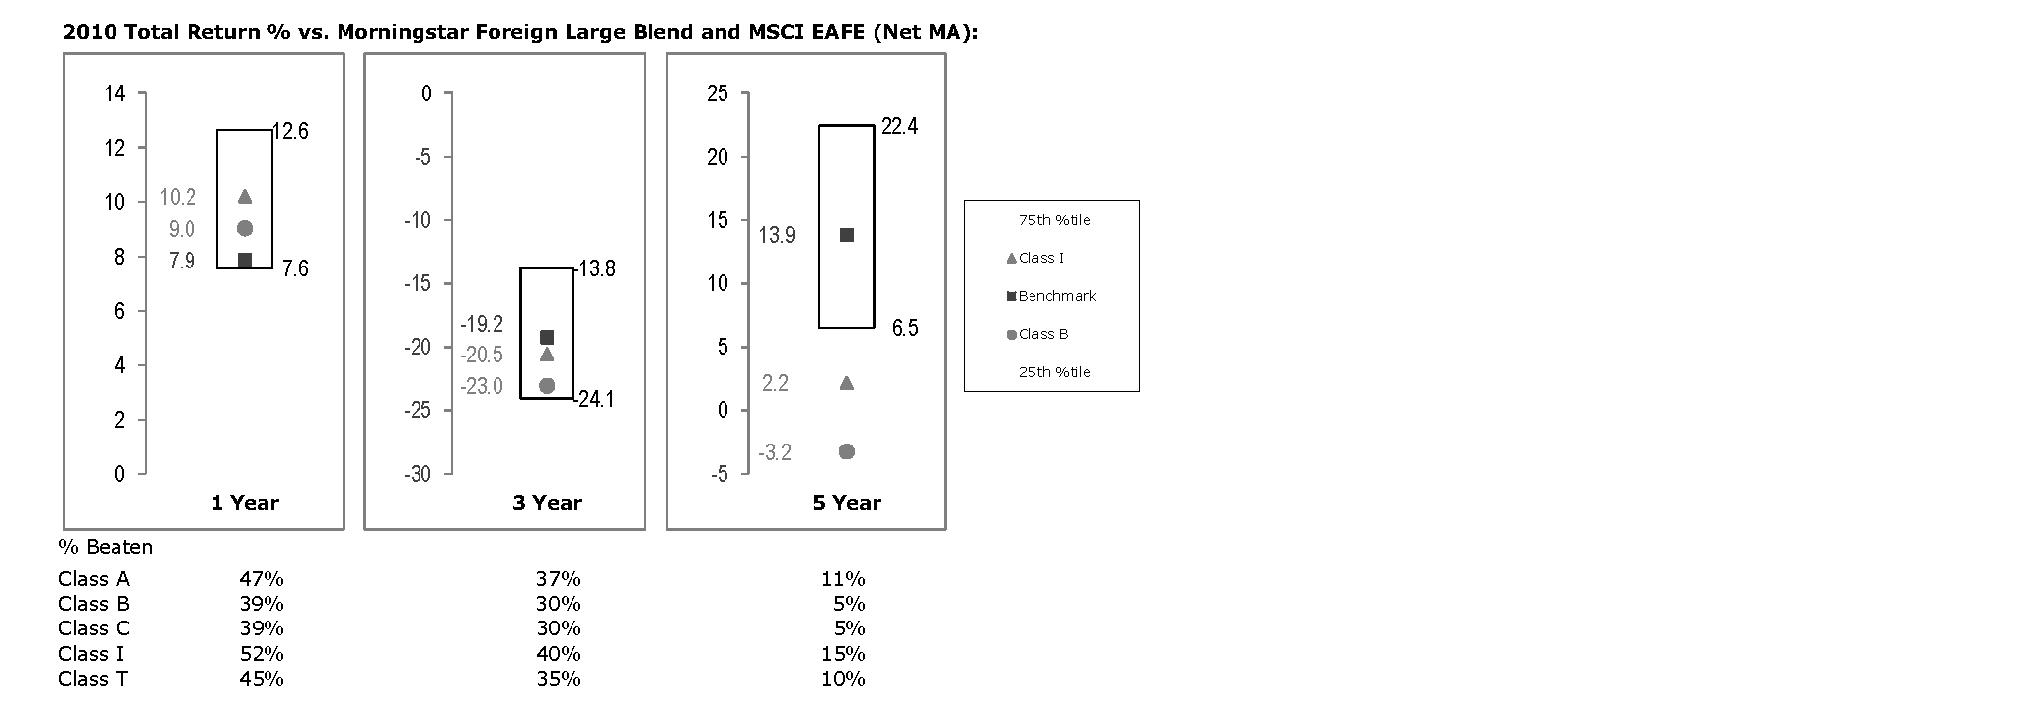
The Board reviewed the fund's relative investment performance against its peer group and noted that the performance of Institutional Class (Class I) of the fund was in the second quartile for the one-year period, the third quartile for the three-year period, and the fourth quartile for the five-year period. The Board also noted that the investment performance of the fund was lower than its benchmark for the three- and five-year periods, although the one-year total return of Institutional Class (Class I) compared favorably to its benchmark. The Board considered that the variations in performance among the fund's classes reflect the variations in class expenses, which result in lower performance for higher expense classes. The Board also reviewed the fund's performance since inception as well as performance in the current year.
Based on its review, the Board concluded that the nature, extent, and quality of services provided to the fund under the Advisory Contracts should benefit the fund's shareholders.
Competitiveness of Management Fee and Total Expense Ratio. The Board considered the fund's management fee and total expense ratio compared to "mapped groups" of competitive funds and classes. Fidelity creates "mapped groups" by combining similar Lipper investment objective categories that have comparable management fee characteristics. Combining Lipper investment objective categories aids the Board's management fee and total expense ratio comparisons by broadening the competitive group used for comparison and by reducing the number of universes to which various Fidelity funds are compared.
Annual Report
Management Fee. The Board considered two proprietary management fee comparisons for the 12-month periods shown in the chart below. The group of Lipper funds used by the Board for management fee comparisons is referred to below as the "Total Mapped Group." The Total Mapped Group comparison focuses on a fund's standing relative to the total universe of comparable funds available to investors in terms of gross management fees before expense reimbursements or caps. "TMG %" represents the percentage of funds in the Total Mapped Group that had management fees that were lower than the fund's. For example, a TMG % of 16% means that 84% of the funds in the Total Mapped Group had higher management fees than the fund. The "Asset-Size Peer Group" (ASPG) comparison focuses on a fund's standing relative to non-Fidelity funds similar in size to the fund within the Total Mapped Group. The ASPG represents at least 15% of the funds in the Total Mapped Group with comparable asset size and management fee characteristics, subject to a minimum of 50 funds (or all funds in the Total Mapped Group if fewer than 50). Additional information, such as the ASPG quartile in which the fund's management fee ranked, is also included in the chart and considered by the Board.
Fidelity Advisor Diversified International Fund
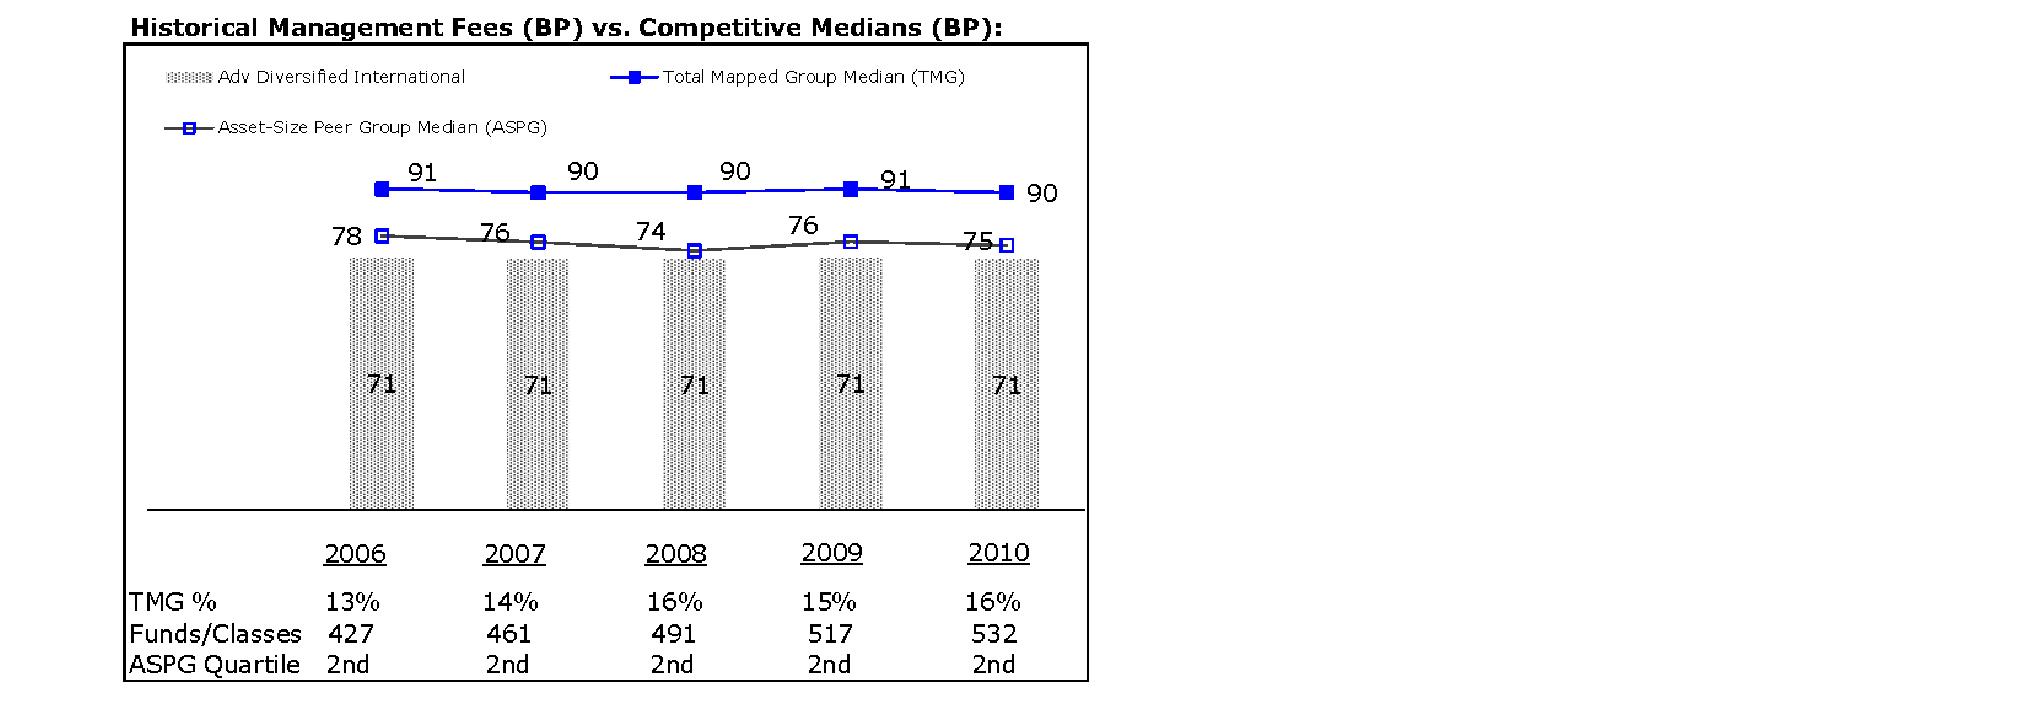
The Board noted that the fund's management fee ranked below the median of its Total Mapped Group and below the median of its ASPG for 2010.
Based on its review, the Board concluded that the fund's management fee is fair and reasonable in light of the services that the fund receives and the other factors considered.
Total Expense Ratio. In its review of each class's total expense ratio, the Board considered the fund's management fee as well as other fund or class expenses, as applicable, such as transfer agent fees, pricing and bookkeeping fees, fund-paid 12b-1 fees, and custodial, legal, and audit fees. The Board also noted the effects of any waivers and reimbursements on fees and expenses. As part of its review, the Board also considered the current and historical total expense ratios of each class of the fund compared to competitive fund median expenses. Each class of the fund is compared to those funds and classes in the Total Mapped Group (used by the Board for management fee comparisons) that have a similar sales load structure.
Annual Report
Board Approval of Investment Advisory Contracts and
Management Fees - continued
The Board noted that the total expense ratio of each of Class A, Class B, Class C, and Institutional Class ranked below its competitive median for 2010 and the total expense ratio of Class T ranked above its competitive median for 2010. The Board considered that various factors, including 12b-1 fees, positive or negative performance adjustments, and relatively higher other expenses in the case of small fund size, can affect total expense ratios. The Board noted that the total expense ratio of Class T was above the competitive median primarily because of higher 12b-1 fees on Class T. Class T has a higher 12b-1 fee, but a lower front-end sales charge, than traditionally priced front-end sales charge classes. The Board noted that the fund offers multiple classes, each of which has a different sales load and 12b-1 fee structure, and that the multiple structures are intended to offer a range of pricing options for the intermediary market. The Board also noted that the total expense ratios of the classes vary primarily by the level of their 12b-1 fees, although differences in transfer agent fees may also cause expenses to vary from class to class.
Fees Charged to Other Fidelity Clients. The Board also considered Fidelity fee structures and other information with respect to clients of FMR and its affiliates, such as other mutual funds advised or subadvised by FMR or its affiliates, pension plan clients, and other institutional clients. In March 2010, the Board created an ad hoc joint committee with the board of other Fidelity funds (the Committee) to review and compare Fidelity's institutional investment advisory business with its business of providing services to the Fidelity funds, including the differences in services provided, fees charged, and costs incurred, as well as competition in their respective marketplaces.
Based on its review of total expense ratios and fees charged to other Fidelity clients, the Board concluded that the total expense ratio of each class of the fund was reasonable, although Class T was above the median of the universe presented for comparison, in light of the services that the fund and its shareholders receive and the other factors considered, including the findings of the Committee.
Costs of the Services and Profitability. The Board considered the revenues earned and the expenses incurred by Fidelity in conducting the business of developing, marketing, distributing, managing, administering and servicing the fund and its shareholders. The Board also considered the level of Fidelity's profits in respect of all the Fidelity funds.
Annual Report
On an annual basis, FMR presents to the Board Fidelity's profitability for the fund. Fidelity calculates the profitability for each fund, as well as aggregate profitability for groups of Fidelity funds and all Fidelity funds, using a series of detailed revenue and cost allocation methodologies which originate with the books and records of Fidelity on which Fidelity's audited financial statements are based. The Audit Committee of the Board reviews any significant changes from the prior year's methodologies.
PricewaterhouseCoopers LLP (PwC), independent registered public accounting firm and auditor to Fidelity and certain Fidelity funds, has been engaged annually by the Board as part of the Board's assessment of Fidelity's profitability analysis. PwC's engagement includes the review and assessment of Fidelity's methodologies used in determining the revenues and expenses attributable to Fidelity's mutual fund business, and completion of agreed-upon procedures surrounding the mathematical accuracy of fund profitability and its conformity to allocation methodologies. After considering PwC's reports issued under the engagement and information provided by Fidelity, the Board concluded that while other allocation methods may also be reasonable, Fidelity's profitability methodologies are reasonable in all material respects.
The Board also reviewed Fidelity's non-fund businesses and fall-out benefits related to the mutual fund business as well as cases where Fidelity's affiliates may benefit from or be related to the fund's business.
The Board considered the costs of the services provided by and the profits realized by Fidelity in connection with the operation of the fund and was satisfied that the profitability was not excessive in the circumstances.
Economies of Scale. The Board considered whether there have been economies of scale in respect of the management of the Fidelity funds, whether the Fidelity funds (including the fund) have appropriately benefited from any such economies of scale, and whether there is potential for realization of any further economies of scale. The Board considered the extent to which the fund will benefit from economies of scale through increased services to the fund, through waivers or reimbursements, or through fee or expense reductions. The Board also noted that in 2009, it and the board of other Fidelity funds created an ad hoc committee (the Economies of Scale Committee) to analyze whether FMR attains economies of scale in respect of the management and servicing of the Fidelity funds, whether the Fidelity funds have appropriately benefited from such economies of scale, and whether there is potential for realization of any further economies of scale.
The Board recognized that the fund's management contract incorporates a "group fee" structure, which provides for lower group fee rates as total fund assets under FMR's management increase, and for higher group fee rates as total fund assets under FMR's management decrease. FMR calculates the group fee rates based on a tiered asset "breakpoint" schedule that varies based on asset class. The Board considered that the group fee is designed to deliver the benefits of economies of scale to fund shareholders when total Fidelity fund assets increase, even if assets of any particular fund are unchanged or have declined, because some portion of Fidelity's costs are attributable to services provided to all Fidelity funds, and all funds benefit if those costs can be allocated among more assets. The Board concluded that, given the group fee structure, fund shareholders will benefit from lower management fees as assets under FMR's management increase at the fund complex level, regardless of whether Fidelity achieves any such economies of scale.
Annual Report
Board Approval of Investment Advisory Contracts and
Management Fees - continued
The Board concluded, taking into account the analysis of the Economies of Scale Committee, that any potential economies of scale are being appropriately shared between fund shareholders and Fidelity.
Additional Information Requested by the Board. In order to develop fully the factual basis for consideration of the Fidelity funds' Advisory Contracts, the Board requested and received additional information on certain topics, including (i) fund performance trends, actions to be taken by FMR to improve certain funds' overall performance, and Fidelity's long-term strategies for certain funds; (ii) portfolio manager changes that have occurred during the past year and length of portfolio manager tenure for different categories of funds over time; (iii) Fidelity's compensation structure for portfolio managers and other key personnel and strategies for attracting and retaining non-investment personnel; (iv) the amount of the investment that each portfolio manager has made in the Fidelity fund(s) that he or she manages; (v) historical trends in Fidelity's realization of fall-out benefits; (vi) Fidelity's group fee structures and the rationale for the individual fee rates of certain funds; (vii) fund profitability methodology and the impact of certain factors on fund profitability results; (viii) trends regarding industry use of performance fee structures and Fidelity's compliance practices with respect to performance adjustment calculations; (ix) the fee structures in place for certain other Fidelity clients; and (x) explanations regarding the relative total expense ratios of certain funds and classes, total expense competitive trends, and actions that might be taken by FMR to reduce total expense ratios for certain funds and classes.
Based on its evaluation of all of the conclusions noted above, and after considering all factors it believed relevant, the Board ultimately concluded that the advisory fee structures are fair and reasonable, and that the fund's Advisory Contracts should be renewed.
Annual Report
Investment Adviser
Fidelity Management & Research Company
Boston, MA
Investment Sub-Advisers
FMR Co., Inc.
Fidelity Management & Research
(U.K.) Inc.
FIL Investment Advisors
FIL Investments (Japan) Limited
FIL Investment Advisors (U.K.) Ltd.
Fidelity Management & Research
Company (Hong Kong) Limited
Fidelity Management & Research
Company (Japan) Inc.
General Distributor
Fidelity Distributors Corporation
Boston, MA
Transfer and Service Agents
Fidelity Investments Institutional Operations Company, Inc.
Boston, MA
Fidelity Service Company, Inc.
Boston, MA
Custodian
State Street Bank and Trust Company
Quincy, MA
ADIF-UANN-1211
1.784735.108

(Fidelity Investment logo)(registered trademark)
Fidelity Advisor®
Diversified International
Fund - Institutional Class
Annual Report
October 31, 2011
Contents
Chairman's Message | (Click Here) | The Chairman's message to shareholders. |
Performance | (Click Here) | How the fund has done over time. |
Management's Discussion of Fund Performance | (Click Here) | The Portfolio Manager's review of fund performance and strategy. |
Shareholder Expense Example | (Click Here) | An example of shareholder expenses. |
Investment Changes | (Click Here) | A summary of major shifts in the fund's investments over the past six months. |
Investments | (Click Here) | A complete list of the fund's investments with their market values. |
Financial Statements | (Click Here) | Statements of assets and liabilities, operations, and changes in net assets, as well as financial highlights. |
Notes | (Click Here) | Notes to the financial statements. |
Report of Independent Registered Public Accounting Firm | (Click Here) | |
Trustees and Officers | (Click Here) | |
Distributions | (Click Here) | |
Board Approval of Investment Advisory Contracts and Management Fees | (Click Here) | |
To view a fund's proxy voting guidelines and proxy voting record for the 12-month period ended June 30, visit http://www.fidelity.com/proxyvotingresults or visit the Securities and Exchange Commission's (SEC) web site at http://www.sec.gov. You may also call 1-877-208-0098 to request a free copy of the proxy voting guidelines.
Standard & Poor's, S&P and S&P 500 are registered service marks of The McGraw-Hill Companies, Inc. and have been licensed for use by Fidelity Distributors Corporation.
Other third party marks appearing herein are the property of their respective owners.
All other marks appearing herein are registered or unregistered trademarks or service marks of FMR LLC or an affiliated company.
Annual Report
This report and the financial statements contained herein are submitted for the general information of the shareholders of the fund. This report is not authorized for distribution to prospective investors in the fund unless preceded or accompanied by an effective prospectus.
A fund files its complete schedule of portfolio holdings with the SEC for the first and third quarters of each fiscal year on Form N-Q. Forms N-Q are available on the SEC's web site at http://www.sec.gov. A fund's Forms N-Q may be reviewed and copied at the SEC's Public Reference Room in Washington, DC. Information regarding the operation of the SEC's Public Reference Room may be obtained by calling 1-800-SEC-0330. For a complete list of a fund's portfolio holdings, view the most recent holdings listing, semiannual report, or annual report on Fidelity's web site at http://www.fidelity.com, http://www.advisor.fidelity.com, or http://www.401k.com, as applicable.
NOT FDIC INSURED • MAY LOSE VALUE • NO BANK GUARANTEE
Neither the fund nor Fidelity Distributors Corporation is a bank.
Annual Report
(photo_of_James_C_Curvey)
Dear Shareholder:
Global equity markets began the fourth quarter on a strong note, sharply reversing course in October amid strong corporate earnings, better-than-expected economic news and the promise of a resolution to the sovereign debt crisis in Europe. The mini rally followed a third quarter marked by a significant downturn in July and August, which heightened investor anxiety and set off a wave of volatility that hampered most major asset classes through the end of September. Financial markets are difficult to predict, of course, but you can help put the odds in your favor by following these time-tested investment principles.
One of the basic tenets is to invest according to your time horizon. For long-term investors, riding out the markets' inevitable ups and downs has proven much more effective than making decisions based on short-term developments. If your goal is approaching, you can also benefit from patience and restraint, rather than attempting to time the market. No matter your time horizon, missing only a few of the markets' best days can significantly diminish returns. Patience also affords the benefits of compounding - earning interest on additional income or reinvested dividends and capital gains. While staying the course doesn't eliminate risk, it can considerably lessen the negative impact of short-term downturns.
Asset allocation is another principle to manage risk. As you spread your portfolio among the asset classes, be sure to consider your time horizon, risk tolerance and investment objectives. Younger investors may be better served by emphasizing equities, which historically have been the best-performing asset class over time. Investors who are nearing a specific goal, such as retirement or sending a child to college, may choose to favor bonds and other investments that have tended to be more stable. Studies indicate that asset allocation is the single most important determinant of a portfolio's long-term success. After deciding on a suitable allocation strategy, make sure your portfolio is adequately diversified, with exposure to stocks of small-, mid- and large-cap companies in a range of sectors, for example. And today, more than ever, geographic diversification should be taken into account.
Lastly, investing a certain amount of money on a regular basis - a principle known as dollar-cost averaging - can help lower the average cost of your purchases, while also giving you the discipline to avoid selling weak performers just prior to an upswing, or chasing a hot performer just before a correction.
We invite you to learn more by visiting us on the Internet, dropping by one of our Investor Centers or calling us by phone. It is our privilege to provide the resources you need to choose investments that are right for you.
Sincerely,
(The acting chairman's signature appears here.)
James C. Curvey
Acting Chairman
Annual Report
Average annual total return reflects the change in the value of an investment, assuming reinvestment of the class' distributions from dividend income and capital gains (the profits earned upon the sale of securities that have grown in value, if any) and assuming a constant rate of performance each year. The $10,000 table and the fund's returns do not reflect the deduction of taxes that a shareholder would pay on fund distributions or the redemption of fund shares. During periods of reimbursement by Fidelity, a fund's total return will be greater than it would be had the reimbursement not occurred. How a fund did yesterday is no guarantee of how it will do tomorrow.
Average Annual Total Returns
Periods ended October 31, 2011 | Past 1
year | Past 5
years | Past 10
years |
Institutional Class | -4.85% | -3.45% | 6.10% |
$10,000 Over Past 10 Years
Let's say hypothetically that $10,000 was invested in Fidelity Advisor® Diversified International Fund - Institutional Class on October 31, 2001. The chart shows how the value of your investment would have changed, and also shows how the MSCI ® EAFE® (Europe, Australia, Far East) Index performed over the same period.
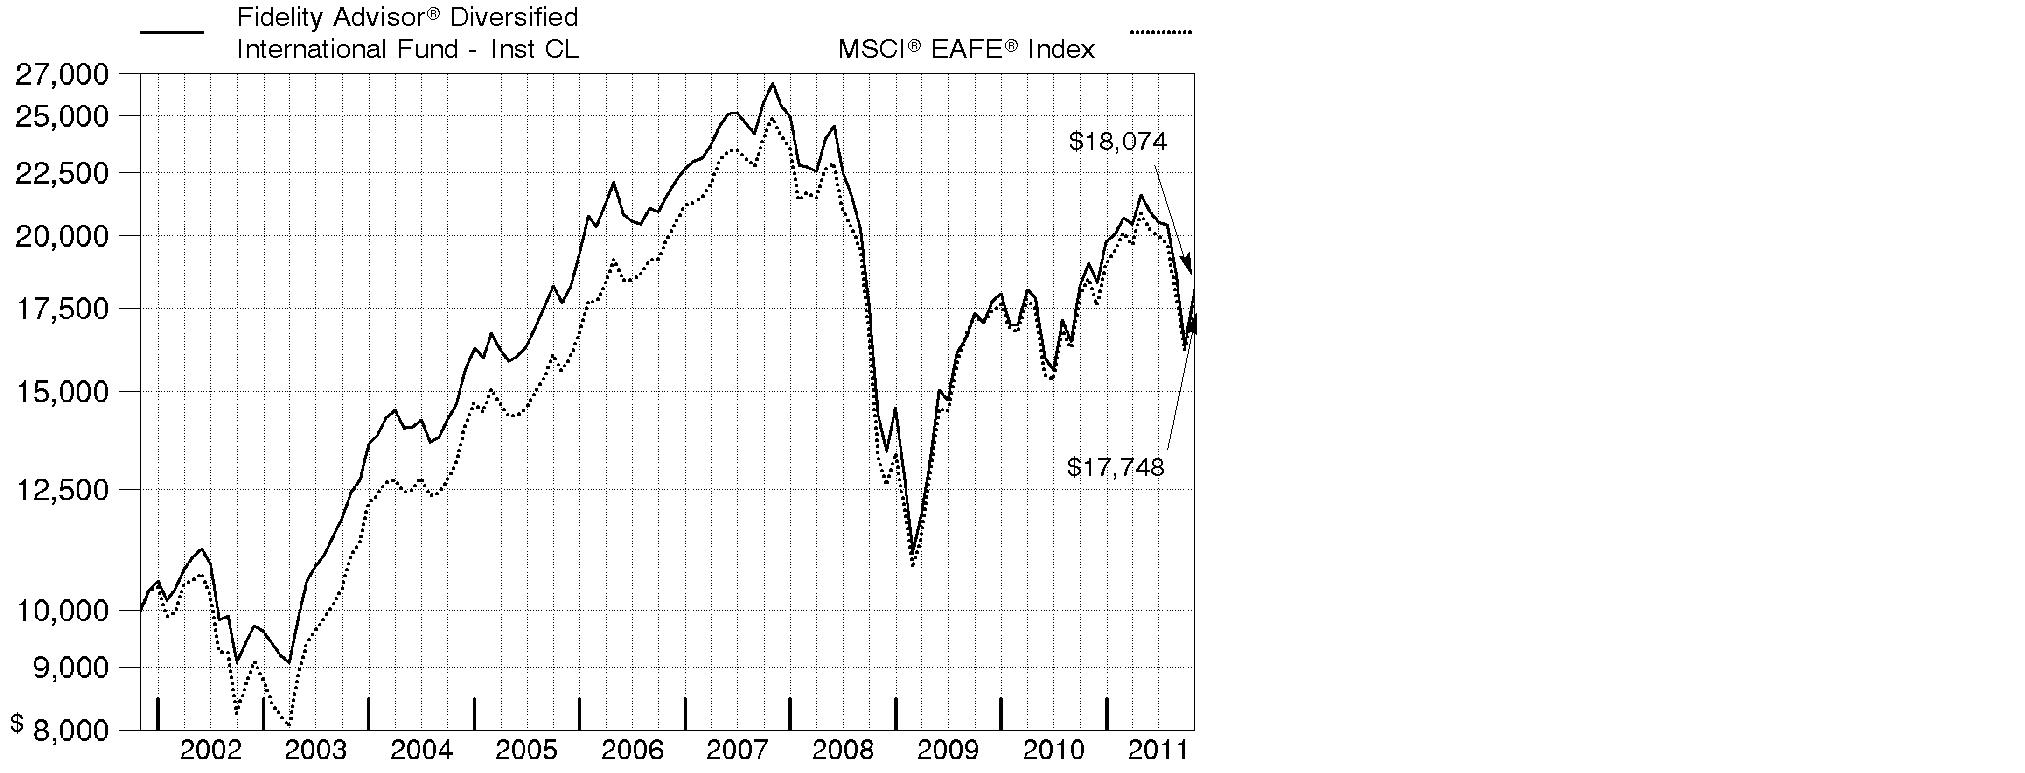
Annual Report
Market Recap: International equities were rocked by a number of headline events during the year ending October 31, 2011. Stocks posted a solid advance for the first half of the period, despite concern about the sovereign debt crisis in Europe, a devastating earthquake and tsunami in Japan, and political upheaval in the Middle East and North Africa. Sentiment turned decidedly negative in the second half, however, as fresh worries about Europe, inflation in China and a dimmed outlook for global growth caused foreign markets to suffer declines that intensified in August and September. October brought with it yet another dramatic swing, as eurozone policymakers appeared near a resolution to the debt debacle and buyers stormed back onto the scene in search of bargains. Still, those gains - along with favorable currency fluctuations overall - weren't enough to offset prior losses, and the MSCI® ACWI® (All Country World Index) ex USA Index finished the period down 4.56%. Within the MSCI index, Europe and emerging markets suffered the biggest declines, with many countries in these areas sustaining steep losses. By contrast, Japan showed resilience in the wake of its natural disasters, falling only 2%. Australia (+4%), Switzerland (+3%), the U.K. (+2%) and Canada, which produced a nominal return, were among the few major benchmark components to break into positive territory.
Comments from William Bower, Portfolio Manager of Fidelity Advisor® Diversified International Fund: For the year, the fund's Institutional Class shares returned -4.85%, underperforming the -3.97% return of the MSCI® EAFE® (Europe, Australasia, Far East) Index. Fund performance versus the index was held back by security selection in energy, positioning in consumer staples, stock selection in financials and an underweighting in pharmaceuticals. Geographically, fund performance was curtailed by stock selection in the Asia-Pacific ex Japan region, China and Canada. Individual detractors included U.K.-based Lloyds Banking Group; out-of-benchmark positions in Canadian energy companies Niko Resources and Petrobank Energy & Resources; an underweighting in Swiss drug company Roche Holding - no longer held; Danish beer company Carlsberg; and Italy's Fiat Industrial. On the plus side, the fund benefited from an underweighting in the utilities sector, positioning in consumer discretionary and security selection in technology hardware/equipment. Regionally, positioning in continental Europe helped, as did stock picks in Japan. Top contributors included Japan Tobacco, U.K.-listed Royal Dutch Shell, an out-of-index position in Japanese online retailer Start Today, a lack of exposure to Tokyo Electric Power and a non-benchmark stake in technology giant Apple.
Annual Report
The views expressed above reflect those of the portfolio manager(s) only through the end of the period as stated on the cover of this report and do not necessarily represent the views of Fidelity or any other person in the Fidelity organization. Any such views are subject to change at any time based upon market or other conditions and Fidelity disclaims any responsibility to update such views. These views may not be relied on as investment advice and, because investment decisions for a Fidelity fund are based on numerous factors, may not be relied on as an indication of trading intent on behalf of any Fidelity fund.
Annual Report
Shareholder Expense Example
As a shareholder of the Fund, you incur two types of costs: (1) transaction costs, including sales charges (loads) on purchase payments or redemption proceeds, redemption fees, and (2) ongoing costs, including management fees, distribution and/or service (12b-1) fees and other Fund expenses. This Example is intended to help you understand your ongoing costs (in dollars) of investing in the Fund and to compare these costs with the ongoing costs of investing in other mutual funds.
The Example is based on an investment of $1,000 invested at the beginning of the period and held for the entire period (May 1, 2011 to October 31, 2011).
Actual Expenses
The first line of the accompanying table for each class of the Fund provides information about actual account values and actual expenses. You may use the information in this line, together with the amount you invested, to estimate the expenses that you paid over the period. Simply divide your account value by $1,000.00 (for example, an $8,600 account value divided by $1,000.00 = 8.6), then multiply the result by the number in the first line for a class of the Fund under the heading entitled "Expenses Paid During Period" to estimate the expenses you paid on your account during this period. In addition, the Fund, as a shareholder in the underlying Fidelity Central Funds, will indirectly bear its pro-rata share of the fees and expenses incurred by the underlying Fidelity Central Funds. These fees and expenses are not included in the Fund's annualized expense ratio used to calculate the expense estimate in the table below.
Hypothetical Example for Comparison Purposes
The second line of the accompanying table for each class of the Fund provides information about hypothetical account values and hypothetical expenses based on a Class' actual expense ratio and an assumed rate of return of 5% per year before expenses, which is not the Class' actual return. The hypothetical account values and expenses may not be used to estimate the actual ending account balance or expenses you paid for the period. You may use this information to compare the ongoing costs of investing in the Fund and other funds. To do so, compare this 5% hypothetical example with the 5% hypothetical examples that appear in the shareholder reports of the other funds. In addition, the Fund, as a shareholder in the underlying Fidelity Central Funds, will indirectly bear its pro-rata share of the fees and expenses incurred by the underlying Fidelity Central Funds. These fees and expenses are not included in the Fund's annualized expense ratio used to calculate the expense estimate in the table below.
Please note that the expenses shown in the table are meant to highlight your ongoing costs only and do not reflect any transaction costs. Therefore, the second line of the table is useful in comparing ongoing costs only, and will not help you determine the relative total costs of owning different funds. In addition, if these transactional costs were included, your costs would have been higher.
Annual Report
Shareholder Expense Example - continued
| Annualized Expense Ratio | Beginning
Account Value
May 1, 2011 | Ending
Account Value
October 31, 2011 | Expenses Paid
During Period*
May 1, 2011 to
October 31, 2011 |
Class A | 1.30% | | | |
Actual | | $ 1,000.00 | $ 836.30 | $ 6.02 |
Hypothetical A | | $ 1,000.00 | $ 1,018.65 | $ 6.61 |
Class T | 1.55% | | | |
Actual | | $ 1,000.00 | $ 835.40 | $ 7.17 |
Hypothetical A | | $ 1,000.00 | $ 1,017.39 | $ 7.88 |
Class B | 2.08% | | | |
Actual | | $ 1,000.00 | $ 832.90 | $ 9.61 |
Hypothetical A | | $ 1,000.00 | $ 1,014.72 | $ 10.56 |
Class C | 2.05% | | | |
Actual | | $ 1,000.00 | $ 833.30 | $ 9.47 |
Hypothetical A | | $ 1,000.00 | $ 1,014.87 | $ 10.41 |
Institutional Class | .99% | | | |
Actual | | $ 1,000.00 | $ 837.70 | $ 4.59 |
Hypothetical A | | $ 1,000.00 | $ 1,020.21 | $ 5.04 |
A 5% return per year before expenses
* Expenses are equal to each Class' annualized expense ratio, multiplied by the average account value over the period, multiplied by 184/365 (to reflect the one-half year period).
Annual Report
Investment Changes (Unaudited)
Top Five Stocks as of October 31, 2011 |
| % of fund's
net assets | % of fund's net assets
6 months ago |
Royal Dutch Shell PLC Class B (United Kingdom, Oil, Gas & Consumable Fuels) | 4.3 | 3.4 |
BHP Billiton Ltd. sponsored ADR (Australia, Metals & Mining) | 2.1 | 2.0 |
Novo Nordisk A/S Series B (Denmark, Pharmaceuticals) | 1.9 | 1.8 |
GlaxoSmithKline PLC (United Kingdom, Pharmaceuticals) | 1.7 | 1.2 |
Vodafone Group PLC sponsored ADR (United Kingdom, Wireless Telecommunication Services) | 1.7 | 1.2 |
| 11.7 | |
Top Five Market Sectors as of October 31, 2011 |
| % of fund's
net assets | % of fund's net assets
6 months ago |
Consumer Discretionary | 16.4 | 16.1 |
Financials | 15.7 | 20.6 |
Energy | 11.6 | 11.6 |
Consumer Staples | 10.6 | 7.1 |
Materials | 10.1 | 10.5 |
Top Five Countries as of October 31, 2011 |
(excluding cash equivalents) | % of fund's
net assets | % of fund's net assets
6 months ago |
United Kingdom | 18.2 | 17.0 |
Japan | 14.5 | 13.8 |
Germany | 8.4 | 7.9 |
France | 7.0 | 6.0 |
Canada | 5.7 | 5.0 |
Percentages are adjusted for the effect of open futures contracts, if applicable. |
Asset Allocation (% of fund's net assets) |
As of October 31, 2011 | As of April 30, 2011 |
| Stocks 97.7% | | | Stocks 99.5% | |
| Other
Investments 0.0%* | | | Other
Investments 0.0%* | |
| Short-Term
Investments and
Net Other Assets 2.3% | | | Short-Term
Investments and
Net Other Assets 0.5% | |

* Amount represents less than 0.1%. |
Annual Report
Investments October 31, 2011
Showing Percentage of Net Assets
Common Stocks - 96.2% |
| Shares | | Value (000s) |
Australia - 3.7% |
BHP Billiton Ltd. sponsored ADR (d) | 665,600 | | $ 51,970 |
Fortescue Metals Group Ltd. | 552,575 | | 2,776 |
Iluka Resources Ltd. | 215,410 | | 3,581 |
Newcrest Mining Ltd. | 714,443 | | 25,252 |
QBE Insurance Group Ltd. | 276,266 | | 4,253 |
WorleyParsons Ltd. | 49,933 | | 1,449 |
TOTAL AUSTRALIA | | 89,281 |
Bailiwick of Guernsey - 1.2% |
Amdocs Ltd. (a) | 176,500 | | 5,299 |
Ashmore Global Opportunities Ltd. (United Kingdom) | 80,098 | | 889 |
Resolution Ltd. | 5,147,282 | | 22,764 |
TOTAL BAILIWICK OF GUERNSEY | | 28,952 |
Bailiwick of Jersey - 2.0% |
Experian PLC | 1,380,600 | | 17,995 |
Randgold Resources Ltd. sponsored ADR | 90,400 | | 9,905 |
Shire PLC | 271,800 | | 8,532 |
WPP PLC | 1,160,845 | | 12,018 |
TOTAL BAILIWICK OF JERSEY | | 48,450 |
Belgium - 1.0% |
Anheuser-Busch InBev SA NV | 427,346 | | 23,702 |
Bermuda - 1.2% |
Assured Guaranty Ltd. | 290,700 | | 3,704 |
Clear Media Ltd. (a) | 11,132,000 | | 4,245 |
CNPC (Hong Kong) Ltd. | 1,736,000 | | 2,432 |
Huabao International Holdings Ltd. | 4,119,000 | | 2,617 |
Li & Fung Ltd. | 4,706,000 | | 9,069 |
Noble Group Ltd. | 6,197,000 | | 7,564 |
TOTAL BERMUDA | | 29,631 |
Brazil - 2.1% |
Anhanguera Educacional Participacoes SA | 193,600 | | 2,847 |
Banco Bradesco SA (PN) sponsored ADR | 340,000 | | 6,188 |
Droga Raia SA | 41,000 | | 581 |
Drogasil SA | 462,600 | | 2,909 |
Estacio Participacoes SA | 210,300 | | 2,454 |
Itau Unibanco Banco Multiplo SA sponsored ADR | 658,800 | | 12,596 |
Kroton Educacional SA unit (a) | 128,700 | | 1,439 |
Qualicorp SA | 333,000 | | 3,045 |
Souza Cruz Industria Comerico | 497,800 | | 6,105 |
Common Stocks - continued |
| Shares | | Value (000s) |
Brazil - continued |
T4F Entretenimento SA | 212,800 | | $ 1,487 |
Telefonica Brasil SA sponsored ADR (a) | 252,635 | | 7,331 |
Tractebel Energia SA | 181,600 | | 2,908 |
TOTAL BRAZIL | | 49,890 |
British Virgin Islands - 0.4% |
Arcos Dorados Holdings, Inc. | 177,300 | | 4,149 |
Camelot Information Systems, Inc. ADR (a)(d) | 225,500 | | 735 |
Mail.ru Group Ltd. GDR (Reg. S) | 105,400 | | 3,631 |
TOTAL BRITISH VIRGIN ISLANDS | | 8,515 |
Canada - 5.7% |
Barrick Gold Corp. | 95,000 | | 4,690 |
Canadian Natural Resources Ltd. | 503,500 | | 17,759 |
Fairfax Financial Holdings Ltd. (sub. vtg.) | 18,000 | | 7,524 |
Goldcorp, Inc. | 183,000 | | 8,904 |
InterOil Corp. (a)(d) | 26,200 | | 1,245 |
Ivanhoe Mines Ltd. (a) | 313,760 | | 6,421 |
Niko Resources Ltd. | 218,400 | | 12,013 |
Open Text Corp. (a) | 137,900 | | 8,440 |
Osisko Mining Corp. (a) | 281,100 | | 3,389 |
Painted Pony Petroleum Ltd. (a)(e) | 170,900 | | 2,090 |
Painted Pony Petroleum Ltd. Class A (a) | 900,000 | | 11,006 |
Penn West Petroleum Ltd. | 73,300 | | 1,310 |
Petrobank Energy & Resources Ltd. | 528,300 | | 4,754 |
Petrominerales Ltd. (d) | 313,514 | | 8,271 |
Potash Corp. of Saskatchewan, Inc. | 260,000 | | 12,306 |
Suncor Energy, Inc. | 256,900 | | 8,182 |
Talisman Energy, Inc. | 660,700 | | 9,372 |
Tourmaline Oil Corp. (a) | 150,000 | | 4,987 |
Tourmaline Oil Corp. (a)(e) | 32,900 | | 1,094 |
Uranium One, Inc. | 1,093,500 | | 3,291 |
Valeant Pharmaceuticals International, Inc. (Canada) | 75,000 | | 2,961 |
TOTAL CANADA | | 140,009 |
Cayman Islands - 0.8% |
China Automation Group Ltd. | 565,000 | | 196 |
China ZhengTong Auto Services Holdings Ltd. | 2,608,000 | | 2,824 |
Haitian International Holdings Ltd. | 2,822,000 | | 2,507 |
Hengan International Group Co. Ltd. | 914,500 | | 7,927 |
HiSoft Technology International Ltd. ADR (a)(d) | 178,100 | | 2,205 |
Common Stocks - continued |
| Shares | | Value (000s) |
Cayman Islands - continued |
NVC Lighting Holdings Ltd. | 4,004,000 | | $ 1,739 |
Sands China Ltd. (a) | 468,000 | | 1,406 |
TOTAL CAYMAN ISLANDS | | 18,804 |
China - 1.0% |
Baidu.com, Inc. sponsored ADR (a) | 131,300 | | 18,406 |
Changsha Zoomlion Heavy Industry Science & Technology Development Co. Ltd. (H Shares) | 2,303,640 | | 3,333 |
Shandong Weigao Group Medical Polymer Co. Ltd. (H Shares) | 2,108,000 | | 2,191 |
SINA Corp. (a) | 15,000 | | 1,219 |
TOTAL CHINA | | 25,149 |
Curacao - 0.6% |
Schlumberger Ltd. | 202,200 | | 14,856 |
Denmark - 2.6% |
Carlsberg A/S Series B | 147,600 | | 10,047 |
Novo Nordisk A/S Series B | 424,708 | | 45,097 |
William Demant Holding A/S (a) | 106,535 | | 8,500 |
TOTAL DENMARK | | 63,644 |
Finland - 0.1% |
Nokian Tyres PLC | 46,300 | | 1,701 |
France - 7.0% |
Alstom SA | 293,834 | | 11,020 |
Arkema SA | 33,900 | | 2,319 |
Atos Origin SA | 35,000 | | 1,696 |
AXA SA | 484,000 | | 7,884 |
BNP Paribas SA | 429,300 | | 19,516 |
Bureau Veritas SA | 47,700 | | 3,711 |
Danone | 257,800 | | 17,946 |
Essilor International SA | 173,646 | | 12,592 |
JC Decaux SA (a) | 87,700 | | 2,350 |
LVMH Moet Hennessy - Louis Vuitton | 175,327 | | 29,177 |
PPR SA | 196,700 | | 30,733 |
Publicis Groupe SA | 125,000 | | 6,061 |
Sanofi-aventis | 348,286 | | 24,920 |
TOTAL FRANCE | | 169,925 |
Germany - 6.9% |
adidas AG | 147,700 | | 10,457 |
Allianz AG | 79,246 | | 8,906 |
BASF AG | 219,303 | | 16,143 |
Common Stocks - continued |
| Shares | | Value (000s) |
Germany - continued |
Bayer AG | 184,652 | | $ 11,830 |
Bayerische Motoren Werke AG (BMW) | 60,177 | | 4,918 |
Deutsche Boerse AG | 93,200 | | 5,159 |
ElringKlinger AG | 81,300 | | 2,254 |
Fresenius Medical Care AG & Co. KGaA | 266,200 | | 19,394 |
Fresenius SE | 194,400 | | 19,185 |
Infineon Technologies AG | 269,600 | | 2,436 |
Kabel Deutschland Holding AG (a) | 88,700 | | 5,065 |
Linde AG | 117,847 | | 18,747 |
SAP AG | 272,836 | | 16,500 |
Siemens AG | 260,351 | | 27,294 |
TOTAL GERMANY | | 168,288 |
Hong Kong - 1.1% |
AIA Group Ltd. | 2,631,000 | | 8,045 |
China Mobile (Hong Kong) Ltd. sponsored ADR | 133,400 | | 6,345 |
China Resources Enterprise Ltd. | 326,000 | | 1,191 |
Henderson Land Development Co. Ltd. | 998,325 | | 5,457 |
Swire Pacific Ltd. (A Shares) | 537,000 | | 6,205 |
TOTAL HONG KONG | | 27,243 |
India - 2.2% |
Axis Bank Ltd. | 154,359 | | 3,648 |
Bajaj Auto Ltd. | 77,063 | | 2,726 |
Bharti Airtel Ltd. | 875,793 | | 7,014 |
Cummins India Ltd. | 60,573 | | 494 |
Dr. Reddy's Laboratories Ltd. | 15,851 | | 537 |
HDFC Bank Ltd. | 1,241,884 | | 12,385 |
Housing Development Finance Corp. Ltd. | 640,065 | | 9,008 |
Infrastructure Development Finance Co. Ltd. | 1,296,940 | | 3,501 |
ITC Ltd. | 504,101 | | 2,199 |
Lupin Ltd. | 49,561 | | 477 |
Mahindra & Mahindra Financial Services Ltd. | 231,785 | | 3,187 |
Shriram Transport Finance Co. Ltd. | 243,922 | | 3,054 |
State Bank of India | 121,560 | | 4,728 |
Wipro Ltd. | 140,264 | | 1,052 |
TOTAL INDIA | | 54,010 |
Ireland - 0.3% |
Accenture PLC Class A | 84,700 | | 5,104 |
Elan Corp. PLC sponsored ADR (a) | 252,900 | | 3,032 |
TOTAL IRELAND | | 8,136 |
Common Stocks - continued |
| Shares | | Value (000s) |
Italy - 1.8% |
ENI SpA | 89,400 | | $ 1,976 |
Fiat Industrial SpA (a) | 2,202,500 | | 19,218 |
Prada SpA | 701,200 | | 3,466 |
Saipem SpA | 428,501 | | 19,213 |
TOTAL ITALY | | 43,873 |
Japan - 14.5% |
ABC-Mart, Inc. | 124,400 | | 4,872 |
Aozora Bank Ltd. | 1,485,000 | | 3,755 |
Calbee, Inc. (d) | 112,000 | | 5,106 |
Cosmos Pharmaceutical Corp. | 151,100 | | 7,009 |
Denso Corp. | 185,900 | | 5,718 |
Dentsu, Inc. | 224,700 | | 6,767 |
Don Quijote Co. Ltd. | 154,600 | | 5,664 |
Fanuc Corp. | 81,900 | | 13,244 |
Hitachi Ltd. | 4,450,000 | | 23,847 |
Honda Motor Co. Ltd. sponsored ADR | 746,006 | | 22,306 |
Hoya Corp. | 244,500 | | 5,342 |
Itochu Corp. | 1,259,800 | | 12,462 |
Japan Retail Fund Investment Corp. | 358 | | 554 |
Japan Tobacco, Inc. | 6,256 | | 31,273 |
JSR Corp. | 349,200 | | 6,667 |
KDDI Corp. | 2,618 | | 19,180 |
Keyence Corp. | 63,800 | | 16,221 |
Mitsubishi Corp. | 301,600 | | 6,204 |
Mitsubishi UFJ Financial Group, Inc. | 1,783,800 | | 7,753 |
Mitsui & Co. Ltd. | 334,700 | | 4,885 |
Nitori Holdings Co. Ltd. | 45,400 | | 4,342 |
NTT DoCoMo, Inc. | 6,081 | | 10,801 |
ORIX Corp. | 374,570 | | 32,695 |
OSAKA Titanium technologies Co. Ltd. | 11,600 | | 639 |
Rakuten, Inc. | 21,801 | | 23,902 |
Seven & i Holdings Co., Ltd. | 392,600 | | 10,478 |
Shimadzu Corp. | 172,000 | | 1,464 |
SHIMANO, Inc. | 103,800 | | 5,132 |
SMC Corp. | 78,600 | | 12,227 |
SOFTBANK CORP. | 454,800 | | 14,763 |
Start Today Co. Ltd. | 791,600 | | 16,748 |
Sumitomo Mitsui Financial Group, Inc. | 93,900 | | 2,625 |
Yahoo! Japan Corp. | 25,684 | | 8,250 |
TOTAL JAPAN | | 352,895 |
Common Stocks - continued |
| Shares | | Value (000s) |
Korea (South) - 1.9% |
Amorepacific Corp. | 9,101 | | $ 10,262 |
LG Household & Health Care Ltd. | 5,491 | | 2,471 |
Orion Corp. | 23,346 | | 12,478 |
Samsung Electronics Co. Ltd. | 19,473 | | 16,701 |
Shinhan Financial Group Co. Ltd. | 134,470 | | 5,337 |
TOTAL KOREA (SOUTH) | | 47,249 |
Luxembourg - 0.3% |
Samsonite International SA | 2,545,800 | | 4,142 |
Ternium SA sponsored ADR | 141,900 | | 3,482 |
TOTAL LUXEMBOURG | | 7,624 |
Mexico - 0.9% |
America Movil SAB de CV Series L sponsored ADR | 305,200 | | 7,758 |
Grupo Televisa SA de CV (CPO) sponsored ADR | 230,100 | | 4,908 |
Wal-Mart de Mexico SA de CV Series V | 3,523,000 | | 9,101 |
TOTAL MEXICO | | 21,767 |
Netherlands - 2.8% |
AEGON NV (a) | 2,658,300 | | 12,679 |
ASML Holding NV (Netherlands) | 133,500 | | 5,601 |
Gemalto NV | 141,225 | | 6,444 |
ING Groep NV sponsored ADR (a)(d) | 1,888,600 | | 16,318 |
Koninklijke KPN NV | 1,077,782 | | 14,164 |
Koninklijke Philips Electronics NV (depositary receipt) (NY Reg.) | 392,500 | | 8,184 |
Unilever NV (Certificaten Van Aandelen) (Bearer) unit | 73,400 | | 2,534 |
Yandex NV | 45,000 | | 1,238 |
TOTAL NETHERLANDS | | 67,162 |
Norway - 1.6% |
DnB NOR ASA | 891,599 | | 10,401 |
Storebrand ASA (A Shares) | 600,000 | | 3,700 |
Telenor ASA | 1,365,000 | | 24,370 |
TOTAL NORWAY | | 38,471 |
Qatar - 0.2% |
Commercial Bank of Qatar GDR (Reg. S) | 1,100,000 | | 5,045 |
Russia - 0.3% |
Sberbank of Russia sponsored ADR | 320,000 | | 3,440 |
Uralkali JSC GDR (Reg. S) | 90,000 | | 3,906 |
TOTAL RUSSIA | | 7,346 |
Common Stocks - continued |
| Shares | | Value (000s) |
South Africa - 0.8% |
AngloGold Ashanti Ltd. sponsored ADR | 208,200 | | $ 9,413 |
Foschini Ltd. | 165,400 | | 2,087 |
Naspers Ltd. Class N | 84,300 | | 4,036 |
Shoprite Holdings Ltd. | 265,100 | | 3,885 |
Tiger Brands Ltd. | 37,200 | | 1,072 |
TOTAL SOUTH AFRICA | | 20,493 |
Spain - 2.6% |
Banco Bilbao Vizcaya Argentaria SA | 673,090 | | 6,059 |
Banco Santander SA (Spain) sponsored ADR (d) | 1,295,000 | | 11,085 |
Grifols SA ADR (a) | 938,900 | | 6,018 |
Inditex SA | 322,785 | | 29,375 |
Prosegur Compania de Seguridad SA (Reg.) | 176,100 | | 8,786 |
Repsol YPF SA | 95,491 | | 2,894 |
TOTAL SPAIN | | 64,217 |
Sweden - 0.4% |
H&M Hennes & Mauritz AB (B Shares) | 125,563 | | 4,158 |
Swedbank AB (A Shares) | 414,600 | | 5,841 |
TOTAL SWEDEN | | 9,999 |
Switzerland - 3.8% |
Clariant AG (Reg.) (a) | 474,195 | | 5,185 |
Kuehne & Nagel International AG | 149,610 | | 18,634 |
Nestle SA | 564,038 | | 32,716 |
Noble Corp. | 71,700 | | 2,577 |
Partners Group Holding | 5,000 | | 937 |
Transocean Ltd. (United States) | 163,000 | | 9,315 |
UBS AG (a) | 1,184,990 | | 14,980 |
Zurich Financial Services AG | 39,749 | | 9,231 |
TOTAL SWITZERLAND | | 93,575 |
Taiwan - 1.0% |
HTC Corp. | 392,800 | | 8,828 |
Taiwan Fertilizer Co. Ltd. | 368,000 | | 948 |
Taiwan Semiconductor Manufacturing Co. Ltd. sponsored ADR | 1,015,300 | | 12,813 |
Unified-President Enterprises Corp. | 696,420 | | 958 |
TOTAL TAIWAN | | 23,547 |
United Kingdom - 18.2% |
3Legs Resources PLC | 645,100 | | 1,401 |
Anglo American PLC (United Kingdom) | 328,300 | | 12,109 |
BG Group PLC | 1,116,992 | | 24,367 |
Common Stocks - continued |
| Shares | | Value (000s) |
United Kingdom - continued |
British American Tobacco PLC sponsored ADR | 182,100 | | $ 16,799 |
Burberry Group PLC | 582,600 | | 12,564 |
Capita Group PLC | 277,600 | | 3,243 |
Carphone Warehouse Group PLC | 1,801,600 | | 10,170 |
Filtrona PLC | 658,900 | | 4,208 |
GlaxoSmithKline PLC | 1,832,500 | | 41,133 |
HSBC Holdings PLC sponsored ADR | 831,900 | | 36,321 |
Imperial Tobacco Group PLC | 205,191 | | 7,504 |
Inchcape PLC | 1,639,100 | | 8,601 |
Intertek Group PLC | 241,700 | | 7,988 |
ITV PLC | 4,848,100 | | 4,994 |
Lloyds Banking Group PLC (a) | 21,916,100 | | 11,335 |
Misys PLC | 1,534,750 | | 7,202 |
Next PLC | 313,300 | | 12,878 |
Ocado Group PLC (a)(d) | 1,074,000 | | 1,618 |
Pearson PLC | 996,300 | | 18,306 |
Pz Cussons PLC Class L | 137,000 | | 811 |
Reckitt Benckiser Group PLC | 631,700 | | 32,488 |
Rolls-Royce Group PLC | 1,800,600 | | 20,342 |
Rolls-Royce Group PLC Class C | 124,241,400 | | 200 |
Royal Dutch Shell PLC Class B | 2,943,612 | | 105,633 |
SuperGroup PLC (a) | 155,800 | | 1,563 |
Vodafone Group PLC sponsored ADR | 1,447,300 | | 40,293 |
TOTAL UNITED KINGDOM | | 444,071 |
United States of America - 5.2% |
Apple, Inc. (a) | 63,500 | | 25,704 |
CF Industries Holdings, Inc. | 45,500 | | 7,383 |
Citigroup, Inc. | 488,880 | | 15,444 |
Cognizant Technology Solutions Corp. Class A (a) | 66,700 | | 4,852 |
Facebook, Inc. Class B (f) | 131,847 | | 3,296 |
Green Mountain Coffee Roasters, Inc. (a) | 26,900 | | 1,749 |
Nabors Industries Ltd. (a) | 153,200 | | 2,808 |
Newmont Mining Corp. | 125,000 | | 8,354 |
Noble Energy, Inc. | 75,600 | | 6,754 |
Polycom, Inc. (a) | 275,000 | | 4,546 |
PriceSmart, Inc. | 4,200 | | 319 |
SanDisk Corp. (a) | 194,000 | | 9,830 |
Schweitzer-Mauduit International, Inc. | 156,300 | | 10,991 |
The Mosaic Co. | 108,300 | | 6,342 |
Unisys Corp. (a) | 239,998 | | 6,238 |
Common Stocks - continued |
| Shares | | Value (000s) |
United States of America - continued |
Virgin Media, Inc. | 87,600 | | $ 2,136 |
Wells Fargo & Co. | 399,100 | | 10,341 |
TOTAL UNITED STATES OF AMERICA | | 127,087 |
TOTAL COMMON STOCKS (Cost $2,192,838) | 2,344,607 |
Nonconvertible Preferred Stocks - 1.5% |
| | | |
Germany - 1.5% |
ProSiebenSat.1 Media AG | 347,500 | | 7,454 |
Volkswagen AG | 169,700 | | 29,779 |
TOTAL NONCONVERTIBLE PREFERRED STOCKS (Cost $22,794) | 37,233 |
Master Notes - 0.0% |
| Principal Amount (000s) | | |
Canada - 0.0% |
OZ Optics Ltd. 5% 11/5/14 (f)
(Cost $15) | | $ 14 | | 14 |
Money Market Funds - 4.6% |
| Shares | | |
Fidelity Cash Central Fund, 0.12% (b) | 47,652,773 | | 47,653 |
Fidelity Securities Lending Cash Central Fund, 0.11% (b)(c) | 65,392,682 | | 65,393 |
TOTAL MONEY MARKET FUNDS (Cost $113,046) | 113,046 |
TOTAL INVESTMENT PORTFOLIO - 102.3% (Cost $2,328,693) | 2,494,900 |
NET OTHER ASSETS (LIABILITIES) - (2.3)% | (56,326) |
NET ASSETS - 100% | $ 2,438,574 |
Legend |
(a) Non-income producing |
(b) Affiliated fund that is available only to investment companies and other accounts managed by Fidelity Investments. The rate quoted is the annualized seven-day yield of the fund at period end. A complete unaudited listing of the fund's holdings as of its most recent quarter end is available upon request. In addition, each Fidelity Central Fund's financial statements, which are not covered by the Fund's Report of Independent Registered Public Accounting Firm, are available on the SEC's website or upon request. |
(c) Investment made with cash collateral received from securities on loan. |
(d) Security or a portion of the security is on loan at period end. |
(e) Security exempt from registration under Rule 144A of the Securities Act of 1933. These securities may be resold in transactions exempt from registration, normally to qualified institutional buyers. At the end of the period, the value of these securities amounted to $3,184,000 or 0.1% of net assets. |
(f) Restricted securities - Investment in securities not registered under the Securities Act of 1933 (excluding 144A issues). At the end of the period, the value of restricted securities (excluding 144A issues) amounted to $3,310,000 or 0.1% of net assets. |
Additional information on each restricted holding is as follows: |
Security | Acquisition Date | Acquisition Cost (000s) |
Facebook, Inc. Class B | 3/31/11 | $ 3,296 |
OZ Optics Ltd. 5% 11/5/14 | 11/5/10 | $ 15 |
Affiliated Central Funds |
Information regarding fiscal year to date income earned by the Fund from investments in Fidelity Central Funds is as follows: |
Fund | Income earned
(Amounts in thousands) |
Fidelity Cash Central Fund | $ 74 |
Fidelity Securities Lending Cash Central Fund | 2,043 |
Total | $ 2,117 |
Other Information |
The following is a summary of the inputs used, as of October 31, 2011, involving the Fund's assets and liabilities carried at fair value. The inputs or methodology used for valuing securities may not be an indication of the risk associated with investing in those securities. For more information on valuation inputs, and their aggregation into the levels used in the tables below, please refer to the Security Valuation section in the accompanying Notes to Financial Statements. |
Valuation Inputs at Reporting Date: |
Description
(Amounts in thousands) | Total | Level 1 | Level 2 | Level 3 |
Investments in Securities: | | | | |
Equities: | | | | |
United Kingdom | $ 444,071 | $ 267,664 | $ 176,407 | $ - |
Japan | 352,895 | 22,306 | 330,589 | - |
Germany | 205,521 | 142,333 | 63,188 | - |
France | 169,925 | 145,005 | 24,920 | - |
Canada | 140,009 | 140,009 | - | - |
United States of America | 127,087 | 123,791 | - | 3,296 |
Switzerland | 93,575 | 78,595 | 14,980 | - |
Australia | 89,281 | 51,970 | 37,311 | - |
Netherlands | 67,162 | 46,348 | 20,814 | - |
Other | 692,314 | 406,381 | 285,933 | - |
Master Notes | 14 | - | - | 14 |
Money Market Funds | 113,046 | 113,046 | - | - |
Total Investments in Securities: | $ 2,494,900 | $ 1,537,448 | $ 954,142 | $ 3,310 |
The following is a reconciliation of Investments in Securities for which Level 3 inputs were used in determining value: |
(Amounts in thousands) | |
Investments in Securities: | |
Beginning Balance | $ 24 |
Total Realized Gain (Loss) | (56) |
Total Unrealized Gain (Loss) | 54 |
Cost of Purchases | 3,321 |
Proceeds of Sales | (33) |
Amortization/Accretion | - |
Transfers in to Level 3 | - |
Transfers out of Level 3 | - |
Ending Balance | $ 3,310 |
The change in unrealized gain (loss) for the period attributable to Level 3 securities held at October 31, 2011 | $ - |
The information used in the above reconciliation represents fiscal year to date activity for any Investments in Securities identified as using Level 3 inputs at either the beginning or the end of the current fiscal period. Transfers in or out of Level 3 represent the beginning value of any Security or Instrument where a change in the pricing level occurred from the beginning to the end of the period. The cost of purchases and the proceeds of sales may include securities received or delivered through corporate actions or exchanges. Realized and unrealized gains (losses) disclosed in the reconciliation are included in Net Gain (Loss) on the Fund's Statement of Operations. |
Income Tax Information |
At October 31, 2011, the Fund had a capital loss carryforward of approximately $3,034,664,000 all of which will expire in fiscal 2017. Capital loss carryforwards are only available to offset future capital gains of the Fund to the extent provided by regulations and may be limited. |
See accompanying notes which are an integral part of the financial statements.
Annual Report
Statement of Assets and Liabilities
Amounts in thousands (except per-share amounts) | October 31, 2011 |
| | |
Assets | | |
Investment in securities, at value (including securities loaned of $59,345) - See accompanying schedule: Unaffiliated issuers (cost $2,215,647) | $ 2,381,854 | |
Fidelity Central Funds (cost $113,046) | 113,046 | |
Total Investments (cost $2,328,693) | | $ 2,494,900 |
Foreign currency held at value (cost $264) | | 264 |
Receivable for investments sold
Regular delivery | | 22,969 |
Delayed delivery | | 5 |
Receivable for fund shares sold | | 1,425 |
Dividends receivable | | 4,326 |
Interest receivable | | 1 |
Distributions receivable from Fidelity Central Funds | | 31 |
Prepaid expenses | | 9 |
Other receivables | | 271 |
Total assets | | 2,524,201 |
| | |
Liabilities | | |
Payable for investments purchased | $ 8,231 | |
Payable for fund shares redeemed | 6,721 | |
Accrued management fee | 1,404 | |
Distribution and service plan fees payable | 669 | |
Other affiliated payables | 640 | |
Other payables and accrued expenses | 2,569 | |
Collateral on securities loaned, at value | 65,393 | |
Total liabilities | | 85,627 |
| | |
Net Assets | | $ 2,438,574 |
Net Assets consist of: | | |
Paid in capital | | $ 5,303,272 |
Undistributed net investment income | | 26,393 |
Accumulated undistributed net realized gain (loss) on investments and foreign currency transactions | | (3,054,924) |
Net unrealized appreciation (depreciation) on investments and assets and liabilities in foreign currencies | | 163,833 |
Net Assets | | $ 2,438,574 |
See accompanying notes which are an integral part of the financial statements.
Annual Report
Statement of Assets and Liabilities - continued
Amounts in thousands (except per-share amounts) | October 31, 2011 |
| | |
Calculation of Maximum Offering Price Class A:
Net Asset Value and redemption price per share ($915,719 ÷ 62,674 shares) | | $ 14.61 |
| | |
Maximum offering price per share (100/94.25 of $14.61) | | $ 15.50 |
Class T:
Net Asset Value and redemption price per share ($404,046 ÷ 27,940 shares) | | $ 14.46 |
| | |
Maximum offering price per share (100/96.50 of $14.46) | | $ 14.98 |
Class B:
Net Asset Value and offering price per share ($93,512 ÷ 6,722 shares)A | | $ 13.91 |
| | |
Class C:
Net Asset Value and offering price per share ($301,931 ÷ 21,640 shares)A | | $ 13.95 |
| | |
| | |
Institutional Class:
Net Asset Value, offering price and redemption price per share ($723,366 ÷ 48,648 shares) | | $ 14.87 |
A Redemption price per share is equal to net asset value less any applicable contingent deferred sales charge.
See accompanying notes which are an integral part of the financial statements.
Annual Report
Financial Statements - continued
Statement of Operations
Amounts in thousands | Year ended October 31, 2011 |
| | |
Investment Income | | |
Dividends | | $ 76,910 |
Special dividends | | 12,968 |
Interest | | 2 |
Income from Fidelity Central Funds | | 2,117 |
Income before foreign taxes withheld | | 91,997 |
Less foreign taxes withheld | | (5,673) |
Total income | | 86,324 |
| | |
Expenses | | |
Management fee | $ 22,912 | |
Transfer agent fees | 8,313 | |
Distribution and service plan fees | 10,560 | |
Accounting and security lending fees | 1,390 | |
Custodian fees and expenses | 554 | |
Independent trustees' compensation | 18 | |
Registration fees | 120 | |
Audit | 113 | |
Legal | 14 | |
Interest | 1 | |
Miscellaneous | 25 | |
Total expenses before reductions | 44,020 | |
Expense reductions | (701) | 43,319 |
Net investment income (loss) | | 43,005 |
Realized and Unrealized Gain (Loss) Net realized gain (loss) on: | | |
Investment securities: | | |
Unaffiliated issuers | 251,964 | |
Foreign currency transactions | (496) | |
Total net realized gain (loss) | | 251,468 |
Change in net unrealized appreciation (depreciation) on: Investment securities (net of decrease in deferred foreign taxes of $228) | (391,817) | |
Assets and liabilities in foreign currencies | (295) | |
Total change in net unrealized appreciation (depreciation) | | (392,112) |
Net gain (loss) | | (140,644) |
Net increase (decrease) in net assets resulting from operations | | $ (97,639) |
See accompanying notes which are an integral part of the financial statements.
Annual Report
Statement of Changes in Net Assets
Amounts in thousands | Year ended October 31,
2011 | Year ended
October 31,
2010 |
Increase (Decrease) in Net Assets | | |
Operations | | |
Net investment income (loss) | $ 43,005 | $ 38,199 |
Net realized gain (loss) | 251,468 | 465,302 |
Change in net unrealized appreciation (depreciation) | (392,112) | (92,787) |
Net increase (decrease) in net assets resulting
from operations | (97,639) | 410,714 |
Distributions to shareholders from net investment income | (45,397) | (59,773) |
Distributions to shareholders from net realized gain | (8,026) | (3,252) |
Total distributions | (53,423) | (63,025) |
Share transactions - net increase (decrease) | (1,225,390) | (1,259,295) |
Redemption fees | 65 | 104 |
Total increase (decrease) in net assets | (1,376,387) | (911,502) |
| | |
Net Assets | | |
Beginning of period | 3,814,961 | 4,726,463 |
End of period (including undistributed net investment income of $26,393 and undistributed net investment income of $32,132, respectively) | $ 2,438,574 | $ 3,814,961 |
See accompanying notes which are an integral part of the financial statements.
Annual Report
Financial Highlights - Class A
Years ended October 31, | 2011 | 2010 | 2009 | 2008 | 2007 |
Selected Per-Share Data | | | | | |
Net asset value, beginning of period | $ 15.63 | $ 14.25 | $ 12.57 | $ 26.62 | $ 23.42 |
Income from Investment Operations | | | | | |
Net investment income (loss) C | .22 F | .14 | .17 | .36 | .31 |
Net realized and unrealized gain (loss) | (1.01) | 1.44 | 1.96 | (11.15) | 4.69 |
Total from investment operations | (.79) | 1.58 | 2.13 | (10.79) | 5.00 |
Distributions from net investment income | (.20) | (.19) | (.45) | (.24) | (.23) |
Distributions from net realized gain | (.03) | (.01) | - | (3.02) | (1.57) |
Total distributions | (.23) | (.20) | (.45) | (3.26) | (1.80) |
Redemption fees added to paid in capital C,H | - | - | - | - | - |
Net asset value, end of period | $ 14.61 | $ 15.63 | $ 14.25 | $ 12.57 | $ 26.62 |
Total Return A,B | (5.15)% | 11.17% | 18.16% | (45.95)% | 22.76% |
Ratios to Average Net Assets D,G | | | | | |
Expenses before reductions | 1.31% | 1.32% | 1.34% | 1.26% | 1.25% |
Expenses net of fee waivers, if any | 1.31% | 1.32% | 1.34% | 1.26% | 1.25% |
Expenses net of all reductions | 1.29% | 1.30% | 1.31% | 1.22% | 1.21% |
Net investment income (loss) | 1.38% F | .95% | 1.43% | 1.80% | 1.26% |
Supplemental Data | | | | | |
Net assets, end of period (in millions) | $ 916 | $ 1,302 | $ 1,662 | $ 2,004 | $ 5,774 |
Portfolio turnover rate E | 48% | 59% | 92% | 88% | 105% |
A Total returns would have been lower if certain expenses had not been reduced during the applicable periods shown.
B Total returns do not include the effect of the sales charges.
C Calculated based on average shares outstanding during the period.
D Fees and expenses of any underlying Fidelity Central Funds are not included in the Fund's expense ratio. The Fund indirectly bears its proportionate share of the expenses of any underlying Fidelity Central Funds.
E Amount does not include the portfolio activity of any underlying Fidelity Central Funds.
F Investment income per share reflects a special dividend which amounted to $.06 per share. Excluding the special dividend, the ratio of net investment income (loss) to average net assets would have been .98%.
G Expense ratios reflect operating expenses of the class. Expenses before reductions do not reflect amounts reimbursed by the investment adviser or reductions from brokerage service arrangements or reductions from other expense offset arrangements and do not represent the amount paid by the class during periods when reimbursements or reductions occur. Expenses net of fee waivers reflect expenses after reimbursement by the investment adviser but prior to reductions from brokerage service arrangements or other expense offset arrangements. Expenses net of all reductions represent the net expenses paid by the class.
H Amount represents less than $.01 per share.
See accompanying notes which are an integral part of the financial statements.
Annual Report
Financial Highlights - Class T
Years ended October 31, | 2011 | 2010 | 2009 | 2008 | 2007 |
Selected Per-Share Data | | | | | |
Net asset value, beginning of period | $ 15.47 | $ 14.11 | $ 12.42 | $ 26.30 | $ 23.17 |
Income from Investment Operations | | | | | |
Net investment income (loss) C | .18 F | .10 | .14 | .31 | .25 |
Net realized and unrealized gain (loss) | (.99) | 1.43 | 1.94 | (11.01) | 4.63 |
Total from investment operations | (.81) | 1.53 | 2.08 | (10.70) | 4.88 |
Distributions from net investment income | (.16) | (.16) | (.39) | (.16) | (.18) |
Distributions from net realized gain | (.03) | (.01) | - | (3.02) | (1.57) |
Total distributions | (.20) I | (.17) | (.39) | (3.18) | (1.75) |
Redemption fees added to paid in capital C,H | - | - | - | - | - |
Net asset value, end of period | $ 14.46 | $ 15.47 | $ 14.11 | $ 12.42 | $ 26.30 |
Total Return A,B | (5.35)% | 10.88% | 17.84% | (46.04)% | 22.43% |
Ratios to Average Net Assets D,G | | | | | |
Expenses before reductions | 1.55% | 1.55% | 1.58% | 1.49% | 1.47% |
Expenses net of fee waivers, if any | 1.55% | 1.55% | 1.58% | 1.49% | 1.47% |
Expenses net of all reductions | 1.53% | 1.53% | 1.55% | 1.44% | 1.43% |
Net investment income (loss) | 1.14% F | .71% | 1.19% | 1.57% | 1.04% |
Supplemental Data | | | | | |
Net assets, end of period (in millions) | $ 404 | $ 621 | $ 832 | $ 1,110 | $ 3,569 |
Portfolio turnover rate E | 48% | 59% | 92% | 88% | 105% |
A Total returns would have been lower if certain expenses had not been reduced during the applicable periods shown.
B Total returns do not include the effect of the sales charges.
C Calculated based on average shares outstanding during the period.
D Fees and expenses of any underlying Fidelity Central Funds are not included in the Fund's expense ratio. The Fund indirectly bears its proportionate share of the expenses of any underlying Fidelity Central Funds.
E Amount does not include the portfolio activity of any underlying Fidelity Central Funds.
F Investment income per share reflects a special dividend which amounted to $.06 per share. Excluding the special dividend, the ratio of net investment income (loss) to average net assets would have been .74%.
G Expense ratios reflect operating expenses of the class. Expenses before reductions do not reflect amounts reimbursed by the investment adviser or reductions from brokerage service arrangements or reductions from other expense offset arrangements and do not represent the amount paid by the class during periods when reimbursements or reductions occur. Expenses net of fee waivers reflect expenses after reimbursement by the investment adviser but prior to reductions from brokerage service arrangements or other expense offset arrangements. Expenses net of all reductions represent the net expenses paid by the class.
H Amount represents less than $.01 per share.
I Total distributions of $.20 per share is comprised of distributions from net investment income of $.164 and distributions from net realized gain of $.034 per share.
See accompanying notes which are an integral part of the financial statements.
Annual Report
Financial Highlights - Class B
Years ended October 31, | 2011 | 2010 | 2009 | 2008 | 2007 |
Selected Per-Share Data | | | | | |
Net asset value, beginning of period | $ 14.91 | $ 13.61 | $ 11.95 | $ 25.44 | $ 22.46 |
Income from Investment Operations | | | | | |
Net investment income (loss) C | .09 F | .02 | .08 | .18 | .10 |
Net realized and unrealized gain (loss) | (.96) | 1.38 | 1.88 | (10.62) | 4.50 |
Total from investment operations | (.87) | 1.40 | 1.96 | (10.44) | 4.60 |
Distributions from net investment income | (.10) | (.09) | (.30) | (.03) | (.05) |
Distributions from net realized gain | (.03) | (.01) | - | (3.02) | (1.57) |
Total distributions | (.13) | (.10) | (.30) | (3.05) | (1.62) |
Redemption fees added to paid in capital C,H | - | - | - | - | - |
Net asset value, end of period | $ 13.91 | $ 14.91 | $ 13.61 | $ 11.95 | $ 25.44 |
Total Return A,B | (5.89)% | 10.34% | 17.25% | (46.39)% | 21.73% |
Ratios to Average Net Assets D,G | | | | | |
Expenses before reductions | 2.08% | 2.09% | 2.10% | 2.08% | 2.08% |
Expenses net of fee waivers, if any | 2.08% | 2.09% | 2.10% | 2.08% | 2.08% |
Expenses net of all reductions | 2.06% | 2.07% | 2.07% | 2.04% | 2.04% |
Net investment income (loss) | .61% F | .18% | .67% | .97% | .42% |
Supplemental Data | | | | | |
Net assets, end of period (in millions) | $ 94 | $ 157 | $ 191 | $ 221 | $ 559 |
Portfolio turnover rate E | 48% | 59% | 92% | 88% | 105% |
A Total returns would have been lower if certain expenses had not been reduced during the applicable periods shown.
B Total returns do not include the effect of the contingent deferred sales charge.
C Calculated based on average shares outstanding during the period.
D Fees and expenses of any underlying Fidelity Central Funds are not included in the Fund's expense ratio. The Fund indirectly bears its proportionate share of the expenses of any underlying Fidelity Central Funds.
E Amount does not include the portfolio activity of any underlying Fidelity Central Funds.
F Investment income per share reflects a special dividend which amounted to $.06 per share. Excluding the special dividend, the ratio of net investment income (loss) to average net assets would have been .21%.
G Expense ratios reflect operating expenses of the class. Expenses before reductions do not reflect amounts reimbursed by the investment adviser or reductions from brokerage service arrangements or reductions from other expense offset arrangements and do not represent the amount paid by the class during periods when reimbursements or reductions occur. Expenses net of fee waivers reflect expenses after reimbursement by the investment adviser but prior to reductions from brokerage service arrangements or other expense offset arrangements. Expenses net of all reductions represent the net expenses paid by the class.
H Amount represents less than $.01 per share.
See accompanying notes which are an integral part of the financial statements.
Annual Report
Financial Highlights - Class C
Years ended October 31, | 2011 | 2010 | 2009 | 2008 | 2007 |
Selected Per-Share Data | | | | | |
Net asset value, beginning of period | $ 14.95 | $ 13.65 | $ 11.98 | $ 25.50 | $ 22.53 |
Income from Investment Operations | | | | | |
Net investment income (loss) C | .10 F | .03 | .08 | .20 | .12 |
Net realized and unrealized gain (loss) | (.96) | 1.38 | 1.89 | (10.64) | 4.50 |
Total from investment operations | (.86) | 1.41 | 1.97 | (10.44) | 4.62 |
Distributions from net investment income | (.11) | (.10) | (.30) | (.06) | (.08) |
Distributions from net realized gain | (.03) | (.01) | - | (3.02) | (1.57) |
Total distributions | (.14) | (.11) | (.30) | (3.08) | (1.65) |
Redemption fees added to paid in capital C,H | - | - | - | - | - |
Net asset value, end of period | $ 13.95 | $ 14.95 | $ 13.65 | $ 11.98 | $ 25.50 |
Total Return A,B | (5.83)% | 10.32% | 17.24% | (46.33)% | 21.81% |
Ratios to Average Net Assets D,G | | | | | |
Expenses before reductions | 2.05% | 2.06% | 2.09% | 2.01% | 2.00% |
Expenses net of fee waivers, if any | 2.05% | 2.06% | 2.09% | 2.01% | 2.00% |
Expenses net of all reductions | 2.03% | 2.04% | 2.06% | 1.97% | 1.96% |
Net investment income (loss) | .64% F | .21% | .68% | 1.04% | .51% |
Supplemental Data | | | | | |
Net assets, end of period (in millions) | $ 302 | $ 419 | $ 502 | $ 618 | $ 1,673 |
Portfolio turnover rate E | 48% | 59% | 92% | 88% | 105% |
A Total returns would have been lower if certain expenses had not been reduced during the applicable periods shown.
B Total returns do not include the effect of the contingent deferred sales charge.
C Calculated based on average shares outstanding during the period.
D Fees and expenses of any underlying Fidelity Central Funds are not included in the Fund's expense ratio. The Fund indirectly bears its proportionate share of the expenses of any underlying Fidelity Central Funds.
E Amount does not include the portfolio activity of any underlying Fidelity Central Funds.
F Investment income per share reflects a special dividend which amounted to $.06 per share. Excluding the special dividend, the ratio of net investment income (loss) to average net assets would have been .24%.
G Expense ratios reflect operating expenses of the class. Expenses before reductions do not reflect amounts reimbursed by the investment adviser or reductions from brokerage service arrangements or reductions from other expense offset arrangements and do not represent the amount paid by the class during periods when reimbursements or reductions occur. Expenses net of fee waivers reflect expenses after reimbursement by the investment adviser but prior to reductions from brokerage service arrangements or other expense offset arrangements. Expenses net of all reductions represent the net expenses paid by the class.
H Amount represents less than $.01 per share.
See accompanying notes which are an integral part of the financial statements.
Annual Report
Financial Highlights - Institutional Class
Years ended October 31, | 2011 | 2010 | 2009 | 2008 | 2007 |
Selected Per-Share Data | | | | | |
Net asset value, beginning of period | $ 15.90 | $ 14.48 | $ 12.81 | $ 27.06 | $ 23.78 |
Income from Investment Operations | | | | | |
Net investment income (loss) B | .28 E | .19 | .21 | .41 | .38 |
Net realized and unrealized gain (loss) | (1.03) | 1.47 | 1.98 | (11.34) | 4.76 |
Total from investment operations | (.75) | 1.66 | 2.19 | (10.93) | 5.14 |
Distributions from net investment income | (.25) | (.23) | (.52) | (.30) | (.29) |
Distributions from net realized gain | (.03) | (.01) | - | (3.02) | (1.57) |
Total distributions | (.28) | (.24) | (.52) | (3.32) | (1.86) |
Redemption fees added to paid in capital B,G | - | - | - | - | - |
Net asset value, end of period | $ 14.87 | $ 15.90 | $ 14.48 | $ 12.81 | $ 27.06 |
Total Return A | (4.85)% | 11.55% | 18.45% | (45.79)% | 23.07% |
Ratios to Average Net Assets C,F | | | | | |
Expenses before reductions | .99% | .99% | 1.07% | .99% | .98% |
Expenses net of fee waivers, if any | .99% | .99% | 1.07% | .99% | .98% |
Expenses net of all reductions | .97% | .97% | 1.04% | .94% | .94% |
Net investment income (loss) | 1.70% E | 1.28% | 1.70% | 2.07% | 1.53% |
Supplemental Data | | | | | |
Net assets, end of period (in millions) | $ 723 | $ 1,316 | $ 1,540 | $ 2,235 | $ 5,266 |
Portfolio turnover rate D | 48% | 59% | 92% | 88% | 105% |
A Total returns would have been lower if certain expenses had not been reduced during the applicable periods shown.
B Calculated based on average shares outstanding during the period.
C Fees and expenses of any underlying Fidelity Central Funds are not included in the Fund's expense ratio. The Fund indirectly bears its proportionate share of the expenses of any underlying Fidelity Central Funds.
D Amount does not include the portfolio activity of any underlying Fidelity Central Funds.
E Investment income per share reflects a special dividend which amounted to $.06 per share. Excluding the special dividend, the ratio of net investment income (loss) to average net assets would have been 1.30%.
F Expense ratios reflect operating expenses of the class. Expenses before reductions do not reflect amounts reimbursed by the investment adviser or reductions from brokerage service arrangements or reductions from other expense offset arrangements and do not represent the amount paid by the class during periods when reimbursements or reductions occur. Expenses net of fee waivers reflect expenses after reimbursement by the investment adviser but prior to reductions from brokerage service arrangements or other expense offset arrangements. Expenses net of all reductions represent the net expenses paid by the class.
G Amount represents less than $.01 per share.
See accompanying notes which are an integral part of the financial statements.
Annual Report
Notes to Financial Statements
For the period ended October 31, 2011
(Amounts in thousands except percentages)
1. Organization.
Fidelity Advisor Diversified International Fund (the Fund) is a fund of Fidelity Advisor Series VIII (the Trust) and is authorized to issue an unlimited number of shares. The Trust is registered under the Investment Company Act of 1940, as amended (the 1940 Act), as an open-end management investment company organized as a Massachusetts business trust.
The Fund offers Class A, Class T, Class C and Institutional Class shares, each of which, along with Class B shares, has equal rights as to assets and voting privileges. Effective after the close of business on September 1, 2010, Class B shares were closed to new accounts and additional purchases, except for exchanges and reinvestments by existing shareholders. Each class has exclusive voting rights with respect to matters that affect that class. Class B shares will automatically convert to Class A shares after a holding period of seven years from the initial date of purchase. Investment income, realized and unrealized capital gains and losses, the common expenses of the Fund, and certain fund-level expense reductions, if any, are allocated on a pro-rata basis to each class based on the relative net assets of each class to the total net assets of the Fund. Each class differs with respect to transfer agent and distribution and service plan fees incurred. Certain expense reductions may also differ by class.
2. Investments in Fidelity Central Funds.
The Fund invests in Fidelity Central Funds, which are open-end investment companies available only to other investment companies and accounts managed by Fidelity Management & Research Company (FMR) and its affiliates. The Fund's Schedule of Investments lists each of the Fidelity Central Funds held as of period end, if any, as an investment of the Fund, but does not include the underlying holdings of each Fidelity Central Fund. As an Investing Fund, the Fund indirectly bears its proportionate share of the expenses of the underlying Fidelity Central Funds.
The Money Market Central Funds seek preservation of capital and current income and are managed by Fidelity Investments Money Management, Inc. (FIMM), an affiliate of FMR.
A complete unaudited list of holdings for each Fidelity Central Fund is available upon request or at the Securities and Exchange Commission (the SEC) web site at www.sec.gov. In addition, the financial statements of the Fidelity Central Funds, which are not covered by the Fund's Report of Independent Registered Public Accounting Firm are available on the SEC web site or upon request.
Annual Report
3. Significant Accounting Policies.
The financial statements have been prepared in conformity with accounting principles generally accepted in the United States of America (GAAP), which require management to make certain estimates and assumptions at the date of the financial statements. Actual results could differ from those estimates. Subsequent events, if any, through the date that the financial statements were issued have been evaluated in the preparation of the financial statements. The following summarizes the significant accounting policies of the Fund:
Security Valuation. Investments are valued as of 4:00 p.m. Eastern time on the last calendar day of the period. The Fund uses independent pricing services approved by the Board of Trustees to value its investments. When current market prices or quotations are not readily available or reliable, valuations may be determined in good faith in accordance with procedures adopted by the Board of Trustees. Factors used in determining value may include market or security specific events. The frequency with which these procedures are used cannot be predicted and they may be utilized to a significant extent. The value used for net asset value (NAV) calculation under these procedures may differ from published prices for the same securities.
The Fund categorizes the inputs to valuation techniques used to value its investments into a disclosure hierarchy consisting of three levels as shown below:
Level 1 - quoted prices in active markets for identical investments
Level 2 - other significant observable inputs (including quoted prices for similar investments, interest rates, prepayment speeds, etc.)
Level 3 - unobservable inputs (including the Fund's own assumptions based on the best information available)
Changes in valuation techniques may result in transfers in or out of an assigned level within the disclosure hierarchy. The aggregate value of investments by input level, as of October 31, 2011, as well as a roll forward of Level 3 securities, is included at the end of the Fund's Schedule of Investments. Valuation techniques used to value the Fund's investments by major category are as follows:
Equity securities, including restricted securities, for which market quotations are readily available, are valued at the last reported sale price or official closing price as reported by an independent pricing service on the primary market or exchange on which they are traded and are categorized as Level 1 in the hierarchy. In the event there were no sales during the day or closing prices are not available, securities are valued at the last quoted bid price or may be valued using the last available price and are generally categorized as Level 2 in the hierarchy. For foreign equity securities, when significant market or security specific events arise, comparisons to the valuation of American Depositary Receipts
Annual Report
Notes to Financial Statements - continued
(Amounts in thousands except percentages)
3. Significant Accounting Policies - continued
Security Valuation - continued
(ADRs), futures contracts, Exchange-traded funds (ETFs) and certain indexes as well as quoted prices for similar securities are used and are categorized as Level 2 in the hierarchy in these circumstances. Utilizing these techniques may result in transfers between Level 1 and Level 2. For restricted equity securities and private placements where observable inputs are limited, assumptions about market activity and risk are used and are categorized as Level 3 in the hierarchy.
Debt securities, including restricted securities, are valued based on evaluated prices received from independent pricing services or from dealers who make markets in such securities. For master notes, pricing services utilize matrix pricing which considers yield or price of bonds of comparable quality, coupon, maturity and type as well as dealer supplied prices and are generally categorized as Level 2 in the hierarchy. When independent prices are unavailable or unreliable, debt securities may be valued utilizing pricing matrices which consider similar factors that would be used by independent pricing services. These are generally categorized as Level 2 in the hierarchy but may be Level 3 depending on the circumstances.
Investments in open-end mutual funds, including the Fidelity Central Funds, are valued at their closing net asset value each business day and are categorized as Level 1 in the hierarchy.
Foreign Currency. The Fund may use foreign currency contracts to facilitate transactions in foreign-denominated securities. Gains and losses from these transactions may arise from changes in the value of the foreign currency or if the counterparties do not perform under the contracts' terms.
Foreign-denominated assets, including investment securities, and liabilities are translated into U.S. dollars at the exchange rate at period end. Purchases and sales of investment securities, income and dividends received and expenses denominated in foreign currencies are translated into U.S. dollars at the exchange rate in effect on the transaction date.
The effects of exchange rate fluctuations on investments are included with the net realized and unrealized gain (loss) on investment securities. Other foreign currency transactions resulting in realized and unrealized gain (loss) are disclosed separately.
Annual Report
3. Significant Accounting Policies - continued
Investment Transactions and Income. For financial reporting purposes, the Fund's investment holdings and NAV include trades executed through the end of the last business day of the period. The NAV per share for processing shareholder transactions is calculated as of the close of business of the New York Stock Exchange (NYSE), normally 4:00 p.m. Eastern time and includes trades executed through the end of the prior business day. Gains and losses on securities sold are determined on the basis of identified cost and may include proceeds received from litigation. Dividend income is recorded on the ex-dividend date, except for certain dividends from foreign securities where the ex-dividend date may have passed, which are recorded as soon as the Fund is informed of the ex-dividend date. Non-cash dividends included in dividend income, if any, are recorded at the fair market value of the securities received. Distributions received on securities that represent a return of capital or capital gain are recorded as a reduction of cost of investments and/or as a realized gain. The Fund estimates the components of distributions received that may be considered return of capital distributions or capital gain distributions. Large, non-recurring dividends recognized by the Fund are presented separately on the Statement of Operations as "Special Dividends" and the impact of these dividends is presented in the Financial Highlights. Interest income and distributions from the Fidelity Central Funds are accrued as earned. Interest income includes coupon interest and amortization of premium and accretion of discount on debt securities. Investment income is recorded net of foreign taxes withheld where recovery of such taxes is uncertain.
Expenses. Expenses directly attributable to a fund are charged to that fund. Expenses attributable to more than one fund are allocated among the respective funds on the basis of relative net assets or other appropriate methods. Expense estimates are accrued in the period to which they relate and adjustments are made when actual amounts are known.
Deferred Trustee Compensation. Under a Deferred Compensation Plan (the Plan), independent Trustees may elect to defer receipt of a portion of their annual compensation. Deferred amounts are invested in a cross-section of Fidelity funds, are marked-to-market and remain in the Fund until distributed in accordance with the Plan. The investment of deferred amounts and the offsetting payable to the Trustees are included in the accompanying Statement of Assets and Liabilities.
Income Tax Information and Distributions to Shareholders. Each year, the Fund intends to qualify as a regulated investment company, including distributing substantially all of its taxable income and realized gains under Subchapter M of the Internal Revenue Code and filing its U.S. federal tax return. As a result, no provision for income taxes is required. As of October 31, 2011, the Fund did not have any unrecognized tax benefits in the financial statements. A fund's federal tax return is subject to examination by the Internal Revenue Service (IRS) for a period of three years. Foreign taxes are provided for based on the Fund's understanding of the tax rules and rates that exist in the foreign markets in which it invests.
Annual Report
Notes to Financial Statements - continued
(Amounts in thousands except percentages)
3. Significant Accounting Policies - continued
Income Tax Information and Distributions to Shareholders - continued
Distributions are declared and recorded on the ex-dividend date. Income dividends and capital gain distributions are declared separately for each class. Income and capital gain distributions are determined in accordance with income tax regulations, which may differ from GAAP.
Capital accounts within the financial statements are adjusted for permanent book-tax differences. These adjustments have no impact on net assets or the results of operations. Temporary book-tax differences will reverse in a subsequent period.
Book-tax differences are primarily due to foreign currency transactions, passive foreign investment companies (PFIC), deferred trustees compensation, capital loss carryforwards and losses deferred due to wash sales.
The federal tax cost of investment securities and unrealized appreciation (depreciation) as of period end were as follows:
Gross unrealized appreciation | $ 376,198 |
Gross unrealized depreciation | (230,250) |
Net unrealized appreciation (depreciation) on securities and other investments | $ 145,948 |
| |
Tax Cost | $ 2,348,952 |
The tax-based components of distributable earnings as of period end were as follows:
Undistributed ordinary income | $ 26,452 |
Capital loss carryforward | $ (3,034,664) |
Net unrealized appreciation (depreciation) | $ 145,969 |
Under the recently enacted Regulated Investment Company Modernization Act of 2010 (the Act), the Fund will be permitted to carry forward capital losses incurred in taxable years beginning after December 22, 2010 for an unlimited period. However, any losses incurred during those future taxable years will be required to be utilized prior to any losses incurred in pre-enactment taxable years, which generally expire after eight years from when they are incurred. Additionally, post-enactment capital losses that are carried forward will retain their character as either short-term or long-term capital losses rather than being considered all short-term as under previous law. The Fund's first fiscal year end subject to the Act will be October 31, 2012.
Annual Report
3. Significant Accounting Policies - continued
Income Tax Information and Distributions to Shareholders - continued
The tax character of distributions paid was as follows:
| October 31, 2011 | October 31, 2010 |
Ordinary Income | $ 53,423 | $ 63,025 |
Short-Term Trading (Redemption) Fees. Shares held by investors in the Fund less than 30 days are subject to a redemption fee equal to 1.00% of the net asset value of shares redeemed. All redemption fees, which reduce the proceeds of the shareholder redemption, are retained by the Fund and accounted for as an addition to paid in capital.
New Accounting Pronouncement. In May 2011, the Financial Accounting Standards Board issued Accounting Standard Update No. 2011-04, Fair Value Measurement (Topic 820) - Amendments to Achieve Common Fair Value Measurement and Disclosure Requirements in U.S. GAAP and IFRSs. The update changes the wording used to describe the requirements in GAAP for measuring fair value and for disclosing information about fair value measurements. The update is effective during interim and annual periods beginning after December 15, 2011. Management is currently evaluating the impact of the update's adoption on the Fund's financial statement disclosures.
4. Operating Policies.
Delayed Delivery Transactions and When-Issued Securities. During the period, the Fund transacted in securities on a delayed delivery or when-issued basis. Payment and delivery may take place after the customary settlement period for that security. The price of the underlying securities and the date when the securities will be delivered and paid for are fixed at the time the transaction is negotiated. During the time a delayed delivery sell is outstanding, the contract is marked-to-market daily and equivalent deliverable securities are held for the transaction. The Fund may receive compensation for interest forgone in the purchase of a delayed delivery or when-issued security. With respect to purchase commitments, the Fund identifies securities as segregated in its records with a value at least equal to the amount of the commitment. Losses may arise due to changes in the value of the underlying securities or if the counterparty does not perform under the contract's terms, or if the issuer does not issue the securities due to political, economic, or other factors.
Restricted Securities. The Fund may invest in securities that are subject to legal or contractual restrictions on resale. These securities generally may be resold in transactions exempt from registration or to the public if the securities are registered. Disposal of these securities may involve time-consuming negotiations and expense, and prompt sale at an acceptable price may be difficult. Information regarding restricted securities is included at the end of the Fund's Schedule of Investments.
Annual Report
Notes to Financial Statements - continued
(Amounts in thousands except percentages)
5. Purchases and Sales of Investments.
Purchases and sales of securities, other than short-term securities, aggregated $1,545,645 and $2,749,361, respectively.
6. Fees and Other Transactions with Affiliates.
Management Fee. FMR and its affiliates provide the Fund with investment management related services for which the Fund pays a monthly management fee. The management fee is the sum of an individual fund fee rate that is based on an annual rate of .45% of the Fund's average net assets and a group fee rate that averaged .26% during the period. The group fee rate is based upon the average net assets of all the mutual funds advised by FMR. The group fee rate decreases as assets under management increase and increases as assets under management decrease. For the period, the total annual management fee rate was .71% of the Fund's average net assets.
Distribution and Service Plan Fees. In accordance with Rule 12b-1 of the 1940 Act, the Fund has adopted separate Distribution and Service Plans for each class of shares, except for the Institutional Class. Certain classes pay Fidelity Distributors Corporation (FDC), an affiliate of FMR, separate Distribution and Service Fees, each of which is based on an annual percentage of each class' average net assets. In addition, FDC may pay financial intermediaries for selling shares of the Fund and providing shareholder support services. For the period, the Distribution and Service Fee rates, total fees and amounts retained by FDC were as follows:
| Distribution
Fee | Service
Fee | Total
Fees | Retained
by FDC |
Class A | -% | .25% | $ 2,863 | $ 48 |
Class T | .25% | .25% | 2,660 | 15 |
Class B | .75% | .25% | 1,285 | 965 |
Class C | .75% | .25% | 3,752 | 153 |
| | | $ 10,560 | $ 1,181 |
Sales Load. FDC may receive a front-end sales charge of up to 5.75% for selling Class A shares, and 3.50% for selling Class T shares, some of which is paid to financial intermediaries for selling shares of the Fund. Depending on the holding period, FDC may receive contingent deferred sales charges levied on Class A, Class T, Class B, and Class C redemptions. The deferred sales charges range from 5% to 1% for Class B, 1% for Class C, 1.00% for certain purchases of Class A shares and .25% for certain purchases of Class T shares.
Annual Report
6. Fees and Other Transactions with Affiliates - continued
Sales Load - continued
For the period, sales charge amounts retained by FDC were as follows:
| Retained
by FDC |
Class A | $ 120 |
Class T | 32 |
Class B* | 208 |
Class C* | 15 |
| $ 375 |
* When Class B and Class C shares are initially sold, FDC pays commissions from its own resources to financial intermediaries through which the sales are made.
Transfer Agent Fees. Fidelity Investments Institutional Operations Company, Inc. (FIIOC), an affiliate of FMR, is the transfer, dividend disbursing and shareholder servicing agent for each class of the Fund. FIIOC receives account fees and asset-based fees that vary according to the account size and type of account of the shareholders of the respective classes of the Fund. FIIOC pays for typesetting, printing and mailing of shareholder reports, except proxy statements. For the period, transfer agent fees for each class were as follows:
| Amount | % of
Average
Net Assets |
Class A | $ 3,204 | .28 |
Class T | 1,482 | .28 |
Class B | 388 | .30 |
Class C | 1,004 | .27 |
Institutional Class | 2,235 | .21 |
| $ 8,313 | |
Accounting and Security Lending Fees. Fidelity Service Company, Inc. (FSC), an affiliate of FMR, maintains the Fund's accounting records. The accounting fee is based on the level of average net assets for the month. Under a separate contract, FSC administers the security lending program. The security lending fee is based on the number and duration of lending transactions.
Brokerage Commissions. The Fund placed a portion of its portfolio transactions with brokerage firms which are affiliates of the investment adviser. The commissions paid to these affiliated firms were $14 for the period.
Annual Report
Notes to Financial Statements - continued
(Amounts in thousands except percentages)
6. Fees and Other Transactions with Affiliates - continued
Interfund Lending Program. Pursuant to an Exemptive Order issued by the SEC, the Fund, along with other registered investment companies having management contracts with FMR, may participate in an interfund lending program. This program provides an alternative credit facility allowing the funds to borrow from, or lend money to, other participating affiliated funds. At period end, there were no interfund loans outstanding. The Fund's activity in this program during the period for which loans were outstanding was as follows:
Borrower or Lender | Average Daily
Loan Balance | Weighted Average Interest Rate | Interest
Expense |
Borrower | $ 9,674 | .33% | $ 1 |
7. Committed Line of Credit.
The Fund participates with other funds managed by FMR or an affiliate in a $4.0 billion credit facility (the "line of credit") to be utilized for temporary or emergency purposes to fund shareholder redemptions or for other short-term liquidity purposes. The Fund has agreed to pay commitment fees on its pro-rata portion of the line of credit, which amounted to $10 and is reflected in Miscellaneous expenses on the Statement of Operations. During the period, there were no borrowings on this line of credit.
8. Security Lending.
The Fund lends portfolio securities through a lending agent from time to time in order to earn additional income. For equity securities, a lending agent is used and may loan securities to certain qualified borrowers, including Fidelity Capital Markets (FCM), a broker-dealer affiliated with the Fund. On the settlement date of the loan, the Fund receives collateral (in the form of U.S. Treasury obligations, letters of credit and/or cash) against the loaned securities and maintains collateral in an amount not less than 100% of the market value of the loaned securities during the period of the loan. The market value of the loaned securities is determined at the close of business of the Fund and any additional required collateral is delivered to the Fund on the next business day. If the borrower defaults on its obligation to return the securities loaned because of insolvency or other reasons, a fund could experience delays and costs in recovering the securities loaned or in gaining access to the collateral. Any cash collateral received is invested in the Fidelity Securities Lending Cash Central Fund. The value of loaned securities and cash collateral at period end are disclosed on the Fund's Statement of Assets and Liabilities. At period end, there were no security loans outstanding with FCM. Security lending income represents the income earned on investing cash collateral, less rebates paid to borrowers and any lending agent fees associated with the loan, plus any premium
Annual Report
8. Security Lending - continued
payments received for lending certain types of securities. Security lending income is presented in the Statement of Operations as a component of income from Fidelity Central Funds. Total security lending income during the period amounted to $2,043, including eighty-eight dollars from securities loaned to FCM.
9. Expense Reductions.
Many of the brokers with whom FMR places trades on behalf of the Fund provided services to the Fund in addition to trade execution. These services included payments of certain expenses on behalf of the Fund totaling $700 for the period. In addition, through arrangements with the Fund's custodian, credits realized as a result of uninvested cash balances were used to reduce the Fund's expenses. During the period, these credits reduced the Fund's custody expenses by $1.
10. Distributions to Shareholders.
Distributions to shareholders of each class were as follows:
Years ended October 31, | 2011 | 2010 |
From net investment income | | |
Class A | $ 15,976 | $ 21,908 |
Class T | 6,296 | 9,175 |
Class B | 993 | 1,280 |
Class C | 2,886 | 3,424 |
Institutional Class | 19,246 | 23,986 |
Total | $ 45,397 | $ 59,773 |
From net realized gain | | |
Class A | $ 2,738 | $ 1,135 |
Class T | 1,311 | 581 |
Class B | 343 | 138 |
Class C | 927 | 360 |
Institutional Class | 2,707 | 1,038 |
Total | $ 8,026 | $ 3,252 |
Annual Report
Notes to Financial Statements - continued
(Amounts in thousands except percentages)
11. Share Transactions.
Transactions for each class of shares were as follows:
| Shares | Dollars |
Years ended October 31, | 2011 | 2010 | 2011 | 2010 |
Class A | | | | |
Shares sold | 9,002 | 11,857 | $ 142,807 | $ 171,401 |
Reinvestment of distributions | 1,034 | 1,361 | 16,424 | 20,356 |
Shares redeemed | (30,677) | (46,493) | (486,880) | (670,244) |
Net increase (decrease) | (20,641) | (33,275) | $ (327,649) | $ (478,487) |
Class T | | | | |
Shares sold | 2,789 | 5,521 | $ 43,918 | $ 79,294 |
Reinvestment of distributions | 447 | 636 | 7,039 | 9,432 |
Shares redeemed | (15,458) | (24,938) | (243,511) | (355,762) |
Net increase (decrease) | (12,222) | (18,781) | $ (192,554) | $ (267,036) |
Class B | | | | |
Shares sold | 58 | 579 | $ 888 | $ 8,025 |
Reinvestment of distributions | 75 | 88 | 1,145 | 1,270 |
Shares redeemed | (3,940) | (4,186) | (60,055) | (57,671) |
Net increase (decrease) | (3,807) | (3,519) | $ (58,022) | $ (48,376) |
Class C | | | | |
Shares sold | 1,225 | 1,779 | $ 18,824 | $ 24,719 |
Reinvestment of distributions | 191 | 201 | 2,917 | 2,898 |
Shares redeemed | (7,773) | (10,773) | (118,247) | (148,900) |
Net increase (decrease) | (6,357) | (8,793) | $ (96,506) | $ (121,283) |
Institutional Class | | | | |
Shares sold | 10,009 | 22,171 | $ 160,916 | $ 322,782 |
Reinvestment of distributions | 1,047 | 1,330 | 16,863 | 20,174 |
Shares redeemed | (45,174) | (47,045) | (728,438) | (687,069) |
Net increase (decrease) | (34,118) | (23,544) | $ (550,659) | $ (344,113) |
12. Other.
The Fund's organizational documents provide former and current trustees and officers with a limited indemnification against liabilities arising in connection with the performance of their duties to the Fund. In the normal course of business, the Fund may also enter into contracts that provide general indemnifications. The Fund's maximum exposure under these arrangements is unknown as this would be dependent on future claims that may be made against the Fund. The risk of material loss from such claims is considered remote.
Annual Report
To the Trustees of Fidelity Advisor Series VIII and the Shareholders of Fidelity Advisor Diversified International Fund:
In our opinion, the accompanying statement of assets and liabilities, including the schedule of investments, and the related statements of operations and of changes in net assets and the financial highlights present fairly, in all material respects, the financial position of Fidelity Advisor Diversified International Fund (a fund of Fidelity Advisor Series VIII) at October 31, 2011, the results of its operations for the year then ended, the changes in its net assets for each of the two years in the period then ended and the financial highlights for each of the five years in the period then ended, in conformity with accounting principles generally accepted in the United States of America. These financial statements and financial highlights (hereafter referred to as "financial statements") are the responsibility of the Fidelity Advisor Diversified International Fund's management. Our responsibility is to express an opinion on these financial statements based on our audits. We conducted our audits of these financial statements in accordance with the standards of the Public Company Accounting Oversight Board (United States). Those standards require that we plan and perform the audit to obtain reasonable assurance about whether the financial statements are free of material misstatement. An audit includes examining, on a test basis, evidence supporting the amounts and disclosures in the financial statements, assessing the accounting principles used and significant estimates made by management, and evaluating the overall financial statement presentation. We believe that our audits, which included confirmation of securities at October 31, 2011 by correspondence with the custodian and brokers, provide a reasonable basis for our opinion.
/s/ PricewaterhouseCoopers LLP
PricewaterhouseCoopers LLP
Boston, Massachusetts
December 12, 2011
Annual Report
The Trustees, Members of the Advisory Board, and executive officers of the trust and fund, as applicable, are listed below. The Board of Trustees governs the fund and is responsible for protecting the interests of shareholders. The Trustees are experienced executives who meet periodically throughout the year to oversee the fund's activities, review contractual arrangements with companies that provide services to the fund, oversee management of the risks associated with such activities and contractual arrangements, and review the fund's performance. Except for James C. Curvey, each of the Trustees oversees 226 funds advised by FMR or an affiliate. Mr. Curvey oversees 429 funds advised by FMR or an affiliate.
The Trustees hold office without limit in time except that (a) any Trustee may resign; (b) any Trustee may be removed by written instrument, signed by at least two-thirds of the number of Trustees prior to such removal; (c) any Trustee who requests to be retired or who has become incapacitated by illness or injury may be retired by written instrument signed by a majority of the other Trustees; and (d) any Trustee may be removed at any special meeting of shareholders by a two-thirds vote of the outstanding voting securities of the trust. Each Trustee who is not an interested person (as defined in the 1940 Act) (Independent Trustee), shall retire not later than the last day of the calendar year in which his or her 75th birthday occurs. The Independent Trustees may waive this mandatory retirement age policy with respect to individual Trustees. The executive officers and Advisory Board Members hold office without limit in time, except that any officer and Advisory Board Member may resign or may be removed by a vote of a majority of the Trustees at any regular meeting or any special meeting of the Trustees. Except as indicated, each individual has held the office shown or other offices in the same company for the past five years.
Experience, Skills, Attributes, and Qualifications of the Fund's Trustees. The Governance and Nominating Committee has adopted a statement of policy that describes the experience, qualifications, attributes, and skills that are necessary and desirable for potential Independent Trustee candidates (Statement of Policy). The Board believes that each Trustee satisfied at the time he or she was initially elected or appointed a Trustee, and continues to satisfy, the standards contemplated by the Statement of Policy. The Governance and Nominating Committee also engages professional search firms to help identify potential Independent Trustee candidates who have the experience, qualifications, attributes, and skills consistent with the Statement of Policy. From time to time, additional criteria based on the composition and skills of the current Independent Trustees, as well as experience or skills that may be appropriate in light of future changes to board composition, business conditions, and regulatory or other developments, have also been considered by the professional search firms and the Governance and Nominating Committee. In addition, the Board takes into account the Trustees' commitment and participation in Board and committee meetings, as well as their leadership of standing and ad hoc committees throughout their tenure.
In determining that a particular Trustee was and continues to be qualified to serve as a Trustee, the Board has considered a variety of criteria, none of which, in isolation, was controlling. The Board believes that, collectively, the Trustees have balanced and diverse experience, qualifications, attributes, and skills, which allow the Board to operate effectively in governing the fund and protecting the interests of shareholders. Information about the specific experience, skills, attributes, and qualifications of each Trustee, which in each case led to the Board's conclusion that the Trustee should serve (or continue to serve) as a trustee of the fund, is provided below.
Annual Report
Board Structure and Oversight Function. James C. Curvey is an interested person (as defined in the 1940 Act) and currently serves as Acting Chairman. The Trustees have determined that an interested Chairman is appropriate and benefits shareholders because an interested Chairman has a personal and professional stake in the quality and continuity of services provided to the fund. Independent Trustees exercise their informed business judgment to appoint an individual of their choosing to serve as Chairman, regardless of whether the Trustee happens to be independent or a member of management. The Independent Trustees have determined that they can act independently and effectively without having an Independent Trustee serve as Chairman and that a key structural component for assuring that they are in a position to do so is for the Independent Trustees to constitute a substantial majority for the Board. The Independent Trustees also regularly meet in executive session. Ned C. Lautenbach serves as Chairman of the Independent Trustees and as such (i) acts as a liaison between the Independent Trustees and management with respect to matters important to the Independent Trustees and (ii) with management prepares agendas for Board meetings.
Fidelity funds are overseen by different Boards of Trustees. The fund's Board oversees Fidelity's equity and high income funds and another Board oversees Fidelity's investment-grade bond, money market, and asset allocation funds. The asset allocation funds may invest in Fidelity funds overseen by the fund's Board. The use of separate Boards, each with its own committee structure, allows the Trustees of each group of Fidelity funds to focus on the unique issues of the funds they oversee, including common research, investment, and operational issues. On occasion, the separate Boards establish joint committees to address issues of overlapping consequences for the Fidelity funds overseen by each Board.
The Trustees operate using a system of committees to facilitate the timely and efficient consideration of all matters of importance to the Trustees, the fund, and fund shareholders and to facilitate compliance with legal and regulatory requirements and oversight of the fund's activities and associated risks. The Board, acting through its committees, has charged FMR and its affiliates with (i) identifying events or circumstances the occurrence of which could have demonstrably adverse effects on the fund's business and/or reputation; (ii) implementing processes and controls to lessen the possibility that such events or circumstances occur or to mitigate the effects of such events or circumstances if they do occur; and (iii) creating and maintaining a system designed to evaluate continuously business and market conditions in order to facilitate the identification and implementation processes described in (i) and (ii) above. Because the day-to-day operations and activities of the fund are carried out by or through FMR, its affiliates and other service providers, the fund's exposure to risks is mitigated but not eliminated by the processes overseen by the Trustees. While each of the Board's committees has responsibility for overseeing different aspects of the fund's activities, oversight is exercised primarily through the Operations, Audit, and Compliance Committees. In addition, the Independent Trustees have worked with FMR to enhance the Board's oversight of investment and financial risks, legal and regulatory risks, technology risks, and operational risks, including the development of additional risk reporting to the Board. For example, a working group comprised of Independent Trustees and FMR has worked and continues to work to review the Fidelity funds' valuation-related activities, reporting and risk management. Appropriate personnel, including but not limited to the fund's Chief Compliance Officer (CCO), FMR's internal auditor, the independent accountants, the fund's Treasurer and portfolio management personnel, make periodic reports to the Board's committees, as appropriate, including an annual review of FMR's risk management program for the Fidelity funds. The responsibilities of each standing committee, including their oversight responsibilities, are described further under "Standing Committees of the Fund's Trustees."
Annual Report
Trustees and Officers - continued
The fund's Statement of Additional Information (SAI) includes more information about the Trustees. To request a free copy, call Fidelity at 1-877-208-0098.
Interested Trustees*:
Correspondence intended for each Trustee who is an interested person may be sent to Fidelity Investments, 82 Devonshire Street, Boston, Massachusetts 02109.
Name, Age; Principal Occupations and Other Relevant Experience+ |
James C. Curvey (76) |
| Year of Election or Appointment: 2007 Mr. Curvey is Trustee and Acting Chairman of the Board of Trustees of certain Trusts. Mr. Curvey also serves as Trustee (2007-present) of other investment companies advised by FMR. Mr. Curvey is a Director of Fidelity Investments Money Management, Inc. (2009-present), Director of Fidelity Research & Analysis Co. (2009-present) and Director of FMR and FMR Co., Inc. (2007-present). Mr. Curvey is also Vice Chairman (2007-present) and Director of FMR LLC. In addition, Mr. Curvey serves as an Overseer for the Boston Symphony Orchestra and a member of the Trustees of Villanova University. Previously, Mr. Curvey was the Vice Chairman (2006-2007) and Director (2000-2007) of FMR Corp. |
Ronald P. O'Hanley (54) |
| Year of Election or Appointment: 2011 Mr. O'Hanley is Director of FMR Co., Inc. (2010-present), Director of Fidelity Investments Money Management, Inc. (2010-present), Director of Fidelity Research & Analysis Company (2010-present), President of Fidelity Asset Management and Corporate Services and a member of Fidelity's Executive Committee (2010-present). Previously, Mr. O'Hanley served as President and Chief Executive Officer of BNY Mellon Asset Management (2007-2010). Mr. O'Hanley also served as Vice Chairman of Bank New York Mellon Corp. and a member of that firm's Executive Committee. Prior to the 2007 merger of The Bank of New York and Mellon Financial Corporation, he was Vice Chairman of Mellon Financial Corporation and President and Chief Executive Officer of Mellon Asset Management. He joined Mellon in February 1997. Mr. O'Hanley currently serves as Chairman of the Boston Public Library Foundation Board of Directors and sits on the Board of Directors of Beth Israel Deaconess Medical Center, the Board of Trustees of the Marine Biological Laboratory and the Advisory Board of the Maxwell School of Citizenship and Public Administration at Syracuse University. Mr. O'Hanley also chairs the Council on Asset Management for the Financial Services Roundtable and is a member of the Board of Directors of Institutional Investor's U.S. Institute. |
* Trustees have been determined to be "Interested Trustees" by virtue of, among other things, their affiliation with the trust or various entities under common control with FMR.
+ The information above includes each Trustee's principal occupation during the last five years and other information relating to the experience, attributes, and skills relevant to each Trustee's qualifications to serve as a Trustee, which led to the conclusion that each Trustee should serve as a Trustee for the fund.
Annual Report
Trustees and Officers - continued
Independent Trustees:
Correspondence intended for each Independent Trustee (that is, the Trustees other than the Interested Trustees) may be sent to Fidelity Investments, P.O. Box 55235, Boston, Massachusetts 02205-5235.
Name, Age; Principal Occupations and Other Relevant Experience+ |
Dennis J. Dirks (63) |
| Year of Election or Appointment: 2005 Prior to his retirement in May 2003, Mr. Dirks was Chief Operating Officer and a member of the Board of The Depository Trust & Clearing Corporation (DTCC). He also served as President, Chief Operating Officer, and Board member of The Depository Trust Company (DTC) and President and Board member of the National Securities Clearing Corporation (NSCC). In addition, Mr. Dirks served as Chief Executive Officer and Board member of the Government Securities Clearing Corporation, Chief Executive Officer and Board member of the Mortgage-Backed Securities Clearing Corporation, as a Trustee and a member of the Finance Committee of Manhattan College (2005-2008), and as a Trustee and a member of the Finance Committee of AHRC of Nassau County (2006-2008). Mr. Dirks is a member of the Independent Directors Council (IDC) Governing Council (2010-Present) and Board of Directors for The Brookville Center for Children's Services, Inc. (2009-present). |
Alan J. Lacy (58) |
| Year of Election or Appointment: 2008 Mr. Lacy serves as Senior Adviser (2007-present) of Oak Hill Capital Partners, L.P. (private equity). Mr. Lacy also served as Chief Executive Officer (2000-2005) and Vice Chairman (2005-2006) of Sears Holdings Corporation and Sears, Roebuck and Co. (retail). In addition, Mr. Lacy serves as a member of the Board of Directors of Dave & Buster's, Inc. (restaurant and entertainment complexes, 2010-present), The Hillman Companies, Inc. (hardware wholesalers, 2010-present), and Bristol-Myers Squibb Company (global pharmaceuticals, 2007-present). Mr. Lacy is a member of the Board of Trustees of The National Parks Conservation Association (2006-Present). Previously, Mr. Lacy served as Chairman of the Board of Trustees of the National Parks Conservation Association (2008-2011) and as a member of the Board of Directors for the Western Union Company (global money transfer, 2006-2011). |
Ned C. Lautenbach (67) |
| Year of Election or Appointment: 2000 Mr. Lautenbach is Chairman of the Independent Trustees of the Equity and High Income Funds (2006-present). Mr. Lautenbach currently serves as the Lead Director of the Eaton Corporation Board of Directors (diversified industrial, 1997-present). Mr. Lautenbach is also a member of the Board of Directors of the Philharmonic Center for the Arts in Naples, Florida (1999-present); a member of the Board of Trustees of Fairfield University (2005-present); and a member of the Council on Foreign Relations (1994-present). Previously, Mr. Lautenbach was a Partner/Advisory Partner at Clayton, Dubilier & Rice, LLC (private equity investment, 1998-2010), as well as a Director of Sony Corporation (2006-2007). |
Joseph Mauriello (67) |
| Year of Election or Appointment: 2008 Prior to his retirement in January 2006, Mr. Mauriello served in numerous senior management positions including Deputy Chairman and Chief Operating Officer (2004-2005), and Vice Chairman of Financial Services (2002-2004) of KPMG LLP US (professional services, 1965-2005). Mr. Mauriello currently serves as a member of the Board of Directors of XL Group plc. (global insurance and re-insurance, 2006-present) and of Arcadia Resources Inc. (health care services and products, 2007-present). Previously, Mr. Mauriello served as a Director of the Hamilton Funds of the Bank of New York (2006-2007). |
Robert W. Selander (61) |
| Year of Election or Appointment: 2011 Previously, Mr. Selander served as a Member of the Advisory Board of Fidelity's Equity and High Income Funds (2011), Executive Vice Chairman (2010), Chief Executive Officer (2009-2010), and President and Chief Executive Officer (1997-2009) of Mastercard, Inc. |
Cornelia M. Small (67) |
| Year of Election or Appointment: 2005 Ms. Small is a member of the Board of Directors of the Teagle Foundation (2009-present). Ms. Small is also a member of the Investment Committee, and Chair (2008-present) and a member of the Board of Trustees of Smith College. In addition, Ms. Small serves on the Investment Committee of the Berkshire Taconic Community Foundation (2008-present). Previously, Ms. Small served as Chairperson of the Investment Committee (2002-2008) of Smith College. In addition, Ms. Small served as Chief Investment Officer, Director of Global Equity Investments, and a member of the Board of Directors of Scudder, Stevens & Clark and Scudder Kemper Investments. |
William S. Stavropoulos (72) |
| Year of Election or Appointment: 2001 Mr. Stavropoulos is Vice Chairman of the Independent Trustees of the Equity and High Income Funds (2006-present). Mr. Stavropoulos serves as President and Founder of the Michigan Baseball Foundation, the Great Lakes Loons (2007-present). Mr. Stavropoulos is Chairman Emeritus of the Board of Directors of The Dow Chemical Company, where he previously served in numerous senior management positions, including President, CEO (1995-2000; 2002-2004), Chairman of the Executive Committee (2000-2006), and as a member of the Board of Directors (1990-2006). Currently, Mr. Stavropoulos is Chairman of Univar (global distributor of commodity and specialty chemicals, 2010-present), a Director of Teradata Corporation (data warehousing and technology solutions, 2008-present), Chemical Financial Corporation, Maersk Inc. (industrial conglomerate), Tyco International, Inc. (multinational manufacturing and services, 2007-present), and a member of the Advisory Board for Metalmark Capital (private equity investment, 2005-present). Mr. Stavropoulos is a special advisor to Clayton, Dubilier & Rice, LLC (private equity investment). In addition, Mr. Stavropoulos is a member of the University of Notre Dame Advisory Council for the College of Science. |
David M. Thomas (62) |
| Year of Election or Appointment: 2008 Previously, Mr. Thomas served as Executive Chairman (2005-2006) and Chairman and Chief Executive Officer (2000-2005) of IMS Health, Inc. (pharmaceutical and healthcare information solutions). In addition, Mr. Thomas serves as a member of the Board of Directors of Fortune Brands, Inc. (consumer products), and Interpublic Group of Companies, Inc. (marketing communication, 2004-present). |
Michael E. Wiley (61) |
| Year of Election or Appointment: 2008 Mr. Wiley also serves as a Director of Asia Pacific Exploration Consolidated (international oil and gas exploration and production, 2008-present). Mr. Wiley serves as a Director of Tesoro Corporation (independent oil refiner and marketer, 2005-present), and a Director of Bill Barrett Corporation (exploration and production, 2005-present). In addition, Mr. Wiley also serves as a Director of Post Oak Bank (privately-held bank, 2004-present). Previously, Mr. Wiley served as a member of the Board of Trustees of the University of Tulsa (2000-2006; 2007-2010), as a Senior Energy Advisor of Katzenbach Partners, LLC (consulting, 2006-2007), as an Advisory Director of Riverstone Holdings (private investment), Chairman, President, and CEO of Baker Hughes, Inc. (oilfield services, 2000-2004), and as Director of Spinnaker Exploration Company (exploration and production, 2001-2005). |
Annual Report
+ The information above includes each Trustee's principal occupation during the last five years and other information relating to the experience, attributes, and skills relevant to each Trustee's qualifications to serve as a Trustee, which led to the conclusion that each Trustee should serve as a Trustee for the fund.
Advisory Board Members and Executive Officers:
Correspondence intended for each executive officer, Edward C. Johnson 3d, and Peter S. Lynch may be sent to Fidelity Investments, 82 Devonshire Street, Boston, Massachusetts 02109.
Name, Age; Principal Occupation |
Edward C. Johnson 3d (81) |
| Year of Election or Appointment: 2011 Member of the Advisory Board of Fidelity's Equity and High Income Funds. Mr. Johnson serves as Chief Executive Officer, Chairman, and a Director of FMR LLC, and also serves as Chairman and Director of FIL Limited. Previously, Mr. Johnson served as a Trustee and Chairman of the Board of certain Fidelity Trusts, Chairman and a Director of FMR, Chairman and a Director of FMR Co., Inc., and President of FMR LLC (2006-2007). |
Peter S. Lynch (67) |
| Year of Election or Appointment: 2003 Member of the Advisory Board of Fidelity's Equity and High Income Funds. Mr. Lynch is Vice Chairman and a Director of FMR and FMR Co., Inc. In addition, Mr. Lynch serves as a Trustee of Boston College and as the Chairman of the Inner-City Scholarship Fund. Previously, Mr. Lynch served on the Special Olympics International Board of Directors (1997-2006). |
Kenneth B. Robins (42) |
| Year of Election or Appointment: 2008 President and Treasurer of Fidelity's Equity and High Income Funds. Mr. Robins also serves as President and Treasurer (2010-present) and Assistant Treasurer (2009-present) of other Fidelity funds and is an employee of Fidelity Investments (2004-present). Previously, Mr. Robins served as Deputy Treasurer of the Fidelity funds (2005-2008) and Treasurer and Chief Financial Officer of The North Carolina Capital Management Trust: Cash and Term Portfolios (2006-2008). |
Bruce T. Herring (46) |
| Year of Election or Appointment: 2006 Vice President of certain Equity Funds. Mr. Herring also serves as Chief Investment Officer and Director of Fidelity Management & Research (U.K.) Inc. (2010-present) and Group Chief Investments Officer of FMR. Previously, Mr. Herring served as Vice President (2005-2006) and Senior Vice President (2006-2007) of Fidelity Management & Research Company, Vice President of FMR Co., Inc. (2001-2007) and as a portfolio manager for Fidelity U.S. Equity Funds. |
Brian B. Hogan (47) |
| Year of Election or Appointment: 2009 Vice President of Equity and High Income Funds. Mr. Hogan also serves as President of FMR's Equity Division (2009-present). Previously, Mr. Hogan served as Senior Vice President, Equity Research of FMR (2006-2009) and as a portfolio manager. |
Scott C. Goebel (43) |
| Year of Election or Appointment: 2008 Secretary and Chief Legal Officer (CLO) of the Fidelity funds. Mr. Goebel also serves as Secretary of Fidelity Investments Money Management, Inc. (FIMM) (2010-present) and Fidelity Research and Analysis Company (FRAC) (2010-present); Secretary and CLO of The North Carolina Capital Management Trust: Cash and Term Portfolios (2008-present); General Counsel, Secretary, and Senior Vice President of FMR (2008-present) and FMR Co., Inc. (2008-present); employed by FMR LLC or an affiliate (2001-present); Chief Legal Officer of Fidelity Management & Research (Hong Kong) Limited (2008-present) and Assistant Secretary of Fidelity Management & Research (Japan) Inc. (2008-present), and Fidelity Management & Research (U.K.) Inc. (2008-present). Previously, Mr. Goebel served as Assistant Secretary of FIMM (2008-2010), FRAC (2008-2010), and the Funds (2007-2008) and as Vice President and Secretary of Fidelity Distributors Corporation (FDC) (2005-2007). |
William C. Coffey (42) |
| Year of Election or Appointment: 2009 Assistant Secretary of Fidelity's Equity and High Income Funds. Mr. Coffey also serves as Senior Vice President and Deputy General Counsel of FMR LLC (2010-present), and is an employee of Fidelity Investments. Previously, Mr. Coffey served as Vice President and Associate General Counsel of FMR LLC (2005-2009). |
Holly C. Laurent (57) |
| Year of Election or Appointment: 2008 Anti-Money Laundering (AML) Officer of the Fidelity funds. Ms. Laurent also serves as AML Officer of The North Carolina Capital Management Trust: Cash and Term Portfolios (2008-present) and is an employee of Fidelity Investments. Previously, Ms. Laurent was Senior Vice President and Head of Legal for Fidelity Business Services India Pvt. Ltd. (2006-2008), and Senior Vice President, Deputy General Counsel and Group Head for FMR LLC (2005-2006). |
Christine Reynolds (53) |
| Year of Election or Appointment: 2008 Chief Financial Officer of the Fidelity funds. Ms. Reynolds became President of Fidelity Pricing and Cash Management Services (FPCMS) in August 2008. Ms. Reynolds served as Chief Operating Officer of FPCMS (2007-2008). Previously, Ms. Reynolds served as President, Treasurer, and Anti-Money Laundering officer of the Fidelity funds (2004-2007). |
Kenneth A. Rathgeber (64) |
| Year of Election or Appointment: 2004 Chief Compliance Officer of Fidelity's Equity and High Income Funds. Mr. Rathgeber is Chief Compliance Officer of Fidelity Management & Research (Hong Kong) Limited (2008-present), Fidelity Management & Research (Japan) Inc. (2008-present), FMR (2005-present), FMR Co., Inc. (2005-present), Fidelity Management & Research (U.K.) Inc. (2005-present), Fidelity Research & Analysis Company (2005-present), Fidelity Investments Money Management, Inc. (2005-present), Pyramis Global Advisors, LLC (2005-present), and Strategic Advisers, Inc. (2005-present). |
Jeffrey S. Christian (50) |
| Year of Election or Appointment: 2009 Deputy Treasurer of the Fidelity funds. Mr. Christian is an employee of Fidelity Investments. Previously, Mr. Christian served as Chief Financial Officer (2008-2009) of certain Fidelity funds and Senior Vice President of Fidelity Pricing and Cash Management Services (FPCMS) (2004-2009). |
Joseph F. Zambello (54) |
| Year of Election or Appointment: 2011 Deputy Treasurer of the Fidelity funds. Mr. Zambello is an employee of Fidelity Investments. Previously, Mr. Zambello served as Vice President of FMR's Program Management Group (2009-2011) and Vice President of the Transfer Agent Oversight Group (2005-2009). |
Adrien E. Deberghes (44) |
| Year of Election or Appointment: 2008 Deputy Treasurer of Fidelity's Equity and High Income Funds. Mr. Deberghes also serves as Vice President and Assistant Treasurer of Fidelity Rutland Square Trust II and Fidelity Commonwealth Trust II (2011-present), Assistant Treasurer of other Fidelity funds (2010-present), and is an employee of Fidelity Investments (2008-present). Previously, Mr. Deberghes served as Senior Vice President of Mutual Fund Administration at State Street Corporation (2007-2008), Senior Director of Mutual Fund Administration at Investors Bank & Trust (2005-2007), and Director of Finance for Dunkin' Brands (2000-2005). |
Stephanie J. Dorsey (42) |
| Year of Election or Appointment: 2010 Assistant Treasurer of Fidelity's Equity and High Income Funds. Ms. Dorsey also serves as Deputy Treasurer of other Fidelity funds (2008-present) and is an employee of Fidelity Investments (2008-present). Previously, Ms. Dorsey served as Treasurer (2004-2008) of the JPMorgan Mutual Funds and Vice President (2004-2008) of JPMorgan Chase Bank. |
John R. Hebble (53) |
| Year of Election or Appointment: 2009 Assistant Treasurer of Fidelity's Equity and High Income Funds. Mr. Hebble also serves as President (2011-present), Treasurer, and Chief Financial Officer of The North Carolina Capital Management Trust: Cash and Term Portfolios (2008-present), President and Treasurer of other Fidelity funds (2008-present) and is an employee of Fidelity Investments. |
Gary W. Ryan (53) |
| Year of Election or Appointment: 2005 Assistant Treasurer of the Fidelity funds. Mr. Ryan is an employee of Fidelity Investments. Previously, Mr. Ryan served as Vice President of Fund Reporting in Fidelity Pricing and Cash Management Services (FPCMS) (1999-2005). |
Jonathan Davis (43) |
| Year of Election or Appointment: 2010 Assistant Treasurer of the Fidelity funds. Mr. Davis is also Assistant Treasurer of Fidelity Rutland Square Trust II and Fidelity Commonwealth Trust II. Mr. Davis is an employee of Fidelity Investments. Previously, Mr. Davis served as Vice President and Associate General Counsel of FMR LLC (2003-2010). |
Annual Report
Class I designates 100% of the dividends distributed during the fiscal year as amounts which may be taken into account as a dividend for purposes of the maximum rate under section 1(h)(11) of the Internal Revenue Code.
The amounts per share which represent income derived from sources within, and taxes paid to, foreign countries or possessions of the United States are as follows:
| Pay Date | Income | Taxes |
Class I | 12/06/10 | $0.252 | $0.0303 |
Class I | 12/31/10 | $0.058 | $0.0000 |
The fund will notify shareholders in January 2012 of amounts for use in preparing 2011 income tax returns.
Annual Report
Board Approval of Investment Advisory Contracts and Management Fees
Fidelity Advisor Diversified International Fund
Each year, the Board of Trustees, including the Independent Trustees (together, the Board), votes on the renewal of the management contract and sub-advisory agreements (together, the Advisory Contracts) for the fund. The Board, assisted by the advice of fund counsel and Independent Trustees' counsel, requests and considers a broad range of information relevant to the renewal of the Advisory Contracts throughout the year.
The Board meets regularly and considers at each of its meetings factors that are relevant to its annual consideration of the renewal of the fund's Advisory Contracts, including the services and support provided to the fund and its shareholders. The Board has established various standing committees, each composed of Independent Trustees with varying backgrounds, to which the Board has assigned specific subject matter responsibilities in order to enhance effective decision-making by the Board. The Board, acting directly and through its Committees, requests and receives information concerning the annual consideration of the renewal of the fund's Advisory Contracts. The Board also meets as needed to consider matters specifically related to the Board's annual consideration of the renewal of Advisory Contracts. Members of the Board may also meet with trustees of other Fidelity funds through ad hoc joint committees to discuss certain matters relevant to the Fidelity funds.
At its July 2011 meeting, the Board of Trustees, including the Independent Trustees, unanimously determined to renew the fund's Advisory Contracts. In reaching its determination, the Board considered all factors it believed relevant, including (i) the nature, extent, and quality of the services to be provided to the fund and its shareholders (including the investment performance of the fund); (ii) the competitiveness of the fund's management fee and total expense ratio; (iii) the total costs of the services to be provided by and the profits to be realized by Fidelity from its relationship with the fund; (iv) the extent to which economies of scale would be realized as the fund grows; and (v) whether fee levels reflect these economies of scale, if any, for the benefit of fund shareholders.
In considering whether to renew the Advisory Contracts for the fund, the Board reached a determination, with the assistance of fund counsel and Independent Trustees' counsel and through the exercise of its business judgment, that the renewal of the Advisory Contracts is in the best interests of the fund and its shareholders and that the compensation payable under the Advisory Contracts is fair and reasonable. The Board's decision to renew the Advisory Contracts was not based on any single factor, but rather was based on a comprehensive consideration of all the information provided to the Board at its meetings throughout the year. The Board, in reaching its determination to renew the Advisory Contracts, is aware that shareholders in the fund have a broad range of investment choices available to them, including a wide choice among mutual funds offered by Fidelity's competitors, and that the fund's shareholders, who have the opportunity to review and weigh the disclosure provided by the fund in its prospectus and other public disclosures, have chosen to invest in this fund, managed by Fidelity.
Annual Report
Nature, Extent, and Quality of Services Provided. The Board considered the staffing within the investment adviser, FMR, and the sub-advisers (together, the Investment Advisers), including the backgrounds of the fund's investment personnel and the fund's investment objective and discipline. The Independent Trustees also had discussions with senior management of Fidelity's investment operations and investment groups. The Board considered the structure of the portfolio manager compensation program and whether this structure provides appropriate incentives to act in the best interests of the fund.
Resources Dedicated to Investment Management and Support Services. The Board and the Fund Oversight and Research Committees reviewed the general qualifications and capabilities of the Investment Advisers' investment staff, including its size, education, experience, and resources, as well as the Investment Advisers' approach to recruiting, training, managing, and compensating investment personnel. The Board also noted that FMR has devoted increased resources to non-U.S. offices. The Board noted that Fidelity's analysts have extensive resources, tools and capabilities which allow them to conduct sophisticated quantitative and fundamental analysis, as well as credit analysis of issuers, counterparties and enhancers. The Board also believes that Fidelity's investment professionals have sufficient access to global information and data so as to provide competitive investment results over time, and that those professionals also have access to sophisticated tools which permit them to assess portfolio construction and risk and performance attribution characteristics continuously, as well as to transmit new information and research conclusions rapidly around the world. Additionally, in their deliberations, the Board considered the Investment Advisers' trading capabilities and resources which are an integral part of the investment management process.
Shareholder and Administrative Services. The Board considered (i) the nature, extent, quality, and cost of advisory, administrative, and shareholder services performed by the Investment Advisers and their affiliates under the Advisory Contracts and under separate agreements covering transfer agency, pricing and bookkeeping, and securities lending services for the fund; (ii) the nature and extent of the investment adviser's supervision of third party service providers, principally custodians and subcustodians; and (iii) the resources devoted to, and the record of compliance with, the fund's compliance policies and procedures. The Board also reviewed the allocation of fund brokerage, including allocations to brokers affiliated with the Investment Advisers, the use of brokerage commissions to pay fund expenses, and the use of "soft" commission dollars to pay for research services.
The Board noted that the growth of fund assets over time across the complex allows Fidelity to reinvest in the development of services designed to enhance the value or convenience of the Fidelity funds as investment vehicles. These services include 24-hour access to account information and market information through telephone representatives and over the Internet, investor education materials and asset allocation tools, and the expanded availability of Fidelity Investor Centers, with 35 new branches opening since 2010.
Annual Report
Board Approval of Investment Advisory Contracts and
Management Fees - continued
Investment in a Large Fund Family. The Board considered the benefits to shareholders of investing in a Fidelity fund, including the benefits of investing in a fund that is part of a large family of funds offering a variety of investment disciplines and providing a large variety of mutual fund investor services. The Board noted that Fidelity had taken, or had made recommendations that resulted in the Fidelity funds taking, a number of actions over the previous year that benefited particular funds, including (i) continuing to dedicate additional resources to investment research and support of the senior management team that oversees asset management; (ii) rationalizing product lines through the mergers of six funds into other funds; (iii) continuing to migrate the Freedom Funds to dedicated lower cost underlying funds; (iv) obtaining shareholder approval to broaden the investment strategies for Fidelity Consumer Finance Portfolio, Fidelity Emerging Asia Fund, and Fidelity Environment and Alternative Energy Portfolio; (v) contractually agreeing to reduce the management fees and impose other expense limitations on Spartan 500 Index Fund and U.S. Bond Index Fund in connection with launching new institutional classes of these funds; (vi) changing the name, primary and supplemental benchmarks, and investment policies of Fidelity Global Strategies Fund to support the fund's flexible investment mandate and global orientation; and (vii) reducing the transfer agency account fee rates on certain accounts.
Investment Performance. The Board considered whether the fund has operated in accordance with its investment objective, as well as its record of compliance with its investment restrictions. It also reviewed the fund's absolute investment performance for each class, as well as the fund's relative investment performance for each class measured over multiple periods against (i) a broad-based securities market index, and (ii) a peer group of mutual funds deemed appropriate by Fidelity and reviewed by the Board. The following charts considered by the Board show, over the one-, three-, and five-year periods ended December 31, 2010, the cumulative total returns of Institutional Class (Class I) and Class B of the fund, the cumulative total returns of a broad-based securities market index ("benchmark"), and a range of cumulative total returns of a peer group of mutual funds identified by Morningstar, Inc. as having an investment style similar to that of the fund based on underlying portfolio holdings. The returns of Institutional Class (Class I) and Class B show the performance of the highest and lowest performing classes, respectively (based on five-year performance). The box within each chart shows the 25th percentile return (bottom of box) and the 75th percentile return (top of box) of the peer group. Returns shown above the box are in the first quartile and returns shown below the box are in the fourth quartile. The percentage beaten numbers noted below each chart correspond to the percentile box and represent the percentage of funds in the peer group whose performance was equal to or lower than that of the class indicated.
Annual Report
Fidelity Advisor Diversified International Fund

The Board reviewed the fund's relative investment performance against its peer group and noted that the performance of Institutional Class (Class I) of the fund was in the second quartile for the one-year period, the third quartile for the three-year period, and the fourth quartile for the five-year period. The Board also noted that the investment performance of the fund was lower than its benchmark for the three- and five-year periods, although the one-year total return of Institutional Class (Class I) compared favorably to its benchmark. The Board considered that the variations in performance among the fund's classes reflect the variations in class expenses, which result in lower performance for higher expense classes. The Board also reviewed the fund's performance since inception as well as performance in the current year.
Based on its review, the Board concluded that the nature, extent, and quality of services provided to the fund under the Advisory Contracts should benefit the fund's shareholders.
Competitiveness of Management Fee and Total Expense Ratio. The Board considered the fund's management fee and total expense ratio compared to "mapped groups" of competitive funds and classes. Fidelity creates "mapped groups" by combining similar Lipper investment objective categories that have comparable management fee characteristics. Combining Lipper investment objective categories aids the Board's management fee and total expense ratio comparisons by broadening the competitive group used for comparison and by reducing the number of universes to which various Fidelity funds are compared.
Annual Report
Board Approval of Investment Advisory Contracts and
Management Fees - continued
Management Fee. The Board considered two proprietary management fee comparisons for the 12-month periods shown in the chart below. The group of Lipper funds used by the Board for management fee comparisons is referred to below as the "Total Mapped Group." The Total Mapped Group comparison focuses on a fund's standing relative to the total universe of comparable funds available to investors in terms of gross management fees before expense reimbursements or caps. "TMG %" represents the percentage of funds in the Total Mapped Group that had management fees that were lower than the fund's. For example, a TMG % of 16% means that 84% of the funds in the Total Mapped Group had higher management fees than the fund. The "Asset-Size Peer Group" (ASPG) comparison focuses on a fund's standing relative to non-Fidelity funds similar in size to the fund within the Total Mapped Group. The ASPG represents at least 15% of the funds in the Total Mapped Group with comparable asset size and management fee characteristics, subject to a minimum of 50 funds (or all funds in the Total Mapped Group if fewer than 50). Additional information, such as the ASPG quartile in which the fund's management fee ranked, is also included in the chart and considered by the Board.
Fidelity Advisor Diversified International Fund

The Board noted that the fund's management fee ranked below the median of its Total Mapped Group and below the median of its ASPG for 2010.
Based on its review, the Board concluded that the fund's management fee is fair and reasonable in light of the services that the fund receives and the other factors considered.
Total Expense Ratio. In its review of each class's total expense ratio, the Board considered the fund's management fee as well as other fund or class expenses, as applicable, such as transfer agent fees, pricing and bookkeeping fees, fund-paid 12b-1 fees, and custodial, legal, and audit fees. The Board also noted the effects of any waivers and reimbursements on fees and expenses. As part of its review, the Board also considered the current and historical total expense ratios of each class of the fund compared to competitive fund median expenses. Each class of the fund is compared to those funds and classes in the Total Mapped Group (used by the Board for management fee comparisons) that have a similar sales load structure.
Annual Report
The Board noted that the total expense ratio of each of Class A, Class B, Class C, and Institutional Class ranked below its competitive median for 2010 and the total expense ratio of Class T ranked above its competitive median for 2010. The Board considered that various factors, including 12b-1 fees, positive or negative performance adjustments, and relatively higher other expenses in the case of small fund size, can affect total expense ratios. The Board noted that the total expense ratio of Class T was above the competitive median primarily because of higher 12b-1 fees on Class T. Class T has a higher 12b-1 fee, but a lower front-end sales charge, than traditionally priced front-end sales charge classes. The Board noted that the fund offers multiple classes, each of which has a different sales load and 12b-1 fee structure, and that the multiple structures are intended to offer a range of pricing options for the intermediary market. The Board also noted that the total expense ratios of the classes vary primarily by the level of their 12b-1 fees, although differences in transfer agent fees may also cause expenses to vary from class to class.
Fees Charged to Other Fidelity Clients. The Board also considered Fidelity fee structures and other information with respect to clients of FMR and its affiliates, such as other mutual funds advised or subadvised by FMR or its affiliates, pension plan clients, and other institutional clients. In March 2010, the Board created an ad hoc joint committee with the board of other Fidelity funds (the Committee) to review and compare Fidelity's institutional investment advisory business with its business of providing services to the Fidelity funds, including the differences in services provided, fees charged, and costs incurred, as well as competition in their respective marketplaces.
Based on its review of total expense ratios and fees charged to other Fidelity clients, the Board concluded that the total expense ratio of each class of the fund was reasonable, although Class T was above the median of the universe presented for comparison, in light of the services that the fund and its shareholders receive and the other factors considered, including the findings of the Committee.
Costs of the Services and Profitability. The Board considered the revenues earned and the expenses incurred by Fidelity in conducting the business of developing, marketing, distributing, managing, administering and servicing the fund and its shareholders. The Board also considered the level of Fidelity's profits in respect of all the Fidelity funds.
Annual Report
Board Approval of Investment Advisory Contracts and
Management Fees - continued
On an annual basis, FMR presents to the Board Fidelity's profitability for the fund. Fidelity calculates the profitability for each fund, as well as aggregate profitability for groups of Fidelity funds and all Fidelity funds, using a series of detailed revenue and cost allocation methodologies which originate with the books and records of Fidelity on which Fidelity's audited financial statements are based. The Audit Committee of the Board reviews any significant changes from the prior year's methodologies.
PricewaterhouseCoopers LLP (PwC), independent registered public accounting firm and auditor to Fidelity and certain Fidelity funds, has been engaged annually by the Board as part of the Board's assessment of Fidelity's profitability analysis. PwC's engagement includes the review and assessment of Fidelity's methodologies used in determining the revenues and expenses attributable to Fidelity's mutual fund business, and completion of agreed-upon procedures surrounding the mathematical accuracy of fund profitability and its conformity to allocation methodologies. After considering PwC's reports issued under the engagement and information provided by Fidelity, the Board concluded that while other allocation methods may also be reasonable, Fidelity's profitability methodologies are reasonable in all material respects.
The Board also reviewed Fidelity's non-fund businesses and fall-out benefits related to the mutual fund business as well as cases where Fidelity's affiliates may benefit from or be related to the fund's business.
The Board considered the costs of the services provided by and the profits realized by Fidelity in connection with the operation of the fund and was satisfied that the profitability was not excessive in the circumstances.
Economies of Scale. The Board considered whether there have been economies of scale in respect of the management of the Fidelity funds, whether the Fidelity funds (including the fund) have appropriately benefited from any such economies of scale, and whether there is potential for realization of any further economies of scale. The Board considered the extent to which the fund will benefit from economies of scale through increased services to the fund, through waivers or reimbursements, or through fee or expense reductions. The Board also noted that in 2009, it and the board of other Fidelity funds created an ad hoc committee (the Economies of Scale Committee) to analyze whether FMR attains economies of scale in respect of the management and servicing of the Fidelity funds, whether the Fidelity funds have appropriately benefited from such economies of scale, and whether there is potential for realization of any further economies of scale.
The Board recognized that the fund's management contract incorporates a "group fee" structure, which provides for lower group fee rates as total fund assets under FMR's management increase, and for higher group fee rates as total fund assets under FMR's management decrease. FMR calculates the group fee rates based on a tiered asset "breakpoint" schedule that varies based on asset class. The Board considered that the group fee is designed to deliver the benefits of economies of scale to fund shareholders when total Fidelity fund assets increase, even if assets of any particular fund are unchanged or have declined, because some portion of Fidelity's costs are attributable to services provided to all Fidelity funds, and all funds benefit if those costs can be allocated among more assets. The Board concluded that, given the group fee structure, fund shareholders will benefit from lower management fees as assets under FMR's management increase at the fund complex level, regardless of whether Fidelity achieves any such economies of scale.
Annual Report
The Board concluded, taking into account the analysis of the Economies of Scale Committee, that any potential economies of scale are being appropriately shared between fund shareholders and Fidelity.
Additional Information Requested by the Board. In order to develop fully the factual basis for consideration of the Fidelity funds' Advisory Contracts, the Board requested and received additional information on certain topics, including (i) fund performance trends, actions to be taken by FMR to improve certain funds' overall performance, and Fidelity's long-term strategies for certain funds; (ii) portfolio manager changes that have occurred during the past year and length of portfolio manager tenure for different categories of funds over time; (iii) Fidelity's compensation structure for portfolio managers and other key personnel and strategies for attracting and retaining non-investment personnel; (iv) the amount of the investment that each portfolio manager has made in the Fidelity fund(s) that he or she manages; (v) historical trends in Fidelity's realization of fall-out benefits; (vi) Fidelity's group fee structures and the rationale for the individual fee rates of certain funds; (vii) fund profitability methodology and the impact of certain factors on fund profitability results; (viii) trends regarding industry use of performance fee structures and Fidelity's compliance practices with respect to performance adjustment calculations; (ix) the fee structures in place for certain other Fidelity clients; and (x) explanations regarding the relative total expense ratios of certain funds and classes, total expense competitive trends, and actions that might be taken by FMR to reduce total expense ratios for certain funds and classes.
Based on its evaluation of all of the conclusions noted above, and after considering all factors it believed relevant, the Board ultimately concluded that the advisory fee structures are fair and reasonable, and that the fund's Advisory Contracts should be renewed.
Annual Report
Investment Adviser
Fidelity Management & Research Company
Boston, MA
Investment Sub-Advisers
FMR Co., Inc.
Fidelity Management & Research
(U.K.) Inc.
FIL Investment Advisors
FIL Investments (Japan) Limited
FIL Investment Advisors (U.K.) Ltd.
Fidelity Management & Research
Company (Hong Kong) Limited
Fidelity Management & Research
Company (Japan) Inc.
General Distributor
Fidelity Distributors Corporation
Boston, MA
Transfer and Service Agents
Fidelity Investments Institutional Operations Company, Inc.
Boston, MA
Fidelity Service Company, Inc.
Boston, MA
Custodian
State Street Bank and Trust Company
Quincy, MA
ADIFI-UANN-1211
1.784736.108
(Fidelity Investment logo)(registered trademark)
Fidelity Advisor®
Emerging Asia
Fund - Class A, Class T, Class B
and Class C
Annual Report
October 31, 2011
Contents
Chairman's Message | (Click Here) | The Chairman's message to shareholders. |
Performance | (Click Here) | How the fund has done over time. |
Management's Discussion of Fund Performance | (Click Here) | The Portfolio Manager's review of fund performance and strategy. |
Shareholder Expense Example | (Click Here) | An example of shareholder expenses. |
Investment Changes | (Click Here) | A summary of major shifts in the fund's investments over the past six months. |
Investments | (Click Here) | A complete list of the fund's investments with their market values. |
Financial Statements | (Click Here) | Statements of assets and liabilities, operations, and changes in net assets, as well as financial highlights. |
Notes | (Click Here) | Notes to financial statements. |
Report of Independent Registered Public Accounting Firm | (Click Here) | |
Trustees and Officers | (Click Here) | |
Distributions | (Click Here) | |
Board Approval of Investment Advisory Contracts and Management Fees | (Click Here) | |
To view a fund's proxy voting guidelines and proxy voting record for the 12-month period ended June 30, visit http://www.fidelity.com/proxyvotingresults or visit the Securities and Exchange Commission's (SEC) web site at http://www.sec.gov. You may also call 1-877-208-0098 to request a free copy of the proxy voting guidelines.
Standard & Poor's, S&P and S&P 500 are registered service marks of The McGraw-Hill Companies, Inc. and have been licensed for use by Fidelity Distributors Corporation.
Other third party marks appearing herein are the property of their respective owners.
All other marks appearing herein are registered or unregistered trademarks or service marks of FMR LLC or an affiliated company.
Annual Report
This report and the financial statements contained herein are submitted for the general information of the shareholders of the fund. This report is not authorized for distribution to prospective investors in the fund unless preceded or accompanied by an effective prospectus.
A fund files its complete schedule of portfolio holdings with the SEC for the first and third quarters of each fiscal year on Form N-Q. Forms N-Q are available on the SEC's web site at http://www.sec.gov. A fund's Forms N-Q may be reviewed and copied at the SEC's Public Reference Room in Washington, DC. Information regarding the operation of the SEC's Public Reference Room may be obtained by calling 1-800-SEC-0330. For a complete list of a fund's portfolio holdings, view the most recent holdings listing, semiannual report, or annual report on Fidelity's web site at http://www.fidelity.com, http://www.advisor.fidelity.com, or http://www.401k.com, as applicable.
NOT FDIC INSURED • MAY LOSE VALUE • NO BANK GUARANTEE
Neither the fund nor Fidelity Distributors Corporation is a bank.
Annual Report
(photo_of_James_C_Curvey)
Dear Shareholder:
Global equity markets began the fourth quarter on a strong note, sharply reversing course in October amid strong corporate earnings, better-than-expected economic news and the promise of a resolution to the sovereign debt crisis in Europe. The mini rally followed a third quarter marked by a significant downturn in July and August, which heightened investor anxiety and set off a wave of volatility that hampered most major asset classes through the end of September. Financial markets are difficult to predict, of course, but you can help put the odds in your favor by following these time-tested investment principles.
One of the basic tenets is to invest according to your time horizon. For long-term investors, riding out the markets' inevitable ups and downs has proven much more effective than making decisions based on short-term developments. If your goal is approaching, you can also benefit from patience and restraint, rather than attempting to time the market. No matter your time horizon, missing only a few of the markets' best days can significantly diminish returns. Patience also affords the benefits of compounding - earning interest on additional income or reinvested dividends and capital gains. While staying the course doesn't eliminate risk, it can considerably lessen the negative impact of short-term downturns.
Asset allocation is another principle to manage risk. As you spread your portfolio among the asset classes, be sure to consider your time horizon, risk tolerance and investment objectives. Younger investors may be better served by emphasizing equities, which historically have been the best-performing asset class over time. Investors who are nearing a specific goal, such as retirement or sending a child to college, may choose to favor bonds and other investments that have tended to be more stable. Studies indicate that asset allocation is the single most important determinant of a portfolio's long-term success. After deciding on a suitable allocation strategy, make sure your portfolio is adequately diversified, with exposure to stocks of small-, mid- and large-cap companies in a range of sectors, for example. And today, more than ever, geographic diversification should be taken into account.
Lastly, investing a certain amount of money on a regular basis - a principle known as dollar-cost averaging - can help lower the average cost of your purchases, while also giving you the discipline to avoid selling weak performers just prior to an upswing, or chasing a hot performer just before a correction.
We invite you to learn more by visiting us on the Internet, dropping by one of our Investor Centers or calling us by phone. It is our privilege to provide the resources you need to choose investments that are right for you.
Sincerely,
(The acting chairman's signature appears here.)
James C. Curvey
Acting Chairman
Annual Report
Average annual total return reflects the change in the value of an investment, assuming reinvestment of the class' distributions from dividend income and capital gains (the profits earned upon the sale of securities that have grown in value, if any) and assuming a constant rate of performance each year. The $10,000 table and the fund's returns do not reflect the deduction of taxes that a shareholder would pay on fund distributions or the redemption of fund shares. During periods of reimbursement by Fidelity, a fund's total return will be greater than it would be had the reimbursement not occurred. How a fund did yesterday is no guarantee of how it will do tomorrow. Returns reflect the conversion of Class B shares to Class A shares after a maximum of seven years.
Average Annual Total Returns
Periods ended October 31, 2011 | Past 1
year | Past 5
years | Past 10 years |
Class A (incl. 5.75% sales charge) | -12.76% | 9.17% | 15.44% |
Class T (incl. 3.50% sales charge) | -10.93% | 9.39% | 15.41% |
Class B (incl. contingent deferred sales charge) A | -12.49% | 9.35% | 15.52% |
Class C (incl. contingent deferred sales charge) B | -8.97% | 9.65% | 15.27% |
A Class B shares' contingent deferred sales charges included in the past one year, past five years, and past ten years total return figures are 5%, 2%, and 0%, respectively.
B Class C shares' contingent deferred sales charge included in the past one year, past five years, and past ten years total return figures are 1%, 0%, and 0%, respectively.
Annual Report
$10,000 Over 10 Years
Let's say hypothetically that $10,000 was invested in Fidelity Advisor® Emerging Asia Fund - Class A on October 31, 2001, and the current 5.75% sales charge was paid. The chart shows how the value of your investment would have changed, and also shows how the MSCI® AC (All Country) Asia ex Japan Index performed over the same period.
Annual Report
Market Recap: Stocks in emerging Asia lost ground during the 12-month period ending October 31, 2011, weighed down in part by double-digit losses in China and India. Share prices in those two countries struggled against the head wind of a tighter monetary environment, as government officials attempted to tame inflationary pressures without triggering abrupt slowdowns in their rapidly expanding economies. In China's case, inflation cooled a bit toward period end after hitting a three-year peak in July, but food prices continued to expand at a double-digit pace. For the year, the MSCI® AC (All Country) Asia ex Japan Index returned -6.74%. China, with an average benchmark allocation of 18%, finished the period with a roughly -17% return, while India, representing about 10% of the index, returned -20%. The three other major country constituents fared considerably better. Hong Kong, with a 17% weighting, modestly lagged the benchmark, at about -8%. Taiwan checked in with a 16% weighting and a return of -2%. South Korea, the largest benchmark constituent, at 20%, finished in the black, gaining about 7%, bolstered in part by stellar showings from its automakers.
Comments from Colin Chickles, Portfolio Manager of Fidelity Advisor® Emerging Asia Fund: During the year, the fund's Class A, Class T, Class B and Class C shares returned -7.44%, -7.70%, -8.16% and -8.10%, respectively (excluding sales charges), lagging the MSCI index. Stock selection in consumer staples, energy, the banking segment of financials, and telecommunication services hurt the fund's relative results. Geographically, stock picking in India and Hong Kong were negatives. China-based Chaoda Modern Agriculture, the fund's largest relative detractor, was hampered by suspicion the company was overstating the size of its land holdings. Other important detractors included Chinese energy producer PetroChina, which I sold by period end, and an underweighting in wireless carrier and benchmark component China Mobile. Conversely, positioning in materials, information technology and consumer discretionary added value. Geographically, my picks in Taiwan and South Korea bolstered performance. Hong Kong utility Power Assets Holdings was the fund's top relative contributor. The company was able to raise its rates and expand its customer base. Underweighting and ultimately selling two poorly performing benchmark components, Bank of China (Hong Kong) and China Life Insurance, also helped.
Annual Report
The views expressed above reflect those of the portfolio manager(s) only through the end of the period as stated on the cover of this report and do not necessarily represent the views of Fidelity or any other person in the Fidelity organization. Any such views are subject to change at any time based upon market or other conditions and Fidelity disclaims any responsibility to update such views. These views may not be relied on as investment advice and, because investment decisions for a Fidelity fund are based on numerous factors, may not be relied on as an indication of trading intent on behalf of any Fidelity fund.
Annual Report
Shareholder Expense Example
As a shareholder of the Fund, you incur two types of costs: (1) transaction costs, including sales charges (loads) on purchase payments or redemption proceeds, redemption fees, and (2) ongoing costs, including management fees, distribution and/or service (12b-1) fees and other Fund expenses. This Example is intended to help you understand your ongoing costs (in dollars) of investing in the Fund and to compare these costs with the ongoing costs of investing in other mutual funds.
The Example is based on an investment of $1,000 invested at the beginning of the period and held for the entire period (May 1, 2011 to October 31, 2011).
Actual Expenses
The first line of the accompanying table for each class of the Fund provides information about actual account values and actual expenses. You may use the information in this line, together with the amount you invested, to estimate the expenses that you paid over the period. Simply divide your account value by $1,000.00 (for example, an $8,600 account value divided by $1,000.00 = 8.6), then multiply the result by the number in the first line for a class of the Fund under the heading entitled "Expenses Paid During Period" to estimate the expenses you paid on your account during this period. In addition, the Fund, as a shareholder in the underlying Fidelity Central Funds, will indirectly bear its pro-rata share of the fees and expenses incurred by the underlying Fidelity Central Funds. These fees and expenses are not included in the Fund's annualized expense ratio used to calculate the expense estimate in the table below.
Hypothetical Example for Comparison Purposes
The second line of the accompanying table for each class of the Fund provides information about hypothetical account values and hypothetical expenses based on a Class' actual expense ratio and an assumed rate of return of 5% per year before expenses, which is not the Class' actual return. The hypothetical account values and expenses may not be used to estimate the actual ending account balance or expenses you paid for the period. You may use this information to compare the ongoing costs of investing in the Fund and other funds. To do so, compare this 5% hypothetical example with the 5% hypothetical examples that appear in the shareholder reports of the other funds. In addition, the Fund, as a shareholder in the underlying Fidelity Central Funds, will indirectly bear its pro-rata share of the fees and expenses incurred by the underlying Fidelity Central Funds. These fees and expenses are not included in the Fund's annualized expense ratio used to calculate the expense estimate in the table below.
Please note that the expenses shown in the table are meant to highlight your ongoing costs only and do not reflect any transaction costs. Therefore, the second line of the table is useful in comparing ongoing costs only, and will not help you determine the relative total costs of owning different funds. In addition, if these transactional costs were included, your costs would have been higher.
Annual Report
| Annualized
Expense Ratio | Beginning
Account Value
May 1, 2011 | Ending
Account Value
October 31, 2011 | Expenses Paid
During Period*
May 1, 2011 to
October 31, 2011 |
Class A | 1.37% | | | |
Actual | | $ 1,000.00 | $ 833.10 | $ 6.33 |
HypotheticalA | | $ 1,000.00 | $ 1,018.30 | $ 6.97 |
Class T | 1.67% | | | |
Actual | | $ 1,000.00 | $ 832.00 | $ 7.71 |
HypotheticalA | | $ 1,000.00 | $ 1,016.79 | $ 8.49 |
Class B | 2.15% | | | |
Actual | | $ 1,000.00 | $ 829.80 | $ 9.92 |
HypotheticalA | | $ 1,000.00 | $ 1,014.37 | $ 10.92 |
Class C | 2.11% | | | |
Actual | | $ 1,000.00 | $ 829.90 | $ 9.73 |
HypotheticalA | | $ 1,000.00 | $ 1,014.57 | $ 10.71 |
Institutional Class | 1.09% | | | |
Actual | | $ 1,000.00 | $ 834.50 | $ 5.04 |
HypotheticalA | | $ 1,000.00 | $ 1,019.71 | $ 5.55 |
A 5% return per year before expenses
* Expenses are equal to each Class' annualized expense ratio, multiplied by the average account value over the period, multiplied by 184/365 (to reflect the one-half year period).
Annual Report
Investment Changes (Unaudited)
Top Ten Stocks as of October 31, 2011 |
| % of fund's
net assets | % of fund's net assets
6 months ago |
Samsung Electronics Co. Ltd. | 5.7 | 4.1 |
Taiwan Semiconductor Manufacturing Co. Ltd. | 3.9 | 3.3 |
China Mobile (Hong Kong) Ltd. | 3.3 | 0.0 |
CNOOC Ltd. | 2.6 | 1.9 |
POSCO | 2.5 | 0.0 |
Sun Hung Kai Properties Ltd. | 2.4 | 0.0 |
China Construction Bank Corp. (H Shares) | 2.3 | 2.1 |
Power Assets Holdings Ltd. | 1.9 | 1.4 |
Industrial & Commercial Bank of China Ltd. (H Shares) | 1.8 | 2.7 |
Housing Development Finance Corp. Ltd. | 1.5 | 0.0 |
| 27.9 | |
Top Five Market Sectors as of October 31, 2011 |
| % of fund's
net assets | % of fund's net assets
6 months ago |
Financials | 29.3 | 30.6 |
Information Technology | 17.3 | 16.9 |
Consumer Discretionary | 10.3 | 8.5 |
Industrials | 10.3 | 11.6 |
Materials | 8.6 | 10.4 |
Asset Allocation (% of fund's net assets) |
As of October 31, 2011 | As of April 30, 2011 |
| Stocks 98.7% | | | Stocks 97.9% | |
| Short-Term
Investments and
Net Other Assets 1.3% | | | Short-Term
Investments and
Net Other Assets 2.1% | |

Annual Report
Investments October 31, 2011
Showing Percentage of Net Assets
Common Stocks - 98.7% |
| Shares | | Value |
Australia - 0.2% |
Origin Energy Ltd. | 44,256 | | $ 666,976 |
Bailiwick of Jersey - 0.1% |
WNS Holdings Ltd. sponsored ADR (a) | 13,200 | | 159,720 |
Bermuda - 1.5% |
Cheung Kong Infrastructure Holdings Ltd. | 153,000 | | 819,578 |
China Oil & Gas Group Ltd. (a) | 880,000 | | 59,051 |
China Yurun Food Group Ltd. | 489,000 | | 848,757 |
CNPC (Hong Kong) Ltd. | 266,000 | | 372,608 |
First Pacific Co. Ltd. | 798,000 | | 831,362 |
Jardine Matheson Holdings Ltd. | 16,400 | | 826,537 |
Man Wah Holdings Ltd. | 216,000 | | 120,275 |
Noble Group Ltd. | 1,044,000 | | 1,274,266 |
PAX Global Technology Ltd. | 413,000 | | 87,038 |
Skyworth Digital Holdings Ltd. | 1,172,000 | | 619,303 |
TOTAL BERMUDA | | 5,858,775 |
Cayman Islands - 3.3% |
AirMedia Group, Inc. ADR (a) | 44,700 | | 121,584 |
Belle International Holdings Ltd. | 1,032,000 | | 2,023,986 |
Biostime International Holdings Ltd. | 298,000 | | 531,418 |
Changyou.com Ltd. (A Shares) ADR (a) | 9,100 | | 239,603 |
Chaoda Modern Agriculture (Holdings) Ltd. | 3,564,000 | | 504,634 |
China Resources Land Ltd. | 930,000 | | 1,361,237 |
China Shanshui Cement Group Ltd. | 619,000 | | 474,139 |
Haitian International Holdings Ltd. | 561,000 | | 498,446 |
Hidili Industry International Development Ltd. | 962,000 | | 402,909 |
International Taifeng Holdings Ltd. | 1,210,000 | | 565,501 |
Maoye International Holdings Ltd. (a) | 2,629,000 | | 722,228 |
New Oriental Education & Technology Group, Inc. sponsored ADR (a) | 8,200 | | 243,048 |
Qihoo 360 Technology Co. Ltd. ADR | 6,200 | | 125,302 |
Sands China Ltd. (a) | 768,400 | | 2,309,186 |
Shenguan Holdings Group Ltd. | 694,000 | | 372,855 |
Spreadtrum Communications, Inc. ADR | 41,500 | | 1,102,655 |
Springland International Holdings Ltd. | 423,000 | | 286,578 |
Yingde Gases Group Co. Ltd. | 186,000 | | 198,357 |
Youyuan International Holdings Ltd. (a) | 1,946,000 | | 606,321 |
TOTAL CAYMAN ISLANDS | | 12,689,987 |
China - 11.7% |
51job, Inc. sponsored ADR (a) | 6,900 | | 318,642 |
Baidu.com, Inc. sponsored ADR (a) | 18,300 | | 2,565,294 |
Common Stocks - continued |
| Shares | | Value |
China - continued |
Changsha Zoomlion Heavy Industry Science & Technology Development Co. Ltd. (H Shares) | 556,600 | | $ 805,280 |
China Coal Energy Co. Ltd. (H Shares) | 1,697,000 | | 2,113,662 |
China Communications Construction Co. Ltd. (H Shares) | 1,899,000 | | 1,432,333 |
China Communications Services Corp. Ltd. (H Shares) | 2,608,000 | | 1,202,773 |
China Construction Bank Corp. (H Shares) | 11,845,000 | | 8,702,939 |
China Eastern Airlines Corp. Ltd. (H Shares) (a) | 682,000 | | 268,327 |
China Metal Recycling (Holdings) Ltd. | 996,000 | | 1,066,414 |
China Minsheng Banking Corp. Ltd. (H Shares) | 2,599,500 | | 2,117,602 |
China National Building Materials Co. Ltd. (H Shares) | 832,000 | | 1,065,714 |
China Pacific Insurance Group Co. Ltd. (H Shares) | 461,200 | | 1,415,280 |
China Petroleum & Chemical Corp. (H Shares) | 4,188,000 | | 3,960,719 |
China Southern Airlines Ltd. (H Shares) (a) | 1,652,000 | | 921,916 |
Comba Telecom Systems Holdings Ltd. | 445,500 | | 376,162 |
Focus Media Holding Ltd. ADR (a) | 26,300 | | 714,834 |
Great Wall Motor Co. Ltd. (H Shares) | 1,488,250 | | 2,020,913 |
Harbin Power Equipment Co. Ltd. (H Shares) | 1,742,000 | | 1,755,479 |
Industrial & Commercial Bank of China Ltd. (H Shares) | 11,307,000 | | 7,060,806 |
PICC Property & Casualty Co. Ltd. (H Shares) | 1,228,000 | | 1,703,002 |
Shanghai Jin Jiang International Hotel Co. Ltd. (H Shares) | 1,304,000 | | 167,682 |
Sinopec Shanghai Petrochemical Co. Ltd. (H Shares) | 1,750,000 | | 642,511 |
Tianneng Power International Ltd. | 278,000 | | 130,197 |
Yanzhou Coal Mining Co. Ltd. (H Shares) | 594,000 | | 1,470,324 |
Zhongpin, Inc. (a)(d) | 31,900 | | 294,437 |
Zijin Mining Group Co. Ltd. (H Shares) | 1,882,000 | | 801,035 |
TOTAL CHINA | | 45,094,277 |
Hong Kong - 18.2% |
AIA Group Ltd. | 1,851,400 | | 5,661,098 |
BYD Electronic International Co. Ltd. (a) | 547,500 | | 195,320 |
Cathay Pacific Airways Ltd. | 678,000 | | 1,230,687 |
China Insurance International Holdings Co. Ltd. (a) | 331,200 | | 718,227 |
China Merchant Holdings International Co. Ltd. | 438,000 | | 1,351,549 |
China Mobile (Hong Kong) Ltd. | 1,327,500 | | 12,617,014 |
China Overseas Land & Investment Ltd. | 1,382,000 | | 2,557,239 |
China Unicom (Hong Kong) Ltd. | 1,442,000 | | 2,899,308 |
Citic Pacific Ltd. | 827,000 | | 1,494,613 |
CNOOC Ltd. | 5,356,500 | | 10,125,712 |
Dah Chong Hong Holdings Ltd. | 552,000 | | 670,369 |
Galaxy Entertainment Group Ltd. (a) | 448,000 | | 906,006 |
Giordano International Ltd. | 382,000 | | 288,137 |
Guangdong Investment Ltd. | 3,212,000 | | 1,933,578 |
Common Stocks - continued |
| Shares | | Value |
Hong Kong - continued |
Hang Lung Group Ltd. | 210,000 | | $ 1,276,272 |
Hysan Development Co. Ltd. | 309,332 | | 1,079,438 |
Lenovo Group Ltd. | 3,080,000 | | 2,070,698 |
MTR Corp. Ltd. | 546,000 | | 1,762,476 |
New World Development Co. Ltd. | 1,390,000 | | 1,464,301 |
New World Development Co. Ltd. rights 11/22/11 (a) | 695,000 | | 237,070 |
PCCW Ltd. | 6,349,000 | | 2,537,180 |
Power Assets Holdings Ltd. | 962,000 | | 7,310,055 |
Singamas Container Holdings Ltd. | 238,000 | | 55,127 |
Sinotruk Hong Kong Ltd. | 732,000 | | 430,457 |
Sun Hung Kai Properties Ltd. | 672,000 | | 9,252,619 |
TOTAL HONG KONG | | 70,124,550 |
India - 8.1% |
Apollo Tyres Ltd. | 455,823 | | 534,564 |
Axis Bank Ltd. | 116,300 | | 2,748,710 |
Bank of Baroda | 86,080 | | 1,357,275 |
Canara Bank | 105,069 | | 1,002,097 |
Deccan Chronicle Holdings Ltd. (a) | 244,971 | | 259,088 |
Dena Bank | 129,933 | | 213,976 |
Gateway Distriparks Ltd. | 112,674 | | 342,861 |
Grasim Industries Ltd. | 22,927 | | 1,217,566 |
HCL Infosystems Ltd. | 255,318 | | 339,081 |
Hindalco Industries Ltd. | 448,779 | | 1,240,638 |
Hindustan Petroleum Corp. Ltd. | 186,895 | | 1,264,979 |
Housing Development Finance Corp. Ltd. | 415,220 | | 5,843,320 |
ICSA (India) Ltd. | 186,602 | | 218,908 |
Indian Oil Corp. Ltd. | 195,971 | | 1,158,592 |
Indian Overseas Bank | 356,535 | | 747,194 |
Jubilant Industries Ltd. | 5,873 | | 22,460 |
Jubilant Life Sciences Ltd. | 47,794 | | 191,285 |
Page Industries Ltd. | 3,278 | | 170,589 |
Piramal Healthcare Ltd. | 63,145 | | 465,616 |
Ramky Infrastructure Ltd. | 73,635 | | 355,621 |
Sintex Industries Ltd. | 172,960 | | 415,884 |
SREI Infrastructure Finance Ltd. | 476,053 | | 347,449 |
State Bank of India | 64,363 | | 2,503,438 |
Tata Consultancy Services Ltd. | 211,584 | | 4,813,070 |
Tata Motors Ltd. Class A | 361,005 | | 789,108 |
Tata Steel Ltd. | 98,638 | | 971,329 |
Welspun Gujarat Stahl Rohren Ltd. | 114,288 | | 250,297 |
Common Stocks - continued |
| Shares | | Value |
India - continued |
Yes Bank Ltd. | 219,750 | | $ 1,408,216 |
Zee Learn Ltd. (a) | 35,117 | | 13,743 |
TOTAL INDIA | | 31,206,954 |
Indonesia - 3.3% |
PT Astra International Tbk | 501,500 | | 3,866,942 |
PT Bank Rakyat Indonesia Tbk | 6,154,000 | | 4,626,865 |
PT BISI International Tbk | 376,500 | | 42,870 |
PT Global Mediacom Tbk | 4,988,500 | | 447,848 |
PT Gudang Garam Tbk | 228,500 | | 1,499,845 |
PT Tower Bersama Infrastructure Tbk | 2,425,000 | | 564,378 |
PT Unilever Indonesia Tbk | 593,000 | | 1,042,475 |
PT Sampoerna Agro Tbk | 1,120,000 | | 378,888 |
TOTAL INDONESIA | | 12,470,111 |
Korea (South) - 25.6% |
BS Financial Group, Inc. (a) | 241,470 | | 2,647,712 |
Cheil Worldwide, Inc. | 127,230 | | 2,075,500 |
Chong Kun Dang Pharmaceutical Corp. | 29,390 | | 567,891 |
CJ CheilJedang Corp. | 7,555 | | 2,077,143 |
CJ Corp. | 20,054 | | 1,431,393 |
Daewoo Shipbuilding & Marine Engineering Co. Ltd. | 118,780 | | 2,909,978 |
DGB Financial Group Co. Ltd. (a) | 72,680 | | 901,455 |
Dongbu Insurance Co. Ltd. | 27,020 | | 1,133,282 |
Doosan Co. Ltd. | 10,290 | | 1,296,309 |
Hana Financial Group, Inc. | 130,810 | | 4,655,544 |
Hankook Tire Co. Ltd. | 31,010 | | 1,233,120 |
Hynix Semiconductor, Inc. | 143,970 | | 2,902,693 |
Hyundai Department Store Co. Ltd. | 7,557 | | 1,079,448 |
Hyundai Fire & Marine Insurance Co. Ltd. | 15,060 | | 434,448 |
Hyundai Heavy Industries Co. Ltd. | 19,620 | | 5,222,203 |
Hyundai Mobis | 15,997 | | 4,561,125 |
Hyundai Motor Co. | 13,659 | | 2,740,503 |
ICD Co. Ltd. (a) | 3,854 | | 174,758 |
Industrial Bank of Korea | 218,960 | | 2,863,849 |
KB Financial Group, Inc. | 94,250 | | 3,637,799 |
Kia Motors Corp. | 67,930 | | 4,338,873 |
Korea Electric Power Corp. (a) | 89,840 | | 2,004,233 |
Kyeryong Construction Industrial Co. Ltd. | 11,900 | | 156,370 |
LG International Corp. | 14,202 | | 624,699 |
Lotte Samkang Co. Ltd. | 1,310 | | 390,467 |
Lotte Shopping Co. Ltd. | 4,924 | | 1,760,645 |
Common Stocks - continued |
| Shares | | Value |
Korea (South) - continued |
MegaStudy Co. Ltd. | 9,331 | | $ 1,028,162 |
Nong Shim Co. Ltd. | 1,085 | | 211,820 |
Orion Corp. | 1,094 | | 584,725 |
POSCO | 27,963 | | 9,652,712 |
Samsung Electronics Co. Ltd. | 25,385 | | 21,771,442 |
Samsung Fire & Marine Insurance Co. Ltd. | 14,179 | | 3,003,707 |
Samsung Heavy Industries Ltd. | 76,000 | | 2,309,986 |
Shinsegae Co. Ltd. | 4,161 | | 1,042,586 |
SK Chemicals Co. Ltd. | 10,569 | | 673,630 |
SK Telecom Co. Ltd. | 22,496 | | 2,984,294 |
Sungwoo Hitech Co. Ltd. | 61,923 | | 1,018,387 |
Tong Yang Life Insurance Co. Ltd. | 31,410 | | 375,018 |
TOTAL KOREA (SOUTH) | | 98,477,909 |
Malaysia - 0.6% |
AirAsia Bhd | 528,900 | | 664,677 |
Genting Malaysia Bhd | 970,100 | | 1,206,774 |
Glomac Bhd | 1,104,800 | | 304,531 |
TOTAL MALAYSIA | | 2,175,982 |
Mauritius - 0.3% |
Golden Agri-Resources Ltd. | 2,381,000 | | 1,218,453 |
Papua New Guinea - 0.1% |
Oil Search Ltd. | 31,658 | | 215,998 |
Philippines - 1.0% |
Banco de Oro Universal Bank | 539,000 | | 711,756 |
Globe Telecom, Inc. | 40,310 | | 859,430 |
Manila Water Co., Inc. | 2,617,700 | | 1,191,120 |
Universal Robina Corp. | 1,100,000 | | 1,212,619 |
TOTAL PHILIPPINES | | 3,974,925 |
Singapore - 5.8% |
Avago Technologies Ltd. | 32,400 | | 1,094,148 |
City Developments Ltd. | 245,000 | | 2,112,037 |
DBS Group Holdings Ltd. | 327,000 | | 3,192,916 |
First Resources Ltd. | 898,000 | | 1,005,051 |
Keppel Corp. Ltd. | 559,600 | | 4,187,734 |
Mapletree Logistics Trust (REIT) | 708,000 | | 480,663 |
Sakari Resources Ltd. | 359,000 | | 670,363 |
SembCorp Industries Ltd. | 408,000 | | 1,344,659 |
United Overseas Bank Ltd. | 351,000 | | 4,758,746 |
UOL Group Ltd. | 201,000 | | 710,328 |
Common Stocks - continued |
| Shares | | Value |
Singapore - continued |
Wilmar International Ltd. | 521,000 | | $ 2,248,781 |
Yanlord Land Group Ltd. | 611,000 | | 495,644 |
TOTAL SINGAPORE | | 22,301,070 |
Taiwan - 10.8% |
Asia Cement Corp. | 1,468,300 | | 1,768,647 |
ASUSTeK Computer, Inc. | 254,000 | | 1,765,855 |
Catcher Technology Co. Ltd. | 172,000 | | 958,299 |
Chicony Electronics Co. Ltd. | 488,000 | | 815,447 |
Compal Electronics, Inc. | 1,839,000 | | 1,687,796 |
E.Sun Financial Holdings Co. Ltd. | 5,730,568 | | 2,855,970 |
EVA Airways Corp. | 1,791,900 | | 1,296,267 |
Far East Department Stores Co. Ltd. | 29,340 | | 44,858 |
Formosa Plastics Corp. | 1,768,000 | | 5,199,850 |
HIWIN Technologies Corp. | 74,000 | | 668,980 |
Hon Hai Precision Industry Co. Ltd. (Foxconn) | 682,900 | | 1,872,087 |
Insyde Software Corp. | 98,195 | | 434,651 |
King Slide Works Co. Ltd. | 102,850 | | 441,697 |
Quanta Computer, Inc. | 1,122,000 | | 2,207,916 |
Taichung Commercial Bank Co. Ltd. | 23,640 | | 7,955 |
Taishin Financial Holdings Co. Ltd. | 8,855,572 | | 3,749,609 |
Taiwan Semiconductor Manufacturing Co. Ltd. | 6,132,393 | | 14,943,885 |
Wistron Corp. | 659,100 | | 762,776 |
TOTAL TAIWAN | | 41,482,545 |
Thailand - 6.5% |
Advanced Info Service PCL (For. Reg.) | 486,500 | | 2,043,941 |
Asian Property Development PCL (For. Reg.) | 3,613,080 | | 528,091 |
Bangkok Life Assurance PCL NVDR | 234,500 | | 325,422 |
Banpu PCL (For. Reg.) | 183,900 | | 3,733,241 |
Big C Supercenter PCL unit | 81,900 | | 292,520 |
Bumrungrad Hospital PCL (For. Reg.) | 266,700 | | 341,299 |
C.P. Seven Eleven PCL (For. Reg.) | 616,300 | | 932,535 |
Charoen Pokphand Foods PCL (For. Reg.) | 1,618,800 | | 1,576,499 |
Glow Energy PCL (For. Reg.) | 342,300 | | 589,571 |
Indorama Ventures PCL (For. Reg.) | 611,700 | | 704,027 |
LPN Development PCL (For. Reg.) | 1,772,400 | | 576,313 |
PTT Global Chemical PCL (For. Reg.) (a) | 691,767 | | 1,458,734 |
PTT PCL (For. Reg.) | 249,300 | | 2,455,946 |
Siam Cement PCL: | | | |
(For. Reg.) | 165,200 | | 1,980,679 |
NVDR unit | 142,500 | | 1,448,241 |
Common Stocks - continued |
| Shares | | Value |
Thailand - continued |
Siam Commercial Bank PCL (For. Reg.) | 798,600 | | $ 3,020,941 |
Siam Makro PCL (For. Reg.) | 155,700 | | 1,042,622 |
Supalai PCL (For. Reg.) | 1,471,800 | | 592,289 |
Thai Union Frozen Products PCL (For. Reg.) | 207,100 | | 353,371 |
Total Access Communication PCL | 263,900 | | 622,126 |
Total Access Communication PCL unit | 153,800 | | 368,029 |
TOTAL THAILAND | | 24,986,437 |
United Kingdom - 0.5% |
HSBC Holdings PLC (Hong Kong) | 229,678 | | 2,006,315 |
United States of America - 1.1% |
China Natural Gas, Inc. (a)(d) | 13,300 | | 25,536 |
Citigroup, Inc. | 22,500 | | 710,775 |
Cognizant Technology Solutions Corp. Class A (a) | 34,100 | | 2,480,775 |
Freeport-McMoRan Copper & Gold, Inc. | 22,700 | | 913,902 |
SORL Auto Parts, Inc. (a)(d) | 45,900 | | 151,929 |
TOTAL UNITED STATES OF AMERICA | | 4,282,917 |
TOTAL COMMON STOCKS (Cost $361,396,820) | 379,393,901 |
Money Market Funds - 0.7% |
| | | |
Fidelity Cash Central Fund, 0.12% (b) | 2,556,517 | | 2,556,517 |
Fidelity Securities Lending Cash Central Fund, 0.11% (b)(c) | 225,344 | | 225,344 |
TOTAL MONEY MARKET FUNDS (Cost $2,781,861) | 2,781,861 |
TOTAL INVESTMENT PORTFOLIO - 99.4% (Cost $364,178,681) | | 382,175,762 |
NET OTHER ASSETS (LIABILITIES) - 0.6% | | 2,280,372 |
NET ASSETS - 100% | $ 384,456,134 |
Legend |
(a) Non-income producing |
(b) Affiliated fund that is available only to investment companies and other accounts managed by Fidelity Investments. The rate quoted is the annualized seven-day yield of the fund at period end. A complete unaudited listing of the fund's holdings as of its most recent quarter end is available upon request. In addition, each Fidelity Central Fund's financial statements, which are not covered by the Fund's Report of Independent Registered Public Accounting Firm, are available on the SEC's website or upon request. |
(c) Investment made with cash collateral received from securities on loan. |
(d) Security or a portion of the security is on loan at period end. |
Affiliated Central Funds |
Information regarding fiscal year to date income earned by the Fund from investments in Fidelity Central Funds is as follows: |
Fund | Income earned |
Fidelity Cash Central Fund | $ 10,600 |
Fidelity Securities Lending Cash Central Fund | 145,253 |
Total | $ 155,853 |
Other Information |
The following is a summary of the inputs used, as of October 31, 2011, involving the Fund's assets and liabilities carried at fair value. The inputs or methodology used for valuing securities may not be an indication of the risk associated with investing in those securities. For more information on valuation inputs, and their aggregation into the levels used in the tables below, please refer to the Security Valuation section in the accompanying Notes to Financial Statements. |
Valuation Inputs at Reporting Date: |
Description | Total | Level 1 | Level 2 | Level 3 |
Investments in Securities: | | | | |
Equities: | | | | |
Korea (South) | $ 98,477,909 | $ - | $ 98,477,909 | $ - |
Hong Kong | 70,124,550 | - | 70,124,550 | - |
China | 45,094,277 | 3,893,207 | 41,201,070 | - |
Taiwan | 41,482,545 | - | 41,482,545 | - |
India | 31,206,954 | - | 31,206,954 | - |
Thailand | 24,986,437 | - | 24,986,437 | - |
Singapore | 22,301,070 | 1,094,148 | 21,206,922 | - |
Cayman Islands | 12,689,987 | 1,832,192 | 10,353,161 | 504,634 |
Indonesia | 12,470,111 | - | 12,470,111 | - |
United States of America | 4,282,917 | 4,257,381 | - | 25,536 |
Other | 16,277,144 | 4,134,645 | 12,142,499 | - |
Money Market Funds | 2,781,861 | 2,781,861 | - | - |
Total Investments in Securities: | $ 382,175,762 | $ 17,993,434 | $ 363,652,158 | $ 530,170 |
Transfers from Level 1 to Level 2 during the period were $141,198,608. |
The following is a reconciliation of Investments in Securities for which Level 3 inputs were used in determining value: |
Investments in Securities: | |
Beginning Balance | $ 10,299 |
Total Realized Gain (Loss) | (11,263) |
Total Unrealized Gain (Loss) | (2,286,410) |
Cost of Purchases | 1,288,476 |
Proceeds of Sales | (223,951) |
Amortization/Accretion | - |
Transfers in to Level 3 | 1,763,318 |
Transfers out of Level 3 | (10,299) |
Ending Balance | $ 530,170 |
The change in unrealized gain (loss) for the period attributable to Level 3 securities held at October 31, 2011 | $ (2,286,410) |
The information used in the above reconciliation represents fiscal year to date activity for any Investments in Securities identified as using Level 3 inputs at either the beginning or the end of the current fiscal period. Transfers in or out of Level 3 represent the beginning value of any Security or Instrument where a change in the pricing level occurred from the beginning to the end of the period. The cost of purchases and the proceeds of sales may include securities received or delivered through corporate actions or exchanges. Realized and unrealized gains (losses) disclosed in the reconciliation are included in Net Gain (Loss) on the Fund's Statement of Operations. |
See accompanying notes which are an integral part of the financial statements.
Annual Report
Statement of Assets and Liabilities
| October 31, 2011 |
| | |
Assets | | |
Investment in securities, at value (including securities loaned of $209,936) - See accompanying schedule: Unaffiliated issuers (cost $361,396,820) | $ 379,393,901 | |
Fidelity Central Funds (cost $2,781,861) | 2,781,861 | |
Total Investments (cost $364,178,681) | | $ 382,175,762 |
Foreign currency held at value (cost $6,831) | | 6,869 |
Receivable for investments sold | | 4,425,612 |
Receivable for fund shares sold | | 711,103 |
Dividends receivable | | 104,140 |
Distributions receivable from Fidelity Central Funds | | 17,984 |
Prepaid expenses | | 1,780 |
Other receivables | | 237,778 |
Total assets | | 387,681,028 |
| | |
Liabilities | | |
Payable for investments purchased | $ 1,830,082 | |
Payable for fund shares redeemed | 613,822 | |
Accrued management fee | 215,526 | |
Distribution and service plan fees payable | 136,040 | |
Other affiliated payables | 101,526 | |
Other payables and accrued expenses | 102,554 | |
Collateral on securities loaned, at value | 225,344 | |
Total liabilities | | 3,224,894 |
| | |
Net Assets | | $ 384,456,134 |
Net Assets consist of: | | |
Paid in capital | | $ 348,582,194 |
Undistributed net investment income | | 2,634,151 |
Accumulated undistributed net realized gain (loss) on investments and foreign currency transactions | | 15,257,786 |
Net unrealized appreciation (depreciation) on investments and assets and liabilities in foreign currencies | | 17,982,003 |
Net Assets | | $ 384,456,134 |
See accompanying notes which are an integral part of the financial statements.
Annual Report
Financial Statements - continued
Statement of Assets and Liabilities - continued
| October 31, 2011 |
| | |
Calculation of Maximum Offering Price Class A:
Net Asset Value and redemption price per share ($179,346,257 ÷ 6,247,951 shares) | | $ 28.70 |
| | |
Maximum offering price per share (100/94.25 of $28.70) | | $ 30.45 |
Class T:
Net Asset Value and redemption price per share ($55,452,066 ÷ 1,981,697 shares) | | $ 27.98 |
| | |
Maximum offering price per share (100/96.50 of $27.98) | | $ 28.99 |
Class B:
Net Asset Value and offering price per share ($20,831,248 ÷ 782,511 shares)A | | $ 26.62 |
| | |
Class C:
Net Asset Value and offering price per share ($78,939,036 ÷ 2,985,046 shares)A | | $ 26.44 |
| | |
Institutional Class:
Net Asset Value, offering price and redemption price per share ($49,887,527 ÷ 1,691,928 shares) | | $ 29.49 |
A Redemption price per share is equal to net asset value less any applicable contingent deferred sales charge.
See accompanying notes which are an integral part of the financial statements.
Annual Report
Statement of Operations
| Year ended October 31, 2011 |
| | |
Investment Income | | |
Dividends | | $ 12,014,525 |
Interest | | 26,248 |
Income from Fidelity Central Funds | | 155,853 |
Income before foreign taxes withheld | | 12,196,626 |
Less foreign taxes withheld | | (1,403,506) |
Total income | | 10,793,120 |
| | |
Expenses | | |
Management fee | $ 3,092,651 | |
Transfer agent fees | 1,132,034 | |
Distribution and service plan fees | 1,987,080 | |
Accounting and security lending fees | 227,018 | |
Custodian fees and expenses | 341,127 | |
Independent trustees' compensation | 2,414 | |
Registration fees | 97,161 | |
Audit | 98,208 | |
Legal | 1,737 | |
Interest | 1,400 | |
Miscellaneous | 3,877 | |
Total expenses before reductions | 6,984,707 | |
Expense reductions | (169,580) | 6,815,127 |
Net investment income (loss) | | 3,977,993 |
Realized and Unrealized Gain (Loss) Net realized gain (loss) on: | | |
Investment securities: | | |
Unaffiliated issuers | 23,310,033 | |
Foreign currency transactions | (79,566) | |
Futures contracts | (459,204) | |
Total net realized gain (loss) | | 22,771,263 |
Change in net unrealized appreciation (depreciation) on: Investment securities | (61,642,252) | |
Assets and liabilities in foreign currencies | (27,904) | |
Total change in net unrealized appreciation (depreciation) | | (61,670,156) |
Net gain (loss) | | (38,898,893) |
Net increase (decrease) in net assets resulting from operations | | $ (34,920,900) |
See accompanying notes which are an integral part of the financial statements.
Annual Report
Financial Statements - continued
Statement of Changes in Net Assets
| Year ended
October 31,
2011 | Year ended
October 31,
2010 |
Increase (Decrease) in Net Assets | | |
Operations | | |
Net investment income (loss) | $ 3,977,993 | $ 2,119,167 |
Net realized gain (loss) | 22,771,263 | 58,114,163 |
Change in net unrealized appreciation (depreciation) | (61,670,156) | 23,767,257 |
Net increase (decrease) in net assets resulting
from operations | (34,920,900) | 84,000,587 |
Distributions to shareholders from net investment income | (1,974,190) | (971,544) |
Distributions to shareholders from net realized gain | (23,691,402) | (2,532,430) |
Total distributions | (25,665,592) | (3,503,974) |
Share transactions - net increase (decrease) | 32,289,855 | 46,082,399 |
Redemption fees | 135,689 | 86,566 |
Total increase (decrease) in net assets | (28,160,948) | 126,665,578 |
| | |
Net Assets | | |
Beginning of period | 412,617,082 | 285,951,504 |
End of period (including undistributed net investment income of $2,634,151 and undistributed net investment income of $1,972,932, respectively) | $ 384,456,134 | $ 412,617,082 |
See accompanying notes which are an integral part of the financial statements.
Annual Report
Financial Highlights - Class A
Years ended October 31, | 2011 | 2010 | 2009 | 2008 | 2007 |
Selected Per-Share Data | | | | | |
Net asset value, beginning of period | $ 32.97 | $ 25.96 | $ 15.74 | $ 37.55 | $ 22.48 |
Income from Investment Operations | | | | | |
Net investment income (loss) C | .35 | .25 | .19 | .19 | .24 |
Net realized and unrealized gain (loss) | (2.62) | 7.09 | 10.07 | (18.72) | 16.64 |
Total from investment operations | (2.27) | 7.34 | 10.26 | (18.53) | 16.88 |
Distributions from net investment income | (.20) | (.12) | (.05) | (.23) | (.15) |
Distributions from net realized gain | (1.81) | (.22) | - | (3.06) | (1.68) |
Total distributions | (2.01) | (.34) | (.05) | (3.29) | (1.83) |
Redemption fees added to paid in capital C | .01 | .01 | .01 | .01 | .02 |
Net asset value, end of period | $ 28.70 | $ 32.97 | $ 25.96 | $ 15.74 | $ 37.55 |
Total Return A, B | (7.44)% | 28.53% | 65.43% | (53.66)% | 80.43% |
Ratios to Average Net Assets D, F | | | | | |
Expenses before reductions | 1.39% | 1.44% | 1.54% | 1.50% | 1.47% |
Expenses net of fee waivers, if any | 1.39% | 1.44% | 1.50% | 1.50% | 1.47% |
Expenses net of all reductions | 1.35% | 1.40% | 1.41% | 1.41% | 1.40% |
Net investment income (loss) | 1.12% | .86% | .94% | .73% | .88% |
Supplemental Data | | | | | |
Net assets, end of period (000 omitted) | $ 179,346 | $ 189,255 | $ 131,564 | $ 71,722 | $ 152,630 |
Portfolio turnover rate E | 119% | 138% | 91% | 92% G | 66% |
A Total returns would have been lower if certain expenses had not been reduced during the applicable periods shown.
B Total returns do not include the effect of the sales charges.
C Calculated based on average shares outstanding during the period.
D Fees and expenses of any underlying Fidelity Central Funds are not included in the Fund's expense ratio. The Fund indirectly bears its proportionate share of the expenses of any underlying Fidelity Central Funds.
E Amount does not include the portfolio activity of any underlying Fidelity Central Funds.
F Expense ratios reflect operating expenses of the class. Expenses before reductions do not reflect amounts reimbursed by the investment adviser or reductions from brokerage service arrangements or reductions from other expense offset arrangements and do not represent the amount paid by the class during periods when reimbursements or reductions occur. Expenses net of fee waivers reflect expenses after reimbursement by the investment adviser but prior to reductions from brokerage service arrangements or other expense offset arrangements. Expenses net of all reductions represent the net expenses paid by the class.
G The portfolio turnover rate does not include the assets acquired in the merger.
See accompanying notes which are an integral part of the financial statements.
Annual Report
Financial Highlights - Class T
Years ended October 31, | 2011 | 2010 | 2009 | 2008 | 2007 |
Selected Per-Share Data | | | | | |
Net asset value, beginning of period | $ 32.20 | $ 25.40 | $ 15.43 | $ 36.88 | $ 22.13 |
Income from Investment Operations | | | | | |
Net investment income (loss) C | .25 | .15 | .14 | .12 | .16 |
Net realized and unrealized gain (loss) | (2.55) | 6.94 | 9.86 | (18.38) | 16.37 |
Total from investment operations | (2.30) | 7.09 | 10.00 | (18.26) | 16.53 |
Distributions from net investment income | (.12) | (.08) | (.04) | (.14) | (.12) |
Distributions from net realized gain | (1.81) | (.22) | - | (3.06) | (1.68) |
Total distributions | (1.93) | (.30) | (.04) | (3.20) | (1.80) |
Redemption fees added to paid in capital C | .01 | .01 | .01 | .01 | .02 |
Net asset value, end of period | $ 27.98 | $ 32.20 | $ 25.40 | $ 15.43 | $ 36.88 |
Total Return A, B | (7.70)% | 28.13% | 65.06% | (53.79)% | 79.98% |
Ratios to Average Net Assets D, F | | | | | |
Expenses before reductions | 1.70% | 1.74% | 1.84% | 1.80% | 1.79% |
Expenses net of fee waivers, if any | 1.69% | 1.74% | 1.75% | 1.75% | 1.75% |
Expenses net of all reductions | 1.65% | 1.70% | 1.66% | 1.66% | 1.67% |
Net investment income (loss) | .82% | .55% | .69% | .48% | .61% |
Supplemental Data | | | | | |
Net assets, end of period (000 omitted) | $ 55,452 | $ 61,620 | $ 45,259 | $ 25,205 | $ 64,813 |
Portfolio turnover rate E | 119% | 138% | 91% | 92% G | 66% |
A Total returns would have been lower if certain expenses had not been reduced during the applicable periods shown.
B Total returns do not include the effect of the sales charges.
C Calculated based on average shares outstanding during the period.
D Fees and expenses of any underlying Fidelity Central Funds are not included in the Fund's expense ratio. The Fund indirectly bears its proportionate share of the expenses of any underlying Fidelity Central Funds.
E Amount does not include the portfolio activity of any underlying Fidelity Central Funds.
F Expense ratios reflect operating expenses of the class. Expenses before reductions do not reflect amounts reimbursed by the investment adviser or reductions from brokerage service arrangements or reductions from other expense offset arrangements and do not represent the amount paid by the class during periods when reimbursements or reductions occur. Expenses net of fee waivers reflect expenses after reimbursement by the investment adviser but prior to reductions from brokerage service arrangements or other expense offset arrangements. Expenses net of all reductions represent the net expenses paid by the class.
G The portfolio turnover rate does not include the assets acquired in the merger.
See accompanying notes which are an integral part of the financial statements.
Annual Report
Financial Highlights - Class B
Years ended October 31, | 2011 | 2010 | 2009 | 2008 | 2007 |
Selected Per-Share Data | | | | | |
Net asset value, beginning of period | $ 30.72 | $ 24.29 | $ 14.82 | $ 35.55 | $ 21.42 |
Income from Investment Operations | | | | | |
Net investment income (loss) C | .10 | .02 | .04 | (.01) | .03 |
Net realized and unrealized gain (loss) | (2.44) | 6.61 | 9.45 | (17.68) | 15.79 |
Total from investment operations | (2.34) | 6.63 | 9.49 | (17.69) | 15.82 |
Distributions from net investment income | - | - | (.03) | - | (.03) |
Distributions from net realized gain | (1.77) | (.21) | - | (3.05) | (1.68) |
Total distributions | (1.77) | (.21) | (.03) | (3.05) | (1.71) |
Redemption fees added to paid in capital C | .01 | .01 | .01 | .01 | .02 |
Net asset value, end of period | $ 26.62 | $ 30.72 | $ 24.29 | $ 14.82 | $ 35.55 |
Total Return A, B | (8.16)% | 27.48% | 64.23% | (54.01)% | 79.01% |
Ratios to Average Net Assets D, F | | | | | |
Expenses before reductions | 2.19% | 2.24% | 2.32% | 2.29% | 2.28% |
Expenses net of fee waivers, if any | 2.18% | 2.24% | 2.25% | 2.25% | 2.25% |
Expenses net of all reductions | 2.15% | 2.20% | 2.16% | 2.16% | 2.17% |
Net investment income (loss) | .32% | .06% | .19% | (.02)% | .11% |
Supplemental Data | | | | | |
Net assets, end of period (000 omitted) | $ 20,831 | $ 29,611 | $ 25,750 | $ 17,040 | $ 40,775 |
Portfolio turnover rate E | 119% | 138% | 91% | 92% G | 66% |
A Total returns would have been lower if certain expenses had not been reduced during the applicable periods shown.
B Total returns do not include the effect of the contingent deferred sales charge.
C Calculated based on average shares outstanding during the period.
D Fees and expenses of any underlying Fidelity Central Funds are not included in the Fund's expense ratio. The Fund indirectly bears its proportionate share of the expenses of any underlying Fidelity Central Funds.
E Amount does not include the portfolio activity of any underlying Fidelity Central Funds.
F Expense ratios reflect operating expenses of the class. Expenses before reductions do not reflect amounts reimbursed by the investment adviser or reductions from brokerage service arrangements or reductions from other expense offset arrangements and do not represent the amount paid by the class during periods when reimbursements or reductions occur. Expenses net of fee waivers reflect expenses after reimbursement by the investment adviser but prior to reductions from brokerage service arrangements or other expense offset arrangements. Expenses net of all reductions represent the net expenses paid by the class.
G The portfolio turnover rate does not include the assets acquired in the merger.
See accompanying notes which are an integral part of the financial statements.
Annual Report
Financial Highlights - Class C
Years ended October 31, | 2011 | 2010 | 2009 | 2008 | 2007 |
Selected Per-Share Data | | | | | |
Net asset value, beginning of period | $ 30.58 | $ 24.19 | $ 14.76 | $ 35.48 | $ 21.39 |
Income from Investment Operations | | | | | |
Net investment income (loss) C | .11 | .03 | .04 | - H | .04 |
Net realized and unrealized gain (loss) | (2.41) | 6.59 | 9.41 | (17.63) | 15.76 |
Total from investment operations | (2.30) | 6.62 | 9.45 | (17.63) | 15.80 |
Distributions from net investment income | (.04) | (.02) | (.03) | (.04) | (.05) |
Distributions from net realized gain | (1.81) | (.22) | - | (3.06) | (1.68) |
Total distributions | (1.85) | (.24) | (.03) | (3.10) | (1.73) |
Redemption fees added to paid in capital C | .01 | .01 | .01 | .01 | .02 |
Net asset value, end of period | $ 26.44 | $ 30.58 | $ 24.19 | $ 14.76 | $ 35.48 |
Total Return A, B | (8.10)% | 27.58% | 64.21% | (54.02)% | 79.05% |
Ratios to Average Net Assets D, F | | | | | |
Expenses before reductions | 2.13% | 2.17% | 2.28% | 2.25% | 2.21% |
Expenses net of fee waivers, if any | 2.13% | 2.17% | 2.25% | 2.25% | 2.21% |
Expenses net of all reductions | 2.10% | 2.13% | 2.16% | 2.16% | 2.13% |
Net investment income (loss) | .37% | .12% | .19% | (.02)% | .14% |
Supplemental Data | | | | | |
Net assets, end of period (000 omitted) | $ 78,939 | $ 87,089 | $ 59,491 | $ 30,577 | $ 82,070 |
Portfolio turnover rate E | 119% | 138% | 91% | 92% G | 66% |
A Total returns would have been lower if certain expenses had not been reduced during the applicable periods shown.
B Total returns do not include the effect of the contingent deferred sales charge.
C Calculated based on average shares outstanding during the period.
D Fees and expenses of any underlying Fidelity Central Funds are not included in the Fund's expense ratio. The Fund indirectly bears its proportionate share of the expenses of any underlying Fidelity Central Funds.
E Amount does not include the portfolio activity of any underlying Fidelity Central Funds.
F Expense ratios reflect operating expenses of the class. Expenses before reductions do not reflect amounts reimbursed by the investment adviser or reductions from brokerage service arrangements or reductions from other expense offset arrangements and do not represent the amount paid by the class during periods when reimbursements or reductions occur. Expenses net of fee waivers reflect expenses after reimbursement by the investment adviser but prior to reductions from brokerage service arrangements or other expense offset arrangements. Expenses net of all reductions represent the net expenses paid by the class.
G The portfolio turnover rate does not include the assets acquired in the merger.
H Amount represents less than $.01 per share.
See accompanying notes which are an integral part of the financial statements.
Annual Report
Financial Highlights - Institutional Class
Years ended October 31, | 2011 | 2010 | 2009 | 2008 | 2007 |
Selected Per-Share Data | | | | | |
Net asset value, beginning of period | $ 33.80 | $ 26.58 | $ 16.07 | $ 38.25 | $ 22.84 |
Income from Investment Operations | | | | | |
Net investment income (loss) B | .46 | .34 | .26 | .27 | .34 |
Net realized and unrealized gain (loss) | (2.69) | 7.26 | 10.29 | (19.09) | 16.92 |
Total from investment operations | (2.23) | 7.60 | 10.55 | (18.82) | 17.26 |
Distributions from net investment income | (.29) | (.17) | (.05) | (.31) | (.19) |
Distributions from net realized gain | (1.81) | (.22) | - | (3.06) | (1.68) |
Total distributions | (2.09) G | (.39) | (.05) | (3.37) | (1.87) |
Redemption fees added to paid in capital B | .01 | .01 | .01 | .01 | .02 |
Net asset value, end of period | $ 29.49 | $ 33.80 | $ 26.58 | $ 16.07 | $ 38.25 |
Total Return A | (7.13)% | 28.87% | 65.94% | (53.53)% | 80.97% |
Ratios to Average Net Assets C, E | | | | | |
Expenses before reductions | 1.10% | 1.14% | 1.25% | 1.20% | 1.16% |
Expenses net of fee waivers, if any | 1.10% | 1.14% | 1.25% | 1.20% | 1.16% |
Expenses net of all reductions | 1.06% | 1.10% | 1.16% | 1.11% | 1.08% |
Net investment income (loss) | 1.41% | 1.16% | 1.18% | 1.03% | 1.20% |
Supplemental Data | | | | | |
Net assets, end of period (000 omitted) | $ 49,888 | $ 45,042 | $ 23,888 | $ 5,933 | $ 16,300 |
Portfolio turnover rate D | 119% | 138% | 91% | 92% F | 66% |
A Total returns would have been lower if certain expenses had not been reduced during the applicable periods shown.
B Calculated based on average shares outstanding during the period.
C Fees and expenses of any underlying Fidelity Central Funds are not included in the Fund's expense ratio. The Fund indirectly bears its proportionate share of the expenses of any underlying Fidelity Central Funds.
D Amount does not include the portfolio activity of any underlying Fidelity Central Funds.
E Expense ratios reflect operating expenses of the class. Expenses before reductions do not reflect amounts reimbursed by the investment adviser or reductions from brokerage service arrangements or reductions from other expense offset arrangements and do not represent the amount paid by the class during periods when reimbursements or reductions occur. Expenses net of fee waivers reflect expenses after reimbursement by the investment adviser but prior to reductions from brokerage service arrangements or other expense offset arrangements. Expenses net of all reductions represent the net expenses paid by the class.
F The portfolio turnover rate does not include the assets acquired in the merger.
G Total distributions of $2.09 per share is comprised of distributions from net investment income of $.288 and distributions from net realized gain of $1.805 per share.
See accompanying notes which are an integral part of the financial statements.
Annual Report
Notes to Financial Statements
For the period ended October 31, 2011
1. Organization.
Fidelity Advisor Emerging Asia Fund (the Fund) is a fund of Fidelity Advisor Series VIII (the Trust) and is authorized to issue an unlimited number of shares. The Trust is registered under the Investment Company Act of 1940, as amended (the 1940 Act), as an open-end management investment company organized as a Massachusetts business trust. The Fund offers Class A, Class T, Class C, and Institutional Class shares, each of which, along with Class B shares, has equal rights as to assets and voting privileges. Effective after the close of business on September 1, 2010, Class B shares were closed to new accounts and additional purchases, except for exchanges and reinvestments by existing shareholders. Each class has exclusive voting rights with respect to matters that affect that class. Class B shares will automatically convert to Class A shares after a holding period of seven years from the initial date of purchase. Investment income, realized and unrealized capital gains and losses, the common expenses of the Fund, and certain fund-level expense reductions, if any, are allocated on a pro-rata basis to each class based on the relative net assets of each class to the total net assets of the Fund. Each class differs with respect to transfer agent and distribution and service plan fees incurred. Certain expense reductions may also differ by class. The Fund's investments in emerging markets can be subject to social, economic, regulatory, and political uncertainties and can be extremely volatile.
2. Investments in Fidelity Central Funds.
The Fund invests in Fidelity Central Funds, which are open-end investment companies available only to other investment companies and accounts managed by Fidelity Management & Research Company (FMR) and its affiliates. The Fund's Schedule of Investments lists each of the Fidelity Central Funds held as of period end, if any, as an investment of the Fund, but does not include the underlying holdings of each Fidelity Central Fund. As an Investing Fund, the Fund indirectly bears its proportionate share of the expenses of the underlying Fidelity Central Funds.
The Money Market Central Funds seek preservation of capital and current income and are managed by Fidelity Investments Money Management, Inc. (FIMM), an affiliate of FMR.
A complete unaudited list of holdings for each Fidelity Central Fund is available upon request or at the Securities and Exchange Commission (the SEC) web site at www.sec.gov. In addition, the financial statements of the Fidelity Central Funds, which are not covered by the Fund's Report of Independent Registered Public Accounting Firm are available on the SEC web site or upon request.
Annual Report
Notes to Financial Statements - continued
3. Significant Accounting Policies.
The financial statements have been prepared in conformity with accounting principles generally accepted in the United States of America (GAAP), which require management to make certain estimates and assumptions at the date of the financial statements. Actual results could differ from those estimates. Subsequent events, if any, through the date that the financial statements were issued have been evaluated in the preparation of the financial statements. The following summarizes the significant accounting policies of the Fund:
Security Valuation. Investments are valued as of 4:00 p.m. Eastern time on the last calendar day of the period. The Fund uses independent pricing services approved by the Board of Trustees to value its investments. When current market prices or quotations are not readily available or reliable, valuations may be determined in good faith in accordance with procedures adopted by the Board of Trustees. Factors used in determining value may include market or security specific events. The frequency with which these procedures are used cannot be predicted and they may be utilized to a significant extent. The value used for net asset value (NAV) calculation under these procedures may differ from published prices for the same securities.
The Fund categorizes the inputs to valuation techniques used to value its investments into a disclosure hierarchy consisting of three levels as shown below:
Level 1 - quoted prices in active markets for identical investments
Level 2 - other significant observable inputs (including quoted prices for similar investments, interest rates, prepayment speeds, etc.)
Level 3 - unobservable inputs (including the Fund's own assumptions based on the best information available)
Changes in valuation techniques may result in transfers in or out of an assigned level within the disclosure hierarchy. The aggregate value of investments by input level, as of October 31, 2011, as well as a roll forward of Level 3 securities, is included at the end of the Fund's Schedule of Investments. Valuation techniques used to value the Fund's investments by major category are as follows:
Equity securities, including restricted securities, for which market quotations are readily available, are valued at the last reported sale price or official closing price as reported by an independent pricing service on the primary market or exchange on which they are traded and are categorized as Level 1 in the hierarchy. In the event there were no sales during the day or closing prices are not available, securities are valued at the last quoted bid price or may be valued using the last available price and are generally categorized as Level 2 in the hierarchy. For foreign equity securities, when significant market or security specific events arise, comparisons to the valuation of American Depositary Receipts
Annual Report
3. Significant Accounting Policies - continued
Security Valuation - continued
(ADRs), futures contracts, Exchange-traded funds (ETFs) and certain indexes as well as quoted prices for similar securities are used and are categorized as Level 2 in the hierarchy in these circumstances. Utilizing these techniques may result in transfers between Level 1 and Level 2. For restricted equity securities and private placements where observable inputs are limited, assumptions about market activity and risk are used and are categorized as Level 3 in the hierarchy.
Investments in open-end mutual funds, including the Fidelity Central Funds, are valued at their closing net asset value each business day and are categorized as Level 1 in the hierarchy.
Foreign Currency. The Fund may use foreign currency contracts to facilitate transactions in foreign-denominated securities. Gains and losses from these transactions may arise from changes in the value of the foreign currency or if the counterparties do not perform under the contracts' terms.
Foreign-denominated assets, including investment securities, and liabilities are translated into U.S. dollars at the exchange rate at period end. Purchases and sales of investment securities, income and dividends received and expenses denominated in foreign currencies are translated into U.S. dollars at the exchange rate in effect on the transaction date.
The effects of exchange rate fluctuations on investments are included with the net realized and unrealized gain (loss) on investment securities. Other foreign currency transactions resulting in realized and unrealized gain (loss) are disclosed separately.
Investment Transactions and Income. For financial reporting purposes, the Fund's investment holdings and NAV include trades executed through the end of the last business day of the period. The NAV per share for processing shareholder transactions is calculated as of the close of business of the New York Stock Exchange (NYSE), normally 4:00 p.m. Eastern time and includes trades executed through the end of the prior business day. Gains and losses on securities sold are determined on the basis of identified cost and may include proceeds received from litigation. Dividend income is recorded on the ex-dividend date, except for certain dividends from foreign securities where the ex-dividend date may have passed, which are recorded as soon as the Fund is informed of the ex-dividend date. Non-cash dividends included in dividend income, if any, are recorded at the fair market value of the securities received. Distributions received on securities that represent a return of capital or capital gain are recorded as a reduction of cost of investments and/or as a realized gain. The Fund estimates the components of distributions received that may be considered return of capital distributions or capital gain distributions. Interest income and distributions from the Fidelity Central Funds are
Annual Report
Notes to Financial Statements - continued
3. Significant Accounting Policies - continued
Investment Transactions and Income - continued
accrued as earned. Interest income includes coupon interest and amortization of premium and accretion of discount on debt securities. Investment income is recorded net of foreign taxes withheld where recovery of such taxes is uncertain.
Expenses. Expenses directly attributable to a fund are charged to that fund. Expenses attributable to more than one fund are allocated among the respective funds on the basis of relative net assets or other appropriate methods. Expense estimates are accrued in the period to which they relate and adjustments are made when actual amounts are known.
Income Tax Information and Distributions to Shareholders. Each year, the Fund intends to qualify as a regulated investment company, including distributing substantially all of its taxable income and realized gains under Subchapter M of the Internal Revenue Code and filing its U.S. federal tax return. As a result, no provision for income taxes is required. As of October 31, 2011, the Fund did not have any unrecognized tax benefits in the financial statements. A fund's federal tax return is subject to examination by the Internal Revenue Service (IRS) for a period of three years. Foreign taxes are provided for based on the Fund's understanding of the tax rules and rates that exist in the foreign markets in which it invests. The Fund received a final ruling from the Authority for Advance Ruling in India regarding the applicability of taxes imposed by the country on realized capital gains under the US/India tax treaty. The ruling entitled the Fund to a refund of capital gains taxes paid in prior years and exempts the Fund from taxes on future realized gains. The India Central Board of Direct Taxation may challenge the ruling at any time which could result in the reversal of some or all of the benefits recorded by the Fund.
Distributions are declared and recorded on the ex-dividend date. Income dividends and capital gain distributions are declared separately for each class. Income and capital gain distributions are determined in accordance with income tax regulations, which may differ from GAAP. In addition, the Fund claimed a portion of the payment made to redeeming shareholders as a distribution for income tax purposes.
Capital accounts within the financial statements are adjusted for permanent book-tax differences. These adjustments have no impact on net assets or the results of operations. Temporary book-tax differences will reverse in a subsequent period.
Book-tax differences are primarily due to futures transactions, foreign currency transactions, passive foreign investment companies (PFIC), and losses deferred due to wash sales.
Annual Report
3. Significant Accounting Policies - continued
Income Tax Information and Distributions to Shareholders - continued
The federal tax cost of investment securities and unrealized appreciation (depreciation) as of period end were as follows:
Gross unrealized appreciation | $ 47,310,211 |
Gross unrealized depreciation | (30,715,528) |
Net unrealized appreciation (depreciation) on securities and other investments | $ 16,594,683 |
| |
Tax Cost | $ 365,581,079 |
The tax-based components of distributable earnings as of period end were as follows:
Undistributed ordinary income | $ 2,634,151 |
Undistributed long-term capital gain | $ 16,660,184 |
Net unrealized appreciation (depreciation) | $ 16,579,605 |
Under the recently enacted Regulated Investment Company Modernization Act of 2010 (the Act), the Fund will be permitted to carry forward capital losses incurred in taxable years beginning after December 22, 2010 for an unlimited period. However, any losses incurred during those future taxable years will be required to be utilized prior to any losses incurred in pre-enactment taxable years, which generally expire after eight years from when they are incurred. Additionally, post-enactment capital losses that are carried forward will retain their character as either short-term or long-term capital losses rather than being considered all short-term as under previous law. The Fund's first fiscal year end subject to the Act will be October 31, 2012.
The tax character of distributions paid was as follows:
| October 31, 2011 | October 31, 2010 |
Ordinary Income | $ 3,521,543 | $ 3,503,974 |
Long-term Capital Gains | 22,144,049 | - |
Total | $ 25,665,592 | $ 3,503,974 |
Short-Term Trading (Redemption) Fees. Shares held by investors in the Fund less than 90 days are subject to a redemption fee equal to 1.50% of the net asset value of shares redeemed. All redemption fees, which reduce the proceeds of the shareholder redemption, are retained by the Fund and accounted for as an addition to paid in capital.
Annual Report
Notes to Financial Statements - continued
3. Significant Accounting Policies - continued
New Accounting Pronouncement. In May 2011, the Financial Accounting Standards Board issued Accounting Standard Update No. 2011-04, Fair Value Measurement (Topic 820) - Amendments to Achieve Common Fair Value Measurement and Disclosure Requirements in U.S. GAAP and IFRSs. The update changes the wording used to describe the requirements in GAAP for measuring fair value and for disclosing information about fair value measurements. The update is effective during interim and annual periods beginning after December 15, 2011. Management is currently evaluating the impact of the update's adoption on the Fund's financial statement disclosures.
4. Derivative Instruments.
Risk Exposures and the Use of Derivative Instruments. The Fund used derivative instruments (derivatives), including futures contracts in order to meet its investment objectives. The strategy is to use derivatives to increase returns, to gain exposure to certain types of assets and to manage exposure to certain risks as defined below. The success of any strategy involving derivatives depends on analysis of numerous economic factors, and if the strategies for investment do not work as intended, the Fund may not achieve its objectives.
The Fund's use of derivatives increased or decreased its exposure to the following risks:
Equity Risk | Equity risk relates to the fluctuations in the value of financial instruments as a result of changes in market prices (other than those arising from interest rate risk or foreign exchange risk), whether caused by factors specific to an individual investment, its issuer, or all factors affecting all instruments traded in a market or market segment. |
The Fund is also exposed to additional risks from investing in derivatives, such as liquidity risk and counterparty credit risk. Liquidity risk is the risk that the Fund will be unable to sell the derivative in the open market in a timely manner. Counterparty credit risk is the risk that the counterparty will not be able to fulfill its obligation to the Fund.
Futures Contracts. A futures contract is an agreement between two parties to buy or sell a specified underlying instrument for a fixed price at a specified future date. The Fund used futures contracts to manage its exposure to the stock market and fluctuations in currency values.
Upon entering into a futures contract, a fund is required to deposit either cash or securities (initial margin) with a clearing broker in an amount equal to a certain percentage of the face value of the contract. Futures contracts are marked-to-market daily and subsequent payments(variation margin) are made or received by a fund depending on the
Annual Report
4. Derivative Instruments - continued
Futures Contracts - continued
daily fluctuations in the value of the futures contracts and are recorded as unrealized appreciation or (depreciation). This receivable and/or payable is included in daily variation margin on futures contracts in the Statement of Assets and Liabilities. Realized gain or (loss) is recorded upon the expiration or closing of a futures contract. The net realized gain (loss) and change in net unrealized appreciation (depreciation) on futures contracts during the period is included in the Statement of Operations.
The underlying face amount at value of open futures contracts at period end, if any, is shown in the Schedule of Investments under the caption "Futures Contracts." This amount reflects each contract's exposure to the underlying instrument at period end. Securities deposited to meet initial margin requirements are identified in the Schedule of Investments.
Certain risks arise upon entering into futures contracts, including the risk that an illiquid market limits the ability to close out a futures contract prior to settlement date.
During the period the Fund recognized net realized gain (loss) of $(459,204) related to its investment in futures contracts. This amount is included in the Statement of Operations.
5. Purchases and Sales of Investments.
Purchases and sales of securities, other than short-term securities, aggregated $523,035,766 and $506,770,221, respectively.
6. Fees and Other Transactions with Affiliates.
Management Fee. FMR and its affiliates provide the Fund with investment management related services for which the Fund pays a monthly management fee. The management fee is the sum of an individual fund fee rate that is based on an annual rate of .45% of the Fund's average net assets and a group fee rate that averaged .26% during the period. The group fee rate is based upon the average net assets of all the mutual funds advised by FMR. The group fee rate decreases as assets under management increase and increases as assets under management decrease. For the period, the total annual management fee rate was .71% of the Fund's average net assets.
Annual Report
Notes to Financial Statements - continued
6. Fees and Other Transactions with Affiliates - continued
Distribution and Service Plan Fees. In accordance with Rule 12b-1 of the 1940 Act, the Fund has adopted separate Distribution and Service Plans for each class of shares. Certain classes pay Fidelity Distributors Corporation (FDC), an affiliate of FMR, separate Distribution and Service Fees, each of which is based on an annual percentage of each class' average net assets. In addition, FDC may pay financial intermediaries for selling shares of the Fund and providing shareholder support services.
For the period, the Distribution and Service Fee rates, total fees and amounts retained by FDC were as follows:
| Distribution
Fee | Service
Fee | Total Fees | Retained
by FDC |
Class A | -% | .25% | $ 508,104 | $ 14,268 |
Class T | .25% | .25% | 315,598 | 367 |
Class B | .75% | .25% | 260,552 | 195,658 |
Class C | .75% | .25% | 902,826 | 205,445 |
| | | $ 1,987,080 | $ 415,738 |
Sales Load. FDC may receive a front-end sales charge of up to 5.75% for selling Class A shares, and 3.50% for selling Class T shares, some of which is paid to financial intermediaries for selling shares of the Fund. Depending on the holding period, FDC may receive contingent deferred sales charges levied on Class A, Class T, Class B, and Class C redemptions. The deferred sales charges range from 5% to 1% for Class B, 1% for Class C, 1.00% for certain purchases of Class A shares and .25% for certain purchases of Class T shares.
For the period, sales charge amounts retained by FDC were as follows:
| Retained
by FDC |
Class A | $ 130,443 |
Class T | 20,319 |
Class B* | 42,404 |
Class C* | 14,316 |
| $ 207,482 |
* When Class B and Class C shares are initially sold, FDC pays commissions from its own resources to financial intermediaries through which the sales are made.
Transfer Agent Fees. Fidelity Investments Institutional Operations Company, Inc. (FIIOC), an affiliate of FMR, is the transfer, dividend disbursing and shareholder servicing agent for each class of the Fund. FIIOC receives account fees and asset-based fees that vary according to the account size and type of account of the shareholders of the respective classes of the Fund. FIIOC pays for typesetting, printing and mailing of shareholder reports, except proxy statements.
Annual Report
6. Fees and Other Transactions with Affiliates - continued
Transfer Agent Fees - continued
For the period, transfer agent fees for each class were as follows:
| Amount | % of
Average
Net Assets |
Class A | $ 514,416 | .25 |
Class T | 196,848 | .31 |
Class B | 78,963 | .30 |
Class C | 223,172 | .25 |
Institutional Class | 118,635 | .22 |
| $ 1,132,034 | |
Accounting and Security Lending Fees. Fidelity Service Company, Inc. (FSC), an affiliate of FMR, maintains the Fund's accounting records. The accounting fee is based on the level of average net assets for the month. Under a separate contract, FSC administers the security lending program. The security lending fee is based on the number and duration of lending transactions.
Brokerage Commissions. The Fund placed a portion of its portfolio transactions with brokerage firms which are affiliates of the investment adviser. The commissions paid to these affiliated firms were $386 for the period.
Interfund Lending Program. Pursuant to an Exemptive Order issued by the SEC, the Fund, along with other registered investment companies having management contracts with FMR, may participate in an interfund lending program. This program provides an alternative credit facility allowing the funds to borrow from, or lend money to, other participating affiliated funds. At period end, there were no interfund loans outstanding. The Fund's activity in this program during the period for which loans were outstanding was as follows:
Borrower or Lender | Average Daily
Loan Balance | Weighted Average Interest Rate | Interest
Expense |
Borrower | $ 6,580,526 | .40% | $ 1,400 |
7. Committed Line of Credit.
The Fund participates with other funds managed by FMR or an affiliate in a $4.0 billion credit facility (the "line of credit") to be utilized for temporary or emergency purposes to fund shareholder redemptions or for other short-term liquidity purposes. The Fund has agreed to pay commitment fees on its pro-rata portion of the line of credit, which amounted to $1,351 and is reflected in Miscellaneous expenses on the Statement of Operations. During the period, there were no borrowings on this line of credit.
Annual Report
Notes to Financial Statements - continued
8. Security Lending.
The Fund lends portfolio securities through a lending agent from time to time in order to earn additional income. For equity securities, a lending agent is used and may loan securities to certain qualified borrowers, including Fidelity Capital Markets (FCM), a broker-dealer affiliated with the Fund. On the settlement date of the loan, the Fund receives collateral (in the form of U.S. Treasury obligations, letters of credit and/or cash) against the loaned securities and maintains collateral in an amount not less than 100% of the market value of the loaned securities during the period of the loan. The market value of the loaned securities is determined at the close of business of the Fund and any additional required collateral is delivered to the Fund on the next business day. If the borrower defaults on its obligation to return the securities loaned because of insolvency or other reasons, a fund could experience delays and costs in recovering the securities loaned or in gaining access to the collateral. Any cash collateral received is invested in the Fidelity Securities Lending Cash Central Fund. The value of loaned securities and cash collateral at period end are disclosed on the Fund's Statement of Assets and Liabilities. Security lending income represents the income earned on investing cash collateral, less rebates paid to borrowers and any lending agent fees associated with the loan, plus any premium payments received for lending certain types of securities. Security lending income is presented in the Statement of Operations as a component of income from Fidelity Central Funds. Total security lending income during the period amounted to $145,253. During the period, there were no securities loaned to FCM.
9. Expense Reductions.
FMR voluntarily agreed to reimburse each class to the extent annual operating expenses exceeded certain levels of average net assets as noted in the table below. Some expenses, for example interest expense, including commitment fees, are excluded from this reimbursement.
The following classes were in reimbursement during the period:
| Expense
Limitations | Reimbursement
from adviser |
Class T | 1.75%-1.90%* | 3,344 |
Class B | 2.25%-2.40%* | 1,308 |
| | $ 4,652 |
* Expense limitation in effect at period end.
Many of the brokers with whom FMR places trades on behalf of the Fund provided services to the Fund in addition to trade execution. These services included payments of certain expenses on behalf of the Fund totaling $164,928 for the period.
Annual Report
10. Distributions to Shareholders.
Distributions to shareholders of each class were as follows:
Years ended October 31, | 2011 | 2010 |
From net investment income | | |
Class A | $ 1,195,236 | $ 615,994 |
Class T | 238,089 | 138,177 |
Class C | 129,641 | 55,860 |
Institutional Class | 411,224 | 161,513 |
Total | $ 1,974,190 | $ 971,544 |
From net realized gain | | |
Class A | $ 10,575,420 | $ 1,138,813 |
Class T | 3,522,540 | 399,983 |
Class B | 1,697,909 | 223,532 |
Class C | 5,318,244 | 558,596 |
Institutional Class | 2,577,289 | 211,506 |
Total | $ 23,691,402 | $ 2,532,430 |
11. Share Transactions.
Transactions for each class of shares were as follows:
| Shares | Dollars |
Years ended October 31, | 2011 | 2010 | 2011 | 2010 |
Class A | | | | |
Shares sold | 2,202,556 | 2,066,420 | $ 71,049,522 | $ 59,859,672 |
Reinvestment of distributions | 309,654 | 54,021 | 9,819,123 | 1,525,557 |
Shares redeemed | (2,005,332) | (1,447,315) | (62,867,653) | (40,817,600) |
Net increase (decrease) | 506,878 | 673,126 | $ 18,000,992 | $ 20,567,629 |
Class T | | | | |
Shares sold | 487,526 | 516,790 | $ 15,326,473 | $ 14,594,570 |
Reinvestment of distributions | 118,542 | 18,968 | 3,673,606 | 524,658 |
Shares redeemed | (538,208) | (403,834) | (16,492,902) | (11,178,425) |
Net increase (decrease) | 67,860 | 131,924 | $ 2,507,177 | $ 3,940,803 |
Class B | | | | |
Shares sold | 65,556 | 202,362 | $ 2,016,841 | $ 5,365,940 |
Reinvestment of distributions | 44,891 | 6,691 | 1,329,672 | 177,369 |
Shares redeemed | (291,995) | (305,292) | (8,641,379) | (8,111,865) |
Net increase (decrease) | (181,548) | (96,239) | $ (5,294,866) | $ (2,568,556) |
Class C | | | | |
Shares sold | 976,733 | 996,034 | $ 29,282,683 | $ 27,112,281 |
Reinvestment of distributions | 152,906 | 18,926 | 4,496,965 | 499,282 |
Shares redeemed | (992,268) | (626,174) | (28,874,366) | (16,404,984) |
Net increase (decrease) | 137,371 | 388,786 | $ 4,905,282 | $ 11,206,579 |
Annual Report
Notes to Financial Statements - continued
11. Share Transactions - continued
| Shares | Dollars |
Years ended October 31, | 2011 | 2010 | 2011 | 2010 |
Institutional Class | | | | |
Shares sold | 1,196,148 | 836,632 | $ 38,645,718 | $ 24,478,070 |
Reinvestment of distributions | 57,110 | 9,083 | 1,854,949 | 262,322 |
Shares redeemed | (893,992) | (411,905) | (28,329,397) | (11,804,448) |
Net increase (decrease) | 359,266 | 433,810 | $ 12,171,270 | $ 12,935,944 |
12. Other.
The Fund's organizational documents provide former and current trustees and officers with a limited indemnification against liabilities arising in connection with the performance of their duties to the Fund. In the normal course of business, the Fund may also enter into contracts that provide general indemnifications. The Fund's maximum exposure under these arrangements is unknown as this would be dependent on future claims that may be made against the Fund. The risk of material loss from such claims is considered remote.
Annual Report
To the Trustees of Fidelity Advisor Series VIII and the Shareholders of Fidelity Advisor Emerging Asia Fund:
In our opinion, the accompanying statement of assets and liabilities, including the schedule of investments, and the related statements of operations and of changes in net assets and the financial highlights present fairly, in all material respects, the financial position of Fidelity Advisor Emerging Asia Fund (a fund of Fidelity Advisor Series VIII) at October 31, 2011, the results of its operations for the year then ended, the changes in its net assets for each of the two years in the period then ended and the financial highlights for each of the five years in the period then ended, in conformity with accounting principles generally accepted in the United States of America. These financial statements and financial highlights (hereafter referred to as "financial statements") are the responsibility of the Fidelity Advisor Emerging Asia Fund's management. Our responsibility is to express an opinion on these financial statements based on our audits. We conducted our audits of these financial statements in accordance with the standards of the Public Company Accounting Oversight Board (United States). Those standards require that we plan and perform the audit to obtain reasonable assurance about whether the financial statements are free of material misstatement. An audit includes examining, on a test basis, evidence supporting the amounts and disclosures in the financial statements, assessing the accounting principles used and significant estimates made by management, and evaluating the overall financial statement presentation. We believe that our audits, which included confirmation of securities at October 31, 2011 by correspondence with the custodian and brokers, provide a reasonable basis for our opinion.
/s/ PricewaterhouseCoopers LLP
PricewaterhouseCoopers LLP
Boston, Massachusetts
December 12, 2011
Annual Report
The Trustees, Members of the Advisory Board, and executive officers of the trust and fund, as applicable, are listed below. The Board of Trustees governs the fund and is responsible for protecting the interests of shareholders. The Trustees are experienced executives who meet periodically throughout the year to oversee the fund's activities, review contractual arrangements with companies that provide services to the fund, oversee management of the risks associated with such activities and contractual arrangements, and review the fund's performance. Except for James C. Curvey, each of the Trustees oversees 226 funds advised by FMR or an affiliate. Mr. Curvey oversees 429 funds advised by FMR or an affiliate.
The Trustees hold office without limit in time except that (a) any Trustee may resign; (b) any Trustee may be removed by written instrument, signed by at least two-thirds of the number of Trustees prior to such removal; (c) any Trustee who requests to be retired or who has become incapacitated by illness or injury may be retired by written instrument signed by a majority of the other Trustees; and (d) any Trustee may be removed at any special meeting of shareholders by a two-thirds vote of the outstanding voting securities of the trust. Each Trustee who is not an interested person (as defined in the 1940 Act) (Independent Trustee), shall retire not later than the last day of the calendar year in which his or her 75th birthday occurs. The Independent Trustees may waive this mandatory retirement age policy with respect to individual Trustees. The executive officers and Advisory Board Members hold office without limit in time, except that any officer and Advisory Board Member may resign or may be removed by a vote of a majority of the Trustees at any regular meeting or any special meeting of the Trustees. Except as indicated, each individual has held the office shown or other offices in the same company for the past five years.
Experience, Skills, Attributes, and Qualifications of the Fund's Trustees. The Governance and Nominating Committee has adopted a statement of policy that describes the experience, qualifications, attributes, and skills that are necessary and desirable for potential Independent Trustee candidates (Statement of Policy). The Board believes that each Trustee satisfied at the time he or she was initially elected or appointed a Trustee, and continues to satisfy, the standards contemplated by the Statement of Policy. The Governance and Nominating Committee also engages professional search firms to help identify potential Independent Trustee candidates who have the experience, qualifications, attributes, and skills consistent with the Statement of Policy. From time to time, additional criteria based on the composition and skills of the current Independent Trustees, as well as experience or skills that may be appropriate in light of future changes to board composition, business conditions, and regulatory or other developments, have also been considered by the professional search firms and the Governance and Nominating Committee. In addition, the Board takes into account the Trustees' commitment and participation in Board and committee meetings, as well as their leadership of standing and ad hoc committees throughout their tenure.
In determining that a particular Trustee was and continues to be qualified to serve as a Trustee, the Board has considered a variety of criteria, none of which, in isolation, was controlling. The Board believes that, collectively, the Trustees have balanced and diverse experience, qualifications, attributes, and skills, which allow the Board to operate effectively in governing the fund and protecting the interests of shareholders. Information about the specific experience, skills, attributes, and qualifications of each Trustee, which in each case led to the Board's conclusion that the Trustee should serve (or continue to serve) as a trustee of the fund, is provided below.
Annual Report
Board Structure and Oversight Function. James C. Curvey is an interested person (as defined in the 1940 Act) and currently serves as Acting Chairman. The Trustees have determined that an interested Chairman is appropriate and benefits shareholders because an interested Chairman has a personal and professional stake in the quality and continuity of services provided to the fund. Independent Trustees exercise their informed business judgment to appoint an individual of their choosing to serve as Chairman, regardless of whether the Trustee happens to be independent or a member of management. The Independent Trustees have determined that they can act independently and effectively without having an Independent Trustee serve as Chairman and that a key structural component for assuring that they are in a position to do so is for the Independent Trustees to constitute a substantial majority for the Board. The Independent Trustees also regularly meet in executive session. Ned C. Lautenbach serves as Chairman of the Independent Trustees and as such (i) acts as a liaison between the Independent Trustees and management with respect to matters important to the Independent Trustees and (ii) with management prepares agendas for Board meetings.
Fidelity funds are overseen by different Boards of Trustees. The fund's Board oversees Fidelity's equity and high income funds and another Board oversees Fidelity's investment-grade bond, money market, and asset allocation funds. The asset allocation funds may invest in Fidelity funds overseen by the fund's Board. The use of separate Boards, each with its own committee structure, allows the Trustees of each group of Fidelity funds to focus on the unique issues of the funds they oversee, including common research, investment, and operational issues. On occasion, the separate Boards establish joint committees to address issues of overlapping consequences for the Fidelity funds overseen by each Board.
The Trustees operate using a system of committees to facilitate the timely and efficient consideration of all matters of importance to the Trustees, the fund, and fund shareholders and to facilitate compliance with legal and regulatory requirements and oversight of the fund's activities and associated risks. The Board, acting through its committees, has charged FMR and its affiliates with (i) identifying events or circumstances the occurrence of which could have demonstrably adverse effects on the fund's business and/or reputation; (ii) implementing processes and controls to lessen the possibility that such events or circumstances occur or to mitigate the effects of such events or circumstances if they do occur; and (iii) creating and maintaining a system designed to evaluate continuously business and market conditions in order to facilitate the identification and implementation processes described in (i) and (ii) above. Because the day-to-day operations and activities of the fund are carried out by or through FMR, its affiliates and other service providers, the fund's exposure to risks is mitigated but not eliminated by the processes overseen by the Trustees. While each of the Board's committees has responsibility for overseeing different aspects of the fund's activities, oversight is exercised primarily through the Operations, Audit, and Compliance Committees. In addition, the Independent Trustees have worked with FMR to enhance the Board's oversight of investment and financial risks, legal and regulatory risks, technology risks, and operational risks, including the development of additional risk reporting to the Board. For example, a working group comprised of Independent Trustees and FMR has worked and continues to work to review the Fidelity funds' valuation-related activities, reporting and risk management. Appropriate personnel, including but not limited to the fund's Chief Compliance Officer (CCO), FMR's internal auditor, the independent accountants, the fund's Treasurer and portfolio management personnel, make periodic reports to the Board's committees, as appropriate, including an annual review of FMR's risk management program for the Fidelity funds. The responsibilities of each standing committee, including their oversight responsibilities, are described further under "Standing Committees of the Fund's Trustees."
Annual Report
Trustees and Officers - continued
The fund's Statement of Additional Information (SAI) includes more information about the Trustees. To request a free copy, call Fidelity at 1-877-208-0098.
Interested Trustees*:
Correspondence intended for each Trustee who is an interested person may be sent to Fidelity Investments, 82 Devonshire Street, Boston, Massachusetts 02109.
Name, Age; Principal Occupations and Other Relevant Experience+ |
James C. Curvey (76) |
| Year of Election or Appointment: 2007 Mr. Curvey is Trustee and Acting Chairman of the Board of Trustees of certain Trusts. Mr. Curvey also serves as Trustee (2007-present) of other investment companies advised by FMR. Mr. Curvey is a Director of Fidelity Investments Money Management, Inc. (2009-present), Director of Fidelity Research & Analysis Co. (2009-present) and Director of FMR and FMR Co., Inc. (2007-present). Mr. Curvey is also Vice Chairman (2007-present) and Director of FMR LLC. In addition, Mr. Curvey serves as an Overseer for the Boston Symphony Orchestra and a member of the Trustees of Villanova University. Previously, Mr. Curvey was the Vice Chairman (2006-2007) and Director (2000-2007) of FMR Corp. |
Ronald P. O'Hanley (54) |
| Year of Election or Appointment: 2011 Mr. O'Hanley is Director of FMR Co., Inc. (2010-present), Director of Fidelity Investments Money Management, Inc. (2010-present), Director of Fidelity Research & Analysis Company (2010-present), President of Fidelity Asset Management and Corporate Services and a member of Fidelity's Executive Committee (2010-present). Previously, Mr. O'Hanley served as President and Chief Executive Officer of BNY Mellon Asset Management (2007-2010). Mr. O'Hanley also served as Vice Chairman of Bank New York Mellon Corp. and a member of that firm's Executive Committee. Prior to the 2007 merger of The Bank of New York and Mellon Financial Corporation, he was Vice Chairman of Mellon Financial Corporation and President and Chief Executive Officer of Mellon Asset Management. He joined Mellon in February 1997. Mr. O'Hanley currently serves as Chairman of the Boston Public Library Foundation Board of Directors and sits on the Board of Directors of Beth Israel Deaconess Medical Center, the Board of Trustees of the Marine Biological Laboratory and the Advisory Board of the Maxwell School of Citizenship and Public Administration at Syracuse University. Mr. O'Hanley also chairs the Council on Asset Management for the Financial Services Roundtable and is a member of the Board of Directors of Institutional Investor's U.S. Institute. |
* Trustees have been determined to be "Interested Trustees" by virtue of, among other things, their affiliation with the trust or various entities under common control with FMR.
+ The information above includes each Trustee's principal occupation during the last five years and other information relating to the experience, attributes, and skills relevant to each Trustee's qualifications to serve as a Trustee, which led to the conclusion that each Trustee should serve as a Trustee for the fund.
Annual Report
Trustees and Officers - continued
Independent Trustees:
Correspondence intended for each Independent Trustee (that is, the Trustees other than the Interested Trustees) may be sent to Fidelity Investments, P.O. Box 55235, Boston, Massachusetts 02205-5235.
Name, Age; Principal Occupations and Other Relevant Experience+ |
Dennis J. Dirks (63) |
| Year of Election or Appointment: 2005 Prior to his retirement in May 2003, Mr. Dirks was Chief Operating Officer and a member of the Board of The Depository Trust & Clearing Corporation (DTCC). He also served as President, Chief Operating Officer, and Board member of The Depository Trust Company (DTC) and President and Board member of the National Securities Clearing Corporation (NSCC). In addition, Mr. Dirks served as Chief Executive Officer and Board member of the Government Securities Clearing Corporation, Chief Executive Officer and Board member of the Mortgage-Backed Securities Clearing Corporation, as a Trustee and a member of the Finance Committee of Manhattan College (2005-2008), and as a Trustee and a member of the Finance Committee of AHRC of Nassau County (2006-2008). Mr. Dirks is a member of the Independent Directors Council (IDC) Governing Council (2010-Present) and Board of Directors for The Brookville Center for Children's Services, Inc. (2009-present). |
Alan J. Lacy (58) |
| Year of Election or Appointment: 2008 Mr. Lacy serves as Senior Adviser (2007-present) of Oak Hill Capital Partners, L.P. (private equity). Mr. Lacy also served as Chief Executive Officer (2000-2005) and Vice Chairman (2005-2006) of Sears Holdings Corporation and Sears, Roebuck and Co. (retail). In addition, Mr. Lacy serves as a member of the Board of Directors of Dave & Buster's, Inc. (restaurant and entertainment complexes, 2010-present), The Hillman Companies, Inc. (hardware wholesalers, 2010-present), and Bristol-Myers Squibb Company (global pharmaceuticals, 2007-present). Mr. Lacy is a member of the Board of Trustees of The National Parks Conservation Association (2006-Present). Previously, Mr. Lacy served as Chairman of the Board of Trustees of the National Parks Conservation Association (2008-2011) and as a member of the Board of Directors for the Western Union Company (global money transfer, 2006-2011). |
Ned C. Lautenbach (67) |
| Year of Election or Appointment: 2000 Mr. Lautenbach is Chairman of the Independent Trustees of the Equity and High Income Funds (2006-present). Mr. Lautenbach currently serves as the Lead Director of the Eaton Corporation Board of Directors (diversified industrial, 1997-present). Mr. Lautenbach is also a member of the Board of Directors of the Philharmonic Center for the Arts in Naples, Florida (1999-present); a member of the Board of Trustees of Fairfield University (2005-present); and a member of the Council on Foreign Relations (1994-present). Previously, Mr. Lautenbach was a Partner/Advisory Partner at Clayton, Dubilier & Rice, LLC (private equity investment, 1998-2010), as well as a Director of Sony Corporation (2006-2007). |
Joseph Mauriello (67) |
| Year of Election or Appointment: 2008 Prior to his retirement in January 2006, Mr. Mauriello served in numerous senior management positions including Deputy Chairman and Chief Operating Officer (2004-2005), and Vice Chairman of Financial Services (2002-2004) of KPMG LLP US (professional services, 1965-2005). Mr. Mauriello currently serves as a member of the Board of Directors of XL Group plc. (global insurance and re-insurance, 2006-present) and of Arcadia Resources Inc. (health care services and products, 2007-present). Previously, Mr. Mauriello served as a Director of the Hamilton Funds of the Bank of New York (2006-2007). |
Robert W. Selander (61) |
| Year of Election or Appointment: 2011 Previously, Mr. Selander served as a Member of the Advisory Board of Fidelity's Equity and High Income Funds (2011), Executive Vice Chairman (2010), Chief Executive Officer (2009-2010), and President and Chief Executive Officer (1997-2009) of Mastercard, Inc. |
Cornelia M. Small (67) |
| Year of Election or Appointment: 2005 Ms. Small is a member of the Board of Directors of the Teagle Foundation (2009-present). Ms. Small is also a member of the Investment Committee, and Chair (2008-present) and a member of the Board of Trustees of Smith College. In addition, Ms. Small serves on the Investment Committee of the Berkshire Taconic Community Foundation (2008-present). Previously, Ms. Small served as Chairperson of the Investment Committee (2002-2008) of Smith College. In addition, Ms. Small served as Chief Investment Officer, Director of Global Equity Investments, and a member of the Board of Directors of Scudder, Stevens & Clark and Scudder Kemper Investments. |
William S. Stavropoulos (72) |
| Year of Election or Appointment: 2002 Mr. Stavropoulos is Vice Chairman of the Independent Trustees of the Equity and High Income Funds (2006-present). Mr. Stavropoulos serves as President and Founder of the Michigan Baseball Foundation, the Great Lakes Loons (2007-present). Mr. Stavropoulos is Chairman Emeritus of the Board of Directors of The Dow Chemical Company, where he previously served in numerous senior management positions, including President, CEO (1995-2000; 2002-2004), Chairman of the Executive Committee (2000-2006), and as a member of the Board of Directors (1990-2006). Currently, Mr. Stavropoulos is Chairman of Univar (global distributor of commodity and specialty chemicals, 2010-present), a Director of Teradata Corporation (data warehousing and technology solutions, 2008-present), Chemical Financial Corporation, Maersk Inc. (industrial conglomerate), Tyco International, Inc. (multinational manufacturing and services, 2007-present), and a member of the Advisory Board for Metalmark Capital (private equity investment, 2005-present). Mr. Stavropoulos is a special advisor to Clayton, Dubilier & Rice, LLC (private equity investment). In addition, Mr. Stavropoulos is a member of the University of Notre Dame Advisory Council for the College of Science. |
David M. Thomas (62) |
| Year of Election or Appointment: 2008 Previously, Mr. Thomas served as Executive Chairman (2005-2006) and Chairman and Chief Executive Officer (2000-2005) of IMS Health, Inc. (pharmaceutical and healthcare information solutions). In addition, Mr. Thomas serves as a member of the Board of Directors of Fortune Brands, Inc. (consumer products), and Interpublic Group of Companies, Inc. (marketing communication, 2004-present). |
Michael E. Wiley (61) |
| Year of Election or Appointment: 2008 Mr. Wiley also serves as a Director of Asia Pacific Exploration Consolidated (international oil and gas exploration and production, 2008-present). Mr. Wiley serves as a Director of Tesoro Corporation (independent oil refiner and marketer, 2005-present), and a Director of Bill Barrett Corporation (exploration and production, 2005-present). In addition, Mr. Wiley also serves as a Director of Post Oak Bank (privately-held bank, 2004-present). Previously, Mr. Wiley served as a member of the Board of Trustees of the University of Tulsa (2000-2006; 2007-2010), as a Senior Energy Advisor of Katzenbach Partners, LLC (consulting, 2006-2007), as an Advisory Director of Riverstone Holdings (private investment), Chairman, President, and CEO of Baker Hughes, Inc. (oilfield services, 2000-2004), and as Director of Spinnaker Exploration Company (exploration and production, 2001-2005). |
Annual Report
+ The information above includes each Trustee's principal occupation during the last five years and other information relating to the experience, attributes, and skills relevant to each Trustee's qualifications to serve as a Trustee, which led to the conclusion that each Trustee should serve as a Trustee for the fund.
Advisory Board Members and Executive Officers:
Correspondence intended for each executive officer, Edward C. Johnson 3d, and Peter S. Lynch may be sent to Fidelity Investments, 82 Devonshire Street, Boston, Massachusetts 02109.
Name, Age; Principal Occupation |
Edward C. Johnson 3d (81) |
| Year of Election or Appointment: 2011 Member of the Advisory Board of Fidelity's Equity and High Income Funds. Mr. Johnson serves as Chief Executive Officer, Chairman, and a Director of FMR LLC, and also serves as Chairman and Director of FIL Limited. Previously, Mr. Johnson served as a Trustee and Chairman of the Board of certain Fidelity Trusts, Chairman and a Director of FMR, Chairman and a Director of FMR Co., Inc., and President of FMR LLC (2006-2007). |
Peter S. Lynch (67) |
| Year of Election or Appointment: 2003 Member of the Advisory Board of Fidelity's Equity and High Income Funds. Mr. Lynch is Vice Chairman and a Director of FMR and FMR Co., Inc. In addition, Mr. Lynch serves as a Trustee of Boston College and as the Chairman of the Inner-City Scholarship Fund. Previously, Mr. Lynch served on the Special Olympics International Board of Directors (1997-2006). |
Kenneth B. Robins (42) |
| Year of Election or Appointment: 2008 President and Treasurer of Fidelity's Equity and High Income Funds. Mr. Robins also serves as President and Treasurer (2010-present) and Assistant Treasurer (2009-present) of other Fidelity funds and is an employee of Fidelity Investments (2004-present). Previously, Mr. Robins served as Deputy Treasurer of the Fidelity funds (2005-2008) and Treasurer and Chief Financial Officer of The North Carolina Capital Management Trust: Cash and Term Portfolios (2006-2008). |
Bruce T. Herring (46) |
| Year of Election or Appointment: 2006 Vice President of certain Equity Funds. Mr. Herring also serves as Chief Investment Officer and Director of Fidelity Management & Research (U.K.) Inc. (2010-present) and Group Chief Investments Officer of FMR. Previously, Mr. Herring served as Vice President (2005-2006) and Senior Vice President (2006-2007) of Fidelity Management & Research Company, Vice President of FMR Co., Inc. (2001-2007) and as a portfolio manager for Fidelity U.S. Equity Funds. |
Brian B. Hogan (47) |
| Year of Election or Appointment: 2009 Vice President of Equity and High Income Funds. Mr. Hogan also serves as President of FMR's Equity Division (2009-present). Previously, Mr. Hogan served as Senior Vice President, Equity Research of FMR (2006-2009) and as a portfolio manager. |
Thomas C. Hense (47) |
| Year of Election or Appointment: 2008 or 2010 Vice President of Fidelity's High Income (2008), Small Cap (2008), and Value (2010) Funds. Previously, Mr. Hense served as a portfolio manager for Fidelity's Institutional Money Management Group (Pyramis) (2003-2008). |
Scott C. Goebel (43) |
| Year of Election or Appointment: 2008 Secretary and Chief Legal Officer (CLO) of the Fidelity funds. Mr. Goebel also serves as Secretary of Fidelity Investments Money Management, Inc. (FIMM) (2010-present) and Fidelity Research and Analysis Company (FRAC) (2010-present); Secretary and CLO of The North Carolina Capital Management Trust: Cash and Term Portfolios (2008-present); General Counsel, Secretary, and Senior Vice President of FMR (2008-present) and FMR Co., Inc. (2008-present); employed by FMR LLC or an affiliate (2001-present); Chief Legal Officer of Fidelity Management & Research (Hong Kong) Limited (2008-present) and Assistant Secretary of Fidelity Management & Research (Japan) Inc. (2008-present), and Fidelity Management & Research (U.K.) Inc. (2008-present). Previously, Mr. Goebel served as Assistant Secretary of FIMM (2008-2010), FRAC (2008-2010), and the Funds (2007-2008) and as Vice President and Secretary of Fidelity Distributors Corporation (FDC) (2005-2007). |
William C. Coffey (42) |
| Year of Election or Appointment: 2009 Assistant Secretary of Fidelity's Equity and High Income Funds. Mr. Coffey also serves as Senior Vice President and Deputy General Counsel of FMR LLC (2010-present), and is an employee of Fidelity Investments. Previously, Mr. Coffey served as Vice President and Associate General Counsel of FMR LLC (2005-2009). |
Holly C. Laurent (57) |
| Year of Election or Appointment: 2008 Anti-Money Laundering (AML) Officer of the Fidelity funds. Ms. Laurent also serves as AML Officer of The North Carolina Capital Management Trust: Cash and Term Portfolios (2008-present) and is an employee of Fidelity Investments. Previously, Ms. Laurent was Senior Vice President and Head of Legal for Fidelity Business Services India Pvt. Ltd. (2006-2008), and Senior Vice President, Deputy General Counsel and Group Head for FMR LLC (2005-2006). |
Christine Reynolds (53) |
| Year of Election or Appointment: 2008 Chief Financial Officer of the Fidelity funds. Ms. Reynolds became President of Fidelity Pricing and Cash Management Services (FPCMS) in August 2008. Ms. Reynolds served as Chief Operating Officer of FPCMS (2007-2008). Previously, Ms. Reynolds served as President, Treasurer, and Anti-Money Laundering officer of the Fidelity funds (2004-2007). |
Kenneth A. Rathgeber (64) |
| Year of Election or Appointment: 2004 Chief Compliance Officer of Fidelity's Equity and High Income Funds. Mr. Rathgeber is Chief Compliance Officer of Fidelity Management & Research (Hong Kong) Limited (2008-present), Fidelity Management & Research (Japan) Inc. (2008-present), FMR (2005-present), FMR Co., Inc. (2005-present), Fidelity Management & Research (U.K.) Inc. (2005-present), Fidelity Research & Analysis Company (2005-present), Fidelity Investments Money Management, Inc. (2005-present), Pyramis Global Advisors, LLC (2005-present), and Strategic Advisers, Inc. (2005-present). |
Jeffrey S. Christian (50) |
| Year of Election or Appointment: 2009 Deputy Treasurer of the Fidelity funds. Mr. Christian is an employee of Fidelity Investments. Previously, Mr. Christian served as Chief Financial Officer (2008-2009) of certain Fidelity funds and Senior Vice President of Fidelity Pricing and Cash Management Services (FPCMS) (2004-2009). |
Joseph F. Zambello (54) |
| Year of Election or Appointment: 2011 Deputy Treasurer of the Fidelity funds. Mr. Zambello is an employee of Fidelity Investments. Previously, Mr. Zambello served as Vice President of FMR's Program Management Group (2009-2011) and Vice President of the Transfer Agent Oversight Group (2005-2009). |
Adrien E. Deberghes (44) |
| Year of Election or Appointment: 2008 Deputy Treasurer of Fidelity's Equity and High Income Funds. Mr. Deberghes also serves as Vice President and Assistant Treasurer of Fidelity Rutland Square Trust II and Fidelity Commonwealth Trust II (2011-present), Assistant Treasurer of other Fidelity funds (2010-present), and is an employee of Fidelity Investments (2008-present). Previously, Mr. Deberghes served as Senior Vice President of Mutual Fund Administration at State Street Corporation (2007-2008), Senior Director of Mutual Fund Administration at Investors Bank & Trust (2005-2007), and Director of Finance for Dunkin' Brands (2000-2005). |
Stephanie J. Dorsey (42) |
| Year of Election or Appointment: 2010 Assistant Treasurer of Fidelity's Equity and High Income Funds. Ms. Dorsey also serves as Deputy Treasurer of other Fidelity funds (2008-present) and is an employee of Fidelity Investments (2008-present). Previously, Ms. Dorsey served as Treasurer (2004-2008) of the JPMorgan Mutual Funds and Vice President (2004-2008) of JPMorgan Chase Bank. |
John R. Hebble (53) |
| Year of Election or Appointment: 2009 Assistant Treasurer of Fidelity's Equity and High Income Funds. Mr. Hebble also serves as President (2011-present), Treasurer, and Chief Financial Officer of The North Carolina Capital Management Trust: Cash and Term Portfolios (2008-present), President and Treasurer of other Fidelity funds (2008-present) and is an employee of Fidelity Investments. |
Gary W. Ryan (53) |
| Year of Election or Appointment: 2005 Assistant Treasurer of the Fidelity funds. Mr. Ryan is an employee of Fidelity Investments. Previously, Mr. Ryan served as Vice President of Fund Reporting in Fidelity Pricing and Cash Management Services (FPCMS) (1999-2005). |
Jonathan Davis (43) |
| Year of Election or Appointment: 2010 Assistant Treasurer of the Fidelity funds. Mr. Davis is also Assistant Treasurer of Fidelity Rutland Square Trust II and Fidelity Commonwealth Trust II. Mr. Davis is an employee of Fidelity Investments. Previously, Mr. Davis served as Vice President and Associate General Counsel of FMR LLC (2003-2010). |
Annual Report
The Board of Trustees of Advisor Emerging Asia Fund voted to pay to shareholders of record at the opening of business on record date, the following distributions per share derived from capital gains realized from sales of portfolio securities, and dividends derived from net investment income:
| Pay Date | Record Date | Dividends | Capital Gains |
Class A | 12/05/11 | 12/02/11 | $.307 | $1.23 |
Class T | 12/05/11 | 12/02/11 | $.203 | $1.23 |
Class B | 12/05/11 | 12/02/11 | $- | $1.23 |
Class C | 12/05/11 | 12/02/11 | $.061 | $1.23 |
The fund hereby designates as a capital gain dividend with respect to the taxable year ended October 31, 2011, $23,110,235 or, if subsequently determined to be different, the net capital gain of such year.
Class A designates 66%, Class T designates 84%, Class B designates 100%, and Class C designates 100% of the dividends distributed during the fiscal year as amounts which may be taken into account as a dividend for purposes of the maximum rate under section 1(h)(11) of the Internal Revenue Code.
The amounts per share which represent income derived from sources within, and taxes paid to, foreign countries or possessions of the United States are as follows:
| Pay Date | Income | Taxes |
Class A | 12/06/10 | $.385 | $.0606 |
Class T | 12/06/10 | $.303 | $.0606 |
Class B | 12/06/10 | $.150 | $.0606 |
Class C | 12/06/10 | $.225 | $.0606 |
The fund will notify shareholders in January 2012 of amounts for use in preparing 2011 income tax returns.
Annual Report
Board Approval of Investment Advisory Contracts and Management Fees
Fidelity Advisor Emerging Asia Fund
Each year, the Board of Trustees, including the Independent Trustees (together, the Board), votes on the renewal of the management contract and sub-advisory agreements (together, the Advisory Contracts) for the fund. The Board, assisted by the advice of fund counsel and Independent Trustees' counsel, requests and considers a broad range of information relevant to the renewal of the Advisory Contracts throughout the year.
The Board meets regularly and considers at each of its meetings factors that are relevant to its annual consideration of the renewal of the fund's Advisory Contracts, including the services and support provided to the fund and its shareholders. The Board has established various standing committees, each composed of Independent Trustees with varying backgrounds, to which the Board has assigned specific subject matter responsibilities in order to enhance effective decision-making by the Board. The Board, acting directly and through its Committees, requests and receives information concerning the annual consideration of the renewal of the fund's Advisory Contracts. The Board also meets as needed to consider matters specifically related to the Board's annual consideration of the renewal of Advisory Contracts. Members of the Board may also meet with trustees of other Fidelity funds through ad hoc joint committees to discuss certain matters relevant to the Fidelity funds.
At its July 2011 meeting, the Board of Trustees, including the Independent Trustees, unanimously determined to renew the fund's Advisory Contracts. In reaching its determination, the Board considered all factors it believed relevant, including (i) the nature, extent, and quality of the services to be provided to the fund and its shareholders (including the investment performance of the fund); (ii) the competitiveness of the fund's management fee and total expense ratio; (iii) the total costs of the services to be provided by and the profits to be realized by Fidelity from its relationship with the fund; (iv) the extent to which economies of scale would be realized as the fund grows; and (v) whether fee levels reflect these economies of scale, if any, for the benefit of fund shareholders.
In considering whether to renew the Advisory Contracts for the fund, the Board reached a determination, with the assistance of fund counsel and Independent Trustees' counsel and through the exercise of its business judgment, that the renewal of the Advisory Contracts is in the best interests of the fund and its shareholders and that the compensation payable under the Advisory Contracts is fair and reasonable. The Board's decision to renew the Advisory Contracts was not based on any single factor, but rather was based on a comprehensive consideration of all the information provided to the Board at its meetings throughout the year. The Board, in reaching its determination to renew the Advisory Contracts, is aware that shareholders in the fund have a broad range of investment choices available to them, including a wide choice among mutual funds offered by Fidelity's competitors, and that the fund's shareholders, who have the opportunity to review and weigh the disclosure provided by the fund in its prospectus and other public disclosures, have chosen to invest in this fund, managed by Fidelity.
Annual Report
Board Approval of Investment Advisory Contracts and
Management Fees - continued
Nature, Extent, and Quality of Services Provided. The Board considered the staffing within the investment adviser, FMR, and the sub-advisers (together, the Investment Advisers), including the backgrounds of the fund's investment personnel and the fund's investment objective and discipline. The Independent Trustees also had discussions with senior management of Fidelity's investment operations and investment groups. The Board considered the structure of the portfolio manager compensation program and whether this structure provides appropriate incentives to act in the best interests of the fund.
Resources Dedicated to Investment Management and Support Services. The Board and the Fund Oversight and Research Committees reviewed the general qualifications and capabilities of the Investment Advisers' investment staff, including its size, education, experience, and resources, as well as the Investment Advisers' approach to recruiting, training, managing, and compensating investment personnel. The Board also noted that FMR has devoted increased resources to non-U.S. offices. The Board noted that Fidelity's analysts have extensive resources, tools and capabilities which allow them to conduct sophisticated quantitative and fundamental analysis, as well as credit analysis of issuers, counterparties and enhancers. The Board also believes that Fidelity's investment professionals have sufficient access to global information and data so as to provide competitive investment results over time, and that those professionals also have access to sophisticated tools which permit them to assess portfolio construction and risk and performance attribution characteristics continuously, as well as to transmit new information and research conclusions rapidly around the world. Additionally, in their deliberations, the Board considered the Investment Advisers' trading capabilities and resources which are an integral part of the investment management process.
Shareholder and Administrative Services. The Board considered (i) the nature, extent, quality, and cost of advisory, administrative, and shareholder services performed by the Investment Advisers and their affiliates under the Advisory Contracts and under separate agreements covering transfer agency, pricing and bookkeeping, and securities lending services for the fund; (ii) the nature and extent of the investment adviser's supervision of third party service providers, principally custodians and subcustodians; and (iii) the resources devoted to, and the record of compliance with, the fund's compliance policies and procedures. The Board also reviewed the allocation of fund brokerage, including allocations to brokers affiliated with the Investment Advisers, the use of brokerage commissions to pay fund expenses, and the use of "soft" commission dollars to pay for research services.
The Board noted that the growth of fund assets over time across the complex allows Fidelity to reinvest in the development of services designed to enhance the value or convenience of the Fidelity funds as investment vehicles. These services include 24-hour access to account information and market information through telephone representatives and over the Internet, investor education materials and asset allocation tools, and the expanded availability of Fidelity Investor Centers, with 35 new branches opening since 2010.
Annual Report
Investment in a Large Fund Family. The Board considered the benefits to shareholders of investing in a Fidelity fund, including the benefits of investing in a fund that is part of a large family of funds offering a variety of investment disciplines and providing a large variety of mutual fund investor services. The Board noted that Fidelity had taken, or had made recommendations that resulted in the Fidelity funds taking, a number of actions over the previous year that benefited particular funds, including (i) continuing to dedicate additional resources to investment research and support of the senior management team that oversees asset management; (ii) rationalizing product lines through the mergers of six funds into other funds; (iii) continuing to migrate the Freedom Funds to dedicated lower cost underlying funds; (iv) obtaining shareholder approval to broaden the investment strategies for Fidelity Consumer Finance Portfolio, Fidelity Emerging Asia Fund, and Fidelity Environment and Alternative Energy Portfolio; (v) contractually agreeing to reduce the management fees and impose other expense limitations on Spartan 500 Index Fund and U.S. Bond Index Fund in connection with launching new institutional classes of these funds; (vi) changing the name, primary and supplemental benchmarks, and investment policies of Fidelity Global Strategies Fund to support the fund's flexible investment mandate and global orientation; and (vii) reducing the transfer agency account fee rates on certain accounts.
Investment Performance. The Board considered whether the fund has operated in accordance with its investment objective, as well as its record of compliance with its investment restrictions. It also reviewed the fund's absolute investment performance for each class, as well as the fund's relative investment performance for each class measured over multiple periods against a broad-based securities market index. The Board noted that FMR does not believe that a meaningful peer group exists against which to compare the fund's performance. The following charts considered by the Board show, over the one-, three-, and five-year periods ended December 31, 2010, the cumulative total returns of Institutional Class (Class I) and Class B of the fund and the cumulative total returns of a broad-based securities market index ("benchmark"). The returns of Institutional Class (Class I) and Class B show the performance of the highest and lowest performing classes, respectively (based on five-year performance).
Annual Report
Board Approval of Investment Advisory Contracts and
Management Fees - continued
Fidelity Advisor Emerging Asia Fund

The Board noted that the investment performance of Institutional Class (Class I) of the fund compared favorably to its benchmark for all the periods shown. The Board considered that the variations in performance among the fund's classes reflect the variations in class expenses, which result in lower performance for higher expense classes. The Board also reviewed the fund's performance since inception as well as performance in the current year.
Based on its review, the Board concluded that the nature, extent, and quality of services provided to the fund under the Advisory Contracts should benefit the fund's shareholders.
Competitiveness of Management Fee and Total Expense Ratio. The Board considered the fund's management fee and total expense ratio compared to "mapped groups" of competitive funds and classes. Fidelity creates "mapped groups" by combining similar Lipper investment objective categories that have comparable management fee characteristics. Combining Lipper investment objective categories aids the Board's management fee and total expense ratio comparisons by broadening the competitive group used for comparison and by reducing the number of universes to which various Fidelity funds are compared.
Management Fee. The Board considered two proprietary management fee comparisons for the 12-month periods shown in the chart below. The group of Lipper funds used by the Board for management fee comparisons is referred to below as the "Total Mapped Group." The Total Mapped Group comparison focuses on a fund's standing relative to the total universe of comparable funds available to investors in terms of gross management fees before expense reimbursements or caps. "TMG %" represents the percentage of funds in the Total Mapped Group that had management fees that were lower than the fund's. For example, a TMG % of 7% means that 93% of the funds in the Total Mapped Group had higher management fees than the fund. The "Asset-Size Peer Group" (ASPG) comparison focuses on a fund's standing relative to non-Fidelity funds similar in size to the fund within the Total Mapped Group. The ASPG represents at least 15% of the funds in the Total Mapped Group with comparable asset size and management fee characteristics, subject to a minimum of 50 funds (or all funds in the Total Mapped Group if fewer than 50). Additional information, such as the ASPG quartile in which the fund's management fee ranked, is also included in the chart and considered by the Board.
Annual Report
Fidelity Advisor Emerging Asia Fund

The Board noted that the fund's management fee ranked below the median of its Total Mapped Group and below the median of its ASPG for 2010.
Based on its review, the Board concluded that the fund's management fee is fair and reasonable in light of the services that the fund receives and the other factors considered.
Total Expense Ratio. In its review of each class's total expense ratio, the Board considered the fund's management fee as well as other fund or class expenses, as applicable, such as transfer agent fees, pricing and bookkeeping fees, fund-paid 12b-1 fees, and custodial, legal, and audit fees. The Board also noted the effects of any waivers and reimbursements on fees and expenses. As part of its review, the Board also considered the current and historical total expense ratios of each class of the fund compared to competitive fund median expenses. Each class of the fund is compared to those funds and classes in the Total Mapped Group (used by the Board for management fee comparisons) that have a similar sales load structure.
Annual Report
Board Approval of Investment Advisory Contracts and
Management Fees - continued
The Board noted that the total expense ratio of each class ranked below its competitive median for 2010. The Board considered that various factors, including 12b-1 fees, positive or negative performance adjustments, and relatively higher other expenses in the case of small fund size, can affect total expense ratios.
Fees Charged to Other Fidelity Clients. The Board also considered Fidelity fee structures and other information with respect to clients of FMR and its affiliates, such as other mutual funds advised or subadvised by FMR or its affiliates, pension plan clients, and other institutional clients. In March 2010, the Board created an ad hoc joint committee with the board of other Fidelity funds (the Committee) to review and compare Fidelity's institutional investment advisory business with its business of providing services to the Fidelity funds, including the differences in services provided, fees charged, and costs incurred, as well as competition in their respective marketplaces.
Based on its review of total expense ratios and fees charged to other Fidelity clients, the Board concluded that the total expense ratio of each class of the fund was reasonable in light of the services that the fund and its shareholders receive and the other factors considered, including the findings of the Committee.
Costs of the Services and Profitability. The Board considered the revenues earned and the expenses incurred by Fidelity in conducting the business of developing, marketing, distributing, managing, administering and servicing the fund and its shareholders. The Board also considered the level of Fidelity's profits in respect of all the Fidelity funds.
On an annual basis, FMR presents to the Board Fidelity's profitability for the fund. Fidelity calculates the profitability for each fund, as well as aggregate profitability for groups of Fidelity funds and all Fidelity funds, using a series of detailed revenue and cost allocation methodologies which originate with the books and records of Fidelity on which Fidelity's audited financial statements are based. The Audit Committee of the Board reviews any significant changes from the prior year's methodologies.
PricewaterhouseCoopers LLP (PwC), independent registered public accounting firm and auditor to Fidelity and certain Fidelity funds, has been engaged annually by the Board as part of the Board's assessment of Fidelity's profitability analysis. PwC's engagement includes the review and assessment of Fidelity's methodologies used in determining the revenues and expenses attributable to Fidelity's mutual fund business, and completion of agreed-upon procedures surrounding the mathematical accuracy of fund profitability and its conformity to allocation methodologies. After considering PwC's reports issued under the engagement and information provided by Fidelity, the Board concluded that while other allocation methods may also be reasonable, Fidelity's profitability methodologies are reasonable in all material respects.
Annual Report
The Board also reviewed Fidelity's non-fund businesses and fall-out benefits related to the mutual fund business as well as cases where Fidelity's affiliates may benefit from or be related to the fund's business.
The Board considered the costs of the services provided by and the profits realized by Fidelity in connection with the operation of the fund and was satisfied that the profitability was not excessive in the circumstances.
Economies of Scale. The Board considered whether there have been economies of scale in respect of the management of the Fidelity funds, whether the Fidelity funds (including the fund) have appropriately benefited from any such economies of scale, and whether there is potential for realization of any further economies of scale. The Board considered the extent to which the fund will benefit from economies of scale through increased services to the fund, through waivers or reimbursements, or through fee or expense reductions. The Board also noted that in 2009, it and the board of other Fidelity funds created an ad hoc committee (the Economies of Scale Committee) to analyze whether FMR attains economies of scale in respect of the management and servicing of the Fidelity funds, whether the Fidelity funds have appropriately benefited from such economies of scale, and whether there is potential for realization of any further economies of scale.
The Board recognized that the fund's management contract incorporates a "group fee" structure, which provides for lower group fee rates as total fund assets under FMR's management increase, and for higher group fee rates as total fund assets under FMR's management decrease. FMR calculates the group fee rates based on a tiered asset "breakpoint" schedule that varies based on asset class. The Board considered that the group fee is designed to deliver the benefits of economies of scale to fund shareholders when total Fidelity fund assets increase, even if assets of any particular fund are unchanged or have declined, because some portion of Fidelity's costs are attributable to services provided to all Fidelity funds, and all funds benefit if those costs can be allocated among more assets. The Board concluded that, given the group fee structure, fund shareholders will benefit from lower management fees as assets under FMR's management increase at the fund complex level, regardless of whether Fidelity achieves any such economies of scale.
The Board concluded, taking into account the analysis of the Economies of Scale Committee, that any potential economies of scale are being appropriately shared between fund shareholders and Fidelity.
Additional Information Requested by the Board. In order to develop fully the factual basis for consideration of the Fidelity funds' Advisory Contracts, the Board requested and received additional information on certain topics, including (i) fund performance trends, actions to be taken by FMR to improve certain funds' overall performance, and Fidelity's long-term strategies for certain funds; (ii) portfolio manager changes that have occurred during the past year and length of portfolio manager tenure for different categories of funds over time; (iii) Fidelity's compensation structure for portfolio managers and other key personnel and strategies for attracting and retaining non-investment personnel; (iv) the amount of the investment that each portfolio manager has made in the Fidelity fund(s) that he or she manages; (v) historical trends in Fidelity's realization of fall-out benefits; (vi) Fidelity's group fee structures and the rationale for the individual fee rates of certain funds; (vii) fund profitability methodology and the impact of certain factors on fund profitability results; (viii) trends regarding industry use of performance fee structures and Fidelity's compliance practices with respect to performance adjustment calculations; (ix) the fee structures in place for certain other Fidelity clients; and (x) explanations regarding the relative total expense ratios of certain funds and classes, total expense competitive trends, and actions that might be taken by FMR to reduce total expense ratios for certain funds and classes.
Annual Report
Board Approval of Investment Advisory Contracts and
Management Fees - continued
Based on its evaluation of all of the conclusions noted above, and after considering all factors it believed relevant, the Board ultimately concluded that the advisory fee structures are fair and reasonable, and that the fund's Advisory Contracts should be renewed.
Annual Report
Investment Adviser
Fidelity Management & Research Company
Boston, MA
Investment Sub-Advisers
FMR Co., Inc.
Fidelity Management & Research
(U.K.) Inc.
FIL Investment Advisors
FIL Investment Advisors (U.K.) Limited
FIL Investments (Japan) Limited
Fidelity Management & Research (Hong Kong) Limited
Fidelity Management & Research (Japan), Inc.
General Distributor
Fidelity Distributors Corporation
Boston, MA
Transfer and Service Agents
Fidelity Investments Institutional Operations Company, Inc.
Boston, MA
Fidelity Service Company, Inc.
Boston, MA
Custodian
Brown Brothers Harriman & Co.
Boston, MA
AEA-UANN-1211
1.784737.108
(Fidelity Investment logo)(registered trademark)
Fidelity Advisor®
Emerging Asia
Fund - Institutional Class
Annual Report
October 31, 2011
Contents
Chairman's Message | (Click Here) | The Chairman's message to shareholders. |
Performance | (Click Here) | How the fund has done over time. |
Management's Discussion of Fund Performance | (Click Here) | The Portfolio Manager's review of fund performance and strategy. |
Shareholder Expense Example | (Click Here) | An example of shareholder expenses. |
Investment Changes | (Click Here) | A summary of major shifts in the fund's investments over the past six months. |
Investments | (Click Here) | A complete list of the fund's investments with their market values. |
Financial Statements | (Click Here) | Statements of assets and liabilities, operations, and changes in net assets, as well as financial highlights. |
Notes | (Click Here) | Notes to financial statements. |
Report of Independent Registered Public Accounting Firm | (Click Here) | |
Trustees and Officers | (Click Here) | |
Distributions | (Click Here) | |
Board Approval of Investment Advisory Contracts and Management Fees | (Click Here) | |
To view a fund's proxy voting guidelines and proxy voting record for the 12-month period ended June 30, visit http://www.fidelity.com/proxyvotingresults or visit the Securities and Exchange Commission's (SEC) web site at http://www.sec.gov. You may also call 1-877-208-0098 to request a free copy of the proxy voting guidelines.
Standard & Poor's, S&P and S&P 500 are registered service marks of The McGraw-Hill Companies, Inc. and have been licensed for use by Fidelity Distributors Corporation.
Other third party marks appearing herein are the property of their respective owners.
All other marks appearing herein are registered or unregistered trademarks or service marks of FMR LLC or an affiliated company.
Annual Report
This report and the financial statements contained herein are submitted for the general information of the shareholders of the fund. This report is not authorized for distribution to prospective investors in the fund unless preceded or accompanied by an effective prospectus.
A fund files its complete schedule of portfolio holdings with the SEC for the first and third quarters of each fiscal year on Form N-Q. Forms N-Q are available on the SEC's web site at http://www.sec.gov. A fund's Forms N-Q may be reviewed and copied at the SEC's Public Reference Room in Washington, DC. Information regarding the operation of the SEC's Public Reference Room may be obtained by calling 1-800-SEC-0330. For a complete list of a fund's portfolio holdings, view the most recent holdings listing, semiannual report, or annual report on Fidelity's web site at http://www.fidelity.com, http://www.advisor.fidelity.com, or http://www.401k.com, as applicable.
NOT FDIC INSURED • MAY LOSE VALUE • NO BANK GUARANTEE
Neither the fund nor Fidelity Distributors Corporation is a bank.
Annual Report
(photo_of_James_C_Curvey)
Dear Shareholder:
Global equity markets began the fourth quarter on a strong note, sharply reversing course in October amid strong corporate earnings, better-than-expected economic news and the promise of a resolution to the sovereign debt crisis in Europe. The mini rally followed a third quarter marked by a significant downturn in July and August, which heightened investor anxiety and set off a wave of volatility that hampered most major asset classes through the end of September. Financial markets are difficult to predict, of course, but you can help put the odds in your favor by following these time-tested investment principles.
One of the basic tenets is to invest according to your time horizon. For long-term investors, riding out the markets' inevitable ups and downs has proven much more effective than making decisions based on short-term developments. If your goal is approaching, you can also benefit from patience and restraint, rather than attempting to time the market. No matter your time horizon, missing only a few of the markets' best days can significantly diminish returns. Patience also affords the benefits of compounding - earning interest on additional income or reinvested dividends and capital gains. While staying the course doesn't eliminate risk, it can considerably lessen the negative impact of short-term downturns.
Asset allocation is another principle to manage risk. As you spread your portfolio among the asset classes, be sure to consider your time horizon, risk tolerance and investment objectives. Younger investors may be better served by emphasizing equities, which historically have been the best-performing asset class over time. Investors who are nearing a specific goal, such as retirement or sending a child to college, may choose to favor bonds and other investments that have tended to be more stable. Studies indicate that asset allocation is the single most important determinant of a portfolio's long-term success. After deciding on a suitable allocation strategy, make sure your portfolio is adequately diversified, with exposure to stocks of small-, mid- and large-cap companies in a range of sectors, for example. And today, more than ever, geographic diversification should be taken into account.
Lastly, investing a certain amount of money on a regular basis - a principle known as dollar-cost averaging - can help lower the average cost of your purchases, while also giving you the discipline to avoid selling weak performers just prior to an upswing, or chasing a hot performer just before a correction.
We invite you to learn more by visiting us on the Internet, dropping by one of our Investor Centers or calling us by phone. It is our privilege to provide the resources you need to choose investments that are right for you.
Sincerely,
(The acting chairman's signature appears here.)
James C. Curvey
Acting Chairman
Annual Report
Average annual total return reflects the change in the value of an investment, assuming reinvestment of the class' distributions from dividend income and capital gains (the profits earned upon the sale of securities that have grown in value, if any) and assuming a constant rate of performance each year. The $10,000 table and the fund's returns do not reflect the deduction of taxes that a shareholder would pay on fund distributions or the redemption of fund shares. During periods of reimbursement by Fidelity, a fund's total return will be greater than it would be had the reimbursement not occurred. How a fund did yesterday is no guarantee of how it will do tomorrow.
Average Annual Total Returns
Periods ended October 31, 2011 | Past 1
year | Past 5
years | Past 10
years |
Institutional Class | -7.13% | 10.80% | 16.42% |
$10,000 Over 10 Years
 how the value of your investment would have changed, and also shows how the MSCI® AC (All Country) Asia ex Japan Index performed over the same period.
Annual Report
Market Recap: Stocks in emerging Asia lost ground during the 12-month period ending October 31, 2011, weighed down in part by double-digit losses in China and India. Share prices in those two countries struggled against the head wind of a tighter monetary environment, as government officials attempted to tame inflationary pressures without triggering abrupt slowdowns in their rapidly expanding economies. In China's case, inflation cooled a bit toward period end after hitting a three-year peak in July, but food prices continued to expand at a double-digit pace. For the year, the MSCI® AC (All Country) Asia ex Japan Index returned -6.74%. China, with an average benchmark allocation of 18%, finished the period with a roughly -17% return, while India, representing about 10% of the index, returned -20%. The three other major country constituents fared considerably better. Hong Kong, with a 17% weighting, modestly lagged the benchmark, at about -8%. Taiwan checked in with a 16% weighting and a return of -2%. South Korea, the largest benchmark constituent, at 20%, finished in the black, gaining about 7%, bolstered in part by stellar showings from its automakers.
Comments from Colin Chickles, Portfolio Manager of Fidelity Advisor® Emerging Asia Fund: During the year, the fund's Institutional Class shares returned -7.13%, modestly lagging the MSCI index. Stock selection in consumer staples, energy, the banking segment of financials, and telecommunication services hurt the fund's relative results. Geographically, stock picking in India and Hong Kong were negatives. China-based Chaoda Modern Agriculture, the fund's largest relative detractor, was hampered by suspicion the company was overstating the size of its land holdings. Other important detractors included Chinese energy producer PetroChina, which I sold by period end, and an underweighting in wireless carrier and benchmark component China Mobile. Conversely, positioning in materials, information technology and consumer discretionary added value. Geographically, my picks in Taiwan and South Korea bolstered performance. Hong Kong utility Power Assets Holdings was the fund's top relative contributor. The company was able to raise its rates and expand its customer base. Underweighting and ultimately selling two poorly performing benchmark components, Bank of China (Hong Kong) and China Life Insurance, also helped.
Annual Report
The views expressed above reflect those of the portfolio manager(s) only through the end of the period as stated on the cover of this report and do not necessarily represent the views of Fidelity or any other person in the Fidelity organization. Any such views are subject to change at any time based upon market or other conditions and Fidelity disclaims any responsibility to update such views. These views may not be relied on as investment advice and, because investment decisions for a Fidelity fund are based on numerous factors, may not be relied on as an indication of trading intent on behalf of any Fidelity fund.
Annual Report
Shareholder Expense Example
As a shareholder of the Fund, you incur two types of costs: (1) transaction costs, including sales charges (loads) on purchase payments or redemption proceeds, redemption fees, and (2) ongoing costs, including management fees, distribution and/or service (12b-1) fees and other Fund expenses. This Example is intended to help you understand your ongoing costs (in dollars) of investing in the Fund and to compare these costs with the ongoing costs of investing in other mutual funds.
The Example is based on an investment of $1,000 invested at the beginning of the period and held for the entire period (May 1, 2011 to October 31, 2011).
Actual Expenses
The first line of the accompanying table for each class of the Fund provides information about actual account values and actual expenses. You may use the information in this line, together with the amount you invested, to estimate the expenses that you paid over the period. Simply divide your account value by $1,000.00 (for example, an $8,600 account value divided by $1,000.00 = 8.6), then multiply the result by the number in the first line for a class of the Fund under the heading entitled "Expenses Paid During Period" to estimate the expenses you paid on your account during this period. In addition, the Fund, as a shareholder in the underlying Fidelity Central Funds, will indirectly bear its pro-rata share of the fees and expenses incurred by the underlying Fidelity Central Funds. These fees and expenses are not included in the Fund's annualized expense ratio used to calculate the expense estimate in the table below.
Hypothetical Example for Comparison Purposes
The second line of the accompanying table for each class of the Fund provides information about hypothetical account values and hypothetical expenses based on a Class' actual expense ratio and an assumed rate of return of 5% per year before expenses, which is not the Class' actual return. The hypothetical account values and expenses may not be used to estimate the actual ending account balance or expenses you paid for the period. You may use this information to compare the ongoing costs of investing in the Fund and other funds. To do so, compare this 5% hypothetical example with the 5% hypothetical examples that appear in the shareholder reports of the other funds. In addition, the Fund, as a shareholder in the underlying Fidelity Central Funds, will indirectly bear its pro-rata share of the fees and expenses incurred by the underlying Fidelity Central Funds. These fees and expenses are not included in the Fund's annualized expense ratio used to calculate the expense estimate in the table below.
Please note that the expenses shown in the table are meant to highlight your ongoing costs only and do not reflect any transaction costs. Therefore, the second line of the table is useful in comparing ongoing costs only, and will not help you determine the relative total costs of owning different funds. In addition, if these transactional costs were included, your costs would have been higher.
Annual Report
Shareholder Expense Example - continued
| Annualized
Expense Ratio | Beginning
Account Value
May 1, 2011 | Ending
Account Value
October 31, 2011 | Expenses Paid
During Period*
May 1, 2011 to
October 31, 2011 |
Class A | 1.37% | | | |
Actual | | $ 1,000.00 | $ 833.10 | $ 6.33 |
HypotheticalA | | $ 1,000.00 | $ 1,018.30 | $ 6.97 |
Class T | 1.67% | | | |
Actual | | $ 1,000.00 | $ 832.00 | $ 7.71 |
HypotheticalA | | $ 1,000.00 | $ 1,016.79 | $ 8.49 |
Class B | 2.15% | | | |
Actual | | $ 1,000.00 | $ 829.80 | $ 9.92 |
HypotheticalA | | $ 1,000.00 | $ 1,014.37 | $ 10.92 |
Class C | 2.11% | | | |
Actual | | $ 1,000.00 | $ 829.90 | $ 9.73 |
HypotheticalA | | $ 1,000.00 | $ 1,014.57 | $ 10.71 |
Institutional Class | 1.09% | | | |
Actual | | $ 1,000.00 | $ 834.50 | $ 5.04 |
HypotheticalA | | $ 1,000.00 | $ 1,019.71 | $ 5.55 |
A 5% return per year before expenses
* Expenses are equal to each Class' annualized expense ratio, multiplied by the average account value over the period, multiplied by 184/365 (to reflect the one-half year period).
Annual Report
Investment Changes (Unaudited)
Top Ten Stocks as of October 31, 2011 |
| % of fund's
net assets | % of fund's net assets
6 months ago |
Samsung Electronics Co. Ltd. | 5.7 | 4.1 |
Taiwan Semiconductor Manufacturing Co. Ltd. | 3.9 | 3.3 |
China Mobile (Hong Kong) Ltd. | 3.3 | 0.0 |
CNOOC Ltd. | 2.6 | 1.9 |
POSCO | 2.5 | 0.0 |
Sun Hung Kai Properties Ltd. | 2.4 | 0.0 |
China Construction Bank Corp. (H Shares) | 2.3 | 2.1 |
Power Assets Holdings Ltd. | 1.9 | 1.4 |
Industrial & Commercial Bank of China Ltd. (H Shares) | 1.8 | 2.7 |
Housing Development Finance Corp. Ltd. | 1.5 | 0.0 |
| 27.9 | |
Top Five Market Sectors as of October 31, 2011 |
| % of fund's
net assets | % of fund's net assets
6 months ago |
Financials | 29.3 | 30.6 |
Information Technology | 17.3 | 16.9 |
Consumer Discretionary | 10.3 | 8.5 |
Industrials | 10.3 | 11.6 |
Materials | 8.6 | 10.4 |
Asset Allocation (% of fund's net assets) |
As of October 31, 2011 | As of April 30, 2011 |
| Stocks 98.7% | | | Stocks 97.9% | |
| Short-Term
Investments and
Net Other Assets 1.3% | | | Short-Term
Investments and
Net Other Assets 2.1% | |

Annual Report
Investments October 31, 2011
Showing Percentage of Net Assets
Common Stocks - 98.7% |
| Shares | | Value |
Australia - 0.2% |
Origin Energy Ltd. | 44,256 | | $ 666,976 |
Bailiwick of Jersey - 0.1% |
WNS Holdings Ltd. sponsored ADR (a) | 13,200 | | 159,720 |
Bermuda - 1.5% |
Cheung Kong Infrastructure Holdings Ltd. | 153,000 | | 819,578 |
China Oil & Gas Group Ltd. (a) | 880,000 | | 59,051 |
China Yurun Food Group Ltd. | 489,000 | | 848,757 |
CNPC (Hong Kong) Ltd. | 266,000 | | 372,608 |
First Pacific Co. Ltd. | 798,000 | | 831,362 |
Jardine Matheson Holdings Ltd. | 16,400 | | 826,537 |
Man Wah Holdings Ltd. | 216,000 | | 120,275 |
Noble Group Ltd. | 1,044,000 | | 1,274,266 |
PAX Global Technology Ltd. | 413,000 | | 87,038 |
Skyworth Digital Holdings Ltd. | 1,172,000 | | 619,303 |
TOTAL BERMUDA | | 5,858,775 |
Cayman Islands - 3.3% |
AirMedia Group, Inc. ADR (a) | 44,700 | | 121,584 |
Belle International Holdings Ltd. | 1,032,000 | | 2,023,986 |
Biostime International Holdings Ltd. | 298,000 | | 531,418 |
Changyou.com Ltd. (A Shares) ADR (a) | 9,100 | | 239,603 |
Chaoda Modern Agriculture (Holdings) Ltd. | 3,564,000 | | 504,634 |
China Resources Land Ltd. | 930,000 | | 1,361,237 |
China Shanshui Cement Group Ltd. | 619,000 | | 474,139 |
Haitian International Holdings Ltd. | 561,000 | | 498,446 |
Hidili Industry International Development Ltd. | 962,000 | | 402,909 |
International Taifeng Holdings Ltd. | 1,210,000 | | 565,501 |
Maoye International Holdings Ltd. (a) | 2,629,000 | | 722,228 |
New Oriental Education & Technology Group, Inc. sponsored ADR (a) | 8,200 | | 243,048 |
Qihoo 360 Technology Co. Ltd. ADR | 6,200 | | 125,302 |
Sands China Ltd. (a) | 768,400 | | 2,309,186 |
Shenguan Holdings Group Ltd. | 694,000 | | 372,855 |
Spreadtrum Communications, Inc. ADR | 41,500 | | 1,102,655 |
Springland International Holdings Ltd. | 423,000 | | 286,578 |
Yingde Gases Group Co. Ltd. | 186,000 | | 198,357 |
Youyuan International Holdings Ltd. (a) | 1,946,000 | | 606,321 |
TOTAL CAYMAN ISLANDS | | 12,689,987 |
China - 11.7% |
51job, Inc. sponsored ADR (a) | 6,900 | | 318,642 |
Baidu.com, Inc. sponsored ADR (a) | 18,300 | | 2,565,294 |
Common Stocks - continued |
| Shares | | Value |
China - continued |
Changsha Zoomlion Heavy Industry Science & Technology Development Co. Ltd. (H Shares) | 556,600 | | $ 805,280 |
China Coal Energy Co. Ltd. (H Shares) | 1,697,000 | | 2,113,662 |
China Communications Construction Co. Ltd. (H Shares) | 1,899,000 | | 1,432,333 |
China Communications Services Corp. Ltd. (H Shares) | 2,608,000 | | 1,202,773 |
China Construction Bank Corp. (H Shares) | 11,845,000 | | 8,702,939 |
China Eastern Airlines Corp. Ltd. (H Shares) (a) | 682,000 | | 268,327 |
China Metal Recycling (Holdings) Ltd. | 996,000 | | 1,066,414 |
China Minsheng Banking Corp. Ltd. (H Shares) | 2,599,500 | | 2,117,602 |
China National Building Materials Co. Ltd. (H Shares) | 832,000 | | 1,065,714 |
China Pacific Insurance Group Co. Ltd. (H Shares) | 461,200 | | 1,415,280 |
China Petroleum & Chemical Corp. (H Shares) | 4,188,000 | | 3,960,719 |
China Southern Airlines Ltd. (H Shares) (a) | 1,652,000 | | 921,916 |
Comba Telecom Systems Holdings Ltd. | 445,500 | | 376,162 |
Focus Media Holding Ltd. ADR (a) | 26,300 | | 714,834 |
Great Wall Motor Co. Ltd. (H Shares) | 1,488,250 | | 2,020,913 |
Harbin Power Equipment Co. Ltd. (H Shares) | 1,742,000 | | 1,755,479 |
Industrial & Commercial Bank of China Ltd. (H Shares) | 11,307,000 | | 7,060,806 |
PICC Property & Casualty Co. Ltd. (H Shares) | 1,228,000 | | 1,703,002 |
Shanghai Jin Jiang International Hotel Co. Ltd. (H Shares) | 1,304,000 | | 167,682 |
Sinopec Shanghai Petrochemical Co. Ltd. (H Shares) | 1,750,000 | | 642,511 |
Tianneng Power International Ltd. | 278,000 | | 130,197 |
Yanzhou Coal Mining Co. Ltd. (H Shares) | 594,000 | | 1,470,324 |
Zhongpin, Inc. (a)(d) | 31,900 | | 294,437 |
Zijin Mining Group Co. Ltd. (H Shares) | 1,882,000 | | 801,035 |
TOTAL CHINA | | 45,094,277 |
Hong Kong - 18.2% |
AIA Group Ltd. | 1,851,400 | | 5,661,098 |
BYD Electronic International Co. Ltd. (a) | 547,500 | | 195,320 |
Cathay Pacific Airways Ltd. | 678,000 | | 1,230,687 |
China Insurance International Holdings Co. Ltd. (a) | 331,200 | | 718,227 |
China Merchant Holdings International Co. Ltd. | 438,000 | | 1,351,549 |
China Mobile (Hong Kong) Ltd. | 1,327,500 | | 12,617,014 |
China Overseas Land & Investment Ltd. | 1,382,000 | | 2,557,239 |
China Unicom (Hong Kong) Ltd. | 1,442,000 | | 2,899,308 |
Citic Pacific Ltd. | 827,000 | | 1,494,613 |
CNOOC Ltd. | 5,356,500 | | 10,125,712 |
Dah Chong Hong Holdings Ltd. | 552,000 | | 670,369 |
Galaxy Entertainment Group Ltd. (a) | 448,000 | | 906,006 |
Giordano International Ltd. | 382,000 | | 288,137 |
Guangdong Investment Ltd. | 3,212,000 | | 1,933,578 |
Common Stocks - continued |
| Shares | | Value |
Hong Kong - continued |
Hang Lung Group Ltd. | 210,000 | | $ 1,276,272 |
Hysan Development Co. Ltd. | 309,332 | | 1,079,438 |
Lenovo Group Ltd. | 3,080,000 | | 2,070,698 |
MTR Corp. Ltd. | 546,000 | | 1,762,476 |
New World Development Co. Ltd. | 1,390,000 | | 1,464,301 |
New World Development Co. Ltd. rights 11/22/11 (a) | 695,000 | | 237,070 |
PCCW Ltd. | 6,349,000 | | 2,537,180 |
Power Assets Holdings Ltd. | 962,000 | | 7,310,055 |
Singamas Container Holdings Ltd. | 238,000 | | 55,127 |
Sinotruk Hong Kong Ltd. | 732,000 | | 430,457 |
Sun Hung Kai Properties Ltd. | 672,000 | | 9,252,619 |
TOTAL HONG KONG | | 70,124,550 |
India - 8.1% |
Apollo Tyres Ltd. | 455,823 | | 534,564 |
Axis Bank Ltd. | 116,300 | | 2,748,710 |
Bank of Baroda | 86,080 | | 1,357,275 |
Canara Bank | 105,069 | | 1,002,097 |
Deccan Chronicle Holdings Ltd. (a) | 244,971 | | 259,088 |
Dena Bank | 129,933 | | 213,976 |
Gateway Distriparks Ltd. | 112,674 | | 342,861 |
Grasim Industries Ltd. | 22,927 | | 1,217,566 |
HCL Infosystems Ltd. | 255,318 | | 339,081 |
Hindalco Industries Ltd. | 448,779 | | 1,240,638 |
Hindustan Petroleum Corp. Ltd. | 186,895 | | 1,264,979 |
Housing Development Finance Corp. Ltd. | 415,220 | | 5,843,320 |
ICSA (India) Ltd. | 186,602 | | 218,908 |
Indian Oil Corp. Ltd. | 195,971 | | 1,158,592 |
Indian Overseas Bank | 356,535 | | 747,194 |
Jubilant Industries Ltd. | 5,873 | | 22,460 |
Jubilant Life Sciences Ltd. | 47,794 | | 191,285 |
Page Industries Ltd. | 3,278 | | 170,589 |
Piramal Healthcare Ltd. | 63,145 | | 465,616 |
Ramky Infrastructure Ltd. | 73,635 | | 355,621 |
Sintex Industries Ltd. | 172,960 | | 415,884 |
SREI Infrastructure Finance Ltd. | 476,053 | | 347,449 |
State Bank of India | 64,363 | | 2,503,438 |
Tata Consultancy Services Ltd. | 211,584 | | 4,813,070 |
Tata Motors Ltd. Class A | 361,005 | | 789,108 |
Tata Steel Ltd. | 98,638 | | 971,329 |
Welspun Gujarat Stahl Rohren Ltd. | 114,288 | | 250,297 |
Common Stocks - continued |
| Shares | | Value |
India - continued |
Yes Bank Ltd. | 219,750 | | $ 1,408,216 |
Zee Learn Ltd. (a) | 35,117 | | 13,743 |
TOTAL INDIA | | 31,206,954 |
Indonesia - 3.3% |
PT Astra International Tbk | 501,500 | | 3,866,942 |
PT Bank Rakyat Indonesia Tbk | 6,154,000 | | 4,626,865 |
PT BISI International Tbk | 376,500 | | 42,870 |
PT Global Mediacom Tbk | 4,988,500 | | 447,848 |
PT Gudang Garam Tbk | 228,500 | | 1,499,845 |
PT Tower Bersama Infrastructure Tbk | 2,425,000 | | 564,378 |
PT Unilever Indonesia Tbk | 593,000 | | 1,042,475 |
PT Sampoerna Agro Tbk | 1,120,000 | | 378,888 |
TOTAL INDONESIA | | 12,470,111 |
Korea (South) - 25.6% |
BS Financial Group, Inc. (a) | 241,470 | | 2,647,712 |
Cheil Worldwide, Inc. | 127,230 | | 2,075,500 |
Chong Kun Dang Pharmaceutical Corp. | 29,390 | | 567,891 |
CJ CheilJedang Corp. | 7,555 | | 2,077,143 |
CJ Corp. | 20,054 | | 1,431,393 |
Daewoo Shipbuilding & Marine Engineering Co. Ltd. | 118,780 | | 2,909,978 |
DGB Financial Group Co. Ltd. (a) | 72,680 | | 901,455 |
Dongbu Insurance Co. Ltd. | 27,020 | | 1,133,282 |
Doosan Co. Ltd. | 10,290 | | 1,296,309 |
Hana Financial Group, Inc. | 130,810 | | 4,655,544 |
Hankook Tire Co. Ltd. | 31,010 | | 1,233,120 |
Hynix Semiconductor, Inc. | 143,970 | | 2,902,693 |
Hyundai Department Store Co. Ltd. | 7,557 | | 1,079,448 |
Hyundai Fire & Marine Insurance Co. Ltd. | 15,060 | | 434,448 |
Hyundai Heavy Industries Co. Ltd. | 19,620 | | 5,222,203 |
Hyundai Mobis | 15,997 | | 4,561,125 |
Hyundai Motor Co. | 13,659 | | 2,740,503 |
ICD Co. Ltd. (a) | 3,854 | | 174,758 |
Industrial Bank of Korea | 218,960 | | 2,863,849 |
KB Financial Group, Inc. | 94,250 | | 3,637,799 |
Kia Motors Corp. | 67,930 | | 4,338,873 |
Korea Electric Power Corp. (a) | 89,840 | | 2,004,233 |
Kyeryong Construction Industrial Co. Ltd. | 11,900 | | 156,370 |
LG International Corp. | 14,202 | | 624,699 |
Lotte Samkang Co. Ltd. | 1,310 | | 390,467 |
Lotte Shopping Co. Ltd. | 4,924 | | 1,760,645 |
Common Stocks - continued |
| Shares | | Value |
Korea (South) - continued |
MegaStudy Co. Ltd. | 9,331 | | $ 1,028,162 |
Nong Shim Co. Ltd. | 1,085 | | 211,820 |
Orion Corp. | 1,094 | | 584,725 |
POSCO | 27,963 | | 9,652,712 |
Samsung Electronics Co. Ltd. | 25,385 | | 21,771,442 |
Samsung Fire & Marine Insurance Co. Ltd. | 14,179 | | 3,003,707 |
Samsung Heavy Industries Ltd. | 76,000 | | 2,309,986 |
Shinsegae Co. Ltd. | 4,161 | | 1,042,586 |
SK Chemicals Co. Ltd. | 10,569 | | 673,630 |
SK Telecom Co. Ltd. | 22,496 | | 2,984,294 |
Sungwoo Hitech Co. Ltd. | 61,923 | | 1,018,387 |
Tong Yang Life Insurance Co. Ltd. | 31,410 | | 375,018 |
TOTAL KOREA (SOUTH) | | 98,477,909 |
Malaysia - 0.6% |
AirAsia Bhd | 528,900 | | 664,677 |
Genting Malaysia Bhd | 970,100 | | 1,206,774 |
Glomac Bhd | 1,104,800 | | 304,531 |
TOTAL MALAYSIA | | 2,175,982 |
Mauritius - 0.3% |
Golden Agri-Resources Ltd. | 2,381,000 | | 1,218,453 |
Papua New Guinea - 0.1% |
Oil Search Ltd. | 31,658 | | 215,998 |
Philippines - 1.0% |
Banco de Oro Universal Bank | 539,000 | | 711,756 |
Globe Telecom, Inc. | 40,310 | | 859,430 |
Manila Water Co., Inc. | 2,617,700 | | 1,191,120 |
Universal Robina Corp. | 1,100,000 | | 1,212,619 |
TOTAL PHILIPPINES | | 3,974,925 |
Singapore - 5.8% |
Avago Technologies Ltd. | 32,400 | | 1,094,148 |
City Developments Ltd. | 245,000 | | 2,112,037 |
DBS Group Holdings Ltd. | 327,000 | | 3,192,916 |
First Resources Ltd. | 898,000 | | 1,005,051 |
Keppel Corp. Ltd. | 559,600 | | 4,187,734 |
Mapletree Logistics Trust (REIT) | 708,000 | | 480,663 |
Sakari Resources Ltd. | 359,000 | | 670,363 |
SembCorp Industries Ltd. | 408,000 | | 1,344,659 |
United Overseas Bank Ltd. | 351,000 | | 4,758,746 |
UOL Group Ltd. | 201,000 | | 710,328 |
Common Stocks - continued |
| Shares | | Value |
Singapore - continued |
Wilmar International Ltd. | 521,000 | | $ 2,248,781 |
Yanlord Land Group Ltd. | 611,000 | | 495,644 |
TOTAL SINGAPORE | | 22,301,070 |
Taiwan - 10.8% |
Asia Cement Corp. | 1,468,300 | | 1,768,647 |
ASUSTeK Computer, Inc. | 254,000 | | 1,765,855 |
Catcher Technology Co. Ltd. | 172,000 | | 958,299 |
Chicony Electronics Co. Ltd. | 488,000 | | 815,447 |
Compal Electronics, Inc. | 1,839,000 | | 1,687,796 |
E.Sun Financial Holdings Co. Ltd. | 5,730,568 | | 2,855,970 |
EVA Airways Corp. | 1,791,900 | | 1,296,267 |
Far East Department Stores Co. Ltd. | 29,340 | | 44,858 |
Formosa Plastics Corp. | 1,768,000 | | 5,199,850 |
HIWIN Technologies Corp. | 74,000 | | 668,980 |
Hon Hai Precision Industry Co. Ltd. (Foxconn) | 682,900 | | 1,872,087 |
Insyde Software Corp. | 98,195 | | 434,651 |
King Slide Works Co. Ltd. | 102,850 | | 441,697 |
Quanta Computer, Inc. | 1,122,000 | | 2,207,916 |
Taichung Commercial Bank Co. Ltd. | 23,640 | | 7,955 |
Taishin Financial Holdings Co. Ltd. | 8,855,572 | | 3,749,609 |
Taiwan Semiconductor Manufacturing Co. Ltd. | 6,132,393 | | 14,943,885 |
Wistron Corp. | 659,100 | | 762,776 |
TOTAL TAIWAN | | 41,482,545 |
Thailand - 6.5% |
Advanced Info Service PCL (For. Reg.) | 486,500 | | 2,043,941 |
Asian Property Development PCL (For. Reg.) | 3,613,080 | | 528,091 |
Bangkok Life Assurance PCL NVDR | 234,500 | | 325,422 |
Banpu PCL (For. Reg.) | 183,900 | | 3,733,241 |
Big C Supercenter PCL unit | 81,900 | | 292,520 |
Bumrungrad Hospital PCL (For. Reg.) | 266,700 | | 341,299 |
C.P. Seven Eleven PCL (For. Reg.) | 616,300 | | 932,535 |
Charoen Pokphand Foods PCL (For. Reg.) | 1,618,800 | | 1,576,499 |
Glow Energy PCL (For. Reg.) | 342,300 | | 589,571 |
Indorama Ventures PCL (For. Reg.) | 611,700 | | 704,027 |
LPN Development PCL (For. Reg.) | 1,772,400 | | 576,313 |
PTT Global Chemical PCL (For. Reg.) (a) | 691,767 | | 1,458,734 |
PTT PCL (For. Reg.) | 249,300 | | 2,455,946 |
Siam Cement PCL: | | | |
(For. Reg.) | 165,200 | | 1,980,679 |
NVDR unit | 142,500 | | 1,448,241 |
Common Stocks - continued |
| Shares | | Value |
Thailand - continued |
Siam Commercial Bank PCL (For. Reg.) | 798,600 | | $ 3,020,941 |
Siam Makro PCL (For. Reg.) | 155,700 | | 1,042,622 |
Supalai PCL (For. Reg.) | 1,471,800 | | 592,289 |
Thai Union Frozen Products PCL (For. Reg.) | 207,100 | | 353,371 |
Total Access Communication PCL | 263,900 | | 622,126 |
Total Access Communication PCL unit | 153,800 | | 368,029 |
TOTAL THAILAND | | 24,986,437 |
United Kingdom - 0.5% |
HSBC Holdings PLC (Hong Kong) | 229,678 | | 2,006,315 |
United States of America - 1.1% |
China Natural Gas, Inc. (a)(d) | 13,300 | | 25,536 |
Citigroup, Inc. | 22,500 | | 710,775 |
Cognizant Technology Solutions Corp. Class A (a) | 34,100 | | 2,480,775 |
Freeport-McMoRan Copper & Gold, Inc. | 22,700 | | 913,902 |
SORL Auto Parts, Inc. (a)(d) | 45,900 | | 151,929 |
TOTAL UNITED STATES OF AMERICA | | 4,282,917 |
TOTAL COMMON STOCKS (Cost $361,396,820) | 379,393,901 |
Money Market Funds - 0.7% |
| | | |
Fidelity Cash Central Fund, 0.12% (b) | 2,556,517 | | 2,556,517 |
Fidelity Securities Lending Cash Central Fund, 0.11% (b)(c) | 225,344 | | 225,344 |
TOTAL MONEY MARKET FUNDS (Cost $2,781,861) | 2,781,861 |
TOTAL INVESTMENT PORTFOLIO - 99.4% (Cost $364,178,681) | | 382,175,762 |
NET OTHER ASSETS (LIABILITIES) - 0.6% | | 2,280,372 |
NET ASSETS - 100% | $ 384,456,134 |
Legend |
(a) Non-income producing |
(b) Affiliated fund that is available only to investment companies and other accounts managed by Fidelity Investments. The rate quoted is the annualized seven-day yield of the fund at period end. A complete unaudited listing of the fund's holdings as of its most recent quarter end is available upon request. In addition, each Fidelity Central Fund's financial statements, which are not covered by the Fund's Report of Independent Registered Public Accounting Firm, are available on the SEC's website or upon request. |
(c) Investment made with cash collateral received from securities on loan. |
(d) Security or a portion of the security is on loan at period end. |
Affiliated Central Funds |
Information regarding fiscal year to date income earned by the Fund from investments in Fidelity Central Funds is as follows: |
Fund | Income earned |
Fidelity Cash Central Fund | $ 10,600 |
Fidelity Securities Lending Cash Central Fund | 145,253 |
Total | $ 155,853 |
Other Information |
The following is a summary of the inputs used, as of October 31, 2011, involving the Fund's assets and liabilities carried at fair value. The inputs or methodology used for valuing securities may not be an indication of the risk associated with investing in those securities. For more information on valuation inputs, and their aggregation into the levels used in the tables below, please refer to the Security Valuation section in the accompanying Notes to Financial Statements. |
Valuation Inputs at Reporting Date: |
Description | Total | Level 1 | Level 2 | Level 3 |
Investments in Securities: | | | | |
Equities: | | | | |
Korea (South) | $ 98,477,909 | $ - | $ 98,477,909 | $ - |
Hong Kong | 70,124,550 | - | 70,124,550 | - |
China | 45,094,277 | 3,893,207 | 41,201,070 | - |
Taiwan | 41,482,545 | - | 41,482,545 | - |
India | 31,206,954 | - | 31,206,954 | - |
Thailand | 24,986,437 | - | 24,986,437 | - |
Singapore | 22,301,070 | 1,094,148 | 21,206,922 | - |
Cayman Islands | 12,689,987 | 1,832,192 | 10,353,161 | 504,634 |
Indonesia | 12,470,111 | - | 12,470,111 | - |
United States of America | 4,282,917 | 4,257,381 | - | 25,536 |
Other | 16,277,144 | 4,134,645 | 12,142,499 | - |
Money Market Funds | 2,781,861 | 2,781,861 | - | - |
Total Investments in Securities: | $ 382,175,762 | $ 17,993,434 | $ 363,652,158 | $ 530,170 |
Transfers from Level 1 to Level 2 during the period were $141,198,608. |
The following is a reconciliation of Investments in Securities for which Level 3 inputs were used in determining value: |
Investments in Securities: | |
Beginning Balance | $ 10,299 |
Total Realized Gain (Loss) | (11,263) |
Total Unrealized Gain (Loss) | (2,286,410) |
Cost of Purchases | 1,288,476 |
Proceeds of Sales | (223,951) |
Amortization/Accretion | - |
Transfers in to Level 3 | 1,763,318 |
Transfers out of Level 3 | (10,299) |
Ending Balance | $ 530,170 |
The change in unrealized gain (loss) for the period attributable to Level 3 securities held at October 31, 2011 | $ (2,286,410) |
The information used in the above reconciliation represents fiscal year to date activity for any Investments in Securities identified as using Level 3 inputs at either the beginning or the end of the current fiscal period. Transfers in or out of Level 3 represent the beginning value of any Security or Instrument where a change in the pricing level occurred from the beginning to the end of the period. The cost of purchases and the proceeds of sales may include securities received or delivered through corporate actions or exchanges. Realized and unrealized gains (losses) disclosed in the reconciliation are included in Net Gain (Loss) on the Fund's Statement of Operations. |
See accompanying notes which are an integral part of the financial statements.
Annual Report
Statement of Assets and Liabilities
| October 31, 2011 |
| | |
Assets | | |
Investment in securities, at value (including securities loaned of $209,936) - See accompanying schedule: Unaffiliated issuers (cost $361,396,820) | $ 379,393,901 | |
Fidelity Central Funds (cost $2,781,861) | 2,781,861 | |
Total Investments (cost $364,178,681) | | $ 382,175,762 |
Foreign currency held at value (cost $6,831) | | 6,869 |
Receivable for investments sold | | 4,425,612 |
Receivable for fund shares sold | | 711,103 |
Dividends receivable | | 104,140 |
Distributions receivable from Fidelity Central Funds | | 17,984 |
Prepaid expenses | | 1,780 |
Other receivables | | 237,778 |
Total assets | | 387,681,028 |
| | |
Liabilities | | |
Payable for investments purchased | $ 1,830,082 | |
Payable for fund shares redeemed | 613,822 | |
Accrued management fee | 215,526 | |
Distribution and service plan fees payable | 136,040 | |
Other affiliated payables | 101,526 | |
Other payables and accrued expenses | 102,554 | |
Collateral on securities loaned, at value | 225,344 | |
Total liabilities | | 3,224,894 |
| | |
Net Assets | | $ 384,456,134 |
Net Assets consist of: | | |
Paid in capital | | $ 348,582,194 |
Undistributed net investment income | | 2,634,151 |
Accumulated undistributed net realized gain (loss) on investments and foreign currency transactions | | 15,257,786 |
Net unrealized appreciation (depreciation) on investments and assets and liabilities in foreign currencies | | 17,982,003 |
Net Assets | | $ 384,456,134 |
See accompanying notes which are an integral part of the financial statements.
Annual Report
Statement of Assets and Liabilities - continued
| October 31, 2011 |
| | |
Calculation of Maximum Offering Price Class A:
Net Asset Value and redemption price per share ($179,346,257 ÷ 6,247,951 shares) | | $ 28.70 |
| | |
Maximum offering price per share (100/94.25 of $28.70) | | $ 30.45 |
Class T:
Net Asset Value and redemption price per share ($55,452,066 ÷ 1,981,697 shares) | | $ 27.98 |
| | |
Maximum offering price per share (100/96.50 of $27.98) | | $ 28.99 |
Class B:
Net Asset Value and offering price per share ($20,831,248 ÷ 782,511 shares)A | | $ 26.62 |
| | |
Class C:
Net Asset Value and offering price per share ($78,939,036 ÷ 2,985,046 shares)A | | $ 26.44 |
| | |
Institutional Class:
Net Asset Value, offering price and redemption price per share ($49,887,527 ÷ 1,691,928 shares) | | $ 29.49 |
A Redemption price per share is equal to net asset value less any applicable contingent deferred sales charge.
See accompanying notes which are an integral part of the financial statements.
Annual Report
Financial Statements - continued
Statement of Operations
| Year ended October 31, 2011 |
| | |
Investment Income | | |
Dividends | | $ 12,014,525 |
Interest | | 26,248 |
Income from Fidelity Central Funds | | 155,853 |
Income before foreign taxes withheld | | 12,196,626 |
Less foreign taxes withheld | | (1,403,506) |
Total income | | 10,793,120 |
| | |
Expenses | | |
Management fee | $ 3,092,651 | |
Transfer agent fees | 1,132,034 | |
Distribution and service plan fees | 1,987,080 | |
Accounting and security lending fees | 227,018 | |
Custodian fees and expenses | 341,127 | |
Independent trustees' compensation | 2,414 | |
Registration fees | 97,161 | |
Audit | 98,208 | |
Legal | 1,737 | |
Interest | 1,400 | |
Miscellaneous | 3,877 | |
Total expenses before reductions | 6,984,707 | |
Expense reductions | (169,580) | 6,815,127 |
Net investment income (loss) | | 3,977,993 |
Realized and Unrealized Gain (Loss) Net realized gain (loss) on: | | |
Investment securities: | | |
Unaffiliated issuers | 23,310,033 | |
Foreign currency transactions | (79,566) | |
Futures contracts | (459,204) | |
Total net realized gain (loss) | | 22,771,263 |
Change in net unrealized appreciation (depreciation) on: Investment securities | (61,642,252) | |
Assets and liabilities in foreign currencies | (27,904) | |
Total change in net unrealized appreciation (depreciation) | | (61,670,156) |
Net gain (loss) | | (38,898,893) |
Net increase (decrease) in net assets resulting from operations | | $ (34,920,900) |
See accompanying notes which are an integral part of the financial statements.
Annual Report
Statement of Changes in Net Assets
| Year ended
October 31,
2011 | Year ended
October 31,
2010 |
Increase (Decrease) in Net Assets | | |
Operations | | |
Net investment income (loss) | $ 3,977,993 | $ 2,119,167 |
Net realized gain (loss) | 22,771,263 | 58,114,163 |
Change in net unrealized appreciation (depreciation) | (61,670,156) | 23,767,257 |
Net increase (decrease) in net assets resulting
from operations | (34,920,900) | 84,000,587 |
Distributions to shareholders from net investment income | (1,974,190) | (971,544) |
Distributions to shareholders from net realized gain | (23,691,402) | (2,532,430) |
Total distributions | (25,665,592) | (3,503,974) |
Share transactions - net increase (decrease) | 32,289,855 | 46,082,399 |
Redemption fees | 135,689 | 86,566 |
Total increase (decrease) in net assets | (28,160,948) | 126,665,578 |
| | |
Net Assets | | |
Beginning of period | 412,617,082 | 285,951,504 |
End of period (including undistributed net investment income of $2,634,151 and undistributed net investment income of $1,972,932, respectively) | $ 384,456,134 | $ 412,617,082 |
See accompanying notes which are an integral part of the financial statements.
Annual Report
Financial Highlights - Class A
Years ended October 31, | 2011 | 2010 | 2009 | 2008 | 2007 |
Selected Per-Share Data | | | | | |
Net asset value, beginning of period | $ 32.97 | $ 25.96 | $ 15.74 | $ 37.55 | $ 22.48 |
Income from Investment Operations | | | | | |
Net investment income (loss) C | .35 | .25 | .19 | .19 | .24 |
Net realized and unrealized gain (loss) | (2.62) | 7.09 | 10.07 | (18.72) | 16.64 |
Total from investment operations | (2.27) | 7.34 | 10.26 | (18.53) | 16.88 |
Distributions from net investment income | (.20) | (.12) | (.05) | (.23) | (.15) |
Distributions from net realized gain | (1.81) | (.22) | - | (3.06) | (1.68) |
Total distributions | (2.01) | (.34) | (.05) | (3.29) | (1.83) |
Redemption fees added to paid in capital C | .01 | .01 | .01 | .01 | .02 |
Net asset value, end of period | $ 28.70 | $ 32.97 | $ 25.96 | $ 15.74 | $ 37.55 |
Total Return A, B | (7.44)% | 28.53% | 65.43% | (53.66)% | 80.43% |
Ratios to Average Net Assets D, F | | | | | |
Expenses before reductions | 1.39% | 1.44% | 1.54% | 1.50% | 1.47% |
Expenses net of fee waivers, if any | 1.39% | 1.44% | 1.50% | 1.50% | 1.47% |
Expenses net of all reductions | 1.35% | 1.40% | 1.41% | 1.41% | 1.40% |
Net investment income (loss) | 1.12% | .86% | .94% | .73% | .88% |
Supplemental Data | | | | | |
Net assets, end of period (000 omitted) | $ 179,346 | $ 189,255 | $ 131,564 | $ 71,722 | $ 152,630 |
Portfolio turnover rate E | 119% | 138% | 91% | 92% G | 66% |
A Total returns would have been lower if certain expenses had not been reduced during the applicable periods shown.
B Total returns do not include the effect of the sales charges.
C Calculated based on average shares outstanding during the period.
D Fees and expenses of any underlying Fidelity Central Funds are not included in the Fund's expense ratio. The Fund indirectly bears its proportionate share of the expenses of any underlying Fidelity Central Funds.
E Amount does not include the portfolio activity of any underlying Fidelity Central Funds.
F Expense ratios reflect operating expenses of the class. Expenses before reductions do not reflect amounts reimbursed by the investment adviser or reductions from brokerage service arrangements or reductions from other expense offset arrangements and do not represent the amount paid by the class during periods when reimbursements or reductions occur. Expenses net of fee waivers reflect expenses after reimbursement by the investment adviser but prior to reductions from brokerage service arrangements or other expense offset arrangements. Expenses net of all reductions represent the net expenses paid by the class.
G The portfolio turnover rate does not include the assets acquired in the merger.
See accompanying notes which are an integral part of the financial statements.
Annual Report
Financial Highlights - Class T
Years ended October 31, | 2011 | 2010 | 2009 | 2008 | 2007 |
Selected Per-Share Data | | | | | |
Net asset value, beginning of period | $ 32.20 | $ 25.40 | $ 15.43 | $ 36.88 | $ 22.13 |
Income from Investment Operations | | | | | |
Net investment income (loss) C | .25 | .15 | .14 | .12 | .16 |
Net realized and unrealized gain (loss) | (2.55) | 6.94 | 9.86 | (18.38) | 16.37 |
Total from investment operations | (2.30) | 7.09 | 10.00 | (18.26) | 16.53 |
Distributions from net investment income | (.12) | (.08) | (.04) | (.14) | (.12) |
Distributions from net realized gain | (1.81) | (.22) | - | (3.06) | (1.68) |
Total distributions | (1.93) | (.30) | (.04) | (3.20) | (1.80) |
Redemption fees added to paid in capital C | .01 | .01 | .01 | .01 | .02 |
Net asset value, end of period | $ 27.98 | $ 32.20 | $ 25.40 | $ 15.43 | $ 36.88 |
Total Return A, B | (7.70)% | 28.13% | 65.06% | (53.79)% | 79.98% |
Ratios to Average Net Assets D, F | | | | | |
Expenses before reductions | 1.70% | 1.74% | 1.84% | 1.80% | 1.79% |
Expenses net of fee waivers, if any | 1.69% | 1.74% | 1.75% | 1.75% | 1.75% |
Expenses net of all reductions | 1.65% | 1.70% | 1.66% | 1.66% | 1.67% |
Net investment income (loss) | .82% | .55% | .69% | .48% | .61% |
Supplemental Data | | | | | |
Net assets, end of period (000 omitted) | $ 55,452 | $ 61,620 | $ 45,259 | $ 25,205 | $ 64,813 |
Portfolio turnover rate E | 119% | 138% | 91% | 92% G | 66% |
A Total returns would have been lower if certain expenses had not been reduced during the applicable periods shown.
B Total returns do not include the effect of the sales charges.
C Calculated based on average shares outstanding during the period.
D Fees and expenses of any underlying Fidelity Central Funds are not included in the Fund's expense ratio. The Fund indirectly bears its proportionate share of the expenses of any underlying Fidelity Central Funds.
E Amount does not include the portfolio activity of any underlying Fidelity Central Funds.
F Expense ratios reflect operating expenses of the class. Expenses before reductions do not reflect amounts reimbursed by the investment adviser or reductions from brokerage service arrangements or reductions from other expense offset arrangements and do not represent the amount paid by the class during periods when reimbursements or reductions occur. Expenses net of fee waivers reflect expenses after reimbursement by the investment adviser but prior to reductions from brokerage service arrangements or other expense offset arrangements. Expenses net of all reductions represent the net expenses paid by the class.
G The portfolio turnover rate does not include the assets acquired in the merger.
See accompanying notes which are an integral part of the financial statements.
Annual Report
Financial Highlights - Class B
Years ended October 31, | 2011 | 2010 | 2009 | 2008 | 2007 |
Selected Per-Share Data | | | | | |
Net asset value, beginning of period | $ 30.72 | $ 24.29 | $ 14.82 | $ 35.55 | $ 21.42 |
Income from Investment Operations | | | | | |
Net investment income (loss) C | .10 | .02 | .04 | (.01) | .03 |
Net realized and unrealized gain (loss) | (2.44) | 6.61 | 9.45 | (17.68) | 15.79 |
Total from investment operations | (2.34) | 6.63 | 9.49 | (17.69) | 15.82 |
Distributions from net investment income | - | - | (.03) | - | (.03) |
Distributions from net realized gain | (1.77) | (.21) | - | (3.05) | (1.68) |
Total distributions | (1.77) | (.21) | (.03) | (3.05) | (1.71) |
Redemption fees added to paid in capital C | .01 | .01 | .01 | .01 | .02 |
Net asset value, end of period | $ 26.62 | $ 30.72 | $ 24.29 | $ 14.82 | $ 35.55 |
Total Return A, B | (8.16)% | 27.48% | 64.23% | (54.01)% | 79.01% |
Ratios to Average Net Assets D, F | | | | | |
Expenses before reductions | 2.19% | 2.24% | 2.32% | 2.29% | 2.28% |
Expenses net of fee waivers, if any | 2.18% | 2.24% | 2.25% | 2.25% | 2.25% |
Expenses net of all reductions | 2.15% | 2.20% | 2.16% | 2.16% | 2.17% |
Net investment income (loss) | .32% | .06% | .19% | (.02)% | .11% |
Supplemental Data | | | | | |
Net assets, end of period (000 omitted) | $ 20,831 | $ 29,611 | $ 25,750 | $ 17,040 | $ 40,775 |
Portfolio turnover rate E | 119% | 138% | 91% | 92% G | 66% |
A Total returns would have been lower if certain expenses had not been reduced during the applicable periods shown.
B Total returns do not include the effect of the contingent deferred sales charge.
C Calculated based on average shares outstanding during the period.
D Fees and expenses of any underlying Fidelity Central Funds are not included in the Fund's expense ratio. The Fund indirectly bears its proportionate share of the expenses of any underlying Fidelity Central Funds.
E Amount does not include the portfolio activity of any underlying Fidelity Central Funds.
F Expense ratios reflect operating expenses of the class. Expenses before reductions do not reflect amounts reimbursed by the investment adviser or reductions from brokerage service arrangements or reductions from other expense offset arrangements and do not represent the amount paid by the class during periods when reimbursements or reductions occur. Expenses net of fee waivers reflect expenses after reimbursement by the investment adviser but prior to reductions from brokerage service arrangements or other expense offset arrangements. Expenses net of all reductions represent the net expenses paid by the class.
G The portfolio turnover rate does not include the assets acquired in the merger.
See accompanying notes which are an integral part of the financial statements.
Annual Report
Financial Highlights - Class C
Years ended October 31, | 2011 | 2010 | 2009 | 2008 | 2007 |
Selected Per-Share Data | | | | | |
Net asset value, beginning of period | $ 30.58 | $ 24.19 | $ 14.76 | $ 35.48 | $ 21.39 |
Income from Investment Operations | | | | | |
Net investment income (loss) C | .11 | .03 | .04 | - H | .04 |
Net realized and unrealized gain (loss) | (2.41) | 6.59 | 9.41 | (17.63) | 15.76 |
Total from investment operations | (2.30) | 6.62 | 9.45 | (17.63) | 15.80 |
Distributions from net investment income | (.04) | (.02) | (.03) | (.04) | (.05) |
Distributions from net realized gain | (1.81) | (.22) | - | (3.06) | (1.68) |
Total distributions | (1.85) | (.24) | (.03) | (3.10) | (1.73) |
Redemption fees added to paid in capital C | .01 | .01 | .01 | .01 | .02 |
Net asset value, end of period | $ 26.44 | $ 30.58 | $ 24.19 | $ 14.76 | $ 35.48 |
Total Return A, B | (8.10)% | 27.58% | 64.21% | (54.02)% | 79.05% |
Ratios to Average Net Assets D, F | | | | | |
Expenses before reductions | 2.13% | 2.17% | 2.28% | 2.25% | 2.21% |
Expenses net of fee waivers, if any | 2.13% | 2.17% | 2.25% | 2.25% | 2.21% |
Expenses net of all reductions | 2.10% | 2.13% | 2.16% | 2.16% | 2.13% |
Net investment income (loss) | .37% | .12% | .19% | (.02)% | .14% |
Supplemental Data | | | | | |
Net assets, end of period (000 omitted) | $ 78,939 | $ 87,089 | $ 59,491 | $ 30,577 | $ 82,070 |
Portfolio turnover rate E | 119% | 138% | 91% | 92% G | 66% |
A Total returns would have been lower if certain expenses had not been reduced during the applicable periods shown.
B Total returns do not include the effect of the contingent deferred sales charge.
C Calculated based on average shares outstanding during the period.
D Fees and expenses of any underlying Fidelity Central Funds are not included in the Fund's expense ratio. The Fund indirectly bears its proportionate share of the expenses of any underlying Fidelity Central Funds.
E Amount does not include the portfolio activity of any underlying Fidelity Central Funds.
F Expense ratios reflect operating expenses of the class. Expenses before reductions do not reflect amounts reimbursed by the investment adviser or reductions from brokerage service arrangements or reductions from other expense offset arrangements and do not represent the amount paid by the class during periods when reimbursements or reductions occur. Expenses net of fee waivers reflect expenses after reimbursement by the investment adviser but prior to reductions from brokerage service arrangements or other expense offset arrangements. Expenses net of all reductions represent the net expenses paid by the class.
G The portfolio turnover rate does not include the assets acquired in the merger.
H Amount represents less than $.01 per share.
See accompanying notes which are an integral part of the financial statements.
Annual Report
Financial Highlights - Institutional Class
Years ended October 31, | 2011 | 2010 | 2009 | 2008 | 2007 |
Selected Per-Share Data | | | | | |
Net asset value, beginning of period | $ 33.80 | $ 26.58 | $ 16.07 | $ 38.25 | $ 22.84 |
Income from Investment Operations | | | | | |
Net investment income (loss) B | .46 | .34 | .26 | .27 | .34 |
Net realized and unrealized gain (loss) | (2.69) | 7.26 | 10.29 | (19.09) | 16.92 |
Total from investment operations | (2.23) | 7.60 | 10.55 | (18.82) | 17.26 |
Distributions from net investment income | (.29) | (.17) | (.05) | (.31) | (.19) |
Distributions from net realized gain | (1.81) | (.22) | - | (3.06) | (1.68) |
Total distributions | (2.09) G | (.39) | (.05) | (3.37) | (1.87) |
Redemption fees added to paid in capital B | .01 | .01 | .01 | .01 | .02 |
Net asset value, end of period | $ 29.49 | $ 33.80 | $ 26.58 | $ 16.07 | $ 38.25 |
Total Return A | (7.13)% | 28.87% | 65.94% | (53.53)% | 80.97% |
Ratios to Average Net Assets C, E | | | | | |
Expenses before reductions | 1.10% | 1.14% | 1.25% | 1.20% | 1.16% |
Expenses net of fee waivers, if any | 1.10% | 1.14% | 1.25% | 1.20% | 1.16% |
Expenses net of all reductions | 1.06% | 1.10% | 1.16% | 1.11% | 1.08% |
Net investment income (loss) | 1.41% | 1.16% | 1.18% | 1.03% | 1.20% |
Supplemental Data | | | | | |
Net assets, end of period (000 omitted) | $ 49,888 | $ 45,042 | $ 23,888 | $ 5,933 | $ 16,300 |
Portfolio turnover rate D | 119% | 138% | 91% | 92% F | 66% |
A Total returns would have been lower if certain expenses had not been reduced during the applicable periods shown.
B Calculated based on average shares outstanding during the period.
C Fees and expenses of any underlying Fidelity Central Funds are not included in the Fund's expense ratio. The Fund indirectly bears its proportionate share of the expenses of any underlying Fidelity Central Funds.
D Amount does not include the portfolio activity of any underlying Fidelity Central Funds.
E Expense ratios reflect operating expenses of the class. Expenses before reductions do not reflect amounts reimbursed by the investment adviser or reductions from brokerage service arrangements or reductions from other expense offset arrangements and do not represent the amount paid by the class during periods when reimbursements or reductions occur. Expenses net of fee waivers reflect expenses after reimbursement by the investment adviser but prior to reductions from brokerage service arrangements or other expense offset arrangements. Expenses net of all reductions represent the net expenses paid by the class.
F The portfolio turnover rate does not include the assets acquired in the merger.
G Total distributions of $2.09 per share is comprised of distributions from net investment income of $.288 and distributions from net realized gain of $1.805 per share.
See accompanying notes which are an integral part of the financial statements.
Annual Report
Notes to Financial Statements
For the period ended October 31, 2011
1. Organization.
Fidelity Advisor Emerging Asia Fund (the Fund) is a fund of Fidelity Advisor Series VIII (the Trust) and is authorized to issue an unlimited number of shares. The Trust is registered under the Investment Company Act of 1940, as amended (the 1940 Act), as an open-end management investment company organized as a Massachusetts business trust. The Fund offers Class A, Class T, Class C, and Institutional Class shares, each of which, along with Class B shares, has equal rights as to assets and voting privileges. Effective after the close of business on September 1, 2010, Class B shares were closed to new accounts and additional purchases, except for exchanges and reinvestments by existing shareholders. Each class has exclusive voting rights with respect to matters that affect that class. Class B shares will automatically convert to Class A shares after a holding period of seven years from the initial date of purchase. Investment income, realized and unrealized capital gains and losses, the common expenses of the Fund, and certain fund-level expense reductions, if any, are allocated on a pro-rata basis to each class based on the relative net assets of each class to the total net assets of the Fund. Each class differs with respect to transfer agent and distribution and service plan fees incurred. Certain expense reductions may also differ by class. The Fund's investments in emerging markets can be subject to social, economic, regulatory, and political uncertainties and can be extremely volatile.
2. Investments in Fidelity Central Funds.
The Fund invests in Fidelity Central Funds, which are open-end investment companies available only to other investment companies and accounts managed by Fidelity Management & Research Company (FMR) and its affiliates. The Fund's Schedule of Investments lists each of the Fidelity Central Funds held as of period end, if any, as an investment of the Fund, but does not include the underlying holdings of each Fidelity Central Fund. As an Investing Fund, the Fund indirectly bears its proportionate share of the expenses of the underlying Fidelity Central Funds.
The Money Market Central Funds seek preservation of capital and current income and are managed by Fidelity Investments Money Management, Inc. (FIMM), an affiliate of FMR.
A complete unaudited list of holdings for each Fidelity Central Fund is available upon request or at the Securities and Exchange Commission (the SEC) web site at www.sec.gov. In addition, the financial statements of the Fidelity Central Funds, which are not covered by the Fund's Report of Independent Registered Public Accounting Firm are available on the SEC web site or upon request.
Annual Report
Notes to Financial Statements - continued
3. Significant Accounting Policies.
The financial statements have been prepared in conformity with accounting principles generally accepted in the United States of America (GAAP), which require management to make certain estimates and assumptions at the date of the financial statements. Actual results could differ from those estimates. Subsequent events, if any, through the date that the financial statements were issued have been evaluated in the preparation of the financial statements. The following summarizes the significant accounting policies of the Fund:
Security Valuation. Investments are valued as of 4:00 p.m. Eastern time on the last calendar day of the period. The Fund uses independent pricing services approved by the Board of Trustees to value its investments. When current market prices or quotations are not readily available or reliable, valuations may be determined in good faith in accordance with procedures adopted by the Board of Trustees. Factors used in determining value may include market or security specific events. The frequency with which these procedures are used cannot be predicted and they may be utilized to a significant extent. The value used for net asset value (NAV) calculation under these procedures may differ from published prices for the same securities.
The Fund categorizes the inputs to valuation techniques used to value its investments into a disclosure hierarchy consisting of three levels as shown below:
Level 1 - quoted prices in active markets for identical investments
Level 2 - other significant observable inputs (including quoted prices for similar investments, interest rates, prepayment speeds, etc.)
Level 3 - unobservable inputs (including the Fund's own assumptions based on the best information available)
Changes in valuation techniques may result in transfers in or out of an assigned level within the disclosure hierarchy. The aggregate value of investments by input level, as of October 31, 2011, as well as a roll forward of Level 3 securities, is included at the end of the Fund's Schedule of Investments. Valuation techniques used to value the Fund's investments by major category are as follows:
Equity securities, including restricted securities, for which market quotations are readily available, are valued at the last reported sale price or official closing price as reported by an independent pricing service on the primary market or exchange on which they are traded and are categorized as Level 1 in the hierarchy. In the event there were no sales during the day or closing prices are not available, securities are valued at the last quoted bid price or may be valued using the last available price and are generally categorized as Level 2 in the hierarchy. For foreign equity securities, when significant market or security specific events arise, comparisons to the valuation of American Depositary Receipts
Annual Report
3. Significant Accounting Policies - continued
Security Valuation - continued
(ADRs), futures contracts, Exchange-traded funds (ETFs) and certain indexes as well as quoted prices for similar securities are used and are categorized as Level 2 in the hierarchy in these circumstances. Utilizing these techniques may result in transfers between Level 1 and Level 2. For restricted equity securities and private placements where observable inputs are limited, assumptions about market activity and risk are used and are categorized as Level 3 in the hierarchy.
Investments in open-end mutual funds, including the Fidelity Central Funds, are valued at their closing net asset value each business day and are categorized as Level 1 in the hierarchy.
Foreign Currency. The Fund may use foreign currency contracts to facilitate transactions in foreign-denominated securities. Gains and losses from these transactions may arise from changes in the value of the foreign currency or if the counterparties do not perform under the contracts' terms.
Foreign-denominated assets, including investment securities, and liabilities are translated into U.S. dollars at the exchange rate at period end. Purchases and sales of investment securities, income and dividends received and expenses denominated in foreign currencies are translated into U.S. dollars at the exchange rate in effect on the transaction date.
The effects of exchange rate fluctuations on investments are included with the net realized and unrealized gain (loss) on investment securities. Other foreign currency transactions resulting in realized and unrealized gain (loss) are disclosed separately.
Investment Transactions and Income. For financial reporting purposes, the Fund's investment holdings and NAV include trades executed through the end of the last business day of the period. The NAV per share for processing shareholder transactions is calculated as of the close of business of the New York Stock Exchange (NYSE), normally 4:00 p.m. Eastern time and includes trades executed through the end of the prior business day. Gains and losses on securities sold are determined on the basis of identified cost and may include proceeds received from litigation. Dividend income is recorded on the ex-dividend date, except for certain dividends from foreign securities where the ex-dividend date may have passed, which are recorded as soon as the Fund is informed of the ex-dividend date. Non-cash dividends included in dividend income, if any, are recorded at the fair market value of the securities received. Distributions received on securities that represent a return of capital or capital gain are recorded as a reduction of cost of investments and/or as a realized gain. The Fund estimates the components of distributions received that may be considered return of capital distributions or capital gain distributions. Interest income and distributions from the Fidelity Central Funds are
Annual Report
Notes to Financial Statements - continued
3. Significant Accounting Policies - continued
Investment Transactions and Income - continued
accrued as earned. Interest income includes coupon interest and amortization of premium and accretion of discount on debt securities. Investment income is recorded net of foreign taxes withheld where recovery of such taxes is uncertain.
Expenses. Expenses directly attributable to a fund are charged to that fund. Expenses attributable to more than one fund are allocated among the respective funds on the basis of relative net assets or other appropriate methods. Expense estimates are accrued in the period to which they relate and adjustments are made when actual amounts are known.
Income Tax Information and Distributions to Shareholders. Each year, the Fund intends to qualify as a regulated investment company, including distributing substantially all of its taxable income and realized gains under Subchapter M of the Internal Revenue Code and filing its U.S. federal tax return. As a result, no provision for income taxes is required. As of October 31, 2011, the Fund did not have any unrecognized tax benefits in the financial statements. A fund's federal tax return is subject to examination by the Internal Revenue Service (IRS) for a period of three years. Foreign taxes are provided for based on the Fund's understanding of the tax rules and rates that exist in the foreign markets in which it invests. The Fund received a final ruling from the Authority for Advance Ruling in India regarding the applicability of taxes imposed by the country on realized capital gains under the US/India tax treaty. The ruling entitled the Fund to a refund of capital gains taxes paid in prior years and exempts the Fund from taxes on future realized gains. The India Central Board of Direct Taxation may challenge the ruling at any time which could result in the reversal of some or all of the benefits recorded by the Fund.
Distributions are declared and recorded on the ex-dividend date. Income dividends and capital gain distributions are declared separately for each class. Income and capital gain distributions are determined in accordance with income tax regulations, which may differ from GAAP. In addition, the Fund claimed a portion of the payment made to redeeming shareholders as a distribution for income tax purposes.
Capital accounts within the financial statements are adjusted for permanent book-tax differences. These adjustments have no impact on net assets or the results of operations. Temporary book-tax differences will reverse in a subsequent period.
Book-tax differences are primarily due to futures transactions, foreign currency transactions, passive foreign investment companies (PFIC), and losses deferred due to wash sales.
Annual Report
3. Significant Accounting Policies - continued
Income Tax Information and Distributions to Shareholders - continued
The federal tax cost of investment securities and unrealized appreciation (depreciation) as of period end were as follows:
Gross unrealized appreciation | $ 47,310,211 |
Gross unrealized depreciation | (30,715,528) |
Net unrealized appreciation (depreciation) on securities and other investments | $ 16,594,683 |
| |
Tax Cost | $ 365,581,079 |
The tax-based components of distributable earnings as of period end were as follows:
Undistributed ordinary income | $ 2,634,151 |
Undistributed long-term capital gain | $ 16,660,184 |
Net unrealized appreciation (depreciation) | $ 16,579,605 |
Under the recently enacted Regulated Investment Company Modernization Act of 2010 (the Act), the Fund will be permitted to carry forward capital losses incurred in taxable years beginning after December 22, 2010 for an unlimited period. However, any losses incurred during those future taxable years will be required to be utilized prior to any losses incurred in pre-enactment taxable years, which generally expire after eight years from when they are incurred. Additionally, post-enactment capital losses that are carried forward will retain their character as either short-term or long-term capital losses rather than being considered all short-term as under previous law. The Fund's first fiscal year end subject to the Act will be October 31, 2012.
The tax character of distributions paid was as follows:
| October 31, 2011 | October 31, 2010 |
Ordinary Income | $ 3,521,543 | $ 3,503,974 |
Long-term Capital Gains | 22,144,049 | - |
Total | $ 25,665,592 | $ 3,503,974 |
Short-Term Trading (Redemption) Fees. Shares held by investors in the Fund less than 90 days are subject to a redemption fee equal to 1.50% of the net asset value of shares redeemed. All redemption fees, which reduce the proceeds of the shareholder redemption, are retained by the Fund and accounted for as an addition to paid in capital.
Annual Report
Notes to Financial Statements - continued
3. Significant Accounting Policies - continued
New Accounting Pronouncement. In May 2011, the Financial Accounting Standards Board issued Accounting Standard Update No. 2011-04, Fair Value Measurement (Topic 820) - Amendments to Achieve Common Fair Value Measurement and Disclosure Requirements in U.S. GAAP and IFRSs. The update changes the wording used to describe the requirements in GAAP for measuring fair value and for disclosing information about fair value measurements. The update is effective during interim and annual periods beginning after December 15, 2011. Management is currently evaluating the impact of the update's adoption on the Fund's financial statement disclosures.
4. Derivative Instruments.
Risk Exposures and the Use of Derivative Instruments. The Fund used derivative instruments (derivatives), including futures contracts in order to meet its investment objectives. The strategy is to use derivatives to increase returns, to gain exposure to certain types of assets and to manage exposure to certain risks as defined below. The success of any strategy involving derivatives depends on analysis of numerous economic factors, and if the strategies for investment do not work as intended, the Fund may not achieve its objectives.
The Fund's use of derivatives increased or decreased its exposure to the following risks:
Equity Risk | Equity risk relates to the fluctuations in the value of financial instruments as a result of changes in market prices (other than those arising from interest rate risk or foreign exchange risk), whether caused by factors specific to an individual investment, its issuer, or all factors affecting all instruments traded in a market or market segment. |
The Fund is also exposed to additional risks from investing in derivatives, such as liquidity risk and counterparty credit risk. Liquidity risk is the risk that the Fund will be unable to sell the derivative in the open market in a timely manner. Counterparty credit risk is the risk that the counterparty will not be able to fulfill its obligation to the Fund.
Futures Contracts. A futures contract is an agreement between two parties to buy or sell a specified underlying instrument for a fixed price at a specified future date. The Fund used futures contracts to manage its exposure to the stock market and fluctuations in currency values.
Upon entering into a futures contract, a fund is required to deposit either cash or securities (initial margin) with a clearing broker in an amount equal to a certain percentage of the face value of the contract. Futures contracts are marked-to-market daily and subsequent payments(variation margin) are made or received by a fund depending on the
Annual Report
4. Derivative Instruments - continued
Futures Contracts - continued
daily fluctuations in the value of the futures contracts and are recorded as unrealized appreciation or (depreciation). This receivable and/or payable is included in daily variation margin on futures contracts in the Statement of Assets and Liabilities. Realized gain or (loss) is recorded upon the expiration or closing of a futures contract. The net realized gain (loss) and change in net unrealized appreciation (depreciation) on futures contracts during the period is included in the Statement of Operations.
The underlying face amount at value of open futures contracts at period end, if any, is shown in the Schedule of Investments under the caption "Futures Contracts." This amount reflects each contract's exposure to the underlying instrument at period end. Securities deposited to meet initial margin requirements are identified in the Schedule of Investments.
Certain risks arise upon entering into futures contracts, including the risk that an illiquid market limits the ability to close out a futures contract prior to settlement date.
During the period the Fund recognized net realized gain (loss) of $(459,204) related to its investment in futures contracts. This amount is included in the Statement of Operations.
5. Purchases and Sales of Investments.
Purchases and sales of securities, other than short-term securities, aggregated $523,035,766 and $506,770,221, respectively.
6. Fees and Other Transactions with Affiliates.
Management Fee. FMR and its affiliates provide the Fund with investment management related services for which the Fund pays a monthly management fee. The management fee is the sum of an individual fund fee rate that is based on an annual rate of .45% of the Fund's average net assets and a group fee rate that averaged .26% during the period. The group fee rate is based upon the average net assets of all the mutual funds advised by FMR. The group fee rate decreases as assets under management increase and increases as assets under management decrease. For the period, the total annual management fee rate was .71% of the Fund's average net assets.
Annual Report
Notes to Financial Statements - continued
6. Fees and Other Transactions with Affiliates - continued
Distribution and Service Plan Fees. In accordance with Rule 12b-1 of the 1940 Act, the Fund has adopted separate Distribution and Service Plans for each class of shares. Certain classes pay Fidelity Distributors Corporation (FDC), an affiliate of FMR, separate Distribution and Service Fees, each of which is based on an annual percentage of each class' average net assets. In addition, FDC may pay financial intermediaries for selling shares of the Fund and providing shareholder support services.
For the period, the Distribution and Service Fee rates, total fees and amounts retained by FDC were as follows:
| Distribution
Fee | Service
Fee | Total Fees | Retained
by FDC |
Class A | -% | .25% | $ 508,104 | $ 14,268 |
Class T | .25% | .25% | 315,598 | 367 |
Class B | .75% | .25% | 260,552 | 195,658 |
Class C | .75% | .25% | 902,826 | 205,445 |
| | | $ 1,987,080 | $ 415,738 |
Sales Load. FDC may receive a front-end sales charge of up to 5.75% for selling Class A shares, and 3.50% for selling Class T shares, some of which is paid to financial intermediaries for selling shares of the Fund. Depending on the holding period, FDC may receive contingent deferred sales charges levied on Class A, Class T, Class B, and Class C redemptions. The deferred sales charges range from 5% to 1% for Class B, 1% for Class C, 1.00% for certain purchases of Class A shares and .25% for certain purchases of Class T shares.
For the period, sales charge amounts retained by FDC were as follows:
| Retained
by FDC |
Class A | $ 130,443 |
Class T | 20,319 |
Class B* | 42,404 |
Class C* | 14,316 |
| $ 207,482 |
* When Class B and Class C shares are initially sold, FDC pays commissions from its own resources to financial intermediaries through which the sales are made.
Transfer Agent Fees. Fidelity Investments Institutional Operations Company, Inc. (FIIOC), an affiliate of FMR, is the transfer, dividend disbursing and shareholder servicing agent for each class of the Fund. FIIOC receives account fees and asset-based fees that vary according to the account size and type of account of the shareholders of the respective classes of the Fund. FIIOC pays for typesetting, printing and mailing of shareholder reports, except proxy statements.
Annual Report
6. Fees and Other Transactions with Affiliates - continued
Transfer Agent Fees - continued
For the period, transfer agent fees for each class were as follows:
| Amount | % of
Average
Net Assets |
Class A | $ 514,416 | .25 |
Class T | 196,848 | .31 |
Class B | 78,963 | .30 |
Class C | 223,172 | .25 |
Institutional Class | 118,635 | .22 |
| $ 1,132,034 | |
Accounting and Security Lending Fees. Fidelity Service Company, Inc. (FSC), an affiliate of FMR, maintains the Fund's accounting records. The accounting fee is based on the level of average net assets for the month. Under a separate contract, FSC administers the security lending program. The security lending fee is based on the number and duration of lending transactions.
Brokerage Commissions. The Fund placed a portion of its portfolio transactions with brokerage firms which are affiliates of the investment adviser. The commissions paid to these affiliated firms were $386 for the period.
Interfund Lending Program. Pursuant to an Exemptive Order issued by the SEC, the Fund, along with other registered investment companies having management contracts with FMR, may participate in an interfund lending program. This program provides an alternative credit facility allowing the funds to borrow from, or lend money to, other participating affiliated funds. At period end, there were no interfund loans outstanding. The Fund's activity in this program during the period for which loans were outstanding was as follows:
Borrower or Lender | Average Daily
Loan Balance | Weighted Average Interest Rate | Interest
Expense |
Borrower | $ 6,580,526 | .40% | $ 1,400 |
7. Committed Line of Credit.
The Fund participates with other funds managed by FMR or an affiliate in a $4.0 billion credit facility (the "line of credit") to be utilized for temporary or emergency purposes to fund shareholder redemptions or for other short-term liquidity purposes. The Fund has agreed to pay commitment fees on its pro-rata portion of the line of credit, which amounted to $1,351 and is reflected in Miscellaneous expenses on the Statement of Operations. During the period, there were no borrowings on this line of credit.
Annual Report
Notes to Financial Statements - continued
8. Security Lending.
The Fund lends portfolio securities through a lending agent from time to time in order to earn additional income. For equity securities, a lending agent is used and may loan securities to certain qualified borrowers, including Fidelity Capital Markets (FCM), a broker-dealer affiliated with the Fund. On the settlement date of the loan, the Fund receives collateral (in the form of U.S. Treasury obligations, letters of credit and/or cash) against the loaned securities and maintains collateral in an amount not less than 100% of the market value of the loaned securities during the period of the loan. The market value of the loaned securities is determined at the close of business of the Fund and any additional required collateral is delivered to the Fund on the next business day. If the borrower defaults on its obligation to return the securities loaned because of insolvency or other reasons, a fund could experience delays and costs in recovering the securities loaned or in gaining access to the collateral. Any cash collateral received is invested in the Fidelity Securities Lending Cash Central Fund. The value of loaned securities and cash collateral at period end are disclosed on the Fund's Statement of Assets and Liabilities. Security lending income represents the income earned on investing cash collateral, less rebates paid to borrowers and any lending agent fees associated with the loan, plus any premium payments received for lending certain types of securities. Security lending income is presented in the Statement of Operations as a component of income from Fidelity Central Funds. Total security lending income during the period amounted to $145,253. During the period, there were no securities loaned to FCM.
9. Expense Reductions.
FMR voluntarily agreed to reimburse each class to the extent annual operating expenses exceeded certain levels of average net assets as noted in the table below. Some expenses, for example interest expense, including commitment fees, are excluded from this reimbursement.
The following classes were in reimbursement during the period:
| Expense
Limitations | Reimbursement
from adviser |
Class T | 1.75%-1.90%* | 3,344 |
Class B | 2.25%-2.40%* | 1,308 |
| | $ 4,652 |
* Expense limitation in effect at period end.
Many of the brokers with whom FMR places trades on behalf of the Fund provided services to the Fund in addition to trade execution. These services included payments of certain expenses on behalf of the Fund totaling $164,928 for the period.
Annual Report
10. Distributions to Shareholders.
Distributions to shareholders of each class were as follows:
Years ended October 31, | 2011 | 2010 |
From net investment income | | |
Class A | $ 1,195,236 | $ 615,994 |
Class T | 238,089 | 138,177 |
Class C | 129,641 | 55,860 |
Institutional Class | 411,224 | 161,513 |
Total | $ 1,974,190 | $ 971,544 |
From net realized gain | | |
Class A | $ 10,575,420 | $ 1,138,813 |
Class T | 3,522,540 | 399,983 |
Class B | 1,697,909 | 223,532 |
Class C | 5,318,244 | 558,596 |
Institutional Class | 2,577,289 | 211,506 |
Total | $ 23,691,402 | $ 2,532,430 |
11. Share Transactions.
Transactions for each class of shares were as follows:
| Shares | Dollars |
Years ended October 31, | 2011 | 2010 | 2011 | 2010 |
Class A | | | | |
Shares sold | 2,202,556 | 2,066,420 | $ 71,049,522 | $ 59,859,672 |
Reinvestment of distributions | 309,654 | 54,021 | 9,819,123 | 1,525,557 |
Shares redeemed | (2,005,332) | (1,447,315) | (62,867,653) | (40,817,600) |
Net increase (decrease) | 506,878 | 673,126 | $ 18,000,992 | $ 20,567,629 |
Class T | | | | |
Shares sold | 487,526 | 516,790 | $ 15,326,473 | $ 14,594,570 |
Reinvestment of distributions | 118,542 | 18,968 | 3,673,606 | 524,658 |
Shares redeemed | (538,208) | (403,834) | (16,492,902) | (11,178,425) |
Net increase (decrease) | 67,860 | 131,924 | $ 2,507,177 | $ 3,940,803 |
Class B | | | | |
Shares sold | 65,556 | 202,362 | $ 2,016,841 | $ 5,365,940 |
Reinvestment of distributions | 44,891 | 6,691 | 1,329,672 | 177,369 |
Shares redeemed | (291,995) | (305,292) | (8,641,379) | (8,111,865) |
Net increase (decrease) | (181,548) | (96,239) | $ (5,294,866) | $ (2,568,556) |
Class C | | | | |
Shares sold | 976,733 | 996,034 | $ 29,282,683 | $ 27,112,281 |
Reinvestment of distributions | 152,906 | 18,926 | 4,496,965 | 499,282 |
Shares redeemed | (992,268) | (626,174) | (28,874,366) | (16,404,984) |
Net increase (decrease) | 137,371 | 388,786 | $ 4,905,282 | $ 11,206,579 |
Annual Report
Notes to Financial Statements - continued
11. Share Transactions - continued
| Shares | Dollars |
Years ended October 31, | 2011 | 2010 | 2011 | 2010 |
Institutional Class | | | | |
Shares sold | 1,196,148 | 836,632 | $ 38,645,718 | $ 24,478,070 |
Reinvestment of distributions | 57,110 | 9,083 | 1,854,949 | 262,322 |
Shares redeemed | (893,992) | (411,905) | (28,329,397) | (11,804,448) |
Net increase (decrease) | 359,266 | 433,810 | $ 12,171,270 | $ 12,935,944 |
12. Other.
The Fund's organizational documents provide former and current trustees and officers with a limited indemnification against liabilities arising in connection with the performance of their duties to the Fund. In the normal course of business, the Fund may also enter into contracts that provide general indemnifications. The Fund's maximum exposure under these arrangements is unknown as this would be dependent on future claims that may be made against the Fund. The risk of material loss from such claims is considered remote.
Annual Report
To the Trustees of Fidelity Advisor Series VIII and the Shareholders of Fidelity Advisor Emerging Asia Fund:
In our opinion, the accompanying statement of assets and liabilities, including the schedule of investments, and the related statements of operations and of changes in net assets and the financial highlights present fairly, in all material respects, the financial position of Fidelity Advisor Emerging Asia Fund (a fund of Fidelity Advisor Series VIII) at October 31, 2011, the results of its operations for the year then ended, the changes in its net assets for each of the two years in the period then ended and the financial highlights for each of the five years in the period then ended, in conformity with accounting principles generally accepted in the United States of America. These financial statements and financial highlights (hereafter referred to as "financial statements") are the responsibility of the Fidelity Advisor Emerging Asia Fund's management. Our responsibility is to express an opinion on these financial statements based on our audits. We conducted our audits of these financial statements in accordance with the standards of the Public Company Accounting Oversight Board (United States). Those standards require that we plan and perform the audit to obtain reasonable assurance about whether the financial statements are free of material misstatement. An audit includes examining, on a test basis, evidence supporting the amounts and disclosures in the financial statements, assessing the accounting principles used and significant estimates made by management, and evaluating the overall financial statement presentation. We believe that our audits, which included confirmation of securities at October 31, 2011 by correspondence with the custodian and brokers, provide a reasonable basis for our opinion.
/s/ PricewaterhouseCoopers LLP
PricewaterhouseCoopers LLP
Boston, Massachusetts
December 12, 2011
Annual Report
The Trustees, Members of the Advisory Board, and executive officers of the trust and fund, as applicable, are listed below. The Board of Trustees governs the fund and is responsible for protecting the interests of shareholders. The Trustees are experienced executives who meet periodically throughout the year to oversee the fund's activities, review contractual arrangements with companies that provide services to the fund, oversee management of the risks associated with such activities and contractual arrangements, and review the fund's performance. Except for James C. Curvey, each of the Trustees oversees 226 funds advised by FMR or an affiliate. Mr. Curvey oversees 429 funds advised by FMR or an affiliate.
The Trustees hold office without limit in time except that (a) any Trustee may resign; (b) any Trustee may be removed by written instrument, signed by at least two-thirds of the number of Trustees prior to such removal; (c) any Trustee who requests to be retired or who has become incapacitated by illness or injury may be retired by written instrument signed by a majority of the other Trustees; and (d) any Trustee may be removed at any special meeting of shareholders by a two-thirds vote of the outstanding voting securities of the trust. Each Trustee who is not an interested person (as defined in the 1940 Act) (Independent Trustee), shall retire not later than the last day of the calendar year in which his or her 75th birthday occurs. The Independent Trustees may waive this mandatory retirement age policy with respect to individual Trustees. The executive officers and Advisory Board Members hold office without limit in time, except that any officer and Advisory Board Member may resign or may be removed by a vote of a majority of the Trustees at any regular meeting or any special meeting of the Trustees. Except as indicated, each individual has held the office shown or other offices in the same company for the past five years.
Experience, Skills, Attributes, and Qualifications of the Fund's Trustees. The Governance and Nominating Committee has adopted a statement of policy that describes the experience, qualifications, attributes, and skills that are necessary and desirable for potential Independent Trustee candidates (Statement of Policy). The Board believes that each Trustee satisfied at the time he or she was initially elected or appointed a Trustee, and continues to satisfy, the standards contemplated by the Statement of Policy. The Governance and Nominating Committee also engages professional search firms to help identify potential Independent Trustee candidates who have the experience, qualifications, attributes, and skills consistent with the Statement of Policy. From time to time, additional criteria based on the composition and skills of the current Independent Trustees, as well as experience or skills that may be appropriate in light of future changes to board composition, business conditions, and regulatory or other developments, have also been considered by the professional search firms and the Governance and Nominating Committee. In addition, the Board takes into account the Trustees' commitment and participation in Board and committee meetings, as well as their leadership of standing and ad hoc committees throughout their tenure.
In determining that a particular Trustee was and continues to be qualified to serve as a Trustee, the Board has considered a variety of criteria, none of which, in isolation, was controlling. The Board believes that, collectively, the Trustees have balanced and diverse experience, qualifications, attributes, and skills, which allow the Board to operate effectively in governing the fund and protecting the interests of shareholders. Information about the specific experience, skills, attributes, and qualifications of each Trustee, which in each case led to the Board's conclusion that the Trustee should serve (or continue to serve) as a trustee of the fund, is provided below.
Annual Report
Board Structure and Oversight Function. James C. Curvey is an interested person (as defined in the 1940 Act) and currently serves as Acting Chairman. The Trustees have determined that an interested Chairman is appropriate and benefits shareholders because an interested Chairman has a personal and professional stake in the quality and continuity of services provided to the fund. Independent Trustees exercise their informed business judgment to appoint an individual of their choosing to serve as Chairman, regardless of whether the Trustee happens to be independent or a member of management. The Independent Trustees have determined that they can act independently and effectively without having an Independent Trustee serve as Chairman and that a key structural component for assuring that they are in a position to do so is for the Independent Trustees to constitute a substantial majority for the Board. The Independent Trustees also regularly meet in executive session. Ned C. Lautenbach serves as Chairman of the Independent Trustees and as such (i) acts as a liaison between the Independent Trustees and management with respect to matters important to the Independent Trustees and (ii) with management prepares agendas for Board meetings.
Fidelity funds are overseen by different Boards of Trustees. The fund's Board oversees Fidelity's equity and high income funds and another Board oversees Fidelity's investment-grade bond, money market, and asset allocation funds. The asset allocation funds may invest in Fidelity funds overseen by the fund's Board. The use of separate Boards, each with its own committee structure, allows the Trustees of each group of Fidelity funds to focus on the unique issues of the funds they oversee, including common research, investment, and operational issues. On occasion, the separate Boards establish joint committees to address issues of overlapping consequences for the Fidelity funds overseen by each Board.
The Trustees operate using a system of committees to facilitate the timely and efficient consideration of all matters of importance to the Trustees, the fund, and fund shareholders and to facilitate compliance with legal and regulatory requirements and oversight of the fund's activities and associated risks. The Board, acting through its committees, has charged FMR and its affiliates with (i) identifying events or circumstances the occurrence of which could have demonstrably adverse effects on the fund's business and/or reputation; (ii) implementing processes and controls to lessen the possibility that such events or circumstances occur or to mitigate the effects of such events or circumstances if they do occur; and (iii) creating and maintaining a system designed to evaluate continuously business and market conditions in order to facilitate the identification and implementation processes described in (i) and (ii) above. Because the day-to-day operations and activities of the fund are carried out by or through FMR, its affiliates and other service providers, the fund's exposure to risks is mitigated but not eliminated by the processes overseen by the Trustees. While each of the Board's committees has responsibility for overseeing different aspects of the fund's activities, oversight is exercised primarily through the Operations, Audit, and Compliance Committees. In addition, the Independent Trustees have worked with FMR to enhance the Board's oversight of investment and financial risks, legal and regulatory risks, technology risks, and operational risks, including the development of additional risk reporting to the Board. For example, a working group comprised of Independent Trustees and FMR has worked and continues to work to review the Fidelity funds' valuation-related activities, reporting and risk management. Appropriate personnel, including but not limited to the fund's Chief Compliance Officer (CCO), FMR's internal auditor, the independent accountants, the fund's Treasurer and portfolio management personnel, make periodic reports to the Board's committees, as appropriate, including an annual review of FMR's risk management program for the Fidelity funds. The responsibilities of each standing committee, including their oversight responsibilities, are described further under "Standing Committees of the Fund's Trustees."
Annual Report
Trustees and Officers - continued
The fund's Statement of Additional Information (SAI) includes more information about the Trustees. To request a free copy, call Fidelity at 1-877-208-0098.
Interested Trustees*:
Correspondence intended for each Trustee who is an interested person may be sent to Fidelity Investments, 82 Devonshire Street, Boston, Massachusetts 02109.
Name, Age; Principal Occupations and Other Relevant Experience+ |
James C. Curvey (76) |
| Year of Election or Appointment: 2007 Mr. Curvey is Trustee and Acting Chairman of the Board of Trustees of certain Trusts. Mr. Curvey also serves as Trustee (2007-present) of other investment companies advised by FMR. Mr. Curvey is a Director of Fidelity Investments Money Management, Inc. (2009-present), Director of Fidelity Research & Analysis Co. (2009-present) and Director of FMR and FMR Co., Inc. (2007-present). Mr. Curvey is also Vice Chairman (2007-present) and Director of FMR LLC. In addition, Mr. Curvey serves as an Overseer for the Boston Symphony Orchestra and a member of the Trustees of Villanova University. Previously, Mr. Curvey was the Vice Chairman (2006-2007) and Director (2000-2007) of FMR Corp. |
Ronald P. O'Hanley (54) |
| Year of Election or Appointment: 2011 Mr. O'Hanley is Director of FMR Co., Inc. (2010-present), Director of Fidelity Investments Money Management, Inc. (2010-present), Director of Fidelity Research & Analysis Company (2010-present), President of Fidelity Asset Management and Corporate Services and a member of Fidelity's Executive Committee (2010-present). Previously, Mr. O'Hanley served as President and Chief Executive Officer of BNY Mellon Asset Management (2007-2010). Mr. O'Hanley also served as Vice Chairman of Bank New York Mellon Corp. and a member of that firm's Executive Committee. Prior to the 2007 merger of The Bank of New York and Mellon Financial Corporation, he was Vice Chairman of Mellon Financial Corporation and President and Chief Executive Officer of Mellon Asset Management. He joined Mellon in February 1997. Mr. O'Hanley currently serves as Chairman of the Boston Public Library Foundation Board of Directors and sits on the Board of Directors of Beth Israel Deaconess Medical Center, the Board of Trustees of the Marine Biological Laboratory and the Advisory Board of the Maxwell School of Citizenship and Public Administration at Syracuse University. Mr. O'Hanley also chairs the Council on Asset Management for the Financial Services Roundtable and is a member of the Board of Directors of Institutional Investor's U.S. Institute. |
* Trustees have been determined to be "Interested Trustees" by virtue of, among other things, their affiliation with the trust or various entities under common control with FMR.
+ The information above includes each Trustee's principal occupation during the last five years and other information relating to the experience, attributes, and skills relevant to each Trustee's qualifications to serve as a Trustee, which led to the conclusion that each Trustee should serve as a Trustee for the fund.
Annual Report
Trustees and Officers - continued
Independent Trustees:
Correspondence intended for each Independent Trustee (that is, the Trustees other than the Interested Trustees) may be sent to Fidelity Investments, P.O. Box 55235, Boston, Massachusetts 02205-5235.
Name, Age; Principal Occupations and Other Relevant Experience+ |
Dennis J. Dirks (63) |
| Year of Election or Appointment: 2005 Prior to his retirement in May 2003, Mr. Dirks was Chief Operating Officer and a member of the Board of The Depository Trust & Clearing Corporation (DTCC). He also served as President, Chief Operating Officer, and Board member of The Depository Trust Company (DTC) and President and Board member of the National Securities Clearing Corporation (NSCC). In addition, Mr. Dirks served as Chief Executive Officer and Board member of the Government Securities Clearing Corporation, Chief Executive Officer and Board member of the Mortgage-Backed Securities Clearing Corporation, as a Trustee and a member of the Finance Committee of Manhattan College (2005-2008), and as a Trustee and a member of the Finance Committee of AHRC of Nassau County (2006-2008). Mr. Dirks is a member of the Independent Directors Council (IDC) Governing Council (2010-Present) and Board of Directors for The Brookville Center for Children's Services, Inc. (2009-present). |
Alan J. Lacy (58) |
| Year of Election or Appointment: 2008 Mr. Lacy serves as Senior Adviser (2007-present) of Oak Hill Capital Partners, L.P. (private equity). Mr. Lacy also served as Chief Executive Officer (2000-2005) and Vice Chairman (2005-2006) of Sears Holdings Corporation and Sears, Roebuck and Co. (retail). In addition, Mr. Lacy serves as a member of the Board of Directors of Dave & Buster's, Inc. (restaurant and entertainment complexes, 2010-present), The Hillman Companies, Inc. (hardware wholesalers, 2010-present), and Bristol-Myers Squibb Company (global pharmaceuticals, 2007-present). Mr. Lacy is a member of the Board of Trustees of The National Parks Conservation Association (2006-Present). Previously, Mr. Lacy served as Chairman of the Board of Trustees of the National Parks Conservation Association (2008-2011) and as a member of the Board of Directors for the Western Union Company (global money transfer, 2006-2011). |
Ned C. Lautenbach (67) |
| Year of Election or Appointment: 2000 Mr. Lautenbach is Chairman of the Independent Trustees of the Equity and High Income Funds (2006-present). Mr. Lautenbach currently serves as the Lead Director of the Eaton Corporation Board of Directors (diversified industrial, 1997-present). Mr. Lautenbach is also a member of the Board of Directors of the Philharmonic Center for the Arts in Naples, Florida (1999-present); a member of the Board of Trustees of Fairfield University (2005-present); and a member of the Council on Foreign Relations (1994-present). Previously, Mr. Lautenbach was a Partner/Advisory Partner at Clayton, Dubilier & Rice, LLC (private equity investment, 1998-2010), as well as a Director of Sony Corporation (2006-2007). |
Joseph Mauriello (67) |
| Year of Election or Appointment: 2008 Prior to his retirement in January 2006, Mr. Mauriello served in numerous senior management positions including Deputy Chairman and Chief Operating Officer (2004-2005), and Vice Chairman of Financial Services (2002-2004) of KPMG LLP US (professional services, 1965-2005). Mr. Mauriello currently serves as a member of the Board of Directors of XL Group plc. (global insurance and re-insurance, 2006-present) and of Arcadia Resources Inc. (health care services and products, 2007-present). Previously, Mr. Mauriello served as a Director of the Hamilton Funds of the Bank of New York (2006-2007). |
Robert W. Selander (61) |
| Year of Election or Appointment: 2011 Previously, Mr. Selander served as a Member of the Advisory Board of Fidelity's Equity and High Income Funds (2011), Executive Vice Chairman (2010), Chief Executive Officer (2009-2010), and President and Chief Executive Officer (1997-2009) of Mastercard, Inc. |
Cornelia M. Small (67) |
| Year of Election or Appointment: 2005 Ms. Small is a member of the Board of Directors of the Teagle Foundation (2009-present). Ms. Small is also a member of the Investment Committee, and Chair (2008-present) and a member of the Board of Trustees of Smith College. In addition, Ms. Small serves on the Investment Committee of the Berkshire Taconic Community Foundation (2008-present). Previously, Ms. Small served as Chairperson of the Investment Committee (2002-2008) of Smith College. In addition, Ms. Small served as Chief Investment Officer, Director of Global Equity Investments, and a member of the Board of Directors of Scudder, Stevens & Clark and Scudder Kemper Investments. |
William S. Stavropoulos (72) |
| Year of Election or Appointment: 2002 Mr. Stavropoulos is Vice Chairman of the Independent Trustees of the Equity and High Income Funds (2006-present). Mr. Stavropoulos serves as President and Founder of the Michigan Baseball Foundation, the Great Lakes Loons (2007-present). Mr. Stavropoulos is Chairman Emeritus of the Board of Directors of The Dow Chemical Company, where he previously served in numerous senior management positions, including President, CEO (1995-2000; 2002-2004), Chairman of the Executive Committee (2000-2006), and as a member of the Board of Directors (1990-2006). Currently, Mr. Stavropoulos is Chairman of Univar (global distributor of commodity and specialty chemicals, 2010-present), a Director of Teradata Corporation (data warehousing and technology solutions, 2008-present), Chemical Financial Corporation, Maersk Inc. (industrial conglomerate), Tyco International, Inc. (multinational manufacturing and services, 2007-present), and a member of the Advisory Board for Metalmark Capital (private equity investment, 2005-present). Mr. Stavropoulos is a special advisor to Clayton, Dubilier & Rice, LLC (private equity investment). In addition, Mr. Stavropoulos is a member of the University of Notre Dame Advisory Council for the College of Science. |
David M. Thomas (62) |
| Year of Election or Appointment: 2008 Previously, Mr. Thomas served as Executive Chairman (2005-2006) and Chairman and Chief Executive Officer (2000-2005) of IMS Health, Inc. (pharmaceutical and healthcare information solutions). In addition, Mr. Thomas serves as a member of the Board of Directors of Fortune Brands, Inc. (consumer products), and Interpublic Group of Companies, Inc. (marketing communication, 2004-present). |
Michael E. Wiley (61) |
| Year of Election or Appointment: 2008 Mr. Wiley also serves as a Director of Asia Pacific Exploration Consolidated (international oil and gas exploration and production, 2008-present). Mr. Wiley serves as a Director of Tesoro Corporation (independent oil refiner and marketer, 2005-present), and a Director of Bill Barrett Corporation (exploration and production, 2005-present). In addition, Mr. Wiley also serves as a Director of Post Oak Bank (privately-held bank, 2004-present). Previously, Mr. Wiley served as a member of the Board of Trustees of the University of Tulsa (2000-2006; 2007-2010), as a Senior Energy Advisor of Katzenbach Partners, LLC (consulting, 2006-2007), as an Advisory Director of Riverstone Holdings (private investment), Chairman, President, and CEO of Baker Hughes, Inc. (oilfield services, 2000-2004), and as Director of Spinnaker Exploration Company (exploration and production, 2001-2005). |
Annual Report
+ The information above includes each Trustee's principal occupation during the last five years and other information relating to the experience, attributes, and skills relevant to each Trustee's qualifications to serve as a Trustee, which led to the conclusion that each Trustee should serve as a Trustee for the fund.
Advisory Board Members and Executive Officers:
Correspondence intended for each executive officer, Edward C. Johnson 3d, and Peter S. Lynch may be sent to Fidelity Investments, 82 Devonshire Street, Boston, Massachusetts 02109.
Name, Age; Principal Occupation |
Edward C. Johnson 3d (81) |
| Year of Election or Appointment: 2011 Member of the Advisory Board of Fidelity's Equity and High Income Funds. Mr. Johnson serves as Chief Executive Officer, Chairman, and a Director of FMR LLC, and also serves as Chairman and Director of FIL Limited. Previously, Mr. Johnson served as a Trustee and Chairman of the Board of certain Fidelity Trusts, Chairman and a Director of FMR, Chairman and a Director of FMR Co., Inc., and President of FMR LLC (2006-2007). |
Peter S. Lynch (67) |
| Year of Election or Appointment: 2003 Member of the Advisory Board of Fidelity's Equity and High Income Funds. Mr. Lynch is Vice Chairman and a Director of FMR and FMR Co., Inc. In addition, Mr. Lynch serves as a Trustee of Boston College and as the Chairman of the Inner-City Scholarship Fund. Previously, Mr. Lynch served on the Special Olympics International Board of Directors (1997-2006). |
Kenneth B. Robins (42) |
| Year of Election or Appointment: 2008 President and Treasurer of Fidelity's Equity and High Income Funds. Mr. Robins also serves as President and Treasurer (2010-present) and Assistant Treasurer (2009-present) of other Fidelity funds and is an employee of Fidelity Investments (2004-present). Previously, Mr. Robins served as Deputy Treasurer of the Fidelity funds (2005-2008) and Treasurer and Chief Financial Officer of The North Carolina Capital Management Trust: Cash and Term Portfolios (2006-2008). |
Bruce T. Herring (46) |
| Year of Election or Appointment: 2006 Vice President of certain Equity Funds. Mr. Herring also serves as Chief Investment Officer and Director of Fidelity Management & Research (U.K.) Inc. (2010-present) and Group Chief Investments Officer of FMR. Previously, Mr. Herring served as Vice President (2005-2006) and Senior Vice President (2006-2007) of Fidelity Management & Research Company, Vice President of FMR Co., Inc. (2001-2007) and as a portfolio manager for Fidelity U.S. Equity Funds. |
Brian B. Hogan (47) |
| Year of Election or Appointment: 2009 Vice President of Equity and High Income Funds. Mr. Hogan also serves as President of FMR's Equity Division (2009-present). Previously, Mr. Hogan served as Senior Vice President, Equity Research of FMR (2006-2009) and as a portfolio manager. |
Thomas C. Hense (47) |
| Year of Election or Appointment: 2008 or 2010 Vice President of Fidelity's High Income (2008), Small Cap (2008), and Value (2010) Funds. Previously, Mr. Hense served as a portfolio manager for Fidelity's Institutional Money Management Group (Pyramis) (2003-2008). |
Scott C. Goebel (43) |
| Year of Election or Appointment: 2008 Secretary and Chief Legal Officer (CLO) of the Fidelity funds. Mr. Goebel also serves as Secretary of Fidelity Investments Money Management, Inc. (FIMM) (2010-present) and Fidelity Research and Analysis Company (FRAC) (2010-present); Secretary and CLO of The North Carolina Capital Management Trust: Cash and Term Portfolios (2008-present); General Counsel, Secretary, and Senior Vice President of FMR (2008-present) and FMR Co., Inc. (2008-present); employed by FMR LLC or an affiliate (2001-present); Chief Legal Officer of Fidelity Management & Research (Hong Kong) Limited (2008-present) and Assistant Secretary of Fidelity Management & Research (Japan) Inc. (2008-present), and Fidelity Management & Research (U.K.) Inc. (2008-present). Previously, Mr. Goebel served as Assistant Secretary of FIMM (2008-2010), FRAC (2008-2010), and the Funds (2007-2008) and as Vice President and Secretary of Fidelity Distributors Corporation (FDC) (2005-2007). |
William C. Coffey (42) |
| Year of Election or Appointment: 2009 Assistant Secretary of Fidelity's Equity and High Income Funds. Mr. Coffey also serves as Senior Vice President and Deputy General Counsel of FMR LLC (2010-present), and is an employee of Fidelity Investments. Previously, Mr. Coffey served as Vice President and Associate General Counsel of FMR LLC (2005-2009). |
Holly C. Laurent (57) |
| Year of Election or Appointment: 2008 Anti-Money Laundering (AML) Officer of the Fidelity funds. Ms. Laurent also serves as AML Officer of The North Carolina Capital Management Trust: Cash and Term Portfolios (2008-present) and is an employee of Fidelity Investments. Previously, Ms. Laurent was Senior Vice President and Head of Legal for Fidelity Business Services India Pvt. Ltd. (2006-2008), and Senior Vice President, Deputy General Counsel and Group Head for FMR LLC (2005-2006). |
Christine Reynolds (53) |
| Year of Election or Appointment: 2008 Chief Financial Officer of the Fidelity funds. Ms. Reynolds became President of Fidelity Pricing and Cash Management Services (FPCMS) in August 2008. Ms. Reynolds served as Chief Operating Officer of FPCMS (2007-2008). Previously, Ms. Reynolds served as President, Treasurer, and Anti-Money Laundering officer of the Fidelity funds (2004-2007). |
Kenneth A. Rathgeber (64) |
| Year of Election or Appointment: 2004 Chief Compliance Officer of Fidelity's Equity and High Income Funds. Mr. Rathgeber is Chief Compliance Officer of Fidelity Management & Research (Hong Kong) Limited (2008-present), Fidelity Management & Research (Japan) Inc. (2008-present), FMR (2005-present), FMR Co., Inc. (2005-present), Fidelity Management & Research (U.K.) Inc. (2005-present), Fidelity Research & Analysis Company (2005-present), Fidelity Investments Money Management, Inc. (2005-present), Pyramis Global Advisors, LLC (2005-present), and Strategic Advisers, Inc. (2005-present). |
Jeffrey S. Christian (50) |
| Year of Election or Appointment: 2009 Deputy Treasurer of the Fidelity funds. Mr. Christian is an employee of Fidelity Investments. Previously, Mr. Christian served as Chief Financial Officer (2008-2009) of certain Fidelity funds and Senior Vice President of Fidelity Pricing and Cash Management Services (FPCMS) (2004-2009). |
Joseph F. Zambello (54) |
| Year of Election or Appointment: 2011 Deputy Treasurer of the Fidelity funds. Mr. Zambello is an employee of Fidelity Investments. Previously, Mr. Zambello served as Vice President of FMR's Program Management Group (2009-2011) and Vice President of the Transfer Agent Oversight Group (2005-2009). |
Adrien E. Deberghes (44) |
| Year of Election or Appointment: 2008 Deputy Treasurer of Fidelity's Equity and High Income Funds. Mr. Deberghes also serves as Vice President and Assistant Treasurer of Fidelity Rutland Square Trust II and Fidelity Commonwealth Trust II (2011-present), Assistant Treasurer of other Fidelity funds (2010-present), and is an employee of Fidelity Investments (2008-present). Previously, Mr. Deberghes served as Senior Vice President of Mutual Fund Administration at State Street Corporation (2007-2008), Senior Director of Mutual Fund Administration at Investors Bank & Trust (2005-2007), and Director of Finance for Dunkin' Brands (2000-2005). |
Stephanie J. Dorsey (42) |
| Year of Election or Appointment: 2010 Assistant Treasurer of Fidelity's Equity and High Income Funds. Ms. Dorsey also serves as Deputy Treasurer of other Fidelity funds (2008-present) and is an employee of Fidelity Investments (2008-present). Previously, Ms. Dorsey served as Treasurer (2004-2008) of the JPMorgan Mutual Funds and Vice President (2004-2008) of JPMorgan Chase Bank. |
John R. Hebble (53) |
| Year of Election or Appointment: 2009 Assistant Treasurer of Fidelity's Equity and High Income Funds. Mr. Hebble also serves as President (2011-present), Treasurer, and Chief Financial Officer of The North Carolina Capital Management Trust: Cash and Term Portfolios (2008-present), President and Treasurer of other Fidelity funds (2008-present) and is an employee of Fidelity Investments. |
Gary W. Ryan (53) |
| Year of Election or Appointment: 2005 Assistant Treasurer of the Fidelity funds. Mr. Ryan is an employee of Fidelity Investments. Previously, Mr. Ryan served as Vice President of Fund Reporting in Fidelity Pricing and Cash Management Services (FPCMS) (1999-2005). |
Jonathan Davis (43) |
| Year of Election or Appointment: 2010 Assistant Treasurer of the Fidelity funds. Mr. Davis is also Assistant Treasurer of Fidelity Rutland Square Trust II and Fidelity Commonwealth Trust II. Mr. Davis is an employee of Fidelity Investments. Previously, Mr. Davis served as Vice President and Associate General Counsel of FMR LLC (2003-2010). |
Annual Report
The Board of Trustees of Advisor Emerging Asia Fund voted to pay to shareholders of record at the opening of business on record date, the following distributions per share derived from capital gains realized from sales of portfolio securities, and dividends derived from net investment income:
| Pay Date | Record Date | Dividends | Capital Gains |
Institutional Class | 12/05/11 | 12/02/11 | $.416 | $1.23 |
The fund hereby designates as a capital gain dividend with respect to the taxable year ended October 31, 2011, $23,110,235, or, if subsequently determined to be different, the net capital gain of such year.
Institutional Class designates 55% of the dividends distributed during the fiscal year as amounts which may be taken into account as a dividend for purposes of the maximum rate under section 1(h)(11) of the Internal Revenue Code.
The amounts per share which represent income derived from sources within, and taxes paid to, foreign countries or possessions of the United States are $.469 and $.0606 for the dividend paid 12/06/10.
The fund will notify shareholders in January 2012 of amounts for use in preparing 2011 income tax returns.
Annual Report
Board Approval of Investment Advisory Contracts and Management Fees
Fidelity Advisor Emerging Asia Fund
Each year, the Board of Trustees, including the Independent Trustees (together, the Board), votes on the renewal of the management contract and sub-advisory agreements (together, the Advisory Contracts) for the fund. The Board, assisted by the advice of fund counsel and Independent Trustees' counsel, requests and considers a broad range of information relevant to the renewal of the Advisory Contracts throughout the year.
The Board meets regularly and considers at each of its meetings factors that are relevant to its annual consideration of the renewal of the fund's Advisory Contracts, including the services and support provided to the fund and its shareholders. The Board has established various standing committees, each composed of Independent Trustees with varying backgrounds, to which the Board has assigned specific subject matter responsibilities in order to enhance effective decision-making by the Board. The Board, acting directly and through its Committees, requests and receives information concerning the annual consideration of the renewal of the fund's Advisory Contracts. The Board also meets as needed to consider matters specifically related to the Board's annual consideration of the renewal of Advisory Contracts. Members of the Board may also meet with trustees of other Fidelity funds through ad hoc joint committees to discuss certain matters relevant to the Fidelity funds.
At its July 2011 meeting, the Board of Trustees, including the Independent Trustees, unanimously determined to renew the fund's Advisory Contracts. In reaching its determination, the Board considered all factors it believed relevant, including (i) the nature, extent, and quality of the services to be provided to the fund and its shareholders (including the investment performance of the fund); (ii) the competitiveness of the fund's management fee and total expense ratio; (iii) the total costs of the services to be provided by and the profits to be realized by Fidelity from its relationship with the fund; (iv) the extent to which economies of scale would be realized as the fund grows; and (v) whether fee levels reflect these economies of scale, if any, for the benefit of fund shareholders.
In considering whether to renew the Advisory Contracts for the fund, the Board reached a determination, with the assistance of fund counsel and Independent Trustees' counsel and through the exercise of its business judgment, that the renewal of the Advisory Contracts is in the best interests of the fund and its shareholders and that the compensation payable under the Advisory Contracts is fair and reasonable. The Board's decision to renew the Advisory Contracts was not based on any single factor, but rather was based on a comprehensive consideration of all the information provided to the Board at its meetings throughout the year. The Board, in reaching its determination to renew the Advisory Contracts, is aware that shareholders in the fund have a broad range of investment choices available to them, including a wide choice among mutual funds offered by Fidelity's competitors, and that the fund's shareholders, who have the opportunity to review and weigh the disclosure provided by the fund in its prospectus and other public disclosures, have chosen to invest in this fund, managed by Fidelity.
Annual Report
Board Approval of Investment Advisory Contracts and
Management Fees - continued
Nature, Extent, and Quality of Services Provided. The Board considered the staffing within the investment adviser, FMR, and the sub-advisers (together, the Investment Advisers), including the backgrounds of the fund's investment personnel and the fund's investment objective and discipline. The Independent Trustees also had discussions with senior management of Fidelity's investment operations and investment groups. The Board considered the structure of the portfolio manager compensation program and whether this structure provides appropriate incentives to act in the best interests of the fund.
Resources Dedicated to Investment Management and Support Services. The Board and the Fund Oversight and Research Committees reviewed the general qualifications and capabilities of the Investment Advisers' investment staff, including its size, education, experience, and resources, as well as the Investment Advisers' approach to recruiting, training, managing, and compensating investment personnel. The Board also noted that FMR has devoted increased resources to non-U.S. offices. The Board noted that Fidelity's analysts have extensive resources, tools and capabilities which allow them to conduct sophisticated quantitative and fundamental analysis, as well as credit analysis of issuers, counterparties and enhancers. The Board also believes that Fidelity's investment professionals have sufficient access to global information and data so as to provide competitive investment results over time, and that those professionals also have access to sophisticated tools which permit them to assess portfolio construction and risk and performance attribution characteristics continuously, as well as to transmit new information and research conclusions rapidly around the world. Additionally, in their deliberations, the Board considered the Investment Advisers' trading capabilities and resources which are an integral part of the investment management process.
Shareholder and Administrative Services. The Board considered (i) the nature, extent, quality, and cost of advisory, administrative, and shareholder services performed by the Investment Advisers and their affiliates under the Advisory Contracts and under separate agreements covering transfer agency, pricing and bookkeeping, and securities lending services for the fund; (ii) the nature and extent of the investment adviser's supervision of third party service providers, principally custodians and subcustodians; and (iii) the resources devoted to, and the record of compliance with, the fund's compliance policies and procedures. The Board also reviewed the allocation of fund brokerage, including allocations to brokers affiliated with the Investment Advisers, the use of brokerage commissions to pay fund expenses, and the use of "soft" commission dollars to pay for research services.
The Board noted that the growth of fund assets over time across the complex allows Fidelity to reinvest in the development of services designed to enhance the value or convenience of the Fidelity funds as investment vehicles. These services include 24-hour access to account information and market information through telephone representatives and over the Internet, investor education materials and asset allocation tools, and the expanded availability of Fidelity Investor Centers, with 35 new branches opening since 2010.
Annual Report
Investment in a Large Fund Family. The Board considered the benefits to shareholders of investing in a Fidelity fund, including the benefits of investing in a fund that is part of a large family of funds offering a variety of investment disciplines and providing a large variety of mutual fund investor services. The Board noted that Fidelity had taken, or had made recommendations that resulted in the Fidelity funds taking, a number of actions over the previous year that benefited particular funds, including (i) continuing to dedicate additional resources to investment research and support of the senior management team that oversees asset management; (ii) rationalizing product lines through the mergers of six funds into other funds; (iii) continuing to migrate the Freedom Funds to dedicated lower cost underlying funds; (iv) obtaining shareholder approval to broaden the investment strategies for Fidelity Consumer Finance Portfolio, Fidelity Emerging Asia Fund, and Fidelity Environment and Alternative Energy Portfolio; (v) contractually agreeing to reduce the management fees and impose other expense limitations on Spartan 500 Index Fund and U.S. Bond Index Fund in connection with launching new institutional classes of these funds; (vi) changing the name, primary and supplemental benchmarks, and investment policies of Fidelity Global Strategies Fund to support the fund's flexible investment mandate and global orientation; and (vii) reducing the transfer agency account fee rates on certain accounts.
Investment Performance. The Board considered whether the fund has operated in accordance with its investment objective, as well as its record of compliance with its investment restrictions. It also reviewed the fund's absolute investment performance for each class, as well as the fund's relative investment performance for each class measured over multiple periods against a broad-based securities market index. The Board noted that FMR does not believe that a meaningful peer group exists against which to compare the fund's performance. The following charts considered by the Board show, over the one-, three-, and five-year periods ended December 31, 2010, the cumulative total returns of Institutional Class (Class I) and Class B of the fund and the cumulative total returns of a broad-based securities market index ("benchmark"). The returns of Institutional Class (Class I) and Class B show the performance of the highest and lowest performing classes, respectively (based on five-year performance).
Annual Report
Board Approval of Investment Advisory Contracts and
Management Fees - continued
Fidelity Advisor Emerging Asia Fund
The Board noted that the investment performance of Institutional Class (Class I) of the fund compared favorably to its benchmark for all the periods shown. The Board considered that the variations in performance among the fund's classes reflect the variations in class expenses, which result in lower performance for higher expense classes. The Board also reviewed the fund's performance since inception as well as performance in the current year.
Based on its review, the Board concluded that the nature, extent, and quality of services provided to the fund under the Advisory Contracts should benefit the fund's shareholders.
Competitiveness of Management Fee and Total Expense Ratio. The Board considered the fund's management fee and total expense ratio compared to "mapped groups" of competitive funds and classes. Fidelity creates "mapped groups" by combining similar Lipper investment objective categories that have comparable management fee characteristics. Combining Lipper investment objective categories aids the Board's management fee and total expense ratio comparisons by broadening the competitive group used for comparison and by reducing the number of universes to which various Fidelity funds are compared.
Management Fee. The Board considered two proprietary management fee comparisons for the 12-month periods shown in the chart below. The group of Lipper funds used by the Board for management fee comparisons is referred to below as the "Total Mapped Group." The Total Mapped Group comparison focuses on a fund's standing relative to the total universe of comparable funds available to investors in terms of gross management fees before expense reimbursements or caps. "TMG %" represents the percentage of funds in the Total Mapped Group that had management fees that were lower than the fund's. For example, a TMG % of 7% means that 93% of the funds in the Total Mapped Group had higher management fees than the fund. The "Asset-Size Peer Group" (ASPG) comparison focuses on a fund's standing relative to non-Fidelity funds similar in size to the fund within the Total Mapped Group. The ASPG represents at least 15% of the funds in the Total Mapped Group with comparable asset size and management fee characteristics, subject to a minimum of 50 funds (or all funds in the Total Mapped Group if fewer than 50). Additional information, such as the ASPG quartile in which the fund's management fee ranked, is also included in the chart and considered by the Board.
Annual Report
Fidelity Advisor Emerging Asia Fund

The Board noted that the fund's management fee ranked below the median of its Total Mapped Group and below the median of its ASPG for 2010.
Based on its review, the Board concluded that the fund's management fee is fair and reasonable in light of the services that the fund receives and the other factors considered.
Total Expense Ratio. In its review of each class's total expense ratio, the Board considered the fund's management fee as well as other fund or class expenses, as applicable, such as transfer agent fees, pricing and bookkeeping fees, fund-paid 12b-1 fees, and custodial, legal, and audit fees. The Board also noted the effects of any waivers and reimbursements on fees and expenses. As part of its review, the Board also considered the current and historical total expense ratios of each class of the fund compared to competitive fund median expenses. Each class of the fund is compared to those funds and classes in the Total Mapped Group (used by the Board for management fee comparisons) that have a similar sales load structure.
Annual Report
Board Approval of Investment Advisory Contracts and
Management Fees - continued
The Board noted that the total expense ratio of each class ranked below its competitive median for 2010. The Board considered that various factors, including 12b-1 fees, positive or negative performance adjustments, and relatively higher other expenses in the case of small fund size, can affect total expense ratios.
Fees Charged to Other Fidelity Clients. The Board also considered Fidelity fee structures and other information with respect to clients of FMR and its affiliates, such as other mutual funds advised or subadvised by FMR or its affiliates, pension plan clients, and other institutional clients. In March 2010, the Board created an ad hoc joint committee with the board of other Fidelity funds (the Committee) to review and compare Fidelity's institutional investment advisory business with its business of providing services to the Fidelity funds, including the differences in services provided, fees charged, and costs incurred, as well as competition in their respective marketplaces.
Based on its review of total expense ratios and fees charged to other Fidelity clients, the Board concluded that the total expense ratio of each class of the fund was reasonable in light of the services that the fund and its shareholders receive and the other factors considered, including the findings of the Committee.
Costs of the Services and Profitability. The Board considered the revenues earned and the expenses incurred by Fidelity in conducting the business of developing, marketing, distributing, managing, administering and servicing the fund and its shareholders. The Board also considered the level of Fidelity's profits in respect of all the Fidelity funds.
On an annual basis, FMR presents to the Board Fidelity's profitability for the fund. Fidelity calculates the profitability for each fund, as well as aggregate profitability for groups of Fidelity funds and all Fidelity funds, using a series of detailed revenue and cost allocation methodologies which originate with the books and records of Fidelity on which Fidelity's audited financial statements are based. The Audit Committee of the Board reviews any significant changes from the prior year's methodologies.
PricewaterhouseCoopers LLP (PwC), independent registered public accounting firm and auditor to Fidelity and certain Fidelity funds, has been engaged annually by the Board as part of the Board's assessment of Fidelity's profitability analysis. PwC's engagement includes the review and assessment of Fidelity's methodologies used in determining the revenues and expenses attributable to Fidelity's mutual fund business, and completion of agreed-upon procedures surrounding the mathematical accuracy of fund profitability and its conformity to allocation methodologies. After considering PwC's reports issued under the engagement and information provided by Fidelity, the Board concluded that while other allocation methods may also be reasonable, Fidelity's profitability methodologies are reasonable in all material respects.
Annual Report
The Board also reviewed Fidelity's non-fund businesses and fall-out benefits related to the mutual fund business as well as cases where Fidelity's affiliates may benefit from or be related to the fund's business.
The Board considered the costs of the services provided by and the profits realized by Fidelity in connection with the operation of the fund and was satisfied that the profitability was not excessive in the circumstances.
Economies of Scale. The Board considered whether there have been economies of scale in respect of the management of the Fidelity funds, whether the Fidelity funds (including the fund) have appropriately benefited from any such economies of scale, and whether there is potential for realization of any further economies of scale. The Board considered the extent to which the fund will benefit from economies of scale through increased services to the fund, through waivers or reimbursements, or through fee or expense reductions. The Board also noted that in 2009, it and the board of other Fidelity funds created an ad hoc committee (the Economies of Scale Committee) to analyze whether FMR attains economies of scale in respect of the management and servicing of the Fidelity funds, whether the Fidelity funds have appropriately benefited from such economies of scale, and whether there is potential for realization of any further economies of scale.
The Board recognized that the fund's management contract incorporates a "group fee" structure, which provides for lower group fee rates as total fund assets under FMR's management increase, and for higher group fee rates as total fund assets under FMR's management decrease. FMR calculates the group fee rates based on a tiered asset "breakpoint" schedule that varies based on asset class. The Board considered that the group fee is designed to deliver the benefits of economies of scale to fund shareholders when total Fidelity fund assets increase, even if assets of any particular fund are unchanged or have declined, because some portion of Fidelity's costs are attributable to services provided to all Fidelity funds, and all funds benefit if those costs can be allocated among more assets. The Board concluded that, given the group fee structure, fund shareholders will benefit from lower management fees as assets under FMR's management increase at the fund complex level, regardless of whether Fidelity achieves any such economies of scale.
The Board concluded, taking into account the analysis of the Economies of Scale Committee, that any potential economies of scale are being appropriately shared between fund shareholders and Fidelity.
Additional Information Requested by the Board. In order to develop fully the factual basis for consideration of the Fidelity funds' Advisory Contracts, the Board requested and received additional information on certain topics, including (i) fund performance trends, actions to be taken by FMR to improve certain funds' overall performance, and Fidelity's long-term strategies for certain funds; (ii) portfolio manager changes that have occurred during the past year and length of portfolio manager tenure for different categories of funds over time; (iii) Fidelity's compensation structure for portfolio managers and other key personnel and strategies for attracting and retaining non-investment personnel; (iv) the amount of the investment that each portfolio manager has made in the Fidelity fund(s) that he or she manages; (v) historical trends in Fidelity's realization of fall-out benefits; (vi) Fidelity's group fee structures and the rationale for the individual fee rates of certain funds; (vii) fund profitability methodology and the impact of certain factors on fund profitability results; (viii) trends regarding industry use of performance fee structures and Fidelity's compliance practices with respect to performance adjustment calculations; (ix) the fee structures in place for certain other Fidelity clients; and (x) explanations regarding the relative total expense ratios of certain funds and classes, total expense competitive trends, and actions that might be taken by FMR to reduce total expense ratios for certain funds and classes.
Annual Report
Board Approval of Investment Advisory Contracts and
Management Fees - continued
Based on its evaluation of all of the conclusions noted above, and after considering all factors it believed relevant, the Board ultimately concluded that the advisory fee structures are fair and reasonable, and that the fund's Advisory Contracts should be renewed.
Annual Report
Investment Adviser
Fidelity Management & Research Company
Boston, MA
Investment Sub-Advisers
FMR Co., Inc.
Fidelity Management & Research
(U.K.) Inc.
FIL Investment Advisors
FIL Investment Advisors (U.K.) Limited
FIL Investments (Japan) Limited
Fidelity Management & Research (Hong Kong) Limited
Fidelity Management & Research (Japan), Inc.
General Distributor
Fidelity Distributors Corporation
Boston, MA
Transfer and Service Agents
Fidelity Investments Institutional Operations Company, Inc.
Boston, MA
Fidelity Service Company, Inc.
Boston, MA
Custodian
Brown Brothers Harriman & Co.
Boston, MA
AEAI-UANN-1211
1.784738.108
(Fidelity Investment logo)(registered trademark)
Fidelity Advisor®
Emerging Markets
Fund - Class A, Class T, Class B
and Class C
Annual Report
October 31, 2011
Contents
Chairman's Message | (Click Here) | The Chairman's message to shareholders. |
Performance | (Click Here) | How the fund has done over time. |
Management's Discussion of Fund Performance | (Click Here) | The Portfolio Manager's review of fund performance and strategy. |
Shareholder Expense Example | (Click Here) | An example of shareholder expenses. |
Investment Changes | (Click Here) | A summary of major shifts in the fund's investments over the past six months. |
Investments | (Click Here) | A complete list of the fund's investments with their market values. |
Financial Statements | (Click Here) | Statements of assets and liabilities, operations, and changes in net assets, as well as financial highlights. |
Notes | (Click Here) | Notes to the financial statements. |
Report of Independent Registered Public Accounting Firm | (Click Here) | |
Trustees and Officers | (Click Here) | |
Distributions | (Click Here) | |
Board Approval of Investment Advisory Contracts and Management Fees | (Click Here) | |
To view a fund's proxy voting guidelines and proxy voting record for the 12-month period ended June 30, visit http://www.fidelity.com/proxyvotingresults or visit the Securities and Exchange Commission's (SEC) web site at http://www.sec.gov. You may also call 1-877-208-0098 to request a free copy of the proxy voting guidelines.
Standard & Poor's, S&P and S&P 500 are registered service marks of The McGraw-Hill Companies, Inc. and have been licensed for use by Fidelity Distributors Corporation.
Other third party marks appearing herein are the property of their respective owners.
All other marks appearing herein are registered or unregistered trademarks or service marks of FMR LLC or an affiliated company.
Annual Report
This report and the financial statements contained herein are submitted for the general information of the shareholders of the fund. This report is not authorized for distribution to prospective investors in the fund unless preceded or accompanied by an effective prospectus.
A fund files its complete schedule of portfolio holdings with the SEC for the first and third quarters of each fiscal year on Form N-Q. Forms N-Q are available on the SEC's web site at http://www.sec.gov. A fund's Forms N-Q may be reviewed and copied at the SEC's Public Reference Room in Washington, DC. Information regarding the operation of the SEC's Public Reference Room may be obtained by calling 1-800-SEC-0330. For a complete list of a fund's portfolio holdings, view the most recent holdings listing, semiannual report, or annual report on Fidelity's web site at http://www.fidelity.com, http://advisor.fidelity.com, or http://www.401k.com, as applicable.
NOT FDIC INSURED • MAY LOSE VALUE • NO BANK GUARANTEE
Neither the fund nor Fidelity Distributors Corporation is a bank.
Annual Report
(photo_of_James_C_Curvey)
Dear Shareholder:
Global equity markets began the fourth quarter on a strong note, sharply reversing course in October amid strong corporate earnings, better-than-expected economic news and the promise of a resolution to the sovereign debt crisis in Europe. The mini rally followed a third quarter marked by a significant downturn in July and August, which heightened investor anxiety and set off a wave of volatility that hampered most major asset classes through the end of September. Financial markets are difficult to predict, of course, but you can help put the odds in your favor by following these time-tested investment principles.
One of the basic tenets is to invest according to your time horizon. For long-term investors, riding out the markets' inevitable ups and downs has proven much more effective than making decisions based on short-term developments. If your goal is approaching, you can also benefit from patience and restraint, rather than attempting to time the market. No matter your time horizon, missing only a few of the markets' best days can significantly diminish returns. Patience also affords the benefits of compounding - earning interest on additional income or reinvested dividends and capital gains. While staying the course doesn't eliminate risk, it can considerably lessen the negative impact of short-term downturns.
Asset allocation is another principle to manage risk. As you spread your portfolio among the asset classes, be sure to consider your time horizon, risk tolerance and investment objectives. Younger investors may be better served by emphasizing equities, which historically have been the best-performing asset class over time. Investors who are nearing a specific goal, such as retirement or sending a child to college, may choose to favor bonds and other investments that have tended to be more stable. Studies indicate that asset allocation is the single most important determinant of a portfolio's long-term success. After deciding on a suitable allocation strategy, make sure your portfolio is adequately diversified, with exposure to stocks of small-, mid- and large-cap companies in a range of sectors, for example. And today, more than ever, geographic diversification should be taken into account.
Lastly, investing a certain amount of money on a regular basis - a principle known as dollar-cost averaging - can help lower the average cost of your purchases, while also giving you the discipline to avoid selling weak performers just prior to an upswing, or chasing a hot performer just before a correction.
We invite you to learn more by visiting us on the Internet, dropping by one of our Investor Centers or calling us by phone. It is our privilege to provide the resources you need to choose investments that are right for you.
Sincerely,
(The acting chairman's signature appears here.)
James C. Curvey
Acting Chairman
Annual Report
Average annual total return reflects the change in the value of an investment, assuming reinvestment of the class' distributions from dividend income and capital gains (the profits earned upon the sale of securities that have grown in value, if any) and assuming a constant rate of performance each year. The $10,000 table and the fund's returns do not reflect the deduction of taxes that a shareholder would pay on fund distributions or the redemption of fund shares. During periods of reimbursement by Fidelity, a fund's total return will be greater than it would be had the reimbursement not occurred. How a fund did yesterday is no guarantee of how it will do tomorrow. Returns reflect the conversion of Class B shares into Class A shares after a maximum of seven years.
Average Annual Total Returns
Periods ended October 31, 2011 | Past 1
year | Past 5
years | Life of
fund A |
Class A (incl. 5.75% sales charge) | -17.71% | 1.31% | 10.02% |
Class T (incl. 3.50% sales charge) | -15.93% | 1.55% | 10.08% |
Class B (incl. contingent deferred sales charge) B | -17.66% | 1.39% | 10.11% |
Class C (incl. contingent deferred sales charge) C | -14.20% | 1.77% | 10.06% |
A From March 29, 2004.
B Class B shares' contingent deferred sales charges included in the past one year, past five years, and life of fund total return figures are 5%, 2%, and 0%, respectively.
C Class C shares' contingent deferred sales charge included in the past one year, past five years, and life of fund total return figures are 1%, 0%, and 0%, respectively.
Annual Report
$10,000 Over Life of Fund
Let's say hypothetically that $10,000 was invested in Fidelity Advisor® Emerging Markets Fund - Class A on March 29, 2004, when the fund started, and the current 5.75% sales charge was paid. The chart shows how the value of your investment would have changed, and also shows how the MSCI® Emerging Markets Index performed over the same period.
Annual Report
Market Recap: Emerging-markets stocks concluded the 12-month period ending October 31, 2011, on a strong note, reversing direction in October amid hope for a resolution to the sovereign debt crisis in Europe. The brief rally, on top of a robust first half of the period, could only partially offset the negative impact of a five-month downturn that began in May and intensified in August and September, as investors began to flee riskier securities due to the debt debacle, concern the U.S. economy may contract and worry about a significant slowdown in China. For the year, the MSCI® Emerging Markets Index declined 7.44%, hampered in part by global currency fluctuation. The index gained roughly 13% in October, after falling 9% in August and about 15% in September. For the full year, returns across the individual country components of the emerging-markets index were decidedly negative. Several of the largest countries in the index struggled, especially India (-20%), China (-17%) and Brazil (-12%), as did Turkey (-34%). Conversely, South Korea had the strongest result, gaining about 7%, while another sizable index component, Russia, returned roughly 1%. Smaller constituents Indonesia (+5%) and Malaysia (+4%) also finished in positive territory. A trio of countries had negative returns but outpaced the index: Mexico (-1%), Taiwan (-2%) and South Africa (-3%).
Comments from Robert von Rekowsky, Portfolio Manager of Fidelity Advisor® Emerging Markets Fund: During the year, the fund's Class A, Class T, Class B and Class C shares returned -12.69%, -12.89%, -13.33%, and -13.33%, respectively (excluding sales charges), well behind the MSCI index. Relative performance was hurt the most by stock selection in energy, consumer staples and financials, followed by positioning in industrials and information technology. Geographically, security selection in China, India and South Africa weighed on the fund's results. Untimely ownership of wireless carrier and benchmark component China Mobile made it the fund's largest individual detractor. Similarly, underweighting Russian energy firm Gazprom when its stock was advancing early in the period dampened performance. Other key detractors were pork producer China Yurun Food Group - which I sold - and Turkish bank Turkiye Garanti Bankasi. Conversely, my picks in materials and positioning in the automobiles/components segment of consumer discretionary added value. Geographically, stock picking in Brazil and South Korea helped. Russian natural gas producer NOVATEK acquired additional acreage and added new customers, which bolstered its stock. Performance also benefited from Thai wireless carrier Advanced Info Service, as well as Korean automakers Kia Motors and Hyundai Motor.
Annual Report
The views expressed above reflect those of the portfolio manager(s) only through the end of the period as stated on the cover of this report and do not necessarily represent the views of Fidelity or any other person in the Fidelity organization. Any such views are subject to change at any time based upon market or other conditions and Fidelity disclaims any responsibility to update such views. These views may not be relied on as investment advice and, because investment decisions for a Fidelity fund are based on numerous factors, may not be relied on as an indication of trading intent on behalf of any Fidelity fund.
Annual Report
Shareholder Expense Example
As a shareholder of the Fund, you incur two types of costs: (1) transaction costs, including sales charges (loads) on purchase payments or redemption proceeds, redemption fees, and (2) ongoing costs, including management fees, distribution and/or service (12b-1) fees and other Fund expenses. This Example is intended to help you understand your ongoing costs (in dollars) of investing in the Fund and to compare these costs with the ongoing costs of investing in other mutual funds.
The Example is based on an investment of $1,000 invested at the beginning of the period and held for the entire period (May 1, 2011 to October 31, 2011).
Actual Expenses
The first line of the accompanying table for each class of the Fund provides information about actual account values and actual expenses. You may use the information in this line, together with the amount you invested, to estimate the expenses that you paid over the period. Simply divide your account value by $1,000.00 (for example, an $8,600 account value divided by $1,000.00 = 8.6), then multiply the result by the number in the first line for a class of the Fund under the heading entitled "Expenses Paid During Period" to estimate the expenses you paid on your account during this period. In addition, the Fund, as a shareholder in the underlying Fidelity Central Funds, will indirectly bear its pro-rata share of the fees and expenses incurred by the underlying Fidelity Central Funds. These fees and expenses are not included in the Fund's annualized expense ratio used to calculate the expense estimate in the table below.
Hypothetical Example for Comparison Purposes
The second line of the accompanying table for each class of the Fund provides information about hypothetical account values and hypothetical expenses based on a Class' actual expense ratio and an assumed rate of return of 5% per year before expenses, which is not the Class' actual return. The hypothetical account values and expenses may not be used to estimate the actual ending account balance or expenses you paid for the period. You may use this information to compare the ongoing costs of investing in the Fund and other funds. To do so, compare this 5% hypothetical example with the 5% hypothetical examples that appear in the shareholder reports of the other funds. In addition, the Fund, as a shareholder in the underlying Fidelity Central Funds, will indirectly bear its pro-rata share of the fees and expenses incurred by the underlying Fidelity Central Funds. These fees and expenses are not included in the Fund's annualized expense ratio used to calculate the expense estimate in the table below.
Please note that the expenses shown in the table are meant to highlight your ongoing costs only and do not reflect any transaction costs. Therefore, the second line of the table is useful in comparing ongoing costs only, and will not help you determine the relative total costs of owning different funds. In addition, if these transactional costs were included, your costs would have been higher.
Annual Report
| Annualized
Expense Ratio | Beginning
Account Value
May 1, 2011 | Ending
Account Value
October 31, 2011 | Expenses Paid
During Period*
May 1, 2011 to
October 31, 2011 |
Class A | 1.51% | | | |
Actual | | $ 1,000.00 | $ 796.70 | $ 6.84 |
HypotheticalA | | $ 1,000.00 | $ 1,017.59 | $ 7.68 |
Class T | 1.76% | | | |
Actual | | $ 1,000.00 | $ 795.90 | $ 7.97 |
HypotheticalA | | $ 1,000.00 | $ 1,016.33 | $ 8.94 |
Class B | 2.26% | | | |
Actual | | $ 1,000.00 | $ 793.90 | $ 10.22 |
HypotheticalA | | $ 1,000.00 | $ 1,013.81 | $ 11.47 |
Class C | 2.26% | | | |
Actual | | $ 1,000.00 | $ 794.00 | $ 10.22 |
HypotheticalA | | $ 1,000.00 | $ 1,013.81 | $ 11.47 |
Institutional Class | 1.18% | | | |
Actual | | $ 1,000.00 | $ 798.10 | $ 5.35 |
HypotheticalA | | $ 1,000.00 | $ 1,019.26 | $ 6.01 |
A 5% return per year before expenses
* Expenses are equal to each Class' annualized expense ratio, multiplied by the average account value over the period, multiplied by 184/365 (to reflect the one-half year period).
Annual Report
Investment Changes (Unaudited)
Top Five Stocks as of October 31, 2011 |
| % of fund's
net assets | % of fund's net assets
6 months ago |
Samsung Electronics Co. Ltd. (Korea (South), Semiconductors & Semiconductor Equipment) | 4.3 | 2.5 |
Petroleo Brasileiro SA - Petrobras (PN) (Brazil, Oil, Gas & Consumable Fuels) | 2.4 | 2.1 |
China Mobile (Hong Kong) Ltd. (Hong Kong, Wireless Telecommunication Services) | 2.4 | 0.0 |
Hyundai Motor Co. (Korea (South), Automobiles) | 2.2 | 1.7 |
Banco Bradesco SA (PN) sponsored ADR (Brazil, Commercial Banks) | 2.1 | 1.5 |
| 13.4 | |
Top Five Market Sectors as of October 31, 2011 |
| % of fund's
net assets | % of fund's net assets
6 months ago |
Financials | 23.6 | 24.1 |
Energy | 14.2 | 15.2 |
Information Technology | 11.4 | 13.4 |
Materials | 11.1 | 16.2 |
Consumer Discretionary | 10.7 | 8.3 |
Top Five Countries as of October 31, 2011 |
(excluding cash equivalents) | % of fund's
net assets | % of fund's net assets
6 months ago |
Korea (South) | 20.2 | 16.7 |
Brazil | 15.1 | 14.4 |
China | 8.5 | 8.7 |
Taiwan | 6.7 | 10.6 |
Russia | 5.8 | 8.9 |
Percentages are adjusted for the effect of open futures contracts, if applicable. |
Asset Allocation (% of fund's net assets) |
As of October 31, 2011 | As of April 30, 2011 |
| Stocks 98.2% | | | Stocks 97.9% | |
| Short-Term
Investments and
Net Other Assets 1.8% | | | Short-Term
Investments and
Net Other Assets 2.1% | |

Annual Report
Investments October 31, 2011
Showing Percentage of Net Assets
Common Stocks - 98.2% |
| Shares | | Value |
Bailiwick of Jersey - 0.7% |
Randgold Resources Ltd. sponsored ADR | 35,600 | | $ 3,900,692 |
Bermuda - 1.5% |
Cheung Kong Infrastructure Holdings Ltd. | 512,000 | | 2,742,639 |
CNPC (Hong Kong) Ltd. | 1,758,000 | | 2,462,576 |
Great Eagle Holdings Ltd. | 553,062 | | 1,228,314 |
NWS Holdings Ltd. | 906,000 | | 1,373,835 |
TOTAL BERMUDA | | 7,807,364 |
Brazil - 15.1% |
Banco Bradesco SA (PN) sponsored ADR | 596,890 | | 10,863,398 |
Banco do Estado do Rio Grande do Sul SA | 295,100 | | 3,110,476 |
BR Malls Participacoes SA | 276,000 | | 2,981,481 |
Companhia de Bebidas das Americas (AmBev) (PN) sponsored ADR | 186,705 | | 6,295,693 |
Companhia de Saneamento Basico do Estado de Sao Paulo (SABESP) | 132,100 | | 3,623,288 |
Companhia de Saneamento de Minas Gerais | 44,200 | | 829,844 |
Eletropaulo Metropolitana SA (PN-B) | 169,600 | | 3,041,975 |
Embraer SA sponsored ADR | 79,900 | | 2,222,818 |
Gol Linhas Aereas Inteligentes SA sponsored ADR (d) | 291,000 | | 2,333,820 |
Klabin SA (PN) (non-vtg.) | 142,600 | | 524,826 |
Localiza Rent A Car SA | 60,100 | | 908,220 |
Marcopolo SA (PN) | 244,700 | | 1,082,996 |
Mills Estruturas e Servicos de Engenharia SA | 62,600 | | 625,198 |
Multiplus SA | 97,024 | | 1,638,537 |
OGX Petroleo e Gas Participacoes SA (a) | 627,700 | | 5,190,624 |
Petroleo Brasileiro SA - Petrobras: | | | |
(PN) (non-vtg.) | 113,200 | | 1,405,441 |
(PN) sponsored ADR (d) | 432,510 | | 10,938,178 |
Qualicorp SA | 99,000 | | 905,136 |
Tegma Gestao Logistica | 149,700 | | 1,944,043 |
Telefonica Brasil SA sponsored ADR (a) | 80,300 | | 2,330,306 |
TIM Participacoes SA sponsored ADR | 190,436 | | 4,958,953 |
Ultrapar Participacoes SA | 158,100 | | 2,817,296 |
Vale SA (PN-A) sponsored ADR (d) | 319,700 | | 7,544,920 |
TOTAL BRAZIL | | 78,117,467 |
British Virgin Islands - 0.5% |
Mail.ru Group Ltd.: | | | |
GDR (a)(e) | 64,300 | | 2,215,135 |
GDR (Reg. S) | 5,900 | | 203,255 |
TOTAL BRITISH VIRGIN ISLANDS | | 2,418,390 |
Common Stocks - continued |
| Shares | | Value |
Canada - 1.7% |
Eldorado Gold Corp. | 200,285 | | $ 3,763,192 |
First Quantum Minerals Ltd. | 136,900 | | 2,871,625 |
Petrominerales Ltd. | 79,100 | | 2,086,904 |
TOTAL CANADA | | 8,721,721 |
Cayman Islands - 3.5% |
Belle International Holdings Ltd. | 988,000 | | 1,937,692 |
Central China Real Estate Ltd. | 2,170,836 | | 490,203 |
China Shangshui Cement Group Ltd. | 3,733,000 | | 2,859,389 |
Country Garden Holdings Co. Ltd. | 5,313,000 | | 2,103,617 |
Eurasia Drilling Co. Ltd. GDR (Reg. S) | 121,463 | | 2,866,527 |
EVA Precision Industrial Holdings Ltd. | 5,466,000 | | 1,411,601 |
Haitian International Holdings Ltd. | 1,095,000 | | 972,902 |
Shenguan Holdings Group Ltd. | 3,050,000 | | 1,638,629 |
Silver Base Group Holdings Ltd. | 1,500,000 | | 1,597,484 |
SOHO China Ltd. | 2,795,000 | | 1,992,747 |
TOTAL CAYMAN ISLANDS | | 17,870,791 |
Chile - 1.0% |
CFR Pharmaceuticals SA | 9,020,934 | | 2,135,786 |
Empresa Nacional de Telecomunicaciones SA (ENTEL) | 157,908 | | 3,126,254 |
TOTAL CHILE | | 5,262,040 |
China - 8.5% |
Baidu.com, Inc. sponsored ADR (a) | 19,515 | | 2,735,613 |
China Communications Construction Co. Ltd. (H Shares) | 3,568,000 | | 2,691,187 |
China Communications Services Corp. Ltd. (H Shares) | 4,928,000 | | 2,272,725 |
China Construction Bank Corp. (H Shares) | 10,290,000 | | 7,560,426 |
China Minsheng Banking Corp. Ltd. (H Shares) | 5,230,000 | | 4,260,457 |
China National Building Materials Co. Ltd. (H Shares) | 1,652,000 | | 2,116,056 |
China Pacific Insurance Group Co. Ltd. (H Shares) | 485,400 | | 1,489,542 |
China Petroleum & Chemical Corp.: | | | |
(H Shares) | 3,208,000 | | 3,033,903 |
sponsored ADR (H Shares) (d) | 21,600 | | 2,039,040 |
China Southern Airlines Ltd. (H Shares) (a) | 3,808,000 | | 2,125,094 |
Great Wall Motor Co. Ltd. (H Shares) | 1,607,500 | | 2,182,844 |
Harbin Power Equipment Co. Ltd. (H Shares) | 2,662,000 | | 2,682,598 |
Industrial & Commercial Bank of China Ltd. (H Shares) | 5,047,035 | | 3,151,688 |
SINA Corp. (a)(d) | 16,778 | | 1,363,884 |
Sinopec Shanghai Petrochemical Co. Ltd. (H Shares) | 3,946,000 | | 1,448,771 |
Yantai Changyu Pioneer Wine Co. (B Shares) | 227,939 | | 2,564,539 |
TOTAL CHINA | | 43,718,367 |
Common Stocks - continued |
| Shares | | Value |
Czech Republic - 1.7% |
Ceske Energeticke Zavody AS | 115,000 | | $ 4,863,391 |
Komercni Banka AS | 11,405 | | 2,199,640 |
Philip Morris CR A/S | 2,291 | | 1,504,301 |
TOTAL CZECH REPUBLIC | | 8,567,332 |
Egypt - 0.5% |
Commercial International Bank Ltd. sponsored GDR | 559,378 | | 2,471,332 |
Georgia - 0.2% |
Bank of Georgia GDR (Reg. S) | 70,400 | | 897,600 |
Hong Kong - 5.6% |
China Insurance International Holdings Co. Ltd. (a) | 1,157,800 | | 2,510,759 |
China Mobile (Hong Kong) Ltd. | 1,289,500 | | 12,255,849 |
China Power International Development Ltd. | 11,110,000 | | 2,350,869 |
CNOOC Ltd. | 4,280,000 | | 8,090,740 |
CNOOC Ltd. sponsored ADR | 10,100 | | 1,904,961 |
Dah Chong Hong Holdings Ltd. | 893,000 | | 1,084,491 |
Lenovo Group Ltd. | 912,000 | | 613,142 |
TOTAL HONG KONG | | 28,810,811 |
Hungary - 0.1% |
Magyar Telekom PLC | 209,500 | | 487,552 |
India - 4.2% |
Bank of Baroda | 208,283 | | 3,284,122 |
Bharti Airtel Ltd. | 406,724 | | 3,257,339 |
Housing Development Finance Corp. Ltd. | 375,185 | | 5,279,914 |
Indian Overseas Bank | 787,322 | | 1,649,998 |
Jain Irrigation Systems Ltd. | 59,911 | | 152,656 |
Punjab National Bank | 51,156 | | 1,042,125 |
Tata Consultancy Services Ltd. | 173,499 | | 3,946,720 |
Tata Steel Ltd. | 115,844 | | 1,140,764 |
Ultratech Cement Ltd. | 81,637 | | 1,927,525 |
TOTAL INDIA | | 21,681,163 |
Indonesia - 5.3% |
PT Astra International Tbk | 763,500 | | 5,887,159 |
PT Bank Negara Indonesia (Persero) Tbk | 5,202,000 | | 2,331,338 |
PT Bank Rakyat Indonesia Tbk | 8,428,500 | | 6,336,941 |
PT Bank Tabungan Negara Tbk | 7,825,500 | | 1,259,673 |
PT Bumi Serpong Damai Tbk | 11,588,100 | | 1,192,446 |
PT Ciputra Development Tbk | 14,439,000 | | 791,675 |
PT Gadjah Tunggal Tbk | 2,713,500 | | 829,783 |
PT Indofood Sukses Makmur Tbk | 4,061,000 | | 2,410,607 |
Common Stocks - continued |
| Shares | | Value |
Indonesia - continued |
PT Indosat Tbk | 3,834,000 | | $ 2,296,282 |
PT Summarecon Agung Tbk | 4,801,000 | | 628,283 |
PT Tower Bersama Infrastructure Tbk | 5,965,000 | | 1,388,255 |
PT XL Axiata Tbk | 3,921,000 | | 2,192,975 |
TOTAL INDONESIA | | 27,545,417 |
Israel - 0.4% |
Check Point Software Technologies Ltd. (a) | 40,400 | | 2,328,252 |
Kazakhstan - 0.5% |
KazMunaiGas Exploration & Production JSC (Reg. S) GDR | 153,077 | | 2,599,247 |
Korea (South) - 20.2% |
BS Financial Group, Inc. (a) | 210,130 | | 2,304,070 |
Cheil Worldwide, Inc. | 121,220 | | 1,977,459 |
CJ CheilJedang Corp. | 2,806 | | 771,471 |
CJ Corp. | 43,637 | | 3,114,675 |
Daum Communications Corp. | 12,149 | | 1,466,415 |
Doosan Co. Ltd. | 24,160 | | 3,043,618 |
GS Holdings Corp. | 55,755 | | 3,199,602 |
Hana Financial Group, Inc. | 132,830 | | 4,727,436 |
Hankook Tire Co. Ltd. | 43,210 | | 1,718,256 |
Hyundai Department Store Co. Ltd. | 22,660 | | 3,236,772 |
Hyundai Fire & Marine Insurance Co. Ltd. | 54,490 | | 1,571,917 |
Hyundai Heavy Industries Co. Ltd. | 17,618 | | 4,689,336 |
Hyundai Hysco Co. Ltd. | 52,900 | | 2,040,089 |
Hyundai Mobis | 18,065 | | 5,150,761 |
Hyundai Motor Co. | 55,432 | | 11,121,721 |
Industrial Bank of Korea | 304,090 | | 3,977,292 |
Kia Motors Corp. | 79,490 | | 5,077,242 |
Korea Zinc Co. Ltd. | 5,268 | | 1,538,334 |
KT&G Corp. | 83,609 | | 5,210,736 |
LG Chemical Ltd. | 7 | | 2,250 |
LIG Non-Life Insurance Co. Ltd. | 59,440 | | 1,260,591 |
Lotte Samkang Co. Ltd. | 1,974 | | 588,383 |
Nong Shim Co. Ltd. | 11,079 | | 2,162,906 |
Paradise Co. Ltd. | 260,483 | | 1,823,893 |
Samsung Card Co. Ltd. | 59,651 | | 2,226,967 |
Samsung Electronics Co. Ltd. | 26,052 | | 22,343,496 |
Shinhan Financial Group Co. Ltd. | 154,002 | | 6,112,112 |
SK Chemicals Co. Ltd. | 30,120 | | 1,919,741 |
TOTAL KOREA (SOUTH) | | 104,377,541 |
Common Stocks - continued |
| Shares | | Value |
Luxembourg - 0.7% |
Millicom International Cellular SA (depositary receipt) | 32,960 | | $ 3,632,422 |
Malaysia - 0.7% |
Axiata Group Bhd | 2,258,100 | | 3,569,053 |
Mauritius - 0.0% |
Golden Agri-Resources Ltd. | 3,000 | | 1,535 |
Mexico - 0.3% |
Embotelladoras Arca SAB de CC | 351,800 | | 1,669,182 |
Netherlands - 0.2% |
Yandex NV | 39,700 | | 1,092,544 |
Nigeria - 0.4% |
Guaranty Trust Bank PLC GDR (Reg. S) | 422,095 | | 1,941,637 |
Panama - 0.5% |
Copa Holdings SA Class A | 37,828 | | 2,612,780 |
Peru - 0.7% |
Compania de Minas Buenaventura SA sponsored ADR | 94,898 | | 3,884,175 |
Philippines - 0.2% |
Globe Telecom, Inc. | 46,070 | | 982,236 |
Poland - 0.7% |
Polska Grupa Energetyczna SA | 301,400 | | 1,857,452 |
TVN SA | 401,443 | | 1,606,832 |
TOTAL POLAND | | 3,464,284 |
Qatar - 0.1% |
Commercial Bank of Qatar GDR (Reg. S) | 68,433 | | 313,857 |
Russia - 5.8% |
Cherkizovo Group OJSC GDR (a) | 71,794 | | 1,001,269 |
Gazprom OAO sponsored ADR | 285,368 | | 3,313,122 |
Lukoil Oil Co. sponsored ADR | 99,715 | | 5,753,556 |
Mostotrest OAO (a) | 97,100 | | 558,156 |
NOVATEK OAO GDR | 54,698 | | 7,679,599 |
Rosneft Oil Co. OJSC GDR (Reg. S) | 184,400 | | 1,312,006 |
Sberbank of Russia (f) | 2,331,200 | | 6,325,780 |
TNK-BP Holding | 108,300 | | 296,311 |
Uralkali JSC GDR (Reg. S) | 88,000 | | 3,819,200 |
TOTAL RUSSIA | | 30,058,999 |
Singapore - 0.2% |
Sakari Resources Ltd. | 610,000 | | 1,139,058 |
South Africa - 2.6% |
African Bank Investments Ltd. | 711,047 | | 3,085,627 |
Common Stocks - continued |
| Shares | | Value |
South Africa - continued |
Foschini Ltd. | 250,578 | | $ 3,161,786 |
Imperial Holdings Ltd. | 137,851 | | 2,040,938 |
Life Healthcare Group Holdings Ltd. | 763,100 | | 1,856,717 |
Mr Price Group Ltd. | 193,100 | | 1,858,907 |
Northam Platinum Ltd. | 344,471 | | 1,334,688 |
TOTAL SOUTH AFRICA | | 13,338,663 |
Taiwan - 6.7% |
Catcher Technology Co. Ltd. | 580,000 | | 3,231,474 |
Chroma ATE, Inc. | 593,208 | | 1,183,577 |
Formosa Chemicals & Fibre Corp. | 2,000 | | 5,788 |
Formosa Plastics Corp. | 1,488,000 | | 4,376,345 |
Hotai Motor Co. Ltd. | 63,000 | | 274,075 |
HTC Corp. | 178,202 | | 4,004,832 |
Kinsus Interconnect Technology Corp. | 434,000 | | 1,498,950 |
Leofoo Development Co. Ltd. (a) | 823,000 | | 541,690 |
President Chain Store Corp. | 457,000 | | 2,541,257 |
SIMPLO Technology Co. Ltd. | 195,500 | | 1,150,355 |
Taishin Financial Holdings Co. Ltd. | 9,405,059 | | 3,982,272 |
Taiwan Cement Corp. | 3,307,804 | | 4,131,053 |
Taiwan Semiconductor Manufacturing Co. Ltd. | 3,057,534 | | 7,450,833 |
TOTAL TAIWAN | | 34,372,501 |
Thailand - 4.3% |
Advanced Info Service PCL (For. Reg.) | 1,202,700 | | 5,052,926 |
Asian Property Development PCL (For. Reg.) | 7,877,920 | | 1,151,443 |
Bangkok Expressway PCL (For.Reg.) | 173,300 | | 91,499 |
Banpu PCL (For. Reg.) | 65,650 | | 1,332,720 |
Charoen Pokphand Foods PCL (For. Reg.) | 1,219,000 | | 1,187,146 |
Krung Thai Bank PCL (For. Reg.) | 3,163,500 | | 1,548,055 |
PTT Global Chemical PCL (For. Reg.) (a) | 202,170 | | 426,317 |
PTT PCL (For. Reg.) | 330,600 | | 3,256,862 |
Siam Cement PCL (For. Reg.) | 212,200 | | 2,544,190 |
Siam Commercial Bank PCL (For. Reg.) | 1,412,200 | | 5,342,065 |
Total Access Communication PCL (For. Reg.) | 14,600 | | 34,782 |
TOTAL THAILAND | | 21,968,005 |
Turkey - 1.5% |
Aygaz A/S | 257,580 | | 1,407,167 |
Koc Holding AS | 337,000 | | 1,204,490 |
Common Stocks - continued |
| Shares | | Value |
Turkey - continued |
Tofas Turk Otomobil Fabrikasi AS | 396,670 | | $ 1,534,411 |
Turkiye Garanti Bankasi AS | 1,025,375 | | 3,618,459 |
TOTAL TURKEY | | 7,764,527 |
United Kingdom - 0.7% |
International Personal Finance PLC | 259,640 | | 1,144,930 |
Kazakhmys PLC | 171,600 | | 2,559,595 |
TOTAL UNITED KINGDOM | | 3,704,525 |
United States of America - 0.7% |
Cognizant Technology Solutions Corp. Class A (a) | 35,900 | | 2,611,725 |
Freeport-McMoRan Copper & Gold, Inc. | 25,000 | | 1,006,500 |
TOTAL UNITED STATES OF AMERICA | | 3,618,225 |
TOTAL COMMON STOCKS (Cost $479,594,161) |
506,711,287
|
Money Market Funds - 7.0% |
| | | |
Fidelity Cash Central Fund, 0.12% (b) | 12,103,407 | | 12,103,407 |
Fidelity Securities Lending Cash Central Fund, 0.11% (b)(c) | 24,032,425 | | 24,032,425 |
TOTAL MONEY MARKET FUNDS (Cost $36,135,832) |
36,135,832
|
TOTAL INVESTMENT PORTFOLIO - 105.2% (Cost $515,729,993) | | 542,847,119 |
NET OTHER ASSETS (LIABILITIES) - (5.2)% | | (26,752,906) |
NET ASSETS - 100% | $ 516,094,213 |
Legend |
(a) Non-income producing |
(b) Affiliated fund that is available only to investment companies and other accounts managed by Fidelity Investments. The rate quoted is the annualized seven-day yield of the fund at period end. A complete unaudited listing of the fund's holdings as of its most recent quarter end is available upon request. In addition, each Fidelity Central Fund's financial statements, which are not covered by the Fund's Report of Independent Registered Public Accounting Firm, are available on the SEC's website or upon request. |
(c) Investment made with cash collateral received from securities on loan. |
(d) Security or a portion of the security is on loan at period end. |
(e) Security exempt from registration under Rule 144A of the Securities Act of 1933. These securities may be resold in transactions exempt from registration, normally to qualified institutional buyers. At the end of the period, the value of these securities amounted to $2,215,135 or 0.4% of net assets. |
(f) Security or a portion of the security purchased on a delayed delivery or when-issued basis. |
Affiliated Central Funds |
Information regarding fiscal year to date income earned by the Fund from investments in Fidelity Central Funds is as follows: |
Fund | Income earned |
Fidelity Cash Central Fund | $ 7,900 |
Fidelity Securities Lending Cash Central Fund | 208,223 |
Total | $ 216,123 |
Other Information |
The following is a summary of the inputs used, as of October 31, 2011, involving the Fund's assets and liabilities carried at fair value. The inputs or methodology used for valuing securities may not be an indication of the risk associated with investing in those securities. For more information on valuation inputs, and their aggregation into the levels used in the table below, please refer to the Security Valuation section in the accompanying Notes to Financial Statements. |
Valuation Inputs at Reporting Date: |
Description | Total | Level 1 | Level 2 | Level 3 |
Investments in Securities: | | | | |
Equities: | | | | |
Korea (South) | $ 104,377,541 | $ - | $ 104,377,541 | $ - |
Brazil | 78,117,467 | 78,117,467 | - | - |
China | 43,718,367 | 6,138,537 | 37,579,830 | - |
Taiwan | 34,372,501 | - | 34,372,501 | - |
Russia | 30,058,999 | 30,058,999 | - | - |
Hong Kong | 28,810,811 | 1,904,961 | 26,905,850 | - |
Indonesia | 27,545,417 | - | 27,545,417 | - |
Thailand | 21,968,005 | - | 21,968,005 | - |
India | 21,681,163 | - | 21,681,163 | - |
Other | 116,061,016 | 88,539,742 | 27,521,274 | - |
Money Market Funds | 36,135,832 | 36,135,832 | - | - |
Total Investments in Securities: | $ 542,847,119 | $ 240,895,538 | $ 301,951,581 | $ - |
Transfers from Level 1 to Level 2 during the period were $175,991,065. |
Income Tax Information |
At October 31, 2011, the Fund had a capital loss carryforward of approximately $70,963,758 all of which will expire in fiscal 2017. Capital loss carryforwards are only available to offset future capital gains of the Fund to the extent provided by regulations and may be limited. |
See accompanying notes which are an integral part of the financial statements.
Annual Report
Statement of Assets and Liabilities
| October 31, 2011 |
| | |
Assets | | |
Investment in securities, at value (including securities loaned of $22,529,650) - See accompanying schedule: Unaffiliated issuers (cost $479,594,161) | $ 506,711,287 | |
Fidelity Central Funds (cost $36,135,832) | 36,135,832 | |
Total Investments (cost $515,729,993) | | $ 542,847,119 |
Cash | | 59,010 |
Foreign currency held at value (cost $120,091) | | 120,327 |
Receivable for investments sold | | 9,923,111 |
Receivable for fund shares sold | | 435,050 |
Dividends receivable | | 863,941 |
Distributions receivable from Fidelity Central Funds | | 3,383 |
Prepaid expenses | | 2,245 |
Other receivables | | 150,712 |
Total assets | | 554,404,898 |
| | |
Liabilities | | |
Payable for investments purchased
Regular delivery | $ 11,512,990 | |
Delayed delivery | 544,208 | |
Payable for fund shares redeemed | 1,476,075 | |
Accrued management fee | 331,950 | |
Distribution and service plan fees payable | 150,229 | |
Other affiliated payables | 144,341 | |
Other payables and accrued expenses | 118,467 | |
Collateral on securities loaned, at value | 24,032,425 | |
Total liabilities | | 38,310,685 |
| | |
Net Assets | | $ 516,094,213 |
Net Assets consist of: | | |
Paid in capital | | $ 564,650,323 |
Undistributed net investment income | | 2,180,940 |
Accumulated undistributed net realized gain (loss) on investments and foreign currency transactions | | (77,792,055) |
Net unrealized appreciation (depreciation) on investments and assets and liabilities in foreign currencies | | 27,055,005 |
Net Assets | | $ 516,094,213 |
See accompanying notes which are an integral part of the financial statements.
Annual Report
Statement of Assets and Liabilities - continued
| October 31, 2011 |
| | |
Calculation of Maximum Offering Price Class A:
Net Asset Value and redemption price per share ($202,477,116 ÷ 9,874,684 shares) | | $ 20.50 |
| | |
Maximum offering price per share (100/94.25 of $20.50) | | $ 21.75 |
Class T:
Net Asset Value and redemption price per share ($73,146,470 ÷ 3,580,925 shares) | | $ 20.43 |
| | |
Maximum offering price per share (100/96.50 of $20.43) | | $ 21.17 |
Class B:
Net Asset Value and offering price per share ($21,303,616 ÷ 1,063,635 shares)A | | $ 20.03 |
| | |
Class C:
Net Asset Value and offering price per share ($80,855,457 ÷ 4,042,960 shares)A | | $ 20.00 |
| | |
| | |
Institutional Class:
Net Asset Value, offering price and redemption price per share ($138,311,554 ÷ 6,704,037 shares) | | $ 20.63 |
A Redemption price per share is equal to net asset value less any applicable contingent deferred sales charge.
See accompanying notes which are an integral part of the financial statements.
Annual Report
Financial Statements - continued
Statement of Operations
| Year ended October 31, 2011 |
| | |
Investment Income | | |
Dividends | | $ 17,261,482 |
Interest | | 4,047 |
Income from Fidelity Central Funds | | 216,123 |
Income before foreign taxes withheld | | 17,481,652 |
Less foreign taxes withheld | | (1,780,223) |
Total income | | 15,701,429 |
| | |
Expenses | | |
Management fee | $ 5,313,198 | |
Transfer agent fees | 1,881,504 | |
Distribution and service plan fees | 2,433,212 | |
Accounting and security lending fees | 329,547 | |
Custodian fees and expenses | 607,708 | |
Independent trustees' compensation | 3,689 | |
Registration fees | 99,322 | |
Audit | 76,331 | |
Legal | 2,750 | |
Interest | 759 | |
Miscellaneous | 6,064 | |
Total expenses before reductions | 10,754,084 | |
Expense reductions | (424,291) | 10,329,793 |
Net investment income (loss) | | 5,371,636 |
Realized and Unrealized Gain (Loss) Net realized gain (loss) on: | | |
Investment securities: | | |
Unaffiliated issuers | 52,328,302 | |
Foreign currency transactions | (1,019,132) | |
Total net realized gain (loss) | | 51,309,170 |
Change in net unrealized appreciation (depreciation) on: Investment securities (net of decrease in deferred foreign taxes of $557,002) | (134,107,578) | |
Assets and liabilities in foreign currencies | (62,766) | |
Total change in net unrealized appreciation (depreciation) | | (134,170,344) |
Net gain (loss) | | (82,861,174) |
Net increase (decrease) in net assets resulting from operations | | $ (77,489,538) |
See accompanying notes which are an integral part of the financial statements.
Annual Report
Statement of Changes in Net Assets
| Year ended
October 31,
2011 | Year ended
October 31,
2010 |
Increase (Decrease) in Net Assets | | |
Operations | | |
Net investment income (loss) | $ 5,371,636 | $ 2,925,139 |
Net realized gain (loss) | 51,309,170 | 51,525,426 |
Change in net unrealized appreciation (depreciation) | (134,170,344) | 78,533,647 |
Net increase (decrease) in net assets resulting
from operations | (77,489,538) | 132,984,212 |
Distributions to shareholders from net investment income | (3,137,543) | (1,614,133) |
Distributions to shareholders from net realized gain | (3,336,770) | (3,680,474) |
Total distributions | (6,474,313) | (5,294,607) |
Share transactions - net increase (decrease) | (114,129,705) | 64,839,760 |
Redemption fees | 141,338 | 140,252 |
Total increase (decrease) in net assets | (197,952,218) | 192,669,617 |
| | |
Net Assets | | |
Beginning of period | 714,046,431 | 521,376,814 |
End of period (including undistributed net investment income of $2,180,940 and undistributed net investment income of $2,876,119, respectively) | $ 516,094,213 | $ 714,046,431 |
See accompanying notes which are an integral part of the financial statements.
Annual Report
Financial Highlights - Class A
Years ended October 31, | 2011 | 2010 | 2009 | 2008 | 2007 |
Selected Per-Share Data | | | | | |
Net asset value, beginning of period | $ 23.71 | $ 19.20 | $ 12.59 | $ 32.75 | $ 19.22 |
Income from Investment Operations | | | | | |
Net investment income (loss) C | .21 | .12 | .10 | .24 | .09 |
Net realized and unrealized gain (loss) | (3.19) | 4.59 | 6.64 | (19.61) | 13.46 |
Total from investment operations | (2.98) | 4.71 | 6.74 | (19.37) | 13.55 |
Distributions from net investment income | (.11) | (.07) | (.14) | (.02) | (.03) |
Distributions from net realized gain | (.13) | (.13) | - | (.79) | - |
Total distributions | (.24) | (.20) | (.14) | (.81) | (.03) |
Redemption fees added to paid in capital C | .01 | - G | .01 | .02 | .01 |
Net asset value, end of period | $ 20.50 | $ 23.71 | $ 19.20 | $ 12.59 | $ 32.75 |
Total Return A, B | (12.69)% | 24.69% | 54.54% | (60.55)% | 70.63% |
Ratios to Average Net Assets D, F | | | | | |
Expenses before reductions | 1.54% | 1.56% | 1.60% | 1.59% | 1.59% |
Expenses net of fee waivers, if any | 1.54% | 1.56% | 1.60% | 1.59% | 1.59% |
Expenses net of all reductions | 1.47% | 1.50% | 1.53% | 1.53% | 1.54% |
Net investment income (loss) | .92% | .59% | .70% | .94% | .36% |
Supplemental Data | | | | | |
Net assets, end of period (000 omitted) | $ 202,477 | $ 286,970 | $ 216,187 | $ 122,911 | $ 218,836 |
Portfolio turnover rate E | 122% | 86% | 85% | 61% | 48% |
A Total returns would have been lower if certain expenses had not been reduced during the applicable periods shown.
B Total returns do not include the effect of the sales charges.
C Calculated based on average shares outstanding during the period.
D Fees and expenses of any underlying Fidelity Central Funds are not included in the Fund's expense ratio. The Fund indirectly bears its proportionate share of the expenses of any underlying Fidelity Central Funds.
E Amount does not include the portfolio activity of any underlying Fidelity Central Funds.
F Expense ratios reflect operating expenses of the class. Expenses before reductions do not reflect amounts reimbursed by the investment adviser or reductions from brokerage service arrangements or reductions from other expense offset arrangements and do not represent the amount paid by the class during periods when reimbursements or reductions occur. Expenses net of fee waivers reflect expenses after reimbursement by the investment adviser but prior to reductions from brokerage service arrangements or other expense offset arrangements. Expenses net of all reductions represent the net expenses paid by the class.
G Amount represents less than $.01 per share.
See accompanying notes which are an integral part of the financial statements.
Annual Report
Financial Highlights - Class T
Years ended October 31, | 2011 | 2010 | 2009 | 2008 | 2007 |
Selected Per-Share Data | | | | | |
Net asset value, beginning of period | $ 23.61 | $ 19.14 | $ 12.49 | $ 32.52 | $ 19.10 |
Income from Investment Operations | | | | | |
Net investment income (loss) C | .15 | .07 | .07 | .17 | .03 |
Net realized and unrealized gain (loss) | (3.18) | 4.57 | 6.64 | (19.48) | 13.38 |
Total from investment operations | (3.03) | 4.64 | 6.71 | (19.31) | 13.41 |
Distributions from net investment income | (.04) | (.04) | (.07) | - | - |
Distributions from net realized gain | (.13) | (.13) | - | (.74) | - |
Total distributions | (.16) H | (.17) | (.07) | (.74) | - |
Redemption fees added to paid in capital C | .01 | - G | .01 | .02 | .01 |
Net asset value, end of period | $ 20.43 | $ 23.61 | $ 19.14 | $ 12.49 | $ 32.52 |
Total Return A, B | (12.89)% | 24.38% | 54.17% | (60.66)% | 70.26% |
Ratios to Average Net Assets D, F | | | | | |
Expenses before reductions | 1.79% | 1.81% | 1.87% | 1.84% | 1.86% |
Expenses net of fee waivers, if any | 1.79% | 1.81% | 1.85% | 1.84% | 1.85% |
Expenses net of all reductions | 1.73% | 1.76% | 1.78% | 1.79% | 1.79% |
Net investment income (loss) | .66% | .33% | .44% | .69% | .11% |
Supplemental Data | | | | | |
Net assets, end of period (000 omitted) | $ 73,146 | $ 104,417 | $ 86,959 | $ 47,300 | $ 119,952 |
Portfolio turnover rate E | 122% | 86% | 85% | 61% | 48% |
A Total returns would have been lower if certain expenses had not been reduced during the applicable periods shown.
B Total returns do not include the effect of the sales charges.
C Calculated based on average shares outstanding during the period.
D Fees and expenses of any underlying Fidelity Central Funds are not included in the Fund's expense ratio. The Fund indirectly bears its proportionate share of the expenses of any underlying Fidelity Central Funds.
E Amount does not include the portfolio activity of any underlying Fidelity Central Funds.
F Expense ratios reflect operating expenses of the class. Expenses before reductions do not reflect amounts reimbursed by the investment adviser or reductions from brokerage service arrangements or reductions from other expense offset arrangements and do not represent the amount paid by the class during periods when reimbursements or reductions occur. Expenses net of fee waivers reflect expenses after reimbursement by the investment adviser but prior to reductions from brokerage service arrangements or other expense offset arrangements. Expenses net of all reductions represent the net expenses paid by the class.
G Amount represents less than $.01 per share.
H Total distributions of $.16 per share is comprised of distributions from net investment income of $.037 and distributions from net realized gain of $.125 per share.
See accompanying notes which are an integral part of the financial statements.
Annual Report
Financial Highlights - Class B
Years ended October 31, | 2011 | 2010 | 2009 | 2008 | 2007 |
Selected Per-Share Data | | | | | |
Net asset value, beginning of period | $ 23.14 | $ 18.80 | $ 12.26 | $ 32.03 | $ 18.91 |
Income from Investment Operations | | | | | |
Net investment income (loss) C | .04 | (.03) | (.01) | .04 | (.09) |
Net realized and unrealized gain (loss) | (3.13) | 4.49 | 6.55 | (19.13) | 13.20 |
Total from investment operations | (3.09) | 4.46 | 6.54 | (19.09) | 13.11 |
Distributions from net investment income | (.01) | - | - | - | - |
Distributions from net realized gain | (.03) | (.12) | - | (.70) | - |
Total distributions | (.03) H | (.12) | - | (.70) | - |
Redemption fees added to paid in capital C | .01 | - G | - G | .02 | .01 |
Net asset value, end of period | $ 20.03 | $ 23.14 | $ 18.80 | $ 12.26 | $ 32.03 |
Total Return A, B | (13.33)% | 23.77% | 53.34% | (60.83)% | 69.38% |
Ratios to Average Net Assets D, F | | | | | |
Expenses before reductions | 2.29% | 2.32% | 2.36% | 2.35% | 2.37% |
Expenses net of fee waivers, if any | 2.29% | 2.32% | 2.35% | 2.35% | 2.35% |
Expenses net of all reductions | 2.22% | 2.26% | 2.28% | 2.30% | 2.29% |
Net investment income (loss) | .16% | (.17)% | (.05)% | .18% | (.39)% |
Supplemental Data | | | | | |
Net assets, end of period (000 omitted) | $ 21,304 | $ 31,159 | $ 27,580 | $ 17,307 | $ 41,042 |
Portfolio turnover rate E | 122% | 86% | 85% | 61% | 48% |
A Total returns would have been lower if certain expenses had not been reduced during the applicable periods shown.
B Total returns do not include the effect of the contingent deferred sales charge.
C Calculated based on average shares outstanding during the period.
D Fees and expenses of any underlying Fidelity Central Funds are not included in the Fund's expense ratio. The Fund indirectly bears its proportionate share of the expenses of any underlying Fidelity Central Funds.
E Amount does not include the portfolio activity of any underlying Fidelity Central Funds.
F Expense ratios reflect operating expenses of the class. Expenses before reductions do not reflect amounts reimbursed by the investment adviser or reductions from brokerage service arrangements or reductions from other expense offset arrangements and do not represent the amount paid by the class during periods when reimbursements or reductions occur. Expenses net of fee waivers reflect expenses after reimbursement by the investment adviser but prior to reductions from brokerage service arrangements or other expense offset arrangements. Expenses net of all reductions represent the net expenses paid by the class.
G Amount represents less than $.01 per share.
H Total distributions of $.03 per share is comprised of distributions from net investment income of $.005 and distributions from net realized gain of $.025 per share.
See accompanying notes which are an integral part of the financial statements.
Annual Report
Financial Highlights - Class C
Years ended October 31, | 2011 | 2010 | 2009 | 2008 | 2007 |
Selected Per-Share Data | | | | | |
Net asset value, beginning of period | $ 23.13 | $ 18.80 | $ 12.26 | $ 32.04 | $ 18.91 |
Income from Investment Operations | | | | | |
Net investment income (loss) C | .04 | (.03) | (.01) | .05 | (.09) |
Net realized and unrealized gain (loss) | (3.12) | 4.49 | 6.54 | (19.15) | 13.21 |
Total from investment operations | (3.08) | 4.46 | 6.53 | (19.10) | 13.12 |
Distributions from net investment income | (.01) | - | - | - | - |
Distributions from net realized gain | (.05) | (.13) | - | (.70) | - |
Total distributions | (.06) | (.13) | - | (.70) | - |
Redemption fees added to paid in capital C | .01 | - G | .01 | .02 | .01 |
Net asset value, end of period | $ 20.00 | $ 23.13 | $ 18.80 | $ 12.26 | $ 32.04 |
Total Return A, B | (13.33)% | 23.80% | 53.34% | (60.84)% | 69.43% |
Ratios to Average Net Assets D, F | | | | | |
Expenses before reductions | 2.28% | 2.30% | 2.34% | 2.34% | 2.34% |
Expenses net of fee waivers, if any | 2.28% | 2.30% | 2.34% | 2.34% | 2.34% |
Expenses net of all reductions | 2.22% | 2.24% | 2.28% | 2.29% | 2.29% |
Net investment income (loss) | .17% | (.15)% | (.05)% | .19% | (.39)% |
Supplemental Data | | | | | |
Net assets, end of period (000 omitted) | $ 80,855 | $ 106,711 | $ 83,939 | $ 44,878 | $ 104,885 |
Portfolio turnover rate E | 122% | 86% | 85% | 61% | 48% |
A Total returns would have been lower if certain expenses had not been reduced during the applicable periods shown.
B Total returns do not include the effect of the contingent deferred sales charge.
C Calculated based on average shares outstanding during the period.
D Fees and expenses of any underlying Fidelity Central Funds are not included in the Fund's expense ratio. The Fund indirectly bears its proportionate share of the expenses of any underlying Fidelity Central Funds.
E Amount does not include the portfolio activity of any underlying Fidelity Central Funds.
F Expense ratios reflect operating expenses of the class. Expenses before reductions do not reflect amounts reimbursed by the investment adviser or reductions from brokerage service arrangements or reductions from other expense offset arrangements and do not represent the amount paid by the class during periods when reimbursements or reductions occur. Expenses net of fee waivers reflect expenses after reimbursement by the investment adviser but prior to reductions from brokerage service arrangements or other expense offset arrangements. Expenses net of all reductions represent the net expenses paid by the class.
G Amount represents less than $.01 per share.
See accompanying notes which are an integral part of the financial statements.
Annual Report
Financial Highlights - Institutional Class
Years ended October 31, | 2011 | 2010 | 2009 | 2008 | 2007 |
Selected Per-Share Data | | | | | |
Net asset value, beginning of period | $ 23.87 | $ 19.29 | $ 12.71 | $ 33.02 | $ 19.34 |
Income from Investment Operations | | | | | |
Net investment income (loss) B | .29 | .20 | .15 | .31 | .18 |
Net realized and unrealized gain (loss) | (3.21) | 4.62 | 6.65 | (19.76) | 13.55 |
Total from investment operations | (2.92) | 4.82 | 6.80 | (19.45) | 13.73 |
Distributions from net investment income | (.20) | (.11) | (.23) | (.09) | (.06) |
Distributions from net realized gain | (.13) | (.13) | - | (.79) | - |
Total distributions | (.33) | (.24) | (.23) | (.88) | (.06) |
Redemption fees added to paid in capital B | .01 | - F | .01 | .02 | .01 |
Net asset value, end of period | $ 20.63 | $ 23.87 | $ 19.29 | $ 12.71 | $ 33.02 |
Total Return A | (12.41)% | 25.15% | 54.97% | (60.42)% | 71.23% |
Ratios to Average Net Assets C, E | | | | | |
Expenses before reductions | 1.21% | 1.22% | 1.30% | 1.27% | 1.25% |
Expenses net of fee waivers, if any | 1.21% | 1.22% | 1.30% | 1.27% | 1.25% |
Expenses net of all reductions | 1.14% | 1.17% | 1.23% | 1.21% | 1.19% |
Net investment income (loss) | 1.25% | .93% | .99% | 1.26% | .71% |
Supplemental Data | | | | | |
Net assets, end of period (000 omitted) | $ 138,312 | $ 184,789 | $ 106,713 | $ 47,557 | $ 52,011 |
Portfolio turnover rate D | 122% | 86% | 85% | 61% | 48% |
A Total returns would have been lower if certain expenses had not been reduced during the applicable periods shown.
B Calculated based on average shares outstanding during the period.
C Fees and expenses of any underlying Fidelity Central Funds are not included in the Fund's expense ratio. The Fund indirectly bears its proportionate share of the expenses of any underlying Fidelity Central Funds.
D Amount does not include the portfolio activity of any underlying Fidelity Central Funds.
E Expense ratios reflect operating expenses of the class. Expenses before reductions do not reflect amounts reimbursed by the investment adviser or reductions from brokerage service arrangements or reductions from other expense offset arrangements and do not represent the amount paid by the class during periods when reimbursements or reductions occur. Expenses net of fee waivers reflect expenses after reimbursement by the investment adviser but prior to reductions from brokerage service arrangements or other expense offset arrangements. Expenses net of all reductions represent the net expenses paid by the class.
F Amount represents less than $.01 per share.
See accompanying notes which are an integral part of the financial statements.
Annual Report
Notes to Financial Statements
For the period ended October 31, 2011
1. Organization.
Fidelity Advisor Emerging Markets Fund (the Fund) is a fund of Fidelity Advisor Series VIII (the Trust) and is authorized to issue an unlimited number of shares. The Trust is registered under the Investment Company Act of 1940, as amended (the 1940 Act), as an open-end management investment company organized as a Massachusetts business trust. The Fund offers Class A, Class T, Class C and Institutional Class shares, each of which, along with Class B shares, has equal rights as to assets and voting privileges. Effective after the close of business on September 1, 2010, Class B shares were closed to new accounts and additional purchases, except for exchanges and reinvestments by existing shareholders. Each class has exclusive voting rights with respect to matters that affect that class. Class B shares will automatically convert to Class A shares after a holding period of seven years from the initial date of purchase. Investment income, realized and unrealized capital gains and losses, the common expenses of the Fund, and certain fund-level expense reductions, if any, are allocated on a pro-rata basis to each class based on the relative net assets of each class to the total net assets of the Fund. Each class differs with respect to transfer agent and distribution and service plan fees incurred. Certain expense reductions may also differ by class. The Fund's investments in emerging markets can be subject to social, economic, regulatory, and political uncertainties and can be extremely volatile.
2. Investments in Fidelity Central Funds.
The Fund invests in Fidelity Central Funds, which are open-end investment companies available only to other investment companies and accounts managed by Fidelity Management & Research Company (FMR) and its affiliates. The Fund's Schedule of Investments lists each of the Fidelity Central Funds held as of period end, if any, as an investment of the Fund, but does not include the underlying holdings of each Fidelity Central Fund. As an Investing Fund, the Fund indirectly bears its proportionate share of the expenses of the underlying Fidelity Central Funds.
The Money Market Central Funds seek preservation of capital and current income and are managed by Fidelity Investments Money Management, Inc. (FIMM), an affiliate of FMR.
A complete unaudited list of holdings for each Fidelity Central Fund is available upon request or at the Securities and Exchange Commission (the SEC) web site at www.sec.gov. In addition, the financial statements of the Fidelity Central Funds, which are not covered by the Fund's Report of Independent Registered Public Accounting Firm are available on the SEC web site or upon request.
Annual Report
3. Significant Accounting Policies.
The financial statements have been prepared in conformity with accounting principles generally accepted in the United States of America (GAAP), which require management to make certain estimates and assumptions at the date of the financial statements. Actual results could differ from those estimates. Subsequent events, if any, through the date that the financial statements were issued have been evaluated in the preparation of the financial statements. The following summarizes the significant accounting policies of the Fund:
Security Valuation. Investments are valued as of 4:00 p.m. Eastern time on the last calendar day of the period. The Fund uses independent pricing services approved by the Board of Trustees to value its investments. When current market prices or quotations are not readily available or reliable, valuations may be determined in good faith in accordance with procedures adopted by the Board of Trustees. Factors used in determining value may include market or security specific events. The frequency with which these procedures are used cannot be predicted and they may be utilized to a significant extent. The value used for net asset value (NAV) calculation under these procedures may differ from published prices for the same securities.
The Fund categorizes the inputs to valuation techniques used to value its investments into a disclosure hierarchy consisting of three levels as shown below:
Level 1 - quoted prices in active markets for identical investments
Level 2 - other significant observable inputs (including quoted prices for similar investments, interest rates, prepayment speeds, etc.)
Level 3 - unobservable inputs (including the Fund's own assumptions based on the best information available)
Changes in valuation techniques may result in transfers in or out of an assigned level within the disclosure hierarchy. The aggregate value of investments by input level, as of October 31, 2011, is included at the end of the Fund's Schedule of Investments. Valuation techniques used to value the Fund's investments by major category are as follows:
Equity securities, including restricted securities, for which market quotations are readily available, are valued at the last reported sale price or official closing price as reported by an independent pricing service on the primary market or exchange on which they are traded and are categorized as Level 1 in the hierarchy. In the event there were no sales during the day or closing prices are not available, securities are valued at the last quoted bid price or may be valued using the last available price and are generally categorized as Level 2 in the hierarchy. For foreign equity securities, when significant market or security specific events arise, comparisons to the valuation of American Depositary Receipts
Annual Report
Notes to Financial Statements - continued
3. Significant Accounting Policies - continued
Security Valuation - continued
(ADRs), futures contracts, Exchange-traded funds (ETFs) and certain indexes as well as quoted prices for similar securities are used and are categorized as Level 2 in the hierarchy in these circumstances. Utilizing these techniques may result in transfers between Level 1 and Level 2. For restricted equity securities and private placements where observable inputs are limited, assumptions about market activity and risk are used and are categorized as Level 3 in the hierarchy.
Investments in open-end mutual funds, including the Fidelity Central Funds, are valued at their closing net asset value each business day and are categorized as Level 1 in the hierarchy.
Foreign Currency. The Fund may use foreign currency contracts to facilitate transactions in foreign-denominated securities. Gains and losses from these transactions may arise from changes in the value of the foreign currency or if the counterparties do not perform under the contracts' terms.
Foreign-denominated assets, including investment securities, and liabilities are translated into U.S. dollars at the exchange rate at period end. Purchases and sales of investment securities, income and dividends received and expenses denominated in foreign currencies are translated into U.S. dollars at the exchange rate in effect on the transaction date.
The effects of exchange rate fluctuations on investments are included with the net realized and unrealized gain (loss) on investment securities. Other foreign currency transactions resulting in realized and unrealized gain (loss) are disclosed separately.
Investment Transactions and Income. For financial reporting purposes, the Fund's investment holdings and NAV include trades executed through the end of the last business day of the period. The NAV per share for processing shareholder transactions is calculated as of the close of business of the New York Stock Exchange (NYSE), normally 4:00 p.m. Eastern time and includes trades executed through the end of the prior business day. Gains and losses on securities sold are determined on the basis of identified cost. Dividend income is recorded on the ex-dividend date, except for certain dividends from foreign securities where the ex-dividend date may have passed, which are recorded as soon as the Fund is informed of the ex-dividend date. Non-cash dividends included in dividend income, if any, are recorded at the fair market value of the securities received. Distributions received on securities that represent a return of capital or capital gain are recorded as a reduction of cost of investments and/or as a realized gain. The Fund estimates the components of distributions received that may be considered return of capital distributions or capital gain distributions. Interest income and distributions from the Fidelity Central Funds are accrued as earned. Interest income includes coupon
Annual Report
3. Significant Accounting Policies - continued
Investment Transactions and Income - continued
interest and amortization of premium and accretion of discount on debt securities. Investment income is recorded net of foreign taxes withheld where recovery of such taxes is uncertain.
Expenses. Expenses directly attributable to a fund are charged to that fund. Expenses attributable to more than one fund are allocated among the respective funds on the basis of relative net assets or other appropriate methods. Expense estimates are accrued in the period to which they relate and adjustments are made when actual amounts are known.
Income Tax Information and Distributions to Shareholders. Each year, the Fund intends to qualify as a regulated investment company, including distributing substantially all of its taxable income and realized gains under Subchapter M of the Internal Revenue Code and filing its U.S. federal tax return. As a result, no provision for income taxes is required. As of October 31, 2011, the Fund did not have any unrecognized tax benefits in the financial statements. A fund's federal tax return is subject to examination by the Internal Revenue Service (IRS) for a period of three years. Foreign taxes are provided for based on the Fund's understanding of the tax rules and rates that exist in the foreign markets in which it invests.
Distributions are declared and recorded on the ex-dividend date. Income dividends and capital gain distributions are declared separately for each class. Income and capital gain distributions are determined in accordance with income tax regulations, which may differ from GAAP.
Capital accounts within the financial statements are adjusted for permanent book-tax differences. These adjustments have no impact on net assets or the results of operations. Temporary book-tax differences will reverse in a subsequent period.
Book-tax differences are primarily due to foreign currency transactions, certain foreign taxes, passive foreign investment companies (PFIC), capital loss carryforwards and losses deferred due to wash sales.
The federal tax cost of investment securities and unrealized appreciation (depreciation) as of period end were as follows:
Gross unrealized appreciation | $ 60,308,189 |
Gross unrealized depreciation | (40,019,364) |
Net unrealized appreciation (depreciation) on securities and other investments | $ 20,288,825 |
| |
Tax Cost | $ 522,558,294 |
Annual Report
Notes to Financial Statements - continued
3. Significant Accounting Policies - continued
Income Tax Information and Distributions to Shareholders - continued
The tax-based components of distributable earnings as of period end were as follows:
Undistributed ordinary income | $ 2,180,940 |
Capital loss carryforward | $ (70,963,758) |
Net unrealized appreciation (depreciation) | $ 20,226,704 |
Under the recently enacted Regulated Investment Company Modernization Act of 2010 (the Act), the Fund will be permitted to carry forward capital losses incurred in taxable years beginning after December 22, 2010 for an unlimited period. However, any losses incurred during those future taxable years will be required to be utilized prior to any losses incurred in pre-enactment taxable years, which generally expire after eight years from when they are incurred. Additionally, post-enactment capital losses that are carried forward will retain their character as either short-term or long-term capital losses rather than being considered all short-term as under previous law. The Fund's first fiscal year end subject to the Act will be October 31, 2012.
The tax character of distributions paid was as follows:
| October 31, 2011 | October 31, 2010 |
Ordinary Income | $ 6,474,313 | $ 5,294,607 |
Short-Term Trading (Redemption) Fees. Shares held by investors in the Fund less than 90 days are subject to a redemption fee equal to 1.50% of the net asset value of shares redeemed. All redemption fees, which reduce the proceeds of the shareholder redemption, are retained by the Fund and accounted for as an addition to paid in capital.
New Accounting Pronouncement. In May 2011, the Financial Accounting Standards Board issued Accounting Standard Update No. 2011-04, Fair Value Measurement (Topic 820) - Amendments to Achieve Common Fair Value Measurement and Disclosure Requirements in U.S. GAAP and IFRSs. The update changes the wording used to describe the requirements in GAAP for measuring fair value and for disclosing information about fair value measurements. The update is effective during interim and annual periods beginning after December 15, 2011. Management is currently evaluating the impact of the update's adoption on the Fund's financial statement disclosures.
Annual Report
4. Operating Policies.
Delayed Delivery Transactions and When-Issued Securities. During the period, the Fund transacted in securities on a delayed delivery or when-issued basis. Payment and delivery may take place after the customary settlement period for that security. The price of the underlying securities and the date when the securities will be delivered and paid for are fixed at the time the transaction is negotiated. During the time a delayed delivery sell is outstanding, the contract is marked-to-market daily and equivalent deliverable securities are held for the transaction. The securities purchased on a delayed delivery or when-issued basis are identified as such in the Fund's Schedule of Investments. The Fund may receive compensation for interest forgone in the purchase of a delayed delivery or when-issued security. With respect to purchase commitments, the Fund identifies securities as segregated in its records with a value at least equal to the amount of the commitment. Losses may arise due to changes in the value of the underlying securities or if the counterparty does not perform under the contract's terms, or if the issuer does not issue the securities due to political, economic, or other factors.
Restricted Securities. The Fund may invest in securities that are subject to legal or contractual restrictions on resale. These securities generally may be resold in transactions exempt from registration or to the public if the securities are registered. Disposal of these securities may involve time-consuming negotiations and expense, and prompt sale at an acceptable price may be difficult. Information regarding restricted securities is included at the end of the Fund's Schedule of Investments.
5. Purchases and Sales of Investments.
Purchases and sales of securities, other than short-term securities, aggregated $793,493,102 and $904,699,290, respectively.
6. Fees and Other Transactions with Affiliates.
Management Fee. FMR and its affiliates provide the Fund with investment management related services for which the Fund pays a monthly management fee. The management fee is the sum of an individual fund fee rate that is based on an annual rate of .55% of the Fund's average net assets and a group fee rate that averaged .26% during the period. The group fee rate is based upon the average net assets of all the mutual funds advised by FMR. The group fee rate decreases as assets under management increase and increases as assets under management decrease. For the period, the total annual management fee rate was .81% of the Fund's average net assets.
Annual Report
Notes to Financial Statements - continued
6. Fees and Other Transactions with Affiliates - continued
Distribution and Service Plan Fees. In accordance with Rule 12b-1 of the 1940 Act, the Fund has adopted separate Distribution and Service Plans for each class of shares. Certain classes pay Fidelity Distributors Corporation (FDC), an affiliate of FMR, separate Distribution and Service Fees, each of which is based on an annual percentage of each class' average net assets. In addition, FDC may pay financial intermediaries for selling shares of the Fund and providing shareholder support services. For the period, the Distribution and Service Fee rates, total fees and amounts retained by FDC were as follows:
| Distribution
Fee | Service
Fee | Total Fees | Retained
by FDC |
Class A | -% | .25% | $ 670,844 | $ 17,761 |
Class T | .25% | .25% | 474,396 | 1,623 |
Class B | .75% | .25% | 278,324 | 208,937 |
Class C | .75% | .25% | 1,009,648 | 156,329 |
| | | $ 2,433,212 | $ 384,650 |
Sales Load. FDC may receive a front-end sales charge of up to 5.75% for selling Class A shares, and 3.50% for selling Class T shares, some of which is paid to financial intermediaries for selling shares of the Fund. Depending on the holding period, FDC may receive contingent deferred sales charges levied on Class A, Class T, Class B, and Class C redemptions. The deferred sales charges range from 5% to 1% for Class B, 1% for Class C, 1.00% for certain purchases of Class A shares and .25% for certain purchases of Class T shares.
For the period, sales charge amounts retained by FDC were as follows:
| Retained
by FDC |
Class A | $ 99,047 |
Class T | 22,366 |
Class B* | 60,646 |
Class C* | 11,255 |
| $ 193,314 |
* When Class B and Class C shares are initially sold, FDC pays commissions from its own resources to financial intermediaries through which the sales are made.
Transfer Agent Fees. Fidelity Investments Institutional Operations Company, Inc. (FIIOC), an affiliate of FMR, is the transfer, dividend disbursing and shareholder servicing agent for each class of the Fund. FIIOC receives account fees and asset-based fees that vary according to the account size and type of account of the shareholders of the respective classes of the Fund. FIIOC pays for typesetting, printing and mailing of shareholder reports, except proxy statements.
Annual Report
6. Fees and Other Transactions with Affiliates - continued
Transfer Agent Fees - continued
For the period, transfer agent fees for each class were as follows:
| Amount | % of
Average
Net Assets |
Class A | $ 820,854 | .31 |
Class T | 296,239 | .31 |
Class B | 85,544 | .31 |
Class C | 301,434 | .30 |
Institutional Class | 377,433 | .23 |
| $ 1,881,504 | |
Accounting and Security Lending Fees. Fidelity Service Company, Inc. (FSC), an affiliate of FMR, maintains the Fund's accounting records. The accounting fee is based on the level of average net assets for the month. Under a separate contract, FSC administers the security lending program. The security lending fee is based on the number and duration of lending transactions.
Brokerage Commissions. The Fund placed a portion of its portfolio transactions with brokerage firms which are affiliates of the investment adviser. The commissions paid to these affiliated firms were $406 for the period.
Interfund Lending Program. Pursuant to an Exemptive Order issued by the SEC, the Fund, along with other registered investment companies having management contracts with FMR, may participate in an interfund lending program. This program provides an alternative credit facility allowing the funds to borrow from, or lend money to, other participating affiliated funds. At period end, there were no interfund loans outstanding. The Fund's activity in this program during the period for which loans were outstanding was as follows:
Borrower or Lender | Average Daily
Loan Balance | Weighted Average
Interest Rate | Interest
Expense |
Borrower | $ 3,769,842 | .38% | $ 759 |
7. Committed Line of Credit.
The Fund participates with other funds managed by FMR or an affiliate in a $4.0 billion credit facility (the "line of credit") to be utilized for temporary or emergency purposes to fund shareholder redemptions or for other short-term liquidity purposes. The Fund has agreed to pay commitment fees on its pro-rata portion of the line of credit, which amounted to $2,094 and is reflected in Miscellaneous expenses on the Statement of Operations. During the period, there were no borrowings on this line of credit.
Annual Report
Notes to Financial Statements - continued
8. Security Lending.
The Fund lends portfolio securities through a lending agent from time to time in order to earn additional income. For equity securities, a lending agent is used and may loan securities to certain qualified borrowers, including Fidelity Capital Markets (FCM), a broker-dealer affiliated with the Fund. On the settlement date of the loan, the Fund receives collateral (in the form of U.S. Treasury obligations, letters of credit and/or cash) against the loaned securities and maintains collateral in an amount not less than 100% of the market value of the loaned securities during the period of the loan. The market value of the loaned securities is determined at the close of business of the Fund and any additional required collateral is delivered to the Fund on the next business day. If the borrower defaults on its obligation to return the securities loaned because of insolvency or other reasons, a fund could experience delays and costs in recovering the securities loaned or in gaining access to the collateral. Any cash collateral received is invested in the Fidelity Securities Lending Cash Central Fund. The value of loaned securities and cash collateral at period end are disclosed on the Fund's Statement of Assets and Liabilities. Security lending income represents the income earned on investing cash collateral, less rebates paid to borrowers and any lending agent fees associated with the loan, plus any premium payments received for lending certain types of securities. Security lending income is presented in the Statement of Operations as a component of income from Fidelity Central Funds. Total security lending income during the period amounted to $208,223. During the period, there were no securities loaned to FCM.
9. Expense Reductions.
Many of the brokers with whom FMR places trades on behalf of the Fund provided services to the Fund in addition to trade execution. These services included payments of certain expenses on behalf of the Fund totaling $424,116 for the period. In addition, through arrangements with the Fund's custodian, credits realized as a result of uninvested cash balances were used to reduce the Fund's expenses. During the period, these credits reduced the Fund's custody expenses by $175.
10. Distributions to Shareholders.
Distributions to shareholders of each class were as follows:
Years ended October 31, | 2011 | 2010 |
From net investment income | | |
Class A | $ 1,359,820 | $ 823,941 |
Class T | 162,957 | 194,714 |
Class B | 6,606 | - |
Class C | 23,592 | - |
Institutional Class | 1,584,568 | 595,478 |
Total | $ 3,137,543 | $ 1,614,133 |
Annual Report
10. Distributions to Shareholders - continued
Years ended October 31, | 2011 | 2010 |
From net realized gain | | |
Class A | $ 1,530,131 | $ 1,543,065 |
Class T | 550,254 | 631,634 |
Class B | 33,415 | 170,009 |
Class C | 232,626 | 588,609 |
Institutional Class | 990,344 | 747,157 |
Total | $ 3,336,770 | $ 3,680,474 |
11. Share Transactions.
Transactions for each class of shares were as follows:
| Shares | Dollars |
Years ended October 31, | 2011 | 2010 | 2011 | 2010 |
Class A | | | | |
Shares sold | 2,979,791 | 4,968,910 | $ 70,086,728 | $ 104,602,234 |
Reinvestment of distributions | 111,230 | 108,006 | 2,675,569 | 2,258,405 |
Shares redeemed | (5,317,665) | (4,235,043) | (123,086,641) | (87,859,971) |
Net increase (decrease) | (2,226,644) | 841,873 | $ (50,324,344) | $ 19,000,668 |
Class T | | | | |
Shares sold | 883,154 | 1,526,646 | $ 20,610,023 | $ 32,084,382 |
Reinvestment of distributions | 28,248 | 38,153 | 678,402 | 796,254 |
Shares redeemed | (1,752,649) | (1,685,925) | (40,710,223) | (34,798,827) |
Net increase (decrease) | (841,247) | (121,126) | $ (19,421,798) | $ (1,918,191) |
Class B | | | | |
Shares sold | 68,462 | 284,855 | $ 1,586,905 | $ 5,842,113 |
Reinvestment of distributions | 1,377 | 7,131 | 32,616 | 146,541 |
Shares redeemed | (352,710) | (412,420) | (8,040,387) | (8,414,002) |
Net increase (decrease) | (282,871) | (120,434) | $ (6,420,866) | $ (2,425,348) |
Class C | | | | |
Shares sold | 956,543 | 1,416,872 | $ 22,080,298 | $ 29,287,955 |
Reinvestment of distributions | 9,045 | 24,169 | 213,702 | 496,184 |
Shares redeemed | (1,536,376) | (1,291,795) | (34,998,720) | (26,390,410) |
Net increase (decrease) | (570,788) | 149,246 | $ (12,704,720) | $ 3,393,729 |
Institutional Class | | | | |
Shares sold | 2,773,126 | 4,771,525 | $ 64,258,215 | $ 100,570,593 |
Reinvestment of distributions | 73,837 | 25,873 | 1,781,181 | 542,822 |
Shares redeemed | (3,885,014) | (2,586,784) | (91,297,373) | (54,324,513) |
Net increase (decrease) | (1,038,051) | 2,210,614 | $ (25,257,977) | $ 46,788,902 |
Annual Report
Notes to Financial Statements - continued
12. Other.
The Fund's organizational documents provide former and current trustees and officers with a limited indemnification against liabilities arising in connection with the performance of their duties to the Fund. In the normal course of business, the Fund may also enter into contracts that provide general indemnifications. The Fund's maximum exposure under these arrangements is unknown as this would be dependent on future claims that may be made against the Fund. The risk of material loss from such claims is considered remote.
Annual Report
To the Trustees of Fidelity Advisor Series VIII and Shareholders of Fidelity Advisor Emerging Markets Fund:
We have audited the accompanying statement of assets and liabilities of Fidelity Advisor Emerging Markets Fund (the Fund), a fund of Fidelity Advisor Series VIII, including the schedule of investments, as of October 31, 2011, and the related statement of operations for the year then ended, the statement of changes in net assets for each of the two years in the period then ended, and the financial highlights for each of the five years in the period then ended. These financial statements and financial highlights are the responsibility of the Fund's management. Our responsibility is to express an opinion on these financial statements and financial highlights based on our audits.
We conducted our audits in accordance with the standards of the Public Company Accounting Oversight Board (United States). Those standards require that we plan and perform the audit to obtain reasonable assurance about whether the financial statements and financial highlights are free of material misstatement. The Fund is not required to have, nor were we engaged to perform, an audit of its internal control over financial reporting. Our audits included consideration of internal control over financial reporting as a basis for designing audit procedures that are appropriate in the circumstances, but not for the purpose of expressing an opinion on the effectiveness of the Fund's internal control over financial reporting. Accordingly, we express no such opinion. An audit also includes examining, on a test basis, evidence supporting the amounts and disclosures in the financial statements, assessing the accounting principles used and significant estimates made by management, as well as evaluating the overall financial statement presentation. Our procedures included confirmation of securities owned as of October 31, 2011, by correspondence with the custodians and brokers; where replies were not received from brokers, we performed other auditing procedures. We believe that our audits provide a reasonable basis for our opinion.
In our opinion, the financial statements and financial highlights referred to above present fairly, in all material respects, the financial position of Fidelity Advisor Emerging Markets Fund as of October 31, 2011, the results of its operations for the year then ended, the changes in its net assets for each of the two years in the period then ended, and the financial highlights for each of the five years in the period then ended, in conformity with accounting principles generally accepted in the United States of America.
/s/ Deloitte & Touche LLP
DELOITTE & TOUCHE LLP
Boston, Massachusetts
December 14, 2011
Annual Report
The Trustees, Members of the Advisory Board, and executive officers of the trust and fund, as applicable, are listed below. The Board of Trustees governs the fund and is responsible for protecting the interests of shareholders. The Trustees are experienced executives who meet periodically throughout the year to oversee the fund's activities, review contractual arrangements with companies that provide services to the fund, oversee management of the risks associated with such activities and contractual arrangements, and review the fund's performance. Except for James C. Curvey, each of the Trustees oversees 226 funds advised by FMR or an affiliate. Mr. Curvey oversees 429 funds advised by FMR or an affiliate.
The Trustees hold office without limit in time except that (a) any Trustee may resign; (b) any Trustee may be removed by written instrument, signed by at least two-thirds of the number of Trustees prior to such removal; (c) any Trustee who requests to be retired or who has become incapacitated by illness or injury may be retired by written instrument signed by a majority of the other Trustees; and (d) any Trustee may be removed at any special meeting of shareholders by a two-thirds vote of the outstanding voting securities of the trust. Each Trustee who is not an interested person (as defined in the 1940 Act) (Independent Trustee), shall retire not later than the last day of the calendar year in which his or her 75th birthday occurs. The Independent Trustees may waive this mandatory retirement age policy with respect to individual Trustees. The executive officers and Advisory Board Members hold office without limit in time, except that any officer and Advisory Board Member may resign or may be removed by a vote of a majority of the Trustees at any regular meeting or any special meeting of the Trustees. Except as indicated, each individual has held the office shown or other offices in the same company for the past five years.
Experience, Skills, Attributes, and Qualifications of the Fund's Trustees. The Governance and Nominating Committee has adopted a statement of policy that describes the experience, qualifications, attributes, and skills that are necessary and desirable for potential Independent Trustee candidates (Statement of Policy). The Board believes that each Trustee satisfied at the time he or she was initially elected or appointed a Trustee, and continues to satisfy, the standards contemplated by the Statement of Policy. The Governance and Nominating Committee also engages professional search firms to help identify potential Independent Trustee candidates who have the experience, qualifications, attributes, and skills consistent with the Statement of Policy. From time to time, additional criteria based on the composition and skills of the current Independent Trustees, as well as experience or skills that may be appropriate in light of future changes to board composition, business conditions, and regulatory or other developments, have also been considered by the professional search firms and the Governance and Nominating Committee. In addition, the Board takes into account the Trustees' commitment and participation in Board and committee meetings, as well as their leadership of standing and ad hoc committees throughout their tenure.
In determining that a particular Trustee was and continues to be qualified to serve as a Trustee, the Board has considered a variety of criteria, none of which, in isolation, was controlling. The Board believes that, collectively, the Trustees have balanced and diverse experience, qualifications, attributes, and skills, which allow the Board to operate effectively in governing the fund and protecting the interests of shareholders. Information about the specific experience, skills, attributes, and qualifications of each Trustee, which in each case led to the Board's conclusion that the Trustee should serve (or continue to serve) as a trustee of the fund, is provided below.
Annual Report
Board Structure and Oversight Function. James C. Curvey is an interested person (as defined in the 1940 Act) and currently serves as Acting Chairman. The Trustees have determined that an interested Chairman is appropriate and benefits shareholders because an interested Chairman has a personal and professional stake in the quality and continuity of services provided to the fund. Independent Trustees exercise their informed business judgment to appoint an individual of their choosing to serve as Chairman, regardless of whether the Trustee happens to be independent or a member of management. The Independent Trustees have determined that they can act independently and effectively without having an Independent Trustee serve as Chairman and that a key structural component for assuring that they are in a position to do so is for the Independent Trustees to constitute a substantial majority for the Board. The Independent Trustees also regularly meet in executive session. Ned C. Lautenbach serves as Chairman of the Independent Trustees and as such (i) acts as a liaison between the Independent Trustees and management with respect to matters important to the Independent Trustees and (ii) with management prepares agendas for Board meetings.
Fidelity funds are overseen by different Boards of Trustees. The fund's Board oversees Fidelity's equity and high income funds and another Board oversees Fidelity's investment-grade bond, money market, and asset allocation funds. The asset allocation funds may invest in Fidelity funds overseen by the fund's Board. The use of separate Boards, each with its own committee structure, allows the Trustees of each group of Fidelity funds to focus on the unique issues of the funds they oversee, including common research, investment, and operational issues. On occasion, the separate Boards establish joint committees to address issues of overlapping consequences for the Fidelity funds overseen by each Board.
The Trustees operate using a system of committees to facilitate the timely and efficient consideration of all matters of importance to the Trustees, the fund, and fund shareholders and to facilitate compliance with legal and regulatory requirements and oversight of the fund's activities and associated risks. The Board, acting through its committees, has charged FMR and its affiliates with (i) identifying events or circumstances the occurrence of which could have demonstrably adverse effects on the fund's business and/or reputation; (ii) implementing processes and controls to lessen the possibility that such events or circumstances occur or to mitigate the effects of such events or circumstances if they do occur; and (iii) creating and maintaining a system designed to evaluate continuously business and market conditions in order to facilitate the identification and implementation processes described in (i) and (ii) above. Because the day-to-day operations and activities of the fund are carried out by or through FMR, its affiliates and other service providers, the fund's exposure to risks is mitigated but not eliminated by the processes overseen by the Trustees. While each of the Board's committees has responsibility for overseeing different aspects of the fund's activities, oversight is exercised primarily through the Operations, Audit, and Compliance Committees. In addition, the Independent Trustees have worked with FMR to enhance the Board's oversight of investment and financial risks, legal and regulatory risks, technology risks, and operational risks, including the development of additional risk reporting to the Board. For example, a working group comprised of Independent Trustees and FMR has worked and continues to work to review the Fidelity funds' valuation-related activities, reporting and risk management. Appropriate personnel, including but not limited to the fund's Chief Compliance Officer (CCO), FMR's internal auditor, the independent accountants, the fund's Treasurer and portfolio management personnel, make periodic reports to the Board's committees, as appropriate, including an annual review of FMR's risk management program for the Fidelity funds. The responsibilities of each standing committee, including their oversight responsibilities, are described further under "Standing Committees of the Fund's Trustees."
Annual Report
Trustees and Officers - continued
The fund's Statement of Additional Informaion (SAI) includes more information about the Trustees. To request a copy, call Fidelity at 1-877-208-0098.
Interested Trustees*:
Correspondence intended for each Trustee who is an interested person may be sent to Fidelity Investments, 82 Devonshire Street, Boston, Massachusetts 02109.
Name, Age; Principal Occupations and Other Relevant Experience+ |
James C. Curvey (76) |
| Year of Election or Appointment: 2007 Mr. Curvey is Trustee and Acting Chairman of the Board of Trustees of certain Trusts. Mr. Curvey also serves as Trustee (2007-present) of other investment companies advised by FMR. Mr. Curvey is a Director of Fidelity Investments Money Management, Inc. (2009-present), Director of Fidelity Research & Analysis Co. (2009-present) and Director of FMR and FMR Co., Inc. (2007-present). Mr. Curvey is also Vice Chairman (2007-present) and Director of FMR LLC. In addition, Mr. Curvey serves as an Overseer for the Boston Symphony Orchestra and a member of the Trustees of Villanova University. Previously, Mr. Curvey was the Vice Chairman (2006-2007) and Director (2000-2007) of FMR Corp. |
Ronald P. O'Hanley (54) |
| Year of Election or Appointment: 2011 Mr. O'Hanley is Director of FMR Co., Inc. (2010-present), Director of Fidelity Investments Money Management, Inc. (2010-present), Director of Fidelity Research & Analysis Company (2010-present), President of Fidelity Asset Management and Corporate Services and a member of Fidelity's Executive Committee (2010-present). Previously, Mr. O'Hanley served as President and Chief Executive Officer of BNY Mellon Asset Management (2007-2010). Mr. O'Hanley also served as Vice Chairman of Bank New York Mellon Corp. and a member of that firm's Executive Committee. Prior to the 2007 merger of The Bank of New York and Mellon Financial Corporation, he was Vice Chairman of Mellon Financial Corporation and President and Chief Executive Officer of Mellon Asset Management. He joined Mellon in February 1997. Mr. O'Hanley currently serves as Chairman of the Boston Public Library Foundation Board of Directors and sits on the Board of Directors of Beth Israel Deaconess Medical Center, the Board of Trustees of the Marine Biological Laboratory and the Advisory Board of the Maxwell School of Citizenship and Public Administration at Syracuse University. Mr. O'Hanley also chairs the Council on Asset Management for the Financial Services Roundtable and is a member of the Board of Directors of Institutional Investor's U.S. Institute. |
* Trustees have been determined to be "Interested Trustees" by virtue of, among other things, their affiliation with the trust or various entities under common control with FMR.
+ The information above includes each Trustee's principal occupation during the last five years and other information relating to the experience, attributes, and skills relevant to each Trustee's qualifications to serve as a Trustee, which led to the conclusion that each Trustee should serve as a Trustee for the fund.
Annual Report
Trustees and Officers - continued
Independent Trustees:
Correspondence intended for each Independent Trustee (that is, the Trustees other than the Interested Trustees) may be sent to Fidelity Investments, P.O. Box 55235, Boston, Massachusetts 02205-5235.
Name, Age; Principal Occupations and Other Relevant Experience+ |
Dennis J. Dirks (63) |
| Year of Election or Appointment: 2005 Prior to his retirement in May 2003, Mr. Dirks was Chief Operating Officer and a member of the Board of The Depository Trust & Clearing Corporation (DTCC). He also served as President, Chief Operating Officer, and Board member of The Depository Trust Company (DTC) and President and Board member of the National Securities Clearing Corporation (NSCC). In addition, Mr. Dirks served as Chief Executive Officer and Board member of the Government Securities Clearing Corporation, Chief Executive Officer and Board member of the Mortgage-Backed Securities Clearing Corporation, as a Trustee and a member of the Finance Committee of Manhattan College (2005-2008), and as a Trustee and a member of the Finance Committee of AHRC of Nassau County (2006-2008). Mr. Dirks is a member of the Independent Directors Council (IDC) Governing Council (2010-Present) and Board of Directors for The Brookville Center for Children's Services, Inc. (2009-present). |
Alan J. Lacy (58) |
| Year of Election or Appointment: 2008 Mr. Lacy serves as Senior Adviser (2007-present) of Oak Hill Capital Partners, L.P. (private equity). Mr. Lacy also served as Chief Executive Officer (2000-2005) and Vice Chairman (2005-2006) of Sears Holdings Corporation and Sears, Roebuck and Co. (retail). In addition, Mr. Lacy serves as a member of the Board of Directors of Dave & Buster's, Inc. (restaurant and entertainment complexes, 2010-present), The Hillman Companies, Inc. (hardware wholesalers, 2010-present), and Bristol-Myers Squibb Company (global pharmaceuticals, 2007-present). Mr. Lacy is a member of the Board of Trustees of The National Parks Conservation Association (2006-Present). Previously, Mr. Lacy served as Chairman of the Board of Trustees of the National Parks Conservation Association (2008-2011) and as a member of the Board of Directors for the Western Union Company (global money transfer, 2006-2011). |
Ned C. Lautenbach (67) |
| Year of Election or Appointment: 2000 Mr. Lautenbach is Chairman of the Independent Trustees of the Equity and High Income Funds (2006-present). Mr. Lautenbach currently serves as the Lead Director of the Eaton Corporation Board of Directors (diversified industrial, 1997-present). Mr. Lautenbach is also a member of the Board of Directors of the Philharmonic Center for the Arts in Naples, Florida (1999-present); a member of the Board of Trustees of Fairfield University (2005-present); and a member of the Council on Foreign Relations (1994-present). Previously, Mr. Lautenbach was a Partner/Advisory Partner at Clayton, Dubilier & Rice, LLC (private equity investment, 1998-2010), as well as a Director of Sony Corporation (2006-2007). |
Joseph Mauriello (67) |
| Year of Election or Appointment: 2008 Prior to his retirement in January 2006, Mr. Mauriello served in numerous senior management positions including Deputy Chairman and Chief Operating Officer (2004-2005), and Vice Chairman of Financial Services (2002-2004) of KPMG LLP US (professional services, 1965-2005). Mr. Mauriello currently serves as a member of the Board of Directors of XL Group plc. (global insurance and re-insurance, 2006-present) and of Arcadia Resources Inc. (health care services and products, 2007-present). Previously, Mr. Mauriello served as a Director of the Hamilton Funds of the Bank of New York (2006-2007). |
Robert W. Selander (61) |
| Year of Election or Appointment: 2011 Previously, Mr. Selander served as a Member of the Advisory Board of Fidelity's Equity and High Income Funds (2011), Executive Vice Chairman (2010), Chief Executive Officer (2009-2010), and President and Chief Executive Officer (1997-2009) of Mastercard, Inc. |
Cornelia M. Small (67) |
| Year of Election or Appointment: 2005 Ms. Small is a member of the Board of Directors of the Teagle Foundation (2009-present). Ms. Small is also a member of the Investment Committee, and Chair (2008-present) and a member of the Board of Trustees of Smith College. In addition, Ms. Small serves on the Investment Committee of the Berkshire Taconic Community Foundation (2008-present). Previously, Ms. Small served as Chairperson of the Investment Committee (2002-2008) of Smith College. In addition, Ms. Small served as Chief Investment Officer, Director of Global Equity Investments, and a member of the Board of Directors of Scudder, Stevens & Clark and Scudder Kemper Investments. |
William S. Stavropoulos (72) |
| Year of Election or Appointment: 2001 Mr. Stavropoulos is Vice Chairman of the Independent Trustees of the Equity and High Income Funds (2006-present). Mr. Stavropoulos serves as President and Founder of the Michigan Baseball Foundation, the Great Lakes Loons (2007-present). Mr. Stavropoulos is Chairman Emeritus of the Board of Directors of The Dow Chemical Company, where he previously served in numerous senior management positions, including President, CEO (1995-2000; 2002-2004), Chairman of the Executive Committee (2000-2006), and as a member of the Board of Directors (1990-2006). Currently, Mr. Stavropoulos is Chairman of Univar (global distributor of commodity and specialty chemicals, 2010-present), a Director of Teradata Corporation (data warehousing and technology solutions, 2008-present), Chemical Financial Corporation, Maersk Inc. (industrial conglomerate), Tyco International, Inc. (multinational manufacturing and services, 2007-present), and a member of the Advisory Board for Metalmark Capital (private equity investment, 2005-present). Mr. Stavropoulos is a special advisor to Clayton, Dubilier & Rice, LLC (private equity investment). In addition, Mr. Stavropoulos is a member of the University of Notre Dame Advisory Council for the College of Science. |
David M. Thomas (62) |
| Year of Election or Appointment: 2008 Previously, Mr. Thomas served as Executive Chairman (2005-2006) and Chairman and Chief Executive Officer (2000-2005) of IMS Health, Inc. (pharmaceutical and healthcare information solutions). In addition, Mr. Thomas serves as a member of the Board of Directors of Fortune Brands, Inc. (consumer products), and Interpublic Group of Companies, Inc. (marketing communication, 2004-present). |
Michael E. Wiley (61) |
| Year of Election or Appointment: 2008 Mr. Wiley also serves as a Director of Asia Pacific Exploration Consolidated (international oil and gas exploration and production, 2008-present). Mr. Wiley serves as a Director of Tesoro Corporation (independent oil refiner and marketer, 2005-present), and a Director of Bill Barrett Corporation (exploration and production, 2005-present). In addition, Mr. Wiley also serves as a Director of Post Oak Bank (privately-held bank, 2004-present). Previously, Mr. Wiley served as a member of the Board of Trustees of the University of Tulsa (2000-2006; 2007-2010), as a Senior Energy Advisor of Katzenbach Partners, LLC (consulting, 2006-2007), as an Advisory Director of Riverstone Holdings (private investment), Chairman, President, and CEO of Baker Hughes, Inc. (oilfield services, 2000-2004), and as Director of Spinnaker Exploration Company (exploration and production, 2001-2005). |
Annual Report
+ The information above includes each Trustee's principal occupation during the last five years and other information relating to the experience, attributes, and skills relevant to each Trustee's qualifications to serve as a Trustee, which led to the conclusion that each Trustee should serve as a Trustee for the fund.
Advisory Board Members and Executive Officers:
Correspondence intended for each executive officer, Edward C. Johnson 3d, and Peter S. Lynch may be sent to Fidelity Investments, 82 Devonshire Street, Boston, Massachusetts 02109.
Name, Age; Principal Occupation |
Edward C. Johnson 3d (81) |
| Year of Election or Appointment: 2011 Member of the Advisory Board of Fidelity's Equity and High Income Funds. Mr. Johnson serves as Chief Executive Officer, Chairman, and a Director of FMR LLC, and also serves as Chairman and Director of FIL Limited. Previously, Mr. Johnson served as a Trustee and Chairman of the Board of certain Fidelity Trusts, Chairman and a Director of FMR, Chairman and a Director of FMR Co., Inc., and President of FMR LLC (2006-2007). |
Peter S. Lynch (67) |
| Year of Election or Appointment: 2003 Member of the Advisory Board of Fidelity's Equity and High Income Funds. Mr. Lynch is Vice Chairman and a Director of FMR and FMR Co., Inc. In addition, Mr. Lynch serves as a Trustee of Boston College and as the Chairman of the Inner-City Scholarship Fund. Previously, Mr. Lynch served on the Special Olympics International Board of Directors (1997-2006). |
Kenneth B. Robins (42) |
| Year of Election or Appointment: 2008 President and Treasurer of Fidelity's Equity and High Income Funds. Mr. Robins also serves as President and Treasurer (2010-present) and Assistant Treasurer (2009-present) of other Fidelity funds and is an employee of Fidelity Investments (2004-present). Previously, Mr. Robins served as Deputy Treasurer of the Fidelity funds (2005-2008) and Treasurer and Chief Financial Officer of The North Carolina Capital Management Trust: Cash and Term Portfolios (2006-2008). |
Bruce T. Herring (46) |
| Year of Election or Appointment: 2006 Vice President of certain Equity Funds. Mr. Herring also serves as Chief Investment Officer and Director of Fidelity Management & Research (U.K.) Inc. (2010-present) and Group Chief Investments Officer of FMR. Previously, Mr. Herring served as Vice President (2005-2006) and Senior Vice President (2006-2007) of Fidelity Management & Research Company, Vice President of FMR Co., Inc. (2001-2007) and as a portfolio manager for Fidelity U.S. Equity Funds. |
Brian B. Hogan (47) |
| Year of Election or Appointment: 2009 Vice President of Equity and High Income Funds. Mr. Hogan also serves as President of FMR's Equity Division (2009-present). Previously, Mr. Hogan served as Senior Vice President, Equity Research of FMR (2006-2009) and as a portfolio manager. |
Scott C. Goebel (43) |
| Year of Election or Appointment: 2008 Secretary and Chief Legal Officer (CLO) of the Fidelity funds. Mr. Goebel also serves as Secretary of Fidelity Investments Money Management, Inc. (FIMM) (2010-present) and Fidelity Research and Analysis Company (FRAC) (2010-present); Secretary and CLO of The North Carolina Capital Management Trust: Cash and Term Portfolios (2008-present); General Counsel, Secretary, and Senior Vice President of FMR (2008-present) and FMR Co., Inc. (2008-present); employed by FMR LLC or an affiliate (2001-present); Chief Legal Officer of Fidelity Management & Research (Hong Kong) Limited (2008-present) and Assistant Secretary of Fidelity Management & Research (Japan) Inc. (2008-present), and Fidelity Management & Research (U.K.) Inc. (2008-present). Previously, Mr. Goebel served as Assistant Secretary of FIMM (2008-2010), FRAC (2008-2010), and the Funds (2007-2008) and as Vice President and Secretary of Fidelity Distributors Corporation (FDC) (2005-2007). |
William C. Coffey (42) |
| Year of Election or Appointment: 2009 Assistant Secretary of Fidelity's Equity and High Income Funds. Mr. Coffey also serves as Senior Vice President and Deputy General Counsel of FMR LLC (2010-present), and is an employee of Fidelity Investments. Previously, Mr. Coffey served as Vice President and Associate General Counsel of FMR LLC (2005-2009). |
Holly C. Laurent (57) |
| Year of Election or Appointment: 2008 Anti-Money Laundering (AML) Officer of the Fidelity funds. Ms. Laurent also serves as AML Officer of The North Carolina Capital Management Trust: Cash and Term Portfolios (2008-present) and is an employee of Fidelity Investments. Previously, Ms. Laurent was Senior Vice President and Head of Legal for Fidelity Business Services India Pvt. Ltd. (2006-2008), and Senior Vice President, Deputy General Counsel and Group Head for FMR LLC (2005-2006). |
Christine Reynolds (53) |
| Year of Election or Appointment: 2008 Chief Financial Officer of the Fidelity funds. Ms. Reynolds became President of Fidelity Pricing and Cash Management Services (FPCMS) in August 2008. Ms. Reynolds served as Chief Operating Officer of FPCMS (2007-2008). Previously, Ms. Reynolds served as President, Treasurer, and Anti-Money Laundering officer of the Fidelity funds (2004-2007). |
Kenneth A. Rathgeber (64) |
| Year of Election or Appointment: 2004 Chief Compliance Officer of Fidelity's Equity and High Income Funds. Mr. Rathgeber is Chief Compliance Officer of Fidelity Management & Research (Hong Kong) Limited (2008-present), Fidelity Management & Research (Japan) Inc. (2008-present), FMR (2005-present), FMR Co., Inc. (2005-present), Fidelity Management & Research (U.K.) Inc. (2005-present), Fidelity Research & Analysis Company (2005-present), Fidelity Investments Money Management, Inc. (2005-present), Pyramis Global Advisors, LLC (2005-present), and Strategic Advisers, Inc. (2005-present). |
Jeffrey S. Christian (50) |
| Year of Election or Appointment: 2009 Deputy Treasurer of the Fidelity funds. Mr. Christian is an employee of Fidelity Investments. Previously, Mr. Christian served as Chief Financial Officer (2008-2009) of certain Fidelity funds and Senior Vice President of Fidelity Pricing and Cash Management Services (FPCMS) (2004-2009). |
Joseph F. Zambello (54) |
| Year of Election or Appointment: 2011 Deputy Treasurer of the Fidelity funds. Mr. Zambello is an employee of Fidelity Investments. Previously, Mr. Zambello served as Vice President of FMR's Program Management Group (2009-2011) and Vice President of the Transfer Agent Oversight Group (2005-2009). |
Adrien E. Deberghes (44) |
| Year of Election or Appointment: 2008 Deputy Treasurer of Fidelity's Equity and High Income Funds. Mr. Deberghes also serves as Vice President and Assistant Treasurer of Fidelity Rutland Square Trust II and Fidelity Commonwealth Trust II (2011-present), Assistant Treasurer of other Fidelity funds (2010-present), and is an employee of Fidelity Investments (2008-present). Previously, Mr. Deberghes served as Senior Vice President of Mutual Fund Administration at State Street Corporation (2007-2008), Senior Director of Mutual Fund Administration at Investors Bank & Trust (2005-2007), and Director of Finance for Dunkin' Brands (2000-2005). |
Stephanie J. Dorsey (42) |
| Year of Election or Appointment: 2010 Assistant Treasurer of Fidelity's Equity and High Income Funds. Ms. Dorsey also serves as Deputy Treasurer of other Fidelity funds (2008-present) and is an employee of Fidelity Investments (2008-present). Previously, Ms. Dorsey served as Treasurer (2004-2008) of the JPMorgan Mutual Funds and Vice President (2004-2008) of JPMorgan Chase Bank. |
John R. Hebble (53) |
| Year of Election or Appointment: 2009 Assistant Treasurer of Fidelity's Equity and High Income Funds. Mr. Hebble also serves as President (2011-present), Treasurer, and Chief Financial Officer of The North Carolina Capital Management Trust: Cash and Term Portfolios (2008-present), President and Treasurer of other Fidelity funds (2008-present) and is an employee of Fidelity Investments. |
Gary W. Ryan (53) |
| Year of Election or Appointment: 2005 Assistant Treasurer of the Fidelity funds. Mr. Ryan is an employee of Fidelity Investments. Previously, Mr. Ryan served as Vice President of Fund Reporting in Fidelity Pricing and Cash Management Services (FPCMS) (1999-2005). |
Jonathan Davis (43) |
| Year of Election or Appointment: 2010 Assistant Treasurer of the Fidelity funds. Mr. Davis is also Assistant Treasurer of Fidelity Rutland Square Trust II and Fidelity Commonwealth Trust II. Mr. Davis is an employee of Fidelity Investments. Previously, Mr. Davis served as Vice President and Associate General Counsel of FMR LLC (2003-2010). |
Annual Report
Class A designates 100%; Class T designates 100%; Class B designates 100%; and Class C designates 100%; of the dividends distributed during the fiscal year as amounts which may be taken into account as a dividend for purposes of the maximum rate under section 1(h)(11) of the Internal Revenue Code.
The amounts per share which represent income derived from sources within, and taxes paid to, foreign countries or possessions of the United States are as follows:
| Pay Date | Income | Taxes |
Class A | 12/06/10 | $0.277 | $0.0459 |
| 12/31/10 | 0.005 | 0.0000 |
Class T | 12/06/10 | $0.203 | $0.0459 |
| 12/31/10 | 0.005 | 0.0000 |
Class B | 12/06/10 | $0.071 | $0.0459 |
| 12/31/10 | 0.005 | 0.0000 |
Class C | 12/06/10 | $0.096 | $0.0459 |
| 12/31/10 | 0.005 | 0.0000 |
The fund will notify shareholders in January 2012 of amounts for use in preparing 2011 income tax returns.
Annual Report
Board Approval of Investment Advisory Contracts and Management Fees
Fidelity Advisor Emerging Markets Fund
Each year, the Board of Trustees, including the Independent Trustees (together, the Board), votes on the renewal of the management contract and sub-advisory agreements (together, the Advisory Contracts) for the fund. The Board, assisted by the advice of fund counsel and Independent Trustees' counsel, requests and considers a broad range of information relevant to the renewal of the Advisory Contracts throughout the year.
The Board meets regularly and considers at each of its meetings factors that are relevant to its annual consideration of the renewal of the fund's Advisory Contracts, including the services and support provided to the fund and its shareholders. The Board has established various standing committees, each composed of Independent Trustees with varying backgrounds, to which the Board has assigned specific subject matter responsibilities in order to enhance effective decision-making by the Board. The Board, acting directly and through its Committees, requests and receives information concerning the annual consideration of the renewal of the fund's Advisory Contracts. The Board also meets as needed to consider matters specifically related to the Board's annual consideration of the renewal of Advisory Contracts. Members of the Board may also meet with trustees of other Fidelity funds through ad hoc joint committees to discuss certain matters relevant to the Fidelity funds.
At its July 2011 meeting, the Board of Trustees, including the Independent Trustees, unanimously determined to renew the fund's Advisory Contracts. In reaching its determination, the Board considered all factors it believed relevant, including (i) the nature, extent, and quality of the services to be provided to the fund and its shareholders (including the investment performance of the fund); (ii) the competitiveness of the fund's management fee and total expense ratio; (iii) the total costs of the services to be provided by and the profits to be realized by Fidelity from its relationship with the fund; (iv) the extent to which economies of scale would be realized as the fund grows; and (v) whether fee levels reflect these economies of scale, if any, for the benefit of fund shareholders.
In considering whether to renew the Advisory Contracts for the fund, the Board reached a determination, with the assistance of fund counsel and Independent Trustees' counsel and through the exercise of its business judgment, that the renewal of the Advisory Contracts is in the best interests of the fund and its shareholders and that the compensation payable under the Advisory Contracts is fair and reasonable. The Board's decision to renew the Advisory Contracts was not based on any single factor, but rather was based on a comprehensive consideration of all the information provided to the Board at its meetings throughout the year. The Board, in reaching its determination to renew the Advisory Contracts, is aware that shareholders in the fund have a broad range of investment choices available to them, including a wide choice among mutual funds offered by Fidelity's competitors, and that the fund's shareholders, who have the opportunity to review and weigh the disclosure provided by the fund in its prospectus and other public disclosures, have chosen to invest in this fund, managed by Fidelity.
Annual Report
Nature, Extent, and Quality of Services Provided. The Board considered the staffing within the investment adviser, FMR, and the sub-advisers (together, the Investment Advisers), including the backgrounds of the fund's investment personnel and the fund's investment objective and discipline. The Independent Trustees also had discussions with senior management of Fidelity's investment operations and investment groups. The Board considered the structure of the portfolio manager compensation program and whether this structure provides appropriate incentives to act in the best interests of the fund.
Resources Dedicated to Investment Management and Support Services. The Board and the Fund Oversight and Research Committees reviewed the general qualifications and capabilities of the Investment Advisers' investment staff, including its size, education, experience, and resources, as well as the Investment Advisers' approach to recruiting, training, managing, and compensating investment personnel. The Board also noted that FMR has devoted increased resources to non-U.S. offices. The Board noted that Fidelity's analysts have extensive resources, tools and capabilities which allow them to conduct sophisticated quantitative and fundamental analysis, as well as credit analysis of issuers, counterparties and enhancers. The Board also believes that Fidelity's investment professionals have sufficient access to global information and data so as to provide competitive investment results over time, and that those professionals also have access to sophisticated tools which permit them to assess portfolio construction and risk and performance attribution characteristics continuously, as well as to transmit new information and research conclusions rapidly around the world. Additionally, in their deliberations, the Board considered the Investment Advisers' trading capabilities and resources which are an integral part of the investment management process.
Shareholder and Administrative Services. The Board considered (i) the nature, extent, quality, and cost of advisory, administrative, and shareholder services performed by the Investment Advisers and their affiliates under the Advisory Contracts and under separate agreements covering transfer agency, pricing and bookkeeping, and securities lending services for the fund; (ii) the nature and extent of the investment adviser's supervision of third party service providers, principally custodians and subcustodians; and (iii) the resources devoted to, and the record of compliance with, the fund's compliance policies and procedures. The Board also reviewed the allocation of fund brokerage, including allocations to brokers affiliated with the Investment Advisers, the use of brokerage commissions to pay fund expenses, and the use of "soft" commission dollars to pay for research services.
The Board noted that the growth of fund assets over time across the complex allows Fidelity to reinvest in the development of services designed to enhance the value or convenience of the Fidelity funds as investment vehicles. These services include 24-hour access to account information and market information through telephone representatives and over the Internet, investor education materials and asset allocation tools, and the expanded availability of Fidelity Investor Centers, with 35 new branches opening since 2010.
Annual Report
Board Approval of Investment Advisory Contracts and
Management Fees - continued
Investment in a Large Fund Family. The Board considered the benefits to shareholders of investing in a Fidelity fund, including the benefits of investing in a fund that is part of a large family of funds offering a variety of investment disciplines and providing a large variety of mutual fund investor services. The Board noted that Fidelity had taken, or had made recommendations that resulted in the Fidelity funds taking, a number of actions over the previous year that benefited particular funds, including (i) continuing to dedicate additional resources to investment research and support of the senior management team that oversees asset management; (ii) rationalizing product lines through the mergers of six funds into other funds; (iii) continuing to migrate the Freedom Funds to dedicated lower cost underlying funds; (iv) obtaining shareholder approval to broaden the investment strategies for Fidelity Consumer Finance Portfolio, Fidelity Emerging Asia Fund, and Fidelity Environment and Alternative Energy Portfolio; (v) contractually agreeing to reduce the management fees and impose other expense limitations on Spartan 500 Index Fund and U.S. Bond Index Fund in connection with launching new institutional classes of these funds; (vi) changing the name, primary and supplemental benchmarks, and investment policies of Fidelity Global Strategies Fund to support the fund's flexible investment mandate and global orientation; and (vii) reducing the transfer agency account fee rates on certain accounts.
Investment Performance. The Board considered whether the fund has operated in accordance with its investment objective, as well as its record of compliance with its investment restrictions. It also reviewed the fund's absolute investment performance for each class, as well as the fund's relative investment performance for each class measured over multiple periods against (i) a broad-based securities market index, and (ii) a peer group of mutual funds deemed appropriate by Fidelity and reviewed by the Board. The following charts considered by the Board show, over the one-, three-, and five-year periods ended December 31, 2010, the cumulative total returns of Institutional Class (Class I) and Class B of the fund, the cumulative total returns of a broad-based securities market index ("benchmark"), and a range of cumulative total returns of a peer group of mutual funds identified by Morningstar, Inc. as having an investment style similar to that of the fund based on underlying portfolio holdings. The returns of Institutional Class (Class I) and Class B show the performance of the highest and lowest performing classes, respectively (based on five-year performance). The box within each chart shows the 25th percentile return (bottom of box) and the 75th percentile return (top of box) of the peer group. Returns shown above the box are in the first quartile and returns shown below the box are in the fourth quartile. The percentage beaten numbers noted below each chart correspond to the percentile box and represent the percentage of funds in the peer group whose performance was equal to or lower than that of the class indicated.
Annual Report
Fidelity Advisor Emerging Markets Fund
The Board reviewed the fund's relative investment performance against its peer group and noted that the performance of Institutional Class (Class I) of the fund was in the third quartile for the one- and five- year periods and the fourth quartile for the three-year period. The Board also noted that the investment performance of the fund was lower than its benchmark for all the periods shown. The Board considered that the variations in performance among the fund's classes reflect the variations in class expenses, which result in lower performance for higher expense classes. The Board discussed with FMR actions that have been taken by FMR to improve the fund's disappointing performance relative to its peer group and benchmark. The Board also reviewed the fund's performance since inception as well as performance in the current year. The Board will continue to closely monitor the performance of the fund in the coming year and discuss with FMR other appropriate actions to address the performance of the fund.
Based on its review, the Board concluded that the nature, extent, and quality of services provided to the fund under the Advisory Contracts should benefit the fund's shareholders.
Competitiveness of Management Fee and Total Expense Ratio. The Board considered the fund's management fee and total expense ratio compared to "mapped groups" of competitive funds and classes. Fidelity creates "mapped groups" by combining similar Lipper investment objective categories that have comparable management fee characteristics. Combining Lipper investment objective categories aids the Board's management fee and total expense ratio comparisons by broadening the competitive group used for comparison and by reducing the number of universes to which various Fidelity funds are compared.
Annual Report
Board Approval of Investment Advisory Contracts and
Management Fees - continued
Management Fee. The Board considered two proprietary management fee comparisons for the 12-month periods shown in the chart below. The group of Lipper funds used by the Board for management fee comparisons is referred to below as the "Total Mapped Group." The Total Mapped Group comparison focuses on a fund's standing relative to the total universe of comparable funds available to investors in terms of gross management fees before expense reimbursements or caps. "TMG %" represents the percentage of funds in the Total Mapped Group that had management fees that were lower than the fund's. For example, a TMG % of 13% means that 87% of the funds in the Total Mapped Group had higher management fees than the fund. The "Asset-Size Peer Group" (ASPG) comparison focuses on a fund's standing relative to non-Fidelity funds similar in size to the fund within the Total Mapped Group. The ASPG represents at least 15% of the funds in the Total Mapped Group with comparable asset size and management fee characteristics, subject to a minimum of 50 funds (or all funds in the Total Mapped Group if fewer than 50). Additional information, such as the ASPG quartile in which the fund's management fee ranked, is also included in the chart and considered by the Board.
Fidelity Advisor Emerging Markets Fund
The Board noted that the fund's management fee ranked below the median of its Total Mapped Group and below the median of its ASPG for 2010.
Annual Report
Based on its review, the Board concluded that the fund's management fee is fair and reasonable in light of the services that the fund receives and the other factors considered.
Total Expense Ratio. In its review of each class's total expense ratio, the Board considered the fund's management fee as well as other fund or class expenses, as applicable, such as transfer agent fees, pricing and bookkeeping fees, fund-paid 12b-1 fees, and custodial, legal, and audit fees. The Board also noted the effects of any waivers and reimbursements on fees and expenses. As part of its review, the Board also considered the current and historical total expense ratios of each class of the fund compared to competitive fund median expenses. Each class of the fund is compared to those funds and classes in the Total Mapped Group (used by the Board for management fee comparisons) that have a similar sales load structure.
The Board noted that the total expense ratio of each of Class A, Class B, Class C, and Institutional Class ranked below its competitive median for 2010 and the total expense ratio of Class T ranked above its competitive median for 2010. The Board considered that various factors, including 12b-1 fees, positive or negative performance adjustments, and relatively higher other expenses in the case of small fund size, can affect total expense ratios. The Board noted that the total expense ratio of Class T was above the competitive median primarily because of higher 12b-1 fees on Class T. Class T has a higher 12b-1 fee, but a lower front-end sales charge, than traditionally priced front-end sales charge classes. The Board noted that the fund offers multiple classes, each of which has a different sales load and 12b-1 fee structure, and that the multiple structures are intended to offer a range of pricing options for the intermediary market. The Board also noted that the total expense ratios of the classes vary primarily by the level of their 12b-1 fees, although differences in transfer agent fees may also cause expenses to vary from class to class.
Fees Charged to Other Fidelity Clients. The Board also considered Fidelity fee structures and other information with respect to clients of FMR and its affiliates, such as other mutual funds advised or subadvised by FMR or its affiliates, pension plan clients, and other institutional clients. In March 2010, the Board created an ad hoc joint committee with the board of other Fidelity funds (the Committee) to review and compare Fidelity's institutional investment advisory business with its business of providing services to the Fidelity funds, including the differences in services provided, fees charged, and costs incurred, as well as competition in their respective marketplaces.
Based on its review of total expense ratios and fees charged to other Fidelity clients, the Board concluded that the total expense ratio of each class of the fund was reasonable, although Class T was above the median of the universe presented for comparison, in light of the services that the fund and its shareholders receive and the other factors considered, including the findings of the Committee.
Annual Report
Board Approval of Investment Advisory Contracts and
Management Fees - continued
Costs of the Services and Profitability. The Board considered the revenues earned and the expenses incurred by Fidelity in conducting the business of developing, marketing, distributing, managing, administering and servicing the fund and its shareholders. The Board also considered the level of Fidelity's profits in respect of all the Fidelity funds.
On an annual basis, FMR presents to the Board Fidelity's profitability for the fund. Fidelity calculates the profitability for each fund, as well as aggregate profitability for groups of Fidelity funds and all Fidelity funds, using a series of detailed revenue and cost allocation methodologies which originate with the books and records of Fidelity on which Fidelity's audited financial statements are based. The Audit Committee of the Board reviews any significant changes from the prior year's methodologies.
PricewaterhouseCoopers LLP (PwC), independent registered public accounting firm and auditor to Fidelity and certain Fidelity funds, has been engaged annually by the Board as part of the Board's assessment of Fidelity's profitability analysis. PwC's engagement includes the review and assessment of Fidelity's methodologies used in determining the revenues and expenses attributable to Fidelity's mutual fund business, and completion of agreed-upon procedures surrounding the mathematical accuracy of fund profitability and its conformity to allocation methodologies. After considering PwC's reports issued under the engagement and information provided by Fidelity, the Board concluded that while other allocation methods may also be reasonable, Fidelity's profitability methodologies are reasonable in all material respects.
The Board also reviewed Fidelity's non-fund businesses and fall-out benefits related to the mutual fund business as well as cases where Fidelity's affiliates may benefit from or be related to the fund's business.
The Board considered the costs of the services provided by and the profits realized by Fidelity in connection with the operation of the fund and was satisfied that the profitability was not excessive in the circumstances.
Economies of Scale. The Board considered whether there have been economies of scale in respect of the management of the Fidelity funds, whether the Fidelity funds (including the fund) have appropriately benefited from any such economies of scale, and whether there is potential for realization of any further economies of scale. The Board considered the extent to which the fund will benefit from economies of scale through increased services to the fund, through waivers or reimbursements, or through fee or expense reductions. The Board also noted that in 2009, it and the board of other Fidelity funds created an ad hoc committee (the Economies of Scale Committee) to analyze whether FMR attains economies of scale in respect of the management and servicing of the Fidelity funds, whether the Fidelity funds have appropriately benefited from such economies of scale, and whether there is potential for realization of any further economies of scale.
Annual Report
The Board recognized that the fund's management contract incorporates a "group fee" structure, which provides for lower group fee rates as total fund assets under FMR's management increase, and for higher group fee rates as total fund assets under FMR's management decrease. FMR calculates the group fee rates based on a tiered asset "breakpoint" schedule that varies based on asset class. The Board considered that the group fee is designed to deliver the benefits of economies of scale to fund shareholders when total Fidelity fund assets increase, even if assets of any particular fund are unchanged or have declined, because some portion of Fidelity's costs are attributable to services provided to all Fidelity funds, and all funds benefit if those costs can be allocated among more assets. The Board concluded that, given the group fee structure, fund shareholders will benefit from lower management fees as assets under FMR's management increase at the fund complex level, regardless of whether Fidelity achieves any such economies of scale.
The Board concluded, taking into account the analysis of the Economies of Scale Committee, that any potential economies of scale are being appropriately shared between fund shareholders and Fidelity.
Additional Information Requested by the Board. In order to develop fully the factual basis for consideration of the Fidelity funds' Advisory Contracts, the Board requested and received additional information on certain topics, including (i) fund performance trends, actions to be taken by FMR to improve certain funds' overall performance, and Fidelity's long-term strategies for certain funds; (ii) portfolio manager changes that have occurred during the past year and length of portfolio manager tenure for different categories of funds over time; (iii) Fidelity's compensation structure for portfolio managers and other key personnel and strategies for attracting and retaining non-investment personnel; (iv) the amount of the investment that each portfolio manager has made in the Fidelity fund(s) that he or she manages; (v) historical trends in Fidelity's realization of fall-out benefits; (vi) Fidelity's group fee structures and the rationale for the individual fee rates of certain funds; (vii) fund profitability methodology and the impact of certain factors on fund profitability results; (viii) trends regarding industry use of performance fee structures and Fidelity's compliance practices with respect to performance adjustment calculations; (ix) the fee structures in place for certain other Fidelity clients; and (x) explanations regarding the relative total expense ratios of certain funds and classes, total expense competitive trends, and actions that might be taken by FMR to reduce total expense ratios for certain funds and classes.
Based on its evaluation of all of the conclusions noted above, and after considering all factors it believed relevant, the Board ultimately concluded that the advisory fee structures are fair and reasonable, and that the fund's Advisory Contracts should be renewed.
Annual Report
Investment Adviser
Fidelity Management & Research Company
Boston, MA
Investment Sub-Advisers
FMR Co., Inc.
Fidelity Management & Research
(U.K.) Inc.
Fidelity Management & Research
(Hong Kong) Limited
FIL Investments (Japan) Limited
Fidelity Management & Research
(Japan) Inc.
FIL Investment Advisors (UK) Limited
FIL Investment Advisors
General Distributor
Fidelity Distributors Corporation
Boston, MA
Transfer and Service Agents
Fidelity Investments Institutional Operations Company, Inc.
Boston, MA
Fidelity Service Company, Inc.
Boston, MA
Custodian
JPMorgan Chase Bank
New York, NY
FAEM-UANN-1211
1.809005.107
(Fidelity Investment logo)(registered trademark)
Fidelity Advisor®
Emerging Markets
Fund - Institutional Class
Annual Report
October 31, 2011
Contents
Chairman's Message | (Click Here) | The Chairman's message to shareholders. |
Performance | (Click Here) | How the fund has done over time. |
Management's Discussion of Fund Performance | (Click Here) | The Portfolio Manager's review of fund performance and strategy. |
Shareholder Expense Example | (Click Here) | An example of shareholder expenses. |
Investment Changes | (Click Here) | A summary of major shifts in the fund's investments over the past six months. |
Investments | (Click Here) | A complete list of the fund's investments with their market values. |
Financial Statements | (Click Here) | Statements of assets and liabilities, operations, and changes in net assets, as well as financial highlights. |
Notes | (Click Here) | Notes to the financial statements. |
Report of Independent Registered Public Accounting Firm | (Click Here) | |
Trustees and Officers | (Click Here) | |
Distributions | (Click Here) | |
Board Approval of Investment Advisory Contracts and Management Fees | (Click Here) | |
To view a fund's proxy voting guidelines and proxy voting record for the 12-month period ended June 30, visit http://www.fidelity.com/proxyvotingresults or visit the Securities and Exchange Commission's (SEC) web site at http://www.sec.gov. You may also call 1-877-208-0098 to request a free copy of the proxy voting guidelines.
Standard & Poor's, S&P and S&P 500 are registered service marks of The McGraw-Hill Companies, Inc. and have been licensed for use by Fidelity Distributors Corporation.
Other third party marks appearing herein are the property of their respective owners.
All other marks appearing herein are registered or unregistered trademarks or service marks of FMR LLC or an affiliated company.
Annual Report
This report and the financial statements contained herein are submitted for the general information of the shareholders of the fund. This report is not authorized for distribution to prospective investors in the fund unless preceded or accompanied by an effective prospectus.
A fund files its complete schedule of portfolio holdings with the SEC for the first and third quarters of each fiscal year on Form N-Q. Forms N-Q are available on the SEC's web site at http://www.sec.gov. A fund's Forms N-Q may be reviewed and copied at the SEC's Public Reference Room in Washington, DC. Information regarding the operation of the SEC's Public Reference Room may be obtained by calling 1-800-SEC-0330. For a complete list of a fund's portfolio holdings, view the most recent holdings listing, semiannual report, or annual report on Fidelity's web site at http://www.fidelity.com, http://www.advisor.fidelity.com, or http://www.401k.com, as applicable.
NOT FDIC INSURED • MAY LOSE VALUE • NO BANK GUARANTEE
Neither the fund nor Fidelity Distributors Corporation is a bank.
Annual Report
(photo_of_James_C_Curvey)
Dear Shareholder:
Global equity markets began the fourth quarter on a strong note, sharply reversing course in October amid strong corporate earnings, better-than-expected economic news and the promise of a resolution to the sovereign debt crisis in Europe. The mini rally followed a third quarter marked by a significant downturn in July and August, which heightened investor anxiety and set off a wave of volatility that hampered most major asset classes through the end of September. Financial markets are difficult to predict, of course, but you can help put the odds in your favor by following these time-tested investment principles.
One of the basic tenets is to invest according to your time horizon. For long-term investors, riding out the markets' inevitable ups and downs has proven much more effective than making decisions based on short-term developments. If your goal is approaching, you can also benefit from patience and restraint, rather than attempting to time the market. No matter your time horizon, missing only a few of the markets' best days can significantly diminish returns. Patience also affords the benefits of compounding - earning interest on additional income or reinvested dividends and capital gains. While staying the course doesn't eliminate risk, it can considerably lessen the negative impact of short-term downturns.
Asset allocation is another principle to manage risk. As you spread your portfolio among the asset classes, be sure to consider your time horizon, risk tolerance and investment objectives. Younger investors may be better served by emphasizing equities, which historically have been the best-performing asset class over time. Investors who are nearing a specific goal, such as retirement or sending a child to college, may choose to favor bonds and other investments that have tended to be more stable. Studies indicate that asset allocation is the single most important determinant of a portfolio's long-term success. After deciding on a suitable allocation strategy, make sure your portfolio is adequately diversified, with exposure to stocks of small-, mid- and large-cap companies in a range of sectors, for example. And today, more than ever, geographic diversification should be taken into account.
Lastly, investing a certain amount of money on a regular basis - a principle known as dollar-cost averaging - can help lower the average cost of your purchases, while also giving you the discipline to avoid selling weak performers just prior to an upswing, or chasing a hot performer just before a correction.
We invite you to learn more by visiting us on the Internet, dropping by one of our Investor Centers or calling us by phone. It is our privilege to provide the resources you need to choose investments that are right for you.
Sincerely,
(The acting chairman's signature appears here.)
James C. Curvey
Acting Chairman
Annual Report
Average annual total return reflects the change in the value of an investment, assuming reinvestment of the class' distributions from dividend income and capital gains (the profits earned upon the sale of securities that have grown in value, if any) and assuming a constant rate of performance each year. The $10,000 table and the fund's returns do not reflect the deduction of taxes that a shareholder would pay on fund distributions or the redemption of fund shares. During periods of reimbursement by Fidelity, a fund's total return will be greater than it would be had the reimbursement not occurred. How a fund did yesterday is no guarantee of how it will do tomorrow.
Average Annual Total Returns
Periods ended October 31, 2011 | Past 1
year | Past 5
years | Life of
fundA |
Institutional Class | -12.41% | 2.86% | 11.22% |
A From March 29, 2004.
$10,000 Over Life of Fund
Let's say hypothetically that $10,000 was invested in Fidelity Advisor® Emerging Markets Fund - Institutional Class on March 29, 2004, when the fund started. The chart shows how the value of your investment would have changed, and also shows how the MSCI® Emerging Markets Index performed over the same period.
Annual Report
Market Recap: Emerging-markets stocks concluded the 12-month period ending October 31, 2011, on a strong note, reversing direction in October amid hope for a resolution to the sovereign debt crisis in Europe. The brief rally, on top of a robust first half of the period, could only partially offset the negative impact of a five-month downturn that began in May and intensified in August and September, as investors began to flee riskier securities due to the debt debacle, concern the U.S. economy may contract and worry about a significant slowdown in China. For the year, the MSCI® Emerging Markets Index declined 7.44%, hampered in part by global currency fluctuation. The index gained roughly 13% in October, after falling 9% in August and about 15% in September. For the full year, returns across the individual country components of the emerging-markets index were decidedly negative. Several of the largest countries in the index struggled, especially India (-20%), China (-17%) and Brazil (-12%), as did Turkey (-34%). Conversely, South Korea had the strongest result, gaining about 7%, while another sizable index component, Russia, returned roughly 1%. Smaller constituents Indonesia (+5%) and Malaysia (+4%) also finished in positive territory. A trio of countries had negative returns but outpaced the index: Mexico (-1%), Taiwan (-2%) and South Africa (-3%).
Comments from Robert von Rekowsky, Portfolio Manager of Fidelity Advisor® Emerging Markets Fund: During the past year, the fund's Institutional Class shares returned -12.41%, well behind the MSCI index. Relative performance was hurt the most by stock selection in energy, consumer staples and financials, followed by positioning in industrials and information technology. Geographically, security selection in China, India and South Africa weighed on the fund's results. Untimely ownership of wireless carrier and benchmark component China Mobile made it the fund's largest individual detractor. Similarly, underweighting Russian energy firm Gazprom when its stock was advancing early in the period dampened performance. Other key detractors were pork producer China Yurun Food Group - which I sold - and Turkish bank Turkiye Garanti Bankasi. Conversely, my picks in materials and positioning in the automobiles/components segment of consumer discretionary added value. Geographically, stock picking in Brazil and South Korea helped. Russian natural gas producer NOVATEK acquired additional acreage and added new customers, which bolstered its stock. Performance also benefited from Thai wireless carrier Advanced Info Service, as well as Korean automakers Kia Motors and Hyundai Motor.
Annual Report
The views expressed above reflect those of the portfolio manager(s) only through the end of the period as stated on the cover of this report and do not necessarily represent the views of Fidelity or any other person in the Fidelity organization. Any such views are subject to change at any time based upon market or other conditions and Fidelity disclaims any responsibility to update such views. These views may not be relied on as investment advice and, because investment decisions for a Fidelity fund are based on numerous factors, may not be relied on as an indication of trading intent on behalf of any Fidelity fund.
Annual Report
Shareholder Expense Example
As a shareholder of the Fund, you incur two types of costs: (1) transaction costs, including sales charges (loads) on purchase payments or redemption proceeds, redemption fees, and (2) ongoing costs, including management fees, distribution and/or service (12b-1) fees and other Fund expenses. This Example is intended to help you understand your ongoing costs (in dollars) of investing in the Fund and to compare these costs with the ongoing costs of investing in other mutual funds.
The Example is based on an investment of $1,000 invested at the beginning of the period and held for the entire period (May 1, 2011 to October 31, 2011).
Actual Expenses
The first line of the accompanying table for each class of the Fund provides information about actual account values and actual expenses. You may use the information in this line, together with the amount you invested, to estimate the expenses that you paid over the period. Simply divide your account value by $1,000.00 (for example, an $8,600 account value divided by $1,000.00 = 8.6), then multiply the result by the number in the first line for a class of the Fund under the heading entitled "Expenses Paid During Period" to estimate the expenses you paid on your account during this period. In addition, the Fund, as a shareholder in the underlying Fidelity Central Funds, will indirectly bear its pro-rata share of the fees and expenses incurred by the underlying Fidelity Central Funds. These fees and expenses are not included in the Fund's annualized expense ratio used to calculate the expense estimate in the table below.
Hypothetical Example for Comparison Purposes
The second line of the accompanying table for each class of the Fund provides information about hypothetical account values and hypothetical expenses based on a Class' actual expense ratio and an assumed rate of return of 5% per year before expenses, which is not the Class' actual return. The hypothetical account values and expenses may not be used to estimate the actual ending account balance or expenses you paid for the period. You may use this information to compare the ongoing costs of investing in the Fund and other funds. To do so, compare this 5% hypothetical example with the 5% hypothetical examples that appear in the shareholder reports of the other funds. In addition, the Fund, as a shareholder in the underlying Fidelity Central Funds, will indirectly bear its pro-rata share of the fees and expenses incurred by the underlying Fidelity Central Funds. These fees and expenses are not included in the Fund's annualized expense ratio used to calculate the expense estimate in the table below.
Please note that the expenses shown in the table are meant to highlight your ongoing costs only and do not reflect any transaction costs. Therefore, the second line of the table is useful in comparing ongoing costs only, and will not help you determine the relative total costs of owning different funds. In addition, if these transactional costs were included, your costs would have been higher.
Annual Report
| Annualized
Expense Ratio | Beginning
Account Value
May 1, 2011 | Ending
Account Value
October 31, 2011 | Expenses Paid
During Period*
May 1, 2011 to
October 31, 2011 |
Class A | 1.51% | | | |
Actual | | $ 1,000.00 | $ 796.70 | $ 6.84 |
HypotheticalA | | $ 1,000.00 | $ 1,017.59 | $ 7.68 |
Class T | 1.76% | | | |
Actual | | $ 1,000.00 | $ 795.90 | $ 7.97 |
HypotheticalA | | $ 1,000.00 | $ 1,016.33 | $ 8.94 |
Class B | 2.26% | | | |
Actual | | $ 1,000.00 | $ 793.90 | $ 10.22 |
HypotheticalA | | $ 1,000.00 | $ 1,013.81 | $ 11.47 |
Class C | 2.26% | | | |
Actual | | $ 1,000.00 | $ 794.00 | $ 10.22 |
HypotheticalA | | $ 1,000.00 | $ 1,013.81 | $ 11.47 |
Institutional Class | 1.18% | | | |
Actual | | $ 1,000.00 | $ 798.10 | $ 5.35 |
HypotheticalA | | $ 1,000.00 | $ 1,019.26 | $ 6.01 |
A 5% return per year before expenses
* Expenses are equal to each Class' annualized expense ratio, multiplied by the average account value over the period, multiplied by 184/365 (to reflect the one-half year period).
Annual Report
Investment Changes (Unaudited)
Top Five Stocks as of October 31, 2011 |
| % of fund's
net assets | % of fund's net assets
6 months ago |
Samsung Electronics Co. Ltd. (Korea (South), Semiconductors & Semiconductor Equipment) | 4.3 | 2.5 |
Petroleo Brasileiro SA - Petrobras (PN) (Brazil, Oil, Gas & Consumable Fuels) | 2.4 | 2.1 |
China Mobile (Hong Kong) Ltd. (Hong Kong, Wireless Telecommunication Services) | 2.4 | 0.0 |
Hyundai Motor Co. (Korea (South), Automobiles) | 2.2 | 1.7 |
Banco Bradesco SA (PN) sponsored ADR (Brazil, Commercial Banks) | 2.1 | 1.5 |
| 13.4 | |
Top Five Market Sectors as of October 31, 2011 |
| % of fund's
net assets | % of fund's net assets
6 months ago |
Financials | 23.6 | 24.1 |
Energy | 14.2 | 15.2 |
Information Technology | 11.4 | 13.4 |
Materials | 11.1 | 16.2 |
Consumer Discretionary | 10.7 | 8.3 |
Top Five Countries as of October 31, 2011 |
(excluding cash equivalents) | % of fund's
net assets | % of fund's net assets
6 months ago |
Korea (South) | 20.2 | 16.7 |
Brazil | 15.1 | 14.4 |
China | 8.5 | 8.7 |
Taiwan | 6.7 | 10.6 |
Russia | 5.8 | 8.9 |
Percentages are adjusted for the effect of open futures contracts, if applicable. |
Asset Allocation (% of fund's net assets) |
As of October 31, 2011 | As of April 30, 2011 |
| Stocks 98.2% | | | Stocks 97.9% | |
| Short-Term
Investments and
Net Other Assets 1.8% | | | Short-Term
Investments and
Net Other Assets 2.1% | |

Annual Report
Investments October 31, 2011
Showing Percentage of Net Assets
Common Stocks - 98.2% |
| Shares | | Value |
Bailiwick of Jersey - 0.7% |
Randgold Resources Ltd. sponsored ADR | 35,600 | | $ 3,900,692 |
Bermuda - 1.5% |
Cheung Kong Infrastructure Holdings Ltd. | 512,000 | | 2,742,639 |
CNPC (Hong Kong) Ltd. | 1,758,000 | | 2,462,576 |
Great Eagle Holdings Ltd. | 553,062 | | 1,228,314 |
NWS Holdings Ltd. | 906,000 | | 1,373,835 |
TOTAL BERMUDA | | 7,807,364 |
Brazil - 15.1% |
Banco Bradesco SA (PN) sponsored ADR | 596,890 | | 10,863,398 |
Banco do Estado do Rio Grande do Sul SA | 295,100 | | 3,110,476 |
BR Malls Participacoes SA | 276,000 | | 2,981,481 |
Companhia de Bebidas das Americas (AmBev) (PN) sponsored ADR | 186,705 | | 6,295,693 |
Companhia de Saneamento Basico do Estado de Sao Paulo (SABESP) | 132,100 | | 3,623,288 |
Companhia de Saneamento de Minas Gerais | 44,200 | | 829,844 |
Eletropaulo Metropolitana SA (PN-B) | 169,600 | | 3,041,975 |
Embraer SA sponsored ADR | 79,900 | | 2,222,818 |
Gol Linhas Aereas Inteligentes SA sponsored ADR (d) | 291,000 | | 2,333,820 |
Klabin SA (PN) (non-vtg.) | 142,600 | | 524,826 |
Localiza Rent A Car SA | 60,100 | | 908,220 |
Marcopolo SA (PN) | 244,700 | | 1,082,996 |
Mills Estruturas e Servicos de Engenharia SA | 62,600 | | 625,198 |
Multiplus SA | 97,024 | | 1,638,537 |
OGX Petroleo e Gas Participacoes SA (a) | 627,700 | | 5,190,624 |
Petroleo Brasileiro SA - Petrobras: | | | |
(PN) (non-vtg.) | 113,200 | | 1,405,441 |
(PN) sponsored ADR (d) | 432,510 | | 10,938,178 |
Qualicorp SA | 99,000 | | 905,136 |
Tegma Gestao Logistica | 149,700 | | 1,944,043 |
Telefonica Brasil SA sponsored ADR (a) | 80,300 | | 2,330,306 |
TIM Participacoes SA sponsored ADR | 190,436 | | 4,958,953 |
Ultrapar Participacoes SA | 158,100 | | 2,817,296 |
Vale SA (PN-A) sponsored ADR (d) | 319,700 | | 7,544,920 |
TOTAL BRAZIL | | 78,117,467 |
British Virgin Islands - 0.5% |
Mail.ru Group Ltd.: | | | |
GDR (a)(e) | 64,300 | | 2,215,135 |
GDR (Reg. S) | 5,900 | | 203,255 |
TOTAL BRITISH VIRGIN ISLANDS | | 2,418,390 |
Common Stocks - continued |
| Shares | | Value |
Canada - 1.7% |
Eldorado Gold Corp. | 200,285 | | $ 3,763,192 |
First Quantum Minerals Ltd. | 136,900 | | 2,871,625 |
Petrominerales Ltd. | 79,100 | | 2,086,904 |
TOTAL CANADA | | 8,721,721 |
Cayman Islands - 3.5% |
Belle International Holdings Ltd. | 988,000 | | 1,937,692 |
Central China Real Estate Ltd. | 2,170,836 | | 490,203 |
China Shangshui Cement Group Ltd. | 3,733,000 | | 2,859,389 |
Country Garden Holdings Co. Ltd. | 5,313,000 | | 2,103,617 |
Eurasia Drilling Co. Ltd. GDR (Reg. S) | 121,463 | | 2,866,527 |
EVA Precision Industrial Holdings Ltd. | 5,466,000 | | 1,411,601 |
Haitian International Holdings Ltd. | 1,095,000 | | 972,902 |
Shenguan Holdings Group Ltd. | 3,050,000 | | 1,638,629 |
Silver Base Group Holdings Ltd. | 1,500,000 | | 1,597,484 |
SOHO China Ltd. | 2,795,000 | | 1,992,747 |
TOTAL CAYMAN ISLANDS | | 17,870,791 |
Chile - 1.0% |
CFR Pharmaceuticals SA | 9,020,934 | | 2,135,786 |
Empresa Nacional de Telecomunicaciones SA (ENTEL) | 157,908 | | 3,126,254 |
TOTAL CHILE | | 5,262,040 |
China - 8.5% |
Baidu.com, Inc. sponsored ADR (a) | 19,515 | | 2,735,613 |
China Communications Construction Co. Ltd. (H Shares) | 3,568,000 | | 2,691,187 |
China Communications Services Corp. Ltd. (H Shares) | 4,928,000 | | 2,272,725 |
China Construction Bank Corp. (H Shares) | 10,290,000 | | 7,560,426 |
China Minsheng Banking Corp. Ltd. (H Shares) | 5,230,000 | | 4,260,457 |
China National Building Materials Co. Ltd. (H Shares) | 1,652,000 | | 2,116,056 |
China Pacific Insurance Group Co. Ltd. (H Shares) | 485,400 | | 1,489,542 |
China Petroleum & Chemical Corp.: | | | |
(H Shares) | 3,208,000 | | 3,033,903 |
sponsored ADR (H Shares) (d) | 21,600 | | 2,039,040 |
China Southern Airlines Ltd. (H Shares) (a) | 3,808,000 | | 2,125,094 |
Great Wall Motor Co. Ltd. (H Shares) | 1,607,500 | | 2,182,844 |
Harbin Power Equipment Co. Ltd. (H Shares) | 2,662,000 | | 2,682,598 |
Industrial & Commercial Bank of China Ltd. (H Shares) | 5,047,035 | | 3,151,688 |
SINA Corp. (a)(d) | 16,778 | | 1,363,884 |
Sinopec Shanghai Petrochemical Co. Ltd. (H Shares) | 3,946,000 | | 1,448,771 |
Yantai Changyu Pioneer Wine Co. (B Shares) | 227,939 | | 2,564,539 |
TOTAL CHINA | | 43,718,367 |
Common Stocks - continued |
| Shares | | Value |
Czech Republic - 1.7% |
Ceske Energeticke Zavody AS | 115,000 | | $ 4,863,391 |
Komercni Banka AS | 11,405 | | 2,199,640 |
Philip Morris CR A/S | 2,291 | | 1,504,301 |
TOTAL CZECH REPUBLIC | | 8,567,332 |
Egypt - 0.5% |
Commercial International Bank Ltd. sponsored GDR | 559,378 | | 2,471,332 |
Georgia - 0.2% |
Bank of Georgia GDR (Reg. S) | 70,400 | | 897,600 |
Hong Kong - 5.6% |
China Insurance International Holdings Co. Ltd. (a) | 1,157,800 | | 2,510,759 |
China Mobile (Hong Kong) Ltd. | 1,289,500 | | 12,255,849 |
China Power International Development Ltd. | 11,110,000 | | 2,350,869 |
CNOOC Ltd. | 4,280,000 | | 8,090,740 |
CNOOC Ltd. sponsored ADR | 10,100 | | 1,904,961 |
Dah Chong Hong Holdings Ltd. | 893,000 | | 1,084,491 |
Lenovo Group Ltd. | 912,000 | | 613,142 |
TOTAL HONG KONG | | 28,810,811 |
Hungary - 0.1% |
Magyar Telekom PLC | 209,500 | | 487,552 |
India - 4.2% |
Bank of Baroda | 208,283 | | 3,284,122 |
Bharti Airtel Ltd. | 406,724 | | 3,257,339 |
Housing Development Finance Corp. Ltd. | 375,185 | | 5,279,914 |
Indian Overseas Bank | 787,322 | | 1,649,998 |
Jain Irrigation Systems Ltd. | 59,911 | | 152,656 |
Punjab National Bank | 51,156 | | 1,042,125 |
Tata Consultancy Services Ltd. | 173,499 | | 3,946,720 |
Tata Steel Ltd. | 115,844 | | 1,140,764 |
Ultratech Cement Ltd. | 81,637 | | 1,927,525 |
TOTAL INDIA | | 21,681,163 |
Indonesia - 5.3% |
PT Astra International Tbk | 763,500 | | 5,887,159 |
PT Bank Negara Indonesia (Persero) Tbk | 5,202,000 | | 2,331,338 |
PT Bank Rakyat Indonesia Tbk | 8,428,500 | | 6,336,941 |
PT Bank Tabungan Negara Tbk | 7,825,500 | | 1,259,673 |
PT Bumi Serpong Damai Tbk | 11,588,100 | | 1,192,446 |
PT Ciputra Development Tbk | 14,439,000 | | 791,675 |
PT Gadjah Tunggal Tbk | 2,713,500 | | 829,783 |
PT Indofood Sukses Makmur Tbk | 4,061,000 | | 2,410,607 |
Common Stocks - continued |
| Shares | | Value |
Indonesia - continued |
PT Indosat Tbk | 3,834,000 | | $ 2,296,282 |
PT Summarecon Agung Tbk | 4,801,000 | | 628,283 |
PT Tower Bersama Infrastructure Tbk | 5,965,000 | | 1,388,255 |
PT XL Axiata Tbk | 3,921,000 | | 2,192,975 |
TOTAL INDONESIA | | 27,545,417 |
Israel - 0.4% |
Check Point Software Technologies Ltd. (a) | 40,400 | | 2,328,252 |
Kazakhstan - 0.5% |
KazMunaiGas Exploration & Production JSC (Reg. S) GDR | 153,077 | | 2,599,247 |
Korea (South) - 20.2% |
BS Financial Group, Inc. (a) | 210,130 | | 2,304,070 |
Cheil Worldwide, Inc. | 121,220 | | 1,977,459 |
CJ CheilJedang Corp. | 2,806 | | 771,471 |
CJ Corp. | 43,637 | | 3,114,675 |
Daum Communications Corp. | 12,149 | | 1,466,415 |
Doosan Co. Ltd. | 24,160 | | 3,043,618 |
GS Holdings Corp. | 55,755 | | 3,199,602 |
Hana Financial Group, Inc. | 132,830 | | 4,727,436 |
Hankook Tire Co. Ltd. | 43,210 | | 1,718,256 |
Hyundai Department Store Co. Ltd. | 22,660 | | 3,236,772 |
Hyundai Fire & Marine Insurance Co. Ltd. | 54,490 | | 1,571,917 |
Hyundai Heavy Industries Co. Ltd. | 17,618 | | 4,689,336 |
Hyundai Hysco Co. Ltd. | 52,900 | | 2,040,089 |
Hyundai Mobis | 18,065 | | 5,150,761 |
Hyundai Motor Co. | 55,432 | | 11,121,721 |
Industrial Bank of Korea | 304,090 | | 3,977,292 |
Kia Motors Corp. | 79,490 | | 5,077,242 |
Korea Zinc Co. Ltd. | 5,268 | | 1,538,334 |
KT&G Corp. | 83,609 | | 5,210,736 |
LG Chemical Ltd. | 7 | | 2,250 |
LIG Non-Life Insurance Co. Ltd. | 59,440 | | 1,260,591 |
Lotte Samkang Co. Ltd. | 1,974 | | 588,383 |
Nong Shim Co. Ltd. | 11,079 | | 2,162,906 |
Paradise Co. Ltd. | 260,483 | | 1,823,893 |
Samsung Card Co. Ltd. | 59,651 | | 2,226,967 |
Samsung Electronics Co. Ltd. | 26,052 | | 22,343,496 |
Shinhan Financial Group Co. Ltd. | 154,002 | | 6,112,112 |
SK Chemicals Co. Ltd. | 30,120 | | 1,919,741 |
TOTAL KOREA (SOUTH) | | 104,377,541 |
Common Stocks - continued |
| Shares | | Value |
Luxembourg - 0.7% |
Millicom International Cellular SA (depositary receipt) | 32,960 | | $ 3,632,422 |
Malaysia - 0.7% |
Axiata Group Bhd | 2,258,100 | | 3,569,053 |
Mauritius - 0.0% |
Golden Agri-Resources Ltd. | 3,000 | | 1,535 |
Mexico - 0.3% |
Embotelladoras Arca SAB de CC | 351,800 | | 1,669,182 |
Netherlands - 0.2% |
Yandex NV | 39,700 | | 1,092,544 |
Nigeria - 0.4% |
Guaranty Trust Bank PLC GDR (Reg. S) | 422,095 | | 1,941,637 |
Panama - 0.5% |
Copa Holdings SA Class A | 37,828 | | 2,612,780 |
Peru - 0.7% |
Compania de Minas Buenaventura SA sponsored ADR | 94,898 | | 3,884,175 |
Philippines - 0.2% |
Globe Telecom, Inc. | 46,070 | | 982,236 |
Poland - 0.7% |
Polska Grupa Energetyczna SA | 301,400 | | 1,857,452 |
TVN SA | 401,443 | | 1,606,832 |
TOTAL POLAND | | 3,464,284 |
Qatar - 0.1% |
Commercial Bank of Qatar GDR (Reg. S) | 68,433 | | 313,857 |
Russia - 5.8% |
Cherkizovo Group OJSC GDR (a) | 71,794 | | 1,001,269 |
Gazprom OAO sponsored ADR | 285,368 | | 3,313,122 |
Lukoil Oil Co. sponsored ADR | 99,715 | | 5,753,556 |
Mostotrest OAO (a) | 97,100 | | 558,156 |
NOVATEK OAO GDR | 54,698 | | 7,679,599 |
Rosneft Oil Co. OJSC GDR (Reg. S) | 184,400 | | 1,312,006 |
Sberbank of Russia (f) | 2,331,200 | | 6,325,780 |
TNK-BP Holding | 108,300 | | 296,311 |
Uralkali JSC GDR (Reg. S) | 88,000 | | 3,819,200 |
TOTAL RUSSIA | | 30,058,999 |
Singapore - 0.2% |
Sakari Resources Ltd. | 610,000 | | 1,139,058 |
South Africa - 2.6% |
African Bank Investments Ltd. | 711,047 | | 3,085,627 |
Common Stocks - continued |
| Shares | | Value |
South Africa - continued |
Foschini Ltd. | 250,578 | | $ 3,161,786 |
Imperial Holdings Ltd. | 137,851 | | 2,040,938 |
Life Healthcare Group Holdings Ltd. | 763,100 | | 1,856,717 |
Mr Price Group Ltd. | 193,100 | | 1,858,907 |
Northam Platinum Ltd. | 344,471 | | 1,334,688 |
TOTAL SOUTH AFRICA | | 13,338,663 |
Taiwan - 6.7% |
Catcher Technology Co. Ltd. | 580,000 | | 3,231,474 |
Chroma ATE, Inc. | 593,208 | | 1,183,577 |
Formosa Chemicals & Fibre Corp. | 2,000 | | 5,788 |
Formosa Plastics Corp. | 1,488,000 | | 4,376,345 |
Hotai Motor Co. Ltd. | 63,000 | | 274,075 |
HTC Corp. | 178,202 | | 4,004,832 |
Kinsus Interconnect Technology Corp. | 434,000 | | 1,498,950 |
Leofoo Development Co. Ltd. (a) | 823,000 | | 541,690 |
President Chain Store Corp. | 457,000 | | 2,541,257 |
SIMPLO Technology Co. Ltd. | 195,500 | | 1,150,355 |
Taishin Financial Holdings Co. Ltd. | 9,405,059 | | 3,982,272 |
Taiwan Cement Corp. | 3,307,804 | | 4,131,053 |
Taiwan Semiconductor Manufacturing Co. Ltd. | 3,057,534 | | 7,450,833 |
TOTAL TAIWAN | | 34,372,501 |
Thailand - 4.3% |
Advanced Info Service PCL (For. Reg.) | 1,202,700 | | 5,052,926 |
Asian Property Development PCL (For. Reg.) | 7,877,920 | | 1,151,443 |
Bangkok Expressway PCL (For.Reg.) | 173,300 | | 91,499 |
Banpu PCL (For. Reg.) | 65,650 | | 1,332,720 |
Charoen Pokphand Foods PCL (For. Reg.) | 1,219,000 | | 1,187,146 |
Krung Thai Bank PCL (For. Reg.) | 3,163,500 | | 1,548,055 |
PTT Global Chemical PCL (For. Reg.) (a) | 202,170 | | 426,317 |
PTT PCL (For. Reg.) | 330,600 | | 3,256,862 |
Siam Cement PCL (For. Reg.) | 212,200 | | 2,544,190 |
Siam Commercial Bank PCL (For. Reg.) | 1,412,200 | | 5,342,065 |
Total Access Communication PCL (For. Reg.) | 14,600 | | 34,782 |
TOTAL THAILAND | | 21,968,005 |
Turkey - 1.5% |
Aygaz A/S | 257,580 | | 1,407,167 |
Koc Holding AS | 337,000 | | 1,204,490 |
Common Stocks - continued |
| Shares | | Value |
Turkey - continued |
Tofas Turk Otomobil Fabrikasi AS | 396,670 | | $ 1,534,411 |
Turkiye Garanti Bankasi AS | 1,025,375 | | 3,618,459 |
TOTAL TURKEY | | 7,764,527 |
United Kingdom - 0.7% |
International Personal Finance PLC | 259,640 | | 1,144,930 |
Kazakhmys PLC | 171,600 | | 2,559,595 |
TOTAL UNITED KINGDOM | | 3,704,525 |
United States of America - 0.7% |
Cognizant Technology Solutions Corp. Class A (a) | 35,900 | | 2,611,725 |
Freeport-McMoRan Copper & Gold, Inc. | 25,000 | | 1,006,500 |
TOTAL UNITED STATES OF AMERICA | | 3,618,225 |
TOTAL COMMON STOCKS (Cost $479,594,161) |
506,711,287
|
Money Market Funds - 7.0% |
| | | |
Fidelity Cash Central Fund, 0.12% (b) | 12,103,407 | | 12,103,407 |
Fidelity Securities Lending Cash Central Fund, 0.11% (b)(c) | 24,032,425 | | 24,032,425 |
TOTAL MONEY MARKET FUNDS (Cost $36,135,832) |
36,135,832
|
TOTAL INVESTMENT PORTFOLIO - 105.2% (Cost $515,729,993) | | 542,847,119 |
NET OTHER ASSETS (LIABILITIES) - (5.2)% | | (26,752,906) |
NET ASSETS - 100% | $ 516,094,213 |
Legend |
(a) Non-income producing |
(b) Affiliated fund that is available only to investment companies and other accounts managed by Fidelity Investments. The rate quoted is the annualized seven-day yield of the fund at period end. A complete unaudited listing of the fund's holdings as of its most recent quarter end is available upon request. In addition, each Fidelity Central Fund's financial statements, which are not covered by the Fund's Report of Independent Registered Public Accounting Firm, are available on the SEC's website or upon request. |
(c) Investment made with cash collateral received from securities on loan. |
(d) Security or a portion of the security is on loan at period end. |
(e) Security exempt from registration under Rule 144A of the Securities Act of 1933. These securities may be resold in transactions exempt from registration, normally to qualified institutional buyers. At the end of the period, the value of these securities amounted to $2,215,135 or 0.4% of net assets. |
(f) Security or a portion of the security purchased on a delayed delivery or when-issued basis. |
Affiliated Central Funds |
Information regarding fiscal year to date income earned by the Fund from investments in Fidelity Central Funds is as follows: |
Fund | Income earned |
Fidelity Cash Central Fund | $ 7,900 |
Fidelity Securities Lending Cash Central Fund | 208,223 |
Total | $ 216,123 |
Other Information |
The following is a summary of the inputs used, as of October 31, 2011, involving the Fund's assets and liabilities carried at fair value. The inputs or methodology used for valuing securities may not be an indication of the risk associated with investing in those securities. For more information on valuation inputs, and their aggregation into the levels used in the table below, please refer to the Security Valuation section in the accompanying Notes to Financial Statements. |
Valuation Inputs at Reporting Date: |
Description | Total | Level 1 | Level 2 | Level 3 |
Investments in Securities: | | | | |
Equities: | | | | |
Korea (South) | $ 104,377,541 | $ - | $ 104,377,541 | $ - |
Brazil | 78,117,467 | 78,117,467 | - | - |
China | 43,718,367 | 6,138,537 | 37,579,830 | - |
Taiwan | 34,372,501 | - | 34,372,501 | - |
Russia | 30,058,999 | 30,058,999 | - | - |
Hong Kong | 28,810,811 | 1,904,961 | 26,905,850 | - |
Indonesia | 27,545,417 | - | 27,545,417 | - |
Thailand | 21,968,005 | - | 21,968,005 | - |
India | 21,681,163 | - | 21,681,163 | - |
Other | 116,061,016 | 88,539,742 | 27,521,274 | - |
Money Market Funds | 36,135,832 | 36,135,832 | - | - |
Total Investments in Securities: | $ 542,847,119 | $ 240,895,538 | $ 301,951,581 | $ - |
Transfers from Level 1 to Level 2 during the period were $175,991,065. |
Income Tax Information |
At October 31, 2011, the Fund had a capital loss carryforward of approximately $70,963,758 all of which will expire in fiscal 2017. Capital loss carryforwards are only available to offset future capital gains of the Fund to the extent provided by regulations and may be limited. |
See accompanying notes which are an integral part of the financial statements.
Annual Report
Statement of Assets and Liabilities
| October 31, 2011 |
| | |
Assets | | |
Investment in securities, at value (including securities loaned of $22,529,650) - See accompanying schedule: Unaffiliated issuers (cost $479,594,161) | $ 506,711,287 | |
Fidelity Central Funds (cost $36,135,832) | 36,135,832 | |
Total Investments (cost $515,729,993) | | $ 542,847,119 |
Cash | | 59,010 |
Foreign currency held at value (cost $120,091) | | 120,327 |
Receivable for investments sold | | 9,923,111 |
Receivable for fund shares sold | | 435,050 |
Dividends receivable | | 863,941 |
Distributions receivable from Fidelity Central Funds | | 3,383 |
Prepaid expenses | | 2,245 |
Other receivables | | 150,712 |
Total assets | | 554,404,898 |
| | |
Liabilities | | |
Payable for investments purchased
Regular delivery | $ 11,512,990 | |
Delayed delivery | 544,208 | |
Payable for fund shares redeemed | 1,476,075 | |
Accrued management fee | 331,950 | |
Distribution and service plan fees payable | 150,229 | |
Other affiliated payables | 144,341 | |
Other payables and accrued expenses | 118,467 | |
Collateral on securities loaned, at value | 24,032,425 | |
Total liabilities | | 38,310,685 |
| | |
Net Assets | | $ 516,094,213 |
Net Assets consist of: | | |
Paid in capital | | $ 564,650,323 |
Undistributed net investment income | | 2,180,940 |
Accumulated undistributed net realized gain (loss) on investments and foreign currency transactions | | (77,792,055) |
Net unrealized appreciation (depreciation) on investments and assets and liabilities in foreign currencies | | 27,055,005 |
Net Assets | | $ 516,094,213 |
See accompanying notes which are an integral part of the financial statements.
Annual Report
Statement of Assets and Liabilities - continued
| October 31, 2011 |
| | |
Calculation of Maximum Offering Price Class A:
Net Asset Value and redemption price per share ($202,477,116 ÷ 9,874,684 shares) | | $ 20.50 |
| | |
Maximum offering price per share (100/94.25 of $20.50) | | $ 21.75 |
Class T:
Net Asset Value and redemption price per share ($73,146,470 ÷ 3,580,925 shares) | | $ 20.43 |
| | |
Maximum offering price per share (100/96.50 of $20.43) | | $ 21.17 |
Class B:
Net Asset Value and offering price per share ($21,303,616 ÷ 1,063,635 shares)A | | $ 20.03 |
| | |
Class C:
Net Asset Value and offering price per share ($80,855,457 ÷ 4,042,960 shares)A | | $ 20.00 |
| | |
| | |
Institutional Class:
Net Asset Value, offering price and redemption price per share ($138,311,554 ÷ 6,704,037 shares) | | $ 20.63 |
A Redemption price per share is equal to net asset value less any applicable contingent deferred sales charge.
See accompanying notes which are an integral part of the financial statements.
Annual Report
Financial Statements - continued
Statement of Operations
| Year ended October 31, 2011 |
| | |
Investment Income | | |
Dividends | | $ 17,261,482 |
Interest | | 4,047 |
Income from Fidelity Central Funds | | 216,123 |
Income before foreign taxes withheld | | 17,481,652 |
Less foreign taxes withheld | | (1,780,223) |
Total income | | 15,701,429 |
| | |
Expenses | | |
Management fee | $ 5,313,198 | |
Transfer agent fees | 1,881,504 | |
Distribution and service plan fees | 2,433,212 | |
Accounting and security lending fees | 329,547 | |
Custodian fees and expenses | 607,708 | |
Independent trustees' compensation | 3,689 | |
Registration fees | 99,322 | |
Audit | 76,331 | |
Legal | 2,750 | |
Interest | 759 | |
Miscellaneous | 6,064 | |
Total expenses before reductions | 10,754,084 | |
Expense reductions | (424,291) | 10,329,793 |
Net investment income (loss) | | 5,371,636 |
Realized and Unrealized Gain (Loss) Net realized gain (loss) on: | | |
Investment securities: | | |
Unaffiliated issuers | 52,328,302 | |
Foreign currency transactions | (1,019,132) | |
Total net realized gain (loss) | | 51,309,170 |
Change in net unrealized appreciation (depreciation) on: Investment securities (net of decrease in deferred foreign taxes of $557,002) | (134,107,578) | |
Assets and liabilities in foreign currencies | (62,766) | |
Total change in net unrealized appreciation (depreciation) | | (134,170,344) |
Net gain (loss) | | (82,861,174) |
Net increase (decrease) in net assets resulting from operations | | $ (77,489,538) |
See accompanying notes which are an integral part of the financial statements.
Annual Report
Statement of Changes in Net Assets
| Year ended
October 31,
2011 | Year ended
October 31,
2010 |
Increase (Decrease) in Net Assets | | |
Operations | | |
Net investment income (loss) | $ 5,371,636 | $ 2,925,139 |
Net realized gain (loss) | 51,309,170 | 51,525,426 |
Change in net unrealized appreciation (depreciation) | (134,170,344) | 78,533,647 |
Net increase (decrease) in net assets resulting
from operations | (77,489,538) | 132,984,212 |
Distributions to shareholders from net investment income | (3,137,543) | (1,614,133) |
Distributions to shareholders from net realized gain | (3,336,770) | (3,680,474) |
Total distributions | (6,474,313) | (5,294,607) |
Share transactions - net increase (decrease) | (114,129,705) | 64,839,760 |
Redemption fees | 141,338 | 140,252 |
Total increase (decrease) in net assets | (197,952,218) | 192,669,617 |
| | |
Net Assets | | |
Beginning of period | 714,046,431 | 521,376,814 |
End of period (including undistributed net investment income of $2,180,940 and undistributed net investment income of $2,876,119, respectively) | $ 516,094,213 | $ 714,046,431 |
See accompanying notes which are an integral part of the financial statements.
Annual Report
Financial Highlights - Class A
Years ended October 31, | 2011 | 2010 | 2009 | 2008 | 2007 |
Selected Per-Share Data | | | | | |
Net asset value, beginning of period | $ 23.71 | $ 19.20 | $ 12.59 | $ 32.75 | $ 19.22 |
Income from Investment Operations | | | | | |
Net investment income (loss) C | .21 | .12 | .10 | .24 | .09 |
Net realized and unrealized gain (loss) | (3.19) | 4.59 | 6.64 | (19.61) | 13.46 |
Total from investment operations | (2.98) | 4.71 | 6.74 | (19.37) | 13.55 |
Distributions from net investment income | (.11) | (.07) | (.14) | (.02) | (.03) |
Distributions from net realized gain | (.13) | (.13) | - | (.79) | - |
Total distributions | (.24) | (.20) | (.14) | (.81) | (.03) |
Redemption fees added to paid in capital C | .01 | - G | .01 | .02 | .01 |
Net asset value, end of period | $ 20.50 | $ 23.71 | $ 19.20 | $ 12.59 | $ 32.75 |
Total Return A, B | (12.69)% | 24.69% | 54.54% | (60.55)% | 70.63% |
Ratios to Average Net Assets D, F | | | | | |
Expenses before reductions | 1.54% | 1.56% | 1.60% | 1.59% | 1.59% |
Expenses net of fee waivers, if any | 1.54% | 1.56% | 1.60% | 1.59% | 1.59% |
Expenses net of all reductions | 1.47% | 1.50% | 1.53% | 1.53% | 1.54% |
Net investment income (loss) | .92% | .59% | .70% | .94% | .36% |
Supplemental Data | | | | | |
Net assets, end of period (000 omitted) | $ 202,477 | $ 286,970 | $ 216,187 | $ 122,911 | $ 218,836 |
Portfolio turnover rate E | 122% | 86% | 85% | 61% | 48% |
A Total returns would have been lower if certain expenses had not been reduced during the applicable periods shown.
B Total returns do not include the effect of the sales charges.
C Calculated based on average shares outstanding during the period.
D Fees and expenses of any underlying Fidelity Central Funds are not included in the Fund's expense ratio. The Fund indirectly bears its proportionate share of the expenses of any underlying Fidelity Central Funds.
E Amount does not include the portfolio activity of any underlying Fidelity Central Funds.
F Expense ratios reflect operating expenses of the class. Expenses before reductions do not reflect amounts reimbursed by the investment adviser or reductions from brokerage service arrangements or reductions from other expense offset arrangements and do not represent the amount paid by the class during periods when reimbursements or reductions occur. Expenses net of fee waivers reflect expenses after reimbursement by the investment adviser but prior to reductions from brokerage service arrangements or other expense offset arrangements. Expenses net of all reductions represent the net expenses paid by the class.
G Amount represents less than $.01 per share.
See accompanying notes which are an integral part of the financial statements.
Annual Report
Financial Highlights - Class T
Years ended October 31, | 2011 | 2010 | 2009 | 2008 | 2007 |
Selected Per-Share Data | | | | | |
Net asset value, beginning of period | $ 23.61 | $ 19.14 | $ 12.49 | $ 32.52 | $ 19.10 |
Income from Investment Operations | | | | | |
Net investment income (loss) C | .15 | .07 | .07 | .17 | .03 |
Net realized and unrealized gain (loss) | (3.18) | 4.57 | 6.64 | (19.48) | 13.38 |
Total from investment operations | (3.03) | 4.64 | 6.71 | (19.31) | 13.41 |
Distributions from net investment income | (.04) | (.04) | (.07) | - | - |
Distributions from net realized gain | (.13) | (.13) | - | (.74) | - |
Total distributions | (.16) H | (.17) | (.07) | (.74) | - |
Redemption fees added to paid in capital C | .01 | - G | .01 | .02 | .01 |
Net asset value, end of period | $ 20.43 | $ 23.61 | $ 19.14 | $ 12.49 | $ 32.52 |
Total Return A, B | (12.89)% | 24.38% | 54.17% | (60.66)% | 70.26% |
Ratios to Average Net Assets D, F | | | | | |
Expenses before reductions | 1.79% | 1.81% | 1.87% | 1.84% | 1.86% |
Expenses net of fee waivers, if any | 1.79% | 1.81% | 1.85% | 1.84% | 1.85% |
Expenses net of all reductions | 1.73% | 1.76% | 1.78% | 1.79% | 1.79% |
Net investment income (loss) | .66% | .33% | .44% | .69% | .11% |
Supplemental Data | | | | | |
Net assets, end of period (000 omitted) | $ 73,146 | $ 104,417 | $ 86,959 | $ 47,300 | $ 119,952 |
Portfolio turnover rate E | 122% | 86% | 85% | 61% | 48% |
A Total returns would have been lower if certain expenses had not been reduced during the applicable periods shown.
B Total returns do not include the effect of the sales charges.
C Calculated based on average shares outstanding during the period.
D Fees and expenses of any underlying Fidelity Central Funds are not included in the Fund's expense ratio. The Fund indirectly bears its proportionate share of the expenses of any underlying Fidelity Central Funds.
E Amount does not include the portfolio activity of any underlying Fidelity Central Funds.
F Expense ratios reflect operating expenses of the class. Expenses before reductions do not reflect amounts reimbursed by the investment adviser or reductions from brokerage service arrangements or reductions from other expense offset arrangements and do not represent the amount paid by the class during periods when reimbursements or reductions occur. Expenses net of fee waivers reflect expenses after reimbursement by the investment adviser but prior to reductions from brokerage service arrangements or other expense offset arrangements. Expenses net of all reductions represent the net expenses paid by the class.
G Amount represents less than $.01 per share.
H Total distributions of $.16 per share is comprised of distributions from net investment income of $.037 and distributions from net realized gain of $.125 per share.
See accompanying notes which are an integral part of the financial statements.
Annual Report
Financial Highlights - Class B
Years ended October 31, | 2011 | 2010 | 2009 | 2008 | 2007 |
Selected Per-Share Data | | | | | |
Net asset value, beginning of period | $ 23.14 | $ 18.80 | $ 12.26 | $ 32.03 | $ 18.91 |
Income from Investment Operations | | | | | |
Net investment income (loss) C | .04 | (.03) | (.01) | .04 | (.09) |
Net realized and unrealized gain (loss) | (3.13) | 4.49 | 6.55 | (19.13) | 13.20 |
Total from investment operations | (3.09) | 4.46 | 6.54 | (19.09) | 13.11 |
Distributions from net investment income | (.01) | - | - | - | - |
Distributions from net realized gain | (.03) | (.12) | - | (.70) | - |
Total distributions | (.03) H | (.12) | - | (.70) | - |
Redemption fees added to paid in capital C | .01 | - G | - G | .02 | .01 |
Net asset value, end of period | $ 20.03 | $ 23.14 | $ 18.80 | $ 12.26 | $ 32.03 |
Total Return A, B | (13.33)% | 23.77% | 53.34% | (60.83)% | 69.38% |
Ratios to Average Net Assets D, F | | | | | |
Expenses before reductions | 2.29% | 2.32% | 2.36% | 2.35% | 2.37% |
Expenses net of fee waivers, if any | 2.29% | 2.32% | 2.35% | 2.35% | 2.35% |
Expenses net of all reductions | 2.22% | 2.26% | 2.28% | 2.30% | 2.29% |
Net investment income (loss) | .16% | (.17)% | (.05)% | .18% | (.39)% |
Supplemental Data | | | | | |
Net assets, end of period (000 omitted) | $ 21,304 | $ 31,159 | $ 27,580 | $ 17,307 | $ 41,042 |
Portfolio turnover rate E | 122% | 86% | 85% | 61% | 48% |
A Total returns would have been lower if certain expenses had not been reduced during the applicable periods shown.
B Total returns do not include the effect of the contingent deferred sales charge.
C Calculated based on average shares outstanding during the period.
D Fees and expenses of any underlying Fidelity Central Funds are not included in the Fund's expense ratio. The Fund indirectly bears its proportionate share of the expenses of any underlying Fidelity Central Funds.
E Amount does not include the portfolio activity of any underlying Fidelity Central Funds.
F Expense ratios reflect operating expenses of the class. Expenses before reductions do not reflect amounts reimbursed by the investment adviser or reductions from brokerage service arrangements or reductions from other expense offset arrangements and do not represent the amount paid by the class during periods when reimbursements or reductions occur. Expenses net of fee waivers reflect expenses after reimbursement by the investment adviser but prior to reductions from brokerage service arrangements or other expense offset arrangements. Expenses net of all reductions represent the net expenses paid by the class.
G Amount represents less than $.01 per share.
H Total distributions of $.03 per share is comprised of distributions from net investment income of $.005 and distributions from net realized gain of $.025 per share.
See accompanying notes which are an integral part of the financial statements.
Annual Report
Financial Highlights - Class C
Years ended October 31, | 2011 | 2010 | 2009 | 2008 | 2007 |
Selected Per-Share Data | | | | | |
Net asset value, beginning of period | $ 23.13 | $ 18.80 | $ 12.26 | $ 32.04 | $ 18.91 |
Income from Investment Operations | | | | | |
Net investment income (loss) C | .04 | (.03) | (.01) | .05 | (.09) |
Net realized and unrealized gain (loss) | (3.12) | 4.49 | 6.54 | (19.15) | 13.21 |
Total from investment operations | (3.08) | 4.46 | 6.53 | (19.10) | 13.12 |
Distributions from net investment income | (.01) | - | - | - | - |
Distributions from net realized gain | (.05) | (.13) | - | (.70) | - |
Total distributions | (.06) | (.13) | - | (.70) | - |
Redemption fees added to paid in capital C | .01 | - G | .01 | .02 | .01 |
Net asset value, end of period | $ 20.00 | $ 23.13 | $ 18.80 | $ 12.26 | $ 32.04 |
Total Return A, B | (13.33)% | 23.80% | 53.34% | (60.84)% | 69.43% |
Ratios to Average Net Assets D, F | | | | | |
Expenses before reductions | 2.28% | 2.30% | 2.34% | 2.34% | 2.34% |
Expenses net of fee waivers, if any | 2.28% | 2.30% | 2.34% | 2.34% | 2.34% |
Expenses net of all reductions | 2.22% | 2.24% | 2.28% | 2.29% | 2.29% |
Net investment income (loss) | .17% | (.15)% | (.05)% | .19% | (.39)% |
Supplemental Data | | | | | |
Net assets, end of period (000 omitted) | $ 80,855 | $ 106,711 | $ 83,939 | $ 44,878 | $ 104,885 |
Portfolio turnover rate E | 122% | 86% | 85% | 61% | 48% |
A Total returns would have been lower if certain expenses had not been reduced during the applicable periods shown.
B Total returns do not include the effect of the contingent deferred sales charge.
C Calculated based on average shares outstanding during the period.
D Fees and expenses of any underlying Fidelity Central Funds are not included in the Fund's expense ratio. The Fund indirectly bears its proportionate share of the expenses of any underlying Fidelity Central Funds.
E Amount does not include the portfolio activity of any underlying Fidelity Central Funds.
F Expense ratios reflect operating expenses of the class. Expenses before reductions do not reflect amounts reimbursed by the investment adviser or reductions from brokerage service arrangements or reductions from other expense offset arrangements and do not represent the amount paid by the class during periods when reimbursements or reductions occur. Expenses net of fee waivers reflect expenses after reimbursement by the investment adviser but prior to reductions from brokerage service arrangements or other expense offset arrangements. Expenses net of all reductions represent the net expenses paid by the class.
G Amount represents less than $.01 per share.
See accompanying notes which are an integral part of the financial statements.
Annual Report
Financial Highlights - Institutional Class
Years ended October 31, | 2011 | 2010 | 2009 | 2008 | 2007 |
Selected Per-Share Data | | | | | |
Net asset value, beginning of period | $ 23.87 | $ 19.29 | $ 12.71 | $ 33.02 | $ 19.34 |
Income from Investment Operations | | | | | |
Net investment income (loss) B | .29 | .20 | .15 | .31 | .18 |
Net realized and unrealized gain (loss) | (3.21) | 4.62 | 6.65 | (19.76) | 13.55 |
Total from investment operations | (2.92) | 4.82 | 6.80 | (19.45) | 13.73 |
Distributions from net investment income | (.20) | (.11) | (.23) | (.09) | (.06) |
Distributions from net realized gain | (.13) | (.13) | - | (.79) | - |
Total distributions | (.33) | (.24) | (.23) | (.88) | (.06) |
Redemption fees added to paid in capital B | .01 | - F | .01 | .02 | .01 |
Net asset value, end of period | $ 20.63 | $ 23.87 | $ 19.29 | $ 12.71 | $ 33.02 |
Total Return A | (12.41)% | 25.15% | 54.97% | (60.42)% | 71.23% |
Ratios to Average Net Assets C, E | | | | | |
Expenses before reductions | 1.21% | 1.22% | 1.30% | 1.27% | 1.25% |
Expenses net of fee waivers, if any | 1.21% | 1.22% | 1.30% | 1.27% | 1.25% |
Expenses net of all reductions | 1.14% | 1.17% | 1.23% | 1.21% | 1.19% |
Net investment income (loss) | 1.25% | .93% | .99% | 1.26% | .71% |
Supplemental Data | | | | | |
Net assets, end of period (000 omitted) | $ 138,312 | $ 184,789 | $ 106,713 | $ 47,557 | $ 52,011 |
Portfolio turnover rate D | 122% | 86% | 85% | 61% | 48% |
A Total returns would have been lower if certain expenses had not been reduced during the applicable periods shown.
B Calculated based on average shares outstanding during the period.
C Fees and expenses of any underlying Fidelity Central Funds are not included in the Fund's expense ratio. The Fund indirectly bears its proportionate share of the expenses of any underlying Fidelity Central Funds.
D Amount does not include the portfolio activity of any underlying Fidelity Central Funds.
E Expense ratios reflect operating expenses of the class. Expenses before reductions do not reflect amounts reimbursed by the investment adviser or reductions from brokerage service arrangements or reductions from other expense offset arrangements and do not represent the amount paid by the class during periods when reimbursements or reductions occur. Expenses net of fee waivers reflect expenses after reimbursement by the investment adviser but prior to reductions from brokerage service arrangements or other expense offset arrangements. Expenses net of all reductions represent the net expenses paid by the class.
F Amount represents less than $.01 per share.
See accompanying notes which are an integral part of the financial statements.
Annual Report
Notes to Financial Statements
For the period ended October 31, 2011
1. Organization.
Fidelity Advisor Emerging Markets Fund (the Fund) is a fund of Fidelity Advisor Series VIII (the Trust) and is authorized to issue an unlimited number of shares. The Trust is registered under the Investment Company Act of 1940, as amended (the 1940 Act), as an open-end management investment company organized as a Massachusetts business trust. The Fund offers Class A, Class T, Class C and Institutional Class shares, each of which, along with Class B shares, has equal rights as to assets and voting privileges. Effective after the close of business on September 1, 2010, Class B shares were closed to new accounts and additional purchases, except for exchanges and reinvestments by existing shareholders. Each class has exclusive voting rights with respect to matters that affect that class. Class B shares will automatically convert to Class A shares after a holding period of seven years from the initial date of purchase. Investment income, realized and unrealized capital gains and losses, the common expenses of the Fund, and certain fund-level expense reductions, if any, are allocated on a pro-rata basis to each class based on the relative net assets of each class to the total net assets of the Fund. Each class differs with respect to transfer agent and distribution and service plan fees incurred. Certain expense reductions may also differ by class. The Fund's investments in emerging markets can be subject to social, economic, regulatory, and political uncertainties and can be extremely volatile.
2. Investments in Fidelity Central Funds.
The Fund invests in Fidelity Central Funds, which are open-end investment companies available only to other investment companies and accounts managed by Fidelity Management & Research Company (FMR) and its affiliates. The Fund's Schedule of Investments lists each of the Fidelity Central Funds held as of period end, if any, as an investment of the Fund, but does not include the underlying holdings of each Fidelity Central Fund. As an Investing Fund, the Fund indirectly bears its proportionate share of the expenses of the underlying Fidelity Central Funds.
The Money Market Central Funds seek preservation of capital and current income and are managed by Fidelity Investments Money Management, Inc. (FIMM), an affiliate of FMR.
A complete unaudited list of holdings for each Fidelity Central Fund is available upon request or at the Securities and Exchange Commission (the SEC) web site at www.sec.gov. In addition, the financial statements of the Fidelity Central Funds, which are not covered by the Fund's Report of Independent Registered Public Accounting Firm are available on the SEC web site or upon request.
Annual Report
3. Significant Accounting Policies.
The financial statements have been prepared in conformity with accounting principles generally accepted in the United States of America (GAAP), which require management to make certain estimates and assumptions at the date of the financial statements. Actual results could differ from those estimates. Subsequent events, if any, through the date that the financial statements were issued have been evaluated in the preparation of the financial statements. The following summarizes the significant accounting policies of the Fund:
Security Valuation. Investments are valued as of 4:00 p.m. Eastern time on the last calendar day of the period. The Fund uses independent pricing services approved by the Board of Trustees to value its investments. When current market prices or quotations are not readily available or reliable, valuations may be determined in good faith in accordance with procedures adopted by the Board of Trustees. Factors used in determining value may include market or security specific events. The frequency with which these procedures are used cannot be predicted and they may be utilized to a significant extent. The value used for net asset value (NAV) calculation under these procedures may differ from published prices for the same securities.
The Fund categorizes the inputs to valuation techniques used to value its investments into a disclosure hierarchy consisting of three levels as shown below:
Level 1 - quoted prices in active markets for identical investments
Level 2 - other significant observable inputs (including quoted prices for similar investments, interest rates, prepayment speeds, etc.)
Level 3 - unobservable inputs (including the Fund's own assumptions based on the best information available)
Changes in valuation techniques may result in transfers in or out of an assigned level within the disclosure hierarchy. The aggregate value of investments by input level, as of October 31, 2011, is included at the end of the Fund's Schedule of Investments. Valuation techniques used to value the Fund's investments by major category are as follows:
Equity securities, including restricted securities, for which market quotations are readily available, are valued at the last reported sale price or official closing price as reported by an independent pricing service on the primary market or exchange on which they are traded and are categorized as Level 1 in the hierarchy. In the event there were no sales during the day or closing prices are not available, securities are valued at the last quoted bid price or may be valued using the last available price and are generally categorized as Level 2 in the hierarchy. For foreign equity securities, when significant market or security specific events arise, comparisons to the valuation of American Depositary Receipts
Annual Report
Notes to Financial Statements - continued
3. Significant Accounting Policies - continued
Security Valuation - continued
(ADRs), futures contracts, Exchange-traded funds (ETFs) and certain indexes as well as quoted prices for similar securities are used and are categorized as Level 2 in the hierarchy in these circumstances. Utilizing these techniques may result in transfers between Level 1 and Level 2. For restricted equity securities and private placements where observable inputs are limited, assumptions about market activity and risk are used and are categorized as Level 3 in the hierarchy.
Investments in open-end mutual funds, including the Fidelity Central Funds, are valued at their closing net asset value each business day and are categorized as Level 1 in the hierarchy.
Foreign Currency. The Fund may use foreign currency contracts to facilitate transactions in foreign-denominated securities. Gains and losses from these transactions may arise from changes in the value of the foreign currency or if the counterparties do not perform under the contracts' terms.
Foreign-denominated assets, including investment securities, and liabilities are translated into U.S. dollars at the exchange rate at period end. Purchases and sales of investment securities, income and dividends received and expenses denominated in foreign currencies are translated into U.S. dollars at the exchange rate in effect on the transaction date.
The effects of exchange rate fluctuations on investments are included with the net realized and unrealized gain (loss) on investment securities. Other foreign currency transactions resulting in realized and unrealized gain (loss) are disclosed separately.
Investment Transactions and Income. For financial reporting purposes, the Fund's investment holdings and NAV include trades executed through the end of the last business day of the period. The NAV per share for processing shareholder transactions is calculated as of the close of business of the New York Stock Exchange (NYSE), normally 4:00 p.m. Eastern time and includes trades executed through the end of the prior business day. Gains and losses on securities sold are determined on the basis of identified cost. Dividend income is recorded on the ex-dividend date, except for certain dividends from foreign securities where the ex-dividend date may have passed, which are recorded as soon as the Fund is informed of the ex-dividend date. Non-cash dividends included in dividend income, if any, are recorded at the fair market value of the securities received. Distributions received on securities that represent a return of capital or capital gain are recorded as a reduction of cost of investments and/or as a realized gain. The Fund estimates the components of distributions received that may be considered return of capital distributions or capital gain distributions. Interest income and distributions from the Fidelity Central Funds are accrued as earned. Interest income includes coupon
Annual Report
3. Significant Accounting Policies - continued
Investment Transactions and Income - continued
interest and amortization of premium and accretion of discount on debt securities. Investment income is recorded net of foreign taxes withheld where recovery of such taxes is uncertain.
Expenses. Expenses directly attributable to a fund are charged to that fund. Expenses attributable to more than one fund are allocated among the respective funds on the basis of relative net assets or other appropriate methods. Expense estimates are accrued in the period to which they relate and adjustments are made when actual amounts are known.
Income Tax Information and Distributions to Shareholders. Each year, the Fund intends to qualify as a regulated investment company, including distributing substantially all of its taxable income and realized gains under Subchapter M of the Internal Revenue Code and filing its U.S. federal tax return. As a result, no provision for income taxes is required. As of October 31, 2011, the Fund did not have any unrecognized tax benefits in the financial statements. A fund's federal tax return is subject to examination by the Internal Revenue Service (IRS) for a period of three years. Foreign taxes are provided for based on the Fund's understanding of the tax rules and rates that exist in the foreign markets in which it invests.
Distributions are declared and recorded on the ex-dividend date. Income dividends and capital gain distributions are declared separately for each class. Income and capital gain distributions are determined in accordance with income tax regulations, which may differ from GAAP.
Capital accounts within the financial statements are adjusted for permanent book-tax differences. These adjustments have no impact on net assets or the results of operations. Temporary book-tax differences will reverse in a subsequent period.
Book-tax differences are primarily due to foreign currency transactions, certain foreign taxes, passive foreign investment companies (PFIC), capital loss carryforwards and losses deferred due to wash sales.
The federal tax cost of investment securities and unrealized appreciation (depreciation) as of period end were as follows:
Gross unrealized appreciation | $ 60,308,189 |
Gross unrealized depreciation | (40,019,364) |
Net unrealized appreciation (depreciation) on securities and other investments | $ 20,288,825 |
| |
Tax Cost | $ 522,558,294 |
Annual Report
Notes to Financial Statements - continued
3. Significant Accounting Policies - continued
Income Tax Information and Distributions to Shareholders - continued
The tax-based components of distributable earnings as of period end were as follows:
Undistributed ordinary income | $ 2,180,940 |
Capital loss carryforward | $ (70,963,758) |
Net unrealized appreciation (depreciation) | $ 20,226,704 |
Under the recently enacted Regulated Investment Company Modernization Act of 2010 (the Act), the Fund will be permitted to carry forward capital losses incurred in taxable years beginning after December 22, 2010 for an unlimited period. However, any losses incurred during those future taxable years will be required to be utilized prior to any losses incurred in pre-enactment taxable years, which generally expire after eight years from when they are incurred. Additionally, post-enactment capital losses that are carried forward will retain their character as either short-term or long-term capital losses rather than being considered all short-term as under previous law. The Fund's first fiscal year end subject to the Act will be October 31, 2012.
The tax character of distributions paid was as follows:
| October 31, 2011 | October 31, 2010 |
Ordinary Income | $ 6,474,313 | $ 5,294,607 |
Short-Term Trading (Redemption) Fees. Shares held by investors in the Fund less than 90 days are subject to a redemption fee equal to 1.50% of the net asset value of shares redeemed. All redemption fees, which reduce the proceeds of the shareholder redemption, are retained by the Fund and accounted for as an addition to paid in capital.
New Accounting Pronouncement. In May 2011, the Financial Accounting Standards Board issued Accounting Standard Update No. 2011-04, Fair Value Measurement (Topic 820) - Amendments to Achieve Common Fair Value Measurement and Disclosure Requirements in U.S. GAAP and IFRSs. The update changes the wording used to describe the requirements in GAAP for measuring fair value and for disclosing information about fair value measurements. The update is effective during interim and annual periods beginning after December 15, 2011. Management is currently evaluating the impact of the update's adoption on the Fund's financial statement disclosures.
Annual Report
4. Operating Policies.
Delayed Delivery Transactions and When-Issued Securities. During the period, the Fund transacted in securities on a delayed delivery or when-issued basis. Payment and delivery may take place after the customary settlement period for that security. The price of the underlying securities and the date when the securities will be delivered and paid for are fixed at the time the transaction is negotiated. During the time a delayed delivery sell is outstanding, the contract is marked-to-market daily and equivalent deliverable securities are held for the transaction. The securities purchased on a delayed delivery or when-issued basis are identified as such in the Fund's Schedule of Investments. The Fund may receive compensation for interest forgone in the purchase of a delayed delivery or when-issued security. With respect to purchase commitments, the Fund identifies securities as segregated in its records with a value at least equal to the amount of the commitment. Losses may arise due to changes in the value of the underlying securities or if the counterparty does not perform under the contract's terms, or if the issuer does not issue the securities due to political, economic, or other factors.
Restricted Securities. The Fund may invest in securities that are subject to legal or contractual restrictions on resale. These securities generally may be resold in transactions exempt from registration or to the public if the securities are registered. Disposal of these securities may involve time-consuming negotiations and expense, and prompt sale at an acceptable price may be difficult. Information regarding restricted securities is included at the end of the Fund's Schedule of Investments.
5. Purchases and Sales of Investments.
Purchases and sales of securities, other than short-term securities, aggregated $793,493,102 and $904,699,290, respectively.
6. Fees and Other Transactions with Affiliates.
Management Fee. FMR and its affiliates provide the Fund with investment management related services for which the Fund pays a monthly management fee. The management fee is the sum of an individual fund fee rate that is based on an annual rate of .55% of the Fund's average net assets and a group fee rate that averaged .26% during the period. The group fee rate is based upon the average net assets of all the mutual funds advised by FMR. The group fee rate decreases as assets under management increase and increases as assets under management decrease. For the period, the total annual management fee rate was .81% of the Fund's average net assets.
Annual Report
Notes to Financial Statements - continued
6. Fees and Other Transactions with Affiliates - continued
Distribution and Service Plan Fees. In accordance with Rule 12b-1 of the 1940 Act, the Fund has adopted separate Distribution and Service Plans for each class of shares. Certain classes pay Fidelity Distributors Corporation (FDC), an affiliate of FMR, separate Distribution and Service Fees, each of which is based on an annual percentage of each class' average net assets. In addition, FDC may pay financial intermediaries for selling shares of the Fund and providing shareholder support services. For the period, the Distribution and Service Fee rates, total fees and amounts retained by FDC were as follows:
| Distribution
Fee | Service
Fee | Total Fees | Retained
by FDC |
Class A | -% | .25% | $ 670,844 | $ 17,761 |
Class T | .25% | .25% | 474,396 | 1,623 |
Class B | .75% | .25% | 278,324 | 208,937 |
Class C | .75% | .25% | 1,009,648 | 156,329 |
| | | $ 2,433,212 | $ 384,650 |
Sales Load. FDC may receive a front-end sales charge of up to 5.75% for selling Class A shares, and 3.50% for selling Class T shares, some of which is paid to financial intermediaries for selling shares of the Fund. Depending on the holding period, FDC may receive contingent deferred sales charges levied on Class A, Class T, Class B, and Class C redemptions. The deferred sales charges range from 5% to 1% for Class B, 1% for Class C, 1.00% for certain purchases of Class A shares and .25% for certain purchases of Class T shares.
For the period, sales charge amounts retained by FDC were as follows:
| Retained
by FDC |
Class A | $ 99,047 |
Class T | 22,366 |
Class B* | 60,646 |
Class C* | 11,255 |
| $ 193,314 |
* When Class B and Class C shares are initially sold, FDC pays commissions from its own resources to financial intermediaries through which the sales are made.
Transfer Agent Fees. Fidelity Investments Institutional Operations Company, Inc. (FIIOC), an affiliate of FMR, is the transfer, dividend disbursing and shareholder servicing agent for each class of the Fund. FIIOC receives account fees and asset-based fees that vary according to the account size and type of account of the shareholders of the respective classes of the Fund. FIIOC pays for typesetting, printing and mailing of shareholder reports, except proxy statements.
Annual Report
6. Fees and Other Transactions with Affiliates - continued
Transfer Agent Fees - continued
For the period, transfer agent fees for each class were as follows:
| Amount | % of
Average
Net Assets |
Class A | $ 820,854 | .31 |
Class T | 296,239 | .31 |
Class B | 85,544 | .31 |
Class C | 301,434 | .30 |
Institutional Class | 377,433 | .23 |
| $ 1,881,504 | |
Accounting and Security Lending Fees. Fidelity Service Company, Inc. (FSC), an affiliate of FMR, maintains the Fund's accounting records. The accounting fee is based on the level of average net assets for the month. Under a separate contract, FSC administers the security lending program. The security lending fee is based on the number and duration of lending transactions.
Brokerage Commissions. The Fund placed a portion of its portfolio transactions with brokerage firms which are affiliates of the investment adviser. The commissions paid to these affiliated firms were $406 for the period.
Interfund Lending Program. Pursuant to an Exemptive Order issued by the SEC, the Fund, along with other registered investment companies having management contracts with FMR, may participate in an interfund lending program. This program provides an alternative credit facility allowing the funds to borrow from, or lend money to, other participating affiliated funds. At period end, there were no interfund loans outstanding. The Fund's activity in this program during the period for which loans were outstanding was as follows:
Borrower or Lender | Average Daily
Loan Balance | Weighted Average
Interest Rate | Interest
Expense |
Borrower | $ 3,769,842 | .38% | $ 759 |
7. Committed Line of Credit.
The Fund participates with other funds managed by FMR or an affiliate in a $4.0 billion credit facility (the "line of credit") to be utilized for temporary or emergency purposes to fund shareholder redemptions or for other short-term liquidity purposes. The Fund has agreed to pay commitment fees on its pro-rata portion of the line of credit, which amounted to $2,094 and is reflected in Miscellaneous expenses on the Statement of Operations. During the period, there were no borrowings on this line of credit.
Annual Report
Notes to Financial Statements - continued
8. Security Lending.
The Fund lends portfolio securities through a lending agent from time to time in order to earn additional income. For equity securities, a lending agent is used and may loan securities to certain qualified borrowers, including Fidelity Capital Markets (FCM), a broker-dealer affiliated with the Fund. On the settlement date of the loan, the Fund receives collateral (in the form of U.S. Treasury obligations, letters of credit and/or cash) against the loaned securities and maintains collateral in an amount not less than 100% of the market value of the loaned securities during the period of the loan. The market value of the loaned securities is determined at the close of business of the Fund and any additional required collateral is delivered to the Fund on the next business day. If the borrower defaults on its obligation to return the securities loaned because of insolvency or other reasons, a fund could experience delays and costs in recovering the securities loaned or in gaining access to the collateral. Any cash collateral received is invested in the Fidelity Securities Lending Cash Central Fund. The value of loaned securities and cash collateral at period end are disclosed on the Fund's Statement of Assets and Liabilities. Security lending income represents the income earned on investing cash collateral, less rebates paid to borrowers and any lending agent fees associated with the loan, plus any premium payments received for lending certain types of securities. Security lending income is presented in the Statement of Operations as a component of income from Fidelity Central Funds. Total security lending income during the period amounted to $208,223. During the period, there were no securities loaned to FCM.
9. Expense Reductions.
Many of the brokers with whom FMR places trades on behalf of the Fund provided services to the Fund in addition to trade execution. These services included payments of certain expenses on behalf of the Fund totaling $424,116 for the period. In addition, through arrangements with the Fund's custodian, credits realized as a result of uninvested cash balances were used to reduce the Fund's expenses. During the period, these credits reduced the Fund's custody expenses by $175.
10. Distributions to Shareholders.
Distributions to shareholders of each class were as follows:
Years ended October 31, | 2011 | 2010 |
From net investment income | | |
Class A | $ 1,359,820 | $ 823,941 |
Class T | 162,957 | 194,714 |
Class B | 6,606 | - |
Class C | 23,592 | - |
Institutional Class | 1,584,568 | 595,478 |
Total | $ 3,137,543 | $ 1,614,133 |
Annual Report
10. Distributions to Shareholders - continued
Years ended October 31, | 2011 | 2010 |
From net realized gain | | |
Class A | $ 1,530,131 | $ 1,543,065 |
Class T | 550,254 | 631,634 |
Class B | 33,415 | 170,009 |
Class C | 232,626 | 588,609 |
Institutional Class | 990,344 | 747,157 |
Total | $ 3,336,770 | $ 3,680,474 |
11. Share Transactions.
Transactions for each class of shares were as follows:
| Shares | Dollars |
Years ended October 31, | 2011 | 2010 | 2011 | 2010 |
Class A | | | | |
Shares sold | 2,979,791 | 4,968,910 | $ 70,086,728 | $ 104,602,234 |
Reinvestment of distributions | 111,230 | 108,006 | 2,675,569 | 2,258,405 |
Shares redeemed | (5,317,665) | (4,235,043) | (123,086,641) | (87,859,971) |
Net increase (decrease) | (2,226,644) | 841,873 | $ (50,324,344) | $ 19,000,668 |
Class T | | | | |
Shares sold | 883,154 | 1,526,646 | $ 20,610,023 | $ 32,084,382 |
Reinvestment of distributions | 28,248 | 38,153 | 678,402 | 796,254 |
Shares redeemed | (1,752,649) | (1,685,925) | (40,710,223) | (34,798,827) |
Net increase (decrease) | (841,247) | (121,126) | $ (19,421,798) | $ (1,918,191) |
Class B | | | | |
Shares sold | 68,462 | 284,855 | $ 1,586,905 | $ 5,842,113 |
Reinvestment of distributions | 1,377 | 7,131 | 32,616 | 146,541 |
Shares redeemed | (352,710) | (412,420) | (8,040,387) | (8,414,002) |
Net increase (decrease) | (282,871) | (120,434) | $ (6,420,866) | $ (2,425,348) |
Class C | | | | |
Shares sold | 956,543 | 1,416,872 | $ 22,080,298 | $ 29,287,955 |
Reinvestment of distributions | 9,045 | 24,169 | 213,702 | 496,184 |
Shares redeemed | (1,536,376) | (1,291,795) | (34,998,720) | (26,390,410) |
Net increase (decrease) | (570,788) | 149,246 | $ (12,704,720) | $ 3,393,729 |
Institutional Class | | | | |
Shares sold | 2,773,126 | 4,771,525 | $ 64,258,215 | $ 100,570,593 |
Reinvestment of distributions | 73,837 | 25,873 | 1,781,181 | 542,822 |
Shares redeemed | (3,885,014) | (2,586,784) | (91,297,373) | (54,324,513) |
Net increase (decrease) | (1,038,051) | 2,210,614 | $ (25,257,977) | $ 46,788,902 |
Annual Report
Notes to Financial Statements - continued
12. Other.
The Fund's organizational documents provide former and current trustees and officers with a limited indemnification against liabilities arising in connection with the performance of their duties to the Fund. In the normal course of business, the Fund may also enter into contracts that provide general indemnifications. The Fund's maximum exposure under these arrangements is unknown as this would be dependent on future claims that may be made against the Fund. The risk of material loss from such claims is considered remote.
Annual Report
To the Trustees of Fidelity Advisor Series VIII and Shareholders of Fidelity Advisor Emerging Markets Fund:
We have audited the accompanying statement of assets and liabilities of Fidelity Advisor Emerging Markets Fund (the Fund), a fund of Fidelity Advisor Series VIII, including the schedule of investments, as of October 31, 2011, and the related statement of operations for the year then ended, the statement of changes in net assets for each of the two years in the period then ended, and the financial highlights for each of the five years in the period then ended. These financial statements and financial highlights are the responsibility of the Fund's management. Our responsibility is to express an opinion on these financial statements and financial highlights based on our audits.
We conducted our audits in accordance with the standards of the Public Company Accounting Oversight Board (United States). Those standards require that we plan and perform the audit to obtain reasonable assurance about whether the financial statements and financial highlights are free of material misstatement. The Fund is not required to have, nor were we engaged to perform, an audit of its internal control over financial reporting. Our audits included consideration of internal control over financial reporting as a basis for designing audit procedures that are appropriate in the circumstances, but not for the purpose of expressing an opinion on the effectiveness of the Fund's internal control over financial reporting. Accordingly, we express no such opinion. An audit also includes examining, on a test basis, evidence supporting the amounts and disclosures in the financial statements, assessing the accounting principles used and significant estimates made by management, as well as evaluating the overall financial statement presentation. Our procedures included confirmation of securities owned as of October 31, 2011, by correspondence with the custodians and brokers; where replies were not received from brokers, we performed other auditing procedures. We believe that our audits provide a reasonable basis for our opinion.
In our opinion, the financial statements and financial highlights referred to above present fairly, in all material respects, the financial position of Fidelity Advisor Emerging Markets Fund as of October 31, 2011, the results of its operations for the year then ended, the changes in its net assets for each of the two years in the period then ended, and the financial highlights for each of the five years in the period then ended, in conformity with accounting principles generally accepted in the United States of America.
/s/ Deloitte & Touche LLP
DELOITTE & TOUCHE LLP
Boston, Massachusetts
December 14, 2011
Annual Report
The Trustees, Members of the Advisory Board, and executive officers of the trust and fund, as applicable, are listed below. The Board of Trustees governs the fund and is responsible for protecting the interests of shareholders. The Trustees are experienced executives who meet periodically throughout the year to oversee the fund's activities, review contractual arrangements with companies that provide services to the fund, oversee management of the risks associated with such activities and contractual arrangements, and review the fund's performance. Except for James C. Curvey, each of the Trustees oversees 226 funds advised by FMR or an affiliate. Mr. Curvey oversees 429 funds advised by FMR or an affiliate.
The Trustees hold office without limit in time except that (a) any Trustee may resign; (b) any Trustee may be removed by written instrument, signed by at least two-thirds of the number of Trustees prior to such removal; (c) any Trustee who requests to be retired or who has become incapacitated by illness or injury may be retired by written instrument signed by a majority of the other Trustees; and (d) any Trustee may be removed at any special meeting of shareholders by a two-thirds vote of the outstanding voting securities of the trust. Each Trustee who is not an interested person (as defined in the 1940 Act) (Independent Trustee), shall retire not later than the last day of the calendar year in which his or her 75th birthday occurs. The Independent Trustees may waive this mandatory retirement age policy with respect to individual Trustees. The executive officers and Advisory Board Members hold office without limit in time, except that any officer and Advisory Board Member may resign or may be removed by a vote of a majority of the Trustees at any regular meeting or any special meeting of the Trustees. Except as indicated, each individual has held the office shown or other offices in the same company for the past five years.
Experience, Skills, Attributes, and Qualifications of the Fund's Trustees. The Governance and Nominating Committee has adopted a statement of policy that describes the experience, qualifications, attributes, and skills that are necessary and desirable for potential Independent Trustee candidates (Statement of Policy). The Board believes that each Trustee satisfied at the time he or she was initially elected or appointed a Trustee, and continues to satisfy, the standards contemplated by the Statement of Policy. The Governance and Nominating Committee also engages professional search firms to help identify potential Independent Trustee candidates who have the experience, qualifications, attributes, and skills consistent with the Statement of Policy. From time to time, additional criteria based on the composition and skills of the current Independent Trustees, as well as experience or skills that may be appropriate in light of future changes to board composition, business conditions, and regulatory or other developments, have also been considered by the professional search firms and the Governance and Nominating Committee. In addition, the Board takes into account the Trustees' commitment and participation in Board and committee meetings, as well as their leadership of standing and ad hoc committees throughout their tenure.
In determining that a particular Trustee was and continues to be qualified to serve as a Trustee, the Board has considered a variety of criteria, none of which, in isolation, was controlling. The Board believes that, collectively, the Trustees have balanced and diverse experience, qualifications, attributes, and skills, which allow the Board to operate effectively in governing the fund and protecting the interests of shareholders. Information about the specific experience, skills, attributes, and qualifications of each Trustee, which in each case led to the Board's conclusion that the Trustee should serve (or continue to serve) as a trustee of the fund, is provided below.
Annual Report
Board Structure and Oversight Function. James C. Curvey is an interested person (as defined in the 1940 Act) and currently serves as Acting Chairman. The Trustees have determined that an interested Chairman is appropriate and benefits shareholders because an interested Chairman has a personal and professional stake in the quality and continuity of services provided to the fund. Independent Trustees exercise their informed business judgment to appoint an individual of their choosing to serve as Chairman, regardless of whether the Trustee happens to be independent or a member of management. The Independent Trustees have determined that they can act independently and effectively without having an Independent Trustee serve as Chairman and that a key structural component for assuring that they are in a position to do so is for the Independent Trustees to constitute a substantial majority for the Board. The Independent Trustees also regularly meet in executive session. Ned C. Lautenbach serves as Chairman of the Independent Trustees and as such (i) acts as a liaison between the Independent Trustees and management with respect to matters important to the Independent Trustees and (ii) with management prepares agendas for Board meetings.
Fidelity funds are overseen by different Boards of Trustees. The fund's Board oversees Fidelity's equity and high income funds and another Board oversees Fidelity's investment-grade bond, money market, and asset allocation funds. The asset allocation funds may invest in Fidelity funds overseen by the fund's Board. The use of separate Boards, each with its own committee structure, allows the Trustees of each group of Fidelity funds to focus on the unique issues of the funds they oversee, including common research, investment, and operational issues. On occasion, the separate Boards establish joint committees to address issues of overlapping consequences for the Fidelity funds overseen by each Board.
The Trustees operate using a system of committees to facilitate the timely and efficient consideration of all matters of importance to the Trustees, the fund, and fund shareholders and to facilitate compliance with legal and regulatory requirements and oversight of the fund's activities and associated risks. The Board, acting through its committees, has charged FMR and its affiliates with (i) identifying events or circumstances the occurrence of which could have demonstrably adverse effects on the fund's business and/or reputation; (ii) implementing processes and controls to lessen the possibility that such events or circumstances occur or to mitigate the effects of such events or circumstances if they do occur; and (iii) creating and maintaining a system designed to evaluate continuously business and market conditions in order to facilitate the identification and implementation processes described in (i) and (ii) above. Because the day-to-day operations and activities of the fund are carried out by or through FMR, its affiliates and other service providers, the fund's exposure to risks is mitigated but not eliminated by the processes overseen by the Trustees. While each of the Board's committees has responsibility for overseeing different aspects of the fund's activities, oversight is exercised primarily through the Operations, Audit, and Compliance Committees. In addition, the Independent Trustees have worked with FMR to enhance the Board's oversight of investment and financial risks, legal and regulatory risks, technology risks, and operational risks, including the development of additional risk reporting to the Board. For example, a working group comprised of Independent Trustees and FMR has worked and continues to work to review the Fidelity funds' valuation-related activities, reporting and risk management. Appropriate personnel, including but not limited to the fund's Chief Compliance Officer (CCO), FMR's internal auditor, the independent accountants, the fund's Treasurer and portfolio management personnel, make periodic reports to the Board's committees, as appropriate, including an annual review of FMR's risk management program for the Fidelity funds. The responsibilities of each standing committee, including their oversight responsibilities, are described further under "Standing Committees of the Fund's Trustees."
Annual Report
Trustees and Officers - continued
The fund's Statement of Additional Informaion (SAI) includes more information about the Trustees. To request a copy, call Fidelity at 1-877-208-0098.
Interested Trustees*:
Correspondence intended for each Trustee who is an interested person may be sent to Fidelity Investments, 82 Devonshire Street, Boston, Massachusetts 02109.
Name, Age; Principal Occupations and Other Relevant Experience+ |
James C. Curvey (76) |
| Year of Election or Appointment: 2007 Mr. Curvey is Trustee and Acting Chairman of the Board of Trustees of certain Trusts. Mr. Curvey also serves as Trustee (2007-present) of other investment companies advised by FMR. Mr. Curvey is a Director of Fidelity Investments Money Management, Inc. (2009-present), Director of Fidelity Research & Analysis Co. (2009-present) and Director of FMR and FMR Co., Inc. (2007-present). Mr. Curvey is also Vice Chairman (2007-present) and Director of FMR LLC. In addition, Mr. Curvey serves as an Overseer for the Boston Symphony Orchestra and a member of the Trustees of Villanova University. Previously, Mr. Curvey was the Vice Chairman (2006-2007) and Director (2000-2007) of FMR Corp. |
Ronald P. O'Hanley (54) |
| Year of Election or Appointment: 2011 Mr. O'Hanley is Director of FMR Co., Inc. (2010-present), Director of Fidelity Investments Money Management, Inc. (2010-present), Director of Fidelity Research & Analysis Company (2010-present), President of Fidelity Asset Management and Corporate Services and a member of Fidelity's Executive Committee (2010-present). Previously, Mr. O'Hanley served as President and Chief Executive Officer of BNY Mellon Asset Management (2007-2010). Mr. O'Hanley also served as Vice Chairman of Bank New York Mellon Corp. and a member of that firm's Executive Committee. Prior to the 2007 merger of The Bank of New York and Mellon Financial Corporation, he was Vice Chairman of Mellon Financial Corporation and President and Chief Executive Officer of Mellon Asset Management. He joined Mellon in February 1997. Mr. O'Hanley currently serves as Chairman of the Boston Public Library Foundation Board of Directors and sits on the Board of Directors of Beth Israel Deaconess Medical Center, the Board of Trustees of the Marine Biological Laboratory and the Advisory Board of the Maxwell School of Citizenship and Public Administration at Syracuse University. Mr. O'Hanley also chairs the Council on Asset Management for the Financial Services Roundtable and is a member of the Board of Directors of Institutional Investor's U.S. Institute. |
* Trustees have been determined to be "Interested Trustees" by virtue of, among other things, their affiliation with the trust or various entities under common control with FMR.
+ The information above includes each Trustee's principal occupation during the last five years and other information relating to the experience, attributes, and skills relevant to each Trustee's qualifications to serve as a Trustee, which led to the conclusion that each Trustee should serve as a Trustee for the fund.
Annual Report
Trustees and Officers - continued
Independent Trustees:
Correspondence intended for each Independent Trustee (that is, the Trustees other than the Interested Trustees) may be sent to Fidelity Investments, P.O. Box 55235, Boston, Massachusetts 02205-5235.
Name, Age; Principal Occupations and Other Relevant Experience+ |
Dennis J. Dirks (63) |
| Year of Election or Appointment: 2005 Prior to his retirement in May 2003, Mr. Dirks was Chief Operating Officer and a member of the Board of The Depository Trust & Clearing Corporation (DTCC). He also served as President, Chief Operating Officer, and Board member of The Depository Trust Company (DTC) and President and Board member of the National Securities Clearing Corporation (NSCC). In addition, Mr. Dirks served as Chief Executive Officer and Board member of the Government Securities Clearing Corporation, Chief Executive Officer and Board member of the Mortgage-Backed Securities Clearing Corporation, as a Trustee and a member of the Finance Committee of Manhattan College (2005-2008), and as a Trustee and a member of the Finance Committee of AHRC of Nassau County (2006-2008). Mr. Dirks is a member of the Independent Directors Council (IDC) Governing Council (2010-Present) and Board of Directors for The Brookville Center for Children's Services, Inc. (2009-present). |
Alan J. Lacy (58) |
| Year of Election or Appointment: 2008 Mr. Lacy serves as Senior Adviser (2007-present) of Oak Hill Capital Partners, L.P. (private equity). Mr. Lacy also served as Chief Executive Officer (2000-2005) and Vice Chairman (2005-2006) of Sears Holdings Corporation and Sears, Roebuck and Co. (retail). In addition, Mr. Lacy serves as a member of the Board of Directors of Dave & Buster's, Inc. (restaurant and entertainment complexes, 2010-present), The Hillman Companies, Inc. (hardware wholesalers, 2010-present), and Bristol-Myers Squibb Company (global pharmaceuticals, 2007-present). Mr. Lacy is a member of the Board of Trustees of The National Parks Conservation Association (2006-Present). Previously, Mr. Lacy served as Chairman of the Board of Trustees of the National Parks Conservation Association (2008-2011) and as a member of the Board of Directors for the Western Union Company (global money transfer, 2006-2011). |
Ned C. Lautenbach (67) |
| Year of Election or Appointment: 2000 Mr. Lautenbach is Chairman of the Independent Trustees of the Equity and High Income Funds (2006-present). Mr. Lautenbach currently serves as the Lead Director of the Eaton Corporation Board of Directors (diversified industrial, 1997-present). Mr. Lautenbach is also a member of the Board of Directors of the Philharmonic Center for the Arts in Naples, Florida (1999-present); a member of the Board of Trustees of Fairfield University (2005-present); and a member of the Council on Foreign Relations (1994-present). Previously, Mr. Lautenbach was a Partner/Advisory Partner at Clayton, Dubilier & Rice, LLC (private equity investment, 1998-2010), as well as a Director of Sony Corporation (2006-2007). |
Joseph Mauriello (67) |
| Year of Election or Appointment: 2008 Prior to his retirement in January 2006, Mr. Mauriello served in numerous senior management positions including Deputy Chairman and Chief Operating Officer (2004-2005), and Vice Chairman of Financial Services (2002-2004) of KPMG LLP US (professional services, 1965-2005). Mr. Mauriello currently serves as a member of the Board of Directors of XL Group plc. (global insurance and re-insurance, 2006-present) and of Arcadia Resources Inc. (health care services and products, 2007-present). Previously, Mr. Mauriello served as a Director of the Hamilton Funds of the Bank of New York (2006-2007). |
Robert W. Selander (61) |
| Year of Election or Appointment: 2011 Previously, Mr. Selander served as a Member of the Advisory Board of Fidelity's Equity and High Income Funds (2011), Executive Vice Chairman (2010), Chief Executive Officer (2009-2010), and President and Chief Executive Officer (1997-2009) of Mastercard, Inc. |
Cornelia M. Small (67) |
| Year of Election or Appointment: 2005 Ms. Small is a member of the Board of Directors of the Teagle Foundation (2009-present). Ms. Small is also a member of the Investment Committee, and Chair (2008-present) and a member of the Board of Trustees of Smith College. In addition, Ms. Small serves on the Investment Committee of the Berkshire Taconic Community Foundation (2008-present). Previously, Ms. Small served as Chairperson of the Investment Committee (2002-2008) of Smith College. In addition, Ms. Small served as Chief Investment Officer, Director of Global Equity Investments, and a member of the Board of Directors of Scudder, Stevens & Clark and Scudder Kemper Investments. |
William S. Stavropoulos (72) |
| Year of Election or Appointment: 2001 Mr. Stavropoulos is Vice Chairman of the Independent Trustees of the Equity and High Income Funds (2006-present). Mr. Stavropoulos serves as President and Founder of the Michigan Baseball Foundation, the Great Lakes Loons (2007-present). Mr. Stavropoulos is Chairman Emeritus of the Board of Directors of The Dow Chemical Company, where he previously served in numerous senior management positions, including President, CEO (1995-2000; 2002-2004), Chairman of the Executive Committee (2000-2006), and as a member of the Board of Directors (1990-2006). Currently, Mr. Stavropoulos is Chairman of Univar (global distributor of commodity and specialty chemicals, 2010-present), a Director of Teradata Corporation (data warehousing and technology solutions, 2008-present), Chemical Financial Corporation, Maersk Inc. (industrial conglomerate), Tyco International, Inc. (multinational manufacturing and services, 2007-present), and a member of the Advisory Board for Metalmark Capital (private equity investment, 2005-present). Mr. Stavropoulos is a special advisor to Clayton, Dubilier & Rice, LLC (private equity investment). In addition, Mr. Stavropoulos is a member of the University of Notre Dame Advisory Council for the College of Science. |
David M. Thomas (62) |
| Year of Election or Appointment: 2008 Previously, Mr. Thomas served as Executive Chairman (2005-2006) and Chairman and Chief Executive Officer (2000-2005) of IMS Health, Inc. (pharmaceutical and healthcare information solutions). In addition, Mr. Thomas serves as a member of the Board of Directors of Fortune Brands, Inc. (consumer products), and Interpublic Group of Companies, Inc. (marketing communication, 2004-present). |
Michael E. Wiley (61) |
| Year of Election or Appointment: 2008 Mr. Wiley also serves as a Director of Asia Pacific Exploration Consolidated (international oil and gas exploration and production, 2008-present). Mr. Wiley serves as a Director of Tesoro Corporation (independent oil refiner and marketer, 2005-present), and a Director of Bill Barrett Corporation (exploration and production, 2005-present). In addition, Mr. Wiley also serves as a Director of Post Oak Bank (privately-held bank, 2004-present). Previously, Mr. Wiley served as a member of the Board of Trustees of the University of Tulsa (2000-2006; 2007-2010), as a Senior Energy Advisor of Katzenbach Partners, LLC (consulting, 2006-2007), as an Advisory Director of Riverstone Holdings (private investment), Chairman, President, and CEO of Baker Hughes, Inc. (oilfield services, 2000-2004), and as Director of Spinnaker Exploration Company (exploration and production, 2001-2005). |
Annual Report
+ The information above includes each Trustee's principal occupation during the last five years and other information relating to the experience, attributes, and skills relevant to each Trustee's qualifications to serve as a Trustee, which led to the conclusion that each Trustee should serve as a Trustee for the fund.
Advisory Board Members and Executive Officers:
Correspondence intended for each executive officer, Edward C. Johnson 3d, and Peter S. Lynch may be sent to Fidelity Investments, 82 Devonshire Street, Boston, Massachusetts 02109.
Name, Age; Principal Occupation |
Edward C. Johnson 3d (81) |
| Year of Election or Appointment: 2011 Member of the Advisory Board of Fidelity's Equity and High Income Funds. Mr. Johnson serves as Chief Executive Officer, Chairman, and a Director of FMR LLC, and also serves as Chairman and Director of FIL Limited. Previously, Mr. Johnson served as a Trustee and Chairman of the Board of certain Fidelity Trusts, Chairman and a Director of FMR, Chairman and a Director of FMR Co., Inc., and President of FMR LLC (2006-2007). |
Peter S. Lynch (67) |
| Year of Election or Appointment: 2003 Member of the Advisory Board of Fidelity's Equity and High Income Funds. Mr. Lynch is Vice Chairman and a Director of FMR and FMR Co., Inc. In addition, Mr. Lynch serves as a Trustee of Boston College and as the Chairman of the Inner-City Scholarship Fund. Previously, Mr. Lynch served on the Special Olympics International Board of Directors (1997-2006). |
Kenneth B. Robins (42) |
| Year of Election or Appointment: 2008 President and Treasurer of Fidelity's Equity and High Income Funds. Mr. Robins also serves as President and Treasurer (2010-present) and Assistant Treasurer (2009-present) of other Fidelity funds and is an employee of Fidelity Investments (2004-present). Previously, Mr. Robins served as Deputy Treasurer of the Fidelity funds (2005-2008) and Treasurer and Chief Financial Officer of The North Carolina Capital Management Trust: Cash and Term Portfolios (2006-2008). |
Bruce T. Herring (46) |
| Year of Election or Appointment: 2006 Vice President of certain Equity Funds. Mr. Herring also serves as Chief Investment Officer and Director of Fidelity Management & Research (U.K.) Inc. (2010-present) and Group Chief Investments Officer of FMR. Previously, Mr. Herring served as Vice President (2005-2006) and Senior Vice President (2006-2007) of Fidelity Management & Research Company, Vice President of FMR Co., Inc. (2001-2007) and as a portfolio manager for Fidelity U.S. Equity Funds. |
Brian B. Hogan (47) |
| Year of Election or Appointment: 2009 Vice President of Equity and High Income Funds. Mr. Hogan also serves as President of FMR's Equity Division (2009-present). Previously, Mr. Hogan served as Senior Vice President, Equity Research of FMR (2006-2009) and as a portfolio manager. |
Scott C. Goebel (43) |
| Year of Election or Appointment: 2008 Secretary and Chief Legal Officer (CLO) of the Fidelity funds. Mr. Goebel also serves as Secretary of Fidelity Investments Money Management, Inc. (FIMM) (2010-present) and Fidelity Research and Analysis Company (FRAC) (2010-present); Secretary and CLO of The North Carolina Capital Management Trust: Cash and Term Portfolios (2008-present); General Counsel, Secretary, and Senior Vice President of FMR (2008-present) and FMR Co., Inc. (2008-present); employed by FMR LLC or an affiliate (2001-present); Chief Legal Officer of Fidelity Management & Research (Hong Kong) Limited (2008-present) and Assistant Secretary of Fidelity Management & Research (Japan) Inc. (2008-present), and Fidelity Management & Research (U.K.) Inc. (2008-present). Previously, Mr. Goebel served as Assistant Secretary of FIMM (2008-2010), FRAC (2008-2010), and the Funds (2007-2008) and as Vice President and Secretary of Fidelity Distributors Corporation (FDC) (2005-2007). |
William C. Coffey (42) |
| Year of Election or Appointment: 2009 Assistant Secretary of Fidelity's Equity and High Income Funds. Mr. Coffey also serves as Senior Vice President and Deputy General Counsel of FMR LLC (2010-present), and is an employee of Fidelity Investments. Previously, Mr. Coffey served as Vice President and Associate General Counsel of FMR LLC (2005-2009). |
Holly C. Laurent (57) |
| Year of Election or Appointment: 2008 Anti-Money Laundering (AML) Officer of the Fidelity funds. Ms. Laurent also serves as AML Officer of The North Carolina Capital Management Trust: Cash and Term Portfolios (2008-present) and is an employee of Fidelity Investments. Previously, Ms. Laurent was Senior Vice President and Head of Legal for Fidelity Business Services India Pvt. Ltd. (2006-2008), and Senior Vice President, Deputy General Counsel and Group Head for FMR LLC (2005-2006). |
Christine Reynolds (53) |
| Year of Election or Appointment: 2008 Chief Financial Officer of the Fidelity funds. Ms. Reynolds became President of Fidelity Pricing and Cash Management Services (FPCMS) in August 2008. Ms. Reynolds served as Chief Operating Officer of FPCMS (2007-2008). Previously, Ms. Reynolds served as President, Treasurer, and Anti-Money Laundering officer of the Fidelity funds (2004-2007). |
Kenneth A. Rathgeber (64) |
| Year of Election or Appointment: 2004 Chief Compliance Officer of Fidelity's Equity and High Income Funds. Mr. Rathgeber is Chief Compliance Officer of Fidelity Management & Research (Hong Kong) Limited (2008-present), Fidelity Management & Research (Japan) Inc. (2008-present), FMR (2005-present), FMR Co., Inc. (2005-present), Fidelity Management & Research (U.K.) Inc. (2005-present), Fidelity Research & Analysis Company (2005-present), Fidelity Investments Money Management, Inc. (2005-present), Pyramis Global Advisors, LLC (2005-present), and Strategic Advisers, Inc. (2005-present). |
Jeffrey S. Christian (50) |
| Year of Election or Appointment: 2009 Deputy Treasurer of the Fidelity funds. Mr. Christian is an employee of Fidelity Investments. Previously, Mr. Christian served as Chief Financial Officer (2008-2009) of certain Fidelity funds and Senior Vice President of Fidelity Pricing and Cash Management Services (FPCMS) (2004-2009). |
Joseph F. Zambello (54) |
| Year of Election or Appointment: 2011 Deputy Treasurer of the Fidelity funds. Mr. Zambello is an employee of Fidelity Investments. Previously, Mr. Zambello served as Vice President of FMR's Program Management Group (2009-2011) and Vice President of the Transfer Agent Oversight Group (2005-2009). |
Adrien E. Deberghes (44) |
| Year of Election or Appointment: 2008 Deputy Treasurer of Fidelity's Equity and High Income Funds. Mr. Deberghes also serves as Vice President and Assistant Treasurer of Fidelity Rutland Square Trust II and Fidelity Commonwealth Trust II (2011-present), Assistant Treasurer of other Fidelity funds (2010-present), and is an employee of Fidelity Investments (2008-present). Previously, Mr. Deberghes served as Senior Vice President of Mutual Fund Administration at State Street Corporation (2007-2008), Senior Director of Mutual Fund Administration at Investors Bank & Trust (2005-2007), and Director of Finance for Dunkin' Brands (2000-2005). |
Stephanie J. Dorsey (42) |
| Year of Election or Appointment: 2010 Assistant Treasurer of Fidelity's Equity and High Income Funds. Ms. Dorsey also serves as Deputy Treasurer of other Fidelity funds (2008-present) and is an employee of Fidelity Investments (2008-present). Previously, Ms. Dorsey served as Treasurer (2004-2008) of the JPMorgan Mutual Funds and Vice President (2004-2008) of JPMorgan Chase Bank. |
John R. Hebble (53) |
| Year of Election or Appointment: 2009 Assistant Treasurer of Fidelity's Equity and High Income Funds. Mr. Hebble also serves as President (2011-present), Treasurer, and Chief Financial Officer of The North Carolina Capital Management Trust: Cash and Term Portfolios (2008-present), President and Treasurer of other Fidelity funds (2008-present) and is an employee of Fidelity Investments. |
Gary W. Ryan (53) |
| Year of Election or Appointment: 2005 Assistant Treasurer of the Fidelity funds. Mr. Ryan is an employee of Fidelity Investments. Previously, Mr. Ryan served as Vice President of Fund Reporting in Fidelity Pricing and Cash Management Services (FPCMS) (1999-2005). |
Jonathan Davis (43) |
| Year of Election or Appointment: 2010 Assistant Treasurer of the Fidelity funds. Mr. Davis is also Assistant Treasurer of Fidelity Rutland Square Trust II and Fidelity Commonwealth Trust II. Mr. Davis is an employee of Fidelity Investments. Previously, Mr. Davis served as Vice President and Associate General Counsel of FMR LLC (2003-2010). |
Annual Report
Institutional Class designates 100% of the dividends distributed during the fiscal year as amounts which may be taken into account as a dividend for purposes of the maximum rate under section 1(h)(11) of the Internal Revenue Code.
The amounts per share which represent income derived from sources within, and taxes paid to, foreign countries or possessions of the United States are as Follows
| Pay Date | Income | Taxes |
Institutional Class | 12/06/10 | $0.366 | $0.0459 |
| 12/31/10 | 0.005 | 0.0000 |
The fund will notify shareholders in January 2012 of amounts for use in preparing 2011 income tax returns.
Annual Report
Board Approval of Investment Advisory Contracts and Management Fees
Fidelity Advisor Emerging Markets Fund
Each year, the Board of Trustees, including the Independent Trustees (together, the Board), votes on the renewal of the management contract and sub-advisory agreements (together, the Advisory Contracts) for the fund. The Board, assisted by the advice of fund counsel and Independent Trustees' counsel, requests and considers a broad range of information relevant to the renewal of the Advisory Contracts throughout the year.
The Board meets regularly and considers at each of its meetings factors that are relevant to its annual consideration of the renewal of the fund's Advisory Contracts, including the services and support provided to the fund and its shareholders. The Board has established various standing committees, each composed of Independent Trustees with varying backgrounds, to which the Board has assigned specific subject matter responsibilities in order to enhance effective decision-making by the Board. The Board, acting directly and through its Committees, requests and receives information concerning the annual consideration of the renewal of the fund's Advisory Contracts. The Board also meets as needed to consider matters specifically related to the Board's annual consideration of the renewal of Advisory Contracts. Members of the Board may also meet with trustees of other Fidelity funds through ad hoc joint committees to discuss certain matters relevant to the Fidelity funds.
At its July 2011 meeting, the Board of Trustees, including the Independent Trustees, unanimously determined to renew the fund's Advisory Contracts. In reaching its determination, the Board considered all factors it believed relevant, including (i) the nature, extent, and quality of the services to be provided to the fund and its shareholders (including the investment performance of the fund); (ii) the competitiveness of the fund's management fee and total expense ratio; (iii) the total costs of the services to be provided by and the profits to be realized by Fidelity from its relationship with the fund; (iv) the extent to which economies of scale would be realized as the fund grows; and (v) whether fee levels reflect these economies of scale, if any, for the benefit of fund shareholders.
In considering whether to renew the Advisory Contracts for the fund, the Board reached a determination, with the assistance of fund counsel and Independent Trustees' counsel and through the exercise of its business judgment, that the renewal of the Advisory Contracts is in the best interests of the fund and its shareholders and that the compensation payable under the Advisory Contracts is fair and reasonable. The Board's decision to renew the Advisory Contracts was not based on any single factor, but rather was based on a comprehensive consideration of all the information provided to the Board at its meetings throughout the year. The Board, in reaching its determination to renew the Advisory Contracts, is aware that shareholders in the fund have a broad range of investment choices available to them, including a wide choice among mutual funds offered by Fidelity's competitors, and that the fund's shareholders, who have the opportunity to review and weigh the disclosure provided by the fund in its prospectus and other public disclosures, have chosen to invest in this fund, managed by Fidelity.
Annual Report
Nature, Extent, and Quality of Services Provided. The Board considered the staffing within the investment adviser, FMR, and the sub-advisers (together, the Investment Advisers), including the backgrounds of the fund's investment personnel and the fund's investment objective and discipline. The Independent Trustees also had discussions with senior management of Fidelity's investment operations and investment groups. The Board considered the structure of the portfolio manager compensation program and whether this structure provides appropriate incentives to act in the best interests of the fund.
Resources Dedicated to Investment Management and Support Services. The Board and the Fund Oversight and Research Committees reviewed the general qualifications and capabilities of the Investment Advisers' investment staff, including its size, education, experience, and resources, as well as the Investment Advisers' approach to recruiting, training, managing, and compensating investment personnel. The Board also noted that FMR has devoted increased resources to non-U.S. offices. The Board noted that Fidelity's analysts have extensive resources, tools and capabilities which allow them to conduct sophisticated quantitative and fundamental analysis, as well as credit analysis of issuers, counterparties and enhancers. The Board also believes that Fidelity's investment professionals have sufficient access to global information and data so as to provide competitive investment results over time, and that those professionals also have access to sophisticated tools which permit them to assess portfolio construction and risk and performance attribution characteristics continuously, as well as to transmit new information and research conclusions rapidly around the world. Additionally, in their deliberations, the Board considered the Investment Advisers' trading capabilities and resources which are an integral part of the investment management process.
Shareholder and Administrative Services. The Board considered (i) the nature, extent, quality, and cost of advisory, administrative, and shareholder services performed by the Investment Advisers and their affiliates under the Advisory Contracts and under separate agreements covering transfer agency, pricing and bookkeeping, and securities lending services for the fund; (ii) the nature and extent of the investment adviser's supervision of third party service providers, principally custodians and subcustodians; and (iii) the resources devoted to, and the record of compliance with, the fund's compliance policies and procedures. The Board also reviewed the allocation of fund brokerage, including allocations to brokers affiliated with the Investment Advisers, the use of brokerage commissions to pay fund expenses, and the use of "soft" commission dollars to pay for research services.
The Board noted that the growth of fund assets over time across the complex allows Fidelity to reinvest in the development of services designed to enhance the value or convenience of the Fidelity funds as investment vehicles. These services include 24-hour access to account information and market information through telephone representatives and over the Internet, investor education materials and asset allocation tools, and the expanded availability of Fidelity Investor Centers, with 35 new branches opening since 2010.
Annual Report
Board Approval of Investment Advisory Contracts and
Management Fees - continued
Investment in a Large Fund Family. The Board considered the benefits to shareholders of investing in a Fidelity fund, including the benefits of investing in a fund that is part of a large family of funds offering a variety of investment disciplines and providing a large variety of mutual fund investor services. The Board noted that Fidelity had taken, or had made recommendations that resulted in the Fidelity funds taking, a number of actions over the previous year that benefited particular funds, including (i) continuing to dedicate additional resources to investment research and support of the senior management team that oversees asset management; (ii) rationalizing product lines through the mergers of six funds into other funds; (iii) continuing to migrate the Freedom Funds to dedicated lower cost underlying funds; (iv) obtaining shareholder approval to broaden the investment strategies for Fidelity Consumer Finance Portfolio, Fidelity Emerging Asia Fund, and Fidelity Environment and Alternative Energy Portfolio; (v) contractually agreeing to reduce the management fees and impose other expense limitations on Spartan 500 Index Fund and U.S. Bond Index Fund in connection with launching new institutional classes of these funds; (vi) changing the name, primary and supplemental benchmarks, and investment policies of Fidelity Global Strategies Fund to support the fund's flexible investment mandate and global orientation; and (vii) reducing the transfer agency account fee rates on certain accounts.
Investment Performance. The Board considered whether the fund has operated in accordance with its investment objective, as well as its record of compliance with its investment restrictions. It also reviewed the fund's absolute investment performance for each class, as well as the fund's relative investment performance for each class measured over multiple periods against (i) a broad-based securities market index, and (ii) a peer group of mutual funds deemed appropriate by Fidelity and reviewed by the Board. The following charts considered by the Board show, over the one-, three-, and five-year periods ended December 31, 2010, the cumulative total returns of Institutional Class (Class I) and Class B of the fund, the cumulative total returns of a broad-based securities market index ("benchmark"), and a range of cumulative total returns of a peer group of mutual funds identified by Morningstar, Inc. as having an investment style similar to that of the fund based on underlying portfolio holdings. The returns of Institutional Class (Class I) and Class B show the performance of the highest and lowest performing classes, respectively (based on five-year performance). The box within each chart shows the 25th percentile return (bottom of box) and the 75th percentile return (top of box) of the peer group. Returns shown above the box are in the first quartile and returns shown below the box are in the fourth quartile. The percentage beaten numbers noted below each chart correspond to the percentile box and represent the percentage of funds in the peer group whose performance was equal to or lower than that of the class indicated.
Annual Report
Fidelity Advisor Emerging Markets Fund

The Board reviewed the fund's relative investment performance against its peer group and noted that the performance of Institutional Class (Class I) of the fund was in the third quartile for the one- and five- year periods and the fourth quartile for the three-year period. The Board also noted that the investment performance of the fund was lower than its benchmark for all the periods shown. The Board considered that the variations in performance among the fund's classes reflect the variations in class expenses, which result in lower performance for higher expense classes. The Board discussed with FMR actions that have been taken by FMR to improve the fund's disappointing performance relative to its peer group and benchmark. The Board also reviewed the fund's performance since inception as well as performance in the current year. The Board will continue to closely monitor the performance of the fund in the coming year and discuss with FMR other appropriate actions to address the performance of the fund.
Based on its review, the Board concluded that the nature, extent, and quality of services provided to the fund under the Advisory Contracts should benefit the fund's shareholders.
Competitiveness of Management Fee and Total Expense Ratio. The Board considered the fund's management fee and total expense ratio compared to "mapped groups" of competitive funds and classes. Fidelity creates "mapped groups" by combining similar Lipper investment objective categories that have comparable management fee characteristics. Combining Lipper investment objective categories aids the Board's management fee and total expense ratio comparisons by broadening the competitive group used for comparison and by reducing the number of universes to which various Fidelity funds are compared.
Annual Report
Board Approval of Investment Advisory Contracts and
Management Fees - continued
Management Fee. The Board considered two proprietary management fee comparisons for the 12-month periods shown in the chart below. The group of Lipper funds used by the Board for management fee comparisons is referred to below as the "Total Mapped Group." The Total Mapped Group comparison focuses on a fund's standing relative to the total universe of comparable funds available to investors in terms of gross management fees before expense reimbursements or caps. "TMG %" represents the percentage of funds in the Total Mapped Group that had management fees that were lower than the fund's. For example, a TMG % of 13% means that 87% of the funds in the Total Mapped Group had higher management fees than the fund. The "Asset-Size Peer Group" (ASPG) comparison focuses on a fund's standing relative to non-Fidelity funds similar in size to the fund within the Total Mapped Group. The ASPG represents at least 15% of the funds in the Total Mapped Group with comparable asset size and management fee characteristics, subject to a minimum of 50 funds (or all funds in the Total Mapped Group if fewer than 50). Additional information, such as the ASPG quartile in which the fund's management fee ranked, is also included in the chart and considered by the Board.
Fidelity Advisor Emerging Markets Fund

The Board noted that the fund's management fee ranked below the median of its Total Mapped Group and below the median of its ASPG for 2010.
Annual Report
Based on its review, the Board concluded that the fund's management fee is fair and reasonable in light of the services that the fund receives and the other factors considered.
Total Expense Ratio. In its review of each class's total expense ratio, the Board considered the fund's management fee as well as other fund or class expenses, as applicable, such as transfer agent fees, pricing and bookkeeping fees, fund-paid 12b-1 fees, and custodial, legal, and audit fees. The Board also noted the effects of any waivers and reimbursements on fees and expenses. As part of its review, the Board also considered the current and historical total expense ratios of each class of the fund compared to competitive fund median expenses. Each class of the fund is compared to those funds and classes in the Total Mapped Group (used by the Board for management fee comparisons) that have a similar sales load structure.
The Board noted that the total expense ratio of each of Class A, Class B, Class C, and Institutional Class ranked below its competitive median for 2010 and the total expense ratio of Class T ranked above its competitive median for 2010. The Board considered that various factors, including 12b-1 fees, positive or negative performance adjustments, and relatively higher other expenses in the case of small fund size, can affect total expense ratios. The Board noted that the total expense ratio of Class T was above the competitive median primarily because of higher 12b-1 fees on Class T. Class T has a higher 12b-1 fee, but a lower front-end sales charge, than traditionally priced front-end sales charge classes. The Board noted that the fund offers multiple classes, each of which has a different sales load and 12b-1 fee structure, and that the multiple structures are intended to offer a range of pricing options for the intermediary market. The Board also noted that the total expense ratios of the classes vary primarily by the level of their 12b-1 fees, although differences in transfer agent fees may also cause expenses to vary from class to class.
Fees Charged to Other Fidelity Clients. The Board also considered Fidelity fee structures and other information with respect to clients of FMR and its affiliates, such as other mutual funds advised or subadvised by FMR or its affiliates, pension plan clients, and other institutional clients. In March 2010, the Board created an ad hoc joint committee with the board of other Fidelity funds (the Committee) to review and compare Fidelity's institutional investment advisory business with its business of providing services to the Fidelity funds, including the differences in services provided, fees charged, and costs incurred, as well as competition in their respective marketplaces.
Based on its review of total expense ratios and fees charged to other Fidelity clients, the Board concluded that the total expense ratio of each class of the fund was reasonable, although Class T was above the median of the universe presented for comparison, in light of the services that the fund and its shareholders receive and the other factors considered, including the findings of the Committee.
Annual Report
Board Approval of Investment Advisory Contracts and
Management Fees - continued
Costs of the Services and Profitability. The Board considered the revenues earned and the expenses incurred by Fidelity in conducting the business of developing, marketing, distributing, managing, administering and servicing the fund and its shareholders. The Board also considered the level of Fidelity's profits in respect of all the Fidelity funds.
On an annual basis, FMR presents to the Board Fidelity's profitability for the fund. Fidelity calculates the profitability for each fund, as well as aggregate profitability for groups of Fidelity funds and all Fidelity funds, using a series of detailed revenue and cost allocation methodologies which originate with the books and records of Fidelity on which Fidelity's audited financial statements are based. The Audit Committee of the Board reviews any significant changes from the prior year's methodologies.
PricewaterhouseCoopers LLP (PwC), independent registered public accounting firm and auditor to Fidelity and certain Fidelity funds, has been engaged annually by the Board as part of the Board's assessment of Fidelity's profitability analysis. PwC's engagement includes the review and assessment of Fidelity's methodologies used in determining the revenues and expenses attributable to Fidelity's mutual fund business, and completion of agreed-upon procedures surrounding the mathematical accuracy of fund profitability and its conformity to allocation methodologies. After considering PwC's reports issued under the engagement and information provided by Fidelity, the Board concluded that while other allocation methods may also be reasonable, Fidelity's profitability methodologies are reasonable in all material respects.
The Board also reviewed Fidelity's non-fund businesses and fall-out benefits related to the mutual fund business as well as cases where Fidelity's affiliates may benefit from or be related to the fund's business.
The Board considered the costs of the services provided by and the profits realized by Fidelity in connection with the operation of the fund and was satisfied that the profitability was not excessive in the circumstances.
Economies of Scale. The Board considered whether there have been economies of scale in respect of the management of the Fidelity funds, whether the Fidelity funds (including the fund) have appropriately benefited from any such economies of scale, and whether there is potential for realization of any further economies of scale. The Board considered the extent to which the fund will benefit from economies of scale through increased services to the fund, through waivers or reimbursements, or through fee or expense reductions. The Board also noted that in 2009, it and the board of other Fidelity funds created an ad hoc committee (the Economies of Scale Committee) to analyze whether FMR attains economies of scale in respect of the management and servicing of the Fidelity funds, whether the Fidelity funds have appropriately benefited from such economies of scale, and whether there is potential for realization of any further economies of scale.
Annual Report
The Board recognized that the fund's management contract incorporates a "group fee" structure, which provides for lower group fee rates as total fund assets under FMR's management increase, and for higher group fee rates as total fund assets under FMR's management decrease. FMR calculates the group fee rates based on a tiered asset "breakpoint" schedule that varies based on asset class. The Board considered that the group fee is designed to deliver the benefits of economies of scale to fund shareholders when total Fidelity fund assets increase, even if assets of any particular fund are unchanged or have declined, because some portion of Fidelity's costs are attributable to services provided to all Fidelity funds, and all funds benefit if those costs can be allocated among more assets. The Board concluded that, given the group fee structure, fund shareholders will benefit from lower management fees as assets under FMR's management increase at the fund complex level, regardless of whether Fidelity achieves any such economies of scale.
The Board concluded, taking into account the analysis of the Economies of Scale Committee, that any potential economies of scale are being appropriately shared between fund shareholders and Fidelity.
Additional Information Requested by the Board. In order to develop fully the factual basis for consideration of the Fidelity funds' Advisory Contracts, the Board requested and received additional information on certain topics, including (i) fund performance trends, actions to be taken by FMR to improve certain funds' overall performance, and Fidelity's long-term strategies for certain funds; (ii) portfolio manager changes that have occurred during the past year and length of portfolio manager tenure for different categories of funds over time; (iii) Fidelity's compensation structure for portfolio managers and other key personnel and strategies for attracting and retaining non-investment personnel; (iv) the amount of the investment that each portfolio manager has made in the Fidelity fund(s) that he or she manages; (v) historical trends in Fidelity's realization of fall-out benefits; (vi) Fidelity's group fee structures and the rationale for the individual fee rates of certain funds; (vii) fund profitability methodology and the impact of certain factors on fund profitability results; (viii) trends regarding industry use of performance fee structures and Fidelity's compliance practices with respect to performance adjustment calculations; (ix) the fee structures in place for certain other Fidelity clients; and (x) explanations regarding the relative total expense ratios of certain funds and classes, total expense competitive trends, and actions that might be taken by FMR to reduce total expense ratios for certain funds and classes.
Based on its evaluation of all of the conclusions noted above, and after considering all factors it believed relevant, the Board ultimately concluded that the advisory fee structures are fair and reasonable, and that the fund's Advisory Contracts should be renewed.
Annual Report
Investment Adviser
Fidelity Management & Research Company
Boston, MA
Investment Sub-Advisers
FMR Co., Inc.
Fidelity Management & Research
(U.K.) Inc.
Fidelity Management & Research
(Hong Kong) Limited
FIL Investments (Japan) Limited
Fidelity Management & Research
(Japan) Inc.
FIL Investment Advisors (UK) Limited
FIL Investment Advisors
General Distributor
Fidelity Distributors Corporation
Boston, MA
Transfer and Service Agents
Fidelity Investments Institutional Operations Company, Inc.
Boston, MA
Fidelity Service Company, Inc.
Boston, MA
Custodian
JPMorgan Chase Bank
New York, NY
FAEMI-UANN-1211
1.809006.107
(Fidelity Investment logo)(registered trademark)
Fidelity Advisor®
Europe Capital Appreciation
Fund - Class A, Class T, Class B
and Class C
Annual Report
October 31, 2011
Contents
Chairman's Message | (Click Here) | The Chairman's message to shareholders. |
Performance | (Click Here) | How the fund has done over time. |
Management's Discussion of Fund Performance | (Click Here) | The Portfolio Manager's review of fund performance and strategy. |
Shareholder Expense Example | (Click Here) | An example of shareholder expenses. |
Investment Changes | (Click Here) | A summary of major shifts in the fund's investments over the past six months. |
Investments | (Click Here) | A complete list of the fund's investments with their market values. |
Financial Statements | (Click Here) | Statements of assets and liabilities, operations, and changes in net assets, as well as financial highlights. |
Notes | (Click Here) | Notes to financial statements. |
Report of Independent Registered Public Accounting Firm | (Click Here) | |
Trustees and Officers | (Click Here) | |
Distributions | (Click Here) | |
Board Approval of Investment Advisory Contracts and Management Fees | (Click Here) | |
To view a fund's proxy voting guidelines and proxy voting record for the 12-month period ended June 30, visit http://www.fidelity.com/proxyvotingresults or visit the Securities and Exchange Commission's (SEC) web site at http://www.sec.gov. You may also call 1-877-208-0098 to request a free copy of the proxy voting guidelines.
Standard & Poor's, S&P and S&P 500 are registered service marks of The McGraw-Hill Companies, Inc. and have been licensed for use by Fidelity Distributors Corporation.
Other third party marks appearing herein are the property of their respective owners.
All other marks appearing herein are registered or unregistered trademarks or service marks of FMR LLC or an affiliated company.
Annual Report
This report and the financial statements contained herein are submitted for the general information of the shareholders of the fund. This report is not authorized for distribution to prospective investors in the fund unless preceded or accompanied by an effective prospectus.
A fund files its complete schedule of portfolio holdings with the SEC for the first and third quarters of each fiscal year on Form N-Q. Forms N-Q are available on the SEC's web site at http://www.sec.gov. A fund's Forms N-Q may be reviewed and copied at the SEC's Public Reference Room in Washington, DC. Information regarding the operation of the SEC's Public Reference Room may be obtained by calling 1-800-SEC-0330. For a complete list of a fund's portfolio holdings, view the most recent holdings listing, semiannual report, or annual report on Fidelity's web site at http://www.fidelity.com, http://www.advisor.fidelity.com, or http://www.401k.com, as applicable.
NOT FDIC INSURED • MAY LOSE VALUE • NO BANK GUARANTEE
Neither the fund nor Fidelity Distributors Corporation is a bank.
Annual Report
(photo_of_James_C_Curvey)
Dear Shareholder:
Global equity markets began the fourth quarter on a strong note, sharply reversing course in October amid strong corporate earnings, better-than-expected economic news and the promise of a resolution to the sovereign debt crisis in Europe. The mini rally followed a third quarter marked by a significant downturn in July and August, which heightened investor anxiety and set off a wave of volatility that hampered most major asset classes through the end of September. Financial markets are difficult to predict, of course, but you can help put the odds in your favor by following these time-tested investment principles.
One of the basic tenets is to invest according to your time horizon. For long-term investors, riding out the markets' inevitable ups and downs has proven much more effective than making decisions based on short-term developments. If your goal is approaching, you can also benefit from patience and restraint, rather than attempting to time the market. No matter your time horizon, missing only a few of the markets' best days can significantly diminish returns. Patience also affords the benefits of compounding - earning interest on additional income or reinvested dividends and capital gains. While staying the course doesn't eliminate risk, it can considerably lessen the negative impact of short-term downturns.
Asset allocation is another principle to manage risk. As you spread your portfolio among the asset classes, be sure to consider your time horizon, risk tolerance and investment objectives. Younger investors may be better served by emphasizing equities, which historically have been the best-performing asset class over time. Investors who are nearing a specific goal, such as retirement or sending a child to college, may choose to favor bonds and other investments that have tended to be more stable. Studies indicate that asset allocation is the single most important determinant of a portfolio's long-term success. After deciding on a suitable allocation strategy, make sure your portfolio is adequately diversified, with exposure to stocks of small-, mid- and large-cap companies in a range of sectors, for example. And today, more than ever, geographic diversification should be taken into account.
Lastly, investing a certain amount of money on a regular basis - a principle known as dollar-cost averaging - can help lower the average cost of your purchases, while also giving you the discipline to avoid selling weak performers just prior to an upswing, or chasing a hot performer just before a correction.
We invite you to learn more by visiting us on the Internet, dropping by one of our Investor Centers or calling us by phone. It is our privilege to provide the resources you need to choose investments that are right for you.
Sincerely,
(The acting chairman's signature appears here.)
James C. Curvey
Acting Chairman
Annual Report
Average annual total return reflects the change in the value of an investment, assuming reinvestment of the class' distributions from dividend income and capital gains (the profits earned upon the sale of securities that have grown in value, if any) and assuming a constant rate of performance each year. The $10,000 table and the fund's returns do not reflect the deduction of taxes that a shareholder would pay on fund distributions or the redemption of fund shares. During periods of reimbursement by Fidelity, a fund's total return will be greater than it would be had the reimbursement not occurred. How a fund did yesterday is no guarantee of how it will do tomorrow. Returns reflect the conversion of Class B shares to Class A shares after a maximum of seven years.
Average Annual Total Returns
Periods ended October 31, 2011 | Past 1
year | Past 5
years | Past 10
years |
Class A (incl. 5.75% sales charge) | -14.42% | -5.26% | 4.43% |
Class T (incl. 3.50% sales charge) | -12.56% | -5.04% | 4.44% |
Class B (incl. contingent deferred sales charge) A | -14.37% | -5.13% | 4.54% |
Class C (incl. contingent deferred sales charge) B | -10.81% | -4.84% | 4.27% |
A Class B shares' contingent deferred sales charges included in the past one year, past five years, and past ten years total return figures are 5%, 2%, and 0%, respectively.
B Class C shares' contingent deferred sales charges included in the past one year, past five years, and past ten years total return figures are 1%, 0%, and 0%, respectively.
Annual Report
$10,000 Over 10 Years
Let's say hypothetically that $10,000 was invested in Fidelity Advisor® Europe Capital Appreciation Fund - Class A on October 31, 2001, and the current 5.75% sales charge was paid. The chart shows how the value of your investment would have changed, and also shows how the MSCI® Europe Index performed over the same period.
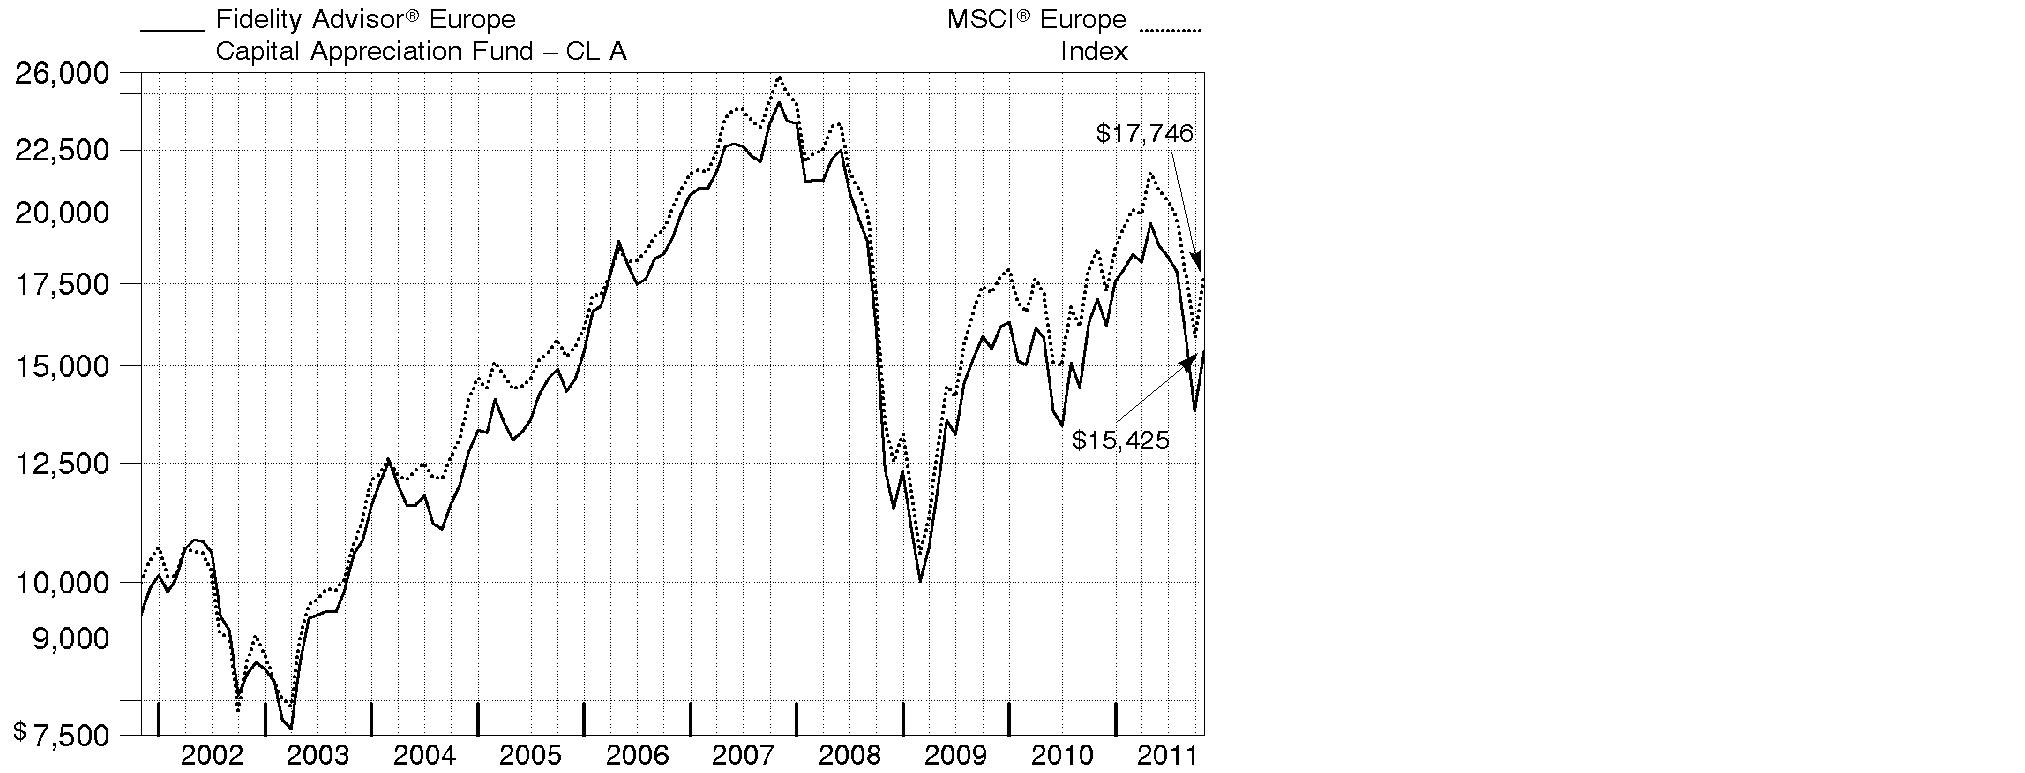
Annual Report
Market Recap: International equities were rocked by a number of headline events during the year ending October 31, 2011. Stocks posted a solid advance for the first half of the period, despite concern about the sovereign debt crisis in Europe, a devastating earthquake and tsunami in Japan, and political upheaval in the Middle East and North Africa. Sentiment turned decidedly negative in the second half, however, as fresh worries about Europe, inflation in China and a dimmed outlook for global growth caused foreign markets to suffer declines that intensified in August and September. October brought with it yet another dramatic swing, as eurozone policymakers appeared near a resolution to the debt debacle and buyers stormed back onto the scene in search of bargains. Still, those gains - along with favorable currency fluctuations overall - weren't enough to offset prior losses, and the MSCI® ACWI® (All Country World Index) ex USA Index finished the period down 4.56%. Within the MSCI index, Europe and emerging markets suffered the biggest declines, with many countries in these areas sustaining steep losses. By contrast, Japan showed resilience in the wake of its natural disasters, falling only 2%. Australia (+4%), Switzerland (+3%), the U.K. (+2%) and Canada, which produced a nominal return, were among the few major benchmark components to break into positive territory.
Comments from Melissa Reilly, Portfolio Manager of Fidelity Advisor® Europe Capital Appreciation Fund: For the year, the fund's Class A, Class T, Class B and Class C shares declined 9.19%, 9.38%, 9.87% and 9.91%, respectively (excluding sales charges), while the MSCI® Europe Index fell 5.01%. Stock selection in financials, especially banks; positioning in the pharmaceuticals/biotechnology/life science group of health care; picks in energy and tech; a modest stake in cash and positioning in the food/beverage/tobacco area of consumer staples all hurt. Individual detractors included: Spain's Mediaset Espana Comunicacion, French banks Societe Generale and BNP Paribas, and British bank Lloyds Banking Group. Underweighting the U.K.'s GlaxoSmithKline and not owning Roche Holding, two pharmaceutical companies in the index, also hurt, as did an underweighting in Germany-based chemicals company and index component BASF. Picks across Europe hurt, led by the U.K. Aiding the fund were positioning in industrials; stock selection in automobiles/components; positioning in utilities; and picks in telecommunication services. The following positions were beneficial: German car manufacturer Volkswagen, U.K. software developer Autonomy, an out-of-index holding in Russian fertilizer company Uralkali, and an out-of-index position in Mead Johnson Nutrition, a U.S.-based manufacturer of infant formula. Holdings in Germany and the Bailiwick of Jersey also helped. Some of the holdings mentioned in this report were sold by period end.
Annual Report
The views expressed above reflect those of the portfolio manager(s) only through the end of the period as stated on the cover of this report and do not necessarily represent the views of Fidelity or any other person in the Fidelity organization. Any such views are subject to change at any time based upon market or other conditions and Fidelity disclaims any responsibility to update such views. These views may not be relied on as investment advice and, because investment decisions for a Fidelity fund are based on numerous factors, may not be relied on as an indication of trading intent on behalf of any Fidelity fund.
Annual Report
Shareholder Expense Example
As a shareholder of the Fund, you incur two types of costs: (1) transaction costs, including sales charges (loads) on purchase payments or redemption proceeds, redemption fees, and (2) ongoing costs, including management fees, distribution and/or service (12b-1) fees and other Fund expenses. This Example is intended to help you understand your ongoing costs (in dollars) of investing in the Fund and to compare these costs with the ongoing costs of investing in other mutual funds.
The Example is based on an investment of $1,000 invested at the beginning of the period and held for the entire period (May 1, 2011 to October 31, 2011).
Actual Expenses
The first line of the accompanying table for each class of the Fund provides information about actual account values and actual expenses. You may use the information in this line, together with the amount you invested, to estimate the expenses that you paid over the period. Simply divide your account value by $1,000.00 (for example, an $8,600 account value divided by $1,000.00 = 8.6), then multiply the result by the number in the first line for a class of the Fund under the heading entitled "Expenses Paid During Period" to estimate the expenses you paid on your account during this period. In addition, the Fund, as a shareholder in the underlying Fidelity Central Funds, will indirectly bear its pro-rata share of the fees and expenses incurred by the underlying Fidelity Central Funds. These fees and expenses are not included in the Fund's annualized expense ratio used to calculate the expense estimate in the table below.
Hypothetical Example for Comparison Purposes
The second line of the accompanying table for each class of the Fund provides information about hypothetical account values and hypothetical expenses based on a Class' actual expense ratio and an assumed rate of return of 5% per year before expenses, which is not the Class' actual return. The hypothetical account values and expenses may not be used to estimate the actual ending account balance or expenses you paid for the period. You may use this information to compare the ongoing costs of investing in the Fund and other funds. To do so, compare this 5% hypothetical example with the 5% hypothetical examples that appear in the shareholder reports of the other funds. In addition, the Fund, as a shareholder in the underlying Fidelity Central Funds, will indirectly bear its pro-rata share of the fees and expenses incurred by the underlying Fidelity Central Funds. These fees and expenses are not included in the Fund's annualized expense ratio used to calculate the expense estimate in the table below.
Please note that the expenses shown in the table are meant to highlight your ongoing costs only and do not reflect any transaction costs. Therefore, the second line of the table is useful in comparing ongoing costs only, and will not help you determine the relative total costs of owning different funds. In addition, if these transactional costs were included, your costs would have been higher.
Annual Report
| Annualized
Expense Ratio | Beginning
Account Value
May 1, 2011 | Ending
Account Value
October 31, 2011 | Expenses Paid
During Period*
May 1, 2011 to
October 31, 2011 |
Class A | 1.45% | | | |
Actual | | $ 1,000.00 | $ 787.10 | $ 6.53 |
HypotheticalA | | $ 1,000.00 | $ 1,017.90 | $ 7.38 |
Class T | 1.70% | | | |
Actual | | $ 1,000.00 | $ 786.30 | $ 7.65 |
HypotheticalA | | $ 1,000.00 | $ 1,016.64 | $ 8.64 |
Class B | 2.20% | | | |
Actual | | $ 1,000.00 | $ 783.90 | $ 9.89 |
HypotheticalA | | $ 1,000.00 | $ 1,014.12 | $ 11.17 |
Class C | 2.20% | | | |
Actual | | $ 1,000.00 | $ 784.30 | $ 9.89 |
HypotheticalA | | $ 1,000.00 | $ 1,014.12 | $ 11.17 |
Institutional Class | 1.20% | | | |
Actual | | $ 1,000.00 | $ 788.20 | $ 5.41 |
HypotheticalA | | $ 1,000.00 | $ 1,019.16 | $ 6.11 |
A 5% return per year before expenses
* Expenses are equal to each Class' annualized expense ratio, multiplied by the average account value over the period, multiplied by 184/365 (to reflect the one-half year period).
Annual Report
Investment Changes (Unaudited)
Top Five Stocks as of October 31, 2011 |
| % of fund's
net assets | % of fund's net assets
6 months ago |
Royal Dutch Shell PLC Class A (United Kingdom) (United Kingdom, Oil, Gas & Consumable Fuels) | 5.0 | 3.5 |
Nestle SA (Switzerland, Food Products) | 3.8 | 0.0 |
Sanofi-aventis (France, Pharmaceuticals) | 3.1 | 0.0 |
Vodafone Group PLC (United Kingdom, Wireless Telecommunication Services) | 2.9 | 2.3 |
BG Group PLC (United Kingdom, Oil, Gas & Consumable Fuels) | 2.3 | 1.9 |
| 17.1 | |
Top Five Market Sectors as of October 31, 2011 |
| % of fund's
net assets | % of fund's net assets
6 months ago |
Financials | 22.4 | 19.9 |
Consumer Discretionary | 16.6 | 20.0 |
Energy | 11.8 | 12.7 |
Health Care | 10.3 | 4.4 |
Consumer Staples | 10.2 | 6.3 |
Top Five Countries as of October 31, 2011 |
(excluding cash equivalents) | % of fund's
net assets | % of fund's net assets
6 months ago |
United Kingdom | 33.4 | 29.2 |
France | 16.9 | 15.2 |
Germany | 10.0 | 10.0 |
Switzerland | 8.7 | 5.0 |
Italy | 4.9 | 4.6 |
Percentages are adjusted for the effect of open futures contracts, if applicable. |
Asset Allocation (% of fund's net assets) |
As of October 31, 2011 | As of April 30, 2011 |
| Stocks 98.5% | | | Stocks 99.9% | |
| Short-Term
Investments and
Net Other Assets 1.5% | | | Short-Term
Investments and
Net Other Assets 0.1% | |

Annual Report
Investments October 31, 2011
Showing Percentage of Net Assets
Common Stocks - 96.0% |
| Shares | | Value |
Australia - 0.4% |
Fortescue Metals Group Ltd. | 13,182 | | $ 66,217 |
Bailiwick of Guernsey - 0.5% |
Resolution Ltd. | 18,400 | | 81,375 |
Bailiwick of Jersey - 2.9% |
Experian PLC | 13,600 | | 177,269 |
Randgold Resources Ltd. sponsored ADR | 1,100 | | 120,527 |
Shire PLC | 6,890 | | 216,287 |
TOTAL BAILIWICK OF JERSEY | | 514,083 |
Belgium - 0.0% |
Anheuser-Busch InBev SA NV (strip VVPR) (a) | 6,080 | | 8 |
Bermuda - 0.3% |
Lazard Ltd. Class A | 2,100 | | 57,414 |
British Virgin Islands - 0.6% |
Mail.ru Group Ltd. GDR (Reg. S) | 3,100 | | 106,795 |
China - 0.6% |
Baidu.com, Inc. sponsored ADR (a) | 800 | | 112,144 |
Denmark - 1.5% |
Danske Bank A/S (a) | 7,560 | | 104,751 |
Novo Nordisk A/S Series B | 1,637 | | 173,822 |
TOTAL DENMARK | | 278,573 |
France - 16.9% |
Alstom SA | 4,175 | | 156,578 |
Arkema SA | 1,800 | | 123,144 |
Atos Origin SA | 2,454 | | 118,931 |
BNP Paribas SA | 5,469 | | 248,627 |
Christian Dior SA | 600 | | 84,944 |
Compagnie Generale de Geophysique SA (a) | 3,500 | | 76,484 |
Danone | 4,100 | | 285,402 |
Edenred | 4,200 | | 119,154 |
GDF Suez | 3,200 | | 90,850 |
Iliad SA | 1,257 | | 147,132 |
JC Decaux SA (a) | 4,700 | | 125,956 |
LVMH Moet Hennessy - Louis Vuitton | 1,201 | | 199,863 |
PPR SA | 1,600 | | 249,988 |
Publicis Groupe SA | 3,100 | | 150,303 |
Safran SA | 4,100 | | 134,303 |
Common Stocks - continued |
| Shares | | Value |
France - continued |
Sanofi-aventis | 7,830 | | $ 560,232 |
Unibail-Rodamco | 800 | | 159,979 |
TOTAL FRANCE | | 3,031,870 |
Germany - 7.5% |
Allianz AG | 1,894 | | 212,860 |
BASF AG | 2,588 | | 190,502 |
Bayer AG | 3,100 | | 198,610 |
Deutsche Bank AG | 2,500 | | 103,386 |
E.ON AG | 3,270 | | 79,239 |
Fresenius Medical Care AG & Co. KGaA | 1,800 | | 131,141 |
HeidelbergCement AG | 2,100 | | 95,846 |
Kabel Deutschland Holding AG (a) | 1,800 | | 102,779 |
SAP AG | 3,934 | | 237,915 |
TOTAL GERMANY | | 1,352,278 |
Ireland - 0.3% |
Elan Corp. PLC (a) | 4,600 | | 54,560 |
Italy - 4.9% |
Amplifon SpA | 10,600 | | 50,991 |
ENI SpA | 11,500 | | 254,232 |
Fiat Industrial SpA (a) | 15,400 | | 134,373 |
Intesa Sanpaolo SpA | 88,059 | | 157,328 |
Prada SpA | 36,300 | | 179,447 |
Prysmian SpA | 6,500 | | 98,499 |
TOTAL ITALY | | 874,870 |
Netherlands - 3.2% |
AEGON NV (a) | 31,100 | | 148,336 |
ING Groep NV (Certificaten Van Aandelen) (a) | 27,600 | | 237,973 |
Koninklijke Philips Electronics NV | 5,400 | | 112,426 |
Yandex NV | 2,600 | | 71,552 |
TOTAL NETHERLANDS | | 570,287 |
Norway - 1.8% |
Aker Solutions ASA | 9,100 | | 105,831 |
Storebrand ASA (A Shares) | 35,000 | | 215,811 |
TOTAL NORWAY | | 321,642 |
Poland - 0.3% |
Eurocash SA | 7,700 | | 61,738 |
Common Stocks - continued |
| Shares | | Value |
Spain - 4.5% |
Banco Bilbao Vizcaya Argentaria SA | 29,292 | | $ 263,664 |
Banco Santander SA: | | | |
rights 10/31/11 | 24,586 | | 4,253 |
(Spain) | 16,511 | | 139,767 |
Grifols SA (a) | 4,700 | | 87,711 |
Inditex SA | 2,621 | | 238,525 |
Mediaset Espana Comunicacion (d) | 10,985 | | 72,970 |
TOTAL SPAIN | | 806,890 |
Sweden - 2.9% |
H&M Hennes & Mauritz AB (B Shares) | 5,348 | | 177,103 |
Swedbank AB (A Shares) | 11,105 | | 156,452 |
Telefonaktiebolaget LM Ericsson (B Shares) | 18,703 | | 194,888 |
TOTAL SWEDEN | | 528,443 |
Switzerland - 8.7% |
Adecco SA (Reg.) | 2,464 | | 119,080 |
Bank Sarasin & Co. Ltd. Series B (Reg.) | 2,190 | | 83,602 |
Compagnie Financiere Richemont SA Series A | 3,537 | | 202,535 |
Nestle SA | 11,909 | | 690,751 |
Schindler Holding AG (participation certificate) | 1,323 | | 155,585 |
Transocean Ltd. (United States) | 1,900 | | 108,585 |
UBS AG (a) | 16,324 | | 206,365 |
TOTAL SWITZERLAND | | 1,566,503 |
United Kingdom - 33.4% |
Aegis Group PLC | 55,818 | | 123,160 |
Aviva PLC | 22,400 | | 122,227 |
Barclays PLC | 87,019 | | 269,804 |
BG Group PLC | 19,273 | | 420,445 |
BHP Billiton PLC | 7,346 | | 231,365 |
British American Tobacco PLC (United Kingdom) | 7,500 | | 343,942 |
British Land Co. PLC | 20,996 | | 172,374 |
Carphone Warehouse Group PLC | 69,750 | | 393,724 |
Filtrona PLC | 17,000 | | 108,565 |
GlaxoSmithKline PLC | 15,900 | | 356,900 |
HSBC Holdings PLC sponsored ADR | 7,662 | | 334,523 |
Invensys PLC | 14,400 | | 52,221 |
Lloyds Banking Group PLC (a) | 317,200 | | 164,062 |
Meggitt PLC | 21,900 | | 135,455 |
Micro Focus International PLC | 15,400 | | 84,106 |
Misys PLC | 13,802 | | 64,769 |
Next PLC | 3,700 | | 152,091 |
Common Stocks - continued |
| Shares | | Value |
United Kingdom - continued |
Rolls-Royce Group PLC | 9,600 | | $ 108,457 |
Rolls-Royce Group PLC Class C | 662,400 | | 1,065 |
Royal Dutch Shell PLC Class A (United Kingdom) | 25,217 | | 893,466 |
Standard Chartered PLC (United Kingdom) | 10,037 | | 235,505 |
Tullow Oil PLC | 5,200 | | 117,328 |
Unilever PLC | 9,600 | | 321,854 |
Vodafone Group PLC | 188,600 | | 523,781 |
Xstrata PLC | 15,200 | | 255,569 |
TOTAL UNITED KINGDOM | | 5,986,758 |
United States of America - 4.8% |
Apple, Inc. (a) | 225 | | 91,076 |
Beam, Inc. | 1,100 | | 54,373 |
Dunkin' Brands Group, Inc. (a) | 100 | | 2,911 |
Fluor Corp. | 1,300 | | 73,905 |
Halliburton Co. | 2,100 | | 78,456 |
Mead Johnson Nutrition Co. Class A | 1,200 | | 86,220 |
Morgan Stanley | 6,400 | | 112,896 |
Noble Energy, Inc. | 1,000 | | 89,340 |
Perrigo Co. | 400 | | 36,112 |
salesforce.com, Inc. (a) | 500 | | 66,585 |
The Mosaic Co. | 1,500 | | 87,840 |
Virgin Media, Inc. | 3,300 | | 80,454 |
TOTAL UNITED STATES OF AMERICA | | 860,168 |
TOTAL COMMON STOCKS (Cost $18,281,851) | 17,232,616 |
Nonconvertible Preferred Stocks - 2.5% |
| | | |
Germany - 2.5% |
ProSiebenSat.1 Media AG | 10,000 | | 214,505 |
Volkswagen AG | 1,300 | | 228,122 |
TOTAL NONCONVERTIBLE PREFERRED STOCKS (Cost $373,633) | 442,627 |
Money Market Funds - 2.2% |
| Shares | | Value |
Fidelity Cash Central Fund, 0.12% (b) | 268,586 | | $ 268,586 |
Fidelity Securities Lending Cash Central Fund, 0.11% (b)(c) | 120,000 | | 120,000 |
TOTAL MONEY MARKET FUNDS (Cost $388,586) | 388,586 |
TOTAL INVESTMENT PORTFOLIO - 100.7% (Cost $19,044,070) | | 18,063,829 |
NET OTHER ASSETS (LIABILITIES) - (0.7)% | | (118,327) |
NET ASSETS - 100% | $ 17,945,502 |
Legend |
(a) Non-income producing |
(b) Affiliated fund that is available only to investment companies and other accounts managed by Fidelity Investments. The rate quoted is the annualized seven-day yield of the fund at period end. A complete unaudited listing of the fund's holdings as of its most recent quarter end is available upon request. In addition, each Fidelity Central Fund's financial statements, which are not covered by the Fund's Report of Independent Registered Public Accounting Firm, are available on the SEC's website or upon request. |
(c) Investment made with cash collateral received from securities on loan. |
(d) Security or a portion of the security is on loan at period end. |
Affiliated Central Funds |
Information regarding fiscal year to date income earned by the Fund from investments in Fidelity Central Funds is as follows: |
Fund | Income earned |
Fidelity Cash Central Fund | $ 596 |
Fidelity Securities Lending Cash Central Fund | 7,159 |
Total | $ 7,755 |
Other Information |
The following is a summary of the inputs used, as of October 31, 2011, involving the Fund's assets and liabilities carried at fair value. The inputs or methodology used for valuing securities may not be an indication of the risk associated with investing in those securities. For more information on valuation inputs, and their aggregation into the levels used in the table below, please refer to the Security Valuation section in the accompanying Notes to Financial Statements. |
Valuation Inputs at Reporting Date: |
Description | Total | Level 1 | Level 2 | Level 3 |
Investments in Securities: | | | | |
Equities: | | | | |
United Kingdom | $ 5,986,758 | $ 2,759,357 | $ 3,227,401 | $ - |
France | 3,031,870 | 2,395,154 | 636,716 | - |
Germany | 1,794,905 | 1,322,463 | 472,442 | - |
Switzerland | 1,566,503 | 1,360,138 | 206,365 | - |
Italy | 874,870 | 441,191 | 433,679 | - |
United States of America | 860,168 | 860,168 | - | - |
Spain | 806,890 | 403,459 | 403,431 | - |
Netherlands | 570,287 | 71,552 | 498,735 | - |
Sweden | 528,443 | 333,555 | 194,888 | - |
Other | 1,654,549 | 1,143,663 | 510,886 | - |
Money Market Funds | 388,586 | 388,586 | - | - |
Total Investments in Securities: | $ 18,063,829 | $ 11,479,286 | $ 6,584,543 | $ - |
Income Tax Information |
At October 31, 2011, the Fund had a capital loss carryforward of approximately $17,533,353 of which $9,488,728 and $8,044,625 will expire in fiscal 2016 and 2017, respectively. Capital loss carryforwards are only available to offset future capital gains of the Fund to the extent provided by regulations and may be limited. |
See accompanying notes which are an integral part of the financial statements.
Annual Report
Statement of Assets and Liabilities
| October 31, 2011 |
Assets | | |
Investment in securities, at value (including securities loaned of $107,120) - See accompanying schedule: Unaffiliated issuers (cost $18,655,484) | $ 17,675,243 | |
Fidelity Central Funds (cost $388,586) | 388,586 | |
Total Investments (cost $19,044,070) | | $ 18,063,829 |
Foreign currency held at value (cost $817) | | 817 |
Receivable for investments sold | | 300,599 |
Receivable for fund shares sold | | 19,302 |
Dividends receivable | | 27,802 |
Distributions receivable from Fidelity Central Funds | | 107 |
Prepaid expenses | | 73 |
Receivable from investment adviser for expense reductions | | 4,018 |
Other receivables | | 3,450 |
Total assets | | 18,419,997 |
| | |
Liabilities | | |
Payable for investments purchased | $ 239,325 | |
Payable for fund shares redeemed | 53,225 | |
Accrued management fee | 10,148 | |
Distribution and service plan fees payable | 6,867 | |
Other affiliated payables | 4,958 | |
Other payables and accrued expenses | 39,972 | |
Collateral on securities loaned, at value | 120,000 | |
Total liabilities | | 474,495 |
| | |
Net Assets | | $ 17,945,502 |
Net Assets consist of: | | |
Paid in capital | | $ 36,431,519 |
Undistributed net investment income | | 204,426 |
Accumulated undistributed net realized gain (loss) on investments and foreign currency transactions | | (17,710,205) |
Net unrealized appreciation (depreciation) on investments and assets and liabilities in foreign currencies | | (980,238) |
Net Assets | | $ 17,945,502 |
See accompanying notes which are an integral part of the financial statements.
Annual Report
Financial Statements - continued
Statement of Assets and Liabilities - continued
| October 31, 2011 |
Calculation of Maximum Offering Price Class A:
Net Asset Value and redemption price per share ($8,024,582 ÷ 756,396 shares) | | $ 10.61 |
| | |
Maximum offering price per share (100/94.25 of $10.61) | | $ 11.26 |
Class T:
Net Asset Value and redemption price per share ($5,964,841 ÷ 565,054 shares) | | $ 10.56 |
| | |
Maximum offering price per share (100/96.50 of $10.56) | | $ 10.94 |
Class B:
Net Asset Value and offering price per share ($1,136,377 ÷ 111,093 shares)A | | $ 10.23 |
| | |
Class C:
Net Asset Value and offering price per share ($2,524,192 ÷ 247,984 shares)A | | $ 10.18 |
| | |
Institutional Class:
Net Asset Value, offering price and redemption price per share ($295,510 ÷ 27,292 shares) | | $ 10.83 |
A Redemption price per share is equal to net asset value less any applicable contingent deferred sales charge.
See accompanying notes which are an integral part of the financial statements.
Annual Report
Statement of Operations
| Year ended October 31, 2011 |
Investment Income | | |
Dividends | | $ 625,108 |
Interest | | 2 |
Income from Fidelity Central Funds | | 7,755 |
Income before foreign taxes withheld | | 632,865 |
Less foreign taxes withheld | | (65,854) |
Total income | | 567,011 |
| | |
Expenses | | |
Management fee | $ 155,084 | |
Transfer agent fees | 68,488 | |
Distribution and service plan fees | 105,807 | |
Accounting and security lending fees | 11,461 | |
Custodian fees and expenses | 38,245 | |
Independent trustees' compensation | 123 | |
Registration fees | 59,689 | |
Audit | 49,935 | |
Legal | 175 | |
Miscellaneous | 222 | |
Total expenses before reductions | 489,229 | |
Expense reductions | (130,199) | 359,030 |
Net investment income (loss) | | 207,981 |
Realized and Unrealized Gain (Loss) Net realized gain (loss) on: | | |
Investment securities: | | |
Unaffiliated issuers | 1,828,147 | |
Foreign currency transactions | (148) | |
Total net realized gain (loss) | | 1,827,999 |
Change in net unrealized appreciation (depreciation) on: Investment securities | (3,857,375) | |
Assets and liabilities in foreign currencies | (4,128) | |
Total change in net unrealized appreciation (depreciation) | | (3,861,503) |
Net gain (loss) | | (2,033,504) |
Net increase (decrease) in net assets resulting from operations | | $ (1,825,523) |
See accompanying notes which are an integral part of the financial statements.
Annual Report
Financial Statements - continued
Statement of Changes in Net Assets
| Year ended
October 31,
2011 | Year ended
October 31,
2010 |
Increase (Decrease) in Net Assets | | |
Operations | | |
Net investment income (loss) | $ 207,981 | $ 84,988 |
Net realized gain (loss) | 1,827,999 | 322,052 |
Change in net unrealized appreciation (depreciation) | (3,861,503) | 1,507,133 |
Net increase (decrease) in net assets resulting
from operations | (1,825,523) | 1,914,173 |
Distributions to shareholders from net investment income | (69,262) | (281,171) |
Share transactions - net increase (decrease) | (3,369,781) | (4,178,483) |
Redemption fees | 300 | 436 |
Total increase (decrease) in net assets | (5,264,266) | (2,545,045) |
| | |
Net Assets | | |
Beginning of period | 23,209,768 | 25,754,813 |
End of period (including undistributed net investment income of $204,426 and undistributed net investment income of $65,823, respectively) | $ 17,945,502 | $ 23,209,768 |
See accompanying notes which are an integral part of the financial statements.
Annual Report
Financial Highlights - Class A
Years ended October 31, | 2011 | 2010 | 2009 | 2008 | 2007 |
Selected Per-Share Data | | | | | |
Net asset value, beginning of period | $ 11.74 | $ 10.82 | $ 8.98 | $ 20.94 | $ 17.49 |
Income from Investment Operations | | | | | |
Net investment income (loss) C | .14 | .06 | .15 | .25 | .32 |
Net realized and unrealized gain (loss) | (1.21) | .99 | 1.99 | (9.22) | 4.48 |
Total from investment operations | (1.07) | 1.05 | 2.14 | (8.97) | 4.80 |
Distributions from net investment income | (.06) | (.13) | (.30) | (.31) | (.12) |
Distributions from net realized gain | - | - | - | (2.68) | (1.23) |
Total distributions | (.06) | (.13) | (.30) | (2.99) | (1.35) |
Redemption fees added to paid in capital C, G | - | - | - | - | - |
Net asset value, end of period | $ 10.61 | $ 11.74 | $ 10.82 | $ 8.98 | $ 20.94 |
Total Return A, B | (9.19)% | 9.74% | 25.27% | (49.77)% | 29.16% |
Ratios to Average Net Assets D, F | | | | | |
Expenses before reductions | 2.00% | 2.05% | 2.00% | 1.63% | 1.53% |
Expenses net of fee waivers, if any | 1.45% | 1.50% | 1.50% | 1.50% | 1.50% |
Expenses net of all reductions | 1.41% | 1.43% | 1.46% | 1.46% | 1.46% |
Net investment income (loss) | 1.18% | .61% | 1.73% | 1.65% | 1.69% |
Supplemental Data | | | | | |
Net assets, end of period (000 omitted) | $ 8,025 | $ 10,276 | $ 10,904 | $ 10,286 | $ 29,273 |
Portfolio turnover rate E | 118% | 143% | 109% | 112% | 173% |
A Total returns would have been lower if certain expenses had not been reduced during the applicable periods shown.
B Total returns do not include the effect of the sales charges.
C Calculated based on average shares outstanding during the period.
D Fees and expenses of any underlying Fidelity Central Funds are not included in the Fund's expense ratio. The Fund indirectly bears its proportionate share of the expenses of any underlying Fidelity Central Funds.
E Amount does not include the portfolio activity of any underlying Fidelity Central Funds.
F Expense ratios reflect operating expenses of the class. Expenses before reductions do not reflect amounts reimbursed by the investment adviser or reductions from brokerage service arrangements or reductions from other expense offset arrangements and do not represent the amount paid by the class during periods when reimbursements or reductions occur. Expenses net of fee waivers reflect expenses after reimbursement by the investment adviser but prior to reductions from brokerage service arrangements or other expense offset arrangements. Expenses net of all reductions represent the net expenses paid by the class.
G Amount represents less than $.01 per share.
See accompanying notes which are an integral part of the financial statements.
Annual Report
Financial Highlights - Class T
Years ended October 31, | 2011 | 2010 | 2009 | 2008 | 2007 |
Selected Per-Share Data | | | | | |
Net asset value, beginning of period | $ 11.68 | $ 10.78 | $ 8.92 | $ 20.75 | $ 17.35 |
Income from Investment Operations | | | | | |
Net investment income (loss) C | .11 | .04 | .13 | .21 | .27 |
Net realized and unrealized gain (loss) | (1.20) | .97 | 1.99 | (9.17) | 4.44 |
Total from investment operations | (1.09) | 1.01 | 2.12 | (8.96) | 4.71 |
Distributions from net investment income | (.03) | (.11) | (.26) | (.19) | (.08) |
Distributions from net realized gain | - | - | - | (2.68) | (1.23) |
Total distributions | (.03) | (.11) | (.26) | (2.87) | (1.31) |
Redemption fees added to paid in capital C, G | - | - | - | - | - |
Net asset value, end of period | $ 10.56 | $ 11.68 | $ 10.78 | $ 8.92 | $ 20.75 |
Total Return A, B | (9.38)% | 9.42% | 24.99% | (49.91)% | 28.86% |
Ratios to Average Net Assets D, F | | | | | |
Expenses before reductions | 2.27% | 2.34% | 2.28% | 1.88% | 1.80% |
Expenses net of fee waivers, if any | 1.70% | 1.75% | 1.75% | 1.75% | 1.75% |
Expenses net of all reductions | 1.66% | 1.67% | 1.71% | 1.71% | 1.71% |
Net investment income (loss) | .93% | .36% | 1.48% | 1.40% | 1.44% |
Supplemental Data | | | | | |
Net assets, end of period (000 omitted) | $ 5,965 | $ 7,496 | $ 8,014 | $ 7,866 | $ 21,357 |
Portfolio turnover rate E | 118% | 143% | 109% | 112% | 173% |
A Total returns would have been lower if certain expenses had not been reduced during the applicable periods shown.
B Total returns do not include the effect of the sales charges.
C Calculated based on average shares outstanding during the period.
D Fees and expenses of any underlying Fidelity Central Funds are not included in the Fund's expense ratio. The Fund indirectly bears its proportionate share of the expenses of any underlying Fidelity Central Funds.
E Amount does not include the portfolio activity of any underlying Fidelity Central Funds.
F Expense ratios reflect operating expenses of the class. Expenses before reductions do not reflect amounts reimbursed by the investment adviser or reductions from brokerage service arrangements or reductions from other expense offset arrangements and do not represent the amount paid by the class during periods when reimbursements or reductions occur. Expenses net of fee waivers reflect expenses after reimbursement by the investment adviser but prior to reductions from brokerage service arrangements or other expense offset arrangements. Expenses net of all reductions represent the net expenses paid by the class.
G Amount represents less than $.01 per share.
See accompanying notes which are an integral part of the financial statements.
Annual Report
Financial Highlights - Class B
Years ended October 31, | 2011 | 2010 | 2009 | 2008 | 2007 |
Selected Per-Share Data | | | | | |
Net asset value, beginning of period | $ 11.35 | $ 10.48 | $ 8.61 | $ 20.16 | $ 16.91 |
Income from Investment Operations | | | | | |
Net investment income (loss) C | .05 | (.01) | .08 | .13 | .17 |
Net realized and unrealized gain (loss) | (1.17) | .94 | 1.95 | (8.86) | 4.34 |
Total from investment operations | (1.12) | .93 | 2.03 | (8.73) | 4.51 |
Distributions from net investment income | - | (.06) | (.16) | (.14) | (.03) |
Distributions from net realized gain | - | - | - | (2.68) | (1.23) |
Total distributions | - | (.06) | (.16) | (2.82) | (1.26) |
Redemption fees added to paid in capital C, G | - | - | - | - | - |
Net asset value, end of period | $ 10.23 | $ 11.35 | $ 10.48 | $ 8.61 | $ 20.16 |
Total Return A, B | (9.87)% | 8.87% | 24.34% | (50.13)% | 28.29% |
Ratios to Average Net Assets D, F | | | | | |
Expenses before reductions | 2.78% | 2.82% | 2.77% | 2.39% | 2.31% |
Expenses net of fee waivers, if any | 2.20% | 2.25% | 2.25% | 2.25% | 2.25% |
Expenses net of all reductions | 2.16% | 2.18% | 2.21% | 2.21% | 2.21% |
Net investment income (loss) | .43% | (.14)% | .98% | .90% | .94% |
Supplemental Data | | | | | |
Net assets, end of period (000 omitted) | $ 1,136 | $ 1,935 | $ 2,490 | $ 2,806 | $ 11,206 |
Portfolio turnover rate E | 118% | 143% | 109% | 112% | 173% |
A Total returns would have been lower if certain expenses had not been reduced during the applicable periods shown.
B Total returns do not include the effect of the contingent deferred sales charge.
C Calculated based on average shares outstanding during the period.
D Fees and expenses of any underlying Fidelity Central Funds are not included in the Fund's expense ratio. The Fund indirectly bears its proportionate share of the expenses of any underlying Fidelity Central Funds.
E Amount does not include the portfolio activity of any underlying Fidelity Central Funds.
F Expense ratios reflect operating expenses of the class. Expenses before reductions do not reflect amounts reimbursed by the investment adviser or reductions from brokerage service arrangements or reductions from other expense offset arrangements and do not represent the amount paid by the class during periods when reimbursements or reductions occur. Expenses net of fee waivers reflect expenses after reimbursement by the investment adviser but prior to reductions from brokerage service arrangements or other expense offset arrangements. Expenses net of all reductions represent the net expenses paid by the class.
G Amount represents less than $.01 per share.
See accompanying notes which are an integral part of the financial statements.
Annual Report
Financial Highlights - Class C
Years ended October 31, | 2011 | 2010 | 2009 | 2008 | 2007 |
Selected Per-Share Data | | | | | |
Net asset value, beginning of period | $ 11.30 | $ 10.43 | $ 8.58 | $ 20.10 | $ 16.89 |
Income from Investment Operations | | | | | |
Net investment income (loss) C | .05 | (.01) | .08 | .13 | .17 |
Net realized and unrealized gain (loss) | (1.17) | .94 | 1.94 | (8.82) | 4.32 |
Total from investment operations | (1.12) | .93 | 2.02 | (8.69) | 4.49 |
Distributions from net investment income | - | (.06) | (.17) | (.15) | (.05) |
Distributions from net realized gain | - | - | - | (2.68) | (1.23) |
Total distributions | - | (.06) | (.17) | (2.83) | (1.28) |
Redemption fees added to paid in capital C, G | - | - | - | - | - |
Net asset value, end of period | $ 10.18 | $ 11.30 | $ 10.43 | $ 8.58 | $ 20.10 |
Total Return A, B | (9.91)% | 8.92% | 24.29% | (50.11)% | 28.21% |
Ratios to Average Net Assets D, F | | | | | |
Expenses before reductions | 2.75% | 2.82% | 2.77% | 2.38% | 2.26% |
Expenses net of fee waivers, if any | 2.20% | 2.25% | 2.25% | 2.25% | 2.25% |
Expenses net of all reductions | 2.16% | 2.18% | 2.21% | 2.21% | 2.21% |
Net investment income (loss) | .43% | (.14)% | .98% | .90% | .94% |
Supplemental Data | | | | | |
Net assets, end of period (000 omitted) | $ 2,524 | $ 3,166 | $ 3,913 | $ 4,522 | $ 16,084 |
Portfolio turnover rate E | 118% | 143% | 109% | 112% | 173% |
A Total returns would have been lower if certain expenses had not been reduced during the applicable periods shown.
B Total returns do not include the effect of the contingent deferred sales charge.
C Calculated based on average shares outstanding during the period.
D Fees and expenses of any underlying Fidelity Central Funds are not included in the Fund's expense ratio. The Fund indirectly bears its proportionate share of the expenses of any underlying Fidelity Central Funds.
E Amount does not include the portfolio activity of any underlying Fidelity Central Funds.
F Expense ratios reflect operating expenses of the class. Expenses before reductions do not reflect amounts reimbursed by the investment adviser or reductions from brokerage service arrangements or reductions from other expense offset arrangements and do not represent the amount paid by the class during periods when reimbursements or reductions occur. Expenses net of fee waivers reflect expenses after reimbursement by the investment adviser but prior to reductions from brokerage service arrangements or other expense offset arrangements. Expenses net of all reductions represent the net expenses paid by the class.
G Amount represents less than $.01 per share.
See accompanying notes which are an integral part of the financial statements.
Annual Report
Financial Highlights - Institutional Class
Years ended October 31, | 2011 | 2010 | 2009 | 2008 | 2007 |
Selected Per-Share Data | | | | | |
Net asset value, beginning of period | $ 11.98 | $ 11.03 | $ 9.13 | $ 21.27 | $ 17.72 |
Income from Investment Operations | | | | | |
Net investment income (loss) B | .18 | .09 | .18 | .30 | .38 |
Net realized and unrealized gain (loss) | (1.24) | 1.01 | 2.03 | (9.38) | 4.54 |
Total from investment operations | (1.06) | 1.10 | 2.21 | (9.08) | 4.92 |
Distributions from net investment income | (.09) | (.15) | (.31) | (.38) | (.14) |
Distributions from net realized gain | - | - | - | (2.68) | (1.23) |
Total distributions | (.09) | (.15) | (.31) | (3.06) | (1.37) |
Redemption fees added to paid in capital B, F | - | - | - | - | - |
Net asset value, end of period | $ 10.83 | $ 11.98 | $ 11.03 | $ 9.13 | $ 21.27 |
Total Return A | (8.95)% | 10.00% | 25.57% | (49.63)% | 29.57% |
Ratios to Average Net Assets C, E | | | | | |
Expenses before reductions | 1.54% | 1.80% | 1.68% | 1.27% | 1.19% |
Expenses net of fee waivers, if any | 1.20% | 1.25% | 1.25% | 1.25% | 1.19% |
Expenses net of all reductions | 1.16% | 1.17% | 1.21% | 1.21% | 1.15% |
Net investment income (loss) | 1.43% | .86% | 1.98% | 1.90% | 2.00% |
Supplemental Data | | | | | |
Net assets, end of period (000 omitted) | $ 296 | $ 336 | $ 434 | $ 378 | $ 1,738 |
Portfolio turnover rate D | 118% | 143% | 109% | 112% | 173% |
A Total returns would have been lower if certain expenses had not been reduced during the applicable periods shown.
B Calculated based on average shares outstanding during the period.
C Fees and expenses of any underlying Fidelity Central Funds are not included in the Fund's expense ratio. The Fund indirectly bears its proportionate share of the expenses of any underlying Fidelity Central Funds.
D Amount does not include the portfolio activity of any underlying Fidelity Central Funds.
E Expense ratios reflect operating expenses of the class. Expenses before reductions do not reflect amounts reimbursed by the investment adviser or reductions from brokerage service arrangements or reductions from other expense offset arrangements and do not represent the amount paid by the class during periods when reimbursements or reductions occur. Expenses net of fee waivers reflect expenses after reimbursement by the investment adviser but prior to reductions from brokerage service arrangements or other expense offset arrangements. Expenses net of all reductions represent the net expenses paid by the class.
F Amount represents less than $.01 per share.
See accompanying notes which are an integral part of the financial statements.
Annual Report
Notes to Financial Statements
For the period ended October 31, 2011
1. Organization.
Fidelity Advisor Europe Capital Appreciation Fund (the Fund) is a fund of Fidelity Advisor Series VIII (the Trust) and is authorized to issue an unlimited number of shares. The Trust is registered under the Investment Company Act of 1940, as amended (the 1940 Act), as an open-end management investment company organized as a Massachusetts business trust. The Fund offers Class A, Class T, Class C and Institutional Class shares, each of which, along with Class B shares, has equal rights as to assets and voting privileges. Effective after the close of business on September 1, 2010, Class B shares were closed to new accounts and additional purchases, except for exchanges and reinvestments by existing shareholders. Each class has exclusive voting rights with respect to matters that affect that class. Class B shares will automatically convert to Class A shares after a holding period of seven years from the initial date of purchase. Investment income, realized and unrealized capital gains and losses, the common expenses of the Fund, and certain fund-level expense reductions, if any, are allocated on a pro-rata basis to each class based on the relative net assets of each class to the total net assets of the Fund. Each class differs with respect to transfer agent and distribution and service plan fees incurred. Certain expense reductions may also differ by class.
2. Investments in Fidelity Central Funds.
The Fund invests in Fidelity Central Funds, which are open-end investment companies available only to other investment companies and accounts managed by Fidelity Management & Research Company (FMR) and its affiliates. The Fund's Schedule of Investments lists each of the Fidelity Central Funds held as of period end, if any, as an investment of the Fund, but does not include the underlying holdings of each Fidelity Central Fund. As an Investing Fund, the Fund indirectly bears its proportionate share of the expenses of the underlying Fidelity Central Funds.
The Money Market Central Funds seek preservation of capital and current income and are managed by Fidelity Investments Money Management, Inc. (FIMM), an affiliate of FMR.
A complete unaudited list of holdings for each Fidelity Central Fund is available upon request or at the Securities and Exchange Commission (the SEC) web site at www.sec.gov. In addition, the financial statements of the Fidelity Central Funds, which are not covered by the Fund's Report of Independent Registered Public Accounting Firm are available on the SEC web site or upon request.
3. Significant Accounting Policies.
The financial statements have been prepared in conformity with accounting principles generally accepted in the United States of America (GAAP), which require management to make certain estimates and assumptions at the date of the financial statements.
Annual Report
Notes to Financial Statements - continued
3. Significant Accounting Policies - continued
Actual results could differ from those estimates. Subsequent events, if any, through the date that the financial statements were issued have been evaluated in the preparation of the financial statements. The following summarizes the significant accounting policies of the Fund:
Security Valuation. Investments are valued as of 4:00 p.m. Eastern time on the last calendar day of the period. The Fund uses independent pricing services approved by the Board of Trustees to value its investments. When current market prices or quotations are not readily available or reliable, valuations may be determined in good faith in accordance with procedures adopted by the Board of Trustees. Factors used in determining value may include market or security specific events. The frequency with which these procedures are used cannot be predicted and they may be utilized to a significant extent. The value used for net asset value (NAV) calculation under these procedures may differ from published prices for the same securities.
The Fund categorizes the inputs to valuation techniques used to value its investments into a disclosure hierarchy consisting of three levels as shown below:
Level 1 - quoted prices in active markets for identical investments
Level 2 - other significant observable inputs (including quoted prices for similar investments, interest rates, prepayment speeds, etc.)
Level 3 - unobservable inputs (including the Fund's own assumptions based on the best information available)
Changes in valuation techniques may result in transfers in or out of an assigned level within the disclosure hierarchy. The aggregate value of investments by input level, as of October 31, 2011, is included at the end of the Fund's Schedule of Investments. Valuation techniques used to value the Fund's investments by major category are as follows:
Equity securities, including restricted securities, for which market quotations are readily available, are valued at the last reported sale price or official closing price as reported by an independent pricing service on the primary market or exchange on which they are traded and are categorized as Level 1 in the hierarchy. In the event there were no sales during the day or closing prices are not available, securities are valued at the last quoted bid price or may be valued using the last available price and are generally categorized as Level 2 in the hierarchy. For foreign equity securities, when significant market or security specific events arise, comparisons to the valuation of American Depositary Receipts (ADRs), futures contracts, Exchange-traded funds (ETFs) and certain indexes as well as quoted prices for similar securities are used and are categorized as Level 2 in the hierarchy in these circumstances. Utilizing these techniques may result in transfers between Level 1 and Level 2. For restricted equity securities and private placements where
Annual Report
3. Significant Accounting Policies - continued
Security Valuation - continued
observable inputs are limited, assumptions about market activity and risk are used and are categorized as Level 3 in the hierarchy.
Investments in open-end mutual funds, including the Fidelity Central Funds, are valued at their closing net asset value each business day and are categorized as Level 1 in the hierarchy.
Foreign Currency. The Fund may use foreign currency contracts to facilitate transactions in foreign-denominated securities. Gains and losses from these transactions may arise from changes in the value of the foreign currency or if the counterparties do not perform under the contracts' terms.
Foreign-denominated assets, including investment securities, and liabilities are translated into U.S. dollars at the exchange rate at period end. Purchases and sales of investment securities, income and dividends received and expenses denominated in foreign currencies are translated into U.S. dollars at the exchange rate in effect on the transaction date.
The effects of exchange rate fluctuations on investments are included with the net realized and unrealized gain (loss) on investment securities. Other foreign currency transactions resulting in realized and unrealized gain (loss) are disclosed separately.
Investment Transactions and Income. For financial reporting purposes, the Fund's investment holdings and NAV include trades executed through the end of the last business day of the period. The NAV per share for processing shareholder transactions is calculated as of the close of business of the New York Stock Exchange (NYSE), normally 4:00 p.m. Eastern time and includes trades executed through the end of the prior business day. Gains and losses on securities sold are determined on the basis of identified cost and may include proceeds received from litigation. Dividend income is recorded on the ex-dividend date, except for certain dividends from foreign securities where the ex-dividend date may have passed, which are recorded as soon as the Fund is informed of the ex-dividend date. Non-cash dividends included in dividend income, if any, are recorded at the fair market value of the securities received. Distributions received on securities that represent a return of capital or capital gain are recorded as a reduction of cost of investments and/or as a realized gain. The Fund estimates the components of distributions received that may be considered return of capital distributions or capital gain distributions. Interest income and distributions from the Fidelity Central Funds are accrued as earned. Interest income includes coupon interest and amortization of premium and accretion of discount on debt securities. Investment income is recorded net of foreign taxes withheld where recovery of such taxes is uncertain.
Annual Report
Notes to Financial Statements - continued
3. Significant Accounting Policies - continued
Expenses. Expenses directly attributable to a fund are charged to that fund. Expenses attributable to more than one fund are allocated among the respective funds on the basis of relative net assets or other appropriate methods. Expense estimates are accrued in the period to which they relate and adjustments are made when actual amounts are known.
Income Tax Information and Distributions to Shareholders. Each year, the Fund intends to qualify as a regulated investment company, including distributing substantially all of its taxable income and realized gains under Subchapter M of the Internal Revenue Code and filing its U.S. federal tax return. As a result, no provision for income taxes is required. As of October 31, 2011, the Fund did not have any unrecognized tax benefits in the financial statements. A fund's federal tax return is subject to examination by the Internal Revenue Service (IRS) for a period of three years. Foreign taxes are provided for based on the Fund's understanding of the tax rules and rates that exist in the foreign markets in which it invests.
Distributions are declared and recorded on the ex-dividend date. Income dividends and capital gain distributions are declared separately for each class. Income and capital gain distributions are determined in accordance with income tax regulations, which may differ from GAAP.
Capital accounts within the financial statements are adjusted for permanent book-tax differences. These adjustments have no impact on net assets or the results of operations. Temporary book-tax differences will reverse in a subsequent period.
Book-tax differences are primarily due to foreign currency transactions, passive foreign investment companies (PFIC), capital loss carryforwards and losses deferred due to wash sales.
The federal tax cost of investment securities and unrealized appreciation (depreciation) as of period end were as follows:
Gross unrealized appreciation | $ 1,281,793 |
Gross unrealized depreciation | (2,438,885) |
Net unrealized appreciation (depreciation) on securities and other investments | $ (1,157,092) |
| |
Tax Cost | $ 19,220,921 |
Annual Report
3. Significant Accounting Policies - continued
Income Tax Information and Distributions to Shareholders - continued
The tax-based components of distributable earnings as of period end were as follows:
Undistributed ordinary income | $ 204,425 |
Capital loss carryforward | $ (17,533,353) |
Net unrealized appreciation (depreciation) | $ (1,157,089) |
Under the recently enacted Regulated Investment Company Modernization Act of 2010 (the Act), the Fund will be permitted to carry forward capital losses incurred in taxable years beginning after December 22, 2010 for an unlimited period. However, any losses incurred during those future taxable years will be required to be utilized prior to any losses incurred in pre-enactment taxable years, which generally expire after eight years from when they are incurred. Additionally, post-enactment capital losses that are carried forward will retain their character as either short-term or long-term capital losses rather than being considered all short-term as under previous law. The Fund's first fiscal year end subject to the Act will be October 31, 2012.
The tax character of distributions paid was as follows:
| October 31, 2011 | October 31, 2010 |
Ordinary Income | $ 69,262 | $ 281,171 |
Short-Term Trading (Redemption) Fees. Shares held by investors in the Fund less than 30 days are subject to a redemption fee equal to 1.00% of the net asset value of shares redeemed. All redemption fees, which reduce the proceeds of the shareholder redemption, are retained by the Fund and accounted for as an addition to paid in capital.
New Accounting Pronouncement. In May 2011, the Financial Accounting Standards Board issued Accounting Standard Update No. 2011-04, Fair Value Measurement (Topic 820) - Amendments to Achieve Common Fair Value Measurement and Disclosure Requirements in U.S. GAAP and IFRSs. The update changes the wording used to describe the requirements in GAAP for measuring fair value and for disclosing information about fair value measurements. The update is effective during interim and annual periods beginning after December 15, 2011. Management is currently evaluating the impact of the update's adoption on the Fund's financial statement disclosures.
Annual Report
Notes to Financial Statements - continued
4. Purchases and Sales of Investments.
Purchases and sales of securities, other than short-term securities, aggregated $25,544,845 and $28,913,333, respectively.
5. Fees and Other Transactions with Affiliates.
Management Fee. FMR and its affiliates provide the Fund with investment management related services for which the Fund pays a monthly management fee. The management fee is the sum of an individual fund fee rate that is based on an annual rate of .45% of the Fund's average net assets and a group fee rate that averaged .26% during the period. The group fee rate is based upon the average net assets of all the mutual funds advised by FMR. The group fee rate decreases as assets under management increase and increases as assets under management decrease. For the period, the total annual management fee rate was .71% of the Fund's average net assets.
Distribution and Service Plan Fees. In accordance with Rule 12b-1 of the 1940 Act, the Fund has adopted separate Distribution and Service Plans for each class of shares. Certain classes pay Fidelity Distributors Corporation (FDC), an affiliate of FMR, separate Distribution and Service Fees, each of which is based on an annual percentage of each class' average net assets. In addition, FDC may pay financial intermediaries for selling shares of the Fund and providing shareholder support services. For the period, the Distribution and Service Fee rates, total fees and amounts retained by FDC were as follows:
| Distribution
Fee | Service
Fee | Total Fees | Retained
by FDC |
Class A | -% | .25% | $ 24,218 | $ 193 |
Class T | .25% | .25% | 35,140 | 87 |
Class B | .75% | .25% | 15,777 | 11,875 |
Class C | .75% | .25% | 30,672 | 2,428 |
| | | $ 105,807 | $ 14,583 |
Sales Load. FDC may receive a front-end sales charge of up to 5.75% for selling Class A shares, and 3.50% for selling Class T shares, some of which is paid to financial intermediaries for selling shares of the Fund. Depending on the holding period, FDC may receive contingent deferred sales charges levied on Class A, Class T, Class B, and Class C redemptions. The deferred sales charges range from 5% to 1% for Class B, 1% for Class C, 1.00% for certain purchases of Class A shares and .25% for certain purchases of Class T shares.
Annual Report
5. Fees and Other Transactions with Affiliates - continued
Sales Load - continued
For the period, sales charge amounts retained by FDC were as follows:
| Retained
by FDC |
Class A | $ 1,948 |
Class T | 1,444 |
Class B* | 3,721 |
Class C* | 324 |
| $ 7,437 |
* When Class B and Class C shares are initially sold, FDC pays commissions from its own resources to financial intermediaries through which the sales are made.
Transfer Agent Fees. Fidelity Investments Institutional Operations Company, Inc. (FIIOC), an affiliate of FMR, is the transfer, dividend disbursing and shareholder servicing agent for each class of the Fund. FIIOC receives account fees and asset-based fees that vary according to the account size and type of account of the shareholders of the respective classes of the Fund. FIIOC pays for typesetting, printing and mailing of shareholder reports, except proxy statements. For the period, transfer agent fees for each class were as follows:
| Amount | % of
Average
Net Assets |
Class A | $ 29,942 | .31 |
Class T | 23,106 | .33 |
Class B | 4,871 | .31 |
Class C | 9,467 | .31 |
Institutional Class | 1,102 | .19 |
| $ 68,488 | |
Accounting and Security Lending Fees. Fidelity Service Company, Inc. (FSC), an affiliate of FMR, maintains the Fund's accounting records. The accounting fee is based on the level of average net assets for the month. Under a separate contract, FSC administers the security lending program. The security lending fee is based on the number and duration of lending transactions.
Brokerage Commissions. The Fund placed a portion of its portfolio transactions with brokerage firms which are affiliates of the investment adviser. The commissions paid to these affiliated firms were $75 for the period.
Annual Report
Notes to Financial Statements - continued
6. Committed Line of Credit.
The Fund participates with other funds managed by FMR or an affiliate in a $4.0 billion credit facility (the "line of credit") to be utilized for temporary or emergency purposes to fund shareholder redemptions or for other short-term liquidity purposes. The Fund has agreed to pay commitment fees on its pro-rata portion of the line of credit, which amounted to $69 and is reflected in Miscellaneous expenses on the Statement of Operations. During the period, there were no borrowings on this line of credit.
7. Security Lending.
The Fund lends portfolio securities through a lending agent from time to time in order to earn additional income. For equity securities, a lending agent is used and may loan securities to certain qualified borrowers, including Fidelity Capital Markets (FCM), a broker-dealer affiliated with the Fund. On the settlement date of the loan, the Fund receives collateral (in the form of U.S. Treasury obligations, letters of credit and/or cash) against the loaned securities and maintains collateral in an amount not less than 100% of the market value of the loaned securities during the period of the loan. The market value of the loaned securities is determined at the close of business of the Fund and any additional required collateral is delivered to the Fund on the next business day. If the borrower defaults on its obligation to return the securities loaned because of insolvency or other reasons, a fund could experience delays and costs in recovering the securities loaned or in gaining access to the collateral. Any cash collateral received is invested in the Fidelity Securities Lending Cash Central Fund. The value of loaned securities and cash collateral at period end are disclosed on the Fund's Statement of Assets and Liabilities. Security lending income represents the income earned on investing cash collateral, less rebates paid to borrowers and any lending agent fees associated with the loan, plus any premium payments received for lending certain types of securities. Security lending income is presented in the Statement of Operations as a component of income from Fidelity Central Funds. Total security lending income during the period amounted to $7,159. During the period, there were no securities loaned to FCM.
8. Expense Reductions.
FMR voluntarily agreed to reimburse each class to the extent annual operating expenses exceeded certain levels of average net assets as noted in the table below. Some expenses, for example interest expense, including commitment fees, are excluded from this reimbursement.
Annual Report
8. Expense Reductions - continued
The following classes were in reimbursement during the period:
| Expense
Limitations | Reimbursement
from adviser |
Class A | 1.45% | $ 52,842 |
Class T | 1.70% | 39,982 |
Class B | 2.20% | 9,136 |
Class C | 2.20% | 16,636 |
Institutional Class | 1.20% | 1,951 |
| | $ 120,547 |
Many of the brokers with whom FMR places trades on behalf of the Fund provided services to the Fund in addition to trade execution. These services included payments of certain expenses on behalf of the Fund totaling $9,652 for the period.
9. Distributions to Shareholders.
Distributions to shareholders of each class were as follows:
Years ended October 31, | 2011 | 2010 |
From net investment income | | |
Class A | $ 48,533 | $ 132,405 |
Class T | 17,367 | 105,744 |
Class B | - | 13,563 |
Class C | - | 22,327 |
Institutional Class | 3,362 | 7,132 |
Total | $ 69,262 | $ 281,171 |
10. Share Transactions.
Transactions for each class of shares were as follows:
| Shares | Dollars |
Years ended October 31, | 2011 | 2010 | 2011 | 2010 |
Class A | | | | |
Shares sold | 113,790 | 127,568 | $ 1,369,180 | $ 1,411,611 |
Reinvestment of distributions | 3,553 | 10,457 | 42,460 | 119,629 |
Shares redeemed | (236,239) | (270,495) | (2,808,784) | (2,873,077) |
Net increase (decrease) | (118,896) | (132,470) | $ (1,397,144) | $ (1,341,837) |
Class T | | | | |
Shares sold | 87,655 | 285,617 | $ 1,039,691 | $ 3,265,728 |
Reinvestment of distributions | 1,416 | 8,986 | 16,885 | 102,440 |
Shares redeemed | (165,637) | (396,557) | (1,980,913) | (4,398,721) |
Net increase (decrease) | (76,566) | (101,954) | $ (924,337) | $ (1,030,553) |
Annual Report
Notes to Financial Statements - continued
10. Share Transactions - continued
| Shares | Dollars |
Years ended October 31, | 2011 | 2010 | 2011 | 2010 |
Class B | | | | |
Shares sold | 1,700 | 16,071 | $ 19,713 | $ 167,235 |
Reinvestment of distributions | - | 1,085 | - | 12,073 |
Shares redeemed | (61,103) | (84,324) | (715,010) | (867,232) |
Net increase (decrease) | (59,403) | (67,168) | $ (695,297) | $ (687,924) |
Class C | | | | |
Shares sold | 39,446 | 36,176 | $ 455,073 | $ 385,078 |
Reinvestment of distributions | - | 1,719 | - | 19,047 |
Shares redeemed | (71,785) | (132,930) | (822,473) | (1,389,265) |
Net increase (decrease) | (32,339) | (95,035) | $ (367,400) | $ (985,140) |
Institutional Class | | | | |
Shares sold | 55,800 | 21,917 | $ 702,293 | $ 240,660 |
Reinvestment of distributions | 124 | 430 | 1,508 | 5,009 |
Shares redeemed | (56,680) | (33,643) | (689,404) | (378,698) |
Net increase (decrease) | (756) | (11,296) | $ 14,397 | $ (133,029) |
11. Other.
The Fund's organizational documents provide former and current trustees and officers with a limited indemnification against liabilities arising in connection with the performance of their duties to the Fund. In the normal course of business, the Fund may also enter into contracts that provide general indemnifications. The Fund's maximum exposure under these arrangements is unknown as this would be dependent on future claims that may be made against the Fund. The risk of material loss from such claims is considered remote.
Annual Report
To the Trustees of Fidelity Advisor Series VIII and Shareholders of Fidelity Advisor Europe Capital Appreciation Fund:
We have audited the accompanying statement of assets and liabilities of Fidelity Advisor Europe Capital Appreciation Fund (the Fund), a fund of Fidelity Advisor Series VIII, including the schedule of investments, as of October 31, 2011, and the related statement of operations for the year then ended, the statement of changes in net assets for each of the two years in the period then ended, and the financial highlights for each of the five years in the period then ended. These financial statements and financial highlights are the responsibility of the Fund's management. Our responsibility is to express an opinion on these financial statements and financial highlights based on our audits.
We conducted our audits in accordance with the standards of the Public Company Accounting Oversight Board (United States). Those standards require that we plan and perform the audit to obtain reasonable assurance about whether the financial statements and financial highlights are free of material misstatement. The Fund is not required to have, nor were we engaged to perform, an audit of its internal control over financial reporting. Our audits included consideration of internal control over financial reporting as a basis for designing audit procedures that are appropriate in the circumstances, but not for the purpose of expressing an opinion on the effectiveness of the Fund's internal control over financial reporting. Accordingly, we express no such opinion. An audit also includes examining, on a test basis, evidence supporting the amounts and disclosures in the financial statements, assessing the accounting principles used and significant estimates made by management, as well as evaluating the overall financial statement presentation. Our procedures included confirmation of securities owned as of October 31, 2011, by correspondence with the custodians and brokers; where replies were not received from brokers, we performed other auditing procedures. We believe that our audits provide a reasonable basis for our opinion.
In our opinion, the financial statements and financial highlights referred to above present fairly, in all material respects, the financial position of Fidelity Advisor Europe Capital Appreciation Fund as of October 31, 2011, the results of its operations for the year then ended, the changes in its net assets for each of the two years in the period then ended, and the financial highlights for each of the five years in the period then ended, in conformity with accounting principles generally accepted in the United States of America.
/s/ Deloitte & Touche LLP
DELOITTE & TOUCHE LLP
Boston, Massachusetts
December 12, 2011
Annual Report
The Trustees, Members of the Advisory Board, and executive officers of the trust and fund, as applicable, are listed below. The Board of Trustees governs the fund and is responsible for protecting the interests of shareholders. The Trustees are experienced executives who meet periodically throughout the year to oversee the fund's activities, review contractual arrangements with companies that provide services to the fund, oversee management of the risks associated with such activities and contractual arrangements, and review the fund's performance. Except for James C. Curvey, each of the Trustees oversees 226 funds advised by FMR or an affiliate. Mr. Curvey oversees 429 funds advised by FMR or an affiliate.
The Trustees hold office without limit in time except that (a) any Trustee may resign; (b) any Trustee may be removed by written instrument, signed by at least two-thirds of the number of Trustees prior to such removal; (c) any Trustee who requests to be retired or who has become incapacitated by illness or injury may be retired by written instrument signed by a majority of the other Trustees; and (d) any Trustee may be removed at any special meeting of shareholders by a two-thirds vote of the outstanding voting securities of the trust. Each Trustee who is not an interested person (as defined in the 1940 Act) (Independent Trustee), shall retire not later than the last day of the calendar year in which his or her 75th birthday occurs. The Independent Trustees may waive this mandatory retirement age policy with respect to individual Trustees. The executive officers and Advisory Board Members hold office without limit in time, except that any officer and Advisory Board Member may resign or may be removed by a vote of a majority of the Trustees at any regular meeting or any special meeting of the Trustees. Except as indicated, each individual has held the office shown or other offices in the same company for the past five years.
Experience, Skills, Attributes, and Qualifications of the Fund's Trustees. The Governance and Nominating Committee has adopted a statement of policy that describes the experience, qualifications, attributes, and skills that are necessary and desirable for potential Independent Trustee candidates (Statement of Policy). The Board believes that each Trustee satisfied at the time he or she was initially elected or appointed a Trustee, and continues to satisfy, the standards contemplated by the Statement of Policy. The Governance and Nominating Committee also engages professional search firms to help identify potential Independent Trustee candidates who have the experience, qualifications, attributes, and skills consistent with the Statement of Policy. From time to time, additional criteria based on the composition and skills of the current Independent Trustees, as well as experience or skills that may be appropriate in light of future changes to board composition, business conditions, and regulatory or other developments, have also been considered by the professional search firms and the Governance and Nominating Committee. In addition, the Board takes into account the Trustees' commitment and participation in Board and committee meetings, as well as their leadership of standing and ad hoc committees throughout their tenure.
In determining that a particular Trustee was and continues to be qualified to serve as a Trustee, the Board has considered a variety of criteria, none of which, in isolation, was controlling. The Board believes that, collectively, the Trustees have balanced and diverse experience, qualifications, attributes, and skills, which allow the Board to operate effectively in governing the fund and protecting the interests of shareholders. Information about the specific experience, skills, attributes, and qualifications of each Trustee, which in each case led to the Board's conclusion that the Trustee should serve (or continue to serve) as a trustee of the fund, is provided below.
Annual Report
Board Structure and Oversight Function. James C. Curvey is an interested person (as defined in the 1940 Act) and currently serves as Acting Chairman. The Trustees have determined that an interested Chairman is appropriate and benefits shareholders because an interested Chairman has a personal and professional stake in the quality and continuity of services provided to the fund. Independent Trustees exercise their informed business judgment to appoint an individual of their choosing to serve as Chairman, regardless of whether the Trustee happens to be independent or a member of management. The Independent Trustees have determined that they can act independently and effectively without having an Independent Trustee serve as Chairman and that a key structural component for assuring that they are in a position to do so is for the Independent Trustees to constitute a substantial majority for the Board. The Independent Trustees also regularly meet in executive session. Ned C. Lautenbach serves as Chairman of the Independent Trustees and as such (i) acts as a liaison between the Independent Trustees and management with respect to matters important to the Independent Trustees and (ii) with management prepares agendas for Board meetings.
Fidelity funds are overseen by different Boards of Trustees. The fund's Board oversees Fidelity's equity and high income funds and another Board oversees Fidelity's investment-grade bond, money market, and asset allocation funds. The asset allocation funds may invest in Fidelity funds overseen by the fund's Board. The use of separate Boards, each with its own committee structure, allows the Trustees of each group of Fidelity funds to focus on the unique issues of the funds they oversee, including common research, investment, and operational issues. On occasion, the separate Boards establish joint committees to address issues of overlapping consequences for the Fidelity funds overseen by each Board.
The Trustees operate using a system of committees to facilitate the timely and efficient consideration of all matters of importance to the Trustees, the fund, and fund shareholders and to facilitate compliance with legal and regulatory requirements and oversight of the fund's activities and associated risks. The Board, acting through its committees, has charged FMR and its affiliates with (i) identifying events or circumstances the occurrence of which could have demonstrably adverse effects on the fund's business and/or reputation; (ii) implementing processes and controls to lessen the possibility that such events or circumstances occur or to mitigate the effects of such events or circumstances if they do occur; and (iii) creating and maintaining a system designed to evaluate continuously business and market conditions in order to facilitate the identification and implementation processes described in (i) and (ii) above. Because the day-to-day operations and activities of the fund are carried out by or through FMR, its affiliates and other service providers, the fund's exposure to risks is mitigated but not eliminated by the processes overseen by the Trustees. While each of the Board's committees has responsibility for overseeing different aspects of the fund's activities, oversight is exercised primarily through the Operations, Audit, and Compliance Committees. In addition, the Independent Trustees have worked with FMR to enhance the Board's oversight of investment and financial risks, legal and regulatory risks, technology risks, and operational risks, including the development of additional risk reporting to the Board. For example, a working group comprised of Independent Trustees and FMR has worked and continues to work to review the Fidelity funds' valuation-related activities, reporting and risk management. Appropriate personnel, including but not limited to the fund's Chief Compliance Officer (CCO), FMR's internal auditor, the independent accountants, the fund's Treasurer and portfolio management personnel, make periodic reports to the Board's committees, as appropriate, including an annual review of FMR's risk management program for the Fidelity funds. The responsibilities of each standing committee, including their oversight responsibilities, are described further under "Standing Committees of the Fund's Trustees."
Annual Report
Trustees and Officers - continued
The fund's Statement of Additional Information (SAI) includes more information about the Trustees. To request a free copy, call Fidelity at 1-877-208-0098.
Interested Trustees*:
Correspondence intended for each Trustee who is an interested person may be sent to Fidelity Investments, 82 Devonshire Street, Boston, Massachusetts 02109.
Name, Age; Principal Occupations and Other Relevant Experience+ |
James C. Curvey (76) |
| Year of Election or Appointment: 2007 Mr. Curvey is Trustee and Acting Chairman of the Board of Trustees of certain Trusts. Mr. Curvey also serves as Trustee (2007-present) of other investment companies advised by FMR. Mr. Curvey is a Director of Fidelity Investments Money Management, Inc. (2009-present), Director of Fidelity Research & Analysis Co. (2009-present) and Director of FMR and FMR Co., Inc. (2007-present). Mr. Curvey is also Vice Chairman (2007-present) and Director of FMR LLC. In addition, Mr. Curvey serves as an Overseer for the Boston Symphony Orchestra and a member of the Trustees of Villanova University. Previously, Mr. Curvey was the Vice Chairman (2006-2007) and Director (2000-2007) of FMR Corp. |
Ronald P. O'Hanley (54) |
| Year of Election or Appointment: 2011 Mr. O'Hanley is Director of FMR Co., Inc. (2010-present), Director of Fidelity Investments Money Management, Inc. (2010-present), Director of Fidelity Research & Analysis Company (2010-present), President of Fidelity Asset Management and Corporate Services and a member of Fidelity's Executive Committee (2010-present). Previously, Mr. O'Hanley served as President and Chief Executive Officer of BNY Mellon Asset Management (2007-2010). Mr. O'Hanley also served as Vice Chairman of Bank New York Mellon Corp. and a member of that firm's Executive Committee. Prior to the 2007 merger of The Bank of New York and Mellon Financial Corporation, he was Vice Chairman of Mellon Financial Corporation and President and Chief Executive Officer of Mellon Asset Management. He joined Mellon in February 1997. Mr. O'Hanley currently serves as Chairman of the Boston Public Library Foundation Board of Directors and sits on the Board of Directors of Beth Israel Deaconess Medical Center, the Board of Trustees of the Marine Biological Laboratory and the Advisory Board of the Maxwell School of Citizenship and Public Administration at Syracuse University. Mr. O'Hanley also chairs the Council on Asset Management for the Financial Services Roundtable and is a member of the Board of Directors of Institutional Investor's U.S. Institute. |
* Trustees have been determined to be "Interested Trustees" by virtue of, among other things, their affiliation with the trust or various entities under common control with FMR.
+ The information above includes each Trustee's principal occupation during the last five years and other information relating to the experience, attributes, and skills relevant to each Trustee's qualifications to serve as a Trustee, which led to the conclusion that each Trustee should serve as a Trustee for the fund.
Annual Report
Trustees and Officers - continued
Independent Trustees:
Correspondence intended for each Independent Trustee (that is, the Trustees other than the Interested Trustees) may be sent to Fidelity Investments, P.O. Box 55235, Boston, Massachusetts 02205-5235.
Name, Age; Principal Occupations and Other Relevant Experience+ |
Dennis J. Dirks (63) |
| Year of Election or Appointment: 2005 Prior to his retirement in May 2003, Mr. Dirks was Chief Operating Officer and a member of the Board of The Depository Trust & Clearing Corporation (DTCC). He also served as President, Chief Operating Officer, and Board member of The Depository Trust Company (DTC) and President and Board member of the National Securities Clearing Corporation (NSCC). In addition, Mr. Dirks served as Chief Executive Officer and Board member of the Government Securities Clearing Corporation, Chief Executive Officer and Board member of the Mortgage-Backed Securities Clearing Corporation, as a Trustee and a member of the Finance Committee of Manhattan College (2005-2008), and as a Trustee and a member of the Finance Committee of AHRC of Nassau County (2006-2008). Mr. Dirks is a member of the Independent Directors Council (IDC) Governing Council (2010-Present) and Board of Directors for The Brookville Center for Children's Services, Inc. (2009-present). |
Alan J. Lacy (58) |
| Year of Election or Appointment: 2008 Mr. Lacy serves as Senior Adviser (2007-present) of Oak Hill Capital Partners, L.P. (private equity). Mr. Lacy also served as Chief Executive Officer (2000-2005) and Vice Chairman (2005-2006) of Sears Holdings Corporation and Sears, Roebuck and Co. (retail). In addition, Mr. Lacy serves as a member of the Board of Directors of Dave & Buster's, Inc. (restaurant and entertainment complexes, 2010-present), The Hillman Companies, Inc. (hardware wholesalers, 2010-present), and Bristol-Myers Squibb Company (global pharmaceuticals, 2007-present). Mr. Lacy is a member of the Board of Trustees of The National Parks Conservation Association (2006-Present). Previously, Mr. Lacy served as Chairman of the Board of Trustees of the National Parks Conservation Association (2008-2011) and as a member of the Board of Directors for the Western Union Company (global money transfer, 2006-2011). |
Ned C. Lautenbach (67) |
| Year of Election or Appointment: 2000 Mr. Lautenbach is Chairman of the Independent Trustees of the Equity and High Income Funds (2006-present). Mr. Lautenbach currently serves as the Lead Director of the Eaton Corporation Board of Directors (diversified industrial, 1997-present). Mr. Lautenbach is also a member of the Board of Directors of the Philharmonic Center for the Arts in Naples, Florida (1999-present); a member of the Board of Trustees of Fairfield University (2005-present); and a member of the Council on Foreign Relations (1994-present). Previously, Mr. Lautenbach was a Partner/Advisory Partner at Clayton, Dubilier & Rice, LLC (private equity investment, 1998-2010), as well as a Director of Sony Corporation (2006-2007). |
Joseph Mauriello (67) |
| Year of Election or Appointment: 2008 Prior to his retirement in January 2006, Mr. Mauriello served in numerous senior management positions including Deputy Chairman and Chief Operating Officer (2004-2005), and Vice Chairman of Financial Services (2002-2004) of KPMG LLP US (professional services, 1965-2005). Mr. Mauriello currently serves as a member of the Board of Directors of XL Group plc. (global insurance and re-insurance, 2006-present) and of Arcadia Resources Inc. (health care services and products, 2007-present). Previously, Mr. Mauriello served as a Director of the Hamilton Funds of the Bank of New York (2006-2007). |
Robert W. Selander (61) |
| Year of Election or Appointment: 2011 Previously, Mr. Selander served as a Member of the Advisory Board of Fidelity's Equity and High Income Funds (2011), Executive Vice Chairman (2010), Chief Executive Officer (2009-2010), and President and Chief Executive Officer (1997-2009) of Mastercard, Inc. |
Cornelia M. Small (67) |
| Year of Election or Appointment: 2005 Ms. Small is a member of the Board of Directors of the Teagle Foundation (2009-present). Ms. Small is also a member of the Investment Committee, and Chair (2008-present) and a member of the Board of Trustees of Smith College. In addition, Ms. Small serves on the Investment Committee of the Berkshire Taconic Community Foundation (2008-present). Previously, Ms. Small served as Chairperson of the Investment Committee (2002-2008) of Smith College. In addition, Ms. Small served as Chief Investment Officer, Director of Global Equity Investments, and a member of the Board of Directors of Scudder, Stevens & Clark and Scudder Kemper Investments. |
William S. Stavropoulos (72) |
| Year of Election or Appointment: 2001 Mr. Stavropoulos is Vice Chairman of the Independent Trustees of the Equity and High Income Funds (2006-present). Mr. Stavropoulos serves as President and Founder of the Michigan Baseball Foundation, the Great Lakes Loons (2007-present). Mr. Stavropoulos is Chairman Emeritus of the Board of Directors of The Dow Chemical Company, where he previously served in numerous senior management positions, including President, CEO (1995-2000; 2002-2004), Chairman of the Executive Committee (2000-2006), and as a member of the Board of Directors (1990-2006). Currently, Mr. Stavropoulos is Chairman of Univar (global distributor of commodity and specialty chemicals, 2010-present), a Director of Teradata Corporation (data warehousing and technology solutions, 2008-present), Chemical Financial Corporation, Maersk Inc. (industrial conglomerate), Tyco International, Inc. (multinational manufacturing and services, 2007-present), and a member of the Advisory Board for Metalmark Capital (private equity investment, 2005-present). Mr. Stavropoulos is a special advisor to Clayton, Dubilier & Rice, LLC (private equity investment). In addition, Mr. Stavropoulos is a member of the University of Notre Dame Advisory Council for the College of Science. |
David M. Thomas (62) |
| Year of Election or Appointment: 2008 Previously, Mr. Thomas served as Executive Chairman (2005-2006) and Chairman and Chief Executive Officer (2000-2005) of IMS Health, Inc. (pharmaceutical and healthcare information solutions). In addition, Mr. Thomas serves as a member of the Board of Directors of Fortune Brands, Inc. (consumer products), and Interpublic Group of Companies, Inc. (marketing communication, 2004-present). |
Michael E. Wiley (61) |
| Year of Election or Appointment: 2008 Mr. Wiley also serves as a Director of Asia Pacific Exploration Consolidated (international oil and gas exploration and production, 2008-present). Mr. Wiley serves as a Director of Tesoro Corporation (independent oil refiner and marketer, 2005-present), and a Director of Bill Barrett Corporation (exploration and production, 2005-present). In addition, Mr. Wiley also serves as a Director of Post Oak Bank (privately-held bank, 2004-present). Previously, Mr. Wiley served as a member of the Board of Trustees of the University of Tulsa (2000-2006; 2007-2010), as a Senior Energy Advisor of Katzenbach Partners, LLC (consulting, 2006-2007), as an Advisory Director of Riverstone Holdings (private investment), Chairman, President, and CEO of Baker Hughes, Inc. (oilfield services, 2000-2004), and as Director of Spinnaker Exploration Company (exploration and production, 2001-2005). |
Annual Report
+ The information above includes each Trustee's principal occupation during the last five years and other information relating to the experience, attributes, and skills relevant to each Trustee's qualifications to serve as a Trustee, which led to the conclusion that each Trustee should serve as a Trustee for the fund.
Advisory Board Members and Executive Officers:
Correspondence intended for each executive officer, Edward C. Johnson 3d, and Peter S. Lynch may be sent to Fidelity Investments, 82 Devonshire Street, Boston, Massachusetts 02109.
Name, Age; Principal Occupation |
Edward C. Johnson 3d (81) |
| Year of Election or Appointment: 2011 Member of the Advisory Board of Fidelity's Equity and High Income Funds. Mr. Johnson serves as Chief Executive Officer, Chairman, and a Director of FMR LLC, and also serves as Chairman and Director of FIL Limited. Previously, Mr. Johnson served as a Trustee and Chairman of the Board of certain Fidelity Trusts, Chairman and a Director of FMR, Chairman and a Director of FMR Co., Inc., and President of FMR LLC (2006-2007). |
Peter S. Lynch (67) |
| Year of Election or Appointment: 2003 Member of the Advisory Board of Fidelity's Equity and High Income Funds. Mr. Lynch is Vice Chairman and a Director of FMR and FMR Co., Inc. In addition, Mr. Lynch serves as a Trustee of Boston College and as the Chairman of the Inner-City Scholarship Fund. Previously, Mr. Lynch served on the Special Olympics International Board of Directors (1997-2006). |
Kenneth B. Robins (42) |
| Year of Election or Appointment: 2008 President and Treasurer of Fidelity's Equity and High Income Funds. Mr. Robins also serves as President and Treasurer (2010-present) and Assistant Treasurer (2009-present) of other Fidelity funds and is an employee of Fidelity Investments (2004-present). Previously, Mr. Robins served as Deputy Treasurer of the Fidelity funds (2005-2008) and Treasurer and Chief Financial Officer of The North Carolina Capital Management Trust: Cash and Term Portfolios (2006-2008). |
Bruce T. Herring (46) |
| Year of Election or Appointment: 2006 Vice President of certain Equity Funds. Mr. Herring also serves as Chief Investment Officer and Director of Fidelity Management & Research (U.K.) Inc. (2010-present) and Group Chief Investments Officer of FMR. Previously, Mr. Herring served as Vice President (2005-2006) and Senior Vice President (2006-2007) of Fidelity Management & Research Company, Vice President of FMR Co., Inc. (2001-2007) and as a portfolio manager for Fidelity U.S. Equity Funds. |
Brian B. Hogan (47) |
| Year of Election or Appointment: 2009 Vice President of Equity and High Income Funds. Mr. Hogan also serves as President of FMR's Equity Division (2009-present). Previously, Mr. Hogan served as Senior Vice President, Equity Research of FMR (2006-2009) and as a portfolio manager. |
Scott C. Goebel (43) |
| Year of Election or Appointment: 2008 Secretary and Chief Legal Officer (CLO) of the Fidelity funds. Mr. Goebel also serves as Secretary of Fidelity Investments Money Management, Inc. (FIMM) (2010-present) and Fidelity Research and Analysis Company (FRAC) (2010-present); Secretary and CLO of The North Carolina Capital Management Trust: Cash and Term Portfolios (2008-present); General Counsel, Secretary, and Senior Vice President of FMR (2008-present) and FMR Co., Inc. (2008-present); employed by FMR LLC or an affiliate (2001-present); Chief Legal Officer of Fidelity Management & Research (Hong Kong) Limited (2008-present) and Assistant Secretary of Fidelity Management & Research (Japan) Inc. (2008-present), and Fidelity Management & Research (U.K.) Inc. (2008-present). Previously, Mr. Goebel served as Assistant Secretary of FIMM (2008-2010), FRAC (2008-2010), and the Funds (2007-2008) and as Vice President and Secretary of Fidelity Distributors Corporation (FDC) (2005-2007). |
William C. Coffey (42) |
| Year of Election or Appointment: 2009 Assistant Secretary of Fidelity's Equity and High Income Funds. Mr. Coffey also serves as Senior Vice President and Deputy General Counsel of FMR LLC (2010-present), and is an employee of Fidelity Investments. Previously, Mr. Coffey served as Vice President and Associate General Counsel of FMR LLC (2005-2009). |
Holly C. Laurent (57) |
| Year of Election or Appointment: 2008 Anti-Money Laundering (AML) Officer of the Fidelity funds. Ms. Laurent also serves as AML Officer of The North Carolina Capital Management Trust: Cash and Term Portfolios (2008-present) and is an employee of Fidelity Investments. Previously, Ms. Laurent was Senior Vice President and Head of Legal for Fidelity Business Services India Pvt. Ltd. (2006-2008), and Senior Vice President, Deputy General Counsel and Group Head for FMR LLC (2005-2006). |
Christine Reynolds (53) |
| Year of Election or Appointment: 2008 Chief Financial Officer of the Fidelity funds. Ms. Reynolds became President of Fidelity Pricing and Cash Management Services (FPCMS) in August 2008. Ms. Reynolds served as Chief Operating Officer of FPCMS (2007-2008). Previously, Ms. Reynolds served as President, Treasurer, and Anti-Money Laundering officer of the Fidelity funds (2004-2007). |
Kenneth A. Rathgeber (64) |
| Year of Election or Appointment: 2004 Chief Compliance Officer of Fidelity's Equity and High Income Funds. Mr. Rathgeber is Chief Compliance Officer of Fidelity Management & Research (Hong Kong) Limited (2008-present), Fidelity Management & Research (Japan) Inc. (2008-present), FMR (2005-present), FMR Co., Inc. (2005-present), Fidelity Management & Research (U.K.) Inc. (2005-present), Fidelity Research & Analysis Company (2005-present), Fidelity Investments Money Management, Inc. (2005-present), Pyramis Global Advisors, LLC (2005-present), and Strategic Advisers, Inc. (2005-present). |
Jeffrey S. Christian (50) |
| Year of Election or Appointment: 2009 Deputy Treasurer of the Fidelity funds. Mr. Christian is an employee of Fidelity Investments. Previously, Mr. Christian served as Chief Financial Officer (2008-2009) of certain Fidelity funds and Senior Vice President of Fidelity Pricing and Cash Management Services (FPCMS) (2004-2009). |
Joseph F. Zambello (54) |
| Year of Election or Appointment: 2011 Deputy Treasurer of the Fidelity funds. Mr. Zambello is an employee of Fidelity Investments. Previously, Mr. Zambello served as Vice President of FMR's Program Management Group (2009-2011) and Vice President of the Transfer Agent Oversight Group (2005-2009). |
Adrien E. Deberghes (44) |
| Year of Election or Appointment: 2008 Deputy Treasurer of Fidelity's Equity and High Income Funds. Mr. Deberghes also serves as Vice President and Assistant Treasurer of Fidelity Rutland Square Trust II and Fidelity Commonwealth Trust II (2011-present), Assistant Treasurer of other Fidelity funds (2010-present), and is an employee of Fidelity Investments (2008-present). Previously, Mr. Deberghes served as Senior Vice President of Mutual Fund Administration at State Street Corporation (2007-2008), Senior Director of Mutual Fund Administration at Investors Bank & Trust (2005-2007), and Director of Finance for Dunkin' Brands (2000-2005). |
Stephanie J. Dorsey (42) |
| Year of Election or Appointment: 2010 Assistant Treasurer of Fidelity's Equity and High Income Funds. Ms. Dorsey also serves as Deputy Treasurer of other Fidelity funds (2008-present) and is an employee of Fidelity Investments (2008-present). Previously, Ms. Dorsey served as Treasurer (2004-2008) of the JPMorgan Mutual Funds and Vice President (2004-2008) of JPMorgan Chase Bank. |
John R. Hebble (53) |
| Year of Election or Appointment: 2009 Assistant Treasurer of Fidelity's Equity and High Income Funds. Mr. Hebble also serves as President (2011-present), Treasurer, and Chief Financial Officer of The North Carolina Capital Management Trust: Cash and Term Portfolios (2008-present), President and Treasurer of other Fidelity funds (2008-present) and is an employee of Fidelity Investments. |
Gary W. Ryan (53) |
| Year of Election or Appointment: 2005 Assistant Treasurer of the Fidelity funds. Mr. Ryan is an employee of Fidelity Investments. Previously, Mr. Ryan served as Vice President of Fund Reporting in Fidelity Pricing and Cash Management Services (FPCMS) (1999-2005). |
Jonathan Davis (43) |
| Year of Election or Appointment: 2010 Assistant Treasurer of the Fidelity funds. Mr. Davis is also Assistant Treasurer of Fidelity Rutland Square Trust II and Fidelity Commonwealth Trust II. Mr. Davis is an employee of Fidelity Investments. Previously, Mr. Davis served as Vice President and Associate General Counsel of FMR LLC (2003-2010). |
Annual Report
Class A and Class T designates 100% of each, dividends distributed during the fiscal year as amounts which may be taken into account as a dividend for purposes of the maximum rate under section 1(h)(11) of the Internal Revenue Code.
The amounts per share which represent income derived from sources within, and taxes paid to, foreign countries or possessions of the United States are as follows:
| Pay Date | Income | Taxes |
Class A | 12/06/10 | $0.088 | $0.0308 |
Class T | 12/06/10 | $0.058 | $0.0308 |
Class B | 12/06/10 | $0.000 | $0.0000 |
Class C | 12/06/10 | $0.000 | $0.0000 |
The fund will notify shareholders in January 2012 of amounts for use in preparing 2011 income tax returns.
Annual Report
Board Approval of Investment Advisory Contracts and Management Fees
Fidelity Advisor Europe Capital Appreciation Fund
Each year, the Board of Trustees, including the Independent Trustees (together, the Board), votes on the renewal of the management contract and sub-advisory agreements (together, the Advisory Contracts) for the fund. The Board, assisted by the advice of fund counsel and Independent Trustees' counsel, requests and considers a broad range of information relevant to the renewal of the Advisory Contracts throughout the year.
The Board meets regularly and considers at each of its meetings factors that are relevant to its annual consideration of the renewal of the fund's Advisory Contracts, including the services and support provided to the fund and its shareholders. The Board has established various standing committees, each composed of Independent Trustees with varying backgrounds, to which the Board has assigned specific subject matter responsibilities in order to enhance effective decision-making by the Board. The Board, acting directly and through its Committees, requests and receives information concerning the annual consideration of the renewal of the fund's Advisory Contracts. The Board also meets as needed to consider matters specifically related to the Board's annual consideration of the renewal of Advisory Contracts. Members of the Board may also meet with trustees of other Fidelity funds through ad hoc joint committees to discuss certain matters relevant to the Fidelity funds.
At its July 2011 meeting, the Board of Trustees, including the Independent Trustees, unanimously determined to renew the fund's Advisory Contracts. In reaching its determination, the Board considered all factors it believed relevant, including (i) the nature, extent, and quality of the services to be provided to the fund and its shareholders (including the investment performance of the fund); (ii) the competitiveness of the fund's management fee and total expense ratio; (iii) the total costs of the services to be provided by and the profits to be realized by Fidelity from its relationship with the fund; (iv) the extent to which economies of scale would be realized as the fund grows; and (v) whether fee levels reflect these economies of scale, if any, for the benefit of fund shareholders.
In considering whether to renew the Advisory Contracts for the fund, the Board reached a determination, with the assistance of fund counsel and Independent Trustees' counsel and through the exercise of its business judgment, that the renewal of the Advisory Contracts is in the best interests of the fund and its shareholders and that the compensation payable under the Advisory Contracts is fair and reasonable. The Board's decision to renew the Advisory Contracts was not based on any single factor, but rather was based on a comprehensive consideration of all the information provided to the Board at its meetings throughout the year. The Board, in reaching its determination to renew the Advisory Contracts, is aware that shareholders in the fund have a broad range of investment choices available to them, including a wide choice among mutual funds offered by Fidelity's competitors, and that the fund's shareholders, who have the opportunity to review and weigh the disclosure provided by the fund in its prospectus and other public disclosures, have chosen to invest in this fund, managed by Fidelity.
Annual Report
Nature, Extent, and Quality of Services Provided. The Board considered the staffing within the investment adviser, FMR, and the sub-advisers (together, the Investment Advisers), including the backgrounds of the fund's investment personnel and the fund's investment objective and discipline. The Independent Trustees also had discussions with senior management of Fidelity's investment operations and investment groups. The Board considered the structure of the portfolio manager compensation program and whether this structure provides appropriate incentives to act in the best interests of the fund.
Resources Dedicated to Investment Management and Support Services. The Board and the Fund Oversight and Research Committees reviewed the general qualifications and capabilities of the Investment Advisers' investment staff, including its size, education, experience, and resources, as well as the Investment Advisers' approach to recruiting, training, managing, and compensating investment personnel. The Board also noted that FMR has devoted increased resources to non-U.S. offices. The Board noted that Fidelity's analysts have extensive resources, tools and capabilities which allow them to conduct sophisticated quantitative and fundamental analysis, as well as credit analysis of issuers, counterparties and enhancers. The Board also believes that Fidelity's investment professionals have sufficient access to global information and data so as to provide competitive investment results over time, and that those professionals also have access to sophisticated tools which permit them to assess portfolio construction and risk and performance attribution characteristics continuously, as well as to transmit new information and research conclusions rapidly around the world. Additionally, in their deliberations, the Board considered the Investment Advisers' trading capabilities and resources which are an integral part of the investment management process.
Shareholder and Administrative Services. The Board considered (i) the nature, extent, quality, and cost of advisory, administrative, and shareholder services performed by the Investment Advisers and their affiliates under the Advisory Contracts and under separate agreements covering transfer agency, pricing and bookkeeping, and securities lending services for the fund; (ii) the nature and extent of the investment adviser's supervision of third party service providers, principally custodians and subcustodians; and (iii) the resources devoted to, and the record of compliance with, the fund's compliance policies and procedures. The Board also reviewed the allocation of fund brokerage, including allocations to brokers affiliated with the Investment Advisers, the use of brokerage commissions to pay fund expenses, and the use of "soft" commission dollars to pay for research services.
The Board noted that the growth of fund assets over time across the complex allows Fidelity to reinvest in the development of services designed to enhance the value or convenience of the Fidelity funds as investment vehicles. These services include 24-hour access to account information and market information through telephone representatives and over the Internet, investor education materials and asset allocation tools, and the expanded availability of Fidelity Investor Centers, with 35 new branches opening since 2010.
Annual Report
Board Approval of Investment Advisory Contracts and
Management Fees - continued
Investment in a Large Fund Family. The Board considered the benefits to shareholders of investing in a Fidelity fund, including the benefits of investing in a fund that is part of a large family of funds offering a variety of investment disciplines and providing a large variety of mutual fund investor services. The Board noted that Fidelity had taken, or had made recommendations that resulted in the Fidelity funds taking, a number of actions over the previous year that benefited particular funds, including (i) continuing to dedicate additional resources to investment research and support of the senior management team that oversees asset management; (ii) rationalizing product lines through the mergers of six funds into other funds; (iii) continuing to migrate the Freedom Funds to dedicated lower cost underlying funds; (iv) obtaining shareholder approval to broaden the investment strategies for Fidelity Consumer Finance Portfolio, Fidelity Emerging Asia Fund, and Fidelity Environment and Alternative Energy Portfolio; (v) contractually agreeing to reduce the management fees and impose other expense limitations on Spartan 500 Index Fund and U.S. Bond Index Fund in connection with launching new institutional classes of these funds; (vi) changing the name, primary and supplemental benchmarks, and investment policies of Fidelity Global Strategies Fund to support the fund's flexible investment mandate and global orientation; and (vii) reducing the transfer agency account fee rates on certain accounts.
Investment Performance. The Board considered whether the fund has operated in accordance with its investment objective, as well as its record of compliance with its investment restrictions. It also reviewed the fund's absolute investment performance for each class, as well as the fund's relative investment performance for each class measured over multiple periods against (i) a broad-based securities market index, and (ii) a peer group of mutual funds deemed appropriate by Fidelity and reviewed by the Board. The following charts considered by the Board show, over the one-, three-, and five-year periods ended December 31, 2010, the cumulative total returns of Institutional Class (Class I) and Class C of the fund, the cumulative total returns of a broad-based securities market index ("benchmark"), and a range of cumulative total returns of a peer group of mutual funds identified by Morningstar, Inc. as having an investment style similar to that of the fund based on underlying portfolio holdings. The returns of Institutional Class (Class I) and Class C show the performance of the highest and lowest performing classes, respectively (based on five-year performance). The box within each chart shows the 25th percentile return (bottom of box) and the 75th percentile return (top of box) of the peer group. Returns shown above the box are in the first quartile and returns shown below the box are in the fourth quartile. The percentage beaten numbers noted below each chart correspond to the percentile box and represent the percentage of funds in the peer group whose performance was equal to or lower than that of the class indicated.
Annual Report
Advisor Europe Capital Appreciation Fund

The Board reviewed the fund's relative investment performance against its peer group and noted that the performance of Institutional Class (Class I) of the fund was in the third quartile for all the periods shown. The Board also noted that the investment performance of the fund was lower than its benchmark for the three- and five-year periods, although the one-year total return of Institutional Class (Class I) compared favorably to its benchmark. The Board considered that the variations in performance among the fund's classes reflect the variations in class expenses, which result in lower performance for higher expense classes. The Board discussed with FMR actions that have been taken by FMR to improve the fund's disappointing performance relative to its peer group. The Board also reviewed the fund's performance since inception as well as performance in the current year. The Board will continue to closely monitor the performance of the fund in the coming year and discuss with FMR other appropriate actions to address the performance of the fund.
Based on its review, the Board concluded that the nature, extent, and quality of services provided to the fund under the Advisory Contracts should benefit the fund's shareholders.
Competitiveness of Management Fee and Total Expense Ratio. The Board considered the fund's management fee and total expense ratio compared to "mapped groups" of competitive funds and classes. Fidelity creates "mapped groups" by combining similar Lipper investment objective categories that have comparable management fee characteristics. Combining Lipper investment objective categories aids the Board's management fee and total expense ratio comparisons by broadening the competitive group used for comparison and by reducing the number of universes to which various Fidelity funds are compared.
Annual Report
Board Approval of Investment Advisory Contracts and
Management Fees - continued
Management Fee. The Board considered two proprietary management fee comparisons for the 12-month periods shown in the chart below. The group of Lipper funds used by the Board for management fee comparisons is referred to below as the "Total Mapped Group." The Total Mapped Group comparison focuses on a fund's standing relative to the total universe of comparable funds available to investors in terms of gross management fees before expense reimbursements or caps. "TMG %" represents the percentage of funds in the Total Mapped Group that had management fees that were lower than the fund's. For example, a TMG % of 16% means that 84% of the funds in the Total Mapped Group had higher management fees than the fund. The "Asset-Size Peer Group" (ASPG) comparison focuses on a fund's standing relative to non-Fidelity funds similar in size to the fund within the Total Mapped Group. The ASPG represents at least 15% of the funds in the Total Mapped Group with comparable asset size and management fee characteristics, subject to a minimum of 50 funds (or all funds in the Total Mapped Group if fewer than 50). Additional information, such as the ASPG quartile in which the fund's management fee ranked, is also included in the chart and considered by the Board.
Advisor Europe Capital Appreciation Fund
The Board noted that the fund's management fee ranked below the median of its Total Mapped Group and below the median of its ASPG for 2010.
Annual Report
Based on its review, the Board concluded that the fund's management fee is fair and reasonable in light of the services that the fund receives and the other factors considered.
Total Expense Ratio. In its review of each class's total expense ratio, the Board considered the fund's management fee as well as other fund or class expenses, as applicable, such as transfer agent fees, pricing and bookkeeping fees, fund-paid 12b-1 fees, and custodial, legal, and audit fees. The Board also noted the effects of any waivers and reimbursements on fees and expenses. As part of its review, the Board also considered the current and historical total expense ratios of each class of the fund compared to competitive fund median expenses. Each class of the fund is compared to those funds and classes in the Total Mapped Group (used by the Board for management fee comparisons) that have a similar sales load structure.
The Board noted that the total expense ratio of each of Class A and Class B ranked below its competitive median for 2010, the total expense ratio of Class C ranked equal to its competitive median for 2010, and the total expense ratio of each of Class T and Institutional Class ranked above its competitive median for 2010. The Board considered that various factors, including 12b-1 fees, positive or negative performance adjustments, and relatively higher other expenses in the case of small fund size, can affect total expense ratios. The Board noted that the total expense ratio of Class T was above the competitive median primarily because of higher 12b-1 fees on Class T. Class T has a higher 12b-1 fee, but a lower front-end sales charge, than traditionally priced front-end sales charge classes. The Board noted that the fund offers multiple classes, each of which has a different sales load and 12b-1 fee structure, and that the multiple structures are intended to offer a range of pricing options for the intermediary market. The Board also noted that the total expense ratios of the classes vary primarily by the level of their 12b-1 fees, although differences in transfer agent fees may also cause expenses to vary from class to class.
Fees Charged to Other Fidelity Clients. The Board also considered Fidelity fee structures and other information with respect to clients of FMR and its affiliates, such as other mutual funds advised or subadvised by FMR or its affiliates, pension plan clients, and other institutional clients. In March 2010, the Board created an ad hoc joint committee with the board of other Fidelity funds (the Committee) to review and compare Fidelity's institutional investment advisory business with its business of providing services to the Fidelity funds, including the differences in services provided, fees charged, and costs incurred, as well as competition in their respective marketplaces.
Based on its review of total expense ratios and fees charged to other Fidelity clients, the Board concluded that the total expense ratio of each class of the fund was reasonable, although in some cases above the median of the universe presented for comparison, in light of the services that the fund and its shareholders receive and the other factors considered, including the findings of the Committee.
Annual Report
Board Approval of Investment Advisory Contracts and
Management Fees - continued
Costs of the Services and Profitability. The Board considered the revenues earned and the expenses incurred by Fidelity in conducting the business of developing, marketing, distributing, managing, administering and servicing the fund and its shareholders. The Board also considered the level of Fidelity's profits in respect of all the Fidelity funds.
On an annual basis, FMR presents to the Board Fidelity's profitability for the fund. Fidelity calculates the profitability for each fund, as well as aggregate profitability for groups of Fidelity funds and all Fidelity funds, using a series of detailed revenue and cost allocation methodologies which originate with the books and records of Fidelity on which Fidelity's audited financial statements are based. The Audit Committee of the Board reviews any significant changes from the prior year's methodologies.
PricewaterhouseCoopers LLP (PwC), independent registered public accounting firm and auditor to Fidelity and certain Fidelity funds, has been engaged annually by the Board as part of the Board's assessment of Fidelity's profitability analysis. PwC's engagement includes the review and assessment of Fidelity's methodologies used in determining the revenues and expenses attributable to Fidelity's mutual fund business, and completion of agreed-upon procedures surrounding the mathematical accuracy of fund profitability and its conformity to allocation methodologies. After considering PwC's reports issued under the engagement and information provided by Fidelity, the Board concluded that while other allocation methods may also be reasonable, Fidelity's profitability methodologies are reasonable in all material respects.
The Board also reviewed Fidelity's non-fund businesses and fall-out benefits related to the mutual fund business as well as cases where Fidelity's affiliates may benefit from or be related to the fund's business.
The Board considered the costs of the services provided by and the profits realized by Fidelity in connection with the operation of the fund and was satisfied that the profitability was not excessive in the circumstances.
Economies of Scale. The Board considered whether there have been economies of scale in respect of the management of the Fidelity funds, whether the Fidelity funds (including the fund) have appropriately benefited from any such economies of scale, and whether there is potential for realization of any further economies of scale. The Board considered the extent to which the fund will benefit from economies of scale through increased services to the fund, through waivers or reimbursements, or through fee or expense reductions. The Board also noted that in 2009, it and the board of other Fidelity funds created an ad hoc committee (the Economies of Scale Committee) to analyze whether FMR attains economies of scale in respect of the management and servicing of the Fidelity funds, whether the Fidelity funds have appropriately benefited from such economies of scale, and whether there is potential for realization of any further economies of scale.
Annual Report
The Board recognized that the fund's management contract incorporates a "group fee" structure, which provides for lower group fee rates as total fund assets under FMR's management increase, and for higher group fee rates as total fund assets under FMR's management decrease. FMR calculates the group fee rates based on a tiered asset "breakpoint" schedule that varies based on asset class. The Board considered that the group fee is designed to deliver the benefits of economies of scale to fund shareholders when total Fidelity fund assets increase, even if assets of any particular fund are unchanged or have declined, because some portion of Fidelity's costs are attributable to services provided to all Fidelity funds, and all funds benefit if those costs can be allocated among more assets. The Board concluded that, given the group fee structure, fund shareholders will benefit from lower management fees as assets under FMR's management increase at the fund complex level, regardless of whether Fidelity achieves any such economies of scale.
The Board concluded, taking into account the analysis of the Economies of Scale Committee, that any potential economies of scale are being appropriately shared between fund shareholders and Fidelity.
Additional Information Requested by the Board. In order to develop fully the factual basis for consideration of the Fidelity funds' Advisory Contracts, the Board requested and received additional information on certain topics, including (i) fund performance trends, actions to be taken by FMR to improve certain funds' overall performance, and Fidelity's long-term strategies for certain funds; (ii) portfolio manager changes that have occurred during the past year and length of portfolio manager tenure for different categories of funds over time; (iii) Fidelity's compensation structure for portfolio managers and other key personnel and strategies for attracting and retaining non-investment personnel; (iv) the amount of the investment that each portfolio manager has made in the Fidelity fund(s) that he or she manages; (v) historical trends in Fidelity's realization of fall-out benefits; (vi) Fidelity's group fee structures and the rationale for the individual fee rates of certain funds; (vii) fund profitability methodology and the impact of certain factors on fund profitability results; (viii) trends regarding industry use of performance fee structures and Fidelity's compliance practices with respect to performance adjustment calculations; (ix) the fee structures in place for certain other Fidelity clients; and (x) explanations regarding the relative total expense ratios of certain funds and classes, total expense competitive trends, and actions that might be taken by FMR to reduce total expense ratios for certain funds and classes.
Annual Report
Board Approval of Investment Advisory Contracts and
Management Fees - continued
Based on its evaluation of all of the conclusions noted above, and after considering all factors it believed relevant, the Board ultimately concluded that the advisory fee structures are fair and reasonable, and that the fund's Advisory Contracts should be renewed.
Annual Report
Investment Adviser
Fidelity Management & Research Company
Boston, MA
Investment Sub-Advisers
FMR Co., Inc.
Fidelity Management & Research
(U.K.) Inc.
FIL Investment Advisors
FIL Investment Advisors (U.K.) Limited
Fidelity Management & Research
(Hong Kong) Limited
Fidelity Management & Research
(Japan) Inc.
General Distributor
Fidelity Distributors Corporation
Boston, MA
Transfer and Service Agents
Fidelity Investments Institutional Operations Company, Inc.
Boston, MA
Fidelity Service Company, Inc.
Boston, MA
Custodian
State Street Bank and Trust Company
Quincy, MA
AEUR-UANN-1211
1.784739.108
(Fidelity Investment logo)(registered trademark)
Fidelity Advisor®
Europe Capital Appreciation
Fund - Institutional Class
Annual Report
October 31, 2011
Contents
Chairman's Message | (Click Here) | The Chairman's message to shareholders. |
Performance | (Click Here) | How the fund has done over time. |
Management's Discussion of Fund Performance | (Click Here) | The Portfolio Manager's review of fund performance and strategy. |
Shareholder Expense Example | (Click Here) | An example of shareholder expenses. |
Investment Changes | (Click Here) | A summary of major shifts in the fund's investments over the past six months. |
Investments | (Click Here) | A complete list of the fund's investments with their market values. |
Financial Statements | (Click Here) | Statements of assets and liabilities, operations, and changes in net assets, as well as financial highlights. |
Notes | (Click Here) | Notes to financial statements. |
Report of Independent Registered Public Accounting Firm | (Click Here) | |
Trustees and Officers | (Click Here) | |
Distributions | (Click Here) | |
Board Approval of Investment Advisory Contracts and Management Fees | (Click Here) | |
To view a fund's proxy voting guidelines and proxy voting record for the 12-month period ended June 30, visit http://www.fidelity.com/proxyvotingresults or visit the Securities and Exchange Commission's (SEC) web site at http://www.sec.gov. You may also call 1-877-208-0098 to request a free copy of the proxy voting guidelines.
Standard & Poor's, S&P and S&P 500 are registered service marks of The McGraw-Hill Companies, Inc. and have been licensed for use by Fidelity Distributors Corporation.
Other third party marks appearing herein are the property of their respective owners.
All other marks appearing herein are registered or unregistered trademarks or service marks of FMR LLC or an affiliated company.
Annual Report
This report and the financial statements contained herein are submitted for the general information of the shareholders of the fund. This report is not authorized for distribution to prospective investors in the fund unless preceded or accompanied by an effective prospectus.
A fund files its complete schedule of portfolio holdings with the SEC for the first and third quarters of each fiscal year on Form N-Q. Forms N-Q are available on the SEC's web site at http://www.sec.gov. A fund's Forms N-Q may be reviewed and copied at the SEC's Public Reference Room in Washington, DC. Information regarding the operation of the SEC's Public Reference Room may be obtained by calling 1-800-SEC-0330. For a complete list of a fund's portfolio holdings, view the most recent holdings listing, semiannual report, or annual report on Fidelity's web site at http://www.fidelity.com, http://www.advisor.fidelity.com, or http://www.401k.com, as applicable.
NOT FDIC INSURED • MAY LOSE VALUE • NO BANK GUARANTEE
Neither the fund nor Fidelity Distributors Corporation is a bank.
Annual Report
(photo_of_James_C_Curvey)
Dear Shareholder:
Global equity markets began the fourth quarter on a strong note, sharply reversing course in October amid strong corporate earnings, better-than-expected economic news and the promise of a resolution to the sovereign debt crisis in Europe. The mini rally followed a third quarter marked by a significant downturn in July and August, which heightened investor anxiety and set off a wave of volatility that hampered most major asset classes through the end of September. Financial markets are difficult to predict, of course, but you can help put the odds in your favor by following these time-tested investment principles.
One of the basic tenets is to invest according to your time horizon. For long-term investors, riding out the markets' inevitable ups and downs has proven much more effective than making decisions based on short-term developments. If your goal is approaching, you can also benefit from patience and restraint, rather than attempting to time the market. No matter your time horizon, missing only a few of the markets' best days can significantly diminish returns. Patience also affords the benefits of compounding - earning interest on additional income or reinvested dividends and capital gains. While staying the course doesn't eliminate risk, it can considerably lessen the negative impact of short-term downturns.
Asset allocation is another principle to manage risk. As you spread your portfolio among the asset classes, be sure to consider your time horizon, risk tolerance and investment objectives. Younger investors may be better served by emphasizing equities, which historically have been the best-performing asset class over time. Investors who are nearing a specific goal, such as retirement or sending a child to college, may choose to favor bonds and other investments that have tended to be more stable. Studies indicate that asset allocation is the single most important determinant of a portfolio's long-term success. After deciding on a suitable allocation strategy, make sure your portfolio is adequately diversified, with exposure to stocks of small-, mid- and large-cap companies in a range of sectors, for example. And today, more than ever, geographic diversification should be taken into account.
Lastly, investing a certain amount of money on a regular basis - a principle known as dollar-cost averaging - can help lower the average cost of your purchases, while also giving you the discipline to avoid selling weak performers just prior to an upswing, or chasing a hot performer just before a correction.
We invite you to learn more by visiting us on the Internet, dropping by one of our Investor Centers or calling us by phone. It is our privilege to provide the resources you need to choose investments that are right for you.
Sincerely,
(The acting chairman's signature appears here.)
James C. Curvey
Acting Chairman
Annual Report
Average annual total return reflects the change in the value of an investment, assuming reinvestment of the class' distributions from dividend income and capital gains (the profits earned upon the sale of securities that have grown in value, if any) and assuming a constant rate of performance each year. The $10,000 table and the fund's returns do not reflect the deduction of taxes that a shareholder would pay on fund distributions or the redemption of fund shares. During periods of reimbursement by Fidelity, a fund's total return will be greater than it would be had the reimbursement not occurred. How a fund did yesterday is no guarantee of how it will do tomorrow.
Average Annual Total Returns
Periods ended October 31, 2011 | Past 1
year | Past 5
years | Past 10
years |
Institutional Class | -8.95% | -3.87% | 5.32% |
$10,000 Over 10 Years
Let's say hypothetically that $10,000 was invested in Fidelity Advisor® Europe Capital Appreciation Fund - Institutional Class on October 31, 2001. The chart shows how the value of your investment would have changed, and also shows how the MSCI® Europe Index performed over the same period.
Annual Report
Market Recap: International equities were rocked by a number of headline events during the year ending October 31, 2011. Stocks posted a solid advance for the first half of the period, despite concern about the sovereign debt crisis in Europe, a devastating earthquake and tsunami in Japan, and political upheaval in the Middle East and North Africa. Sentiment turned decidedly negative in the second half, however, as fresh worries about Europe, inflation in China and a dimmed outlook for global growth caused foreign markets to suffer declines that intensified in August and September. October brought with it yet another dramatic swing, as eurozone policymakers appeared near a resolution to the debt debacle and buyers stormed back onto the scene in search of bargains. Still, those gains - along with favorable currency fluctuations overall - weren't enough to offset prior losses, and the MSCI® ACWI® (All Country World Index) ex USA Index finished the period down 4.56%. Within the MSCI index, Europe and emerging markets suffered the biggest declines, with many countries in these areas sustaining steep losses. By contrast, Japan showed resilience in the wake of its natural disasters, falling only 2%. Australia (+4%), Switzerland (+3%), the U.K. (+2%) and Canada, which produced a nominal return, were among the few major benchmark components to break into positive territory.
Comments from Melissa Reilly, Portfolio Manager of Fidelity Advisor® Europe Capital Appreciation Fund: For the year, the fund's Institutional Class shares declined 8.95%, while the MSCI® Europe Index fell 5.01%. Stock selection in financials, especially banks; positioning in the pharmaceuticals/biotechnology/life science group of health care; picks in energy and tech; a modest stake in cash and positioning in the food/beverage/tobacco area of consumer staples all hurt. Individual detractors included: Spain's Mediaset Espana Comunicacion, French banks Societe Generale and BNP Paribas, and British bank Lloyds Banking Group. Underweighting the U.K.'s GlaxoSmithKline and not owning Roche Holding, two pharmaceutical companies in the index, also hurt, as did an underweighting in Germany-based chemicals company and index component BASF. Picks across Europe hurt, led by the U.K. Aiding the fund were positioning in industrials; stock selection in automobiles/components; positioning in utilities; and picks in telecommunication services. The following positions were beneficial: German car manufacturer Volkswagen, U.K. software developer Autonomy; an out-of-index holding in Russian fertilizer company Uralkali, and an out-of-index position in Mead Johnson Nutrition, a U.S.-based manufacturer of infant formula. Holdings in Germany and the Bailiwick of Jersey also helped. Some of the holdings mentioned in this report were sold by period end.
Annual Report
The views expressed above reflect those of the portfolio manager(s) only through the end of the period as stated on the cover of this report and do not necessarily represent the views of Fidelity or any other person in the Fidelity organization. Any such views are subject to change at any time based upon market or other conditions and Fidelity disclaims any responsibility to update such views. These views may not be relied on as investment advice and, because investment decisions for a Fidelity fund are based on numerous factors, may not be relied on as an indication of trading intent on behalf of any Fidelity fund.
Annual Report
Shareholder Expense Example
As a shareholder of the Fund, you incur two types of costs: (1) transaction costs, including sales charges (loads) on purchase payments or redemption proceeds, redemption fees, and (2) ongoing costs, including management fees, distribution and/or service (12b-1) fees and other Fund expenses. This Example is intended to help you understand your ongoing costs (in dollars) of investing in the Fund and to compare these costs with the ongoing costs of investing in other mutual funds.
The Example is based on an investment of $1,000 invested at the beginning of the period and held for the entire period (May 1, 2011 to October 31, 2011).
Actual Expenses
The first line of the accompanying table for each class of the Fund provides information about actual account values and actual expenses. You may use the information in this line, together with the amount you invested, to estimate the expenses that you paid over the period. Simply divide your account value by $1,000.00 (for example, an $8,600 account value divided by $1,000.00 = 8.6), then multiply the result by the number in the first line for a class of the Fund under the heading entitled "Expenses Paid During Period" to estimate the expenses you paid on your account during this period. In addition, the Fund, as a shareholder in the underlying Fidelity Central Funds, will indirectly bear its pro-rata share of the fees and expenses incurred by the underlying Fidelity Central Funds. These fees and expenses are not included in the Fund's annualized expense ratio used to calculate the expense estimate in the table below.
Hypothetical Example for Comparison Purposes
The second line of the accompanying table for each class of the Fund provides information about hypothetical account values and hypothetical expenses based on a Class' actual expense ratio and an assumed rate of return of 5% per year before expenses, which is not the Class' actual return. The hypothetical account values and expenses may not be used to estimate the actual ending account balance or expenses you paid for the period. You may use this information to compare the ongoing costs of investing in the Fund and other funds. To do so, compare this 5% hypothetical example with the 5% hypothetical examples that appear in the shareholder reports of the other funds. In addition, the Fund, as a shareholder in the underlying Fidelity Central Funds, will indirectly bear its pro-rata share of the fees and expenses incurred by the underlying Fidelity Central Funds. These fees and expenses are not included in the Fund's annualized expense ratio used to calculate the expense estimate in the table below.
Please note that the expenses shown in the table are meant to highlight your ongoing costs only and do not reflect any transaction costs. Therefore, the second line of the table is useful in comparing ongoing costs only, and will not help you determine the relative total costs of owning different funds. In addition, if these transactional costs were included, your costs would have been higher.
Annual Report
Shareholder Expense Example - continued
| Annualized
Expense Ratio | Beginning
Account Value
May 1, 2011 | Ending
Account Value
October 31, 2011 | Expenses Paid
During Period*
May 1, 2011 to
October 31, 2011 |
Class A | 1.45% | | | |
Actual | | $ 1,000.00 | $ 787.10 | $ 6.53 |
HypotheticalA | | $ 1,000.00 | $ 1,017.90 | $ 7.38 |
Class T | 1.70% | | | |
Actual | | $ 1,000.00 | $ 786.30 | $ 7.65 |
HypotheticalA | | $ 1,000.00 | $ 1,016.64 | $ 8.64 |
Class B | 2.20% | | | |
Actual | | $ 1,000.00 | $ 783.90 | $ 9.89 |
HypotheticalA | | $ 1,000.00 | $ 1,014.12 | $ 11.17 |
Class C | 2.20% | | | |
Actual | | $ 1,000.00 | $ 784.30 | $ 9.89 |
HypotheticalA | | $ 1,000.00 | $ 1,014.12 | $ 11.17 |
Institutional Class | 1.20% | | | |
Actual | | $ 1,000.00 | $ 788.20 | $ 5.41 |
HypotheticalA | | $ 1,000.00 | $ 1,019.16 | $ 6.11 |
A 5% return per year before expenses
* Expenses are equal to each Class' annualized expense ratio, multiplied by the average account value over the period, multiplied by 184/365 (to reflect the one-half year period).
Annual Report
Investment Changes (Unaudited)
Top Five Stocks as of October 31, 2011 |
| % of fund's
net assets | % of fund's net assets
6 months ago |
Royal Dutch Shell PLC Class A (United Kingdom) (United Kingdom, Oil, Gas & Consumable Fuels) | 5.0 | 3.5 |
Nestle SA (Switzerland, Food Products) | 3.8 | 0.0 |
Sanofi-aventis (France, Pharmaceuticals) | 3.1 | 0.0 |
Vodafone Group PLC (United Kingdom, Wireless Telecommunication Services) | 2.9 | 2.3 |
BG Group PLC (United Kingdom, Oil, Gas & Consumable Fuels) | 2.3 | 1.9 |
| 17.1 | |
Top Five Market Sectors as of October 31, 2011 |
| % of fund's
net assets | % of fund's net assets
6 months ago |
Financials | 22.4 | 19.9 |
Consumer Discretionary | 16.6 | 20.0 |
Energy | 11.8 | 12.7 |
Health Care | 10.3 | 4.4 |
Consumer Staples | 10.2 | 6.3 |
Top Five Countries as of October 31, 2011 |
(excluding cash equivalents) | % of fund's
net assets | % of fund's net assets
6 months ago |
United Kingdom | 33.4 | 29.2 |
France | 16.9 | 15.2 |
Germany | 10.0 | 10.0 |
Switzerland | 8.7 | 5.0 |
Italy | 4.9 | 4.6 |
Percentages are adjusted for the effect of open futures contracts, if applicable. |
Asset Allocation (% of fund's net assets) |
As of October 31, 2011 | As of April 30, 2011 |
| Stocks 98.5% | | | Stocks 99.9% | |
| Short-Term
Investments and
Net Other Assets 1.5% | | | Short-Term
Investments and
Net Other Assets 0.1% | |

Annual Report
Investments October 31, 2011
Showing Percentage of Net Assets
Common Stocks - 96.0% |
| Shares | | Value |
Australia - 0.4% |
Fortescue Metals Group Ltd. | 13,182 | | $ 66,217 |
Bailiwick of Guernsey - 0.5% |
Resolution Ltd. | 18,400 | | 81,375 |
Bailiwick of Jersey - 2.9% |
Experian PLC | 13,600 | | 177,269 |
Randgold Resources Ltd. sponsored ADR | 1,100 | | 120,527 |
Shire PLC | 6,890 | | 216,287 |
TOTAL BAILIWICK OF JERSEY | | 514,083 |
Belgium - 0.0% |
Anheuser-Busch InBev SA NV (strip VVPR) (a) | 6,080 | | 8 |
Bermuda - 0.3% |
Lazard Ltd. Class A | 2,100 | | 57,414 |
British Virgin Islands - 0.6% |
Mail.ru Group Ltd. GDR (Reg. S) | 3,100 | | 106,795 |
China - 0.6% |
Baidu.com, Inc. sponsored ADR (a) | 800 | | 112,144 |
Denmark - 1.5% |
Danske Bank A/S (a) | 7,560 | | 104,751 |
Novo Nordisk A/S Series B | 1,637 | | 173,822 |
TOTAL DENMARK | | 278,573 |
France - 16.9% |
Alstom SA | 4,175 | | 156,578 |
Arkema SA | 1,800 | | 123,144 |
Atos Origin SA | 2,454 | | 118,931 |
BNP Paribas SA | 5,469 | | 248,627 |
Christian Dior SA | 600 | | 84,944 |
Compagnie Generale de Geophysique SA (a) | 3,500 | | 76,484 |
Danone | 4,100 | | 285,402 |
Edenred | 4,200 | | 119,154 |
GDF Suez | 3,200 | | 90,850 |
Iliad SA | 1,257 | | 147,132 |
JC Decaux SA (a) | 4,700 | | 125,956 |
LVMH Moet Hennessy - Louis Vuitton | 1,201 | | 199,863 |
PPR SA | 1,600 | | 249,988 |
Publicis Groupe SA | 3,100 | | 150,303 |
Safran SA | 4,100 | | 134,303 |
Common Stocks - continued |
| Shares | | Value |
France - continued |
Sanofi-aventis | 7,830 | | $ 560,232 |
Unibail-Rodamco | 800 | | 159,979 |
TOTAL FRANCE | | 3,031,870 |
Germany - 7.5% |
Allianz AG | 1,894 | | 212,860 |
BASF AG | 2,588 | | 190,502 |
Bayer AG | 3,100 | | 198,610 |
Deutsche Bank AG | 2,500 | | 103,386 |
E.ON AG | 3,270 | | 79,239 |
Fresenius Medical Care AG & Co. KGaA | 1,800 | | 131,141 |
HeidelbergCement AG | 2,100 | | 95,846 |
Kabel Deutschland Holding AG (a) | 1,800 | | 102,779 |
SAP AG | 3,934 | | 237,915 |
TOTAL GERMANY | | 1,352,278 |
Ireland - 0.3% |
Elan Corp. PLC (a) | 4,600 | | 54,560 |
Italy - 4.9% |
Amplifon SpA | 10,600 | | 50,991 |
ENI SpA | 11,500 | | 254,232 |
Fiat Industrial SpA (a) | 15,400 | | 134,373 |
Intesa Sanpaolo SpA | 88,059 | | 157,328 |
Prada SpA | 36,300 | | 179,447 |
Prysmian SpA | 6,500 | | 98,499 |
TOTAL ITALY | | 874,870 |
Netherlands - 3.2% |
AEGON NV (a) | 31,100 | | 148,336 |
ING Groep NV (Certificaten Van Aandelen) (a) | 27,600 | | 237,973 |
Koninklijke Philips Electronics NV | 5,400 | | 112,426 |
Yandex NV | 2,600 | | 71,552 |
TOTAL NETHERLANDS | | 570,287 |
Norway - 1.8% |
Aker Solutions ASA | 9,100 | | 105,831 |
Storebrand ASA (A Shares) | 35,000 | | 215,811 |
TOTAL NORWAY | | 321,642 |
Poland - 0.3% |
Eurocash SA | 7,700 | | 61,738 |
Common Stocks - continued |
| Shares | | Value |
Spain - 4.5% |
Banco Bilbao Vizcaya Argentaria SA | 29,292 | | $ 263,664 |
Banco Santander SA: | | | |
rights 10/31/11 | 24,586 | | 4,253 |
(Spain) | 16,511 | | 139,767 |
Grifols SA (a) | 4,700 | | 87,711 |
Inditex SA | 2,621 | | 238,525 |
Mediaset Espana Comunicacion (d) | 10,985 | | 72,970 |
TOTAL SPAIN | | 806,890 |
Sweden - 2.9% |
H&M Hennes & Mauritz AB (B Shares) | 5,348 | | 177,103 |
Swedbank AB (A Shares) | 11,105 | | 156,452 |
Telefonaktiebolaget LM Ericsson (B Shares) | 18,703 | | 194,888 |
TOTAL SWEDEN | | 528,443 |
Switzerland - 8.7% |
Adecco SA (Reg.) | 2,464 | | 119,080 |
Bank Sarasin & Co. Ltd. Series B (Reg.) | 2,190 | | 83,602 |
Compagnie Financiere Richemont SA Series A | 3,537 | | 202,535 |
Nestle SA | 11,909 | | 690,751 |
Schindler Holding AG (participation certificate) | 1,323 | | 155,585 |
Transocean Ltd. (United States) | 1,900 | | 108,585 |
UBS AG (a) | 16,324 | | 206,365 |
TOTAL SWITZERLAND | | 1,566,503 |
United Kingdom - 33.4% |
Aegis Group PLC | 55,818 | | 123,160 |
Aviva PLC | 22,400 | | 122,227 |
Barclays PLC | 87,019 | | 269,804 |
BG Group PLC | 19,273 | | 420,445 |
BHP Billiton PLC | 7,346 | | 231,365 |
British American Tobacco PLC (United Kingdom) | 7,500 | | 343,942 |
British Land Co. PLC | 20,996 | | 172,374 |
Carphone Warehouse Group PLC | 69,750 | | 393,724 |
Filtrona PLC | 17,000 | | 108,565 |
GlaxoSmithKline PLC | 15,900 | | 356,900 |
HSBC Holdings PLC sponsored ADR | 7,662 | | 334,523 |
Invensys PLC | 14,400 | | 52,221 |
Lloyds Banking Group PLC (a) | 317,200 | | 164,062 |
Meggitt PLC | 21,900 | | 135,455 |
Micro Focus International PLC | 15,400 | | 84,106 |
Misys PLC | 13,802 | | 64,769 |
Next PLC | 3,700 | | 152,091 |
Common Stocks - continued |
| Shares | | Value |
United Kingdom - continued |
Rolls-Royce Group PLC | 9,600 | | $ 108,457 |
Rolls-Royce Group PLC Class C | 662,400 | | 1,065 |
Royal Dutch Shell PLC Class A (United Kingdom) | 25,217 | | 893,466 |
Standard Chartered PLC (United Kingdom) | 10,037 | | 235,505 |
Tullow Oil PLC | 5,200 | | 117,328 |
Unilever PLC | 9,600 | | 321,854 |
Vodafone Group PLC | 188,600 | | 523,781 |
Xstrata PLC | 15,200 | | 255,569 |
TOTAL UNITED KINGDOM | | 5,986,758 |
United States of America - 4.8% |
Apple, Inc. (a) | 225 | | 91,076 |
Beam, Inc. | 1,100 | | 54,373 |
Dunkin' Brands Group, Inc. (a) | 100 | | 2,911 |
Fluor Corp. | 1,300 | | 73,905 |
Halliburton Co. | 2,100 | | 78,456 |
Mead Johnson Nutrition Co. Class A | 1,200 | | 86,220 |
Morgan Stanley | 6,400 | | 112,896 |
Noble Energy, Inc. | 1,000 | | 89,340 |
Perrigo Co. | 400 | | 36,112 |
salesforce.com, Inc. (a) | 500 | | 66,585 |
The Mosaic Co. | 1,500 | | 87,840 |
Virgin Media, Inc. | 3,300 | | 80,454 |
TOTAL UNITED STATES OF AMERICA | | 860,168 |
TOTAL COMMON STOCKS (Cost $18,281,851) | 17,232,616 |
Nonconvertible Preferred Stocks - 2.5% |
| | | |
Germany - 2.5% |
ProSiebenSat.1 Media AG | 10,000 | | 214,505 |
Volkswagen AG | 1,300 | | 228,122 |
TOTAL NONCONVERTIBLE PREFERRED STOCKS (Cost $373,633) | 442,627 |
Money Market Funds - 2.2% |
| Shares | | Value |
Fidelity Cash Central Fund, 0.12% (b) | 268,586 | | $ 268,586 |
Fidelity Securities Lending Cash Central Fund, 0.11% (b)(c) | 120,000 | | 120,000 |
TOTAL MONEY MARKET FUNDS (Cost $388,586) | 388,586 |
TOTAL INVESTMENT PORTFOLIO - 100.7% (Cost $19,044,070) | | 18,063,829 |
NET OTHER ASSETS (LIABILITIES) - (0.7)% | | (118,327) |
NET ASSETS - 100% | $ 17,945,502 |
Legend |
(a) Non-income producing |
(b) Affiliated fund that is available only to investment companies and other accounts managed by Fidelity Investments. The rate quoted is the annualized seven-day yield of the fund at period end. A complete unaudited listing of the fund's holdings as of its most recent quarter end is available upon request. In addition, each Fidelity Central Fund's financial statements, which are not covered by the Fund's Report of Independent Registered Public Accounting Firm, are available on the SEC's website or upon request. |
(c) Investment made with cash collateral received from securities on loan. |
(d) Security or a portion of the security is on loan at period end. |
Affiliated Central Funds |
Information regarding fiscal year to date income earned by the Fund from investments in Fidelity Central Funds is as follows: |
Fund | Income earned |
Fidelity Cash Central Fund | $ 596 |
Fidelity Securities Lending Cash Central Fund | 7,159 |
Total | $ 7,755 |
Other Information |
The following is a summary of the inputs used, as of October 31, 2011, involving the Fund's assets and liabilities carried at fair value. The inputs or methodology used for valuing securities may not be an indication of the risk associated with investing in those securities. For more information on valuation inputs, and their aggregation into the levels used in the table below, please refer to the Security Valuation section in the accompanying Notes to Financial Statements. |
Valuation Inputs at Reporting Date: |
Description | Total | Level 1 | Level 2 | Level 3 |
Investments in Securities: | | | | |
Equities: | | | | |
United Kingdom | $ 5,986,758 | $ 2,759,357 | $ 3,227,401 | $ - |
France | 3,031,870 | 2,395,154 | 636,716 | - |
Germany | 1,794,905 | 1,322,463 | 472,442 | - |
Switzerland | 1,566,503 | 1,360,138 | 206,365 | - |
Italy | 874,870 | 441,191 | 433,679 | - |
United States of America | 860,168 | 860,168 | - | - |
Spain | 806,890 | 403,459 | 403,431 | - |
Netherlands | 570,287 | 71,552 | 498,735 | - |
Sweden | 528,443 | 333,555 | 194,888 | - |
Other | 1,654,549 | 1,143,663 | 510,886 | - |
Money Market Funds | 388,586 | 388,586 | - | - |
Total Investments in Securities: | $ 18,063,829 | $ 11,479,286 | $ 6,584,543 | $ - |
Income Tax Information |
At October 31, 2011, the Fund had a capital loss carryforward of approximately $17,533,353 of which $9,488,728 and $8,044,625 will expire in fiscal 2016 and 2017, respectively. Capital loss carryforwards are only available to offset future capital gains of the Fund to the extent provided by regulations and may be limited. |
See accompanying notes which are an integral part of the financial statements.
Annual Report
Statement of Assets and Liabilities
| October 31, 2011 |
Assets | | |
Investment in securities, at value (including securities loaned of $107,120) - See accompanying schedule: Unaffiliated issuers (cost $18,655,484) | $ 17,675,243 | |
Fidelity Central Funds (cost $388,586) | 388,586 | |
Total Investments (cost $19,044,070) | | $ 18,063,829 |
Foreign currency held at value (cost $817) | | 817 |
Receivable for investments sold | | 300,599 |
Receivable for fund shares sold | | 19,302 |
Dividends receivable | | 27,802 |
Distributions receivable from Fidelity Central Funds | | 107 |
Prepaid expenses | | 73 |
Receivable from investment adviser for expense reductions | | 4,018 |
Other receivables | | 3,450 |
Total assets | | 18,419,997 |
| | |
Liabilities | | |
Payable for investments purchased | $ 239,325 | |
Payable for fund shares redeemed | 53,225 | |
Accrued management fee | 10,148 | |
Distribution and service plan fees payable | 6,867 | |
Other affiliated payables | 4,958 | |
Other payables and accrued expenses | 39,972 | |
Collateral on securities loaned, at value | 120,000 | |
Total liabilities | | 474,495 |
| | |
Net Assets | | $ 17,945,502 |
Net Assets consist of: | | |
Paid in capital | | $ 36,431,519 |
Undistributed net investment income | | 204,426 |
Accumulated undistributed net realized gain (loss) on investments and foreign currency transactions | | (17,710,205) |
Net unrealized appreciation (depreciation) on investments and assets and liabilities in foreign currencies | | (980,238) |
Net Assets | | $ 17,945,502 |
See accompanying notes which are an integral part of the financial statements.
Annual Report
Statement of Assets and Liabilities - continued
| October 31, 2011 |
Calculation of Maximum Offering Price Class A:
Net Asset Value and redemption price per share ($8,024,582 ÷ 756,396 shares) | | $ 10.61 |
| | |
Maximum offering price per share (100/94.25 of $10.61) | | $ 11.26 |
Class T:
Net Asset Value and redemption price per share ($5,964,841 ÷ 565,054 shares) | | $ 10.56 |
| | |
Maximum offering price per share (100/96.50 of $10.56) | | $ 10.94 |
Class B:
Net Asset Value and offering price per share ($1,136,377 ÷ 111,093 shares)A | | $ 10.23 |
| | |
Class C:
Net Asset Value and offering price per share ($2,524,192 ÷ 247,984 shares)A | | $ 10.18 |
| | |
Institutional Class:
Net Asset Value, offering price and redemption price per share ($295,510 ÷ 27,292 shares) | | $ 10.83 |
A Redemption price per share is equal to net asset value less any applicable contingent deferred sales charge.
See accompanying notes which are an integral part of the financial statements.
Annual Report
Financial Statements - continued
Statement of Operations
| Year ended October 31, 2011 |
Investment Income | | |
Dividends | | $ 625,108 |
Interest | | 2 |
Income from Fidelity Central Funds | | 7,755 |
Income before foreign taxes withheld | | 632,865 |
Less foreign taxes withheld | | (65,854) |
Total income | | 567,011 |
| | |
Expenses | | |
Management fee | $ 155,084 | |
Transfer agent fees | 68,488 | |
Distribution and service plan fees | 105,807 | |
Accounting and security lending fees | 11,461 | |
Custodian fees and expenses | 38,245 | |
Independent trustees' compensation | 123 | |
Registration fees | 59,689 | |
Audit | 49,935 | |
Legal | 175 | |
Miscellaneous | 222 | |
Total expenses before reductions | 489,229 | |
Expense reductions | (130,199) | 359,030 |
Net investment income (loss) | | 207,981 |
Realized and Unrealized Gain (Loss) Net realized gain (loss) on: | | |
Investment securities: | | |
Unaffiliated issuers | 1,828,147 | |
Foreign currency transactions | (148) | |
Total net realized gain (loss) | | 1,827,999 |
Change in net unrealized appreciation (depreciation) on: Investment securities | (3,857,375) | |
Assets and liabilities in foreign currencies | (4,128) | |
Total change in net unrealized appreciation (depreciation) | | (3,861,503) |
Net gain (loss) | | (2,033,504) |
Net increase (decrease) in net assets resulting from operations | | $ (1,825,523) |
See accompanying notes which are an integral part of the financial statements.
Annual Report
Statement of Changes in Net Assets
| Year ended
October 31,
2011 | Year ended
October 31,
2010 |
Increase (Decrease) in Net Assets | | |
Operations | | |
Net investment income (loss) | $ 207,981 | $ 84,988 |
Net realized gain (loss) | 1,827,999 | 322,052 |
Change in net unrealized appreciation (depreciation) | (3,861,503) | 1,507,133 |
Net increase (decrease) in net assets resulting
from operations | (1,825,523) | 1,914,173 |
Distributions to shareholders from net investment income | (69,262) | (281,171) |
Share transactions - net increase (decrease) | (3,369,781) | (4,178,483) |
Redemption fees | 300 | 436 |
Total increase (decrease) in net assets | (5,264,266) | (2,545,045) |
| | |
Net Assets | | |
Beginning of period | 23,209,768 | 25,754,813 |
End of period (including undistributed net investment income of $204,426 and undistributed net investment income of $65,823, respectively) | $ 17,945,502 | $ 23,209,768 |
See accompanying notes which are an integral part of the financial statements.
Annual Report
Financial Highlights - Class A
Years ended October 31, | 2011 | 2010 | 2009 | 2008 | 2007 |
Selected Per-Share Data | | | | | |
Net asset value, beginning of period | $ 11.74 | $ 10.82 | $ 8.98 | $ 20.94 | $ 17.49 |
Income from Investment Operations | | | | | |
Net investment income (loss) C | .14 | .06 | .15 | .25 | .32 |
Net realized and unrealized gain (loss) | (1.21) | .99 | 1.99 | (9.22) | 4.48 |
Total from investment operations | (1.07) | 1.05 | 2.14 | (8.97) | 4.80 |
Distributions from net investment income | (.06) | (.13) | (.30) | (.31) | (.12) |
Distributions from net realized gain | - | - | - | (2.68) | (1.23) |
Total distributions | (.06) | (.13) | (.30) | (2.99) | (1.35) |
Redemption fees added to paid in capital C, G | - | - | - | - | - |
Net asset value, end of period | $ 10.61 | $ 11.74 | $ 10.82 | $ 8.98 | $ 20.94 |
Total Return A, B | (9.19)% | 9.74% | 25.27% | (49.77)% | 29.16% |
Ratios to Average Net Assets D, F | | | | | |
Expenses before reductions | 2.00% | 2.05% | 2.00% | 1.63% | 1.53% |
Expenses net of fee waivers, if any | 1.45% | 1.50% | 1.50% | 1.50% | 1.50% |
Expenses net of all reductions | 1.41% | 1.43% | 1.46% | 1.46% | 1.46% |
Net investment income (loss) | 1.18% | .61% | 1.73% | 1.65% | 1.69% |
Supplemental Data | | | | | |
Net assets, end of period (000 omitted) | $ 8,025 | $ 10,276 | $ 10,904 | $ 10,286 | $ 29,273 |
Portfolio turnover rate E | 118% | 143% | 109% | 112% | 173% |
A Total returns would have been lower if certain expenses had not been reduced during the applicable periods shown.
B Total returns do not include the effect of the sales charges.
C Calculated based on average shares outstanding during the period.
D Fees and expenses of any underlying Fidelity Central Funds are not included in the Fund's expense ratio. The Fund indirectly bears its proportionate share of the expenses of any underlying Fidelity Central Funds.
E Amount does not include the portfolio activity of any underlying Fidelity Central Funds.
F Expense ratios reflect operating expenses of the class. Expenses before reductions do not reflect amounts reimbursed by the investment adviser or reductions from brokerage service arrangements or reductions from other expense offset arrangements and do not represent the amount paid by the class during periods when reimbursements or reductions occur. Expenses net of fee waivers reflect expenses after reimbursement by the investment adviser but prior to reductions from brokerage service arrangements or other expense offset arrangements. Expenses net of all reductions represent the net expenses paid by the class.
G Amount represents less than $.01 per share.
See accompanying notes which are an integral part of the financial statements.
Annual Report
Financial Highlights - Class T
Years ended October 31, | 2011 | 2010 | 2009 | 2008 | 2007 |
Selected Per-Share Data | | | | | |
Net asset value, beginning of period | $ 11.68 | $ 10.78 | $ 8.92 | $ 20.75 | $ 17.35 |
Income from Investment Operations | | | | | |
Net investment income (loss) C | .11 | .04 | .13 | .21 | .27 |
Net realized and unrealized gain (loss) | (1.20) | .97 | 1.99 | (9.17) | 4.44 |
Total from investment operations | (1.09) | 1.01 | 2.12 | (8.96) | 4.71 |
Distributions from net investment income | (.03) | (.11) | (.26) | (.19) | (.08) |
Distributions from net realized gain | - | - | - | (2.68) | (1.23) |
Total distributions | (.03) | (.11) | (.26) | (2.87) | (1.31) |
Redemption fees added to paid in capital C, G | - | - | - | - | - |
Net asset value, end of period | $ 10.56 | $ 11.68 | $ 10.78 | $ 8.92 | $ 20.75 |
Total Return A, B | (9.38)% | 9.42% | 24.99% | (49.91)% | 28.86% |
Ratios to Average Net Assets D, F | | | | | |
Expenses before reductions | 2.27% | 2.34% | 2.28% | 1.88% | 1.80% |
Expenses net of fee waivers, if any | 1.70% | 1.75% | 1.75% | 1.75% | 1.75% |
Expenses net of all reductions | 1.66% | 1.67% | 1.71% | 1.71% | 1.71% |
Net investment income (loss) | .93% | .36% | 1.48% | 1.40% | 1.44% |
Supplemental Data | | | | | |
Net assets, end of period (000 omitted) | $ 5,965 | $ 7,496 | $ 8,014 | $ 7,866 | $ 21,357 |
Portfolio turnover rate E | 118% | 143% | 109% | 112% | 173% |
A Total returns would have been lower if certain expenses had not been reduced during the applicable periods shown.
B Total returns do not include the effect of the sales charges.
C Calculated based on average shares outstanding during the period.
D Fees and expenses of any underlying Fidelity Central Funds are not included in the Fund's expense ratio. The Fund indirectly bears its proportionate share of the expenses of any underlying Fidelity Central Funds.
E Amount does not include the portfolio activity of any underlying Fidelity Central Funds.
F Expense ratios reflect operating expenses of the class. Expenses before reductions do not reflect amounts reimbursed by the investment adviser or reductions from brokerage service arrangements or reductions from other expense offset arrangements and do not represent the amount paid by the class during periods when reimbursements or reductions occur. Expenses net of fee waivers reflect expenses after reimbursement by the investment adviser but prior to reductions from brokerage service arrangements or other expense offset arrangements. Expenses net of all reductions represent the net expenses paid by the class.
G Amount represents less than $.01 per share.
See accompanying notes which are an integral part of the financial statements.
Annual Report
Financial Highlights - Class B
Years ended October 31, | 2011 | 2010 | 2009 | 2008 | 2007 |
Selected Per-Share Data | | | | | |
Net asset value, beginning of period | $ 11.35 | $ 10.48 | $ 8.61 | $ 20.16 | $ 16.91 |
Income from Investment Operations | | | | | |
Net investment income (loss) C | .05 | (.01) | .08 | .13 | .17 |
Net realized and unrealized gain (loss) | (1.17) | .94 | 1.95 | (8.86) | 4.34 |
Total from investment operations | (1.12) | .93 | 2.03 | (8.73) | 4.51 |
Distributions from net investment income | - | (.06) | (.16) | (.14) | (.03) |
Distributions from net realized gain | - | - | - | (2.68) | (1.23) |
Total distributions | - | (.06) | (.16) | (2.82) | (1.26) |
Redemption fees added to paid in capital C, G | - | - | - | - | - |
Net asset value, end of period | $ 10.23 | $ 11.35 | $ 10.48 | $ 8.61 | $ 20.16 |
Total Return A, B | (9.87)% | 8.87% | 24.34% | (50.13)% | 28.29% |
Ratios to Average Net Assets D, F | | | | | |
Expenses before reductions | 2.78% | 2.82% | 2.77% | 2.39% | 2.31% |
Expenses net of fee waivers, if any | 2.20% | 2.25% | 2.25% | 2.25% | 2.25% |
Expenses net of all reductions | 2.16% | 2.18% | 2.21% | 2.21% | 2.21% |
Net investment income (loss) | .43% | (.14)% | .98% | .90% | .94% |
Supplemental Data | | | | | |
Net assets, end of period (000 omitted) | $ 1,136 | $ 1,935 | $ 2,490 | $ 2,806 | $ 11,206 |
Portfolio turnover rate E | 118% | 143% | 109% | 112% | 173% |
A Total returns would have been lower if certain expenses had not been reduced during the applicable periods shown.
B Total returns do not include the effect of the contingent deferred sales charge.
C Calculated based on average shares outstanding during the period.
D Fees and expenses of any underlying Fidelity Central Funds are not included in the Fund's expense ratio. The Fund indirectly bears its proportionate share of the expenses of any underlying Fidelity Central Funds.
E Amount does not include the portfolio activity of any underlying Fidelity Central Funds.
F Expense ratios reflect operating expenses of the class. Expenses before reductions do not reflect amounts reimbursed by the investment adviser or reductions from brokerage service arrangements or reductions from other expense offset arrangements and do not represent the amount paid by the class during periods when reimbursements or reductions occur. Expenses net of fee waivers reflect expenses after reimbursement by the investment adviser but prior to reductions from brokerage service arrangements or other expense offset arrangements. Expenses net of all reductions represent the net expenses paid by the class.
G Amount represents less than $.01 per share.
See accompanying notes which are an integral part of the financial statements.
Annual Report
Financial Highlights - Class C
Years ended October 31, | 2011 | 2010 | 2009 | 2008 | 2007 |
Selected Per-Share Data | | | | | |
Net asset value, beginning of period | $ 11.30 | $ 10.43 | $ 8.58 | $ 20.10 | $ 16.89 |
Income from Investment Operations | | | | | |
Net investment income (loss) C | .05 | (.01) | .08 | .13 | .17 |
Net realized and unrealized gain (loss) | (1.17) | .94 | 1.94 | (8.82) | 4.32 |
Total from investment operations | (1.12) | .93 | 2.02 | (8.69) | 4.49 |
Distributions from net investment income | - | (.06) | (.17) | (.15) | (.05) |
Distributions from net realized gain | - | - | - | (2.68) | (1.23) |
Total distributions | - | (.06) | (.17) | (2.83) | (1.28) |
Redemption fees added to paid in capital C, G | - | - | - | - | - |
Net asset value, end of period | $ 10.18 | $ 11.30 | $ 10.43 | $ 8.58 | $ 20.10 |
Total Return A, B | (9.91)% | 8.92% | 24.29% | (50.11)% | 28.21% |
Ratios to Average Net Assets D, F | | | | | |
Expenses before reductions | 2.75% | 2.82% | 2.77% | 2.38% | 2.26% |
Expenses net of fee waivers, if any | 2.20% | 2.25% | 2.25% | 2.25% | 2.25% |
Expenses net of all reductions | 2.16% | 2.18% | 2.21% | 2.21% | 2.21% |
Net investment income (loss) | .43% | (.14)% | .98% | .90% | .94% |
Supplemental Data | | | | | |
Net assets, end of period (000 omitted) | $ 2,524 | $ 3,166 | $ 3,913 | $ 4,522 | $ 16,084 |
Portfolio turnover rate E | 118% | 143% | 109% | 112% | 173% |
A Total returns would have been lower if certain expenses had not been reduced during the applicable periods shown.
B Total returns do not include the effect of the contingent deferred sales charge.
C Calculated based on average shares outstanding during the period.
D Fees and expenses of any underlying Fidelity Central Funds are not included in the Fund's expense ratio. The Fund indirectly bears its proportionate share of the expenses of any underlying Fidelity Central Funds.
E Amount does not include the portfolio activity of any underlying Fidelity Central Funds.
F Expense ratios reflect operating expenses of the class. Expenses before reductions do not reflect amounts reimbursed by the investment adviser or reductions from brokerage service arrangements or reductions from other expense offset arrangements and do not represent the amount paid by the class during periods when reimbursements or reductions occur. Expenses net of fee waivers reflect expenses after reimbursement by the investment adviser but prior to reductions from brokerage service arrangements or other expense offset arrangements. Expenses net of all reductions represent the net expenses paid by the class.
G Amount represents less than $.01 per share.
See accompanying notes which are an integral part of the financial statements.
Annual Report
Financial Highlights - Institutional Class
Years ended October 31, | 2011 | 2010 | 2009 | 2008 | 2007 |
Selected Per-Share Data | | | | | |
Net asset value, beginning of period | $ 11.98 | $ 11.03 | $ 9.13 | $ 21.27 | $ 17.72 |
Income from Investment Operations | | | | | |
Net investment income (loss) B | .18 | .09 | .18 | .30 | .38 |
Net realized and unrealized gain (loss) | (1.24) | 1.01 | 2.03 | (9.38) | 4.54 |
Total from investment operations | (1.06) | 1.10 | 2.21 | (9.08) | 4.92 |
Distributions from net investment income | (.09) | (.15) | (.31) | (.38) | (.14) |
Distributions from net realized gain | - | - | - | (2.68) | (1.23) |
Total distributions | (.09) | (.15) | (.31) | (3.06) | (1.37) |
Redemption fees added to paid in capital B, F | - | - | - | - | - |
Net asset value, end of period | $ 10.83 | $ 11.98 | $ 11.03 | $ 9.13 | $ 21.27 |
Total Return A | (8.95)% | 10.00% | 25.57% | (49.63)% | 29.57% |
Ratios to Average Net Assets C, E | | | | | |
Expenses before reductions | 1.54% | 1.80% | 1.68% | 1.27% | 1.19% |
Expenses net of fee waivers, if any | 1.20% | 1.25% | 1.25% | 1.25% | 1.19% |
Expenses net of all reductions | 1.16% | 1.17% | 1.21% | 1.21% | 1.15% |
Net investment income (loss) | 1.43% | .86% | 1.98% | 1.90% | 2.00% |
Supplemental Data | | | | | |
Net assets, end of period (000 omitted) | $ 296 | $ 336 | $ 434 | $ 378 | $ 1,738 |
Portfolio turnover rate D | 118% | 143% | 109% | 112% | 173% |
A Total returns would have been lower if certain expenses had not been reduced during the applicable periods shown.
B Calculated based on average shares outstanding during the period.
C Fees and expenses of any underlying Fidelity Central Funds are not included in the Fund's expense ratio. The Fund indirectly bears its proportionate share of the expenses of any underlying Fidelity Central Funds.
D Amount does not include the portfolio activity of any underlying Fidelity Central Funds.
E Expense ratios reflect operating expenses of the class. Expenses before reductions do not reflect amounts reimbursed by the investment adviser or reductions from brokerage service arrangements or reductions from other expense offset arrangements and do not represent the amount paid by the class during periods when reimbursements or reductions occur. Expenses net of fee waivers reflect expenses after reimbursement by the investment adviser but prior to reductions from brokerage service arrangements or other expense offset arrangements. Expenses net of all reductions represent the net expenses paid by the class.
F Amount represents less than $.01 per share.
See accompanying notes which are an integral part of the financial statements.
Annual Report
Notes to Financial Statements
For the period ended October 31, 2011
1. Organization.
Fidelity Advisor Europe Capital Appreciation Fund (the Fund) is a fund of Fidelity Advisor Series VIII (the Trust) and is authorized to issue an unlimited number of shares. The Trust is registered under the Investment Company Act of 1940, as amended (the 1940 Act), as an open-end management investment company organized as a Massachusetts business trust. The Fund offers Class A, Class T, Class C and Institutional Class shares, each of which, along with Class B shares, has equal rights as to assets and voting privileges. Effective after the close of business on September 1, 2010, Class B shares were closed to new accounts and additional purchases, except for exchanges and reinvestments by existing shareholders. Each class has exclusive voting rights with respect to matters that affect that class. Class B shares will automatically convert to Class A shares after a holding period of seven years from the initial date of purchase. Investment income, realized and unrealized capital gains and losses, the common expenses of the Fund, and certain fund-level expense reductions, if any, are allocated on a pro-rata basis to each class based on the relative net assets of each class to the total net assets of the Fund. Each class differs with respect to transfer agent and distribution and service plan fees incurred. Certain expense reductions may also differ by class.
2. Investments in Fidelity Central Funds.
The Fund invests in Fidelity Central Funds, which are open-end investment companies available only to other investment companies and accounts managed by Fidelity Management & Research Company (FMR) and its affiliates. The Fund's Schedule of Investments lists each of the Fidelity Central Funds held as of period end, if any, as an investment of the Fund, but does not include the underlying holdings of each Fidelity Central Fund. As an Investing Fund, the Fund indirectly bears its proportionate share of the expenses of the underlying Fidelity Central Funds.
The Money Market Central Funds seek preservation of capital and current income and are managed by Fidelity Investments Money Management, Inc. (FIMM), an affiliate of FMR.
A complete unaudited list of holdings for each Fidelity Central Fund is available upon request or at the Securities and Exchange Commission (the SEC) web site at www.sec.gov. In addition, the financial statements of the Fidelity Central Funds, which are not covered by the Fund's Report of Independent Registered Public Accounting Firm are available on the SEC web site or upon request.
3. Significant Accounting Policies.
The financial statements have been prepared in conformity with accounting principles generally accepted in the United States of America (GAAP), which require management to make certain estimates and assumptions at the date of the financial statements.
Annual Report
Notes to Financial Statements - continued
3. Significant Accounting Policies - continued
Actual results could differ from those estimates. Subsequent events, if any, through the date that the financial statements were issued have been evaluated in the preparation of the financial statements. The following summarizes the significant accounting policies of the Fund:
Security Valuation. Investments are valued as of 4:00 p.m. Eastern time on the last calendar day of the period. The Fund uses independent pricing services approved by the Board of Trustees to value its investments. When current market prices or quotations are not readily available or reliable, valuations may be determined in good faith in accordance with procedures adopted by the Board of Trustees. Factors used in determining value may include market or security specific events. The frequency with which these procedures are used cannot be predicted and they may be utilized to a significant extent. The value used for net asset value (NAV) calculation under these procedures may differ from published prices for the same securities.
The Fund categorizes the inputs to valuation techniques used to value its investments into a disclosure hierarchy consisting of three levels as shown below:
Level 1 - quoted prices in active markets for identical investments
Level 2 - other significant observable inputs (including quoted prices for similar investments, interest rates, prepayment speeds, etc.)
Level 3 - unobservable inputs (including the Fund's own assumptions based on the best information available)
Changes in valuation techniques may result in transfers in or out of an assigned level within the disclosure hierarchy. The aggregate value of investments by input level, as of October 31, 2011, is included at the end of the Fund's Schedule of Investments. Valuation techniques used to value the Fund's investments by major category are as follows:
Equity securities, including restricted securities, for which market quotations are readily available, are valued at the last reported sale price or official closing price as reported by an independent pricing service on the primary market or exchange on which they are traded and are categorized as Level 1 in the hierarchy. In the event there were no sales during the day or closing prices are not available, securities are valued at the last quoted bid price or may be valued using the last available price and are generally categorized as Level 2 in the hierarchy. For foreign equity securities, when significant market or security specific events arise, comparisons to the valuation of American Depositary Receipts (ADRs), futures contracts, Exchange-traded funds (ETFs) and certain indexes as well as quoted prices for similar securities are used and are categorized as Level 2 in the hierarchy in these circumstances. Utilizing these techniques may result in transfers between Level 1 and Level 2. For restricted equity securities and private placements where
Annual Report
3. Significant Accounting Policies - continued
Security Valuation - continued
observable inputs are limited, assumptions about market activity and risk are used and are categorized as Level 3 in the hierarchy.
Investments in open-end mutual funds, including the Fidelity Central Funds, are valued at their closing net asset value each business day and are categorized as Level 1 in the hierarchy.
Foreign Currency. The Fund may use foreign currency contracts to facilitate transactions in foreign-denominated securities. Gains and losses from these transactions may arise from changes in the value of the foreign currency or if the counterparties do not perform under the contracts' terms.
Foreign-denominated assets, including investment securities, and liabilities are translated into U.S. dollars at the exchange rate at period end. Purchases and sales of investment securities, income and dividends received and expenses denominated in foreign currencies are translated into U.S. dollars at the exchange rate in effect on the transaction date.
The effects of exchange rate fluctuations on investments are included with the net realized and unrealized gain (loss) on investment securities. Other foreign currency transactions resulting in realized and unrealized gain (loss) are disclosed separately.
Investment Transactions and Income. For financial reporting purposes, the Fund's investment holdings and NAV include trades executed through the end of the last business day of the period. The NAV per share for processing shareholder transactions is calculated as of the close of business of the New York Stock Exchange (NYSE), normally 4:00 p.m. Eastern time and includes trades executed through the end of the prior business day. Gains and losses on securities sold are determined on the basis of identified cost and may include proceeds received from litigation. Dividend income is recorded on the ex-dividend date, except for certain dividends from foreign securities where the ex-dividend date may have passed, which are recorded as soon as the Fund is informed of the ex-dividend date. Non-cash dividends included in dividend income, if any, are recorded at the fair market value of the securities received. Distributions received on securities that represent a return of capital or capital gain are recorded as a reduction of cost of investments and/or as a realized gain. The Fund estimates the components of distributions received that may be considered return of capital distributions or capital gain distributions. Interest income and distributions from the Fidelity Central Funds are accrued as earned. Interest income includes coupon interest and amortization of premium and accretion of discount on debt securities. Investment income is recorded net of foreign taxes withheld where recovery of such taxes is uncertain.
Annual Report
Notes to Financial Statements - continued
3. Significant Accounting Policies - continued
Expenses. Expenses directly attributable to a fund are charged to that fund. Expenses attributable to more than one fund are allocated among the respective funds on the basis of relative net assets or other appropriate methods. Expense estimates are accrued in the period to which they relate and adjustments are made when actual amounts are known.
Income Tax Information and Distributions to Shareholders. Each year, the Fund intends to qualify as a regulated investment company, including distributing substantially all of its taxable income and realized gains under Subchapter M of the Internal Revenue Code and filing its U.S. federal tax return. As a result, no provision for income taxes is required. As of October 31, 2011, the Fund did not have any unrecognized tax benefits in the financial statements. A fund's federal tax return is subject to examination by the Internal Revenue Service (IRS) for a period of three years. Foreign taxes are provided for based on the Fund's understanding of the tax rules and rates that exist in the foreign markets in which it invests.
Distributions are declared and recorded on the ex-dividend date. Income dividends and capital gain distributions are declared separately for each class. Income and capital gain distributions are determined in accordance with income tax regulations, which may differ from GAAP.
Capital accounts within the financial statements are adjusted for permanent book-tax differences. These adjustments have no impact on net assets or the results of operations. Temporary book-tax differences will reverse in a subsequent period.
Book-tax differences are primarily due to foreign currency transactions, passive foreign investment companies (PFIC), capital loss carryforwards and losses deferred due to wash sales.
The federal tax cost of investment securities and unrealized appreciation (depreciation) as of period end were as follows:
Gross unrealized appreciation | $ 1,281,793 |
Gross unrealized depreciation | (2,438,885) |
Net unrealized appreciation (depreciation) on securities and other investments | $ (1,157,092) |
| |
Tax Cost | $ 19,220,921 |
Annual Report
3. Significant Accounting Policies - continued
Income Tax Information and Distributions to Shareholders - continued
The tax-based components of distributable earnings as of period end were as follows:
Undistributed ordinary income | $ 204,425 |
Capital loss carryforward | $ (17,533,353) |
Net unrealized appreciation (depreciation) | $ (1,157,089) |
Under the recently enacted Regulated Investment Company Modernization Act of 2010 (the Act), the Fund will be permitted to carry forward capital losses incurred in taxable years beginning after December 22, 2010 for an unlimited period. However, any losses incurred during those future taxable years will be required to be utilized prior to any losses incurred in pre-enactment taxable years, which generally expire after eight years from when they are incurred. Additionally, post-enactment capital losses that are carried forward will retain their character as either short-term or long-term capital losses rather than being considered all short-term as under previous law. The Fund's first fiscal year end subject to the Act will be October 31, 2012.
The tax character of distributions paid was as follows:
| October 31, 2011 | October 31, 2010 |
Ordinary Income | $ 69,262 | $ 281,171 |
Short-Term Trading (Redemption) Fees. Shares held by investors in the Fund less than 30 days are subject to a redemption fee equal to 1.00% of the net asset value of shares redeemed. All redemption fees, which reduce the proceeds of the shareholder redemption, are retained by the Fund and accounted for as an addition to paid in capital.
New Accounting Pronouncement. In May 2011, the Financial Accounting Standards Board issued Accounting Standard Update No. 2011-04, Fair Value Measurement (Topic 820) - Amendments to Achieve Common Fair Value Measurement and Disclosure Requirements in U.S. GAAP and IFRSs. The update changes the wording used to describe the requirements in GAAP for measuring fair value and for disclosing information about fair value measurements. The update is effective during interim and annual periods beginning after December 15, 2011. Management is currently evaluating the impact of the update's adoption on the Fund's financial statement disclosures.
Annual Report
Notes to Financial Statements - continued
4. Purchases and Sales of Investments.
Purchases and sales of securities, other than short-term securities, aggregated $25,544,845 and $28,913,333, respectively.
5. Fees and Other Transactions with Affiliates.
Management Fee. FMR and its affiliates provide the Fund with investment management related services for which the Fund pays a monthly management fee. The management fee is the sum of an individual fund fee rate that is based on an annual rate of .45% of the Fund's average net assets and a group fee rate that averaged .26% during the period. The group fee rate is based upon the average net assets of all the mutual funds advised by FMR. The group fee rate decreases as assets under management increase and increases as assets under management decrease. For the period, the total annual management fee rate was .71% of the Fund's average net assets.
Distribution and Service Plan Fees. In accordance with Rule 12b-1 of the 1940 Act, the Fund has adopted separate Distribution and Service Plans for each class of shares. Certain classes pay Fidelity Distributors Corporation (FDC), an affiliate of FMR, separate Distribution and Service Fees, each of which is based on an annual percentage of each class' average net assets. In addition, FDC may pay financial intermediaries for selling shares of the Fund and providing shareholder support services. For the period, the Distribution and Service Fee rates, total fees and amounts retained by FDC were as follows:
| Distribution
Fee | Service
Fee | Total Fees | Retained
by FDC |
Class A | -% | .25% | $ 24,218 | $ 193 |
Class T | .25% | .25% | 35,140 | 87 |
Class B | .75% | .25% | 15,777 | 11,875 |
Class C | .75% | .25% | 30,672 | 2,428 |
| | | $ 105,807 | $ 14,583 |
Sales Load. FDC may receive a front-end sales charge of up to 5.75% for selling Class A shares, and 3.50% for selling Class T shares, some of which is paid to financial intermediaries for selling shares of the Fund. Depending on the holding period, FDC may receive contingent deferred sales charges levied on Class A, Class T, Class B, and Class C redemptions. The deferred sales charges range from 5% to 1% for Class B, 1% for Class C, 1.00% for certain purchases of Class A shares and .25% for certain purchases of Class T shares.
Annual Report
5. Fees and Other Transactions with Affiliates - continued
Sales Load - continued
For the period, sales charge amounts retained by FDC were as follows:
| Retained
by FDC |
Class A | $ 1,948 |
Class T | 1,444 |
Class B* | 3,721 |
Class C* | 324 |
| $ 7,437 |
* When Class B and Class C shares are initially sold, FDC pays commissions from its own resources to financial intermediaries through which the sales are made.
Transfer Agent Fees. Fidelity Investments Institutional Operations Company, Inc. (FIIOC), an affiliate of FMR, is the transfer, dividend disbursing and shareholder servicing agent for each class of the Fund. FIIOC receives account fees and asset-based fees that vary according to the account size and type of account of the shareholders of the respective classes of the Fund. FIIOC pays for typesetting, printing and mailing of shareholder reports, except proxy statements. For the period, transfer agent fees for each class were as follows:
| Amount | % of
Average
Net Assets |
Class A | $ 29,942 | .31 |
Class T | 23,106 | .33 |
Class B | 4,871 | .31 |
Class C | 9,467 | .31 |
Institutional Class | 1,102 | .19 |
| $ 68,488 | |
Accounting and Security Lending Fees. Fidelity Service Company, Inc. (FSC), an affiliate of FMR, maintains the Fund's accounting records. The accounting fee is based on the level of average net assets for the month. Under a separate contract, FSC administers the security lending program. The security lending fee is based on the number and duration of lending transactions.
Brokerage Commissions. The Fund placed a portion of its portfolio transactions with brokerage firms which are affiliates of the investment adviser. The commissions paid to these affiliated firms were $75 for the period.
Annual Report
Notes to Financial Statements - continued
6. Committed Line of Credit.
The Fund participates with other funds managed by FMR or an affiliate in a $4.0 billion credit facility (the "line of credit") to be utilized for temporary or emergency purposes to fund shareholder redemptions or for other short-term liquidity purposes. The Fund has agreed to pay commitment fees on its pro-rata portion of the line of credit, which amounted to $69 and is reflected in Miscellaneous expenses on the Statement of Operations. During the period, there were no borrowings on this line of credit.
7. Security Lending.
The Fund lends portfolio securities through a lending agent from time to time in order to earn additional income. For equity securities, a lending agent is used and may loan securities to certain qualified borrowers, including Fidelity Capital Markets (FCM), a broker-dealer affiliated with the Fund. On the settlement date of the loan, the Fund receives collateral (in the form of U.S. Treasury obligations, letters of credit and/or cash) against the loaned securities and maintains collateral in an amount not less than 100% of the market value of the loaned securities during the period of the loan. The market value of the loaned securities is determined at the close of business of the Fund and any additional required collateral is delivered to the Fund on the next business day. If the borrower defaults on its obligation to return the securities loaned because of insolvency or other reasons, a fund could experience delays and costs in recovering the securities loaned or in gaining access to the collateral. Any cash collateral received is invested in the Fidelity Securities Lending Cash Central Fund. The value of loaned securities and cash collateral at period end are disclosed on the Fund's Statement of Assets and Liabilities. Security lending income represents the income earned on investing cash collateral, less rebates paid to borrowers and any lending agent fees associated with the loan, plus any premium payments received for lending certain types of securities. Security lending income is presented in the Statement of Operations as a component of income from Fidelity Central Funds. Total security lending income during the period amounted to $7,159. During the period, there were no securities loaned to FCM.
8. Expense Reductions.
FMR voluntarily agreed to reimburse each class to the extent annual operating expenses exceeded certain levels of average net assets as noted in the table below. Some expenses, for example interest expense, including commitment fees, are excluded from this reimbursement.
Annual Report
8. Expense Reductions - continued
The following classes were in reimbursement during the period:
| Expense
Limitations | Reimbursement
from adviser |
Class A | 1.45% | $ 52,842 |
Class T | 1.70% | 39,982 |
Class B | 2.20% | 9,136 |
Class C | 2.20% | 16,636 |
Institutional Class | 1.20% | 1,951 |
| | $ 120,547 |
Many of the brokers with whom FMR places trades on behalf of the Fund provided services to the Fund in addition to trade execution. These services included payments of certain expenses on behalf of the Fund totaling $9,652 for the period.
9. Distributions to Shareholders.
Distributions to shareholders of each class were as follows:
Years ended October 31, | 2011 | 2010 |
From net investment income | | |
Class A | $ 48,533 | $ 132,405 |
Class T | 17,367 | 105,744 |
Class B | - | 13,563 |
Class C | - | 22,327 |
Institutional Class | 3,362 | 7,132 |
Total | $ 69,262 | $ 281,171 |
10. Share Transactions.
Transactions for each class of shares were as follows:
| Shares | Dollars |
Years ended October 31, | 2011 | 2010 | 2011 | 2010 |
Class A | | | | |
Shares sold | 113,790 | 127,568 | $ 1,369,180 | $ 1,411,611 |
Reinvestment of distributions | 3,553 | 10,457 | 42,460 | 119,629 |
Shares redeemed | (236,239) | (270,495) | (2,808,784) | (2,873,077) |
Net increase (decrease) | (118,896) | (132,470) | $ (1,397,144) | $ (1,341,837) |
Class T | | | | |
Shares sold | 87,655 | 285,617 | $ 1,039,691 | $ 3,265,728 |
Reinvestment of distributions | 1,416 | 8,986 | 16,885 | 102,440 |
Shares redeemed | (165,637) | (396,557) | (1,980,913) | (4,398,721) |
Net increase (decrease) | (76,566) | (101,954) | $ (924,337) | $ (1,030,553) |
Annual Report
Notes to Financial Statements - continued
10. Share Transactions - continued
| Shares | Dollars |
Years ended October 31, | 2011 | 2010 | 2011 | 2010 |
Class B | | | | |
Shares sold | 1,700 | 16,071 | $ 19,713 | $ 167,235 |
Reinvestment of distributions | - | 1,085 | - | 12,073 |
Shares redeemed | (61,103) | (84,324) | (715,010) | (867,232) |
Net increase (decrease) | (59,403) | (67,168) | $ (695,297) | $ (687,924) |
Class C | | | | |
Shares sold | 39,446 | 36,176 | $ 455,073 | $ 385,078 |
Reinvestment of distributions | - | 1,719 | - | 19,047 |
Shares redeemed | (71,785) | (132,930) | (822,473) | (1,389,265) |
Net increase (decrease) | (32,339) | (95,035) | $ (367,400) | $ (985,140) |
Institutional Class | | | | |
Shares sold | 55,800 | 21,917 | $ 702,293 | $ 240,660 |
Reinvestment of distributions | 124 | 430 | 1,508 | 5,009 |
Shares redeemed | (56,680) | (33,643) | (689,404) | (378,698) |
Net increase (decrease) | (756) | (11,296) | $ 14,397 | $ (133,029) |
11. Other.
The Fund's organizational documents provide former and current trustees and officers with a limited indemnification against liabilities arising in connection with the performance of their duties to the Fund. In the normal course of business, the Fund may also enter into contracts that provide general indemnifications. The Fund's maximum exposure under these arrangements is unknown as this would be dependent on future claims that may be made against the Fund. The risk of material loss from such claims is considered remote.
Annual Report
To the Trustees of Fidelity Advisor Series VIII and Shareholders of Fidelity Advisor Europe Capital Appreciation Fund:
We have audited the accompanying statement of assets and liabilities of Fidelity Advisor Europe Capital Appreciation Fund (the Fund), a fund of Fidelity Advisor Series VIII, including the schedule of investments, as of October 31, 2011, and the related statement of operations for the year then ended, the statement of changes in net assets for each of the two years in the period then ended, and the financial highlights for each of the five years in the period then ended. These financial statements and financial highlights are the responsibility of the Fund's management. Our responsibility is to express an opinion on these financial statements and financial highlights based on our audits.
We conducted our audits in accordance with the standards of the Public Company Accounting Oversight Board (United States). Those standards require that we plan and perform the audit to obtain reasonable assurance about whether the financial statements and financial highlights are free of material misstatement. The Fund is not required to have, nor were we engaged to perform, an audit of its internal control over financial reporting. Our audits included consideration of internal control over financial reporting as a basis for designing audit procedures that are appropriate in the circumstances, but not for the purpose of expressing an opinion on the effectiveness of the Fund's internal control over financial reporting. Accordingly, we express no such opinion. An audit also includes examining, on a test basis, evidence supporting the amounts and disclosures in the financial statements, assessing the accounting principles used and significant estimates made by management, as well as evaluating the overall financial statement presentation. Our procedures included confirmation of securities owned as of October 31, 2011, by correspondence with the custodians and brokers; where replies were not received from brokers, we performed other auditing procedures. We believe that our audits provide a reasonable basis for our opinion.
In our opinion, the financial statements and financial highlights referred to above present fairly, in all material respects, the financial position of Fidelity Advisor Europe Capital Appreciation Fund as of October 31, 2011, the results of its operations for the year then ended, the changes in its net assets for each of the two years in the period then ended, and the financial highlights for each of the five years in the period then ended, in conformity with accounting principles generally accepted in the United States of America.
/s/ Deloitte & Touche LLP
DELOITTE & TOUCHE LLP
Boston, Massachusetts
December 12, 2011
Annual Report
The Trustees, Members of the Advisory Board, and executive officers of the trust and fund, as applicable, are listed below. The Board of Trustees governs the fund and is responsible for protecting the interests of shareholders. The Trustees are experienced executives who meet periodically throughout the year to oversee the fund's activities, review contractual arrangements with companies that provide services to the fund, oversee management of the risks associated with such activities and contractual arrangements, and review the fund's performance. Except for James C. Curvey, each of the Trustees oversees 226 funds advised by FMR or an affiliate. Mr. Curvey oversees 429 funds advised by FMR or an affiliate.
The Trustees hold office without limit in time except that (a) any Trustee may resign; (b) any Trustee may be removed by written instrument, signed by at least two-thirds of the number of Trustees prior to such removal; (c) any Trustee who requests to be retired or who has become incapacitated by illness or injury may be retired by written instrument signed by a majority of the other Trustees; and (d) any Trustee may be removed at any special meeting of shareholders by a two-thirds vote of the outstanding voting securities of the trust. Each Trustee who is not an interested person (as defined in the 1940 Act) (Independent Trustee), shall retire not later than the last day of the calendar year in which his or her 75th birthday occurs. The Independent Trustees may waive this mandatory retirement age policy with respect to individual Trustees. The executive officers and Advisory Board Members hold office without limit in time, except that any officer and Advisory Board Member may resign or may be removed by a vote of a majority of the Trustees at any regular meeting or any special meeting of the Trustees. Except as indicated, each individual has held the office shown or other offices in the same company for the past five years.
Experience, Skills, Attributes, and Qualifications of the Fund's Trustees. The Governance and Nominating Committee has adopted a statement of policy that describes the experience, qualifications, attributes, and skills that are necessary and desirable for potential Independent Trustee candidates (Statement of Policy). The Board believes that each Trustee satisfied at the time he or she was initially elected or appointed a Trustee, and continues to satisfy, the standards contemplated by the Statement of Policy. The Governance and Nominating Committee also engages professional search firms to help identify potential Independent Trustee candidates who have the experience, qualifications, attributes, and skills consistent with the Statement of Policy. From time to time, additional criteria based on the composition and skills of the current Independent Trustees, as well as experience or skills that may be appropriate in light of future changes to board composition, business conditions, and regulatory or other developments, have also been considered by the professional search firms and the Governance and Nominating Committee. In addition, the Board takes into account the Trustees' commitment and participation in Board and committee meetings, as well as their leadership of standing and ad hoc committees throughout their tenure.
In determining that a particular Trustee was and continues to be qualified to serve as a Trustee, the Board has considered a variety of criteria, none of which, in isolation, was controlling. The Board believes that, collectively, the Trustees have balanced and diverse experience, qualifications, attributes, and skills, which allow the Board to operate effectively in governing the fund and protecting the interests of shareholders. Information about the specific experience, skills, attributes, and qualifications of each Trustee, which in each case led to the Board's conclusion that the Trustee should serve (or continue to serve) as a trustee of the fund, is provided below.
Annual Report
Board Structure and Oversight Function. James C. Curvey is an interested person (as defined in the 1940 Act) and currently serves as Acting Chairman. The Trustees have determined that an interested Chairman is appropriate and benefits shareholders because an interested Chairman has a personal and professional stake in the quality and continuity of services provided to the fund. Independent Trustees exercise their informed business judgment to appoint an individual of their choosing to serve as Chairman, regardless of whether the Trustee happens to be independent or a member of management. The Independent Trustees have determined that they can act independently and effectively without having an Independent Trustee serve as Chairman and that a key structural component for assuring that they are in a position to do so is for the Independent Trustees to constitute a substantial majority for the Board. The Independent Trustees also regularly meet in executive session. Ned C. Lautenbach serves as Chairman of the Independent Trustees and as such (i) acts as a liaison between the Independent Trustees and management with respect to matters important to the Independent Trustees and (ii) with management prepares agendas for Board meetings.
Fidelity funds are overseen by different Boards of Trustees. The fund's Board oversees Fidelity's equity and high income funds and another Board oversees Fidelity's investment-grade bond, money market, and asset allocation funds. The asset allocation funds may invest in Fidelity funds overseen by the fund's Board. The use of separate Boards, each with its own committee structure, allows the Trustees of each group of Fidelity funds to focus on the unique issues of the funds they oversee, including common research, investment, and operational issues. On occasion, the separate Boards establish joint committees to address issues of overlapping consequences for the Fidelity funds overseen by each Board.
The Trustees operate using a system of committees to facilitate the timely and efficient consideration of all matters of importance to the Trustees, the fund, and fund shareholders and to facilitate compliance with legal and regulatory requirements and oversight of the fund's activities and associated risks. The Board, acting through its committees, has charged FMR and its affiliates with (i) identifying events or circumstances the occurrence of which could have demonstrably adverse effects on the fund's business and/or reputation; (ii) implementing processes and controls to lessen the possibility that such events or circumstances occur or to mitigate the effects of such events or circumstances if they do occur; and (iii) creating and maintaining a system designed to evaluate continuously business and market conditions in order to facilitate the identification and implementation processes described in (i) and (ii) above. Because the day-to-day operations and activities of the fund are carried out by or through FMR, its affiliates and other service providers, the fund's exposure to risks is mitigated but not eliminated by the processes overseen by the Trustees. While each of the Board's committees has responsibility for overseeing different aspects of the fund's activities, oversight is exercised primarily through the Operations, Audit, and Compliance Committees. In addition, the Independent Trustees have worked with FMR to enhance the Board's oversight of investment and financial risks, legal and regulatory risks, technology risks, and operational risks, including the development of additional risk reporting to the Board. For example, a working group comprised of Independent Trustees and FMR has worked and continues to work to review the Fidelity funds' valuation-related activities, reporting and risk management. Appropriate personnel, including but not limited to the fund's Chief Compliance Officer (CCO), FMR's internal auditor, the independent accountants, the fund's Treasurer and portfolio management personnel, make periodic reports to the Board's committees, as appropriate, including an annual review of FMR's risk management program for the Fidelity funds. The responsibilities of each standing committee, including their oversight responsibilities, are described further under "Standing Committees of the Fund's Trustees."
Annual Report
Trustees and Officers - continued
The fund's Statement of Additional Information (SAI) includes more information about the Trustees. To request a free copy, call Fidelity at 1-877-208-0098.
Interested Trustees*:
Correspondence intended for each Trustee who is an interested person may be sent to Fidelity Investments, 82 Devonshire Street, Boston, Massachusetts 02109.
Name, Age; Principal Occupations and Other Relevant Experience+ |
James C. Curvey (76) |
| Year of Election or Appointment: 2007 Mr. Curvey is Trustee and Acting Chairman of the Board of Trustees of certain Trusts. Mr. Curvey also serves as Trustee (2007-present) of other investment companies advised by FMR. Mr. Curvey is a Director of Fidelity Investments Money Management, Inc. (2009-present), Director of Fidelity Research & Analysis Co. (2009-present) and Director of FMR and FMR Co., Inc. (2007-present). Mr. Curvey is also Vice Chairman (2007-present) and Director of FMR LLC. In addition, Mr. Curvey serves as an Overseer for the Boston Symphony Orchestra and a member of the Trustees of Villanova University. Previously, Mr. Curvey was the Vice Chairman (2006-2007) and Director (2000-2007) of FMR Corp. |
Ronald P. O'Hanley (54) |
| Year of Election or Appointment: 2011 Mr. O'Hanley is Director of FMR Co., Inc. (2010-present), Director of Fidelity Investments Money Management, Inc. (2010-present), Director of Fidelity Research & Analysis Company (2010-present), President of Fidelity Asset Management and Corporate Services and a member of Fidelity's Executive Committee (2010-present). Previously, Mr. O'Hanley served as President and Chief Executive Officer of BNY Mellon Asset Management (2007-2010). Mr. O'Hanley also served as Vice Chairman of Bank New York Mellon Corp. and a member of that firm's Executive Committee. Prior to the 2007 merger of The Bank of New York and Mellon Financial Corporation, he was Vice Chairman of Mellon Financial Corporation and President and Chief Executive Officer of Mellon Asset Management. He joined Mellon in February 1997. Mr. O'Hanley currently serves as Chairman of the Boston Public Library Foundation Board of Directors and sits on the Board of Directors of Beth Israel Deaconess Medical Center, the Board of Trustees of the Marine Biological Laboratory and the Advisory Board of the Maxwell School of Citizenship and Public Administration at Syracuse University. Mr. O'Hanley also chairs the Council on Asset Management for the Financial Services Roundtable and is a member of the Board of Directors of Institutional Investor's U.S. Institute. |
* Trustees have been determined to be "Interested Trustees" by virtue of, among other things, their affiliation with the trust or various entities under common control with FMR.
+ The information above includes each Trustee's principal occupation during the last five years and other information relating to the experience, attributes, and skills relevant to each Trustee's qualifications to serve as a Trustee, which led to the conclusion that each Trustee should serve as a Trustee for the fund.
Annual Report
Trustees and Officers - continued
Independent Trustees:
Correspondence intended for each Independent Trustee (that is, the Trustees other than the Interested Trustees) may be sent to Fidelity Investments, P.O. Box 55235, Boston, Massachusetts 02205-5235.
Name, Age; Principal Occupations and Other Relevant Experience+ |
Dennis J. Dirks (63) |
| Year of Election or Appointment: 2005 Prior to his retirement in May 2003, Mr. Dirks was Chief Operating Officer and a member of the Board of The Depository Trust & Clearing Corporation (DTCC). He also served as President, Chief Operating Officer, and Board member of The Depository Trust Company (DTC) and President and Board member of the National Securities Clearing Corporation (NSCC). In addition, Mr. Dirks served as Chief Executive Officer and Board member of the Government Securities Clearing Corporation, Chief Executive Officer and Board member of the Mortgage-Backed Securities Clearing Corporation, as a Trustee and a member of the Finance Committee of Manhattan College (2005-2008), and as a Trustee and a member of the Finance Committee of AHRC of Nassau County (2006-2008). Mr. Dirks is a member of the Independent Directors Council (IDC) Governing Council (2010-Present) and Board of Directors for The Brookville Center for Children's Services, Inc. (2009-present). |
Alan J. Lacy (58) |
| Year of Election or Appointment: 2008 Mr. Lacy serves as Senior Adviser (2007-present) of Oak Hill Capital Partners, L.P. (private equity). Mr. Lacy also served as Chief Executive Officer (2000-2005) and Vice Chairman (2005-2006) of Sears Holdings Corporation and Sears, Roebuck and Co. (retail). In addition, Mr. Lacy serves as a member of the Board of Directors of Dave & Buster's, Inc. (restaurant and entertainment complexes, 2010-present), The Hillman Companies, Inc. (hardware wholesalers, 2010-present), and Bristol-Myers Squibb Company (global pharmaceuticals, 2007-present). Mr. Lacy is a member of the Board of Trustees of The National Parks Conservation Association (2006-Present). Previously, Mr. Lacy served as Chairman of the Board of Trustees of the National Parks Conservation Association (2008-2011) and as a member of the Board of Directors for the Western Union Company (global money transfer, 2006-2011). |
Ned C. Lautenbach (67) |
| Year of Election or Appointment: 2000 Mr. Lautenbach is Chairman of the Independent Trustees of the Equity and High Income Funds (2006-present). Mr. Lautenbach currently serves as the Lead Director of the Eaton Corporation Board of Directors (diversified industrial, 1997-present). Mr. Lautenbach is also a member of the Board of Directors of the Philharmonic Center for the Arts in Naples, Florida (1999-present); a member of the Board of Trustees of Fairfield University (2005-present); and a member of the Council on Foreign Relations (1994-present). Previously, Mr. Lautenbach was a Partner/Advisory Partner at Clayton, Dubilier & Rice, LLC (private equity investment, 1998-2010), as well as a Director of Sony Corporation (2006-2007). |
Joseph Mauriello (67) |
| Year of Election or Appointment: 2008 Prior to his retirement in January 2006, Mr. Mauriello served in numerous senior management positions including Deputy Chairman and Chief Operating Officer (2004-2005), and Vice Chairman of Financial Services (2002-2004) of KPMG LLP US (professional services, 1965-2005). Mr. Mauriello currently serves as a member of the Board of Directors of XL Group plc. (global insurance and re-insurance, 2006-present) and of Arcadia Resources Inc. (health care services and products, 2007-present). Previously, Mr. Mauriello served as a Director of the Hamilton Funds of the Bank of New York (2006-2007). |
Robert W. Selander (61) |
| Year of Election or Appointment: 2011 Previously, Mr. Selander served as a Member of the Advisory Board of Fidelity's Equity and High Income Funds (2011), Executive Vice Chairman (2010), Chief Executive Officer (2009-2010), and President and Chief Executive Officer (1997-2009) of Mastercard, Inc. |
Cornelia M. Small (67) |
| Year of Election or Appointment: 2005 Ms. Small is a member of the Board of Directors of the Teagle Foundation (2009-present). Ms. Small is also a member of the Investment Committee, and Chair (2008-present) and a member of the Board of Trustees of Smith College. In addition, Ms. Small serves on the Investment Committee of the Berkshire Taconic Community Foundation (2008-present). Previously, Ms. Small served as Chairperson of the Investment Committee (2002-2008) of Smith College. In addition, Ms. Small served as Chief Investment Officer, Director of Global Equity Investments, and a member of the Board of Directors of Scudder, Stevens & Clark and Scudder Kemper Investments. |
William S. Stavropoulos (72) |
| Year of Election or Appointment: 2001 Mr. Stavropoulos is Vice Chairman of the Independent Trustees of the Equity and High Income Funds (2006-present). Mr. Stavropoulos serves as President and Founder of the Michigan Baseball Foundation, the Great Lakes Loons (2007-present). Mr. Stavropoulos is Chairman Emeritus of the Board of Directors of The Dow Chemical Company, where he previously served in numerous senior management positions, including President, CEO (1995-2000; 2002-2004), Chairman of the Executive Committee (2000-2006), and as a member of the Board of Directors (1990-2006). Currently, Mr. Stavropoulos is Chairman of Univar (global distributor of commodity and specialty chemicals, 2010-present), a Director of Teradata Corporation (data warehousing and technology solutions, 2008-present), Chemical Financial Corporation, Maersk Inc. (industrial conglomerate), Tyco International, Inc. (multinational manufacturing and services, 2007-present), and a member of the Advisory Board for Metalmark Capital (private equity investment, 2005-present). Mr. Stavropoulos is a special advisor to Clayton, Dubilier & Rice, LLC (private equity investment). In addition, Mr. Stavropoulos is a member of the University of Notre Dame Advisory Council for the College of Science. |
David M. Thomas (62) |
| Year of Election or Appointment: 2008 Previously, Mr. Thomas served as Executive Chairman (2005-2006) and Chairman and Chief Executive Officer (2000-2005) of IMS Health, Inc. (pharmaceutical and healthcare information solutions). In addition, Mr. Thomas serves as a member of the Board of Directors of Fortune Brands, Inc. (consumer products), and Interpublic Group of Companies, Inc. (marketing communication, 2004-present). |
Michael E. Wiley (61) |
| Year of Election or Appointment: 2008 Mr. Wiley also serves as a Director of Asia Pacific Exploration Consolidated (international oil and gas exploration and production, 2008-present). Mr. Wiley serves as a Director of Tesoro Corporation (independent oil refiner and marketer, 2005-present), and a Director of Bill Barrett Corporation (exploration and production, 2005-present). In addition, Mr. Wiley also serves as a Director of Post Oak Bank (privately-held bank, 2004-present). Previously, Mr. Wiley served as a member of the Board of Trustees of the University of Tulsa (2000-2006; 2007-2010), as a Senior Energy Advisor of Katzenbach Partners, LLC (consulting, 2006-2007), as an Advisory Director of Riverstone Holdings (private investment), Chairman, President, and CEO of Baker Hughes, Inc. (oilfield services, 2000-2004), and as Director of Spinnaker Exploration Company (exploration and production, 2001-2005). |
Annual Report
+ The information above includes each Trustee's principal occupation during the last five years and other information relating to the experience, attributes, and skills relevant to each Trustee's qualifications to serve as a Trustee, which led to the conclusion that each Trustee should serve as a Trustee for the fund.
Advisory Board Members and Executive Officers:
Correspondence intended for each executive officer, Edward C. Johnson 3d, and Peter S. Lynch may be sent to Fidelity Investments, 82 Devonshire Street, Boston, Massachusetts 02109.
Name, Age; Principal Occupation |
Edward C. Johnson 3d (81) |
| Year of Election or Appointment: 2011 Member of the Advisory Board of Fidelity's Equity and High Income Funds. Mr. Johnson serves as Chief Executive Officer, Chairman, and a Director of FMR LLC, and also serves as Chairman and Director of FIL Limited. Previously, Mr. Johnson served as a Trustee and Chairman of the Board of certain Fidelity Trusts, Chairman and a Director of FMR, Chairman and a Director of FMR Co., Inc., and President of FMR LLC (2006-2007). |
Peter S. Lynch (67) |
| Year of Election or Appointment: 2003 Member of the Advisory Board of Fidelity's Equity and High Income Funds. Mr. Lynch is Vice Chairman and a Director of FMR and FMR Co., Inc. In addition, Mr. Lynch serves as a Trustee of Boston College and as the Chairman of the Inner-City Scholarship Fund. Previously, Mr. Lynch served on the Special Olympics International Board of Directors (1997-2006). |
Kenneth B. Robins (42) |
| Year of Election or Appointment: 2008 President and Treasurer of Fidelity's Equity and High Income Funds. Mr. Robins also serves as President and Treasurer (2010-present) and Assistant Treasurer (2009-present) of other Fidelity funds and is an employee of Fidelity Investments (2004-present). Previously, Mr. Robins served as Deputy Treasurer of the Fidelity funds (2005-2008) and Treasurer and Chief Financial Officer of The North Carolina Capital Management Trust: Cash and Term Portfolios (2006-2008). |
Bruce T. Herring (46) |
| Year of Election or Appointment: 2006 Vice President of certain Equity Funds. Mr. Herring also serves as Chief Investment Officer and Director of Fidelity Management & Research (U.K.) Inc. (2010-present) and Group Chief Investments Officer of FMR. Previously, Mr. Herring served as Vice President (2005-2006) and Senior Vice President (2006-2007) of Fidelity Management & Research Company, Vice President of FMR Co., Inc. (2001-2007) and as a portfolio manager for Fidelity U.S. Equity Funds. |
Brian B. Hogan (47) |
| Year of Election or Appointment: 2009 Vice President of Equity and High Income Funds. Mr. Hogan also serves as President of FMR's Equity Division (2009-present). Previously, Mr. Hogan served as Senior Vice President, Equity Research of FMR (2006-2009) and as a portfolio manager. |
Scott C. Goebel (43) |
| Year of Election or Appointment: 2008 Secretary and Chief Legal Officer (CLO) of the Fidelity funds. Mr. Goebel also serves as Secretary of Fidelity Investments Money Management, Inc. (FIMM) (2010-present) and Fidelity Research and Analysis Company (FRAC) (2010-present); Secretary and CLO of The North Carolina Capital Management Trust: Cash and Term Portfolios (2008-present); General Counsel, Secretary, and Senior Vice President of FMR (2008-present) and FMR Co., Inc. (2008-present); employed by FMR LLC or an affiliate (2001-present); Chief Legal Officer of Fidelity Management & Research (Hong Kong) Limited (2008-present) and Assistant Secretary of Fidelity Management & Research (Japan) Inc. (2008-present), and Fidelity Management & Research (U.K.) Inc. (2008-present). Previously, Mr. Goebel served as Assistant Secretary of FIMM (2008-2010), FRAC (2008-2010), and the Funds (2007-2008) and as Vice President and Secretary of Fidelity Distributors Corporation (FDC) (2005-2007). |
William C. Coffey (42) |
| Year of Election or Appointment: 2009 Assistant Secretary of Fidelity's Equity and High Income Funds. Mr. Coffey also serves as Senior Vice President and Deputy General Counsel of FMR LLC (2010-present), and is an employee of Fidelity Investments. Previously, Mr. Coffey served as Vice President and Associate General Counsel of FMR LLC (2005-2009). |
Holly C. Laurent (57) |
| Year of Election or Appointment: 2008 Anti-Money Laundering (AML) Officer of the Fidelity funds. Ms. Laurent also serves as AML Officer of The North Carolina Capital Management Trust: Cash and Term Portfolios (2008-present) and is an employee of Fidelity Investments. Previously, Ms. Laurent was Senior Vice President and Head of Legal for Fidelity Business Services India Pvt. Ltd. (2006-2008), and Senior Vice President, Deputy General Counsel and Group Head for FMR LLC (2005-2006). |
Christine Reynolds (53) |
| Year of Election or Appointment: 2008 Chief Financial Officer of the Fidelity funds. Ms. Reynolds became President of Fidelity Pricing and Cash Management Services (FPCMS) in August 2008. Ms. Reynolds served as Chief Operating Officer of FPCMS (2007-2008). Previously, Ms. Reynolds served as President, Treasurer, and Anti-Money Laundering officer of the Fidelity funds (2004-2007). |
Kenneth A. Rathgeber (64) |
| Year of Election or Appointment: 2004 Chief Compliance Officer of Fidelity's Equity and High Income Funds. Mr. Rathgeber is Chief Compliance Officer of Fidelity Management & Research (Hong Kong) Limited (2008-present), Fidelity Management & Research (Japan) Inc. (2008-present), FMR (2005-present), FMR Co., Inc. (2005-present), Fidelity Management & Research (U.K.) Inc. (2005-present), Fidelity Research & Analysis Company (2005-present), Fidelity Investments Money Management, Inc. (2005-present), Pyramis Global Advisors, LLC (2005-present), and Strategic Advisers, Inc. (2005-present). |
Jeffrey S. Christian (50) |
| Year of Election or Appointment: 2009 Deputy Treasurer of the Fidelity funds. Mr. Christian is an employee of Fidelity Investments. Previously, Mr. Christian served as Chief Financial Officer (2008-2009) of certain Fidelity funds and Senior Vice President of Fidelity Pricing and Cash Management Services (FPCMS) (2004-2009). |
Joseph F. Zambello (54) |
| Year of Election or Appointment: 2011 Deputy Treasurer of the Fidelity funds. Mr. Zambello is an employee of Fidelity Investments. Previously, Mr. Zambello served as Vice President of FMR's Program Management Group (2009-2011) and Vice President of the Transfer Agent Oversight Group (2005-2009). |
Adrien E. Deberghes (44) |
| Year of Election or Appointment: 2008 Deputy Treasurer of Fidelity's Equity and High Income Funds. Mr. Deberghes also serves as Vice President and Assistant Treasurer of Fidelity Rutland Square Trust II and Fidelity Commonwealth Trust II (2011-present), Assistant Treasurer of other Fidelity funds (2010-present), and is an employee of Fidelity Investments (2008-present). Previously, Mr. Deberghes served as Senior Vice President of Mutual Fund Administration at State Street Corporation (2007-2008), Senior Director of Mutual Fund Administration at Investors Bank & Trust (2005-2007), and Director of Finance for Dunkin' Brands (2000-2005). |
Stephanie J. Dorsey (42) |
| Year of Election or Appointment: 2010 Assistant Treasurer of Fidelity's Equity and High Income Funds. Ms. Dorsey also serves as Deputy Treasurer of other Fidelity funds (2008-present) and is an employee of Fidelity Investments (2008-present). Previously, Ms. Dorsey served as Treasurer (2004-2008) of the JPMorgan Mutual Funds and Vice President (2004-2008) of JPMorgan Chase Bank. |
John R. Hebble (53) |
| Year of Election or Appointment: 2009 Assistant Treasurer of Fidelity's Equity and High Income Funds. Mr. Hebble also serves as President (2011-present), Treasurer, and Chief Financial Officer of The North Carolina Capital Management Trust: Cash and Term Portfolios (2008-present), President and Treasurer of other Fidelity funds (2008-present) and is an employee of Fidelity Investments. |
Gary W. Ryan (53) |
| Year of Election or Appointment: 2005 Assistant Treasurer of the Fidelity funds. Mr. Ryan is an employee of Fidelity Investments. Previously, Mr. Ryan served as Vice President of Fund Reporting in Fidelity Pricing and Cash Management Services (FPCMS) (1999-2005). |
Jonathan Davis (43) |
| Year of Election or Appointment: 2010 Assistant Treasurer of the Fidelity funds. Mr. Davis is also Assistant Treasurer of Fidelity Rutland Square Trust II and Fidelity Commonwealth Trust II. Mr. Davis is an employee of Fidelity Investments. Previously, Mr. Davis served as Vice President and Associate General Counsel of FMR LLC (2003-2010). |
Annual Report
Institutional Class designates 100% of the dividends distributed during the fiscal year as amounts which may be taken into account as a dividend for purposes of the maximum rate under section 1(h)(11) of the Internal Revenue Code.
The amounts per share which represent income derived from sources within, and taxes paid to, foreign countries or possessions of the United States are as follows:
| Pay Date | Income | Taxes |
Class I | 12/06/10 | $0.118 | $0.0308 |
The fund will notify shareholders in January 2012 of amounts for use in preparing 2011 income tax returns.
Annual Report
Board Approval of Investment Advisory Contracts and Management Fees
Fidelity Advisor Europe Capital Appreciation Fund
Each year, the Board of Trustees, including the Independent Trustees (together, the Board), votes on the renewal of the management contract and sub-advisory agreements (together, the Advisory Contracts) for the fund. The Board, assisted by the advice of fund counsel and Independent Trustees' counsel, requests and considers a broad range of information relevant to the renewal of the Advisory Contracts throughout the year.
The Board meets regularly and considers at each of its meetings factors that are relevant to its annual consideration of the renewal of the fund's Advisory Contracts, including the services and support provided to the fund and its shareholders. The Board has established various standing committees, each composed of Independent Trustees with varying backgrounds, to which the Board has assigned specific subject matter responsibilities in order to enhance effective decision-making by the Board. The Board, acting directly and through its Committees, requests and receives information concerning the annual consideration of the renewal of the fund's Advisory Contracts. The Board also meets as needed to consider matters specifically related to the Board's annual consideration of the renewal of Advisory Contracts. Members of the Board may also meet with trustees of other Fidelity funds through ad hoc joint committees to discuss certain matters relevant to the Fidelity funds.
At its July 2011 meeting, the Board of Trustees, including the Independent Trustees, unanimously determined to renew the fund's Advisory Contracts. In reaching its determination, the Board considered all factors it believed relevant, including (i) the nature, extent, and quality of the services to be provided to the fund and its shareholders (including the investment performance of the fund); (ii) the competitiveness of the fund's management fee and total expense ratio; (iii) the total costs of the services to be provided by and the profits to be realized by Fidelity from its relationship with the fund; (iv) the extent to which economies of scale would be realized as the fund grows; and (v) whether fee levels reflect these economies of scale, if any, for the benefit of fund shareholders.
In considering whether to renew the Advisory Contracts for the fund, the Board reached a determination, with the assistance of fund counsel and Independent Trustees' counsel and through the exercise of its business judgment, that the renewal of the Advisory Contracts is in the best interests of the fund and its shareholders and that the compensation payable under the Advisory Contracts is fair and reasonable. The Board's decision to renew the Advisory Contracts was not based on any single factor, but rather was based on a comprehensive consideration of all the information provided to the Board at its meetings throughout the year. The Board, in reaching its determination to renew the Advisory Contracts, is aware that shareholders in the fund have a broad range of investment choices available to them, including a wide choice among mutual funds offered by Fidelity's competitors, and that the fund's shareholders, who have the opportunity to review and weigh the disclosure provided by the fund in its prospectus and other public disclosures, have chosen to invest in this fund, managed by Fidelity.
Annual Report
Nature, Extent, and Quality of Services Provided. The Board considered the staffing within the investment adviser, FMR, and the sub-advisers (together, the Investment Advisers), including the backgrounds of the fund's investment personnel and the fund's investment objective and discipline. The Independent Trustees also had discussions with senior management of Fidelity's investment operations and investment groups. The Board considered the structure of the portfolio manager compensation program and whether this structure provides appropriate incentives to act in the best interests of the fund.
Resources Dedicated to Investment Management and Support Services. The Board and the Fund Oversight and Research Committees reviewed the general qualifications and capabilities of the Investment Advisers' investment staff, including its size, education, experience, and resources, as well as the Investment Advisers' approach to recruiting, training, managing, and compensating investment personnel. The Board also noted that FMR has devoted increased resources to non-U.S. offices. The Board noted that Fidelity's analysts have extensive resources, tools and capabilities which allow them to conduct sophisticated quantitative and fundamental analysis, as well as credit analysis of issuers, counterparties and enhancers. The Board also believes that Fidelity's investment professionals have sufficient access to global information and data so as to provide competitive investment results over time, and that those professionals also have access to sophisticated tools which permit them to assess portfolio construction and risk and performance attribution characteristics continuously, as well as to transmit new information and research conclusions rapidly around the world. Additionally, in their deliberations, the Board considered the Investment Advisers' trading capabilities and resources which are an integral part of the investment management process.
Shareholder and Administrative Services. The Board considered (i) the nature, extent, quality, and cost of advisory, administrative, and shareholder services performed by the Investment Advisers and their affiliates under the Advisory Contracts and under separate agreements covering transfer agency, pricing and bookkeeping, and securities lending services for the fund; (ii) the nature and extent of the investment adviser's supervision of third party service providers, principally custodians and subcustodians; and (iii) the resources devoted to, and the record of compliance with, the fund's compliance policies and procedures. The Board also reviewed the allocation of fund brokerage, including allocations to brokers affiliated with the Investment Advisers, the use of brokerage commissions to pay fund expenses, and the use of "soft" commission dollars to pay for research services.
The Board noted that the growth of fund assets over time across the complex allows Fidelity to reinvest in the development of services designed to enhance the value or convenience of the Fidelity funds as investment vehicles. These services include 24-hour access to account information and market information through telephone representatives and over the Internet, investor education materials and asset allocation tools, and the expanded availability of Fidelity Investor Centers, with 35 new branches opening since 2010.
Annual Report
Board Approval of Investment Advisory Contracts and
Management Fees - continued
Investment in a Large Fund Family. The Board considered the benefits to shareholders of investing in a Fidelity fund, including the benefits of investing in a fund that is part of a large family of funds offering a variety of investment disciplines and providing a large variety of mutual fund investor services. The Board noted that Fidelity had taken, or had made recommendations that resulted in the Fidelity funds taking, a number of actions over the previous year that benefited particular funds, including (i) continuing to dedicate additional resources to investment research and support of the senior management team that oversees asset management; (ii) rationalizing product lines through the mergers of six funds into other funds; (iii) continuing to migrate the Freedom Funds to dedicated lower cost underlying funds; (iv) obtaining shareholder approval to broaden the investment strategies for Fidelity Consumer Finance Portfolio, Fidelity Emerging Asia Fund, and Fidelity Environment and Alternative Energy Portfolio; (v) contractually agreeing to reduce the management fees and impose other expense limitations on Spartan 500 Index Fund and U.S. Bond Index Fund in connection with launching new institutional classes of these funds; (vi) changing the name, primary and supplemental benchmarks, and investment policies of Fidelity Global Strategies Fund to support the fund's flexible investment mandate and global orientation; and (vii) reducing the transfer agency account fee rates on certain accounts.
Investment Performance. The Board considered whether the fund has operated in accordance with its investment objective, as well as its record of compliance with its investment restrictions. It also reviewed the fund's absolute investment performance for each class, as well as the fund's relative investment performance for each class measured over multiple periods against (i) a broad-based securities market index, and (ii) a peer group of mutual funds deemed appropriate by Fidelity and reviewed by the Board. The following charts considered by the Board show, over the one-, three-, and five-year periods ended December 31, 2010, the cumulative total returns of Institutional Class (Class I) and Class C of the fund, the cumulative total returns of a broad-based securities market index ("benchmark"), and a range of cumulative total returns of a peer group of mutual funds identified by Morningstar, Inc. as having an investment style similar to that of the fund based on underlying portfolio holdings. The returns of Institutional Class (Class I) and Class C show the performance of the highest and lowest performing classes, respectively (based on five-year performance). The box within each chart shows the 25th percentile return (bottom of box) and the 75th percentile return (top of box) of the peer group. Returns shown above the box are in the first quartile and returns shown below the box are in the fourth quartile. The percentage beaten numbers noted below each chart correspond to the percentile box and represent the percentage of funds in the peer group whose performance was equal to or lower than that of the class indicated.
Annual Report
Advisor Europe Capital Appreciation Fund
The Board reviewed the fund's relative investment performance against its peer group and noted that the performance of Institutional Class (Class I) of the fund was in the third quartile for all the periods shown. The Board also noted that the investment performance of the fund was lower than its benchmark for the three- and five-year periods, although the one-year total return of Institutional Class (Class I) compared favorably to its benchmark. The Board considered that the variations in performance among the fund's classes reflect the variations in class expenses, which result in lower performance for higher expense classes. The Board discussed with FMR actions that have been taken by FMR to improve the fund's disappointing performance relative to its peer group. The Board also reviewed the fund's performance since inception as well as performance in the current year. The Board will continue to closely monitor the performance of the fund in the coming year and discuss with FMR other appropriate actions to address the performance of the fund.
Based on its review, the Board concluded that the nature, extent, and quality of services provided to the fund under the Advisory Contracts should benefit the fund's shareholders.
Competitiveness of Management Fee and Total Expense Ratio. The Board considered the fund's management fee and total expense ratio compared to "mapped groups" of competitive funds and classes. Fidelity creates "mapped groups" by combining similar Lipper investment objective categories that have comparable management fee characteristics. Combining Lipper investment objective categories aids the Board's management fee and total expense ratio comparisons by broadening the competitive group used for comparison and by reducing the number of universes to which various Fidelity funds are compared.
Annual Report
Board Approval of Investment Advisory Contracts and
Management Fees - continued
Management Fee. The Board considered two proprietary management fee comparisons for the 12-month periods shown in the chart below. The group of Lipper funds used by the Board for management fee comparisons is referred to below as the "Total Mapped Group." The Total Mapped Group comparison focuses on a fund's standing relative to the total universe of comparable funds available to investors in terms of gross management fees before expense reimbursements or caps. "TMG %" represents the percentage of funds in the Total Mapped Group that had management fees that were lower than the fund's. For example, a TMG % of 16% means that 84% of the funds in the Total Mapped Group had higher management fees than the fund. The "Asset-Size Peer Group" (ASPG) comparison focuses on a fund's standing relative to non-Fidelity funds similar in size to the fund within the Total Mapped Group. The ASPG represents at least 15% of the funds in the Total Mapped Group with comparable asset size and management fee characteristics, subject to a minimum of 50 funds (or all funds in the Total Mapped Group if fewer than 50). Additional information, such as the ASPG quartile in which the fund's management fee ranked, is also included in the chart and considered by the Board.
Advisor Europe Capital Appreciation Fund

The Board noted that the fund's management fee ranked below the median of its Total Mapped Group and below the median of its ASPG for 2010.
Annual Report
Based on its review, the Board concluded that the fund's management fee is fair and reasonable in light of the services that the fund receives and the other factors considered.
Total Expense Ratio. In its review of each class's total expense ratio, the Board considered the fund's management fee as well as other fund or class expenses, as applicable, such as transfer agent fees, pricing and bookkeeping fees, fund-paid 12b-1 fees, and custodial, legal, and audit fees. The Board also noted the effects of any waivers and reimbursements on fees and expenses. As part of its review, the Board also considered the current and historical total expense ratios of each class of the fund compared to competitive fund median expenses. Each class of the fund is compared to those funds and classes in the Total Mapped Group (used by the Board for management fee comparisons) that have a similar sales load structure.
The Board noted that the total expense ratio of each of Class A and Class B ranked below its competitive median for 2010, the total expense ratio of Class C ranked equal to its competitive median for 2010, and the total expense ratio of each of Class T and Institutional Class ranked above its competitive median for 2010. The Board considered that various factors, including 12b-1 fees, positive or negative performance adjustments, and relatively higher other expenses in the case of small fund size, can affect total expense ratios. The Board noted that the total expense ratio of Class T was above the competitive median primarily because of higher 12b-1 fees on Class T. Class T has a higher 12b-1 fee, but a lower front-end sales charge, than traditionally priced front-end sales charge classes. The Board noted that the fund offers multiple classes, each of which has a different sales load and 12b-1 fee structure, and that the multiple structures are intended to offer a range of pricing options for the intermediary market. The Board also noted that the total expense ratios of the classes vary primarily by the level of their 12b-1 fees, although differences in transfer agent fees may also cause expenses to vary from class to class.
Fees Charged to Other Fidelity Clients. The Board also considered Fidelity fee structures and other information with respect to clients of FMR and its affiliates, such as other mutual funds advised or subadvised by FMR or its affiliates, pension plan clients, and other institutional clients. In March 2010, the Board created an ad hoc joint committee with the board of other Fidelity funds (the Committee) to review and compare Fidelity's institutional investment advisory business with its business of providing services to the Fidelity funds, including the differences in services provided, fees charged, and costs incurred, as well as competition in their respective marketplaces.
Based on its review of total expense ratios and fees charged to other Fidelity clients, the Board concluded that the total expense ratio of each class of the fund was reasonable, although in some cases above the median of the universe presented for comparison, in light of the services that the fund and its shareholders receive and the other factors considered, including the findings of the Committee.
Annual Report
Board Approval of Investment Advisory Contracts and
Management Fees - continued
Costs of the Services and Profitability. The Board considered the revenues earned and the expenses incurred by Fidelity in conducting the business of developing, marketing, distributing, managing, administering and servicing the fund and its shareholders. The Board also considered the level of Fidelity's profits in respect of all the Fidelity funds.
On an annual basis, FMR presents to the Board Fidelity's profitability for the fund. Fidelity calculates the profitability for each fund, as well as aggregate profitability for groups of Fidelity funds and all Fidelity funds, using a series of detailed revenue and cost allocation methodologies which originate with the books and records of Fidelity on which Fidelity's audited financial statements are based. The Audit Committee of the Board reviews any significant changes from the prior year's methodologies.
PricewaterhouseCoopers LLP (PwC), independent registered public accounting firm and auditor to Fidelity and certain Fidelity funds, has been engaged annually by the Board as part of the Board's assessment of Fidelity's profitability analysis. PwC's engagement includes the review and assessment of Fidelity's methodologies used in determining the revenues and expenses attributable to Fidelity's mutual fund business, and completion of agreed-upon procedures surrounding the mathematical accuracy of fund profitability and its conformity to allocation methodologies. After considering PwC's reports issued under the engagement and information provided by Fidelity, the Board concluded that while other allocation methods may also be reasonable, Fidelity's profitability methodologies are reasonable in all material respects.
The Board also reviewed Fidelity's non-fund businesses and fall-out benefits related to the mutual fund business as well as cases where Fidelity's affiliates may benefit from or be related to the fund's business.
The Board considered the costs of the services provided by and the profits realized by Fidelity in connection with the operation of the fund and was satisfied that the profitability was not excessive in the circumstances.
Economies of Scale. The Board considered whether there have been economies of scale in respect of the management of the Fidelity funds, whether the Fidelity funds (including the fund) have appropriately benefited from any such economies of scale, and whether there is potential for realization of any further economies of scale. The Board considered the extent to which the fund will benefit from economies of scale through increased services to the fund, through waivers or reimbursements, or through fee or expense reductions. The Board also noted that in 2009, it and the board of other Fidelity funds created an ad hoc committee (the Economies of Scale Committee) to analyze whether FMR attains economies of scale in respect of the management and servicing of the Fidelity funds, whether the Fidelity funds have appropriately benefited from such economies of scale, and whether there is potential for realization of any further economies of scale.
Annual Report
The Board recognized that the fund's management contract incorporates a "group fee" structure, which provides for lower group fee rates as total fund assets under FMR's management increase, and for higher group fee rates as total fund assets under FMR's management decrease. FMR calculates the group fee rates based on a tiered asset "breakpoint" schedule that varies based on asset class. The Board considered that the group fee is designed to deliver the benefits of economies of scale to fund shareholders when total Fidelity fund assets increase, even if assets of any particular fund are unchanged or have declined, because some portion of Fidelity's costs are attributable to services provided to all Fidelity funds, and all funds benefit if those costs can be allocated among more assets. The Board concluded that, given the group fee structure, fund shareholders will benefit from lower management fees as assets under FMR's management increase at the fund complex level, regardless of whether Fidelity achieves any such economies of scale.
The Board concluded, taking into account the analysis of the Economies of Scale Committee, that any potential economies of scale are being appropriately shared between fund shareholders and Fidelity.
Additional Information Requested by the Board. In order to develop fully the factual basis for consideration of the Fidelity funds' Advisory Contracts, the Board requested and received additional information on certain topics, including (i) fund performance trends, actions to be taken by FMR to improve certain funds' overall performance, and Fidelity's long-term strategies for certain funds; (ii) portfolio manager changes that have occurred during the past year and length of portfolio manager tenure for different categories of funds over time; (iii) Fidelity's compensation structure for portfolio managers and other key personnel and strategies for attracting and retaining non-investment personnel; (iv) the amount of the investment that each portfolio manager has made in the Fidelity fund(s) that he or she manages; (v) historical trends in Fidelity's realization of fall-out benefits; (vi) Fidelity's group fee structures and the rationale for the individual fee rates of certain funds; (vii) fund profitability methodology and the impact of certain factors on fund profitability results; (viii) trends regarding industry use of performance fee structures and Fidelity's compliance practices with respect to performance adjustment calculations; (ix) the fee structures in place for certain other Fidelity clients; and (x) explanations regarding the relative total expense ratios of certain funds and classes, total expense competitive trends, and actions that might be taken by FMR to reduce total expense ratios for certain funds and classes.
Annual Report
Board Approval of Investment Advisory Contracts and
Management Fees - continued
Based on its evaluation of all of the conclusions noted above, and after considering all factors it believed relevant, the Board ultimately concluded that the advisory fee structures are fair and reasonable, and that the fund's Advisory Contracts should be renewed.
Annual Report
Investment Adviser
Fidelity Management & Research Company
Boston, MA
Investment Sub-Advisers
FMR Co., Inc.
Fidelity Management & Research
(U.K.) Inc.
FIL Investment Advisors
FIL Investment Advisors (U.K.) Limited
Fidelity Management & Research
(Hong Kong) Limited
Fidelity Management & Research
(Japan) Inc.
General Distributor
Fidelity Distributors Corporation
Boston, MA
Transfer and Service Agents
Fidelity Investments Institutional Operations Company, Inc.
Boston, MA
Fidelity Service Company, Inc.
Boston, MA
Custodian
State Street Bank and Trust Company
Quincy, MA
AEURI-UANN-1211
1.784740.108
(Fidelity Investment logo)(registered trademark)
Fidelity Advisor®
Global Capital Appreciation
Fund - Class A, Class T, Class B
and Class C
Annual Report
October 31, 2011

Contents
Chairman's Message | (Click Here) | The Chairman's message to shareholders. |
Performance | (Click Here) | How the fund has done over time. |
Management's Discussion of Fund Performance | (Click Here) | The Portfolio Manager's review of fund performance and strategy. |
Shareholder Expense Example | (Click Here) | An example of shareholder expenses. |
Investment Changes | (Click Here) | A summary of major shifts in the fund's investments over the past six months. |
Investments | (Click Here) | A complete list of the fund's investments with their market values. |
Financial Statements | (Click Here) | Statements of assets and liabilities, operations, and changes in net assets, as well as financial highlights. |
Notes | (Click Here) | Notes to financial statements. |
Report of Independent Registered Public Accounting Firm | (Click Here) | |
Trustees and Officers | (Click Here) | |
Distributions | (Click Here) | |
Board Approval of Investment Advisory Contracts and Management Fees | (Click Here) | |
To view a fund's proxy voting guidelines and proxy voting record for the 12-month period ended June 30, visit http://www.fidelity.com/proxyvotingresults or visit the Securities and Exchange Commission's (SEC) web site at http://www.sec.gov. You may also call 1-877-208-0098 to request a free copy of the proxy voting guidelines.
Standard & Poor's, S&P and S&P 500 are registered service marks of The McGraw-Hill Companies, Inc. and have been licensed for use by Fidelity Distributors Corporation.
Other third party marks appearing herein are the property of their respective owners.
All other marks appearing herein are registered or unregistered trademarks or service marks of FMR LLC or an affiliated company.
Annual Report
This report and the financial statements contained herein are submitted for the general information of the shareholders of the fund. This report is not authorized for distribution to prospective investors in the fund unless preceded or accompanied by an effective prospectus.
A fund files its complete schedule of portfolio holdings with the SEC for the first and third quarters of each fiscal year on Form N-Q. Forms N-Q are available on the SEC's web site at http://www.sec.gov. A fund's Forms N-Q may be reviewed and copied at the SEC's Public Reference Room in Washington, DC. Information regarding the operation of the SEC's Public Reference Room may be obtained by calling 1-800-SEC-0330. For a complete list of a fund's portfolio holdings, view the most recent holdings listing, semiannual report, or annual report on Fidelity's web site at http://www.fidelity.com, http://www.advisor.fidelity.com, or http://www.401k.com, as applicable.
NOT FDIC INSURED • MAY LOSE VALUE • NO BANK GUARANTEE
Neither the fund nor Fidelity Distributors Corporation is a bank.
Annual Report
(photo_of_James_C_Curvey)
Dear Shareholder:
Global equity markets began the fourth quarter on a strong note, sharply reversing course in October amid strong corporate earnings, better-than-expected economic news and the promise of a resolution to the sovereign debt crisis in Europe. The mini rally followed a third quarter marked by a significant downturn in July and August, which heightened investor anxiety and set off a wave of volatility that hampered most major asset classes through the end of September. Financial markets are difficult to predict, of course, but you can help put the odds in your favor by following these time-tested investment principles.
One of the basic tenets is to invest according to your time horizon. For long-term investors, riding out the markets' inevitable ups and downs has proven much more effective than making decisions based on short-term developments. If your goal is approaching, you can also benefit from patience and restraint, rather than attempting to time the market. No matter your time horizon, missing only a few of the markets' best days can significantly diminish returns. Patience also affords the benefits of compounding - earning interest on additional income or reinvested dividends and capital gains. While staying the course doesn't eliminate risk, it can considerably lessen the negative impact of short-term downturns.
Asset allocation is another principle to manage risk. As you spread your portfolio among the asset classes, be sure to consider your time horizon, risk tolerance and investment objectives. Younger investors may be better served by emphasizing equities, which historically have been the best-performing asset class over time. Investors who are nearing a specific goal, such as retirement or sending a child to college, may choose to favor bonds and other investments that have tended to be more stable. Studies indicate that asset allocation is the single most important determinant of a portfolio's long-term success. After deciding on a suitable allocation strategy, make sure your portfolio is adequately diversified, with exposure to stocks of small-, mid- and large-cap companies in a range of sectors, for example. And today, more than ever, geographic diversification should be taken into account.
Lastly, investing a certain amount of money on a regular basis - a principle known as dollar-cost averaging - can help lower the average cost of your purchases, while also giving you the discipline to avoid selling weak performers just prior to an upswing, or chasing a hot performer just before a correction.
We invite you to learn more by visiting us on the Internet, dropping by one of our Investor Centers or calling us by phone. It is our privilege to provide the resources you need to choose investments that are right for you.
Sincerely,
(The acting chairman's signature appears here.)
James C. Curvey
Acting Chairman
Annual Report
Average annual total return reflects the change in the value of an investment, assuming reinvestment of the class' distributions from dividend income and capital gains (the profits earned upon the sale of securities that have grown in value, if any) and assuming a constant rate of performance each year. The $10,000 table and the fund's returns do not reflect the deduction of taxes that a shareholder would pay on fund distributions or the redemption of fund shares. During periods of reimbursement by Fidelity, a fund's total return will be greater than it would be had the reimbursement not occurred. How a fund did yesterday is no guarantee of how it will do tomorrow. Returns reflect the conversion of Class B shares to Class A shares after a maximum of seven years.
Average Annual Total Returns
Periods ended October 31, 2011 | Past 1
year | Past 5
years | Past 10
years |
Class A (incl. 5.75% sales charge) | -20.65% | -3.88% | 2.27% |
Class T (incl. 3.50% sales charge) | -18.91% | -3.66% | 2.26% |
Class B (incl. contingent deferred sales charge)A | -20.60% | -3.76% | 2.36% |
Class C (incl. contingent deferred sales charge)B | -17.22% | -3.47% | 2.11% |
A Class B shares' contingent deferred sales charges included in the past one year, past five years, and past ten years total return figures are 5%, 2%, and 0%, respectively.
B Class C shares' contingent deferred sales charges included in the past one year, past five years, and past ten years total return figures are 1%, 0%, and 0%, respectively.
Annual Report
$10,000 Over 10 Years
Let's say hypothetically that $10,000 was invested in Fidelity Advisor® Global Capital Appreciation Fund - Class A on October 31, 2001, and the current 5.75% sales charge was paid. The chart shows how the value of your investment would have changed, and also shows how the MSCI® ACWI® (All Country World Index) Index performed over the same period.

Annual Report
Market Recap: Global equities were rocked by a number of headline events during the year ending October 31, 2011. Stocks posted a solid advance for the first half of the period, despite concern about sovereign debt in Europe, a devastating earthquake/tsunami in Japan, and political upheaval in the Middle East and North Africa. Sentiment turned decidedly negative in the second half, however, as fresh worries about Europe, inflation in China, gridlock over raising the debt ceiling in the U.S. - along with Standard & Poor's downgrade of the nation's long-term sovereign credit rating - and a dimmed outlook for global growth caused markets to suffer declines that intensified in August and September. October brought with it yet another dramatic swing, as better-than-expected U.S. economic data and prospects for a resolution to the European debt debacle prompted buyers to storm back onto the scene in search of bargains. Those gains - along with favorable currency fluctuations overall - helped lift the MSCI® ACWI® (All Country World Index) Index 0.75% for the year. Within the index, Europe and emerging markets declined the most, with many countries in these areas sustaining steep losses. By contrast, the U.S. (+8%), which dominates the index, delivered a positive result, as did Australia (+4%) and Switzerland (+3%). Japan showed resilience in the wake of its natural disasters, falling only 2%.
Comments from Thomas Allen, Portfolio Manager of Fidelity Advisor® Global Capital Appreciation Fund: During the year, the fund's Class A, Class T, Class B and Class C shares returned -15.81%, -15.97%, -16.42% and -16.38%, respectively (excluding sales charges), significantly lagging the MSCI index. Stock selection in health care curbed relative performance the most. Stock picking in information technology and financials, together with positioning in energy and consumer staples, also hurt. The largest detractor by a wide margin was Nanosphere, which executed poorly when rolling out its genomic and protein testing equipment. The fund also was hurt by Longtop Financial Technologies, a Chinese software firm, and Corning, a maker of glass panels for televisions and personal computers. Conversely, stock picking among retailers was a positive, along with overweighting software/services and having little exposure to banks. Geographically, stock selection in Japan contributed significantly. The fund's top-three relative contributors were Japan-based: eyewear retailer Megane Top, price comparison portal Kakaku.com and M3, a supplier of data for physicians. All of the stocks I've mentioned in this report, except for Corning, were not part of the index. Longtop was not held by the fund at period end.
The views expressed above reflect those of the portfolio manager(s) only through the end of the period as stated on the cover of this report and do not necessarily represent the views of Fidelity or any other person in the Fidelity organization. Any such views are subject to change at any time based upon market or other conditions and Fidelity disclaims any responsibility to update such views. These views may not be relied on as investment advice and, because investment decisions for a Fidelity fund are based on numerous factors, may not be relied on as an indication of trading intent on behalf of any Fidelity fund.
Annual Report
Shareholder Expense Example
As a shareholder of the Fund, you incur two types of costs: (1) transaction costs, including sales charges (loads) on purchase payments or redemption proceeds, redemption fees, and (2) ongoing costs, including management fees, distribution and/or service (12b-1) fees and other Fund expenses. This Example is intended to help you understand your ongoing costs (in dollars) of investing in the Fund and to compare these costs with the ongoing costs of investing in other mutual funds.
The Example is based on an investment of $1,000 invested at the beginning of the period and held for the entire period (May 1, 2011 to October 31, 2011).
Actual Expenses
The first line of the accompanying table for each class of the Fund provides information about actual account values and actual expenses. You may use the information in this line, together with the amount you invested, to estimate the expenses that you paid over the period. Simply divide your account value by $1,000.00 (for example, an $8,600 account value divided by $1,000.00 = 8.6), then multiply the result by the number in the first line for a class of the Fund under the heading entitled "Expenses Paid During Period" to estimate the expenses you paid on your account during this period. In addition, the Fund, as a shareholder in the underlying Fidelity Central Funds, will indirectly bear its pro-rata share of the fees and expenses incurred by the underlying Fidelity Central Funds. These fees and expenses are not included in the Fund's annualized expense ratio used to calculate the expense estimate in the table below.
Hypothetical Example for Comparison Purposes
The second line of the accompanying table for each class of the Fund provides information about hypothetical account values and hypothetical expenses based on a Class' actual expense ratio and an assumed rate of return of 5% per year before expenses, which is not the Class' actual return. The hypothetical account values and expenses may not be used to estimate the actual ending account balance or expenses you paid for the period. You may use this information to compare the ongoing costs of investing in the Fund and other funds. To do so, compare this 5% hypothetical example with the 5% hypothetical examples that appear in the shareholder reports of the other funds. In addition, the Fund, as a shareholder in the underlying Fidelity Central Funds, will indirectly bear its pro-rata share of the fees and expenses incurred by the underlying Fidelity Central Funds. These fees and expenses are not included in the Fund's annualized expense ratio used to calculate the expense estimate in the table below.
Please note that the expenses shown in the table are meant to highlight your ongoing costs only and do not reflect any transaction costs. Therefore, the second line of the table is useful in comparing ongoing costs only, and will not help you determine the relative total costs of owning different funds. In addition, if these transactional costs were included, your costs would have been higher.
Annual Report
| Annualized
Expense Ratio | Beginning
Account Value
May 1, 2011 | Ending
Account Value
October 31, 2011 | Expenses Paid
During Period*
May 1, 2011 to
October 31, 2011 |
Class A | 1.45% | | | |
Actual | | $ 1,000.00 | $ 842.70 | $ 6.73 |
HypotheticalA | | $ 1,000.00 | $ 1,017.90 | $ 7.38 |
Class T | 1.70% | | | |
Actual | | $ 1,000.00 | $ 841.30 | $ 7.89 |
HypotheticalA | | $ 1,000.00 | $ 1,016.64 | $ 8.64 |
Class B | 2.20% | | | |
Actual | | $ 1,000.00 | $ 839.00 | $ 10.20 |
HypotheticalA | | $ 1,000.00 | $ 1,014.12 | $ 11.17 |
Class C | 2.20% | | | |
Actual | | $ 1,000.00 | $ 838.90 | $ 10.20 |
HypotheticalA | | $ 1,000.00 | $ 1,014.12 | $ 11.17 |
Institutional Class | 1.14% | | | |
Actual | | $ 1,000.00 | $ 843.20 | $ 5.30 |
HypotheticalA | | $ 1,000.00 | $ 1,019.46 | $ 5.80 |
A 5% return per year before expenses
* Expenses are equal to each Class' annualized expense ratio, multiplied by the average account value over the period, multiplied by 184/365 (to reflect the one-half year period).
Annual Report
Investment Changes (Unaudited)
Top Five Stocks as of October 31, 2011 |
| % of fund's
net assets | % of fund's net assets
6 months ago |
Google, Inc. Class A (United States of America, Internet Software & Services) | 4.6 | 3.5 |
Royal Dutch Shell PLC Class B sponsored ADR (United Kingdom, Oil, Gas & Consumable Fuels) | 4.3 | 3.0 |
MasterCard, Inc. Class A (United States of America, IT Services) | 3.9 | 0.6 |
Copa Holdings SA Class A (Panama, Airlines) | 3.9 | 3.1 |
Kakaku.com, Inc. (Japan, Internet Software & Services) | 3.7 | 1.5 |
| 20.4 | |
Top Five Market Sectors as of October 31, 2011 |
| % of fund's
net assets | % of fund's net assets
6 months ago |
Information Technology | 32.3 | 30.8 |
Consumer Discretionary | 18.2 | 16.1 |
Health Care | 14.8 | 19.1 |
Energy | 9.4 | 12.1 |
Financials | 9.2 | 7.9 |
Top Five Countries as of October 31, 2011 |
(excluding cash equivalents) | % of fund's
net assets | % of fund's net assets
6 months ago |
United States of America | 35.1 | 38.4 |
India | 16.5 | 18.7 |
Japan | 14.4 | 9.8 |
Canada | 5.5 | 7.0 |
United Kingdom | 5.4 | 4.2 |
Percentages are adjusted for the effect of open futures contracts, if applicable. |
Asset Allocation (% of fund's net assets) |
As of October 31, 2011 | As of April 30, 2011 |
 | Stocks 98.0% | | | Stocks 98.2% | |
 | Short-Term
Investments and
Net Other Assets 2.0% | | | Short-Term
Investments and
Net Other Assets 1.8% | |

Annual Report
Investments October 31, 2011
Showing Percentage of Net Assets
Common Stocks - 98.0% |
| Shares | | Value |
Australia - 1.2% |
carsales.com Ltd. (d) | 205,327 | | $ 1,061,541 |
Newcrest Mining Ltd. | 6,393 | | 225,962 |
TOTAL AUSTRALIA | | 1,287,503 |
Bailiwick of Jersey - 0.0% |
Velti PLC (a) | 3,750 | | 31,575 |
Bermuda - 2.5% |
CNPC (Hong Kong) Ltd. | 74,000 | | 103,658 |
Fairwood Holdings Ltd. | 443,500 | | 577,654 |
Invesco Ltd. | 19,300 | | 387,351 |
Luk Fook Holdings International Ltd. | 275,000 | | 1,179,035 |
Marvell Technology Group Ltd. (a) | 20,700 | | 289,593 |
TOTAL BERMUDA | | 2,537,291 |
Brazil - 0.9% |
Amil Participacoes SA | 7,700 | | 77,888 |
Drogasil SA | 100 | | 629 |
Marisa Lojas SA | 100 | | 1,380 |
Porto Seguro SA | 16,600 | | 177,871 |
Tegma Gestao Logistica | 20,600 | | 267,517 |
Totvs SA | 24,300 | | 403,302 |
TOTAL BRAZIL | | 928,587 |
Canada - 5.5% |
Barrick Gold Corp. | 69,700 | | 3,440,775 |
Bellhaven Copper & Gold, Inc. (a) | 832,000 | | 484,085 |
Canadian Natural Resources Ltd. | 3,200 | | 112,868 |
Carpathian Gold, Inc. (a) | 2,543,500 | | 1,097,161 |
Petrobank Energy & Resources Ltd. | 16,400 | | 147,573 |
Petrominerales Ltd. | 1,044 | | 27,544 |
Peyto Exploration & Development Corp. | 100 | | 2,182 |
PHX Energy Services Corp. | 9,200 | | 94,598 |
SunOpta, Inc. (a) | 11,500 | | 60,030 |
Talisman Energy, Inc. | 12,500 | | 177,309 |
TOTAL CANADA | | 5,644,125 |
Cayman Islands - 0.9% |
Biostime International Holdings Ltd. | 60,000 | | 106,997 |
Daphne International Holdings Ltd. | 190,000 | | 198,504 |
Shenguan Holdings Group Ltd. | 422,000 | | 226,722 |
Common Stocks - continued |
| Shares | | Value |
Cayman Islands - continued |
Shenzhou International Group Holdings Ltd. | 297,000 | | $ 382,070 |
SITC International Holdings Co. Ltd. | 113,000 | | 29,188 |
TOTAL CAYMAN ISLANDS | | 943,481 |
Denmark - 0.1% |
Carlsberg A/S Series B | 1,100 | | 74,878 |
Finland - 0.0% |
Nokian Tyres PLC | 600 | | 22,046 |
France - 1.8% |
1000mercis | 2,800 | | 154,609 |
Edenred | 9,600 | | 272,352 |
Maisons France Confort | 28,700 | | 1,028,694 |
Ubisoft Entertainment SA (a) | 62,564 | | 377,845 |
TOTAL FRANCE | | 1,833,500 |
Hong Kong - 0.5% |
AIA Group Ltd. | 175,600 | | 536,939 |
India - 16.5% |
Cipla Ltd. | 14,696 | | 88,797 |
CRISIL Ltd. | 12,790 | | 230,989 |
eClerx | 74,317 | | 1,138,764 |
FDC Ltd. | 609,912 | | 1,149,698 |
Hawkins Cookers Ltd. | 4,513 | | 138,700 |
ICRA Ltd. | 53,875 | | 991,226 |
Indoco Remedies Ltd. | 187,943 | | 1,456,106 |
INFO Edge India Ltd. | 175,086 | | 2,442,109 |
Ipca Laboratories Ltd. | 25,000 | | 130,414 |
Jubilant Foodworks Ltd. (a) | 175,042 | | 2,884,601 |
Opto Circuits India Ltd. | 575,876 | | 2,959,175 |
Page Industries Ltd. | 1,375 | | 71,556 |
Prakash Industries Ltd. | 83,027 | | 78,935 |
Sobha Developers Ltd. | 255,112 | | 1,319,474 |
Sun TV Ltd. | 350,124 | | 1,869,166 |
TOTAL INDIA | | 16,949,710 |
Ireland - 0.6% |
Trinity Biotech PLC sponsored ADR | 58,441 | | 599,605 |
Japan - 14.4% |
CyberAgent, Inc. | 141 | | 475,275 |
DeNA Co. Ltd. | 13,600 | | 587,073 |
Kakaku.com, Inc. | 95,400 | | 3,777,846 |
Kenedix, Inc. (a) | 18,158 | | 2,692,254 |
Common Stocks - continued |
| Shares | | Value |
Japan - continued |
MEGANE TOP CO. LTD. | 49,650 | | $ 579,876 |
Proto Corp. | 70,200 | | 2,383,941 |
So-net M3, Inc. (d) | 708 | | 3,202,287 |
Start Today Co. Ltd. | 28,600 | | 605,088 |
Tsutsumi Jewelry Co. Ltd. | 22,000 | | 512,715 |
TOTAL JAPAN | | 14,816,355 |
Korea (South) - 1.4% |
MegaStudy Co. Ltd. | 9,976 | | 1,099,234 |
Orion Corp. | 65 | | 34,741 |
Woongjin Coway Co. Ltd. | 9,810 | | 336,683 |
TOTAL KOREA (SOUTH) | | 1,470,658 |
Luxembourg - 1.0% |
GlobeOp Financial Services SA | 221,802 | | 1,016,601 |
Mexico - 0.4% |
Genomma Lab Internacional SA de CV (a) | 185,400 | | 386,524 |
Netherlands - 0.2% |
Randstad Holdings NV | 4,947 | | 176,460 |
Norway - 0.3% |
Schibsted ASA (B Shares) | 11,600 | | 303,563 |
Panama - 3.9% |
Copa Holdings SA Class A | 58,302 | | 4,026,919 |
Poland - 0.2% |
Eurocash SA | 26,800 | | 214,879 |
Russia - 3.4% |
Pharmstandard OJSC (a) | 39,933 | | 2,794,385 |
Vozrozhdenie Bank | 26,600 | | 695,049 |
TOTAL RUSSIA | | 3,489,434 |
Singapore - 0.1% |
Breadtalk Group Ltd. | 190,000 | | 77,477 |
Sweden - 0.7% |
EnergyO Solutions AB (a) | 98,507 | | 341,474 |
Swedol AB | 82,700 | | 380,548 |
TOTAL SWEDEN | | 722,022 |
Taiwan - 1.0% |
HTC Corp. | 47,700 | | 1,071,988 |
United Kingdom - 5.4% |
Ascent Resources PLC (a) | 2,035,600 | | 119,488 |
Common Stocks - continued |
| Shares | | Value |
United Kingdom - continued |
Ashtead Group PLC | 171,000 | | $ 426,528 |
ASOS PLC (a) | 5,100 | | 127,620 |
Royal Dutch Shell PLC Class B sponsored ADR | 61,500 | | 4,415,700 |
Royalblue Group PLC | 16,300 | | 426,496 |
TOTAL UNITED KINGDOM | | 5,515,832 |
United States of America - 35.1% |
Advance Auto Parts, Inc. | 23,400 | | 1,522,638 |
Aegion Corp. (a) | 18,000 | | 266,220 |
Allscripts-Misys Healthcare Solutions, Inc. (a) | 8,900 | | 170,435 |
Apache Corp. | 25,500 | | 2,540,565 |
Apple, Inc. (a) | 2,600 | | 1,052,428 |
Applied Materials, Inc. | 78,500 | | 967,120 |
Brookdale Senior Living, Inc. (a) | 5,000 | | 82,900 |
CME Group, Inc. | 1,000 | | 275,560 |
Cognex Corp. | 7,470 | | 253,158 |
Computer Task Group, Inc. (a) | 138,500 | | 1,768,645 |
Con-way, Inc. | 3,200 | | 94,304 |
Corning, Inc. | 248,000 | | 3,543,920 |
Cymer, Inc. (a) | 9,200 | | 399,740 |
Discover Financial Services | 41,300 | | 973,028 |
eBay, Inc. (a) | 95,900 | | 3,052,497 |
EnerNOC, Inc. (a) | 4,259 | | 37,777 |
Entegris, Inc. (a) | 43,000 | | 385,280 |
Genomic Health, Inc. (a) | 6,280 | | 134,392 |
Google, Inc. Class A (a) | 8,000 | | 4,741,121 |
Hasbro, Inc. | 7,300 | | 277,838 |
Health Management Associates, Inc. Class A (a) | 14,900 | | 130,524 |
Impax Laboratories, Inc. (a) | 10,800 | | 204,228 |
Infinity Pharmaceuticals, Inc. (a)(d) | 19,900 | | 150,643 |
Intuit, Inc. | 12,900 | | 692,343 |
IPC The Hospitalist Co., Inc. (a) | 4,700 | | 197,071 |
MasterCard, Inc. Class A | 11,600 | | 4,027,984 |
McKesson Corp. | 3,900 | | 318,045 |
Nabors Industries Ltd. (a) | 2,100 | | 38,493 |
Nanosphere, Inc. (a) | 435,370 | | 657,409 |
NeuStar, Inc. Class A (a) | 2,300 | | 73,117 |
Noble Energy, Inc. | 2,600 | | 232,284 |
NVE Corp. (a) | 2,421 | | 133,203 |
Pioneer Natural Resources Co. | 3,600 | | 302,040 |
Polycom, Inc. (a) | 15,500 | | 256,215 |
QEP Resources, Inc. | 40,600 | | 1,443,330 |
Common Stocks - continued |
| Shares | | Value |
United States of America - continued |
RF Micro Devices, Inc. (a) | 5,800 | | $ 42,572 |
Ross Stores, Inc. | 3,900 | | 342,147 |
Rovi Corp. (a) | 18,200 | | 901,628 |
rue21, Inc. (a)(d) | 3,100 | | 82,584 |
Smart Balance, Inc. (a) | 166,500 | | 1,090,575 |
Solera Holdings, Inc. | 10,100 | | 551,763 |
Synta Pharmaceuticals Corp. (a)(d) | 51,067 | | 188,948 |
TD Ameritrade Holding Corp. | 5,500 | | 92,290 |
The Walt Disney Co. | 31,200 | | 1,088,256 |
Thermo Fisher Scientific, Inc. (a) | 2,400 | | 120,648 |
Zoltek Companies, Inc. (a) | 30,341 | | 219,972 |
TOTAL UNITED STATES OF AMERICA | | 36,117,878 |
TOTAL COMMON STOCKS (Cost $107,957,434) | 100,795,830 |
Money Market Funds - 2.5% |
| | | |
Fidelity Cash Central Fund, 0.12% (b) | 355,467 | | 355,467 |
Fidelity Securities Lending Cash Central Fund, 0.11% (b)(c) | 2,144,666 | | 2,144,666 |
TOTAL MONEY MARKET FUNDS (Cost $2,500,133) | 2,500,133 |
TOTAL INVESTMENT PORTFOLIO - 100.5% (Cost $110,457,567) | | 103,295,963 |
NET OTHER ASSETS (LIABILITIES) - (0.5)% | | (466,144) |
NET ASSETS - 100% | $ 102,829,819 |
Legend |
(a) Non-income producing |
(b) Affiliated fund that is available only to investment companies and other accounts managed by Fidelity Investments. The rate quoted is the annualized seven-day yield of the fund at period end. A complete unaudited listing of the fund's holdings as of its most recent quarter end is available upon request. In addition, each Fidelity Central Fund's financial statements, which are not covered by the Fund's Report of Independent Registered Public Accounting Firm, are available on the SEC's website or upon request. |
(c) Investment made with cash collateral received from securities on loan. |
(d) Security or a portion of the security is on loan at period end. |
Affiliated Central Funds |
Information regarding fiscal year to date income earned by the Fund from investments in Fidelity Central Funds is as follows: |
Fund | Income earned |
Fidelity Cash Central Fund | $ 11,400 |
Fidelity Securities Lending Cash Central Fund | 95,446 |
Total | $ 106,846 |
Other Affiliated Issuers |
An affiliated company is a company in which the Fund has ownership of at least 5% of the voting securities. Fiscal year to date transactions with companies which are or were affiliates are as follows: |
Affiliate | Value, beginning of period | Purchases | Sales Proceeds | Dividend Income | Value,
end of
period |
Nanosphere, Inc. | $ 911,696 | $ 8,709,271 | $ 2,480,836 | $ - | $ - |
Other Information |
The following is a summary of the inputs used, as of October 31, 2011, involving the Fund's assets and liabilities carried at fair value. The inputs or methodology used for valuing securities may not be an indication of the risk associated with investing in those securities. For more information on valuation inputs, and their aggregation into the levels used in the table below, please refer to the Security Valuation section in the accompanying Notes to Financial Statements. |
Valuation Inputs at Reporting Date: |
Description | Total | Level 1 | Level 2 | Level 3 |
Investments in Securities: | | | | |
Equities: | | | | |
United States of America | $ 36,117,878 | $ 36,117,878 | $ - | $ - |
India | 16,949,710 | - | 16,949,710 | - |
Japan | 14,816,355 | - | 14,816,355 | - |
Canada | 5,644,125 | 5,644,125 | - | - |
United Kingdom | 5,515,832 | 5,515,832 | - | - |
Panama | 4,026,919 | 4,026,919 | - | - |
Russia | 3,489,434 | 3,489,434 | - | - |
Bermuda | 2,537,291 | 676,944 | 1,860,347 | - |
France | 1,833,500 | 1,833,500 | - | - |
Other | 9,864,786 | 4,476,740 | 5,388,046 | - |
Money Market Funds | 2,500,133 | 2,500,133 | - | - |
Total Investments in Securities: | $ 103,295,963 | $ 64,281,505 | $ 39,014,458 | $ - |
Transfers from Level 1 to Level 2 during the period were $19,761,777. |
Income Tax Information |
At October 31, 2011, the Fund had a capital loss carryforward of approximately $24,751,307 of which $7,618,418, $3,018,401 and $14,114,488 will expire in fiscal 2016, 2017 and 2019, respectively. Capital loss carryforwards are only available to offset future capital gains of the Fund to the extent provided by regulations and may be limited. |
See accompanying notes which are an integral part of the financial statements.
Annual Report
Statement of Assets and Liabilities
| October 31, 2011 |
Assets | | |
Investment in securities, at value (including securities loaned of $2,034,944) - See accompanying schedule: Unaffiliated issuers (cost $107,957,434) | $ 100,795,830 | |
Fidelity Central Funds (cost $2,500,133) | 2,500,133 | |
Total Investments (cost $110,457,567) | | $ 103,295,963 |
Foreign currency held at value (cost $1,961,084) | | 1,873,033 |
Receivable for investments sold | | 612,177 |
Receivable for fund shares sold | | 78,958 |
Dividends receivable | | 80,889 |
Distributions receivable from Fidelity Central Funds | | 1,186 |
Prepaid expenses | | 694 |
Other receivables | | 70,973 |
Total assets | | 106,013,873 |
| | |
Liabilities | | |
Payable for investments purchased | $ 744,747 | |
Payable for fund shares redeemed | 123,258 | |
Accrued management fee | 61,375 | |
Distribution and service plan fees payable | 28,510 | |
Other affiliated payables | 27,957 | |
Other payables and accrued expenses | 53,541 | |
Collateral on securities loaned, at value | 2,144,666 | |
Total liabilities | | 3,184,054 |
| | |
Net Assets | | $ 102,829,819 |
Net Assets consist of: | | |
Paid in capital | | $ 135,061,298 |
Accumulated undistributed net realized gain (loss) on investments and foreign currency transactions | | (24,974,009) |
Net unrealized appreciation (depreciation) on investments and assets and liabilities in foreign currencies | | (7,257,470) |
Net Assets | | $ 102,829,819 |
See accompanying notes which are an integral part of the financial statements.
Annual Report
Statement of Assets and Liabilities - continued
| October 31, 2011 |
Calculation of Maximum Offering Price Class A:
Net Asset Value and redemption price per share ($36,366,881 ÷ 3,800,369 shares) | | $ 9.57 |
| | |
Maximum offering price per share (100/94.25 of $9.57) | | $ 10.15 |
Class T:
Net Asset Value and redemption price per share ($24,179,813 ÷ 2,598,107 shares) | | $ 9.31 |
| | |
Maximum offering price per share (100/96.50 of $9.31) | | $ 9.65 |
Class B:
Net Asset Value and offering price per share ($1,926,183 ÷ 220,369 shares)A | | $ 8.74 |
| | |
Class C:
Net Asset Value and offering price per share ($11,631,872 ÷ 1,332,713 shares)A | | $ 8.73 |
| | |
Institutional Class:
Net Asset Value, offering price and redemption price per share ($28,725,070 ÷ 2,906,092 shares) | | $ 9.88 |
A Redemption price per share is equal to net asset value less any applicable contingent deferred sales charge.
See accompanying notes which are an integral part of the financial statements.
Annual Report
Financial Statements - continued
Statement of Operations
| Year ended October 31, 2011 |
Investment Income | | |
Dividends | | $ 1,638,952 |
Interest | | 444 |
Income from Fidelity Central Funds (including $95,446 from security lending) | | 106,846 |
Income before foreign taxes withheld | | 1,746,242 |
Less foreign taxes withheld | | (100,644) |
Total income | | 1,645,598 |
| | |
Expenses | | |
Management fee
Basic fee | $ 979,879 | |
Performance adjustment | (248) | |
Transfer agent fees | 353,091 | |
Distribution and service plan fees | 423,841 | |
Accounting and security lending fees | 72,778 | |
Custodian fees and expenses | 124,801 | |
Independent trustees' compensation | 727 | |
Registration fees | 95,010 | |
Audit | 81,858 | |
Legal | 490 | |
Interest | 1,390 | |
Miscellaneous | 658 | |
Total expenses before reductions | 2,134,275 | |
Expense reductions | (94,854) | 2,039,421 |
Net investment income (loss) | | (393,823) |
Realized and Unrealized Gain (Loss) Net realized gain (loss) on: | | |
Investment securities: | | |
Unaffiliated issuers | (8,975,815) | |
Other affiliated issuers | (4,697,382) | |
Foreign currency transactions | (142,811) | |
Total net realized gain (loss) | | (13,816,008) |
Change in net unrealized appreciation (depreciation) on: Investment securities (net of decrease in deferred foreign taxes of $145,516) | (16,352,358) | |
Assets and liabilities in foreign currencies | (96,967) | |
Total change in net unrealized appreciation (depreciation) | | (16,449,325) |
Net gain (loss) | | (30,265,333) |
Net increase (decrease) in net assets resulting from operations | | $ (30,659,156) |
See accompanying notes which are an integral part of the financial statements.
Annual Report
Statement of Changes in Net Assets
| Year ended
October 31,
2011 | Year ended
October 31,
2010 |
Increase (Decrease) in Net Assets | | |
Operations | | |
Net investment income (loss) | $ (393,823) | $ (31,162) |
Net realized gain (loss) | (13,816,008) | 2,238,659 |
Change in net unrealized appreciation (depreciation) | (16,449,325) | 7,407,825 |
Net increase (decrease) in net assets resulting
from operations | (30,659,156) | 9,615,322 |
Distributions to shareholders from net investment income | - | (45,039) |
Distributions to shareholders from net realized gain | (352,610) | (205,342) |
Total distributions | (352,610) | (250,381) |
Share transactions - net increase (decrease) | 56,562,275 | 43,722,613 |
Redemption fees | 6,577 | 5,493 |
Total increase (decrease) in net assets | 25,557,086 | 53,093,047 |
| | |
Net Assets | | |
Beginning of period | 77,272,733 | 24,179,686 |
End of period | $ 102,829,819 | $ 77,272,733 |
See accompanying notes which are an integral part of the financial statements.
Annual Report
Financial Highlights - Class A
Years ended October 31, | 2011 | 2010 | 2009 | 2008 | 2007 |
Selected Per-Share Data | | | | | |
Net asset value, beginning of period | $ 11.41 | $ 9.04 | $ 6.88 | $ 15.38 | $ 14.83 |
Income from Investment Operations | | | | | |
Net investment income (loss) C | (.03) | .01 | .04 | .04 | .01 |
Net realized and unrealized gain (loss) | (1.76) | 2.47 | 2.13 | (6.74) | 2.69 |
Total from investment operations | (1.79) | 2.48 | 2.17 | (6.70) | 2.70 |
Distributions from net investment income | - | (.03) | (.01) | - | - |
Distributions from net realized gain | (.05) | (.08) | - | (1.80) | (2.15) |
Total distributions | (.05) | (.11) | (.01) | (1.80) | (2.15) |
Redemption fees added to paid in capital C, G | - | - | - | - | - |
Net asset value, end of period | $ 9.57 | $ 11.41 | $ 9.04 | $ 6.88 | $ 15.38 |
Total Return A, B | (15.81)% | 27.68% | 31.68% | (48.99)% | 20.55% |
Ratios to Average Net Assets D. F | | | | | |
Expenses before reductions | 1.51% | 1.89% | 2.22% | 1.90% | 1.81% |
Expenses net of fee waivers, if any | 1.45% | 1.50% | 1.50% | 1.50% | 1.50% |
Expenses net of all reductions | 1.43% | 1.44% | 1.43% | 1.41% | 1.45% |
Net investment income (loss) | (.24)% | .13% | .53% | .38% | .06% |
Supplemental Data | | | | | |
Net assets, end of period (000 omitted) | $ 36,367 | $ 30,383 | $ 6,997 | $ 6,904 | $ 14,000 |
Portfolio turnover rate E | 140% | 179% | 258% | 257% | 102% |
A Total returns would have been lower if certain expenses had not been reduced during the applicable periods shown.
B Total returns do not include the effect of the sales charges.
C Calculated based on average shares outstanding during the period.
D Fees and expenses of any underlying Fidelity Central Funds are not included in the Fund's expense ratio. The Fund indirectly bears its proportionate share of the expenses of any underlying Fidelity Central Funds.
E Amount does not include the portfolio activity of any underlying Fidelity Central Funds.
F Expense ratios reflect operating expenses of the class. Expenses before reductions do not reflect amounts reimbursed by the investment adviser or reductions from brokerage service arrangements or reductions from other expense offset arrangements and do not represent the amount paid by the class during periods when reimbursements or reductions occur. Expenses net of fee waivers reflect expenses after reimbursement by the investment adviser but prior to reductions from brokerage service arrangements or other expense offset arrangements. Expenses net of all reductions represent the net expenses paid by the class.
G Amount represents less than $.01 per share.
See accompanying notes which are an integral part of the financial statements.
Annual Report
Financial Highlights - Class T
Years ended October 31, | 2011 | 2010 | 2009 | 2008 | 2007 |
Selected Per-Share Data | | | | | |
Net asset value, beginning of period | $ 11.11 | $ 8.82 | $ 6.72 | $ 15.05 | $ 14.59 |
Income from Investment Operations | | | | | |
Net investment income (loss) C | (.05) | (.01) | .02 | .01 | (.03) |
Net realized and unrealized gain (loss) | (1.72) | 2.39 | 2.09 | (6.59) | 2.64 |
Total from investment operations | (1.77) | 2.38 | 2.11 | (6.58) | 2.61 |
Distributions from net investment income | - | (.01) | (.01) | - | - |
Distributions from net realized gain | (.03) | (.08) | - | (1.75) | (2.15) |
Total distributions | (.03) | (.09) | (.01) | (1.75) | (2.15) |
Redemption fees added to paid in capital C, G | - | - | - | - | - |
Net asset value, end of period | $ 9.31 | $ 11.11 | $ 8.82 | $ 6.72 | $ 15.05 |
Total Return A, B | (15.97)% | 27.20% | 31.50% | (49.12)% | 20.24% |
Ratios to Average Net Assets D, F | | | | | |
Expenses before reductions | 1.80% | 2.32% | 2.50% | 2.17% | 2.08% |
Expenses net of fee waivers, if any | 1.70% | 1.75% | 1.75% | 1.75% | 1.75% |
Expenses net of all reductions | 1.68% | 1.70% | 1.69% | 1.66% | 1.71% |
Net investment income (loss) | (.49)% | (.13)% | .27% | .13% | (.19)% |
Supplemental Data | | | | | |
Net assets, end of period (000 omitted) | $ 24,180 | $ 23,237 | $ 10,494 | $ 8,104 | $ 22,039 |
Portfolio turnover rate E | 140% | 179% | 258% | 257% | 102% |
A Total returns would have been lower if certain expenses had not been reduced during the applicable periods shown.
B Total returns do not include the effect of the sales charges.
C Calculated based on average shares outstanding during the period.
D Fees and expenses of any underlying Fidelity Central Funds are not included in the Fund's expense ratio. The Fund indirectly bears its proportionate share of the expenses of any underlying Fidelity Central Funds.
E Amount does not include the portfolio activity of any underlying Fidelity Central Funds.
F Expense ratios reflect operating expenses of the class. Expenses before reductions do not reflect amounts reimbursed by the investment adviser or reductions from brokerage service arrangements or reductions from other expense offset arrangements and do not represent the amount paid by the class during periods when reimbursements or reductions occur. Expenses net of fee waivers reflect expenses after reimbursement by the investment adviser but prior to reductions from brokerage service arrangements or other expense offset arrangements. Expenses net of all reductions represent the net expenses paid by the class.
G Amount represents less than $.01 per share.
See accompanying notes which are an integral part of the financial statements.
Annual Report
Financial Highlights - Class B
Years ended October 31, | 2011 | 2010 | 2009 | 2008 | 2007 |
Selected Per-Share Data | | | | | |
Net asset value, beginning of period | $ 10.46 | $ 8.31 | $ 6.37 | $ 14.34 | $ 14.06 |
Income from Investment Operations | | | | | |
Net investment income (loss) C | (.10) | (.06) | (.02) | (.04) | (.09) |
Net realized and unrealized gain (loss) | (1.62) | 2.26 | 1.97 | (6.25) | 2.52 |
Total from investment operations | (1.72) | 2.20 | 1.95 | (6.29) | 2.43 |
Distributions from net investment income | - | - | (.01) | - | - |
Distributions from net realized gain | - G | (.05) | - | (1.68) | (2.15) |
Total distributions | - G | (.05) | (.01) | (1.68) | (2.15) |
Redemption fees added to paid in capital C, G | - | - | - | - | - |
Net asset value, end of period | $ 8.74 | $ 10.46 | $ 8.31 | $ 6.37 | $ 14.34 |
Total Return A, B | (16.42)% | 26.64% | 30.62% | (49.33)% | 19.65% |
Ratios to Average Net Assets D, F | | | | | |
Expenses before reductions | 2.32% | 2.82% | 2.98% | 2.66% | 2.57% |
Expenses net of fee waivers, if any | 2.20% | 2.25% | 2.25% | 2.25% | 2.25% |
Expenses net of all reductions | 2.18% | 2.19% | 2.18% | 2.16% | 2.20% |
Net investment income (loss) | (.99)% | (.62)% | (.22)% | (.37)% | (.69)% |
Supplemental Data | | | | | |
Net assets, end of period (000 omitted) | $ 1,926 | $ 2,731 | $ 2,162 | $ 1,918 | $ 5,029 |
Portfolio turnover rate E | 140% | 179% | 258% | 257% | 102% |
A Total returns would have been lower if certain expenses had not been reduced during the applicable periods shown.
B Total returns do not include the effect of the contingent deferred sales charge.
C Calculated based on average shares outstanding during the period.
D Fees and expenses of any underlying Fidelity Central Funds are not included in the Fund's expense ratio. The Fund indirectly bears its proportionate share of the expenses of any underlying Fidelity Central Funds.
E Amount does not include the portfolio activity of any underlying Fidelity Central Funds.
F Expense ratios reflect operating expenses of the class. Expenses before reductions do not reflect amounts reimbursed by the investment adviser or reductions from brokerage service arrangements or reductions from other expense offset arrangements and do not represent the amount paid by the class during periods when reimbursements or reductions occur. Expenses net of fee waivers reflect expenses after reimbursement by the investment adviser but prior to reductions from brokerage service arrangements or other expense offset arrangements. Expenses net of all reductions represent the net expenses paid by the class.
G Amount represents less than $.01 per share.
See accompanying notes which are an integral part of the financial statements.
Annual Report
Financial Highlights - Class C
Years ended October 31, | 2011 | 2010 | 2009 | 2008 | 2007 |
Selected Per-Share Data | | | | | |
Net asset value, beginning of period | $ 10.46 | $ 8.31 | $ 6.37 | $ 14.36 | $ 14.08 |
Income from Investment Operations | | | | | |
Net investment income (loss) C | (.10) | (.06) | (.02) | (.04) | (.09) |
Net realized and unrealized gain (loss) | (1.61) | 2.27 | 1.97 | (6.26) | 2.52 |
Total from investment operations | (1.71) | 2.21 | 1.95 | (6.30) | 2.43 |
Distributions from net investment income | - | - | (.01) | - | - |
Distributions from net realized gain | (.02) | (.06) | - | (1.69) | (2.15) |
Total distributions | (.02) | (.06) | (.01) | (1.69) | (2.15) |
Redemption fees added to paid in capital C, G | - | - | - | - | - |
Net asset value, end of period | $ 8.73 | $ 10.46 | $ 8.31 | $ 6.37 | $ 14.36 |
Total Return A, B | (16.38)% | 26.68% | 30.62% | (49.35)% | 19.62% |
Ratios to Average Net Assets D, F | | | | | |
Expenses before reductions | 2.28% | 2.77% | 2.97% | 2.63% | 2.57% |
Expenses net of fee waivers, if any | 2.20% | 2.25% | 2.25% | 2.25% | 2.25% |
Expenses net of all reductions | 2.18% | 2.20% | 2.18% | 2.16% | 2.20% |
Net investment income (loss) | (.99)% | (.63)% | (.22)% | (.37)% | (.69)% |
Supplemental Data | | | | | |
Net assets, end of period (000 omitted) | $ 11,632 | $ 7,986 | $ 3,378 | $ 2,697 | $ 5,352 |
Portfolio turnover rate E | 140% | 179% | 258% | 257% | 102% |
A Total returns would have been lower if certain expenses had not been reduced during the applicable periods shown.
B Total returns do not include the effect of the contingent deferred sales charge.
C Calculated based on average shares outstanding during the period.
D Fees and expenses of any underlying Fidelity Central Funds are not included in the Fund's expense ratio. The Fund indirectly bears its proportionate share of the expenses of any underlying Fidelity Central Funds.
E Amount does not include the portfolio activity of any underlying Fidelity Central Funds.
F Expense ratios reflect operating expenses of the class. Expenses before reductions do not reflect amounts reimbursed by the investment adviser or reductions from brokerage service arrangements or reductions from other expense offset arrangements and do not represent the amount paid by the class during periods when reimbursements or reductions occur. Expenses net of fee waivers reflect expenses after reimbursement by the investment adviser but prior to reductions from brokerage service arrangements or other expense offset arrangements. Expenses net of all reductions represent the net expenses paid by the class.
G Amount represents less than $.01 per share.
See accompanying notes which are an integral part of the financial statements.
Annual Report
Financial Highlights - Institutional Class
Years ended October 31, | 2011 | 2010 | 2009 | 2008 | 2007 |
Selected Per-Share Data | | | | | |
Net asset value, beginning of period | $ 11.76 | $ 9.31 | $ 7.07 | $ 15.76 | $ 15.11 |
Income from Investment Operations | | | | | |
Net investment income (loss) B | - F | .04 | .06 | .07 | .05 |
Net realized and unrealized gain (loss) | (1.82) | 2.54 | 2.20 | (6.93) | 2.75 |
Total from investment operations | (1.82) | 2.58 | 2.26 | (6.86) | 2.80 |
Distributions from net investment income | - | (.05) | (.02) | - | - |
Distributions from net realized gain | (.06) | (.08) | - | (1.83) | (2.15) |
Total distributions | (.06) | (.13) | (.02) | (1.83) | (2.15) |
Redemption fees added to paid in capital B, F | - | - | - | - | - |
Net asset value, end of period | $ 9.88 | $ 11.76 | $ 9.31 | $ 7.07 | $ 15.76 |
Total Return A | (15.60)% | 28.00% | 32.03% | (48.89)% | 20.88% |
Ratios to Average Net Assets C, E | | | | | |
Expenses before reductions | 1.18% | 1.43% | 1.88% | 1.51% | 1.43% |
Expenses net of fee waivers, if any | 1.17% | 1.25% | 1.25% | 1.25% | 1.25% |
Expenses net of all reductions | 1.15% | 1.19% | 1.18% | 1.16% | 1.20% |
Net investment income (loss) | .04% | .38% | .78% | .63% | .31% |
Supplemental Data | | | | | |
Net assets, end of period (000 omitted) | $ 28,725 | $ 12,936 | $ 1,148 | $ 1,166 | $ 2,476 |
Portfolio turnover rate D | 140% | 179% | 258% | 257% | 102% |
A Total returns would have been lower if certain expenses had not been reduced during the applicable periods shown.
B Calculated based on average shares outstanding during the period.
C Fees and expenses of any underlying Fidelity Central Funds are not included in the Fund's expense ratio. The Fund indirectly bears its proportionate share of the expenses of any underlying Fidelity Central Funds.
D Amount does not include the portfolio activity of any underlying Fidelity Central Funds.
E Expense ratios reflect operating expenses of the class. Expenses before reductions do not reflect amounts reimbursed by the investment adviser or reductions from brokerage service arrangements or reductions from other expense offset arrangements and do not represent the amount paid by the class during periods when reimbursements or reductions occur. Expenses net of fee waivers reflect expenses after reimbursement by the investment adviser but prior to reductions from brokerage service arrangements or other expense offset arrangements. Expenses net of all reductions represent the net expenses paid by the class.
F Amount represents less than $.01 per share.
See accompanying notes which are an integral part of the financial statements.
Annual Report
Notes to Financial Statements
For the period ended October 31, 2011
1. Organization.
Fidelity Advisor Global Capital Appreciation Fund (the Fund) is a fund of Fidelity Advisor Series VIII (the Trust) and is authorized to issue an unlimited number of shares. The Trust is registered under the Investment Company Act of 1940, as amended (the 1940 Act), as an open-end management investment company organized as a Massachusetts business trust. The Fund offers Class A, Class T, Class C, and Institutional Class shares, each of which, along with Class B shares, has equal rights as to assets and voting privileges. Effective after the close of business on September 1, 2010, Class B shares were closed to new accounts and additional purchases, except for exchanges and reinvestments by existing shareholders. Each class has exclusive voting rights with respect to matters that affect that class. Class B shares will automatically convert to Class A shares after a holding period of seven years from the initial date of purchase. Investment income, realized and unrealized capital gains and losses, the common expenses of the Fund, and certain fund-level expense reductions, if any, are allocated on a pro-rata basis to each class based on the relative net assets of each class to the total net assets of the Fund. Each class differs with respect to transfer agent and distribution and service plan fees incurred. Certain expense reductions may also differ by class. The Fund's investments in emerging markets can be subject to social, economic, regulatory, and political uncertainties and can be extremely volatile.
2. Investments in Fidelity Central Funds.
The Fund invests in Fidelity Central Funds, which are open-end investment companies available only to other investment companies and accounts managed by Fidelity Management & Research Company (FMR) and its affiliates. The Fund's Schedule of Investments lists each of the Fidelity Central Funds held as of period end, if any, as an investment of the Fund, but does not include the underlying holdings of each Fidelity Central Fund. As an Investing Fund, the Fund indirectly bears its proportionate share of the expenses of the underlying Fidelity Central Funds.
The Money Market Central Funds seek preservation of capital and current income and are managed by Fidelity Investments Money Management, Inc. (FIMM), an affiliate of FMR.
A complete unaudited list of holdings for each Fidelity Central Fund is available upon request or at the Securities and Exchange Commission (the SEC) web site at www.sec.gov. In addition, the financial statements of the Fidelity Central Funds, which are not covered by the Fund's Report of Independent Registered Public Accounting Firm are available on the SEC web site or upon request.
Annual Report
Notes to Financial Statements - continued
3. Significant Accounting Policies.
The financial statements have been prepared in conformity with accounting principles generally accepted in the United States of America (GAAP), which require management to make certain estimates and assumptions at the date of the financial statements. Actual results could differ from those estimates. Subsequent events, if any, through the date that the financial statements were issued have been evaluated in the preparation of the financial statements. The following summarizes the significant accounting policies of the Fund:
Security Valuation. Investments are valued as of 4:00 p.m. Eastern time on the last calendar day of the period. The Fund uses independent pricing services approved by the Board of Trustees to value its investments. When current market prices or quotations are not readily available or reliable, valuations may be determined in good faith in accordance with procedures adopted by the Board of Trustees. Factors used in determining value may include market or security specific events. The frequency with which these procedures are used cannot be predicted and they may be utilized to a significant extent. The value used for net asset value (NAV) calculation under these procedures may differ from published prices for the same securities.
The Fund categorizes the inputs to valuation techniques used to value its investments into a disclosure hierarchy consisting of three levels as shown below:
Level 1 - quoted prices in active markets for identical investments
Level 2 - other significant observable inputs (including quoted prices for similar investments, interest rates, prepayment speeds, etc.)
Level 3 - unobservable inputs (including the Fund's own assumptions based on the best information available)
Changes in valuation techniques may result in transfers in or out of an assigned level within the disclosure hierarchy. The aggregate value of investments by input level, as of October 31, 2011, is included at the end of the Fund's Schedule of Investments. Valuation techniques used to value the Fund's investments by major category are as follows:
Equity securities, including restricted securities, for which market quotations are readily available, are valued at the last reported sale price or official closing price as reported by an independent pricing service on the primary market or exchange on which they are traded and are categorized as Level 1 in the hierarchy. In the event there were no sales during the day or closing prices are not available, securities are valued at the last quoted bid price or may be valued using the last available price and are generally categorized as Level 2 in the hierarchy. For foreign equity securities, when significant market or security specific events arise, comparisons to the valuation of American Depositary Receipts
Annual Report
3. Significant Accounting Policies - continued
Security Valuation - continued
(ADRs), futures contracts, Exchange-traded funds (ETFs) and certain indexes as well as quoted prices for similar securities are used and are categorized as Level 2 in the hierarchy in these circumstances. Utilizing these techniques may result in transfers between Level 1 and Level 2. For restricted equity securities and private placements where observable inputs are limited, assumptions about market activity and risk are used and are categorized as Level 3 in the hierarchy.
Investments in open-end mutual funds,including the Fidelity Central Funds, are valued at their closing net asset value each business day and are categorized as Level 1 in the hierarchy.
Foreign Currency. The Fund may use foreign currency contracts to facilitate transactions in foreign-denominated securities. Gains and losses from these transactions may arise from changes in the value of the foreign currency or if the counterparties do not perform under the contracts' terms.
Foreign-denominated assets, including investment securities, and liabilities are translated into U.S. dollars at the exchange rate at period end. Purchases and sales of investment securities, income and dividends received and expenses denominated in foreign currencies are translated into U.S. dollars at the exchange rate in effect on the transaction date.
The effects of exchange rate fluctuations on investments are included with the net realized and unrealized gain (loss) on investment securities. Other foreign currency transactions resulting in realized and unrealized gain (loss) are disclosed separately.
Investment Transactions and Income. For financial reporting purposes, the Fund's investment holdings and NAV include trades executed through the end of the last business day of the period. The NAV per share for processing shareholder transactions is calculated as of the close of business of the New York Stock Exchange (NYSE), normally 4:00 p.m. Eastern time and includes trades executed through the end of the prior business day. Gains and losses on securities sold are determined on the basis of identified cost and may include proceeds received from litigation. Dividend income is recorded on the ex-dividend date, except for certain dividends from foreign securities where the ex-dividend date may have passed, which are recorded as soon as the Fund is informed of the ex-dividend date. Non-cash dividends included in dividend income, if any, are recorded at the fair market value of the securities received. Distributions received on securities that represent a return of capital or capital gain are recorded as a reduction of cost of investments and/or as a realized gain. The Fund estimates the components of distributions received that may be considered return of capital distributions or capital
Annual Report
Notes to Financial Statements - continued
3. Significant Accounting Policies - continued
Investment Transactions and Income - continued
gain distributions. Interest income and distributions from the Fidelity Central Funds are accrued as earned. Interest income includes coupon interest and amortization of premium and accretion of discount on debt securities. Investment income is recorded net of foreign taxes withheld where recovery of such taxes is uncertain.
Expenses. Expenses directly attributable to a fund are charged to that fund. Expenses attributable to more than one fund are allocated among the respective funds on the basis of relative net assets or other appropriate methods. Expense estimates are accrued in the period to which they relate and adjustments are made when actual amounts are known.
Income Tax Information and Distributions to Shareholders. Each year, the Fund intends to qualify as a regulated investment company, including distributing substantially all of its taxable income and realized gains under Subchapter M of the Internal Revenue Code and filing its U.S. federal tax return. As a result, no provision for income taxes is required. As of October 31, 2011, the Fund did not have any unrecognized tax benefits in the financial statements. A fund's federal tax return is subject to examination by the Internal Revenue Service (IRS) for a period of three years. Foreign taxes are provided for based on the Fund's understanding of the tax rules and rates that exist in the foreign markets in which it invests.
Distributions are declared and recorded on the ex-dividend date. Income dividends and capital gain distributions are declared separately for each class. Income and capital gain distributions are determined in accordance with income tax regulations, which may differ from GAAP.
Capital accounts within the financial statements are adjusted for permanent book-tax differences. These adjustments have no impact on net assets or the results of operations. Temporary book-tax differences will reverse in a subsequent period.
Book-tax differences are primarily due to foreign currency transactions, certain foreign taxes, passive foreign investment companies (PFIC), net operating losses, capital loss carryforwards and losses deferred due to wash sales.
The federal tax cost of investment securities and unrealized appreciation (depreciation) as of period end were as follows:
Gross unrealized appreciation | $ 8,771,282 |
Gross unrealized depreciation | (16,155,586) |
Net unrealized appreciation (depreciation) on securities and other investments | $ (7,384,304) |
| |
Tax Cost | $ 110,680,267 |
Annual Report
3. Significant Accounting Policies - continued
Income Tax Information and Distributions to Shareholders - continued
The tax-based components of distributable earnings as of period end were as follows:
Capital loss carryforward | $ (24,751,307) |
Net unrealized appreciation (depreciation) | $ (7,480,170) |
Under the recently enacted Regulated Investment Company Modernization Act of 2010 (the Act), the Fund will be permitted to carry forward capital losses incurred in taxable years beginning after December 22, 2010 for an unlimited period. However, any losses incurred during those future taxable years will be required to be utilized prior to any losses incurred in pre-enactment taxable years, which generally expire after eight years from when they are incurred. Additionally, post-enactment capital losses that are carried forward will retain their character as either short-term or long-term capital losses rather than being considered all short-term as under previous law. The Fund's first fiscal year end subject to the Act will be October 31, 2012.
The tax character of distributions paid was as follows:
| October 31, 2011 | October 31, 2010 |
Ordinary Income | $ 352,610 | $ 250,381 |
Short-Term Trading (Redemption) Fees. Shares held by investors in the Fund less than 30 days are subject to a redemption fee equal to 1.00% of the net asset value of shares redeemed. All redemption fees, which reduce the proceeds of the shareholder redemption, are retained by the Fund and accounted for as an addition to paid in capital.
New Accounting Pronouncement. In May 2011, the Financial Accounting Standards Board issued Accounting Standard Update No. 2011-04, Fair Value Measurement (Topic 820) - Amendments to Achieve Common Fair Value Measurement and Disclosure Requirements in U.S. GAAP and IFRSs. The update changes the wording used to describe the requirements in GAAP for measuring fair value and for disclosing information about fair value measurements. The update is effective during interim and annual periods beginning after December 15, 2011. Management is currently evaluating the impact of the update's adoption on the Fund's financial statement disclosures.
4. Purchases and Sales of Investments.
Purchases and sales of securities, other than short-term securities, aggregated $247,660,432 and $182,112,533, respectively.
Annual Report
Notes to Financial Statements - continued
5. Fees and Other Transactions with Affiliates.
Management Fee. FMR and its affiliates provide the Fund with investment management related services for which the Fund pays a monthly management fee. The management fee is the sum of an individual fund fee rate that is based on an annual rate of .45% of the Fund's average net assets and a group fee rate that averaged .26% during the period. The group fee rate is based upon the average net assets of all the mutual funds advised by FMR. The group fee rate decreases as assets under management increase and increases as assets under management decrease. In addition, the management fee is subject to a performance adjustment (up to a maximum of ± .20% of the Fund's average net assets over a 36 month performance period). The upward or downward adjustment to the management fee is based on the relative investment performance of the Institutional Class of the Fund as compared to an appropriate benchmark index. For the period, the total annual management fee rate, including the performance adjustment, was .71% of the Fund's average net assets.
Distribution and Service Plan Fees. In accordance with Rule 12b-1 of the 1940 Act, the Fund has adopted separate Distribution and Service Plans for each class of shares. Certain classes pay Fidelity Distributors Corporation (FDC), an affiliate of FMR, separate Distribution and Service Fees, each of which is based on an annual percentage of each class' average net assets. In addition, FDC may pay financial intermediaries for selling shares of the Fund and providing shareholder support services. For the period, the Distribution and Service Fee rates, total fees and amounts retained by FDC were as follows:
| Distribution
Fee | Service
Fee | Total Fees | Retained
by FDC |
Class A | -% | .25% | $ 110,510 | $ 10,430 |
Class T | .25% | .25% | 147,154 | 75 |
Class B | .75% | .25% | 25,792 | 19,362 |
Class C | .75% | .25% | 140,385 | 82,957 |
| | | $ 423,841 | $ 112,824 |
Sales Load. FDC may receive a front-end sales charge of up to 5.75% for selling Class A shares, and 3.50% for selling Class T shares, some of which is paid to financial intermediaries for selling shares of the Fund. Depending on the holding period, FDC may receive contingent deferred sales charges levied on Class A, Class T, Class B, and Class C redemptions. The deferred sales charges range from 5% to 1% for Class B, 1% for Class C, 1.00% for certain purchases of Class A shares and .25% for certain purchases of Class T shares.
Annual Report
5. Fees and Other Transactions with Affiliates - continued
Sales Load - continued
For the period, sales charge amounts retained by FDC were as follows:
| Retained
by FDC |
Class A | $ 53,137 |
Class T | 10,527 |
Class B* | 4,390 |
Class C* | 15,060 |
| $ 83,114 |
* When Class B and Class C shares are initially sold, FDC pays commissions from its own resources to financial intermediaries through which the sales are made.
Transfer Agent Fees. Fidelity Investments Institutional Operations Company, Inc. (FIIOC), an affiliate of FMR, is the transfer, dividend disbursing and shareholder servicing agent for each class of the Fund. FIIOC receives account fees and asset-based fees that vary according to the account size and type of account of the shareholders of the respective classes of the Fund. FIIOC pays for typesetting, printing and mailing of shareholder reports, except proxy statements. For the period, transfer agent fees for each class were as follows:
| Amount | % of
Average
Net Assets |
Class A | $ 118,843 | .27 |
Class T | 88,343 | .30 |
Class B | 7,868 | .31 |
Class C | 41,153 | .29 |
Institutional Class | 96,884 | .20 |
| $ 353,091 | |
Accounting and Security Lending Fees. Fidelity Service Company, Inc. (FSC), an affiliate of FMR, maintains the Fund's accounting records. The accounting fee is based on the level of average net assets for the month. Under a separate contract, FSC administers the security lending program. The security lending fee is based on the number and duration of lending transactions.
Brokerage Commissions. The Fund placed a portion of its portfolio transactions with brokerage firms which are affiliates of the investment adviser. The commissions paid to these affiliated firms were $7,261 for the period.
Annual Report
Notes to Financial Statements - continued
5. Fees and Other Transactions with Affiliates - continued
Interfund Lending Program. Pursuant to an Exemptive Order issued by the SEC, the Fund, along with other registered investment companies having management contracts with FMR, may participate in an interfund lending program. This program provides an alternative credit facility allowing the funds to borrow from, or lend money to, other participating affiliated funds. At period end, there were no interfund loans outstanding. The Fund's activity in this program during the period for which loans were outstanding was as follows:
Borrower or Lender | Average Daily
Loan Balance | Weighted Average
Interest Rate | Interest
Expense |
Borrower | $ 9,837,692 | .39% | $ 1,390 |
6. Committed Line of Credit.
The Fund participates with other funds managed by FMR or an affiliate in a $4.0 billion credit facility (the "line of credit") to be utilized for temporary or emergency purposes to fund shareholder redemptions or for other short-term liquidity purposes. The Fund has agreed to pay commitment fees on its pro-rata portion of the line of credit, which amounted to $418 and is reflected in Miscellaneous expenses on the Statement of Operations. During the period, there were no borrowings on this line of credit.
7. Security Lending.
The Fund lends portfolio securities through a lending agent from time to time in order to earn additional income. For equity securities, a lending agent is used and may loan securities to certain qualified borrowers, including Fidelity Capital Markets (FCM), a broker-dealer affiliated with the Fund. On the settlement date of the loan, the Fund receives collateral (in the form of U.S. Treasury obligations, letters of credit and/or cash) against the loaned securities and maintains collateral in an amount not less than 100% of the market value of the loaned securities during the period of the loan. The market value of the loaned securities is determined at the close of business of the Fund and any additional required collateral is delivered to the Fund on the next business day. If the borrower defaults on its obligation to return the securities loaned because of insolvency or other reasons, a fund could experience delays and costs in recovering the securities loaned or in gaining access to the collateral. Any cash collateral received is invested in the Fidelity Securities Lending Cash Central Fund. The value of loaned securities and cash collateral at period end are disclosed on the Fund's Statement of Assets and Liabilities. At period end, there were no security loans outstanding with FCM. Security lending income represents the income earned on investing cash collateral, less rebates paid to borrowers and any lending agent fees associated with the loan, plus any premium
Annual Report
7. Security Lending - continued
payments received for lending certain types of securities. Security lending income is presented in the Statement of Operations as a component of income from Fidelity Central Funds and includes $58 from securities loaned to FCM.
8. Expense Reductions.
FMR contractually agreed to reimburse each class to the extent annual operating expenses exceeded certain levels of average net assets as noted in the table below. This reimbursement will remain in place through December 31, 2012. Some expenses, for example interest expense, including commitment fees, are excluded from this reimbursement.
The following classes were in reimbursement during the period:
| Expense
Limitations | Reimbursement
from adviser |
Class A | 1.45% | $ 24,171 |
Class T | 1.70% | 27,895 |
Class B | 2.20% | 2,997 |
Class C | 2.20% | 10,305 |
| | $ 65,368 |
In addition, FMR voluntarily agreed to reimburse a portion of its management fee. For the period, the amount of this reimbursement was $673.
Many of the brokers with whom FMR places trades on behalf of the Fund provided services to the Fund in addition to trade execution. These services included payments of certain expenses on behalf of the Fund totaling $28,813 for the period.
9. Distributions to Shareholders.
Distributions to shareholders of each class were as follows:
Years ended October 31, | 2011 | 2010 |
From net investment income | | |
Class A | $ - | $ 24,148 |
Class T | - | 14,394 |
Institutional Class | - | 6,497 |
Total | $ - | $ 45,039 |
From net realized gain | | |
Class A | $ 149,904 | $ 62,317 |
Class T | 82,578 | 95,962 |
Class B | 761 | 13,694 |
Class C | 23,129 | 23,177 |
Institutional Class | 96,238 | 10,192 |
Total | $ 352,610 | $ 205,342 |
Annual Report
Notes to Financial Statements - continued
10. Share Transactions.
Transactions for each class of shares were as follows:
| Shares | Dollars |
Years ended October 31, | 2011 | 2010 | 2011 | 2010 |
Class A | | | | |
Shares sold | 3,313,300 | 2,107,781 | $ 38,257,984 | $ 21,885,164 |
Reinvestment of distributions | 11,121 | 8,588 | 130,500 | 82,276 |
Shares redeemed | (2,187,648) | (226,391) | (23,557,856) | (2,293,965) |
Net increase (decrease) | 1,136,773 | 1,889,978 | $ 14,830,628 | $ 19,673,475 |
Class T | | | | |
Shares sold | 1,500,646 | 1,253,117 | $ 16,821,913 | $ 13,010,370 |
Reinvestment of distributions | 7,107 | 11,592 | 81,139 | 108,388 |
Shares redeemed | (1,001,188) | (363,578) | (10,370,670) | (3,522,646) |
Net increase (decrease) | 506,565 | 901,131 | $ 6,532,382 | $ 9,596,112 |
Class B | | | | |
Shares sold | 67,595 | 87,120 | $ 715,061 | $ 802,164 |
Reinvestment of distributions | 70 | 1,450 | 677 | 12,817 |
Shares redeemed | (108,399) | (87,578) | (1,075,608) | (796,786) |
Net increase (decrease) | (40,734) | 992 | $ (359,870) | $ 18,195 |
Class C | | | | |
Shares sold | 1,263,963 | 501,896 | $ 13,329,175 | $ 4,858,487 |
Reinvestment of distributions | 1,981 | 2,379 | 21,056 | 21,027 |
Shares redeemed | (696,642) | (147,177) | (6,685,064) | (1,345,064) |
Net increase (decrease) | 569,302 | 357,098 | $ 6,665,167 | $ 3,534,450 |
Institutional Class | | | | |
Shares sold | 6,587,351 | 986,043 | $ 79,174,965 | $ 11,001,071 |
Reinvestment of distributions | 6,022 | 415 | 72,484 | 4,092 |
Shares redeemed | (4,787,531) | (9,490) | (50,353,481) | (104,782) |
Net increase (decrease) | 1,805,842 | 976,968 | $ 28,893,968 | $ 10,900,381 |
11. Other.
The Fund's organizational documents provide former and current trustees and officers with a limited indemnification against liabilities arising in connection with the performance of their duties to the Fund. In the normal course of business, the Fund may also enter into contracts that provide general indemnifications. The Fund's maximum exposure under these arrangements is unknown as this would be dependent on future claims that may be made against the Fund. The risk of material loss from such claims is considered remote.
Annual Report
To the Trustees of Fidelity Advisor Series VIII and the Shareholders of Fidelity Advisor Global Capital Appreciation Fund:
In our opinion, the accompanying statement of assets and liabilities, including the schedule of investments, and the related statements of operations and of changes in net assets and the financial highlights present fairly, in all material respects, the financial position of Fidelity Advisor Global Capital Appreciation Fund (a fund of Fidelity Advisor Series VIII) at October 31, 2011, the results of its operations for the year then ended, the changes in its net assets for each of the two years in the period then ended and the financial highlights for each of the five years in the period then ended, in conformity with accounting principles generally accepted in the United States of America. These financial statements and financial highlights (hereafter referred to as "financial statements") are the responsibility of the Fidelity Advisor Global Capital Appreciation Fund's management. Our responsibility is to express an opinion on these financial statements based on our audits. We conducted our audits of these financial statements in accordance with the standards of the Public Company Accounting Oversight Board (United States). Those standards require that we plan and perform the audit to obtain reasonable assurance about whether the financial statements are free of material misstatement. An audit includes examining, on a test basis, evidence supporting the amounts and disclosures in the financial statements, assessing the accounting principles used and significant estimates made by management, and evaluating the overall financial statement presentation. We believe that our audits, which included confirmation of securities at October 31, 2011 by correspondence with the custodian and brokers, provide a reasonable basis for our opinion.
/s/ PricewaterhouseCoopers LLP
PricewaterhouseCoopers LLP
Boston, Massachusetts
December 15, 2011
Annual Report
The Trustees, Members of the Advisory Board, and executive officers of the trust and fund, as applicable, are listed below. The Board of Trustees governs the fund and is responsible for protecting the interests of shareholders. The Trustees are experienced executives who meet periodically throughout the year to oversee the fund's activities, review contractual arrangements with companies that provide services to the fund, oversee management of the risks associated with such activities and contractual arrangements, and review the fund's performance. Except for James C. Curvey, each of the Trustees oversees 226 funds advised by FMR or an affiliate. Mr. Curvey oversees 429 funds advised by FMR or an affiliate.
The Trustees hold office without limit in time except that (a) any Trustee may resign; (b) any Trustee may be removed by written instrument, signed by at least two-thirds of the number of Trustees prior to such removal; (c) any Trustee who requests to be retired or who has become incapacitated by illness or injury may be retired by written instrument signed by a majority of the other Trustees; and (d) any Trustee may be removed at any special meeting of shareholders by a two-thirds vote of the outstanding voting securities of the trust. Each Trustee who is not an interested person (as defined in the 1940 Act) (Independent Trustee), shall retire not later than the last day of the calendar year in which his or her 75th birthday occurs. The Independent Trustees may waive this mandatory retirement age policy with respect to individual Trustees. The executive officers and Advisory Board Members hold office without limit in time, except that any officer and Advisory Board Member may resign or may be removed by a vote of a majority of the Trustees at any regular meeting or any special meeting of the Trustees. Except as indicated, each individual has held the office shown or other offices in the same company for the past five years.
Experience, Skills, Attributes, and Qualifications of the Fund's Trustees. The Governance and Nominating Committee has adopted a statement of policy that describes the experience, qualifications, attributes, and skills that are necessary and desirable for potential Independent Trustee candidates (Statement of Policy). The Board believes that each Trustee satisfied at the time he or she was initially elected or appointed a Trustee, and continues to satisfy, the standards contemplated by the Statement of Policy. The Governance and Nominating Committee also engages professional search firms to help identify potential Independent Trustee candidates who have the experience, qualifications, attributes, and skills consistent with the Statement of Policy. From time to time, additional criteria based on the composition and skills of the current Independent Trustees, as well as experience or skills that may be appropriate in light of future changes to board composition, business conditions, and regulatory or other developments, have also been considered by the professional search firms and the Governance and Nominating Committee. In addition, the Board takes into account the Trustees' commitment and participation in Board and committee meetings, as well as their leadership of standing and ad hoc committees throughout their tenure.
In determining that a particular Trustee was and continues to be qualified to serve as a Trustee, the Board has considered a variety of criteria, none of which, in isolation, was controlling. The Board believes that, collectively, the Trustees have balanced and diverse experience, qualifications, attributes, and skills, which allow the Board to operate effectively in governing the fund and protecting the interests of shareholders. Information about the specific experience, skills, attributes, and qualifications of each Trustee, which in each case led to the Board's conclusion that the Trustee should serve (or continue to serve) as a trustee of the fund, is provided below.
Annual Report
Board Structure and Oversight Function. James C. Curvey is an interested person (as defined in the 1940 Act) and currently serves as Acting Chairman. The Trustees have determined that an interested Chairman is appropriate and benefits shareholders because an interested Chairman has a personal and professional stake in the quality and continuity of services provided to the fund. Independent Trustees exercise their informed business judgment to appoint an individual of their choosing to serve as Chairman, regardless of whether the Trustee happens to be independent or a member of management. The Independent Trustees have determined that they can act independently and effectively without having an Independent Trustee serve as Chairman and that a key structural component for assuring that they are in a position to do so is for the Independent Trustees to constitute a substantial majority for the Board. The Independent Trustees also regularly meet in executive session. Ned C. Lautenbach serves as Chairman of the Independent Trustees and as such (i) acts as a liaison between the Independent Trustees and management with respect to matters important to the Independent Trustees and (ii) with management prepares agendas for Board meetings.
Fidelity funds are overseen by different Boards of Trustees. The fund's Board oversees Fidelity's equity and high income funds and another Board oversees Fidelity's investment-grade bond, money market, and asset allocation funds. The asset allocation funds may invest in Fidelity funds overseen by the fund's Board. The use of separate Boards, each with its own committee structure, allows the Trustees of each group of Fidelity funds to focus on the unique issues of the funds they oversee, including common research, investment, and operational issues. On occasion, the separate Boards establish joint committees to address issues of overlapping consequences for the Fidelity funds overseen by each Board.
The Trustees operate using a system of committees to facilitate the timely and efficient consideration of all matters of importance to the Trustees, the fund, and fund shareholders and to facilitate compliance with legal and regulatory requirements and oversight of the fund's activities and associated risks. The Board, acting through its committees, has charged FMR and its affiliates with (i) identifying events or circumstances the occurrence of which could have demonstrably adverse effects on the fund's business and/or reputation; (ii) implementing processes and controls to lessen the possibility that such events or circumstances occur or to mitigate the effects of such events or circumstances if they do occur; and (iii) creating and maintaining a system designed to evaluate continuously business and market conditions in order to facilitate the identification and implementation processes described in (i) and (ii) above. Because the day-to-day operations and activities of the fund are carried out by or through FMR, its affiliates and other service providers, the fund's exposure to risks is mitigated but not eliminated by the processes overseen by the Trustees. While each of the Board's committees has responsibility for overseeing different aspects of the fund's activities, oversight is exercised primarily through the Operations, Audit, and Compliance Committees. In addition, the Independent Trustees have worked with FMR to enhance the Board's oversight of investment and financial risks, legal and regulatory risks, technology risks, and operational risks, including the development of additional risk reporting to the Board. For example, a working group comprised of Independent Trustees and FMR has worked and continues to work to review the Fidelity funds' valuation-related activities, reporting and risk management. Appropriate personnel, including but not limited to the fund's Chief Compliance Officer (CCO), FMR's internal auditor, the independent accountants, the fund's Treasurer and portfolio management personnel, make periodic reports to the Board's committees, as appropriate, including an annual review of FMR's risk management program for the Fidelity funds. The responsibilities of each standing committee, including their oversight responsibilities, are described further under "Standing Committees of the Fund's Trustees."
Annual Report
Trustees and Officers - continued
The fund's Statement of Additional Information (SAI) includes more information about the Trustees. To request a free copy, call Fidelity at 1-877-208-0098.
Interested Trustees*:
Correspondence intended for each Trustee who is an interested person may be sent to Fidelity Investments, 82 Devonshire Street, Boston, Massachusetts 02109.
Name, Age; Principal Occupations and Other Relevant Experience+ |
James C. Curvey (76) |
| Year of Election or Appointment: 2007 Mr. Curvey is Trustee and Acting Chairman of the Board of Trustees of certain Trusts. Mr. Curvey also serves as Trustee (2007-present) of other investment companies advised by FMR. Mr. Curvey is a Director of Fidelity Investments Money Management, Inc. (2009-present), Director of Fidelity Research & Analysis Co. (2009-present) and Director of FMR and FMR Co., Inc. (2007-present). Mr. Curvey is also Vice Chairman (2007-present) and Director of FMR LLC. In addition, Mr. Curvey serves as an Overseer for the Boston Symphony Orchestra and a member of the Trustees of Villanova University. Previously, Mr. Curvey was the Vice Chairman (2006-2007) and Director (2000-2007) of FMR Corp. |
Ronald P. O'Hanley (54) |
| Year of Election or Appointment: 2011 Mr. O'Hanley is Director of FMR Co., Inc. (2010-present), Director of Fidelity Investments Money Management, Inc. (2010-present), Director of Fidelity Research & Analysis Company (2010-present), President of Fidelity Asset Management and Corporate Services and a member of Fidelity's Executive Committee (2010-present). Previously, Mr. O'Hanley served as President and Chief Executive Officer of BNY Mellon Asset Management (2007-2010). Mr. O'Hanley also served as Vice Chairman of Bank New York Mellon Corp. and a member of that firm's Executive Committee. Prior to the 2007 merger of The Bank of New York and Mellon Financial Corporation, he was Vice Chairman of Mellon Financial Corporation and President and Chief Executive Officer of Mellon Asset Management. He joined Mellon in February 1997. Mr. O'Hanley currently serves as Chairman of the Boston Public Library Foundation Board of Directors and sits on the Board of Directors of Beth Israel Deaconess Medical Center, the Board of Trustees of the Marine Biological Laboratory and the Advisory Board of the Maxwell School of Citizenship and Public Administration at Syracuse University. Mr. O'Hanley also chairs the Council on Asset Management for the Financial Services Roundtable and is a member of the Board of Directors of Institutional Investor's U.S. Institute. |
* Trustees have been determined to be "Interested Trustees" by virtue of, among other things, their affiliation with the trust or various entities under common control with FMR.
+ The information above includes each Trustee's principal occupation during the last five years and other information relating to the experience, attributes, and skills relevant to each Trustee's qualifications to serve as a Trustee, which led to the conclusion that each Trustee should serve as a Trustee for the fund.
Annual Report
Trustees and Officers - continued
Independent Trustees:
Correspondence intended for each Independent Trustee (that is, the Trustees other than the Interested Trustees) may be sent to Fidelity Investments, P.O. Box 55235, Boston, Massachusetts 02205-5235.
Name, Age; Principal Occupations and Other Relevant Experience+ |
Dennis J. Dirks (63) |
| Year of Election or Appointment: 2005 Prior to his retirement in May 2003, Mr. Dirks was Chief Operating Officer and a member of the Board of The Depository Trust & Clearing Corporation (DTCC). He also served as President, Chief Operating Officer, and Board member of The Depository Trust Company (DTC) and President and Board member of the National Securities Clearing Corporation (NSCC). In addition, Mr. Dirks served as Chief Executive Officer and Board member of the Government Securities Clearing Corporation, Chief Executive Officer and Board member of the Mortgage-Backed Securities Clearing Corporation, as a Trustee and a member of the Finance Committee of Manhattan College (2005-2008), and as a Trustee and a member of the Finance Committee of AHRC of Nassau County (2006-2008). Mr. Dirks is a member of the Independent Directors Council (IDC) Governing Council (2010-Present) and Board of Directors for The Brookville Center for Children's Services, Inc. (2009-present). |
Alan J. Lacy (58) |
| Year of Election or Appointment: 2008 Mr. Lacy serves as Senior Adviser (2007-present) of Oak Hill Capital Partners, L.P. (private equity). Mr. Lacy also served as Chief Executive Officer (2000-2005) and Vice Chairman (2005-2006) of Sears Holdings Corporation and Sears, Roebuck and Co. (retail). In addition, Mr. Lacy serves as a member of the Board of Directors of Dave & Buster's, Inc. (restaurant and entertainment complexes, 2010-present), The Hillman Companies, Inc. (hardware wholesalers, 2010-present), and Bristol-Myers Squibb Company (global pharmaceuticals, 2007-present). Mr. Lacy is a member of the Board of Trustees of The National Parks Conservation Association (2006-Present). Previously, Mr. Lacy served as Chairman of the Board of Trustees of the National Parks Conservation Association (2008-2011) and as a member of the Board of Directors for the Western Union Company (global money transfer, 2006-2011). |
Ned C. Lautenbach (67) |
| Year of Election or Appointment: 2000 Mr. Lautenbach is Chairman of the Independent Trustees of the Equity and High Income Funds (2006-present). Mr. Lautenbach currently serves as the Lead Director of the Eaton Corporation Board of Directors (diversified industrial, 1997-present). Mr. Lautenbach is also a member of the Board of Directors of the Philharmonic Center for the Arts in Naples, Florida (1999-present); a member of the Board of Trustees of Fairfield University (2005-present); and a member of the Council on Foreign Relations (1994-present). Previously, Mr. Lautenbach was a Partner/Advisory Partner at Clayton, Dubilier & Rice, LLC (private equity investment, 1998-2010), as well as a Director of Sony Corporation (2006-2007). |
Joseph Mauriello (67) |
| Year of Election or Appointment: 2008 Prior to his retirement in January 2006, Mr. Mauriello served in numerous senior management positions including Deputy Chairman and Chief Operating Officer (2004-2005), and Vice Chairman of Financial Services (2002-2004) of KPMG LLP US (professional services, 1965-2005). Mr. Mauriello currently serves as a member of the Board of Directors of XL Group plc. (global insurance and re-insurance, 2006-present) and of Arcadia Resources Inc. (health care services and products, 2007-present). Previously, Mr. Mauriello served as a Director of the Hamilton Funds of the Bank of New York (2006-2007). |
Robert W. Selander (61) |
| Year of Election or Appointment: 2011 Previously, Mr. Selander served as a Member of the Advisory Board of Fidelity's Equity and High Income Funds (2011), Executive Vice Chairman (2010), Chief Executive Officer (2009-2010), and President and Chief Executive Officer (1997-2009) of Mastercard, Inc. |
Cornelia M. Small (67) |
| Year of Election or Appointment: 2005 Ms. Small is a member of the Board of Directors of the Teagle Foundation (2009-present). Ms. Small is also a member of the Investment Committee, and Chair (2008-present) and a member of the Board of Trustees of Smith College. In addition, Ms. Small serves on the Investment Committee of the Berkshire Taconic Community Foundation (2008-present). Previously, Ms. Small served as Chairperson of the Investment Committee (2002-2008) of Smith College. In addition, Ms. Small served as Chief Investment Officer, Director of Global Equity Investments, and a member of the Board of Directors of Scudder, Stevens & Clark and Scudder Kemper Investments. |
William S. Stavropoulos (72) |
| Year of Election or Appointment: 2001 Mr. Stavropoulos is Vice Chairman of the Independent Trustees of the Equity and High Income Funds (2006-present). Mr. Stavropoulos serves as President and Founder of the Michigan Baseball Foundation, the Great Lakes Loons (2007-present). Mr. Stavropoulos is Chairman Emeritus of the Board of Directors of The Dow Chemical Company, where he previously served in numerous senior management positions, including President, CEO (1995-2000; 2002-2004), Chairman of the Executive Committee (2000-2006), and as a member of the Board of Directors (1990-2006). Currently, Mr. Stavropoulos is Chairman of Univar (global distributor of commodity and specialty chemicals, 2010-present), a Director of Teradata Corporation (data warehousing and technology solutions, 2008-present), Chemical Financial Corporation, Maersk Inc. (industrial conglomerate), Tyco International, Inc. (multinational manufacturing and services, 2007-present), and a member of the Advisory Board for Metalmark Capital (private equity investment, 2005-present). Mr. Stavropoulos is a special advisor to Clayton, Dubilier & Rice, LLC (private equity investment). In addition, Mr. Stavropoulos is a member of the University of Notre Dame Advisory Council for the College of Science. |
David M. Thomas (62) |
| Year of Election or Appointment: 2008 Previously, Mr. Thomas served as Executive Chairman (2005-2006) and Chairman and Chief Executive Officer (2000-2005) of IMS Health, Inc. (pharmaceutical and healthcare information solutions). In addition, Mr. Thomas serves as a member of the Board of Directors of Fortune Brands, Inc. (consumer products), and Interpublic Group of Companies, Inc. (marketing communication, 2004-present). |
Michael E. Wiley (61) |
| Year of Election or Appointment: 2008 Mr. Wiley also serves as a Director of Asia Pacific Exploration Consolidated (international oil and gas exploration and production, 2008-present). Mr. Wiley serves as a Director of Tesoro Corporation (independent oil refiner and marketer, 2005-present), and a Director of Bill Barrett Corporation (exploration and production, 2005-present). In addition, Mr. Wiley also serves as a Director of Post Oak Bank (privately-held bank, 2004-present). Previously, Mr. Wiley served as a member of the Board of Trustees of the University of Tulsa (2000-2006; 2007-2010), as a Senior Energy Advisor of Katzenbach Partners, LLC (consulting, 2006-2007), as an Advisory Director of Riverstone Holdings (private investment), Chairman, President, and CEO of Baker Hughes, Inc. (oilfield services, 2000-2004), and as Director of Spinnaker Exploration Company (exploration and production, 2001-2005). |
Annual Report
+ The information above includes each Trustee's principal occupation during the last five years and other information relating to the experience, attributes, and skills relevant to each Trustee's qualifications to serve as a Trustee, which led to the conclusion that each Trustee should serve as a Trustee for the fund.
Advisory Board Members and Executive Officers:
Correspondence intended for each executive officer, Edward C. Johnson 3d, and Peter S. Lynch may be sent to Fidelity Investments, 82 Devonshire Street, Boston, Massachusetts 02109.
Name, Age; Principal Occupation |
Edward C. Johnson 3d (81) |
| Year of Election or Appointment: 2011 Member of the Advisory Board of Fidelity's Equity and High Income Funds. Mr. Johnson serves as Chief Executive Officer, Chairman, and a Director of FMR LLC, and also serves as Chairman and Director of FIL Limited. Previously, Mr. Johnson served as a Trustee and Chairman of the Board of certain Fidelity Trusts, Chairman and a Director of FMR, Chairman and a Director of FMR Co., Inc., and President of FMR LLC (2006-2007). |
Peter S. Lynch (67) |
| Year of Election or Appointment: 2003 Member of the Advisory Board of Fidelity's Equity and High Income Funds. Mr. Lynch is Vice Chairman and a Director of FMR and FMR Co., Inc. In addition, Mr. Lynch serves as a Trustee of Boston College and as the Chairman of the Inner-City Scholarship Fund. Previously, Mr. Lynch served on the Special Olympics International Board of Directors (1997-2006). |
Kenneth B. Robins (42) |
| Year of Election or Appointment: 2008 President and Treasurer of Fidelity's Equity and High Income Funds. Mr. Robins also serves as President and Treasurer (2010-present) and Assistant Treasurer (2009-present) of other Fidelity funds and is an employee of Fidelity Investments (2004-present). Previously, Mr. Robins served as Deputy Treasurer of the Fidelity funds (2005-2008) and Treasurer and Chief Financial Officer of The North Carolina Capital Management Trust: Cash and Term Portfolios (2006-2008). |
Bruce T. Herring (46) |
| Year of Election or Appointment: 2006 Vice President of certain Equity Funds. Mr. Herring also serves as Chief Investment Officer and Director of Fidelity Management & Research (U.K.) Inc. (2010-present) and Group Chief Investments Officer of FMR. Previously, Mr. Herring served as Vice President (2005-2006) and Senior Vice President (2006-2007) of Fidelity Management & Research Company, Vice President of FMR Co., Inc. (2001-2007) and as a portfolio manager for Fidelity U.S. Equity Funds. |
Brian B. Hogan (47) |
| Year of Election or Appointment: 2009 Vice President of Equity and High Income Funds. Mr. Hogan also serves as President of FMR's Equity Division (2009-present). Previously, Mr. Hogan served as Senior Vice President, Equity Research of FMR (2006-2009) and as a portfolio manager. |
Scott C. Goebel (43) |
| Year of Election or Appointment: 2008 Secretary and Chief Legal Officer (CLO) of the Fidelity funds. Mr. Goebel also serves as Secretary of Fidelity Investments Money Management, Inc. (FIMM) (2010-present) and Fidelity Research and Analysis Company (FRAC) (2010-present); Secretary and CLO of The North Carolina Capital Management Trust: Cash and Term Portfolios (2008-present); General Counsel, Secretary, and Senior Vice President of FMR (2008-present) and FMR Co., Inc. (2008-present); employed by FMR LLC or an affiliate (2001-present); Chief Legal Officer of Fidelity Management & Research (Hong Kong) Limited (2008-present) and Assistant Secretary of Fidelity Management & Research (Japan) Inc. (2008-present), and Fidelity Management & Research (U.K.) Inc. (2008-present). Previously, Mr. Goebel served as Assistant Secretary of FIMM (2008-2010), FRAC (2008-2010), and the Funds (2007-2008) and as Vice President and Secretary of Fidelity Distributors Corporation (FDC) (2005-2007). |
William C. Coffey (42) |
| Year of Election or Appointment: 2009 Assistant Secretary of Fidelity's Equity and High Income Funds. Mr. Coffey also serves as Senior Vice President and Deputy General Counsel of FMR LLC (2010-present), and is an employee of Fidelity Investments. Previously, Mr. Coffey served as Vice President and Associate General Counsel of FMR LLC (2005-2009). |
Holly C. Laurent (57) |
| Year of Election or Appointment: 2008 Anti-Money Laundering (AML) Officer of the Fidelity funds. Ms. Laurent also serves as AML Officer of The North Carolina Capital Management Trust: Cash and Term Portfolios (2008-present) and is an employee of Fidelity Investments. Previously, Ms. Laurent was Senior Vice President and Head of Legal for Fidelity Business Services India Pvt. Ltd. (2006-2008), and Senior Vice President, Deputy General Counsel and Group Head for FMR LLC (2005-2006). |
Christine Reynolds (53) |
| Year of Election or Appointment: 2008 Chief Financial Officer of the Fidelity funds. Ms. Reynolds became President of Fidelity Pricing and Cash Management Services (FPCMS) in August 2008. Ms. Reynolds served as Chief Operating Officer of FPCMS (2007-2008). Previously, Ms. Reynolds served as President, Treasurer, and Anti-Money Laundering officer of the Fidelity funds (2004-2007). |
Kenneth A. Rathgeber (64) |
| Year of Election or Appointment: 2004 Chief Compliance Officer of Fidelity's Equity and High Income Funds. Mr. Rathgeber is Chief Compliance Officer of Fidelity Management & Research (Hong Kong) Limited (2008-present), Fidelity Management & Research (Japan) Inc. (2008-present), FMR (2005-present), FMR Co., Inc. (2005-present), Fidelity Management & Research (U.K.) Inc. (2005-present), Fidelity Research & Analysis Company (2005-present), Fidelity Investments Money Management, Inc. (2005-present), Pyramis Global Advisors, LLC (2005-present), and Strategic Advisers, Inc. (2005-present). |
Jeffrey S. Christian (50) |
| Year of Election or Appointment: 2009 Deputy Treasurer of the Fidelity funds. Mr. Christian is an employee of Fidelity Investments. Previously, Mr. Christian served as Chief Financial Officer (2008-2009) of certain Fidelity funds and Senior Vice President of Fidelity Pricing and Cash Management Services (FPCMS) (2004-2009). |
Joseph F. Zambello (54) |
| Year of Election or Appointment: 2011 Deputy Treasurer of the Fidelity funds. Mr. Zambello is an employee of Fidelity Investments. Previously, Mr. Zambello served as Vice President of FMR's Program Management Group (2009-2011) and Vice President of the Transfer Agent Oversight Group (2005-2009). |
Adrien E. Deberghes (44) |
| Year of Election or Appointment: 2008 Deputy Treasurer of Fidelity's Equity and High Income Funds. Mr. Deberghes also serves as Vice President and Assistant Treasurer of Fidelity Rutland Square Trust II and Fidelity Commonwealth Trust II (2011-present), Assistant Treasurer of other Fidelity funds (2010-present), and is an employee of Fidelity Investments (2008-present). Previously, Mr. Deberghes served as Senior Vice President of Mutual Fund Administration at State Street Corporation (2007-2008), Senior Director of Mutual Fund Administration at Investors Bank & Trust (2005-2007), and Director of Finance for Dunkin' Brands (2000-2005). |
Stephanie J. Dorsey (42) |
| Year of Election or Appointment: 2010 Assistant Treasurer of Fidelity's Equity and High Income Funds. Ms. Dorsey also serves as Deputy Treasurer of other Fidelity funds (2008-present) and is an employee of Fidelity Investments (2008-present). Previously, Ms. Dorsey served as Treasurer (2004-2008) of the JPMorgan Mutual Funds and Vice President (2004-2008) of JPMorgan Chase Bank. |
John R. Hebble (53) |
| Year of Election or Appointment: 2009 Assistant Treasurer of Fidelity's Equity and High Income Funds. Mr. Hebble also serves as President (2011-present), Treasurer, and Chief Financial Officer of The North Carolina Capital Management Trust: Cash and Term Portfolios (2008-present), President and Treasurer of other Fidelity funds (2008-present) and is an employee of Fidelity Investments. |
Gary W. Ryan (53) |
| Year of Election or Appointment: 2005 Assistant Treasurer of the Fidelity funds. Mr. Ryan is an employee of Fidelity Investments. Previously, Mr. Ryan served as Vice President of Fund Reporting in Fidelity Pricing and Cash Management Services (FPCMS) (1999-2005). |
Jonathan Davis (43) |
| Year of Election or Appointment: 2010 Assistant Treasurer of the Fidelity funds. Mr. Davis is also Assistant Treasurer of Fidelity Rutland Square Trust II and Fidelity Commonwealth Trust II. Mr. Davis is an employee of Fidelity Investments. Previously, Mr. Davis served as Vice President and Associate General Counsel of FMR LLC (2003-2010). |
Annual Report
Class A designates 8%; Class T designates 10%; and Class C designates 15%; of the dividends distributed in respectively during the fiscal year as qualifying for the dividends-received deduction for corporate shareholders.
Class A, Class T, and Class C designates 100% of the, dividends distributed during the fiscal year as amounts which may be taken into account as a dividend for purposes of the maximum rate under section 1(h)(11) of the Internal Revenue Code.
The amounts per share which represent income derived from sources within, and taxes paid to, foreign countries or possessions of the United States are as follows:
| Pay Date | Income | Taxes |
Class A | 12/06/2010 | $0.038 | $0.0108 |
| 07/11/2011 | $0.002 | $0.0000 |
Class T | 12/06/2010 | $0.029 | $0.0108 |
| 07/11/2011 | $0.002 | $0.0000 |
Class B | 12/06/2010 | $0.000 | $0.0000 |
| 07/11/2011 | $0.002 | $0.0000 |
Class C | 12/06/2010 | $0.020 | $0.0108 |
| 07/11/2011 | $0.002 | $0.0000 |
The fund will notify shareholders in January 2012 of amounts for use in preparing 2011 income tax returns.
Annual Report
Board Approval of Investment Advisory Contracts and Management Fees
Fidelity Advisor Global Capital Appreciation Fund
Each year, the Board of Trustees, including the Independent Trustees (together, the Board), votes on the renewal of the management contract and sub-advisory agreements (together, the Advisory Contracts) for the fund. The Board, assisted by the advice of fund counsel and Independent Trustees' counsel, requests and considers a broad range of information relevant to the renewal of the Advisory Contracts throughout the year.
The Board meets regularly and considers at each of its meetings factors that are relevant to its annual consideration of the renewal of the fund's Advisory Contracts, including the services and support provided to the fund and its shareholders. The Board has established various standing committees, each composed of Independent Trustees with varying backgrounds, to which the Board has assigned specific subject matter responsibilities in order to enhance effective decision-making by the Board. The Board, acting directly and through its Committees, requests and receives information concerning the annual consideration of the renewal of the fund's Advisory Contracts. The Board also meets as needed to consider matters specifically related to the Board's annual consideration of the renewal of Advisory Contracts. Members of the Board may also meet with trustees of other Fidelity funds through ad hoc joint committees to discuss certain matters relevant to the Fidelity funds.
At its July 2011 meeting, the Board of Trustees, including the Independent Trustees, unanimously determined to renew the fund's Advisory Contracts. In reaching its determination, the Board considered all factors it believed relevant, including (i) the nature, extent, and quality of the services to be provided to the fund and its shareholders (including the investment performance of the fund); (ii) the competitiveness of the fund's management fee and total expense ratio; (iii) the total costs of the services to be provided by and the profits to be realized by Fidelity from its relationship with the fund; (iv) the extent to which economies of scale would be realized as the fund grows; and (v) whether fee levels reflect these economies of scale, if any, for the benefit of fund shareholders.
In considering whether to renew the Advisory Contracts for the fund, the Board reached a determination, with the assistance of fund counsel and Independent Trustees' counsel and through the exercise of its business judgment, that the renewal of the Advisory Contracts is in the best interests of the fund and its shareholders and that the compensation payable under the Advisory Contracts is fair and reasonable. The Board's decision to renew the Advisory Contracts was not based on any single factor, but rather was based on a comprehensive consideration of all the information provided to the Board at its meetings throughout the year. The Board, in reaching its determination to renew the Advisory Contracts, is aware that shareholders in the fund have a broad range of investment choices available to them, including a wide choice among mutual funds offered by Fidelity's competitors, and that the fund's shareholders, who have the opportunity to review and weigh the disclosure provided by the fund in its prospectus and other public disclosures, have chosen to invest in this fund, managed by Fidelity.
Annual Report
Nature, Extent, and Quality of Services Provided. The Board considered the staffing within the investment adviser, FMR, and the sub-advisers (together, the Investment Advisers), including the backgrounds of the fund's investment personnel and the fund's investment objective and discipline. The Independent Trustees also had discussions with senior management of Fidelity's investment operations and investment groups. The Board considered the structure of the portfolio manager compensation program and whether this structure provides appropriate incentives to act in the best interests of the fund.
Resources Dedicated to Investment Management and Support Services. The Board and the Fund Oversight and Research Committees reviewed the general qualifications and capabilities of the Investment Advisers' investment staff, including its size, education, experience, and resources, as well as the Investment Advisers' approach to recruiting, training, managing, and compensating investment personnel. The Board also noted that FMR has devoted increased resources to non-U.S. offices. The Board noted that Fidelity's analysts have extensive resources, tools and capabilities which allow them to conduct sophisticated quantitative and fundamental analysis, as well as credit analysis of issuers, counterparties and enhancers. The Board also believes that Fidelity's investment professionals have sufficient access to global information and data so as to provide competitive investment results over time, and that those professionals also have access to sophisticated tools which permit them to assess portfolio construction and risk and performance attribution characteristics continuously, as well as to transmit new information and research conclusions rapidly around the world. Additionally, in their deliberations, the Board considered the Investment Advisers' trading capabilities and resources which are an integral part of the investment management process.
Shareholder and Administrative Services. The Board considered (i) the nature, extent, quality, and cost of advisory, administrative, and shareholder services performed by the Investment Advisers and their affiliates under the Advisory Contracts and under separate agreements covering transfer agency, pricing and bookkeeping, and securities lending services for the fund; (ii) the nature and extent of the investment adviser's supervision of third party service providers, principally custodians and subcustodians; and (iii) the resources devoted to, and the record of compliance with, the fund's compliance policies and procedures. The Board also reviewed the allocation of fund brokerage, including allocations to brokers affiliated with the Investment Advisers, the use of brokerage commissions to pay fund expenses, and the use of "soft" commission dollars to pay for research services.
The Board noted that the growth of fund assets over time across the complex allows Fidelity to reinvest in the development of services designed to enhance the value or convenience of the Fidelity funds as investment vehicles. These services include 24-hour access to account information and market information through telephone representatives and over the Internet, investor education materials and asset allocation tools, and the expanded availability of Fidelity Investor Centers, with 35 new branches opening since 2010.
Annual Report
Board Approval of Investment Advisory Contracts and
Management Fees - continued
Investment in a Large Fund Family. The Board considered the benefits to shareholders of investing in a Fidelity fund, including the benefits of investing in a fund that is part of a large family of funds offering a variety of investment disciplines and providing a large variety of mutual fund investor services. The Board noted that Fidelity had taken, or had made recommendations that resulted in the Fidelity funds taking, a number of actions over the previous year that benefited particular funds, including (i) continuing to dedicate additional resources to investment research and support of the senior management team that oversees asset management; (ii) rationalizing product lines through the mergers of six funds into other funds; (iii) continuing to migrate the Freedom Funds to dedicated lower cost underlying funds; (iv) obtaining shareholder approval to broaden the investment strategies for Fidelity Consumer Finance Portfolio, Fidelity Emerging Asia Fund, and Fidelity Environment and Alternative Energy Portfolio; (v) contractually agreeing to reduce the management fees and impose other expense limitations on Spartan 500 Index Fund and U.S. Bond Index Fund in connection with launching new institutional classes of these funds; (vi) changing the name, primary and supplemental benchmarks, and investment policies of Fidelity Global Strategies Fund to support the fund's flexible investment mandate and global orientation; and (vii) reducing the transfer agency account fee rates on certain accounts.
Investment Performance. The Board considered whether the fund has operated in accordance with its investment objective, as well as its record of compliance with its investment restrictions. It also reviewed the fund's absolute investment performance for each class, as well as the fund's relative investment performance for each class measured over multiple periods against (i) a broad-based securities market index, and (ii) a peer group of mutual funds deemed appropriate by Fidelity and reviewed by the Board. The following charts considered by the Board show, over the one-, three-, and five-year periods ended December 31, 2010, the cumulative total returns of Institutional Class (Class I) and Class B of the fund, the cumulative total returns of a broad-based securities market index ("benchmark"), and a range of cumulative total returns of a peer group of mutual funds identified by Morningstar, Inc. as having an investment style similar to that of the fund based on underlying portfolio holdings. The returns of Institutional Class (Class I) and Class B show the performance of the highest and lowest performing classes, respectively (based on five-year performance). The box within each chart shows the 25th percentile return (bottom of box) and the 75th percentile return (top of box) of the peer group. Returns shown above the box are in the first quartile and returns shown below the box are in the fourth quartile. The percentage beaten numbers noted below each chart correspond to the percentile box and represent the percentage of funds in the peer group whose performance was equal to or lower than that of the class indicated.
Annual Report
Fidelity Advisor Global Capital Appreciation Fund

The Board reviewed the fund's relative investment performance against its peer group and noted that the performance of Institutional Class (Class I) of the fund was in the first quartile for the one- and three-year periods and the third quartile for the five-year period. The Board also noted that the investment performance of Institutional Class (Class I) of the fund compared favorably to its benchmark for the one- and three-year periods, although the fund's five-year cumulative total return was lower than its benchmark. The Board considered that the variations in performance among the fund's classes reflect the variations in class expenses, which result in lower performance for higher expense classes. The Board also reviewed the fund's performance since inception as well as performance in the current year.
The Board also considered that the fund's management fee is subject to upward or downward adjustment depending upon whether, and to what extent, the fund's investment performance for the performance period exceeds, or is exceeded by, the record (over the same period) of a Board-approved performance adjustment index. The Board noted that the performance adjustment provides FMR with a strong economic incentive to seek to achieve superior performance for the fund's shareholders and helps to more closely align the interests of FMR and the fund's shareholders.
Based on its review, the Board concluded that the nature, extent, and quality of services provided to the fund under the Advisory Contracts should benefit the fund's shareholders.
Annual Report
Board Approval of Investment Advisory Contracts and
Management Fees - continued
Competitiveness of Management Fee and Total Expense Ratio. The Board considered the fund's management fee and total expense ratio compared to "mapped groups" of competitive funds and classes. Fidelity creates "mapped groups" by combining similar Lipper investment objective categories that have comparable management fee characteristics. Combining Lipper investment objective categories aids the Board's management fee and total expense ratio comparisons by broadening the competitive group used for comparison and by reducing the number of universes to which various Fidelity funds are compared.
Management Fee. The Board considered two proprietary management fee comparisons for the 12-month periods shown in the chart below. The group of Lipper funds used by the Board for management fee comparisons is referred to below as the "Total Mapped Group." The Total Mapped Group comparison focuses on a fund's standing relative to the total universe of comparable funds available to investors in terms of gross management fees before expense reimbursements or caps, and without giving effect to the fund's performance adjustment. "TMG %" represents the percentage of funds in the Total Mapped Group that had management fees that were lower than the fund's. For example, a TMG % of 16% means that 84% of the funds in the Total Mapped Group had higher management fees than the fund. The "Asset-Size Peer Group" (ASPG) comparison focuses on a fund's standing relative to non-Fidelity funds similar in size to the fund within the Total Mapped Group. The ASPG represents at least 15% of the funds in the Total Mapped Group with comparable asset size and management fee characteristics, subject to a minimum of 50 funds (or all funds in the Total Mapped Group if fewer than 50). Additional information, such as the ASPG quartile in which the fund's management fee ranked and the impact of the fund's performance adjustment, is also included in the chart and considered by the Board.
Annual Report
Fidelity Advisor Global Capital Appreciation Fund

The Board noted that the fund's management fee ranked below the median of its Total Mapped Group and below the median of its ASPG for 2010. The Board also noted the effect of the fund's positive performance adjustment on the fund's management fee ranking. The Board noted that the performance adjustment for each year represents calculations for performance periods that differ from the periods shown in the performance charts above.
Based on its review, the Board concluded that the fund's management fee is fair and reasonable in light of the services that the fund receives and the other factors considered.
Total Expense Ratio. In its review of each class's total expense ratio, the Board considered the fund's management fee as well as other fund or class expenses, as applicable, such as transfer agent fees, pricing and bookkeeping fees, fund-paid 12b-1 fees, and custodial, legal, and audit fees. The Board also noted the effects of any waivers and reimbursements on fees and expenses, as well as the impact of the fund's performance adjustment. As part of its review, the Board also considered the current and historical total expense ratios of each class of the fund compared to competitive fund median expenses. Each class of the fund is compared to those funds and classes in the Total Mapped Group (used by the Board for management fee comparisons) that have a similar sales load structure.
The Board noted that the total expense ratio of each of Class A and Class B ranked below its competitive median for 2010, the total expense ratio of Class C ranked equal to its competitive median for 2010, and the total expense ratio of each of Class T and Institutional Class ranked above its competitive median for 2010. The Board considered that various factors, including 12b-1 fees, positive or negative performance adjustments, and relatively higher other expenses in the case of small fund size, can affect total expense ratios. The Board noted that the total expense ratio of Class T was above the competitive median primarily because of higher 12b-1 fees on Class T. Class T has a higher 12b-1 fee, but a lower front-end sales charge, than traditionally priced front-end sales charge classes. The Board noted that the fund offers multiple classes, each of which has a different sales load and 12b-1 fee structure, and that the multiple structures are intended to offer a range of pricing options for the intermediary market. The Board also noted that the total expense ratios of the classes vary primarily by the level of their 12b-1 fees, although differences in transfer agent fees may also cause expenses to vary from class to class.
Annual Report
Board Approval of Investment Advisory Contracts and
Management Fees - continued
Fees Charged to Other Fidelity Clients. The Board also considered Fidelity fee structures and other information with respect to clients of FMR and its affiliates, such as other mutual funds advised or subadvised by FMR or its affiliates, pension plan clients, and other institutional clients. In March 2010, the Board created an ad hoc joint committee with the board of other Fidelity funds (the Committee) to review and compare Fidelity's institutional investment advisory business with its business of providing services to the Fidelity funds, including the differences in services provided, fees charged, and costs incurred, as well as competition in their respective marketplaces.
Based on its review of total expense ratios and fees charged to other Fidelity clients, the Board concluded that the total expense ratio of each class of the fund was reasonable, although in some cases above the median of the universe presented for comparison, in light of the services that the fund and its shareholders receive and the other factors considered, including the findings of the Committee.
Costs of the Services and Profitability. The Board considered the revenues earned and the expenses incurred by Fidelity in conducting the business of developing, marketing, distributing, managing, administering and servicing the fund and its shareholders. The Board also considered the level of Fidelity's profits in respect of all the Fidelity funds.
On an annual basis, FMR presents to the Board Fidelity's profitability for the fund. Fidelity calculates the profitability for each fund, as well as aggregate profitability for groups of Fidelity funds and all Fidelity funds, using a series of detailed revenue and cost allocation methodologies which originate with the books and records of Fidelity on which Fidelity's audited financial statements are based. The Audit Committee of the Board reviews any significant changes from the prior year's methodologies.
PricewaterhouseCoopers LLP (PwC), independent registered public accounting firm and auditor to Fidelity and certain Fidelity funds, has been engaged annually by the Board as part of the Board's assessment of Fidelity's profitability analysis. PwC's engagement includes the review and assessment of Fidelity's methodologies used in determining the revenues and expenses attributable to Fidelity's mutual fund business, and completion of agreed-upon procedures surrounding the mathematical accuracy of fund profitability and its conformity to allocation methodologies. After considering PwC's reports issued under the engagement and information provided by Fidelity, the Board concluded that while other allocation methods may also be reasonable, Fidelity's profitability methodologies are reasonable in all material respects.
Annual Report
The Board also reviewed Fidelity's non-fund businesses and fall-out benefits related to the mutual fund business as well as cases where Fidelity's affiliates may benefit from or be related to the fund's business.
The Board considered the costs of the services provided by and the profits realized by Fidelity in connection with the operation of the fund and was satisfied that the profitability was not excessive in the circumstances.
Economies of Scale. The Board considered whether there have been economies of scale in respect of the management of the Fidelity funds, whether the Fidelity funds (including the fund) have appropriately benefited from any such economies of scale, and whether there is potential for realization of any further economies of scale. The Board considered the extent to which the fund will benefit from economies of scale through increased services to the fund, through waivers or reimbursements, or through fee or expense reductions. The Board also noted that in 2009, it and the board of other Fidelity funds created an ad hoc committee (the Economies of Scale Committee) to analyze whether FMR attains economies of scale in respect of the management and servicing of the Fidelity funds, whether the Fidelity funds have appropriately benefited from such economies of scale, and whether there is potential for realization of any further economies of scale.
The Board recognized that the fund's management contract incorporates a "group fee" structure, which provides for lower group fee rates as total fund assets under FMR's management increase, and for higher group fee rates as total fund assets under FMR's management decrease. FMR calculates the group fee rates based on a tiered asset "breakpoint" schedule that varies based on asset class. The Board considered that the group fee is designed to deliver the benefits of economies of scale to fund shareholders when total Fidelity fund assets increase, even if assets of any particular fund are unchanged or have declined, because some portion of Fidelity's costs are attributable to services provided to all Fidelity funds, and all funds benefit if those costs can be allocated among more assets. The Board concluded that, given the group fee structure, fund shareholders will benefit from lower management fees as assets under FMR's management increase at the fund complex level, regardless of whether Fidelity achieves any such economies of scale.
Annual Report
Board Approval of Investment Advisory Contracts and
Management Fees - continued
The Board concluded, taking into account the analysis of the Economies of Scale Committee, that any potential economies of scale are being appropriately shared between fund shareholders and Fidelity.
Additional Information Requested by the Board. In order to develop fully the factual basis for consideration of the Fidelity funds' Advisory Contracts, the Board requested and received additional information on certain topics, including (i) fund performance trends, actions to be taken by FMR to improve certain funds' overall performance, and Fidelity's long-term strategies for certain funds; (ii) portfolio manager changes that have occurred during the past year and length of portfolio manager tenure for different categories of funds over time; (iii) Fidelity's compensation structure for portfolio managers and other key personnel and strategies for attracting and retaining non-investment personnel; (iv) the amount of the investment that each portfolio manager has made in the Fidelity fund(s) that he or she manages; (v) historical trends in Fidelity's realization of fall-out benefits; (vi) Fidelity's group fee structures and the rationale for the individual fee rates of certain funds; (vii) fund profitability methodology and the impact of certain factors on fund profitability results; (viii) trends regarding industry use of performance fee structures and Fidelity's compliance practices with respect to performance adjustment calculations; (ix) the fee structures in place for certain other Fidelity clients; and (x) explanations regarding the relative total expense ratios of certain funds and classes, total expense competitive trends, and actions that might be taken by FMR to reduce total expense ratios for certain funds and classes.
Based on its evaluation of all of the conclusions noted above, and after considering all factors it believed relevant, the Board ultimately concluded that the advisory fee structures are fair and reasonable, and that the fund's Advisory Contracts should be renewed.
Annual Report
Investment Adviser
Fidelity Management & Research Company
Boston, MA
Investment Sub-Advisers
FMR Co., Inc.
Fidelity Management & Research
(U.K.) Inc.
FIL Investment Advisors
FIL Investments (Japan) Limited
FIL Investment Advisors (UK) Limited
Fidelity Management & Research
(Hong Kong) Limited
Fidelity Management & Research
(Japan) Inc.
General Distributor
Fidelity Distributors Corporation
Boston, MA
Transfer and Service Agents
Fidelity Investments Institutional Operations Company, Inc.
Boston, MA
Fidelity Service Company, Inc.
Boston, MA
Custodian
State Street Bank and Trust Company
Quincy, MA
AGLO-UANN-1211
1.784744.108

(Fidelity Investment logo)(registered trademark)
Fidelity Advisor®
Global Capital Appreciation
Fund - Institutional Class
Annual Report
October 31, 2011
Contents
Chairman's Message | (Click Here) | The Chairman's message to shareholders. |
Performance | (Click Here) | How the fund has done over time. |
Management's Discussion of Fund Performance | (Click Here) | The Portfolio Manager's review of fund performance and strategy. |
Shareholder Expense Example | (Click Here) | An example of shareholder expenses. |
Investment Changes | (Click Here) | A summary of major shifts in the fund's investments over the past six months. |
Investments | (Click Here) | A complete list of the fund's investments with their market values. |
Financial Statements | (Click Here) | Statements of assets and liabilities, operations, and changes in net assets, as well as financial highlights. |
Notes | (Click Here) | Notes to financial statements. |
Report of Independent Registered Public Accounting Firm | (Click Here) | |
Trustees and Officers | (Click Here) | |
Distributions | (Click Here) | |
Board Approval of Investment Advisory Contracts and Management Fees | (Click Here) | |
To view a fund's proxy voting guidelines and proxy voting record for the 12-month period ended June 30, visit http://www.fidelity.com/proxyvotingresults or visit the Securities and Exchange Commission's (SEC) web site at http://www.sec.gov. You may also call 1-877-208-0098 to request a free copy of the proxy voting guidelines.
Standard & Poor's, S&P and S&P 500 are registered service marks of The McGraw-Hill Companies, Inc. and have been licensed for use by Fidelity Distributors Corporation.
Other third party marks appearing herein are the property of their respective owners.
All other marks appearing herein are registered or unregistered trademarks or service marks of FMR LLC or an affiliated company.
Annual Report
This report and the financial statements contained herein are submitted for the general information of the shareholders of the fund. This report is not authorized for distribution to prospective investors in the fund unless preceded or accompanied by an effective prospectus.
A fund files its complete schedule of portfolio holdings with the SEC for the first and third quarters of each fiscal year on Form N-Q. Forms N-Q are available on the SEC's web site at http://www.sec.gov. A fund's Forms N-Q may be reviewed and copied at the SEC's Public Reference Room in Washington, DC. Information regarding the operation of the SEC's Public Reference Room may be obtained by calling 1-800-SEC-0330. For a complete list of a fund's portfolio holdings, view the most recent holdings listing, semiannual report, or annual report on Fidelity's web site at http://www.fidelity.com, http://www.advisor.fidelity.com, or http://www.401k.com, as applicable.
NOT FDIC INSURED • MAY LOSE VALUE • NO BANK GUARANTEE
Neither the fund nor Fidelity Distributors Corporation is a bank.
Annual Report
(photo_of_James_C_Curvey)
Dear Shareholder:
Global equity markets began the fourth quarter on a strong note, sharply reversing course in October amid strong corporate earnings, better-than-expected economic news and the promise of a resolution to the sovereign debt crisis in Europe. The mini rally followed a third quarter marked by a significant downturn in July and August, which heightened investor anxiety and set off a wave of volatility that hampered most major asset classes through the end of September. Financial markets are difficult to predict, of course, but you can help put the odds in your favor by following these time-tested investment principles.
One of the basic tenets is to invest according to your time horizon. For long-term investors, riding out the markets' inevitable ups and downs has proven much more effective than making decisions based on short-term developments. If your goal is approaching, you can also benefit from patience and restraint, rather than attempting to time the market. No matter your time horizon, missing only a few of the markets' best days can significantly diminish returns. Patience also affords the benefits of compounding - earning interest on additional income or reinvested dividends and capital gains. While staying the course doesn't eliminate risk, it can considerably lessen the negative impact of short-term downturns.
Asset allocation is another principle to manage risk. As you spread your portfolio among the asset classes, be sure to consider your time horizon, risk tolerance and investment objectives. Younger investors may be better served by emphasizing equities, which historically have been the best-performing asset class over time. Investors who are nearing a specific goal, such as retirement or sending a child to college, may choose to favor bonds and other investments that have tended to be more stable. Studies indicate that asset allocation is the single most important determinant of a portfolio's long-term success. After deciding on a suitable allocation strategy, make sure your portfolio is adequately diversified, with exposure to stocks of small-, mid- and large-cap companies in a range of sectors, for example. And today, more than ever, geographic diversification should be taken into account.
Lastly, investing a certain amount of money on a regular basis - a principle known as dollar-cost averaging - can help lower the average cost of your purchases, while also giving you the discipline to avoid selling weak performers just prior to an upswing, or chasing a hot performer just before a correction.
We invite you to learn more by visiting us on the Internet, dropping by one of our Investor Centers or calling us by phone. It is our privilege to provide the resources you need to choose investments that are right for you.
Sincerely,
(The acting chairman's signature appears here.)
James C. Curvey
Acting Chairman
Annual Report
Average annual total return reflects the change in the value of an investment, assuming reinvestment of the class' distributions from dividend income and capital gains (the profits earned upon the sale of securities that have grown in value, if any) and assuming a constant rate of performance each year. The $10,000 table and the fund's returns do not reflect the deduction of taxes that a shareholder would pay on fund distributions or the redemption of fund shares. During periods of reimbursement by Fidelity, a fund's total return will be greater than it would be had the reimbursement not occurred. How a fund did yesterday is no guarantee of how it will do tomorrow.
Average Annual Total Returns
Periods ended October 31, 2011 | Past 1
year | Past 5
years | Past 10
years |
Institutional Class | -15.60% | -2.50% | 3.17% |
$10,000 Over 10 Years
Let's say hypothetically that $10,000 was invested in Fidelity Advisor® Global Capital Appreciation Fund - Institutional Class on October 31, 2001. The chart shows how the value of your investment would have changed, and also shows how the MSCI® ACWI® (All Country World Index) Index performed over the same period.
Annual Report
Market Recap: Global equities were rocked by a number of headline events during the year ending October 31, 2011. Stocks posted a solid advance for the first half of the period, despite concern about sovereign debt in Europe, a devastating earthquake/tsunami in Japan, and political upheaval in the Middle East and North Africa. Sentiment turned decidedly negative in the second half, however, as fresh worries about Europe, inflation in China, gridlock over raising the debt ceiling in the U.S. - along with Standard & Poor's downgrade of the nation's long-term sovereign credit rating - and a dimmed outlook for global growth caused markets to suffer declines that intensified in August and September. October brought with it yet another dramatic swing, as better-than-expected U.S. economic data and prospects for a resolution to the European debt debacle prompted buyers to storm back onto the scene in search of bargains. Those gains - along with favorable currency fluctuations overall - helped lift the MSCI® ACWI® (All Country World Index) Index 0.75% for the year. Within the index, Europe and emerging markets declined the most, with many countries in these areas sustaining steep losses. By contrast, the U.S. (+8%), which dominates the index, delivered a positive result, as did Australia (+4%) and Switzerland (+3%). Japan showed resilience in the wake of its natural disasters, falling only 2%.
Comments from Thomas Allen, Portfolio Manager of Fidelity Advisor® Global Capital Appreciation Fund: During the year, the fund's Institutional Class shares returned -15.60%, significantly lagging the MSCI index. Stock selection in health care curbed relative performance the most. Stock picking in information technology and financials, together with positioning in energy and consumer staples, also hurt. The largest detractor by a wide margin was Nanosphere, which executed poorly when rolling out its genomic and protein testing equipment. The fund also was hurt by Longtop Financial Technologies, a Chinese software firm, and Corning, a maker of glass panels for televisions and personal computers. Conversely, stock picking among retailers was a positive, along with overweighting software/services and having little exposure to banks. Geographically, stock selection in Japan contributed significantly. The fund's top-three relative contributors were Japan-based: eyewear retailer Megane Top, price comparison portal Kakaku.com and M3, a supplier of data for physicians. All of the stocks I've mentioned in this report, except for Corning, were not part of the index. Longtop was not held by the fund at period end.
The views expressed above reflect those of the portfolio manager(s) only through the end of the period as stated on the cover of this report and do not necessarily represent the views of Fidelity or any other person in the Fidelity organization. Any such views are subject to change at any time based upon market or other conditions and Fidelity disclaims any responsibility to update such views. These views may not be relied on as investment advice and, because investment decisions for a Fidelity fund are based on numerous factors, may not be relied on as an indication of trading intent on behalf of any Fidelity fund.
Annual Report
Shareholder Expense Example
As a shareholder of the Fund, you incur two types of costs: (1) transaction costs, including sales charges (loads) on purchase payments or redemption proceeds, redemption fees, and (2) ongoing costs, including management fees, distribution and/or service (12b-1) fees and other Fund expenses. This Example is intended to help you understand your ongoing costs (in dollars) of investing in the Fund and to compare these costs with the ongoing costs of investing in other mutual funds.
The Example is based on an investment of $1,000 invested at the beginning of the period and held for the entire period (May 1, 2011 to October 31, 2011).
Actual Expenses
The first line of the accompanying table for each class of the Fund provides information about actual account values and actual expenses. You may use the information in this line, together with the amount you invested, to estimate the expenses that you paid over the period. Simply divide your account value by $1,000.00 (for example, an $8,600 account value divided by $1,000.00 = 8.6), then multiply the result by the number in the first line for a class of the Fund under the heading entitled "Expenses Paid During Period" to estimate the expenses you paid on your account during this period. In addition, the Fund, as a shareholder in the underlying Fidelity Central Funds, will indirectly bear its pro-rata share of the fees and expenses incurred by the underlying Fidelity Central Funds. These fees and expenses are not included in the Fund's annualized expense ratio used to calculate the expense estimate in the table below.
Hypothetical Example for Comparison Purposes
The second line of the accompanying table for each class of the Fund provides information about hypothetical account values and hypothetical expenses based on a Class' actual expense ratio and an assumed rate of return of 5% per year before expenses, which is not the Class' actual return. The hypothetical account values and expenses may not be used to estimate the actual ending account balance or expenses you paid for the period. You may use this information to compare the ongoing costs of investing in the Fund and other funds. To do so, compare this 5% hypothetical example with the 5% hypothetical examples that appear in the shareholder reports of the other funds. In addition, the Fund, as a shareholder in the underlying Fidelity Central Funds, will indirectly bear its pro-rata share of the fees and expenses incurred by the underlying Fidelity Central Funds. These fees and expenses are not included in the Fund's annualized expense ratio used to calculate the expense estimate in the table below.
Please note that the expenses shown in the table are meant to highlight your ongoing costs only and do not reflect any transaction costs. Therefore, the second line of the table is useful in comparing ongoing costs only, and will not help you determine the relative total costs of owning different funds. In addition, if these transactional costs were included, your costs would have been higher.
Annual Report
Shareholder Expense Example - continued
| Annualized
Expense Ratio | Beginning
Account Value
May 1, 2011 | Ending
Account Value
October 31, 2011 | Expenses Paid
During Period*
May 1, 2011 to
October 31, 2011 |
Class A | 1.45% | | | |
Actual | | $ 1,000.00 | $ 842.70 | $ 6.73 |
HypotheticalA | | $ 1,000.00 | $ 1,017.90 | $ 7.38 |
Class T | 1.70% | | | |
Actual | | $ 1,000.00 | $ 841.30 | $ 7.89 |
HypotheticalA | | $ 1,000.00 | $ 1,016.64 | $ 8.64 |
Class B | 2.20% | | | |
Actual | | $ 1,000.00 | $ 839.00 | $ 10.20 |
HypotheticalA | | $ 1,000.00 | $ 1,014.12 | $ 11.17 |
Class C | 2.20% | | | |
Actual | | $ 1,000.00 | $ 838.90 | $ 10.20 |
HypotheticalA | | $ 1,000.00 | $ 1,014.12 | $ 11.17 |
Institutional Class | 1.14% | | | |
Actual | | $ 1,000.00 | $ 843.20 | $ 5.30 |
HypotheticalA | | $ 1,000.00 | $ 1,019.46 | $ 5.80 |
A 5% return per year before expenses
* Expenses are equal to each Class' annualized expense ratio, multiplied by the average account value over the period, multiplied by 184/365 (to reflect the one-half year period).
Annual Report
Investment Changes (Unaudited)
Top Five Stocks as of October 31, 2011 |
| % of fund's
net assets | % of fund's net assets
6 months ago |
Google, Inc. Class A (United States of America, Internet Software & Services) | 4.6 | 3.5 |
Royal Dutch Shell PLC Class B sponsored ADR (United Kingdom, Oil, Gas & Consumable Fuels) | 4.3 | 3.0 |
MasterCard, Inc. Class A (United States of America, IT Services) | 3.9 | 0.6 |
Copa Holdings SA Class A (Panama, Airlines) | 3.9 | 3.1 |
Kakaku.com, Inc. (Japan, Internet Software & Services) | 3.7 | 1.5 |
| 20.4 | |
Top Five Market Sectors as of October 31, 2011 |
| % of fund's
net assets | % of fund's net assets
6 months ago |
Information Technology | 32.3 | 30.8 |
Consumer Discretionary | 18.2 | 16.1 |
Health Care | 14.8 | 19.1 |
Energy | 9.4 | 12.1 |
Financials | 9.2 | 7.9 |
Top Five Countries as of October 31, 2011 |
(excluding cash equivalents) | % of fund's
net assets | % of fund's net assets
6 months ago |
United States of America | 35.1 | 38.4 |
India | 16.5 | 18.7 |
Japan | 14.4 | 9.8 |
Canada | 5.5 | 7.0 |
United Kingdom | 5.4 | 4.2 |
Percentages are adjusted for the effect of open futures contracts, if applicable. |
Asset Allocation (% of fund's net assets) |
As of October 31, 2011 | As of April 30, 2011 |
| Stocks 98.0% | | | Stocks 98.2% | |
| Short-Term
Investments and
Net Other Assets 2.0% | | | Short-Term
Investments and
Net Other Assets 1.8% | |

Annual Report
Investments October 31, 2011
Showing Percentage of Net Assets
Common Stocks - 98.0% |
| Shares | | Value |
Australia - 1.2% |
carsales.com Ltd. (d) | 205,327 | | $ 1,061,541 |
Newcrest Mining Ltd. | 6,393 | | 225,962 |
TOTAL AUSTRALIA | | 1,287,503 |
Bailiwick of Jersey - 0.0% |
Velti PLC (a) | 3,750 | | 31,575 |
Bermuda - 2.5% |
CNPC (Hong Kong) Ltd. | 74,000 | | 103,658 |
Fairwood Holdings Ltd. | 443,500 | | 577,654 |
Invesco Ltd. | 19,300 | | 387,351 |
Luk Fook Holdings International Ltd. | 275,000 | | 1,179,035 |
Marvell Technology Group Ltd. (a) | 20,700 | | 289,593 |
TOTAL BERMUDA | | 2,537,291 |
Brazil - 0.9% |
Amil Participacoes SA | 7,700 | | 77,888 |
Drogasil SA | 100 | | 629 |
Marisa Lojas SA | 100 | | 1,380 |
Porto Seguro SA | 16,600 | | 177,871 |
Tegma Gestao Logistica | 20,600 | | 267,517 |
Totvs SA | 24,300 | | 403,302 |
TOTAL BRAZIL | | 928,587 |
Canada - 5.5% |
Barrick Gold Corp. | 69,700 | | 3,440,775 |
Bellhaven Copper & Gold, Inc. (a) | 832,000 | | 484,085 |
Canadian Natural Resources Ltd. | 3,200 | | 112,868 |
Carpathian Gold, Inc. (a) | 2,543,500 | | 1,097,161 |
Petrobank Energy & Resources Ltd. | 16,400 | | 147,573 |
Petrominerales Ltd. | 1,044 | | 27,544 |
Peyto Exploration & Development Corp. | 100 | | 2,182 |
PHX Energy Services Corp. | 9,200 | | 94,598 |
SunOpta, Inc. (a) | 11,500 | | 60,030 |
Talisman Energy, Inc. | 12,500 | | 177,309 |
TOTAL CANADA | | 5,644,125 |
Cayman Islands - 0.9% |
Biostime International Holdings Ltd. | 60,000 | | 106,997 |
Daphne International Holdings Ltd. | 190,000 | | 198,504 |
Shenguan Holdings Group Ltd. | 422,000 | | 226,722 |
Common Stocks - continued |
| Shares | | Value |
Cayman Islands - continued |
Shenzhou International Group Holdings Ltd. | 297,000 | | $ 382,070 |
SITC International Holdings Co. Ltd. | 113,000 | | 29,188 |
TOTAL CAYMAN ISLANDS | | 943,481 |
Denmark - 0.1% |
Carlsberg A/S Series B | 1,100 | | 74,878 |
Finland - 0.0% |
Nokian Tyres PLC | 600 | | 22,046 |
France - 1.8% |
1000mercis | 2,800 | | 154,609 |
Edenred | 9,600 | | 272,352 |
Maisons France Confort | 28,700 | | 1,028,694 |
Ubisoft Entertainment SA (a) | 62,564 | | 377,845 |
TOTAL FRANCE | | 1,833,500 |
Hong Kong - 0.5% |
AIA Group Ltd. | 175,600 | | 536,939 |
India - 16.5% |
Cipla Ltd. | 14,696 | | 88,797 |
CRISIL Ltd. | 12,790 | | 230,989 |
eClerx | 74,317 | | 1,138,764 |
FDC Ltd. | 609,912 | | 1,149,698 |
Hawkins Cookers Ltd. | 4,513 | | 138,700 |
ICRA Ltd. | 53,875 | | 991,226 |
Indoco Remedies Ltd. | 187,943 | | 1,456,106 |
INFO Edge India Ltd. | 175,086 | | 2,442,109 |
Ipca Laboratories Ltd. | 25,000 | | 130,414 |
Jubilant Foodworks Ltd. (a) | 175,042 | | 2,884,601 |
Opto Circuits India Ltd. | 575,876 | | 2,959,175 |
Page Industries Ltd. | 1,375 | | 71,556 |
Prakash Industries Ltd. | 83,027 | | 78,935 |
Sobha Developers Ltd. | 255,112 | | 1,319,474 |
Sun TV Ltd. | 350,124 | | 1,869,166 |
TOTAL INDIA | | 16,949,710 |
Ireland - 0.6% |
Trinity Biotech PLC sponsored ADR | 58,441 | | 599,605 |
Japan - 14.4% |
CyberAgent, Inc. | 141 | | 475,275 |
DeNA Co. Ltd. | 13,600 | | 587,073 |
Kakaku.com, Inc. | 95,400 | | 3,777,846 |
Kenedix, Inc. (a) | 18,158 | | 2,692,254 |
Common Stocks - continued |
| Shares | | Value |
Japan - continued |
MEGANE TOP CO. LTD. | 49,650 | | $ 579,876 |
Proto Corp. | 70,200 | | 2,383,941 |
So-net M3, Inc. (d) | 708 | | 3,202,287 |
Start Today Co. Ltd. | 28,600 | | 605,088 |
Tsutsumi Jewelry Co. Ltd. | 22,000 | | 512,715 |
TOTAL JAPAN | | 14,816,355 |
Korea (South) - 1.4% |
MegaStudy Co. Ltd. | 9,976 | | 1,099,234 |
Orion Corp. | 65 | | 34,741 |
Woongjin Coway Co. Ltd. | 9,810 | | 336,683 |
TOTAL KOREA (SOUTH) | | 1,470,658 |
Luxembourg - 1.0% |
GlobeOp Financial Services SA | 221,802 | | 1,016,601 |
Mexico - 0.4% |
Genomma Lab Internacional SA de CV (a) | 185,400 | | 386,524 |
Netherlands - 0.2% |
Randstad Holdings NV | 4,947 | | 176,460 |
Norway - 0.3% |
Schibsted ASA (B Shares) | 11,600 | | 303,563 |
Panama - 3.9% |
Copa Holdings SA Class A | 58,302 | | 4,026,919 |
Poland - 0.2% |
Eurocash SA | 26,800 | | 214,879 |
Russia - 3.4% |
Pharmstandard OJSC (a) | 39,933 | | 2,794,385 |
Vozrozhdenie Bank | 26,600 | | 695,049 |
TOTAL RUSSIA | | 3,489,434 |
Singapore - 0.1% |
Breadtalk Group Ltd. | 190,000 | | 77,477 |
Sweden - 0.7% |
EnergyO Solutions AB (a) | 98,507 | | 341,474 |
Swedol AB | 82,700 | | 380,548 |
TOTAL SWEDEN | | 722,022 |
Taiwan - 1.0% |
HTC Corp. | 47,700 | | 1,071,988 |
United Kingdom - 5.4% |
Ascent Resources PLC (a) | 2,035,600 | | 119,488 |
Common Stocks - continued |
| Shares | | Value |
United Kingdom - continued |
Ashtead Group PLC | 171,000 | | $ 426,528 |
ASOS PLC (a) | 5,100 | | 127,620 |
Royal Dutch Shell PLC Class B sponsored ADR | 61,500 | | 4,415,700 |
Royalblue Group PLC | 16,300 | | 426,496 |
TOTAL UNITED KINGDOM | | 5,515,832 |
United States of America - 35.1% |
Advance Auto Parts, Inc. | 23,400 | | 1,522,638 |
Aegion Corp. (a) | 18,000 | | 266,220 |
Allscripts-Misys Healthcare Solutions, Inc. (a) | 8,900 | | 170,435 |
Apache Corp. | 25,500 | | 2,540,565 |
Apple, Inc. (a) | 2,600 | | 1,052,428 |
Applied Materials, Inc. | 78,500 | | 967,120 |
Brookdale Senior Living, Inc. (a) | 5,000 | | 82,900 |
CME Group, Inc. | 1,000 | | 275,560 |
Cognex Corp. | 7,470 | | 253,158 |
Computer Task Group, Inc. (a) | 138,500 | | 1,768,645 |
Con-way, Inc. | 3,200 | | 94,304 |
Corning, Inc. | 248,000 | | 3,543,920 |
Cymer, Inc. (a) | 9,200 | | 399,740 |
Discover Financial Services | 41,300 | | 973,028 |
eBay, Inc. (a) | 95,900 | | 3,052,497 |
EnerNOC, Inc. (a) | 4,259 | | 37,777 |
Entegris, Inc. (a) | 43,000 | | 385,280 |
Genomic Health, Inc. (a) | 6,280 | | 134,392 |
Google, Inc. Class A (a) | 8,000 | | 4,741,121 |
Hasbro, Inc. | 7,300 | | 277,838 |
Health Management Associates, Inc. Class A (a) | 14,900 | | 130,524 |
Impax Laboratories, Inc. (a) | 10,800 | | 204,228 |
Infinity Pharmaceuticals, Inc. (a)(d) | 19,900 | | 150,643 |
Intuit, Inc. | 12,900 | | 692,343 |
IPC The Hospitalist Co., Inc. (a) | 4,700 | | 197,071 |
MasterCard, Inc. Class A | 11,600 | | 4,027,984 |
McKesson Corp. | 3,900 | | 318,045 |
Nabors Industries Ltd. (a) | 2,100 | | 38,493 |
Nanosphere, Inc. (a) | 435,370 | | 657,409 |
NeuStar, Inc. Class A (a) | 2,300 | | 73,117 |
Noble Energy, Inc. | 2,600 | | 232,284 |
NVE Corp. (a) | 2,421 | | 133,203 |
Pioneer Natural Resources Co. | 3,600 | | 302,040 |
Polycom, Inc. (a) | 15,500 | | 256,215 |
QEP Resources, Inc. | 40,600 | | 1,443,330 |
Common Stocks - continued |
| Shares | | Value |
United States of America - continued |
RF Micro Devices, Inc. (a) | 5,800 | | $ 42,572 |
Ross Stores, Inc. | 3,900 | | 342,147 |
Rovi Corp. (a) | 18,200 | | 901,628 |
rue21, Inc. (a)(d) | 3,100 | | 82,584 |
Smart Balance, Inc. (a) | 166,500 | | 1,090,575 |
Solera Holdings, Inc. | 10,100 | | 551,763 |
Synta Pharmaceuticals Corp. (a)(d) | 51,067 | | 188,948 |
TD Ameritrade Holding Corp. | 5,500 | | 92,290 |
The Walt Disney Co. | 31,200 | | 1,088,256 |
Thermo Fisher Scientific, Inc. (a) | 2,400 | | 120,648 |
Zoltek Companies, Inc. (a) | 30,341 | | 219,972 |
TOTAL UNITED STATES OF AMERICA | | 36,117,878 |
TOTAL COMMON STOCKS (Cost $107,957,434) | 100,795,830 |
Money Market Funds - 2.5% |
| | | |
Fidelity Cash Central Fund, 0.12% (b) | 355,467 | | 355,467 |
Fidelity Securities Lending Cash Central Fund, 0.11% (b)(c) | 2,144,666 | | 2,144,666 |
TOTAL MONEY MARKET FUNDS (Cost $2,500,133) | 2,500,133 |
TOTAL INVESTMENT PORTFOLIO - 100.5% (Cost $110,457,567) | | 103,295,963 |
NET OTHER ASSETS (LIABILITIES) - (0.5)% | | (466,144) |
NET ASSETS - 100% | $ 102,829,819 |
Legend |
(a) Non-income producing |
(b) Affiliated fund that is available only to investment companies and other accounts managed by Fidelity Investments. The rate quoted is the annualized seven-day yield of the fund at period end. A complete unaudited listing of the fund's holdings as of its most recent quarter end is available upon request. In addition, each Fidelity Central Fund's financial statements, which are not covered by the Fund's Report of Independent Registered Public Accounting Firm, are available on the SEC's website or upon request. |
(c) Investment made with cash collateral received from securities on loan. |
(d) Security or a portion of the security is on loan at period end. |
Affiliated Central Funds |
Information regarding fiscal year to date income earned by the Fund from investments in Fidelity Central Funds is as follows: |
Fund | Income earned |
Fidelity Cash Central Fund | $ 11,400 |
Fidelity Securities Lending Cash Central Fund | 95,446 |
Total | $ 106,846 |
Other Affiliated Issuers |
An affiliated company is a company in which the Fund has ownership of at least 5% of the voting securities. Fiscal year to date transactions with companies which are or were affiliates are as follows: |
Affiliate | Value, beginning of period | Purchases | Sales Proceeds | Dividend Income | Value,
end of
period |
Nanosphere, Inc. | $ 911,696 | $ 8,709,271 | $ 2,480,836 | $ - | $ - |
Other Information |
The following is a summary of the inputs used, as of October 31, 2011, involving the Fund's assets and liabilities carried at fair value. The inputs or methodology used for valuing securities may not be an indication of the risk associated with investing in those securities. For more information on valuation inputs, and their aggregation into the levels used in the table below, please refer to the Security Valuation section in the accompanying Notes to Financial Statements. |
Valuation Inputs at Reporting Date: |
Description | Total | Level 1 | Level 2 | Level 3 |
Investments in Securities: | | | | |
Equities: | | | | |
United States of America | $ 36,117,878 | $ 36,117,878 | $ - | $ - |
India | 16,949,710 | - | 16,949,710 | - |
Japan | 14,816,355 | - | 14,816,355 | - |
Canada | 5,644,125 | 5,644,125 | - | - |
United Kingdom | 5,515,832 | 5,515,832 | - | - |
Panama | 4,026,919 | 4,026,919 | - | - |
Russia | 3,489,434 | 3,489,434 | - | - |
Bermuda | 2,537,291 | 676,944 | 1,860,347 | - |
France | 1,833,500 | 1,833,500 | - | - |
Other | 9,864,786 | 4,476,740 | 5,388,046 | - |
Money Market Funds | 2,500,133 | 2,500,133 | - | - |
Total Investments in Securities: | $ 103,295,963 | $ 64,281,505 | $ 39,014,458 | $ - |
Transfers from Level 1 to Level 2 during the period were $19,761,777. |
Income Tax Information |
At October 31, 2011, the Fund had a capital loss carryforward of approximately $24,751,307 of which $7,618,418, $3,018,401 and $14,114,488 will expire in fiscal 2016, 2017 and 2019, respectively. Capital loss carryforwards are only available to offset future capital gains of the Fund to the extent provided by regulations and may be limited. |
See accompanying notes which are an integral part of the financial statements.
Annual Report
Statement of Assets and Liabilities
| October 31, 2011 |
Assets | | |
Investment in securities, at value (including securities loaned of $2,034,944) - See accompanying schedule: Unaffiliated issuers (cost $107,957,434) | $ 100,795,830 | |
Fidelity Central Funds (cost $2,500,133) | 2,500,133 | |
Total Investments (cost $110,457,567) | | $ 103,295,963 |
Foreign currency held at value (cost $1,961,084) | | 1,873,033 |
Receivable for investments sold | | 612,177 |
Receivable for fund shares sold | | 78,958 |
Dividends receivable | | 80,889 |
Distributions receivable from Fidelity Central Funds | | 1,186 |
Prepaid expenses | | 694 |
Other receivables | | 70,973 |
Total assets | | 106,013,873 |
| | |
Liabilities | | |
Payable for investments purchased | $ 744,747 | |
Payable for fund shares redeemed | 123,258 | |
Accrued management fee | 61,375 | |
Distribution and service plan fees payable | 28,510 | |
Other affiliated payables | 27,957 | |
Other payables and accrued expenses | 53,541 | |
Collateral on securities loaned, at value | 2,144,666 | |
Total liabilities | | 3,184,054 |
| | |
Net Assets | | $ 102,829,819 |
Net Assets consist of: | | |
Paid in capital | | $ 135,061,298 |
Accumulated undistributed net realized gain (loss) on investments and foreign currency transactions | | (24,974,009) |
Net unrealized appreciation (depreciation) on investments and assets and liabilities in foreign currencies | | (7,257,470) |
Net Assets | | $ 102,829,819 |
See accompanying notes which are an integral part of the financial statements.
Annual Report
Financial Statements - continued
Statement of Assets and Liabilities - continued
| October 31, 2011 |
Calculation of Maximum Offering Price Class A:
Net Asset Value and redemption price per share ($36,366,881 ÷ 3,800,369 shares) | | $ 9.57 |
| | |
Maximum offering price per share (100/94.25 of $9.57) | | $ 10.15 |
Class T:
Net Asset Value and redemption price per share ($24,179,813 ÷ 2,598,107 shares) | | $ 9.31 |
| | |
Maximum offering price per share (100/96.50 of $9.31) | | $ 9.65 |
Class B:
Net Asset Value and offering price per share ($1,926,183 ÷ 220,369 shares)A | | $ 8.74 |
| | |
Class C:
Net Asset Value and offering price per share ($11,631,872 ÷ 1,332,713 shares)A | | $ 8.73 |
| | |
Institutional Class:
Net Asset Value, offering price and redemption price per share ($28,725,070 ÷ 2,906,092 shares) | | $ 9.88 |
A Redemption price per share is equal to net asset value less any applicable contingent deferred sales charge.
See accompanying notes which are an integral part of the financial statements.
Annual Report
Statement of Operations
| Year ended October 31, 2011 |
Investment Income | | |
Dividends | | $ 1,638,952 |
Interest | | 444 |
Income from Fidelity Central Funds (including $95,446 from security lending) | | 106,846 |
Income before foreign taxes withheld | | 1,746,242 |
Less foreign taxes withheld | | (100,644) |
Total income | | 1,645,598 |
| | |
Expenses | | |
Management fee
Basic fee | $ 979,879 | |
Performance adjustment | (248) | |
Transfer agent fees | 353,091 | |
Distribution and service plan fees | 423,841 | |
Accounting and security lending fees | 72,778 | |
Custodian fees and expenses | 124,801 | |
Independent trustees' compensation | 727 | |
Registration fees | 95,010 | |
Audit | 81,858 | |
Legal | 490 | |
Interest | 1,390 | |
Miscellaneous | 658 | |
Total expenses before reductions | 2,134,275 | |
Expense reductions | (94,854) | 2,039,421 |
Net investment income (loss) | | (393,823) |
Realized and Unrealized Gain (Loss) Net realized gain (loss) on: | | |
Investment securities: | | |
Unaffiliated issuers | (8,975,815) | |
Other affiliated issuers | (4,697,382) | |
Foreign currency transactions | (142,811) | |
Total net realized gain (loss) | | (13,816,008) |
Change in net unrealized appreciation (depreciation) on: Investment securities (net of decrease in deferred foreign taxes of $145,516) | (16,352,358) | |
Assets and liabilities in foreign currencies | (96,967) | |
Total change in net unrealized appreciation (depreciation) | | (16,449,325) |
Net gain (loss) | | (30,265,333) |
Net increase (decrease) in net assets resulting from operations | | $ (30,659,156) |
See accompanying notes which are an integral part of the financial statements.
Annual Report
Financial Statements - continued
Statement of Changes in Net Assets
| Year ended
October 31,
2011 | Year ended
October 31,
2010 |
Increase (Decrease) in Net Assets | | |
Operations | | |
Net investment income (loss) | $ (393,823) | $ (31,162) |
Net realized gain (loss) | (13,816,008) | 2,238,659 |
Change in net unrealized appreciation (depreciation) | (16,449,325) | 7,407,825 |
Net increase (decrease) in net assets resulting
from operations | (30,659,156) | 9,615,322 |
Distributions to shareholders from net investment income | - | (45,039) |
Distributions to shareholders from net realized gain | (352,610) | (205,342) |
Total distributions | (352,610) | (250,381) |
Share transactions - net increase (decrease) | 56,562,275 | 43,722,613 |
Redemption fees | 6,577 | 5,493 |
Total increase (decrease) in net assets | 25,557,086 | 53,093,047 |
| | |
Net Assets | | |
Beginning of period | 77,272,733 | 24,179,686 |
End of period | $ 102,829,819 | $ 77,272,733 |
See accompanying notes which are an integral part of the financial statements.
Annual Report
Financial Highlights - Class A
Years ended October 31, | 2011 | 2010 | 2009 | 2008 | 2007 |
Selected Per-Share Data | | | | | |
Net asset value, beginning of period | $ 11.41 | $ 9.04 | $ 6.88 | $ 15.38 | $ 14.83 |
Income from Investment Operations | | | | | |
Net investment income (loss) C | (.03) | .01 | .04 | .04 | .01 |
Net realized and unrealized gain (loss) | (1.76) | 2.47 | 2.13 | (6.74) | 2.69 |
Total from investment operations | (1.79) | 2.48 | 2.17 | (6.70) | 2.70 |
Distributions from net investment income | - | (.03) | (.01) | - | - |
Distributions from net realized gain | (.05) | (.08) | - | (1.80) | (2.15) |
Total distributions | (.05) | (.11) | (.01) | (1.80) | (2.15) |
Redemption fees added to paid in capital C, G | - | - | - | - | - |
Net asset value, end of period | $ 9.57 | $ 11.41 | $ 9.04 | $ 6.88 | $ 15.38 |
Total Return A, B | (15.81)% | 27.68% | 31.68% | (48.99)% | 20.55% |
Ratios to Average Net Assets D. F | | | | | |
Expenses before reductions | 1.51% | 1.89% | 2.22% | 1.90% | 1.81% |
Expenses net of fee waivers, if any | 1.45% | 1.50% | 1.50% | 1.50% | 1.50% |
Expenses net of all reductions | 1.43% | 1.44% | 1.43% | 1.41% | 1.45% |
Net investment income (loss) | (.24)% | .13% | .53% | .38% | .06% |
Supplemental Data | | | | | |
Net assets, end of period (000 omitted) | $ 36,367 | $ 30,383 | $ 6,997 | $ 6,904 | $ 14,000 |
Portfolio turnover rate E | 140% | 179% | 258% | 257% | 102% |
A Total returns would have been lower if certain expenses had not been reduced during the applicable periods shown.
B Total returns do not include the effect of the sales charges.
C Calculated based on average shares outstanding during the period.
D Fees and expenses of any underlying Fidelity Central Funds are not included in the Fund's expense ratio. The Fund indirectly bears its proportionate share of the expenses of any underlying Fidelity Central Funds.
E Amount does not include the portfolio activity of any underlying Fidelity Central Funds.
F Expense ratios reflect operating expenses of the class. Expenses before reductions do not reflect amounts reimbursed by the investment adviser or reductions from brokerage service arrangements or reductions from other expense offset arrangements and do not represent the amount paid by the class during periods when reimbursements or reductions occur. Expenses net of fee waivers reflect expenses after reimbursement by the investment adviser but prior to reductions from brokerage service arrangements or other expense offset arrangements. Expenses net of all reductions represent the net expenses paid by the class.
G Amount represents less than $.01 per share.
See accompanying notes which are an integral part of the financial statements.
Annual Report
Financial Highlights - Class T
Years ended October 31, | 2011 | 2010 | 2009 | 2008 | 2007 |
Selected Per-Share Data | | | | | |
Net asset value, beginning of period | $ 11.11 | $ 8.82 | $ 6.72 | $ 15.05 | $ 14.59 |
Income from Investment Operations | | | | | |
Net investment income (loss) C | (.05) | (.01) | .02 | .01 | (.03) |
Net realized and unrealized gain (loss) | (1.72) | 2.39 | 2.09 | (6.59) | 2.64 |
Total from investment operations | (1.77) | 2.38 | 2.11 | (6.58) | 2.61 |
Distributions from net investment income | - | (.01) | (.01) | - | - |
Distributions from net realized gain | (.03) | (.08) | - | (1.75) | (2.15) |
Total distributions | (.03) | (.09) | (.01) | (1.75) | (2.15) |
Redemption fees added to paid in capital C, G | - | - | - | - | - |
Net asset value, end of period | $ 9.31 | $ 11.11 | $ 8.82 | $ 6.72 | $ 15.05 |
Total Return A, B | (15.97)% | 27.20% | 31.50% | (49.12)% | 20.24% |
Ratios to Average Net Assets D, F | | | | | |
Expenses before reductions | 1.80% | 2.32% | 2.50% | 2.17% | 2.08% |
Expenses net of fee waivers, if any | 1.70% | 1.75% | 1.75% | 1.75% | 1.75% |
Expenses net of all reductions | 1.68% | 1.70% | 1.69% | 1.66% | 1.71% |
Net investment income (loss) | (.49)% | (.13)% | .27% | .13% | (.19)% |
Supplemental Data | | | | �� | |
Net assets, end of period (000 omitted) | $ 24,180 | $ 23,237 | $ 10,494 | $ 8,104 | $ 22,039 |
Portfolio turnover rate E | 140% | 179% | 258% | 257% | 102% |
A Total returns would have been lower if certain expenses had not been reduced during the applicable periods shown.
B Total returns do not include the effect of the sales charges.
C Calculated based on average shares outstanding during the period.
D Fees and expenses of any underlying Fidelity Central Funds are not included in the Fund's expense ratio. The Fund indirectly bears its proportionate share of the expenses of any underlying Fidelity Central Funds.
E Amount does not include the portfolio activity of any underlying Fidelity Central Funds.
F Expense ratios reflect operating expenses of the class. Expenses before reductions do not reflect amounts reimbursed by the investment adviser or reductions from brokerage service arrangements or reductions from other expense offset arrangements and do not represent the amount paid by the class during periods when reimbursements or reductions occur. Expenses net of fee waivers reflect expenses after reimbursement by the investment adviser but prior to reductions from brokerage service arrangements or other expense offset arrangements. Expenses net of all reductions represent the net expenses paid by the class.
G Amount represents less than $.01 per share.
See accompanying notes which are an integral part of the financial statements.
Annual Report
Financial Highlights - Class B
Years ended October 31, | 2011 | 2010 | 2009 | 2008 | 2007 |
Selected Per-Share Data | | | | | |
Net asset value, beginning of period | $ 10.46 | $ 8.31 | $ 6.37 | $ 14.34 | $ 14.06 |
Income from Investment Operations | | | | | |
Net investment income (loss) C | (.10) | (.06) | (.02) | (.04) | (.09) |
Net realized and unrealized gain (loss) | (1.62) | 2.26 | 1.97 | (6.25) | 2.52 |
Total from investment operations | (1.72) | 2.20 | 1.95 | (6.29) | 2.43 |
Distributions from net investment income | - | - | (.01) | - | - |
Distributions from net realized gain | - G | (.05) | - | (1.68) | (2.15) |
Total distributions | - G | (.05) | (.01) | (1.68) | (2.15) |
Redemption fees added to paid in capital C, G | - | - | - | - | - |
Net asset value, end of period | $ 8.74 | $ 10.46 | $ 8.31 | $ 6.37 | $ 14.34 |
Total Return A, B | (16.42)% | 26.64% | 30.62% | (49.33)% | 19.65% |
Ratios to Average Net Assets D, F | | | | | |
Expenses before reductions | 2.32% | 2.82% | 2.98% | 2.66% | 2.57% |
Expenses net of fee waivers, if any | 2.20% | 2.25% | 2.25% | 2.25% | 2.25% |
Expenses net of all reductions | 2.18% | 2.19% | 2.18% | 2.16% | 2.20% |
Net investment income (loss) | (.99)% | (.62)% | (.22)% | (.37)% | (.69)% |
Supplemental Data | | | | | |
Net assets, end of period (000 omitted) | $ 1,926 | $ 2,731 | $ 2,162 | $ 1,918 | $ 5,029 |
Portfolio turnover rate E | 140% | 179% | 258% | 257% | 102% |
A Total returns would have been lower if certain expenses had not been reduced during the applicable periods shown.
B Total returns do not include the effect of the contingent deferred sales charge.
C Calculated based on average shares outstanding during the period.
D Fees and expenses of any underlying Fidelity Central Funds are not included in the Fund's expense ratio. The Fund indirectly bears its proportionate share of the expenses of any underlying Fidelity Central Funds.
E Amount does not include the portfolio activity of any underlying Fidelity Central Funds.
F Expense ratios reflect operating expenses of the class. Expenses before reductions do not reflect amounts reimbursed by the investment adviser or reductions from brokerage service arrangements or reductions from other expense offset arrangements and do not represent the amount paid by the class during periods when reimbursements or reductions occur. Expenses net of fee waivers reflect expenses after reimbursement by the investment adviser but prior to reductions from brokerage service arrangements or other expense offset arrangements. Expenses net of all reductions represent the net expenses paid by the class.
G Amount represents less than $.01 per share.
See accompanying notes which are an integral part of the financial statements.
Annual Report
Financial Highlights - Class C
Years ended October 31, | 2011 | 2010 | 2009 | 2008 | 2007 |
Selected Per-Share Data | | | | | |
Net asset value, beginning of period | $ 10.46 | $ 8.31 | $ 6.37 | $ 14.36 | $ 14.08 |
Income from Investment Operations | | | | | |
Net investment income (loss) C | (.10) | (.06) | (.02) | (.04) | (.09) |
Net realized and unrealized gain (loss) | (1.61) | 2.27 | 1.97 | (6.26) | 2.52 |
Total from investment operations | (1.71) | 2.21 | 1.95 | (6.30) | 2.43 |
Distributions from net investment income | - | - | (.01) | - | - |
Distributions from net realized gain | (.02) | (.06) | - | (1.69) | (2.15) |
Total distributions | (.02) | (.06) | (.01) | (1.69) | (2.15) |
Redemption fees added to paid in capital C, G | - | - | - | - | - |
Net asset value, end of period | $ 8.73 | $ 10.46 | $ 8.31 | $ 6.37 | $ 14.36 |
Total Return A, B | (16.38)% | 26.68% | 30.62% | (49.35)% | 19.62% |
Ratios to Average Net Assets D, F | | | | | |
Expenses before reductions | 2.28% | 2.77% | 2.97% | 2.63% | 2.57% |
Expenses net of fee waivers, if any | 2.20% | 2.25% | 2.25% | 2.25% | 2.25% |
Expenses net of all reductions | 2.18% | 2.20% | 2.18% | 2.16% | 2.20% |
Net investment income (loss) | (.99)% | (.63)% | (.22)% | (.37)% | (.69)% |
Supplemental Data | | | | | |
Net assets, end of period (000 omitted) | $ 11,632 | $ 7,986 | $ 3,378 | $ 2,697 | $ 5,352 |
Portfolio turnover rate E | 140% | 179% | 258% | 257% | 102% |
A Total returns would have been lower if certain expenses had not been reduced during the applicable periods shown.
B Total returns do not include the effect of the contingent deferred sales charge.
C Calculated based on average shares outstanding during the period.
D Fees and expenses of any underlying Fidelity Central Funds are not included in the Fund's expense ratio. The Fund indirectly bears its proportionate share of the expenses of any underlying Fidelity Central Funds.
E Amount does not include the portfolio activity of any underlying Fidelity Central Funds.
F Expense ratios reflect operating expenses of the class. Expenses before reductions do not reflect amounts reimbursed by the investment adviser or reductions from brokerage service arrangements or reductions from other expense offset arrangements and do not represent the amount paid by the class during periods when reimbursements or reductions occur. Expenses net of fee waivers reflect expenses after reimbursement by the investment adviser but prior to reductions from brokerage service arrangements or other expense offset arrangements. Expenses net of all reductions represent the net expenses paid by the class.
G Amount represents less than $.01 per share.
See accompanying notes which are an integral part of the financial statements.
Annual Report
Financial Highlights - Institutional Class
Years ended October 31, | 2011 | 2010 | 2009 | 2008 | 2007 |
Selected Per-Share Data | | | | | |
Net asset value, beginning of period | $ 11.76 | $ 9.31 | $ 7.07 | $ 15.76 | $ 15.11 |
Income from Investment Operations | | | | | |
Net investment income (loss) B | - F | .04 | .06 | .07 | .05 |
Net realized and unrealized gain (loss) | (1.82) | 2.54 | 2.20 | (6.93) | 2.75 |
Total from investment operations | (1.82) | 2.58 | 2.26 | (6.86) | 2.80 |
Distributions from net investment income | - | (.05) | (.02) | - | - |
Distributions from net realized gain | (.06) | (.08) | - | (1.83) | (2.15) |
Total distributions | (.06) | (.13) | (.02) | (1.83) | (2.15) |
Redemption fees added to paid in capital B, F | - | - | - | - | - |
Net asset value, end of period | $ 9.88 | $ 11.76 | $ 9.31 | $ 7.07 | $ 15.76 |
Total Return A | (15.60)% | 28.00% | 32.03% | (48.89)% | 20.88% |
Ratios to Average Net Assets C, E | | | | | |
Expenses before reductions | 1.18% | 1.43% | 1.88% | 1.51% | 1.43% |
Expenses net of fee waivers, if any | 1.17% | 1.25% | 1.25% | 1.25% | 1.25% |
Expenses net of all reductions | 1.15% | 1.19% | 1.18% | 1.16% | 1.20% |
Net investment income (loss) | .04% | .38% | .78% | .63% | .31% |
Supplemental Data | | | | | |
Net assets, end of period (000 omitted) | $ 28,725 | $ 12,936 | $ 1,148 | $ 1,166 | $ 2,476 |
Portfolio turnover rate D | 140% | 179% | 258% | 257% | 102% |
A Total returns would have been lower if certain expenses had not been reduced during the applicable periods shown.
B Calculated based on average shares outstanding during the period.
C Fees and expenses of any underlying Fidelity Central Funds are not included in the Fund's expense ratio. The Fund indirectly bears its proportionate share of the expenses of any underlying Fidelity Central Funds.
D Amount does not include the portfolio activity of any underlying Fidelity Central Funds.
E Expense ratios reflect operating expenses of the class. Expenses before reductions do not reflect amounts reimbursed by the investment adviser or reductions from brokerage service arrangements or reductions from other expense offset arrangements and do not represent the amount paid by the class during periods when reimbursements or reductions occur. Expenses net of fee waivers reflect expenses after reimbursement by the investment adviser but prior to reductions from brokerage service arrangements or other expense offset arrangements. Expenses net of all reductions represent the net expenses paid by the class.
F Amount represents less than $.01 per share.
See accompanying notes which are an integral part of the financial statements.
Annual Report
Notes to Financial Statements
For the period ended October 31, 2011
1. Organization.
Fidelity Advisor Global Capital Appreciation Fund (the Fund) is a fund of Fidelity Advisor Series VIII (the Trust) and is authorized to issue an unlimited number of shares. The Trust is registered under the Investment Company Act of 1940, as amended (the 1940 Act), as an open-end management investment company organized as a Massachusetts business trust. The Fund offers Class A, Class T, Class C, and Institutional Class shares, each of which, along with Class B shares, has equal rights as to assets and voting privileges. Effective after the close of business on September 1, 2010, Class B shares were closed to new accounts and additional purchases, except for exchanges and reinvestments by existing shareholders. Each class has exclusive voting rights with respect to matters that affect that class. Class B shares will automatically convert to Class A shares after a holding period of seven years from the initial date of purchase. Investment income, realized and unrealized capital gains and losses, the common expenses of the Fund, and certain fund-level expense reductions, if any, are allocated on a pro-rata basis to each class based on the relative net assets of each class to the total net assets of the Fund. Each class differs with respect to transfer agent and distribution and service plan fees incurred. Certain expense reductions may also differ by class. The Fund's investments in emerging markets can be subject to social, economic, regulatory, and political uncertainties and can be extremely volatile.
2. Investments in Fidelity Central Funds.
The Fund invests in Fidelity Central Funds, which are open-end investment companies available only to other investment companies and accounts managed by Fidelity Management & Research Company (FMR) and its affiliates. The Fund's Schedule of Investments lists each of the Fidelity Central Funds held as of period end, if any, as an investment of the Fund, but does not include the underlying holdings of each Fidelity Central Fund. As an Investing Fund, the Fund indirectly bears its proportionate share of the expenses of the underlying Fidelity Central Funds.
The Money Market Central Funds seek preservation of capital and current income and are managed by Fidelity Investments Money Management, Inc. (FIMM), an affiliate of FMR.
A complete unaudited list of holdings for each Fidelity Central Fund is available upon request or at the Securities and Exchange Commission (the SEC) web site at www.sec.gov. In addition, the financial statements of the Fidelity Central Funds, which are not covered by the Fund's Report of Independent Registered Public Accounting Firm are available on the SEC web site or upon request.
Annual Report
Notes to Financial Statements - continued
3. Significant Accounting Policies.
The financial statements have been prepared in conformity with accounting principles generally accepted in the United States of America (GAAP), which require management to make certain estimates and assumptions at the date of the financial statements. Actual results could differ from those estimates. Subsequent events, if any, through the date that the financial statements were issued have been evaluated in the preparation of the financial statements. The following summarizes the significant accounting policies of the Fund:
Security Valuation. Investments are valued as of 4:00 p.m. Eastern time on the last calendar day of the period. The Fund uses independent pricing services approved by the Board of Trustees to value its investments. When current market prices or quotations are not readily available or reliable, valuations may be determined in good faith in accordance with procedures adopted by the Board of Trustees. Factors used in determining value may include market or security specific events. The frequency with which these procedures are used cannot be predicted and they may be utilized to a significant extent. The value used for net asset value (NAV) calculation under these procedures may differ from published prices for the same securities.
The Fund categorizes the inputs to valuation techniques used to value its investments into a disclosure hierarchy consisting of three levels as shown below:
Level 1 - quoted prices in active markets for identical investments
Level 2 - other significant observable inputs (including quoted prices for similar investments, interest rates, prepayment speeds, etc.)
Level 3 - unobservable inputs (including the Fund's own assumptions based on the best information available)
Changes in valuation techniques may result in transfers in or out of an assigned level within the disclosure hierarchy. The aggregate value of investments by input level, as of October 31, 2011, is included at the end of the Fund's Schedule of Investments. Valuation techniques used to value the Fund's investments by major category are as follows:
Equity securities, including restricted securities, for which market quotations are readily available, are valued at the last reported sale price or official closing price as reported by an independent pricing service on the primary market or exchange on which they are traded and are categorized as Level 1 in the hierarchy. In the event there were no sales during the day or closing prices are not available, securities are valued at the last quoted bid price or may be valued using the last available price and are generally categorized as Level 2 in the hierarchy. For foreign equity securities, when significant market or security specific events arise, comparisons to the valuation of American Depositary Receipts
Annual Report
3. Significant Accounting Policies - continued
Security Valuation - continued
(ADRs), futures contracts, Exchange-traded funds (ETFs) and certain indexes as well as quoted prices for similar securities are used and are categorized as Level 2 in the hierarchy in these circumstances. Utilizing these techniques may result in transfers between Level 1 and Level 2. For restricted equity securities and private placements where observable inputs are limited, assumptions about market activity and risk are used and are categorized as Level 3 in the hierarchy.
Investments in open-end mutual funds,including the Fidelity Central Funds, are valued at their closing net asset value each business day and are categorized as Level 1 in the hierarchy.
Foreign Currency. The Fund may use foreign currency contracts to facilitate transactions in foreign-denominated securities. Gains and losses from these transactions may arise from changes in the value of the foreign currency or if the counterparties do not perform under the contracts' terms.
Foreign-denominated assets, including investment securities, and liabilities are translated into U.S. dollars at the exchange rate at period end. Purchases and sales of investment securities, income and dividends received and expenses denominated in foreign currencies are translated into U.S. dollars at the exchange rate in effect on the transaction date.
The effects of exchange rate fluctuations on investments are included with the net realized and unrealized gain (loss) on investment securities. Other foreign currency transactions resulting in realized and unrealized gain (loss) are disclosed separately.
Investment Transactions and Income. For financial reporting purposes, the Fund's investment holdings and NAV include trades executed through the end of the last business day of the period. The NAV per share for processing shareholder transactions is calculated as of the close of business of the New York Stock Exchange (NYSE), normally 4:00 p.m. Eastern time and includes trades executed through the end of the prior business day. Gains and losses on securities sold are determined on the basis of identified cost and may include proceeds received from litigation. Dividend income is recorded on the ex-dividend date, except for certain dividends from foreign securities where the ex-dividend date may have passed, which are recorded as soon as the Fund is informed of the ex-dividend date. Non-cash dividends included in dividend income, if any, are recorded at the fair market value of the securities received. Distributions received on securities that represent a return of capital or capital gain are recorded as a reduction of cost of investments and/or as a realized gain. The Fund estimates the components of distributions received that may be considered return of capital distributions or capital
Annual Report
Notes to Financial Statements - continued
3. Significant Accounting Policies - continued
Investment Transactions and Income - continued
gain distributions. Interest income and distributions from the Fidelity Central Funds are accrued as earned. Interest income includes coupon interest and amortization of premium and accretion of discount on debt securities. Investment income is recorded net of foreign taxes withheld where recovery of such taxes is uncertain.
Expenses. Expenses directly attributable to a fund are charged to that fund. Expenses attributable to more than one fund are allocated among the respective funds on the basis of relative net assets or other appropriate methods. Expense estimates are accrued in the period to which they relate and adjustments are made when actual amounts are known.
Income Tax Information and Distributions to Shareholders. Each year, the Fund intends to qualify as a regulated investment company, including distributing substantially all of its taxable income and realized gains under Subchapter M of the Internal Revenue Code and filing its U.S. federal tax return. As a result, no provision for income taxes is required. As of October 31, 2011, the Fund did not have any unrecognized tax benefits in the financial statements. A fund's federal tax return is subject to examination by the Internal Revenue Service (IRS) for a period of three years. Foreign taxes are provided for based on the Fund's understanding of the tax rules and rates that exist in the foreign markets in which it invests.
Distributions are declared and recorded on the ex-dividend date. Income dividends and capital gain distributions are declared separately for each class. Income and capital gain distributions are determined in accordance with income tax regulations, which may differ from GAAP.
Capital accounts within the financial statements are adjusted for permanent book-tax differences. These adjustments have no impact on net assets or the results of operations. Temporary book-tax differences will reverse in a subsequent period.
Book-tax differences are primarily due to foreign currency transactions, certain foreign taxes, passive foreign investment companies (PFIC), net operating losses, capital loss carryforwards and losses deferred due to wash sales.
The federal tax cost of investment securities and unrealized appreciation (depreciation) as of period end were as follows:
Gross unrealized appreciation | $ 8,771,282 |
Gross unrealized depreciation | (16,155,586) |
Net unrealized appreciation (depreciation) on securities and other investments | $ (7,384,304) |
| |
Tax Cost | $ 110,680,267 |
Annual Report
3. Significant Accounting Policies - continued
Income Tax Information and Distributions to Shareholders - continued
The tax-based components of distributable earnings as of period end were as follows:
Capital loss carryforward | $ (24,751,307) |
Net unrealized appreciation (depreciation) | $ (7,480,170) |
Under the recently enacted Regulated Investment Company Modernization Act of 2010 (the Act), the Fund will be permitted to carry forward capital losses incurred in taxable years beginning after December 22, 2010 for an unlimited period. However, any losses incurred during those future taxable years will be required to be utilized prior to any losses incurred in pre-enactment taxable years, which generally expire after eight years from when they are incurred. Additionally, post-enactment capital losses that are carried forward will retain their character as either short-term or long-term capital losses rather than being considered all short-term as under previous law. The Fund's first fiscal year end subject to the Act will be October 31, 2012.
The tax character of distributions paid was as follows:
| October 31, 2011 | October 31, 2010 |
Ordinary Income | $ 352,610 | $ 250,381 |
Short-Term Trading (Redemption) Fees. Shares held by investors in the Fund less than 30 days are subject to a redemption fee equal to 1.00% of the net asset value of shares redeemed. All redemption fees, which reduce the proceeds of the shareholder redemption, are retained by the Fund and accounted for as an addition to paid in capital.
New Accounting Pronouncement. In May 2011, the Financial Accounting Standards Board issued Accounting Standard Update No. 2011-04, Fair Value Measurement (Topic 820) - Amendments to Achieve Common Fair Value Measurement and Disclosure Requirements in U.S. GAAP and IFRSs. The update changes the wording used to describe the requirements in GAAP for measuring fair value and for disclosing information about fair value measurements. The update is effective during interim and annual periods beginning after December 15, 2011. Management is currently evaluating the impact of the update's adoption on the Fund's financial statement disclosures.
4. Purchases and Sales of Investments.
Purchases and sales of securities, other than short-term securities, aggregated $247,660,432 and $182,112,533, respectively.
Annual Report
Notes to Financial Statements - continued
5. Fees and Other Transactions with Affiliates.
Management Fee. FMR and its affiliates provide the Fund with investment management related services for which the Fund pays a monthly management fee. The management fee is the sum of an individual fund fee rate that is based on an annual rate of .45% of the Fund's average net assets and a group fee rate that averaged .26% during the period. The group fee rate is based upon the average net assets of all the mutual funds advised by FMR. The group fee rate decreases as assets under management increase and increases as assets under management decrease. In addition, the management fee is subject to a performance adjustment (up to a maximum of ± .20% of the Fund's average net assets over a 36 month performance period). The upward or downward adjustment to the management fee is based on the relative investment performance of the Institutional Class of the Fund as compared to an appropriate benchmark index. For the period, the total annual management fee rate, including the performance adjustment, was .71% of the Fund's average net assets.
Distribution and Service Plan Fees. In accordance with Rule 12b-1 of the 1940 Act, the Fund has adopted separate Distribution and Service Plans for each class of shares. Certain classes pay Fidelity Distributors Corporation (FDC), an affiliate of FMR, separate Distribution and Service Fees, each of which is based on an annual percentage of each class' average net assets. In addition, FDC may pay financial intermediaries for selling shares of the Fund and providing shareholder support services. For the period, the Distribution and Service Fee rates, total fees and amounts retained by FDC were as follows:
| Distribution
Fee | Service
Fee | Total Fees | Retained
by FDC |
Class A | -% | .25% | $ 110,510 | $ 10,430 |
Class T | .25% | .25% | 147,154 | 75 |
Class B | .75% | .25% | 25,792 | 19,362 |
Class C | .75% | .25% | 140,385 | 82,957 |
| | | $ 423,841 | $ 112,824 |
Sales Load. FDC may receive a front-end sales charge of up to 5.75% for selling Class A shares, and 3.50% for selling Class T shares, some of which is paid to financial intermediaries for selling shares of the Fund. Depending on the holding period, FDC may receive contingent deferred sales charges levied on Class A, Class T, Class B, and Class C redemptions. The deferred sales charges range from 5% to 1% for Class B, 1% for Class C, 1.00% for certain purchases of Class A shares and .25% for certain purchases of Class T shares.
Annual Report
5. Fees and Other Transactions with Affiliates - continued
Sales Load - continued
For the period, sales charge amounts retained by FDC were as follows:
| Retained
by FDC |
Class A | $ 53,137 |
Class T | 10,527 |
Class B* | 4,390 |
Class C* | 15,060 |
| $ 83,114 |
* When Class B and Class C shares are initially sold, FDC pays commissions from its own resources to financial intermediaries through which the sales are made.
Transfer Agent Fees. Fidelity Investments Institutional Operations Company, Inc. (FIIOC), an affiliate of FMR, is the transfer, dividend disbursing and shareholder servicing agent for each class of the Fund. FIIOC receives account fees and asset-based fees that vary according to the account size and type of account of the shareholders of the respective classes of the Fund. FIIOC pays for typesetting, printing and mailing of shareholder reports, except proxy statements. For the period, transfer agent fees for each class were as follows:
| Amount | % of
Average
Net Assets |
Class A | $ 118,843 | .27 |
Class T | 88,343 | .30 |
Class B | 7,868 | .31 |
Class C | 41,153 | .29 |
Institutional Class | 96,884 | .20 |
| $ 353,091 | |
Accounting and Security Lending Fees. Fidelity Service Company, Inc. (FSC), an affiliate of FMR, maintains the Fund's accounting records. The accounting fee is based on the level of average net assets for the month. Under a separate contract, FSC administers the security lending program. The security lending fee is based on the number and duration of lending transactions.
Brokerage Commissions. The Fund placed a portion of its portfolio transactions with brokerage firms which are affiliates of the investment adviser. The commissions paid to these affiliated firms were $7,261 for the period.
Annual Report
Notes to Financial Statements - continued
5. Fees and Other Transactions with Affiliates - continued
Interfund Lending Program. Pursuant to an Exemptive Order issued by the SEC, the Fund, along with other registered investment companies having management contracts with FMR, may participate in an interfund lending program. This program provides an alternative credit facility allowing the funds to borrow from, or lend money to, other participating affiliated funds. At period end, there were no interfund loans outstanding. The Fund's activity in this program during the period for which loans were outstanding was as follows:
Borrower or Lender | Average Daily
Loan Balance | Weighted Average
Interest Rate | Interest
Expense |
Borrower | $ 9,837,692 | .39% | $ 1,390 |
6. Committed Line of Credit.
The Fund participates with other funds managed by FMR or an affiliate in a $4.0 billion credit facility (the "line of credit") to be utilized for temporary or emergency purposes to fund shareholder redemptions or for other short-term liquidity purposes. The Fund has agreed to pay commitment fees on its pro-rata portion of the line of credit, which amounted to $418 and is reflected in Miscellaneous expenses on the Statement of Operations. During the period, there were no borrowings on this line of credit.
7. Security Lending.
The Fund lends portfolio securities through a lending agent from time to time in order to earn additional income. For equity securities, a lending agent is used and may loan securities to certain qualified borrowers, including Fidelity Capital Markets (FCM), a broker-dealer affiliated with the Fund. On the settlement date of the loan, the Fund receives collateral (in the form of U.S. Treasury obligations, letters of credit and/or cash) against the loaned securities and maintains collateral in an amount not less than 100% of the market value of the loaned securities during the period of the loan. The market value of the loaned securities is determined at the close of business of the Fund and any additional required collateral is delivered to the Fund on the next business day. If the borrower defaults on its obligation to return the securities loaned because of insolvency or other reasons, a fund could experience delays and costs in recovering the securities loaned or in gaining access to the collateral. Any cash collateral received is invested in the Fidelity Securities Lending Cash Central Fund. The value of loaned securities and cash collateral at period end are disclosed on the Fund's Statement of Assets and Liabilities. At period end, there were no security loans outstanding with FCM. Security lending income represents the income earned on investing cash collateral, less rebates paid to borrowers and any lending agent fees associated with the loan, plus any premium
Annual Report
7. Security Lending - continued
payments received for lending certain types of securities. Security lending income is presented in the Statement of Operations as a component of income from Fidelity Central Funds and includes $58 from securities loaned to FCM.
8. Expense Reductions.
FMR contractually agreed to reimburse each class to the extent annual operating expenses exceeded certain levels of average net assets as noted in the table below. This reimbursement will remain in place through December 31, 2012. Some expenses, for example interest expense, including commitment fees, are excluded from this reimbursement.
The following classes were in reimbursement during the period:
| Expense
Limitations | Reimbursement
from adviser |
Class A | 1.45% | $ 24,171 |
Class T | 1.70% | 27,895 |
Class B | 2.20% | 2,997 |
Class C | 2.20% | 10,305 |
| | $ 65,368 |
In addition, FMR voluntarily agreed to reimburse a portion of its management fee. For the period, the amount of this reimbursement was $673.
Many of the brokers with whom FMR places trades on behalf of the Fund provided services to the Fund in addition to trade execution. These services included payments of certain expenses on behalf of the Fund totaling $28,813 for the period.
9. Distributions to Shareholders.
Distributions to shareholders of each class were as follows:
Years ended October 31, | 2011 | 2010 |
From net investment income | | |
Class A | $ - | $ 24,148 |
Class T | - | 14,394 |
Institutional Class | - | 6,497 |
Total | $ - | $ 45,039 |
From net realized gain | | |
Class A | $ 149,904 | $ 62,317 |
Class T | 82,578 | 95,962 |
Class B | 761 | 13,694 |
Class C | 23,129 | 23,177 |
Institutional Class | 96,238 | 10,192 |
Total | $ 352,610 | $ 205,342 |
Annual Report
Notes to Financial Statements - continued
10. Share Transactions.
Transactions for each class of shares were as follows:
| Shares | Dollars |
Years ended October 31, | 2011 | 2010 | 2011 | 2010 |
Class A | | | | |
Shares sold | 3,313,300 | 2,107,781 | $ 38,257,984 | $ 21,885,164 |
Reinvestment of distributions | 11,121 | 8,588 | 130,500 | 82,276 |
Shares redeemed | (2,187,648) | (226,391) | (23,557,856) | (2,293,965) |
Net increase (decrease) | 1,136,773 | 1,889,978 | $ 14,830,628 | $ 19,673,475 |
Class T | | | | |
Shares sold | 1,500,646 | 1,253,117 | $ 16,821,913 | $ 13,010,370 |
Reinvestment of distributions | 7,107 | 11,592 | 81,139 | 108,388 |
Shares redeemed | (1,001,188) | (363,578) | (10,370,670) | (3,522,646) |
Net increase (decrease) | 506,565 | 901,131 | $ 6,532,382 | $ 9,596,112 |
Class B | | | | |
Shares sold | 67,595 | 87,120 | $ 715,061 | $ 802,164 |
Reinvestment of distributions | 70 | 1,450 | 677 | 12,817 |
Shares redeemed | (108,399) | (87,578) | (1,075,608) | (796,786) |
Net increase (decrease) | (40,734) | 992 | $ (359,870) | $ 18,195 |
Class C | | | | |
Shares sold | 1,263,963 | 501,896 | $ 13,329,175 | $ 4,858,487 |
Reinvestment of distributions | 1,981 | 2,379 | 21,056 | 21,027 |
Shares redeemed | (696,642) | (147,177) | (6,685,064) | (1,345,064) |
Net increase (decrease) | 569,302 | 357,098 | $ 6,665,167 | $ 3,534,450 |
Institutional Class | | | | |
Shares sold | 6,587,351 | 986,043 | $ 79,174,965 | $ 11,001,071 |
Reinvestment of distributions | 6,022 | 415 | 72,484 | 4,092 |
Shares redeemed | (4,787,531) | (9,490) | (50,353,481) | (104,782) |
Net increase (decrease) | 1,805,842 | 976,968 | $ 28,893,968 | $ 10,900,381 |
11. Other.
The Fund's organizational documents provide former and current trustees and officers with a limited indemnification against liabilities arising in connection with the performance of their duties to the Fund. In the normal course of business, the Fund may also enter into contracts that provide general indemnifications. The Fund's maximum exposure under these arrangements is unknown as this would be dependent on future claims that may be made against the Fund. The risk of material loss from such claims is considered remote.
Annual Report
To the Trustees of Fidelity Advisor Series VIII and the Shareholders of Fidelity Advisor Global Capital Appreciation Fund:
In our opinion, the accompanying statement of assets and liabilities, including the schedule of investments, and the related statements of operations and of changes in net assets and the financial highlights present fairly, in all material respects, the financial position of Fidelity Advisor Global Capital Appreciation Fund (a fund of Fidelity Advisor Series VIII) at October 31, 2011, the results of its operations for the year then ended, the changes in its net assets for each of the two years in the period then ended and the financial highlights for each of the five years in the period then ended, in conformity with accounting principles generally accepted in the United States of America. These financial statements and financial highlights (hereafter referred to as "financial statements") are the responsibility of the Fidelity Advisor Global Capital Appreciation Fund's management. Our responsibility is to express an opinion on these financial statements based on our audits. We conducted our audits of these financial statements in accordance with the standards of the Public Company Accounting Oversight Board (United States). Those standards require that we plan and perform the audit to obtain reasonable assurance about whether the financial statements are free of material misstatement. An audit includes examining, on a test basis, evidence supporting the amounts and disclosures in the financial statements, assessing the accounting principles used and significant estimates made by management, and evaluating the overall financial statement presentation. We believe that our audits, which included confirmation of securities at October 31, 2011 by correspondence with the custodian and brokers, provide a reasonable basis for our opinion.
/s/ PricewaterhouseCoopers LLP
PricewaterhouseCoopers LLP
Boston, Massachusetts
December 15, 2011
Annual Report
The Trustees, Members of the Advisory Board, and executive officers of the trust and fund, as applicable, are listed below. The Board of Trustees governs the fund and is responsible for protecting the interests of shareholders. The Trustees are experienced executives who meet periodically throughout the year to oversee the fund's activities, review contractual arrangements with companies that provide services to the fund, oversee management of the risks associated with such activities and contractual arrangements, and review the fund's performance. Except for James C. Curvey, each of the Trustees oversees 226 funds advised by FMR or an affiliate. Mr. Curvey oversees 429 funds advised by FMR or an affiliate.
The Trustees hold office without limit in time except that (a) any Trustee may resign; (b) any Trustee may be removed by written instrument, signed by at least two-thirds of the number of Trustees prior to such removal; (c) any Trustee who requests to be retired or who has become incapacitated by illness or injury may be retired by written instrument signed by a majority of the other Trustees; and (d) any Trustee may be removed at any special meeting of shareholders by a two-thirds vote of the outstanding voting securities of the trust. Each Trustee who is not an interested person (as defined in the 1940 Act) (Independent Trustee), shall retire not later than the last day of the calendar year in which his or her 75th birthday occurs. The Independent Trustees may waive this mandatory retirement age policy with respect to individual Trustees. The executive officers and Advisory Board Members hold office without limit in time, except that any officer and Advisory Board Member may resign or may be removed by a vote of a majority of the Trustees at any regular meeting or any special meeting of the Trustees. Except as indicated, each individual has held the office shown or other offices in the same company for the past five years.
Experience, Skills, Attributes, and Qualifications of the Fund's Trustees. The Governance and Nominating Committee has adopted a statement of policy that describes the experience, qualifications, attributes, and skills that are necessary and desirable for potential Independent Trustee candidates (Statement of Policy). The Board believes that each Trustee satisfied at the time he or she was initially elected or appointed a Trustee, and continues to satisfy, the standards contemplated by the Statement of Policy. The Governance and Nominating Committee also engages professional search firms to help identify potential Independent Trustee candidates who have the experience, qualifications, attributes, and skills consistent with the Statement of Policy. From time to time, additional criteria based on the composition and skills of the current Independent Trustees, as well as experience or skills that may be appropriate in light of future changes to board composition, business conditions, and regulatory or other developments, have also been considered by the professional search firms and the Governance and Nominating Committee. In addition, the Board takes into account the Trustees' commitment and participation in Board and committee meetings, as well as their leadership of standing and ad hoc committees throughout their tenure.
In determining that a particular Trustee was and continues to be qualified to serve as a Trustee, the Board has considered a variety of criteria, none of which, in isolation, was controlling. The Board believes that, collectively, the Trustees have balanced and diverse experience, qualifications, attributes, and skills, which allow the Board to operate effectively in governing the fund and protecting the interests of shareholders. Information about the specific experience, skills, attributes, and qualifications of each Trustee, which in each case led to the Board's conclusion that the Trustee should serve (or continue to serve) as a trustee of the fund, is provided below.
Annual Report
Board Structure and Oversight Function. James C. Curvey is an interested person (as defined in the 1940 Act) and currently serves as Acting Chairman. The Trustees have determined that an interested Chairman is appropriate and benefits shareholders because an interested Chairman has a personal and professional stake in the quality and continuity of services provided to the fund. Independent Trustees exercise their informed business judgment to appoint an individual of their choosing to serve as Chairman, regardless of whether the Trustee happens to be independent or a member of management. The Independent Trustees have determined that they can act independently and effectively without having an Independent Trustee serve as Chairman and that a key structural component for assuring that they are in a position to do so is for the Independent Trustees to constitute a substantial majority for the Board. The Independent Trustees also regularly meet in executive session. Ned C. Lautenbach serves as Chairman of the Independent Trustees and as such (i) acts as a liaison between the Independent Trustees and management with respect to matters important to the Independent Trustees and (ii) with management prepares agendas for Board meetings.
Fidelity funds are overseen by different Boards of Trustees. The fund's Board oversees Fidelity's equity and high income funds and another Board oversees Fidelity's investment-grade bond, money market, and asset allocation funds. The asset allocation funds may invest in Fidelity funds overseen by the fund's Board. The use of separate Boards, each with its own committee structure, allows the Trustees of each group of Fidelity funds to focus on the unique issues of the funds they oversee, including common research, investment, and operational issues. On occasion, the separate Boards establish joint committees to address issues of overlapping consequences for the Fidelity funds overseen by each Board.
The Trustees operate using a system of committees to facilitate the timely and efficient consideration of all matters of importance to the Trustees, the fund, and fund shareholders and to facilitate compliance with legal and regulatory requirements and oversight of the fund's activities and associated risks. The Board, acting through its committees, has charged FMR and its affiliates with (i) identifying events or circumstances the occurrence of which could have demonstrably adverse effects on the fund's business and/or reputation; (ii) implementing processes and controls to lessen the possibility that such events or circumstances occur or to mitigate the effects of such events or circumstances if they do occur; and (iii) creating and maintaining a system designed to evaluate continuously business and market conditions in order to facilitate the identification and implementation processes described in (i) and (ii) above. Because the day-to-day operations and activities of the fund are carried out by or through FMR, its affiliates and other service providers, the fund's exposure to risks is mitigated but not eliminated by the processes overseen by the Trustees. While each of the Board's committees has responsibility for overseeing different aspects of the fund's activities, oversight is exercised primarily through the Operations, Audit, and Compliance Committees. In addition, the Independent Trustees have worked with FMR to enhance the Board's oversight of investment and financial risks, legal and regulatory risks, technology risks, and operational risks, including the development of additional risk reporting to the Board. For example, a working group comprised of Independent Trustees and FMR has worked and continues to work to review the Fidelity funds' valuation-related activities, reporting and risk management. Appropriate personnel, including but not limited to the fund's Chief Compliance Officer (CCO), FMR's internal auditor, the independent accountants, the fund's Treasurer and portfolio management personnel, make periodic reports to the Board's committees, as appropriate, including an annual review of FMR's risk management program for the Fidelity funds. The responsibilities of each standing committee, including their oversight responsibilities, are described further under "Standing Committees of the Fund's Trustees."
Annual Report
Trustees and Officers - continued
The fund's Statement of Additional Information (SAI) includes more information about the Trustees. To request a free copy, call Fidelity at 1-877-208-0098.
Interested Trustees*:
Correspondence intended for each Trustee who is an interested person may be sent to Fidelity Investments, 82 Devonshire Street, Boston, Massachusetts 02109.
Name, Age; Principal Occupations and Other Relevant Experience+ |
James C. Curvey (76) |
| Year of Election or Appointment: 2007 Mr. Curvey is Trustee and Acting Chairman of the Board of Trustees of certain Trusts. Mr. Curvey also serves as Trustee (2007-present) of other investment companies advised by FMR. Mr. Curvey is a Director of Fidelity Investments Money Management, Inc. (2009-present), Director of Fidelity Research & Analysis Co. (2009-present) and Director of FMR and FMR Co., Inc. (2007-present). Mr. Curvey is also Vice Chairman (2007-present) and Director of FMR LLC. In addition, Mr. Curvey serves as an Overseer for the Boston Symphony Orchestra and a member of the Trustees of Villanova University. Previously, Mr. Curvey was the Vice Chairman (2006-2007) and Director (2000-2007) of FMR Corp. |
Ronald P. O'Hanley (54) |
| Year of Election or Appointment: 2011 Mr. O'Hanley is Director of FMR Co., Inc. (2010-present), Director of Fidelity Investments Money Management, Inc. (2010-present), Director of Fidelity Research & Analysis Company (2010-present), President of Fidelity Asset Management and Corporate Services and a member of Fidelity's Executive Committee (2010-present). Previously, Mr. O'Hanley served as President and Chief Executive Officer of BNY Mellon Asset Management (2007-2010). Mr. O'Hanley also served as Vice Chairman of Bank New York Mellon Corp. and a member of that firm's Executive Committee. Prior to the 2007 merger of The Bank of New York and Mellon Financial Corporation, he was Vice Chairman of Mellon Financial Corporation and President and Chief Executive Officer of Mellon Asset Management. He joined Mellon in February 1997. Mr. O'Hanley currently serves as Chairman of the Boston Public Library Foundation Board of Directors and sits on the Board of Directors of Beth Israel Deaconess Medical Center, the Board of Trustees of the Marine Biological Laboratory and the Advisory Board of the Maxwell School of Citizenship and Public Administration at Syracuse University. Mr. O'Hanley also chairs the Council on Asset Management for the Financial Services Roundtable and is a member of the Board of Directors of Institutional Investor's U.S. Institute. |
* Trustees have been determined to be "Interested Trustees" by virtue of, among other things, their affiliation with the trust or various entities under common control with FMR.
+ The information above includes each Trustee's principal occupation during the last five years and other information relating to the experience, attributes, and skills relevant to each Trustee's qualifications to serve as a Trustee, which led to the conclusion that each Trustee should serve as a Trustee for the fund.
Annual Report
Trustees and Officers - continued
Independent Trustees:
Correspondence intended for each Independent Trustee (that is, the Trustees other than the Interested Trustees) may be sent to Fidelity Investments, P.O. Box 55235, Boston, Massachusetts 02205-5235.
Name, Age; Principal Occupations and Other Relevant Experience+ |
Dennis J. Dirks (63) |
| Year of Election or Appointment: 2005 Prior to his retirement in May 2003, Mr. Dirks was Chief Operating Officer and a member of the Board of The Depository Trust & Clearing Corporation (DTCC). He also served as President, Chief Operating Officer, and Board member of The Depository Trust Company (DTC) and President and Board member of the National Securities Clearing Corporation (NSCC). In addition, Mr. Dirks served as Chief Executive Officer and Board member of the Government Securities Clearing Corporation, Chief Executive Officer and Board member of the Mortgage-Backed Securities Clearing Corporation, as a Trustee and a member of the Finance Committee of Manhattan College (2005-2008), and as a Trustee and a member of the Finance Committee of AHRC of Nassau County (2006-2008). Mr. Dirks is a member of the Independent Directors Council (IDC) Governing Council (2010-Present) and Board of Directors for The Brookville Center for Children's Services, Inc. (2009-present). |
Alan J. Lacy (58) |
| Year of Election or Appointment: 2008 Mr. Lacy serves as Senior Adviser (2007-present) of Oak Hill Capital Partners, L.P. (private equity). Mr. Lacy also served as Chief Executive Officer (2000-2005) and Vice Chairman (2005-2006) of Sears Holdings Corporation and Sears, Roebuck and Co. (retail). In addition, Mr. Lacy serves as a member of the Board of Directors of Dave & Buster's, Inc. (restaurant and entertainment complexes, 2010-present), The Hillman Companies, Inc. (hardware wholesalers, 2010-present), and Bristol-Myers Squibb Company (global pharmaceuticals, 2007-present). Mr. Lacy is a member of the Board of Trustees of The National Parks Conservation Association (2006-Present). Previously, Mr. Lacy served as Chairman of the Board of Trustees of the National Parks Conservation Association (2008-2011) and as a member of the Board of Directors for the Western Union Company (global money transfer, 2006-2011). |
Ned C. Lautenbach (67) |
| Year of Election or Appointment: 2000 Mr. Lautenbach is Chairman of the Independent Trustees of the Equity and High Income Funds (2006-present). Mr. Lautenbach currently serves as the Lead Director of the Eaton Corporation Board of Directors (diversified industrial, 1997-present). Mr. Lautenbach is also a member of the Board of Directors of the Philharmonic Center for the Arts in Naples, Florida (1999-present); a member of the Board of Trustees of Fairfield University (2005-present); and a member of the Council on Foreign Relations (1994-present). Previously, Mr. Lautenbach was a Partner/Advisory Partner at Clayton, Dubilier & Rice, LLC (private equity investment, 1998-2010), as well as a Director of Sony Corporation (2006-2007). |
Joseph Mauriello (67) |
| Year of Election or Appointment: 2008 Prior to his retirement in January 2006, Mr. Mauriello served in numerous senior management positions including Deputy Chairman and Chief Operating Officer (2004-2005), and Vice Chairman of Financial Services (2002-2004) of KPMG LLP US (professional services, 1965-2005). Mr. Mauriello currently serves as a member of the Board of Directors of XL Group plc. (global insurance and re-insurance, 2006-present) and of Arcadia Resources Inc. (health care services and products, 2007-present). Previously, Mr. Mauriello served as a Director of the Hamilton Funds of the Bank of New York (2006-2007). |
Robert W. Selander (61) |
| Year of Election or Appointment: 2011 Previously, Mr. Selander served as a Member of the Advisory Board of Fidelity's Equity and High Income Funds (2011), Executive Vice Chairman (2010), Chief Executive Officer (2009-2010), and President and Chief Executive Officer (1997-2009) of Mastercard, Inc. |
Cornelia M. Small (67) |
| Year of Election or Appointment: 2005 Ms. Small is a member of the Board of Directors of the Teagle Foundation (2009-present). Ms. Small is also a member of the Investment Committee, and Chair (2008-present) and a member of the Board of Trustees of Smith College. In addition, Ms. Small serves on the Investment Committee of the Berkshire Taconic Community Foundation (2008-present). Previously, Ms. Small served as Chairperson of the Investment Committee (2002-2008) of Smith College. In addition, Ms. Small served as Chief Investment Officer, Director of Global Equity Investments, and a member of the Board of Directors of Scudder, Stevens & Clark and Scudder Kemper Investments. |
William S. Stavropoulos (72) |
| Year of Election or Appointment: 2001 Mr. Stavropoulos is Vice Chairman of the Independent Trustees of the Equity and High Income Funds (2006-present). Mr. Stavropoulos serves as President and Founder of the Michigan Baseball Foundation, the Great Lakes Loons (2007-present). Mr. Stavropoulos is Chairman Emeritus of the Board of Directors of The Dow Chemical Company, where he previously served in numerous senior management positions, including President, CEO (1995-2000; 2002-2004), Chairman of the Executive Committee (2000-2006), and as a member of the Board of Directors (1990-2006). Currently, Mr. Stavropoulos is Chairman of Univar (global distributor of commodity and specialty chemicals, 2010-present), a Director of Teradata Corporation (data warehousing and technology solutions, 2008-present), Chemical Financial Corporation, Maersk Inc. (industrial conglomerate), Tyco International, Inc. (multinational manufacturing and services, 2007-present), and a member of the Advisory Board for Metalmark Capital (private equity investment, 2005-present). Mr. Stavropoulos is a special advisor to Clayton, Dubilier & Rice, LLC (private equity investment). In addition, Mr. Stavropoulos is a member of the University of Notre Dame Advisory Council for the College of Science. |
David M. Thomas (62) |
| Year of Election or Appointment: 2008 Previously, Mr. Thomas served as Executive Chairman (2005-2006) and Chairman and Chief Executive Officer (2000-2005) of IMS Health, Inc. (pharmaceutical and healthcare information solutions). In addition, Mr. Thomas serves as a member of the Board of Directors of Fortune Brands, Inc. (consumer products), and Interpublic Group of Companies, Inc. (marketing communication, 2004-present). |
Michael E. Wiley (61) |
| Year of Election or Appointment: 2008 Mr. Wiley also serves as a Director of Asia Pacific Exploration Consolidated (international oil and gas exploration and production, 2008-present). Mr. Wiley serves as a Director of Tesoro Corporation (independent oil refiner and marketer, 2005-present), and a Director of Bill Barrett Corporation (exploration and production, 2005-present). In addition, Mr. Wiley also serves as a Director of Post Oak Bank (privately-held bank, 2004-present). Previously, Mr. Wiley served as a member of the Board of Trustees of the University of Tulsa (2000-2006; 2007-2010), as a Senior Energy Advisor of Katzenbach Partners, LLC (consulting, 2006-2007), as an Advisory Director of Riverstone Holdings (private investment), Chairman, President, and CEO of Baker Hughes, Inc. (oilfield services, 2000-2004), and as Director of Spinnaker Exploration Company (exploration and production, 2001-2005). |
Annual Report
+ The information above includes each Trustee's principal occupation during the last five years and other information relating to the experience, attributes, and skills relevant to each Trustee's qualifications to serve as a Trustee, which led to the conclusion that each Trustee should serve as a Trustee for the fund.
Advisory Board Members and Executive Officers:
Correspondence intended for each executive officer, Edward C. Johnson 3d, and Peter S. Lynch may be sent to Fidelity Investments, 82 Devonshire Street, Boston, Massachusetts 02109.
Name, Age; Principal Occupation |
Edward C. Johnson 3d (81) |
| Year of Election or Appointment: 2011 Member of the Advisory Board of Fidelity's Equity and High Income Funds. Mr. Johnson serves as Chief Executive Officer, Chairman, and a Director of FMR LLC, and also serves as Chairman and Director of FIL Limited. Previously, Mr. Johnson served as a Trustee and Chairman of the Board of certain Fidelity Trusts, Chairman and a Director of FMR, Chairman and a Director of FMR Co., Inc., and President of FMR LLC (2006-2007). |
Peter S. Lynch (67) |
| Year of Election or Appointment: 2003 Member of the Advisory Board of Fidelity's Equity and High Income Funds. Mr. Lynch is Vice Chairman and a Director of FMR and FMR Co., Inc. In addition, Mr. Lynch serves as a Trustee of Boston College and as the Chairman of the Inner-City Scholarship Fund. Previously, Mr. Lynch served on the Special Olympics International Board of Directors (1997-2006). |
Kenneth B. Robins (42) |
| Year of Election or Appointment: 2008 President and Treasurer of Fidelity's Equity and High Income Funds. Mr. Robins also serves as President and Treasurer (2010-present) and Assistant Treasurer (2009-present) of other Fidelity funds and is an employee of Fidelity Investments (2004-present). Previously, Mr. Robins served as Deputy Treasurer of the Fidelity funds (2005-2008) and Treasurer and Chief Financial Officer of The North Carolina Capital Management Trust: Cash and Term Portfolios (2006-2008). |
Bruce T. Herring (46) |
| Year of Election or Appointment: 2006 Vice President of certain Equity Funds. Mr. Herring also serves as Chief Investment Officer and Director of Fidelity Management & Research (U.K.) Inc. (2010-present) and Group Chief Investments Officer of FMR. Previously, Mr. Herring served as Vice President (2005-2006) and Senior Vice President (2006-2007) of Fidelity Management & Research Company, Vice President of FMR Co., Inc. (2001-2007) and as a portfolio manager for Fidelity U.S. Equity Funds. |
Brian B. Hogan (47) |
| Year of Election or Appointment: 2009 Vice President of Equity and High Income Funds. Mr. Hogan also serves as President of FMR's Equity Division (2009-present). Previously, Mr. Hogan served as Senior Vice President, Equity Research of FMR (2006-2009) and as a portfolio manager. |
Scott C. Goebel (43) |
| Year of Election or Appointment: 2008 Secretary and Chief Legal Officer (CLO) of the Fidelity funds. Mr. Goebel also serves as Secretary of Fidelity Investments Money Management, Inc. (FIMM) (2010-present) and Fidelity Research and Analysis Company (FRAC) (2010-present); Secretary and CLO of The North Carolina Capital Management Trust: Cash and Term Portfolios (2008-present); General Counsel, Secretary, and Senior Vice President of FMR (2008-present) and FMR Co., Inc. (2008-present); employed by FMR LLC or an affiliate (2001-present); Chief Legal Officer of Fidelity Management & Research (Hong Kong) Limited (2008-present) and Assistant Secretary of Fidelity Management & Research (Japan) Inc. (2008-present), and Fidelity Management & Research (U.K.) Inc. (2008-present). Previously, Mr. Goebel served as Assistant Secretary of FIMM (2008-2010), FRAC (2008-2010), and the Funds (2007-2008) and as Vice President and Secretary of Fidelity Distributors Corporation (FDC) (2005-2007). |
William C. Coffey (42) |
| Year of Election or Appointment: 2009 Assistant Secretary of Fidelity's Equity and High Income Funds. Mr. Coffey also serves as Senior Vice President and Deputy General Counsel of FMR LLC (2010-present), and is an employee of Fidelity Investments. Previously, Mr. Coffey served as Vice President and Associate General Counsel of FMR LLC (2005-2009). |
Holly C. Laurent (57) |
| Year of Election or Appointment: 2008 Anti-Money Laundering (AML) Officer of the Fidelity funds. Ms. Laurent also serves as AML Officer of The North Carolina Capital Management Trust: Cash and Term Portfolios (2008-present) and is an employee of Fidelity Investments. Previously, Ms. Laurent was Senior Vice President and Head of Legal for Fidelity Business Services India Pvt. Ltd. (2006-2008), and Senior Vice President, Deputy General Counsel and Group Head for FMR LLC (2005-2006). |
Christine Reynolds (53) |
| Year of Election or Appointment: 2008 Chief Financial Officer of the Fidelity funds. Ms. Reynolds became President of Fidelity Pricing and Cash Management Services (FPCMS) in August 2008. Ms. Reynolds served as Chief Operating Officer of FPCMS (2007-2008). Previously, Ms. Reynolds served as President, Treasurer, and Anti-Money Laundering officer of the Fidelity funds (2004-2007). |
Kenneth A. Rathgeber (64) |
| Year of Election or Appointment: 2004 Chief Compliance Officer of Fidelity's Equity and High Income Funds. Mr. Rathgeber is Chief Compliance Officer of Fidelity Management & Research (Hong Kong) Limited (2008-present), Fidelity Management & Research (Japan) Inc. (2008-present), FMR (2005-present), FMR Co., Inc. (2005-present), Fidelity Management & Research (U.K.) Inc. (2005-present), Fidelity Research & Analysis Company (2005-present), Fidelity Investments Money Management, Inc. (2005-present), Pyramis Global Advisors, LLC (2005-present), and Strategic Advisers, Inc. (2005-present). |
Jeffrey S. Christian (50) |
| Year of Election or Appointment: 2009 Deputy Treasurer of the Fidelity funds. Mr. Christian is an employee of Fidelity Investments. Previously, Mr. Christian served as Chief Financial Officer (2008-2009) of certain Fidelity funds and Senior Vice President of Fidelity Pricing and Cash Management Services (FPCMS) (2004-2009). |
Joseph F. Zambello (54) |
| Year of Election or Appointment: 2011 Deputy Treasurer of the Fidelity funds. Mr. Zambello is an employee of Fidelity Investments. Previously, Mr. Zambello served as Vice President of FMR's Program Management Group (2009-2011) and Vice President of the Transfer Agent Oversight Group (2005-2009). |
Adrien E. Deberghes (44) |
| Year of Election or Appointment: 2008 Deputy Treasurer of Fidelity's Equity and High Income Funds. Mr. Deberghes also serves as Vice President and Assistant Treasurer of Fidelity Rutland Square Trust II and Fidelity Commonwealth Trust II (2011-present), Assistant Treasurer of other Fidelity funds (2010-present), and is an employee of Fidelity Investments (2008-present). Previously, Mr. Deberghes served as Senior Vice President of Mutual Fund Administration at State Street Corporation (2007-2008), Senior Director of Mutual Fund Administration at Investors Bank & Trust (2005-2007), and Director of Finance for Dunkin' Brands (2000-2005). |
Stephanie J. Dorsey (42) |
| Year of Election or Appointment: 2010 Assistant Treasurer of Fidelity's Equity and High Income Funds. Ms. Dorsey also serves as Deputy Treasurer of other Fidelity funds (2008-present) and is an employee of Fidelity Investments (2008-present). Previously, Ms. Dorsey served as Treasurer (2004-2008) of the JPMorgan Mutual Funds and Vice President (2004-2008) of JPMorgan Chase Bank. |
John R. Hebble (53) |
| Year of Election or Appointment: 2009 Assistant Treasurer of Fidelity's Equity and High Income Funds. Mr. Hebble also serves as President (2011-present), Treasurer, and Chief Financial Officer of The North Carolina Capital Management Trust: Cash and Term Portfolios (2008-present), President and Treasurer of other Fidelity funds (2008-present) and is an employee of Fidelity Investments. |
Gary W. Ryan (53) |
| Year of Election or Appointment: 2005 Assistant Treasurer of the Fidelity funds. Mr. Ryan is an employee of Fidelity Investments. Previously, Mr. Ryan served as Vice President of Fund Reporting in Fidelity Pricing and Cash Management Services (FPCMS) (1999-2005). |
Jonathan Davis (43) |
| Year of Election or Appointment: 2010 Assistant Treasurer of the Fidelity funds. Mr. Davis is also Assistant Treasurer of Fidelity Rutland Square Trust II and Fidelity Commonwealth Trust II. Mr. Davis is an employee of Fidelity Investments. Previously, Mr. Davis served as Vice President and Associate General Counsel of FMR LLC (2003-2010). |
Annual Report
Institutional Class designates 7% of the dividend distributed during the fiscal year as qualifying for the dividends-received deduction for corporate shareholders.
Institutional Class designates 100% of the dividends distributed during the fiscal year as amounts which may be taken into account as a dividend for purposes of the maximum rate under section 1(h)(11) of the Internal Revenue Code.
The amounts per share which represent income derived from sources within, and taxes paid to, foreign countries or possessions of the United States are as follows:
| Pay Date | Income | Taxes |
Institutional Class | 12/06/2010 | $0.046 | $0.0108 |
| 07/11/2011 | $0.002 | $0.0000 |
The fund will notify shareholders in January 2012 of amounts for use in preparing 2011 income tax returns.
Annual Report
Board Approval of Investment Advisory Contracts and Management Fees
Fidelity Advisor Global Capital Appreciation Fund
Each year, the Board of Trustees, including the Independent Trustees (together, the Board), votes on the renewal of the management contract and sub-advisory agreements (together, the Advisory Contracts) for the fund. The Board, assisted by the advice of fund counsel and Independent Trustees' counsel, requests and considers a broad range of information relevant to the renewal of the Advisory Contracts throughout the year.
The Board meets regularly and considers at each of its meetings factors that are relevant to its annual consideration of the renewal of the fund's Advisory Contracts, including the services and support provided to the fund and its shareholders. The Board has established various standing committees, each composed of Independent Trustees with varying backgrounds, to which the Board has assigned specific subject matter responsibilities in order to enhance effective decision-making by the Board. The Board, acting directly and through its Committees, requests and receives information concerning the annual consideration of the renewal of the fund's Advisory Contracts. The Board also meets as needed to consider matters specifically related to the Board's annual consideration of the renewal of Advisory Contracts. Members of the Board may also meet with trustees of other Fidelity funds through ad hoc joint committees to discuss certain matters relevant to the Fidelity funds.
At its July 2011 meeting, the Board of Trustees, including the Independent Trustees, unanimously determined to renew the fund's Advisory Contracts. In reaching its determination, the Board considered all factors it believed relevant, including (i) the nature, extent, and quality of the services to be provided to the fund and its shareholders (including the investment performance of the fund); (ii) the competitiveness of the fund's management fee and total expense ratio; (iii) the total costs of the services to be provided by and the profits to be realized by Fidelity from its relationship with the fund; (iv) the extent to which economies of scale would be realized as the fund grows; and (v) whether fee levels reflect these economies of scale, if any, for the benefit of fund shareholders.
In considering whether to renew the Advisory Contracts for the fund, the Board reached a determination, with the assistance of fund counsel and Independent Trustees' counsel and through the exercise of its business judgment, that the renewal of the Advisory Contracts is in the best interests of the fund and its shareholders and that the compensation payable under the Advisory Contracts is fair and reasonable. The Board's decision to renew the Advisory Contracts was not based on any single factor, but rather was based on a comprehensive consideration of all the information provided to the Board at its meetings throughout the year. The Board, in reaching its determination to renew the Advisory Contracts, is aware that shareholders in the fund have a broad range of investment choices available to them, including a wide choice among mutual funds offered by Fidelity's competitors, and that the fund's shareholders, who have the opportunity to review and weigh the disclosure provided by the fund in its prospectus and other public disclosures, have chosen to invest in this fund, managed by Fidelity.
Annual Report
Nature, Extent, and Quality of Services Provided. The Board considered the staffing within the investment adviser, FMR, and the sub-advisers (together, the Investment Advisers), including the backgrounds of the fund's investment personnel and the fund's investment objective and discipline. The Independent Trustees also had discussions with senior management of Fidelity's investment operations and investment groups. The Board considered the structure of the portfolio manager compensation program and whether this structure provides appropriate incentives to act in the best interests of the fund.
Resources Dedicated to Investment Management and Support Services. The Board and the Fund Oversight and Research Committees reviewed the general qualifications and capabilities of the Investment Advisers' investment staff, including its size, education, experience, and resources, as well as the Investment Advisers' approach to recruiting, training, managing, and compensating investment personnel. The Board also noted that FMR has devoted increased resources to non-U.S. offices. The Board noted that Fidelity's analysts have extensive resources, tools and capabilities which allow them to conduct sophisticated quantitative and fundamental analysis, as well as credit analysis of issuers, counterparties and enhancers. The Board also believes that Fidelity's investment professionals have sufficient access to global information and data so as to provide competitive investment results over time, and that those professionals also have access to sophisticated tools which permit them to assess portfolio construction and risk and performance attribution characteristics continuously, as well as to transmit new information and research conclusions rapidly around the world. Additionally, in their deliberations, the Board considered the Investment Advisers' trading capabilities and resources which are an integral part of the investment management process.
Shareholder and Administrative Services. The Board considered (i) the nature, extent, quality, and cost of advisory, administrative, and shareholder services performed by the Investment Advisers and their affiliates under the Advisory Contracts and under separate agreements covering transfer agency, pricing and bookkeeping, and securities lending services for the fund; (ii) the nature and extent of the investment adviser's supervision of third party service providers, principally custodians and subcustodians; and (iii) the resources devoted to, and the record of compliance with, the fund's compliance policies and procedures. The Board also reviewed the allocation of fund brokerage, including allocations to brokers affiliated with the Investment Advisers, the use of brokerage commissions to pay fund expenses, and the use of "soft" commission dollars to pay for research services.
The Board noted that the growth of fund assets over time across the complex allows Fidelity to reinvest in the development of services designed to enhance the value or convenience of the Fidelity funds as investment vehicles. These services include 24-hour access to account information and market information through telephone representatives and over the Internet, investor education materials and asset allocation tools, and the expanded availability of Fidelity Investor Centers, with 35 new branches opening since 2010.
Annual Report
Board Approval of Investment Advisory Contracts and
Management Fees - continued
Investment in a Large Fund Family. The Board considered the benefits to shareholders of investing in a Fidelity fund, including the benefits of investing in a fund that is part of a large family of funds offering a variety of investment disciplines and providing a large variety of mutual fund investor services. The Board noted that Fidelity had taken, or had made recommendations that resulted in the Fidelity funds taking, a number of actions over the previous year that benefited particular funds, including (i) continuing to dedicate additional resources to investment research and support of the senior management team that oversees asset management; (ii) rationalizing product lines through the mergers of six funds into other funds; (iii) continuing to migrate the Freedom Funds to dedicated lower cost underlying funds; (iv) obtaining shareholder approval to broaden the investment strategies for Fidelity Consumer Finance Portfolio, Fidelity Emerging Asia Fund, and Fidelity Environment and Alternative Energy Portfolio; (v) contractually agreeing to reduce the management fees and impose other expense limitations on Spartan 500 Index Fund and U.S. Bond Index Fund in connection with launching new institutional classes of these funds; (vi) changing the name, primary and supplemental benchmarks, and investment policies of Fidelity Global Strategies Fund to support the fund's flexible investment mandate and global orientation; and (vii) reducing the transfer agency account fee rates on certain accounts.
Investment Performance. The Board considered whether the fund has operated in accordance with its investment objective, as well as its record of compliance with its investment restrictions. It also reviewed the fund's absolute investment performance for each class, as well as the fund's relative investment performance for each class measured over multiple periods against (i) a broad-based securities market index, and (ii) a peer group of mutual funds deemed appropriate by Fidelity and reviewed by the Board. The following charts considered by the Board show, over the one-, three-, and five-year periods ended December 31, 2010, the cumulative total returns of Institutional Class (Class I) and Class B of the fund, the cumulative total returns of a broad-based securities market index ("benchmark"), and a range of cumulative total returns of a peer group of mutual funds identified by Morningstar, Inc. as having an investment style similar to that of the fund based on underlying portfolio holdings. The returns of Institutional Class (Class I) and Class B show the performance of the highest and lowest performing classes, respectively (based on five-year performance). The box within each chart shows the 25th percentile return (bottom of box) and the 75th percentile return (top of box) of the peer group. Returns shown above the box are in the first quartile and returns shown below the box are in the fourth quartile. The percentage beaten numbers noted below each chart correspond to the percentile box and represent the percentage of funds in the peer group whose performance was equal to or lower than that of the class indicated.
Annual Report
Fidelity Advisor Global Capital Appreciation Fund
The Board reviewed the fund's relative investment performance against its peer group and noted that the performance of Institutional Class (Class I) of the fund was in the first quartile for the one- and three-year periods and the third quartile for the five-year period. The Board also noted that the investment performance of Institutional Class (Class I) of the fund compared favorably to its benchmark for the one- and three-year periods, although the fund's five-year cumulative total return was lower than its benchmark. The Board considered that the variations in performance among the fund's classes reflect the variations in class expenses, which result in lower performance for higher expense classes. The Board also reviewed the fund's performance since inception as well as performance in the current year.
The Board also considered that the fund's management fee is subject to upward or downward adjustment depending upon whether, and to what extent, the fund's investment performance for the performance period exceeds, or is exceeded by, the record (over the same period) of a Board-approved performance adjustment index. The Board noted that the performance adjustment provides FMR with a strong economic incentive to seek to achieve superior performance for the fund's shareholders and helps to more closely align the interests of FMR and the fund's shareholders.
Based on its review, the Board concluded that the nature, extent, and quality of services provided to the fund under the Advisory Contracts should benefit the fund's shareholders.
Annual Report
Board Approval of Investment Advisory Contracts and
Management Fees - continued
Competitiveness of Management Fee and Total Expense Ratio. The Board considered the fund's management fee and total expense ratio compared to "mapped groups" of competitive funds and classes. Fidelity creates "mapped groups" by combining similar Lipper investment objective categories that have comparable management fee characteristics. Combining Lipper investment objective categories aids the Board's management fee and total expense ratio comparisons by broadening the competitive group used for comparison and by reducing the number of universes to which various Fidelity funds are compared.
Management Fee. The Board considered two proprietary management fee comparisons for the 12-month periods shown in the chart below. The group of Lipper funds used by the Board for management fee comparisons is referred to below as the "Total Mapped Group." The Total Mapped Group comparison focuses on a fund's standing relative to the total universe of comparable funds available to investors in terms of gross management fees before expense reimbursements or caps, and without giving effect to the fund's performance adjustment. "TMG %" represents the percentage of funds in the Total Mapped Group that had management fees that were lower than the fund's. For example, a TMG % of 16% means that 84% of the funds in the Total Mapped Group had higher management fees than the fund. The "Asset-Size Peer Group" (ASPG) comparison focuses on a fund's standing relative to non-Fidelity funds similar in size to the fund within the Total Mapped Group. The ASPG represents at least 15% of the funds in the Total Mapped Group with comparable asset size and management fee characteristics, subject to a minimum of 50 funds (or all funds in the Total Mapped Group if fewer than 50). Additional information, such as the ASPG quartile in which the fund's management fee ranked and the impact of the fund's performance adjustment, is also included in the chart and considered by the Board.
Annual Report
Fidelity Advisor Global Capital Appreciation Fund
The Board noted that the fund's management fee ranked below the median of its Total Mapped Group and below the median of its ASPG for 2010. The Board also noted the effect of the fund's positive performance adjustment on the fund's management fee ranking. The Board noted that the performance adjustment for each year represents calculations for performance periods that differ from the periods shown in the performance charts above.
Based on its review, the Board concluded that the fund's management fee is fair and reasonable in light of the services that the fund receives and the other factors considered.
Total Expense Ratio. In its review of each class's total expense ratio, the Board considered the fund's management fee as well as other fund or class expenses, as applicable, such as transfer agent fees, pricing and bookkeeping fees, fund-paid 12b-1 fees, and custodial, legal, and audit fees. The Board also noted the effects of any waivers and reimbursements on fees and expenses, as well as the impact of the fund's performance adjustment. As part of its review, the Board also considered the current and historical total expense ratios of each class of the fund compared to competitive fund median expenses. Each class of the fund is compared to those funds and classes in the Total Mapped Group (used by the Board for management fee comparisons) that have a similar sales load structure.
The Board noted that the total expense ratio of each of Class A and Class B ranked below its competitive median for 2010, the total expense ratio of Class C ranked equal to its competitive median for 2010, and the total expense ratio of each of Class T and Institutional Class ranked above its competitive median for 2010. The Board considered that various factors, including 12b-1 fees, positive or negative performance adjustments, and relatively higher other expenses in the case of small fund size, can affect total expense ratios. The Board noted that the total expense ratio of Class T was above the competitive median primarily because of higher 12b-1 fees on Class T. Class T has a higher 12b-1 fee, but a lower front-end sales charge, than traditionally priced front-end sales charge classes. The Board noted that the fund offers multiple classes, each of which has a different sales load and 12b-1 fee structure, and that the multiple structures are intended to offer a range of pricing options for the intermediary market. The Board also noted that the total expense ratios of the classes vary primarily by the level of their 12b-1 fees, although differences in transfer agent fees may also cause expenses to vary from class to class.
Annual Report
Board Approval of Investment Advisory Contracts and
Management Fees - continued
Fees Charged to Other Fidelity Clients. The Board also considered Fidelity fee structures and other information with respect to clients of FMR and its affiliates, such as other mutual funds advised or subadvised by FMR or its affiliates, pension plan clients, and other institutional clients. In March 2010, the Board created an ad hoc joint committee with the board of other Fidelity funds (the Committee) to review and compare Fidelity's institutional investment advisory business with its business of providing services to the Fidelity funds, including the differences in services provided, fees charged, and costs incurred, as well as competition in their respective marketplaces.
Based on its review of total expense ratios and fees charged to other Fidelity clients, the Board concluded that the total expense ratio of each class of the fund was reasonable, although in some cases above the median of the universe presented for comparison, in light of the services that the fund and its shareholders receive and the other factors considered, including the findings of the Committee.
Costs of the Services and Profitability. The Board considered the revenues earned and the expenses incurred by Fidelity in conducting the business of developing, marketing, distributing, managing, administering and servicing the fund and its shareholders. The Board also considered the level of Fidelity's profits in respect of all the Fidelity funds.
On an annual basis, FMR presents to the Board Fidelity's profitability for the fund. Fidelity calculates the profitability for each fund, as well as aggregate profitability for groups of Fidelity funds and all Fidelity funds, using a series of detailed revenue and cost allocation methodologies which originate with the books and records of Fidelity on which Fidelity's audited financial statements are based. The Audit Committee of the Board reviews any significant changes from the prior year's methodologies.
PricewaterhouseCoopers LLP (PwC), independent registered public accounting firm and auditor to Fidelity and certain Fidelity funds, has been engaged annually by the Board as part of the Board's assessment of Fidelity's profitability analysis. PwC's engagement includes the review and assessment of Fidelity's methodologies used in determining the revenues and expenses attributable to Fidelity's mutual fund business, and completion of agreed-upon procedures surrounding the mathematical accuracy of fund profitability and its conformity to allocation methodologies. After considering PwC's reports issued under the engagement and information provided by Fidelity, the Board concluded that while other allocation methods may also be reasonable, Fidelity's profitability methodologies are reasonable in all material respects.
Annual Report
The Board also reviewed Fidelity's non-fund businesses and fall-out benefits related to the mutual fund business as well as cases where Fidelity's affiliates may benefit from or be related to the fund's business.
The Board considered the costs of the services provided by and the profits realized by Fidelity in connection with the operation of the fund and was satisfied that the profitability was not excessive in the circumstances.
Economies of Scale. The Board considered whether there have been economies of scale in respect of the management of the Fidelity funds, whether the Fidelity funds (including the fund) have appropriately benefited from any such economies of scale, and whether there is potential for realization of any further economies of scale. The Board considered the extent to which the fund will benefit from economies of scale through increased services to the fund, through waivers or reimbursements, or through fee or expense reductions. The Board also noted that in 2009, it and the board of other Fidelity funds created an ad hoc committee (the Economies of Scale Committee) to analyze whether FMR attains economies of scale in respect of the management and servicing of the Fidelity funds, whether the Fidelity funds have appropriately benefited from such economies of scale, and whether there is potential for realization of any further economies of scale.
The Board recognized that the fund's management contract incorporates a "group fee" structure, which provides for lower group fee rates as total fund assets under FMR's management increase, and for higher group fee rates as total fund assets under FMR's management decrease. FMR calculates the group fee rates based on a tiered asset "breakpoint" schedule that varies based on asset class. The Board considered that the group fee is designed to deliver the benefits of economies of scale to fund shareholders when total Fidelity fund assets increase, even if assets of any particular fund are unchanged or have declined, because some portion of Fidelity's costs are attributable to services provided to all Fidelity funds, and all funds benefit if those costs can be allocated among more assets. The Board concluded that, given the group fee structure, fund shareholders will benefit from lower management fees as assets under FMR's management increase at the fund complex level, regardless of whether Fidelity achieves any such economies of scale.
Annual Report
Board Approval of Investment Advisory Contracts and
Management Fees - continued
The Board concluded, taking into account the analysis of the Economies of Scale Committee, that any potential economies of scale are being appropriately shared between fund shareholders and Fidelity.
Additional Information Requested by the Board. In order to develop fully the factual basis for consideration of the Fidelity funds' Advisory Contracts, the Board requested and received additional information on certain topics, including (i) fund performance trends, actions to be taken by FMR to improve certain funds' overall performance, and Fidelity's long-term strategies for certain funds; (ii) portfolio manager changes that have occurred during the past year and length of portfolio manager tenure for different categories of funds over time; (iii) Fidelity's compensation structure for portfolio managers and other key personnel and strategies for attracting and retaining non-investment personnel; (iv) the amount of the investment that each portfolio manager has made in the Fidelity fund(s) that he or she manages; (v) historical trends in Fidelity's realization of fall-out benefits; (vi) Fidelity's group fee structures and the rationale for the individual fee rates of certain funds; (vii) fund profitability methodology and the impact of certain factors on fund profitability results; (viii) trends regarding industry use of performance fee structures and Fidelity's compliance practices with respect to performance adjustment calculations; (ix) the fee structures in place for certain other Fidelity clients; and (x) explanations regarding the relative total expense ratios of certain funds and classes, total expense competitive trends, and actions that might be taken by FMR to reduce total expense ratios for certain funds and classes.
Based on its evaluation of all of the conclusions noted above, and after considering all factors it believed relevant, the Board ultimately concluded that the advisory fee structures are fair and reasonable, and that the fund's Advisory Contracts should be renewed.
Annual Report
Investment Adviser
Fidelity Management & Research Company
Boston, MA
Investment Sub-Advisers
FMR Co., Inc.
Fidelity Management & Research
(U.K.) Inc.
FIL Investment Advisors
FIL Investments (Japan) Limited
FIL Investment Advisors (UK) Limited
Fidelity Management & Research
(Hong Kong) Limited
Fidelity Management & Research
(Japan) Inc.
General Distributor
Fidelity Distributors Corporation
Boston, MA
Transfer and Service Agents
Fidelity Investments Institutional Operations Company, Inc.
Boston, MA
Fidelity Service Company, Inc.
Boston, MA
Custodian
State Street Bank and Trust Company
Quincy, MA
AGLOI-UANN-1211
1.784745.108
(Fidelity Investment logo)(registered trademark)
Fidelity Advisor®
International
Capital Appreciation
Fund - Class A, Class T, Class B
and Class C
Annual Report
October 31, 2011
Contents
Chairman's Message | (Click Here) | The Chairman's message to shareholders. |
Performance | (Click Here) | How the fund has done over time. |
Management's Discussion of Fund Performance | (Click Here) | The Portfolio Manager's review of fund performance and strategy. |
Shareholder Expense Example | (Click Here) | An example of shareholder expenses. |
Investment Changes | (Click Here) | A summary of major shifts in the fund's investments over the past six months. |
Investments | (Click Here) | A complete list of the fund's investments with their market values. |
Financial Statements | (Click Here) | Statements of assets and liabilities, operations, and changes in net assets, as well as financial highlights. |
Notes | (Click Here) | Notes to the financial statements. |
Report of Independent Registered Public Accounting Firm | (Click Here) | |
Trustees and Officers | (Click Here) | |
Distributions | (Click Here) | |
Board Approval of Investment Advisory Contracts and Management Fees | (Click Here) | |
To view a fund's proxy voting guidelines and proxy voting record for the 12-month period ended June 30, visit http://www.fidelity.com/proxyvotingresults or visit the Securities and Exchange Commission's (SEC) web site at http://www.sec.gov. You may also call 1-877-208-0098 to request a free copy of the proxy voting guidelines.
Standard & Poor's, S&P and S&P 500 are registered service marks of The McGraw-Hill Companies, Inc. and have been licensed for use by Fidelity Distributors Corporation.
Other third party marks appearing herein are the property of their respective owners.
All other marks appearing herein are registered or unregistered trademarks or service marks of FMR LLC or an affiliated company.
Annual Report
This report and the financial statements contained herein are submitted for the general information of the shareholders of the fund. This report is not authorized for distribution to prospective investors in the fund unless preceded or accompanied by an effective prospectus.
A fund files its complete schedule of portfolio holdings with the SEC for the first and third quarters of each fiscal year on Form N-Q. Forms N-Q are available on the SEC's web site at http://www.sec.gov. A fund's Forms N-Q may be reviewed and copied at the SEC's Public Reference Room in Washington, DC. Information regarding the operation of the SEC's Public Reference Room may be obtained by calling 1-800-SEC-0330. For a complete list of a fund's portfolio holdings, view the most recent holdings listing, semiannual report, or annual report on Fidelity's web site at http://www.fidelity.com, http://www.advisor.fidelity.com, or http://www.401k.com, as applicable.
NOT FDIC INSURED • MAY LOSE VALUE • NO BANK GUARANTEE
Neither the fund nor Fidelity Distributors Corporation is a bank.
Annual Report
(photo_of_James_C_Curvey)
Dear Shareholder:
Global equity markets began the fourth quarter on a strong note, sharply reversing course in October amid strong corporate earnings, better-than-expected economic news and the promise of a resolution to the sovereign debt crisis in Europe. The mini rally followed a third quarter marked by a significant downturn in July and August, which heightened investor anxiety and set off a wave of volatility that hampered most major asset classes through the end of September. Financial markets are difficult to predict, of course, but you can help put the odds in your favor by following these time-tested investment principles.
One of the basic tenets is to invest according to your time horizon. For long-term investors, riding out the markets' inevitable ups and downs has proven much more effective than making decisions based on short-term developments. If your goal is approaching, you can also benefit from patience and restraint, rather than attempting to time the market. No matter your time horizon, missing only a few of the markets' best days can significantly diminish returns. Patience also affords the benefits of compounding - earning interest on additional income or reinvested dividends and capital gains. While staying the course doesn't eliminate risk, it can considerably lessen the negative impact of short-term downturns.
Asset allocation is another principle to manage risk. As you spread your portfolio among the asset classes, be sure to consider your time horizon, risk tolerance and investment objectives. Younger investors may be better served by emphasizing equities, which historically have been the best-performing asset class over time. Investors who are nearing a specific goal, such as retirement or sending a child to college, may choose to favor bonds and other investments that have tended to be more stable. Studies indicate that asset allocation is the single most important determinant of a portfolio's long-term success. After deciding on a suitable allocation strategy, make sure your portfolio is adequately diversified, with exposure to stocks of small-, mid- and large-cap companies in a range of sectors, for example. And today, more than ever, geographic diversification should be taken into account.
Lastly, investing a certain amount of money on a regular basis - a principle known as dollar-cost averaging - can help lower the average cost of your purchases, while also giving you the discipline to avoid selling weak performers just prior to an upswing, or chasing a hot performer just before a correction.
We invite you to learn more by visiting us on the Internet, dropping by one of our Investor Centers or calling us by phone. It is our privilege to provide the resources you need to choose investments that are right for you.
Sincerely,
(The acting chairman's signature appears here.)
James C. Curvey
Acting Chairman
Annual Report
Average annual total return reflects the change in the value of an investment, assuming reinvestment of the class' distributions from dividend income and capital gains (the profits earned upon the sale of securities that have grown in value, if any) and assuming a constant rate of performance each year. The $10,000 table and the fund's returns do not reflect the deduction of taxes that a shareholder would pay on fund distributions or the redemption of fund shares. During periods of reimbursement by Fidelity, a fund's total return will be greater than it would be had the reimbursement not occurred. How a fund did yesterday is no guarantee of how it will do tomorrow. Returns reflect the conversion of Class B shares to Class A shares after a maximum of seven years.
Average Annual Total Returns
Periods ended October 31, 2011 | Past 1
year | Past 5
years | Past 10
years |
Class A (incl. 5.75% sales charge) | -9.75% | -2.75% | 4.85% |
Class T (incl. 3.50% sales charge) | -7.85% | -2.53% | 4.85% |
Class B (incl. contingent deferred sales charge) A | -9.69% | -2.57% | 4.88% |
Class C (incl. contingent deferred sales charge) B | -6.00% | -2.33% | 4.70% |
A Class B shares' contingent deferred sales charges included in the past one year, past five years, and past ten years total return figures are 5%, 2%, and 0%, respectively.
B Class C shares' contingent deferred sales charges included in the past one year, past five years, and past ten years total return figures are 1%, 0%, and 0%, respectively.
Annual Report
$10,000 Over 10 Years
Let's say hypothetically that $10,000 was invested in Fidelity Advisor® International Capital Appreciation Fund - Class A on October 31, 2001, and the current 5.75% sales charge was paid. The chart shows how the value of your investment would have changed, and also shows how the MSCI® ACWI® (All Country World Index) ex USA Index performed over the same period.

Annual Report
Market Recap: International equities were rocked by a number of headline events during the year ending October 31, 2011. Stocks posted a solid advance for the first half of the period, despite concern about the sovereign debt crisis in Europe, a devastating earthquake and tsunami in Japan, and political upheaval in the Middle East and North Africa. Sentiment turned decidedly negative in the second half, however, as fresh worries about Europe, inflation in China and a dimmed outlook for global growth caused foreign markets to suffer declines that intensified in August and September. October brought with it yet another dramatic swing, as eurozone policymakers appeared near a resolution to the debt debacle and buyers stormed back onto the scene in search of bargains. Still, those gains - along with favorable currency fluctuations overall - weren't enough to offset prior losses, and the MSCI® ACWI® (All Country World Index) ex USA Index finished the period down 4.56%. Within the MSCI index, Europe and emerging markets suffered the biggest declines, with many countries in these areas sustaining steep losses. By contrast, Japan showed resilience in the wake of its natural disasters, falling only 2%. Australia (+4%), Switzerland (+3%), the U.K. (+2%) and Canada, which produced a nominal return, were among the few major benchmark components to break into positive territory.
Comments from Sammy Simnegar, Portfolio Manager of Fidelity Advisor® International Capital Appreciation Fund: For the year, the fund's Class A, Class T, Class B and Class C shares returned -4.25%, -4.51%, -4.99% and -5.07%, respectively (excluding sales charges), straddling the MSCI index. Stock picking in consumer discretionary and materials aided relative performance, as did underweighting utilities. Geographically, out-of-benchmark exposure to the United States and positioning in Indonesia, Brazil and Russia helped. The fund's top contributor, Canadian junior silver miner Aurcana, was lifted by surging silver prices and sold. Other notable contributors included two Indonesian holdings, retailer Mitra Adiperkasa and tobacco firm Gudang Garam. Conversely, positioning in health care detracted, as did stock selection in financials and underweighted telecommunication services exposure. Geographically, positioning in India, China and the United Kingdom hurt the fund. Swiss food and beverage maker Nestle - the fund's largest holding at period end - was its largest relative detractor, mainly due to untimely ownership. Other key detractors were India-based Jain Irrigation Systems and Vedanta Resources, a U.K. metals and mining firm. Aurcana, Mitra Adiperkasa and Jain Irrigation Systems were non-index holdings. I sold Jain and Vedanta by period end.
The views expressed above reflect those of the portfolio manager(s) only through the end of the period as stated on the cover of this report and do not necessarily represent the views of Fidelity or any other person in the Fidelity organization. Any such views are subject to change at any time based upon market or other conditions and Fidelity disclaims any responsibility to update such views. These views may not be relied on as investment advice and, because investment decisions for a Fidelity fund are based on numerous factors, may not be relied on as an indication of trading intent on behalf of any Fidelity fund.
Annual Report
Shareholder Expense Example
As a shareholder of the Fund, you incur two types of costs: (1) transaction costs, including sales charges (loads) on purchase payments or redemption proceeds, redemption fees, and (2) ongoing costs, including management fees, distribution and/or service (12b-1) fees and other Fund expenses. This Example is intended to help you understand your ongoing costs (in dollars) of investing in the Fund and to compare these costs with the ongoing costs of investing in other mutual funds.
The Example is based on an investment of $1,000 invested at the beginning of the period and held for the entire period (May 1, 2011 to October 31, 2011).
Actual Expenses
The first line of the accompanying table for each class of the Fund provides information about actual account values and actual expenses. You may use the information in this line, together with the amount you invested, to estimate the expenses that you paid over the period. Simply divide your account value by $1,000.00 (for example, an $8,600 account value divided by $1,000.00 = 8.6), then multiply the result by the number in the first line for a class of the Fund under the heading entitled "Expenses Paid During Period" to estimate the expenses you paid on your account during this period. In addition, the Fund, as a shareholder in the underlying Fidelity Central Funds, will indirectly bear its pro-rata share of the fees and expenses incurred by the underlying Fidelity Central Funds. These fees and expenses are not included in the Fund's annualized expense ratio used to calculate the expense estimate in the table below.
Hypothetical Example for Comparison Purposes
The second line of the accompanying table for each class of the Fund provides information about hypothetical account values and hypothetical expenses based on a Class' actual expense ratio and an assumed rate of return of 5% per year before expenses, which is not the Class' actual return. The hypothetical account values and expenses may not be used to estimate the actual ending account balance or expenses you paid for the period. You may use this information to compare the ongoing costs of investing in the Fund and other funds. To do so, compare this 5% hypothetical example with the 5% hypothetical examples that appear in the shareholder reports of the other funds. In addition, the Fund, as a shareholder in the underlying Fidelity Central Funds, will indirectly bear its pro-rata share of the fees and expenses incurred by the underlying Fidelity Central Funds. These fees and expenses are not included in the Fund's annualized expense ratio used to calculate the expense estimate in the table below.
Please note that the expenses shown in the table are meant to highlight your ongoing costs only and do not reflect any transaction costs. Therefore, the second line of the table is useful in comparing ongoing costs only, and will not help you determine the relative total costs of owning different funds. In addition, if these transactional costs were included, your costs would have been higher.
Annual Report
| Annualized
Expense Ratio | Beginning
Account Value
May 1, 2011 | Ending
Account Value
October 31, 2011 | Expenses Paid
During Period*
May 1, 2011 to
October 31, 2011 |
Class A | 1.45% | | | |
Actual | | $ 1,000.00 | $ 846.60 | $ 6.75 |
HypotheticalA | | $ 1,000.00 | $ 1,017.90 | $ 7.38 |
Class T | 1.70% | | | |
Actual | | $ 1,000.00 | $ 845.30 | $ 7.91 |
HypotheticalA | | $ 1,000.00 | $ 1,016.64 | $ 8.64 |
Class B | 2.20% | | | |
Actual | | $ 1,000.00 | $ 842.60 | $ 10.22 |
HypotheticalA | | $ 1,000.00 | $ 1,014.12 | $ 11.17 |
Class C | 2.20% | | | |
Actual | | $ 1,000.00 | $ 842.20 | $ 10.22 |
HypotheticalA | | $ 1,000.00 | $ 1,014.12 | $ 11.17 |
Institutional Class | 1.20% | | | |
Actual | | $ 1,000.00 | $ 847.20 | $ 5.59 |
HypotheticalA | | $ 1,000.00 | $ 1,019.16 | $ 6.11 |
A 5% return per year before expenses
* Expenses are equal to each Class' annualized expense ratio, multiplied by the average account value over the period, multiplied by 184/365 (to reflect the one-half year period).
Annual Report
Investment Changes (Unaudited)
Top Five Stocks as of October 31, 2011 |
| % of fund's
net assets | % of fund's net assets
6 months ago |
Nestle SA (Switzerland, Food Products) | 2.3 | 0.0 |
Royal Dutch Shell PLC Class B (United Kingdom, Oil, Gas & Consumable Fuels) | 2.0 | 1.9 |
British American Tobacco PLC (United Kingdom) (United Kingdom, Tobacco) | 1.8 | 1.0 |
BHP Billiton PLC ADR (United Kingdom, Metals & Mining) | 1.7 | 2.0 |
Unilever PLC (United Kingdom, Food Products) | 1.2 | 0.0 |
| 9.0 | |
Top Five Market Sectors as of October 31, 2011 |
| % of fund's
net assets | % of fund's net assets
6 months ago |
Consumer Discretionary | 22.0 | 23.8 |
Consumer Staples | 21.5 | 10.2 |
Financials | 16.3 | 20.2 |
Materials | 10.9 | 12.6 |
Industrials | 9.9 | 11.4 |
Top Five Countries as of October 31, 2011 |
(excluding cash equivalents) | % of fund's
net assets | % of fund's net assets
6 months ago |
United States of America | 15.8 | 9.5 |
United Kingdom | 14.7 | 14.6 |
France | 7.9 | 7.3 |
Japan | 7.7 | 14.4 |
Switzerland | 5.7 | 4.2 |
Percentages are adjusted for the effect of open futures contracts, if applicable. |
Asset Allocation (% of fund's net assets) |
As of October 31, 2011 | As of April 30, 2011 |
| Stocks 97.9% | | | Stocks 98.8% | |
| Short-Term
Investments and
Net Other Assets 2.1% | | | Short-Term
Investments and
Net Other Assets 1.2% | |

Annual Report
Investments October 31, 2011
Showing Percentage of Net Assets
Common Stocks - 96.1% |
| Shares | | Value |
Australia - 1.0% |
Atlas Iron Ltd. | 184,307 | | $ 597,835 |
Fortescue Metals Group Ltd. | 135,133 | | 678,816 |
TOTAL AUSTRALIA | | 1,276,651 |
Belgium - 0.8% |
Anheuser-Busch InBev SA NV | 18,457 | | 1,023,702 |
Bermuda - 1.0% |
Credicorp Ltd. (NY Shares) | 6,800 | | 739,704 |
Petra Diamonds Ltd. (a) | 324,062 | | 599,330 |
TOTAL BERMUDA | | 1,339,034 |
Brazil - 4.8% |
BR Malls Participacoes SA | 63,900 | | 690,278 |
Brasil Foods SA sponsored ADR (d) | 37,600 | | 791,480 |
Cia.Hering SA | 30,500 | | 681,152 |
Companhia de Bebidas das Americas (AmBev) (PN) sponsored ADR | 25,400 | | 856,488 |
Iguatemi Empresa de Shopping Centers SA | 32,800 | | 635,486 |
Itau Unibanco Banco Multiplo SA sponsored ADR | 55,500 | | 1,061,160 |
Multiplan Empreendimentos Imobiliarios SA | 33,500 | | 677,335 |
Souza Cruz Industria Comerico | 57,500 | | 705,189 |
TOTAL BRAZIL | | 6,098,568 |
Canada - 1.4% |
First Quantum Minerals Ltd. | 36,800 | | 771,920 |
Potash Corp. of Saskatchewan, Inc. | 20,400 | | 965,513 |
TOTAL CANADA | | 1,737,433 |
Cayman Islands - 3.2% |
Belle International Holdings Ltd. | 391,000 | | 766,840 |
China ZhengTong Auto Services Holdings Ltd. | 563,000 | | 609,624 |
Ctrip.com International Ltd. sponsored ADR (a)(d) | 17,000 | | 592,620 |
Hengdeli Holdings Ltd. | 1,680,000 | | 753,173 |
Intime Department Store Group Co. Ltd. | 475,500 | | 682,376 |
Maoye International Holdings Ltd. (a) | 2,601,000 | | 714,536 |
TOTAL CAYMAN ISLANDS | | 4,119,169 |
Chile - 0.5% |
Banco Santander Chile sponsored ADR | 8,200 | | 669,776 |
China - 1.5% |
Baidu.com, Inc. sponsored ADR (a) | 4,600 | | 644,828 |
Common Stocks - continued |
| Shares | | Value |
China - continued |
Golden Eagle Retail Group Ltd. (H Shares) | 289,000 | | $ 726,310 |
SINA Corp. (a)(d) | 7,300 | | 593,417 |
TOTAL CHINA | | 1,964,555 |
Colombia - 0.5% |
Grupo de Inversiones Surameric | 39,200 | | 688,626 |
Grupo de Inversiones Surameric rights 11/22/11 (a) | 10,029 | | 1,505 |
TOTAL COLOMBIA | | 690,131 |
Curacao - 0.5% |
Schlumberger Ltd. | 8,600 | | 631,842 |
Denmark - 1.3% |
Christian Hansen Holding AS | 29,500 | | 644,674 |
Novo Nordisk A/S Series B sponsored ADR | 10,200 | | 1,084,260 |
TOTAL DENMARK | | 1,728,934 |
Finland - 1.1% |
Kone Oyj (B Shares) | 13,200 | | 729,603 |
Nokian Tyres PLC | 19,314 | | 709,646 |
TOTAL FINLAND | | 1,439,249 |
France - 7.9% |
Air Liquide SA | 7,500 | | 973,055 |
Atos Origin SA | 13,067 | | 633,281 |
BNP Paribas SA | 20,504 | | 932,135 |
Casino Guichard Perrachon et Compagnie | 7,595 | | 713,888 |
Christian Dior SA | 5,640 | | 798,472 |
Danone | 15,600 | | 1,085,919 |
LVMH Moet Hennessy - Louis Vuitton | 6,458 | | 1,074,701 |
Pernod Ricard SA | 8,600 | | 803,354 |
PPR SA | 5,000 | | 781,212 |
Remy Cointreau SA | 8,500 | | 698,731 |
Schneider Electric SA | 15,139 | | 893,554 |
Technip SA | 8,000 | | 760,813 |
TOTAL FRANCE | | 10,149,115 |
Germany - 3.7% |
BASF AG | 16,791 | | 1,235,979 |
Bayerische Motoren Werke AG (BMW) | 11,706 | | 956,768 |
SAP AG | 18,929 | | 1,144,763 |
Siemens AG sponsored ADR | 13,100 | | 1,375,107 |
TOTAL GERMANY | | 4,712,617 |
Common Stocks - continued |
| Shares | | Value |
India - 4.2% |
Bajaj Auto Ltd. | 19,716 | | $ 697,347 |
Gitanjali Gems Ltd. | 86,312 | | 613,642 |
HDFC Bank Ltd. | 75,199 | | 749,956 |
Housing Development Finance Corp. Ltd. | 61,226 | | 861,623 |
ITC Ltd. | 163,879 | | 714,784 |
Jubilant Foodworks Ltd. (a) | 35,699 | | 588,301 |
Smithkline Beecham Consumer Healthcare Ltd. | 12,522 | | 599,522 |
Titan Industries Ltd. | 132,926 | | 590,311 |
TOTAL INDIA | | 5,415,486 |
Indonesia - 4.8% |
PT Ace Hardware Indonesia Tbk | 1,792,000 | | 680,239 |
PT Astra International Tbk | 104,000 | | 801,918 |
PT Bank Mandiri (Persero) Tbk | 959,500 | | 765,377 |
PT Bank Rakyat Indonesia Tbk | 991,000 | | 745,080 |
PT Global Mediacom Tbk | 6,703,000 | | 601,769 |
PT Gudang Garam Tbk | 104,000 | | 682,643 |
PT Indofood Sukses Makmur Tbk | 1,107,000 | | 657,115 |
PT Mitra Adiperkasa Tbk | 1,110,000 | | 611,345 |
PT Modern Internasional Tbk | 1,896,500 | | 635,603 |
TOTAL INDONESIA | | 6,181,089 |
Israel - 1.0% |
Check Point Software Technologies Ltd. (a) | 10,100 | | 582,063 |
Israel Chemicals Ltd. | 57,000 | | 685,887 |
TOTAL ISRAEL | | 1,267,950 |
Italy - 2.3% |
Prada SpA | 149,600 | | 739,541 |
Saipem SpA | 17,114 | | 767,364 |
Salvatore Ferragamo Italia SpA (a) | 44,300 | | 717,902 |
Tod's SpA | 6,983 | | 698,691 |
TOTAL ITALY | | 2,923,498 |
Japan - 7.7% |
Canon, Inc. sponsored ADR (d) | 22,606 | | 1,029,703 |
Fanuc Corp. | 6,000 | | 970,266 |
Japan Tobacco, Inc. | 159 | | 794,809 |
Kakaku.com, Inc. | 15,800 | | 625,681 |
Keyence Corp. | 2,600 | | 661,033 |
Komatsu Ltd. | 36,700 | | 907,517 |
Makita Corp. | 17,900 | | 668,356 |
Mitsubishi Corp. | 44,600 | | 917,404 |
Common Stocks - continued |
| Shares | | Value |
Japan - continued |
Nabtesco Corp. | 33,300 | | $ 729,417 |
Rakuten, Inc. | 593 | | 650,151 |
Sysmex Corp. | 17,800 | | 585,162 |
THK Co. Ltd. | 37,500 | | 730,931 |
Unicharm Corp. | 13,800 | | 618,097 |
TOTAL JAPAN | | 9,888,527 |
Netherlands - 0.7% |
ING Groep NV sponsored ADR (a)(d) | 101,894 | | 880,364 |
Nigeria - 1.0% |
Guaranty Trust Bank PLC GDR (Reg. S) | 152,931 | | 703,483 |
Guinness Nigeria PLC | 483,504 | | 613,481 |
TOTAL NIGERIA | | 1,316,964 |
Norway - 0.6% |
DnB NOR ASA | 63,600 | | 741,939 |
Portugal - 0.5% |
Jeronimo Martins SGPS SA | 39,200 | | 678,111 |
Russia - 3.1% |
Magnit OJSC: | | | |
rights 11/29/11 (a) | 772 | | 0 |
GDR (Reg. S) | 31,795 | | 812,362 |
NOVATEK OAO GDR | 5,700 | | 800,280 |
Sberbank of Russia | 317,500 | | 861,546 |
TNK-BP Holding | 269,300 | | 736,811 |
Uralkali JSC GDR (Reg. S) | 17,500 | | 759,500 |
TOTAL RUSSIA | | 3,970,499 |
South Africa - 1.1% |
Mr Price Group Ltd. | 71,400 | | 687,343 |
Shoprite Holdings Ltd. | 46,100 | | 675,616 |
TOTAL SOUTH AFRICA | | 1,362,959 |
Spain - 0.6% |
Inditex SA | 9,120 | | 829,968 |
Sweden - 1.4% |
Atlas Copco AB (A Shares) | 35,700 | | 781,402 |
H&M Hennes & Mauritz AB (B Shares) | 29,930 | | 991,155 |
TOTAL SWEDEN | | 1,772,557 |
Switzerland - 5.7% |
Compagnie Financiere Richemont SA Series A | 17,844 | | 1,021,778 |
Credit Suisse Group sponsored ADR (d) | 30,300 | | 877,791 |
Dufry AG (a) | 6,000 | | 645,433 |
Common Stocks - continued |
| Shares | | Value |
Switzerland - continued |
Nestle SA | 51,760 | | $ 3,002,203 |
The Swatch Group AG (Bearer) | 2,020 | | 855,372 |
UBS AG (NY Shares) (a) | 77,200 | | 974,264 |
TOTAL SWITZERLAND | | 7,376,841 |
Thailand - 1.6% |
C.P. Seven Eleven PCL (For. Reg.) | 416,000 | | 629,457 |
Kasikornbank PCL (For. Reg.) | 180,700 | | 730,477 |
Siam Makro PCL (For. Reg.) | 96,900 | | 648,877 |
TOTAL THAILAND | | 2,008,811 |
Turkey - 0.6% |
Turkiye Garanti Bankasi AS | 199,000 | | 702,254 |
United Kingdom - 14.7% |
Anglo American PLC (United Kingdom) | 28,100 | | 1,036,442 |
Antofagasta PLC | 37,400 | | 701,912 |
Barclays PLC sponsored ADR (d) | 69,200 | | 865,692 |
BG Group PLC | 56,597 | | 1,234,677 |
BHP Billiton PLC ADR | 35,400 | | 2,229,138 |
British American Tobacco PLC (United Kingdom) | 50,000 | | 2,292,944 |
Burberry Group PLC | 36,200 | | 780,688 |
Imperial Tobacco Group PLC | 26,870 | | 982,648 |
Reckitt Benckiser Group PLC | 18,100 | | 930,887 |
Royal Dutch Shell PLC Class B | 70,744 | | 2,538,637 |
SABMiller PLC | 26,600 | | 971,705 |
Standard Chartered PLC (United Kingdom) | 49,496 | | 1,161,356 |
The Weir Group PLC | 23,100 | | 712,897 |
Unilever PLC | 44,700 | | 1,498,631 |
Xstrata PLC | 55,877 | | 939,501 |
TOTAL UNITED KINGDOM | | 18,877,755 |
United States of America - 15.3% |
Allergan, Inc. | 7,500 | | 630,900 |
Apple, Inc. (a) | 1,580 | | 639,552 |
Caterpillar, Inc. | 6,700 | | 632,882 |
Citigroup, Inc. | 18,700 | | 590,733 |
Citrix Systems, Inc. (a) | 8,500 | | 619,055 |
Coach, Inc. | 10,200 | | 663,714 |
Cummins, Inc. | 6,600 | | 656,238 |
EMC Corp. (a) | 26,000 | | 637,260 |
Freeport-McMoRan Copper & Gold, Inc. | 15,260 | | 614,368 |
Goldman Sachs Group, Inc. | 5,500 | | 602,525 |
Common Stocks - continued |
| Shares | | Value |
United States of America - continued |
Google, Inc. Class A (a) | 1,100 | | $ 651,904 |
Halliburton Co. | 16,200 | | 605,232 |
Joy Global, Inc. | 6,900 | | 601,680 |
JPMorgan Chase & Co. | 17,695 | | 615,078 |
Las Vegas Sands Corp. (a) | 14,440 | | 677,958 |
Lorillard, Inc. | 5,700 | | 630,762 |
MasterCard, Inc. Class A | 1,860 | | 645,866 |
Mead Johnson Nutrition Co. Class A | 8,300 | | 596,355 |
Oracle Corp. | 18,900 | | 619,353 |
Philip Morris International, Inc. | 18,700 | | 1,306,569 |
Rackspace Hosting, Inc. (a) | 15,917 | | 658,805 |
salesforce.com, Inc. (a) | 5,000 | | 665,850 |
The Coca-Cola Co. | 9,200 | | 628,544 |
The Mosaic Co. | 10,284 | | 602,231 |
Tiffany & Co., Inc. | 8,475 | | 675,712 |
TJX Companies, Inc. | 10,700 | | 630,551 |
United Technologies Corp. | 8,622 | | 672,344 |
Visa, Inc. Class A | 6,600 | | 615,516 |
Wells Fargo & Co. | 23,040 | | 596,966 |
Yum! Brands, Inc. | 12,400 | | 664,268 |
TOTAL UNITED STATES OF AMERICA | | 19,648,771 |
TOTAL COMMON STOCKS (Cost $118,770,312) | 123,425,119 |
Preferred Stocks - 1.8% |
| | | |
Convertible Preferred Stocks - 0.5% |
United States of America - 0.5% |
Citigroup, Inc. 7.50% | 6,400 | | 608,256 |
Nonconvertible Preferred Stocks - 1.3% |
Germany - 0.7% |
Volkswagen AG | 5,400 | | 947,584 |
Italy - 0.6% |
Fiat Industrial SpA (a) | 124,767 | | 765,597 |
TOTAL NONCONVERTIBLE PREFERRED STOCKS | | 1,713,181 |
TOTAL PREFERRED STOCKS (Cost $2,334,730) | 2,321,437 |
Money Market Funds - 2.8% |
| Shares | | Value |
Fidelity Securities Lending Cash Central Fund, 0.11% (b)(c)
(Cost $3,635,275) | 3,635,275 | | $ 3,635,275 |
TOTAL INVESTMENT PORTFOLIO - 100.7% (Cost $124,740,317) | | 129,381,831 |
NET OTHER ASSETS (LIABILITIES) - (0.7)% | | (908,855) |
NET ASSETS - 100% | $ 128,472,976 |
Legend |
(a) Non-income producing |
(b) Affiliated fund that is available only to investment companies and other accounts managed by Fidelity Investments. The rate quoted is the annualized seven-day yield of the fund at period end. A complete unaudited listing of the fund's holdings as of its most recent quarter end is available upon request. In addition, each Fidelity Central Fund's financial statements, which are not covered by the Fund's Report of Independent Registered Public Accounting Firm, are available on the SEC's website or upon request. |
(c) Investment made with cash collateral received from securities on loan. |
(d) Security or a portion of the security is on loan at period end. |
Affiliated Central Funds |
Information regarding fiscal year to date income earned by the Fund from investments in Fidelity Central Funds is as follows: |
Fund | Income earned |
Fidelity Cash Central Fund | $ 1,013 |
Fidelity Securities Lending Cash Central Fund | 56,613 |
Total | $ 57,626 |
Other Information |
The following is a summary of the inputs used, as of October 31, 2011, involving the Fund's assets and liabilities carried at fair value. The inputs or methodology used for valuing securities may not be an indication of the risk associated with investing in those securities. For more information on valuation inputs, and their aggregation into the levels used in the table below, please refer to the Security Valuation section in the accompanying Notes to Financial Statements. |
Valuation Inputs at Reporting Date: |
Description | Total | Level 1 | Level 2 | Level 3 |
Investments in Securities: | | | | |
Equities: | | | | |
United States of America | $ 20,257,027 | $ 20,257,027 | $ - | $ - |
United Kingdom | 18,877,755 | 12,547,543 | 6,330,212 | - |
France | 10,149,115 | 10,149,115 | - | - |
Japan | 9,888,527 | 1,029,703 | 8,858,824 | - |
Switzerland | 7,376,841 | 7,376,841 | - | - |
Indonesia | 6,181,089 | - | 6,181,089 | - |
Brazil | 6,098,568 | 6,098,568 | - | - |
Germany | 5,660,201 | 4,515,438 | 1,144,763 | - |
India | 5,415,486 | - | 5,415,486 | - |
Other | 35,841,947 | 26,538,878 | 9,303,069 | - |
Money Market Funds | 3,635,275 | 3,635,275 | - | - |
Total Investments in Securities: | $ 129,381,831 | $ 92,148,388 | $ 37,233,443 | $ - |
Income Tax Information |
At October 31, 2011, the Fund had a capital loss carryforward of approximately $106,313,982 of which $82,346,110 and $23,967,872 will expire in fiscal 2016 and 2017, respectively. Capital loss carryforwards are only available to offset future capital gains of the Fund to the extent provided by regulations and may be limited. |
See accompanying notes which are an integral part of the financial statements.
Annual Report
Statement of Assets and Liabilities
| October 31, 2011 |
Assets | | |
Investment in securities, at value (including securities loaned of $3,356,766) - See accompanying schedule: Unaffiliated issuers (cost $121,105,042) | $ 125,746,556 | |
Fidelity Central Funds (cost $3,635,275) | 3,635,275 | |
Total Investments (cost $124,740,317) | | $ 129,381,831 |
Foreign currency held at value (cost $579,009) | | 581,479 |
Receivable for investments sold | | 4,413,395 |
Receivable for fund shares sold | | 77,149 |
Dividends receivable | | 381,785 |
Distributions receivable from Fidelity Central Funds | | 655 |
Prepaid expenses | | 491 |
Receivable from investment adviser for expense reductions | | 23,612 |
Other receivables | | 301,715 |
Total assets | | 135,162,112 |
| | |
Liabilities | | |
Payable to custodian bank | $ 689,424 | |
Payable for investments purchased | 1,873,920 | |
Payable for fund shares redeemed | 221,135 | |
Accrued management fee | 96,229 | |
Distribution and service plan fees payable | 50,392 | |
Other affiliated payables | 35,481 | |
Other payables and accrued expenses | 87,280 | |
Collateral on securities loaned, at value | 3,635,275 | |
Total liabilities | | 6,689,136 |
| | |
Net Assets | | $ 128,472,976 |
Net Assets consist of: | | |
Paid in capital | | $ 231,514,686 |
Undistributed net investment income | | 717,375 |
Accumulated undistributed net realized gain (loss) on investments and foreign currency transactions | | (108,322,367) |
Net unrealized appreciation (depreciation) on investments and assets and liabilities in foreign currencies | | 4,563,282 |
Net Assets | | $ 128,472,976 |
See accompanying notes which are an integral part of the financial statements.
Annual Report
Statement of Assets and Liabilities - continued
| October 31, 2011 |
Calculation of Maximum Offering Price Class A:
Net Asset Value and redemption price per share ($40,363,509 ÷ 3,955,202 shares) | | $ 10.21 |
| | |
Maximum offering price per share (100/94.25 of $10.21) | | $ 10.83 |
Class T:
Net Asset Value and redemption price per share ($59,914,188 ÷ 5,992,747 shares) | | $ 10.00 |
| | |
Maximum offering price per share (100/96.50 of $10.00) | | $ 10.36 |
Class B:
Net Asset Value and offering price per share ($4,241,394 ÷ 458,113 shares)A | | $ 9.26 |
| | |
Class C:
Net Asset Value and offering price per share ($19,618,816 ÷ 2,124,523 shares)A | | $ 9.23 |
| | |
Institutional Class:
Net Asset Value, offering price and redemption price per share ($4,335,069 ÷ 398,828 shares) | | $ 10.87 |
A Redemption price per share is equal to net asset value less any applicable contingent deferred sales charge.
See accompanying notes which are an integral part of the financial statements.
Annual Report
Financial Statements - continued
Statement of Operations
| Year ended October 31, 2011 |
Investment Income | | |
Dividends | | $ 2,945,449 |
Special dividends | | 381,278 |
Interest | | 12 |
Income from Fidelity Central Funds | | 57,626 |
Income before foreign taxes withheld | | 3,384,365 |
Less foreign taxes withheld | | (220,492) |
Total income | | 3,163,873 |
| | |
Expenses | | |
Management fee
Basic fee | $ 1,057,229 | |
Performance adjustment | 165,453 | |
Transfer agent fees | 445,253 | |
Distribution and service plan fees | 754,996 | |
Accounting and security lending fees | 78,197 | |
Custodian fees and expenses | 172,238 | |
Independent trustees' compensation | 835 | |
Registration fees | 63,175 | |
Audit | 78,417 | |
Legal | 682 | |
Miscellaneous | 1,411 | |
Total expenses before reductions | 2,817,886 | |
Expense reductions | (384,303) | 2,433,583 |
Net investment income (loss) | | 730,290 |
Realized and Unrealized Gain (Loss) Net realized gain (loss) on: | | |
Investment securities: | | |
Unaffiliated issuers | 8,574,922 | |
Foreign currency transactions | (163,435) | |
Total net realized gain (loss) | | 8,411,487 |
Change in net unrealized appreciation (depreciation) on: Investment securities (net of decrease in deferred foreign taxes of $220,998) | (14,252,180) | |
Assets and liabilities in foreign currencies | (42,225) | |
Total change in net unrealized appreciation (depreciation) | | (14,294,405) |
Net gain (loss) | | (5,882,918) |
Net increase (decrease) in net assets resulting from operations | | $ (5,152,628) |
See accompanying notes which are an integral part of the financial statements.
Annual Report
Statement of Changes in Net Assets
| Year ended
October 31,
2011 | Year ended
October 31,
2010 |
Increase (Decrease) in Net Assets | | |
Operations | | |
Net investment income (loss) | $ 730,290 | $ 615,258 |
Net realized gain (loss) | 8,411,487 | 13,450,085 |
Change in net unrealized appreciation (depreciation) | (14,294,405) | 12,333,412 |
Net increase (decrease) in net assets resulting
from operations | (5,152,628) | 26,398,755 |
Distributions to shareholders from net investment income | (760,710) | (1,027,978) |
Distributions to shareholders from net realized gain | (1,721,042) | (2,639,506) |
Total distributions | (2,481,752) | (3,667,484) |
Share transactions - net increase (decrease) | (24,900,583) | (21,653,630) |
Redemption fees | 3,558 | 4,947 |
Total increase (decrease) in net assets | (32,531,405) | 1,082,588 |
| | |
Net Assets | | |
Beginning of period | 161,004,381 | 159,921,793 |
End of period (including undistributed net investment income of $717,375 and undistributed net investment income of $577,824, respectively) | $ 128,472,976 | $ 161,004,381 |
See accompanying notes which are an integral part of the financial statements.
Annual Report
Financial Highlights - Class A
Years ended October 31, | 2011 | 2010 | 2009 | 2008 | 2007 |
Selected Per-Share Data | | | | |
Net asset value, beginning of period | $ 10.85 | $ 9.34 | $ 6.39 | $ 18.64 | $ 17.79 |
Income from Investment Operations | | | | | |
Net investment income (loss) C | .08 J | .06 | .09 | .11 | .07 |
Net realized and unrealized gain (loss) | (.53) | 1.69 | 2.88 | (8.42) | 3.81 |
Total from investment operations | (.45) | 1.75 | 2.97 | (8.31) | 3.88 |
Distributions from net investment income | (.08) | (.08) | (.02) | (.05) | (.12) |
Distributions from net realized gain | (.12) | (.16) | - | (3.89) | (2.90) |
Total distributions | (.19) I | (.24) | (.02) | (3.94) | (3.03) H |
Redemption fees added to paid in capital C, G | - | - | - | - | - |
Net asset value, end of period | $ 10.21 | $ 10.85 | $ 9.34 | $ 6.39 | $ 18.64 |
Total Return A, B | (4.25)% | 18.98% | 46.61% | (55.70)% | 24.76% |
Ratios to Average Net Assets D, F | | | | |
Expenses before reductions | 1.64% | 1.45% | 1.27% | 1.42% | 1.47% |
Expenses net of fee waivers, if any | 1.45% | 1.45% | 1.27% | 1.42% | 1.47% |
Expenses net of all reductions | 1.38% | 1.27% | 1.15% | 1.25% | 1.39% |
Net investment income (loss) | .74% J | .66% | 1.22% | .95% | .39% |
Supplemental Data | | | | |
Net assets, end of period (000 omitted) | $ 40,364 | $ 49,058 | $ 43,389 | $ 35,517 | $ 113,579 |
Portfolio turnover rate E | 254% | 490% | 414% | 394% | 146% |
A Total returns would have been lower if certain expenses had not been reduced during the applicable periods shown.
B Total returns do not include the effect of the sales charges.
C Calculated based on average shares outstanding during the period.
D Fees and expenses of any underlying Fidelity Central Funds are not included in the Fund's expense ratio. The Fund indirectly bears its proportionate share of the expenses of any underlying Fidelity Central Funds.
E Amount does not include the portfolio activity of any underlying Fidelity Central Funds.
F Expense ratios reflect operating expenses of the class. Expenses before reductions do not reflect amounts reimbursed by the investment adviser or reductions from brokerage service arrangements or reductions from other expense offset arrangements and do not represent the amount paid by the class during periods when reimbursements or reductions occur. Expenses net of fee waivers reflect expenses after reimbursement by the investment adviser but prior to reductions from brokerage service arrangements or other expense offset arrangements. Expenses net of all reductions represent the net expenses paid by the class.
G Amount represents less than $.01 per share.
H Total distributions of $3.03 per share is comprised of distributions from net investment income of $.123 and distributions from net realized gain of $2.903 per share.
I Total distributions of $.19 per share is comprised of distributions from net investment income of $.077 and distributions from net realized gain of $.116 per share.
J Investment income per share reflects a special dividend which amounted to $.03 per share. Excluding the special dividend, the ratio of net investment income (loss) to average net assets would have been .49%.
See accompanying notes which are an integral part of the financial statements.
Annual Report
Financial Highlights - Class T
Years ended October 31, | 2011 | 2010 | 2009 | 2008 | 2007 |
Selected Per-Share Data | | | | |
Net asset value, beginning of period | $ 10.63 | $ 9.16 | $ 6.28 | $ 18.38 | $ 17.57 |
Income from Investment Operations | | | | | |
Net investment income (loss) C | .05 J | .04 | .07 | .08 | .03 |
Net realized and unrealized gain (loss) | (.52) | 1.65 | 2.82 | (8.28) | 3.76 |
Total from investment operations | (.47) | 1.69 | 2.89 | (8.20) | 3.79 |
Distributions from net investment income | (.05) | (.06) | (.01) | (.01) | (.07) |
Distributions from net realized gain | (.12) | (.16) | - | (3.89) | (2.90) |
Total distributions | (.16) I | (.22) | (.01) | (3.90) | (2.98) H |
Redemption fees added to paid in capital C, G | - | - | - | - | - |
Net asset value, end of period | $ 10.00 | $ 10.63 | $ 9.16 | $ 6.28 | $ 18.38 |
Total Return A, B | (4.51)% | 18.65% | 46.23% | (55.79)% | 24.47% |
Ratios to Average Net Assets D, F | | | | |
Expenses before reductions | 1.88% | 1.69% | 1.52% | 1.65% | 1.69% |
Expenses net of fee waivers, if any | 1.70% | 1.69% | 1.52% | 1.65% | 1.69% |
Expenses net of all reductions | 1.62% | 1.51% | 1.41% | 1.48% | 1.61% |
Net investment income (loss) | .49% J | .42% | .96% | .71% | .18% |
Supplemental Data | | | | |
Net assets, end of period (000 omitted) | $ 59,914 | $ 74,056 | $ 78,005 | $ 57,603 | $ 179,990 |
Portfolio turnover rate E | 254% | 490% | 414% | 394% | 146% |
A Total returns would have been lower if certain expenses had not been reduced during the applicable periods shown.
B Total returns do not include the effect of the sales charges.
C Calculated based on average shares outstanding during the period.
D Fees and expenses of any underlying Fidelity Central Funds are not included in the Fund's expense ratio. The Fund indirectly bears its proportionate share of the expenses of any underlying Fidelity Central Funds.
E Amount does not include the portfolio activity of any underlying Fidelity Central Funds.
F Expense ratios reflect operating expenses of the class. Expenses before reductions do not reflect amounts reimbursed by the investment adviser or reductions from brokerage service arrangements or reductions from other expense offset arrangements and do not represent the amount paid by the class during periods when reimbursements or reductions occur. Expenses net of fee waivers reflect expenses after reimbursement by the investment adviser but prior to reductions from brokerage service arrangements or other expense offset arrangements. Expenses net of all reductions represent the net expenses paid by the class.
G Amount represents less than $.01 per share.
H Total distributions of $2.98 per share is comprised of distributions from net investment income of $0.74 and distributions from net realized gain of $2.903 per share.
I Total distributions of $.16 per share is comprised of distributions from net investment income of $.047 and distributions from net realized gain of $.116 per share.
J Investment income per share reflects a special dividend which amounted to $.03 per share. Excluding the special dividend, the ratio of net investment income (loss) to average net assets would have been .24%.
See accompanying notes which are an integral part of the financial statements.
Annual Report
Financial Highlights - Class B
Years ended October 31, | 2011 | 2010 | 2009 | 2008 | 2007 |
Selected Per-Share Data | | | | | |
Net asset value, beginning of period | $ 9.84 | $ 8.51 | $ 5.86 | $ 17.36 | $ 16.72 |
Income from Investment Operations | | | | | |
Net investment income (loss) C | - G, I | (.01) | .03 | .02 | (.06) |
Net realized and unrealized gain (loss) | (.48) | 1.53 | 2.63 | (7.75) | 3.57 |
Total from investment operations | (.48) | 1.52 | 2.66 | (7.73) | 3.51 |
Distributions from net investment income | (.01) | (.03) | (.01) | - | - |
Distributions from net realized gain | (.09) | (.16) | - | (3.77) | (2.87) |
Total distributions | (.10) | (.19) | (.01) | (3.77) | (2.87) H |
Redemption fees added to paid in capital C, G | - | - | - | - | - |
Net asset value, end of period | $ 9.26 | $ 9.84 | $ 8.51 | $ 5.86 | $ 17.36 |
Total Return A, B | (4.99)% | 18.03% | 45.50% | (56.02)% | 23.85% |
Ratios to Average Net Assets D, F | | | | | |
Expenses before reductions | 2.39% | 2.20% | 2.02% | 2.17% | 2.24% |
Expenses net of fee waivers, if any | 2.20% | 2.20% | 2.02% | 2.17% | 2.24% |
Expenses net of all reductions | 2.13% | 2.02% | 1.90% | 2.01% | 2.17% |
Net investment income (loss) | (.01)% I | (.09)% | .47% | .19% | (.38)% |
Supplemental Data | | | | | |
Net assets, end of period (000 omitted) | $ 4,241 | $ 8,737 | $ 10,661 | $ 10,356 | $ 40,013 |
Portfolio turnover rate E | 254% | 490% | 414% | 394% | 146% |
A Total returns would have been lower if certain expenses had not been reduced during the applicable periods shown.
B Total returns do not include the effect of the contingent deferred sales charge.
C Calculated based on average shares outstanding during the period.
D Fees and expenses of any underlying Fidelity Central Funds are not included in the Fund's expense ratio. The Fund indirectly bears its proportionate share of the expenses of any underlying Fidelity Central Funds.
E Amount does not include the portfolio activity of any underlying Fidelity Central Funds.
F Expense ratios reflect operating expenses of the class. Expenses before reductions do not reflect amounts reimbursed by the investment adviser or reductions from brokerage service arrangements or reductions from other expense offset arrangements and do not represent the amount paid by the class during periods when reimbursements or reductions occur. Expenses net of fee waivers reflect expenses after reimbursement by the investment adviser but prior to reductions from brokerage service arrangements or other expense offset arrangements. Expenses net of all reductions represent the net expenses paid by the class.
G Amount represents less than $.01 per share.
H Total distributions of $2.87 per share is comprised of distributions from net realized gain of $2.869 per share.
I Investment income per share reflects a special dividend which amounted to $.03 per share. Excluding the special dividend, the ratio of net investment income (loss) to average net assets would have been (.26)%.
See accompanying notes which are an integral part of the financial statements.
Annual Report
Financial Highlights - Class C
Years ended October 31, | 2011 | 2010 | 2009 | 2008 | 2007 |
Selected Per-Share Data | | | | | |
Net asset value, beginning of period | $ 9.84 | $ 8.51 | $ 5.87 | $ 17.42 | $ 16.80 |
Income from Investment Operations | | | | | |
Net investment income (loss) C | - G, J | (.01) | .03 | .02 | (.05) |
Net realized and unrealized gain (loss) | (.49) | 1.53 | 2.62 | (7.75) | 3.57 |
Total from investment operations | (.49) | 1.52 | 2.65 | (7.73) | 3.52 |
Distributions from net investment income | (.01) | (.04) | (.01) | - | - |
Distributions from net realized gain | (.11) | (.16) | - | (3.82) | (2.90) |
Total distributions | (.12) | (.19) I | (.01) | (3.82) | (2.90) H |
Redemption fees added to paid in capital C, G | - | - | - | - | - |
Net asset value, end of period | $ 9.23 | $ 9.84 | $ 8.51 | $ 5.87 | $ 17.42 |
Total Return A, B | (5.07)% | 18.12% | 45.26% | (55.95)% | 23.85% |
Ratios to Average Net Assets D, F | | | | | |
Expenses before reductions | 2.39% | 2.20% | 2.02% | 2.16% | 2.19% |
Expenses net of fee waivers, if any | 2.20% | 2.20% | 2.02% | 2.16% | 2.19% |
Expenses net of all reductions | 2.13% | 2.02% | 1.90% | 2.00% | 2.12% |
Net investment income (loss) | (.01)% J | (.09)% | .47% | .20% | (.33)% |
Supplemental Data | | | | | |
Net assets, end of period (000 omitted) | $ 19,619 | $ 24,809 | $ 24,575 | $ 20,973 | $ 66,298 |
Portfolio turnover rate E | 254% | 490% | 414% | 394% | 146% |
A Total returns would have been lower if certain expenses had not been reduced during the applicable periods shown.
B Total returns do not include the effect of the contingent deferred sales charge.
C Calculated based on average shares outstanding during the period.
D Fees and expenses of any underlying Fidelity Central Funds are not included in the Fund's expense ratio. The Fund indirectly bears its proportionate share of the expenses of any underlying Fidelity Central Funds.
E Amount does not include the portfolio activity of any underlying Fidelity Central Funds.
F Expense ratios reflect operating expenses of the class. Expenses before reductions do not reflect amounts reimbursed by the investment adviser or reductions from brokerage service arrangements or reductions from other expense offset arrangements and do not represent the amount paid by the class during periods when reimbursements or reductions occur. Expenses net of fee waivers reflect expenses after reimbursement by the investment adviser but prior to reductions from brokerage service arrangements or other expense offset arrangements. Expenses net of all reductions represent the net expenses paid by the class.
G Amount represents less than $.01 per share.
H Total distributions of $2.90 per share is comprised of distributions from net realized gain of $2.903 per share.
I Total distributions of $.19 per share is comprised of distributions from net investment income of $.037 and distributions from net realized gain of $.155 per share.
J Investment income per share reflects a special dividend which amounted to $.03 per share. Excluding the special dividend, the ratio of net investment income (loss) to average net assets would have been (.26)%.
See accompanying notes which are an integral part of the financial statements.
Annual Report
Financial Highlights - Institutional Class
Years ended October 31, | 2011 | 2010 | 2009 | 2008 | 2007 |
Selected Per-Share Data | | | | | |
Net asset value, beginning of period | $ 11.54 | $ 9.91 | $ 6.77 | $ 19.49 | $ 18.46 |
Income from Investment Operations | | | | | |
Net investment income (loss) B | .12 I | .10 | .11 | .16 | .13 |
Net realized and unrealized gain (loss) | (.57) | 1.78 | 3.05 | (8.88) | 3.97 |
Total from investment operations | (.45) | 1.88 | 3.16 | (8.72) | 4.10 |
Distributions from net investment income | (.11) | (.09) | (.02) | (.11) | (.17) |
Distributions from net realized gain | (.12) | (.16) | - | (3.89) | (2.90) |
Total distributions | (.22) H | (.25) | (.02) | (4.00) | (3.07) G |
Redemption fees added to paid in capital B, F | - | - | - | - | - |
Net asset value, end of period | $ 10.87 | $ 11.54 | $ 9.91 | $ 6.77 | $ 19.49 |
Total Return A | (4.01)% | 19.22% | 46.85% | (55.51)% | 25.16% |
Ratios to Average Net Assets C, E | | | | | |
Expenses before reductions | 1.35% | 1.19% | 1.00% | 1.12% | 1.14% |
Expenses net of fee waivers, if any | 1.20% | 1.19% | 1.00% | 1.12% | 1.14% |
Expenses net of all reductions | 1.12% | 1.01% | .89% | .95% | 1.07% |
Net investment income (loss) | 1.00% I | .93% | 1.48% | 1.24% | .72% |
Supplemental Data | | | | | |
Net assets, end of period (000 omitted) | $ 4,335 | $ 4,345 | $ 3,292 | $ 3,620 | $ 17,463 |
Portfolio turnover rate D | 254% | 490% | 414% | 394% | 146% |
A Total returns would have been lower if certain expenses had not been reduced during the applicable periods shown.
B Calculated based on average shares outstanding during the period.
C Fees and expenses of any underlying Fidelity Central Funds are not included in the Fund's expense ratio. The Fund indirectly bears its proportionate share of the expenses of any underlying Fidelity Central Funds.
D Amount does not include the portfolio activity of any underlying Fidelity Central Funds.
E Expense ratios reflect operating expenses of the class. Expenses before reductions do not reflect amounts reimbursed by the investment adviser or reductions from brokerage service arrangements or reductions from other expense offset arrangements and do not represent the amount paid by the class during periods when reimbursements or reductions occur. Expenses net of fee waivers reflect expenses after reimbursement by the investment adviser but prior to reductions from brokerage service arrangements or other expense offset arrangements. Expenses net of all reductions represent the net expenses paid by the class.
F Amount represents less than $.01 per share.
G Total distributions of $3.07 per share is comprised of distributions from net investment income of $.166 and distributions from net realized gain of $2.903 per share.
H Total distributions of $.22 per share is comprised of distributions from net investment income of $.107 and distributions from net realized gain of $.116 per share.
I Investment income per share reflects a special dividend which amounted to $.03 per share. Excluding the special dividend, the ratio of net investment income (loss) to average net assets would have been .74%.
See accompanying notes which are an integral part of the financial statements.
Annual Report
Notes to Financial Statements
For the period ended October 31, 2011
1. Organization.
Fidelity Advisor International Capital Appreciation Fund (the Fund) is a fund of Fidelity Advisor Series VIII (the Trust) and is authorized to issue an unlimited number of shares. The Trust is registered under the Investment Company Act of 1940, as amended (the 1940 Act), as an open-end management investment company organized as a Massachusetts business trust. The Fund offers Class A, Class T, Class C and Institutional Class shares, each of which, along with Class B shares, has equal rights as to assets and voting privileges. Effective after the close of business on September 1, 2010, Class B shares were closed to new accounts and additional purchases, except for exchanges and reinvestments by existing shareholders. Each class has exclusive voting rights with respect to matters that affect that class. Class B shares will automatically convert to Class A shares after a holding period of seven years from the initial date of purchase. Investment income, realized and unrealized capital gains and losses, the common expenses of the Fund, and certain fund-level expense reductions, if any, are allocated on a pro-rata basis to each class based on the relative net assets of each class to the total net assets of the Fund. Each class differs with respect to transfer agent and distribution and service plan fees incurred. Certain expense reductions may also differ by class. The Fund's investments in emerging markets can be subject to social, economic, regulatory, and political uncertainties and can be extremely volatile.
2. Investments in Fidelity Central Funds.
The Fund invests in Fidelity Central Funds, which are open-end investment companies available only to other investment companies and accounts managed by Fidelity Management & Research Company (FMR) and its affiliates. The Fund's Schedule of Investments lists each of the Fidelity Central Funds held as of period end, if any, as an investment of the Fund, but does not include the underlying holdings of each Fidelity Central Fund. As an Investing Fund, the Fund indirectly bears its proportionate share of the expenses of the underlying Fidelity Central Funds.
The Money Market Central Funds seek preservation of capital and current income and are managed by Fidelity Investments Money Management, Inc. (FIMM), an affiliate of FMR.
A complete unaudited list of holdings for each Fidelity Central Fund is available upon request or at the Securities and Exchange Commission (the SEC) web site at www.sec.gov. In addition, the financial statements of the Fidelity Central Funds, which are not covered by the Fund's Report of Independent Registered Public Accounting Firm are available on the SEC web site or upon request.
Annual Report
Notes to Financial Statements - continued
3. Significant Accounting Policies.
The financial statements have been prepared in conformity with accounting principles generally accepted in the United States of America (GAAP), which require management to make certain estimates and assumptions at the date of the financial statements. Actual results could differ from those estimates. Subsequent events, if any, through the date that the financial statements were issued have been evaluated in the preparation of the financial statements. The following summarizes the significant accounting policies of the Fund:
Security Valuation. Investments are valued as of 4:00 p.m. Eastern time on the last calendar day of the period. The Fund uses independent pricing services approved by the Board of Trustees to value its investments. When current market prices or quotations are not readily available or reliable, valuations may be determined in good faith in accordance with procedures adopted by the Board of Trustees. Factors used in determining value may include market or security specific events. The frequency with which these procedures are used cannot be predicted and they may be utilized to a significant extent. The value used for net asset value (NAV) calculation under these procedures may differ from published prices for the same securities.
The Fund categorizes the inputs to valuation techniques used to value its investments into a disclosure hierarchy consisting of three levels as shown below:
Level 1 - quoted prices in active markets for identical investments
Level 2 - other significant observable inputs (including quoted prices for similar investments, interest rates, prepayment speeds, etc.)
Level 3 - unobservable inputs (including the Fund's own assumptions based on the best information available)
Changes in valuation techniques may result in transfers in or out of an assigned level within the disclosure hierarchy. The aggregate value of investments by input level, as of October 31, 2011, is included at the end of the Fund's Schedule of Investments. Valuation techniques used to value the Fund's investments by major category are as follows:
Equity securities, including restricted securities, for which market quotations are readily available, are valued at the last reported sale price or official closing price as reported by an independent pricing service on the primary market or exchange on which they are traded and are categorized as Level 1 in the hierarchy. In the event there were no sales during the day or closing prices are not available, securities are valued at the last quoted bid price or may be valued using the last available price and are generally categorized as Level 2 in the hierarchy. For foreign equity securities, when significant market or security specific events arise, comparisons to the valuation of American Depositary Receipts
Annual Report
3. Significant Accounting Policies - continued
Security Valuation - continued
(ADRs), futures contracts, Exchange-traded funds (ETFs) and certain indexes as well as quoted prices for similar securities are used and are categorized as Level 2 in the hierarchy in these circumstances. Utilizing these techniques may result in transfers between Level 1 and Level 2. For restricted equity securities and private placements where observable inputs are limited, assumptions about market activity and risk are used and are categorized as Level 3 in the hierarchy.
Investments in open-end mutual funds, including the Fidelity Central Funds, are valued at their closing net asset value each business day and are categorized as Level 1 in the hierarchy.
Foreign Currency. The Fund may use foreign currency contracts to facilitate transactions in foreign-denominated securities. Gains and losses from these transactions may arise from changes in the value of the foreign currency or if the counterparties do not perform under the contracts' terms.
Foreign-denominated assets, including investment securities, and liabilities are translated into U.S. dollars at the exchange rate at period end. Purchases and sales of investment securities, income and dividends received and expenses denominated in foreign currencies are translated into U.S. dollars at the exchange rate in effect on the transaction date.
The effects of exchange rate fluctuations on investments are included with the net realized and unrealized gain (loss) on investment securities. Other foreign currency transactions resulting in realized and unrealized gain (loss) are disclosed separately.
Investment Transactions and Income. For financial reporting purposes, the Fund's investment holdings and NAV include trades executed through the end of the last business day of the period. The NAV per share for processing shareholder transactions is calculated as of the close of business of the New York Stock Exchange (NYSE), normally 4:00 p.m. Eastern time and includes trades executed through the end of the prior business day. Gains and losses on securities sold are determined on the basis of identified cost and may include proceeds received from litigation. Dividend income is recorded on the ex-dividend date, except for certain dividends from foreign securities where the ex-dividend date may have passed, which are recorded as soon as the Fund is informed of the ex-dividend date. Non-cash dividends included in dividend income, if any, are recorded at the fair market value of the securities received. Distributions received on securities that represent a return of capital or capital gain are recorded as a reduction of cost of investments and/or as a realized gain. The Fund estimates the components of distributions received that may be considered return of capital distributions or capital
Annual Report
Notes to Financial Statements - continued
3. Significant Accounting Policies - continued
Investment Transactions and Income - continued
gain distributions. Large, non-recurring dividends recognized by the Fund are presented separately on the Statement of Operations as "Special Dividends" and the impact of these dividends is presented in the Financial Highlights. Interest income and distributions from the Fidelity Central Funds are accrued as earned. Interest income includes coupon interest and amortization of premium and accretion of discount on debt securities. Investment income is recorded net of foreign taxes withheld where recovery of such taxes is uncertain.
Expenses. Expenses directly attributable to a fund are charged to that fund. Expenses attributable to more than one fund are allocated among the respective funds on the basis of relative net assets or other appropriate methods. Expense estimates are accrued in the period to which they relate and adjustments are made when actual amounts are known.
Income Tax Information and Distributions to Shareholders. Each year, the Fund intends to qualify as a regulated investment company, including distributing substantially all of its taxable income and realized gains under Subchapter M of the Internal Revenue Code and filing its U.S. federal tax return. As a result, no provision for income taxes is required. As of October 31, 2011, the Fund did not have any unrecognized tax benefits in the financial statements. A fund's federal tax return is subject to examination by the Internal Revenue Service (IRS) for a period of three years. Foreign taxes are provided for based on the Fund's understanding of the tax rules and rates that exist in the foreign markets in which it invests. The Fund is subject to a tax imposed on realized short term capital gains on securities of certain issuers domiciled in India. An estimated deferred tax liability for net unrealized gains on these securities is included in Other payables and accrued expenses on the Statement of Assets & Liabilities.
Distributions are declared and recorded on the ex-dividend date. Income dividends and capital gain distributions are declared separately for each class. Income and capital gain distributions are determined in accordance with income tax regulations, which may differ from GAAP.
Capital accounts within the financial statements are adjusted for permanent book-tax differences. These adjustments have no impact on net assets or the results of operations. Temporary book-tax differences will reverse in a subsequent period.
Book-tax differences are primarily due to foreign currency transactions, certain foreign taxes, passive foreign investment companies (PFIC), equity debt classifications, capital loss carryforwards and losses deferred due to wash sales.
Annual Report
3. Significant Accounting Policies - continued
Income Tax Information and Distributions to Shareholders - continued
The federal tax cost of investment securities and unrealized appreciation (depreciation) as of period end were as follows:
Gross unrealized appreciation | $ 10,875,295 |
Gross unrealized depreciation | (8,278,250) |
Net unrealized appreciation (depreciation) on securities and other investments | $ 2,597,045 |
| |
Tax Cost | $ 126,784,786 |
The tax-based components of distributable earnings as of period end were as follows:
Undistributed ordinary income | $ 759,509 |
Capital loss carryforward | $ (106,313,982) |
Net unrealized appreciation (depreciation) | $ 2,539,767 |
Under the recently enacted Regulated Investment Company Modernization Act of 2010 (the Act), the Fund will be permitted to carry forward capital losses incurred in taxable years beginning after December 22, 2010 for an unlimited period. However, any losses incurred during those future taxable years will be required to be utilized prior to any losses incurred in pre-enactment taxable years, which generally expire after eight years from when they are incurred. Additionally, post-enactment capital losses that are carried forward will retain their character as either short-term or long-term capital losses rather than being considered all short-term as under previous law. The Fund's first fiscal year end subject to the Act will be October 31, 2012.
The tax character of distributions paid was as follows:
| October 31, 2011 | October 31, 2010 |
Ordinary Income | $ 2,481,752 | $ 3,667,484 |
Short-Term Trading (Redemption) Fees. Shares held by investors in the Fund less than 30 days are subject to a redemption fee equal to 1.00% of the net asset value of shares redeemed. All redemption fees, which reduce the proceeds of the shareholder redemption, are retained by the Fund and accounted for as an addition to paid in capital.
New Accounting Pronouncement. In May 2011, the Financial Accounting Standards Board issued Accounting Standard Update No. 2011-04, Fair Value Measurement (Topic 820) - Amendments to Achieve Common Fair Value Measurement and Disclosure Requirements in U.S. GAAP and IFRSs. The update changes the wording used to describe the requirements in GAAP for measuring fair value and for disclosing information about
Annual Report
Notes to Financial Statements - continued
3. Significant Accounting Policies - continued
New Accounting Pronouncement - continued
fair value measurements. The update is effective during interim and annual periods beginning after December 15, 2011. Management is currently evaluating the impact of the update's adoption on the Fund's financial statement disclosures.
4. Purchases and Sales of Investments.
Purchases and sales of securities, other than short-term securities, aggregated $376,777,146 and $404,931,434, respectively.
5. Fees and Other Transactions with Affiliates.
Management Fee. FMR and its affiliates provide the Fund with investment management related services for which the Fund pays a monthly management fee. The management fee is the sum of an individual fund fee rate that is based on an annual rate of .45% of the Fund's average net assets and a group fee rate that averaged .26% during the period. The group fee rate is based upon the average net assets of all the mutual funds advised by FMR. The group fee rate decreases as assets under management increase and increases as assets under management decrease. In addition, the management fee is subject to a performance adjustment (up to a maximum of ± .20% of the Fund's average net assets over a 36 month performance period). The upward or downward adjustment to the management fee is based on the relative investment performance of the Institutional Class of the Fund as compared to an appropriate benchmark index. For the period, the total annual management fee rate, including the performance adjustment, was .82% of the Fund's average net assets.
Distribution and Service Plan Fees. In accordance with Rule 12b-1 of the 1940 Act, the Fund has adopted separate Distribution and Service Plans for each class of shares. Certain classes pay Fidelity Distributors Corporation (FDC), an affiliate of FMR, separate Distribution and Service Fees, each of which is based on an annual percentage of each class' average net assets. In addition, FDC may pay financial intermediaries for selling shares of the Fund and providing shareholder support services. For the period, the Distribution and Service Fee rates, total fees and amounts retained by FDC were as follows:
| Distribution
Fee | Service
Fee | Total Fees | Retained
by FDC |
Class A | -% | .25% | $ 117,260 | $ 2,502 |
Class T | .25% | .25% | 341,924 | 1,369 |
Class B | .75% | .25% | 63,609 | 47,871 |
Class C | .75% | .25% | 232,203 | 11,399 |
| | | $ 754,996 | $ 63,141 |
Annual Report
5. Fees and Other Transactions with Affiliates - continued
Sales Load. FDC may receive a front-end sales charge of up to 5.75% for selling Class A shares, and 3.50% for selling Class T shares, some of which is paid to financial intermediaries for selling shares of the Fund. Depending on the holding period, FDC may receive contingent deferred sales charges levied on Class A, Class T, Class B, and Class C redemptions. The deferred sales charges range from 5% to 1% for Class B, 1% for Class C, 1.00% for certain purchases of Class A shares and .25% for certain purchases of Class T shares.
For the period, sales charge amounts retained by FDC were as follows:
| Retained
by FDC |
Class A | $ 8,284 |
Class T | 4,163 |
Class B* | 6,523 |
Class C* | 784 |
| $ 19,754 |
* When Class B and Class C shares are initially sold, FDC pays commissions from its own resources to financial intermediaries through which the sales are made.
Transfer Agent Fees. Fidelity Investments Institutional Operations Company, Inc. (FIIOC), an affiliate of FMR, is the transfer, dividend disbursing and shareholder servicing agent for each class of the Fund. FIIOC receives account fees and asset-based fees that vary according to the account size and type of account of the shareholders of the respective classes of the Fund. FIIOC pays for typesetting, printing and mailing of shareholder reports, except proxy statements. For the period, transfer agent fees for each class were as follows:
| Amount | % of
Average
Net Assets |
Class A | $ 141,944 | .30 |
Class T | 201,380 | .29 |
Class B | 19,272 | .30 |
Class C | 70,409 | .30 |
Institutional Class | 12,248 | .26 |
| $ 445,253 | |
Accounting and Security Lending Fees. Fidelity Service Company, Inc. (FSC), an affiliate of FMR, maintains the Fund's accounting records. The accounting fee is based on the level of average net assets for the month. Under a separate contract, FSC administers the security lending program. The security lending fee is based on the number and duration of lending transactions.
Annual Report
Notes to Financial Statements - continued
5. Fees and Other Transactions with Affiliates - continued
Brokerage Commissions. The Fund placed a portion of its portfolio transactions with brokerage firms which are affiliates of the investment adviser. The commissions paid to these affiliated firms were $4,076 for the period.
6. Committed Line of Credit.
The Fund participates with other funds managed by FMR or an affiliate in a $4.0 billion credit facility (the "line of credit") to be utilized for temporary or emergency purposes to fund shareholder redemptions or for other short-term liquidity purposes. The Fund has agreed to pay commitment fees on its pro-rata portion of the line of credit, which amounted to $471 and is reflected in Miscellaneous expenses on the Statement of Operations. During the period, there were no borrowings on this line of credit.
7. Security Lending.
The Fund lends portfolio securities through a lending agent from time to time in order to earn additional income. For equity securities, a lending agent is used and may loan securities to certain qualified borrowers, including Fidelity Capital Markets (FCM), a broker-dealer affiliated with the Fund. On the settlement date of the loan, the Fund receives collateral (in the form of U.S. Treasury obligations, letters of credit and/or cash) against the loaned securities and maintains collateral in an amount not less than 100% of the market value of the loaned securities during the period of the loan. The market value of the loaned securities is determined at the close of business of the Fund and any additional required collateral is delivered to the Fund on the next business day. If the borrower defaults on its obligation to return the securities loaned because of insolvency or other reasons, a fund could experience delays and costs in recovering the securities loaned or in gaining access to the collateral. Any cash collateral received is invested in the Fidelity Securities Lending Cash Central Fund. The value of loaned securities and cash collateral at period end are disclosed on the Fund's Statement of Assets and Liabilities. Security lending income represents the income earned on investing cash collateral, less rebates paid to borrowers and any lending agent fees associated with the loan, plus any premium payments received for lending certain types of securities. Security lending income is presented in the Statement of Operations as a component of income from Fidelity Central Funds. Total security lending income during the period amounted to $56,613. During the period, there were no securities loaned to FCM.
8. Expense Reductions.
FMR voluntarily agreed to reimburse each class to the extent annual operating expenses exceeded certain levels of average net assets as noted in the table below. Some expenses,
Annual Report
8. Expense Reductions - continued
for example interest expense, including commitment fees, are excluded from this reimbursement.
The following classes were in reimbursement during the period:
| Expense
Limitations | Reimbursement
from adviser |
| | |
Class A | 1.45% | $ 86,969 |
Class T | 1.70% | 121,478 |
Class B | 2.20% | 11,948 |
Class C | 2.20% | 43,249 |
Institutional Class | 1.20% | 6,886 |
| | $ 270,530 |
In addition, FMR voluntarily agreed to reimburse a portion of its management fee. For the period, the amount of this reimbursement was $6,986. Many of the brokers with whom FMR places trades on behalf of the Fund provided services to the Fund in addition to trade execution. These services included payments of certain expenses on behalf of the Fund totaling $106,787 for the period.
9. Distributions to Shareholders.
Distributions to shareholders of each class were as follows:
Years ended October 31, | 2011 | 2010 |
From net investment income | | |
Class A | $ 351,944 | $ 383,536 |
Class T | 323,075 | 471,584 |
Class B | 9,663 | 36,781 |
Class C | 29,995 | 106,805 |
Institutional Class | 46,033 | 29,272 |
Total | $ 760,710 | $ 1,027,978 |
From net realized gain | | |
Class A | $ 529,480 | $ 733,929 |
Class T | 797,756 | 1,218,258 |
Class B | 70,707 | 190,036 |
Class C | 273,307 | 447,425 |
Institutional Class | 49,792 | 49,858 |
Total | $ 1,721,042 | $ 2,639,506 |
Annual Report
Notes to Financial Statements - continued
10. Share Transactions.
Transactions for each class of shares were as follows:
| Shares | Dollars |
Years ended October 31, | 2011 | 2010 | 2011 | 2010 |
Class A | | | | |
Shares sold | 721,944 | 1,168,786 | $ 7,956,982 | $ 11,452,442 |
Reinvestment of distributions | 72,790 | 106,693 | 801,552 | 1,040,260 |
Shares redeemed | (1,361,813) | (1,397,227) | (14,987,238) | (13,480,819) |
Net increase (decrease) | (567,079) | (121,748) | $ (6,228,704) | $ (988,117) |
Class T | | | | |
Shares sold | 879,812 | 1,177,459 | $ 9,150,890 | $ 11,400,103 |
Reinvestment of distributions | 101,007 | 172,890 | 1,092,104 | 1,656,289 |
Shares redeemed | (1,955,605) | (2,898,040) | (20,943,089) | (27,789,326) |
Net increase (decrease) | (974,786) | (1,547,691) | $ (10,700,095) | $ (14,732,934) |
Class B | | | | |
Shares sold | 9,370 | 77,104 | $ 93,679 | $ 688,128 |
Reinvestment of distributions | 7,318 | 23,836 | 73,635 | 212,377 |
Shares redeemed | (446,550) | (465,893) | (4,499,761) | (4,121,865) |
Net increase (decrease) | (429,862) | (364,953) | $ (4,332,447) | $ (3,221,360) |
Class C | | | | |
Shares sold | 194,812 | 282,999 | $ 1,945,397 | $ 2,536,029 |
Reinvestment of distributions | 27,032 | 55,698 | 271,185 | 495,715 |
Shares redeemed | (619,329) | (703,110) | (6,101,194) | (6,197,225) |
Net increase (decrease) | (397,485) | (364,413) | $ (3,884,612) | $ (3,165,481) |
Institutional Class | | | | |
Shares sold | 167,207 | 151,567 | $ 1,942,483 | $ 1,532,760 |
Reinvestment of distributions | 6,560 | 5,962 | 76,766 | 61,704 |
Shares redeemed | (151,382) | (113,282) | (1,773,974) | (1,140,202) |
Net increase (decrease) | 22,385 | 44,247 | $ 245,275 | $ 454,262 |
11. Other.
The Fund's organizational documents provide former and current trustees and officers with a limited indemnification against liabilities arising in connection with the performance of their duties to the Fund. In the normal course of business, the Fund may also enter into contracts that provide general indemnifications. The Fund's maximum exposure under these arrangements is unknown as this would be dependent on future claims that may be made against the Fund. The risk of material loss from such claims is considered remote.
Annual Report
To the Trustees of Fidelity Advisor Series VIII and Shareholders of Fidelity Advisor International Capital Appreciation Fund:
We have audited the accompanying statement of assets and liabilities of Fidelity Advisor International Capital Appreciation Fund (the Fund), a fund of Fidelity Advisor Series VIII, including the schedule of investments, as of October 31, 2011, and the related statement of operations for the year then ended, the statement of changes in net assets for each of the two years in the period then ended, and the financial highlights for each of the five years in the period then ended. These financial statements and financial highlights are the responsibility of the Fund's management. Our responsibility is to express an opinion on these financial statements and financial highlights based on our audits.
We conducted our audits in accordance with the standards of the Public Company Accounting Oversight Board (United States). Those standards require that we plan and perform the audit to obtain reasonable assurance about whether the financial statements and financial highlights are free of material misstatement. The Fund is not required to have, nor were we engaged to perform, an audit of its internal control over financial reporting. Our audits included consideration of internal control over financial reporting as a basis for designing audit procedures that are appropriate in the circumstances, but not for the purpose of expressing an opinion on the effectiveness of the Fund's internal control over financial reporting. Accordingly, we express no such opinion. An audit also includes examining, on a test basis, evidence supporting the amounts and disclosures in the financial statements, assessing the accounting principles used and significant estimates made by management, as well as evaluating the overall financial statement presentation. Our procedures included confirmation of securities owned as of October 31, 2011, by correspondence with the custodians and brokers; where replies were not received from brokers, we performed other auditing procedures. We believe that our audits provide a reasonable basis for our opinion.
In our opinion, the financial statements and financial highlights referred to above present fairly, in all material respects, the financial position of Fidelity Advisor International Capital Appreciation Fund as of October 31, 2011, the results of its operations for the year then ended, the changes in its net assets for each of the two years in the period then ended, and its financial highlights for each of the five years in the period then ended, in conformity with accounting principles generally accepted in the United States of America.
/s/ Deloitte & Touche LLP
DELOITTE & TOUCHE LLP
Boston, Massachusetts
December 15, 2011
Annual Report
The Trustees, Members of the Advisory Board, and executive officers of the trust and fund, as applicable, are listed below. The Board of Trustees governs the fund and is responsible for protecting the interests of shareholders. The Trustees are experienced executives who meet periodically throughout the year to oversee the fund's activities, review contractual arrangements with companies that provide services to the fund, oversee management of the risks associated with such activities and contractual arrangements, and review the fund's performance. Except for James C. Curvey, each of the Trustees oversees 226 funds advised by FMR or an affiliate. Mr. Curvey oversees 429 funds advised by FMR or an affiliate.
The Trustees hold office without limit in time except that (a) any Trustee may resign; (b) any Trustee may be removed by written instrument, signed by at least two-thirds of the number of Trustees prior to such removal; (c) any Trustee who requests to be retired or who has become incapacitated by illness or injury may be retired by written instrument signed by a majority of the other Trustees; and (d) any Trustee may be removed at any special meeting of shareholders by a two-thirds vote of the outstanding voting securities of the trust. Each Trustee who is not an interested person (as defined in the 1940 Act) (Independent Trustee), shall retire not later than the last day of the calendar year in which his or her 75th birthday occurs. The Independent Trustees may waive this mandatory retirement age policy with respect to individual Trustees. The executive officers and Advisory Board Members hold office without limit in time, except that any officer and Advisory Board Member may resign or may be removed by a vote of a majority of the Trustees at any regular meeting or any special meeting of the Trustees. Except as indicated, each individual has held the office shown or other offices in the same company for the past five years.
Experience, Skills, Attributes, and Qualifications of the Fund's Trustees. The Governance and Nominating Committee has adopted a statement of policy that describes the experience, qualifications, attributes, and skills that are necessary and desirable for potential Independent Trustee candidates (Statement of Policy). The Board believes that each Trustee satisfied at the time he or she was initially elected or appointed a Trustee, and continues to satisfy, the standards contemplated by the Statement of Policy. The Governance and Nominating Committee also engages professional search firms to help identify potential Independent Trustee candidates who have the experience, qualifications, attributes, and skills consistent with the Statement of Policy. From time to time, additional criteria based on the composition and skills of the current Independent Trustees, as well as experience or skills that may be appropriate in light of future changes to board composition, business conditions, and regulatory or other developments, have also been considered by the professional search firms and the Governance and Nominating Committee. In addition, the Board takes into account the Trustees' commitment and participation in Board and committee meetings, as well as their leadership of standing and ad hoc committees throughout their tenure.
In determining that a particular Trustee was and continues to be qualified to serve as a Trustee, the Board has considered a variety of criteria, none of which, in isolation, was controlling. The Board believes that, collectively, the Trustees have balanced and diverse experience, qualifications, attributes, and skills, which allow the Board to operate effectively in governing the fund and protecting the interests of shareholders. Information about the specific experience, skills, attributes, and qualifications of each Trustee, which in each case led to the Board's conclusion that the Trustee should serve (or continue to serve) as a trustee of the fund, is provided below.
Annual Report
Board Structure and Oversight Function. James C. Curvey is an interested person (as defined in the 1940 Act) and currently serves as Acting Chairman. The Trustees have determined that an interested Chairman is appropriate and benefits shareholders because an interested Chairman has a personal and professional stake in the quality and continuity of services provided to the fund. Independent Trustees exercise their informed business judgment to appoint an individual of their choosing to serve as Chairman, regardless of whether the Trustee happens to be independent or a member of management. The Independent Trustees have determined that they can act independently and effectively without having an Independent Trustee serve as Chairman and that a key structural component for assuring that they are in a position to do so is for the Independent Trustees to constitute a substantial majority for the Board. The Independent Trustees also regularly meet in executive session. Ned C. Lautenbach serves as Chairman of the Independent Trustees and as such (i) acts as a liaison between the Independent Trustees and management with respect to matters important to the Independent Trustees and (ii) with management prepares agendas for Board meetings.
Fidelity funds are overseen by different Boards of Trustees. The fund's Board oversees Fidelity's equity and high income funds and another Board oversees Fidelity's investment-grade bond, money market, and asset allocation funds. The asset allocation funds may invest in Fidelity funds overseen by the fund's Board. The use of separate Boards, each with its own committee structure, allows the Trustees of each group of Fidelity funds to focus on the unique issues of the funds they oversee, including common research, investment, and operational issues. On occasion, the separate Boards establish joint committees to address issues of overlapping consequences for the Fidelity funds overseen by each Board.
The Trustees operate using a system of committees to facilitate the timely and efficient consideration of all matters of importance to the Trustees, the fund, and fund shareholders and to facilitate compliance with legal and regulatory requirements and oversight of the fund's activities and associated risks. The Board, acting through its committees, has charged FMR and its affiliates with (i) identifying events or circumstances the occurrence of which could have demonstrably adverse effects on the fund's business and/or reputation; (ii) implementing processes and controls to lessen the possibility that such events or circumstances occur or to mitigate the effects of such events or circumstances if they do occur; and (iii) creating and maintaining a system designed to evaluate continuously business and market conditions in order to facilitate the identification and implementation processes described in (i) and (ii) above. Because the day-to-day operations and activities of the fund are carried out by or through FMR, its affiliates and other service providers, the fund's exposure to risks is mitigated but not eliminated by the processes overseen by the Trustees. While each of the Board's committees has responsibility for overseeing different aspects of the fund's activities, oversight is exercised primarily through the Operations, Audit, and Compliance Committees. In addition, the Independent Trustees have worked with FMR to enhance the Board's oversight of investment and financial risks, legal and regulatory risks, technology risks, and operational risks, including the development of additional risk reporting to the Board. For example, a working group comprised of Independent Trustees and FMR has worked and continues to work to review the Fidelity funds' valuation-related activities, reporting and risk management. Appropriate personnel, including but not limited to the fund's Chief Compliance Officer (CCO), FMR's internal auditor, the independent accountants, the fund's Treasurer and portfolio management personnel, make periodic reports to the Board's committees, as appropriate, including an annual review of FMR's risk management program for the Fidelity funds. The responsibilities of each standing committee, including their oversight responsibilities, are described further under "Standing Committees of the Fund's Trustees."
Annual Report
Trustees and Officers - continued
The fund's Statement of Additional Information (SAI) includes more information about the Trustees. To request a free copy, call Fidelity at 1-877-208-0098.
Interested Trustees*:
Correspondence intended for each Trustee who is an interested person may be sent to Fidelity Investments, 82 Devonshire Street, Boston, Massachusetts 02109.
Name, Age; Principal Occupations and Other Relevant Experience+ |
James C. Curvey (76) |
| Year of Election or Appointment: 2007 Mr. Curvey is Trustee and Acting Chairman of the Board of Trustees of certain Trusts. Mr. Curvey also serves as Trustee (2007-present) of other investment companies advised by FMR. Mr. Curvey is a Director of Fidelity Investments Money Management, Inc. (2009-present), Director of Fidelity Research & Analysis Co. (2009-present) and Director of FMR and FMR Co., Inc. (2007-present). Mr. Curvey is also Vice Chairman (2007-present) and Director of FMR LLC. In addition, Mr. Curvey serves as an Overseer for the Boston Symphony Orchestra and a member of the Trustees of Villanova University. Previously, Mr. Curvey was the Vice Chairman (2006-2007) and Director (2000-2007) of FMR Corp. |
Ronald P. O'Hanley (54) |
| Year of Election or Appointment: 2011 Mr. O'Hanley is Director of FMR Co., Inc. (2010-present), Director of Fidelity Investments Money Management, Inc. (2010-present), Director of Fidelity Research & Analysis Company (2010-present), President of Fidelity Asset Management and Corporate Services and a member of Fidelity's Executive Committee (2010-present). Previously, Mr. O'Hanley served as President and Chief Executive Officer of BNY Mellon Asset Management (2007-2010). Mr. O'Hanley also served as Vice Chairman of Bank New York Mellon Corp. and a member of that firm's Executive Committee. Prior to the 2007 merger of The Bank of New York and Mellon Financial Corporation, he was Vice Chairman of Mellon Financial Corporation and President and Chief Executive Officer of Mellon Asset Management. He joined Mellon in February 1997. Mr. O'Hanley currently serves as Chairman of the Boston Public Library Foundation Board of Directors and sits on the Board of Directors of Beth Israel Deaconess Medical Center, the Board of Trustees of the Marine Biological Laboratory and the Advisory Board of the Maxwell School of Citizenship and Public Administration at Syracuse University. Mr. O'Hanley also chairs the Council on Asset Management for the Financial Services Roundtable and is a member of the Board of Directors of Institutional Investor's U.S. Institute. |
* Trustees have been determined to be "Interested Trustees" by virtue of, among other things, their affiliation with the trust or various entities under common control with FMR.
+ The information above includes each Trustee's principal occupation during the last five years and other information relating to the experience, attributes, and skills relevant to each Trustee's qualifications to serve as a Trustee, which led to the conclusion that each Trustee should serve as a Trustee for the fund.
Annual Report
Trustees and Officers - continued
Independent Trustees:
Correspondence intended for each Independent Trustee (that is, the Trustees other than the Interested Trustees) may be sent to Fidelity Investments, P.O. Box 55235, Boston, Massachusetts 02205-5235.
Name, Age; Principal Occupations and Other Relevant Experience+ |
Dennis J. Dirks (63) |
| Year of Election or Appointment: 2005 Prior to his retirement in May 2003, Mr. Dirks was Chief Operating Officer and a member of the Board of The Depository Trust & Clearing Corporation (DTCC). He also served as President, Chief Operating Officer, and Board member of The Depository Trust Company (DTC) and President and Board member of the National Securities Clearing Corporation (NSCC). In addition, Mr. Dirks served as Chief Executive Officer and Board member of the Government Securities Clearing Corporation, Chief Executive Officer and Board member of the Mortgage-Backed Securities Clearing Corporation, as a Trustee and a member of the Finance Committee of Manhattan College (2005-2008), and as a Trustee and a member of the Finance Committee of AHRC of Nassau County (2006-2008). Mr. Dirks is a member of the Independent Directors Council (IDC) Governing Council (2010-Present) and Board of Directors for The Brookville Center for Children's Services, Inc. (2009-present). |
Alan J. Lacy (58) |
| Year of Election or Appointment: 2008 Mr. Lacy serves as Senior Adviser (2007-present) of Oak Hill Capital Partners, L.P. (private equity). Mr. Lacy also served as Chief Executive Officer (2000-2005) and Vice Chairman (2005-2006) of Sears Holdings Corporation and Sears, Roebuck and Co. (retail). In addition, Mr. Lacy serves as a member of the Board of Directors of Dave & Buster's, Inc. (restaurant and entertainment complexes, 2010-present), The Hillman Companies, Inc. (hardware wholesalers, 2010-present), and Bristol-Myers Squibb Company (global pharmaceuticals, 2007-present). Mr. Lacy is a member of the Board of Trustees of The National Parks Conservation Association (2006-Present). Previously, Mr. Lacy served as Chairman of the Board of Trustees of the National Parks Conservation Association (2008-2011) and as a member of the Board of Directors for the Western Union Company (global money transfer, 2006-2011). |
Ned C. Lautenbach (67) |
| Year of Election or Appointment: 2000 Mr. Lautenbach is Chairman of the Independent Trustees of the Equity and High Income Funds (2006-present). Mr. Lautenbach currently serves as the Lead Director of the Eaton Corporation Board of Directors (diversified industrial, 1997-present). Mr. Lautenbach is also a member of the Board of Directors of the Philharmonic Center for the Arts in Naples, Florida (1999-present); a member of the Board of Trustees of Fairfield University (2005-present); and a member of the Council on Foreign Relations (1994-present). Previously, Mr. Lautenbach was a Partner/Advisory Partner at Clayton, Dubilier & Rice, LLC (private equity investment, 1998-2010), as well as a Director of Sony Corporation (2006-2007). |
Joseph Mauriello (67) |
| Year of Election or Appointment: 2008 Prior to his retirement in January 2006, Mr. Mauriello served in numerous senior management positions including Deputy Chairman and Chief Operating Officer (2004-2005), and Vice Chairman of Financial Services (2002-2004) of KPMG LLP US (professional services, 1965-2005). Mr. Mauriello currently serves as a member of the Board of Directors of XL Group plc. (global insurance and re-insurance, 2006-present) and of Arcadia Resources Inc. (health care services and products, 2007-present). Previously, Mr. Mauriello served as a Director of the Hamilton Funds of the Bank of New York (2006-2007). |
Robert W. Selander (61) |
| Year of Election or Appointment: 2011 Previously, Mr. Selander served as a Member of the Advisory Board of Fidelity's Equity and High Income Funds (2011), Executive Vice Chairman (2010), Chief Executive Officer (2009-2010), and President and Chief Executive Officer (1997-2009) of Mastercard, Inc. |
Cornelia M. Small (67) |
| Year of Election or Appointment: 2005 Ms. Small is a member of the Board of Directors of the Teagle Foundation (2009-present). Ms. Small is also a member of the Investment Committee, and Chair (2008-present) and a member of the Board of Trustees of Smith College. In addition, Ms. Small serves on the Investment Committee of the Berkshire Taconic Community Foundation (2008-present). Previously, Ms. Small served as Chairperson of the Investment Committee (2002-2008) of Smith College. In addition, Ms. Small served as Chief Investment Officer, Director of Global Equity Investments, and a member of the Board of Directors of Scudder, Stevens & Clark and Scudder Kemper Investments. |
William S. Stavropoulos (72) |
| Year of Election or Appointment: 2001 Mr. Stavropoulos is Vice Chairman of the Independent Trustees of the Equity and High Income Funds (2006-present). Mr. Stavropoulos serves as President and Founder of the Michigan Baseball Foundation, the Great Lakes Loons (2007-present). Mr. Stavropoulos is Chairman Emeritus of the Board of Directors of The Dow Chemical Company, where he previously served in numerous senior management positions, including President, CEO (1995-2000; 2002-2004), Chairman of the Executive Committee (2000-2006), and as a member of the Board of Directors (1990-2006). Currently, Mr. Stavropoulos is Chairman of Univar (global distributor of commodity and specialty chemicals, 2010-present), a Director of Teradata Corporation (data warehousing and technology solutions, 2008-present), Chemical Financial Corporation, Maersk Inc. (industrial conglomerate), Tyco International, Inc. (multinational manufacturing and services, 2007-present), and a member of the Advisory Board for Metalmark Capital (private equity investment, 2005-present). Mr. Stavropoulos is a special advisor to Clayton, Dubilier & Rice, LLC (private equity investment). In addition, Mr. Stavropoulos is a member of the University of Notre Dame Advisory Council for the College of Science. |
David M. Thomas (62) |
| Year of Election or Appointment: 2008 Previously, Mr. Thomas served as Executive Chairman (2005-2006) and Chairman and Chief Executive Officer (2000-2005) of IMS Health, Inc. (pharmaceutical and healthcare information solutions). In addition, Mr. Thomas serves as a member of the Board of Directors of Fortune Brands, Inc. (consumer products), and Interpublic Group of Companies, Inc. (marketing communication, 2004-present). |
Michael E. Wiley (61) |
| Year of Election or Appointment: 2008 Mr. Wiley also serves as a Director of Asia Pacific Exploration Consolidated (international oil and gas exploration and production, 2008-present). Mr. Wiley serves as a Director of Tesoro Corporation (independent oil refiner and marketer, 2005-present), and a Director of Bill Barrett Corporation (exploration and production, 2005-present). In addition, Mr. Wiley also serves as a Director of Post Oak Bank (privately-held bank, 2004-present). Previously, Mr. Wiley served as a member of the Board of Trustees of the University of Tulsa (2000-2006; 2007-2010), as a Senior Energy Advisor of Katzenbach Partners, LLC (consulting, 2006-2007), as an Advisory Director of Riverstone Holdings (private investment), Chairman, President, and CEO of Baker Hughes, Inc. (oilfield services, 2000-2004), and as Director of Spinnaker Exploration Company (exploration and production, 2001-2005). |
Annual Report
+ The information above includes each Trustee's principal occupation during the last five years and other information relating to the experience, attributes, and skills relevant to each Trustee's qualifications to serve as a Trustee, which led to the conclusion that each Trustee should serve as a Trustee for the fund.
Advisory Board Members and Executive Officers:
Correspondence intended for each executive officer, Edward C. Johnson 3d, and Peter S. Lynch may be sent to Fidelity Investments, 82 Devonshire Street, Boston, Massachusetts 02109.
Name, Age; Principal Occupation |
Edward C. Johnson 3d (81) |
| Year of Election or Appointment: 2011 Member of the Advisory Board of Fidelity's Equity and High Income Funds. Mr. Johnson serves as Chief Executive Officer, Chairman, and a Director of FMR LLC, and also serves as Chairman and Director of FIL Limited. Previously, Mr. Johnson served as a Trustee and Chairman of the Board of certain Fidelity Trusts, Chairman and a Director of FMR, Chairman and a Director of FMR Co., Inc., and President of FMR LLC (2006-2007). |
Peter S. Lynch (67) |
| Year of Election or Appointment: 2003 Member of the Advisory Board of Fidelity's Equity and High Income Funds. Mr. Lynch is Vice Chairman and a Director of FMR and FMR Co., Inc. In addition, Mr. Lynch serves as a Trustee of Boston College and as the Chairman of the Inner-City Scholarship Fund. Previously, Mr. Lynch served on the Special Olympics International Board of Directors (1997-2006). |
Kenneth B. Robins (42) |
| Year of Election or Appointment: 2008 President and Treasurer of Fidelity's Equity and High Income Funds. Mr. Robins also serves as President and Treasurer (2010-present) and Assistant Treasurer (2009-present) of other Fidelity funds and is an employee of Fidelity Investments (2004-present). Previously, Mr. Robins served as Deputy Treasurer of the Fidelity funds (2005-2008) and Treasurer and Chief Financial Officer of The North Carolina Capital Management Trust: Cash and Term Portfolios (2006-2008). |
Bruce T. Herring (46) |
| Year of Election or Appointment: 2006 Vice President of certain Equity Funds. Mr. Herring also serves as Chief Investment Officer and Director of Fidelity Management & Research (U.K.) Inc. (2010-present) and Group Chief Investments Officer of FMR. Previously, Mr. Herring served as Vice President (2005-2006) and Senior Vice President (2006-2007) of Fidelity Management & Research Company, Vice President of FMR Co., Inc. (2001-2007) and as a portfolio manager for Fidelity U.S. Equity Funds. |
Brian B. Hogan (47) |
| Year of Election or Appointment: 2009 Vice President of Equity and High Income Funds. Mr. Hogan also serves as President of FMR's Equity Division (2009-present). Previously, Mr. Hogan served as Senior Vice President, Equity Research of FMR (2006-2009) and as a portfolio manager. |
Scott C. Goebel (43) |
| Year of Election or Appointment: 2008 Secretary and Chief Legal Officer (CLO) of the Fidelity funds. Mr. Goebel also serves as Secretary of Fidelity Investments Money Management, Inc. (FIMM) (2010-present) and Fidelity Research and Analysis Company (FRAC) (2010-present); Secretary and CLO of The North Carolina Capital Management Trust: Cash and Term Portfolios (2008-present); General Counsel, Secretary, and Senior Vice President of FMR (2008-present) and FMR Co., Inc. (2008-present); employed by FMR LLC or an affiliate (2001-present); Chief Legal Officer of Fidelity Management & Research (Hong Kong) Limited (2008-present) and Assistant Secretary of Fidelity Management & Research (Japan) Inc. (2008-present), and Fidelity Management & Research (U.K.) Inc. (2008-present). Previously, Mr. Goebel served as Assistant Secretary of FIMM (2008-2010), FRAC (2008-2010), and the Funds (2007-2008) and as Vice President and Secretary of Fidelity Distributors Corporation (FDC) (2005-2007). |
William C. Coffey (42) |
| Year of Election or Appointment: 2009 Assistant Secretary of Fidelity's Equity and High Income Funds. Mr. Coffey also serves as Senior Vice President and Deputy General Counsel of FMR LLC (2010-present), and is an employee of Fidelity Investments. Previously, Mr. Coffey served as Vice President and Associate General Counsel of FMR LLC (2005-2009). |
Holly C. Laurent (57) |
| Year of Election or Appointment: 2008 Anti-Money Laundering (AML) Officer of the Fidelity funds. Ms. Laurent also serves as AML Officer of The North Carolina Capital Management Trust: Cash and Term Portfolios (2008-present) and is an employee of Fidelity Investments. Previously, Ms. Laurent was Senior Vice President and Head of Legal for Fidelity Business Services India Pvt. Ltd. (2006-2008), and Senior Vice President, Deputy General Counsel and Group Head for FMR LLC (2005-2006). |
Christine Reynolds (53) |
| Year of Election or Appointment: 2008 Chief Financial Officer of the Fidelity funds. Ms. Reynolds became President of Fidelity Pricing and Cash Management Services (FPCMS) in August 2008. Ms. Reynolds served as Chief Operating Officer of FPCMS (2007-2008). Previously, Ms. Reynolds served as President, Treasurer, and Anti-Money Laundering officer of the Fidelity funds (2004-2007). |
Kenneth A. Rathgeber (64) |
| Year of Election or Appointment: 2004 Chief Compliance Officer of Fidelity's Equity and High Income Funds. Mr. Rathgeber is Chief Compliance Officer of Fidelity Management & Research (Hong Kong) Limited (2008-present), Fidelity Management & Research (Japan) Inc. (2008-present), FMR (2005-present), FMR Co., Inc. (2005-present), Fidelity Management & Research (U.K.) Inc. (2005-present), Fidelity Research & Analysis Company (2005-present), Fidelity Investments Money Management, Inc. (2005-present), Pyramis Global Advisors, LLC (2005-present), and Strategic Advisers, Inc. (2005-present). |
Jeffrey S. Christian (50) |
| Year of Election or Appointment: 2009 Deputy Treasurer of the Fidelity funds. Mr. Christian is an employee of Fidelity Investments. Previously, Mr. Christian served as Chief Financial Officer (2008-2009) of certain Fidelity funds and Senior Vice President of Fidelity Pricing and Cash Management Services (FPCMS) (2004-2009). |
Joseph F. Zambello (54) |
| Year of Election or Appointment: 2011 Deputy Treasurer of the Fidelity funds. Mr. Zambello is an employee of Fidelity Investments. Previously, Mr. Zambello served as Vice President of FMR's Program Management Group (2009-2011) and Vice President of the Transfer Agent Oversight Group (2005-2009). |
Adrien E. Deberghes (44) |
| Year of Election or Appointment: 2008 Deputy Treasurer of Fidelity's Equity and High Income Funds. Mr. Deberghes also serves as Vice President and Assistant Treasurer of Fidelity Rutland Square Trust II and Fidelity Commonwealth Trust II (2011-present), Assistant Treasurer of other Fidelity funds (2010-present), and is an employee of Fidelity Investments (2008-present). Previously, Mr. Deberghes served as Senior Vice President of Mutual Fund Administration at State Street Corporation (2007-2008), Senior Director of Mutual Fund Administration at Investors Bank & Trust (2005-2007), and Director of Finance for Dunkin' Brands (2000-2005). |
Stephanie J. Dorsey (42) |
| Year of Election or Appointment: 2010 Assistant Treasurer of Fidelity's Equity and High Income Funds. Ms. Dorsey also serves as Deputy Treasurer of other Fidelity funds (2008-present) and is an employee of Fidelity Investments (2008-present). Previously, Ms. Dorsey served as Treasurer (2004-2008) of the JPMorgan Mutual Funds and Vice President (2004-2008) of JPMorgan Chase Bank. |
John R. Hebble (53) |
| Year of Election or Appointment: 2009 Assistant Treasurer of Fidelity's Equity and High Income Funds. Mr. Hebble also serves as President (2011-present), Treasurer, and Chief Financial Officer of The North Carolina Capital Management Trust: Cash and Term Portfolios (2008-present), President and Treasurer of other Fidelity funds (2008-present) and is an employee of Fidelity Investments. |
Gary W. Ryan (53) |
| Year of Election or Appointment: 2005 Assistant Treasurer of the Fidelity funds. Mr. Ryan is an employee of Fidelity Investments. Previously, Mr. Ryan served as Vice President of Fund Reporting in Fidelity Pricing and Cash Management Services (FPCMS) (1999-2005). |
Jonathan Davis (43) |
| Year of Election or Appointment: 2010 Assistant Treasurer of the Fidelity funds. Mr. Davis is also Assistant Treasurer of Fidelity Rutland Square Trust II and Fidelity Commonwealth Trust II. Mr. Davis is an employee of Fidelity Investments. Previously, Mr. Davis served as Vice President and Associate General Counsel of FMR LLC (2003-2010). |
Annual Report
The Board of Trustees of Fidelity Advisor International Capital Appreciation Fund voted to pay to shareholders of record at the opening of business on record date, the following distributions per share derived from capital gains realized from sales of portfolio securities, and dividends derived from net investment income:
| Pay Date | Record Date | Dividends | Capital Gains |
Class A | 12/05/11 | 12/02/11 | $0.085 | $0.005 |
Class T | 12/05/11 | 12/02/11 | $0.056 | $0.005 |
Class B | 12/05/11 | 12/02/11 | $- | $- |
Class C | 12/05/11 | 12/02/11 | $0.005 | $0.005 |
Class A designates 66% and 100%, Class T designates 78% and 100%, Class B designates 100% and 100%, and Class C designates 100% and 100% of the dividends distributed on December 3 and December 30, 2010 respectively during the fiscal year as amounts which may be taken into account as a dividend for purposes of the maximum rate under section 1(h)(11) of the Internal Revenue Code.
The amounts per share which represent income derived from sources within, and taxes paid to, foreign countries or possessions of the United States are as follows:
| Pay Date | Income | Taxes |
Class A | 12/06/10 | $0.167 | $0.0220 |
| 12/31/10 | $0.010 | $0.0000 |
Class T | 12/06/10 | $0.143 | $0.0220 |
| 12/31/10 | $0.010 | $0.0000 |
Class B | 12/06/10 | $0.088 | $0.0220 |
| 12/31/10 | $0.010 | $0.0000 |
Class C | 12/06/10 | $0.108 | $0.0220 |
| 12/31/10 | $0.010 | $0.0000 |
The fund will notify shareholders in January 2012 of amounts for use in preparing 2011 income tax returns.
Annual Report
Board Approval of Investment Advisory Contracts and Management Fees
Fidelity Advisor International Capital Appreciation Fund
Each year, the Board of Trustees, including the Independent Trustees (together, the Board), votes on the renewal of the management contract and sub-advisory agreements (together, the Advisory Contracts) for the fund. The Board, assisted by the advice of fund counsel and Independent Trustees' counsel, requests and considers a broad range of information relevant to the renewal of the Advisory Contracts throughout the year.
The Board meets regularly and considers at each of its meetings factors that are relevant to its annual consideration of the renewal of the fund's Advisory Contracts, including the services and support provided to the fund and its shareholders. The Board has established various standing committees, each composed of Independent Trustees with varying backgrounds, to which the Board has assigned specific subject matter responsibilities in order to enhance effective decision-making by the Board. The Board, acting directly and through its Committees, requests and receives information concerning the annual consideration of the renewal of the fund's Advisory Contracts. The Board also meets as needed to consider matters specifically related to the Board's annual consideration of the renewal of Advisory Contracts. Members of the Board may also meet with trustees of other Fidelity funds through ad hoc joint committees to discuss certain matters relevant to the Fidelity funds.
At its July 2011 meeting, the Board of Trustees, including the Independent Trustees, unanimously determined to renew the fund's Advisory Contracts. In reaching its determination, the Board considered all factors it believed relevant, including (i) the nature, extent, and quality of the services to be provided to the fund and its shareholders (including the investment performance of the fund); (ii) the competitiveness of the fund's management fee and total expense ratio; (iii) the total costs of the services to be provided by and the profits to be realized by Fidelity from its relationship with the fund; (iv) the extent to which economies of scale would be realized as the fund grows; and (v) whether fee levels reflect these economies of scale, if any, for the benefit of fund shareholders.
In considering whether to renew the Advisory Contracts for the fund, the Board reached a determination, with the assistance of fund counsel and Independent Trustees' counsel and through the exercise of its business judgment, that the renewal of the Advisory Contracts is in the best interests of the fund and its shareholders and that the compensation payable under the Advisory Contracts is fair and reasonable. The Board's decision to renew the Advisory Contracts was not based on any single factor, but rather was based on a comprehensive consideration of all the information provided to the Board at its meetings throughout the year. The Board, in reaching its determination to renew the Advisory Contracts, is aware that shareholders in the fund have a broad range of investment choices available to them, including a wide choice among mutual funds offered by Fidelity's competitors, and that the fund's shareholders, who have the opportunity to review and weigh the disclosure provided by the fund in its prospectus and other public disclosures, have chosen to invest in this fund, managed by Fidelity.
Annual Report
Nature, Extent, and Quality of Services Provided. The Board considered the staffing within the investment adviser, FMR, and the sub-advisers (together, the Investment Advisers), including the backgrounds of the fund's investment personnel and the fund's investment objective and discipline. The Independent Trustees also had discussions with senior management of Fidelity's investment operations and investment groups. The Board considered the structure of the portfolio manager compensation program and whether this structure provides appropriate incentives to act in the best interests of the fund.
Resources Dedicated to Investment Management and Support Services. The Board and the Fund Oversight and Research Committees reviewed the general qualifications and capabilities of the Investment Advisers' investment staff, including its size, education, experience, and resources, as well as the Investment Advisers' approach to recruiting, training, managing, and compensating investment personnel. The Board also noted that FMR has devoted increased resources to non-U.S. offices. The Board noted that Fidelity's analysts have extensive resources, tools and capabilities which allow them to conduct sophisticated quantitative and fundamental analysis, as well as credit analysis of issuers, counterparties and enhancers. The Board also believes that Fidelity's investment professionals have sufficient access to global information and data so as to provide competitive investment results over time, and that those professionals also have access to sophisticated tools which permit them to assess portfolio construction and risk and performance attribution characteristics continuously, as well as to transmit new information and research conclusions rapidly around the world. Additionally, in their deliberations, the Board considered the Investment Advisers' trading capabilities and resources which are an integral part of the investment management process.
Shareholder and Administrative Services. The Board considered (i) the nature, extent, quality, and cost of advisory, administrative, and shareholder services performed by the Investment Advisers and their affiliates under the Advisory Contracts and under separate agreements covering transfer agency, pricing and bookkeeping, and securities lending services for the fund; (ii) the nature and extent of the investment adviser's supervision of third party service providers, principally custodians and subcustodians; and (iii) the resources devoted to, and the record of compliance with, the fund's compliance policies and procedures. The Board also reviewed the allocation of fund brokerage, including allocations to brokers affiliated with the Investment Advisers, the use of brokerage commissions to pay fund expenses, and the use of "soft" commission dollars to pay for research services.
The Board noted that the growth of fund assets over time across the complex allows Fidelity to reinvest in the development of services designed to enhance the value or convenience of the Fidelity funds as investment vehicles. These services include 24-hour access to account information and market information through telephone representatives and over the Internet, investor education materials and asset allocation tools, and the expanded availability of Fidelity Investor Centers, with 35 new branches opening since 2010.
Annual Report
Board Approval of Investment Advisory Contracts and
Management Fees - continued
Investment in a Large Fund Family. The Board considered the benefits to shareholders of investing in a Fidelity fund, including the benefits of investing in a fund that is part of a large family of funds offering a variety of investment disciplines and providing a large variety of mutual fund investor services. The Board noted that Fidelity had taken, or had made recommendations that resulted in the Fidelity funds taking, a number of actions over the previous year that benefited particular funds, including (i) continuing to dedicate additional resources to investment research and support of the senior management team that oversees asset management; (ii) rationalizing product lines through the mergers of six funds into other funds; (iii) continuing to migrate the Freedom Funds to dedicated lower cost underlying funds; (iv) obtaining shareholder approval to broaden the investment strategies for Fidelity Consumer Finance Portfolio, Fidelity Emerging Asia Fund, and Fidelity Environment and Alternative Energy Portfolio; (v) contractually agreeing to reduce the management fees and impose other expense limitations on Spartan 500 Index Fund and U.S. Bond Index Fund in connection with launching new institutional classes of these funds; (vi) changing the name, primary and supplemental benchmarks, and investment policies of Fidelity Global Strategies Fund to support the fund's flexible investment mandate and global orientation; and (vii) reducing the transfer agency account fee rates on certain accounts.
Investment Performance. The Board considered whether the fund has operated in accordance with its investment objective, as well as its record of compliance with its investment restrictions. It also reviewed the fund's absolute investment performance for each class, as well as the fund's relative investment performance for each class measured over multiple periods against (i) a broad-based securities market index, and (ii) a custom peer group of mutual funds deemed appropriate by Fidelity and reviewed by the Board. The following charts considered by the Board show, over the one-, three-, and five-year periods ended December 31, 2010, the cumulative total returns of Institutional Class (Class I) and Class B of the fund, the cumulative total returns of a broad-based securities market index ("benchmark"), and a range of cumulative total returns of a custom peer group of mutual funds defined by FMR based on categories assigned by Morningstar, Inc. The returns of Institutional Class (Class I) and Class B show the performance of the highest and lowest performing classes, respectively (based on five-year performance). The box within each chart shows the 25th percentile return (bottom of box) and the 75th percentile return (top of box) of the peer group. Returns shown above the box are in the first quartile and returns shown below the box are in the fourth quartile. The percentage beaten numbers noted below each chart correspond to the percentile box and represent the percentage of funds in the peer group whose performance was equal to or lower than that of the class indicated. The fund's custom peer group, defined by FMR, is a peer group that FMR believes provides a more meaningful performance comparison than the peer group assigned by Morningstar, Inc., which assigns mutual funds to categories based on their investment styles as measured by their underlying portfolio holdings.
Annual Report
Fidelity Advisor International Capital Appreciation Fund
The Board reviewed the fund's relative investment performance against its peer group and noted that the performance of Institutional Class (Class I) of the fund was in the first quartile for the one- and three-year periods and the third quartile for the five-year period. The Board also noted that the investment performance of Institutional Class (Class I) of the fund compared favorably to its benchmark for the one- and three-year periods, although the fund's five-year cumulative total return was lower than its benchmark. The Board considered that the variations in performance among the fund's classes reflect the variations in class expenses, which result in lower performance for higher expense classes. The Board also reviewed the fund's performance since inception as well as performance in the current year.
The Board also considered that the fund's management fee is subject to upward or downward adjustment depending upon whether, and to what extent, the fund's investment performance for the performance period exceeds, or is exceeded by, the record (over the same period) of a Board-approved performance adjustment index. The Board noted that the performance adjustment provides FMR with a strong economic incentive to seek to achieve superior performance for the fund's shareholders and helps to more closely align the interests of FMR and the fund's shareholders.
Annual Report
Board Approval of Investment Advisory Contracts and
Management Fees - continued
Based on its review, the Board concluded that the nature, extent, and quality of services provided to the fund under the Advisory Contracts should benefit the fund's shareholders.
Competitiveness of Management Fee and Total Expense Ratio. The Board considered the fund's management fee and total expense ratio compared to "mapped groups" of competitive funds and classes. Fidelity creates "mapped groups" by combining similar Lipper investment objective categories that have comparable management fee characteristics. Combining Lipper investment objective categories aids the Board's management fee and total expense ratio comparisons by broadening the competitive group used for comparison and by reducing the number of universes to which various Fidelity funds are compared.
Management Fee. The Board considered two proprietary management fee comparisons for the 12-month periods shown in the chart below. The group of Lipper funds used by the Board for management fee comparisons is referred to below as the "Total Mapped Group." The Total Mapped Group comparison focuses on a fund's standing relative to the total universe of comparable funds available to investors in terms of gross management fees before expense reimbursements or caps, and without giving effect to the fund's performance adjustment. "TMG %" represents the percentage of funds in the Total Mapped Group that had management fees that were lower than the fund's. For example, a TMG % of 16% means that 84% of the funds in the Total Mapped Group had higher management fees than the fund. The "Asset-Size Peer Group" (ASPG) comparison focuses on a fund's standing relative to non-Fidelity funds similar in size to the fund within the Total Mapped Group. The ASPG represents at least 15% of the funds in the Total Mapped Group with comparable asset size and management fee characteristics, subject to a minimum of 50 funds (or all funds in the Total Mapped Group if fewer than 50). Additional information, such as the ASPG quartile in which the fund's management fee ranked and the impact of the fund's performance adjustment, is also included in the chart and considered by the Board.
Annual Report
Fidelity Advisor International Capital Appreciation Fund
The Board noted that the fund's management fee ranked below the median of its Total Mapped Group and below the median of its ASPG for 2010. The Board also noted the effect of the fund's negative performance adjustment on the fund's management fee ranking. The Board noted that the performance adjustment for each year represents calculations for performance periods that differ from the periods shown in the performance charts above.
Based on its review, the Board concluded that the fund's management fee is fair and reasonable in light of the services that the fund receives and the other factors considered.
Total Expense Ratio. In its review of each class's total expense ratio, the Board considered the fund's management fee as well as other fund or class expenses, as applicable, such as transfer agent fees, pricing and bookkeeping fees, fund-paid 12b-1 fees, and custodial, legal, and audit fees. The Board also noted the effects of any waivers and reimbursements on fees and expenses, as well as the impact of the fund's performance adjustment. As part of its review, the Board also considered the current and historical total expense ratios of each class of the fund compared to competitive fund median expenses. Each class of the fund is compared to those funds and classes in the Total Mapped Group (used by the Board for management fee comparisons) that have a similar sales load structure.
The Board noted that the total expense ratio of each of Class A and Class B ranked below its competitive median for 2010, the total expense ratio of Class C ranked equal to its competitive median for 2010, and the total expense ratio of each of Class T and Institutional Class ranked above its competitive median for 2010. The Board considered that various factors, including 12b-1 fees, positive or negative performance adjustments, and relatively higher other expenses in the case of small fund size, can affect total expense ratios. The Board noted that the total expense ratio of Class T was above the competitive median primarily because of higher 12b-1 fees on Class T. Class T has a higher 12b-1 fee, but a lower front-end sales charge, than traditionally priced front-end sales charge classes. The Board noted that the fund offers multiple classes, each of which has a different sales load and 12b-1 fee structure, and that the multiple structures are intended to offer a range of pricing options for the intermediary market. The Board also noted that the total expense ratios of the classes vary primarily by the level of their 12b-1 fees, although differences in transfer agent fees may also cause expenses to vary from class to class.
Annual Report
Board Approval of Investment Advisory Contracts and
Management Fees - continued
Fees Charged to Other Fidelity Clients. The Board also considered Fidelity fee structures and other information with respect to clients of FMR and its affiliates, such as other mutual funds advised or subadvised by FMR or its affiliates, pension plan clients, and other institutional clients. In March 2010, the Board created an ad hoc joint committee with the board of other Fidelity funds (the Committee) to review and compare Fidelity's institutional investment advisory business with its business of providing services to the Fidelity funds, including the differences in services provided, fees charged, and costs incurred, as well as competition in their respective marketplaces.
Based on its review of total expense ratios and fees charged to other Fidelity clients, the Board concluded that the total expense ratio of each class of the fund was reasonable, although in some cases above the median of the universe presented for comparison, in light of the services that the fund and its shareholders receive and the other factors considered, including the findings of the Committee.
Costs of the Services and Profitability. The Board considered the revenues earned and the expenses incurred by Fidelity in conducting the business of developing, marketing, distributing, managing, administering and servicing the fund and its shareholders. The Board also considered the level of Fidelity's profits in respect of all the Fidelity funds.
On an annual basis, FMR presents to the Board Fidelity's profitability for the fund. Fidelity calculates the profitability for each fund, as well as aggregate profitability for groups of Fidelity funds and all Fidelity funds, using a series of detailed revenue and cost allocation methodologies which originate with the books and records of Fidelity on which Fidelity's audited financial statements are based. The Audit Committee of the Board reviews any significant changes from the prior year's methodologies.
PricewaterhouseCoopers LLP (PwC), independent registered public accounting firm and auditor to Fidelity and certain Fidelity funds, has been engaged annually by the Board as part of the Board's assessment of Fidelity's profitability analysis. PwC's engagement includes the review and assessment of Fidelity's methodologies used in determining the revenues and expenses attributable to Fidelity's mutual fund business, and completion of agreed-upon procedures surrounding the mathematical accuracy of fund profitability and its conformity to allocation methodologies. After considering PwC's reports issued under the engagement and information provided by Fidelity, the Board concluded that while other allocation methods may also be reasonable, Fidelity's profitability methodologies are reasonable in all material respects.
Annual Report
The Board also reviewed Fidelity's non-fund businesses and fall-out benefits related to the mutual fund business as well as cases where Fidelity's affiliates may benefit from or be related to the fund's business.
The Board considered the costs of the services provided by and the profits realized by Fidelity in connection with the operation of the fund and was satisfied that the profitability was not excessive in the circumstances.
Economies of Scale. The Board considered whether there have been economies of scale in respect of the management of the Fidelity funds, whether the Fidelity funds (including the fund) have appropriately benefited from any such economies of scale, and whether there is potential for realization of any further economies of scale. The Board considered the extent to which the fund will benefit from economies of scale through increased services to the fund, through waivers or reimbursements, or through fee or expense reductions. The Board also noted that in 2009, it and the board of other Fidelity funds created an ad hoc committee (the Economies of Scale Committee) to analyze whether FMR attains economies of scale in respect of the management and servicing of the Fidelity funds, whether the Fidelity funds have appropriately benefited from such economies of scale, and whether there is potential for realization of any further economies of scale.
The Board recognized that the fund's management contract incorporates a "group fee" structure, which provides for lower group fee rates as total fund assets under FMR's management increase, and for higher group fee rates as total fund assets under FMR's management decrease. FMR calculates the group fee rates based on a tiered asset "breakpoint" schedule that varies based on asset class. The Board considered that the group fee is designed to deliver the benefits of economies of scale to fund shareholders when total Fidelity fund assets increase, even if assets of any particular fund are unchanged or have declined, because some portion of Fidelity's costs are attributable to services provided to all Fidelity funds, and all funds benefit if those costs can be allocated among more assets. The Board concluded that, given the group fee structure, fund shareholders will benefit from lower management fees as assets under FMR's management increase at the fund complex level, regardless of whether Fidelity achieves any such economies of scale.
Annual Report
Board Approval of Investment Advisory Contracts and
Management Fees - continued
The Board concluded, taking into account the analysis of the Economies of Scale Committee, that any potential economies of scale are being appropriately shared between fund shareholders and Fidelity.
Additional Information Requested by the Board. In order to develop fully the factual basis for consideration of the Fidelity funds' Advisory Contracts, the Board requested and received additional information on certain topics, including (i) fund performance trends, actions to be taken by FMR to improve certain funds' overall performance, and Fidelity's long-term strategies for certain funds; (ii) portfolio manager changes that have occurred during the past year and length of portfolio manager tenure for different categories of funds over time; (iii) Fidelity's compensation structure for portfolio managers and other key personnel and strategies for attracting and retaining non-investment personnel; (iv) the amount of the investment that each portfolio manager has made in the Fidelity fund(s) that he or she manages; (v) historical trends in Fidelity's realization of fall-out benefits; (vi) Fidelity's group fee structures and the rationale for the individual fee rates of certain funds; (vii) fund profitability methodology and the impact of certain factors on fund profitability results; (viii) trends regarding industry use of performance fee structures and Fidelity's compliance practices with respect to performance adjustment calculations; (ix) the fee structures in place for certain other Fidelity clients; and (x) explanations regarding the relative total expense ratios of certain funds and classes, total expense competitive trends, and actions that might be taken by FMR to reduce total expense ratios for certain funds and classes.
Based on its evaluation of all of the conclusions noted above, and after considering all factors it believed relevant, the Board ultimately concluded that the advisory fee structures are fair and reasonable, and that the fund's Advisory Contracts should be renewed.
Annual Report
Investment Adviser
Fidelity Management & Research Company
Boston, MA
Investment Sub-Advisers
FMR Co., Inc.
Fidelity Management & Research
(U.K.) Inc.
Fidelity Management & Research
(Hong Kong) Limited
Fidelity Management & Research
(Japan) Inc.
FIL Investment Advisors
FIL Investments (Japan) Limited
FIL Investment Advisors (UK) Limited
General Distributor
Fidelity Distributors Corporation
Boston, MA
Transfer and Service Agents
Fidelity Investments Institutional Operations Company, Inc.
Boston, MA
Fidelity Service Company, Inc.
Boston, MA
Custodian
Brown Brothers Harriman & Co.
Boston, MA
AICAP-UANN-1211
1.784754.108
(Fidelity Investment logo)(registered trademark)
Fidelity Advisor®
International
Capital Appreciation
Fund - Institutional Class
Annual Report
October 31, 2011
Contents
Chairman's Message | (Click Here) | The Chairman's message to shareholders. |
Performance | (Click Here) | How the fund has done over time. |
Management's Discussion of Fund Performance | (Click Here) | The Portfolio Manager's review of fund performance and strategy. |
Shareholder Expense Example | (Click Here) | An example of shareholder expenses. |
Investment Changes | (Click Here) | A summary of major shifts in the fund's investments over the past six months. |
Investments | (Click Here) | A complete list of the fund's investments with their market values. |
Financial Statements | (Click Here) | Statements of assets and liabilities, operations, and changes in net assets, as well as financial highlights. |
Notes | (Click Here) | Notes to the financial statements. |
Report of Independent Registered Public Accounting Firm | (Click Here) | |
Trustees and Officers | (Click Here) | |
Distributions | (Click Here) | |
Board Approval of Investment Advisory Contracts and Management Fees | (Click Here) | |
To view a fund's proxy voting guidelines and proxy voting record for the 12-month period ended June 30, visit http://www.fidelity.com/proxyvotingresults or visit the Securities and Exchange Commission's (SEC) web site at http://www.sec.gov. You may also call 1-877-208-0098 to request a free copy of the proxy voting guidelines.
Standard & Poor's, S&P and S&P 500 are registered service marks of The McGraw-Hill Companies, Inc. and have been licensed for use by Fidelity Distributors Corporation.
Other third party marks appearing herein are the property of their respective owners.
All other marks appearing herein are registered or unregistered trademarks or service marks of FMR LLC or an affiliated company.
Annual Report
This report and the financial statements contained herein are submitted for the general information of the shareholders of the fund. This report is not authorized for distribution to prospective investors in the fund unless preceded or accompanied by an effective prospectus.
A fund files its complete schedule of portfolio holdings with the SEC for the first and third quarters of each fiscal year on Form N-Q. Forms N-Q are available on the SEC's web site at http://www.sec.gov. A fund's Forms N-Q may be reviewed and copied at the SEC's Public Reference Room in Washington, DC. Information regarding the operation of the SEC's Public Reference Room may be obtained by calling 1-800-SEC-0330. For a complete list of a fund's portfolio holdings, view the most recent holdings listing, semiannual report, or annual report on Fidelity's web site at http://www.fidelity.com, http://www.advisor.fidelity.com or http://www.401k.com, as applicable.
NOT FDIC INSURED • MAY LOSE VALUE • NO BANK GUARANTEE
Neither the fund nor Fidelity Distributors Corporation is a bank.
Annual Report
(photo_of_James_C_Curvey)
Dear Shareholder:
Global equity markets began the fourth quarter on a strong note, sharply reversing course in October amid strong corporate earnings, better-than-expected economic news and the promise of a resolution to the sovereign debt crisis in Europe. The mini rally followed a third quarter marked by a significant downturn in July and August, which heightened investor anxiety and set off a wave of volatility that hampered most major asset classes through the end of September. Financial markets are difficult to predict, of course, but you can help put the odds in your favor by following these time-tested investment principles.
One of the basic tenets is to invest according to your time horizon. For long-term investors, riding out the markets' inevitable ups and downs has proven much more effective than making decisions based on short-term developments. If your goal is approaching, you can also benefit from patience and restraint, rather than attempting to time the market. No matter your time horizon, missing only a few of the markets' best days can significantly diminish returns. Patience also affords the benefits of compounding - earning interest on additional income or reinvested dividends and capital gains. While staying the course doesn't eliminate risk, it can considerably lessen the negative impact of short-term downturns.
Asset allocation is another principle to manage risk. As you spread your portfolio among the asset classes, be sure to consider your time horizon, risk tolerance and investment objectives. Younger investors may be better served by emphasizing equities, which historically have been the best-performing asset class over time. Investors who are nearing a specific goal, such as retirement or sending a child to college, may choose to favor bonds and other investments that have tended to be more stable. Studies indicate that asset allocation is the single most important determinant of a portfolio's long-term success. After deciding on a suitable allocation strategy, make sure your portfolio is adequately diversified, with exposure to stocks of small-, mid- and large-cap companies in a range of sectors, for example. And today, more than ever, geographic diversification should be taken into account.
Lastly, investing a certain amount of money on a regular basis - a principle known as dollar-cost averaging - can help lower the average cost of your purchases, while also giving you the discipline to avoid selling weak performers just prior to an upswing, or chasing a hot performer just before a correction.
We invite you to learn more by visiting us on the Internet, dropping by one of our Investor Centers or calling us by phone. It is our privilege to provide the resources you need to choose investments that are right for you.
Sincerely,
(The acting chairman's signature appears here.)
James C. Curvey
Acting Chairman
Annual Report
Average annual total return reflects the change in the value of an investment, assuming reinvestment of the class' distributions from dividend income and capital gains (the profits earned upon the sale of securities that have grown in value, if any) and assuming a constant rate of performance each year. The $10,000 table and the fund's returns do not reflect the deduction of taxes that a shareholder would pay on fund distributions or the redemption of fund shares. During periods of reimbursement by Fidelity, a fund's total return will be greater than it would be had the reimbursement not occurred. How a fund did yesterday is no guarantee of how it will do tomorrow.
Average Annual Total Returns
Periods ended October 31, 2011 | | Past 1
year | Past 5
years | Past 10
years |
Institutional Class | | -4.01% | -1.32% | 5.79% |
$10,000 Over 10 Years
Let's say hypothetically that $10,000 was invested in Fidelity Advisor® International Capital Appreciation Fund - Institutional Class on October 31, 2001. The chart shows how the value of your investment would have changed, and also shows how the MSCI® ACWI® (All Country World Index) ex USA Index performed over the same period.
Annual Report
Market Recap: International equities were rocked by a number of headline events during the year ending October 31, 2011. Stocks posted a solid advance for the first half of the period, despite concern about the sovereign debt crisis in Europe, a devastating earthquake and tsunami in Japan, and political upheaval in the Middle East and North Africa. Sentiment turned decidedly negative in the second half, however, as fresh worries about Europe, inflation in China and a dimmed outlook for global growth caused foreign markets to suffer declines that intensified in August and September. October brought with it yet another dramatic swing, as eurozone policymakers appeared near a resolution to the debt debacle and buyers stormed back onto the scene in search of bargains. Still, those gains - along with favorable currency fluctuations overall - weren't enough to offset prior losses, and the MSCI® ACWI® (All Country World Index) ex USA Index finished the period down 4.56%. Within the MSCI index, Europe and emerging markets suffered the biggest declines, with many countries in these areas sustaining steep losses. By contrast, Japan showed resilience in the wake of its natural disasters, falling only 2%. Australia (+4%), Switzerland (+3%), the U.K. (+2%) and Canada, which produced a nominal return, were among the few major benchmark components to break into positive territory.
Comments from Sammy Simnegar, Portfolio Manager of Fidelity Advisor® International Capital Appreciation Fund: For the year, the fund's Institutional Class shares returned -4.01%, ahead of the MSCI index. Stock picking in consumer discretionary and materials aided relative performance, as did underweighting utilities. Geographically, out-of-benchmark exposure to the United States and positioning in Indonesia, Brazil and Russia helped. The fund's top contributor, Canadian junior silver miner Aurcana, was lifted by surging silver prices and sold. Other notable contributors included two Indonesian holdings, retailer Mitra Adiperkasa and tobacco firm Gudang Garam. Conversely, positioning in health care detracted, as did stock selection in financials and underweighted telecommunication services exposure. Geographically, positioning in India, China and the United Kingdom hurt the fund. Swiss food and beverage maker Nestle - the fund's largest holding at period end - was its largest relative detractor, mainly due to untimely ownership. Other key detractors were India-based Jain Irrigation Systems and Vedanta Resources, a U.K. metals and mining firm. Aurcana, Mitra Adiperkasa and Jain Irrigation Systems were non-index holdings. I sold Jain and Vedanta by period end.
The views expressed above reflect those of the portfolio manager(s) only through the end of the period as stated on the cover of this report and do not necessarily represent the views of Fidelity or any other person in the Fidelity organization. Any such views are subject to change at any time based upon market or other conditions and Fidelity disclaims any responsibility to update such views. These views may not be relied on as investment advice and, because investment decisions for a Fidelity fund are based on numerous factors, may not be relied on as an indication of trading intent on behalf of any Fidelity fund.
Annual Report
Shareholder Expense Example
As a shareholder of the Fund, you incur two types of costs: (1) transaction costs, including sales charges (loads) on purchase payments or redemption proceeds, redemption fees, and (2) ongoing costs, including management fees, distribution and/or service (12b-1) fees and other Fund expenses. This Example is intended to help you understand your ongoing costs (in dollars) of investing in the Fund and to compare these costs with the ongoing costs of investing in other mutual funds.
The Example is based on an investment of $1,000 invested at the beginning of the period and held for the entire period (May 1, 2011 to October 31, 2011).
Actual Expenses
The first line of the accompanying table for each class of the Fund provides information about actual account values and actual expenses. You may use the information in this line, together with the amount you invested, to estimate the expenses that you paid over the period. Simply divide your account value by $1,000.00 (for example, an $8,600 account value divided by $1,000.00 = 8.6), then multiply the result by the number in the first line for a class of the Fund under the heading entitled "Expenses Paid During Period" to estimate the expenses you paid on your account during this period. In addition, the Fund, as a shareholder in the underlying Fidelity Central Funds, will indirectly bear its pro-rata share of the fees and expenses incurred by the underlying Fidelity Central Funds. These fees and expenses are not included in the Fund's annualized expense ratio used to calculate the expense estimate in the table below.
Hypothetical Example for Comparison Purposes
The second line of the accompanying table for each class of the Fund provides information about hypothetical account values and hypothetical expenses based on a Class' actual expense ratio and an assumed rate of return of 5% per year before expenses, which is not the Class' actual return. The hypothetical account values and expenses may not be used to estimate the actual ending account balance or expenses you paid for the period. You may use this information to compare the ongoing costs of investing in the Fund and other funds. To do so, compare this 5% hypothetical example with the 5% hypothetical examples that appear in the shareholder reports of the other funds. In addition, the Fund, as a shareholder in the underlying Fidelity Central Funds, will indirectly bear its pro-rata share of the fees and expenses incurred by the underlying Fidelity Central Funds. These fees and expenses are not included in the Fund's annualized expense ratio used to calculate the expense estimate in the table below.
Please note that the expenses shown in the table are meant to highlight your ongoing costs only and do not reflect any transaction costs. Therefore, the second line of the table is useful in comparing ongoing costs only, and will not help you determine the relative total costs of owning different funds. In addition, if these transactional costs were included, your costs would have been higher.
Annual Report
| Annualized
Expense Ratio | Beginning
Account Value
May 1, 2011 | Ending
Account Value
October 31, 2011 | Expenses Paid
During Period*
May 1, 2011 to
October 31, 2011 |
Class A | 1.45% | | | |
Actual | | $ 1,000.00 | $ 846.60 | $ 6.75 |
HypotheticalA | | $ 1,000.00 | $ 1,017.90 | $ 7.38 |
Class T | 1.70% | | | |
Actual | | $ 1,000.00 | $ 845.30 | $ 7.91 |
HypotheticalA | | $ 1,000.00 | $ 1,016.64 | $ 8.64 |
Class B | 2.20% | | | |
Actual | | $ 1,000.00 | $ 842.60 | $ 10.22 |
HypotheticalA | | $ 1,000.00 | $ 1,014.12 | $ 11.17 |
Class C | 2.20% | | | |
Actual | | $ 1,000.00 | $ 842.20 | $ 10.22 |
HypotheticalA | | $ 1,000.00 | $ 1,014.12 | $ 11.17 |
Institutional Class | 1.20% | | | |
Actual | | $ 1,000.00 | $ 847.20 | $ 5.59 |
HypotheticalA | | $ 1,000.00 | $ 1,019.16 | $ 6.11 |
A 5% return per year before expenses
* Expenses are equal to each Class' annualized expense ratio, multiplied by the average account value over the period, multiplied by 184/365 (to reflect the one-half year period).
Annual Report
Investment Changes (Unaudited)
Top Five Stocks as of October 31, 2011 |
| % of fund's
net assets | % of fund's net assets
6 months ago |
Nestle SA (Switzerland, Food Products) | 2.3 | 0.0 |
Royal Dutch Shell PLC Class B (United Kingdom, Oil, Gas & Consumable Fuels) | 2.0 | 1.9 |
British American Tobacco PLC (United Kingdom) (United Kingdom, Tobacco) | 1.8 | 1.0 |
BHP Billiton PLC ADR (United Kingdom, Metals & Mining) | 1.7 | 2.0 |
Unilever PLC (United Kingdom, Food Products) | 1.2 | 0.0 |
| 9.0 | |
Top Five Market Sectors as of October 31, 2011 |
| % of fund's
net assets | % of fund's net assets
6 months ago |
Consumer Discretionary | 22.0 | 23.8 |
Consumer Staples | 21.5 | 10.2 |
Financials | 16.3 | 20.2 |
Materials | 10.9 | 12.6 |
Industrials | 9.9 | 11.4 |
Top Five Countries as of October 31, 2011 |
(excluding cash equivalents) | % of fund's
net assets | % of fund's net assets
6 months ago |
United States of America | 15.8 | 9.5 |
United Kingdom | 14.7 | 14.6 |
France | 7.9 | 7.3 |
Japan | 7.7 | 14.4 |
Switzerland | 5.7 | 4.2 |
Percentages are adjusted for the effect of open futures contracts, if applicable. |
Asset Allocation (% of fund's net assets) |
As of October 31, 2011 | As of April 30, 2011 |
| Stocks 97.9% | | | Stocks 98.8% | |
| Short-Term
Investments and
Net Other Assets 2.1% | | | Short-Term
Investments and
Net Other Assets 1.2% | |

Annual Report
Investments October 31, 2011
Showing Percentage of Net Assets
Common Stocks - 96.1% |
| Shares | | Value |
Australia - 1.0% |
Atlas Iron Ltd. | 184,307 | | $ 597,835 |
Fortescue Metals Group Ltd. | 135,133 | | 678,816 |
TOTAL AUSTRALIA | | 1,276,651 |
Belgium - 0.8% |
Anheuser-Busch InBev SA NV | 18,457 | | 1,023,702 |
Bermuda - 1.0% |
Credicorp Ltd. (NY Shares) | 6,800 | | 739,704 |
Petra Diamonds Ltd. (a) | 324,062 | | 599,330 |
TOTAL BERMUDA | | 1,339,034 |
Brazil - 4.8% |
BR Malls Participacoes SA | 63,900 | | 690,278 |
Brasil Foods SA sponsored ADR (d) | 37,600 | | 791,480 |
Cia.Hering SA | 30,500 | | 681,152 |
Companhia de Bebidas das Americas (AmBev) (PN) sponsored ADR | 25,400 | | 856,488 |
Iguatemi Empresa de Shopping Centers SA | 32,800 | | 635,486 |
Itau Unibanco Banco Multiplo SA sponsored ADR | 55,500 | | 1,061,160 |
Multiplan Empreendimentos Imobiliarios SA | 33,500 | | 677,335 |
Souza Cruz Industria Comerico | 57,500 | | 705,189 |
TOTAL BRAZIL | | 6,098,568 |
Canada - 1.4% |
First Quantum Minerals Ltd. | 36,800 | | 771,920 |
Potash Corp. of Saskatchewan, Inc. | 20,400 | | 965,513 |
TOTAL CANADA | | 1,737,433 |
Cayman Islands - 3.2% |
Belle International Holdings Ltd. | 391,000 | | 766,840 |
China ZhengTong Auto Services Holdings Ltd. | 563,000 | | 609,624 |
Ctrip.com International Ltd. sponsored ADR (a)(d) | 17,000 | | 592,620 |
Hengdeli Holdings Ltd. | 1,680,000 | | 753,173 |
Intime Department Store Group Co. Ltd. | 475,500 | | 682,376 |
Maoye International Holdings Ltd. (a) | 2,601,000 | | 714,536 |
TOTAL CAYMAN ISLANDS | | 4,119,169 |
Chile - 0.5% |
Banco Santander Chile sponsored ADR | 8,200 | | 669,776 |
China - 1.5% |
Baidu.com, Inc. sponsored ADR (a) | 4,600 | | 644,828 |
Common Stocks - continued |
| Shares | | Value |
China - continued |
Golden Eagle Retail Group Ltd. (H Shares) | 289,000 | | $ 726,310 |
SINA Corp. (a)(d) | 7,300 | | 593,417 |
TOTAL CHINA | | 1,964,555 |
Colombia - 0.5% |
Grupo de Inversiones Surameric | 39,200 | | 688,626 |
Grupo de Inversiones Surameric rights 11/22/11 (a) | 10,029 | | 1,505 |
TOTAL COLOMBIA | | 690,131 |
Curacao - 0.5% |
Schlumberger Ltd. | 8,600 | | 631,842 |
Denmark - 1.3% |
Christian Hansen Holding AS | 29,500 | | 644,674 |
Novo Nordisk A/S Series B sponsored ADR | 10,200 | | 1,084,260 |
TOTAL DENMARK | | 1,728,934 |
Finland - 1.1% |
Kone Oyj (B Shares) | 13,200 | | 729,603 |
Nokian Tyres PLC | 19,314 | | 709,646 |
TOTAL FINLAND | | 1,439,249 |
France - 7.9% |
Air Liquide SA | 7,500 | | 973,055 |
Atos Origin SA | 13,067 | | 633,281 |
BNP Paribas SA | 20,504 | | 932,135 |
Casino Guichard Perrachon et Compagnie | 7,595 | | 713,888 |
Christian Dior SA | 5,640 | | 798,472 |
Danone | 15,600 | | 1,085,919 |
LVMH Moet Hennessy - Louis Vuitton | 6,458 | | 1,074,701 |
Pernod Ricard SA | 8,600 | | 803,354 |
PPR SA | 5,000 | | 781,212 |
Remy Cointreau SA | 8,500 | | 698,731 |
Schneider Electric SA | 15,139 | | 893,554 |
Technip SA | 8,000 | | 760,813 |
TOTAL FRANCE | | 10,149,115 |
Germany - 3.7% |
BASF AG | 16,791 | | 1,235,979 |
Bayerische Motoren Werke AG (BMW) | 11,706 | | 956,768 |
SAP AG | 18,929 | | 1,144,763 |
Siemens AG sponsored ADR | 13,100 | | 1,375,107 |
TOTAL GERMANY | | 4,712,617 |
Common Stocks - continued |
| Shares | | Value |
India - 4.2% |
Bajaj Auto Ltd. | 19,716 | | $ 697,347 |
Gitanjali Gems Ltd. | 86,312 | | 613,642 |
HDFC Bank Ltd. | 75,199 | | 749,956 |
Housing Development Finance Corp. Ltd. | 61,226 | | 861,623 |
ITC Ltd. | 163,879 | | 714,784 |
Jubilant Foodworks Ltd. (a) | 35,699 | | 588,301 |
Smithkline Beecham Consumer Healthcare Ltd. | 12,522 | | 599,522 |
Titan Industries Ltd. | 132,926 | | 590,311 |
TOTAL INDIA | | 5,415,486 |
Indonesia - 4.8% |
PT Ace Hardware Indonesia Tbk | 1,792,000 | | 680,239 |
PT Astra International Tbk | 104,000 | | 801,918 |
PT Bank Mandiri (Persero) Tbk | 959,500 | | 765,377 |
PT Bank Rakyat Indonesia Tbk | 991,000 | | 745,080 |
PT Global Mediacom Tbk | 6,703,000 | | 601,769 |
PT Gudang Garam Tbk | 104,000 | | 682,643 |
PT Indofood Sukses Makmur Tbk | 1,107,000 | | 657,115 |
PT Mitra Adiperkasa Tbk | 1,110,000 | | 611,345 |
PT Modern Internasional Tbk | 1,896,500 | | 635,603 |
TOTAL INDONESIA | | 6,181,089 |
Israel - 1.0% |
Check Point Software Technologies Ltd. (a) | 10,100 | | 582,063 |
Israel Chemicals Ltd. | 57,000 | | 685,887 |
TOTAL ISRAEL | | 1,267,950 |
Italy - 2.3% |
Prada SpA | 149,600 | | 739,541 |
Saipem SpA | 17,114 | | 767,364 |
Salvatore Ferragamo Italia SpA (a) | 44,300 | | 717,902 |
Tod's SpA | 6,983 | | 698,691 |
TOTAL ITALY | | 2,923,498 |
Japan - 7.7% |
Canon, Inc. sponsored ADR (d) | 22,606 | | 1,029,703 |
Fanuc Corp. | 6,000 | | 970,266 |
Japan Tobacco, Inc. | 159 | | 794,809 |
Kakaku.com, Inc. | 15,800 | | 625,681 |
Keyence Corp. | 2,600 | | 661,033 |
Komatsu Ltd. | 36,700 | | 907,517 |
Makita Corp. | 17,900 | | 668,356 |
Mitsubishi Corp. | 44,600 | | 917,404 |
Common Stocks - continued |
| Shares | | Value |
Japan - continued |
Nabtesco Corp. | 33,300 | | $ 729,417 |
Rakuten, Inc. | 593 | | 650,151 |
Sysmex Corp. | 17,800 | | 585,162 |
THK Co. Ltd. | 37,500 | | 730,931 |
Unicharm Corp. | 13,800 | | 618,097 |
TOTAL JAPAN | | 9,888,527 |
Netherlands - 0.7% |
ING Groep NV sponsored ADR (a)(d) | 101,894 | | 880,364 |
Nigeria - 1.0% |
Guaranty Trust Bank PLC GDR (Reg. S) | 152,931 | | 703,483 |
Guinness Nigeria PLC | 483,504 | | 613,481 |
TOTAL NIGERIA | | 1,316,964 |
Norway - 0.6% |
DnB NOR ASA | 63,600 | | 741,939 |
Portugal - 0.5% |
Jeronimo Martins SGPS SA | 39,200 | | 678,111 |
Russia - 3.1% |
Magnit OJSC: | | | |
rights 11/29/11 (a) | 772 | | 0 |
GDR (Reg. S) | 31,795 | | 812,362 |
NOVATEK OAO GDR | 5,700 | | 800,280 |
Sberbank of Russia | 317,500 | | 861,546 |
TNK-BP Holding | 269,300 | | 736,811 |
Uralkali JSC GDR (Reg. S) | 17,500 | | 759,500 |
TOTAL RUSSIA | | 3,970,499 |
South Africa - 1.1% |
Mr Price Group Ltd. | 71,400 | | 687,343 |
Shoprite Holdings Ltd. | 46,100 | | 675,616 |
TOTAL SOUTH AFRICA | | 1,362,959 |
Spain - 0.6% |
Inditex SA | 9,120 | | 829,968 |
Sweden - 1.4% |
Atlas Copco AB (A Shares) | 35,700 | | 781,402 |
H&M Hennes & Mauritz AB (B Shares) | 29,930 | | 991,155 |
TOTAL SWEDEN | | 1,772,557 |
Switzerland - 5.7% |
Compagnie Financiere Richemont SA Series A | 17,844 | | 1,021,778 |
Credit Suisse Group sponsored ADR (d) | 30,300 | | 877,791 |
Dufry AG (a) | 6,000 | | 645,433 |
Common Stocks - continued |
| Shares | | Value |
Switzerland - continued |
Nestle SA | 51,760 | | $ 3,002,203 |
The Swatch Group AG (Bearer) | 2,020 | | 855,372 |
UBS AG (NY Shares) (a) | 77,200 | | 974,264 |
TOTAL SWITZERLAND | | 7,376,841 |
Thailand - 1.6% |
C.P. Seven Eleven PCL (For. Reg.) | 416,000 | | 629,457 |
Kasikornbank PCL (For. Reg.) | 180,700 | | 730,477 |
Siam Makro PCL (For. Reg.) | 96,900 | | 648,877 |
TOTAL THAILAND | | 2,008,811 |
Turkey - 0.6% |
Turkiye Garanti Bankasi AS | 199,000 | | 702,254 |
United Kingdom - 14.7% |
Anglo American PLC (United Kingdom) | 28,100 | | 1,036,442 |
Antofagasta PLC | 37,400 | | 701,912 |
Barclays PLC sponsored ADR (d) | 69,200 | | 865,692 |
BG Group PLC | 56,597 | | 1,234,677 |
BHP Billiton PLC ADR | 35,400 | | 2,229,138 |
British American Tobacco PLC (United Kingdom) | 50,000 | | 2,292,944 |
Burberry Group PLC | 36,200 | | 780,688 |
Imperial Tobacco Group PLC | 26,870 | | 982,648 |
Reckitt Benckiser Group PLC | 18,100 | | 930,887 |
Royal Dutch Shell PLC Class B | 70,744 | | 2,538,637 |
SABMiller PLC | 26,600 | | 971,705 |
Standard Chartered PLC (United Kingdom) | 49,496 | | 1,161,356 |
The Weir Group PLC | 23,100 | | 712,897 |
Unilever PLC | 44,700 | | 1,498,631 |
Xstrata PLC | 55,877 | | 939,501 |
TOTAL UNITED KINGDOM | | 18,877,755 |
United States of America - 15.3% |
Allergan, Inc. | 7,500 | | 630,900 |
Apple, Inc. (a) | 1,580 | | 639,552 |
Caterpillar, Inc. | 6,700 | | 632,882 |
Citigroup, Inc. | 18,700 | | 590,733 |
Citrix Systems, Inc. (a) | 8,500 | | 619,055 |
Coach, Inc. | 10,200 | | 663,714 |
Cummins, Inc. | 6,600 | | 656,238 |
EMC Corp. (a) | 26,000 | | 637,260 |
Freeport-McMoRan Copper & Gold, Inc. | 15,260 | | 614,368 |
Goldman Sachs Group, Inc. | 5,500 | | 602,525 |
Common Stocks - continued |
| Shares | | Value |
United States of America - continued |
Google, Inc. Class A (a) | 1,100 | | $ 651,904 |
Halliburton Co. | 16,200 | | 605,232 |
Joy Global, Inc. | 6,900 | | 601,680 |
JPMorgan Chase & Co. | 17,695 | | 615,078 |
Las Vegas Sands Corp. (a) | 14,440 | | 677,958 |
Lorillard, Inc. | 5,700 | | 630,762 |
MasterCard, Inc. Class A | 1,860 | | 645,866 |
Mead Johnson Nutrition Co. Class A | 8,300 | | 596,355 |
Oracle Corp. | 18,900 | | 619,353 |
Philip Morris International, Inc. | 18,700 | | 1,306,569 |
Rackspace Hosting, Inc. (a) | 15,917 | | 658,805 |
salesforce.com, Inc. (a) | 5,000 | | 665,850 |
The Coca-Cola Co. | 9,200 | | 628,544 |
The Mosaic Co. | 10,284 | | 602,231 |
Tiffany & Co., Inc. | 8,475 | | 675,712 |
TJX Companies, Inc. | 10,700 | | 630,551 |
United Technologies Corp. | 8,622 | | 672,344 |
Visa, Inc. Class A | 6,600 | | 615,516 |
Wells Fargo & Co. | 23,040 | | 596,966 |
Yum! Brands, Inc. | 12,400 | | 664,268 |
TOTAL UNITED STATES OF AMERICA | | 19,648,771 |
TOTAL COMMON STOCKS (Cost $118,770,312) | 123,425,119 |
Preferred Stocks - 1.8% |
| | | |
Convertible Preferred Stocks - 0.5% |
United States of America - 0.5% |
Citigroup, Inc. 7.50% | 6,400 | | 608,256 |
Nonconvertible Preferred Stocks - 1.3% |
Germany - 0.7% |
Volkswagen AG | 5,400 | | 947,584 |
Italy - 0.6% |
Fiat Industrial SpA (a) | 124,767 | | 765,597 |
TOTAL NONCONVERTIBLE PREFERRED STOCKS | | 1,713,181 |
TOTAL PREFERRED STOCKS (Cost $2,334,730) | 2,321,437 |
Money Market Funds - 2.8% |
| Shares | | Value |
Fidelity Securities Lending Cash Central Fund, 0.11% (b)(c)
(Cost $3,635,275) | 3,635,275 | | $ 3,635,275 |
TOTAL INVESTMENT PORTFOLIO - 100.7% (Cost $124,740,317) | | 129,381,831 |
NET OTHER ASSETS (LIABILITIES) - (0.7)% | | (908,855) |
NET ASSETS - 100% | $ 128,472,976 |
Legend |
(a) Non-income producing |
(b) Affiliated fund that is available only to investment companies and other accounts managed by Fidelity Investments. The rate quoted is the annualized seven-day yield of the fund at period end. A complete unaudited listing of the fund's holdings as of its most recent quarter end is available upon request. In addition, each Fidelity Central Fund's financial statements, which are not covered by the Fund's Report of Independent Registered Public Accounting Firm, are available on the SEC's website or upon request. |
(c) Investment made with cash collateral received from securities on loan. |
(d) Security or a portion of the security is on loan at period end. |
Affiliated Central Funds |
Information regarding fiscal year to date income earned by the Fund from investments in Fidelity Central Funds is as follows: |
Fund | Income earned |
Fidelity Cash Central Fund | $ 1,013 |
Fidelity Securities Lending Cash Central Fund | 56,613 |
Total | $ 57,626 |
Other Information |
The following is a summary of the inputs used, as of October 31, 2011, involving the Fund's assets and liabilities carried at fair value. The inputs or methodology used for valuing securities may not be an indication of the risk associated with investing in those securities. For more information on valuation inputs, and their aggregation into the levels used in the table below, please refer to the Security Valuation section in the accompanying Notes to Financial Statements. |
Valuation Inputs at Reporting Date: |
Description | Total | Level 1 | Level 2 | Level 3 |
Investments in Securities: | | | | |
Equities: | | | | |
United States of America | $ 20,257,027 | $ 20,257,027 | $ - | $ - |
United Kingdom | 18,877,755 | 12,547,543 | 6,330,212 | - |
France | 10,149,115 | 10,149,115 | - | - |
Japan | 9,888,527 | 1,029,703 | 8,858,824 | - |
Switzerland | 7,376,841 | 7,376,841 | - | - |
Indonesia | 6,181,089 | - | 6,181,089 | - |
Brazil | 6,098,568 | 6,098,568 | - | - |
Germany | 5,660,201 | 4,515,438 | 1,144,763 | - |
India | 5,415,486 | - | 5,415,486 | - |
Other | 35,841,947 | 26,538,878 | 9,303,069 | - |
Money Market Funds | 3,635,275 | 3,635,275 | - | - |
Total Investments in Securities: | $ 129,381,831 | $ 92,148,388 | $ 37,233,443 | $ - |
Income Tax Information |
At October 31, 2011, the Fund had a capital loss carryforward of approximately $106,313,982 of which $82,346,110 and $23,967,872 will expire in fiscal 2016 and 2017, respectively. Capital loss carryforwards are only available to offset future capital gains of the Fund to the extent provided by regulations and may be limited. |
See accompanying notes which are an integral part of the financial statements.
Annual Report
Statement of Assets and Liabilities
| October 31, 2011 |
Assets | | |
Investment in securities, at value (including securities loaned of $3,356,766) - See accompanying schedule: Unaffiliated issuers (cost $121,105,042) | $ 125,746,556 | |
Fidelity Central Funds (cost $3,635,275) | 3,635,275 | |
Total Investments (cost $124,740,317) | | $ 129,381,831 |
Foreign currency held at value (cost $579,009) | | 581,479 |
Receivable for investments sold | | 4,413,395 |
Receivable for fund shares sold | | 77,149 |
Dividends receivable | | 381,785 |
Distributions receivable from Fidelity Central Funds | | 655 |
Prepaid expenses | | 491 |
Receivable from investment adviser for expense reductions | | 23,612 |
Other receivables | | 301,715 |
Total assets | | 135,162,112 |
| | |
Liabilities | | |
Payable to custodian bank | $ 689,424 | |
Payable for investments purchased | 1,873,920 | |
Payable for fund shares redeemed | 221,135 | |
Accrued management fee | 96,229 | |
Distribution and service plan fees payable | 50,392 | |
Other affiliated payables | 35,481 | |
Other payables and accrued expenses | 87,280 | |
Collateral on securities loaned, at value | 3,635,275 | |
Total liabilities | | 6,689,136 |
| | |
Net Assets | | $ 128,472,976 |
Net Assets consist of: | | |
Paid in capital | | $ 231,514,686 |
Undistributed net investment income | | 717,375 |
Accumulated undistributed net realized gain (loss) on investments and foreign currency transactions | | (108,322,367) |
Net unrealized appreciation (depreciation) on investments and assets and liabilities in foreign currencies | | 4,563,282 |
Net Assets | | $ 128,472,976 |
See accompanying notes which are an integral part of the financial statements.
Annual Report
Statement of Assets and Liabilities - continued
| October 31, 2011 |
Calculation of Maximum Offering Price Class A:
Net Asset Value and redemption price per share ($40,363,509 ÷ 3,955,202 shares) | | $ 10.21 |
| | |
Maximum offering price per share (100/94.25 of $10.21) | | $ 10.83 |
Class T:
Net Asset Value and redemption price per share ($59,914,188 ÷ 5,992,747 shares) | | $ 10.00 |
| | |
Maximum offering price per share (100/96.50 of $10.00) | | $ 10.36 |
Class B:
Net Asset Value and offering price per share ($4,241,394 ÷ 458,113 shares)A | | $ 9.26 |
| | |
Class C:
Net Asset Value and offering price per share ($19,618,816 ÷ 2,124,523 shares)A | | $ 9.23 |
| | |
Institutional Class:
Net Asset Value, offering price and redemption price per share ($4,335,069 ÷ 398,828 shares) | | $ 10.87 |
A Redemption price per share is equal to net asset value less any applicable contingent deferred sales charge.
See accompanying notes which are an integral part of the financial statements.
Annual Report
Financial Statements - continued
Statement of Operations
| Year ended October 31, 2011 |
Investment Income | | |
Dividends | | $ 2,945,449 |
Special dividends | | 381,278 |
Interest | | 12 |
Income from Fidelity Central Funds | | 57,626 |
Income before foreign taxes withheld | | 3,384,365 |
Less foreign taxes withheld | | (220,492) |
Total income | | 3,163,873 |
| | |
Expenses | | |
Management fee
Basic fee | $ 1,057,229 | |
Performance adjustment | 165,453 | |
Transfer agent fees | 445,253 | |
Distribution and service plan fees | 754,996 | |
Accounting and security lending fees | 78,197 | |
Custodian fees and expenses | 172,238 | |
Independent trustees' compensation | 835 | |
Registration fees | 63,175 | |
Audit | 78,417 | |
Legal | 682 | |
Miscellaneous | 1,411 | |
Total expenses before reductions | 2,817,886 | |
Expense reductions | (384,303) | 2,433,583 |
Net investment income (loss) | | 730,290 |
Realized and Unrealized Gain (Loss) Net realized gain (loss) on: | | |
Investment securities: | | |
Unaffiliated issuers | 8,574,922 | |
Foreign currency transactions | (163,435) | |
Total net realized gain (loss) | | 8,411,487 |
Change in net unrealized appreciation (depreciation) on: Investment securities (net of decrease in deferred foreign taxes of $220,998) | (14,252,180) | |
Assets and liabilities in foreign currencies | (42,225) | |
Total change in net unrealized appreciation (depreciation) | | (14,294,405) |
Net gain (loss) | | (5,882,918) |
Net increase (decrease) in net assets resulting from operations | | $ (5,152,628) |
See accompanying notes which are an integral part of the financial statements.
Annual Report
Statement of Changes in Net Assets
| Year ended
October 31,
2011 | Year ended
October 31,
2010 |
Increase (Decrease) in Net Assets | | |
Operations | | |
Net investment income (loss) | $ 730,290 | $ 615,258 |
Net realized gain (loss) | 8,411,487 | 13,450,085 |
Change in net unrealized appreciation (depreciation) | (14,294,405) | 12,333,412 |
Net increase (decrease) in net assets resulting
from operations | (5,152,628) | 26,398,755 |
Distributions to shareholders from net investment income | (760,710) | (1,027,978) |
Distributions to shareholders from net realized gain | (1,721,042) | (2,639,506) |
Total distributions | (2,481,752) | (3,667,484) |
Share transactions - net increase (decrease) | (24,900,583) | (21,653,630) |
Redemption fees | 3,558 | 4,947 |
Total increase (decrease) in net assets | (32,531,405) | 1,082,588 |
| | |
Net Assets | | |
Beginning of period | 161,004,381 | 159,921,793 |
End of period (including undistributed net investment income of $717,375 and undistributed net investment income of $577,824, respectively) | $ 128,472,976 | $ 161,004,381 |
See accompanying notes which are an integral part of the financial statements.
Annual Report
Financial Highlights - Class A
Years ended October 31, | 2011 | 2010 | 2009 | 2008 | 2007 |
Selected Per-Share Data | | | | |
Net asset value, beginning of period | $ 10.85 | $ 9.34 | $ 6.39 | $ 18.64 | $ 17.79 |
Income from Investment Operations | | | | | |
Net investment income (loss) C | .08 J | .06 | .09 | .11 | .07 |
Net realized and unrealized gain (loss) | (.53) | 1.69 | 2.88 | (8.42) | 3.81 |
Total from investment operations | (.45) | 1.75 | 2.97 | (8.31) | 3.88 |
Distributions from net investment income | (.08) | (.08) | (.02) | (.05) | (.12) |
Distributions from net realized gain | (.12) | (.16) | - | (3.89) | (2.90) |
Total distributions | (.19) I | (.24) | (.02) | (3.94) | (3.03) H |
Redemption fees added to paid in capital C, G | - | - | - | - | - |
Net asset value, end of period | $ 10.21 | $ 10.85 | $ 9.34 | $ 6.39 | $ 18.64 |
Total Return A, B | (4.25)% | 18.98% | 46.61% | (55.70)% | 24.76% |
Ratios to Average Net Assets D, F | | | | |
Expenses before reductions | 1.64% | 1.45% | 1.27% | 1.42% | 1.47% |
Expenses net of fee waivers, if any | 1.45% | 1.45% | 1.27% | 1.42% | 1.47% |
Expenses net of all reductions | 1.38% | 1.27% | 1.15% | 1.25% | 1.39% |
Net investment income (loss) | .74% J | .66% | 1.22% | .95% | .39% |
Supplemental Data | | | | |
Net assets, end of period (000 omitted) | $ 40,364 | $ 49,058 | $ 43,389 | $ 35,517 | $ 113,579 |
Portfolio turnover rate E | 254% | 490% | 414% | 394% | 146% |
A Total returns would have been lower if certain expenses had not been reduced during the applicable periods shown.
B Total returns do not include the effect of the sales charges.
C Calculated based on average shares outstanding during the period.
D Fees and expenses of any underlying Fidelity Central Funds are not included in the Fund's expense ratio. The Fund indirectly bears its proportionate share of the expenses of any underlying Fidelity Central Funds.
E Amount does not include the portfolio activity of any underlying Fidelity Central Funds.
F Expense ratios reflect operating expenses of the class. Expenses before reductions do not reflect amounts reimbursed by the investment adviser or reductions from brokerage service arrangements or reductions from other expense offset arrangements and do not represent the amount paid by the class during periods when reimbursements or reductions occur. Expenses net of fee waivers reflect expenses after reimbursement by the investment adviser but prior to reductions from brokerage service arrangements or other expense offset arrangements. Expenses net of all reductions represent the net expenses paid by the class.
G Amount represents less than $.01 per share.
H Total distributions of $3.03 per share is comprised of distributions from net investment income of $.123 and distributions from net realized gain of $2.903 per share.
I Total distributions of $.19 per share is comprised of distributions from net investment income of $.077 and distributions from net realized gain of $.116 per share.
J Investment income per share reflects a special dividend which amounted to $.03 per share. Excluding the special dividend, the ratio of net investment income (loss) to average net assets would have been .49%.
See accompanying notes which are an integral part of the financial statements.
Annual Report
Financial Highlights - Class T
Years ended October 31, | 2011 | 2010 | 2009 | 2008 | 2007 |
Selected Per-Share Data | | | | |
Net asset value, beginning of period | $ 10.63 | $ 9.16 | $ 6.28 | $ 18.38 | $ 17.57 |
Income from Investment Operations | | | | | |
Net investment income (loss) C | .05 J | .04 | .07 | .08 | .03 |
Net realized and unrealized gain (loss) | (.52) | 1.65 | 2.82 | (8.28) | 3.76 |
Total from investment operations | (.47) | 1.69 | 2.89 | (8.20) | 3.79 |
Distributions from net investment income | (.05) | (.06) | (.01) | (.01) | (.07) |
Distributions from net realized gain | (.12) | (.16) | - | (3.89) | (2.90) |
Total distributions | (.16) I | (.22) | (.01) | (3.90) | (2.98) H |
Redemption fees added to paid in capital C, G | - | - | - | - | - |
Net asset value, end of period | $ 10.00 | $ 10.63 | $ 9.16 | $ 6.28 | $ 18.38 |
Total Return A, B | (4.51)% | 18.65% | 46.23% | (55.79)% | 24.47% |
Ratios to Average Net Assets D, F | | | | |
Expenses before reductions | 1.88% | 1.69% | 1.52% | 1.65% | 1.69% |
Expenses net of fee waivers, if any | 1.70% | 1.69% | 1.52% | 1.65% | 1.69% |
Expenses net of all reductions | 1.62% | 1.51% | 1.41% | 1.48% | 1.61% |
Net investment income (loss) | .49% J | .42% | .96% | .71% | .18% |
Supplemental Data | | | | |
Net assets, end of period (000 omitted) | $ 59,914 | $ 74,056 | $ 78,005 | $ 57,603 | $ 179,990 |
Portfolio turnover rate E | 254% | 490% | 414% | 394% | 146% |
A Total returns would have been lower if certain expenses had not been reduced during the applicable periods shown.
B Total returns do not include the effect of the sales charges.
C Calculated based on average shares outstanding during the period.
D Fees and expenses of any underlying Fidelity Central Funds are not included in the Fund's expense ratio. The Fund indirectly bears its proportionate share of the expenses of any underlying Fidelity Central Funds.
E Amount does not include the portfolio activity of any underlying Fidelity Central Funds.
F Expense ratios reflect operating expenses of the class. Expenses before reductions do not reflect amounts reimbursed by the investment adviser or reductions from brokerage service arrangements or reductions from other expense offset arrangements and do not represent the amount paid by the class during periods when reimbursements or reductions occur. Expenses net of fee waivers reflect expenses after reimbursement by the investment adviser but prior to reductions from brokerage service arrangements or other expense offset arrangements. Expenses net of all reductions represent the net expenses paid by the class.
G Amount represents less than $.01 per share.
H Total distributions of $2.98 per share is comprised of distributions from net investment income of $0.74 and distributions from net realized gain of $2.903 per share.
I Total distributions of $.16 per share is comprised of distributions from net investment income of $.047 and distributions from net realized gain of $.116 per share.
J Investment income per share reflects a special dividend which amounted to $.03 per share. Excluding the special dividend, the ratio of net investment income (loss) to average net assets would have been .24%.
See accompanying notes which are an integral part of the financial statements.
Annual Report
Financial Highlights - Class B
Years ended October 31, | 2011 | 2010 | 2009 | 2008 | 2007 |
Selected Per-Share Data | | | | | |
Net asset value, beginning of period | $ 9.84 | $ 8.51 | $ 5.86 | $ 17.36 | $ 16.72 |
Income from Investment Operations | | | | | |
Net investment income (loss) C | - G, I | (.01) | .03 | .02 | (.06) |
Net realized and unrealized gain (loss) | (.48) | 1.53 | 2.63 | (7.75) | 3.57 |
Total from investment operations | (.48) | 1.52 | 2.66 | (7.73) | 3.51 |
Distributions from net investment income | (.01) | (.03) | (.01) | - | - |
Distributions from net realized gain | (.09) | (.16) | - | (3.77) | (2.87) |
Total distributions | (.10) | (.19) | (.01) | (3.77) | (2.87) H |
Redemption fees added to paid in capital C, G | - | - | - | - | - |
Net asset value, end of period | $ 9.26 | $ 9.84 | $ 8.51 | $ 5.86 | $ 17.36 |
Total Return A, B | (4.99)% | 18.03% | 45.50% | (56.02)% | 23.85% |
Ratios to Average Net Assets D, F | | | | | |
Expenses before reductions | 2.39% | 2.20% | 2.02% | 2.17% | 2.24% |
Expenses net of fee waivers, if any | 2.20% | 2.20% | 2.02% | 2.17% | 2.24% |
Expenses net of all reductions | 2.13% | 2.02% | 1.90% | 2.01% | 2.17% |
Net investment income (loss) | (.01)% I | (.09)% | .47% | .19% | (.38)% |
Supplemental Data | | | | | |
Net assets, end of period (000 omitted) | $ 4,241 | $ 8,737 | $ 10,661 | $ 10,356 | $ 40,013 |
Portfolio turnover rate E | 254% | 490% | 414% | 394% | 146% |
A Total returns would have been lower if certain expenses had not been reduced during the applicable periods shown.
B Total returns do not include the effect of the contingent deferred sales charge.
C Calculated based on average shares outstanding during the period.
D Fees and expenses of any underlying Fidelity Central Funds are not included in the Fund's expense ratio. The Fund indirectly bears its proportionate share of the expenses of any underlying Fidelity Central Funds.
E Amount does not include the portfolio activity of any underlying Fidelity Central Funds.
F Expense ratios reflect operating expenses of the class. Expenses before reductions do not reflect amounts reimbursed by the investment adviser or reductions from brokerage service arrangements or reductions from other expense offset arrangements and do not represent the amount paid by the class during periods when reimbursements or reductions occur. Expenses net of fee waivers reflect expenses after reimbursement by the investment adviser but prior to reductions from brokerage service arrangements or other expense offset arrangements. Expenses net of all reductions represent the net expenses paid by the class.
G Amount represents less than $.01 per share.
H Total distributions of $2.87 per share is comprised of distributions from net realized gain of $2.869 per share.
I Investment income per share reflects a special dividend which amounted to $.03 per share. Excluding the special dividend, the ratio of net investment income (loss) to average net assets would have been (.26)%.
See accompanying notes which are an integral part of the financial statements.
Annual Report
Financial Highlights - Class C
Years ended October 31, | 2011 | 2010 | 2009 | 2008 | 2007 |
Selected Per-Share Data | | | | | |
Net asset value, beginning of period | $ 9.84 | $ 8.51 | $ 5.87 | $ 17.42 | $ 16.80 |
Income from Investment Operations | | | | | |
Net investment income (loss) C | - G, J | (.01) | .03 | .02 | (.05) |
Net realized and unrealized gain (loss) | (.49) | 1.53 | 2.62 | (7.75) | 3.57 |
Total from investment operations | (.49) | 1.52 | 2.65 | (7.73) | 3.52 |
Distributions from net investment income | (.01) | (.04) | (.01) | - | - |
Distributions from net realized gain | (.11) | (.16) | - | (3.82) | (2.90) |
Total distributions | (.12) | (.19) I | (.01) | (3.82) | (2.90) H |
Redemption fees added to paid in capital C, G | - | - | - | - | - |
Net asset value, end of period | $ 9.23 | $ 9.84 | $ 8.51 | $ 5.87 | $ 17.42 |
Total Return A, B | (5.07)% | 18.12% | 45.26% | (55.95)% | 23.85% |
Ratios to Average Net Assets D, F | | | | | |
Expenses before reductions | 2.39% | 2.20% | 2.02% | 2.16% | 2.19% |
Expenses net of fee waivers, if any | 2.20% | 2.20% | 2.02% | 2.16% | 2.19% |
Expenses net of all reductions | 2.13% | 2.02% | 1.90% | 2.00% | 2.12% |
Net investment income (loss) | (.01)% J | (.09)% | .47% | .20% | (.33)% |
Supplemental Data | | | | | |
Net assets, end of period (000 omitted) | $ 19,619 | $ 24,809 | $ 24,575 | $ 20,973 | $ 66,298 |
Portfolio turnover rate E | 254% | 490% | 414% | 394% | 146% |
A Total returns would have been lower if certain expenses had not been reduced during the applicable periods shown.
B Total returns do not include the effect of the contingent deferred sales charge.
C Calculated based on average shares outstanding during the period.
D Fees and expenses of any underlying Fidelity Central Funds are not included in the Fund's expense ratio. The Fund indirectly bears its proportionate share of the expenses of any underlying Fidelity Central Funds.
E Amount does not include the portfolio activity of any underlying Fidelity Central Funds.
F Expense ratios reflect operating expenses of the class. Expenses before reductions do not reflect amounts reimbursed by the investment adviser or reductions from brokerage service arrangements or reductions from other expense offset arrangements and do not represent the amount paid by the class during periods when reimbursements or reductions occur. Expenses net of fee waivers reflect expenses after reimbursement by the investment adviser but prior to reductions from brokerage service arrangements or other expense offset arrangements. Expenses net of all reductions represent the net expenses paid by the class.
G Amount represents less than $.01 per share.
H Total distributions of $2.90 per share is comprised of distributions from net realized gain of $2.903 per share.
I Total distributions of $.19 per share is comprised of distributions from net investment income of $.037 and distributions from net realized gain of $.155 per share.
J Investment income per share reflects a special dividend which amounted to $.03 per share. Excluding the special dividend, the ratio of net investment income (loss) to average net assets would have been (.26)%.
See accompanying notes which are an integral part of the financial statements.
Annual Report
Financial Highlights - Institutional Class
Years ended October 31, | 2011 | 2010 | 2009 | 2008 | 2007 |
Selected Per-Share Data | | | | | |
Net asset value, beginning of period | $ 11.54 | $ 9.91 | $ 6.77 | $ 19.49 | $ 18.46 |
Income from Investment Operations | | | | | |
Net investment income (loss) B | .12 I | .10 | .11 | .16 | .13 |
Net realized and unrealized gain (loss) | (.57) | 1.78 | 3.05 | (8.88) | 3.97 |
Total from investment operations | (.45) | 1.88 | 3.16 | (8.72) | 4.10 |
Distributions from net investment income | (.11) | (.09) | (.02) | (.11) | (.17) |
Distributions from net realized gain | (.12) | (.16) | - | (3.89) | (2.90) |
Total distributions | (.22) H | (.25) | (.02) | (4.00) | (3.07) G |
Redemption fees added to paid in capital B, F | - | - | - | - | - |
Net asset value, end of period | $ 10.87 | $ 11.54 | $ 9.91 | $ 6.77 | $ 19.49 |
Total Return A | (4.01)% | 19.22% | 46.85% | (55.51)% | 25.16% |
Ratios to Average Net Assets C, E | | | | | |
Expenses before reductions | 1.35% | 1.19% | 1.00% | 1.12% | 1.14% |
Expenses net of fee waivers, if any | 1.20% | 1.19% | 1.00% | 1.12% | 1.14% |
Expenses net of all reductions | 1.12% | 1.01% | .89% | .95% | 1.07% |
Net investment income (loss) | 1.00% I | .93% | 1.48% | 1.24% | .72% |
Supplemental Data | | | | | |
Net assets, end of period (000 omitted) | $ 4,335 | $ 4,345 | $ 3,292 | $ 3,620 | $ 17,463 |
Portfolio turnover rate D | 254% | 490% | 414% | 394% | 146% |
A Total returns would have been lower if certain expenses had not been reduced during the applicable periods shown.
B Calculated based on average shares outstanding during the period.
C Fees and expenses of any underlying Fidelity Central Funds are not included in the Fund's expense ratio. The Fund indirectly bears its proportionate share of the expenses of any underlying Fidelity Central Funds.
D Amount does not include the portfolio activity of any underlying Fidelity Central Funds.
E Expense ratios reflect operating expenses of the class. Expenses before reductions do not reflect amounts reimbursed by the investment adviser or reductions from brokerage service arrangements or reductions from other expense offset arrangements and do not represent the amount paid by the class during periods when reimbursements or reductions occur. Expenses net of fee waivers reflect expenses after reimbursement by the investment adviser but prior to reductions from brokerage service arrangements or other expense offset arrangements. Expenses net of all reductions represent the net expenses paid by the class.
F Amount represents less than $.01 per share.
G Total distributions of $3.07 per share is comprised of distributions from net investment income of $.166 and distributions from net realized gain of $2.903 per share.
H Total distributions of $.22 per share is comprised of distributions from net investment income of $.107 and distributions from net realized gain of $.116 per share.
I Investment income per share reflects a special dividend which amounted to $.03 per share. Excluding the special dividend, the ratio of net investment income (loss) to average net assets would have been .74%.
See accompanying notes which are an integral part of the financial statements.
Annual Report
Notes to Financial Statements
For the period ended October 31, 2011
1. Organization.
Fidelity Advisor International Capital Appreciation Fund (the Fund) is a fund of Fidelity Advisor Series VIII (the Trust) and is authorized to issue an unlimited number of shares. The Trust is registered under the Investment Company Act of 1940, as amended (the 1940 Act), as an open-end management investment company organized as a Massachusetts business trust. The Fund offers Class A, Class T, Class C and Institutional Class shares, each of which, along with Class B shares, has equal rights as to assets and voting privileges. Effective after the close of business on September 1, 2010, Class B shares were closed to new accounts and additional purchases, except for exchanges and reinvestments by existing shareholders. Each class has exclusive voting rights with respect to matters that affect that class. Class B shares will automatically convert to Class A shares after a holding period of seven years from the initial date of purchase. Investment income, realized and unrealized capital gains and losses, the common expenses of the Fund, and certain fund-level expense reductions, if any, are allocated on a pro-rata basis to each class based on the relative net assets of each class to the total net assets of the Fund. Each class differs with respect to transfer agent and distribution and service plan fees incurred. Certain expense reductions may also differ by class. The Fund's investments in emerging markets can be subject to social, economic, regulatory, and political uncertainties and can be extremely volatile.
2. Investments in Fidelity Central Funds.
The Fund invests in Fidelity Central Funds, which are open-end investment companies available only to other investment companies and accounts managed by Fidelity Management & Research Company (FMR) and its affiliates. The Fund's Schedule of Investments lists each of the Fidelity Central Funds held as of period end, if any, as an investment of the Fund, but does not include the underlying holdings of each Fidelity Central Fund. As an Investing Fund, the Fund indirectly bears its proportionate share of the expenses of the underlying Fidelity Central Funds.
The Money Market Central Funds seek preservation of capital and current income and are managed by Fidelity Investments Money Management, Inc. (FIMM), an affiliate of FMR.
A complete unaudited list of holdings for each Fidelity Central Fund is available upon request or at the Securities and Exchange Commission (the SEC) web site at www.sec.gov. In addition, the financial statements of the Fidelity Central Funds, which are not covered by the Fund's Report of Independent Registered Public Accounting Firm are available on the SEC web site or upon request.
Annual Report
Notes to Financial Statements - continued
3. Significant Accounting Policies.
The financial statements have been prepared in conformity with accounting principles generally accepted in the United States of America (GAAP), which require management to make certain estimates and assumptions at the date of the financial statements. Actual results could differ from those estimates. Subsequent events, if any, through the date that the financial statements were issued have been evaluated in the preparation of the financial statements. The following summarizes the significant accounting policies of the Fund:
Security Valuation. Investments are valued as of 4:00 p.m. Eastern time on the last calendar day of the period. The Fund uses independent pricing services approved by the Board of Trustees to value its investments. When current market prices or quotations are not readily available or reliable, valuations may be determined in good faith in accordance with procedures adopted by the Board of Trustees. Factors used in determining value may include market or security specific events. The frequency with which these procedures are used cannot be predicted and they may be utilized to a significant extent. The value used for net asset value (NAV) calculation under these procedures may differ from published prices for the same securities.
The Fund categorizes the inputs to valuation techniques used to value its investments into a disclosure hierarchy consisting of three levels as shown below:
Level 1 - quoted prices in active markets for identical investments
Level 2 - other significant observable inputs (including quoted prices for similar investments, interest rates, prepayment speeds, etc.)
Level 3 - unobservable inputs (including the Fund's own assumptions based on the best information available)
Changes in valuation techniques may result in transfers in or out of an assigned level within the disclosure hierarchy. The aggregate value of investments by input level, as of October 31, 2011, is included at the end of the Fund's Schedule of Investments. Valuation techniques used to value the Fund's investments by major category are as follows:
Equity securities, including restricted securities, for which market quotations are readily available, are valued at the last reported sale price or official closing price as reported by an independent pricing service on the primary market or exchange on which they are traded and are categorized as Level 1 in the hierarchy. In the event there were no sales during the day or closing prices are not available, securities are valued at the last quoted bid price or may be valued using the last available price and are generally categorized as Level 2 in the hierarchy. For foreign equity securities, when significant market or security specific events arise, comparisons to the valuation of American Depositary Receipts
Annual Report
3. Significant Accounting Policies - continued
Security Valuation - continued
(ADRs), futures contracts, Exchange-traded funds (ETFs) and certain indexes as well as quoted prices for similar securities are used and are categorized as Level 2 in the hierarchy in these circumstances. Utilizing these techniques may result in transfers between Level 1 and Level 2. For restricted equity securities and private placements where observable inputs are limited, assumptions about market activity and risk are used and are categorized as Level 3 in the hierarchy.
Investments in open-end mutual funds, including the Fidelity Central Funds, are valued at their closing net asset value each business day and are categorized as Level 1 in the hierarchy.
Foreign Currency. The Fund may use foreign currency contracts to facilitate transactions in foreign-denominated securities. Gains and losses from these transactions may arise from changes in the value of the foreign currency or if the counterparties do not perform under the contracts' terms.
Foreign-denominated assets, including investment securities, and liabilities are translated into U.S. dollars at the exchange rate at period end. Purchases and sales of investment securities, income and dividends received and expenses denominated in foreign currencies are translated into U.S. dollars at the exchange rate in effect on the transaction date.
The effects of exchange rate fluctuations on investments are included with the net realized and unrealized gain (loss) on investment securities. Other foreign currency transactions resulting in realized and unrealized gain (loss) are disclosed separately.
Investment Transactions and Income. For financial reporting purposes, the Fund's investment holdings and NAV include trades executed through the end of the last business day of the period. The NAV per share for processing shareholder transactions is calculated as of the close of business of the New York Stock Exchange (NYSE), normally 4:00 p.m. Eastern time and includes trades executed through the end of the prior business day. Gains and losses on securities sold are determined on the basis of identified cost and may include proceeds received from litigation. Dividend income is recorded on the ex-dividend date, except for certain dividends from foreign securities where the ex-dividend date may have passed, which are recorded as soon as the Fund is informed of the ex-dividend date. Non-cash dividends included in dividend income, if any, are recorded at the fair market value of the securities received. Distributions received on securities that represent a return of capital or capital gain are recorded as a reduction of cost of investments and/or as a realized gain. The Fund estimates the components of distributions received that may be considered return of capital distributions or capital
Annual Report
Notes to Financial Statements - continued
3. Significant Accounting Policies - continued
Investment Transactions and Income - continued
gain distributions. Large, non-recurring dividends recognized by the Fund are presented separately on the Statement of Operations as "Special Dividends" and the impact of these dividends is presented in the Financial Highlights. Interest income and distributions from the Fidelity Central Funds are accrued as earned. Interest income includes coupon interest and amortization of premium and accretion of discount on debt securities. Investment income is recorded net of foreign taxes withheld where recovery of such taxes is uncertain.
Expenses. Expenses directly attributable to a fund are charged to that fund. Expenses attributable to more than one fund are allocated among the respective funds on the basis of relative net assets or other appropriate methods. Expense estimates are accrued in the period to which they relate and adjustments are made when actual amounts are known.
Income Tax Information and Distributions to Shareholders. Each year, the Fund intends to qualify as a regulated investment company, including distributing substantially all of its taxable income and realized gains under Subchapter M of the Internal Revenue Code and filing its U.S. federal tax return. As a result, no provision for income taxes is required. As of October 31, 2011, the Fund did not have any unrecognized tax benefits in the financial statements. A fund's federal tax return is subject to examination by the Internal Revenue Service (IRS) for a period of three years. Foreign taxes are provided for based on the Fund's understanding of the tax rules and rates that exist in the foreign markets in which it invests. The Fund is subject to a tax imposed on realized short term capital gains on securities of certain issuers domiciled in India. An estimated deferred tax liability for net unrealized gains on these securities is included in Other payables and accrued expenses on the Statement of Assets & Liabilities.
Distributions are declared and recorded on the ex-dividend date. Income dividends and capital gain distributions are declared separately for each class. Income and capital gain distributions are determined in accordance with income tax regulations, which may differ from GAAP.
Capital accounts within the financial statements are adjusted for permanent book-tax differences. These adjustments have no impact on net assets or the results of operations. Temporary book-tax differences will reverse in a subsequent period.
Book-tax differences are primarily due to foreign currency transactions, certain foreign taxes, passive foreign investment companies (PFIC), equity debt classifications, capital loss carryforwards and losses deferred due to wash sales.
Annual Report
3. Significant Accounting Policies - continued
Income Tax Information and Distributions to Shareholders - continued
The federal tax cost of investment securities and unrealized appreciation (depreciation) as of period end were as follows:
Gross unrealized appreciation | $ 10,875,295 |
Gross unrealized depreciation | (8,278,250) |
Net unrealized appreciation (depreciation) on securities and other investments | $ 2,597,045 |
| |
Tax Cost | $ 126,784,786 |
The tax-based components of distributable earnings as of period end were as follows:
Undistributed ordinary income | $ 759,509 |
Capital loss carryforward | $ (106,313,982) |
Net unrealized appreciation (depreciation) | $ 2,539,767 |
Under the recently enacted Regulated Investment Company Modernization Act of 2010 (the Act), the Fund will be permitted to carry forward capital losses incurred in taxable years beginning after December 22, 2010 for an unlimited period. However, any losses incurred during those future taxable years will be required to be utilized prior to any losses incurred in pre-enactment taxable years, which generally expire after eight years from when they are incurred. Additionally, post-enactment capital losses that are carried forward will retain their character as either short-term or long-term capital losses rather than being considered all short-term as under previous law. The Fund's first fiscal year end subject to the Act will be October 31, 2012.
The tax character of distributions paid was as follows:
| October 31, 2011 | October 31, 2010 |
Ordinary Income | $ 2,481,752 | $ 3,667,484 |
Short-Term Trading (Redemption) Fees. Shares held by investors in the Fund less than 30 days are subject to a redemption fee equal to 1.00% of the net asset value of shares redeemed. All redemption fees, which reduce the proceeds of the shareholder redemption, are retained by the Fund and accounted for as an addition to paid in capital.
New Accounting Pronouncement. In May 2011, the Financial Accounting Standards Board issued Accounting Standard Update No. 2011-04, Fair Value Measurement (Topic 820) - Amendments to Achieve Common Fair Value Measurement and Disclosure Requirements in U.S. GAAP and IFRSs. The update changes the wording used to describe the requirements in GAAP for measuring fair value and for disclosing information about
Annual Report
Notes to Financial Statements - continued
3. Significant Accounting Policies - continued
New Accounting Pronouncement - continued
fair value measurements. The update is effective during interim and annual periods beginning after December 15, 2011. Management is currently evaluating the impact of the update's adoption on the Fund's financial statement disclosures.
4. Purchases and Sales of Investments.
Purchases and sales of securities, other than short-term securities, aggregated $376,777,146 and $404,931,434, respectively.
5. Fees and Other Transactions with Affiliates.
Management Fee. FMR and its affiliates provide the Fund with investment management related services for which the Fund pays a monthly management fee. The management fee is the sum of an individual fund fee rate that is based on an annual rate of .45% of the Fund's average net assets and a group fee rate that averaged .26% during the period. The group fee rate is based upon the average net assets of all the mutual funds advised by FMR. The group fee rate decreases as assets under management increase and increases as assets under management decrease. In addition, the management fee is subject to a performance adjustment (up to a maximum of ± .20% of the Fund's average net assets over a 36 month performance period). The upward or downward adjustment to the management fee is based on the relative investment performance of the Institutional Class of the Fund as compared to an appropriate benchmark index. For the period, the total annual management fee rate, including the performance adjustment, was .82% of the Fund's average net assets.
Distribution and Service Plan Fees. In accordance with Rule 12b-1 of the 1940 Act, the Fund has adopted separate Distribution and Service Plans for each class of shares. Certain classes pay Fidelity Distributors Corporation (FDC), an affiliate of FMR, separate Distribution and Service Fees, each of which is based on an annual percentage of each class' average net assets. In addition, FDC may pay financial intermediaries for selling shares of the Fund and providing shareholder support services. For the period, the Distribution and Service Fee rates, total fees and amounts retained by FDC were as follows:
| Distribution
Fee | Service
Fee | Total Fees | Retained
by FDC |
Class A | -% | .25% | $ 117,260 | $ 2,502 |
Class T | .25% | .25% | 341,924 | 1,369 |
Class B | .75% | .25% | 63,609 | 47,871 |
Class C | .75% | .25% | 232,203 | 11,399 |
| | | $ 754,996 | $ 63,141 |
Annual Report
5. Fees and Other Transactions with Affiliates - continued
Sales Load. FDC may receive a front-end sales charge of up to 5.75% for selling Class A shares, and 3.50% for selling Class T shares, some of which is paid to financial intermediaries for selling shares of the Fund. Depending on the holding period, FDC may receive contingent deferred sales charges levied on Class A, Class T, Class B, and Class C redemptions. The deferred sales charges range from 5% to 1% for Class B, 1% for Class C, 1.00% for certain purchases of Class A shares and .25% for certain purchases of Class T shares.
For the period, sales charge amounts retained by FDC were as follows:
| Retained
by FDC |
Class A | $ 8,284 |
Class T | 4,163 |
Class B* | 6,523 |
Class C* | 784 |
| $ 19,754 |
* When Class B and Class C shares are initially sold, FDC pays commissions from its own resources to financial intermediaries through which the sales are made.
Transfer Agent Fees. Fidelity Investments Institutional Operations Company, Inc. (FIIOC), an affiliate of FMR, is the transfer, dividend disbursing and shareholder servicing agent for each class of the Fund. FIIOC receives account fees and asset-based fees that vary according to the account size and type of account of the shareholders of the respective classes of the Fund. FIIOC pays for typesetting, printing and mailing of shareholder reports, except proxy statements. For the period, transfer agent fees for each class were as follows:
| Amount | % of
Average
Net Assets |
Class A | $ 141,944 | .30 |
Class T | 201,380 | .29 |
Class B | 19,272 | .30 |
Class C | 70,409 | .30 |
Institutional Class | 12,248 | .26 |
| $ 445,253 | |
Accounting and Security Lending Fees. Fidelity Service Company, Inc. (FSC), an affiliate of FMR, maintains the Fund's accounting records. The accounting fee is based on the level of average net assets for the month. Under a separate contract, FSC administers the security lending program. The security lending fee is based on the number and duration of lending transactions.
Annual Report
Notes to Financial Statements - continued
5. Fees and Other Transactions with Affiliates - continued
Brokerage Commissions. The Fund placed a portion of its portfolio transactions with brokerage firms which are affiliates of the investment adviser. The commissions paid to these affiliated firms were $4,076 for the period.
6. Committed Line of Credit.
The Fund participates with other funds managed by FMR or an affiliate in a $4.0 billion credit facility (the "line of credit") to be utilized for temporary or emergency purposes to fund shareholder redemptions or for other short-term liquidity purposes. The Fund has agreed to pay commitment fees on its pro-rata portion of the line of credit, which amounted to $471 and is reflected in Miscellaneous expenses on the Statement of Operations. During the period, there were no borrowings on this line of credit.
7. Security Lending.
The Fund lends portfolio securities through a lending agent from time to time in order to earn additional income. For equity securities, a lending agent is used and may loan securities to certain qualified borrowers, including Fidelity Capital Markets (FCM), a broker-dealer affiliated with the Fund. On the settlement date of the loan, the Fund receives collateral (in the form of U.S. Treasury obligations, letters of credit and/or cash) against the loaned securities and maintains collateral in an amount not less than 100% of the market value of the loaned securities during the period of the loan. The market value of the loaned securities is determined at the close of business of the Fund and any additional required collateral is delivered to the Fund on the next business day. If the borrower defaults on its obligation to return the securities loaned because of insolvency or other reasons, a fund could experience delays and costs in recovering the securities loaned or in gaining access to the collateral. Any cash collateral received is invested in the Fidelity Securities Lending Cash Central Fund. The value of loaned securities and cash collateral at period end are disclosed on the Fund's Statement of Assets and Liabilities. Security lending income represents the income earned on investing cash collateral, less rebates paid to borrowers and any lending agent fees associated with the loan, plus any premium payments received for lending certain types of securities. Security lending income is presented in the Statement of Operations as a component of income from Fidelity Central Funds. Total security lending income during the period amounted to $56,613. During the period, there were no securities loaned to FCM.
8. Expense Reductions.
FMR voluntarily agreed to reimburse each class to the extent annual operating expenses exceeded certain levels of average net assets as noted in the table below. Some expenses,
Annual Report
8. Expense Reductions - continued
for example interest expense, including commitment fees, are excluded from this reimbursement.
The following classes were in reimbursement during the period:
| Expense
Limitations | Reimbursement
from adviser |
| | |
Class A | 1.45% | $ 86,969 |
Class T | 1.70% | 121,478 |
Class B | 2.20% | 11,948 |
Class C | 2.20% | 43,249 |
Institutional Class | 1.20% | 6,886 |
| | $ 270,530 |
In addition, FMR voluntarily agreed to reimburse a portion of its management fee. For the period, the amount of this reimbursement was $6,986. Many of the brokers with whom FMR places trades on behalf of the Fund provided services to the Fund in addition to trade execution. These services included payments of certain expenses on behalf of the Fund totaling $106,787 for the period.
9. Distributions to Shareholders.
Distributions to shareholders of each class were as follows:
Years ended October 31, | 2011 | 2010 |
From net investment income | | |
Class A | $ 351,944 | $ 383,536 |
Class T | 323,075 | 471,584 |
Class B | 9,663 | 36,781 |
Class C | 29,995 | 106,805 |
Institutional Class | 46,033 | 29,272 |
Total | $ 760,710 | $ 1,027,978 |
From net realized gain | | |
Class A | $ 529,480 | $ 733,929 |
Class T | 797,756 | 1,218,258 |
Class B | 70,707 | 190,036 |
Class C | 273,307 | 447,425 |
Institutional Class | 49,792 | 49,858 |
Total | $ 1,721,042 | $ 2,639,506 |
Annual Report
Notes to Financial Statements - continued
10. Share Transactions.
Transactions for each class of shares were as follows:
| Shares | Dollars |
Years ended October 31, | 2011 | 2010 | 2011 | 2010 |
Class A | | | | |
Shares sold | 721,944 | 1,168,786 | $ 7,956,982 | $ 11,452,442 |
Reinvestment of distributions | 72,790 | 106,693 | 801,552 | 1,040,260 |
Shares redeemed | (1,361,813) | (1,397,227) | (14,987,238) | (13,480,819) |
Net increase (decrease) | (567,079) | (121,748) | $ (6,228,704) | $ (988,117) |
Class T | | | | |
Shares sold | 879,812 | 1,177,459 | $ 9,150,890 | $ 11,400,103 |
Reinvestment of distributions | 101,007 | 172,890 | 1,092,104 | 1,656,289 |
Shares redeemed | (1,955,605) | (2,898,040) | (20,943,089) | (27,789,326) |
Net increase (decrease) | (974,786) | (1,547,691) | $ (10,700,095) | $ (14,732,934) |
Class B | | | | |
Shares sold | 9,370 | 77,104 | $ 93,679 | $ 688,128 |
Reinvestment of distributions | 7,318 | 23,836 | 73,635 | 212,377 |
Shares redeemed | (446,550) | (465,893) | (4,499,761) | (4,121,865) |
Net increase (decrease) | (429,862) | (364,953) | $ (4,332,447) | $ (3,221,360) |
Class C | | | | |
Shares sold | 194,812 | 282,999 | $ 1,945,397 | $ 2,536,029 |
Reinvestment of distributions | 27,032 | 55,698 | 271,185 | 495,715 |
Shares redeemed | (619,329) | (703,110) | (6,101,194) | (6,197,225) |
Net increase (decrease) | (397,485) | (364,413) | $ (3,884,612) | $ (3,165,481) |
Institutional Class | | | | |
Shares sold | 167,207 | 151,567 | $ 1,942,483 | $ 1,532,760 |
Reinvestment of distributions | 6,560 | 5,962 | 76,766 | 61,704 |
Shares redeemed | (151,382) | (113,282) | (1,773,974) | (1,140,202) |
Net increase (decrease) | 22,385 | 44,247 | $ 245,275 | $ 454,262 |
11. Other.
The Fund's organizational documents provide former and current trustees and officers with a limited indemnification against liabilities arising in connection with the performance of their duties to the Fund. In the normal course of business, the Fund may also enter into contracts that provide general indemnifications. The Fund's maximum exposure under these arrangements is unknown as this would be dependent on future claims that may be made against the Fund. The risk of material loss from such claims is considered remote.
Annual Report
To the Trustees of Fidelity Advisor Series VIII and Shareholders of Fidelity Advisor International Capital Appreciation Fund:
We have audited the accompanying statement of assets and liabilities of Fidelity Advisor International Capital Appreciation Fund (the Fund), a fund of Fidelity Advisor Series VIII, including the schedule of investments, as of October 31, 2011, and the related statement of operations for the year then ended, the statement of changes in net assets for each of the two years in the period then ended, and the financial highlights for each of the five years in the period then ended. These financial statements and financial highlights are the responsibility of the Fund's management. Our responsibility is to express an opinion on these financial statements and financial highlights based on our audits.
We conducted our audits in accordance with the standards of the Public Company Accounting Oversight Board (United States). Those standards require that we plan and perform the audit to obtain reasonable assurance about whether the financial statements and financial highlights are free of material misstatement. The Fund is not required to have, nor were we engaged to perform, an audit of its internal control over financial reporting. Our audits included consideration of internal control over financial reporting as a basis for designing audit procedures that are appropriate in the circumstances, but not for the purpose of expressing an opinion on the effectiveness of the Fund's internal control over financial reporting. Accordingly, we express no such opinion. An audit also includes examining, on a test basis, evidence supporting the amounts and disclosures in the financial statements, assessing the accounting principles used and significant estimates made by management, as well as evaluating the overall financial statement presentation. Our procedures included confirmation of securities owned as of October 31, 2011, by correspondence with the custodians and brokers; where replies were not received from brokers, we performed other auditing procedures. We believe that our audits provide a reasonable basis for our opinion.
In our opinion, the financial statements and financial highlights referred to above present fairly, in all material respects, the financial position of Fidelity Advisor International Capital Appreciation Fund as of October 31, 2011, the results of its operations for the year then ended, the changes in its net assets for each of the two years in the period then ended, and its financial highlights for each of the five years in the period then ended, in conformity with accounting principles generally accepted in the United States of America.
/s/ Deloitte & Touche LLP
DELOITTE & TOUCHE LLP
Boston, Massachusetts
December 15, 2011
Annual Report
The Trustees, Members of the Advisory Board, and executive officers of the trust and fund, as applicable, are listed below. The Board of Trustees governs the fund and is responsible for protecting the interests of shareholders. The Trustees are experienced executives who meet periodically throughout the year to oversee the fund's activities, review contractual arrangements with companies that provide services to the fund, oversee management of the risks associated with such activities and contractual arrangements, and review the fund's performance. Except for James C. Curvey, each of the Trustees oversees 226 funds advised by FMR or an affiliate. Mr. Curvey oversees 429 funds advised by FMR or an affiliate.
The Trustees hold office without limit in time except that (a) any Trustee may resign; (b) any Trustee may be removed by written instrument, signed by at least two-thirds of the number of Trustees prior to such removal; (c) any Trustee who requests to be retired or who has become incapacitated by illness or injury may be retired by written instrument signed by a majority of the other Trustees; and (d) any Trustee may be removed at any special meeting of shareholders by a two-thirds vote of the outstanding voting securities of the trust. Each Trustee who is not an interested person (as defined in the 1940 Act) (Independent Trustee), shall retire not later than the last day of the calendar year in which his or her 75th birthday occurs. The Independent Trustees may waive this mandatory retirement age policy with respect to individual Trustees. The executive officers and Advisory Board Members hold office without limit in time, except that any officer and Advisory Board Member may resign or may be removed by a vote of a majority of the Trustees at any regular meeting or any special meeting of the Trustees. Except as indicated, each individual has held the office shown or other offices in the same company for the past five years.
Experience, Skills, Attributes, and Qualifications of the Fund's Trustees. The Governance and Nominating Committee has adopted a statement of policy that describes the experience, qualifications, attributes, and skills that are necessary and desirable for potential Independent Trustee candidates (Statement of Policy). The Board believes that each Trustee satisfied at the time he or she was initially elected or appointed a Trustee, and continues to satisfy, the standards contemplated by the Statement of Policy. The Governance and Nominating Committee also engages professional search firms to help identify potential Independent Trustee candidates who have the experience, qualifications, attributes, and skills consistent with the Statement of Policy. From time to time, additional criteria based on the composition and skills of the current Independent Trustees, as well as experience or skills that may be appropriate in light of future changes to board composition, business conditions, and regulatory or other developments, have also been considered by the professional search firms and the Governance and Nominating Committee. In addition, the Board takes into account the Trustees' commitment and participation in Board and committee meetings, as well as their leadership of standing and ad hoc committees throughout their tenure.
In determining that a particular Trustee was and continues to be qualified to serve as a Trustee, the Board has considered a variety of criteria, none of which, in isolation, was controlling. The Board believes that, collectively, the Trustees have balanced and diverse experience, qualifications, attributes, and skills, which allow the Board to operate effectively in governing the fund and protecting the interests of shareholders. Information about the specific experience, skills, attributes, and qualifications of each Trustee, which in each case led to the Board's conclusion that the Trustee should serve (or continue to serve) as a trustee of the fund, is provided below.
Annual Report
Board Structure and Oversight Function. James C. Curvey is an interested person (as defined in the 1940 Act) and currently serves as Acting Chairman. The Trustees have determined that an interested Chairman is appropriate and benefits shareholders because an interested Chairman has a personal and professional stake in the quality and continuity of services provided to the fund. Independent Trustees exercise their informed business judgment to appoint an individual of their choosing to serve as Chairman, regardless of whether the Trustee happens to be independent or a member of management. The Independent Trustees have determined that they can act independently and effectively without having an Independent Trustee serve as Chairman and that a key structural component for assuring that they are in a position to do so is for the Independent Trustees to constitute a substantial majority for the Board. The Independent Trustees also regularly meet in executive session. Ned C. Lautenbach serves as Chairman of the Independent Trustees and as such (i) acts as a liaison between the Independent Trustees and management with respect to matters important to the Independent Trustees and (ii) with management prepares agendas for Board meetings.
Fidelity funds are overseen by different Boards of Trustees. The fund's Board oversees Fidelity's equity and high income funds and another Board oversees Fidelity's investment-grade bond, money market, and asset allocation funds. The asset allocation funds may invest in Fidelity funds overseen by the fund's Board. The use of separate Boards, each with its own committee structure, allows the Trustees of each group of Fidelity funds to focus on the unique issues of the funds they oversee, including common research, investment, and operational issues. On occasion, the separate Boards establish joint committees to address issues of overlapping consequences for the Fidelity funds overseen by each Board.
The Trustees operate using a system of committees to facilitate the timely and efficient consideration of all matters of importance to the Trustees, the fund, and fund shareholders and to facilitate compliance with legal and regulatory requirements and oversight of the fund's activities and associated risks. The Board, acting through its committees, has charged FMR and its affiliates with (i) identifying events or circumstances the occurrence of which could have demonstrably adverse effects on the fund's business and/or reputation; (ii) implementing processes and controls to lessen the possibility that such events or circumstances occur or to mitigate the effects of such events or circumstances if they do occur; and (iii) creating and maintaining a system designed to evaluate continuously business and market conditions in order to facilitate the identification and implementation processes described in (i) and (ii) above. Because the day-to-day operations and activities of the fund are carried out by or through FMR, its affiliates and other service providers, the fund's exposure to risks is mitigated but not eliminated by the processes overseen by the Trustees. While each of the Board's committees has responsibility for overseeing different aspects of the fund's activities, oversight is exercised primarily through the Operations, Audit, and Compliance Committees. In addition, the Independent Trustees have worked with FMR to enhance the Board's oversight of investment and financial risks, legal and regulatory risks, technology risks, and operational risks, including the development of additional risk reporting to the Board. For example, a working group comprised of Independent Trustees and FMR has worked and continues to work to review the Fidelity funds' valuation-related activities, reporting and risk management. Appropriate personnel, including but not limited to the fund's Chief Compliance Officer (CCO), FMR's internal auditor, the independent accountants, the fund's Treasurer and portfolio management personnel, make periodic reports to the Board's committees, as appropriate, including an annual review of FMR's risk management program for the Fidelity funds. The responsibilities of each standing committee, including their oversight responsibilities, are described further under "Standing Committees of the Fund's Trustees."
Annual Report
Trustees and Officers - continued
The fund's Statement of Additional Information (SAI) includes more information about the Trustees. To request a free copy, call Fidelity at 1-877-208-0098.
Interested Trustees*:
Correspondence intended for each Trustee who is an interested person may be sent to Fidelity Investments, 82 Devonshire Street, Boston, Massachusetts 02109.
Name, Age; Principal Occupations and Other Relevant Experience+ |
James C. Curvey (76) |
| Year of Election or Appointment: 2007 Mr. Curvey is Trustee and Acting Chairman of the Board of Trustees of certain Trusts. Mr. Curvey also serves as Trustee (2007-present) of other investment companies advised by FMR. Mr. Curvey is a Director of Fidelity Investments Money Management, Inc. (2009-present), Director of Fidelity Research & Analysis Co. (2009-present) and Director of FMR and FMR Co., Inc. (2007-present). Mr. Curvey is also Vice Chairman (2007-present) and Director of FMR LLC. In addition, Mr. Curvey serves as an Overseer for the Boston Symphony Orchestra and a member of the Trustees of Villanova University. Previously, Mr. Curvey was the Vice Chairman (2006-2007) and Director (2000-2007) of FMR Corp. |
Ronald P. O'Hanley (54) |
| Year of Election or Appointment: 2011 Mr. O'Hanley is Director of FMR Co., Inc. (2010-present), Director of Fidelity Investments Money Management, Inc. (2010-present), Director of Fidelity Research & Analysis Company (2010-present), President of Fidelity Asset Management and Corporate Services and a member of Fidelity's Executive Committee (2010-present). Previously, Mr. O'Hanley served as President and Chief Executive Officer of BNY Mellon Asset Management (2007-2010). Mr. O'Hanley also served as Vice Chairman of Bank New York Mellon Corp. and a member of that firm's Executive Committee. Prior to the 2007 merger of The Bank of New York and Mellon Financial Corporation, he was Vice Chairman of Mellon Financial Corporation and President and Chief Executive Officer of Mellon Asset Management. He joined Mellon in February 1997. Mr. O'Hanley currently serves as Chairman of the Boston Public Library Foundation Board of Directors and sits on the Board of Directors of Beth Israel Deaconess Medical Center, the Board of Trustees of the Marine Biological Laboratory and the Advisory Board of the Maxwell School of Citizenship and Public Administration at Syracuse University. Mr. O'Hanley also chairs the Council on Asset Management for the Financial Services Roundtable and is a member of the Board of Directors of Institutional Investor's U.S. Institute. |
* Trustees have been determined to be "Interested Trustees" by virtue of, among other things, their affiliation with the trust or various entities under common control with FMR.
+ The information above includes each Trustee's principal occupation during the last five years and other information relating to the experience, attributes, and skills relevant to each Trustee's qualifications to serve as a Trustee, which led to the conclusion that each Trustee should serve as a Trustee for the fund.
Annual Report
Trustees and Officers - continued
Independent Trustees:
Correspondence intended for each Independent Trustee (that is, the Trustees other than the Interested Trustees) may be sent to Fidelity Investments, P.O. Box 55235, Boston, Massachusetts 02205-5235.
Name, Age; Principal Occupations and Other Relevant Experience+ |
Dennis J. Dirks (63) |
| Year of Election or Appointment: 2005 Prior to his retirement in May 2003, Mr. Dirks was Chief Operating Officer and a member of the Board of The Depository Trust & Clearing Corporation (DTCC). He also served as President, Chief Operating Officer, and Board member of The Depository Trust Company (DTC) and President and Board member of the National Securities Clearing Corporation (NSCC). In addition, Mr. Dirks served as Chief Executive Officer and Board member of the Government Securities Clearing Corporation, Chief Executive Officer and Board member of the Mortgage-Backed Securities Clearing Corporation, as a Trustee and a member of the Finance Committee of Manhattan College (2005-2008), and as a Trustee and a member of the Finance Committee of AHRC of Nassau County (2006-2008). Mr. Dirks is a member of the Independent Directors Council (IDC) Governing Council (2010-Present) and Board of Directors for The Brookville Center for Children's Services, Inc. (2009-present). |
Alan J. Lacy (58) |
| Year of Election or Appointment: 2008 Mr. Lacy serves as Senior Adviser (2007-present) of Oak Hill Capital Partners, L.P. (private equity). Mr. Lacy also served as Chief Executive Officer (2000-2005) and Vice Chairman (2005-2006) of Sears Holdings Corporation and Sears, Roebuck and Co. (retail). In addition, Mr. Lacy serves as a member of the Board of Directors of Dave & Buster's, Inc. (restaurant and entertainment complexes, 2010-present), The Hillman Companies, Inc. (hardware wholesalers, 2010-present), and Bristol-Myers Squibb Company (global pharmaceuticals, 2007-present). Mr. Lacy is a member of the Board of Trustees of The National Parks Conservation Association (2006-Present). Previously, Mr. Lacy served as Chairman of the Board of Trustees of the National Parks Conservation Association (2008-2011) and as a member of the Board of Directors for the Western Union Company (global money transfer, 2006-2011). |
Ned C. Lautenbach (67) |
| Year of Election or Appointment: 2000 Mr. Lautenbach is Chairman of the Independent Trustees of the Equity and High Income Funds (2006-present). Mr. Lautenbach currently serves as the Lead Director of the Eaton Corporation Board of Directors (diversified industrial, 1997-present). Mr. Lautenbach is also a member of the Board of Directors of the Philharmonic Center for the Arts in Naples, Florida (1999-present); a member of the Board of Trustees of Fairfield University (2005-present); and a member of the Council on Foreign Relations (1994-present). Previously, Mr. Lautenbach was a Partner/Advisory Partner at Clayton, Dubilier & Rice, LLC (private equity investment, 1998-2010), as well as a Director of Sony Corporation (2006-2007). |
Joseph Mauriello (67) |
| Year of Election or Appointment: 2008 Prior to his retirement in January 2006, Mr. Mauriello served in numerous senior management positions including Deputy Chairman and Chief Operating Officer (2004-2005), and Vice Chairman of Financial Services (2002-2004) of KPMG LLP US (professional services, 1965-2005). Mr. Mauriello currently serves as a member of the Board of Directors of XL Group plc. (global insurance and re-insurance, 2006-present) and of Arcadia Resources Inc. (health care services and products, 2007-present). Previously, Mr. Mauriello served as a Director of the Hamilton Funds of the Bank of New York (2006-2007). |
Robert W. Selander (61) |
| Year of Election or Appointment: 2011 Previously, Mr. Selander served as a Member of the Advisory Board of Fidelity's Equity and High Income Funds (2011), Executive Vice Chairman (2010), Chief Executive Officer (2009-2010), and President and Chief Executive Officer (1997-2009) of Mastercard, Inc. |
Cornelia M. Small (67) |
| Year of Election or Appointment: 2005 Ms. Small is a member of the Board of Directors of the Teagle Foundation (2009-present). Ms. Small is also a member of the Investment Committee, and Chair (2008-present) and a member of the Board of Trustees of Smith College. In addition, Ms. Small serves on the Investment Committee of the Berkshire Taconic Community Foundation (2008-present). Previously, Ms. Small served as Chairperson of the Investment Committee (2002-2008) of Smith College. In addition, Ms. Small served as Chief Investment Officer, Director of Global Equity Investments, and a member of the Board of Directors of Scudder, Stevens & Clark and Scudder Kemper Investments. |
William S. Stavropoulos (72) |
| Year of Election or Appointment: 2001 Mr. Stavropoulos is Vice Chairman of the Independent Trustees of the Equity and High Income Funds (2006-present). Mr. Stavropoulos serves as President and Founder of the Michigan Baseball Foundation, the Great Lakes Loons (2007-present). Mr. Stavropoulos is Chairman Emeritus of the Board of Directors of The Dow Chemical Company, where he previously served in numerous senior management positions, including President, CEO (1995-2000; 2002-2004), Chairman of the Executive Committee (2000-2006), and as a member of the Board of Directors (1990-2006). Currently, Mr. Stavropoulos is Chairman of Univar (global distributor of commodity and specialty chemicals, 2010-present), a Director of Teradata Corporation (data warehousing and technology solutions, 2008-present), Chemical Financial Corporation, Maersk Inc. (industrial conglomerate), Tyco International, Inc. (multinational manufacturing and services, 2007-present), and a member of the Advisory Board for Metalmark Capital (private equity investment, 2005-present). Mr. Stavropoulos is a special advisor to Clayton, Dubilier & Rice, LLC (private equity investment). In addition, Mr. Stavropoulos is a member of the University of Notre Dame Advisory Council for the College of Science. |
David M. Thomas (62) |
| Year of Election or Appointment: 2008 Previously, Mr. Thomas served as Executive Chairman (2005-2006) and Chairman and Chief Executive Officer (2000-2005) of IMS Health, Inc. (pharmaceutical and healthcare information solutions). In addition, Mr. Thomas serves as a member of the Board of Directors of Fortune Brands, Inc. (consumer products), and Interpublic Group of Companies, Inc. (marketing communication, 2004-present). |
Michael E. Wiley (61) |
| Year of Election or Appointment: 2008 Mr. Wiley also serves as a Director of Asia Pacific Exploration Consolidated (international oil and gas exploration and production, 2008-present). Mr. Wiley serves as a Director of Tesoro Corporation (independent oil refiner and marketer, 2005-present), and a Director of Bill Barrett Corporation (exploration and production, 2005-present). In addition, Mr. Wiley also serves as a Director of Post Oak Bank (privately-held bank, 2004-present). Previously, Mr. Wiley served as a member of the Board of Trustees of the University of Tulsa (2000-2006; 2007-2010), as a Senior Energy Advisor of Katzenbach Partners, LLC (consulting, 2006-2007), as an Advisory Director of Riverstone Holdings (private investment), Chairman, President, and CEO of Baker Hughes, Inc. (oilfield services, 2000-2004), and as Director of Spinnaker Exploration Company (exploration and production, 2001-2005). |
Annual Report
+ The information above includes each Trustee's principal occupation during the last five years and other information relating to the experience, attributes, and skills relevant to each Trustee's qualifications to serve as a Trustee, which led to the conclusion that each Trustee should serve as a Trustee for the fund.
Advisory Board Members and Executive Officers:
Correspondence intended for each executive officer, Edward C. Johnson 3d, and Peter S. Lynch may be sent to Fidelity Investments, 82 Devonshire Street, Boston, Massachusetts 02109.
Name, Age; Principal Occupation |
Edward C. Johnson 3d (81) |
| Year of Election or Appointment: 2011 Member of the Advisory Board of Fidelity's Equity and High Income Funds. Mr. Johnson serves as Chief Executive Officer, Chairman, and a Director of FMR LLC, and also serves as Chairman and Director of FIL Limited. Previously, Mr. Johnson served as a Trustee and Chairman of the Board of certain Fidelity Trusts, Chairman and a Director of FMR, Chairman and a Director of FMR Co., Inc., and President of FMR LLC (2006-2007). |
Peter S. Lynch (67) |
| Year of Election or Appointment: 2003 Member of the Advisory Board of Fidelity's Equity and High Income Funds. Mr. Lynch is Vice Chairman and a Director of FMR and FMR Co., Inc. In addition, Mr. Lynch serves as a Trustee of Boston College and as the Chairman of the Inner-City Scholarship Fund. Previously, Mr. Lynch served on the Special Olympics International Board of Directors (1997-2006). |
Kenneth B. Robins (42) |
| Year of Election or Appointment: 2008 President and Treasurer of Fidelity's Equity and High Income Funds. Mr. Robins also serves as President and Treasurer (2010-present) and Assistant Treasurer (2009-present) of other Fidelity funds and is an employee of Fidelity Investments (2004-present). Previously, Mr. Robins served as Deputy Treasurer of the Fidelity funds (2005-2008) and Treasurer and Chief Financial Officer of The North Carolina Capital Management Trust: Cash and Term Portfolios (2006-2008). |
Bruce T. Herring (46) |
| Year of Election or Appointment: 2006 Vice President of certain Equity Funds. Mr. Herring also serves as Chief Investment Officer and Director of Fidelity Management & Research (U.K.) Inc. (2010-present) and Group Chief Investments Officer of FMR. Previously, Mr. Herring served as Vice President (2005-2006) and Senior Vice President (2006-2007) of Fidelity Management & Research Company, Vice President of FMR Co., Inc. (2001-2007) and as a portfolio manager for Fidelity U.S. Equity Funds. |
Brian B. Hogan (47) |
| Year of Election or Appointment: 2009 Vice President of Equity and High Income Funds. Mr. Hogan also serves as President of FMR's Equity Division (2009-present). Previously, Mr. Hogan served as Senior Vice President, Equity Research of FMR (2006-2009) and as a portfolio manager. |
Scott C. Goebel (43) |
| Year of Election or Appointment: 2008 Secretary and Chief Legal Officer (CLO) of the Fidelity funds. Mr. Goebel also serves as Secretary of Fidelity Investments Money Management, Inc. (FIMM) (2010-present) and Fidelity Research and Analysis Company (FRAC) (2010-present); Secretary and CLO of The North Carolina Capital Management Trust: Cash and Term Portfolios (2008-present); General Counsel, Secretary, and Senior Vice President of FMR (2008-present) and FMR Co., Inc. (2008-present); employed by FMR LLC or an affiliate (2001-present); Chief Legal Officer of Fidelity Management & Research (Hong Kong) Limited (2008-present) and Assistant Secretary of Fidelity Management & Research (Japan) Inc. (2008-present), and Fidelity Management & Research (U.K.) Inc. (2008-present). Previously, Mr. Goebel served as Assistant Secretary of FIMM (2008-2010), FRAC (2008-2010), and the Funds (2007-2008) and as Vice President and Secretary of Fidelity Distributors Corporation (FDC) (2005-2007). |
William C. Coffey (42) |
| Year of Election or Appointment: 2009 Assistant Secretary of Fidelity's Equity and High Income Funds. Mr. Coffey also serves as Senior Vice President and Deputy General Counsel of FMR LLC (2010-present), and is an employee of Fidelity Investments. Previously, Mr. Coffey served as Vice President and Associate General Counsel of FMR LLC (2005-2009). |
Holly C. Laurent (57) |
| Year of Election or Appointment: 2008 Anti-Money Laundering (AML) Officer of the Fidelity funds. Ms. Laurent also serves as AML Officer of The North Carolina Capital Management Trust: Cash and Term Portfolios (2008-present) and is an employee of Fidelity Investments. Previously, Ms. Laurent was Senior Vice President and Head of Legal for Fidelity Business Services India Pvt. Ltd. (2006-2008), and Senior Vice President, Deputy General Counsel and Group Head for FMR LLC (2005-2006). |
Christine Reynolds (53) |
| Year of Election or Appointment: 2008 Chief Financial Officer of the Fidelity funds. Ms. Reynolds became President of Fidelity Pricing and Cash Management Services (FPCMS) in August 2008. Ms. Reynolds served as Chief Operating Officer of FPCMS (2007-2008). Previously, Ms. Reynolds served as President, Treasurer, and Anti-Money Laundering officer of the Fidelity funds (2004-2007). |
Kenneth A. Rathgeber (64) |
| Year of Election or Appointment: 2004 Chief Compliance Officer of Fidelity's Equity and High Income Funds. Mr. Rathgeber is Chief Compliance Officer of Fidelity Management & Research (Hong Kong) Limited (2008-present), Fidelity Management & Research (Japan) Inc. (2008-present), FMR (2005-present), FMR Co., Inc. (2005-present), Fidelity Management & Research (U.K.) Inc. (2005-present), Fidelity Research & Analysis Company (2005-present), Fidelity Investments Money Management, Inc. (2005-present), Pyramis Global Advisors, LLC (2005-present), and Strategic Advisers, Inc. (2005-present). |
Jeffrey S. Christian (50) |
| Year of Election or Appointment: 2009 Deputy Treasurer of the Fidelity funds. Mr. Christian is an employee of Fidelity Investments. Previously, Mr. Christian served as Chief Financial Officer (2008-2009) of certain Fidelity funds and Senior Vice President of Fidelity Pricing and Cash Management Services (FPCMS) (2004-2009). |
Joseph F. Zambello (54) |
| Year of Election or Appointment: 2011 Deputy Treasurer of the Fidelity funds. Mr. Zambello is an employee of Fidelity Investments. Previously, Mr. Zambello served as Vice President of FMR's Program Management Group (2009-2011) and Vice President of the Transfer Agent Oversight Group (2005-2009). |
Adrien E. Deberghes (44) |
| Year of Election or Appointment: 2008 Deputy Treasurer of Fidelity's Equity and High Income Funds. Mr. Deberghes also serves as Vice President and Assistant Treasurer of Fidelity Rutland Square Trust II and Fidelity Commonwealth Trust II (2011-present), Assistant Treasurer of other Fidelity funds (2010-present), and is an employee of Fidelity Investments (2008-present). Previously, Mr. Deberghes served as Senior Vice President of Mutual Fund Administration at State Street Corporation (2007-2008), Senior Director of Mutual Fund Administration at Investors Bank & Trust (2005-2007), and Director of Finance for Dunkin' Brands (2000-2005). |
Stephanie J. Dorsey (42) |
| Year of Election or Appointment: 2010 Assistant Treasurer of Fidelity's Equity and High Income Funds. Ms. Dorsey also serves as Deputy Treasurer of other Fidelity funds (2008-present) and is an employee of Fidelity Investments (2008-present). Previously, Ms. Dorsey served as Treasurer (2004-2008) of the JPMorgan Mutual Funds and Vice President (2004-2008) of JPMorgan Chase Bank. |
John R. Hebble (53) |
| Year of Election or Appointment: 2009 Assistant Treasurer of Fidelity's Equity and High Income Funds. Mr. Hebble also serves as President (2011-present), Treasurer, and Chief Financial Officer of The North Carolina Capital Management Trust: Cash and Term Portfolios (2008-present), President and Treasurer of other Fidelity funds (2008-present) and is an employee of Fidelity Investments. |
Gary W. Ryan (53) |
| Year of Election or Appointment: 2005 Assistant Treasurer of the Fidelity funds. Mr. Ryan is an employee of Fidelity Investments. Previously, Mr. Ryan served as Vice President of Fund Reporting in Fidelity Pricing and Cash Management Services (FPCMS) (1999-2005). |
Jonathan Davis (43) |
| Year of Election or Appointment: 2010 Assistant Treasurer of the Fidelity funds. Mr. Davis is also Assistant Treasurer of Fidelity Rutland Square Trust II and Fidelity Commonwealth Trust II. Mr. Davis is an employee of Fidelity Investments. Previously, Mr. Davis served as Vice President and Associate General Counsel of FMR LLC (2003-2010). |
Annual Report
The Board of Trustees of Fidelity Advisor International Capital Appreciation Fund voted to pay to shareholders of record at the opening of business on record date, the following distributions per share derived from capital gains realized from sales of portfolio securities, and dividends derived from net investment income:
| Pay Date | Record Date | Dividends | Capital Gains |
Institutional Class | 12/05/11 | 12/02/11 | $0.115 | $0.005 |
Institutional Class designates 58% and 100% of the dividend distributed on December 3 and December 30, 2010 respectively during the fiscal year as amounts which may be taken into account as a dividend for purposes of the maximum rate under section 1(h)(11) of the Internal Revenue Code.
The amounts per share which represent income derived from sources within, and taxes paid to, foreign countries or possessions of the United States are as follows:
| Pay Date | Income | Taxes |
Institutional Class | 12/6/10 | $0.192 | $0.0220 |
| 12/31/10 | $0.010 | $0.0000 |
The fund will notify shareholders in January 2012 of amounts for use in preparing 2011 income tax returns.
Annual Report
Board Approval of Investment Advisory Contracts and Management Fees
Fidelity Advisor International Capital Appreciation Fund
Each year, the Board of Trustees, including the Independent Trustees (together, the Board), votes on the renewal of the management contract and sub-advisory agreements (together, the Advisory Contracts) for the fund. The Board, assisted by the advice of fund counsel and Independent Trustees' counsel, requests and considers a broad range of information relevant to the renewal of the Advisory Contracts throughout the year.
The Board meets regularly and considers at each of its meetings factors that are relevant to its annual consideration of the renewal of the fund's Advisory Contracts, including the services and support provided to the fund and its shareholders. The Board has established various standing committees, each composed of Independent Trustees with varying backgrounds, to which the Board has assigned specific subject matter responsibilities in order to enhance effective decision-making by the Board. The Board, acting directly and through its Committees, requests and receives information concerning the annual consideration of the renewal of the fund's Advisory Contracts. The Board also meets as needed to consider matters specifically related to the Board's annual consideration of the renewal of Advisory Contracts. Members of the Board may also meet with trustees of other Fidelity funds through ad hoc joint committees to discuss certain matters relevant to the Fidelity funds.
At its July 2011 meeting, the Board of Trustees, including the Independent Trustees, unanimously determined to renew the fund's Advisory Contracts. In reaching its determination, the Board considered all factors it believed relevant, including (i) the nature, extent, and quality of the services to be provided to the fund and its shareholders (including the investment performance of the fund); (ii) the competitiveness of the fund's management fee and total expense ratio; (iii) the total costs of the services to be provided by and the profits to be realized by Fidelity from its relationship with the fund; (iv) the extent to which economies of scale would be realized as the fund grows; and (v) whether fee levels reflect these economies of scale, if any, for the benefit of fund shareholders.
In considering whether to renew the Advisory Contracts for the fund, the Board reached a determination, with the assistance of fund counsel and Independent Trustees' counsel and through the exercise of its business judgment, that the renewal of the Advisory Contracts is in the best interests of the fund and its shareholders and that the compensation payable under the Advisory Contracts is fair and reasonable. The Board's decision to renew the Advisory Contracts was not based on any single factor, but rather was based on a comprehensive consideration of all the information provided to the Board at its meetings throughout the year. The Board, in reaching its determination to renew the Advisory Contracts, is aware that shareholders in the fund have a broad range of investment choices available to them, including a wide choice among mutual funds offered by Fidelity's competitors, and that the fund's shareholders, who have the opportunity to review and weigh the disclosure provided by the fund in its prospectus and other public disclosures, have chosen to invest in this fund, managed by Fidelity.
Annual Report
Nature, Extent, and Quality of Services Provided. The Board considered the staffing within the investment adviser, FMR, and the sub-advisers (together, the Investment Advisers), including the backgrounds of the fund's investment personnel and the fund's investment objective and discipline. The Independent Trustees also had discussions with senior management of Fidelity's investment operations and investment groups. The Board considered the structure of the portfolio manager compensation program and whether this structure provides appropriate incentives to act in the best interests of the fund.
Resources Dedicated to Investment Management and Support Services. The Board and the Fund Oversight and Research Committees reviewed the general qualifications and capabilities of the Investment Advisers' investment staff, including its size, education, experience, and resources, as well as the Investment Advisers' approach to recruiting, training, managing, and compensating investment personnel. The Board also noted that FMR has devoted increased resources to non-U.S. offices. The Board noted that Fidelity's analysts have extensive resources, tools and capabilities which allow them to conduct sophisticated quantitative and fundamental analysis, as well as credit analysis of issuers, counterparties and enhancers. The Board also believes that Fidelity's investment professionals have sufficient access to global information and data so as to provide competitive investment results over time, and that those professionals also have access to sophisticated tools which permit them to assess portfolio construction and risk and performance attribution characteristics continuously, as well as to transmit new information and research conclusions rapidly around the world. Additionally, in their deliberations, the Board considered the Investment Advisers' trading capabilities and resources which are an integral part of the investment management process.
Shareholder and Administrative Services. The Board considered (i) the nature, extent, quality, and cost of advisory, administrative, and shareholder services performed by the Investment Advisers and their affiliates under the Advisory Contracts and under separate agreements covering transfer agency, pricing and bookkeeping, and securities lending services for the fund; (ii) the nature and extent of the investment adviser's supervision of third party service providers, principally custodians and subcustodians; and (iii) the resources devoted to, and the record of compliance with, the fund's compliance policies and procedures. The Board also reviewed the allocation of fund brokerage, including allocations to brokers affiliated with the Investment Advisers, the use of brokerage commissions to pay fund expenses, and the use of "soft" commission dollars to pay for research services.
The Board noted that the growth of fund assets over time across the complex allows Fidelity to reinvest in the development of services designed to enhance the value or convenience of the Fidelity funds as investment vehicles. These services include 24-hour access to account information and market information through telephone representatives and over the Internet, investor education materials and asset allocation tools, and the expanded availability of Fidelity Investor Centers, with 35 new branches opening since 2010.
Annual Report
Board Approval of Investment Advisory Contracts and
Management Fees - continued
Investment in a Large Fund Family. The Board considered the benefits to shareholders of investing in a Fidelity fund, including the benefits of investing in a fund that is part of a large family of funds offering a variety of investment disciplines and providing a large variety of mutual fund investor services. The Board noted that Fidelity had taken, or had made recommendations that resulted in the Fidelity funds taking, a number of actions over the previous year that benefited particular funds, including (i) continuing to dedicate additional resources to investment research and support of the senior management team that oversees asset management; (ii) rationalizing product lines through the mergers of six funds into other funds; (iii) continuing to migrate the Freedom Funds to dedicated lower cost underlying funds; (iv) obtaining shareholder approval to broaden the investment strategies for Fidelity Consumer Finance Portfolio, Fidelity Emerging Asia Fund, and Fidelity Environment and Alternative Energy Portfolio; (v) contractually agreeing to reduce the management fees and impose other expense limitations on Spartan 500 Index Fund and U.S. Bond Index Fund in connection with launching new institutional classes of these funds; (vi) changing the name, primary and supplemental benchmarks, and investment policies of Fidelity Global Strategies Fund to support the fund's flexible investment mandate and global orientation; and (vii) reducing the transfer agency account fee rates on certain accounts.
Investment Performance. The Board considered whether the fund has operated in accordance with its investment objective, as well as its record of compliance with its investment restrictions. It also reviewed the fund's absolute investment performance for each class, as well as the fund's relative investment performance for each class measured over multiple periods against (i) a broad-based securities market index, and (ii) a custom peer group of mutual funds deemed appropriate by Fidelity and reviewed by the Board. The following charts considered by the Board show, over the one-, three-, and five-year periods ended December 31, 2010, the cumulative total returns of Institutional Class (Class I) and Class B of the fund, the cumulative total returns of a broad-based securities market index ("benchmark"), and a range of cumulative total returns of a custom peer group of mutual funds defined by FMR based on categories assigned by Morningstar, Inc. The returns of Institutional Class (Class I) and Class B show the performance of the highest and lowest performing classes, respectively (based on five-year performance). The box within each chart shows the 25th percentile return (bottom of box) and the 75th percentile return (top of box) of the peer group. Returns shown above the box are in the first quartile and returns shown below the box are in the fourth quartile. The percentage beaten numbers noted below each chart correspond to the percentile box and represent the percentage of funds in the peer group whose performance was equal to or lower than that of the class indicated. The fund's custom peer group, defined by FMR, is a peer group that FMR believes provides a more meaningful performance comparison than the peer group assigned by Morningstar, Inc., which assigns mutual funds to categories based on their investment styles as measured by their underlying portfolio holdings.
Annual Report
Fidelity Advisor International Capital Appreciation Fund

The Board reviewed the fund's relative investment performance against its peer group and noted that the performance of Institutional Class (Class I) of the fund was in the first quartile for the one- and three-year periods and the third quartile for the five-year period. The Board also noted that the investment performance of Institutional Class (Class I) of the fund compared favorably to its benchmark for the one- and three-year periods, although the fund's five-year cumulative total return was lower than its benchmark. The Board considered that the variations in performance among the fund's classes reflect the variations in class expenses, which result in lower performance for higher expense classes. The Board also reviewed the fund's performance since inception as well as performance in the current year.
The Board also considered that the fund's management fee is subject to upward or downward adjustment depending upon whether, and to what extent, the fund's investment performance for the performance period exceeds, or is exceeded by, the record (over the same period) of a Board-approved performance adjustment index. The Board noted that the performance adjustment provides FMR with a strong economic incentive to seek to achieve superior performance for the fund's shareholders and helps to more closely align the interests of FMR and the fund's shareholders.
Annual Report
Board Approval of Investment Advisory Contracts and
Management Fees - continued
Based on its review, the Board concluded that the nature, extent, and quality of services provided to the fund under the Advisory Contracts should benefit the fund's shareholders.
Competitiveness of Management Fee and Total Expense Ratio. The Board considered the fund's management fee and total expense ratio compared to "mapped groups" of competitive funds and classes. Fidelity creates "mapped groups" by combining similar Lipper investment objective categories that have comparable management fee characteristics. Combining Lipper investment objective categories aids the Board's management fee and total expense ratio comparisons by broadening the competitive group used for comparison and by reducing the number of universes to which various Fidelity funds are compared.
Management Fee. The Board considered two proprietary management fee comparisons for the 12-month periods shown in the chart below. The group of Lipper funds used by the Board for management fee comparisons is referred to below as the "Total Mapped Group." The Total Mapped Group comparison focuses on a fund's standing relative to the total universe of comparable funds available to investors in terms of gross management fees before expense reimbursements or caps, and without giving effect to the fund's performance adjustment. "TMG %" represents the percentage of funds in the Total Mapped Group that had management fees that were lower than the fund's. For example, a TMG % of 16% means that 84% of the funds in the Total Mapped Group had higher management fees than the fund. The "Asset-Size Peer Group" (ASPG) comparison focuses on a fund's standing relative to non-Fidelity funds similar in size to the fund within the Total Mapped Group. The ASPG represents at least 15% of the funds in the Total Mapped Group with comparable asset size and management fee characteristics, subject to a minimum of 50 funds (or all funds in the Total Mapped Group if fewer than 50). Additional information, such as the ASPG quartile in which the fund's management fee ranked and the impact of the fund's performance adjustment, is also included in the chart and considered by the Board.
Annual Report
Fidelity Advisor International Capital Appreciation Fund

The Board noted that the fund's management fee ranked below the median of its Total Mapped Group and below the median of its ASPG for 2010. The Board also noted the effect of the fund's negative performance adjustment on the fund's management fee ranking. The Board noted that the performance adjustment for each year represents calculations for performance periods that differ from the periods shown in the performance charts above.
Based on its review, the Board concluded that the fund's management fee is fair and reasonable in light of the services that the fund receives and the other factors considered.
Total Expense Ratio. In its review of each class's total expense ratio, the Board considered the fund's management fee as well as other fund or class expenses, as applicable, such as transfer agent fees, pricing and bookkeeping fees, fund-paid 12b-1 fees, and custodial, legal, and audit fees. The Board also noted the effects of any waivers and reimbursements on fees and expenses, as well as the impact of the fund's performance adjustment. As part of its review, the Board also considered the current and historical total expense ratios of each class of the fund compared to competitive fund median expenses. Each class of the fund is compared to those funds and classes in the Total Mapped Group (used by the Board for management fee comparisons) that have a similar sales load structure.
The Board noted that the total expense ratio of each of Class A and Class B ranked below its competitive median for 2010, the total expense ratio of Class C ranked equal to its competitive median for 2010, and the total expense ratio of each of Class T and Institutional Class ranked above its competitive median for 2010. The Board considered that various factors, including 12b-1 fees, positive or negative performance adjustments, and relatively higher other expenses in the case of small fund size, can affect total expense ratios. The Board noted that the total expense ratio of Class T was above the competitive median primarily because of higher 12b-1 fees on Class T. Class T has a higher 12b-1 fee, but a lower front-end sales charge, than traditionally priced front-end sales charge classes. The Board noted that the fund offers multiple classes, each of which has a different sales load and 12b-1 fee structure, and that the multiple structures are intended to offer a range of pricing options for the intermediary market. The Board also noted that the total expense ratios of the classes vary primarily by the level of their 12b-1 fees, although differences in transfer agent fees may also cause expenses to vary from class to class.
Annual Report
Board Approval of Investment Advisory Contracts and
Management Fees - continued
Fees Charged to Other Fidelity Clients. The Board also considered Fidelity fee structures and other information with respect to clients of FMR and its affiliates, such as other mutual funds advised or subadvised by FMR or its affiliates, pension plan clients, and other institutional clients. In March 2010, the Board created an ad hoc joint committee with the board of other Fidelity funds (the Committee) to review and compare Fidelity's institutional investment advisory business with its business of providing services to the Fidelity funds, including the differences in services provided, fees charged, and costs incurred, as well as competition in their respective marketplaces.
Based on its review of total expense ratios and fees charged to other Fidelity clients, the Board concluded that the total expense ratio of each class of the fund was reasonable, although in some cases above the median of the universe presented for comparison, in light of the services that the fund and its shareholders receive and the other factors considered, including the findings of the Committee.
Costs of the Services and Profitability. The Board considered the revenues earned and the expenses incurred by Fidelity in conducting the business of developing, marketing, distributing, managing, administering and servicing the fund and its shareholders. The Board also considered the level of Fidelity's profits in respect of all the Fidelity funds.
On an annual basis, FMR presents to the Board Fidelity's profitability for the fund. Fidelity calculates the profitability for each fund, as well as aggregate profitability for groups of Fidelity funds and all Fidelity funds, using a series of detailed revenue and cost allocation methodologies which originate with the books and records of Fidelity on which Fidelity's audited financial statements are based. The Audit Committee of the Board reviews any significant changes from the prior year's methodologies.
PricewaterhouseCoopers LLP (PwC), independent registered public accounting firm and auditor to Fidelity and certain Fidelity funds, has been engaged annually by the Board as part of the Board's assessment of Fidelity's profitability analysis. PwC's engagement includes the review and assessment of Fidelity's methodologies used in determining the revenues and expenses attributable to Fidelity's mutual fund business, and completion of agreed-upon procedures surrounding the mathematical accuracy of fund profitability and its conformity to allocation methodologies. After considering PwC's reports issued under the engagement and information provided by Fidelity, the Board concluded that while other allocation methods may also be reasonable, Fidelity's profitability methodologies are reasonable in all material respects.
Annual Report
The Board also reviewed Fidelity's non-fund businesses and fall-out benefits related to the mutual fund business as well as cases where Fidelity's affiliates may benefit from or be related to the fund's business.
The Board considered the costs of the services provided by and the profits realized by Fidelity in connection with the operation of the fund and was satisfied that the profitability was not excessive in the circumstances.
Economies of Scale. The Board considered whether there have been economies of scale in respect of the management of the Fidelity funds, whether the Fidelity funds (including the fund) have appropriately benefited from any such economies of scale, and whether there is potential for realization of any further economies of scale. The Board considered the extent to which the fund will benefit from economies of scale through increased services to the fund, through waivers or reimbursements, or through fee or expense reductions. The Board also noted that in 2009, it and the board of other Fidelity funds created an ad hoc committee (the Economies of Scale Committee) to analyze whether FMR attains economies of scale in respect of the management and servicing of the Fidelity funds, whether the Fidelity funds have appropriately benefited from such economies of scale, and whether there is potential for realization of any further economies of scale.
The Board recognized that the fund's management contract incorporates a "group fee" structure, which provides for lower group fee rates as total fund assets under FMR's management increase, and for higher group fee rates as total fund assets under FMR's management decrease. FMR calculates the group fee rates based on a tiered asset "breakpoint" schedule that varies based on asset class. The Board considered that the group fee is designed to deliver the benefits of economies of scale to fund shareholders when total Fidelity fund assets increase, even if assets of any particular fund are unchanged or have declined, because some portion of Fidelity's costs are attributable to services provided to all Fidelity funds, and all funds benefit if those costs can be allocated among more assets. The Board concluded that, given the group fee structure, fund shareholders will benefit from lower management fees as assets under FMR's management increase at the fund complex level, regardless of whether Fidelity achieves any such economies of scale.
Annual Report
Board Approval of Investment Advisory Contracts and
Management Fees - continued
The Board concluded, taking into account the analysis of the Economies of Scale Committee, that any potential economies of scale are being appropriately shared between fund shareholders and Fidelity.
Additional Information Requested by the Board. In order to develop fully the factual basis for consideration of the Fidelity funds' Advisory Contracts, the Board requested and received additional information on certain topics, including (i) fund performance trends, actions to be taken by FMR to improve certain funds' overall performance, and Fidelity's long-term strategies for certain funds; (ii) portfolio manager changes that have occurred during the past year and length of portfolio manager tenure for different categories of funds over time; (iii) Fidelity's compensation structure for portfolio managers and other key personnel and strategies for attracting and retaining non-investment personnel; (iv) the amount of the investment that each portfolio manager has made in the Fidelity fund(s) that he or she manages; (v) historical trends in Fidelity's realization of fall-out benefits; (vi) Fidelity's group fee structures and the rationale for the individual fee rates of certain funds; (vii) fund profitability methodology and the impact of certain factors on fund profitability results; (viii) trends regarding industry use of performance fee structures and Fidelity's compliance practices with respect to performance adjustment calculations; (ix) the fee structures in place for certain other Fidelity clients; and (x) explanations regarding the relative total expense ratios of certain funds and classes, total expense competitive trends, and actions that might be taken by FMR to reduce total expense ratios for certain funds and classes.
Based on its evaluation of all of the conclusions noted above, and after considering all factors it believed relevant, the Board ultimately concluded that the advisory fee structures are fair and reasonable, and that the fund's Advisory Contracts should be renewed.
Annual Report
Investment Adviser
Fidelity Management & Research Company
Boston, MA
Investment Sub-Advisers
FMR Co., Inc.
Fidelity Management & Research
(U.K.) Inc.
Fidelity Management & Research
(Hong Kong) Limited
Fidelity Management & Research
(Japan) Inc.
FIL Investment Advisors
FIL Investments (Japan) Limited
FIL Investment Advisors (UK) Limited
General Distributor
Fidelity Distributors Corporation
Boston, MA
Transfer and Service Agents
Fidelity Investments Institutional Operations Company, Inc.
Boston, MA
Fidelity Service Company, Inc.
Boston, MA
Custodian
Brown Brothers Harriman & Co.
Boston, MA
AICAPI-UANN-1211
1.784755.108
(Fidelity Investment logo)(registered trademark)
Fidelity Advisor®
Overseas
Fund - Class A, Class T, Class B and Class C
Annual Report
October 31, 2011
Contents
Chairman's Message | (Click Here) | The Chairman's message to shareholders. |
Performance | (Click Here) | How the fund has done over time. |
Management's Discussion of Fund Performance | (Click Here) | The Portfolio Manager's review of fund performance and strategy. |
Shareholder Expense Example | (Click Here) | An example of shareholder expenses. |
Investment Changes | (Click Here) | A summary of major shifts in the fund's investments over the past six months. |
Investments | (Click Here) | A complete list of the fund's investments with their market values. |
Financial Statements | (Click Here) | Statements of assets and liabilities, operations, and changes in net assets, as well as financial highlights. |
Notes | (Click Here) | Notes to the financial statements. |
Report of Independent Registered Public Accounting Firm | (Click Here) | |
Trustees and Officers | (Click Here) | |
Distributions | (Click Here) | |
Board Approval of Investment Advisory Contracts and Management Fees | (Click Here) | |
To view a fund's proxy voting guidelines and proxy voting record for the 12-month period ended June 30, visit http://www.fidelity.com/proxyvotingresults or visit the Securities and Exchange Commission's (SEC) web site at http://www.sec.gov. You may also call 1-877-208-0098 to request a free copy of the proxy voting guidelines.
Standard & Poor's, S&P and S&P 500 are registered service marks of The McGraw-Hill Companies, Inc. and have been licensed for use by Fidelity Distributors Corporation.
Other third party marks appearing herein are the property of their respective owners.
All other marks appearing herein are registered or unregistered trademarks or service marks of FMR LLC or an affiliated company.
Annual Report
This report and the financial statements contained herein are submitted for the general information of the shareholders of the fund. This report is not authorized for distribution to prospective investors in the fund unless preceded or accompanied by an effective prospectus.
A fund files its complete schedule of portfolio holdings with the SEC for the first and third quarters of each fiscal year on Form N-Q. Forms N-Q are available on the SEC's web site at http://www.sec.gov. A fund's Forms N-Q may be reviewed and copied at the SEC's Public Reference Room in Washington, DC. Information regarding the operation of the SEC's Public Reference Room may be obtained by calling 1-800-SEC-0330. For a complete list of a fund's portfolio holdings, view the most recent holdings listing, semiannual report, or annual report on Fidelity's web site at http://www.fidelity.com, http://www.advisor.fidelity.com, or http://www.401k.com, as applicable.
NOT FDIC INSURED • MAY LOSE VALUE • NO BANK GUARANTEE
Neither the fund nor Fidelity Distributors Corporation is a bank.
Annual Report
(photo_of_James_C_Curvey)
Dear Shareholder:
Global equity markets began the fourth quarter on a strong note, sharply reversing course in October amid strong corporate earnings, better-than-expected economic news and the promise of a resolution to the sovereign debt crisis in Europe. The mini rally followed a third quarter marked by a significant downturn in July and August, which heightened investor anxiety and set off a wave of volatility that hampered most major asset classes through the end of September. Financial markets are difficult to predict, of course, but you can help put the odds in your favor by following these time-tested investment principles.
One of the basic tenets is to invest according to your time horizon. For long-term investors, riding out the markets' inevitable ups and downs has proven much more effective than making decisions based on short-term developments. If your goal is approaching, you can also benefit from patience and restraint, rather than attempting to time the market. No matter your time horizon, missing only a few of the markets' best days can significantly diminish returns. Patience also affords the benefits of compounding - earning interest on additional income or reinvested dividends and capital gains. While staying the course doesn't eliminate risk, it can considerably lessen the negative impact of short-term downturns.
Asset allocation is another principle to manage risk. As you spread your portfolio among the asset classes, be sure to consider your time horizon, risk tolerance and investment objectives. Younger investors may be better served by emphasizing equities, which historically have been the best-performing asset class over time. Investors who are nearing a specific goal, such as retirement or sending a child to college, may choose to favor bonds and other investments that have tended to be more stable. Studies indicate that asset allocation is the single most important determinant of a portfolio's long-term success. After deciding on a suitable allocation strategy, make sure your portfolio is adequately diversified, with exposure to stocks of small-, mid- and large-cap companies in a range of sectors, for example. And today, more than ever, geographic diversification should be taken into account.
Lastly, investing a certain amount of money on a regular basis - a principle known as dollar-cost averaging - can help lower the average cost of your purchases, while also giving you the discipline to avoid selling weak performers just prior to an upswing, or chasing a hot performer just before a correction.
We invite you to learn more by visiting us on the Internet, dropping by one of our Investor Centers or calling us by phone. It is our privilege to provide the resources you need to choose investments that are right for you.
Sincerely,
(The acting chairman's signature appears here.)
James C. Curvey
Acting Chairman
Annual Report
Average annual total return reflects the change in the value of an investment, assuming reinvestment of the class' distributions from dividend income and capital gains (the profits earned upon the sale of securities that have grown in value, if any) and assuming a constant rate of performance each year. The $10,000 table and the fund's returns do not reflect the deduction of taxes that a shareholder would pay on fund distributions or the redemption of fund shares. During periods of reimbursement by Fidelity, a fund's total return will be greater than it would be had the reimbursement not occurred. How a fund did yesterday is no guarantee of how it will do tomorrow. Returns reflect the conversion of Class B shares to Class A shares after a maximum of seven years.
Average Annual Total Returns
Periods ended October 31, 2011 | Past 1
year | Past 5
years | Past 10
years |
Class A (incl. 5.75% sales charge) | -13.24% | -3.21% | 4.04% |
Class T (incl. 3.50% sales charge) | -11.38% | -2.92% | 4.12% |
Class B (incl. contingent deferred sales charge) A | -13.21% | -3.13% | 4.07% |
Class C (incl. contingent deferred sales charge) B | -9.58% | -2.79% | 3.86% |
A Class B shares' contingent deferred sales charges included in the past one year, past five year, and past ten year total return figures are 5%, 2% and 0%, respectively.
B Class C shares' contingent deferred sales charge included in the past one year, past five year, and past ten year total return figures are 1%, 0%, and 0%, respectively.
Annual Report
$10,000 Over 10 Years
Let's say hypothetically that $10,000 was invested in Fidelity Advisor® Overseas Fund - Class A on October 31, 2001, and the current 5.75% sales charge was paid. The chart shows how the value of your investment would have changed, and also shows how the MSCI® EAFE® (Europe, Australasia, Far East) Index performed over the same period.
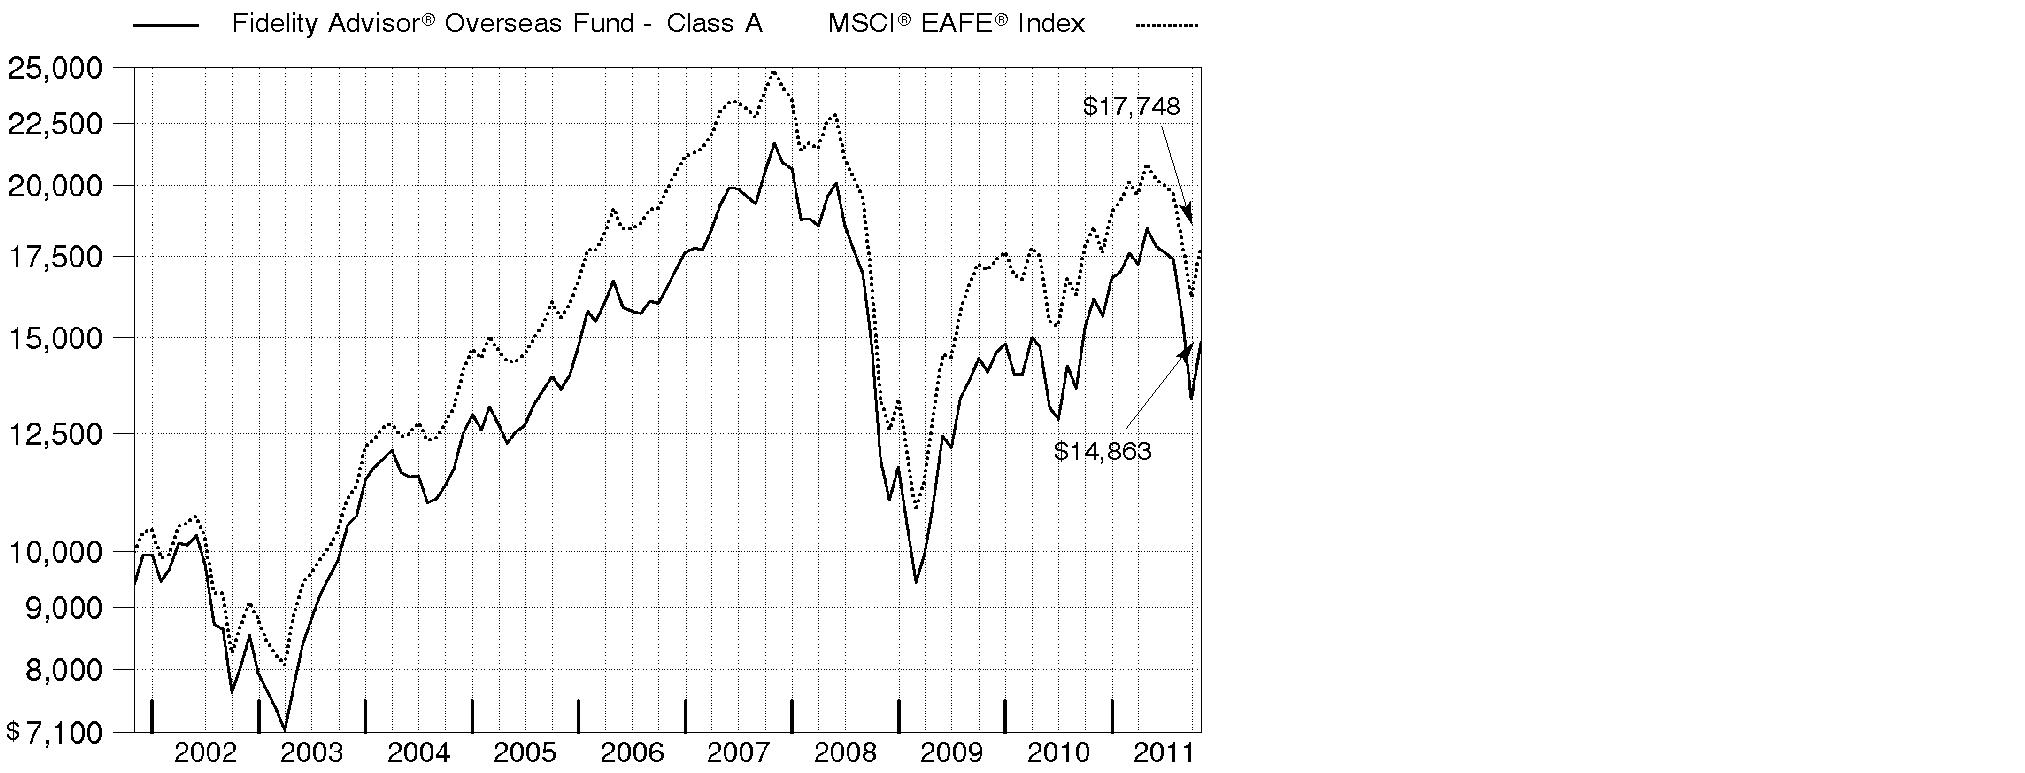
Annual Report
Market Recap: International equities were rocked by a number of headline events during the year ending October 31, 2011. Stocks posted a solid advance for the first half of the period, despite concern about the sovereign debt crisis in Europe, a devastating earthquake and tsunami in Japan, and political upheaval in the Middle East and North Africa. Sentiment turned decidedly negative in the second half, however, as fresh worries about Europe, inflation in China and a dimmed outlook for global growth caused foreign markets to suffer declines that intensified in August and September. October brought with it yet another dramatic swing, as eurozone policymakers appeared near a resolution to the debt debacle and buyers stormed back onto the scene in search of bargains. Still, those gains - along with favorable currency fluctuations overall - weren't enough to offset prior losses, and the MSCI® ACWI® (All Country World Index) ex USA Index finished the period down 4.56%. Within the MSCI index, Europe and emerging markets suffered the biggest declines, with many countries in these areas sustaining steep losses. By contrast, Japan showed resilience in the wake of its natural disasters, falling only 2%. Australia (+4%), Switzerland (+3%), the U.K. (+2%) and Canada, which produced a nominal return, were among the few major benchmark components to break into positive territory.
Comments from Graeme Rockett, Portfolio Manager of Fidelity Advisor® Overseas Fund: For the 12 months ending October 31, 2011, the fund's Class A, Class T, Class B and Class C shares dropped 7.95%, 8.17%, 8.67% and 8.67%, respectively (excluding sales charges), underperforming the MSCI® EAFE® (Europe, Australasia, Far East) Index, which declined 3.97%. Versus the index, positioning in consumer staples, materials and energy detracted, as did stock picking in financials, health care and industrials. Conversely, picks in consumer durables and apparel, an underweighting in utilities and an overweighting in information technology helped. In geographic terms, stock picking in the U.K., Hong Kong, Australia and emerging markets hurt, but security selection in Germany and the U.S. (an out-of-benchmark region) contributed. Specific stocks that detracted included Alstom, a French producer of power-generation, emission-control and rail-transport equipment, and two non-index Chinese companies: apparel manufacturer and retailer Bosideng International Holding (which I sold during the period) and Internet gaming company Perfect World, domiciled in Grand Cayman. Three out-of-benchmark stocks helped the most: U.S.-based footwear company Deckers Outdoor; German high-end men's apparel manufacturer Hugo Boss; and Silver Base Group Holdings, a Chinese distributor of alcoholic beverages.
The views expressed above reflect those of the portfolio manager(s) only through the end of the period as stated on the cover of this report and do not necessarily represent the views of Fidelity or any other person in the Fidelity organization. Any such views are subject to change at any time based upon market or other conditions and Fidelity disclaims any responsibility to update such views. These views may not be relied on as investment advice and, because investment decisions for a Fidelity fund are based on numerous factors, may not be relied on as an indication of trading intent on behalf of any Fidelity fund.
Annual Report
Shareholder Expense Example
As a shareholder of the Fund, you incur two types of costs: (1) transaction costs, including sales charges (loads) on purchase payments or redemption proceeds, redemption fees, and (2) ongoing costs, including management fees, distribution and/or service (12b-1) fees and other Fund expenses. This Example is intended to help you understand your ongoing costs (in dollars) of investing in the Fund and to compare these costs with the ongoing costs of investing in other mutual funds.
The Example is based on an investment of $1,000 invested at the beginning of the period and held for the entire period (May 1, 2011 to October 31, 2011).
Actual Expenses
The first line of the accompanying table for each class of the Fund provides information about actual account values and actual expenses. You may use the information in this line, together with the amount you invested, to estimate the expenses that you paid over the period. Simply divide your account value by $1,000.00 (for example, an $8,600 account value divided by $1,000.00 = 8.6), then multiply the result by the number in the first line for a class of the Fund under the heading entitled "Expenses Paid During Period" to estimate the expenses you paid on your account during this period. In addition, the Fund, as a shareholder in the underlying Fidelity Central Funds, will indirectly bear its pro-rata share of the fees and expenses incurred by the underlying Fidelity Central Funds. These fees and expenses are not included in the Fund's annualized expense ratio used to calculate the expense estimate in the table below.
Hypothetical Example for Comparison Purposes
The second line of the accompanying table for each class of the Fund provides information about hypothetical account values and hypothetical expenses based on a Class' actual expense ratio and an assumed rate of return of 5% per year before expenses, which is not the Class' actual return. The hypothetical account values and expenses may not be used to estimate the actual ending account balance or expenses you paid for the period. You may use this information to compare the ongoing costs of investing in the Fund and other funds. To do so, compare this 5% hypothetical example with the 5% hypothetical examples that appear in the shareholder reports of the other funds. In addition, the Fund, as a shareholder in the underlying Fidelity Central Funds, will indirectly bear its pro-rata share of the fees and expenses incurred by the underlying Fidelity Central Funds. These fees and expenses are not included in the Fund's annualized expense ratio used to calculate the expense estimate in the table below.
Please note that the expenses shown in the table are meant to highlight your ongoing costs only and do not reflect any transaction costs. Therefore, the second line of the table is useful in comparing ongoing costs only, and will not help you determine the relative total costs of owning different funds. In addition, if these transactional costs were included, your costs would have been higher.
Annual Report
| Annualized
Expense Ratio | Beginning
Account Value
May 1, 2011 | Ending
Account Value
October 31, 2011 | Expenses Paid
During Period*
May 1, 2011 to
October 31, 2011 |
Class A | 1.31% | | | |
Actual | | $ 1,000.00 | $ 805.70 | $ 5.96 |
HypotheticalA | | $ 1,000.00 | $ 1,018.60 | $ 6.67 |
Class T | 1.48% | | | |
Actual | | $ 1,000.00 | $ 804.50 | $ 6.73 |
HypotheticalA | | $ 1,000.00 | $ 1,017.74 | $ 7.53 |
Class B | 2.05% | | | |
Actual | | $ 1,000.00 | $ 802.30 | $ 9.31 |
HypotheticalA | | $ 1,000.00 | $ 1,014.87 | $ 10.41 |
Class C | 2.06% | | | |
Actual | | $ 1,000.00 | $ 802.20 | $ 9.36 |
HypotheticalA | | $ 1,000.00 | $ 1,014.82 | $ 10.46 |
Institutional Class | .96% | | | |
Actual | | $ 1,000.00 | $ 806.80 | $ 4.37 |
HypotheticalA | | $ 1,000.00 | $ 1,020.37 | $ 4.89 |
A 5% return per year before expenses
* Expenses are equal to each Class' annualized expense ratio, multiplied by the average account value over the period, multiplied by 184/365 (to reflect the one-half year period).
Annual Report
Investment Changes (Unaudited)
Top Five Stocks as of October 31, 2011 |
| % of fund's
net assets | % of fund's net assets
6 months ago |
HSBC Holdings PLC (United Kingdom, Commercial Banks) | 2.1 | 2.0 |
Novo Nordisk A/S Series B (Denmark, Pharmaceuticals) | 2.0 | 2.1 |
Volkswagen AG (Germany, Automobiles) | 2.0 | 2.0 |
Rakuten, Inc. (Japan, Internet & Catalog Retail) | 2.0 | 0.6 |
LVMH Moet Hennessy - Louis Vuitton (France, Textiles, Apparel & Luxury Goods) | 1.8 | 2.9 |
| 9.9 | |
Top Five Market Sectors as of October 31, 2011 |
| % of fund's
net assets | % of fund's net assets
6 months ago |
Consumer Discretionary | 23.5 | 25.6 |
Financials | 17.6 | 21.8 |
Materials | 12.1 | 11.0 |
Information Technology | 10.9 | 10.2 |
Industrials | 8.7 | 10.6 |
Top Five Countries as of October 31, 2011 |
(excluding cash equivalents) | % of fund's
net assets | % of fund's net assets
6 months ago |
United Kingdom | 18.5 | 17.6 |
Japan | 15.6 | 14.6 |
France | 12.6 | 11.7 |
Germany | 11.6 | 13.7 |
Switzerland | 7.6 | 6.1 |
Percentages are adjusted for the effect of open futures contracts, if applicable. |
Asset Allocation (% of fund's net assets) |
As of October 31, 2011 | As of April 30, 2011 |
| Stocks 98.1% | | | Stocks 99.9% | |
| Short-Term
Investments and
Net Other Assets 1.9% | | | Short-Term
Investments and
Net Other Assets 0.1% | |

Annual Report
Investments October 31, 2011
Showing Percentage of Net Assets
Common Stocks - 96.1% |
| Shares | | Value (000s) |
Australia - 2.8% |
BHP Billiton Ltd. | 211,768 | | $ 8,290 |
Fortescue Metals Group Ltd. | 208,017 | | 1,045 |
Macquarie Group Ltd. | 82,615 | | 2,127 |
Newcrest Mining Ltd. | 172,572 | | 6,100 |
Westfield Group unit | 344,639 | | 2,775 |
TOTAL AUSTRALIA | | 20,337 |
Bailiwick of Jersey - 0.4% |
WPP PLC | 310,041 | | 3,210 |
Belgium - 0.3% |
Ageas | 410,900 | | 830 |
Hamon & Compagnie International SA | 60,300 | | 1,520 |
TOTAL BELGIUM | | 2,350 |
Bermuda - 1.3% |
Clear Media Ltd. (a) | 1,278,000 | | 487 |
Huabao International Holdings Ltd. | 2,087,000 | | 1,326 |
Li & Fung Ltd. | 392,000 | | 755 |
Oriental Watch Holdings Ltd. | 6,012,000 | | 3,469 |
Signet Jewelers Ltd. | 82,600 | | 3,561 |
TOTAL BERMUDA | | 9,598 |
Brazil - 0.1% |
Drogasil SA | 47,700 | | 300 |
Marisa Lojas SA | 36,200 | | 500 |
TOTAL BRAZIL | | 800 |
British Virgin Islands - 0.4% |
Gem Diamonds Ltd. (a) | 261,700 | | 934 |
Mail.ru Group Ltd.: | | | |
GDR (a)(e) | 4,200 | | 145 |
GDR (Reg. S) | 63,100 | | 2,174 |
TOTAL BRITISH VIRGIN ISLANDS | | 3,253 |
Canada - 1.6% |
Barrick Gold Corp. | 31,100 | | 1,535 |
Kinross Gold Corp. | 103,200 | | 1,471 |
Potash Corp. of Saskatchewan, Inc. | 89,900 | | 4,255 |
Suncor Energy, Inc. | 102,800 | | 3,274 |
Yamana Gold, Inc. | 97,300 | | 1,452 |
TOTAL CANADA | | 11,987 |
Common Stocks - continued |
| Shares | | Value (000s) |
Cayman Islands - 4.3% |
Biostime International Holdings Ltd. | 59,500 | | $ 106 |
E-Commerce China Dangdang, Inc. ADR (d) | 38,000 | | 265 |
Hengdeli Holdings Ltd. | 25,890,000 | | 11,607 |
Home Inns & Hotels Management, Inc. sponsored ADR (a) | 32,200 | | 1,100 |
Natural Beauty Bio-Technology Ltd. | 6,200,000 | | 943 |
Noah Holdings Ltd. sponsored ADR (d) | 69,800 | | 609 |
Perfect World Co. Ltd. sponsored ADR Class B (a) | 280,900 | | 3,655 |
Renren, Inc. ADR (d) | 15,000 | | 106 |
Shenguan Holdings Group Ltd. | 2,022,000 | | 1,086 |
Silver Base Group Holdings Ltd. | 3,662,000 | | 3,900 |
Tencent Holdings Ltd. | 358,300 | | 8,287 |
TOTAL CAYMAN ISLANDS | | 31,664 |
China - 0.4% |
Baidu.com, Inc. sponsored ADR (a) | 22,300 | | 3,126 |
Denmark - 2.4% |
Carlsberg A/S Series B | 24,900 | | 1,695 |
Danske Bank A/S (a) | 51,111 | | 708 |
Novo Nordisk A/S: | | | |
Series B | 19,863 | | 2,109 |
Series B sponsored ADR | 120,700 | | 12,830 |
TOTAL DENMARK | | 17,342 |
France - 12.6% |
Accor SA | 93,900 | | 3,087 |
Alstom SA | 345,231 | | 12,947 |
Atos Origin SA | 37,421 | | 1,814 |
AXA SA | 46,658 | | 760 |
AXA SA sponsored ADR | 89,200 | | 1,441 |
BNP Paribas SA | 82,622 | | 3,756 |
Club Mediterranee SA (a) | 53,000 | | 1,006 |
Compagnie Generale de Geophysique SA (a) | 96,000 | | 2,098 |
Credit Agricole SA (d) | 74,474 | | 585 |
Danone | 128,222 | | 8,926 |
Gameloft (a) | 201,700 | | 1,125 |
GDF Suez | 94,700 | | 2,689 |
Iliad SA | 18,000 | | 2,107 |
Ingenico SA | 60,657 | | 2,401 |
Ipsos SA | 63,360 | | 2,081 |
Lafarge SA (Bearer) | 44,500 | | 1,815 |
Laurent-Perrier Group | 3,300 | | 340 |
LVMH Moet Hennessy - Louis Vuitton | 81,400 | | 13,546 |
Common Stocks - continued |
| Shares | | Value (000s) |
France - continued |
Pernod-Ricard SA | 64,800 | | $ 6,053 |
PPR SA | 7,200 | | 1,125 |
Safran SA | 86,100 | | 2,820 |
Sanofi-aventis | 34,620 | | 2,477 |
Sanofi-aventis sponsored ADR | 233,600 | | 8,351 |
Societe Generale Series A | 52,613 | | 1,536 |
Total SA | 94,200 | | 4,916 |
Total SA sponsored ADR | 19,400 | | 1,015 |
Vivendi | 65,063 | | 1,463 |
TOTAL FRANCE | | 92,280 |
Germany - 9.6% |
adidas AG | 123,900 | | 8,772 |
Allianz AG | 46,552 | | 5,232 |
Bayer AG | 58,540 | | 3,751 |
Bayerische Motoren Werke AG (BMW) | 25,448 | | 2,080 |
Commerzbank AG (a) | 235,000 | | 580 |
Deutsche Bank AG | 72,900 | | 3,015 |
Deutsche Boerse AG | 62,469 | | 3,458 |
Deutsche Post AG | 145,871 | | 2,223 |
E.ON AG | 124,333 | | 3,013 |
HeidelbergCement AG | 72,400 | | 3,304 |
Hugo Boss AG | 44,400 | | 3,885 |
K&S AG | 23,400 | | 1,489 |
Kabel Deutschland Holding AG (a) | 61,600 | | 3,517 |
Linde AG | 13,429 | | 2,136 |
Munich Re Group | 13,555 | | 1,828 |
Puma AG | 25,923 | | 8,359 |
SAP AG | 122,957 | | 7,436 |
SAP AG sponsored ADR (d) | 96,600 | | 5,831 |
Tom Tailor Holding AG (a) | 33,100 | | 517 |
TOTAL GERMANY | | 70,426 |
Greece - 0.2% |
Folli Follie Group (a) | 137,123 | | 1,653 |
Hong Kong - 1.3% |
AIA Group Ltd. | 780,200 | | 2,386 |
China Unicom (Hong Kong) Ltd. sponsored ADR (d) | 116,500 | | 2,343 |
Henderson Land Development Co. Ltd. | 222,334 | | 1,215 |
Hutchison Whampoa Ltd. | 138,000 | | 1,262 |
Television Broadcasts Ltd. | 454,000 | | 2,616 |
TOTAL HONG KONG | | 9,822 |
Common Stocks - continued |
| Shares | | Value (000s) |
Ireland - 3.3% |
CRH PLC | 712,498 | | $ 12,863 |
Kingspan Group PLC (United Kingdom) | 671,700 | | 6,024 |
Paddy Power PLC (Ireland) | 102,800 | | 5,691 |
TOTAL IRELAND | | 24,578 |
Israel - 0.1% |
Israel Chemicals Ltd. | 64,100 | | 771 |
Italy - 3.3% |
Assicurazioni Generali SpA | 97,900 | | 1,765 |
ENI SpA | 65,900 | | 1,457 |
ENI SpA sponsored ADR (d) | 22,300 | | 982 |
Intesa Sanpaolo SpA | 888,801 | | 1,588 |
Saipem SpA | 298,214 | | 13,371 |
Sorin SpA (a) | 1,916,000 | | 4,012 |
UniCredit SpA | 832,294 | | 977 |
TOTAL ITALY | | 24,152 |
Japan - 15.6% |
Aozora Bank Ltd. | 918,000 | | 2,321 |
Calbee, Inc. | 26,800 | | 1,222 |
Canon, Inc. | 90,500 | | 4,109 |
CyberAgent, Inc. (d) | 371 | | 1,251 |
Dai-ichi Mutual Life Insurance Co. | 1,169 | | 1,331 |
DeNA Co. Ltd. | 37,700 | | 1,627 |
Denso Corp. | 53,900 | | 1,658 |
eAccess Ltd. (d) | 2,580 | | 697 |
Fanuc Corp. | 15,200 | | 2,458 |
Fuji Media Holdings, Inc. | 1,029 | | 1,472 |
GREE, Inc. | 53,600 | | 1,730 |
Honda Motor Co. Ltd. | 133,300 | | 3,987 |
Japan Tobacco, Inc. | 350 | | 1,750 |
JFE Holdings, Inc. | 72,700 | | 1,384 |
Kakaku.com, Inc. | 50,400 | | 1,996 |
KDDI Corp. | 1,175 | | 8,608 |
Keyence Corp. | 14,000 | | 3,559 |
Mazda Motor Corp. (a) | 667,000 | | 1,402 |
Mitsubishi Corp. | 271,700 | | 5,589 |
Mitsubishi Estate Co. Ltd. | 89,000 | | 1,508 |
Mitsubishi UFJ Financial Group, Inc. | 1,320,700 | | 5,740 |
Mitsubishi UFJ Financial Group, Inc. sponsored ADR (d) | 233,500 | | 1,011 |
Mitsui & Co. Ltd. | 377,600 | | 5,512 |
MS&AD Insurance Group Holdings, Inc. | 79,900 | | 1,565 |
Common Stocks - continued |
| Shares | | Value (000s) |
Japan - continued |
Murata Manufacturing Co. Ltd. | 12,900 | | $ 721 |
NKSJ Holdings, Inc. | 69,000 | | 1,380 |
Nomura Holdings, Inc. | 301,900 | | 1,150 |
ORIX Corp. | 36,650 | | 3,199 |
Rakuten, Inc. | 13,264 | | 14,542 |
SOFTBANK CORP. | 159,700 | | 5,184 |
Sony Corp. | 37,500 | | 782 |
Start Today Co. Ltd. | 175,700 | | 3,717 |
Sumitomo Mitsui Financial Group, Inc. | 149,600 | | 4,182 |
Tokio Marine Holdings, Inc. | 71,800 | | 1,712 |
Tokyo Electron Ltd. | 18,900 | | 1,005 |
Toshiba Corp. | 694,000 | | 3,027 |
Toyota Motor Corp. | 232,000 | | 7,704 |
Toyota Motor Corp. sponsored ADR | 17,600 | | 1,174 |
Yahoo! Japan Corp. | 5,164 | | 1,659 |
TOTAL JAPAN | | 114,625 |
Korea (South) - 0.5% |
Samsung Electronics Co. Ltd. | 4,015 | | 3,443 |
Luxembourg - 0.3% |
ArcelorMittal SA Class A unit (d) | 66,500 | | 1,379 |
L'Occitane Ltd. (a) | 519,500 | | 1,145 |
TOTAL LUXEMBOURG | | 2,524 |
Netherlands - 1.7% |
AEGON NV (a) | 212,400 | | 1,013 |
ASML Holding NV | 31,300 | | 1,312 |
Gemalto NV | 23,756 | | 1,084 |
ING Groep NV: | | | |
(Certificaten Van Aandelen) (a) | 239,010 | | 2,061 |
sponsored ADR (a) | 79,100 | | 683 |
Koninklijke Philips Electronics NV | 202,806 | | 4,222 |
Koninklijke Philips Electronics NV (depositary receipt) (NY Reg.) | 98,500 | | 2,054 |
TOTAL NETHERLANDS | | 12,429 |
Norway - 1.0% |
Aker Solutions ASA | 236,700 | | 2,753 |
DnB NOR ASA | 176,400 | | 2,058 |
StatoilHydro ASA | 12,300 | | 312 |
StatoilHydro ASA sponsored ADR (d) | 71,500 | | 1,818 |
TOTAL NORWAY | | 6,941 |
Common Stocks - continued |
| Shares | | Value (000s) |
Singapore - 0.2% |
United Overseas Bank Ltd. | 125,627 | | $ 1,703 |
South Africa - 0.2% |
Impala Platinum Holdings Ltd. | 48,200 | | 1,114 |
Spain - 2.3% |
Banco Bilbao Vizcaya Argentaria SA (d) | 354,547 | | 3,191 |
Banco Santander SA: | | | |
rights 10/31/11 | 659,888 | | 114 |
(Spain) | 659,888 | | 5,586 |
(Spain) sponsored ADR (d) | 17,600 | | 151 |
EDP Renovaveis SA (a) | 451,605 | | 2,712 |
Iberdrola SA | 232,500 | | 1,692 |
NH Hoteles SA (a) | 235,800 | | 1,160 |
Telefonica SA (d) | 102,662 | | 2,182 |
TOTAL SPAIN | | 16,788 |
Sweden - 0.8% |
Nordea Bank AB | 218,400 | | 1,998 |
Swedbank AB (A Shares) | 59,512 | | 838 |
Swedish Match Co. | 85,800 | | 2,969 |
TOTAL SWEDEN | | 5,805 |
Switzerland - 7.6% |
Adecco SA (Reg.) | 180,028 | | 8,700 |
Compagnie Financiere Richemont SA Series A | 196,788 | | 11,268 |
Credit Suisse Group | 50,181 | | 1,448 |
Credit Suisse Group sponsored ADR (d) | 37,100 | | 1,075 |
Julius Baer Group Ltd. | 42,050 | | 1,598 |
Roche Holding AG (participation certificate) | 40,853 | | 6,736 |
Sika AG (Bearer) | 1,180 | | 2,322 |
Swiss Re Ltd. | 27,990 | | 1,538 |
Syngenta AG (Switzerland) | 16,950 | | 5,166 |
The Swatch Group AG (Bearer) | 19,640 | | 8,317 |
Transocean Ltd. (United States) | 36,600 | | 2,092 |
UBS AG (a) | 207,798 | | 2,627 |
UBS AG (NY Shares) (a) | 68,377 | | 863 |
Zurich Financial Services AG | 8,097 | | 1,880 |
TOTAL SWITZERLAND | | 55,630 |
Common Stocks - continued |
| Shares | | Value (000s) |
Taiwan - 0.7% |
Catcher Technology Co. Ltd. | 112,000 | | $ 624 |
HTC Corp. | 205,920 | | 4,628 |
TOTAL TAIWAN | | 5,252 |
United Kingdom - 18.5% |
Anglo American PLC: | | | |
ADR | 89,346 | | 1,639 |
(United Kingdom) | 118,359 | | 4,366 |
ARM Holdings PLC | 135,900 | | 1,275 |
Aviva PLC | 334,000 | | 1,822 |
Barclays PLC | 1,334,884 | | 4,139 |
Barclays PLC sponsored ADR | 243,800 | | 3,050 |
BG Group PLC | 424,518 | | 9,261 |
BHP Billiton PLC | 192,986 | | 6,078 |
BP PLC sponsored ADR | 176,266 | | 7,787 |
Diageo PLC | 291,229 | | 6,028 |
Dunelm Group PLC | 126,400 | | 1,012 |
Hays PLC | 1,126,800 | | 1,435 |
HSBC Holdings PLC: | | | |
(United Kingdom) | 95,104 | | 830 |
sponsored ADR | 333,633 | | 14,566 |
Imperial Tobacco Group PLC | 274,076 | | 10,023 |
Intertek Group PLC | 85,300 | | 2,819 |
Johnson Matthey PLC | 58,354 | | 1,763 |
Legal & General Group PLC | 813,369 | | 1,445 |
Lloyds Banking Group PLC (a) | 4,767,999 | | 2,466 |
Lloyds Banking Group PLC sponsored ADR (a)(d) | 214,200 | | 441 |
M&C Saatchi | 887,505 | | 1,698 |
Man Group PLC | 825,945 | | 1,991 |
Prudential PLC | 125,264 | | 1,294 |
Reckitt Benckiser Group PLC | 133,000 | | 6,840 |
Rio Tinto PLC | 125,232 | | 6,776 |
Rio Tinto PLC sponsored ADR | 55,800 | | 3,017 |
Rolls-Royce Group PLC | 162,800 | | 1,839 |
Rolls-Royce Group PLC Class C | 11,233,200 | | 18 |
Royal Bank of Scotland Group PLC (a) | 1,512,600 | | 584 |
Royal Dutch Shell PLC Class B | 154,486 | | 5,544 |
Standard Chartered PLC (United Kingdom) | 131,807 | | 3,093 |
Sthree PLC | 190,600 | | 874 |
Tesco PLC | 116,900 | | 755 |
Vodafone Group PLC | 2,742,369 | | 7,616 |
Vodafone Group PLC sponsored ADR | 13,500 | | 376 |
Common Stocks - continued |
| Shares | | Value (000s) |
United Kingdom - continued |
William Hill PLC | 1,723,600 | | $ 5,987 |
Xstrata PLC | 317,400 | | 5,337 |
TOTAL UNITED KINGDOM | | 135,884 |
United States of America - 2.3% |
Apple, Inc. (a) | 15,600 | | 6,315 |
Deckers Outdoor Corp. (a) | 47,300 | | 5,451 |
Google, Inc. Class A (a) | 8,800 | | 5,215 |
TOTAL UNITED STATES OF AMERICA | | 16,981 |
TOTAL COMMON STOCKS (Cost $734,788) | 706,468 |
Nonconvertible Preferred Stocks - 2.0% |
| | | |
Germany - 2.0% |
Volkswagen AG
(Cost $11,213) | 84,600 | | 14,850 |
Money Market Funds - 1.9% |
| | | |
Fidelity Cash Central Fund, 0.12% (b) | 703,907 | | 704 |
Fidelity Securities Lending Cash Central Fund, 0.11% (b)(c) | 13,432,705 | | 13,433 |
TOTAL MONEY MARKET FUNDS (Cost $14,137) | 14,137 |
TOTAL INVESTMENT PORTFOLIO - 100.0% (Cost $760,138) | | 735,455 |
NET OTHER ASSETS (LIABILITIES) - 0.0% | | 190 |
NET ASSETS - 100% | $ 735,645 |
Legend |
(a) Non-income producing |
(b) Affiliated fund that is available only to investment companies and other accounts managed by Fidelity Investments. The rate quoted is the annualized seven-day yield of the fund at period end. A complete unaudited listing of the fund's holdings as of its most recent quarter end is available upon request. In addition, each Fidelity Central Fund's financial statements, which are not covered by the Fund's Report of Independent Registered Public Accounting Firm, are available on the SEC's website or upon request. |
(c) Investment made with cash collateral received from securities on loan. |
(d) Security or a portion of the security is on loan at period end. |
(e) Security exempt from registration under Rule 144A of the Securities Act of 1933. These securities may be resold in transactions exempt from registration, normally to qualified institutional buyers. At the end of the period, the value of these securities amounted to $145,000 or 0.0% of net assets. |
Affiliated Central Funds |
Information regarding fiscal year to date income earned by the Fund from investments in Fidelity Central Funds is as follows: |
Fund | Income earned
(Amounts in thousands) |
Fidelity Cash Central Fund | $ 10 |
Fidelity Securities Lending Cash Central Fund | 848 |
Total | $ 858 |
Other Information |
The following is a summary of the inputs used, as of October 31, 2011, involving the Fund's assets and liabilities carried at fair value. The inputs or methodology used for valuing securities may not be an indication of the risk associated with investing in those securities. For more information on valuation inputs, and their aggregation into the levels used in the table below, please refer to the Security Valuation section in the accompanying Notes to Financial Statements. |
Valuation Inputs at Reporting Date: |
Description
(Amounts in thousands) | Total | Level 1 | Level 2 | Level 3 |
Investments in Securities: | | | | |
Equities: | | | | |
United Kingdom | $ 135,884 | $ 91,432 | $ 44,452 | $ - |
Japan | 114,625 | 2,185 | 112,440 | - |
France | 92,280 | 82,789 | 9,491 | - |
Germany | 85,276 | 74,825 | 10,451 | - |
Switzerland | 55,630 | 46,389 | 9,241 | - |
Cayman Islands | 31,664 | 5,735 | 25,929 | - |
Ireland | 24,578 | 11,715 | 12,863 | - |
Italy | 24,152 | 22,695 | 1,457 | - |
Australia | 20,337 | - | 20,337 | - |
Other | 136,892 | 87,947 | 48,945 | - |
Money Market Funds | 14,137 | 14,137 | - | - |
Total Investments in Securities: | $ 735,455 | $ 439,849 | $ 295,606 | $ - |
Income Tax Information |
At October 31, 2011, the Fund had a capital loss carryforward of approximately $104,924,000 which will expire in fiscal 2017. Capital loss carryforwards are only available to offset future capital gains of the Fund to the extent provided by regulations and may be limited. |
See accompanying notes which are an integral part of the financial statements.
Annual Report
Statement of Assets and Liabilities
Amounts in thousands (except per-share amounts) | October 31, 2011 |
Assets | | |
Investment in securities, at value (including securities loaned of $12,495) - See accompanying schedule: Unaffiliated issuers (cost $746,001) | $ 721,318 | |
Fidelity Central Funds (cost $14,137) | 14,137 | |
Total Investments (cost $760,138) | | $ 735,455 |
Foreign currency held at value (cost $11) | | 11 |
Receivable for investments sold | | 18,456 |
Receivable for fund shares sold | | 219 |
Dividends receivable | | 2,107 |
Distributions receivable from Fidelity Central Funds | | 13 |
Prepaid expenses | | 3 |
Other receivables | | 153 |
Total assets | | 756,417 |
| | |
Liabilities | | |
Payable for investments purchased | $ 5,239 | |
Payable for fund shares redeemed | 1,376 | |
Accrued management fee | 311 | |
Distribution and service plan fees payable | 153 | |
Other affiliated payables | 172 | |
Other payables and accrued expenses | 88 | |
Collateral on securities loaned, at value | 13,433 | |
Total liabilities | | 20,772 |
| | |
Net Assets | | $ 735,645 |
Net Assets consist of: | | |
Paid in capital | | $ 871,136 |
Undistributed net investment income | | 9,657 |
Accumulated undistributed net realized gain (loss) on investments and foreign currency transactions | | (120,523) |
Net unrealized appreciation (depreciation) on investments and assets and liabilities in foreign currencies | | (24,625) |
Net Assets | | $ 735,645 |
See accompanying notes which are an integral part of the financial statements.
Annual Report
Financial Statements - continued
Statement of Assets and Liabilities - continued
Amounts in thousands (except per-share amounts) | October 31, 2011 |
| | |
Calculation of Maximum Offering Price Class A:
Net Asset Value and redemption price per share ($59,654 ÷ 3,698.9 shares) | | $ 16.13 |
| | |
Maximum offering price per share (100/94.25 of $16.13) | | $ 17.11 |
Class T:
Net Asset Value and redemption price per share ($304,508 ÷ 18,452.5 shares) | | $ 16.50 |
| | |
Maximum offering price per share (100/96.50 of $16.50) | | $ 17.10 |
Class B:
Net Asset Value and offering price per share ($4,166 ÷ 267.4 shares)A | | $ 15.58 |
| | |
Class C:
Net Asset Value and offering price per share ($18,757 ÷ 1,188.3 shares)A | | $ 15.78 |
| | |
Institutional Class:
Net Asset Value, offering price and redemption price per share ($348,560 ÷ 21,183.6 shares) | | $ 16.45 |
A Redemption price per share is equal to net asset value less any applicable contingent deferred sales charge.
See accompanying notes which are an integral part of the financial statements.
Annual Report
Statement of Operations
Amounts in thousands | Year ended October 31, 2011 |
Investment Income | | |
Dividends | | $ 23,661 |
Income from Fidelity Central Funds | | 858 |
Income before foreign taxes withheld | | 24,519 |
Less foreign taxes withheld | | (2,035) |
Total income | | 22,484 |
| | |
Expenses | | |
Management fee
Basic fee | $ 7,177 | |
Performance adjustment | (25) | |
Transfer agent fees | 2,245 | |
Distribution and service plan fees | 2,245 | |
Accounting and security lending fees | 481 | |
Custodian fees and expenses | 197 | |
Independent trustees' compensation | 6 | |
Registration fees | 70 | |
Audit | 82 | |
Legal | 5 | |
Interest | 1 | |
Miscellaneous | 11 | |
Total expenses before reductions | 12,495 | |
Expense reductions | (280) | 12,215 |
Net investment income (loss) | | 10,269 |
Realized and Unrealized Gain (Loss) Net realized gain (loss) on: | | |
Investment securities: | | |
Unaffiliated issuers | 139,396 | |
Foreign currency transactions | (314) | |
Total net realized gain (loss) | | 139,082 |
Change in net unrealized appreciation (depreciation) on: Investment securities | (202,738) | |
Assets and liabilities in foreign currencies | (49) | |
Total change in net unrealized appreciation (depreciation) | | (202,787) |
Net gain (loss) | | (63,705) |
Net increase (decrease) in net assets resulting from operations | | $ (53,436) |
See accompanying notes which are an integral part of the financial statements.
Annual Report
Financial Statements - continued
Statement of Changes in Net Assets
Amounts in thousands | Year ended
October 31,
2011 | Year ended
October 31,
2010 |
Increase (Decrease) in Net Assets | | |
Operations | | |
Net investment income (loss) | $ 10,269 | $ 14,198 |
Net realized gain (loss) | 139,082 | 73,737 |
Change in net unrealized appreciation (depreciation) | (202,787) | 72,077 |
Net increase (decrease) in net assets resulting
from operations | (53,436) | 160,012 |
Distributions to shareholders from net investment income | (12,982) | (17,905) |
Distributions to shareholders from net realized gain | (2,756) | (2,268) |
Total distributions | (15,738) | (20,173) |
Share transactions - net increase (decrease) | (342,819) | (188,997) |
Redemption fees | 20 | 22 |
Total increase (decrease) in net assets | (411,973) | (49,136) |
| | |
Net Assets | | |
Beginning of period | 1,147,618 | 1,196,754 |
End of period (including undistributed net investment income of $9,657 and undistributed net investment income of $12,989, respectively) | $ 735,645 | $ 1,147,618 |
See accompanying notes which are an integral part of the financial statements.
Annual Report
Financial Highlights - Class A
Years ended October 31, | 2011 | 2010 | 2009 | 2008 | 2007 |
Selected Per-Share Data | | | | | |
Net asset value, beginning of period | $ 17.77 | $ 15.68 | $ 13.56 | $ 26.85 | $ 21.67 |
Income from Investment Operations | | | | | |
Net investment income (loss) C | .16 | .17 | .24 | .38 | .31 |
Net realized and unrealized gain (loss) | (1.54) | 2.16 | 2.12 | (11.56) | 6.16 |
Total from investment operations | (1.38) | 2.33 | 2.36 | (11.18) | 6.47 |
Distributions from net investment income | (.21) | (.21) | (.24) | (.33) | (.23) |
Distributions from net realized gain | (.05) | (.03) | - | (1.78) | (1.06) |
Total distributions | (.26) | (.24) | (.24) | (2.11) | (1.29) |
Redemption fees added to paid in capital C, G | - | - | - | - | - |
Net asset value, end of period | $ 16.13 | $ 17.77 | $ 15.68 | $ 13.56 | $ 26.85 |
Total Return A, B | (7.95)% | 14.99% | 17.97% | (45.08)% | 31.44% |
Ratios to Average Net Assets D, F | | | | | |
Expenses before reductions | 1.34% | 1.36% | 1.36% | 1.35% | 1.17% |
Expenses net of fee waivers, if any | 1.34% | 1.36% | 1.36% | 1.35% | 1.17% |
Expenses net of all reductions | 1.32% | 1.33% | 1.33% | 1.32% | 1.13% |
Net investment income (loss) | .90% | 1.04% | 1.79% | 1.83% | 1.34% |
Supplemental Data | | | | | |
Net assets, end of period (in millions) | $ 60 | $ 70 | $ 72 | $ 73 | $ 147 |
Portfolio turnover rate E | 44% | 53% | 83% | 79% | 66% |
A Total returns would have been lower if certain expenses had not been reduced during the applicable periods shown.
B Total returns do not include the effect of the sales charges.
C Calculated based on average shares outstanding during the period.
D Fees and expenses of any underlying Fidelity Central Funds are not included in the Fund's expense ratio. The Fund indirectly bears its proportionate share of the expenses of any underlying Fidelity Central Funds.
E Amount does not include the portfolio activity of any underlying Fidelity Central Funds.
F Expense ratios reflect operating expenses of the class. Expenses before reductions do not reflect amounts reimbursed by the investment adviser or reductions from brokerage service arrangements or reductions from other expense offset arrangements and do not represent the amount paid by the class during periods when reimbursements or reductions occur. Expenses net of fee waivers reflect expenses after reimbursement by the investment adviser but prior to reductions from brokerage service arrangements or other expense offset arrangements. Expenses net of all reductions represent the net expenses paid by the class.
G Amount represents less than $.01 per share.
See accompanying notes which are an integral part of the financial statements.
Annual Report
Financial Highlights - Class T
Years ended October 31, | 2011 | 2010 | 2009 | 2008 | 2007 |
Selected Per-Share Data | | | | | |
Net asset value, beginning of period | $ 18.18 | $ 16.03 | $ 13.84 | $ 27.35 | $ 22.05 |
Income from Investment Operations | | | | | |
Net investment income (loss) C | .13 | .14 | .22 | .36 | .28 |
Net realized and unrealized gain (loss) | (1.59) | 2.23 | 2.17 | (11.82) | 6.27 |
Total from investment operations | (1.46) | 2.37 | 2.39 | (11.46) | 6.55 |
Distributions from net investment income | (.17) | (.19) | (.20) | (.27) | (.19) |
Distributions from net realized gain | (.05) | (.03) | - | (1.78) | (1.06) |
Total distributions | (.22) | (.22) | (.20) | (2.05) | (1.25) |
Redemption fees added to paid in capital C, G | - | - | - | - | - |
Net asset value, end of period | $ 16.50 | $ 18.18 | $ 16.03 | $ 13.84 | $ 27.35 |
Total Return A, B | (8.17)% | 14.88% | 17.70% | (45.18)% | 31.24% |
Ratios to Average Net Assets D, F | | | | | |
Expenses before reductions | 1.52% | 1.53% | 1.57% | 1.51% | 1.33% |
Expenses net of fee waivers, if any | 1.51% | 1.53% | 1.57% | 1.51% | 1.33% |
Expenses net of all reductions | 1.49% | 1.50% | 1.54% | 1.48% | 1.30% |
Net investment income (loss) | .73% | .86% | 1.58% | 1.67% | 1.17% |
Supplemental Data | | | | | |
Net assets, end of period (in millions) | $ 305 | $ 371 | $ 367 | $ 345 | $ 710 |
Portfolio turnover rate E | 44% | 53% | 83% | 79% | 66% |
A Total returns would have been lower if certain expenses had not been reduced during the applicable periods shown.
B Total returns do not include the effect of the sales charges.
C Calculated based on average shares outstanding during the period.
D Fees and expenses of any underlying Fidelity Central Funds are not included in the Fund's expense ratio. The Fund indirectly bears its proportionate share of the expenses of any underlying Fidelity Central Funds.
E Amount does not include the portfolio activity of any underlying Fidelity Central Funds.
F Expense ratios reflect operating expenses of the class. Expenses before reductions do not reflect amounts reimbursed by the investment adviser or reductions from brokerage service arrangements or reductions from other expense offset arrangements and do not represent the amount paid by the class during periods when reimbursements or reductions occur. Expenses net of fee waivers reflect expenses after reimbursement by the investment adviser but prior to reductions from brokerage service arrangements or other expense offset arrangements. Expenses net of all reductions represent the net expenses paid by the class.
G Amount represents less than $.01 per share.
See accompanying notes which are an integral part of the financial statements.
Annual Report
Financial Highlights - Class B
Years ended October 31, | 2011 | 2010 | 2009 | 2008 | 2007 |
Selected Per-Share Data | | | | | |
Net asset value, beginning of period | $ 17.18 | $ 15.16 | $ 13.02 | $ 25.79 | $ 20.81 |
Income from Investment Operations | | | | | |
Net investment income (loss) C | .03 | .04 | .13 | .22 | .12 |
Net realized and unrealized gain (loss) | (1.51) | 2.10 | 2.08 | (11.14) | 5.94 |
Total from investment operations | (1.48) | 2.14 | 2.21 | (10.92) | 6.06 |
Distributions from net investment income | (.08) | (.09) | (.07) | (.07) | (.02) |
Distributions from net realized gain | (.05) | (.03) | - | (1.78) | (1.06) |
Total distributions | (.12) H | (.12) | (.07) | (1.85) | (1.08) |
Redemption fees added to paid in capital C, G | - | - | - | - | - |
Net asset value, end of period | $ 15.58 | $ 17.18 | $ 15.16 | $ 13.02 | $ 25.79 |
Total Return A, B | (8.67)% | 14.15% | 17.09% | (45.50)% | 30.45% |
Ratios to Average Net Assets D, F | | | | | |
Expenses before reductions | 2.10% | 2.11% | 2.12% | 2.10% | 1.94% |
Expenses net of fee waivers, if any | 2.09% | 2.11% | 2.12% | 2.10% | 1.94% |
Expenses net of all reductions | 2.07% | 2.09% | 2.08% | 2.08% | 1.91% |
Net investment income (loss) | .15% | .28% | 1.04% | 1.07% | .56% |
Supplemental Data | | | | | |
Net assets, end of period (in millions) | $ 4 | $ 7 | $ 8 | $ 10 | $ 27 |
Portfolio turnover rate E | 44% | 53% | 83% | 79% | 66% |
A Total returns would have been lower if certain expenses had not been reduced during the applicable periods shown.
B Total returns do not include the effect of the contingent deferred sales charge.
C Calculated based on average shares outstanding during the period.
D Fees and expenses of any underlying Fidelity Central Funds are not included in the Fund's expense ratio. The Fund indirectly bears its proportionate share of the expenses of any underlying Fidelity Central Funds.
E Amount does not include the portfolio activity of any underlying Fidelity Central Funds.
F Expense ratios reflect operating expenses of the class. Expenses before reductions do not reflect amounts reimbursed by the investment adviser or reductions from brokerage service arrangements or reductions from other expense offset arrangements and do not represent the amount paid by the class during periods when reimbursements or reductions occur. Expenses net of fee waivers reflect expenses after reimbursement by the investment adviser but prior to reductions from brokerage service arrangements or other expense offset arrangements. Expenses net of all reductions represent the net expenses paid by the class.
G Amount represents less than $.01 per share.
H Total distributions of $.12 per share is comprised of distributions from net investment income of $.079 and distributions from net realized gain of $.045 per share.
See accompanying notes which are an integral part of the financial statements.
Annual Report
Financial Highlights - Class C
Years ended October 31, | 2011 | 2010 | 2009 | 2008 | 2007 |
Selected Per-Share Data | | | | | |
Net asset value, beginning of period | $ 17.39 | $ 15.36 | $ 13.22 | $ 26.22 | $ 21.19 |
Income from Investment Operations | | | | | |
Net investment income (loss) C | .03 | .05 | .14 | .22 | .14 |
Net realized and unrealized gain (loss) | (1.52) | 2.12 | 2.09 | (11.31) | 6.02 |
Total from investment operations | (1.49) | 2.17 | 2.23 | (11.09) | 6.16 |
Distributions from net investment income | (.07) | (.11) | (.09) | (.13) | (.07) |
Distributions from net realized gain | (.05) | (.03) | - | (1.78) | (1.06) |
Total distributions | (.12) | (.14) | (.09) | (1.91) | (1.13) |
Redemption fees added to paid in capital C, G | - | - | - | - | - |
Net asset value, end of period | $ 15.78 | $ 17.39 | $ 15.36 | $ 13.22 | $ 26.22 |
Total Return A, B | (8.67)% | 14.17% | 17.06% | (45.50)% | 30.48% |
Ratios to Average Net Assets D, F | | | | | |
Expenses before reductions | 2.09% | 2.10% | 2.11% | 2.09% | 1.91% |
Expenses net of fee waivers, if any | 2.09% | 2.10% | 2.11% | 2.09% | 1.91% |
Expenses net of all reductions | 2.07% | 2.08% | 2.08% | 2.07% | 1.87% |
Net investment income (loss) | .15% | .29% | 1.05% | 1.08% | .60% |
Supplemental Data | | | | | |
Net assets, end of period (in millions) | $ 19 | $ 22 | $ 23 | $ 22 | $ 46 |
Portfolio turnover rate E | 44% | 53% | 83% | 79% | 66% |
A Total returns would have been lower if certain expenses had not been reduced during the applicable periods shown.
B Total returns do not include the effect of the contingent deferred sales charge.
C Calculated based on average shares outstanding during the period.
D Fees and expenses of any underlying Fidelity Central Funds are not included in the Fund's expense ratio. The Fund indirectly bears its proportionate share of the expenses of any underlying Fidelity Central Funds.
E Amount does not include the portfolio activity of any underlying Fidelity Central Funds.
F Expense ratios reflect operating expenses of the class. Expenses before reductions do not reflect amounts reimbursed by the investment adviser or reductions from brokerage service arrangements or reductions from other expense offset arrangements and do not represent the amount paid by the class during periods when reimbursements or reductions occur. Expenses net of fee waivers reflect expenses after reimbursement by the investment adviser but prior to reductions from brokerage service arrangements or other expense offset arrangements. Expenses net of all reductions represent the net expenses paid by the class.
G Amount represents less than $.01 per share.
See accompanying notes which are an integral part of the financial statements.
Annual Report
Financial Highlights - Institutional Class
Years ended October 31, | 2011 | 2010 | 2009 | 2008 | 2007 |
Selected Per-Share Data | | | | | |
Net asset value, beginning of period | $ 18.10 | $ 15.95 | $ 13.83 | $ 27.35 | $ 22.06 |
Income from Investment Operations | | | | | |
Net investment income (loss) B | .23 | .22 | .29 | .45 | .40 |
Net realized and unrealized gain (loss) | (1.59) | 2.23 | 2.14 | (11.78) | 6.26 |
Total from investment operations | (1.36) | 2.45 | 2.43 | (11.33) | 6.66 |
Distributions from net investment income | (.24) | (.27) | (.31) | (.41) | (.31) |
Distributions from net realized gain | (.05) | (.03) | - | (1.78) | (1.06) |
Total distributions | (.29) | (.30) | (.31) | (2.19) | (1.37) |
Redemption fees added to paid in capital B, F | - | - | - | - | - |
Net asset value, end of period | $ 16.45 | $ 18.10 | $ 15.95 | $ 13.83 | $ 27.35 |
Total Return A | (7.70)% | 15.49% | 18.32% | (44.92)% | 31.88% |
Ratios to Average Net Assets C, E | | | | | |
Expenses before reductions | 1.00% | 1.01% | 1.06% | 1.01% | .84% |
Expenses net of fee waivers, if any | .99% | 1.01% | 1.06% | 1.01% | .84% |
Expenses net of all reductions | .97% | .98% | 1.02% | .98% | .81% |
Net investment income (loss) | 1.25% | 1.39% | 2.10% | 2.17% | 1.66% |
Supplemental Data | | | | | |
Net assets, end of period (in millions) | $ 349 | $ 678 | $ 727 | $ 551 | $ 609 |
Portfolio turnover rate D | 44% | 53% | 83% | 79% | 66% |
A Total returns would have been lower if certain expenses had not been reduced during the applicable periods shown.
B Calculated based on average shares outstanding during the period.
C Fees and expenses of any underlying Fidelity Central Funds are not included in the Fund's expense ratio. The Fund indirectly bears its proportionate share of the expenses of any underlying Fidelity Central Funds.
D Amount does not include the portfolio activity of any underlying Fidelity Central Funds.
E Expense ratios reflect operating expenses of the class. Expenses before reductions do not reflect amounts reimbursed by the investment adviser or reductions from brokerage service arrangements or reductions from other expense offset arrangements and do not represent the amount paid by the class during periods when reimbursements or reductions occur. Expenses net of fee waivers reflect expenses after reimbursement by the investment adviser but prior to reductions from brokerage service arrangements or other expense offset arrangements. Expenses net of all reductions represent the net expenses paid by the class.
F Amount represents less than $.01 per share.
See accompanying notes which are an integral part of the financial statements.
Annual Report
Notes to Financial Statements
For the period ended October 31, 2011
(Amounts in thousands except percentages)
1. Organization.
Fidelity Advisor Overseas Fund (the Fund) is a fund of Fidelity Advisor Series VIII (the Trust) and is authorized to issue an unlimited number of shares. The Trust is registered under the Investment Company Act of 1940, as amended (the 1940 Act), as an open-end management investment company organized as a Massachusetts business trust. The Fund offers Class A, Class T, Class C, and Institutional Class shares, each of which, along with Class B shares, has equal rights as to assets and voting privileges. Effective after the close of business on September 1, 2010, Class B shares were closed to new accounts and additional purchases, except for exchanges and reinvestments by existing shareholders. Each class has exclusive voting rights with respect to matters that affect that class. Class B shares will automatically convert to Class A shares after a holding period of seven years from the initial date of purchase. Investment income, realized and unrealized capital gains and losses, the common expenses of the Fund, and certain fund-level expense reductions, if any, are allocated on a pro-rata basis to each class based on the relative net assets of each class to the total net assets of the Fund. Each class differs with respect to transfer agent and distribution and service plan fees incurred. Certain expense reductions may also differ by class. The Fund's investments in emerging markets can be subject to social, economic, regulatory, and political uncertainties and can be extremely volatile.
2. Investments in Fidelity Central Funds.
The Fund invests in Fidelity Central Funds, which are open-end investment companies available only to other investment companies and accounts managed by Fidelity Management & Research Company (FMR) and its affiliates. The Fund's Schedule of Investments lists each of the Fidelity Central Funds held as of period end, if any, as an investment of the Fund, but does not include the underlying holdings of each Fidelity Central Fund. As an Investing Fund, the Fund indirectly bears its proportionate share of the expenses of the underlying Fidelity Central Funds.
The Money Market Central Funds seek preservation of capital and current income and are managed by Fidelity Investments Money Management, Inc. (FIMM), an affiliate of FMR.
A complete unaudited list of holdings for each Fidelity Central Fund is available upon request or at the Securities and Exchange Commission (the SEC) web site at www.sec.gov. In addition, the financial statements of the Fidelity Central Funds, which are not covered by the Fund's Report of Independent Registered Public Accounting Firm are available on the SEC web site or upon request.
Annual Report
3. Significant Accounting Policies.
The financial statements have been prepared in conformity with accounting principles generally accepted in the United States of America (GAAP), which require management to make certain estimates and assumptions at the date of the financial statements. Actual results could differ from those estimates. Subsequent events, if any, through the date that the financial statements were issued have been evaluated in the preparation of the financial statements. The following summarizes the significant accounting policies of the Fund:
Security Valuation. Investments are valued as of 4:00 p.m. Eastern time on the last calendar day of the period. The Fund uses independent pricing services approved by the Board of Trustees to value its investments. When current market prices or quotations are not readily available or reliable, valuations may be determined in good faith in accordance with procedures adopted by the Board of Trustees. Factors used in determining value may include market or security specific events. The frequency with which these procedures are used cannot be predicted and they may be utilized to a significant extent. The value used for net asset value (NAV) calculation under these procedures may differ from published prices for the same securities.
The Fund categorizes the inputs to valuation techniques used to value its investments into a disclosure hierarchy consisting of three levels as shown below:
Level 1 - quoted prices in active markets for identical investments
Level 2 - other significant observable inputs (including quoted prices for similar investments, interest rates, prepayment speeds, etc.)
Level 3 - unobservable inputs (including the Fund's own assumptions based on the best information available)
Changes in valuation techniques may result in transfers in or out of an assigned level within the disclosure hierarchy. The aggregate value of investments by input level, as of October 31, 2011, is included at the end of the Fund's Schedule of Investments. Valuation techniques used to value the Fund's investments by major category are as follows:
Equity securities, including restricted securities, for which market quotations are readily available, are valued at the last reported sale price or official closing price as reported by an independent pricing service on the primary market or exchange on which they are traded and are categorized as Level 1 in the hierarchy. In the event there were no sales during the day or closing prices are not available, securities are valued at the last quoted bid price or may be valued using the last available price and are generally categorized as Level 2 in the hierarchy. For foreign equity securities, when significant market or security specific events arise, comparisons to the valuation of American Depositary Receipts
Annual Report
Notes to Financial Statements - continued
(Amounts in thousands except percentages)
3. Significant Accounting Policies - continued
Security Valuation - continued
(ADRs), futures contracts, Exchange-traded funds (ETFs) and certain indexes as well as quoted prices for similar securities are used and are categorized as Level 2 in the hierarchy in these circumstances. Utilizing these techniques may result in transfers between Level 1 and Level 2. For restricted equity securities and private placements where observable inputs are limited, assumptions about market activity and risk are used and are categorized as Level 3 in the hierarchy.
Investments in open-end mutual funds, including the Fidelity Central Funds, are valued at their closing net asset value each business day and are categorized as Level 1 in the hierarchy.
Foreign Currency. The Fund may use foreign currency contracts to facilitate transactions in foreign-denominated securities. Gains and losses from these transactions may arise from changes in the value of the foreign currency or if the counterparties do not perform under the contracts' terms.
Foreign-denominated assets, including investment securities, and liabilities are translated into U.S. dollars at the exchange rate at period end. Purchases and sales of investment securities, income and dividends received and expenses denominated in foreign currencies are translated into U.S. dollars at the exchange rate in effect on the transaction date.
The effects of exchange rate fluctuations on investments are included with the net realized and unrealized gain (loss) on investment securities. Other foreign currency transactions resulting in realized and unrealized gain (loss) are disclosed separately.
Investment Transactions and Income. For financial reporting purposes, the Fund's investment holdings and NAV include trades executed through the end of the last business day of the period. The NAV per share for processing shareholder transactions is calculated as of the close of business of the New York Stock Exchange (NYSE), normally 4:00 p.m. Eastern time and includes trades executed through the end of the prior business day. Gains and losses on securities sold are determined on the basis of identified cost and may include proceeds received from litigation. Dividend income is recorded on the ex-dividend date, except for certain dividends from foreign securities where the ex-dividend date may have passed, which are recorded as soon as the Fund is informed of the ex-dividend date. Non-cash dividends included in dividend income, if any, are recorded at the fair market value of the securities received. Distributions received on securities that represent a return of capital or capital gain are recorded as a reduction of cost of investments and/or as a realized gain. The Fund estimates the components of distributions received that may be considered return of capital distributions or capital
Annual Report
3. Significant Accounting Policies - continued
Investment Transactions and Income - continued
gain distributions. Interest income and distributions from the Fidelity Central Funds are accrued as earned. Interest income includes coupon interest and amortization of premium and accretion of discount on debt securities. Investment income is recorded net of foreign taxes withheld where recovery of such taxes is uncertain.
Expenses. Expenses directly attributable to a fund are charged to that fund. Expenses attributable to more than one fund are allocated among the respective funds on the basis of relative net assets or other appropriate methods. Expense estimates are accrued in the period to which they relate and adjustments are made when actual amounts are known.
Income Tax Information and Distributions to Shareholders. Each year, the Fund intends to qualify as a regulated investment company, including distributing substantially all of its taxable income and realized gains under Subchapter M of the Internal Revenue Code and filing its U.S. federal tax return. As a result, no provision for income taxes is required. As of October 31, 2011, the Fund did not have any unrecognized tax benefits in the financial statements. A fund's federal tax return is subject to examination by the Internal Revenue Service (IRS) for a period of three years. Foreign taxes are provided for based on the Fund's understanding of the tax rules and rates that exist in the foreign markets in which it invests.
Distributions are declared and recorded on the ex-dividend date. Income dividends and capital gain distributions are declared separately for each class. Income and capital gain distributions are determined in accordance with income tax regulations, which may differ from GAAP.
Capital accounts within the financial statements are adjusted for permanent book-tax differences. These adjustments have no impact on net assets or the results of operations. Temporary book-tax differences will reverse in a subsequent period.
Book-tax differences are primarily due to foreign currency transactions, passive foreign investment companies (PFIC), deferred trustees compensation, capital loss carryforwards and losses deferred due to wash sales.
Annual Report
Notes to Financial Statements - continued
(Amounts in thousands except percentages)
3. Significant Accounting Policies - continued
Income Tax Information and Distributions to Shareholders - continued
The federal tax cost of investment securities and unrealized appreciation (depreciation) as of period end were as follows:
Gross unrealized appreciation | $ 84,441 |
Gross unrealized depreciation | (124,723) |
Net unrealized appreciation (depreciation) on securities and other investments | $ (40,282) |
| |
Tax Cost | $ 775,737 |
The tax-based components of distributable earnings as of period end were as follows:
Undistributed ordinary income | $ 9,657 |
Capital loss carryforward | $ (104,924) |
Net unrealized appreciation (depreciation) | $ (40,224) |
Under the recently enacted Regulated Investment Company Modernization Act of 2010 (the Act), the Fund will be permitted to carry forward capital losses incurred in taxable years beginning after December 22, 2010 for an unlimited period. However, any losses incurred during those future taxable years will be required to be utilized prior to any losses incurred in pre-enactment taxable years, which generally expire after eight years from when they are incurred. Additionally, post-enactment capital losses that are carried forward will retain their character as either short-term or long-term capital losses rather than being considered all short-term as under previous law. The Fund's first fiscal year end subject to the Act will be October, 31, 2012.
The tax character of distributions paid was as follows:
| October 31, 2011 | October 31, 2010 |
Ordinary Income | $ 15,738 | $ 20,173 |
Short-Term Trading (Redemption) Fees. Shares held by investors in the Fund less than 30 days are subject to a redemption fee equal to 1.00% of the net asset value of shares redeemed. All redemption fees, which reduce the proceeds of the shareholder redemption, are retained by the Fund and accounted for as an addition to paid in capital.
New Accounting Pronouncement. In May 2011, the Financial Accounting Standards Board issued Accounting Standard Update No. 2011-04, Fair Value Measurement (Topic 820) - Amendments to Achieve Common Fair Value Measurement and Disclosure Requirements in U.S. GAAP and IFRSs. The update changes the wording used to describe the requirements in GAAP for measuring fair value and for disclosing information about
Annual Report
3. Significant Accounting Policies - continued
New Accounting Pronouncement - continued
fair value measurements. The update is effective during interim and annual periods beginning after December 15, 2011. Management is currently evaluating the impact of the update's adoption on the Fund's financial statement disclosures.
4. Operating Policies.
Restricted Securities. The Fund may invest in securities that are subject to legal or contractual restrictions on resale. These securities generally may be resold in transactions exempt from registration or to the public if the securities are registered. Disposal of these securities may involve time-consuming negotiations and expense, and prompt sale at an acceptable price may be difficult. Information regarding restricted securities is included at the end of the Fund's Schedule of Investments.
5. Purchases and Sales of Investments.
Purchases and sales of securities, other than short-term securities, aggregated $441,698 and $799,992, respectively.
6. Fees and Other Transactions with Affiliates.
Management Fee. FMR and its affiliates provide the Fund with investment management related services for which the Fund pays a monthly management fee. The management fee is the sum of an individual fund fee rate that is based on an annual rate of .45% of the Fund's average net assets and a group fee rate that averaged .26% during the period. The group fee rate is based upon the average net assets of all the mutual funds advised by FMR. The group fee rate decreases as assets under management increase and increases as assets under management decrease. In addition, the management fee is subject to a performance adjustment (up to a maximum of ± .20% of the Fund's average net assets over a 36 month performance period). The upward or downward adjustment to the management fee is based on the investment performance of the asset-weighted return of all classes as compared to an appropriate benchmark index. For the period, the total annual management fee rate, including the performance adjustment, was .71% of the Fund's average net assets.
Distribution and Service Plan Fees. In accordance with Rule 12b-1 of the 1940 Act, the Fund has adopted separate Distribution and Service Plans for each class of shares. Certain classes pay Fidelity Distributors Corporation (FDC), an affiliate of FMR, separate Distribution and Service Fees, each of which is based on an annual percentage of each class' average net assets. In addition, FDC may pay financial intermediaries for
Annual Report
Notes to Financial Statements - continued
(Amounts in thousands except percentages)
6. Fees and Other Transactions with Affiliates - continued
Distribution and Service Plan Fees - continued
selling shares of the Fund and providing shareholder support services. For the period, the Distribution and Service Fee rates, total fees and amounts retained by FDC were as follows:
| Distribution
Fee | Service
Fee | Total Fees | Retained
by FDC |
Class A | -% | .25% | $ 174 | $ 2 |
Class T | .25% | .25% | 1,795 | 21 |
Class B | .75% | .25% | 56 | 43 |
Class C | .75% | .25% | 220 | 9 |
| | | $ 2,245 | $ 75 |
Sales Load. FDC may receive a front-end sales charge of up to 5.75% for selling Class A shares, and 3.50% for selling Class T shares, some of which is paid to financial intermediaries for selling shares of the Fund. Depending on the holding period, FDC may receive contingent deferred sales charges levied on Class A, Class T, Class B, and Class C redemptions. The deferred sales charges range from 5% to 1% for Class B, 1% for Class C, 1.00% for certain purchases of Class A shares and .25% for certain purchases of Class T shares.
For the period, sales charge amounts retained by FDC were as follows:
| Retained
by FDC |
Class A | $ 8 |
Class T | 5 |
Class B* | 8 |
Class C* | 1 |
| $ 22 |
* When Class B and Class C shares are initially sold, FDC pays commissions from its own resources to financial intermediaries through which the sales are made.
Transfer Agent Fees. Fidelity Investments Institutional Operations Company, Inc. (FIIOC), an affiliate of FMR, is the transfer, dividend disbursing and shareholder servicing agent for each class of the Fund. FIIOC receives account fees and asset-based fees that vary according to the account size and type of account of the shareholders of the respective classes of the Fund. FIIOC pays for typesetting, printing and mailing of
Annual Report
6. Fees and Other Transactions with Affiliates - continued
Transfer Agent Fees - continued
shareholder reports, except proxy statements. For the period, transfer agent fees for each class were as follows:
| Amount | % of
Average
Net Assets |
Class A | $ 211 | .30 |
Class T | 803 | .22 |
Class B | 17 | .30 |
Class C | 66 | .30 |
Institutional Class | 1,148 | .21 |
| $ 2,245 | |
Accounting and Security Lending Fees. Fidelity Service Company, Inc. (FSC), an affiliate of FMR, maintains the Fund's accounting records. The accounting fee is based on the level of average net assets for the month. Under a separate contract, FSC administers the security lending program. The security lending fee is based on the number and duration of lending transactions.
Brokerage Commissions. The Fund placed a portion of its portfolio transactions with brokerage firms which are affiliates of the investment adviser. The commissions paid to these affiliated firms were $2 for the period.
Interfund Lending Program. Pursuant to an Exemptive Order issued by the SEC, the Fund, along with other registered investment companies having management contracts with FMR, may participate in an interfund lending program. This program provides an alternative credit facility allowing the funds to borrow from, or lend money to, other participating affiliated funds. At period end, there were no interfund loans outstanding. The Fund's activity in this program during the period for which loans were outstanding was as follows:
Borrower or Lender | Average Daily
Loan Balance | Weighted Average
Interest Rate | Interest
Expense |
Borrower | $ 5,055 | .43% | $ 1 |
7. Committed Line of Credit.
The Fund participates with other funds managed by FMR or an affiliate in a $4.0 billion credit facility (the "line of credit") to be utilized for temporary or emergency purposes to fund shareholder redemptions or for other short-term liquidity purposes. The Fund has
Annual Report
Notes to Financial Statements - continued
(Amounts in thousands except percentages)
7. Committed Line of Credit - continued
agreed to pay commitment fees on its pro-rata portion of the line of credit, which amounted to $3 and is reflected in Miscellaneous expenses on the Statement of Operations. During the period, there were no borrowings on this line of credit.
8. Security Lending.
The Fund lends portfolio securities through a lending agent from time to time in order to earn additional income. For equity securities, a lending agent is used and may loan securities to certain qualified borrowers, including Fidelity Capital Markets (FCM), a broker-dealer affiliated with the Fund. On the settlement date of the loan, the Fund receives collateral (in the form of U.S. Treasury obligations, letters of credit and/or cash) against the loaned securities and maintains collateral in an amount not less than 100% of the market value of the loaned securities during the period of the loan. The market value of the loaned securities is determined at the close of business of the Fund and any additional required collateral is delivered to the Fund on the next business day. If the borrower defaults on its obligation to return the securities loaned because of insolvency or other reasons, a fund could experience delays and costs in recovering the securities loaned or in gaining access to the collateral. Any cash collateral received is invested in the Fidelity Securities Lending Cash Central Fund. The value of loaned securities and cash collateral at period end are disclosed on the Fund's Statement of Assets and Liabilities. Security lending income represents the income earned on investing cash collateral, less rebates paid to borrowers and any lending agent fees associated with the loan, plus any premium payments received for lending certain types of securities. Security lending income is presented in the Statement of Operations as a component of income from Fidelity Central Funds. Total security lending income during the period amounted to $848. During the period, there were no securities loaned to FCM.
9. Expense Reductions.
FMR voluntarily agreed to reimburse a portion of its management fee. For the period, the amount of this reimbursement was $77.
Many of the brokers with whom FMR places trades on behalf of the Fund provided services to the Fund in addition to trade execution. These services included payments of certain expenses on behalf of the Fund totaling $203 for the period.
Annual Report
10. Distributions to Shareholders.
Distributions to shareholders of each class were as follows:
Years ended October 31, | 2011 | 2010 |
From net investment income | | |
Class A | $ 829 | $ 950 |
Class T | 3,501 | 4,334 |
Class B | 30 | 45 |
Class C | 89 | 160 |
Institutional Class | 8,533 | 12,416 |
Total | $ 12,982 | $ 17,905 |
From net realized gain | | |
Class A | $ 178 | $ 134 |
Class T | 911 | 684 |
Class B | 17 | 15 |
Class C | 57 | 44 |
Institutional Class | 1,593 | 1,391 |
Total | $ 2,756 | $ 2,268 |
11. Share Transactions.
Transactions for each class of shares were as follows:
| Shares | Dollars |
Years ended October 31, | 2011 | 2010 | 2011 | 2010 |
Class A | | | | |
Shares sold | 644 | 475 | $ 11,749 | $ 7,655 |
Reinvestment of distributions | 51 | 61 | 919 | 1,012 |
Shares redeemed | (937) | (1,167) | (16,834) | (18,467) |
Net increase (decrease) | (242) | (631) | $ (4,166) | $ (9,800) |
Class T | | | | |
Shares sold | 3,310 | 4,009 | $ 61,021 | $ 65,721 |
Reinvestment of distributions | 232 | 288 | 4,288 | 4,889 |
Shares redeemed | (5,489) | (6,821) | (101,187) | (111,516) |
Net increase (decrease) | (1,947) | (2,524) | $ (35,878) | $ (40,906) |
Class B | | | | |
Shares sold | 12 | 48 | $ 219 | $ 740 |
Reinvestment of distributions | 2 | 3 | 41 | 54 |
Shares redeemed | (144) | (174) | (2,540) | (2,691) |
Net increase (decrease) | (130) | (123) | $ (2,280) | $ (1,897) |
Class C | | | | |
Shares sold | 165 | 120 | $ 2,956 | $ 1,913 |
Reinvestment of distributions | 7 | 11 | 125 | 176 |
Shares redeemed | (271) | (337) | (4,750) | (5,265) |
Net increase (decrease) | (99) | (206) | $ (1,669) | $ (3,176) |
Annual Report
Notes to Financial Statements - continued
(Amounts in thousands except percentages)
11. Share Transactions - continued
| Shares | Dollars |
Years ended October 31, | 2011 | 2010 | 2011 | 2010 |
Institutional Class | | | | |
Shares sold | 2,965 | 12,645 | $ 53,805 | $ 202,633 |
Reinvestment of distributions | 544 | 818 | 9,988 | 13,738 |
Shares redeemed | (19,770) | (21,576) | (362,619) | (349,589) |
Net increase (decrease) | (16,261) | (8,113) | $ (298,826) | $ (133,218) |
12. Other.
The Fund's organizational documents provide former and current trustees and officers with a limited indemnification against liabilities arising in connection with the performance of their duties to the Fund. In the normal course of business, the Fund may also enter into contracts that provide general indemnifications. The Fund's maximum exposure under these arrangements is unknown as this would be dependent on future claims that may be made against the Fund. The risk of material loss from such claims is considered remote.
At the end of the period, Strategic Advisers International II Fund was the owner of record of approximately 15% of the total outstanding shares of the fund.
Annual Report
To the Trustees of Fidelity Advisor Series VIII and the Shareholders of Fidelity Advisor Overseas Fund:
In our opinion, the accompanying statement of assets and liabilities, including the schedule of investments, and the related statements of operations and of changes in net assets and the financial highlights present fairly, in all material respects, the financial position of Fidelity Advisor Overseas Fund (a fund of Fidelity Advisor Series VIII) at October 31, 2011, the results of its operations for the year then ended, the changes in its net assets for each of the two years in the period then ended and the financial highlights for each of the five years in the period then ended, in conformity with accounting principles generally accepted in the United States of America. These financial statements and financial highlights (hereafter referred to as "financial statements") are the responsibility of the Fidelity Advisor Overseas Fund's management. Our responsibility is to express an opinion on these financial statements based on our audits. We conducted our audits of these financial statements in accordance with the standards of the Public Company Accounting Oversight Board (United States). Those standards require that we plan and perform the audit to obtain reasonable assurance about whether the financial statements are free of material misstatement. An audit includes examining, on a test basis, evidence supporting the amounts and disclosures in the financial statements, assessing the accounting principles used and significant estimates made by management, and evaluating the overall financial statement presentation. We believe that our audits, which included confirmation of securities at October 31, 2011 by correspondence with the custodian and brokers, provide a reasonable basis for our opinion.
/s/ PricewaterhouseCoopers LLP
PricewaterhouseCoopers LLP
Boston, Massachusetts
December 9, 2011
Annual Report
The Trustees, Members of the Advisory Board, and executive officers of the trust and fund, as applicable, are listed below. The Board of Trustees governs the fund and is responsible for protecting the interests of shareholders. The Trustees are experienced executives who meet periodically throughout the year to oversee the fund's activities, review contractual arrangements with companies that provide services to the fund, oversee management of the risks associated with such activities and contractual arrangements, and review the fund's performance. Except for James C. Curvey, each of the Trustees oversees 226 funds advised by FMR or an affiliate. Mr. Curvey oversees 429 funds advised by FMR or an affiliate.
The Trustees hold office without limit in time except that (a) any Trustee may resign; (b) any Trustee may be removed by written instrument, signed by at least two-thirds of the number of Trustees prior to such removal; (c) any Trustee who requests to be retired or who has become incapacitated by illness or injury may be retired by written instrument signed by a majority of the other Trustees; and (d) any Trustee may be removed at any special meeting of shareholders by a two-thirds vote of the outstanding voting securities of the trust. Each Trustee who is not an interested person (as defined in the 1940 Act) (Independent Trustee), shall retire not later than the last day of the calendar year in which his or her 75th birthday occurs. The Independent Trustees may waive this mandatory retirement age policy with respect to individual Trustees. The executive officers and Advisory Board Members hold office without limit in time, except that any officer and Advisory Board Member may resign or may be removed by a vote of a majority of the Trustees at any regular meeting or any special meeting of the Trustees. Except as indicated, each individual has held the office shown or other offices in the same company for the past five years.
Experience, Skills, Attributes, and Qualifications of the Fund's Trustees. The Governance and Nominating Committee has adopted a statement of policy that describes the experience, qualifications, attributes, and skills that are necessary and desirable for potential Independent Trustee candidates (Statement of Policy). The Board believes that each Trustee satisfied at the time he or she was initially elected or appointed a Trustee, and continues to satisfy, the standards contemplated by the Statement of Policy. The Governance and Nominating Committee also engages professional search firms to help identify potential Independent Trustee candidates who have the experience, qualifications, attributes, and skills consistent with the Statement of Policy. From time to time, additional criteria based on the composition and skills of the current Independent Trustees, as well as experience or skills that may be appropriate in light of future changes to board composition, business conditions, and regulatory or other developments, have also been considered by the professional search firms and the Governance and Nominating Committee. In addition, the Board takes into account the Trustees' commitment and participation in Board and committee meetings, as well as their leadership of standing and ad hoc committees throughout their tenure.
In determining that a particular Trustee was and continues to be qualified to serve as a Trustee, the Board has considered a variety of criteria, none of which, in isolation, was controlling. The Board believes that, collectively, the Trustees have balanced and diverse experience, qualifications, attributes, and skills, which allow the Board to operate effectively in governing the fund and protecting the interests of shareholders. Information about the specific experience, skills, attributes, and qualifications of each Trustee, which in each case led to the Board's conclusion that the Trustee should serve (or continue to serve) as a trustee of the fund, is provided below.
Annual Report
Trustees and Officers - continued
Board Structure and Oversight Function. James C. Curvey is an interested person (as defined in the 1940 Act) and currently serves as Acting Chairman. The Trustees have determined that an interested Chairman is appropriate and benefits shareholders because an interested Chairman has a personal and professional stake in the quality and continuity of services provided to the fund. Independent Trustees exercise their informed business judgment to appoint an individual of their choosing to serve as Chairman, regardless of whether the Trustee happens to be independent or a member of management. The Independent Trustees have determined that they can act independently and effectively without having an Independent Trustee serve as Chairman and that a key structural component for assuring that they are in a position to do so is for the Independent Trustees to constitute a substantial majority for the Board. The Independent Trustees also regularly meet in executive session. Ned C. Lautenbach serves as Chairman of the Independent Trustees and as such (i) acts as a liaison between the Independent Trustees and management with respect to matters important to the Independent Trustees and (ii) with management prepares agendas for Board meetings.
Fidelity funds are overseen by different Boards of Trustees. The fund's Board oversees Fidelity's equity and high income funds and another Board oversees Fidelity's investment-grade bond, money market, and asset allocation funds. The asset allocation funds may invest in Fidelity funds overseen by the fund's Board. The use of separate Boards, each with its own committee structure, allows the Trustees of each group of Fidelity funds to focus on the unique issues of the funds they oversee, including common research, investment, and operational issues. On occasion, the separate Boards establish joint committees to address issues of overlapping consequences for the Fidelity funds overseen by each Board.
The Trustees operate using a system of committees to facilitate the timely and efficient consideration of all matters of importance to the Trustees, the fund, and fund shareholders and to facilitate compliance with legal and regulatory requirements and oversight of the fund's activities and associated risks. The Board, acting through its committees, has charged FMR and its affiliates with (i) identifying events or circumstances the occurrence of which could have demonstrably adverse effects on the fund's business and/or reputation; (ii) implementing processes and controls to lessen the possibility that such events or circumstances occur or to mitigate the effects of such events or circumstances if they do occur; and (iii) creating and maintaining a system designed to evaluate continuously business and market conditions in order to facilitate the identification and implementation processes described in (i) and (ii) above. Because the day-to-day operations and activities of the fund are carried out by or through FMR, its affiliates and other service providers, the fund's exposure to risks is mitigated but not eliminated by the processes overseen by the Trustees. While each of the Board's committees has responsibility for overseeing different aspects of the fund's activities, oversight is exercised primarily through the Operations, Audit, and Compliance Committees. In addition, the Independent Trustees have worked with FMR to enhance the Board's oversight of investment and financial risks, legal and regulatory risks, technology risks, and operational risks, including the development of additional risk reporting to the Board. For example, a working group comprised of Independent Trustees and FMR has worked and continues to work to review the Fidelity funds' valuation-related activities, reporting and risk management. Appropriate personnel, including but not limited to the fund's Chief Compliance Officer (CCO), FMR's internal auditor, the independent accountants, the fund's Treasurer and portfolio management personnel, make periodic reports to the Board's committees, as appropriate, including an annual review of FMR's risk management program for the Fidelity funds. The responsibilities of each standing committee, including their oversight responsibilities, are described further under "Standing Committees of the Fund's Trustees."
Annual Report
The fund's Statement of Additional Informaion (SAI) includes more information about the Trustees. To request a copy, call Fidelity at 1-877-208-0098.
Interested Trustees*:
Correspondence intended for each Trustee who is an interested person may be sent to Fidelity Investments, 82 Devonshire Street, Boston, Massachusetts 02109.
Name, Age; Principal Occupations and Other Relevant Experience+ |
James C. Curvey (76) |
| Year of Election or Appointment: 2007 Mr. Curvey is Trustee and Acting Chairman of the Board of Trustees of certain Trusts. Mr. Curvey also serves as Trustee (2007-present) of other investment companies advised by FMR. Mr. Curvey is a Director of Fidelity Investments Money Management, Inc. (2009-present), Director of Fidelity Research & Analysis Co. (2009-present) and Director of FMR and FMR Co., Inc. (2007-present). Mr. Curvey is also Vice Chairman (2007-present) and Director of FMR LLC. In addition, Mr. Curvey serves as an Overseer for the Boston Symphony Orchestra and a member of the Trustees of Villanova University. Previously, Mr. Curvey was the Vice Chairman (2006-2007) and Director (2000-2007) of FMR Corp. |
Ronald P. O'Hanley (54) |
| Year of Election or Appointment: 2011 Mr. O'Hanley is Director of FMR Co., Inc. (2010-present), Director of Fidelity Investments Money Management, Inc. (2010-present), Director of Fidelity Research & Analysis Company (2010-present), President of Fidelity Asset Management and Corporate Services and a member of Fidelity's Executive Committee (2010-present). Previously, Mr. O'Hanley served as President and Chief Executive Officer of BNY Mellon Asset Management (2007-2010). Mr. O'Hanley also served as Vice Chairman of Bank New York Mellon Corp. and a member of that firm's Executive Committee. Prior to the 2007 merger of The Bank of New York and Mellon Financial Corporation, he was Vice Chairman of Mellon Financial Corporation and President and Chief Executive Officer of Mellon Asset Management. He joined Mellon in February 1997. Mr. O'Hanley currently serves as Chairman of the Boston Public Library Foundation Board of Directors and sits on the Board of Directors of Beth Israel Deaconess Medical Center, the Board of Trustees of the Marine Biological Laboratory and the Advisory Board of the Maxwell School of Citizenship and Public Administration at Syracuse University. Mr. O'Hanley also chairs the Council on Asset Management for the Financial Services Roundtable and is a member of the Board of Directors of Institutional Investor's U.S. Institute. |
* Trustees have been determined to be "Interested Trustees" by virtue of, among other things, their affiliation with the trust or various entities under common control with FMR.
+ The information above includes each Trustee's principal occupation during the last five years and other information relating to the experience, attributes, and skills relevant to each Trustee's qualifications to serve as a Trustee, which led to the conclusion that each Trustee should serve as a Trustee for the fund.
Annual Report
Independent Trustees:
Correspondence intended for each Independent Trustee (that is, the Trustees other than the Interested Trustees) may be sent to Fidelity Investments, P.O. Box 55235, Boston, Massachusetts 02205-5235.
Name, Age; Principal Occupations and Other Relevant Experience+ |
Dennis J. Dirks (63) |
| Year of Election or Appointment: 2005 Prior to his retirement in May 2003, Mr. Dirks was Chief Operating Officer and a member of the Board of The Depository Trust & Clearing Corporation (DTCC). He also served as President, Chief Operating Officer, and Board member of The Depository Trust Company (DTC) and President and Board member of the National Securities Clearing Corporation (NSCC). In addition, Mr. Dirks served as Chief Executive Officer and Board member of the Government Securities Clearing Corporation, Chief Executive Officer and Board member of the Mortgage-Backed Securities Clearing Corporation, as a Trustee and a member of the Finance Committee of Manhattan College (2005-2008), and as a Trustee and a member of the Finance Committee of AHRC of Nassau County (2006-2008). Mr. Dirks is a member of the Independent Directors Council (IDC) Governing Council (2010-Present) and Board of Directors for The Brookville Center for Children's Services, Inc. (2009-present). |
Alan J. Lacy (58) |
| Year of Election or Appointment: 2008 Mr. Lacy serves as Senior Adviser (2007-present) of Oak Hill Capital Partners, L.P. (private equity). Mr. Lacy also served as Chief Executive Officer (2000-2005) and Vice Chairman (2005-2006) of Sears Holdings Corporation and Sears, Roebuck and Co. (retail). In addition, Mr. Lacy serves as a member of the Board of Directors of Dave & Buster's, Inc. (restaurant and entertainment complexes, 2010-present), The Hillman Companies, Inc. (hardware wholesalers, 2010-present), and Bristol-Myers Squibb Company (global pharmaceuticals, 2007-present). Mr. Lacy is a member of the Board of Trustees of The National Parks Conservation Association (2006-Present). Previously, Mr. Lacy served as Chairman of the Board of Trustees of the National Parks Conservation Association (2008-2011) and as a member of the Board of Directors for the Western Union Company (global money transfer, 2006-2011). |
Ned C. Lautenbach (67) |
| Year of Election or Appointment: 2000 Mr. Lautenbach is Chairman of the Independent Trustees of the Equity and High Income Funds (2006-present). Mr. Lautenbach currently serves as the Lead Director of the Eaton Corporation Board of Directors (diversified industrial, 1997-present). Mr. Lautenbach is also a member of the Board of Directors of the Philharmonic Center for the Arts in Naples, Florida (1999-present); a member of the Board of Trustees of Fairfield University (2005-present); and a member of the Council on Foreign Relations (1994-present). Previously, Mr. Lautenbach was a Partner/Advisory Partner at Clayton, Dubilier & Rice, LLC (private equity investment, 1998-2010), as well as a Director of Sony Corporation (2006-2007). |
Joseph Mauriello (67) |
| Year of Election or Appointment: 2008 Prior to his retirement in January 2006, Mr. Mauriello served in numerous senior management positions including Deputy Chairman and Chief Operating Officer (2004-2005), and Vice Chairman of Financial Services (2002-2004) of KPMG LLP US (professional services, 1965-2005). Mr. Mauriello currently serves as a member of the Board of Directors of XL Group plc. (global insurance and re-insurance, 2006-present) and of Arcadia Resources Inc. (health care services and products, 2007-present). Previously, Mr. Mauriello served as a Director of the Hamilton Funds of the Bank of New York (2006-2007). |
Robert W. Selander (61) |
| Year of Election or Appointment: 2011 Previously, Mr. Selander served as a Member of the Advisory Board of Fidelity's Equity and High Income Funds (2011), Executive Vice Chairman (2010), Chief Executive Officer (2009-2010), and President and Chief Executive Officer (1997-2009) of Mastercard, Inc. |
Cornelia M. Small (67) |
| Year of Election or Appointment: 2005 Ms. Small is a member of the Board of Directors of the Teagle Foundation (2009-present). Ms. Small is also a member of the Investment Committee, and Chair (2008-present) and a member of the Board of Trustees of Smith College. In addition, Ms. Small serves on the Investment Committee of the Berkshire Taconic Community Foundation (2008-present). Previously, Ms. Small served as Chairperson of the Investment Committee (2002-2008) of Smith College. In addition, Ms. Small served as Chief Investment Officer, Director of Global Equity Investments, and a member of the Board of Directors of Scudder, Stevens & Clark and Scudder Kemper Investments. |
William S. Stavropoulos (72) |
| Year of Election or Appointment: 2001 Mr. Stavropoulos is Vice Chairman of the Independent Trustees of the Equity and High Income Funds (2006-present). Mr. Stavropoulos serves as President and Founder of the Michigan Baseball Foundation, the Great Lakes Loons (2007-present). Mr. Stavropoulos is Chairman Emeritus of the Board of Directors of The Dow Chemical Company, where he previously served in numerous senior management positions, including President, CEO (1995-2000; 2002-2004), Chairman of the Executive Committee (2000-2006), and as a member of the Board of Directors (1990-2006). Currently, Mr. Stavropoulos is Chairman of Univar (global distributor of commodity and specialty chemicals, 2010-present), a Director of Teradata Corporation (data warehousing and technology solutions, 2008-present), Chemical Financial Corporation, Maersk Inc. (industrial conglomerate), Tyco International, Inc. (multinational manufacturing and services, 2007-present), and a member of the Advisory Board for Metalmark Capital (private equity investment, 2005-present). Mr. Stavropoulos is a special advisor to Clayton, Dubilier & Rice, LLC (private equity investment). In addition, Mr. Stavropoulos is a member of the University of Notre Dame Advisory Council for the College of Science. |
David M. Thomas (62) |
| Year of Election or Appointment: 2008 Previously, Mr. Thomas served as Executive Chairman (2005-2006) and Chairman and Chief Executive Officer (2000-2005) of IMS Health, Inc. (pharmaceutical and healthcare information solutions). In addition, Mr. Thomas serves as a member of the Board of Directors of Fortune Brands, Inc. (consumer products), and Interpublic Group of Companies, Inc. (marketing communication, 2004-present). |
Michael E. Wiley (61) |
| Year of Election or Appointment: 2008 Mr. Wiley also serves as a Director of Asia Pacific Exploration Consolidated (international oil and gas exploration and production, 2008-present). Mr. Wiley serves as a Director of Tesoro Corporation (independent oil refiner and marketer, 2005-present), and a Director of Bill Barrett Corporation (exploration and production, 2005-present). In addition, Mr. Wiley also serves as a Director of Post Oak Bank (privately-held bank, 2004-present). Previously, Mr. Wiley served as a member of the Board of Trustees of the University of Tulsa (2000-2006; 2007-2010), as a Senior Energy Advisor of Katzenbach Partners, LLC (consulting, 2006-2007), as an Advisory Director of Riverstone Holdings (private investment), Chairman, President, and CEO of Baker Hughes, Inc. (oilfield services, 2000-2004), and as Director of Spinnaker Exploration Company (exploration and production, 2001-2005). |
Annual Report
Trustees and Officers - continued
+ The information above includes each Trustee's principal occupation during the last five years and other information relating to the experience, attributes, and skills relevant to each Trustee's qualifications to serve as a Trustee, which led to the conclusion that each Trustee should serve as a Trustee for the fund.
Advisory Board Members and Executive Officers:
Correspondence intended for each executive officer, Edward C. Johnson 3d, and Peter S. Lynch may be sent to Fidelity Investments, 82 Devonshire Street, Boston, Massachusetts 02109.
Name, Age; Principal Occupation |
Edward C. Johnson 3d (81) |
| Year of Election or Appointment: 2011 Member of the Advisory Board of Fidelity's Equity and High Income Funds. Mr. Johnson serves as Chief Executive Officer, Chairman, and a Director of FMR LLC, and also serves as Chairman and Director of FIL Limited. Previously, Mr. Johnson served as a Trustee and Chairman of the Board of certain Fidelity Trusts, Chairman and a Director of FMR, Chairman and a Director of FMR Co., Inc., and President of FMR LLC (2006-2007). |
Peter S. Lynch (67) |
| Year of Election or Appointment: 2003 Member of the Advisory Board of Fidelity's Equity and High Income Funds. Mr. Lynch is Vice Chairman and a Director of FMR and FMR Co., Inc. In addition, Mr. Lynch serves as a Trustee of Boston College and as the Chairman of the Inner-City Scholarship Fund. Previously, Mr. Lynch served on the Special Olympics International Board of Directors (1997-2006). |
Kenneth B. Robins (42) |
| Year of Election or Appointment: 2008 President and Treasurer of Fidelity's Equity and High Income Funds. Mr. Robins also serves as President and Treasurer (2010-present) and Assistant Treasurer (2009-present) of other Fidelity funds and is an employee of Fidelity Investments (2004-present). Previously, Mr. Robins served as Deputy Treasurer of the Fidelity funds (2005-2008) and Treasurer and Chief Financial Officer of The North Carolina Capital Management Trust: Cash and Term Portfolios (2006-2008). |
Bruce T. Herring (46) |
| Year of Election or Appointment: 2006 Vice President of certain Equity Funds. Mr. Herring also serves as Chief Investment Officer and Director of Fidelity Management & Research (U.K.) Inc. (2010-present) and Group Chief Investments Officer of FMR. Previously, Mr. Herring served as Vice President (2005-2006) and Senior Vice President (2006-2007) of Fidelity Management & Research Company, Vice President of FMR Co., Inc. (2001-2007) and as a portfolio manager for Fidelity U.S. Equity Funds. |
Brian B. Hogan (47) |
| Year of Election or Appointment: 2009 Vice President of Equity and High Income Funds. Mr. Hogan also serves as President of FMR's Equity Division (2009-present). Previously, Mr. Hogan served as Senior Vice President, Equity Research of FMR (2006-2009) and as a portfolio manager. |
Christopher S. Bartel (39) |
| Year of Election or Appointment: 2009 Vice President of Fidelity's Sector and Real Estate Equity Funds. Mr. Bartel also serves as Senior Vice President of Equity Research (2009-present). Previously, Mr. Bartel served as Managing Director of Research (2006-2009) and an analyst and portfolio manager (2000-2006). |
Thomas C. Hense (47) |
| Year of Election or Appointment: 2008 or 2010 Vice President of Fidelity's High Income (2008), Small Cap (2008), and Value (2010) Funds. Previously, Mr. Hense served as a portfolio manager for Fidelity's Institutional Money Management Group (Pyramis) (2003-2008). |
Scott C. Goebel (43) |
| Year of Election or Appointment: 2008 Secretary and Chief Legal Officer (CLO) of the Fidelity funds. Mr. Goebel also serves as Secretary of Fidelity Investments Money Management, Inc. (FIMM) (2010-present) and Fidelity Research and Analysis Company (FRAC) (2010-present); Secretary and CLO of The North Carolina Capital Management Trust: Cash and Term Portfolios (2008-present); General Counsel, Secretary, and Senior Vice President of FMR (2008-present) and FMR Co., Inc. (2008-present); employed by FMR LLC or an affiliate (2001-present); Chief Legal Officer of Fidelity Management & Research (Hong Kong) Limited (2008-present) and Assistant Secretary of Fidelity Management & Research (Japan) Inc. (2008-present), and Fidelity Management & Research (U.K.) Inc. (2008-present). Previously, Mr. Goebel served as Assistant Secretary of FIMM (2008-2010), FRAC (2008-2010), and the Funds (2007-2008) and as Vice President and Secretary of Fidelity Distributors Corporation (FDC) (2005-2007). |
William C. Coffey (42) |
| Year of Election or Appointment: 2009 Assistant Secretary of Fidelity's Equity and High Income Funds. Mr. Coffey also serves as Senior Vice President and Deputy General Counsel of FMR LLC (2010-present), and is an employee of Fidelity Investments. Previously, Mr. Coffey served as Vice President and Associate General Counsel of FMR LLC (2005-2009). |
Holly C. Laurent (57) |
| Year of Election or Appointment: 2008 Anti-Money Laundering (AML) Officer of the Fidelity funds. Ms. Laurent also serves as AML Officer of The North Carolina Capital Management Trust: Cash and Term Portfolios (2008-present) and is an employee of Fidelity Investments. Previously, Ms. Laurent was Senior Vice President and Head of Legal for Fidelity Business Services India Pvt. Ltd. (2006-2008), and Senior Vice President, Deputy General Counsel and Group Head for FMR LLC (2005-2006). |
Christine Reynolds (53) |
| Year of Election or Appointment: 2008 Chief Financial Officer of the Fidelity funds. Ms. Reynolds became President of Fidelity Pricing and Cash Management Services (FPCMS) in August 2008. Ms. Reynolds served as Chief Operating Officer of FPCMS (2007-2008). Previously, Ms. Reynolds served as President, Treasurer, and Anti-Money Laundering officer of the Fidelity funds (2004-2007). |
Kenneth A. Rathgeber (64) |
| Year of Election or Appointment: 2004 Chief Compliance Officer of Fidelity's Equity and High Income Funds. Mr. Rathgeber is Chief Compliance Officer of Fidelity Management & Research (Hong Kong) Limited (2008-present), Fidelity Management & Research (Japan) Inc. (2008-present), FMR (2005-present), FMR Co., Inc. (2005-present), Fidelity Management & Research (U.K.) Inc. (2005-present), Fidelity Research & Analysis Company (2005-present), Fidelity Investments Money Management, Inc. (2005-present), Pyramis Global Advisors, LLC (2005-present), and Strategic Advisers, Inc. (2005-present). |
Jeffrey S. Christian (50) |
| Year of Election or Appointment: 2009 Deputy Treasurer of the Fidelity funds. Mr. Christian is an employee of Fidelity Investments. Previously, Mr. Christian served as Chief Financial Officer (2008-2009) of certain Fidelity funds and Senior Vice President of Fidelity Pricing and Cash Management Services (FPCMS) (2004-2009). |
Joseph F. Zambello (54) |
| Year of Election or Appointment: 2011 Deputy Treasurer of the Fidelity funds. Mr. Zambello is an employee of Fidelity Investments. Previously, Mr. Zambello served as Vice President of FMR's Program Management Group (2009-2011) and Vice President of the Transfer Agent Oversight Group (2005-2009). |
Adrien E. Deberghes (44) |
| Year of Election or Appointment: 2008 Deputy Treasurer of Fidelity's Equity and High Income Funds. Mr. Deberghes also serves as Vice President and Assistant Treasurer of Fidelity Rutland Square Trust II and Fidelity Commonwealth Trust II (2011-present), Assistant Treasurer of other Fidelity funds (2010-present), and is an employee of Fidelity Investments (2008-present). Previously, Mr. Deberghes served as Senior Vice President of Mutual Fund Administration at State Street Corporation (2007-2008), Senior Director of Mutual Fund Administration at Investors Bank & Trust (2005-2007), and Director of Finance for Dunkin' Brands (2000-2005). |
Stephanie J. Dorsey (42) |
| Year of Election or Appointment: 2010 Assistant Treasurer of Fidelity's Equity and High Income Funds. Ms. Dorsey also serves as Deputy Treasurer of other Fidelity funds (2008-present) and is an employee of Fidelity Investments (2008-present). Previously, Ms. Dorsey served as Treasurer (2004-2008) of the JPMorgan Mutual Funds and Vice President (2004-2008) of JPMorgan Chase Bank. |
John R. Hebble (53) |
| Year of Election or Appointment: 2009 Assistant Treasurer of Fidelity's Equity and High Income Funds. Mr. Hebble also serves as President (2011-present), Treasurer, and Chief Financial Officer of The North Carolina Capital Management Trust: Cash and Term Portfolios (2008-present), President and Treasurer of other Fidelity funds (2008-present) and is an employee of Fidelity Investments. |
Gary W. Ryan (53) |
| Year of Election or Appointment: 2005 Assistant Treasurer of the Fidelity funds. Mr. Ryan is an employee of Fidelity Investments. Previously, Mr. Ryan served as Vice President of Fund Reporting in Fidelity Pricing and Cash Management Services (FPCMS) (1999-2005). |
Jonathan Davis (43) |
| Year of Election or Appointment: 2010 Assistant Treasurer of the Fidelity funds. Mr. Davis is also Assistant Treasurer of Fidelity Rutland Square Trust II and Fidelity Commonwealth Trust II. Mr. Davis is an employee of Fidelity Investments. Previously, Mr. Davis served as Vice President and Associate General Counsel of FMR LLC (2003-2010). |
Annual Report
Class A designates 100%, Class T designates 100%, Class B designates 100%, and Class C designates 100% of the dividends distributed during the fiscal year as amounts which may be taken into account as a dividend for purposes of the maximum rate under section 1(h)(11) of the Internal Revenue Code.
The amounts per share which represent income derived from sources within, and taxes paid to, foreign countries or possessions of the United States are as follows:
| Pay Date | Income | Taxes |
Class A | 12/06/2010 | $0.273 | $0.0185 |
Class T | 12/06/2010 | $0.236 | $0.0185 |
Class B | 12/06/2010 | $0.142 | $0.0185 |
Class C | 12/06/2010 | $0.133 | $0.0185 |
The fund will notify shareholders in January 2012 of amounts for use in preparing 2011 income tax returns.
Annual Report
Board Approval of Investment Advisory Contracts and Management Fees
Fidelity Advisor Overseas Fund
Each year, the Board of Trustees, including the Independent Trustees (together, the Board), votes on the renewal of the management contract and sub-advisory agreements (together, the Advisory Contracts) for the fund. The Board, assisted by the advice of fund counsel and Independent Trustees' counsel, requests and considers a broad range of information relevant to the renewal of the Advisory Contracts throughout the year.
The Board meets regularly and considers at each of its meetings factors that are relevant to its annual consideration of the renewal of the fund's Advisory Contracts, including the services and support provided to the fund and its shareholders. The Board has established various standing committees, each composed of Independent Trustees with varying backgrounds, to which the Board has assigned specific subject matter responsibilities in order to enhance effective decision-making by the Board. The Board, acting directly and through its Committees, requests and receives information concerning the annual consideration of the renewal of the fund's Advisory Contracts. The Board also meets as needed to consider matters specifically related to the Board's annual consideration of the renewal of Advisory Contracts. Members of the Board may also meet with trustees of other Fidelity funds through ad hoc joint committees to discuss certain matters relevant to the Fidelity funds.
At its July 2011 meeting, the Board of Trustees, including the Independent Trustees, unanimously determined to renew the fund's Advisory Contracts. In reaching its determination, the Board considered all factors it believed relevant, including (i) the nature, extent, and quality of the services to be provided to the fund and its shareholders (including the investment performance of the fund); (ii) the competitiveness of the fund's management fee and total expense ratio; (iii) the total costs of the services to be provided by and the profits to be realized by Fidelity from its relationship with the fund; (iv) the extent to which economies of scale would be realized as the fund grows; and (v) whether fee levels reflect these economies of scale, if any, for the benefit of fund shareholders.
In considering whether to renew the Advisory Contracts for the fund, the Board reached a determination, with the assistance of fund counsel and Independent Trustees' counsel and through the exercise of its business judgment, that the renewal of the Advisory Contracts is in the best interests of the fund and its shareholders and that the compensation payable under the Advisory Contracts is fair and reasonable. The Board's decision to renew the Advisory Contracts was not based on any single factor, but rather was based on a comprehensive consideration of all the information provided to the Board at its meetings throughout the year. The Board, in reaching its determination to renew the Advisory Contracts, is aware that shareholders in the fund have a broad range of investment choices available to them, including a wide choice among mutual funds offered by Fidelity's competitors, and that the fund's shareholders, who have the opportunity to review and weigh the disclosure provided by the fund in its prospectus and other public disclosures, have chosen to invest in this fund, managed by Fidelity.
Annual Report
Nature, Extent, and Quality of Services Provided. The Board considered the staffing within the investment adviser, FMR, and the sub-advisers (together, the Investment Advisers), including the backgrounds of the fund's investment personnel and the fund's investment objective and discipline. The Independent Trustees also had discussions with senior management of Fidelity's investment operations and investment groups. The Board considered the structure of the portfolio manager compensation program and whether this structure provides appropriate incentives to act in the best interests of the fund.
Resources Dedicated to Investment Management and Support Services. The Board and the Fund Oversight and Research Committees reviewed the general qualifications and capabilities of the Investment Advisers' investment staff, including its size, education, experience, and resources, as well as the Investment Advisers' approach to recruiting, training, managing, and compensating investment personnel. The Board also noted that FMR has devoted increased resources to non-U.S. offices. The Board noted that Fidelity's analysts have extensive resources, tools and capabilities which allow them to conduct sophisticated quantitative and fundamental analysis, as well as credit analysis of issuers, counterparties and enhancers. The Board also believes that Fidelity's investment professionals have sufficient access to global information and data so as to provide competitive investment results over time, and that those professionals also have access to sophisticated tools which permit them to assess portfolio construction and risk and performance attribution characteristics continuously, as well as to transmit new information and research conclusions rapidly around the world. Additionally, in their deliberations, the Board considered the Investment Advisers' trading capabilities and resources which are an integral part of the investment management process.
Shareholder and Administrative Services. The Board considered (i) the nature, extent, quality, and cost of advisory, administrative, and shareholder services performed by the Investment Advisers and their affiliates under the Advisory Contracts and under separate agreements covering transfer agency, pricing and bookkeeping, and securities lending services for the fund; (ii) the nature and extent of the investment adviser's supervision of third party service providers, principally custodians and subcustodians; and (iii) the resources devoted to, and the record of compliance with, the fund's compliance policies and procedures. The Board also reviewed the allocation of fund brokerage, including allocations to brokers affiliated with the Investment Advisers, the use of brokerage commissions to pay fund expenses, and the use of "soft" commission dollars to pay for research services.
The Board noted that the growth of fund assets over time across the complex allows Fidelity to reinvest in the development of services designed to enhance the value or convenience of the Fidelity funds as investment vehicles. These services include 24-hour access to account information and market information through telephone representatives and over the Internet, investor education materials and asset allocation tools, and the expanded availability of Fidelity Investor Centers, with 35 new branches opening since 2010.
Annual Report
Board Approval of Investment Advisory Contracts and
Management Fees - continued
Investment in a Large Fund Family. The Board considered the benefits to shareholders of investing in a Fidelity fund, including the benefits of investing in a fund that is part of a large family of funds offering a variety of investment disciplines and providing a large variety of mutual fund investor services. The Board noted that Fidelity had taken, or had made recommendations that resulted in the Fidelity funds taking, a number of actions over the previous year that benefited particular funds, including (i) continuing to dedicate additional resources to investment research and support of the senior management team that oversees asset management; (ii) rationalizing product lines through the mergers of six funds into other funds; (iii) continuing to migrate the Freedom Funds to dedicated lower cost underlying funds; (iv) obtaining shareholder approval to broaden the investment strategies for Fidelity Consumer Finance Portfolio, Fidelity Emerging Asia Fund, and Fidelity Environment and Alternative Energy Portfolio; (v) contractually agreeing to reduce the management fees and impose other expense limitations on Spartan 500 Index Fund and U.S. Bond Index Fund in connection with launching new institutional classes of these funds; (vi) changing the name, primary and supplemental benchmarks, and investment policies of Fidelity Global Strategies Fund to support the fund's flexible investment mandate and global orientation; and (vii) reducing the transfer agency account fee rates on certain accounts.
Investment Performance. The Board considered whether the fund has operated in accordance with its investment objective, as well as its record of compliance with its investment restrictions. It also reviewed the fund's absolute investment performance for each class, as well as the fund's relative investment performance for each class measured over multiple periods against (i) a broad-based securities market index, and (ii) a peer group of mutual funds deemed appropriate by Fidelity and reviewed by the Board. The following charts considered by the Board show, over the one-, three-, and five-year periods ended December 31, 2010, the cumulative total returns of Institutional Class (Class I) and Class B of the fund, the cumulative total returns of a broad-based securities market index ("benchmark"), and a range of cumulative total returns of a peer group of mutual funds identified by Morningstar, Inc. as having an investment style similar to that of the fund based on underlying portfolio holdings. The returns of Institutional Class (Class I) and Class B show the performance of the highest and lowest performing classes, respectively (based on five-year performance). The box within each chart shows the 25th percentile return (bottom of box) and the 75th percentile return (top of box) of the peer group. Returns shown above the box are in the first quartile and returns shown below the box are in the fourth quartile. The percentage beaten numbers noted below each chart correspond to the percentile box and represent the percentage of funds in the peer group whose performance was equal to or lower than that of the class indicated.
Annual Report
Fidelity Advisor Overseas Fund
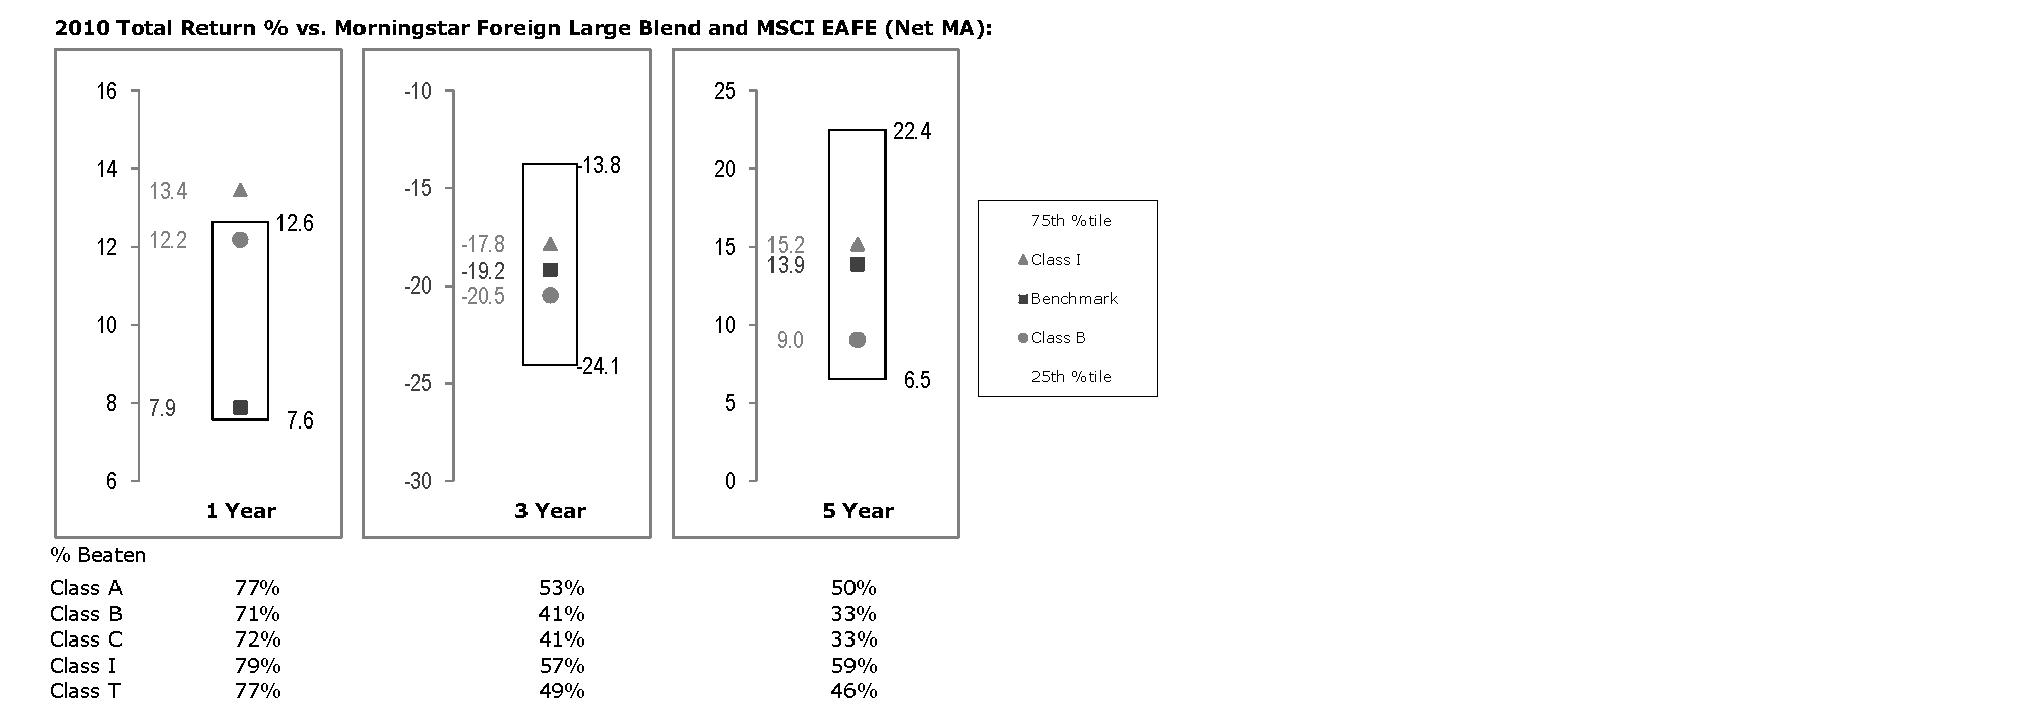
The Board reviewed the fund's relative investment performance against its peer group and noted that the performance of Institutional Class (Class I) of the fund was in the first quartile for the one-year period and the second quartile for the three- and five-year periods. The Board also noted that the investment performance of Institutional Class (Class I) of the fund compared favorably to its benchmark for all the periods shown. The Board considered that the variations in performance among the fund's classes reflect the variations in class expenses, which result in lower performance for higher expense classes. The Board also reviewed the fund's performance since inception as well as performance in the current year.
The Board also considered that the fund's management fee is subject to upward or downward adjustment depending upon whether, and to what extent, the fund's investment performance for the performance period exceeds, or is exceeded by, the record (over the same period) of a Board-approved performance adjustment index. The Board noted that the performance adjustment provides FMR with a strong economic incentive to seek to achieve superior performance for the fund's shareholders and helps to more closely align the interests of FMR and the fund's shareholders.
Based on its review, the Board concluded that the nature, extent, and quality of services provided to the fund under the Advisory Contracts should benefit the fund's shareholders.
Annual Report
Board Approval of Investment Advisory Contracts and
Management Fees - continued
Competitiveness of Management Fee and Total Expense Ratio. The Board considered the fund's management fee and total expense ratio compared to "mapped groups" of competitive funds and classes. Fidelity creates "mapped groups" by combining similar Lipper investment objective categories that have comparable management fee characteristics. Combining Lipper investment objective categories aids the Board's management fee and total expense ratio comparisons by broadening the competitive group used for comparison and by reducing the number of universes to which various Fidelity funds are compared.
Management Fee. The Board considered two proprietary management fee comparisons for the 12-month periods shown in the chart below. The group of Lipper funds used by the Board for management fee comparisons is referred to below as the "Total Mapped Group." The Total Mapped Group comparison focuses on a fund's standing relative to the total universe of comparable funds available to investors in terms of gross management fees before expense reimbursements or caps, and without giving effect to the fund's performance adjustment. "TMG %" represents the percentage of funds in the Total Mapped Group that had management fees that were lower than the fund's. For example, a TMG % of 16% means that 84% of the funds in the Total Mapped Group had higher management fees than the fund. The "Asset-Size Peer Group" (ASPG) comparison focuses on a fund's standing relative to non-Fidelity funds similar in size to the fund within the Total Mapped Group. The ASPG represents at least 15% of the funds in the Total Mapped Group with comparable asset size and management fee characteristics, subject to a minimum of 50 funds (or all funds in the Total Mapped Group if fewer than 50). Additional information, such as the ASPG quartile in which the fund's management fee ranked and the impact of the fund's performance adjustment, is also included in the chart and considered by the Board.
Annual Report
Fidelity Advisor Overseas Fund
The Board noted that the fund's management fee ranked below the median of its Total Mapped Group and below the median of its ASPG for 2010. The Board also noted the effect of the fund's positive performance adjustment on the fund's management fee ranking. The Board noted that the performance adjustment for each year represents calculations for performance periods that differ from the periods shown in the performance charts above.
Based on its review, the Board concluded that the fund's management fee is fair and reasonable in light of the services that the fund receives and the other factors considered.
Total Expense Ratio. In its review of each class's total expense ratio, the Board considered the fund's management fee as well as other fund or class expenses, as applicable, such as transfer agent fees, pricing and bookkeeping fees, fund-paid 12b-1 fees, and custodial, legal, and audit fees. The Board also noted the effects of any waivers and reimbursements on fees and expenses, as well as the impact of the fund's performance adjustment. As part of its review, the Board also considered the current and historical total expense ratios of each class of the fund compared to competitive fund median expenses. Each class of the fund is compared to those funds and classes in the Total Mapped Group (used by the Board for management fee comparisons) that have a similar sales load structure.
The Board noted that the total expense ratio of each of Class A, Class B, Class C, and Institutional Class ranked below its competitive median for 2010 and the total expense ratio of Class T ranked above its competitive median for 2010. The Board considered that various factors, including 12b-1 fees, positive or negative performance adjustments, and relatively higher other expenses in the case of small fund size, can affect total expense ratios. The Board noted that the total expense ratio of Class T was above the competitive median primarily because of higher 12b-1 fees on Class T. Class T has a higher 12b-1 fee, but a lower front-end sales charge, than traditionally priced front-end sales charge classes. The Board noted that the fund offers multiple classes, each of which has a different sales load and 12b-1 fee structure, and that the multiple structures are intended to offer a range of pricing options for the intermediary market. The Board also noted that the total expense ratios of the classes vary primarily by the level of their 12b-1 fees, although differences in transfer agent fees may also cause expenses to vary from class to class.
Annual Report
Board Approval of Investment Advisory Contracts and
Management Fees - continued
Fees Charged to Other Fidelity Clients. The Board also considered Fidelity fee structures and other information with respect to clients of FMR and its affiliates, such as other mutual funds advised or subadvised by FMR or its affiliates, pension plan clients, and other institutional clients. In March 2010, the Board created an ad hoc joint committee with the board of other Fidelity funds (the Committee) to review and compare Fidelity's institutional investment advisory business with its business of providing services to the Fidelity funds, including the differences in services provided, fees charged, and costs incurred, as well as competition in their respective marketplaces.
Based on its review of total expense ratios and fees charged to other Fidelity clients, the Board concluded that the total expense ratio of each class of the fund was reasonable, although Class T was above the median of the universe presented for comparison, in light of the services that the fund and its shareholders receive and the other factors considered, including the findings of the Committee.
Costs of the Services and Profitability. The Board considered the revenues earned and the expenses incurred by Fidelity in conducting the business of developing, marketing, distributing, managing, administering and servicing the fund and its shareholders. The Board also considered the level of Fidelity's profits in respect of all the Fidelity funds.
On an annual basis, FMR presents to the Board Fidelity's profitability for the fund. Fidelity calculates the profitability for each fund, as well as aggregate profitability for groups of Fidelity funds and all Fidelity funds, using a series of detailed revenue and cost allocation methodologies which originate with the books and records of Fidelity on which Fidelity's audited financial statements are based. The Audit Committee of the Board reviews any significant changes from the prior year's methodologies.
PricewaterhouseCoopers LLP (PwC), independent registered public accounting firm and auditor to Fidelity and certain Fidelity funds, has been engaged annually by the Board as part of the Board's assessment of Fidelity's profitability analysis. PwC's engagement includes the review and assessment of Fidelity's methodologies used in determining the revenues and expenses attributable to Fidelity's mutual fund business, and completion of agreed-upon procedures surrounding the mathematical accuracy of fund profitability and its conformity to allocation methodologies. After considering PwC's reports issued under the engagement and information provided by Fidelity, the Board concluded that while other allocation methods may also be reasonable, Fidelity's profitability methodologies are reasonable in all material respects.
Annual Report
The Board also reviewed Fidelity's non-fund businesses and fall-out benefits related to the mutual fund business as well as cases where Fidelity's affiliates may benefit from or be related to the fund's business.
The Board considered the costs of the services provided by and the profits realized by Fidelity in connection with the operation of the fund and was satisfied that the profitability was not excessive in the circumstances.
Economies of Scale. The Board considered whether there have been economies of scale in respect of the management of the Fidelity funds, whether the Fidelity funds (including the fund) have appropriately benefited from any such economies of scale, and whether there is potential for realization of any further economies of scale. The Board considered the extent to which the fund will benefit from economies of scale through increased services to the fund, through waivers or reimbursements, or through fee or expense reductions. The Board also noted that in 2009, it and the board of other Fidelity funds created an ad hoc committee (the Economies of Scale Committee) to analyze whether FMR attains economies of scale in respect of the management and servicing of the Fidelity funds, whether the Fidelity funds have appropriately benefited from such economies of scale, and whether there is potential for realization of any further economies of scale.
The Board recognized that the fund's management contract incorporates a "group fee" structure, which provides for lower group fee rates as total fund assets under FMR's management increase, and for higher group fee rates as total fund assets under FMR's management decrease. FMR calculates the group fee rates based on a tiered asset "breakpoint" schedule that varies based on asset class. The Board considered that the group fee is designed to deliver the benefits of economies of scale to fund shareholders when total Fidelity fund assets increase, even if assets of any particular fund are unchanged or have declined, because some portion of Fidelity's costs are attributable to services provided to all Fidelity funds, and all funds benefit if those costs can be allocated among more assets. The Board concluded that, given the group fee structure, fund shareholders will benefit from lower management fees as assets under FMR's management increase at the fund complex level, regardless of whether Fidelity achieves any such economies of scale.
Annual Report
Board Approval of Investment Advisory Contracts and
Management Fees - continued
The Board concluded, taking into account the analysis of the Economies of Scale Committee, that any potential economies of scale are being appropriately shared between fund shareholders and Fidelity.
Additional Information Requested by the Board. In order to develop fully the factual basis for consideration of the Fidelity funds' Advisory Contracts, the Board requested and received additional information on certain topics, including (i) fund performance trends, actions to be taken by FMR to improve certain funds' overall performance, and Fidelity's long-term strategies for certain funds; (ii) portfolio manager changes that have occurred during the past year and length of portfolio manager tenure for different categories of funds over time; (iii) Fidelity's compensation structure for portfolio managers and other key personnel and strategies for attracting and retaining non-investment personnel; (iv) the amount of the investment that each portfolio manager has made in the Fidelity fund(s) that he or she manages; (v) historical trends in Fidelity's realization of fall-out benefits; (vi) Fidelity's group fee structures and the rationale for the individual fee rates of certain funds; (vii) fund profitability methodology and the impact of certain factors on fund profitability results; (viii) trends regarding industry use of performance fee structures and Fidelity's compliance practices with respect to performance adjustment calculations; (ix) the fee structures in place for certain other Fidelity clients; and (x) explanations regarding the relative total expense ratios of certain funds and classes, total expense competitive trends, and actions that might be taken by FMR to reduce total expense ratios for certain funds and classes.
Based on its evaluation of all of the conclusions noted above, and after considering all factors it believed relevant, the Board ultimately concluded that the advisory fee structures are fair and reasonable, and that the fund's Advisory Contracts should be renewed.
Annual Report
Investment Adviser
Fidelity Management & Research Company
Boston, MA
Investment Sub-Advisers
FMR Co., Inc.
Fidelity Management & Research
(U.K.) Inc.
Fidelity Management & Research
(Hong Kong) Limited
FIL Investments (Japan) Limited
Fidelity Management & Research
(Japan) Inc.
FIL Investment Advisors (UK) Limited
FIL Investment Advisors
General Distributor
Fidelity Distributors Corporation
Boston, MA
Transfer and Service Agents
Fidelity Investments Institutional
Operations Company, Inc.
Boston, MA
Fidelity Service Company, Inc.
Boston, MA
Custodian
The Northern Trust Company
Chicago, IL
OS-UANN-1211
1.784767.108
(Fidelity Investment logo)(registered trademark)
Fidelity Advisor®
Overseas
Fund - Institutional Class
Annual Report
October 31, 2011
Contents
Chairman's Message | (Click Here) | The Chairman's message to shareholders. |
Performance | (Click Here) | How the fund has done over time. |
Management's Discussion of Fund Performance | (Click Here) | The Portfolio Manager's review of fund performance and strategy. |
Shareholder Expense Example | (Click Here) | An example of shareholder expenses. |
Investment Changes | (Click Here) | A summary of major shifts in the fund's investments over the past six months. |
Investments | (Click Here) | A complete list of the fund's investments with their market values. |
Financial Statements | (Click Here) | Statements of assets and liabilities, operations, and changes in net assets, as well as financial highlights. |
Notes | (Click Here) | Notes to the financial statements. |
Report of Independent Registered Public Accounting Firm | (Click Here) | |
Trustees and Officers | (Click Here) | |
Distributions | (Click Here) | |
Board Approval of Investment Advisory Contracts and Management Fees | (Click Here) | |
To view a fund's proxy voting guidelines and proxy voting record for the 12-month period ended June 30, visit http://www.fidelity.com/proxyvotingresults or visit the Securities and Exchange Commission's (SEC) web site at http://www.sec.gov. You may also call 1-877-208-0098 to request a free copy of the proxy voting guidelines.
Standard & Poor's, S&P and S&P 500 are registered service marks of The McGraw-Hill Companies, Inc. and have been licensed for use by Fidelity Distributors Corporation.
Other third party marks appearing herein are the property of their respective owners.
All other marks appearing herein are registered or unregistered trademarks or service marks of FMR LLC or an affiliated company.
Annual Report
This report and the financial statements contained herein are submitted for the general information of the shareholders of the fund. This report is not authorized for distribution to prospective investors in the fund unless preceded or accompanied by an effective prospectus.
A fund files its complete schedule of portfolio holdings with the SEC for the first and third quarters of each fiscal year on Form N-Q. Forms N-Q are available on the SEC's web site at http://www.sec.gov. A fund's Forms N-Q may be reviewed and copied at the SEC's Public Reference Room in Washington, DC. Information regarding the operation of the SEC's Public Reference Room may be obtained by calling 1-800-SEC-0330. For a complete list of a fund's portfolio holdings, view the most recent holdings listing, semiannual report, or annual report on Fidelity's web site at http://www.fidelity.com, http://www.advisor.fidelity.com, or http://www.401k.com, as applicable.
NOT FDIC INSURED • MAY LOSE VALUE • NO BANK GUARANTEE
Neither the fund nor Fidelity Distributors Corporation is a bank.
Annual Report
(photo_of_James_C_Curvey)
Dear Shareholder:
Global equity markets began the fourth quarter on a strong note, sharply reversing course in October amid strong corporate earnings, better-than-expected economic news and the promise of a resolution to the sovereign debt crisis in Europe. The mini rally followed a third quarter marked by a significant downturn in July and August, which heightened investor anxiety and set off a wave of volatility that hampered most major asset classes through the end of September. Financial markets are difficult to predict, of course, but you can help put the odds in your favor by following these time-tested investment principles.
One of the basic tenets is to invest according to your time horizon. For long-term investors, riding out the markets' inevitable ups and downs has proven much more effective than making decisions based on short-term developments. If your goal is approaching, you can also benefit from patience and restraint, rather than attempting to time the market. No matter your time horizon, missing only a few of the markets' best days can significantly diminish returns. Patience also affords the benefits of compounding - earning interest on additional income or reinvested dividends and capital gains. While staying the course doesn't eliminate risk, it can considerably lessen the negative impact of short-term downturns.
Asset allocation is another principle to manage risk. As you spread your portfolio among the asset classes, be sure to consider your time horizon, risk tolerance and investment objectives. Younger investors may be better served by emphasizing equities, which historically have been the best-performing asset class over time. Investors who are nearing a specific goal, such as retirement or sending a child to college, may choose to favor bonds and other investments that have tended to be more stable. Studies indicate that asset allocation is the single most important determinant of a portfolio's long-term success. After deciding on a suitable allocation strategy, make sure your portfolio is adequately diversified, with exposure to stocks of small-, mid- and large-cap companies in a range of sectors, for example. And today, more than ever, geographic diversification should be taken into account.
Lastly, investing a certain amount of money on a regular basis - a principle known as dollar-cost averaging - can help lower the average cost of your purchases, while also giving you the discipline to avoid selling weak performers just prior to an upswing, or chasing a hot performer just before a correction.
We invite you to learn more by visiting us on the Internet, dropping by one of our Investor Centers or calling us by phone. It is our privilege to provide the resources you need to choose investments that are right for you.
Sincerely,
(The acting chairman's signature appears here.)
James C. Curvey
Acting Chairman
Annual Report
Average annual total return reflects the change in the value of an investment, assuming reinvestment of the class' distributions from dividend income and capital gains (the profits earned upon the sale of securities that have grown in value, if any) and assuming a constant rate of performance each year. The $10,000 table and the fund's returns do not reflect the deduction of taxes that a shareholder would pay on fund distributions or the redemption of fund shares. During periods of reimbursement by Fidelity, a fund's total return will be greater than it would be had the reimbursement not occurred. How a fund did yesterday is no guarantee of how it will do tomorrow.
Average Annual Total Returns
Periods ended October 31, 2011 | | Past 1
year | Past 5
years | Past 10
years |
Institutional Class | | -7.70% | -1.73% | 5.03% |
$10,000 Over 10 Years
Let's say hypothetically that $10,000 was invested in Fidelity Advisor® Overseas Fund - Institutional Class on October 31, 2001. The chart shows how the value of your investment would have changed, and also shows how the MSCI® EAFE® Index (Europe, Australasia, Far East) performed over the same period.
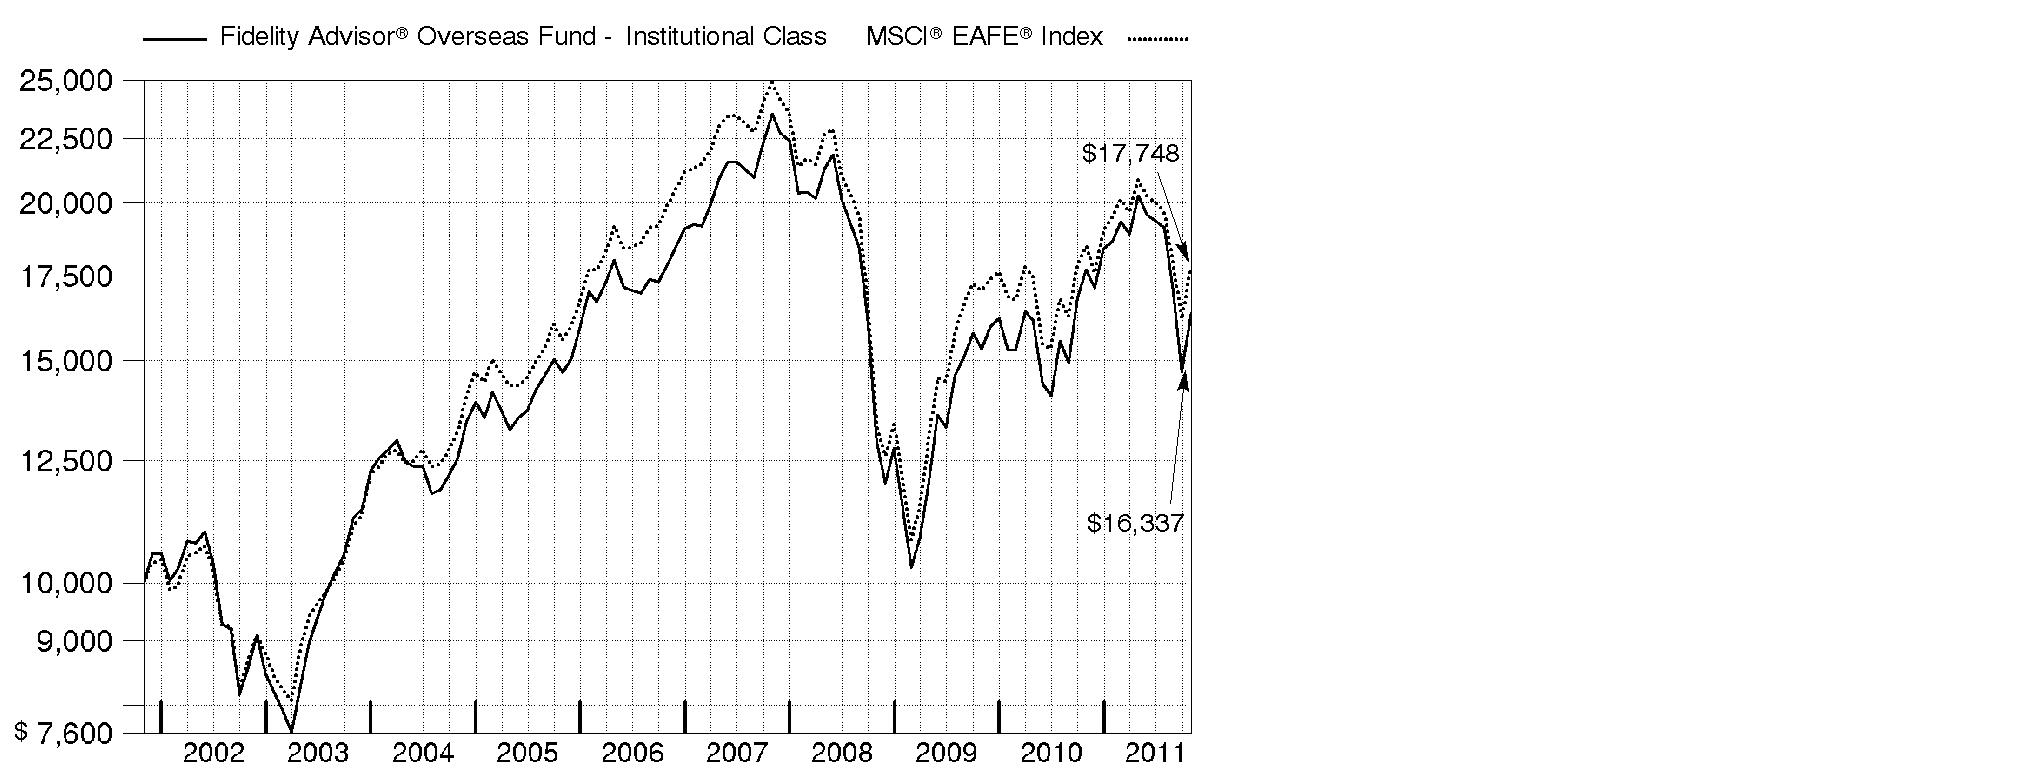
Annual Report
Market Recap: International equities were rocked by a number of headline events during the year ending October 31, 2011. Stocks posted a solid advance for the first half of the period, despite concern about the sovereign debt crisis in Europe, a devastating earthquake and tsunami in Japan, and political upheaval in the Middle East and North Africa. Sentiment turned decidedly negative in the second half, however, as fresh worries about Europe, inflation in China and a dimmed outlook for global growth caused foreign markets to suffer declines that intensified in August and September. October brought with it yet another dramatic swing, as eurozone policymakers appeared near a resolution to the debt debacle and buyers stormed back onto the scene in search of bargains. Still, those gains - along with favorable currency fluctuations overall - weren't enough to offset prior losses, and the MSCI® ACWI® (All Country World Index) ex USA Index finished the period down 4.56%. Within the MSCI index, Europe and emerging markets suffered the biggest declines, with many countries in these areas sustaining steep losses. By contrast, Japan showed resilience in the wake of its natural disasters, falling only 2%. Australia (+4%), Switzerland (+3%), the U.K. (+2%) and Canada, which produced a nominal return, were among the few major benchmark components to break into positive territory.
Comments from Graeme Rockett, Portfolio Manager of Fidelity Advisor® Overseas Fund: For the 12 months ending October 31, 2011, the fund's Institutional Class shares dropped 7.70%, underperforming the MSCI® EAFE® (Europe, Australasia, Far East) Index, which declined 3.97%. Versus the index, positioning in consumer staples, materials and energy detracted, as did stock picking in financials, health care and industrials. Conversely, picks in consumer durables and apparel, an underweighting in utilities and an overweighting in information technology helped. In geographic terms, stock picking in the U.K., Hong Kong, Australia and emerging markets hurt, but security selection in Germany and the U.S. (an out-of-benchmark region) contributed. Specific stocks that detracted included Alstom, a French producer of power-generation, emission-control and rail-transport equipment, and two non-index Chinese companies: apparel manufacturer and retailer Bosideng International Holding (which I sold during the period) and Internet gaming company Perfect World, domiciled in Grand Cayman. Three out-of-benchmark stocks helped the most: U.S.-based footwear company Deckers Outdoor; German high-end men's apparel manufacturer Hugo Boss; and Silver Base Group Holdings, a Chinese distributor of alcoholic beverages.
The views expressed above reflect those of the portfolio manager(s) only through the end of the period as stated on the cover of this report and do not necessarily represent the views of Fidelity or any other person in the Fidelity organization. Any such views are subject to change at any time based upon market or other conditions and Fidelity disclaims any responsibility to update such views. These views may not be relied on as investment advice and, because investment decisions for a Fidelity fund are based on numerous factors, may not be relied on as an indication of trading intent on behalf of any Fidelity fund.
Annual Report
Shareholder Expense Example
As a shareholder of the Fund, you incur two types of costs: (1) transaction costs, including sales charges (loads) on purchase payments or redemption proceeds, redemption fees, and (2) ongoing costs, including management fees, distribution and/or service (12b-1) fees and other Fund expenses. This Example is intended to help you understand your ongoing costs (in dollars) of investing in the Fund and to compare these costs with the ongoing costs of investing in other mutual funds.
The Example is based on an investment of $1,000 invested at the beginning of the period and held for the entire period (May 1, 2011 to October 31, 2011).
Actual Expenses
The first line of the accompanying table for each class of the Fund provides information about actual account values and actual expenses. You may use the information in this line, together with the amount you invested, to estimate the expenses that you paid over the period. Simply divide your account value by $1,000.00 (for example, an $8,600 account value divided by $1,000.00 = 8.6), then multiply the result by the number in the first line for a class of the Fund under the heading entitled "Expenses Paid During Period" to estimate the expenses you paid on your account during this period. In addition, the Fund, as a shareholder in the underlying Fidelity Central Funds, will indirectly bear its pro-rata share of the fees and expenses incurred by the underlying Fidelity Central Funds. These fees and expenses are not included in the Fund's annualized expense ratio used to calculate the expense estimate in the table below.
Hypothetical Example for Comparison Purposes
The second line of the accompanying table for each class of the Fund provides information about hypothetical account values and hypothetical expenses based on a Class' actual expense ratio and an assumed rate of return of 5% per year before expenses, which is not the Class' actual return. The hypothetical account values and expenses may not be used to estimate the actual ending account balance or expenses you paid for the period. You may use this information to compare the ongoing costs of investing in the Fund and other funds. To do so, compare this 5% hypothetical example with the 5% hypothetical examples that appear in the shareholder reports of the other funds. In addition, the Fund, as a shareholder in the underlying Fidelity Central Funds, will indirectly bear its pro-rata share of the fees and expenses incurred by the underlying Fidelity Central Funds. These fees and expenses are not included in the Fund's annualized expense ratio used to calculate the expense estimate in the table below.
Please note that the expenses shown in the table are meant to highlight your ongoing costs only and do not reflect any transaction costs. Therefore, the second line of the table is useful in comparing ongoing costs only, and will not help you determine the relative total costs of owning different funds. In addition, if these transactional costs were included, your costs would have been higher.
Annual Report
| Annualized
Expense Ratio | Beginning
Account Value
May 1, 2011 | Ending
Account Value
October 31, 2011 | Expenses Paid
During Period*
May 1, 2011 to
October 31, 2011 |
Class A | 1.31% | | | |
Actual | | $ 1,000.00 | $ 805.70 | $ 5.96 |
HypotheticalA | | $ 1,000.00 | $ 1,018.60 | $ 6.67 |
Class T | 1.48% | | | |
Actual | | $ 1,000.00 | $ 804.50 | $ 6.73 |
HypotheticalA | | $ 1,000.00 | $ 1,017.74 | $ 7.53 |
Class B | 2.05% | | | |
Actual | | $ 1,000.00 | $ 802.30 | $ 9.31 |
HypotheticalA | | $ 1,000.00 | $ 1,014.87 | $ 10.41 |
Class C | 2.06% | | | |
Actual | | $ 1,000.00 | $ 802.20 | $ 9.36 |
HypotheticalA | | $ 1,000.00 | $ 1,014.82 | $ 10.46 |
Institutional Class | .96% | | | |
Actual | | $ 1,000.00 | $ 806.80 | $ 4.37 |
HypotheticalA | | $ 1,000.00 | $ 1,020.37 | $ 4.89 |
A 5% return per year before expenses
* Expenses are equal to each Class' annualized expense ratio, multiplied by the average account value over the period, multiplied by 184/365 (to reflect the one-half year period).
Annual Report
Investment Changes (Unaudited)
Top Five Stocks as of October 31, 2011 |
| % of fund's
net assets | % of fund's net assets
6 months ago |
HSBC Holdings PLC (United Kingdom, Commercial Banks) | 2.1 | 2.0 |
Novo Nordisk A/S Series B (Denmark, Pharmaceuticals) | 2.0 | 2.1 |
Volkswagen AG (Germany, Automobiles) | 2.0 | 2.0 |
Rakuten, Inc. (Japan, Internet & Catalog Retail) | 2.0 | 0.6 |
LVMH Moet Hennessy - Louis Vuitton (France, Textiles, Apparel & Luxury Goods) | 1.8 | 2.9 |
| 9.9 | |
Top Five Market Sectors as of October 31, 2011 |
| % of fund's
net assets | % of fund's net assets
6 months ago |
Consumer Discretionary | 23.5 | 25.6 |
Financials | 17.6 | 21.8 |
Materials | 12.1 | 11.0 |
Information Technology | 10.9 | 10.2 |
Industrials | 8.7 | 10.6 |
Top Five Countries as of October 31, 2011 |
(excluding cash equivalents) | % of fund's
net assets | % of fund's net assets
6 months ago |
United Kingdom | 18.5 | 17.6 |
Japan | 15.6 | 14.6 |
France | 12.6 | 11.7 |
Germany | 11.6 | 13.7 |
Switzerland | 7.6 | 6.1 |
Percentages are adjusted for the effect of open futures contracts, if applicable. |
Asset Allocation (% of fund's net assets) |
As of October 31, 2011 | As of April 30, 2011 |
| Stocks 98.1% | | | Stocks 99.9% | |
| Short-Term
Investments and
Net Other Assets 1.9% | | | Short-Term
Investments and
Net Other Assets 0.1% | |

Annual Report
Investments October 31, 2011
Showing Percentage of Net Assets
Common Stocks - 96.1% |
| Shares | | Value (000s) |
Australia - 2.8% |
BHP Billiton Ltd. | 211,768 | | $ 8,290 |
Fortescue Metals Group Ltd. | 208,017 | | 1,045 |
Macquarie Group Ltd. | 82,615 | | 2,127 |
Newcrest Mining Ltd. | 172,572 | | 6,100 |
Westfield Group unit | 344,639 | | 2,775 |
TOTAL AUSTRALIA | | 20,337 |
Bailiwick of Jersey - 0.4% |
WPP PLC | 310,041 | | 3,210 |
Belgium - 0.3% |
Ageas | 410,900 | | 830 |
Hamon & Compagnie International SA | 60,300 | | 1,520 |
TOTAL BELGIUM | | 2,350 |
Bermuda - 1.3% |
Clear Media Ltd. (a) | 1,278,000 | | 487 |
Huabao International Holdings Ltd. | 2,087,000 | | 1,326 |
Li & Fung Ltd. | 392,000 | | 755 |
Oriental Watch Holdings Ltd. | 6,012,000 | | 3,469 |
Signet Jewelers Ltd. | 82,600 | | 3,561 |
TOTAL BERMUDA | | 9,598 |
Brazil - 0.1% |
Drogasil SA | 47,700 | | 300 |
Marisa Lojas SA | 36,200 | | 500 |
TOTAL BRAZIL | | 800 |
British Virgin Islands - 0.4% |
Gem Diamonds Ltd. (a) | 261,700 | | 934 |
Mail.ru Group Ltd.: | | | |
GDR (a)(e) | 4,200 | | 145 |
GDR (Reg. S) | 63,100 | | 2,174 |
TOTAL BRITISH VIRGIN ISLANDS | | 3,253 |
Canada - 1.6% |
Barrick Gold Corp. | 31,100 | | 1,535 |
Kinross Gold Corp. | 103,200 | | 1,471 |
Potash Corp. of Saskatchewan, Inc. | 89,900 | | 4,255 |
Suncor Energy, Inc. | 102,800 | | 3,274 |
Yamana Gold, Inc. | 97,300 | | 1,452 |
TOTAL CANADA | | 11,987 |
Common Stocks - continued |
| Shares | | Value (000s) |
Cayman Islands - 4.3% |
Biostime International Holdings Ltd. | 59,500 | | $ 106 |
E-Commerce China Dangdang, Inc. ADR (d) | 38,000 | | 265 |
Hengdeli Holdings Ltd. | 25,890,000 | | 11,607 |
Home Inns & Hotels Management, Inc. sponsored ADR (a) | 32,200 | | 1,100 |
Natural Beauty Bio-Technology Ltd. | 6,200,000 | | 943 |
Noah Holdings Ltd. sponsored ADR (d) | 69,800 | | 609 |
Perfect World Co. Ltd. sponsored ADR Class B (a) | 280,900 | | 3,655 |
Renren, Inc. ADR (d) | 15,000 | | 106 |
Shenguan Holdings Group Ltd. | 2,022,000 | | 1,086 |
Silver Base Group Holdings Ltd. | 3,662,000 | | 3,900 |
Tencent Holdings Ltd. | 358,300 | | 8,287 |
TOTAL CAYMAN ISLANDS | | 31,664 |
China - 0.4% |
Baidu.com, Inc. sponsored ADR (a) | 22,300 | | 3,126 |
Denmark - 2.4% |
Carlsberg A/S Series B | 24,900 | | 1,695 |
Danske Bank A/S (a) | 51,111 | | 708 |
Novo Nordisk A/S: | | | |
Series B | 19,863 | | 2,109 |
Series B sponsored ADR | 120,700 | | 12,830 |
TOTAL DENMARK | | 17,342 |
France - 12.6% |
Accor SA | 93,900 | | 3,087 |
Alstom SA | 345,231 | | 12,947 |
Atos Origin SA | 37,421 | | 1,814 |
AXA SA | 46,658 | | 760 |
AXA SA sponsored ADR | 89,200 | | 1,441 |
BNP Paribas SA | 82,622 | | 3,756 |
Club Mediterranee SA (a) | 53,000 | | 1,006 |
Compagnie Generale de Geophysique SA (a) | 96,000 | | 2,098 |
Credit Agricole SA (d) | 74,474 | | 585 |
Danone | 128,222 | | 8,926 |
Gameloft (a) | 201,700 | | 1,125 |
GDF Suez | 94,700 | | 2,689 |
Iliad SA | 18,000 | | 2,107 |
Ingenico SA | 60,657 | | 2,401 |
Ipsos SA | 63,360 | | 2,081 |
Lafarge SA (Bearer) | 44,500 | | 1,815 |
Laurent-Perrier Group | 3,300 | | 340 |
LVMH Moet Hennessy - Louis Vuitton | 81,400 | | 13,546 |
Common Stocks - continued |
| Shares | | Value (000s) |
France - continued |
Pernod-Ricard SA | 64,800 | | $ 6,053 |
PPR SA | 7,200 | | 1,125 |
Safran SA | 86,100 | | 2,820 |
Sanofi-aventis | 34,620 | | 2,477 |
Sanofi-aventis sponsored ADR | 233,600 | | 8,351 |
Societe Generale Series A | 52,613 | | 1,536 |
Total SA | 94,200 | | 4,916 |
Total SA sponsored ADR | 19,400 | | 1,015 |
Vivendi | 65,063 | | 1,463 |
TOTAL FRANCE | | 92,280 |
Germany - 9.6% |
adidas AG | 123,900 | | 8,772 |
Allianz AG | 46,552 | | 5,232 |
Bayer AG | 58,540 | | 3,751 |
Bayerische Motoren Werke AG (BMW) | 25,448 | | 2,080 |
Commerzbank AG (a) | 235,000 | | 580 |
Deutsche Bank AG | 72,900 | | 3,015 |
Deutsche Boerse AG | 62,469 | | 3,458 |
Deutsche Post AG | 145,871 | | 2,223 |
E.ON AG | 124,333 | | 3,013 |
HeidelbergCement AG | 72,400 | | 3,304 |
Hugo Boss AG | 44,400 | | 3,885 |
K&S AG | 23,400 | | 1,489 |
Kabel Deutschland Holding AG (a) | 61,600 | | 3,517 |
Linde AG | 13,429 | | 2,136 |
Munich Re Group | 13,555 | | 1,828 |
Puma AG | 25,923 | | 8,359 |
SAP AG | 122,957 | | 7,436 |
SAP AG sponsored ADR (d) | 96,600 | | 5,831 |
Tom Tailor Holding AG (a) | 33,100 | | 517 |
TOTAL GERMANY | | 70,426 |
Greece - 0.2% |
Folli Follie Group (a) | 137,123 | | 1,653 |
Hong Kong - 1.3% |
AIA Group Ltd. | 780,200 | | 2,386 |
China Unicom (Hong Kong) Ltd. sponsored ADR (d) | 116,500 | | 2,343 |
Henderson Land Development Co. Ltd. | 222,334 | | 1,215 |
Hutchison Whampoa Ltd. | 138,000 | | 1,262 |
Television Broadcasts Ltd. | 454,000 | | 2,616 |
TOTAL HONG KONG | | 9,822 |
Common Stocks - continued |
| Shares | | Value (000s) |
Ireland - 3.3% |
CRH PLC | 712,498 | | $ 12,863 |
Kingspan Group PLC (United Kingdom) | 671,700 | | 6,024 |
Paddy Power PLC (Ireland) | 102,800 | | 5,691 |
TOTAL IRELAND | | 24,578 |
Israel - 0.1% |
Israel Chemicals Ltd. | 64,100 | | 771 |
Italy - 3.3% |
Assicurazioni Generali SpA | 97,900 | | 1,765 |
ENI SpA | 65,900 | | 1,457 |
ENI SpA sponsored ADR (d) | 22,300 | | 982 |
Intesa Sanpaolo SpA | 888,801 | | 1,588 |
Saipem SpA | 298,214 | | 13,371 |
Sorin SpA (a) | 1,916,000 | | 4,012 |
UniCredit SpA | 832,294 | | 977 |
TOTAL ITALY | | 24,152 |
Japan - 15.6% |
Aozora Bank Ltd. | 918,000 | | 2,321 |
Calbee, Inc. | 26,800 | | 1,222 |
Canon, Inc. | 90,500 | | 4,109 |
CyberAgent, Inc. (d) | 371 | | 1,251 |
Dai-ichi Mutual Life Insurance Co. | 1,169 | | 1,331 |
DeNA Co. Ltd. | 37,700 | | 1,627 |
Denso Corp. | 53,900 | | 1,658 |
eAccess Ltd. (d) | 2,580 | | 697 |
Fanuc Corp. | 15,200 | | 2,458 |
Fuji Media Holdings, Inc. | 1,029 | | 1,472 |
GREE, Inc. | 53,600 | | 1,730 |
Honda Motor Co. Ltd. | 133,300 | | 3,987 |
Japan Tobacco, Inc. | 350 | | 1,750 |
JFE Holdings, Inc. | 72,700 | | 1,384 |
Kakaku.com, Inc. | 50,400 | | 1,996 |
KDDI Corp. | 1,175 | | 8,608 |
Keyence Corp. | 14,000 | | 3,559 |
Mazda Motor Corp. (a) | 667,000 | | 1,402 |
Mitsubishi Corp. | 271,700 | | 5,589 |
Mitsubishi Estate Co. Ltd. | 89,000 | | 1,508 |
Mitsubishi UFJ Financial Group, Inc. | 1,320,700 | | 5,740 |
Mitsubishi UFJ Financial Group, Inc. sponsored ADR (d) | 233,500 | | 1,011 |
Mitsui & Co. Ltd. | 377,600 | | 5,512 |
MS&AD Insurance Group Holdings, Inc. | 79,900 | | 1,565 |
Common Stocks - continued |
| Shares | | Value (000s) |
Japan - continued |
Murata Manufacturing Co. Ltd. | 12,900 | | $ 721 |
NKSJ Holdings, Inc. | 69,000 | | 1,380 |
Nomura Holdings, Inc. | 301,900 | | 1,150 |
ORIX Corp. | 36,650 | | 3,199 |
Rakuten, Inc. | 13,264 | | 14,542 |
SOFTBANK CORP. | 159,700 | | 5,184 |
Sony Corp. | 37,500 | | 782 |
Start Today Co. Ltd. | 175,700 | | 3,717 |
Sumitomo Mitsui Financial Group, Inc. | 149,600 | | 4,182 |
Tokio Marine Holdings, Inc. | 71,800 | | 1,712 |
Tokyo Electron Ltd. | 18,900 | | 1,005 |
Toshiba Corp. | 694,000 | | 3,027 |
Toyota Motor Corp. | 232,000 | | 7,704 |
Toyota Motor Corp. sponsored ADR | 17,600 | | 1,174 |
Yahoo! Japan Corp. | 5,164 | | 1,659 |
TOTAL JAPAN | | 114,625 |
Korea (South) - 0.5% |
Samsung Electronics Co. Ltd. | 4,015 | | 3,443 |
Luxembourg - 0.3% |
ArcelorMittal SA Class A unit (d) | 66,500 | | 1,379 |
L'Occitane Ltd. (a) | 519,500 | | 1,145 |
TOTAL LUXEMBOURG | | 2,524 |
Netherlands - 1.7% |
AEGON NV (a) | 212,400 | | 1,013 |
ASML Holding NV | 31,300 | | 1,312 |
Gemalto NV | 23,756 | | 1,084 |
ING Groep NV: | | | |
(Certificaten Van Aandelen) (a) | 239,010 | | 2,061 |
sponsored ADR (a) | 79,100 | | 683 |
Koninklijke Philips Electronics NV | 202,806 | | 4,222 |
Koninklijke Philips Electronics NV (depositary receipt) (NY Reg.) | 98,500 | | 2,054 |
TOTAL NETHERLANDS | | 12,429 |
Norway - 1.0% |
Aker Solutions ASA | 236,700 | | 2,753 |
DnB NOR ASA | 176,400 | | 2,058 |
StatoilHydro ASA | 12,300 | | 312 |
StatoilHydro ASA sponsored ADR (d) | 71,500 | | 1,818 |
TOTAL NORWAY | | 6,941 |
Common Stocks - continued |
| Shares | | Value (000s) |
Singapore - 0.2% |
United Overseas Bank Ltd. | 125,627 | | $ 1,703 |
South Africa - 0.2% |
Impala Platinum Holdings Ltd. | 48,200 | | 1,114 |
Spain - 2.3% |
Banco Bilbao Vizcaya Argentaria SA (d) | 354,547 | | 3,191 |
Banco Santander SA: | | | |
rights 10/31/11 | 659,888 | | 114 |
(Spain) | 659,888 | | 5,586 |
(Spain) sponsored ADR (d) | 17,600 | | 151 |
EDP Renovaveis SA (a) | 451,605 | | 2,712 |
Iberdrola SA | 232,500 | | 1,692 |
NH Hoteles SA (a) | 235,800 | | 1,160 |
Telefonica SA (d) | 102,662 | | 2,182 |
TOTAL SPAIN | | 16,788 |
Sweden - 0.8% |
Nordea Bank AB | 218,400 | | 1,998 |
Swedbank AB (A Shares) | 59,512 | | 838 |
Swedish Match Co. | 85,800 | | 2,969 |
TOTAL SWEDEN | | 5,805 |
Switzerland - 7.6% |
Adecco SA (Reg.) | 180,028 | | 8,700 |
Compagnie Financiere Richemont SA Series A | 196,788 | | 11,268 |
Credit Suisse Group | 50,181 | | 1,448 |
Credit Suisse Group sponsored ADR (d) | 37,100 | | 1,075 |
Julius Baer Group Ltd. | 42,050 | | 1,598 |
Roche Holding AG (participation certificate) | 40,853 | | 6,736 |
Sika AG (Bearer) | 1,180 | | 2,322 |
Swiss Re Ltd. | 27,990 | | 1,538 |
Syngenta AG (Switzerland) | 16,950 | | 5,166 |
The Swatch Group AG (Bearer) | 19,640 | | 8,317 |
Transocean Ltd. (United States) | 36,600 | | 2,092 |
UBS AG (a) | 207,798 | | 2,627 |
UBS AG (NY Shares) (a) | 68,377 | | 863 |
Zurich Financial Services AG | 8,097 | | 1,880 |
TOTAL SWITZERLAND | | 55,630 |
Common Stocks - continued |
| Shares | | Value (000s) |
Taiwan - 0.7% |
Catcher Technology Co. Ltd. | 112,000 | | $ 624 |
HTC Corp. | 205,920 | | 4,628 |
TOTAL TAIWAN | | 5,252 |
United Kingdom - 18.5% |
Anglo American PLC: | | | |
ADR | 89,346 | | 1,639 |
(United Kingdom) | 118,359 | | 4,366 |
ARM Holdings PLC | 135,900 | | 1,275 |
Aviva PLC | 334,000 | | 1,822 |
Barclays PLC | 1,334,884 | | 4,139 |
Barclays PLC sponsored ADR | 243,800 | | 3,050 |
BG Group PLC | 424,518 | | 9,261 |
BHP Billiton PLC | 192,986 | | 6,078 |
BP PLC sponsored ADR | 176,266 | | 7,787 |
Diageo PLC | 291,229 | | 6,028 |
Dunelm Group PLC | 126,400 | | 1,012 |
Hays PLC | 1,126,800 | | 1,435 |
HSBC Holdings PLC: | | | |
(United Kingdom) | 95,104 | | 830 |
sponsored ADR | 333,633 | | 14,566 |
Imperial Tobacco Group PLC | 274,076 | | 10,023 |
Intertek Group PLC | 85,300 | | 2,819 |
Johnson Matthey PLC | 58,354 | | 1,763 |
Legal & General Group PLC | 813,369 | | 1,445 |
Lloyds Banking Group PLC (a) | 4,767,999 | | 2,466 |
Lloyds Banking Group PLC sponsored ADR (a)(d) | 214,200 | | 441 |
M&C Saatchi | 887,505 | | 1,698 |
Man Group PLC | 825,945 | | 1,991 |
Prudential PLC | 125,264 | | 1,294 |
Reckitt Benckiser Group PLC | 133,000 | | 6,840 |
Rio Tinto PLC | 125,232 | | 6,776 |
Rio Tinto PLC sponsored ADR | 55,800 | | 3,017 |
Rolls-Royce Group PLC | 162,800 | | 1,839 |
Rolls-Royce Group PLC Class C | 11,233,200 | | 18 |
Royal Bank of Scotland Group PLC (a) | 1,512,600 | | 584 |
Royal Dutch Shell PLC Class B | 154,486 | | 5,544 |
Standard Chartered PLC (United Kingdom) | 131,807 | | 3,093 |
Sthree PLC | 190,600 | | 874 |
Tesco PLC | 116,900 | | 755 |
Vodafone Group PLC | 2,742,369 | | 7,616 |
Vodafone Group PLC sponsored ADR | 13,500 | | 376 |
Common Stocks - continued |
| Shares | | Value (000s) |
United Kingdom - continued |
William Hill PLC | 1,723,600 | | $ 5,987 |
Xstrata PLC | 317,400 | | 5,337 |
TOTAL UNITED KINGDOM | | 135,884 |
United States of America - 2.3% |
Apple, Inc. (a) | 15,600 | | 6,315 |
Deckers Outdoor Corp. (a) | 47,300 | | 5,451 |
Google, Inc. Class A (a) | 8,800 | | 5,215 |
TOTAL UNITED STATES OF AMERICA | | 16,981 |
TOTAL COMMON STOCKS (Cost $734,788) | 706,468 |
Nonconvertible Preferred Stocks - 2.0% |
| | | |
Germany - 2.0% |
Volkswagen AG
(Cost $11,213) | 84,600 | | 14,850 |
Money Market Funds - 1.9% |
| | | |
Fidelity Cash Central Fund, 0.12% (b) | 703,907 | | 704 |
Fidelity Securities Lending Cash Central Fund, 0.11% (b)(c) | 13,432,705 | | 13,433 |
TOTAL MONEY MARKET FUNDS (Cost $14,137) | 14,137 |
TOTAL INVESTMENT PORTFOLIO - 100.0% (Cost $760,138) | | 735,455 |
NET OTHER ASSETS (LIABILITIES) - 0.0% | | 190 |
NET ASSETS - 100% | $ 735,645 |
Legend |
(a) Non-income producing |
(b) Affiliated fund that is available only to investment companies and other accounts managed by Fidelity Investments. The rate quoted is the annualized seven-day yield of the fund at period end. A complete unaudited listing of the fund's holdings as of its most recent quarter end is available upon request. In addition, each Fidelity Central Fund's financial statements, which are not covered by the Fund's Report of Independent Registered Public Accounting Firm, are available on the SEC's website or upon request. |
(c) Investment made with cash collateral received from securities on loan. |
(d) Security or a portion of the security is on loan at period end. |
(e) Security exempt from registration under Rule 144A of the Securities Act of 1933. These securities may be resold in transactions exempt from registration, normally to qualified institutional buyers. At the end of the period, the value of these securities amounted to $145,000 or 0.0% of net assets. |
Affiliated Central Funds |
Information regarding fiscal year to date income earned by the Fund from investments in Fidelity Central Funds is as follows: |
Fund | Income earned
(Amounts in thousands) |
Fidelity Cash Central Fund | $ 10 |
Fidelity Securities Lending Cash Central Fund | 848 |
Total | $ 858 |
Other Information |
The following is a summary of the inputs used, as of October 31, 2011, involving the Fund's assets and liabilities carried at fair value. The inputs or methodology used for valuing securities may not be an indication of the risk associated with investing in those securities. For more information on valuation inputs, and their aggregation into the levels used in the table below, please refer to the Security Valuation section in the accompanying Notes to Financial Statements. |
Valuation Inputs at Reporting Date: |
Description
(Amounts in thousands) | Total | Level 1 | Level 2 | Level 3 |
Investments in Securities: | | | | |
Equities: | | | | |
United Kingdom | $ 135,884 | $ 91,432 | $ 44,452 | $ - |
Japan | 114,625 | 2,185 | 112,440 | - |
France | 92,280 | 82,789 | 9,491 | - |
Germany | 85,276 | 74,825 | 10,451 | - |
Switzerland | 55,630 | 46,389 | 9,241 | - |
Cayman Islands | 31,664 | 5,735 | 25,929 | - |
Ireland | 24,578 | 11,715 | 12,863 | - |
Italy | 24,152 | 22,695 | 1,457 | - |
Australia | 20,337 | - | 20,337 | - |
Other | 136,892 | 87,947 | 48,945 | - |
Money Market Funds | 14,137 | 14,137 | - | - |
Total Investments in Securities: | $ 735,455 | $ 439,849 | $ 295,606 | $ - |
Income Tax Information |
At October 31, 2011, the Fund had a capital loss carryforward of approximately $104,924,000 which will expire in fiscal 2017. Capital loss carryforwards are only available to offset future capital gains of the Fund to the extent provided by regulations and may be limited. |
See accompanying notes which are an integral part of the financial statements.
Annual Report
Statement of Assets and Liabilities
Amounts in thousands (except per-share amounts) | October 31, 2011 |
Assets | | |
Investment in securities, at value (including securities loaned of $12,495) - See accompanying schedule: Unaffiliated issuers (cost $746,001) | $ 721,318 | |
Fidelity Central Funds (cost $14,137) | 14,137 | |
Total Investments (cost $760,138) | | $ 735,455 |
Foreign currency held at value (cost $11) | | 11 |
Receivable for investments sold | | 18,456 |
Receivable for fund shares sold | | 219 |
Dividends receivable | | 2,107 |
Distributions receivable from Fidelity Central Funds | | 13 |
Prepaid expenses | | 3 |
Other receivables | | 153 |
Total assets | | 756,417 |
| | |
Liabilities | | |
Payable for investments purchased | $ 5,239 | |
Payable for fund shares redeemed | 1,376 | |
Accrued management fee | 311 | |
Distribution and service plan fees payable | 153 | |
Other affiliated payables | 172 | |
Other payables and accrued expenses | 88 | |
Collateral on securities loaned, at value | 13,433 | |
Total liabilities | | 20,772 |
| | |
Net Assets | | $ 735,645 |
Net Assets consist of: | | |
Paid in capital | | $ 871,136 |
Undistributed net investment income | | 9,657 |
Accumulated undistributed net realized gain (loss) on investments and foreign currency transactions | | (120,523) |
Net unrealized appreciation (depreciation) on investments and assets and liabilities in foreign currencies | | (24,625) |
Net Assets | | $ 735,645 |
See accompanying notes which are an integral part of the financial statements.
Annual Report
Financial Statements - continued
Statement of Assets and Liabilities - continued
Amounts in thousands (except per-share amounts) | October 31, 2011 |
| | |
Calculation of Maximum Offering Price Class A:
Net Asset Value and redemption price per share ($59,654 ÷ 3,698.9 shares) | | $ 16.13 |
| | |
Maximum offering price per share (100/94.25 of $16.13) | | $ 17.11 |
Class T:
Net Asset Value and redemption price per share ($304,508 ÷ 18,452.5 shares) | | $ 16.50 |
| | |
Maximum offering price per share (100/96.50 of $16.50) | | $ 17.10 |
Class B:
Net Asset Value and offering price per share ($4,166 ÷ 267.4 shares)A | | $ 15.58 |
| | |
Class C:
Net Asset Value and offering price per share ($18,757 ÷ 1,188.3 shares)A | | $ 15.78 |
| | |
Institutional Class:
Net Asset Value, offering price and redemption price per share ($348,560 ÷ 21,183.6 shares) | | $ 16.45 |
A Redemption price per share is equal to net asset value less any applicable contingent deferred sales charge.
See accompanying notes which are an integral part of the financial statements.
Annual Report
Statement of Operations
Amounts in thousands | Year ended October 31, 2011 |
Investment Income | | |
Dividends | | $ 23,661 |
Income from Fidelity Central Funds | | 858 |
Income before foreign taxes withheld | | 24,519 |
Less foreign taxes withheld | | (2,035) |
Total income | | 22,484 |
| | |
Expenses | | |
Management fee
Basic fee | $ 7,177 | |
Performance adjustment | (25) | |
Transfer agent fees | 2,245 | |
Distribution and service plan fees | 2,245 | |
Accounting and security lending fees | 481 | |
Custodian fees and expenses | 197 | |
Independent trustees' compensation | 6 | |
Registration fees | 70 | |
Audit | 82 | |
Legal | 5 | |
Interest | 1 | |
Miscellaneous | 11 | |
Total expenses before reductions | 12,495 | |
Expense reductions | (280) | 12,215 |
Net investment income (loss) | | 10,269 |
Realized and Unrealized Gain (Loss) Net realized gain (loss) on: | | |
Investment securities: | | |
Unaffiliated issuers | 139,396 | |
Foreign currency transactions | (314) | |
Total net realized gain (loss) | | 139,082 |
Change in net unrealized appreciation (depreciation) on: Investment securities | (202,738) | |
Assets and liabilities in foreign currencies | (49) | |
Total change in net unrealized appreciation (depreciation) | | (202,787) |
Net gain (loss) | | (63,705) |
Net increase (decrease) in net assets resulting from operations | | $ (53,436) |
See accompanying notes which are an integral part of the financial statements.
Annual Report
Financial Statements - continued
Statement of Changes in Net Assets
Amounts in thousands | Year ended
October 31,
2011 | Year ended
October 31,
2010 |
Increase (Decrease) in Net Assets | | |
Operations | | |
Net investment income (loss) | $ 10,269 | $ 14,198 |
Net realized gain (loss) | 139,082 | 73,737 |
Change in net unrealized appreciation (depreciation) | (202,787) | 72,077 |
Net increase (decrease) in net assets resulting
from operations | (53,436) | 160,012 |
Distributions to shareholders from net investment income | (12,982) | (17,905) |
Distributions to shareholders from net realized gain | (2,756) | (2,268) |
Total distributions | (15,738) | (20,173) |
Share transactions - net increase (decrease) | (342,819) | (188,997) |
Redemption fees | 20 | 22 |
Total increase (decrease) in net assets | (411,973) | (49,136) |
| | |
Net Assets | | |
Beginning of period | 1,147,618 | 1,196,754 |
End of period (including undistributed net investment income of $9,657 and undistributed net investment income of $12,989, respectively) | $ 735,645 | $ 1,147,618 |
See accompanying notes which are an integral part of the financial statements.
Annual Report
Financial Highlights - Class A
Years ended October 31, | 2011 | 2010 | 2009 | 2008 | 2007 |
Selected Per-Share Data | | | | | |
Net asset value, beginning of period | $ 17.77 | $ 15.68 | $ 13.56 | $ 26.85 | $ 21.67 |
Income from Investment Operations | | | | | |
Net investment income (loss) C | .16 | .17 | .24 | .38 | .31 |
Net realized and unrealized gain (loss) | (1.54) | 2.16 | 2.12 | (11.56) | 6.16 |
Total from investment operations | (1.38) | 2.33 | 2.36 | (11.18) | 6.47 |
Distributions from net investment income | (.21) | (.21) | (.24) | (.33) | (.23) |
Distributions from net realized gain | (.05) | (.03) | - | (1.78) | (1.06) |
Total distributions | (.26) | (.24) | (.24) | (2.11) | (1.29) |
Redemption fees added to paid in capital C, G | - | - | - | - | - |
Net asset value, end of period | $ 16.13 | $ 17.77 | $ 15.68 | $ 13.56 | $ 26.85 |
Total Return A, B | (7.95)% | 14.99% | 17.97% | (45.08)% | 31.44% |
Ratios to Average Net Assets D, F | | | | | |
Expenses before reductions | 1.34% | 1.36% | 1.36% | 1.35% | 1.17% |
Expenses net of fee waivers, if any | 1.34% | 1.36% | 1.36% | 1.35% | 1.17% |
Expenses net of all reductions | 1.32% | 1.33% | 1.33% | 1.32% | 1.13% |
Net investment income (loss) | .90% | 1.04% | 1.79% | 1.83% | 1.34% |
Supplemental Data | | | | | |
Net assets, end of period (in millions) | $ 60 | $ 70 | $ 72 | $ 73 | $ 147 |
Portfolio turnover rate E | 44% | 53% | 83% | 79% | 66% |
A Total returns would have been lower if certain expenses had not been reduced during the applicable periods shown.
B Total returns do not include the effect of the sales charges.
C Calculated based on average shares outstanding during the period.
D Fees and expenses of any underlying Fidelity Central Funds are not included in the Fund's expense ratio. The Fund indirectly bears its proportionate share of the expenses of any underlying Fidelity Central Funds.
E Amount does not include the portfolio activity of any underlying Fidelity Central Funds.
F Expense ratios reflect operating expenses of the class. Expenses before reductions do not reflect amounts reimbursed by the investment adviser or reductions from brokerage service arrangements or reductions from other expense offset arrangements and do not represent the amount paid by the class during periods when reimbursements or reductions occur. Expenses net of fee waivers reflect expenses after reimbursement by the investment adviser but prior to reductions from brokerage service arrangements or other expense offset arrangements. Expenses net of all reductions represent the net expenses paid by the class.
G Amount represents less than $.01 per share.
See accompanying notes which are an integral part of the financial statements.
Annual Report
Financial Highlights - Class T
Years ended October 31, | 2011 | 2010 | 2009 | 2008 | 2007 |
Selected Per-Share Data | | | | | |
Net asset value, beginning of period | $ 18.18 | $ 16.03 | $ 13.84 | $ 27.35 | $ 22.05 |
Income from Investment Operations | | | | | |
Net investment income (loss) C | .13 | .14 | .22 | .36 | .28 |
Net realized and unrealized gain (loss) | (1.59) | 2.23 | 2.17 | (11.82) | 6.27 |
Total from investment operations | (1.46) | 2.37 | 2.39 | (11.46) | 6.55 |
Distributions from net investment income | (.17) | (.19) | (.20) | (.27) | (.19) |
Distributions from net realized gain | (.05) | (.03) | - | (1.78) | (1.06) |
Total distributions | (.22) | (.22) | (.20) | (2.05) | (1.25) |
Redemption fees added to paid in capital C, G | - | - | - | - | - |
Net asset value, end of period | $ 16.50 | $ 18.18 | $ 16.03 | $ 13.84 | $ 27.35 |
Total Return A, B | (8.17)% | 14.88% | 17.70% | (45.18)% | 31.24% |
Ratios to Average Net Assets D, F | | | | | |
Expenses before reductions | 1.52% | 1.53% | 1.57% | 1.51% | 1.33% |
Expenses net of fee waivers, if any | 1.51% | 1.53% | 1.57% | 1.51% | 1.33% |
Expenses net of all reductions | 1.49% | 1.50% | 1.54% | 1.48% | 1.30% |
Net investment income (loss) | .73% | .86% | 1.58% | 1.67% | 1.17% |
Supplemental Data | | | | | |
Net assets, end of period (in millions) | $ 305 | $ 371 | $ 367 | $ 345 | $ 710 |
Portfolio turnover rate E | 44% | 53% | 83% | 79% | 66% |
A Total returns would have been lower if certain expenses had not been reduced during the applicable periods shown.
B Total returns do not include the effect of the sales charges.
C Calculated based on average shares outstanding during the period.
D Fees and expenses of any underlying Fidelity Central Funds are not included in the Fund's expense ratio. The Fund indirectly bears its proportionate share of the expenses of any underlying Fidelity Central Funds.
E Amount does not include the portfolio activity of any underlying Fidelity Central Funds.
F Expense ratios reflect operating expenses of the class. Expenses before reductions do not reflect amounts reimbursed by the investment adviser or reductions from brokerage service arrangements or reductions from other expense offset arrangements and do not represent the amount paid by the class during periods when reimbursements or reductions occur. Expenses net of fee waivers reflect expenses after reimbursement by the investment adviser but prior to reductions from brokerage service arrangements or other expense offset arrangements. Expenses net of all reductions represent the net expenses paid by the class.
G Amount represents less than $.01 per share.
See accompanying notes which are an integral part of the financial statements.
Annual Report
Financial Highlights - Class B
Years ended October 31, | 2011 | 2010 | 2009 | 2008 | 2007 |
Selected Per-Share Data | | | | | |
Net asset value, beginning of period | $ 17.18 | $ 15.16 | $ 13.02 | $ 25.79 | $ 20.81 |
Income from Investment Operations | | | | | |
Net investment income (loss) C | .03 | .04 | .13 | .22 | .12 |
Net realized and unrealized gain (loss) | (1.51) | 2.10 | 2.08 | (11.14) | 5.94 |
Total from investment operations | (1.48) | 2.14 | 2.21 | (10.92) | 6.06 |
Distributions from net investment income | (.08) | (.09) | (.07) | (.07) | (.02) |
Distributions from net realized gain | (.05) | (.03) | - | (1.78) | (1.06) |
Total distributions | (.12) H | (.12) | (.07) | (1.85) | (1.08) |
Redemption fees added to paid in capital C, G | - | - | - | - | - |
Net asset value, end of period | $ 15.58 | $ 17.18 | $ 15.16 | $ 13.02 | $ 25.79 |
Total Return A, B | (8.67)% | 14.15% | 17.09% | (45.50)% | 30.45% |
Ratios to Average Net Assets D, F | | | | | |
Expenses before reductions | 2.10% | 2.11% | 2.12% | 2.10% | 1.94% |
Expenses net of fee waivers, if any | 2.09% | 2.11% | 2.12% | 2.10% | 1.94% |
Expenses net of all reductions | 2.07% | 2.09% | 2.08% | 2.08% | 1.91% |
Net investment income (loss) | .15% | .28% | 1.04% | 1.07% | .56% |
Supplemental Data | | | | | |
Net assets, end of period (in millions) | $ 4 | $ 7 | $ 8 | $ 10 | $ 27 |
Portfolio turnover rate E | 44% | 53% | 83% | 79% | 66% |
A Total returns would have been lower if certain expenses had not been reduced during the applicable periods shown.
B Total returns do not include the effect of the contingent deferred sales charge.
C Calculated based on average shares outstanding during the period.
D Fees and expenses of any underlying Fidelity Central Funds are not included in the Fund's expense ratio. The Fund indirectly bears its proportionate share of the expenses of any underlying Fidelity Central Funds.
E Amount does not include the portfolio activity of any underlying Fidelity Central Funds.
F Expense ratios reflect operating expenses of the class. Expenses before reductions do not reflect amounts reimbursed by the investment adviser or reductions from brokerage service arrangements or reductions from other expense offset arrangements and do not represent the amount paid by the class during periods when reimbursements or reductions occur. Expenses net of fee waivers reflect expenses after reimbursement by the investment adviser but prior to reductions from brokerage service arrangements or other expense offset arrangements. Expenses net of all reductions represent the net expenses paid by the class.
G Amount represents less than $.01 per share.
H Total distributions of $.12 per share is comprised of distributions from net investment income of $.079 and distributions from net realized gain of $.045 per share.
See accompanying notes which are an integral part of the financial statements.
Annual Report
Financial Highlights - Class C
Years ended October 31, | 2011 | 2010 | 2009 | 2008 | 2007 |
Selected Per-Share Data | | | | | |
Net asset value, beginning of period | $ 17.39 | $ 15.36 | $ 13.22 | $ 26.22 | $ 21.19 |
Income from Investment Operations | | | | | |
Net investment income (loss) C | .03 | .05 | .14 | .22 | .14 |
Net realized and unrealized gain (loss) | (1.52) | 2.12 | 2.09 | (11.31) | 6.02 |
Total from investment operations | (1.49) | 2.17 | 2.23 | (11.09) | 6.16 |
Distributions from net investment income | (.07) | (.11) | (.09) | (.13) | (.07) |
Distributions from net realized gain | (.05) | (.03) | - | (1.78) | (1.06) |
Total distributions | (.12) | (.14) | (.09) | (1.91) | (1.13) |
Redemption fees added to paid in capital C, G | - | - | - | - | - |
Net asset value, end of period | $ 15.78 | $ 17.39 | $ 15.36 | $ 13.22 | $ 26.22 |
Total Return A, B | (8.67)% | 14.17% | 17.06% | (45.50)% | 30.48% |
Ratios to Average Net Assets D, F | | | | | |
Expenses before reductions | 2.09% | 2.10% | 2.11% | 2.09% | 1.91% |
Expenses net of fee waivers, if any | 2.09% | 2.10% | 2.11% | 2.09% | 1.91% |
Expenses net of all reductions | 2.07% | 2.08% | 2.08% | 2.07% | 1.87% |
Net investment income (loss) | .15% | .29% | 1.05% | 1.08% | .60% |
Supplemental Data | | | | | |
Net assets, end of period (in millions) | $ 19 | $ 22 | $ 23 | $ 22 | $ 46 |
Portfolio turnover rate E | 44% | 53% | 83% | 79% | 66% |
A Total returns would have been lower if certain expenses had not been reduced during the applicable periods shown.
B Total returns do not include the effect of the contingent deferred sales charge.
C Calculated based on average shares outstanding during the period.
D Fees and expenses of any underlying Fidelity Central Funds are not included in the Fund's expense ratio. The Fund indirectly bears its proportionate share of the expenses of any underlying Fidelity Central Funds.
E Amount does not include the portfolio activity of any underlying Fidelity Central Funds.
F Expense ratios reflect operating expenses of the class. Expenses before reductions do not reflect amounts reimbursed by the investment adviser or reductions from brokerage service arrangements or reductions from other expense offset arrangements and do not represent the amount paid by the class during periods when reimbursements or reductions occur. Expenses net of fee waivers reflect expenses after reimbursement by the investment adviser but prior to reductions from brokerage service arrangements or other expense offset arrangements. Expenses net of all reductions represent the net expenses paid by the class.
G Amount represents less than $.01 per share.
See accompanying notes which are an integral part of the financial statements.
Annual Report
Financial Highlights - Institutional Class
Years ended October 31, | 2011 | 2010 | 2009 | 2008 | 2007 |
Selected Per-Share Data | | | | | |
Net asset value, beginning of period | $ 18.10 | $ 15.95 | $ 13.83 | $ 27.35 | $ 22.06 |
Income from Investment Operations | | | | | |
Net investment income (loss) B | .23 | .22 | .29 | .45 | .40 |
Net realized and unrealized gain (loss) | (1.59) | 2.23 | 2.14 | (11.78) | 6.26 |
Total from investment operations | (1.36) | 2.45 | 2.43 | (11.33) | 6.66 |
Distributions from net investment income | (.24) | (.27) | (.31) | (.41) | (.31) |
Distributions from net realized gain | (.05) | (.03) | - | (1.78) | (1.06) |
Total distributions | (.29) | (.30) | (.31) | (2.19) | (1.37) |
Redemption fees added to paid in capital B, F | - | - | - | - | - |
Net asset value, end of period | $ 16.45 | $ 18.10 | $ 15.95 | $ 13.83 | $ 27.35 |
Total Return A | (7.70)% | 15.49% | 18.32% | (44.92)% | 31.88% |
Ratios to Average Net Assets C, E | | | | | |
Expenses before reductions | 1.00% | 1.01% | 1.06% | 1.01% | .84% |
Expenses net of fee waivers, if any | .99% | 1.01% | 1.06% | 1.01% | .84% |
Expenses net of all reductions | .97% | .98% | 1.02% | .98% | .81% |
Net investment income (loss) | 1.25% | 1.39% | 2.10% | 2.17% | 1.66% |
Supplemental Data | | | | | |
Net assets, end of period (in millions) | $ 349 | $ 678 | $ 727 | $ 551 | $ 609 |
Portfolio turnover rate D | 44% | 53% | 83% | 79% | 66% |
A Total returns would have been lower if certain expenses had not been reduced during the applicable periods shown.
B Calculated based on average shares outstanding during the period.
C Fees and expenses of any underlying Fidelity Central Funds are not included in the Fund's expense ratio. The Fund indirectly bears its proportionate share of the expenses of any underlying Fidelity Central Funds.
D Amount does not include the portfolio activity of any underlying Fidelity Central Funds.
E Expense ratios reflect operating expenses of the class. Expenses before reductions do not reflect amounts reimbursed by the investment adviser or reductions from brokerage service arrangements or reductions from other expense offset arrangements and do not represent the amount paid by the class during periods when reimbursements or reductions occur. Expenses net of fee waivers reflect expenses after reimbursement by the investment adviser but prior to reductions from brokerage service arrangements or other expense offset arrangements. Expenses net of all reductions represent the net expenses paid by the class.
F Amount represents less than $.01 per share.
See accompanying notes which are an integral part of the financial statements.
Annual Report
Notes to Financial Statements
For the period ended October 31, 2011
(Amounts in thousands except percentages)
1. Organization.
Fidelity Advisor Overseas Fund (the Fund) is a fund of Fidelity Advisor Series VIII (the Trust) and is authorized to issue an unlimited number of shares. The Trust is registered under the Investment Company Act of 1940, as amended (the 1940 Act), as an open-end management investment company organized as a Massachusetts business trust. The Fund offers Class A, Class T, Class C, and Institutional Class shares, each of which, along with Class B shares, has equal rights as to assets and voting privileges. Effective after the close of business on September 1, 2010, Class B shares were closed to new accounts and additional purchases, except for exchanges and reinvestments by existing shareholders. Each class has exclusive voting rights with respect to matters that affect that class. Class B shares will automatically convert to Class A shares after a holding period of seven years from the initial date of purchase. Investment income, realized and unrealized capital gains and losses, the common expenses of the Fund, and certain fund-level expense reductions, if any, are allocated on a pro-rata basis to each class based on the relative net assets of each class to the total net assets of the Fund. Each class differs with respect to transfer agent and distribution and service plan fees incurred. Certain expense reductions may also differ by class. The Fund's investments in emerging markets can be subject to social, economic, regulatory, and political uncertainties and can be extremely volatile.
2. Investments in Fidelity Central Funds.
The Fund invests in Fidelity Central Funds, which are open-end investment companies available only to other investment companies and accounts managed by Fidelity Management & Research Company (FMR) and its affiliates. The Fund's Schedule of Investments lists each of the Fidelity Central Funds held as of period end, if any, as an investment of the Fund, but does not include the underlying holdings of each Fidelity Central Fund. As an Investing Fund, the Fund indirectly bears its proportionate share of the expenses of the underlying Fidelity Central Funds.
The Money Market Central Funds seek preservation of capital and current income and are managed by Fidelity Investments Money Management, Inc. (FIMM), an affiliate of FMR.
A complete unaudited list of holdings for each Fidelity Central Fund is available upon request or at the Securities and Exchange Commission (the SEC) web site at www.sec.gov. In addition, the financial statements of the Fidelity Central Funds, which are not covered by the Fund's Report of Independent Registered Public Accounting Firm are available on the SEC web site or upon request.
Annual Report
3. Significant Accounting Policies.
The financial statements have been prepared in conformity with accounting principles generally accepted in the United States of America (GAAP), which require management to make certain estimates and assumptions at the date of the financial statements. Actual results could differ from those estimates. Subsequent events, if any, through the date that the financial statements were issued have been evaluated in the preparation of the financial statements. The following summarizes the significant accounting policies of the Fund:
Security Valuation. Investments are valued as of 4:00 p.m. Eastern time on the last calendar day of the period. The Fund uses independent pricing services approved by the Board of Trustees to value its investments. When current market prices or quotations are not readily available or reliable, valuations may be determined in good faith in accordance with procedures adopted by the Board of Trustees. Factors used in determining value may include market or security specific events. The frequency with which these procedures are used cannot be predicted and they may be utilized to a significant extent. The value used for net asset value (NAV) calculation under these procedures may differ from published prices for the same securities.
The Fund categorizes the inputs to valuation techniques used to value its investments into a disclosure hierarchy consisting of three levels as shown below:
Level 1 - quoted prices in active markets for identical investments
Level 2 - other significant observable inputs (including quoted prices for similar investments, interest rates, prepayment speeds, etc.)
Level 3 - unobservable inputs (including the Fund's own assumptions based on the best information available)
Changes in valuation techniques may result in transfers in or out of an assigned level within the disclosure hierarchy. The aggregate value of investments by input level, as of October 31, 2011, is included at the end of the Fund's Schedule of Investments. Valuation techniques used to value the Fund's investments by major category are as follows:
Equity securities, including restricted securities, for which market quotations are readily available, are valued at the last reported sale price or official closing price as reported by an independent pricing service on the primary market or exchange on which they are traded and are categorized as Level 1 in the hierarchy. In the event there were no sales during the day or closing prices are not available, securities are valued at the last quoted bid price or may be valued using the last available price and are generally categorized as Level 2 in the hierarchy. For foreign equity securities, when significant market or security specific events arise, comparisons to the valuation of American Depositary Receipts
Annual Report
Notes to Financial Statements - continued
(Amounts in thousands except percentages)
3. Significant Accounting Policies - continued
Security Valuation - continued
(ADRs), futures contracts, Exchange-traded funds (ETFs) and certain indexes as well as quoted prices for similar securities are used and are categorized as Level 2 in the hierarchy in these circumstances. Utilizing these techniques may result in transfers between Level 1 and Level 2. For restricted equity securities and private placements where observable inputs are limited, assumptions about market activity and risk are used and are categorized as Level 3 in the hierarchy.
Investments in open-end mutual funds, including the Fidelity Central Funds, are valued at their closing net asset value each business day and are categorized as Level 1 in the hierarchy.
Foreign Currency. The Fund may use foreign currency contracts to facilitate transactions in foreign-denominated securities. Gains and losses from these transactions may arise from changes in the value of the foreign currency or if the counterparties do not perform under the contracts' terms.
Foreign-denominated assets, including investment securities, and liabilities are translated into U.S. dollars at the exchange rate at period end. Purchases and sales of investment securities, income and dividends received and expenses denominated in foreign currencies are translated into U.S. dollars at the exchange rate in effect on the transaction date.
The effects of exchange rate fluctuations on investments are included with the net realized and unrealized gain (loss) on investment securities. Other foreign currency transactions resulting in realized and unrealized gain (loss) are disclosed separately.
Investment Transactions and Income. For financial reporting purposes, the Fund's investment holdings and NAV include trades executed through the end of the last business day of the period. The NAV per share for processing shareholder transactions is calculated as of the close of business of the New York Stock Exchange (NYSE), normally 4:00 p.m. Eastern time and includes trades executed through the end of the prior business day. Gains and losses on securities sold are determined on the basis of identified cost and may include proceeds received from litigation. Dividend income is recorded on the ex-dividend date, except for certain dividends from foreign securities where the ex-dividend date may have passed, which are recorded as soon as the Fund is informed of the ex-dividend date. Non-cash dividends included in dividend income, if any, are recorded at the fair market value of the securities received. Distributions received on securities that represent a return of capital or capital gain are recorded as a reduction of cost of investments and/or as a realized gain. The Fund estimates the components of distributions received that may be considered return of capital distributions or capital
Annual Report
3. Significant Accounting Policies - continued
Investment Transactions and Income - continued
gain distributions. Interest income and distributions from the Fidelity Central Funds are accrued as earned. Interest income includes coupon interest and amortization of premium and accretion of discount on debt securities. Investment income is recorded net of foreign taxes withheld where recovery of such taxes is uncertain.
Expenses. Expenses directly attributable to a fund are charged to that fund. Expenses attributable to more than one fund are allocated among the respective funds on the basis of relative net assets or other appropriate methods. Expense estimates are accrued in the period to which they relate and adjustments are made when actual amounts are known.
Income Tax Information and Distributions to Shareholders. Each year, the Fund intends to qualify as a regulated investment company, including distributing substantially all of its taxable income and realized gains under Subchapter M of the Internal Revenue Code and filing its U.S. federal tax return. As a result, no provision for income taxes is required. As of October 31, 2011, the Fund did not have any unrecognized tax benefits in the financial statements. A fund's federal tax return is subject to examination by the Internal Revenue Service (IRS) for a period of three years. Foreign taxes are provided for based on the Fund's understanding of the tax rules and rates that exist in the foreign markets in which it invests.
Distributions are declared and recorded on the ex-dividend date. Income dividends and capital gain distributions are declared separately for each class. Income and capital gain distributions are determined in accordance with income tax regulations, which may differ from GAAP.
Capital accounts within the financial statements are adjusted for permanent book-tax differences. These adjustments have no impact on net assets or the results of operations. Temporary book-tax differences will reverse in a subsequent period.
Book-tax differences are primarily due to foreign currency transactions, passive foreign investment companies (PFIC), deferred trustees compensation, capital loss carryforwards and losses deferred due to wash sales.
Annual Report
Notes to Financial Statements - continued
(Amounts in thousands except percentages)
3. Significant Accounting Policies - continued
Income Tax Information and Distributions to Shareholders - continued
The federal tax cost of investment securities and unrealized appreciation (depreciation) as of period end were as follows:
Gross unrealized appreciation | $ 84,441 |
Gross unrealized depreciation | (124,723) |
Net unrealized appreciation (depreciation) on securities and other investments | $ (40,282) |
| |
Tax Cost | $ 775,737 |
The tax-based components of distributable earnings as of period end were as follows:
Undistributed ordinary income | $ 9,657 |
Capital loss carryforward | $ (104,924) |
Net unrealized appreciation (depreciation) | $ (40,224) |
Under the recently enacted Regulated Investment Company Modernization Act of 2010 (the Act), the Fund will be permitted to carry forward capital losses incurred in taxable years beginning after December 22, 2010 for an unlimited period. However, any losses incurred during those future taxable years will be required to be utilized prior to any losses incurred in pre-enactment taxable years, which generally expire after eight years from when they are incurred. Additionally, post-enactment capital losses that are carried forward will retain their character as either short-term or long-term capital losses rather than being considered all short-term as under previous law. The Fund's first fiscal year end subject to the Act will be October, 31, 2012.
The tax character of distributions paid was as follows:
| October 31, 2011 | October 31, 2010 |
Ordinary Income | $ 15,738 | $ 20,173 |
Short-Term Trading (Redemption) Fees. Shares held by investors in the Fund less than 30 days are subject to a redemption fee equal to 1.00% of the net asset value of shares redeemed. All redemption fees, which reduce the proceeds of the shareholder redemption, are retained by the Fund and accounted for as an addition to paid in capital.
New Accounting Pronouncement. In May 2011, the Financial Accounting Standards Board issued Accounting Standard Update No. 2011-04, Fair Value Measurement (Topic 820) - Amendments to Achieve Common Fair Value Measurement and Disclosure Requirements in U.S. GAAP and IFRSs. The update changes the wording used to describe the requirements in GAAP for measuring fair value and for disclosing information about
Annual Report
3. Significant Accounting Policies - continued
New Accounting Pronouncement - continued
fair value measurements. The update is effective during interim and annual periods beginning after December 15, 2011. Management is currently evaluating the impact of the update's adoption on the Fund's financial statement disclosures.
4. Operating Policies.
Restricted Securities. The Fund may invest in securities that are subject to legal or contractual restrictions on resale. These securities generally may be resold in transactions exempt from registration or to the public if the securities are registered. Disposal of these securities may involve time-consuming negotiations and expense, and prompt sale at an acceptable price may be difficult. Information regarding restricted securities is included at the end of the Fund's Schedule of Investments.
5. Purchases and Sales of Investments.
Purchases and sales of securities, other than short-term securities, aggregated $441,698 and $799,992, respectively.
6. Fees and Other Transactions with Affiliates.
Management Fee. FMR and its affiliates provide the Fund with investment management related services for which the Fund pays a monthly management fee. The management fee is the sum of an individual fund fee rate that is based on an annual rate of .45% of the Fund's average net assets and a group fee rate that averaged .26% during the period. The group fee rate is based upon the average net assets of all the mutual funds advised by FMR. The group fee rate decreases as assets under management increase and increases as assets under management decrease. In addition, the management fee is subject to a performance adjustment (up to a maximum of ± .20% of the Fund's average net assets over a 36 month performance period). The upward or downward adjustment to the management fee is based on the investment performance of the asset-weighted return of all classes as compared to an appropriate benchmark index. For the period, the total annual management fee rate, including the performance adjustment, was .71% of the Fund's average net assets.
Distribution and Service Plan Fees. In accordance with Rule 12b-1 of the 1940 Act, the Fund has adopted separate Distribution and Service Plans for each class of shares. Certain classes pay Fidelity Distributors Corporation (FDC), an affiliate of FMR, separate Distribution and Service Fees, each of which is based on an annual percentage of each class' average net assets. In addition, FDC may pay financial intermediaries for
Annual Report
Notes to Financial Statements - continued
(Amounts in thousands except percentages)
6. Fees and Other Transactions with Affiliates - continued
Distribution and Service Plan Fees - continued
selling shares of the Fund and providing shareholder support services. For the period, the Distribution and Service Fee rates, total fees and amounts retained by FDC were as follows:
| Distribution
Fee | Service
Fee | Total Fees | Retained
by FDC |
Class A | -% | .25% | $ 174 | $ 2 |
Class T | .25% | .25% | 1,795 | 21 |
Class B | .75% | .25% | 56 | 43 |
Class C | .75% | .25% | 220 | 9 |
| | | $ 2,245 | $ 75 |
Sales Load. FDC may receive a front-end sales charge of up to 5.75% for selling Class A shares, and 3.50% for selling Class T shares, some of which is paid to financial intermediaries for selling shares of the Fund. Depending on the holding period, FDC may receive contingent deferred sales charges levied on Class A, Class T, Class B, and Class C redemptions. The deferred sales charges range from 5% to 1% for Class B, 1% for Class C, 1.00% for certain purchases of Class A shares and .25% for certain purchases of Class T shares.
For the period, sales charge amounts retained by FDC were as follows:
| Retained
by FDC |
Class A | $ 8 |
Class T | 5 |
Class B* | 8 |
Class C* | 1 |
| $ 22 |
* When Class B and Class C shares are initially sold, FDC pays commissions from its own resources to financial intermediaries through which the sales are made.
Transfer Agent Fees. Fidelity Investments Institutional Operations Company, Inc. (FIIOC), an affiliate of FMR, is the transfer, dividend disbursing and shareholder servicing agent for each class of the Fund. FIIOC receives account fees and asset-based fees that vary according to the account size and type of account of the shareholders of the respective classes of the Fund. FIIOC pays for typesetting, printing and mailing of
Annual Report
6. Fees and Other Transactions with Affiliates - continued
Transfer Agent Fees - continued
shareholder reports, except proxy statements. For the period, transfer agent fees for each class were as follows:
| Amount | % of
Average
Net Assets |
Class A | $ 211 | .30 |
Class T | 803 | .22 |
Class B | 17 | .30 |
Class C | 66 | .30 |
Institutional Class | 1,148 | .21 |
| $ 2,245 | |
Accounting and Security Lending Fees. Fidelity Service Company, Inc. (FSC), an affiliate of FMR, maintains the Fund's accounting records. The accounting fee is based on the level of average net assets for the month. Under a separate contract, FSC administers the security lending program. The security lending fee is based on the number and duration of lending transactions.
Brokerage Commissions. The Fund placed a portion of its portfolio transactions with brokerage firms which are affiliates of the investment adviser. The commissions paid to these affiliated firms were $2 for the period.
Interfund Lending Program. Pursuant to an Exemptive Order issued by the SEC, the Fund, along with other registered investment companies having management contracts with FMR, may participate in an interfund lending program. This program provides an alternative credit facility allowing the funds to borrow from, or lend money to, other participating affiliated funds. At period end, there were no interfund loans outstanding. The Fund's activity in this program during the period for which loans were outstanding was as follows:
Borrower or Lender | Average Daily
Loan Balance | Weighted Average
Interest Rate | Interest
Expense |
Borrower | $ 5,055 | .43% | $ 1 |
7. Committed Line of Credit.
The Fund participates with other funds managed by FMR or an affiliate in a $4.0 billion credit facility (the "line of credit") to be utilized for temporary or emergency purposes to fund shareholder redemptions or for other short-term liquidity purposes. The Fund has
Annual Report
Notes to Financial Statements - continued
(Amounts in thousands except percentages)
7. Committed Line of Credit - continued
agreed to pay commitment fees on its pro-rata portion of the line of credit, which amounted to $3 and is reflected in Miscellaneous expenses on the Statement of Operations. During the period, there were no borrowings on this line of credit.
8. Security Lending.
The Fund lends portfolio securities through a lending agent from time to time in order to earn additional income. For equity securities, a lending agent is used and may loan securities to certain qualified borrowers, including Fidelity Capital Markets (FCM), a broker-dealer affiliated with the Fund. On the settlement date of the loan, the Fund receives collateral (in the form of U.S. Treasury obligations, letters of credit and/or cash) against the loaned securities and maintains collateral in an amount not less than 100% of the market value of the loaned securities during the period of the loan. The market value of the loaned securities is determined at the close of business of the Fund and any additional required collateral is delivered to the Fund on the next business day. If the borrower defaults on its obligation to return the securities loaned because of insolvency or other reasons, a fund could experience delays and costs in recovering the securities loaned or in gaining access to the collateral. Any cash collateral received is invested in the Fidelity Securities Lending Cash Central Fund. The value of loaned securities and cash collateral at period end are disclosed on the Fund's Statement of Assets and Liabilities. Security lending income represents the income earned on investing cash collateral, less rebates paid to borrowers and any lending agent fees associated with the loan, plus any premium payments received for lending certain types of securities. Security lending income is presented in the Statement of Operations as a component of income from Fidelity Central Funds. Total security lending income during the period amounted to $848. During the period, there were no securities loaned to FCM.
9. Expense Reductions.
FMR voluntarily agreed to reimburse a portion of its management fee. For the period, the amount of this reimbursement was $77.
Many of the brokers with whom FMR places trades on behalf of the Fund provided services to the Fund in addition to trade execution. These services included payments of certain expenses on behalf of the Fund totaling $203 for the period.
Annual Report
10. Distributions to Shareholders.
Distributions to shareholders of each class were as follows:
Years ended October 31, | 2011 | 2010 |
From net investment income | | |
Class A | $ 829 | $ 950 |
Class T | 3,501 | 4,334 |
Class B | 30 | 45 |
Class C | 89 | 160 |
Institutional Class | 8,533 | 12,416 |
Total | $ 12,982 | $ 17,905 |
From net realized gain | | |
Class A | $ 178 | $ 134 |
Class T | 911 | 684 |
Class B | 17 | 15 |
Class C | 57 | 44 |
Institutional Class | 1,593 | 1,391 |
Total | $ 2,756 | $ 2,268 |
11. Share Transactions.
Transactions for each class of shares were as follows:
| Shares | Dollars |
Years ended October 31, | 2011 | 2010 | 2011 | 2010 |
Class A | | | | |
Shares sold | 644 | 475 | $ 11,749 | $ 7,655 |
Reinvestment of distributions | 51 | 61 | 919 | 1,012 |
Shares redeemed | (937) | (1,167) | (16,834) | (18,467) |
Net increase (decrease) | (242) | (631) | $ (4,166) | $ (9,800) |
Class T | | | | |
Shares sold | 3,310 | 4,009 | $ 61,021 | $ 65,721 |
Reinvestment of distributions | 232 | 288 | 4,288 | 4,889 |
Shares redeemed | (5,489) | (6,821) | (101,187) | (111,516) |
Net increase (decrease) | (1,947) | (2,524) | $ (35,878) | $ (40,906) |
Class B | | | | |
Shares sold | 12 | 48 | $ 219 | $ 740 |
Reinvestment of distributions | 2 | 3 | 41 | 54 |
Shares redeemed | (144) | (174) | (2,540) | (2,691) |
Net increase (decrease) | (130) | (123) | $ (2,280) | $ (1,897) |
Class C | | | | |
Shares sold | 165 | 120 | $ 2,956 | $ 1,913 |
Reinvestment of distributions | 7 | 11 | 125 | 176 |
Shares redeemed | (271) | (337) | (4,750) | (5,265) |
Net increase (decrease) | (99) | (206) | $ (1,669) | $ (3,176) |
Annual Report
Notes to Financial Statements - continued
(Amounts in thousands except percentages)
11. Share Transactions - continued
| Shares | Dollars |
Years ended October 31, | 2011 | 2010 | 2011 | 2010 |
Institutional Class | | | | |
Shares sold | 2,965 | 12,645 | $ 53,805 | $ 202,633 |
Reinvestment of distributions | 544 | 818 | 9,988 | 13,738 |
Shares redeemed | (19,770) | (21,576) | (362,619) | (349,589) |
Net increase (decrease) | (16,261) | (8,113) | $ (298,826) | $ (133,218) |
12. Other.
The Fund's organizational documents provide former and current trustees and officers with a limited indemnification against liabilities arising in connection with the performance of their duties to the Fund. In the normal course of business, the Fund may also enter into contracts that provide general indemnifications. The Fund's maximum exposure under these arrangements is unknown as this would be dependent on future claims that may be made against the Fund. The risk of material loss from such claims is considered remote.
At the end of the period, Strategic Advisers International II Fund was the owner of record of approximately 15% of the total outstanding shares of the fund.
Annual Report
To the Trustees of Fidelity Advisor Series VIII and the Shareholders of Fidelity Advisor Overseas Fund:
In our opinion, the accompanying statement of assets and liabilities, including the schedule of investments, and the related statements of operations and of changes in net assets and the financial highlights present fairly, in all material respects, the financial position of Fidelity Advisor Overseas Fund (a fund of Fidelity Advisor Series VIII) at October 31, 2011, the results of its operations for the year then ended, the changes in its net assets for each of the two years in the period then ended and the financial highlights for each of the five years in the period then ended, in conformity with accounting principles generally accepted in the United States of America. These financial statements and financial highlights (hereafter referred to as "financial statements") are the responsibility of the Fidelity Advisor Overseas Fund's management. Our responsibility is to express an opinion on these financial statements based on our audits. We conducted our audits of these financial statements in accordance with the standards of the Public Company Accounting Oversight Board (United States). Those standards require that we plan and perform the audit to obtain reasonable assurance about whether the financial statements are free of material misstatement. An audit includes examining, on a test basis, evidence supporting the amounts and disclosures in the financial statements, assessing the accounting principles used and significant estimates made by management, and evaluating the overall financial statement presentation. We believe that our audits, which included confirmation of securities at October 31, 2011 by correspondence with the custodian and brokers, provide a reasonable basis for our opinion.
/s/ PricewaterhouseCoopers LLP
PricewaterhouseCoopers LLP
Boston, Massachusetts
December 9, 2011
Annual Report
The Trustees, Members of the Advisory Board, and executive officers of the trust and fund, as applicable, are listed below. The Board of Trustees governs the fund and is responsible for protecting the interests of shareholders. The Trustees are experienced executives who meet periodically throughout the year to oversee the fund's activities, review contractual arrangements with companies that provide services to the fund, oversee management of the risks associated with such activities and contractual arrangements, and review the fund's performance. Except for James C. Curvey, each of the Trustees oversees 226 funds advised by FMR or an affiliate. Mr. Curvey oversees 429 funds advised by FMR or an affiliate.
The Trustees hold office without limit in time except that (a) any Trustee may resign; (b) any Trustee may be removed by written instrument, signed by at least two-thirds of the number of Trustees prior to such removal; (c) any Trustee who requests to be retired or who has become incapacitated by illness or injury may be retired by written instrument signed by a majority of the other Trustees; and (d) any Trustee may be removed at any special meeting of shareholders by a two-thirds vote of the outstanding voting securities of the trust. Each Trustee who is not an interested person (as defined in the 1940 Act) (Independent Trustee), shall retire not later than the last day of the calendar year in which his or her 75th birthday occurs. The Independent Trustees may waive this mandatory retirement age policy with respect to individual Trustees. The executive officers and Advisory Board Members hold office without limit in time, except that any officer and Advisory Board Member may resign or may be removed by a vote of a majority of the Trustees at any regular meeting or any special meeting of the Trustees. Except as indicated, each individual has held the office shown or other offices in the same company for the past five years.
Experience, Skills, Attributes, and Qualifications of the Fund's Trustees. The Governance and Nominating Committee has adopted a statement of policy that describes the experience, qualifications, attributes, and skills that are necessary and desirable for potential Independent Trustee candidates (Statement of Policy). The Board believes that each Trustee satisfied at the time he or she was initially elected or appointed a Trustee, and continues to satisfy, the standards contemplated by the Statement of Policy. The Governance and Nominating Committee also engages professional search firms to help identify potential Independent Trustee candidates who have the experience, qualifications, attributes, and skills consistent with the Statement of Policy. From time to time, additional criteria based on the composition and skills of the current Independent Trustees, as well as experience or skills that may be appropriate in light of future changes to board composition, business conditions, and regulatory or other developments, have also been considered by the professional search firms and the Governance and Nominating Committee. In addition, the Board takes into account the Trustees' commitment and participation in Board and committee meetings, as well as their leadership of standing and ad hoc committees throughout their tenure.
In determining that a particular Trustee was and continues to be qualified to serve as a Trustee, the Board has considered a variety of criteria, none of which, in isolation, was controlling. The Board believes that, collectively, the Trustees have balanced and diverse experience, qualifications, attributes, and skills, which allow the Board to operate effectively in governing the fund and protecting the interests of shareholders. Information about the specific experience, skills, attributes, and qualifications of each Trustee, which in each case led to the Board's conclusion that the Trustee should serve (or continue to serve) as a trustee of the fund, is provided below.
Annual Report
Trustees and Officers - continued
Board Structure and Oversight Function. James C. Curvey is an interested person (as defined in the 1940 Act) and currently serves as Acting Chairman. The Trustees have determined that an interested Chairman is appropriate and benefits shareholders because an interested Chairman has a personal and professional stake in the quality and continuity of services provided to the fund. Independent Trustees exercise their informed business judgment to appoint an individual of their choosing to serve as Chairman, regardless of whether the Trustee happens to be independent or a member of management. The Independent Trustees have determined that they can act independently and effectively without having an Independent Trustee serve as Chairman and that a key structural component for assuring that they are in a position to do so is for the Independent Trustees to constitute a substantial majority for the Board. The Independent Trustees also regularly meet in executive session. Ned C. Lautenbach serves as Chairman of the Independent Trustees and as such (i) acts as a liaison between the Independent Trustees and management with respect to matters important to the Independent Trustees and (ii) with management prepares agendas for Board meetings.
Fidelity funds are overseen by different Boards of Trustees. The fund's Board oversees Fidelity's equity and high income funds and another Board oversees Fidelity's investment-grade bond, money market, and asset allocation funds. The asset allocation funds may invest in Fidelity funds overseen by the fund's Board. The use of separate Boards, each with its own committee structure, allows the Trustees of each group of Fidelity funds to focus on the unique issues of the funds they oversee, including common research, investment, and operational issues. On occasion, the separate Boards establish joint committees to address issues of overlapping consequences for the Fidelity funds overseen by each Board.
The Trustees operate using a system of committees to facilitate the timely and efficient consideration of all matters of importance to the Trustees, the fund, and fund shareholders and to facilitate compliance with legal and regulatory requirements and oversight of the fund's activities and associated risks. The Board, acting through its committees, has charged FMR and its affiliates with (i) identifying events or circumstances the occurrence of which could have demonstrably adverse effects on the fund's business and/or reputation; (ii) implementing processes and controls to lessen the possibility that such events or circumstances occur or to mitigate the effects of such events or circumstances if they do occur; and (iii) creating and maintaining a system designed to evaluate continuously business and market conditions in order to facilitate the identification and implementation processes described in (i) and (ii) above. Because the day-to-day operations and activities of the fund are carried out by or through FMR, its affiliates and other service providers, the fund's exposure to risks is mitigated but not eliminated by the processes overseen by the Trustees. While each of the Board's committees has responsibility for overseeing different aspects of the fund's activities, oversight is exercised primarily through the Operations, Audit, and Compliance Committees. In addition, the Independent Trustees have worked with FMR to enhance the Board's oversight of investment and financial risks, legal and regulatory risks, technology risks, and operational risks, including the development of additional risk reporting to the Board. For example, a working group comprised of Independent Trustees and FMR has worked and continues to work to review the Fidelity funds' valuation-related activities, reporting and risk management. Appropriate personnel, including but not limited to the fund's Chief Compliance Officer (CCO), FMR's internal auditor, the independent accountants, the fund's Treasurer and portfolio management personnel, make periodic reports to the Board's committees, as appropriate, including an annual review of FMR's risk management program for the Fidelity funds. The responsibilities of each standing committee, including their oversight responsibilities, are described further under "Standing Committees of the Fund's Trustees."
Annual Report
The fund's Statement of Additional Informaion (SAI) includes more information about the Trustees. To request a copy, call Fidelity at 1-877-208-0098.
Interested Trustees*:
Correspondence intended for each Trustee who is an interested person may be sent to Fidelity Investments, 82 Devonshire Street, Boston, Massachusetts 02109.
Name, Age; Principal Occupations and Other Relevant Experience+ |
James C. Curvey (76) |
| Year of Election or Appointment: 2007 Mr. Curvey is Trustee and Acting Chairman of the Board of Trustees of certain Trusts. Mr. Curvey also serves as Trustee (2007-present) of other investment companies advised by FMR. Mr. Curvey is a Director of Fidelity Investments Money Management, Inc. (2009-present), Director of Fidelity Research & Analysis Co. (2009-present) and Director of FMR and FMR Co., Inc. (2007-present). Mr. Curvey is also Vice Chairman (2007-present) and Director of FMR LLC. In addition, Mr. Curvey serves as an Overseer for the Boston Symphony Orchestra and a member of the Trustees of Villanova University. Previously, Mr. Curvey was the Vice Chairman (2006-2007) and Director (2000-2007) of FMR Corp. |
Ronald P. O'Hanley (54) |
| Year of Election or Appointment: 2011 Mr. O'Hanley is Director of FMR Co., Inc. (2010-present), Director of Fidelity Investments Money Management, Inc. (2010-present), Director of Fidelity Research & Analysis Company (2010-present), President of Fidelity Asset Management and Corporate Services and a member of Fidelity's Executive Committee (2010-present). Previously, Mr. O'Hanley served as President and Chief Executive Officer of BNY Mellon Asset Management (2007-2010). Mr. O'Hanley also served as Vice Chairman of Bank New York Mellon Corp. and a member of that firm's Executive Committee. Prior to the 2007 merger of The Bank of New York and Mellon Financial Corporation, he was Vice Chairman of Mellon Financial Corporation and President and Chief Executive Officer of Mellon Asset Management. He joined Mellon in February 1997. Mr. O'Hanley currently serves as Chairman of the Boston Public Library Foundation Board of Directors and sits on the Board of Directors of Beth Israel Deaconess Medical Center, the Board of Trustees of the Marine Biological Laboratory and the Advisory Board of the Maxwell School of Citizenship and Public Administration at Syracuse University. Mr. O'Hanley also chairs the Council on Asset Management for the Financial Services Roundtable and is a member of the Board of Directors of Institutional Investor's U.S. Institute. |
* Trustees have been determined to be "Interested Trustees" by virtue of, among other things, their affiliation with the trust or various entities under common control with FMR.
+ The information above includes each Trustee's principal occupation during the last five years and other information relating to the experience, attributes, and skills relevant to each Trustee's qualifications to serve as a Trustee, which led to the conclusion that each Trustee should serve as a Trustee for the fund.
Annual Report
Independent Trustees:
Correspondence intended for each Independent Trustee (that is, the Trustees other than the Interested Trustees) may be sent to Fidelity Investments, P.O. Box 55235, Boston, Massachusetts 02205-5235.
Name, Age; Principal Occupations and Other Relevant Experience+ |
Dennis J. Dirks (63) |
| Year of Election or Appointment: 2005 Prior to his retirement in May 2003, Mr. Dirks was Chief Operating Officer and a member of the Board of The Depository Trust & Clearing Corporation (DTCC). He also served as President, Chief Operating Officer, and Board member of The Depository Trust Company (DTC) and President and Board member of the National Securities Clearing Corporation (NSCC). In addition, Mr. Dirks served as Chief Executive Officer and Board member of the Government Securities Clearing Corporation, Chief Executive Officer and Board member of the Mortgage-Backed Securities Clearing Corporation, as a Trustee and a member of the Finance Committee of Manhattan College (2005-2008), and as a Trustee and a member of the Finance Committee of AHRC of Nassau County (2006-2008). Mr. Dirks is a member of the Independent Directors Council (IDC) Governing Council (2010-Present) and Board of Directors for The Brookville Center for Children's Services, Inc. (2009-present). |
Alan J. Lacy (58) |
| Year of Election or Appointment: 2008 Mr. Lacy serves as Senior Adviser (2007-present) of Oak Hill Capital Partners, L.P. (private equity). Mr. Lacy also served as Chief Executive Officer (2000-2005) and Vice Chairman (2005-2006) of Sears Holdings Corporation and Sears, Roebuck and Co. (retail). In addition, Mr. Lacy serves as a member of the Board of Directors of Dave & Buster's, Inc. (restaurant and entertainment complexes, 2010-present), The Hillman Companies, Inc. (hardware wholesalers, 2010-present), and Bristol-Myers Squibb Company (global pharmaceuticals, 2007-present). Mr. Lacy is a member of the Board of Trustees of The National Parks Conservation Association (2006-Present). Previously, Mr. Lacy served as Chairman of the Board of Trustees of the National Parks Conservation Association (2008-2011) and as a member of the Board of Directors for the Western Union Company (global money transfer, 2006-2011). |
Ned C. Lautenbach (67) |
| Year of Election or Appointment: 2000 Mr. Lautenbach is Chairman of the Independent Trustees of the Equity and High Income Funds (2006-present). Mr. Lautenbach currently serves as the Lead Director of the Eaton Corporation Board of Directors (diversified industrial, 1997-present). Mr. Lautenbach is also a member of the Board of Directors of the Philharmonic Center for the Arts in Naples, Florida (1999-present); a member of the Board of Trustees of Fairfield University (2005-present); and a member of the Council on Foreign Relations (1994-present). Previously, Mr. Lautenbach was a Partner/Advisory Partner at Clayton, Dubilier & Rice, LLC (private equity investment, 1998-2010), as well as a Director of Sony Corporation (2006-2007). |
Joseph Mauriello (67) |
| Year of Election or Appointment: 2008 Prior to his retirement in January 2006, Mr. Mauriello served in numerous senior management positions including Deputy Chairman and Chief Operating Officer (2004-2005), and Vice Chairman of Financial Services (2002-2004) of KPMG LLP US (professional services, 1965-2005). Mr. Mauriello currently serves as a member of the Board of Directors of XL Group plc. (global insurance and re-insurance, 2006-present) and of Arcadia Resources Inc. (health care services and products, 2007-present). Previously, Mr. Mauriello served as a Director of the Hamilton Funds of the Bank of New York (2006-2007). |
Robert W. Selander (61) |
| Year of Election or Appointment: 2011 Previously, Mr. Selander served as a Member of the Advisory Board of Fidelity's Equity and High Income Funds (2011), Executive Vice Chairman (2010), Chief Executive Officer (2009-2010), and President and Chief Executive Officer (1997-2009) of Mastercard, Inc. |
Cornelia M. Small (67) |
| Year of Election or Appointment: 2005 Ms. Small is a member of the Board of Directors of the Teagle Foundation (2009-present). Ms. Small is also a member of the Investment Committee, and Chair (2008-present) and a member of the Board of Trustees of Smith College. In addition, Ms. Small serves on the Investment Committee of the Berkshire Taconic Community Foundation (2008-present). Previously, Ms. Small served as Chairperson of the Investment Committee (2002-2008) of Smith College. In addition, Ms. Small served as Chief Investment Officer, Director of Global Equity Investments, and a member of the Board of Directors of Scudder, Stevens & Clark and Scudder Kemper Investments. |
William S. Stavropoulos (72) |
| Year of Election or Appointment: 2001 Mr. Stavropoulos is Vice Chairman of the Independent Trustees of the Equity and High Income Funds (2006-present). Mr. Stavropoulos serves as President and Founder of the Michigan Baseball Foundation, the Great Lakes Loons (2007-present). Mr. Stavropoulos is Chairman Emeritus of the Board of Directors of The Dow Chemical Company, where he previously served in numerous senior management positions, including President, CEO (1995-2000; 2002-2004), Chairman of the Executive Committee (2000-2006), and as a member of the Board of Directors (1990-2006). Currently, Mr. Stavropoulos is Chairman of Univar (global distributor of commodity and specialty chemicals, 2010-present), a Director of Teradata Corporation (data warehousing and technology solutions, 2008-present), Chemical Financial Corporation, Maersk Inc. (industrial conglomerate), Tyco International, Inc. (multinational manufacturing and services, 2007-present), and a member of the Advisory Board for Metalmark Capital (private equity investment, 2005-present). Mr. Stavropoulos is a special advisor to Clayton, Dubilier & Rice, LLC (private equity investment). In addition, Mr. Stavropoulos is a member of the University of Notre Dame Advisory Council for the College of Science. |
David M. Thomas (62) |
| Year of Election or Appointment: 2008 Previously, Mr. Thomas served as Executive Chairman (2005-2006) and Chairman and Chief Executive Officer (2000-2005) of IMS Health, Inc. (pharmaceutical and healthcare information solutions). In addition, Mr. Thomas serves as a member of the Board of Directors of Fortune Brands, Inc. (consumer products), and Interpublic Group of Companies, Inc. (marketing communication, 2004-present). |
Michael E. Wiley (61) |
| Year of Election or Appointment: 2008 Mr. Wiley also serves as a Director of Asia Pacific Exploration Consolidated (international oil and gas exploration and production, 2008-present). Mr. Wiley serves as a Director of Tesoro Corporation (independent oil refiner and marketer, 2005-present), and a Director of Bill Barrett Corporation (exploration and production, 2005-present). In addition, Mr. Wiley also serves as a Director of Post Oak Bank (privately-held bank, 2004-present). Previously, Mr. Wiley served as a member of the Board of Trustees of the University of Tulsa (2000-2006; 2007-2010), as a Senior Energy Advisor of Katzenbach Partners, LLC (consulting, 2006-2007), as an Advisory Director of Riverstone Holdings (private investment), Chairman, President, and CEO of Baker Hughes, Inc. (oilfield services, 2000-2004), and as Director of Spinnaker Exploration Company (exploration and production, 2001-2005). |
Annual Report
Trustees and Officers - continued
+ The information above includes each Trustee's principal occupation during the last five years and other information relating to the experience, attributes, and skills relevant to each Trustee's qualifications to serve as a Trustee, which led to the conclusion that each Trustee should serve as a Trustee for the fund.
Advisory Board Members and Executive Officers:
Correspondence intended for each executive officer, Edward C. Johnson 3d, and Peter S. Lynch may be sent to Fidelity Investments, 82 Devonshire Street, Boston, Massachusetts 02109.
Name, Age; Principal Occupation |
Edward C. Johnson 3d (81) |
| Year of Election or Appointment: 2011 Member of the Advisory Board of Fidelity's Equity and High Income Funds. Mr. Johnson serves as Chief Executive Officer, Chairman, and a Director of FMR LLC, and also serves as Chairman and Director of FIL Limited. Previously, Mr. Johnson served as a Trustee and Chairman of the Board of certain Fidelity Trusts, Chairman and a Director of FMR, Chairman and a Director of FMR Co., Inc., and President of FMR LLC (2006-2007). |
Peter S. Lynch (67) |
| Year of Election or Appointment: 2003 Member of the Advisory Board of Fidelity's Equity and High Income Funds. Mr. Lynch is Vice Chairman and a Director of FMR and FMR Co., Inc. In addition, Mr. Lynch serves as a Trustee of Boston College and as the Chairman of the Inner-City Scholarship Fund. Previously, Mr. Lynch served on the Special Olympics International Board of Directors (1997-2006). |
Kenneth B. Robins (42) |
| Year of Election or Appointment: 2008 President and Treasurer of Fidelity's Equity and High Income Funds. Mr. Robins also serves as President and Treasurer (2010-present) and Assistant Treasurer (2009-present) of other Fidelity funds and is an employee of Fidelity Investments (2004-present). Previously, Mr. Robins served as Deputy Treasurer of the Fidelity funds (2005-2008) and Treasurer and Chief Financial Officer of The North Carolina Capital Management Trust: Cash and Term Portfolios (2006-2008). |
Bruce T. Herring (46) |
| Year of Election or Appointment: 2006 Vice President of certain Equity Funds. Mr. Herring also serves as Chief Investment Officer and Director of Fidelity Management & Research (U.K.) Inc. (2010-present) and Group Chief Investments Officer of FMR. Previously, Mr. Herring served as Vice President (2005-2006) and Senior Vice President (2006-2007) of Fidelity Management & Research Company, Vice President of FMR Co., Inc. (2001-2007) and as a portfolio manager for Fidelity U.S. Equity Funds. |
Brian B. Hogan (47) |
| Year of Election or Appointment: 2009 Vice President of Equity and High Income Funds. Mr. Hogan also serves as President of FMR's Equity Division (2009-present). Previously, Mr. Hogan served as Senior Vice President, Equity Research of FMR (2006-2009) and as a portfolio manager. |
Christopher S. Bartel (39) |
| Year of Election or Appointment: 2009 Vice President of Fidelity's Sector and Real Estate Equity Funds. Mr. Bartel also serves as Senior Vice President of Equity Research (2009-present). Previously, Mr. Bartel served as Managing Director of Research (2006-2009) and an analyst and portfolio manager (2000-2006). |
Thomas C. Hense (47) |
| Year of Election or Appointment: 2008 or 2010 Vice President of Fidelity's High Income (2008), Small Cap (2008), and Value (2010) Funds. Previously, Mr. Hense served as a portfolio manager for Fidelity's Institutional Money Management Group (Pyramis) (2003-2008). |
Scott C. Goebel (43) |
| Year of Election or Appointment: 2008 Secretary and Chief Legal Officer (CLO) of the Fidelity funds. Mr. Goebel also serves as Secretary of Fidelity Investments Money Management, Inc. (FIMM) (2010-present) and Fidelity Research and Analysis Company (FRAC) (2010-present); Secretary and CLO of The North Carolina Capital Management Trust: Cash and Term Portfolios (2008-present); General Counsel, Secretary, and Senior Vice President of FMR (2008-present) and FMR Co., Inc. (2008-present); employed by FMR LLC or an affiliate (2001-present); Chief Legal Officer of Fidelity Management & Research (Hong Kong) Limited (2008-present) and Assistant Secretary of Fidelity Management & Research (Japan) Inc. (2008-present), and Fidelity Management & Research (U.K.) Inc. (2008-present). Previously, Mr. Goebel served as Assistant Secretary of FIMM (2008-2010), FRAC (2008-2010), and the Funds (2007-2008) and as Vice President and Secretary of Fidelity Distributors Corporation (FDC) (2005-2007). |
William C. Coffey (42) |
| Year of Election or Appointment: 2009 Assistant Secretary of Fidelity's Equity and High Income Funds. Mr. Coffey also serves as Senior Vice President and Deputy General Counsel of FMR LLC (2010-present), and is an employee of Fidelity Investments. Previously, Mr. Coffey served as Vice President and Associate General Counsel of FMR LLC (2005-2009). |
Holly C. Laurent (57) |
| Year of Election or Appointment: 2008 Anti-Money Laundering (AML) Officer of the Fidelity funds. Ms. Laurent also serves as AML Officer of The North Carolina Capital Management Trust: Cash and Term Portfolios (2008-present) and is an employee of Fidelity Investments. Previously, Ms. Laurent was Senior Vice President and Head of Legal for Fidelity Business Services India Pvt. Ltd. (2006-2008), and Senior Vice President, Deputy General Counsel and Group Head for FMR LLC (2005-2006). |
Christine Reynolds (53) |
| Year of Election or Appointment: 2008 Chief Financial Officer of the Fidelity funds. Ms. Reynolds became President of Fidelity Pricing and Cash Management Services (FPCMS) in August 2008. Ms. Reynolds served as Chief Operating Officer of FPCMS (2007-2008). Previously, Ms. Reynolds served as President, Treasurer, and Anti-Money Laundering officer of the Fidelity funds (2004-2007). |
Kenneth A. Rathgeber (64) |
| Year of Election or Appointment: 2004 Chief Compliance Officer of Fidelity's Equity and High Income Funds. Mr. Rathgeber is Chief Compliance Officer of Fidelity Management & Research (Hong Kong) Limited (2008-present), Fidelity Management & Research (Japan) Inc. (2008-present), FMR (2005-present), FMR Co., Inc. (2005-present), Fidelity Management & Research (U.K.) Inc. (2005-present), Fidelity Research & Analysis Company (2005-present), Fidelity Investments Money Management, Inc. (2005-present), Pyramis Global Advisors, LLC (2005-present), and Strategic Advisers, Inc. (2005-present). |
Jeffrey S. Christian (50) |
| Year of Election or Appointment: 2009 Deputy Treasurer of the Fidelity funds. Mr. Christian is an employee of Fidelity Investments. Previously, Mr. Christian served as Chief Financial Officer (2008-2009) of certain Fidelity funds and Senior Vice President of Fidelity Pricing and Cash Management Services (FPCMS) (2004-2009). |
Joseph F. Zambello (54) |
| Year of Election or Appointment: 2011 Deputy Treasurer of the Fidelity funds. Mr. Zambello is an employee of Fidelity Investments. Previously, Mr. Zambello served as Vice President of FMR's Program Management Group (2009-2011) and Vice President of the Transfer Agent Oversight Group (2005-2009). |
Adrien E. Deberghes (44) |
| Year of Election or Appointment: 2008 Deputy Treasurer of Fidelity's Equity and High Income Funds. Mr. Deberghes also serves as Vice President and Assistant Treasurer of Fidelity Rutland Square Trust II and Fidelity Commonwealth Trust II (2011-present), Assistant Treasurer of other Fidelity funds (2010-present), and is an employee of Fidelity Investments (2008-present). Previously, Mr. Deberghes served as Senior Vice President of Mutual Fund Administration at State Street Corporation (2007-2008), Senior Director of Mutual Fund Administration at Investors Bank & Trust (2005-2007), and Director of Finance for Dunkin' Brands (2000-2005). |
Stephanie J. Dorsey (42) |
| Year of Election or Appointment: 2010 Assistant Treasurer of Fidelity's Equity and High Income Funds. Ms. Dorsey also serves as Deputy Treasurer of other Fidelity funds (2008-present) and is an employee of Fidelity Investments (2008-present). Previously, Ms. Dorsey served as Treasurer (2004-2008) of the JPMorgan Mutual Funds and Vice President (2004-2008) of JPMorgan Chase Bank. |
John R. Hebble (53) |
| Year of Election or Appointment: 2009 Assistant Treasurer of Fidelity's Equity and High Income Funds. Mr. Hebble also serves as President (2011-present), Treasurer, and Chief Financial Officer of The North Carolina Capital Management Trust: Cash and Term Portfolios (2008-present), President and Treasurer of other Fidelity funds (2008-present) and is an employee of Fidelity Investments. |
Gary W. Ryan (53) |
| Year of Election or Appointment: 2005 Assistant Treasurer of the Fidelity funds. Mr. Ryan is an employee of Fidelity Investments. Previously, Mr. Ryan served as Vice President of Fund Reporting in Fidelity Pricing and Cash Management Services (FPCMS) (1999-2005). |
Jonathan Davis (43) |
| Year of Election or Appointment: 2010 Assistant Treasurer of the Fidelity funds. Mr. Davis is also Assistant Treasurer of Fidelity Rutland Square Trust II and Fidelity Commonwealth Trust II. Mr. Davis is an employee of Fidelity Investments. Previously, Mr. Davis served as Vice President and Associate General Counsel of FMR LLC (2003-2010). |
Annual Report
Institutional Class designates 100% of the dividend distributed during the fiscal year as amounts which may be taken into account as a dividend for purposes of the maximum rate under section 1(h)(11) of the Internal Revenue Code.
The amounts per share which represent income derived from sources within, and taxes paid to, foreign countries or possessions of the United States are as follows:
| Pay Date | Income | Taxes |
Institutional Class | 12/06/2010 | $0.305 | $0.0185 |
The fund will notify shareholders in January 2012 of amounts for use in preparing 2011 income tax returns.
Annual Report
Board Approval of Investment Advisory Contracts and Management Fees
Fidelity Advisor Overseas Fund
Each year, the Board of Trustees, including the Independent Trustees (together, the Board), votes on the renewal of the management contract and sub-advisory agreements (together, the Advisory Contracts) for the fund. The Board, assisted by the advice of fund counsel and Independent Trustees' counsel, requests and considers a broad range of information relevant to the renewal of the Advisory Contracts throughout the year.
The Board meets regularly and considers at each of its meetings factors that are relevant to its annual consideration of the renewal of the fund's Advisory Contracts, including the services and support provided to the fund and its shareholders. The Board has established various standing committees, each composed of Independent Trustees with varying backgrounds, to which the Board has assigned specific subject matter responsibilities in order to enhance effective decision-making by the Board. The Board, acting directly and through its Committees, requests and receives information concerning the annual consideration of the renewal of the fund's Advisory Contracts. The Board also meets as needed to consider matters specifically related to the Board's annual consideration of the renewal of Advisory Contracts. Members of the Board may also meet with trustees of other Fidelity funds through ad hoc joint committees to discuss certain matters relevant to the Fidelity funds.
At its July 2011 meeting, the Board of Trustees, including the Independent Trustees, unanimously determined to renew the fund's Advisory Contracts. In reaching its determination, the Board considered all factors it believed relevant, including (i) the nature, extent, and quality of the services to be provided to the fund and its shareholders (including the investment performance of the fund); (ii) the competitiveness of the fund's management fee and total expense ratio; (iii) the total costs of the services to be provided by and the profits to be realized by Fidelity from its relationship with the fund; (iv) the extent to which economies of scale would be realized as the fund grows; and (v) whether fee levels reflect these economies of scale, if any, for the benefit of fund shareholders.
In considering whether to renew the Advisory Contracts for the fund, the Board reached a determination, with the assistance of fund counsel and Independent Trustees' counsel and through the exercise of its business judgment, that the renewal of the Advisory Contracts is in the best interests of the fund and its shareholders and that the compensation payable under the Advisory Contracts is fair and reasonable. The Board's decision to renew the Advisory Contracts was not based on any single factor, but rather was based on a comprehensive consideration of all the information provided to the Board at its meetings throughout the year. The Board, in reaching its determination to renew the Advisory Contracts, is aware that shareholders in the fund have a broad range of investment choices available to them, including a wide choice among mutual funds offered by Fidelity's competitors, and that the fund's shareholders, who have the opportunity to review and weigh the disclosure provided by the fund in its prospectus and other public disclosures, have chosen to invest in this fund, managed by Fidelity.
Annual Report
Nature, Extent, and Quality of Services Provided. The Board considered the staffing within the investment adviser, FMR, and the sub-advisers (together, the Investment Advisers), including the backgrounds of the fund's investment personnel and the fund's investment objective and discipline. The Independent Trustees also had discussions with senior management of Fidelity's investment operations and investment groups. The Board considered the structure of the portfolio manager compensation program and whether this structure provides appropriate incentives to act in the best interests of the fund.
Resources Dedicated to Investment Management and Support Services. The Board and the Fund Oversight and Research Committees reviewed the general qualifications and capabilities of the Investment Advisers' investment staff, including its size, education, experience, and resources, as well as the Investment Advisers' approach to recruiting, training, managing, and compensating investment personnel. The Board also noted that FMR has devoted increased resources to non-U.S. offices. The Board noted that Fidelity's analysts have extensive resources, tools and capabilities which allow them to conduct sophisticated quantitative and fundamental analysis, as well as credit analysis of issuers, counterparties and enhancers. The Board also believes that Fidelity's investment professionals have sufficient access to global information and data so as to provide competitive investment results over time, and that those professionals also have access to sophisticated tools which permit them to assess portfolio construction and risk and performance attribution characteristics continuously, as well as to transmit new information and research conclusions rapidly around the world. Additionally, in their deliberations, the Board considered the Investment Advisers' trading capabilities and resources which are an integral part of the investment management process.
Shareholder and Administrative Services. The Board considered (i) the nature, extent, quality, and cost of advisory, administrative, and shareholder services performed by the Investment Advisers and their affiliates under the Advisory Contracts and under separate agreements covering transfer agency, pricing and bookkeeping, and securities lending services for the fund; (ii) the nature and extent of the investment adviser's supervision of third party service providers, principally custodians and subcustodians; and (iii) the resources devoted to, and the record of compliance with, the fund's compliance policies and procedures. The Board also reviewed the allocation of fund brokerage, including allocations to brokers affiliated with the Investment Advisers, the use of brokerage commissions to pay fund expenses, and the use of "soft" commission dollars to pay for research services.
The Board noted that the growth of fund assets over time across the complex allows Fidelity to reinvest in the development of services designed to enhance the value or convenience of the Fidelity funds as investment vehicles. These services include 24-hour access to account information and market information through telephone representatives and over the Internet, investor education materials and asset allocation tools, and the expanded availability of Fidelity Investor Centers, with 35 new branches opening since 2010.
Annual Report
Board Approval of Investment Advisory Contracts and
Management Fees - continued
Investment in a Large Fund Family. The Board considered the benefits to shareholders of investing in a Fidelity fund, including the benefits of investing in a fund that is part of a large family of funds offering a variety of investment disciplines and providing a large variety of mutual fund investor services. The Board noted that Fidelity had taken, or had made recommendations that resulted in the Fidelity funds taking, a number of actions over the previous year that benefited particular funds, including (i) continuing to dedicate additional resources to investment research and support of the senior management team that oversees asset management; (ii) rationalizing product lines through the mergers of six funds into other funds; (iii) continuing to migrate the Freedom Funds to dedicated lower cost underlying funds; (iv) obtaining shareholder approval to broaden the investment strategies for Fidelity Consumer Finance Portfolio, Fidelity Emerging Asia Fund, and Fidelity Environment and Alternative Energy Portfolio; (v) contractually agreeing to reduce the management fees and impose other expense limitations on Spartan 500 Index Fund and U.S. Bond Index Fund in connection with launching new institutional classes of these funds; (vi) changing the name, primary and supplemental benchmarks, and investment policies of Fidelity Global Strategies Fund to support the fund's flexible investment mandate and global orientation; and (vii) reducing the transfer agency account fee rates on certain accounts.
Investment Performance. The Board considered whether the fund has operated in accordance with its investment objective, as well as its record of compliance with its investment restrictions. It also reviewed the fund's absolute investment performance for each class, as well as the fund's relative investment performance for each class measured over multiple periods against (i) a broad-based securities market index, and (ii) a peer group of mutual funds deemed appropriate by Fidelity and reviewed by the Board. The following charts considered by the Board show, over the one-, three-, and five-year periods ended December 31, 2010, the cumulative total returns of Institutional Class (Class I) and Class B of the fund, the cumulative total returns of a broad-based securities market index ("benchmark"), and a range of cumulative total returns of a peer group of mutual funds identified by Morningstar, Inc. as having an investment style similar to that of the fund based on underlying portfolio holdings. The returns of Institutional Class (Class I) and Class B show the performance of the highest and lowest performing classes, respectively (based on five-year performance). The box within each chart shows the 25th percentile return (bottom of box) and the 75th percentile return (top of box) of the peer group. Returns shown above the box are in the first quartile and returns shown below the box are in the fourth quartile. The percentage beaten numbers noted below each chart correspond to the percentile box and represent the percentage of funds in the peer group whose performance was equal to or lower than that of the class indicated.
Annual Report
Fidelity Advisor Overseas Fund

The Board reviewed the fund's relative investment performance against its peer group and noted that the performance of Institutional Class (Class I) of the fund was in the first quartile for the one-year period and the second quartile for the three- and five-year periods. The Board also noted that the investment performance of Institutional Class (Class I) of the fund compared favorably to its benchmark for all the periods shown. The Board considered that the variations in performance among the fund's classes reflect the variations in class expenses, which result in lower performance for higher expense classes. The Board also reviewed the fund's performance since inception as well as performance in the current year.
The Board also considered that the fund's management fee is subject to upward or downward adjustment depending upon whether, and to what extent, the fund's investment performance for the performance period exceeds, or is exceeded by, the record (over the same period) of a Board-approved performance adjustment index. The Board noted that the performance adjustment provides FMR with a strong economic incentive to seek to achieve superior performance for the fund's shareholders and helps to more closely align the interests of FMR and the fund's shareholders.
Based on its review, the Board concluded that the nature, extent, and quality of services provided to the fund under the Advisory Contracts should benefit the fund's shareholders.
Annual Report
Board Approval of Investment Advisory Contracts and
Management Fees - continued
Competitiveness of Management Fee and Total Expense Ratio. The Board considered the fund's management fee and total expense ratio compared to "mapped groups" of competitive funds and classes. Fidelity creates "mapped groups" by combining similar Lipper investment objective categories that have comparable management fee characteristics. Combining Lipper investment objective categories aids the Board's management fee and total expense ratio comparisons by broadening the competitive group used for comparison and by reducing the number of universes to which various Fidelity funds are compared.
Management Fee. The Board considered two proprietary management fee comparisons for the 12-month periods shown in the chart below. The group of Lipper funds used by the Board for management fee comparisons is referred to below as the "Total Mapped Group." The Total Mapped Group comparison focuses on a fund's standing relative to the total universe of comparable funds available to investors in terms of gross management fees before expense reimbursements or caps, and without giving effect to the fund's performance adjustment. "TMG %" represents the percentage of funds in the Total Mapped Group that had management fees that were lower than the fund's. For example, a TMG % of 16% means that 84% of the funds in the Total Mapped Group had higher management fees than the fund. The "Asset-Size Peer Group" (ASPG) comparison focuses on a fund's standing relative to non-Fidelity funds similar in size to the fund within the Total Mapped Group. The ASPG represents at least 15% of the funds in the Total Mapped Group with comparable asset size and management fee characteristics, subject to a minimum of 50 funds (or all funds in the Total Mapped Group if fewer than 50). Additional information, such as the ASPG quartile in which the fund's management fee ranked and the impact of the fund's performance adjustment, is also included in the chart and considered by the Board.
Annual Report
Fidelity Advisor Overseas Fund

The Board noted that the fund's management fee ranked below the median of its Total Mapped Group and below the median of its ASPG for 2010. The Board also noted the effect of the fund's positive performance adjustment on the fund's management fee ranking. The Board noted that the performance adjustment for each year represents calculations for performance periods that differ from the periods shown in the performance charts above.
Based on its review, the Board concluded that the fund's management fee is fair and reasonable in light of the services that the fund receives and the other factors considered.
Total Expense Ratio. In its review of each class's total expense ratio, the Board considered the fund's management fee as well as other fund or class expenses, as applicable, such as transfer agent fees, pricing and bookkeeping fees, fund-paid 12b-1 fees, and custodial, legal, and audit fees. The Board also noted the effects of any waivers and reimbursements on fees and expenses, as well as the impact of the fund's performance adjustment. As part of its review, the Board also considered the current and historical total expense ratios of each class of the fund compared to competitive fund median expenses. Each class of the fund is compared to those funds and classes in the Total Mapped Group (used by the Board for management fee comparisons) that have a similar sales load structure.
The Board noted that the total expense ratio of each of Class A, Class B, Class C, and Institutional Class ranked below its competitive median for 2010 and the total expense ratio of Class T ranked above its competitive median for 2010. The Board considered that various factors, including 12b-1 fees, positive or negative performance adjustments, and relatively higher other expenses in the case of small fund size, can affect total expense ratios. The Board noted that the total expense ratio of Class T was above the competitive median primarily because of higher 12b-1 fees on Class T. Class T has a higher 12b-1 fee, but a lower front-end sales charge, than traditionally priced front-end sales charge classes. The Board noted that the fund offers multiple classes, each of which has a different sales load and 12b-1 fee structure, and that the multiple structures are intended to offer a range of pricing options for the intermediary market. The Board also noted that the total expense ratios of the classes vary primarily by the level of their 12b-1 fees, although differences in transfer agent fees may also cause expenses to vary from class to class.
Annual Report
Board Approval of Investment Advisory Contracts and
Management Fees - continued
Fees Charged to Other Fidelity Clients. The Board also considered Fidelity fee structures and other information with respect to clients of FMR and its affiliates, such as other mutual funds advised or subadvised by FMR or its affiliates, pension plan clients, and other institutional clients. In March 2010, the Board created an ad hoc joint committee with the board of other Fidelity funds (the Committee) to review and compare Fidelity's institutional investment advisory business with its business of providing services to the Fidelity funds, including the differences in services provided, fees charged, and costs incurred, as well as competition in their respective marketplaces.
Based on its review of total expense ratios and fees charged to other Fidelity clients, the Board concluded that the total expense ratio of each class of the fund was reasonable, although Class T was above the median of the universe presented for comparison, in light of the services that the fund and its shareholders receive and the other factors considered, including the findings of the Committee.
Costs of the Services and Profitability. The Board considered the revenues earned and the expenses incurred by Fidelity in conducting the business of developing, marketing, distributing, managing, administering and servicing the fund and its shareholders. The Board also considered the level of Fidelity's profits in respect of all the Fidelity funds.
On an annual basis, FMR presents to the Board Fidelity's profitability for the fund. Fidelity calculates the profitability for each fund, as well as aggregate profitability for groups of Fidelity funds and all Fidelity funds, using a series of detailed revenue and cost allocation methodologies which originate with the books and records of Fidelity on which Fidelity's audited financial statements are based. The Audit Committee of the Board reviews any significant changes from the prior year's methodologies.
PricewaterhouseCoopers LLP (PwC), independent registered public accounting firm and auditor to Fidelity and certain Fidelity funds, has been engaged annually by the Board as part of the Board's assessment of Fidelity's profitability analysis. PwC's engagement includes the review and assessment of Fidelity's methodologies used in determining the revenues and expenses attributable to Fidelity's mutual fund business, and completion of agreed-upon procedures surrounding the mathematical accuracy of fund profitability and its conformity to allocation methodologies. After considering PwC's reports issued under the engagement and information provided by Fidelity, the Board concluded that while other allocation methods may also be reasonable, Fidelity's profitability methodologies are reasonable in all material respects.
Annual Report
The Board also reviewed Fidelity's non-fund businesses and fall-out benefits related to the mutual fund business as well as cases where Fidelity's affiliates may benefit from or be related to the fund's business.
The Board considered the costs of the services provided by and the profits realized by Fidelity in connection with the operation of the fund and was satisfied that the profitability was not excessive in the circumstances.
Economies of Scale. The Board considered whether there have been economies of scale in respect of the management of the Fidelity funds, whether the Fidelity funds (including the fund) have appropriately benefited from any such economies of scale, and whether there is potential for realization of any further economies of scale. The Board considered the extent to which the fund will benefit from economies of scale through increased services to the fund, through waivers or reimbursements, or through fee or expense reductions. The Board also noted that in 2009, it and the board of other Fidelity funds created an ad hoc committee (the Economies of Scale Committee) to analyze whether FMR attains economies of scale in respect of the management and servicing of the Fidelity funds, whether the Fidelity funds have appropriately benefited from such economies of scale, and whether there is potential for realization of any further economies of scale.
The Board recognized that the fund's management contract incorporates a "group fee" structure, which provides for lower group fee rates as total fund assets under FMR's management increase, and for higher group fee rates as total fund assets under FMR's management decrease. FMR calculates the group fee rates based on a tiered asset "breakpoint" schedule that varies based on asset class. The Board considered that the group fee is designed to deliver the benefits of economies of scale to fund shareholders when total Fidelity fund assets increase, even if assets of any particular fund are unchanged or have declined, because some portion of Fidelity's costs are attributable to services provided to all Fidelity funds, and all funds benefit if those costs can be allocated among more assets. The Board concluded that, given the group fee structure, fund shareholders will benefit from lower management fees as assets under FMR's management increase at the fund complex level, regardless of whether Fidelity achieves any such economies of scale.
Annual Report
Board Approval of Investment Advisory Contracts and
Management Fees - continued
The Board concluded, taking into account the analysis of the Economies of Scale Committee, that any potential economies of scale are being appropriately shared between fund shareholders and Fidelity.
Additional Information Requested by the Board. In order to develop fully the factual basis for consideration of the Fidelity funds' Advisory Contracts, the Board requested and received additional information on certain topics, including (i) fund performance trends, actions to be taken by FMR to improve certain funds' overall performance, and Fidelity's long-term strategies for certain funds; (ii) portfolio manager changes that have occurred during the past year and length of portfolio manager tenure for different categories of funds over time; (iii) Fidelity's compensation structure for portfolio managers and other key personnel and strategies for attracting and retaining non-investment personnel; (iv) the amount of the investment that each portfolio manager has made in the Fidelity fund(s) that he or she manages; (v) historical trends in Fidelity's realization of fall-out benefits; (vi) Fidelity's group fee structures and the rationale for the individual fee rates of certain funds; (vii) fund profitability methodology and the impact of certain factors on fund profitability results; (viii) trends regarding industry use of performance fee structures and Fidelity's compliance practices with respect to performance adjustment calculations; (ix) the fee structures in place for certain other Fidelity clients; and (x) explanations regarding the relative total expense ratios of certain funds and classes, total expense competitive trends, and actions that might be taken by FMR to reduce total expense ratios for certain funds and classes.
Based on its evaluation of all of the conclusions noted above, and after considering all factors it believed relevant, the Board ultimately concluded that the advisory fee structures are fair and reasonable, and that the fund's Advisory Contracts should be renewed.
Annual Report
Investment Adviser
Fidelity Management & Research Company
Boston, MA
Investment Sub-Advisers
FMR Co., Inc.
Fidelity Management & Research
(U.K.) Inc.
Fidelity Management & Research
(Hong Kong) Limited
FIL Investments (Japan) Limited
Fidelity Management & Research (Japan) Inc.
FIL Investment Advisors (UK) Limited
FIL Investment Advisors
General Distributor
Fidelity Distributors Corporation
Boston, MA
Transfer and Service Agents
Fidelity Investments Institutional Operations Company, Inc.
Boston, MA
Fidelity Service Company, Inc.
Boston, MA
Custodian
The Northern Trust Company
Chicago, IL
OSI-UANN-1211
1.784768.108
(Fidelity Investment logo)(registered trademark)
Fidelity Advisor®
Value Leaders
Fund - Class A, Class T, Class B
and Class C
Annual Report
October 31, 2011
Contents
Chairman's Message | (Click Here) | The Chairman's message to shareholders. |
Performance | (Click Here) | How the fund has done over time. |
Management's Discussion of Fund Performance | (Click Here) | The Portfolio Manager's review of fund performance and strategy. |
Shareholder Expense Example | (Click Here) | An example of shareholder expenses. |
Investment Changes | (Click Here) | A summary of major shifts in the fund's investments over the past six months. |
Investments | (Click Here) | A complete list of the fund's investments with their market values. |
Financial Statements | (Click Here) | Statements of assets and liabilities, operations, and changes in net assets, as well as financial highlights. |
Notes | (Click Here) | Notes to the financial statements. |
Report of Independent Registered Public Accounting Firm | (Click Here) | |
Trustees and Officers | (Click Here) | |
Distributions | (Click Here) | |
Board Approval of Investment Advisory Contracts and Management Fees | (Click Here) | |
To view a fund's proxy voting guidelines and proxy voting record for the 12-month period ended June 30, visit http://www.fidelity.com/proxyvotingresults or visit the Securities and Exchange Commission's (SEC) web site at http://www.sec.gov. You may also call 1-877-208-0098 to request a free copy of the proxy voting guidelines.
Standard & Poor's, S&P and S&P 500 are registered service marks of The McGraw-Hill Companies, Inc. and have been licensed for use by Fidelity Distributors Corporation.
Other third party marks appearing herein are the property of their respective owners.
All other marks appearing herein are registered or unregistered trademarks or service marks of FMR LLC or an affiliated company.
Annual Report
This report and the financial statements contained herein are submitted for the general information of the shareholders of the fund. This report is not authorized for distribution to prospective investors in the fund unless preceded or accompanied by an effective prospectus.
A fund files its complete schedule of portfolio holdings with the SEC for the first and third quarters of each fiscal year on Form N-Q. Forms N-Q are available on the SEC's web site at http://www.sec.gov. A fund's Forms N-Q may be reviewed and copied at the SEC's Public Reference Room in Washington, DC. Information regarding the operation of the SEC's Public Reference Room may be obtained by calling 1-800-SEC-0330. For a complete list of a fund's portfolio holdings, view the most recent holdings listing, semiannual report, or annual report on Fidelity's web site at http://www.fidelity.com, http://www.advisor.fidelity.com, or http://www.401k.com, as applicable.
NOT FDIC INSURED • MAY LOSE VALUE • NO BANK GUARANTEE
Neither the fund nor Fidelity Distributors Corporation is a bank.
Annual Report
(photo_of_James_C_Curvey)
Dear Shareholder:
Global equity markets began the fourth quarter on a strong note, sharply reversing course in October amid strong corporate earnings, better-than-expected economic news and the promise of a resolution to the sovereign debt crisis in Europe. The mini rally followed a third quarter marked by a significant downturn in July and August, which heightened investor anxiety and set off a wave of volatility that hampered most major asset classes through the end of September. Financial markets are difficult to predict, of course, but you can help put the odds in your favor by following these time-tested investment principles.
One of the basic tenets is to invest according to your time horizon. For long-term investors, riding out the markets' inevitable ups and downs has proven much more effective than making decisions based on short-term developments. If your goal is approaching, you can also benefit from patience and restraint, rather than attempting to time the market. No matter your time horizon, missing only a few of the markets' best days can significantly diminish returns. Patience also affords the benefits of compounding - earning interest on additional income or reinvested dividends and capital gains. While staying the course doesn't eliminate risk, it can considerably lessen the negative impact of short-term downturns.
Asset allocation is another principle to manage risk. As you spread your portfolio among the asset classes, be sure to consider your time horizon, risk tolerance and investment objectives. Younger investors may be better served by emphasizing equities, which historically have been the best-performing asset class over time. Investors who are nearing a specific goal, such as retirement or sending a child to college, may choose to favor bonds and other investments that have tended to be more stable. Studies indicate that asset allocation is the single most important determinant of a portfolio's long-term success. After deciding on a suitable allocation strategy, make sure your portfolio is adequately diversified, with exposure to stocks of small-, mid- and large-cap companies in a range of sectors, for example. And today, more than ever, geographic diversification should be taken into account.
Lastly, investing a certain amount of money on a regular basis - a principle known as dollar-cost averaging - can help lower the average cost of your purchases, while also giving you the discipline to avoid selling weak performers just prior to an upswing, or chasing a hot performer just before a correction.
We invite you to learn more by visiting us on the Internet, dropping by one of our Investor Centers or calling us by phone. It is our privilege to provide the resources you need to choose investments that are right for you.
Sincerely,
(The acting chairman's signature appears here.)
James C. Curvey
Acting Chairman
Annual Report
Average annual total return reflects the change in the value of an investment, assuming reinvestment of the class' distributions from dividend income and capital gains (the profits earned upon the sale of securities that have grown in value, if any) and assuming a constant rate of performance each year. The $10,000 table and the fund's returns do not reflect the deduction of taxes that a shareholder would pay on fund distributions or the redemption of fund shares. During periods of reimbursement by Fidelity, a fund's total return will be greater than it would be had the reimbursement not occurred. How a fund did yesterday is no guarantee of how it will do tomorrow. Returns reflect the conversion of Class B shares to Class A shares after a maximum of seven years.
Average Annual Total Returns
Periods ended October 31, 2011 | Past 1
year | Past 5
years | Life of
fund A |
Class A (incl. 5.75% sales charge) | -6.13% | -6.26% | 1.42% |
Class T (incl. 3.50% sales charge) | -4.12% | -6.05% | 1.45% |
Class B (incl. contingent deferred sales charge) B | -6.07% | -6.20% | 1.49% |
Class C (incl. contingent deferred sales charge) C | -2.16% | -5.87% | 1.36% |
A From June 17, 2003.
B Class B shares' contingent deferred sales charges included in the past one year, past five years, and life of fund total return figures are 5%, 2%, and 0%, respectively.
C Class C shares' contingent deferred sales charges included in the past one year, past five years, and life of fund total return figures are 1%, 0%, and 0%, respectively.
Annual Report
$10,000 Over Life of Fund
Let's say hypothetically that $10,000 was invested in Fidelity Advisor® Value Leaders Fund - Class A on June 17, 2003, when the fund started, and the current 5.75% sales charge was paid. The chart shows how the value of your investment would have changed, and also shows how the Russell 1000® Value Index performed over the same period.
Annual Report
Market Recap: U.S. stocks overcame a sharp summer drop to post a solid gain for the 12 months ending October 31, 2011. Bullishness pervaded the market during the first half of the period, only to be squelched by extreme volatility in the summer, as debate over the U.S. debt ceiling, Standard & Poor's subsequent downgrade of the country's long-term sovereign credit rating and deepening debt woes in Europe led to the worst calendar-quarter finish for the S&P 500® Index in almost three years. However, news of a possible solution to the eurozone debt crisis, along with better-than-expected U.S. economic data and strong corporate earnings, helped fuel an October rally that pushed the broad-based index up roughly 11% - its highest monthly return since December 1991. With that boost, the S&P 500® finished the year up 8.09%, while the blue-chip Dow Jones Industrial AverageSM added 10.39% and the technology-heavy Nasdaq Composite® Index gained 8.10%. Among sectors within the S&P 500®, only financials (-6%) posted a decline for the year, while energy (+19%) and utilities (+15%) fared best. Small and mid-sized stocks also rose, with the Russell 2000® and Russell Midcap® indexes adding 6.71% and 7.85%, respectively. The lengthy financial crisis in Europe continued to hamper foreign developed-markets equities, with the MSCI® EAFE® (Europe, Australasia, Far East) Index falling 3.97%.
Comments from Michael Chren, Portfolio Manager of Fidelity Advisor® Value Leaders Fund: For the year, the fund's Class A, Class T, Class B and Class C shares declined 0.40%, 0.64%, 1.14% and 1.18%, respectively (excluding sales charges), compared with a gain of 6.16% for the Russell 1000® Value Index. Two out-of-index European stocks, France-based telecom equipment manufacturer Alcatel-Lucent and Swiss specialty chemicals maker Clariant, accounted for much of the fund's disappointing performance and were the fund's two biggest individual detractors. The fund's overweighting and weak security selection in diversified financials was costly, with our stakes in Citigroup and Goldman Sachs Group hurting performance. Poor positioning in information technology, materials and utilities also dampened results. On the positive side, positioning in consumer staples provided the biggest boost to relative performance, including the portfolio's top individual contributor, Mexican brewer Grupo Modelo. Investments in the consumer discretionary sector yielded mixed results, but we received a contribution from Swiss navigation products manufacturer Garmin. Good positioning in industrials and energy also helped.
The views expressed above reflect those of the portfolio manager(s) only through the end of the period as stated on the cover of this report and do not necessarily represent the views of Fidelity or any other person in the Fidelity organization. Any such views are subject to change at any time based upon market or other conditions and Fidelity disclaims any responsibility to update such views. These views may not be relied on as investment advice and, because investment decisions for a Fidelity fund are based on numerous factors, may not be relied on as an indication of trading intent on behalf of any Fidelity fund.
Annual Report
Shareholder Expense Example
As a shareholder of the Fund, you incur two types of costs: (1) transaction costs, including sales charges (loads) on purchase payments or redemption proceeds, and (2) ongoing costs, including management fees, distribution and/or service (12b-1) fees and other Fund expenses. This Example is intended to help you understand your ongoing costs (in dollars) of investing in the Fund and to compare these costs with the ongoing costs of investing in other mutual funds.
The Example is based on an investment of $1,000 invested at the beginning of the period and held for the entire period (May 1, 2011 to October 31, 2011).
Actual Expenses
The first line of the accompanying table for each class of the Fund provides information about actual account values and actual expenses. You may use the information in this line, together with the amount you invested, to estimate the expenses that you paid over the period. Simply divide your account value by $1,000.00 (for example, an $8,600 account value divided by $1,000.00 = 8.6), then multiply the result by the number in the first line for a class of the Fund under the heading entitled "Expenses Paid During Period" to estimate the expenses you paid on your account during this period. In addition, the Fund, as a shareholder in the underlying Fidelity Central Funds, will indirectly bear its pro-rata share of the fees and expenses incurred by the underlying Fidelity Central Funds. These fees and expenses are not included in the Fund's annualized expense ratio used to calculate the expense estimate in the table below.
Hypothetical Example for Comparison Purposes
The second line of the accompanying table for each class of the Fund provides information about hypothetical account values and hypothetical expenses based on a Class' actual expense ratio and an assumed rate of return of 5% per year before expenses, which is not the Class' actual return. The hypothetical account values and expenses may not be used to estimate the actual ending account balance or expenses you paid for the period. You may use this information to compare the ongoing costs of investing in the Fund and other funds. To do so, compare this 5% hypothetical example with the 5% hypothetical examples that appear in the shareholder reports of the other funds. In addition, the Fund, as a shareholder in the underlying Fidelity Central Funds, will indirectly bear its pro-rata share of the fees and expenses incurred by the underlying Fidelity Central Funds. These fees and expenses are not included in the Fund's annualized expense ratio used to calculate the expense estimate in the table below.
Please note that the expenses shown in the table are meant to highlight your ongoing costs only and do not reflect any transaction costs. Therefore, the second line of the table is useful in comparing ongoing costs only, and will not help you determine the relative total costs of owning different funds. In addition, if these transactional costs were included, your costs would have been higher.
Annual Report
| Annualized
Expense Ratio | Beginning
Account Value
May 1, 2011 | Ending
Account Value
October 31, 2011 | Expenses Paid
During Period*
May 1, 2011 to
October 31, 2011 |
Class A | 1.29% | | | |
Actual | | $ 1,000.00 | $ 845.50 | $ 6.00 |
HypotheticalA | | $ 1,000.00 | $ 1,018.70 | $ 6.56 |
Class T | 1.55% | | | |
Actual | | $ 1,000.00 | $ 844.10 | $ 7.20 |
HypotheticalA | | $ 1,000.00 | $ 1,017.39 | $ 7.88 |
Class B | 2.04% | | | |
Actual | | $ 1,000.00 | $ 841.70 | $ 9.47 |
HypotheticalA | | $ 1,000.00 | $ 1,014.92 | $ 10.36 |
Class C | 2.04% | | | |
Actual | | $ 1,000.00 | $ 842.00 | $ 9.47 |
HypotheticalA | | $ 1,000.00 | $ 1,014.92 | $ 10.36 |
Institutional Class | .97% | | | |
Actual | | $ 1,000.00 | $ 846.50 | $ 4.51 |
HypotheticalA | | $ 1,000.00 | $ 1,020.32 | $ 4.94 |
A 5% return per year before expenses
* Expenses are equal to each Class' annualized expense ratio, multiplied by the average account value over the period, multiplied by 184/365 (to reflect the one-half year period).
Annual Report
Investment Changes (Unaudited)
Top Ten Stocks as of October 31, 2011 |
| % of fund's
net assets | % of fund's net assets
6 months ago |
Garmin Ltd. | 5.0 | 3.4 |
Grupo Modelo SAB de CV Series C | 5.0 | 3.8 |
Citigroup, Inc. | 4.7 | 3.3 |
Pfizer, Inc. | 4.2 | 4.8 |
Alcatel-Lucent SA sponsored ADR | 3.9 | 3.0 |
Johnson & Johnson | 3.8 | 2.1 |
Merck & Co., Inc. | 3.3 | 2.8 |
Procter & Gamble Co. | 3.3 | 0.4 |
General Electric Co. | 3.3 | 3.4 |
Chevron Corp. | 3.0 | 3.0 |
| 39.5 | |
Top Five Market Sectors as of October 31, 2011 |
| % of fund's
net assets | % of fund's net assets
6 months ago |
Financials | 22.9 | 24.3 |
Health Care | 14.8 | 15.7 |
Consumer Staples | 11.8 | 9.3 |
Energy | 11.4 | 11.7 |
Consumer Discretionary | 11.1 | 9.1 |
Asset Allocation (% of fund's net assets) |
As of October 31, 2011* | As of April 30, 2011** |
| Stocks 95.0% | | | Stocks 98.7% | |
| Short-Term
Investments and
Net Other Assets 5.0% | | | Short-Term
Investments and
Net Other Assets 1.3% | |
* Foreign investments | 24.6% | | ** Foreign investments | 24.8% | |

Annual Report
Investments October 31, 2011
Showing Percentage of Net Assets
Common Stocks - 95.0% |
| Shares | | Value |
CONSUMER DISCRETIONARY - 11.1% |
Automobiles - 0.6% |
Honda Motor Co. Ltd. | 5,500 | | $ 164,492 |
Household Durables - 5.7% |
D.R. Horton, Inc. | 18,638 | | 207,441 |
Garmin Ltd. (d) | 42,730 | | 1,469,477 |
| | 1,676,918 |
Media - 1.8% |
Time Warner, Inc. | 6,964 | | 243,670 |
Washington Post Co. Class B (d) | 856 | | 291,177 |
| | 534,847 |
Multiline Retail - 2.4% |
JCPenney Co., Inc. (d) | 19,706 | | 632,168 |
Target Corp. | 1,296 | | 70,956 |
| | 703,124 |
Specialty Retail - 0.6% |
American Eagle Outfitters, Inc. | 13,004 | | 170,743 |
TOTAL CONSUMER DISCRETIONARY | | 3,250,124 |
CONSUMER STAPLES - 11.8% |
Beverages - 5.0% |
Grupo Modelo SAB de CV Series C | 231,200 | | 1,466,507 |
Food & Staples Retailing - 0.7% |
CVS Caremark Corp. | 2,110 | | 76,593 |
Wal-Mart Stores, Inc. | 2,447 | | 138,794 |
| | 215,387 |
Food Products - 2.1% |
Kraft Foods, Inc. Class A | 17,114 | | 602,071 |
Household Products - 3.3% |
Procter & Gamble Co. | 14,913 | | 954,283 |
Tobacco - 0.7% |
Lorillard, Inc. | 1,738 | | 192,327 |
TOTAL CONSUMER STAPLES | | 3,430,575 |
ENERGY - 11.4% |
Energy Equipment & Services - 1.9% |
Transocean Ltd. (United States) | 5,661 | | 323,526 |
Weatherford International Ltd. (a) | 15,864 | | 245,892 |
| | 569,418 |
Common Stocks - continued |
| Shares | | Value |
ENERGY - continued |
Oil, Gas & Consumable Fuels - 9.5% |
Alpha Natural Resources, Inc. (a) | 6,500 | | $ 156,260 |
Anadarko Petroleum Corp. | 2,344 | | 184,004 |
Apache Corp. | 1,300 | | 129,519 |
BP PLC sponsored ADR | 4,620 | | 204,112 |
Chevron Corp. | 8,300 | | 871,915 |
Marathon Petroleum Corp. | 18,305 | | 657,150 |
Occidental Petroleum Corp. | 5,980 | | 555,781 |
| | 2,758,741 |
TOTAL ENERGY | | 3,328,159 |
FINANCIALS - 22.9% |
Capital Markets - 3.6% |
Bank of New York Mellon Corp. | 10,500 | | 223,440 |
E*TRADE Financial Corp. (a) | 34,690 | | 376,387 |
Goldman Sachs Group, Inc. | 2,004 | | 219,538 |
Morgan Stanley | 6,899 | | 121,698 |
State Street Corp. | 2,800 | | 113,092 |
| | 1,054,155 |
Commercial Banks - 6.4% |
Aozora Bank Ltd. | 217,000 | | 548,652 |
KeyCorp | 43,700 | | 308,522 |
Sumitomo Mitsui Financial Group, Inc. | 3,700 | | 103,434 |
U.S. Bancorp | 10,370 | | 265,368 |
Wells Fargo & Co. | 24,826 | | 643,242 |
| | 1,869,218 |
Diversified Financial Services - 6.9% |
Bank of America Corp. | 19,055 | | 130,146 |
Citigroup, Inc. | 42,922 | | 1,355,906 |
JPMorgan Chase & Co. | 15,176 | | 527,518 |
| | 2,013,570 |
Insurance - 5.1% |
Assurant, Inc. | 1,900 | | 73,226 |
Berkshire Hathaway, Inc. Class B (a) | 1,289 | | 100,362 |
MetLife, Inc. | 17,568 | | 617,691 |
RenaissanceRe Holdings Ltd. | 1,597 | | 108,788 |
The Chubb Corp. | 3,600 | | 241,380 |
XL Group PLC Class A | 14,939 | | 324,774 |
| | 1,466,221 |
Common Stocks - continued |
| Shares | | Value |
FINANCIALS - continued |
Real Estate Investment Trusts - 0.7% |
Weyerhaeuser Co. | 11,500 | | $ 206,770 |
Thrifts & Mortgage Finance - 0.2% |
Radian Group, Inc. | 26,100 | | 61,335 |
TOTAL FINANCIALS | | 6,671,269 |
HEALTH CARE - 14.8% |
Health Care Equipment & Supplies - 0.5% |
CareFusion Corp. (a) | 6,200 | | 158,720 |
Pharmaceuticals - 14.3% |
Bristol-Myers Squibb Co. | 3,200 | | 101,088 |
Eli Lilly & Co. | 6,274 | | 233,142 |
Johnson & Johnson | 17,111 | | 1,101,777 |
Merck & Co., Inc. | 28,141 | | 970,865 |
Pfizer, Inc. | 63,725 | | 1,227,344 |
Sanofi-aventis sponsored ADR | 14,625 | | 522,844 |
| | 4,157,060 |
TOTAL HEALTH CARE | | 4,315,780 |
INDUSTRIALS - 5.6% |
Aerospace & Defense - 1.7% |
United Technologies Corp. | 6,500 | | 506,870 |
Construction & Engineering - 0.6% |
Jacobs Engineering Group, Inc. (a) | 4,300 | | 166,840 |
Industrial Conglomerates - 3.3% |
General Electric Co. | 56,680 | | 947,123 |
TOTAL INDUSTRIALS | | 1,620,833 |
INFORMATION TECHNOLOGY - 11.0% |
Communications Equipment - 7.0% |
Alcatel-Lucent SA sponsored ADR (a)(d) | 415,582 | | 1,138,695 |
Cisco Systems, Inc. | 10,937 | | 202,663 |
Comverse Technology, Inc. (a) | 103,700 | | 714,493 |
| | 2,055,851 |
Electronic Equipment & Components - 1.0% |
Corning, Inc. | 19,954 | | 285,143 |
Office Electronics - 0.7% |
Xerox Corp. | 23,649 | | 193,449 |
Common Stocks - continued |
| Shares | | Value |
INFORMATION TECHNOLOGY - continued |
Semiconductors & Semiconductor Equipment - 1.8% |
Advanced Micro Devices, Inc. (a) | 91,438 | | $ 533,084 |
Software - 0.5% |
Microsoft Corp. | 5,172 | | 137,730 |
TOTAL INFORMATION TECHNOLOGY | | 3,205,257 |
MATERIALS - 3.1% |
Chemicals - 2.0% |
Clariant AG (Reg.) (a) | 54,378 | | 594,561 |
Metals & Mining - 1.1% |
Newmont Mining Corp. | 4,678 | | 312,631 |
TOTAL MATERIALS | | 907,192 |
TELECOMMUNICATION SERVICES - 0.5% |
Diversified Telecommunication Services - 0.5% |
CenturyLink, Inc. | 3,745 | | 132,049 |
UTILITIES - 2.8% |
Electric Utilities - 2.8% |
Exelon Corp. | 4,668 | | 207,213 |
FirstEnergy Corp. | 5,904 | | 265,444 |
NextEra Energy, Inc. | 6,296 | | 355,094 |
| | 827,751 |
TOTAL COMMON STOCKS (Cost $30,821,769) | 27,688,989 |
Money Market Funds - 16.1% |
| Shares | | Value |
Fidelity Cash Central Fund, 0.12% (b) | 1,336,268 | | $ 1,336,268 |
Fidelity Securities Lending Cash Central Fund, 0.11% (b)(c) | 3,353,649 | | 3,353,649 |
TOTAL MONEY MARKET FUNDS (Cost $4,689,917) | 4,689,917 |
TOTAL INVESTMENT PORTFOLIO - 111.1% (Cost $35,511,686) | | 32,378,906 |
NET OTHER ASSETS (LIABILITIES) - (11.1)% | | (3,232,267) |
NET ASSETS - 100% | $ 29,146,639 |
Legend |
(a) Non-income producing |
(b) Affiliated fund that is available only to investment companies and other accounts managed by Fidelity Investments. The rate quoted is the annualized seven-day yield of the fund at period end. A complete unaudited listing of the fund's holdings as of its most recent quarter end is available upon request. In addition, each Fidelity Central Fund's financial statements, which are not covered by the Fund's Report of Independent Registered Public Accounting Firm, are available on the SEC's website or upon request. |
(c) Investment made with cash collateral received from securities on loan. |
(d) Security or a portion of the security is on loan at period end. |
Affiliated Central Funds |
Information regarding fiscal year to date income earned by the Fund from investments in Fidelity Central Funds is as follows: |
Fund | Income earned |
Fidelity Cash Central Fund | $ 857 |
Fidelity Securities Lending Cash Central Fund | 39,854 |
Total | $ 40,711 |
Other Information |
The following is a summary of the inputs used, as of October 31, 2011, involving the Fund's assets and liabilities carried at fair value. The inputs or methodology used for valuing securities may not be an indication of the risk associated with investing in those securities. For more information on valuation inputs, and their aggregation into the levels used in the table below, please refer to the Security Valuation section in the accompanying Notes to Financial Statements. |
Valuation Inputs at Reporting Date: |
Description | Total | Level 1 | Level 2 | Level 3 |
Investments in Securities: | | | | |
Equities: | | | | |
Consumer Discretionary | $ 3,250,124 | $ 3,085,632 | $ 164,492 | $ - |
Consumer Staples | 3,430,575 | 3,430,575 | - | - |
Energy | 3,328,159 | 3,328,159 | - | - |
Financials | 6,671,269 | 6,019,183 | 652,086 | - |
Health Care | 4,315,780 | 4,315,780 | - | - |
Industrials | 1,620,833 | 1,620,833 | - | - |
Information Technology | 3,205,257 | 3,205,257 | - | - |
Materials | 907,192 | 907,192 | - | - |
Telecommunication Services | 132,049 | 132,049 | - | - |
Utilities | 827,751 | 827,751 | - | - |
Money Market Funds | 4,689,917 | 4,689,917 | - | - |
Total Investments in Securities: | $ 32,378,906 | $ 31,562,328 | $ 816,578 | $ - |
Distribution of investments by country of issue, as a percentage of total net assets, is as follows: (Unaudited) |
United States of America | 75.4% |
Switzerland | 8.9% |
France | 5.7% |
Mexico | 5.0% |
Japan | 2.8% |
Ireland | 1.1% |
Others (Individually Less Than 1%) | 1.1% |
| 100.0% |
Income Tax Information |
At October 31, 2011, the Fund had a capital loss carryforward of approximately $34,183,216 of which $19,194,347, $14,819,668 and $169,201 will expire in fiscal 2016, 2017 and 2019, respectively. Capital loss carryforwards are only available to offset future capital gains of the Fund to the extent provided by regulations and may be limited. |
See accompanying notes which are an integral part of the financial statements.
Annual Report
Statement of Assets and Liabilities
| October 31, 2011 |
| | |
Assets | | |
Investment in securities, at value (including securities loaned of $3,144,683) - See accompanying schedule: Unaffiliated issuers (cost $30,821,769) | $ 27,688,989 | |
Fidelity Central Funds (cost $4,689,917) | 4,689,917 | |
Total Investments (cost $35,511,686) | | $ 32,378,906 |
Receivable for investments sold | | 576,276 |
Receivable for fund shares sold | | 8,850 |
Dividends receivable | | 23,755 |
Distributions receivable from Fidelity Central Funds | | 2,695 |
Prepaid expenses | | 93 |
Other receivables | | 2,526 |
Total assets | | 32,993,101 |
| | |
Liabilities | | |
Payable to custodian bank | $ 33,843 | |
Payable for investments purchased | 353,119 | |
Payable for fund shares redeemed | 36,147 | |
Accrued management fee | 7,561 | |
Distribution and service plan fees payable | 10,491 | |
Other affiliated payables | 8,226 | |
Other payables and accrued expenses | 43,426 | |
Collateral on securities loaned, at value | 3,353,649 | |
Total liabilities | | 3,846,462 |
| | |
Net Assets | | $ 29,146,639 |
Net Assets consist of: | | |
Paid in capital | | $ 67,015,415 |
Undistributed net investment income | | 188,125 |
Accumulated undistributed net realized gain (loss) on investments and foreign currency transactions | | (34,924,325) |
Net unrealized appreciation (depreciation) on investments and assets and liabilities in foreign currencies | | (3,132,576) |
Net Assets | | $ 29,146,639 |
See accompanying notes which are an integral part of the financial statements.
Annual Report
Financial Statements - continued
Statement of Assets and Liabilities - continued
| October 31, 2011 |
| | |
Calculation of Maximum Offering Price Class A:
Net Asset Value and redemption price per share ($15,483,920 ÷ 1,555,207 shares) | | $ 9.96 |
| | |
Maximum offering price per share (100/94.25 of $9.96) | | $ 10.57 |
Class T:
Net Asset Value and redemption price per share ($8,253,986 ÷ 828,804 shares) | | $ 9.96 |
| | |
Maximum offering price per share (100/96.50 of $9.96) | | $ 10.32 |
Class B:
Net Asset Value and offering price per share ($1,110,133 ÷ 112,827 shares)A | | $ 9.84 |
| | |
Class C:
Net Asset Value and offering price per share ($3,775,217 ÷ 387,126 shares)A | | $ 9.75 |
| | |
Institutional Class:
Net Asset Value, offering price and redemption price per share ($523,383 ÷ 52,149 shares) | | $ 10.04 |
A Redemption price per share is equal to net asset value less any applicable contingent deferred sales charge.
See accompanying notes which are an integral part of the financial statements.
Annual Report
Statement of Operations
| Year ended October 31, 2011 |
| | |
Investment Income | | |
Dividends | | $ 794,507 |
Income from Fidelity Central Funds | | 40,711 |
Total income | | 835,218 |
| | |
Expenses | | |
Management fee
Basic fee | $ 217,492 | |
Performance adjustment | (115,773) | |
Transfer agent fees | 117,048 | |
Distribution and service plan fees | 164,455 | |
Accounting and security lending fees | 15,700 | |
Custodian fees and expenses | 40,526 | |
Independent trustees' compensation | 223 | |
Registration fees | 60,933 | |
Audit | 49,062 | |
Legal | 298 | |
Miscellaneous | 498 | |
Total expenses before reductions | 550,462 | |
Expense reductions | (5,676) | 544,786 |
Net investment income (loss) | | 290,432 |
Realized and Unrealized Gain (Loss) Net realized gain (loss) on: | | |
Investment securities: | | |
Unaffiliated issuers | 726,208 | |
Foreign currency transactions | (6,005) | |
Total net realized gain (loss) | | 720,203 |
Change in net unrealized appreciation (depreciation) on: Investment securities | (343,367) | |
Assets and liabilities in foreign currencies | (19) | |
Total change in net unrealized appreciation (depreciation) | | (343,386) |
Net gain (loss) | | 376,817 |
Net increase (decrease) in net assets resulting from operations | | $ 667,249 |
See accompanying notes which are an integral part of the financial statements.
Annual Report
Financial Statements - continued
Statement of Changes in Net Assets
| Year ended
October 31,
2011 | Year ended
October 31,
2010 |
Increase (Decrease) in Net Assets | | |
Operations | | |
Net investment income (loss) | $ 290,432 | $ 331,551 |
Net realized gain (loss) | 720,203 | 3,334,586 |
Change in net unrealized appreciation (depreciation) | (343,386) | 1,707,613 |
Net increase (decrease) in net assets resulting
from operations | 667,249 | 5,373,750 |
Distributions to shareholders from net investment income | (358,603) | (478,174) |
Distributions to shareholders from net realized gain | (41,497) | (30,375) |
Total distributions | (400,100) | (508,549) |
Share transactions - net increase (decrease) | (15,871,835) | (17,770,134) |
Total increase (decrease) in net assets | (15,604,686) | (12,904,933) |
| | |
Net Assets | | |
Beginning of period | 44,751,325 | 57,656,258 |
End of period (including undistributed net investment income of $188,125 and undistributed net investment income of $270,130, respectively) | $ 29,146,639 | $ 44,751,325 |
See accompanying notes which are an integral part of the financial statements.
Annual Report
Financial Highlights - Class A
Years ended October 31, | 2011 | 2010 | 2009 | 2008 | 2007 |
Selected Per-Share Data | | | | | |
Net asset value, beginning of period | $ 10.12 | $ 9.30 | $ 8.63 | $ 16.40 | $ 15.08 |
Income from Investment Operations | | | | | |
Net investment income (loss) C | .10 | .07 F | .09 | .16 | .13 |
Net realized and unrealized gain (loss) | (.14) G | .85 | .75 | (7.09) | 1.99 |
Total from investment operations | (.04) | .92 | .84 | (6.93) | 2.12 |
Distributions from net investment income | (.11) | (.09) | (.17) | (.12) | (.09) |
Distributions from net realized gain | (.01) | (.01) | - | (.72) | (.71) |
Total distributions | (.12) | (.10) | (.17) | (.84) I | (.80) |
Net asset value, end of period | $ 9.96 | $ 10.12 | $ 9.30 | $ 8.63 | $ 16.40 |
Total Return A, B | (.40)% | 9.91% | 10.13% | (44.43)% | 14.64% |
Ratios to Average Net Assets D, H | | | | | |
Expenses before reductions | 1.24% | 1.22% | 1.25% | 1.26% | 1.28% |
Expenses net of fee waivers, if any | 1.24% | 1.22% | 1.25% | 1.25% | 1.25% |
Expenses net of all reductions | 1.23% | 1.21% | 1.25% | 1.25% | 1.24% |
Net investment income (loss) | .91% | .75% F | 1.10% | 1.21% | .85% |
Supplemental Data | | | | | |
Net assets, end of period (000 omitted) | $ 15,484 | $ 25,431 | $ 28,585 | $ 34,864 | $ 67,434 |
Portfolio turnover rate E | 161% | 51% | 56% | 74% | 76% |
A Total returns would have been lower if certain expenses had not been reduced during the applicable periods shown.
B Total returns do not include the effect of the sales charges.
C Calculated based on average shares outstanding during the period.
D Fees and expenses of any underlying Fidelity Central Funds are not included in the Fund's expense ratio. The Fund indirectly bears its proportionate share of the expenses of any underlying Fidelity Central Funds.
E Amount does not include the portfolio activity of any underlying Fidelity Central Funds.
F Investment income per share reflects a special dividend which amounted to $.02 per share. Excluding the special dividend, the ratio of net investment income (loss) to average net assets would have been .57%.
G The amount shown for a share outstanding does not correspond with the aggregate net gain (loss) on investments for the period due to the timing of sales and repurchases of shares in relation to fluctuating market values of the investments of the Fund.
H Expense ratios reflect operating expenses of the class. Expenses before reductions do not reflect amounts reimbursed by the investment adviser or reductions from brokerage service arrangements or reductions from other expense offset arrangements and do not represent the amount paid by the class during periods when reimbursements or reductions occur. Expenses net of fee waivers reflect expenses after reimbursement by the investment adviser but prior to reductions from brokerage service arrangements or other expense offset arrangements. Expenses net of all reductions represent the net expenses paid by the class.
I Total distributions of $.839 per share is comprised of distributions from net investment income of $.117 and distributions from net realized gain of $.722 per share.
See accompanying notes which are an integral part of the financial statements.
Annual Report
Financial Highlights - Class T
Years ended October 31, | 2011 | 2010 | 2009 | 2008 | 2007 |
Selected Per-Share Data | | | | | |
Net asset value, beginning of period | $ 10.08 | $ 9.27 | $ 8.58 | $ 16.30 | $ 14.99 |
Income from Investment Operations | | | | | |
Net investment income (loss) C | .07 | .05 F | .07 | .13 | .09 |
Net realized and unrealized gain (loss) | (.13) G | .84 | .75 | (7.06) | 1.97 |
Total from investment operations | (.06) | .89 | .82 | (6.93) | 2.06 |
Distributions from net investment income | (.05) | (.07) | (.13) | (.07) | (.04) |
Distributions from net realized gain | (.01) | (.01) | - | (.72) | (.71) |
Total distributions | (.06) | (.08) | (.13) | (.79) I | (.75) |
Net asset value, end of period | $ 9.96 | $ 10.08 | $ 9.27 | $ 8.58 | $ 16.30 |
Total Return A, B | (.64)% | 9.62% | 9.90% | (44.57)% | 14.31% |
Ratios to Average Net Assets D, H | | | | | |
Expenses before reductions | 1.49% | 1.45% | 1.50% | 1.49% | 1.53% |
Expenses net of fee waivers, if any | 1.49% | 1.45% | 1.50% | 1.49% | 1.50% |
Expenses net of all reductions | 1.48% | 1.45% | 1.49% | 1.49% | 1.49% |
Net investment income (loss) | .67% | .52% F | .85% | .97% | .60% |
Supplemental Data | | | | | |
Net assets, end of period (000 omitted) | $ 8,254 | $ 12,735 | $ 20,652 | $ 22,720 | $ 50,998 |
Portfolio turnover rate E | 161% | 51% | 56% | 74% | 76% |
A Total returns would have been lower if certain expenses had not been reduced during the applicable periods shown.
B Total returns do not include the effect of the sales charges.
C Calculated based on average shares outstanding during the period.
D Fees and expenses of any underlying Fidelity Central Funds are not included in the Fund's expense ratio. The Fund indirectly bears its proportionate share of the expenses of any underlying Fidelity Central Funds.
E Amount does not include the portfolio activity of any underlying Fidelity Central Funds.
F Investment income per share reflects a special dividend which amounted to $.02 per share. Excluding the special dividend, the ratio of net investment income (loss) to average net assets would have been .33%.
G The amount shown for a share outstanding does not correspond with the aggregate net gain (loss) on investments for the period due to the timing of sales and repurchases of shares in relation to fluctuating market values of the investments of the Fund.
H Expense ratios reflect operating expenses of the class. Expenses before reductions do not reflect amounts reimbursed by the investment adviser or reductions from brokerage service arrangements or reductions from other expense offset arrangements and do not represent the amount paid by the class during periods when reimbursements or reductions occur. Expenses net of fee waivers reflect expenses after reimbursement by the investment adviser but prior to reductions from brokerage service arrangements or other expense offset arrangements. Expenses net of all reductions represent the net expenses paid by the class.
I Total distributions of $.790 per share is comprised of distributions from net investment income of $.068 and distributions from net realized gain of $.722 per share.
See accompanying notes which are an integral part of the financial statements.
Annual Report
Financial Highlights - Class B
Years ended October 31, | 2011 | 2010 | 2009 | 2008 | 2007 |
Selected Per-Share Data | | | | | |
Net asset value, beginning of period | $ 9.99 | $ 9.18 | $ 8.47 | $ 16.07 | $ 14.81 |
Income from Investment Operations | | | | | |
Net investment income (loss) C | .02 | - F, I | .03 | .06 | .01 |
Net realized and unrealized gain (loss) | (.13) G | .84 | .74 | (6.96) | 1.95 |
Total from investment operations | (.11) | .84 | .77 | (6.90) | 1.96 |
Distributions from net investment income | (.03) | (.02) | (.06) | - | - |
Distributions from net realized gain | (.01) | (.01) | - | (.70) | (.70) |
Total distributions | (.04) | (.03) | (.06) | (.70) J | (.70) |
Net asset value, end of period | $ 9.84 | $ 9.99 | $ 9.18 | $ 8.47 | $ 16.07 |
Total Return A, B | (1.14)% | 9.11% | 9.19% | (44.80)% | 13.74% |
Ratios to Average Net Assets D, H | | | | | |
Expenses before reductions | 1.99% | 1.97% | 2.00% | 2.03% | 2.10% |
Expenses net of fee waivers, if any | 1.99% | 1.97% | 2.00% | 2.00% | 2.00% |
Expenses net of all reductions | 1.98% | 1.97% | 2.00% | 2.00% | 1.99% |
Net investment income (loss) | .16% | (.01)% F | .35% | .45% | .10% |
Supplemental Data | | | | | |
Net assets, end of period (000 omitted) | $ 1,110 | $ 1,605 | $ 1,989 | $ 2,615 | $ 6,734 |
Portfolio turnover rate E | 161% | 51% | 56% | 74% | 76% |
A Total returns would have been lower if certain expenses had not been reduced during the applicable periods shown.
B Total returns do not include the effect of the contingent deferred sales charge.
C Calculated based on average shares outstanding during the period.
D Fees and expenses of any underlying Fidelity Central Funds are not included in the Fund's expense ratio. The Fund indirectly bears its proportionate share of the expenses of any underlying Fidelity Central Funds.
E Amount does not include the portfolio activity of any underlying Fidelity Central Funds.
F Investment income per share reflects a special dividend which amounted to $.02 per share. Excluding the special dividend, the ratio of net investment income (loss) to average net assets would have been (.19)%.
G The amount shown for a share outstanding does not correspond with the aggregate net gain (loss) on investments for the period due to the timing of sales and repurchases of shares in relation to fluctuating market values of the investments of the Fund.
H Expense ratios reflect operating expenses of the class. Expenses before reductions do not reflect amounts reimbursed by the investment adviser or reductions from brokerage service arrangements or reductions from other expense offset arrangements and do not represent the amount paid by the class during periods when reimbursements or reductions occur. Expenses net of fee waivers reflect expenses after reimbursement by the investment adviser but prior to reductions from brokerage service arrangements or other expense offset arrangements. Expenses net of all reductions represent the net expenses paid by the class.
I Amount represents less than $.01 per share.
J Total distributions of $.698 per share is comprised of distributions from net investment income of $.000 and distributions from net realized gain of $.698 per share.
See accompanying notes which are an integral part of the financial statements.
Annual Report
Financial Highlights - Class C
Years ended October 31, | 2011 | 2010 | 2009 | 2008 | 2007 |
Selected Per-Share Data | | | | | |
Net asset value, beginning of period | $ 9.92 | $ 9.11 | $ 8.44 | $ 16.04 | $ 14.80 |
Income from Investment Operations | | | | | |
Net investment income (loss) C | .02 | - G, J | .03 | .06 | .02 |
Net realized and unrealized gain (loss) | (.13) H | .83 | .73 | (6.95) | 1.93 |
Total from investment operations | (.11) | .83 | .76 | (6.89) | 1.95 |
Distributions from net investment income | (.05) | (.02) | (.09) | - | - |
Distributions from net realized gain | (.01) | (.01) | - | (.71) | (.71) |
Total distributions | (.06) | (.02) L | (.09) | (.71) K | (.71) |
Net asset value, end of period | $ 9.75 | $ 9.92 | $ 9.11 | $ 8.44 | $ 16.04 |
Total Return A, B | (1.18)% | 9.12% | 9.28% | (44.84)% | 13.69% |
Ratios to Average Net Assets D, I | | | | | |
Expenses before reductions | 2.00% | 1.97% | 2.01% | 2.03% | 2.09% |
Expenses net of fee waivers, if any | 2.00% | 1.97% | 2.00% | 2.00% | 2.00% |
Expenses net of all reductions | 1.98% | 1.97% | 2.00% | 2.00% | 1.99% |
Net investment income (loss) | .16% | -% F, G | .35% | .45% | .10% |
Supplemental Data | | | | | |
Net assets, end of period (000 omitted) | $ 3,775 | $ 4,139 | $ 4,088 | $ 5,358 | $ 9,718 |
Portfolio turnover rate E | 161% | 51% | 56% | 74% | 76% |
A Total returns would have been lower if certain expenses had not been reduced during the applicable periods shown.
B Total returns do not include the effect of the contingent deferred sales charge.
C Calculated based on average shares outstanding during the period.
D Fees and expenses of any underlying Fidelity Central Funds are not included in the Fund's expense ratio. The Fund indirectly bears its proportionate share of the expenses of any underlying Fidelity Central Funds.
E Amount does not include the portfolio activity of any underlying Fidelity Central Funds.
F Amount represents less than .01%.
G Investment income per share reflects a special dividend which amounted to $.02 per share. Excluding the special dividend, the ratio of net investment income (loss) to average net assets would have been (.19)%.
H The amount shown for a share outstanding does not correspond with the aggregate net gain (loss) on investments for the period due to the timing of sales and repurchases of shares in relation to fluctuating market values of the investments of the Fund.
I Expense ratios reflect operating expenses of the class. Expenses before reductions do not reflect amounts reimbursed by the investment adviser or reductions from brokerage service arrangements or reductions from other expense offset arrangements and do not represent the amount paid by the class during periods when reimbursements or reductions occur. Expenses net of fee waivers reflect expenses after reimbursement by the investment adviser but prior to reductions from brokerage service arrangements or other expense offset arrangements. Expenses net of all reductions represent the net expenses paid by the class.
J Amount represents less than $.01 per share.
K Total distributions of $.712 per share is comprised of distributions from net investment income of $.000 and distributions from net realized gain of $.712 per share.
L Total distributions of $.02 per share is comprised of distributions from net investment income of $.015 and distributions from net realized gain of $.005 per share.
See accompanying notes which are an integral part of the financial statements.
Annual Report
Financial Highlights - Institutional Class
Years ended October 31, | 2011 | 2010 | 2009 | 2008 | 2007 |
Selected Per-Share Data | | | | | |
Net asset value, beginning of period | $ 10.19 | $ 9.35 | $ 8.70 | $ 16.51 | $ 15.17 |
Income from Investment Operations | | | | | |
Net investment income (loss) B | .14 | .10 E | .11 | .20 | .17 |
Net realized and unrealized gain (loss) | (.15) F | .86 | .74 | (7.13) | 1.99 |
Total from investment operations | (.01) | .96 | .85 | (6.93) | 2.16 |
Distributions from net investment income | (.13) | (.11) | (.20) | (.15) | (.11) |
Distributions from net realized gain | (.01) | (.01) | - | (.72) | (.71) |
Total distributions | (.14) | (.12) | (.20) | (.88) H | (.82) |
Net asset value, end of period | $ 10.04 | $ 10.19 | $ 9.35 | $ 8.70 | $ 16.51 |
Total Return A | (.11)% | 10.28% | 10.26% | (44.24)% | 14.89% |
Ratios to Average Net Assets C, G | | | | | |
Expenses before reductions | .89% | .98% | 1.00% | .98% | 1.00% |
Expenses net of fee waivers, if any | .89% | .98% | 1.00% | .98% | 1.00% |
Expenses net of all reductions | .88% | .97% | 1.00% | .97% | .99% |
Net investment income (loss) | 1.27% | .99% E | 1.35% | 1.48% | 1.10% |
Supplemental Data | | | | | |
Net assets, end of period (000 omitted) | $ 523 | $ 841 | $ 2,341 | $ 2,021 | $ 6,833 |
Portfolio turnover rate D | 161% | 51% | 56% | 74% | 76% |
A Total returns would have been lower if certain expenses had not been reduced during the applicable periods shown.
B Calculated based on average shares outstanding during the period.
C Fees and expenses of any underlying Fidelity Central Funds are not included in the Fund's expense ratio. The Fund indirectly bears its proportionate share of the expenses of any underlying Fidelity Central Funds.
D Amount does not include the portfolio activity of any underlying Fidelity Central Funds.
E Investment income per share reflects a special dividend which amounted to $.02 per share. Excluding the special dividend, the ratio of net investment income (loss) to average net assets would have been .81%.
F The amount shown for a share outstanding does not correspond with the aggregate net gain (loss) on investments for the period due to the timing of sales and repurchases of shares in relation to fluctuating market values of the investments of the Fund.
G Expense ratios reflect operating expenses of the class. Expenses before reductions do not reflect amounts reimbursed by the investment adviser or reductions from brokerage service arrangements or reductions from other expense offset arrangements and do not represent the amount paid by the class during periods when reimbursements or reductions occur. Expenses net of fee waivers reflect expenses after reimbursement by the investment adviser but prior to reductions from brokerage service arrangements or other expense offset arrangements. Expenses net of all reductions represent the net expenses paid by the class.
H Total distributions of $.876 per share is comprised of distributions from net investment income of $.154 and distributions from net realized gain of $.722 per share.
See accompanying notes which are an integral part of the financial statements.
Annual Report
Notes to Financial Statements
For the period ended October 31, 2011
1. Organization.
Fidelity Advisor Value Leaders Fund (the Fund) is a fund of Fidelity Advisor Series VIII (the Trust) and is authorized to issue an unlimited number of shares. The Trust is registered under the Investment Company Act of 1940, as amended (the 1940 Act), as an open-end management investment company organized as a Massachusetts business trust. The Fund offers Class A, Class T, Class C, and Institutional Class shares, each of which, along with Class B shares, has equal rights as to assets and voting privileges. Effective after the close of business on September 1, 2010, Class B shares were closed to new accounts and additional purchases, except for exchanges and reinvestments by existing shareholders. Each class has exclusive voting rights with respect to matters that affect that class. Class B shares will automatically convert to Class A shares after a holding period of seven years from the initial date of purchase. Investment income, realized and unrealized capital gains and losses, the common expenses of the Fund, and certain fund-level expense reductions, if any, are allocated on a pro-rata basis to each class based on the relative net assets of each class to the total net assets of the Fund. Each class differs with respect to transfer agent and distribution and service plan fees incurred. Certain expense reductions may also differ by class.
2. Investments in Fidelity Central Funds.
The Fund invests in Fidelity Central Funds, which are open-end investment companies available only to other investment companies and accounts managed by Fidelity Management & Research Company (FMR) and its affiliates. The Fund's Schedule of Investments lists each of the Fidelity Central Funds held as of period end, if any, as an investment of the Fund, but does not include the underlying holdings of each Fidelity Central Fund. As an Investing Fund, the Fund indirectly bears its proportionate share of the expenses of the underlying Fidelity Central Funds.
The Money Market Central Funds seek preservation of capital and current income and are managed by Fidelity Investments Money Management, Inc. (FIMM), an affiliate of FMR.
A complete unaudited list of holdings for each Fidelity Central Fund is available upon request or at the Securities and Exchange Commission (the SEC) web site at www.sec.gov. In addition, the financial statements of the Fidelity Central Funds, which are not covered by the Fund's Report of Independent Registered Public Accounting Firm are available on the SEC web site or upon request.
3. Significant Accounting Policies.
The financial statements have been prepared in conformity with accounting principles generally accepted in the United States of America (GAAP), which require management to make certain estimates and assumptions at the date of the financial statements.
Annual Report
Notes to Financial Statements - continued
3. Significant Accounting Policies - continued
Actual results could differ from those estimates. Subsequent events, if any, through the date that the financial statements were issued have been evaluated in the preparation of the financial statements. The following summarizes the significant accounting policies of the Fund:
Security Valuation. Investments are valued as of 4:00 p.m. Eastern time on the last calendar day of the period. The Fund uses independent pricing services approved by the Board of Trustees to value its investments. When current market prices or quotations are not readily available or reliable, valuations may be determined in good faith in accordance with procedures adopted by the Board of Trustees. Factors used in determining value may include market or security specific events. The frequency with which these procedures are used cannot be predicted and they may be utilized to a significant extent. The value used for net asset value (NAV) calculation under these procedures may differ from published prices for the same securities.
The Fund categorizes the inputs to valuation techniques used to value its investments into a disclosure hierarchy consisting of three levels as shown below:
Level 1 - quoted prices in active markets for identical investments
Level 2 - other significant observable inputs (including quoted prices for similar investments, interest rates, prepayment speeds, etc.)
Level 3 - unobservable inputs (including the Fund's own assumptions based on the best information available)
Changes in valuation techniques may result in transfers in or out of an assigned level within the disclosure hierarchy. The aggregate value of investments by input level, as of October 31, 2011, is included at the end of the Fund's Schedule of Investments. Valuation techniques used to value the Fund's investments by major category are as follows:
Equity securities, including restricted securities, for which market quotations are readily available, are valued at the last reported sale price or official closing price as reported by an independent pricing service on the primary market or exchange on which they are traded and are categorized as Level 1 in the hierarchy. In the event there were no sales during the day or closing prices are not available, securities are valued at the last quoted bid price or may be valued using the last available price and are generally categorized as Level 2 in the hierarchy. For foreign equity securities, when significant market or security specific events arise, comparisons to the valuation of American Depositary Receipts (ADRs), futures contracts, Exchange-traded funds (ETFs) and certain indexes as well as quoted prices for similar securities are used and are categorized as Level 2 in the hierarchy in these circumstances. Utilizing these techniques may result in transfers between Level 1 and Level 2. For restricted equity securities and private placements where
Annual Report
3. Significant Accounting Policies - continued
Security Valuation - continued
observable inputs are limited, assumptions about market activity and risk are used and are categorized as Level 3 in the hierarchy.
Investments in open-end mutual funds, including the Fidelity Central Funds, are valued at their closing net asset value each business day and are categorized as Level 1 in the hierarchy.
Foreign Currency. The Fund may use foreign currency contracts to facilitate transactions in foreign-denominated securities. Gains and losses from these transactions may arise from changes in the value of the foreign currency or if the counterparties do not perform under the contracts' terms.
Foreign-denominated assets, including investment securities, and liabilities are translated into U.S. dollars at the exchange rate at period end. Purchases and sales of investment securities, income and dividends received and expenses denominated in foreign currencies are translated into U.S. dollars at the exchange rate in effect on the transaction date.
The effects of exchange rate fluctuations on investments are included with the net realized and unrealized gain (loss) on investment securities. Other foreign currency transactions resulting in realized and unrealized gain (loss) are disclosed separately.
Investment Transactions and Income. For financial reporting purposes, the Fund's investment holdings and NAV include trades executed through the end of the last business day of the period. The NAV per share for processing shareholder transactions is calculated as of the close of business of the New York Stock Exchange (NYSE), normally 4:00 p.m. Eastern time and includes trades executed through the end of the prior business day. Gains and losses on securities sold are determined on the basis of identified cost and may include proceeds received from litigation. Dividend income is recorded on the ex-dividend date, except for certain dividends from foreign securities where the ex-dividend date may have passed, which are recorded as soon as the Fund is informed of the ex-dividend date. Non-cash dividends included in dividend income, if any, are recorded at the fair market value of the securities received. Distributions received on securities that represent a return of capital or capital gain are recorded as a reduction of cost of investments and/or as a realized gain. The Fund estimates the components of distributions received that may be considered return of capital distributions or capital gain distributions. Interest income and distributions from the Fidelity Central Funds are accrued as earned. Interest income includes coupon interest and amortization of premium and accretion of discount on debt securities. Investment income is recorded net of foreign taxes withheld where recovery of such taxes is uncertain.
Annual Report
Notes to Financial Statements - continued
3. Significant Accounting Policies - continued
Expenses. Expenses directly attributable to a fund are charged to that fund. Expenses attributable to more than one fund are allocated among the respective funds on the basis of relative net assets or other appropriate methods. Expense estimates are accrued in the period to which they relate and adjustments are made when actual amounts are known.
Income Tax Information and Distributions to Shareholders. Each year, the Fund intends to qualify as a regulated investment company, including distributing substantially all of its taxable income and realized gains under Subchapter M of the Internal Revenue Code and filing its U.S. federal tax return. As a result, no provision for income taxes is required. As of October 31, 2011, the Fund did not have any unrecognized tax benefits in the financial statements. A fund's federal tax return is subject to examination by the Internal Revenue Service (IRS) for a period of three years. Foreign taxes are provided for based on the Fund's understanding of the tax rules and rates that exist in the foreign markets in which it invests.
Distributions are declared and recorded on the ex-dividend date. Income dividends and capital gain distributions are declared separately for each class. Income and capital gain distributions are determined in accordance with income tax regulations, which may differ from GAAP.
Capital accounts within the financial statements are adjusted for permanent book-tax differences. These adjustments have no impact on net assets or the results of operations. Temporary book-tax differences will reverse in a subsequent period.
Book-tax differences are primarily due to foreign currency transactions, partnerships, capital loss carryforwards and losses deferred due to wash sales.
The federal tax cost of investment securities and unrealized appreciation (depreciation) as of period end were as follows:
Gross unrealized appreciation | $ 1,174,106 |
Gross unrealized depreciation | (5,053,448) |
Net unrealized appreciation (depreciation) on securities and other investments | $ (3,879,342) |
| |
Tax Cost | $ 36,258,248 |
The tax-based components of distributable earnings as of period end were as follows:
Undistributed ordinary income | $ 193,579 |
Capital loss carryforward | $ (34,183,216) |
Net unrealized appreciation (depreciation) | $ (3,879,138) |
Annual Report
3. Significant Accounting Policies - continued
Income Tax Information and Distributions to Shareholders - continued
Under the recently enacted Regulated Investment Company Modernization Act of 2010 (the Act), the Fund will be permitted to carry forward capital losses incurred in taxable years beginning after December 22, 2010 for an unlimited period. However, any losses incurred during those future taxable years will be required to be utilized prior to any losses incurred in pre-enactment taxable years, which generally expire after eight years from when they are incurred. Additionally, post-enactment capital losses that are carried forward will retain their character as either short-term or long-term capital losses rather than being considered all short-term as under previous law. The Fund's first fiscal year end subject to the Act will be October 31, 2012.
The tax character of distributions paid was as follows:
| October 31, 2011 | October 31, 2010 |
Ordinary Income | $ 400,100 | $ 508,549 |
New Accounting Pronouncement. In May 2011, the Financial Accounting Standards Board issued Accounting Standard Update No. 2011-04, Fair Value Measurement (Topic 820) - Amendments to Achieve Common Fair Value Measurement and Disclosure Requirements in U.S. GAAP and IFRSs. The update changes the wording used to describe the requirements in GAAP for measuring fair value and for disclosing information about fair value measurements. The update is effective during interim and annual periods beginning after December 15, 2011. Management is currently evaluating the impact of the update's adoption on the Fund's financial statement disclosures.
4. Purchases and Sales of Investments.
Purchases and sales of securities, other than short-term securities, aggregated $62,096,856 and $79,559,621, respectively.
5. Fees and Other Transactions with Affiliates.
Management Fee. FMR and its affiliates provide the Fund with investment management related services for which the Fund pays a monthly management fee. The management fee is the sum of an individual fund fee rate that is based on an annual rate of .30% of the Fund's average net assets and a group fee rate that averaged .26% during the period. The group fee rate is based upon the average net assets of all the mutual funds advised by FMR. The group fee rate decreases as assets under management increase and increases as assets under management decrease. In addition, the management fee is subject to a performance adjustment (up to a maximum of ± .20% of the Fund's average net assets over a 36 month performance period). The upward or downward adjustment to
Annual Report
Notes to Financial Statements - continued
5. Fees and Other Transactions with Affiliates - continued
Management Fee - continued
the management fee is based on the relative investment performance of the Institutional Class of the Fund as compared to an appropriate benchmark index. For the period, the total annual management fee rate, including the performance adjustment, was .26% of the Fund's average net assets.
Distribution and Service Plan Fees. In accordance with Rule 12b-1 of the 1940 Act, the Fund has adopted separate Distribution and Service Plans for each class of shares. Certain classes pay Fidelity Distributors Corporation (FDC), an affiliate of FMR, separate Distribution and Service Fees, each of which is based on an annual percentage of each class' average net assets. In addition, FDC may pay financial intermediaries for selling shares of the Fund and providing shareholder support services. For the period, the Distribution and Service Fee rates, total fees and amounts retained by FDC were as follows:
| Distribution
Fee | Service
Fee | Total Fees | Retained
by FDC |
Class A | -% | .25% | $ 55,528 | $ 469 |
Class T | .25% | .25% | 51,912 | 169 |
Class B | .75% | .25% | 14,139 | 10,617 |
Class C | .75% | .25% | 42,876 | 4,588 |
| | | $ 164,455 | $ 15,843 |
Sales Load. FDC may receive a front-end sales charge of up to 5.75% for selling Class A shares, and 3.50% for selling Class T shares, some of which is paid to financial intermediaries for selling shares of the Fund. Depending on the holding period, FDC may receive contingent deferred sales charges levied on Class A, Class T, Class B, and Class C redemptions. The deferred sales charges range from 5% to 1% for Class B, 1% for Class C, 1.00% for certain purchases of Class A shares and .25% for certain purchases of Class T shares.
For the period, sales charge amounts retained by FDC were as follows:
| Retained
by FDC |
Class A | $ 2,650 |
Class T | 1,933 |
Class B* | 2,785 |
Class C* | 320 |
| $ 7,688 |
* When Class B and Class C shares are initially sold, FDC pays commissions from its own resources to financial intermediaries through which the sales are made.
Annual Report
5. Fees and Other Transactions with Affiliates - continued
Transfer Agent Fees. Fidelity Investments Institutional Operations Company, Inc. (FIIOC), an affiliate of FMR, is the transfer, dividend disbursing and shareholder servicing agent for each class of the Fund. FIIOC receives account fees and asset-based fees that vary according to the account size and type of account of the shareholders of the respective classes of the Fund. FIIOC pays for typesetting, printing and mailing of shareholder reports, except proxy statements. For the period, transfer agent fees for each class were as follows:
| Amount | % of
Average
Net Assets |
Class A | $ 67,075 | .30 |
Class T | 31,177 | .30 |
Class B | 4,266 | .30 |
Class C | 13,029 | .30 |
Institutional Class | 1,501 | .20 |
| $ 117,048 | |
Accounting and Security Lending Fees. Fidelity Service Company, Inc. (FSC), an affiliate of FMR, maintains the Fund's accounting records. The accounting fee is based on the level of average net assets for the month. Under a separate contract, FSC administers the security lending program. The security lending fee is based on the number and duration of lending transactions.
Brokerage Commissions. The Fund placed a portion of its portfolio transactions with brokerage firms which are affiliates of the investment adviser. The commissions paid to these affiliated firms were $3,016 for the period.
6. Committed Line of Credit.
The Fund participates with other funds managed by FMR or an affiliate in a $4.0 billion credit facility (the "line of credit") to be utilized for temporary or emergency purposes to fund shareholder redemptions or for other short-term liquidity purposes. The Fund has agreed to pay commitment fees on its pro-rata portion of the line of credit, which amounted to $125 and is reflected in Miscellaneous expenses on the Statement of Operations. During the period, there were no borrowings on this line of credit.
7. Security Lending.
The Fund lends portfolio securities through a lending agent from time to time in order to earn additional income. For equity securities, a lending agent is used and may loan securities to certain qualified borrowers, including Fidelity Capital Markets (FCM), a broker-dealer affiliated with the Fund. On the settlement date of the loan, the Fund
Annual Report
Notes to Financial Statements - continued
7. Security Lending - continued
receives collateral (in the form of U.S. Treasury obligations, letters of credit and/or cash) against the loaned securities and maintains collateral in an amount not less than 100% of the market value of the loaned securities during the period of the loan. The market value of the loaned securities is determined at the close of business of the Fund and any additional required collateral is delivered to the Fund on the next business day. If the borrower defaults on its obligation to return the securities loaned because of insolvency or other reasons, a fund could experience delays and costs in recovering the securities loaned or in gaining access to the collateral. Any cash collateral received is invested in the Fidelity Securities Lending Cash Central Fund. The value of loaned securities and cash collateral at period end are disclosed on the Fund's Statement of Assets and Liabilities. Security lending income represents the income earned on investing cash collateral, less rebates paid to borrowers and any lending agent fees associated with the loan, plus any premium payments received for lending certain types of securities. Security lending income is presented in the Statement of Operations as a component of income from Fidelity Central Funds. Total security lending income during the period amounted to $39,854. During the period, there were no securities loaned to FCM.
8. Expense Reductions.
Many of the brokers with whom FMR places trades on behalf of the Fund provided services to the Fund in addition to trade execution. These services included payments of certain expenses on behalf of the Fund totaling $5,676 for the period.
9. Distributions to Shareholders.
Distributions to shareholders of each class were as follows:
Years ended October 31, | 2011 | 2010 |
From net investment income | | |
Class A | $ 274,577 | $ 284,681 |
Class T | 50,441 | 160,619 |
Class B | 4,151 | 4,372 |
Class C | 18,471 | 6,593 |
Institutional Class | 10,963 | 21,909 |
Total | $ 358,603 | $ 478,174 |
From net realized gain | | |
Class A | $ 24,299 | $ 15,305 |
Class T | 10,732 | 10,853 |
Class B | 1,537 | 1,041 |
Class C | 4,105 | 2,198 |
Institutional Class | 824 | 978 |
Total | $ 41,497 | $ 30,375 |
Annual Report
10. Share Transactions.
Transactions for each class of shares were as follows:
| Shares | Dollars |
Years ended October 31, | 2011 | 2010 | 2011 | 2010 |
Class A | | | | |
Shares sold | 334,576 | 402,871 | $ 3,612,152 | $ 4,034,369 |
Reinvestment of distributions | 28,074 | 29,667 | 288,043 | 290,443 |
Shares redeemed | (1,320,166) | (994,975) | (14,109,969) | (9,899,783) |
Net increase (decrease) | (957,516) | (562,437) | $ (10,209,774) | $ (5,574,971) |
Class T | | | | |
Shares sold | 157,819 | 129,419 | $ 1,706,564 | $ 1,299,211 |
Reinvestment of distributions | 5,816 | 17,388 | 59,851 | 169,877 |
Shares redeemed | (597,712) | (1,112,927) | (6,300,709) | (11,167,229) |
Net increase (decrease) | (434,077) | (966,120) | $ (4,534,294) | $ (9,698,141) |
Class B | | | | |
Shares sold | 248 | 21,226 | $ 2,692 | $ 215,795 |
Reinvestment of distributions | 507 | 524 | 5,175 | 5,094 |
Shares redeemed | (48,512) | (77,825) | (509,116) | (763,138) |
Net increase (decrease) | (47,757) | (56,075) | $ (501,249) | $ (542,249) |
Class C | | | | |
Shares sold | 69,631 | 78,869 | $ 733,867 | $ 774,653 |
Reinvestment of distributions | 2,055 | 834 | 20,799 | 8,059 |
Shares redeemed | (101,679) | (111,299) | (1,050,311) | (1,100,227) |
Net increase (decrease) | (29,993) | (31,596) | $ (295,645) | $ (317,515) |
Institutional Class | | | | |
Shares sold | 74,917 | 25,211 | $ 747,771 | $ 254,312 |
Reinvestment of distributions | 1,083 | 2,223 | 11,162 | 21,848 |
Shares redeemed | (106,405) | (195,256) | (1,089,806) | (1,913,418) |
Net increase (decrease) | (30,405) | (167,822) | $ (330,873) | $ (1,637,258) |
11. Other.
The Fund's organizational documents provide former and current trustees and officers with a limited indemnification against liabilities arising in connection with the performance of their duties to the Fund. In the normal course of business, the Fund may also enter into contracts that provide general indemnifications. The Fund's maximum exposure under these arrangements is unknown as this would be dependent on future claims that may be made against the Fund. The risk of material loss from such claims is considered remote.
Annual Report
To the Trustees of Fidelity Advisor Series VIII and the Shareholders of Fidelity Advisor Value Leaders Fund:
In our opinion, the accompanying statement of assets and liabilities, including the schedule of investments, and the related statements of operations and of changes in net assets and the financial highlights present fairly, in all material respects, the financial position of Fidelity Advisor Value Leaders Fund (a fund of Fidelity Advisor Series VIII) at October 31, 2011, the results of its operations for the year then ended, the changes in its net assets for each of the two years in the period then ended and the financial highlights for each of the five years in the period then ended, in conformity with accounting principles generally accepted in the United States of America. These financial statements and financial highlights (hereafter referred to as "financial statements") are the responsibility of the Fidelity Advisor Value Leaders Fund's management. Our responsibility is to express an opinion on these financial statements based on our audits. We conducted our audits of these financial statements in accordance with the standards of the Public Company Accounting Oversight Board (United States). Those standards require that we plan and perform the audit to obtain reasonable assurance about whether the financial statements are free of material misstatement. An audit includes examining, on a test basis, evidence supporting the amounts and disclosures in the financial statements, assessing the accounting principles used and significant estimates made by management, and evaluating the overall financial statement presentation. We believe that our audits, which included confirmation of securities at October 31, 2011 by correspondence with the custodian and brokers, provide a reasonable basis for our opinion.
/s/ PricewaterhouseCoopers LLP
PricewaterhouseCoopers LLP
Boston, Massachusetts
December 9, 2011
Annual Report
The Trustees, Members of the Advisory Board, and executive officers of the trust and fund, as applicable, are listed below. The Board of Trustees governs the fund and is responsible for protecting the interests of shareholders. The Trustees are experienced executives who meet periodically throughout the year to oversee the fund's activities, review contractual arrangements with companies that provide services to the fund, oversee management of the risks associated with such activities and contractual arrangements, and review the fund's performance. Except for James C. Curvey, each of the Trustees oversees 226 funds advised by FMR or an affiliate. Mr. Curvey oversees 429 funds advised by FMR or an affiliate.
The Trustees hold office without limit in time except that (a) any Trustee may resign; (b) any Trustee may be removed by written instrument, signed by at least two-thirds of the number of Trustees prior to such removal; (c) any Trustee who requests to be retired or who has become incapacitated by illness or injury may be retired by written instrument signed by a majority of the other Trustees; and (d) any Trustee may be removed at any special meeting of shareholders by a two-thirds vote of the outstanding voting securities of the trust. Each Trustee who is not an interested person (as defined in the 1940 Act) (Independent Trustee), shall retire not later than the last day of the calendar year in which his or her 75th birthday occurs. The Independent Trustees may waive this mandatory retirement age policy with respect to individual Trustees. The executive officers and Advisory Board Members hold office without limit in time, except that any officer and Advisory Board Member may resign or may be removed by a vote of a majority of the Trustees at any regular meeting or any special meeting of the Trustees. Except as indicated, each individual has held the office shown or other offices in the same company for the past five years.
Experience, Skills, Attributes, and Qualifications of the Fund's Trustees. The Governance and Nominating Committee has adopted a statement of policy that describes the experience, qualifications, attributes, and skills that are necessary and desirable for potential Independent Trustee candidates (Statement of Policy). The Board believes that each Trustee satisfied at the time he or she was initially elected or appointed a Trustee, and continues to satisfy, the standards contemplated by the Statement of Policy. The Governance and Nominating Committee also engages professional search firms to help identify potential Independent Trustee candidates who have the experience, qualifications, attributes, and skills consistent with the Statement of Policy. From time to time, additional criteria based on the composition and skills of the current Independent Trustees, as well as experience or skills that may be appropriate in light of future changes to board composition, business conditions, and regulatory or other developments, have also been considered by the professional search firms and the Governance and Nominating Committee. In addition, the Board takes into account the Trustees' commitment and participation in Board and committee meetings, as well as their leadership of standing and ad hoc committees throughout their tenure.
In determining that a particular Trustee was and continues to be qualified to serve as a Trustee, the Board has considered a variety of criteria, none of which, in isolation, was controlling. The Board believes that, collectively, the Trustees have balanced and diverse experience, qualifications, attributes, and skills, which allow the Board to operate effectively in governing the fund and protecting the interests of shareholders. Information about the specific experience, skills, attributes, and qualifications of each Trustee, which in each case led to the Board's conclusion that the Trustee should serve (or continue to serve) as a trustee of the fund, is provided below.
Annual Report
Board Structure and Oversight Function. James C. Curvey is an interested person (as defined in the 1940 Act) and currently serves as Acting Chairman. The Trustees have determined that an interested Chairman is appropriate and benefits shareholders because an interested Chairman has a personal and professional stake in the quality and continuity of services provided to the fund. Independent Trustees exercise their informed business judgment to appoint an individual of their choosing to serve as Chairman, regardless of whether the Trustee happens to be independent or a member of management. The Independent Trustees have determined that they can act independently and effectively without having an Independent Trustee serve as Chairman and that a key structural component for assuring that they are in a position to do so is for the Independent Trustees to constitute a substantial majority for the Board. The Independent Trustees also regularly meet in executive session. Ned C. Lautenbach serves as Chairman of the Independent Trustees and as such (i) acts as a liaison between the Independent Trustees and management with respect to matters important to the Independent Trustees and (ii) with management prepares agendas for Board meetings.
Fidelity funds are overseen by different Boards of Trustees. The fund's Board oversees Fidelity's equity and high income funds and another Board oversees Fidelity's investment-grade bond, money market, and asset allocation funds. The asset allocation funds may invest in Fidelity funds overseen by the fund's Board. The use of separate Boards, each with its own committee structure, allows the Trustees of each group of Fidelity funds to focus on the unique issues of the funds they oversee, including common research, investment, and operational issues. On occasion, the separate Boards establish joint committees to address issues of overlapping consequences for the Fidelity funds overseen by each Board.
The Trustees operate using a system of committees to facilitate the timely and efficient consideration of all matters of importance to the Trustees, the fund, and fund shareholders and to facilitate compliance with legal and regulatory requirements and oversight of the fund's activities and associated risks. The Board, acting through its committees, has charged FMR and its affiliates with (i) identifying events or circumstances the occurrence of which could have demonstrably adverse effects on the fund's business and/or reputation; (ii) implementing processes and controls to lessen the possibility that such events or circumstances occur or to mitigate the effects of such events or circumstances if they do occur; and (iii) creating and maintaining a system designed to evaluate continuously business and market conditions in order to facilitate the identification and implementation processes described in (i) and (ii) above. Because the day-to-day operations and activities of the fund are carried out by or through FMR, its affiliates and other service providers, the fund's exposure to risks is mitigated but not eliminated by the processes overseen by the Trustees. While each of the Board's committees has responsibility for overseeing different aspects of the fund's activities, oversight is exercised primarily through the Operations, Audit, and Compliance Committees. In addition, the Independent Trustees have worked with FMR to enhance the Board's oversight of investment and financial risks, legal and regulatory risks, technology risks, and operational risks, including the development of additional risk reporting to the Board. For example, a working group comprised of Independent Trustees and FMR has worked and continues to work to review the Fidelity funds' valuation-related activities, reporting and risk management. Appropriate personnel, including but not limited to the fund's Chief Compliance Officer (CCO), FMR's internal auditor, the independent accountants, the fund's Treasurer and portfolio management personnel, make periodic reports to the Board's committees, as appropriate, including an annual review of FMR's risk management program for the Fidelity funds. The responsibilities of each standing committee, including their oversight responsibilities, are described further under "Standing Committees of the Fund's Trustees."
Annual Report
Trustees and Officers - continued
The fund's Statement of Additional Information (SAI) includes more information about the Trustees. To request a free copy, call Fidelity at 1-877-208-0098.
Interested Trustees*:
Correspondence intended for each Trustee who is an interested person may be sent to Fidelity Investments, 82 Devonshire Street, Boston, Massachusetts 02109.
Name, Age; Principal Occupations and Other Relevant Experience+ |
James C. Curvey (76) |
| Year of Election or Appointment: 2007 Mr. Curvey is Trustee and Acting Chairman of the Board of Trustees of certain Trusts. Mr. Curvey also serves as Trustee (2007-present) of other investment companies advised by FMR. Mr. Curvey is a Director of Fidelity Investments Money Management, Inc. (2009-present), Director of Fidelity Research & Analysis Co. (2009-present) and Director of FMR and FMR Co., Inc. (2007-present). Mr. Curvey is also Vice Chairman (2007-present) and Director of FMR LLC. In addition, Mr. Curvey serves as an Overseer for the Boston Symphony Orchestra and a member of the Trustees of Villanova University. Previously, Mr. Curvey was the Vice Chairman (2006-2007) and Director (2000-2007) of FMR Corp. |
Ronald P. O'Hanley (54) |
| Year of Election or Appointment: 2011 Mr. O'Hanley is Director of FMR Co., Inc. (2010-present), Director of Fidelity Investments Money Management, Inc. (2010-present), Director of Fidelity Research & Analysis Company (2010-present), President of Fidelity Asset Management and Corporate Services and a member of Fidelity's Executive Committee (2010-present). Previously, Mr. O'Hanley served as President and Chief Executive Officer of BNY Mellon Asset Management (2007-2010). Mr. O'Hanley also served as Vice Chairman of Bank New York Mellon Corp. and a member of that firm's Executive Committee. Prior to the 2007 merger of The Bank of New York and Mellon Financial Corporation, he was Vice Chairman of Mellon Financial Corporation and President and Chief Executive Officer of Mellon Asset Management. He joined Mellon in February 1997. Mr. O'Hanley currently serves as Chairman of the Boston Public Library Foundation Board of Directors and sits on the Board of Directors of Beth Israel Deaconess Medical Center, the Board of Trustees of the Marine Biological Laboratory and the Advisory Board of the Maxwell School of Citizenship and Public Administration at Syracuse University. Mr. O'Hanley also chairs the Council on Asset Management for the Financial Services Roundtable and is a member of the Board of Directors of Institutional Investor's U.S. Institute. |
* Trustees have been determined to be "Interested Trustees" by virtue of, among other things, their affiliation with the trust or various entities under common control with FMR.
+ The information above includes each Trustee's principal occupation during the last five years and other information relating to the experience, attributes, and skills relevant to each Trustee's qualifications to serve as a Trustee, which led to the conclusion that each Trustee should serve as a Trustee for the fund.
Annual Report
Trustees and Officers - continued
Independent Trustees:
Correspondence intended for each Independent Trustee (that is, the Trustees other than the Interested Trustees) may be sent to Fidelity Investments, P.O. Box 55235, Boston, Massachusetts 02205-5235.
Name, Age; Principal Occupations and Other Relevant Experience+ |
Dennis J. Dirks (63) |
| Year of Election or Appointment: 2005 Prior to his retirement in May 2003, Mr. Dirks was Chief Operating Officer and a member of the Board of The Depository Trust & Clearing Corporation (DTCC). He also served as President, Chief Operating Officer, and Board member of The Depository Trust Company (DTC) and President and Board member of the National Securities Clearing Corporation (NSCC). In addition, Mr. Dirks served as Chief Executive Officer and Board member of the Government Securities Clearing Corporation, Chief Executive Officer and Board member of the Mortgage-Backed Securities Clearing Corporation, as a Trustee and a member of the Finance Committee of Manhattan College (2005-2008), and as a Trustee and a member of the Finance Committee of AHRC of Nassau County (2006-2008). Mr. Dirks is a member of the Independent Directors Council (IDC) Governing Council (2010-Present) and Board of Directors for The Brookville Center for Children's Services, Inc. (2009-present). |
Alan J. Lacy (58) |
| Year of Election or Appointment: 2008 Mr. Lacy serves as Senior Adviser (2007-present) of Oak Hill Capital Partners, L.P. (private equity). Mr. Lacy also served as Chief Executive Officer (2000-2005) and Vice Chairman (2005-2006) of Sears Holdings Corporation and Sears, Roebuck and Co. (retail). In addition, Mr. Lacy serves as a member of the Board of Directors of Dave & Buster's, Inc. (restaurant and entertainment complexes, 2010-present), The Hillman Companies, Inc. (hardware wholesalers, 2010-present), and Bristol-Myers Squibb Company (global pharmaceuticals, 2007-present). Mr. Lacy is a member of the Board of Trustees of The National Parks Conservation Association (2006-Present). Previously, Mr. Lacy served as Chairman of the Board of Trustees of the National Parks Conservation Association (2008-2011) and as a member of the Board of Directors for the Western Union Company (global money transfer, 2006-2011). |
Ned C. Lautenbach (67) |
| Year of Election or Appointment: 2000 Mr. Lautenbach is Chairman of the Independent Trustees of the Equity and High Income Funds (2006-present). Mr. Lautenbach currently serves as the Lead Director of the Eaton Corporation Board of Directors (diversified industrial, 1997-present). Mr. Lautenbach is also a member of the Board of Directors of the Philharmonic Center for the Arts in Naples, Florida (1999-present); a member of the Board of Trustees of Fairfield University (2005-present); and a member of the Council on Foreign Relations (1994-present). Previously, Mr. Lautenbach was a Partner/Advisory Partner at Clayton, Dubilier & Rice, LLC (private equity investment, 1998-2010), as well as a Director of Sony Corporation (2006-2007). |
Joseph Mauriello (67) |
| Year of Election or Appointment: 2008 Prior to his retirement in January 2006, Mr. Mauriello served in numerous senior management positions including Deputy Chairman and Chief Operating Officer (2004-2005), and Vice Chairman of Financial Services (2002-2004) of KPMG LLP US (professional services, 1965-2005). Mr. Mauriello currently serves as a member of the Board of Directors of XL Group plc. (global insurance and re-insurance, 2006-present) and of Arcadia Resources Inc. (health care services and products, 2007-present). Previously, Mr. Mauriello served as a Director of the Hamilton Funds of the Bank of New York (2006-2007). |
Robert W. Selander (61) |
| Year of Election or Appointment: 2011 Previously, Mr. Selander served as a Member of the Advisory Board of Fidelity's Equity and High Income Funds (2011), Executive Vice Chairman (2010), Chief Executive Officer (2009-2010), and President and Chief Executive Officer (1997-2009) of Mastercard, Inc. |
Cornelia M. Small (67) |
| Year of Election or Appointment: 2005 Ms. Small is a member of the Board of Directors of the Teagle Foundation (2009-present). Ms. Small is also a member of the Investment Committee, and Chair (2008-present) and a member of the Board of Trustees of Smith College. In addition, Ms. Small serves on the Investment Committee of the Berkshire Taconic Community Foundation (2008-present). Previously, Ms. Small served as Chairperson of the Investment Committee (2002-2008) of Smith College. In addition, Ms. Small served as Chief Investment Officer, Director of Global Equity Investments, and a member of the Board of Directors of Scudder, Stevens & Clark and Scudder Kemper Investments. |
William S. Stavropoulos (72) |
| Year of Election or Appointment: 2001 Mr. Stavropoulos is Vice Chairman of the Independent Trustees of the Equity and High Income Funds (2006-present). Mr. Stavropoulos serves as President and Founder of the Michigan Baseball Foundation, the Great Lakes Loons (2007-present). Mr. Stavropoulos is Chairman Emeritus of the Board of Directors of The Dow Chemical Company, where he previously served in numerous senior management positions, including President, CEO (1995-2000; 2002-2004), Chairman of the Executive Committee (2000-2006), and as a member of the Board of Directors (1990-2006). Currently, Mr. Stavropoulos is Chairman of Univar (global distributor of commodity and specialty chemicals, 2010-present), a Director of Teradata Corporation (data warehousing and technology solutions, 2008-present), Chemical Financial Corporation, Maersk Inc. (industrial conglomerate), Tyco International, Inc. (multinational manufacturing and services, 2007-present), and a member of the Advisory Board for Metalmark Capital (private equity investment, 2005-present). Mr. Stavropoulos is a special advisor to Clayton, Dubilier & Rice, LLC (private equity investment). In addition, Mr. Stavropoulos is a member of the University of Notre Dame Advisory Council for the College of Science. |
David M. Thomas (62) |
| Year of Election or Appointment: 2008 Previously, Mr. Thomas served as Executive Chairman (2005-2006) and Chairman and Chief Executive Officer (2000-2005) of IMS Health, Inc. (pharmaceutical and healthcare information solutions). In addition, Mr. Thomas serves as a member of the Board of Directors of Fortune Brands, Inc. (consumer products), and Interpublic Group of Companies, Inc. (marketing communication, 2004-present). |
Michael E. Wiley (61) |
| Year of Election or Appointment: 2008 Mr. Wiley also serves as a Director of Asia Pacific Exploration Consolidated (international oil and gas exploration and production, 2008-present). Mr. Wiley serves as a Director of Tesoro Corporation (independent oil refiner and marketer, 2005-present), and a Director of Bill Barrett Corporation (exploration and production, 2005-present). In addition, Mr. Wiley also serves as a Director of Post Oak Bank (privately-held bank, 2004-present). Previously, Mr. Wiley served as a member of the Board of Trustees of the University of Tulsa (2000-2006; 2007-2010), as a Senior Energy Advisor of Katzenbach Partners, LLC (consulting, 2006-2007), as an Advisory Director of Riverstone Holdings (private investment), Chairman, President, and CEO of Baker Hughes, Inc. (oilfield services, 2000-2004), and as Director of Spinnaker Exploration Company (exploration and production, 2001-2005). |
Annual Report
+ The information above includes each Trustee's principal occupation during the last five years and other information relating to the experience, attributes, and skills relevant to each Trustee's qualifications to serve as a Trustee, which led to the conclusion that each Trustee should serve as a Trustee for the fund.
Advisory Board Members and Executive Officers:
Correspondence intended for each executive officer, Edward C. Johnson 3d, and Peter S. Lynch may be sent to Fidelity Investments, 82 Devonshire Street, Boston, Massachusetts 02109.
Name, Age; Principal Occupation |
Edward C. Johnson 3d (81) |
| Year of Election or Appointment: 2011 Member of the Advisory Board of Fidelity's Equity and High Income Funds. Mr. Johnson serves as Chief Executive Officer, Chairman, and a Director of FMR LLC, and also serves as Chairman and Director of FIL Limited. Previously, Mr. Johnson served as a Trustee and Chairman of the Board of certain Fidelity Trusts, Chairman and a Director of FMR, Chairman and a Director of FMR Co., Inc., and President of FMR LLC (2006-2007). |
Peter S. Lynch (67) |
| Year of Election or Appointment: 2003 Member of the Advisory Board of Fidelity's Equity and High Income Funds. Mr. Lynch is Vice Chairman and a Director of FMR and FMR Co., Inc. In addition, Mr. Lynch serves as a Trustee of Boston College and as the Chairman of the Inner-City Scholarship Fund. Previously, Mr. Lynch served on the Special Olympics International Board of Directors (1997-2006). |
Kenneth B. Robins (42) |
| Year of Election or Appointment: 2008 President and Treasurer of Fidelity's Equity and High Income Funds. Mr. Robins also serves as President and Treasurer (2010-present) and Assistant Treasurer (2009-present) of other Fidelity funds and is an employee of Fidelity Investments (2004-present). Previously, Mr. Robins served as Deputy Treasurer of the Fidelity funds (2005-2008) and Treasurer and Chief Financial Officer of The North Carolina Capital Management Trust: Cash and Term Portfolios (2006-2008). |
Brian B. Hogan (47) |
| Year of Election or Appointment: 2009 Vice President of Equity and High Income Funds. Mr. Hogan also serves as President of FMR's Equity Division (2009-present). Previously, Mr. Hogan served as Senior Vice President, Equity Research of FMR (2006-2009) and as a portfolio manager. |
Thomas C. Hense (47) |
| Year of Election or Appointment: 2008 or 2010 Vice President of Fidelity's High Income (2008), Small Cap (2008), and Value (2010) Funds. Previously, Mr. Hense served as a portfolio manager for Fidelity's Institutional Money Management Group (Pyramis) (2003-2008). |
Scott C. Goebel (43) |
| Year of Election or Appointment: 2008 Secretary and Chief Legal Officer (CLO) of the Fidelity funds. Mr. Goebel also serves as Secretary of Fidelity Investments Money Management, Inc. (FIMM) (2010-present) and Fidelity Research and Analysis Company (FRAC) (2010-present); Secretary and CLO of The North Carolina Capital Management Trust: Cash and Term Portfolios (2008-present); General Counsel, Secretary, and Senior Vice President of FMR (2008-present) and FMR Co., Inc. (2008-present); employed by FMR LLC or an affiliate (2001-present); Chief Legal Officer of Fidelity Management & Research (Hong Kong) Limited (2008-present) and Assistant Secretary of Fidelity Management & Research (Japan) Inc. (2008-present), and Fidelity Management & Research (U.K.) Inc. (2008-present). Previously, Mr. Goebel served as Assistant Secretary of FIMM (2008-2010), FRAC (2008-2010), and the Funds (2007-2008) and as Vice President and Secretary of Fidelity Distributors Corporation (FDC) (2005-2007). |
William C. Coffey (42) |
| Year of Election or Appointment: 2009 Assistant Secretary of Fidelity's Equity and High Income Funds. Mr. Coffey also serves as Senior Vice President and Deputy General Counsel of FMR LLC (2010-present), and is an employee of Fidelity Investments. Previously, Mr. Coffey served as Vice President and Associate General Counsel of FMR LLC (2005-2009). |
Holly C. Laurent (57) |
| Year of Election or Appointment: 2008 Anti-Money Laundering (AML) Officer of the Fidelity funds. Ms. Laurent also serves as AML Officer of The North Carolina Capital Management Trust: Cash and Term Portfolios (2008-present) and is an employee of Fidelity Investments. Previously, Ms. Laurent was Senior Vice President and Head of Legal for Fidelity Business Services India Pvt. Ltd. (2006-2008), and Senior Vice President, Deputy General Counsel and Group Head for FMR LLC (2005-2006). |
Christine Reynolds (53) |
| Year of Election or Appointment: 2008 Chief Financial Officer of the Fidelity funds. Ms. Reynolds became President of Fidelity Pricing and Cash Management Services (FPCMS) in August 2008. Ms. Reynolds served as Chief Operating Officer of FPCMS (2007-2008). Previously, Ms. Reynolds served as President, Treasurer, and Anti-Money Laundering officer of the Fidelity funds (2004-2007). |
Kenneth A. Rathgeber (64) |
| Year of Election or Appointment: 2004 Chief Compliance Officer of Fidelity's Equity and High Income Funds. Mr. Rathgeber is Chief Compliance Officer of Fidelity Management & Research (Hong Kong) Limited (2008-present), Fidelity Management & Research (Japan) Inc. (2008-present), FMR (2005-present), FMR Co., Inc. (2005-present), Fidelity Management & Research (U.K.) Inc. (2005-present), Fidelity Research & Analysis Company (2005-present), Fidelity Investments Money Management, Inc. (2005-present), Pyramis Global Advisors, LLC (2005-present), and Strategic Advisers, Inc. (2005-present). |
Jeffrey S. Christian (50) |
| Year of Election or Appointment: 2009 Deputy Treasurer of the Fidelity funds. Mr. Christian is an employee of Fidelity Investments. Previously, Mr. Christian served as Chief Financial Officer (2008-2009) of certain Fidelity funds and Senior Vice President of Fidelity Pricing and Cash Management Services (FPCMS) (2004-2009). |
Joseph F. Zambello (54) |
| Year of Election or Appointment: 2011 Deputy Treasurer of the Fidelity funds. Mr. Zambello is an employee of Fidelity Investments. Previously, Mr. Zambello served as Vice President of FMR's Program Management Group (2009-2011) and Vice President of the Transfer Agent Oversight Group (2005-2009). |
Adrien E. Deberghes (44) |
| Year of Election or Appointment: 2008 Deputy Treasurer of Fidelity's Equity and High Income Funds. Mr. Deberghes also serves as Vice President and Assistant Treasurer of Fidelity Rutland Square Trust II and Fidelity Commonwealth Trust II (2011-present), Assistant Treasurer of other Fidelity funds (2010-present), and is an employee of Fidelity Investments (2008-present). Previously, Mr. Deberghes served as Senior Vice President of Mutual Fund Administration at State Street Corporation (2007-2008), Senior Director of Mutual Fund Administration at Investors Bank & Trust (2005-2007), and Director of Finance for Dunkin' Brands (2000-2005). |
Stephanie J. Dorsey (42) |
| Year of Election or Appointment: 2010 Assistant Treasurer of Fidelity's Equity and High Income Funds. Ms. Dorsey also serves as Deputy Treasurer of other Fidelity funds (2008-present) and is an employee of Fidelity Investments (2008-present). Previously, Ms. Dorsey served as Treasurer (2004-2008) of the JPMorgan Mutual Funds and Vice President (2004-2008) of JPMorgan Chase Bank. |
John R. Hebble (53) |
| Year of Election or Appointment: 2009 Assistant Treasurer of Fidelity's Equity and High Income Funds. Mr. Hebble also serves as President (2011-present), Treasurer, and Chief Financial Officer of The North Carolina Capital Management Trust: Cash and Term Portfolios (2008-present), President and Treasurer of other Fidelity funds (2008-present) and is an employee of Fidelity Investments. |
Gary W. Ryan (53) |
| Year of Election or Appointment: 2005 Assistant Treasurer of the Fidelity funds. Mr. Ryan is an employee of Fidelity Investments. Previously, Mr. Ryan served as Vice President of Fund Reporting in Fidelity Pricing and Cash Management Services (FPCMS) (1999-2005). |
Jonathan Davis (43) |
| Year of Election or Appointment: 2010 Assistant Treasurer of the Fidelity funds. Mr. Davis is also Assistant Treasurer of Fidelity Rutland Square Trust II and Fidelity Commonwealth Trust II. Mr. Davis is an employee of Fidelity Investments. Previously, Mr. Davis served as Vice President and Associate General Counsel of FMR LLC (2003-2010). |
Annual Report
The Board of Trustees of Advisor Value Leaders Fund voted to pay to shareholders of record at the opening of business on record date, the following distributions per share derived from capital gains realized from sales of portfolio securities, and dividends derived from net investment income:
| Pay Date | Record Date | Dividends | Capital Gains |
Class A | 12/05/11 | 12/02/11 | $0.116 | $0.004 |
Class T | 12/05/11 | 12/02/11 | $0.088 | $0.004 |
Class B | 12/05/11 | 12/02/11 | $0.031 | $0.004 |
Class C | 12/05/11 | 12/02/11 | $0.048 | $0.004 |
Class A, Class T, Class B and Class C designate 100% of the dividends distributed during the fiscal year as qualifying for the dividends-received deduction for corporate shareholders.
Class A, Class T, Class B and Class C designate 100% of the dividends distributed during the fiscal year as amounts which may be taken into account as a dividend for purposes of the maximum rate under section 1(h)(11) of the Internal Revenue Code.
The fund will notify shareholders in January 2012 of amounts for use in preparing 2011 income tax returns.
Annual Report
Board Approval of Investment Advisory Contracts and Management Fees
Fidelity Advisor Value Leaders Fund
Each year, the Board of Trustees, including the Independent Trustees (together, the Board), votes on the renewal of the management contract and sub-advisory agreements (together, the Advisory Contracts) for the fund. The Board, assisted by the advice of fund counsel and Independent Trustees' counsel, requests and considers a broad range of information relevant to the renewal of the Advisory Contracts throughout the year.
The Board meets regularly and considers at each of its meetings factors that are relevant to its annual consideration of the renewal of the fund's Advisory Contracts, including the services and support provided to the fund and its shareholders. The Board has established various standing committees, each composed of Independent Trustees with varying backgrounds, to which the Board has assigned specific subject matter responsibilities in order to enhance effective decision-making by the Board. The Board, acting directly and through its Committees, requests and receives information concerning the annual consideration of the renewal of the fund's Advisory Contracts. The Board also meets as needed to consider matters specifically related to the Board's annual consideration of the renewal of Advisory Contracts. Members of the Board may also meet with trustees of other Fidelity funds through ad hoc joint committees to discuss certain matters relevant to the Fidelity funds.
At its July 2011 meeting, the Board of Trustees, including the Independent Trustees, unanimously determined to renew the fund's Advisory Contracts. In reaching its determination, the Board considered all factors it believed relevant, including (i) the nature, extent, and quality of the services to be provided to the fund and its shareholders (including the investment performance of the fund); (ii) the competitiveness of the fund's management fee and total expense ratio; (iii) the total costs of the services to be provided by and the profits to be realized by Fidelity from its relationship with the fund; (iv) the extent to which economies of scale would be realized as the fund grows; and (v) whether fee levels reflect these economies of scale, if any, for the benefit of fund shareholders.
In considering whether to renew the Advisory Contracts for the fund, the Board reached a determination, with the assistance of fund counsel and Independent Trustees' counsel and through the exercise of its business judgment, that the renewal of the Advisory Contracts is in the best interests of the fund and its shareholders and that the compensation payable under the Advisory Contracts is fair and reasonable. The Board's decision to renew the Advisory Contracts was not based on any single factor, but rather was based on a comprehensive consideration of all the information provided to the Board at its meetings throughout the year. The Board, in reaching its determination to renew the Advisory Contracts, is aware that shareholders in the fund have a broad range of investment choices available to them, including a wide choice among mutual funds offered by Fidelity's competitors, and that the fund's shareholders, who have the opportunity to review and weigh the disclosure provided by the fund in its prospectus and other public disclosures, have chosen to invest in this fund, managed by Fidelity.
Annual Report
Nature, Extent, and Quality of Services Provided. The Board considered the staffing within the investment adviser, FMR, and the sub-advisers (together, the Investment Advisers), including the backgrounds of the fund's investment personnel and the fund's investment objective and discipline. The Independent Trustees also had discussions with senior management of Fidelity's investment operations and investment groups. The Board considered the structure of the portfolio manager compensation program and whether this structure provides appropriate incentives to act in the best interests of the fund.
Resources Dedicated to Investment Management and Support Services. The Board and the Fund Oversight and Research Committees reviewed the general qualifications and capabilities of the Investment Advisers' investment staff, including its size, education, experience, and resources, as well as the Investment Advisers' approach to recruiting, training, managing, and compensating investment personnel. The Board also noted that FMR has devoted increased resources to non-U.S. offices. The Board noted that Fidelity's analysts have extensive resources, tools and capabilities which allow them to conduct sophisticated quantitative and fundamental analysis, as well as credit analysis of issuers, counterparties and enhancers. The Board also believes that Fidelity's investment professionals have sufficient access to global information and data so as to provide competitive investment results over time, and that those professionals also have access to sophisticated tools which permit them to assess portfolio construction and risk and performance attribution characteristics continuously, as well as to transmit new information and research conclusions rapidly around the world. Additionally, in their deliberations, the Board considered the Investment Advisers' trading capabilities and resources which are an integral part of the investment management process.
Shareholder and Administrative Services. The Board considered (i) the nature, extent, quality, and cost of advisory, administrative, and shareholder services performed by the Investment Advisers and their affiliates under the Advisory Contracts and under separate agreements covering transfer agency, pricing and bookkeeping, and securities lending services for the fund; (ii) the nature and extent of the investment adviser's supervision of third party service providers, principally custodians and subcustodians; and (iii) the resources devoted to, and the record of compliance with, the fund's compliance policies and procedures. The Board also reviewed the allocation of fund brokerage, including allocations to brokers affiliated with the Investment Advisers, the use of brokerage commissions to pay fund expenses, and the use of "soft" commission dollars to pay for research services.
The Board noted that the growth of fund assets over time across the complex allows Fidelity to reinvest in the development of services designed to enhance the value or convenience of the Fidelity funds as investment vehicles. These services include 24-hour access to account information and market information through telephone representatives and over the Internet, investor education materials and asset allocation tools, and the expanded availability of Fidelity Investor Centers, with 35 new branches opening since 2010.
Annual Report
Board Approval of Investment Advisory Contracts and
Management Fees - continued
Investment in a Large Fund Family. The Board considered the benefits to shareholders of investing in a Fidelity fund, including the benefits of investing in a fund that is part of a large family of funds offering a variety of investment disciplines and providing a large variety of mutual fund investor services. The Board noted that Fidelity had taken, or had made recommendations that resulted in the Fidelity funds taking, a number of actions over the previous year that benefited particular funds, including (i) continuing to dedicate additional resources to investment research and support of the senior management team that oversees asset management; (ii) rationalizing product lines through the mergers of six funds into other funds; (iii) continuing to migrate the Freedom Funds to dedicated lower cost underlying funds; (iv) obtaining shareholder approval to broaden the investment strategies for Fidelity Consumer Finance Portfolio, Fidelity Emerging Asia Fund, and Fidelity Environment and Alternative Energy Portfolio; (v) contractually agreeing to reduce the management fees and impose other expense limitations on Spartan 500 Index Fund and U.S. Bond Index Fund in connection with launching new institutional classes of these funds; (vi) changing the name, primary and supplemental benchmarks, and investment policies of Fidelity Global Strategies Fund to support the fund's flexible investment mandate and global orientation; and (vii) reducing the transfer agency account fee rates on certain accounts.
Investment Performance. The Board considered whether the fund has operated in accordance with its investment objective, as well as its record of compliance with its investment restrictions. It also reviewed the fund's absolute investment performance for each class, as well as the fund's relative investment performance for each class measured over multiple periods against (i) a broad-based securities market index, and (ii) a peer group of mutual funds deemed appropriate by Fidelity and reviewed by the Board. The following charts considered by the Board show, over the one-, three-, and five-year periods ended December 31, 2010, the cumulative total returns of Institutional Class (Class I) and Class C of the fund, the cumulative total returns of a broad-based securities market index ("benchmark"), and a range of cumulative total returns of a peer group of mutual funds identified by Morningstar, Inc. as having an investment style similar to that of the fund based on underlying portfolio holdings. The returns of Institutional Class (Class I) and Class C show the performance of the highest and lowest performing classes, respectively (based on five-year performance). The box within each chart shows the 25th percentile return (bottom of box) and the 75th percentile return (top of box) of the peer group. Returns shown above the box are in the first quartile and returns shown below the box are in the fourth quartile. The percentage beaten numbers noted below each chart correspond to the percentile box and represent the percentage of funds in the peer group whose performance was equal to or lower than that of the class indicated.
Annual Report
Fidelity Advisor Value Leaders Fund
The Board reviewed the fund's relative investment performance against its peer group and noted that the performance of Institutional Class (Class I) of the fund was in the fourth quartile for all the periods shown. The Board also noted that the investment performance of the fund was lower than its benchmark for all the periods shown. The Board considered that the variations in performance among the fund's classes reflect the variations in class expenses, which result in lower performance for higher expense classes. The Board discussed with FMR actions that have been taken by FMR to improve the fund's disappointing performance relative to its peer group and benchmark. The Board also reviewed the fund's performance since inception as well as performance in the current year. The Board will continue to closely monitor the performance of the fund in the coming year and discuss with FMR other appropriate actions to address the performance of the fund.
The Board also considered that the fund's management fee is subject to upward or downward adjustment depending upon whether, and to what extent, the fund's investment performance for the performance period exceeds, or is exceeded by, the record (over the same period) of a Board-approved performance adjustment index. The Board noted that the performance adjustment provides FMR with a strong economic incentive to seek to achieve superior performance for the fund's shareholders and helps to more closely align the interests of FMR and the fund's shareholders.
Annual Report
Board Approval of Investment Advisory Contracts and
Management Fees - continued
Based on its review, the Board concluded that the nature, extent, and quality of services provided to the fund under the Advisory Contracts should benefit the fund's shareholders.
Competitiveness of Management Fee and Total Expense Ratio. The Board considered the fund's management fee and total expense ratio compared to "mapped groups" of competitive funds and classes. Fidelity creates "mapped groups" by combining similar Lipper investment objective categories that have comparable management fee characteristics. Combining Lipper investment objective categories aids the Board's management fee and total expense ratio comparisons by broadening the competitive group used for comparison and by reducing the number of universes to which various Fidelity funds are compared.
Management Fee. The Board considered two proprietary management fee comparisons for the 12-month periods shown in the chart below. The group of Lipper funds used by the Board for management fee comparisons is referred to below as the "Total Mapped Group." The Total Mapped Group comparison focuses on a fund's standing relative to the total universe of comparable funds available to investors in terms of gross management fees before expense reimbursements or caps, and without giving effect to the fund's performance adjustment. "TMG %" represents the percentage of funds in the Total Mapped Group that had management fees that were lower than the fund's. For example, a TMG % of 10% means that 90% of the funds in the Total Mapped Group had higher management fees than the fund. The "Asset-Size Peer Group" (ASPG) comparison focuses on a fund's standing relative to non-Fidelity funds similar in size to the fund within the Total Mapped Group. The ASPG represents at least 15% of the funds in the Total Mapped Group with comparable asset size and management fee characteristics, subject to a minimum of 50 funds (or all funds in the Total Mapped Group if fewer than 50). Additional information, such as the ASPG quartile in which the fund's management fee ranked and the impact of the fund's performance adjustment, is also included in the chart and considered by the Board.
Annual Report
Fidelity Advisor Value Leaders Fund
The Board noted that the fund's management fee ranked below the median of its Total Mapped Group and below the median of its ASPG for 2010. The Board also noted the effect of the fund's negative performance adjustment on the fund's management fee ranking. The Board noted that the performance adjustment for each year represents calculations for performance periods that differ from the periods shown in the performance charts above.
Based on its review, the Board concluded that the fund's management fee is fair and reasonable in light of the services that the fund receives and the other factors considered.
Total Expense Ratio. In its review of each class's total expense ratio, the Board considered the fund's management fee as well as other fund or class expenses, as applicable, such as transfer agent fees, pricing and bookkeeping fees, fund-paid 12b-1 fees, and custodial, legal, and audit fees. The Board also noted the effects of any waivers and reimbursements on fees and expenses, as well as the impact of the fund's performance adjustment. As part of its review, the Board also considered the current and historical total expense ratios of each class of the fund compared to competitive fund median expenses. Each class of the fund is compared to those funds and classes in the Total Mapped Group (used by the Board for management fee comparisons) that have a similar sales load structure.
The Board noted that the total expense ratio of each of Class A, Class B, Class C, and Institutional Class ranked below its competitive median for 2010 and the total expense ratio of Class T ranked above its competitive median for 2010. The Board considered that various factors, including 12b-1 fees, positive or negative performance adjustments, and relatively higher other expenses in the case of small fund size, can affect total expense ratios. The Board noted that the total expense ratio of Class T was above the competitive median primarily because of higher 12b-1 fees on Class T. Class T has a higher 12b-1 fee, but a lower front-end sales charge, than traditionally priced front-end sales charge classes. The Board noted that the fund offers multiple classes, each of which has a different sales load and 12b-1 fee structure, and that the multiple structures are intended to offer a range of pricing options for the intermediary market. The Board also noted that the total expense ratios of the classes vary primarily by the level of their 12b-1 fees, although differences in transfer agent fees may also cause expenses to vary from class to class.
Annual Report
Board Approval of Investment Advisory Contracts and
Management Fees - continued
Fees Charged to Other Fidelity Clients. The Board also considered Fidelity fee structures and other information with respect to clients of FMR and its affiliates, such as other mutual funds advised or subadvised by FMR or its affiliates, pension plan clients, and other institutional clients. In March 2010, the Board created an ad hoc joint committee with the board of other Fidelity funds (the Committee) to review and compare Fidelity's institutional investment advisory business with its business of providing services to the Fidelity funds, including the differences in services provided, fees charged, and costs incurred, as well as competition in their respective marketplaces.
Based on its review of total expense ratios and fees charged to other Fidelity clients, the Board concluded that the total expense ratio of each class of the fund was reasonable, although Class T was above the median of the universe presented for comparison, in light of the services that the fund and its shareholders receive and the other factors considered, including the findings of the Committee.
Costs of the Services and Profitability. The Board considered the revenues earned and the expenses incurred by Fidelity in conducting the business of developing, marketing, distributing, managing, administering and servicing the fund and its shareholders. The Board also considered the level of Fidelity's profits in respect of all the Fidelity funds.
On an annual basis, FMR presents to the Board Fidelity's profitability for the fund. Fidelity calculates the profitability for each fund, as well as aggregate profitability for groups of Fidelity funds and all Fidelity funds, using a series of detailed revenue and cost allocation methodologies which originate with the books and records of Fidelity on which Fidelity's audited financial statements are based. The Audit Committee of the Board reviews any significant changes from the prior year's methodologies.
PricewaterhouseCoopers LLP (PwC), independent registered public accounting firm and auditor to Fidelity and certain Fidelity funds, has been engaged annually by the Board as part of the Board's assessment of Fidelity's profitability analysis. PwC's engagement includes the review and assessment of Fidelity's methodologies used in determining the revenues and expenses attributable to Fidelity's mutual fund business, and completion of agreed-upon procedures surrounding the mathematical accuracy of fund profitability and its conformity to allocation methodologies. After considering PwC's reports issued under the engagement and information provided by Fidelity, the Board concluded that while other allocation methods may also be reasonable, Fidelity's profitability methodologies are reasonable in all material respects.
Annual Report
The Board also reviewed Fidelity's non-fund businesses and fall-out benefits related to the mutual fund business as well as cases where Fidelity's affiliates may benefit from or be related to the fund's business.
The Board considered the costs of the services provided by and the profits realized by Fidelity in connection with the operation of the fund and was satisfied that the profitability was not excessive in the circumstances.
Economies of Scale. The Board considered whether there have been economies of scale in respect of the management of the Fidelity funds, whether the Fidelity funds (including the fund) have appropriately benefited from any such economies of scale, and whether there is potential for realization of any further economies of scale. The Board considered the extent to which the fund will benefit from economies of scale through increased services to the fund, through waivers or reimbursements, or through fee or expense reductions. The Board also noted that in 2009, it and the board of other Fidelity funds created an ad hoc committee (the Economies of Scale Committee) to analyze whether FMR attains economies of scale in respect of the management and servicing of the Fidelity funds, whether the Fidelity funds have appropriately benefited from such economies of scale, and whether there is potential for realization of any further economies of scale.
The Board recognized that the fund's management contract incorporates a "group fee" structure, which provides for lower group fee rates as total fund assets under FMR's management increase, and for higher group fee rates as total fund assets under FMR's management decrease. FMR calculates the group fee rates based on a tiered asset "breakpoint" schedule that varies based on asset class. The Board considered that the group fee is designed to deliver the benefits of economies of scale to fund shareholders when total Fidelity fund assets increase, even if assets of any particular fund are unchanged or have declined, because some portion of Fidelity's costs are attributable to services provided to all Fidelity funds, and all funds benefit if those costs can be allocated among more assets. The Board concluded that, given the group fee structure, fund shareholders will benefit from lower management fees as assets under FMR's management increase at the fund complex level, regardless of whether Fidelity achieves any such economies of scale.
Annual Report
Board Approval of Investment Advisory Contracts and
Management Fees - continued
The Board concluded, taking into account the analysis of the Economies of Scale Committee, that any potential economies of scale are being appropriately shared between fund shareholders and Fidelity.
Additional Information Requested by the Board. In order to develop fully the factual basis for consideration of the Fidelity funds' Advisory Contracts, the Board requested and received additional information on certain topics, including (i) fund performance trends, actions to be taken by FMR to improve certain funds' overall performance, and Fidelity's long-term strategies for certain funds; (ii) portfolio manager changes that have occurred during the past year and length of portfolio manager tenure for different categories of funds over time; (iii) Fidelity's compensation structure for portfolio managers and other key personnel and strategies for attracting and retaining non-investment personnel; (iv) the amount of the investment that each portfolio manager has made in the Fidelity fund(s) that he or she manages; (v) historical trends in Fidelity's realization of fall-out benefits; (vi) Fidelity's group fee structures and the rationale for the individual fee rates of certain funds; (vii) fund profitability methodology and the impact of certain factors on fund profitability results; (viii) trends regarding industry use of performance fee structures and Fidelity's compliance practices with respect to performance adjustment calculations; (ix) the fee structures in place for certain other Fidelity clients; and (x) explanations regarding the relative total expense ratios of certain funds and classes, total expense competitive trends, and actions that might be taken by FMR to reduce total expense ratios for certain funds and classes.
Based on its evaluation of all of the conclusions noted above, and after considering all factors it believed relevant, the Board ultimately concluded that the advisory fee structures are fair and reasonable, and that the fund's Advisory Contracts should be renewed.
Annual Report
Investment Adviser
Fidelity Management & Research Company
Boston, MA
Investment Sub-Advisers
FMR Co., Inc.
Fidelity Management & Research
(U.K.) Inc.
Fidelity Management & Research
(Hong Kong) Limited
Fidelity Management & Research
(Japan) Inc.
General Distributor
Fidelity Distributors Corporation
Boston, MA
Transfer and Service Agents
Fidelity Investments Institutional Operations Company, Inc.
Boston, MA
Fidelity Service Company, Inc.
Boston, MA
Custodian
Brown Brothers Harriman & Company
Boston, MA
AVLF-UANN-1211
1.793576.108
(Fidelity Investment logo)(registered trademark)
Fidelity Advisor®
Value Leaders
Fund - Institutional Class
Annual Report
October 31, 2011
Contents
Chairman's Message | (Click Here) | The Chairman's message to shareholders. |
Performance | (Click Here) | How the fund has done over time. |
Management's Discussion of Fund Performance | (Click Here) | The Portfolio Manager's review of fund performance and strategy. |
Shareholder Expense Example | (Click Here) | An example of shareholder expenses. |
Investment Changes | (Click Here) | A summary of major shifts in the fund's investments over the past six months. |
Investments | (Click Here) | A complete list of the fund's investments with their market values. |
Financial Statements | (Click Here) | Statements of assets and liabilities, operations, and changes in net assets, as well as financial highlights. |
Notes | (Click Here) | Notes to the financial statements. |
Report of Independent Registered Public Accounting Firm | (Click Here) | |
Trustees and Officers | (Click Here) | |
Distributions | (Click Here) | |
Board Approval of Investment Advisory Contracts and Management Fees | (Click Here) | |
To view a fund's proxy voting guidelines and proxy voting record for the 12-month period ended June 30, visit http://www.fidelity.com/proxyvotingresults or visit the Securities and Exchange Commission's (SEC) web site at http://www.sec.gov. You may also call 1-877-208-0098 to request a free copy of the proxy voting guidelines.
Standard & Poor's, S&P and S&P 500 are registered service marks of The McGraw-Hill Companies, Inc. and have been licensed for use by Fidelity Distributors Corporation.
Other third party marks appearing herein are the property of their respective owners.
All other marks appearing herein are registered or unregistered trademarks or service marks of FMR LLC or an affiliated company.
Annual Report
This report and the financial statements contained herein are submitted for the general information of the shareholders of the fund. This report is not authorized for distribution to prospective investors in the fund unless preceded or accompanied by an effective prospectus.
A fund files its complete schedule of portfolio holdings with the SEC for the first and third quarters of each fiscal year on Form N-Q. Forms N-Q are available on the SEC's web site at http://www.sec.gov. A fund's Forms N-Q may be reviewed and copied at the SEC's Public Reference Room in Washington, DC. Information regarding the operation of the SEC's Public Reference Room may be obtained by calling 1-800-SEC-0330. For a complete list of a fund's portfolio holdings, view the most recent holdings listing, semiannual report, or annual report on Fidelity's web site at http://www.fidelity.com, http://www.advisor.fidelity.com, or http://www.401k.com, as applicable.
NOT FDIC INSURED • MAY LOSE VALUE • NO BANK GUARANTEE
Neither the fund nor Fidelity Distributors Corporation is a bank.
Annual Report
(photo_of_James_C_Curvey)
Dear Shareholder:
Global equity markets began the fourth quarter on a strong note, sharply reversing course in October amid strong corporate earnings, better-than-expected economic news and the promise of a resolution to the sovereign debt crisis in Europe. The mini rally followed a third quarter marked by a significant downturn in July and August, which heightened investor anxiety and set off a wave of volatility that hampered most major asset classes through the end of September. Financial markets are difficult to predict, of course, but you can help put the odds in your favor by following these time-tested investment principles.
One of the basic tenets is to invest according to your time horizon. For long-term investors, riding out the markets' inevitable ups and downs has proven much more effective than making decisions based on short-term developments. If your goal is approaching, you can also benefit from patience and restraint, rather than attempting to time the market. No matter your time horizon, missing only a few of the markets' best days can significantly diminish returns. Patience also affords the benefits of compounding - earning interest on additional income or reinvested dividends and capital gains. While staying the course doesn't eliminate risk, it can considerably lessen the negative impact of short-term downturns.
Asset allocation is another principle to manage risk. As you spread your portfolio among the asset classes, be sure to consider your time horizon, risk tolerance and investment objectives. Younger investors may be better served by emphasizing equities, which historically have been the best-performing asset class over time. Investors who are nearing a specific goal, such as retirement or sending a child to college, may choose to favor bonds and other investments that have tended to be more stable. Studies indicate that asset allocation is the single most important determinant of a portfolio's long-term success. After deciding on a suitable allocation strategy, make sure your portfolio is adequately diversified, with exposure to stocks of small-, mid- and large-cap companies in a range of sectors, for example. And today, more than ever, geographic diversification should be taken into account.
Lastly, investing a certain amount of money on a regular basis - a principle known as dollar-cost averaging - can help lower the average cost of your purchases, while also giving you the discipline to avoid selling weak performers just prior to an upswing, or chasing a hot performer just before a correction.
We invite you to learn more by visiting us on the Internet, dropping by one of our Investor Centers or calling us by phone. It is our privilege to provide the resources you need to choose investments that are right for you.
Sincerely,
(The acting chairman's signature appears here.)
James C. Curvey
Acting Chairman
Annual Report
Average annual total return reflects the change in the value of an investment, assuming reinvestment of the class' distributions from dividend income and capital gains (the profits earned upon the sale of securities that have grown in value, if any) and assuming a constant rate of performance each year. The $10,000 table and the fund's returns do not reflect the deduction of taxes that a shareholder would pay on fund distributions or the redemption of fund shares. During periods of reimbursement by Fidelity, a fund's total return will be greater than it would be had the reimbursement not occurred. How a fund did yesterday is no guarantee of how it will do tomorrow.
Average Annual Total Returns
Periods ended October 31, 2011 | Past 1
year | Past 5
years | Life of
fund A |
Institutional Class | -0.11% | -4.89% | 2.40% |
A From June 17, 2003.
$10,000 Over Life of Fund
Let's say hypothetically that $10,000 was invested in Fidelity Advisor® Value Leaders Fund - Institutional Class on June 17, 2003, when the fund started. The chart shows how the value of your investment would have changed, and also shows how the Russell 1000® Value Index performed over the same period.
Annual Report
Market Recap: U.S. stocks overcame a sharp summer drop to post a solid gain for the 12 months ending October 31, 2011. Bullishness pervaded the market during the first half of the period, only to be squelched by extreme volatility in the summer, as debate over the U.S. debt ceiling, Standard & Poor's subsequent downgrade of the country's long-term sovereign credit rating and deepening debt woes in Europe led to the worst calendar-quarter finish for the S&P 500® Index in almost three years. However, news of a possible solution to the eurozone debt crisis, along with better-than-expected U.S. economic data and strong corporate earnings, helped fuel an October rally that pushed the broad-based index up roughly 11% - its highest monthly return since December 1991. With that boost, the S&P 500® finished the year up 8.09%, while the blue-chip Dow Jones Industrial AverageSM added 10.39% and the technology-heavy Nasdaq Composite® Index gained 8.10%. Among sectors within the S&P 500®, only financials (-6%) posted a decline for the year, while energy (+19%) and utilities (+15%) fared best. Small and mid-sized stocks also rose, with the Russell 2000® and Russell Midcap® indexes adding 6.71% and 7.85%, respectively. The lengthy financial crisis in Europe continued to hamper foreign developed-markets equities, with the MSCI® EAFE® (Europe, Australasia, Far East) Index falling 3.97%.
Comments from Michael Chren, Portfolio Manager of Fidelity Advisor® Value Leaders Fund: For the year, the fund's Institutional Class declined 0.11%, compared with a gain of 6.16% for the Russell 1000® Value Index. Two out-of-index European stocks, France-based telecom equipment manufacturer Alcatel-Lucent and Swiss specialty chemicals maker Clariant, accounted for much of the fund's disappointing performance and were the fund's two biggest individual detractors. The fund's overweighting and weak security selection in diversified financials was costly, with our stakes in Citigroup and Goldman Sachs Group hurting performance. Poor positioning in information technology, materials and utilities also dampened results. On the positive side, positioning in consumer staples provided the biggest boost to relative performance, including the portfolio's top individual contributor, Mexican brewer Grupo Modelo. Investments in the consumer discretionary sector yielded mixed results, but we received a contribution from Swiss navigation products manufacturer Garmin. Good positioning in industrials and energy also helped.
The views expressed above reflect those of the portfolio manager(s) only through the end of the period as stated on the cover of this report and do not necessarily represent the views of Fidelity or any other person in the Fidelity organization. Any such views are subject to change at any time based upon market or other conditions and Fidelity disclaims any responsibility to update such views. These views may not be relied on as investment advice and, because investment decisions for a Fidelity fund are based on numerous factors, may not be relied on as an indication of trading intent on behalf of any Fidelity fund.
Annual Report
Shareholder Expense Example
As a shareholder of the Fund, you incur two types of costs: (1) transaction costs, including sales charges (loads) on purchase payments or redemption proceeds, and (2) ongoing costs, including management fees, distribution and/or service (12b-1) fees and other Fund expenses. This Example is intended to help you understand your ongoing costs (in dollars) of investing in the Fund and to compare these costs with the ongoing costs of investing in other mutual funds.
The Example is based on an investment of $1,000 invested at the beginning of the period and held for the entire period (May 1, 2011 to October 31, 2011).
Actual Expenses
The first line of the accompanying table for each class of the Fund provides information about actual account values and actual expenses. You may use the information in this line, together with the amount you invested, to estimate the expenses that you paid over the period. Simply divide your account value by $1,000.00 (for example, an $8,600 account value divided by $1,000.00 = 8.6), then multiply the result by the number in the first line for a class of the Fund under the heading entitled "Expenses Paid During Period" to estimate the expenses you paid on your account during this period. In addition, the Fund, as a shareholder in the underlying Fidelity Central Funds, will indirectly bear its pro-rata share of the fees and expenses incurred by the underlying Fidelity Central Funds. These fees and expenses are not included in the Fund's annualized expense ratio used to calculate the expense estimate in the table below.
Hypothetical Example for Comparison Purposes
The second line of the accompanying table for each class of the Fund provides information about hypothetical account values and hypothetical expenses based on a Class' actual expense ratio and an assumed rate of return of 5% per year before expenses, which is not the Class' actual return. The hypothetical account values and expenses may not be used to estimate the actual ending account balance or expenses you paid for the period. You may use this information to compare the ongoing costs of investing in the Fund and other funds. To do so, compare this 5% hypothetical example with the 5% hypothetical examples that appear in the shareholder reports of the other funds. In addition, the Fund, as a shareholder in the underlying Fidelity Central Funds, will indirectly bear its pro-rata share of the fees and expenses incurred by the underlying Fidelity Central Funds. These fees and expenses are not included in the Fund's annualized expense ratio used to calculate the expense estimate in the table below.
Please note that the expenses shown in the table are meant to highlight your ongoing costs only and do not reflect any transaction costs. Therefore, the second line of the table is useful in comparing ongoing costs only, and will not help you determine the relative total costs of owning different funds. In addition, if these transactional costs were included, your costs would have been higher.
Annual Report
| Annualized
Expense Ratio | Beginning
Account Value
May 1, 2011 | Ending
Account Value
October 31, 2011 | Expenses Paid
During Period*
May 1, 2011 to
October 31, 2011 |
Class A | 1.29% | | | |
Actual | | $ 1,000.00 | $ 845.50 | $ 6.00 |
HypotheticalA | | $ 1,000.00 | $ 1,018.70 | $ 6.56 |
Class T | 1.55% | | | |
Actual | | $ 1,000.00 | $ 844.10 | $ 7.20 |
HypotheticalA | | $ 1,000.00 | $ 1,017.39 | $ 7.88 |
Class B | 2.04% | | | |
Actual | | $ 1,000.00 | $ 841.70 | $ 9.47 |
HypotheticalA | | $ 1,000.00 | $ 1,014.92 | $ 10.36 |
Class C | 2.04% | | | |
Actual | | $ 1,000.00 | $ 842.00 | $ 9.47 |
HypotheticalA | | $ 1,000.00 | $ 1,014.92 | $ 10.36 |
Institutional Class | .97% | | | |
Actual | | $ 1,000.00 | $ 846.50 | $ 4.51 |
HypotheticalA | | $ 1,000.00 | $ 1,020.32 | $ 4.94 |
A 5% return per year before expenses
* Expenses are equal to each Class' annualized expense ratio, multiplied by the average account value over the period, multiplied by 184/365 (to reflect the one-half year period).
Annual Report
Investment Changes (Unaudited)
Top Ten Stocks as of October 31, 2011 |
| % of fund's
net assets | % of fund's net assets
6 months ago |
Garmin Ltd. | 5.0 | 3.4 |
Grupo Modelo SAB de CV Series C | 5.0 | 3.8 |
Citigroup, Inc. | 4.7 | 3.3 |
Pfizer, Inc. | 4.2 | 4.8 |
Alcatel-Lucent SA sponsored ADR | 3.9 | 3.0 |
Johnson & Johnson | 3.8 | 2.1 |
Merck & Co., Inc. | 3.3 | 2.8 |
Procter & Gamble Co. | 3.3 | 0.4 |
General Electric Co. | 3.3 | 3.4 |
Chevron Corp. | 3.0 | 3.0 |
| 39.5 | |
Top Five Market Sectors as of October 31, 2011 |
| % of fund's
net assets | % of fund's net assets
6 months ago |
Financials | 22.9 | 24.3 |
Health Care | 14.8 | 15.7 |
Consumer Staples | 11.8 | 9.3 |
Energy | 11.4 | 11.7 |
Consumer Discretionary | 11.1 | 9.1 |
Asset Allocation (% of fund's net assets) |
As of October 31, 2011* | As of April 30, 2011** |
| Stocks 95.0% | | | Stocks 98.7% | |
| Short-Term
Investments and
Net Other Assets 5.0% | | | Short-Term
Investments and
Net Other Assets 1.3% | |
* Foreign investments | 24.6% | | ** Foreign investments | 24.8% | |

Annual Report
Investments October 31, 2011
Showing Percentage of Net Assets
Common Stocks - 95.0% |
| Shares | | Value |
CONSUMER DISCRETIONARY - 11.1% |
Automobiles - 0.6% |
Honda Motor Co. Ltd. | 5,500 | | $ 164,492 |
Household Durables - 5.7% |
D.R. Horton, Inc. | 18,638 | | 207,441 |
Garmin Ltd. (d) | 42,730 | | 1,469,477 |
| | 1,676,918 |
Media - 1.8% |
Time Warner, Inc. | 6,964 | | 243,670 |
Washington Post Co. Class B (d) | 856 | | 291,177 |
| | 534,847 |
Multiline Retail - 2.4% |
JCPenney Co., Inc. (d) | 19,706 | | 632,168 |
Target Corp. | 1,296 | | 70,956 |
| | 703,124 |
Specialty Retail - 0.6% |
American Eagle Outfitters, Inc. | 13,004 | | 170,743 |
TOTAL CONSUMER DISCRETIONARY | | 3,250,124 |
CONSUMER STAPLES - 11.8% |
Beverages - 5.0% |
Grupo Modelo SAB de CV Series C | 231,200 | | 1,466,507 |
Food & Staples Retailing - 0.7% |
CVS Caremark Corp. | 2,110 | | 76,593 |
Wal-Mart Stores, Inc. | 2,447 | | 138,794 |
| | 215,387 |
Food Products - 2.1% |
Kraft Foods, Inc. Class A | 17,114 | | 602,071 |
Household Products - 3.3% |
Procter & Gamble Co. | 14,913 | | 954,283 |
Tobacco - 0.7% |
Lorillard, Inc. | 1,738 | | 192,327 |
TOTAL CONSUMER STAPLES | | 3,430,575 |
ENERGY - 11.4% |
Energy Equipment & Services - 1.9% |
Transocean Ltd. (United States) | 5,661 | | 323,526 |
Weatherford International Ltd. (a) | 15,864 | | 245,892 |
| | 569,418 |
Common Stocks - continued |
| Shares | | Value |
ENERGY - continued |
Oil, Gas & Consumable Fuels - 9.5% |
Alpha Natural Resources, Inc. (a) | 6,500 | | $ 156,260 |
Anadarko Petroleum Corp. | 2,344 | | 184,004 |
Apache Corp. | 1,300 | | 129,519 |
BP PLC sponsored ADR | 4,620 | | 204,112 |
Chevron Corp. | 8,300 | | 871,915 |
Marathon Petroleum Corp. | 18,305 | | 657,150 |
Occidental Petroleum Corp. | 5,980 | | 555,781 |
| | 2,758,741 |
TOTAL ENERGY | | 3,328,159 |
FINANCIALS - 22.9% |
Capital Markets - 3.6% |
Bank of New York Mellon Corp. | 10,500 | | 223,440 |
E*TRADE Financial Corp. (a) | 34,690 | | 376,387 |
Goldman Sachs Group, Inc. | 2,004 | | 219,538 |
Morgan Stanley | 6,899 | | 121,698 |
State Street Corp. | 2,800 | | 113,092 |
| | 1,054,155 |
Commercial Banks - 6.4% |
Aozora Bank Ltd. | 217,000 | | 548,652 |
KeyCorp | 43,700 | | 308,522 |
Sumitomo Mitsui Financial Group, Inc. | 3,700 | | 103,434 |
U.S. Bancorp | 10,370 | | 265,368 |
Wells Fargo & Co. | 24,826 | | 643,242 |
| | 1,869,218 |
Diversified Financial Services - 6.9% |
Bank of America Corp. | 19,055 | | 130,146 |
Citigroup, Inc. | 42,922 | | 1,355,906 |
JPMorgan Chase & Co. | 15,176 | | 527,518 |
| | 2,013,570 |
Insurance - 5.1% |
Assurant, Inc. | 1,900 | | 73,226 |
Berkshire Hathaway, Inc. Class B (a) | 1,289 | | 100,362 |
MetLife, Inc. | 17,568 | | 617,691 |
RenaissanceRe Holdings Ltd. | 1,597 | | 108,788 |
The Chubb Corp. | 3,600 | | 241,380 |
XL Group PLC Class A | 14,939 | | 324,774 |
| | 1,466,221 |
Common Stocks - continued |
| Shares | | Value |
FINANCIALS - continued |
Real Estate Investment Trusts - 0.7% |
Weyerhaeuser Co. | 11,500 | | $ 206,770 |
Thrifts & Mortgage Finance - 0.2% |
Radian Group, Inc. | 26,100 | | 61,335 |
TOTAL FINANCIALS | | 6,671,269 |
HEALTH CARE - 14.8% |
Health Care Equipment & Supplies - 0.5% |
CareFusion Corp. (a) | 6,200 | | 158,720 |
Pharmaceuticals - 14.3% |
Bristol-Myers Squibb Co. | 3,200 | | 101,088 |
Eli Lilly & Co. | 6,274 | | 233,142 |
Johnson & Johnson | 17,111 | | 1,101,777 |
Merck & Co., Inc. | 28,141 | | 970,865 |
Pfizer, Inc. | 63,725 | | 1,227,344 |
Sanofi-aventis sponsored ADR | 14,625 | | 522,844 |
| | 4,157,060 |
TOTAL HEALTH CARE | | 4,315,780 |
INDUSTRIALS - 5.6% |
Aerospace & Defense - 1.7% |
United Technologies Corp. | 6,500 | | 506,870 |
Construction & Engineering - 0.6% |
Jacobs Engineering Group, Inc. (a) | 4,300 | | 166,840 |
Industrial Conglomerates - 3.3% |
General Electric Co. | 56,680 | | 947,123 |
TOTAL INDUSTRIALS | | 1,620,833 |
INFORMATION TECHNOLOGY - 11.0% |
Communications Equipment - 7.0% |
Alcatel-Lucent SA sponsored ADR (a)(d) | 415,582 | | 1,138,695 |
Cisco Systems, Inc. | 10,937 | | 202,663 |
Comverse Technology, Inc. (a) | 103,700 | | 714,493 |
| | 2,055,851 |
Electronic Equipment & Components - 1.0% |
Corning, Inc. | 19,954 | | 285,143 |
Office Electronics - 0.7% |
Xerox Corp. | 23,649 | | 193,449 |
Common Stocks - continued |
| Shares | | Value |
INFORMATION TECHNOLOGY - continued |
Semiconductors & Semiconductor Equipment - 1.8% |
Advanced Micro Devices, Inc. (a) | 91,438 | | $ 533,084 |
Software - 0.5% |
Microsoft Corp. | 5,172 | | 137,730 |
TOTAL INFORMATION TECHNOLOGY | | 3,205,257 |
MATERIALS - 3.1% |
Chemicals - 2.0% |
Clariant AG (Reg.) (a) | 54,378 | | 594,561 |
Metals & Mining - 1.1% |
Newmont Mining Corp. | 4,678 | | 312,631 |
TOTAL MATERIALS | | 907,192 |
TELECOMMUNICATION SERVICES - 0.5% |
Diversified Telecommunication Services - 0.5% |
CenturyLink, Inc. | 3,745 | | 132,049 |
UTILITIES - 2.8% |
Electric Utilities - 2.8% |
Exelon Corp. | 4,668 | | 207,213 |
FirstEnergy Corp. | 5,904 | | 265,444 |
NextEra Energy, Inc. | 6,296 | | 355,094 |
| | 827,751 |
TOTAL COMMON STOCKS (Cost $30,821,769) | 27,688,989 |
Money Market Funds - 16.1% |
| Shares | | Value |
Fidelity Cash Central Fund, 0.12% (b) | 1,336,268 | | $ 1,336,268 |
Fidelity Securities Lending Cash Central Fund, 0.11% (b)(c) | 3,353,649 | | 3,353,649 |
TOTAL MONEY MARKET FUNDS (Cost $4,689,917) | 4,689,917 |
TOTAL INVESTMENT PORTFOLIO - 111.1% (Cost $35,511,686) | | 32,378,906 |
NET OTHER ASSETS (LIABILITIES) - (11.1)% | | (3,232,267) |
NET ASSETS - 100% | $ 29,146,639 |
Legend |
(a) Non-income producing |
(b) Affiliated fund that is available only to investment companies and other accounts managed by Fidelity Investments. The rate quoted is the annualized seven-day yield of the fund at period end. A complete unaudited listing of the fund's holdings as of its most recent quarter end is available upon request. In addition, each Fidelity Central Fund's financial statements, which are not covered by the Fund's Report of Independent Registered Public Accounting Firm, are available on the SEC's website or upon request. |
(c) Investment made with cash collateral received from securities on loan. |
(d) Security or a portion of the security is on loan at period end. |
Affiliated Central Funds |
Information regarding fiscal year to date income earned by the Fund from investments in Fidelity Central Funds is as follows: |
Fund | Income earned |
Fidelity Cash Central Fund | $ 857 |
Fidelity Securities Lending Cash Central Fund | 39,854 |
Total | $ 40,711 |
Other Information |
The following is a summary of the inputs used, as of October 31, 2011, involving the Fund's assets and liabilities carried at fair value. The inputs or methodology used for valuing securities may not be an indication of the risk associated with investing in those securities. For more information on valuation inputs, and their aggregation into the levels used in the table below, please refer to the Security Valuation section in the accompanying Notes to Financial Statements. |
Valuation Inputs at Reporting Date: |
Description | Total | Level 1 | Level 2 | Level 3 |
Investments in Securities: | | | | |
Equities: | | | | |
Consumer Discretionary | $ 3,250,124 | $ 3,085,632 | $ 164,492 | $ - |
Consumer Staples | 3,430,575 | 3,430,575 | - | - |
Energy | 3,328,159 | 3,328,159 | - | - |
Financials | 6,671,269 | 6,019,183 | 652,086 | - |
Health Care | 4,315,780 | 4,315,780 | - | - |
Industrials | 1,620,833 | 1,620,833 | - | - |
Information Technology | 3,205,257 | 3,205,257 | - | - |
Materials | 907,192 | 907,192 | - | - |
Telecommunication Services | 132,049 | 132,049 | - | - |
Utilities | 827,751 | 827,751 | - | - |
Money Market Funds | 4,689,917 | 4,689,917 | - | - |
Total Investments in Securities: | $ 32,378,906 | $ 31,562,328 | $ 816,578 | $ - |
Distribution of investments by country of issue, as a percentage of total net assets, is as follows: (Unaudited) |
United States of America | 75.4% |
Switzerland | 8.9% |
France | 5.7% |
Mexico | 5.0% |
Japan | 2.8% |
Ireland | 1.1% |
Others (Individually Less Than 1%) | 1.1% |
| 100.0% |
Income Tax Information |
At October 31, 2011, the Fund had a capital loss carryforward of approximately $34,183,216 of which $19,194,347, $14,819,668 and $169,201 will expire in fiscal 2016, 2017 and 2019, respectively. Capital loss carryforwards are only available to offset future capital gains of the Fund to the extent provided by regulations and may be limited. |
See accompanying notes which are an integral part of the financial statements.
Annual Report
Statement of Assets and Liabilities
| October 31, 2011 |
| | |
Assets | | |
Investment in securities, at value (including securities loaned of $3,144,683) - See accompanying schedule: Unaffiliated issuers (cost $30,821,769) | $ 27,688,989 | |
Fidelity Central Funds (cost $4,689,917) | 4,689,917 | |
Total Investments (cost $35,511,686) | | $ 32,378,906 |
Receivable for investments sold | | 576,276 |
Receivable for fund shares sold | | 8,850 |
Dividends receivable | | 23,755 |
Distributions receivable from Fidelity Central Funds | | 2,695 |
Prepaid expenses | | 93 |
Other receivables | | 2,526 |
Total assets | | 32,993,101 |
| | |
Liabilities | | |
Payable to custodian bank | $ 33,843 | |
Payable for investments purchased | 353,119 | |
Payable for fund shares redeemed | 36,147 | |
Accrued management fee | 7,561 | |
Distribution and service plan fees payable | 10,491 | |
Other affiliated payables | 8,226 | |
Other payables and accrued expenses | 43,426 | |
Collateral on securities loaned, at value | 3,353,649 | |
Total liabilities | | 3,846,462 |
| | |
Net Assets | | $ 29,146,639 |
Net Assets consist of: | | |
Paid in capital | | $ 67,015,415 |
Undistributed net investment income | | 188,125 |
Accumulated undistributed net realized gain (loss) on investments and foreign currency transactions | | (34,924,325) |
Net unrealized appreciation (depreciation) on investments and assets and liabilities in foreign currencies | | (3,132,576) |
Net Assets | | $ 29,146,639 |
See accompanying notes which are an integral part of the financial statements.
Annual Report
Financial Statements - continued
Statement of Assets and Liabilities - continued
| October 31, 2011 |
| | |
Calculation of Maximum Offering Price Class A:
Net Asset Value and redemption price per share ($15,483,920 ÷ 1,555,207 shares) | | $ 9.96 |
| | |
Maximum offering price per share (100/94.25 of $9.96) | | $ 10.57 |
Class T:
Net Asset Value and redemption price per share ($8,253,986 ÷ 828,804 shares) | | $ 9.96 |
| | |
Maximum offering price per share (100/96.50 of $9.96) | | $ 10.32 |
Class B:
Net Asset Value and offering price per share ($1,110,133 ÷ 112,827 shares)A | | $ 9.84 |
| | |
Class C:
Net Asset Value and offering price per share ($3,775,217 ÷ 387,126 shares)A | | $ 9.75 |
| | |
Institutional Class:
Net Asset Value, offering price and redemption price per share ($523,383 ÷ 52,149 shares) | | $ 10.04 |
A Redemption price per share is equal to net asset value less any applicable contingent deferred sales charge.
See accompanying notes which are an integral part of the financial statements.
Annual Report
Statement of Operations
| Year ended October 31, 2011 |
| | |
Investment Income | | |
Dividends | | $ 794,507 |
Income from Fidelity Central Funds | | 40,711 |
Total income | | 835,218 |
| | |
Expenses | | |
Management fee
Basic fee | $ 217,492 | |
Performance adjustment | (115,773) | |
Transfer agent fees | 117,048 | |
Distribution and service plan fees | 164,455 | |
Accounting and security lending fees | 15,700 | |
Custodian fees and expenses | 40,526 | |
Independent trustees' compensation | 223 | |
Registration fees | 60,933 | |
Audit | 49,062 | |
Legal | 298 | |
Miscellaneous | 498 | |
Total expenses before reductions | 550,462 | |
Expense reductions | (5,676) | 544,786 |
Net investment income (loss) | | 290,432 |
Realized and Unrealized Gain (Loss) Net realized gain (loss) on: | | |
Investment securities: | | |
Unaffiliated issuers | 726,208 | |
Foreign currency transactions | (6,005) | |
Total net realized gain (loss) | | 720,203 |
Change in net unrealized appreciation (depreciation) on: Investment securities | (343,367) | |
Assets and liabilities in foreign currencies | (19) | |
Total change in net unrealized appreciation (depreciation) | | (343,386) |
Net gain (loss) | | 376,817 |
Net increase (decrease) in net assets resulting from operations | | $ 667,249 |
See accompanying notes which are an integral part of the financial statements.
Annual Report
Financial Statements - continued
Statement of Changes in Net Assets
| Year ended
October 31,
2011 | Year ended
October 31,
2010 |
Increase (Decrease) in Net Assets | | |
Operations | | |
Net investment income (loss) | $ 290,432 | $ 331,551 |
Net realized gain (loss) | 720,203 | 3,334,586 |
Change in net unrealized appreciation (depreciation) | (343,386) | 1,707,613 |
Net increase (decrease) in net assets resulting
from operations | 667,249 | 5,373,750 |
Distributions to shareholders from net investment income | (358,603) | (478,174) |
Distributions to shareholders from net realized gain | (41,497) | (30,375) |
Total distributions | (400,100) | (508,549) |
Share transactions - net increase (decrease) | (15,871,835) | (17,770,134) |
Total increase (decrease) in net assets | (15,604,686) | (12,904,933) |
| | |
Net Assets | | |
Beginning of period | 44,751,325 | 57,656,258 |
End of period (including undistributed net investment income of $188,125 and undistributed net investment income of $270,130, respectively) | $ 29,146,639 | $ 44,751,325 |
See accompanying notes which are an integral part of the financial statements.
Annual Report
Financial Highlights - Class A
Years ended October 31, | 2011 | 2010 | 2009 | 2008 | 2007 |
Selected Per-Share Data | | | | | |
Net asset value, beginning of period | $ 10.12 | $ 9.30 | $ 8.63 | $ 16.40 | $ 15.08 |
Income from Investment Operations | | | | | |
Net investment income (loss) C | .10 | .07 F | .09 | .16 | .13 |
Net realized and unrealized gain (loss) | (.14) G | .85 | .75 | (7.09) | 1.99 |
Total from investment operations | (.04) | .92 | .84 | (6.93) | 2.12 |
Distributions from net investment income | (.11) | (.09) | (.17) | (.12) | (.09) |
Distributions from net realized gain | (.01) | (.01) | - | (.72) | (.71) |
Total distributions | (.12) | (.10) | (.17) | (.84) I | (.80) |
Net asset value, end of period | $ 9.96 | $ 10.12 | $ 9.30 | $ 8.63 | $ 16.40 |
Total Return A, B | (.40)% | 9.91% | 10.13% | (44.43)% | 14.64% |
Ratios to Average Net Assets D, H | | | | | |
Expenses before reductions | 1.24% | 1.22% | 1.25% | 1.26% | 1.28% |
Expenses net of fee waivers, if any | 1.24% | 1.22% | 1.25% | 1.25% | 1.25% |
Expenses net of all reductions | 1.23% | 1.21% | 1.25% | 1.25% | 1.24% |
Net investment income (loss) | .91% | .75% F | 1.10% | 1.21% | .85% |
Supplemental Data | | | | | |
Net assets, end of period (000 omitted) | $ 15,484 | $ 25,431 | $ 28,585 | $ 34,864 | $ 67,434 |
Portfolio turnover rate E | 161% | 51% | 56% | 74% | 76% |
A Total returns would have been lower if certain expenses had not been reduced during the applicable periods shown.
B Total returns do not include the effect of the sales charges.
C Calculated based on average shares outstanding during the period.
D Fees and expenses of any underlying Fidelity Central Funds are not included in the Fund's expense ratio. The Fund indirectly bears its proportionate share of the expenses of any underlying Fidelity Central Funds.
E Amount does not include the portfolio activity of any underlying Fidelity Central Funds.
F Investment income per share reflects a special dividend which amounted to $.02 per share. Excluding the special dividend, the ratio of net investment income (loss) to average net assets would have been .57%.
G The amount shown for a share outstanding does not correspond with the aggregate net gain (loss) on investments for the period due to the timing of sales and repurchases of shares in relation to fluctuating market values of the investments of the Fund.
H Expense ratios reflect operating expenses of the class. Expenses before reductions do not reflect amounts reimbursed by the investment adviser or reductions from brokerage service arrangements or reductions from other expense offset arrangements and do not represent the amount paid by the class during periods when reimbursements or reductions occur. Expenses net of fee waivers reflect expenses after reimbursement by the investment adviser but prior to reductions from brokerage service arrangements or other expense offset arrangements. Expenses net of all reductions represent the net expenses paid by the class.
I Total distributions of $.839 per share is comprised of distributions from net investment income of $.117 and distributions from net realized gain of $.722 per share.
See accompanying notes which are an integral part of the financial statements.
Annual Report
Financial Highlights - Class T
Years ended October 31, | 2011 | 2010 | 2009 | 2008 | 2007 |
Selected Per-Share Data | | | | | |
Net asset value, beginning of period | $ 10.08 | $ 9.27 | $ 8.58 | $ 16.30 | $ 14.99 |
Income from Investment Operations | | | | | |
Net investment income (loss) C | .07 | .05 F | .07 | .13 | .09 |
Net realized and unrealized gain (loss) | (.13) G | .84 | .75 | (7.06) | 1.97 |
Total from investment operations | (.06) | .89 | .82 | (6.93) | 2.06 |
Distributions from net investment income | (.05) | (.07) | (.13) | (.07) | (.04) |
Distributions from net realized gain | (.01) | (.01) | - | (.72) | (.71) |
Total distributions | (.06) | (.08) | (.13) | (.79) I | (.75) |
Net asset value, end of period | $ 9.96 | $ 10.08 | $ 9.27 | $ 8.58 | $ 16.30 |
Total Return A, B | (.64)% | 9.62% | 9.90% | (44.57)% | 14.31% |
Ratios to Average Net Assets D, H | | | | | |
Expenses before reductions | 1.49% | 1.45% | 1.50% | 1.49% | 1.53% |
Expenses net of fee waivers, if any | 1.49% | 1.45% | 1.50% | 1.49% | 1.50% |
Expenses net of all reductions | 1.48% | 1.45% | 1.49% | 1.49% | 1.49% |
Net investment income (loss) | .67% | .52% F | .85% | .97% | .60% |
Supplemental Data | | | | | |
Net assets, end of period (000 omitted) | $ 8,254 | $ 12,735 | $ 20,652 | $ 22,720 | $ 50,998 |
Portfolio turnover rate E | 161% | 51% | 56% | 74% | 76% |
A Total returns would have been lower if certain expenses had not been reduced during the applicable periods shown.
B Total returns do not include the effect of the sales charges.
C Calculated based on average shares outstanding during the period.
D Fees and expenses of any underlying Fidelity Central Funds are not included in the Fund's expense ratio. The Fund indirectly bears its proportionate share of the expenses of any underlying Fidelity Central Funds.
E Amount does not include the portfolio activity of any underlying Fidelity Central Funds.
F Investment income per share reflects a special dividend which amounted to $.02 per share. Excluding the special dividend, the ratio of net investment income (loss) to average net assets would have been .33%.
G The amount shown for a share outstanding does not correspond with the aggregate net gain (loss) on investments for the period due to the timing of sales and repurchases of shares in relation to fluctuating market values of the investments of the Fund.
H Expense ratios reflect operating expenses of the class. Expenses before reductions do not reflect amounts reimbursed by the investment adviser or reductions from brokerage service arrangements or reductions from other expense offset arrangements and do not represent the amount paid by the class during periods when reimbursements or reductions occur. Expenses net of fee waivers reflect expenses after reimbursement by the investment adviser but prior to reductions from brokerage service arrangements or other expense offset arrangements. Expenses net of all reductions represent the net expenses paid by the class.
I Total distributions of $.790 per share is comprised of distributions from net investment income of $.068 and distributions from net realized gain of $.722 per share.
See accompanying notes which are an integral part of the financial statements.
Annual Report
Financial Highlights - Class B
Years ended October 31, | 2011 | 2010 | 2009 | 2008 | 2007 |
Selected Per-Share Data | | | | | |
Net asset value, beginning of period | $ 9.99 | $ 9.18 | $ 8.47 | $ 16.07 | $ 14.81 |
Income from Investment Operations | | | | | |
Net investment income (loss) C | .02 | - F, I | .03 | .06 | .01 |
Net realized and unrealized gain (loss) | (.13) G | .84 | .74 | (6.96) | 1.95 |
Total from investment operations | (.11) | .84 | .77 | (6.90) | 1.96 |
Distributions from net investment income | (.03) | (.02) | (.06) | - | - |
Distributions from net realized gain | (.01) | (.01) | - | (.70) | (.70) |
Total distributions | (.04) | (.03) | (.06) | (.70) J | (.70) |
Net asset value, end of period | $ 9.84 | $ 9.99 | $ 9.18 | $ 8.47 | $ 16.07 |
Total Return A, B | (1.14)% | 9.11% | 9.19% | (44.80)% | 13.74% |
Ratios to Average Net Assets D, H | | | | | |
Expenses before reductions | 1.99% | 1.97% | 2.00% | 2.03% | 2.10% |
Expenses net of fee waivers, if any | 1.99% | 1.97% | 2.00% | 2.00% | 2.00% |
Expenses net of all reductions | 1.98% | 1.97% | 2.00% | 2.00% | 1.99% |
Net investment income (loss) | .16% | (.01)% F | .35% | .45% | .10% |
Supplemental Data | | | | | |
Net assets, end of period (000 omitted) | $ 1,110 | $ 1,605 | $ 1,989 | $ 2,615 | $ 6,734 |
Portfolio turnover rate E | 161% | 51% | 56% | 74% | 76% |
A Total returns would have been lower if certain expenses had not been reduced during the applicable periods shown.
B Total returns do not include the effect of the contingent deferred sales charge.
C Calculated based on average shares outstanding during the period.
D Fees and expenses of any underlying Fidelity Central Funds are not included in the Fund's expense ratio. The Fund indirectly bears its proportionate share of the expenses of any underlying Fidelity Central Funds.
E Amount does not include the portfolio activity of any underlying Fidelity Central Funds.
F Investment income per share reflects a special dividend which amounted to $.02 per share. Excluding the special dividend, the ratio of net investment income (loss) to average net assets would have been (.19)%.
G The amount shown for a share outstanding does not correspond with the aggregate net gain (loss) on investments for the period due to the timing of sales and repurchases of shares in relation to fluctuating market values of the investments of the Fund.
H Expense ratios reflect operating expenses of the class. Expenses before reductions do not reflect amounts reimbursed by the investment adviser or reductions from brokerage service arrangements or reductions from other expense offset arrangements and do not represent the amount paid by the class during periods when reimbursements or reductions occur. Expenses net of fee waivers reflect expenses after reimbursement by the investment adviser but prior to reductions from brokerage service arrangements or other expense offset arrangements. Expenses net of all reductions represent the net expenses paid by the class.
I Amount represents less than $.01 per share.
J Total distributions of $.698 per share is comprised of distributions from net investment income of $.000 and distributions from net realized gain of $.698 per share.
See accompanying notes which are an integral part of the financial statements.
Annual Report
Financial Highlights - Class C
Years ended October 31, | 2011 | 2010 | 2009 | 2008 | 2007 |
Selected Per-Share Data | | | | | |
Net asset value, beginning of period | $ 9.92 | $ 9.11 | $ 8.44 | $ 16.04 | $ 14.80 |
Income from Investment Operations | | | | | |
Net investment income (loss) C | .02 | - G, J | .03 | .06 | .02 |
Net realized and unrealized gain (loss) | (.13) H | .83 | .73 | (6.95) | 1.93 |
Total from investment operations | (.11) | .83 | .76 | (6.89) | 1.95 |
Distributions from net investment income | (.05) | (.02) | (.09) | - | - |
Distributions from net realized gain | (.01) | (.01) | - | (.71) | (.71) |
Total distributions | (.06) | (.02) L | (.09) | (.71) K | (.71) |
Net asset value, end of period | $ 9.75 | $ 9.92 | $ 9.11 | $ 8.44 | $ 16.04 |
Total Return A, B | (1.18)% | 9.12% | 9.28% | (44.84)% | 13.69% |
Ratios to Average Net Assets D, I | | | | | |
Expenses before reductions | 2.00% | 1.97% | 2.01% | 2.03% | 2.09% |
Expenses net of fee waivers, if any | 2.00% | 1.97% | 2.00% | 2.00% | 2.00% |
Expenses net of all reductions | 1.98% | 1.97% | 2.00% | 2.00% | 1.99% |
Net investment income (loss) | .16% | -% F, G | .35% | .45% | .10% |
Supplemental Data | | | | | |
Net assets, end of period (000 omitted) | $ 3,775 | $ 4,139 | $ 4,088 | $ 5,358 | $ 9,718 |
Portfolio turnover rate E | 161% | 51% | 56% | 74% | 76% |
A Total returns would have been lower if certain expenses had not been reduced during the applicable periods shown.
B Total returns do not include the effect of the contingent deferred sales charge.
C Calculated based on average shares outstanding during the period.
D Fees and expenses of any underlying Fidelity Central Funds are not included in the Fund's expense ratio. The Fund indirectly bears its proportionate share of the expenses of any underlying Fidelity Central Funds.
E Amount does not include the portfolio activity of any underlying Fidelity Central Funds.
F Amount represents less than .01%.
G Investment income per share reflects a special dividend which amounted to $.02 per share. Excluding the special dividend, the ratio of net investment income (loss) to average net assets would have been (.19)%.
H The amount shown for a share outstanding does not correspond with the aggregate net gain (loss) on investments for the period due to the timing of sales and repurchases of shares in relation to fluctuating market values of the investments of the Fund.
I Expense ratios reflect operating expenses of the class. Expenses before reductions do not reflect amounts reimbursed by the investment adviser or reductions from brokerage service arrangements or reductions from other expense offset arrangements and do not represent the amount paid by the class during periods when reimbursements or reductions occur. Expenses net of fee waivers reflect expenses after reimbursement by the investment adviser but prior to reductions from brokerage service arrangements or other expense offset arrangements. Expenses net of all reductions represent the net expenses paid by the class.
J Amount represents less than $.01 per share.
K Total distributions of $.712 per share is comprised of distributions from net investment income of $.000 and distributions from net realized gain of $.712 per share.
L Total distributions of $.02 per share is comprised of distributions from net investment income of $.015 and distributions from net realized gain of $.005 per share.
See accompanying notes which are an integral part of the financial statements.
Annual Report
Financial Highlights - Institutional Class
Years ended October 31, | 2011 | 2010 | 2009 | 2008 | 2007 |
Selected Per-Share Data | | | | | |
Net asset value, beginning of period | $ 10.19 | $ 9.35 | $ 8.70 | $ 16.51 | $ 15.17 |
Income from Investment Operations | | | | | |
Net investment income (loss) B | .14 | .10 E | .11 | .20 | .17 |
Net realized and unrealized gain (loss) | (.15) F | .86 | .74 | (7.13) | 1.99 |
Total from investment operations | (.01) | .96 | .85 | (6.93) | 2.16 |
Distributions from net investment income | (.13) | (.11) | (.20) | (.15) | (.11) |
Distributions from net realized gain | (.01) | (.01) | - | (.72) | (.71) |
Total distributions | (.14) | (.12) | (.20) | (.88) H | (.82) |
Net asset value, end of period | $ 10.04 | $ 10.19 | $ 9.35 | $ 8.70 | $ 16.51 |
Total Return A | (.11)% | 10.28% | 10.26% | (44.24)% | 14.89% |
Ratios to Average Net Assets C, G | | | | | |
Expenses before reductions | .89% | .98% | 1.00% | .98% | 1.00% |
Expenses net of fee waivers, if any | .89% | .98% | 1.00% | .98% | 1.00% |
Expenses net of all reductions | .88% | .97% | 1.00% | .97% | .99% |
Net investment income (loss) | 1.27% | .99% E | 1.35% | 1.48% | 1.10% |
Supplemental Data | | | | | |
Net assets, end of period (000 omitted) | $ 523 | $ 841 | $ 2,341 | $ 2,021 | $ 6,833 |
Portfolio turnover rate D | 161% | 51% | 56% | 74% | 76% |
A Total returns would have been lower if certain expenses had not been reduced during the applicable periods shown.
B Calculated based on average shares outstanding during the period.
C Fees and expenses of any underlying Fidelity Central Funds are not included in the Fund's expense ratio. The Fund indirectly bears its proportionate share of the expenses of any underlying Fidelity Central Funds.
D Amount does not include the portfolio activity of any underlying Fidelity Central Funds.
E Investment income per share reflects a special dividend which amounted to $.02 per share. Excluding the special dividend, the ratio of net investment income (loss) to average net assets would have been .81%.
F The amount shown for a share outstanding does not correspond with the aggregate net gain (loss) on investments for the period due to the timing of sales and repurchases of shares in relation to fluctuating market values of the investments of the Fund.
G Expense ratios reflect operating expenses of the class. Expenses before reductions do not reflect amounts reimbursed by the investment adviser or reductions from brokerage service arrangements or reductions from other expense offset arrangements and do not represent the amount paid by the class during periods when reimbursements or reductions occur. Expenses net of fee waivers reflect expenses after reimbursement by the investment adviser but prior to reductions from brokerage service arrangements or other expense offset arrangements. Expenses net of all reductions represent the net expenses paid by the class.
H Total distributions of $.876 per share is comprised of distributions from net investment income of $.154 and distributions from net realized gain of $.722 per share.
See accompanying notes which are an integral part of the financial statements.
Annual Report
Notes to Financial Statements
For the period ended October 31, 2011
1. Organization.
Fidelity Advisor Value Leaders Fund (the Fund) is a fund of Fidelity Advisor Series VIII (the Trust) and is authorized to issue an unlimited number of shares. The Trust is registered under the Investment Company Act of 1940, as amended (the 1940 Act), as an open-end management investment company organized as a Massachusetts business trust. The Fund offers Class A, Class T, Class C, and Institutional Class shares, each of which, along with Class B shares, has equal rights as to assets and voting privileges. Effective after the close of business on September 1, 2010, Class B shares were closed to new accounts and additional purchases, except for exchanges and reinvestments by existing shareholders. Each class has exclusive voting rights with respect to matters that affect that class. Class B shares will automatically convert to Class A shares after a holding period of seven years from the initial date of purchase. Investment income, realized and unrealized capital gains and losses, the common expenses of the Fund, and certain fund-level expense reductions, if any, are allocated on a pro-rata basis to each class based on the relative net assets of each class to the total net assets of the Fund. Each class differs with respect to transfer agent and distribution and service plan fees incurred. Certain expense reductions may also differ by class.
2. Investments in Fidelity Central Funds.
The Fund invests in Fidelity Central Funds, which are open-end investment companies available only to other investment companies and accounts managed by Fidelity Management & Research Company (FMR) and its affiliates. The Fund's Schedule of Investments lists each of the Fidelity Central Funds held as of period end, if any, as an investment of the Fund, but does not include the underlying holdings of each Fidelity Central Fund. As an Investing Fund, the Fund indirectly bears its proportionate share of the expenses of the underlying Fidelity Central Funds.
The Money Market Central Funds seek preservation of capital and current income and are managed by Fidelity Investments Money Management, Inc. (FIMM), an affiliate of FMR.
A complete unaudited list of holdings for each Fidelity Central Fund is available upon request or at the Securities and Exchange Commission (the SEC) web site at www.sec.gov. In addition, the financial statements of the Fidelity Central Funds, which are not covered by the Fund's Report of Independent Registered Public Accounting Firm are available on the SEC web site or upon request.
3. Significant Accounting Policies.
The financial statements have been prepared in conformity with accounting principles generally accepted in the United States of America (GAAP), which require management to make certain estimates and assumptions at the date of the financial statements.
Annual Report
Notes to Financial Statements - continued
3. Significant Accounting Policies - continued
Actual results could differ from those estimates. Subsequent events, if any, through the date that the financial statements were issued have been evaluated in the preparation of the financial statements. The following summarizes the significant accounting policies of the Fund:
Security Valuation. Investments are valued as of 4:00 p.m. Eastern time on the last calendar day of the period. The Fund uses independent pricing services approved by the Board of Trustees to value its investments. When current market prices or quotations are not readily available or reliable, valuations may be determined in good faith in accordance with procedures adopted by the Board of Trustees. Factors used in determining value may include market or security specific events. The frequency with which these procedures are used cannot be predicted and they may be utilized to a significant extent. The value used for net asset value (NAV) calculation under these procedures may differ from published prices for the same securities.
The Fund categorizes the inputs to valuation techniques used to value its investments into a disclosure hierarchy consisting of three levels as shown below:
Level 1 - quoted prices in active markets for identical investments
Level 2 - other significant observable inputs (including quoted prices for similar investments, interest rates, prepayment speeds, etc.)
Level 3 - unobservable inputs (including the Fund's own assumptions based on the best information available)
Changes in valuation techniques may result in transfers in or out of an assigned level within the disclosure hierarchy. The aggregate value of investments by input level, as of October 31, 2011, is included at the end of the Fund's Schedule of Investments. Valuation techniques used to value the Fund's investments by major category are as follows:
Equity securities, including restricted securities, for which market quotations are readily available, are valued at the last reported sale price or official closing price as reported by an independent pricing service on the primary market or exchange on which they are traded and are categorized as Level 1 in the hierarchy. In the event there were no sales during the day or closing prices are not available, securities are valued at the last quoted bid price or may be valued using the last available price and are generally categorized as Level 2 in the hierarchy. For foreign equity securities, when significant market or security specific events arise, comparisons to the valuation of American Depositary Receipts (ADRs), futures contracts, Exchange-traded funds (ETFs) and certain indexes as well as quoted prices for similar securities are used and are categorized as Level 2 in the hierarchy in these circumstances. Utilizing these techniques may result in transfers between Level 1 and Level 2. For restricted equity securities and private placements where
Annual Report
3. Significant Accounting Policies - continued
Security Valuation - continued
observable inputs are limited, assumptions about market activity and risk are used and are categorized as Level 3 in the hierarchy.
Investments in open-end mutual funds, including the Fidelity Central Funds, are valued at their closing net asset value each business day and are categorized as Level 1 in the hierarchy.
Foreign Currency. The Fund may use foreign currency contracts to facilitate transactions in foreign-denominated securities. Gains and losses from these transactions may arise from changes in the value of the foreign currency or if the counterparties do not perform under the contracts' terms.
Foreign-denominated assets, including investment securities, and liabilities are translated into U.S. dollars at the exchange rate at period end. Purchases and sales of investment securities, income and dividends received and expenses denominated in foreign currencies are translated into U.S. dollars at the exchange rate in effect on the transaction date.
The effects of exchange rate fluctuations on investments are included with the net realized and unrealized gain (loss) on investment securities. Other foreign currency transactions resulting in realized and unrealized gain (loss) are disclosed separately.
Investment Transactions and Income. For financial reporting purposes, the Fund's investment holdings and NAV include trades executed through the end of the last business day of the period. The NAV per share for processing shareholder transactions is calculated as of the close of business of the New York Stock Exchange (NYSE), normally 4:00 p.m. Eastern time and includes trades executed through the end of the prior business day. Gains and losses on securities sold are determined on the basis of identified cost and may include proceeds received from litigation. Dividend income is recorded on the ex-dividend date, except for certain dividends from foreign securities where the ex-dividend date may have passed, which are recorded as soon as the Fund is informed of the ex-dividend date. Non-cash dividends included in dividend income, if any, are recorded at the fair market value of the securities received. Distributions received on securities that represent a return of capital or capital gain are recorded as a reduction of cost of investments and/or as a realized gain. The Fund estimates the components of distributions received that may be considered return of capital distributions or capital gain distributions. Interest income and distributions from the Fidelity Central Funds are accrued as earned. Interest income includes coupon interest and amortization of premium and accretion of discount on debt securities. Investment income is recorded net of foreign taxes withheld where recovery of such taxes is uncertain.
Annual Report
Notes to Financial Statements - continued
3. Significant Accounting Policies - continued
Expenses. Expenses directly attributable to a fund are charged to that fund. Expenses attributable to more than one fund are allocated among the respective funds on the basis of relative net assets or other appropriate methods. Expense estimates are accrued in the period to which they relate and adjustments are made when actual amounts are known.
Income Tax Information and Distributions to Shareholders. Each year, the Fund intends to qualify as a regulated investment company, including distributing substantially all of its taxable income and realized gains under Subchapter M of the Internal Revenue Code and filing its U.S. federal tax return. As a result, no provision for income taxes is required. As of October 31, 2011, the Fund did not have any unrecognized tax benefits in the financial statements. A fund's federal tax return is subject to examination by the Internal Revenue Service (IRS) for a period of three years. Foreign taxes are provided for based on the Fund's understanding of the tax rules and rates that exist in the foreign markets in which it invests.
Distributions are declared and recorded on the ex-dividend date. Income dividends and capital gain distributions are declared separately for each class. Income and capital gain distributions are determined in accordance with income tax regulations, which may differ from GAAP.
Capital accounts within the financial statements are adjusted for permanent book-tax differences. These adjustments have no impact on net assets or the results of operations. Temporary book-tax differences will reverse in a subsequent period.
Book-tax differences are primarily due to foreign currency transactions, partnerships, capital loss carryforwards and losses deferred due to wash sales.
The federal tax cost of investment securities and unrealized appreciation (depreciation) as of period end were as follows:
Gross unrealized appreciation | $ 1,174,106 |
Gross unrealized depreciation | (5,053,448) |
Net unrealized appreciation (depreciation) on securities and other investments | $ (3,879,342) |
| |
Tax Cost | $ 36,258,248 |
The tax-based components of distributable earnings as of period end were as follows:
Undistributed ordinary income | $ 193,579 |
Capital loss carryforward | $ (34,183,216) |
Net unrealized appreciation (depreciation) | $ (3,879,138) |
Annual Report
3. Significant Accounting Policies - continued
Income Tax Information and Distributions to Shareholders - continued
Under the recently enacted Regulated Investment Company Modernization Act of 2010 (the Act), the Fund will be permitted to carry forward capital losses incurred in taxable years beginning after December 22, 2010 for an unlimited period. However, any losses incurred during those future taxable years will be required to be utilized prior to any losses incurred in pre-enactment taxable years, which generally expire after eight years from when they are incurred. Additionally, post-enactment capital losses that are carried forward will retain their character as either short-term or long-term capital losses rather than being considered all short-term as under previous law. The Fund's first fiscal year end subject to the Act will be October 31, 2012.
The tax character of distributions paid was as follows:
| October 31, 2011 | October 31, 2010 |
Ordinary Income | $ 400,100 | $ 508,549 |
New Accounting Pronouncement. In May 2011, the Financial Accounting Standards Board issued Accounting Standard Update No. 2011-04, Fair Value Measurement (Topic 820) - Amendments to Achieve Common Fair Value Measurement and Disclosure Requirements in U.S. GAAP and IFRSs. The update changes the wording used to describe the requirements in GAAP for measuring fair value and for disclosing information about fair value measurements. The update is effective during interim and annual periods beginning after December 15, 2011. Management is currently evaluating the impact of the update's adoption on the Fund's financial statement disclosures.
4. Purchases and Sales of Investments.
Purchases and sales of securities, other than short-term securities, aggregated $62,096,856 and $79,559,621, respectively.
5. Fees and Other Transactions with Affiliates.
Management Fee. FMR and its affiliates provide the Fund with investment management related services for which the Fund pays a monthly management fee. The management fee is the sum of an individual fund fee rate that is based on an annual rate of .30% of the Fund's average net assets and a group fee rate that averaged .26% during the period. The group fee rate is based upon the average net assets of all the mutual funds advised by FMR. The group fee rate decreases as assets under management increase and increases as assets under management decrease. In addition, the management fee is subject to a performance adjustment (up to a maximum of ± .20% of the Fund's average net assets over a 36 month performance period). The upward or downward adjustment to
Annual Report
Notes to Financial Statements - continued
5. Fees and Other Transactions with Affiliates - continued
Management Fee - continued
the management fee is based on the relative investment performance of the Institutional Class of the Fund as compared to an appropriate benchmark index. For the period, the total annual management fee rate, including the performance adjustment, was .26% of the Fund's average net assets.
Distribution and Service Plan Fees. In accordance with Rule 12b-1 of the 1940 Act, the Fund has adopted separate Distribution and Service Plans for each class of shares. Certain classes pay Fidelity Distributors Corporation (FDC), an affiliate of FMR, separate Distribution and Service Fees, each of which is based on an annual percentage of each class' average net assets. In addition, FDC may pay financial intermediaries for selling shares of the Fund and providing shareholder support services. For the period, the Distribution and Service Fee rates, total fees and amounts retained by FDC were as follows:
| Distribution
Fee | Service
Fee | Total Fees | Retained
by FDC |
Class A | -% | .25% | $ 55,528 | $ 469 |
Class T | .25% | .25% | 51,912 | 169 |
Class B | .75% | .25% | 14,139 | 10,617 |
Class C | .75% | .25% | 42,876 | 4,588 |
| | | $ 164,455 | $ 15,843 |
Sales Load. FDC may receive a front-end sales charge of up to 5.75% for selling Class A shares, and 3.50% for selling Class T shares, some of which is paid to financial intermediaries for selling shares of the Fund. Depending on the holding period, FDC may receive contingent deferred sales charges levied on Class A, Class T, Class B, and Class C redemptions. The deferred sales charges range from 5% to 1% for Class B, 1% for Class C, 1.00% for certain purchases of Class A shares and .25% for certain purchases of Class T shares.
For the period, sales charge amounts retained by FDC were as follows:
| Retained
by FDC |
Class A | $ 2,650 |
Class T | 1,933 |
Class B* | 2,785 |
Class C* | 320 |
| $ 7,688 |
* When Class B and Class C shares are initially sold, FDC pays commissions from its own resources to financial intermediaries through which the sales are made.
Annual Report
5. Fees and Other Transactions with Affiliates - continued
Transfer Agent Fees. Fidelity Investments Institutional Operations Company, Inc. (FIIOC), an affiliate of FMR, is the transfer, dividend disbursing and shareholder servicing agent for each class of the Fund. FIIOC receives account fees and asset-based fees that vary according to the account size and type of account of the shareholders of the respective classes of the Fund. FIIOC pays for typesetting, printing and mailing of shareholder reports, except proxy statements. For the period, transfer agent fees for each class were as follows:
| Amount | % of
Average
Net Assets |
Class A | $ 67,075 | .30 |
Class T | 31,177 | .30 |
Class B | 4,266 | .30 |
Class C | 13,029 | .30 |
Institutional Class | 1,501 | .20 |
| $ 117,048 | |
Accounting and Security Lending Fees. Fidelity Service Company, Inc. (FSC), an affiliate of FMR, maintains the Fund's accounting records. The accounting fee is based on the level of average net assets for the month. Under a separate contract, FSC administers the security lending program. The security lending fee is based on the number and duration of lending transactions.
Brokerage Commissions. The Fund placed a portion of its portfolio transactions with brokerage firms which are affiliates of the investment adviser. The commissions paid to these affiliated firms were $3,016 for the period.
6. Committed Line of Credit.
The Fund participates with other funds managed by FMR or an affiliate in a $4.0 billion credit facility (the "line of credit") to be utilized for temporary or emergency purposes to fund shareholder redemptions or for other short-term liquidity purposes. The Fund has agreed to pay commitment fees on its pro-rata portion of the line of credit, which amounted to $125 and is reflected in Miscellaneous expenses on the Statement of Operations. During the period, there were no borrowings on this line of credit.
7. Security Lending.
The Fund lends portfolio securities through a lending agent from time to time in order to earn additional income. For equity securities, a lending agent is used and may loan securities to certain qualified borrowers, including Fidelity Capital Markets (FCM), a broker-dealer affiliated with the Fund. On the settlement date of the loan, the Fund
Annual Report
Notes to Financial Statements - continued
7. Security Lending - continued
receives collateral (in the form of U.S. Treasury obligations, letters of credit and/or cash) against the loaned securities and maintains collateral in an amount not less than 100% of the market value of the loaned securities during the period of the loan. The market value of the loaned securities is determined at the close of business of the Fund and any additional required collateral is delivered to the Fund on the next business day. If the borrower defaults on its obligation to return the securities loaned because of insolvency or other reasons, a fund could experience delays and costs in recovering the securities loaned or in gaining access to the collateral. Any cash collateral received is invested in the Fidelity Securities Lending Cash Central Fund. The value of loaned securities and cash collateral at period end are disclosed on the Fund's Statement of Assets and Liabilities. Security lending income represents the income earned on investing cash collateral, less rebates paid to borrowers and any lending agent fees associated with the loan, plus any premium payments received for lending certain types of securities. Security lending income is presented in the Statement of Operations as a component of income from Fidelity Central Funds. Total security lending income during the period amounted to $39,854. During the period, there were no securities loaned to FCM.
8. Expense Reductions.
Many of the brokers with whom FMR places trades on behalf of the Fund provided services to the Fund in addition to trade execution. These services included payments of certain expenses on behalf of the Fund totaling $5,676 for the period.
9. Distributions to Shareholders.
Distributions to shareholders of each class were as follows:
Years ended October 31, | 2011 | 2010 |
From net investment income | | |
Class A | $ 274,577 | $ 284,681 |
Class T | 50,441 | 160,619 |
Class B | 4,151 | 4,372 |
Class C | 18,471 | 6,593 |
Institutional Class | 10,963 | 21,909 |
Total | $ 358,603 | $ 478,174 |
From net realized gain | | |
Class A | $ 24,299 | $ 15,305 |
Class T | 10,732 | 10,853 |
Class B | 1,537 | 1,041 |
Class C | 4,105 | 2,198 |
Institutional Class | 824 | 978 |
Total | $ 41,497 | $ 30,375 |
Annual Report
10. Share Transactions.
Transactions for each class of shares were as follows:
| Shares | Dollars |
Years ended October 31, | 2011 | 2010 | 2011 | 2010 |
Class A | | | | |
Shares sold | 334,576 | 402,871 | $ 3,612,152 | $ 4,034,369 |
Reinvestment of distributions | 28,074 | 29,667 | 288,043 | 290,443 |
Shares redeemed | (1,320,166) | (994,975) | (14,109,969) | (9,899,783) |
Net increase (decrease) | (957,516) | (562,437) | $ (10,209,774) | $ (5,574,971) |
Class T | | | | |
Shares sold | 157,819 | 129,419 | $ 1,706,564 | $ 1,299,211 |
Reinvestment of distributions | 5,816 | 17,388 | 59,851 | 169,877 |
Shares redeemed | (597,712) | (1,112,927) | (6,300,709) | (11,167,229) |
Net increase (decrease) | (434,077) | (966,120) | $ (4,534,294) | $ (9,698,141) |
Class B | | | | |
Shares sold | 248 | 21,226 | $ 2,692 | $ 215,795 |
Reinvestment of distributions | 507 | 524 | 5,175 | 5,094 |
Shares redeemed | (48,512) | (77,825) | (509,116) | (763,138) |
Net increase (decrease) | (47,757) | (56,075) | $ (501,249) | $ (542,249) |
Class C | | | | |
Shares sold | 69,631 | 78,869 | $ 733,867 | $ 774,653 |
Reinvestment of distributions | 2,055 | 834 | 20,799 | 8,059 |
Shares redeemed | (101,679) | (111,299) | (1,050,311) | (1,100,227) |
Net increase (decrease) | (29,993) | (31,596) | $ (295,645) | $ (317,515) |
Institutional Class | | | | |
Shares sold | 74,917 | 25,211 | $ 747,771 | $ 254,312 |
Reinvestment of distributions | 1,083 | 2,223 | 11,162 | 21,848 |
Shares redeemed | (106,405) | (195,256) | (1,089,806) | (1,913,418) |
Net increase (decrease) | (30,405) | (167,822) | $ (330,873) | $ (1,637,258) |
11. Other.
The Fund's organizational documents provide former and current trustees and officers with a limited indemnification against liabilities arising in connection with the performance of their duties to the Fund. In the normal course of business, the Fund may also enter into contracts that provide general indemnifications. The Fund's maximum exposure under these arrangements is unknown as this would be dependent on future claims that may be made against the Fund. The risk of material loss from such claims is considered remote.
Annual Report
To the Trustees of Fidelity Advisor Series VIII and the Shareholders of Fidelity Advisor Value Leaders Fund:
In our opinion, the accompanying statement of assets and liabilities, including the schedule of investments, and the related statements of operations and of changes in net assets and the financial highlights present fairly, in all material respects, the financial position of Fidelity Advisor Value Leaders Fund (a fund of Fidelity Advisor Series VIII) at October 31, 2011, the results of its operations for the year then ended, the changes in its net assets for each of the two years in the period then ended and the financial highlights for each of the five years in the period then ended, in conformity with accounting principles generally accepted in the United States of America. These financial statements and financial highlights (hereafter referred to as "financial statements") are the responsibility of the Fidelity Advisor Value Leaders Fund's management. Our responsibility is to express an opinion on these financial statements based on our audits. We conducted our audits of these financial statements in accordance with the standards of the Public Company Accounting Oversight Board (United States). Those standards require that we plan and perform the audit to obtain reasonable assurance about whether the financial statements are free of material misstatement. An audit includes examining, on a test basis, evidence supporting the amounts and disclosures in the financial statements, assessing the accounting principles used and significant estimates made by management, and evaluating the overall financial statement presentation. We believe that our audits, which included confirmation of securities at October 31, 2011 by correspondence with the custodian and brokers, provide a reasonable basis for our opinion.
/s/ PricewaterhouseCoopers LLP
PricewaterhouseCoopers LLP
Boston, Massachusetts
December 9, 2011
Annual Report
The Trustees, Members of the Advisory Board, and executive officers of the trust and fund, as applicable, are listed below. The Board of Trustees governs the fund and is responsible for protecting the interests of shareholders. The Trustees are experienced executives who meet periodically throughout the year to oversee the fund's activities, review contractual arrangements with companies that provide services to the fund, oversee management of the risks associated with such activities and contractual arrangements, and review the fund's performance. Except for James C. Curvey, each of the Trustees oversees 226 funds advised by FMR or an affiliate. Mr. Curvey oversees 429 funds advised by FMR or an affiliate.
The Trustees hold office without limit in time except that (a) any Trustee may resign; (b) any Trustee may be removed by written instrument, signed by at least two-thirds of the number of Trustees prior to such removal; (c) any Trustee who requests to be retired or who has become incapacitated by illness or injury may be retired by written instrument signed by a majority of the other Trustees; and (d) any Trustee may be removed at any special meeting of shareholders by a two-thirds vote of the outstanding voting securities of the trust. Each Trustee who is not an interested person (as defined in the 1940 Act) (Independent Trustee), shall retire not later than the last day of the calendar year in which his or her 75th birthday occurs. The Independent Trustees may waive this mandatory retirement age policy with respect to individual Trustees. The executive officers and Advisory Board Members hold office without limit in time, except that any officer and Advisory Board Member may resign or may be removed by a vote of a majority of the Trustees at any regular meeting or any special meeting of the Trustees. Except as indicated, each individual has held the office shown or other offices in the same company for the past five years.
Experience, Skills, Attributes, and Qualifications of the Fund's Trustees. The Governance and Nominating Committee has adopted a statement of policy that describes the experience, qualifications, attributes, and skills that are necessary and desirable for potential Independent Trustee candidates (Statement of Policy). The Board believes that each Trustee satisfied at the time he or she was initially elected or appointed a Trustee, and continues to satisfy, the standards contemplated by the Statement of Policy. The Governance and Nominating Committee also engages professional search firms to help identify potential Independent Trustee candidates who have the experience, qualifications, attributes, and skills consistent with the Statement of Policy. From time to time, additional criteria based on the composition and skills of the current Independent Trustees, as well as experience or skills that may be appropriate in light of future changes to board composition, business conditions, and regulatory or other developments, have also been considered by the professional search firms and the Governance and Nominating Committee. In addition, the Board takes into account the Trustees' commitment and participation in Board and committee meetings, as well as their leadership of standing and ad hoc committees throughout their tenure.
In determining that a particular Trustee was and continues to be qualified to serve as a Trustee, the Board has considered a variety of criteria, none of which, in isolation, was controlling. The Board believes that, collectively, the Trustees have balanced and diverse experience, qualifications, attributes, and skills, which allow the Board to operate effectively in governing the fund and protecting the interests of shareholders. Information about the specific experience, skills, attributes, and qualifications of each Trustee, which in each case led to the Board's conclusion that the Trustee should serve (or continue to serve) as a trustee of the fund, is provided below.
Annual Report
Board Structure and Oversight Function. James C. Curvey is an interested person (as defined in the 1940 Act) and currently serves as Acting Chairman. The Trustees have determined that an interested Chairman is appropriate and benefits shareholders because an interested Chairman has a personal and professional stake in the quality and continuity of services provided to the fund. Independent Trustees exercise their informed business judgment to appoint an individual of their choosing to serve as Chairman, regardless of whether the Trustee happens to be independent or a member of management. The Independent Trustees have determined that they can act independently and effectively without having an Independent Trustee serve as Chairman and that a key structural component for assuring that they are in a position to do so is for the Independent Trustees to constitute a substantial majority for the Board. The Independent Trustees also regularly meet in executive session. Ned C. Lautenbach serves as Chairman of the Independent Trustees and as such (i) acts as a liaison between the Independent Trustees and management with respect to matters important to the Independent Trustees and (ii) with management prepares agendas for Board meetings.
Fidelity funds are overseen by different Boards of Trustees. The fund's Board oversees Fidelity's equity and high income funds and another Board oversees Fidelity's investment-grade bond, money market, and asset allocation funds. The asset allocation funds may invest in Fidelity funds overseen by the fund's Board. The use of separate Boards, each with its own committee structure, allows the Trustees of each group of Fidelity funds to focus on the unique issues of the funds they oversee, including common research, investment, and operational issues. On occasion, the separate Boards establish joint committees to address issues of overlapping consequences for the Fidelity funds overseen by each Board.
The Trustees operate using a system of committees to facilitate the timely and efficient consideration of all matters of importance to the Trustees, the fund, and fund shareholders and to facilitate compliance with legal and regulatory requirements and oversight of the fund's activities and associated risks. The Board, acting through its committees, has charged FMR and its affiliates with (i) identifying events or circumstances the occurrence of which could have demonstrably adverse effects on the fund's business and/or reputation; (ii) implementing processes and controls to lessen the possibility that such events or circumstances occur or to mitigate the effects of such events or circumstances if they do occur; and (iii) creating and maintaining a system designed to evaluate continuously business and market conditions in order to facilitate the identification and implementation processes described in (i) and (ii) above. Because the day-to-day operations and activities of the fund are carried out by or through FMR, its affiliates and other service providers, the fund's exposure to risks is mitigated but not eliminated by the processes overseen by the Trustees. While each of the Board's committees has responsibility for overseeing different aspects of the fund's activities, oversight is exercised primarily through the Operations, Audit, and Compliance Committees. In addition, the Independent Trustees have worked with FMR to enhance the Board's oversight of investment and financial risks, legal and regulatory risks, technology risks, and operational risks, including the development of additional risk reporting to the Board. For example, a working group comprised of Independent Trustees and FMR has worked and continues to work to review the Fidelity funds' valuation-related activities, reporting and risk management. Appropriate personnel, including but not limited to the fund's Chief Compliance Officer (CCO), FMR's internal auditor, the independent accountants, the fund's Treasurer and portfolio management personnel, make periodic reports to the Board's committees, as appropriate, including an annual review of FMR's risk management program for the Fidelity funds. The responsibilities of each standing committee, including their oversight responsibilities, are described further under "Standing Committees of the Fund's Trustees."
Annual Report
Trustees and Officers - continued
The fund's Statement of Additional Information (SAI) includes more information about the Trustees. To request a free copy, call Fidelity at 1-877-208-0098.
Interested Trustees*:
Correspondence intended for each Trustee who is an interested person may be sent to Fidelity Investments, 82 Devonshire Street, Boston, Massachusetts 02109.
Name, Age; Principal Occupations and Other Relevant Experience+ |
James C. Curvey (76) |
| Year of Election or Appointment: 2007 Mr. Curvey is Trustee and Acting Chairman of the Board of Trustees of certain Trusts. Mr. Curvey also serves as Trustee (2007-present) of other investment companies advised by FMR. Mr. Curvey is a Director of Fidelity Investments Money Management, Inc. (2009-present), Director of Fidelity Research & Analysis Co. (2009-present) and Director of FMR and FMR Co., Inc. (2007-present). Mr. Curvey is also Vice Chairman (2007-present) and Director of FMR LLC. In addition, Mr. Curvey serves as an Overseer for the Boston Symphony Orchestra and a member of the Trustees of Villanova University. Previously, Mr. Curvey was the Vice Chairman (2006-2007) and Director (2000-2007) of FMR Corp. |
Ronald P. O'Hanley (54) |
| Year of Election or Appointment: 2011 Mr. O'Hanley is Director of FMR Co., Inc. (2010-present), Director of Fidelity Investments Money Management, Inc. (2010-present), Director of Fidelity Research & Analysis Company (2010-present), President of Fidelity Asset Management and Corporate Services and a member of Fidelity's Executive Committee (2010-present). Previously, Mr. O'Hanley served as President and Chief Executive Officer of BNY Mellon Asset Management (2007-2010). Mr. O'Hanley also served as Vice Chairman of Bank New York Mellon Corp. and a member of that firm's Executive Committee. Prior to the 2007 merger of The Bank of New York and Mellon Financial Corporation, he was Vice Chairman of Mellon Financial Corporation and President and Chief Executive Officer of Mellon Asset Management. He joined Mellon in February 1997. Mr. O'Hanley currently serves as Chairman of the Boston Public Library Foundation Board of Directors and sits on the Board of Directors of Beth Israel Deaconess Medical Center, the Board of Trustees of the Marine Biological Laboratory and the Advisory Board of the Maxwell School of Citizenship and Public Administration at Syracuse University. Mr. O'Hanley also chairs the Council on Asset Management for the Financial Services Roundtable and is a member of the Board of Directors of Institutional Investor's U.S. Institute. |
* Trustees have been determined to be "Interested Trustees" by virtue of, among other things, their affiliation with the trust or various entities under common control with FMR.
+ The information above includes each Trustee's principal occupation during the last five years and other information relating to the experience, attributes, and skills relevant to each Trustee's qualifications to serve as a Trustee, which led to the conclusion that each Trustee should serve as a Trustee for the fund.
Annual Report
Trustees and Officers - continued
Independent Trustees:
Correspondence intended for each Independent Trustee (that is, the Trustees other than the Interested Trustees) may be sent to Fidelity Investments, P.O. Box 55235, Boston, Massachusetts 02205-5235.
Name, Age; Principal Occupations and Other Relevant Experience+ |
Dennis J. Dirks (63) |
| Year of Election or Appointment: 2005 Prior to his retirement in May 2003, Mr. Dirks was Chief Operating Officer and a member of the Board of The Depository Trust & Clearing Corporation (DTCC). He also served as President, Chief Operating Officer, and Board member of The Depository Trust Company (DTC) and President and Board member of the National Securities Clearing Corporation (NSCC). In addition, Mr. Dirks served as Chief Executive Officer and Board member of the Government Securities Clearing Corporation, Chief Executive Officer and Board member of the Mortgage-Backed Securities Clearing Corporation, as a Trustee and a member of the Finance Committee of Manhattan College (2005-2008), and as a Trustee and a member of the Finance Committee of AHRC of Nassau County (2006-2008). Mr. Dirks is a member of the Independent Directors Council (IDC) Governing Council (2010-Present) and Board of Directors for The Brookville Center for Children's Services, Inc. (2009-present). |
Alan J. Lacy (58) |
| Year of Election or Appointment: 2008 Mr. Lacy serves as Senior Adviser (2007-present) of Oak Hill Capital Partners, L.P. (private equity). Mr. Lacy also served as Chief Executive Officer (2000-2005) and Vice Chairman (2005-2006) of Sears Holdings Corporation and Sears, Roebuck and Co. (retail). In addition, Mr. Lacy serves as a member of the Board of Directors of Dave & Buster's, Inc. (restaurant and entertainment complexes, 2010-present), The Hillman Companies, Inc. (hardware wholesalers, 2010-present), and Bristol-Myers Squibb Company (global pharmaceuticals, 2007-present). Mr. Lacy is a member of the Board of Trustees of The National Parks Conservation Association (2006-Present). Previously, Mr. Lacy served as Chairman of the Board of Trustees of the National Parks Conservation Association (2008-2011) and as a member of the Board of Directors for the Western Union Company (global money transfer, 2006-2011). |
Ned C. Lautenbach (67) |
| Year of Election or Appointment: 2000 Mr. Lautenbach is Chairman of the Independent Trustees of the Equity and High Income Funds (2006-present). Mr. Lautenbach currently serves as the Lead Director of the Eaton Corporation Board of Directors (diversified industrial, 1997-present). Mr. Lautenbach is also a member of the Board of Directors of the Philharmonic Center for the Arts in Naples, Florida (1999-present); a member of the Board of Trustees of Fairfield University (2005-present); and a member of the Council on Foreign Relations (1994-present). Previously, Mr. Lautenbach was a Partner/Advisory Partner at Clayton, Dubilier & Rice, LLC (private equity investment, 1998-2010), as well as a Director of Sony Corporation (2006-2007). |
Joseph Mauriello (67) |
| Year of Election or Appointment: 2008 Prior to his retirement in January 2006, Mr. Mauriello served in numerous senior management positions including Deputy Chairman and Chief Operating Officer (2004-2005), and Vice Chairman of Financial Services (2002-2004) of KPMG LLP US (professional services, 1965-2005). Mr. Mauriello currently serves as a member of the Board of Directors of XL Group plc. (global insurance and re-insurance, 2006-present) and of Arcadia Resources Inc. (health care services and products, 2007-present). Previously, Mr. Mauriello served as a Director of the Hamilton Funds of the Bank of New York (2006-2007). |
Robert W. Selander (61) |
| Year of Election or Appointment: 2011 Previously, Mr. Selander served as a Member of the Advisory Board of Fidelity's Equity and High Income Funds (2011), Executive Vice Chairman (2010), Chief Executive Officer (2009-2010), and President and Chief Executive Officer (1997-2009) of Mastercard, Inc. |
Cornelia M. Small (67) |
| Year of Election or Appointment: 2005 Ms. Small is a member of the Board of Directors of the Teagle Foundation (2009-present). Ms. Small is also a member of the Investment Committee, and Chair (2008-present) and a member of the Board of Trustees of Smith College. In addition, Ms. Small serves on the Investment Committee of the Berkshire Taconic Community Foundation (2008-present). Previously, Ms. Small served as Chairperson of the Investment Committee (2002-2008) of Smith College. In addition, Ms. Small served as Chief Investment Officer, Director of Global Equity Investments, and a member of the Board of Directors of Scudder, Stevens & Clark and Scudder Kemper Investments. |
William S. Stavropoulos (72) |
| Year of Election or Appointment: 2001 Mr. Stavropoulos is Vice Chairman of the Independent Trustees of the Equity and High Income Funds (2006-present). Mr. Stavropoulos serves as President and Founder of the Michigan Baseball Foundation, the Great Lakes Loons (2007-present). Mr. Stavropoulos is Chairman Emeritus of the Board of Directors of The Dow Chemical Company, where he previously served in numerous senior management positions, including President, CEO (1995-2000; 2002-2004), Chairman of the Executive Committee (2000-2006), and as a member of the Board of Directors (1990-2006). Currently, Mr. Stavropoulos is Chairman of Univar (global distributor of commodity and specialty chemicals, 2010-present), a Director of Teradata Corporation (data warehousing and technology solutions, 2008-present), Chemical Financial Corporation, Maersk Inc. (industrial conglomerate), Tyco International, Inc. (multinational manufacturing and services, 2007-present), and a member of the Advisory Board for Metalmark Capital (private equity investment, 2005-present). Mr. Stavropoulos is a special advisor to Clayton, Dubilier & Rice, LLC (private equity investment). In addition, Mr. Stavropoulos is a member of the University of Notre Dame Advisory Council for the College of Science. |
David M. Thomas (62) |
| Year of Election or Appointment: 2008 Previously, Mr. Thomas served as Executive Chairman (2005-2006) and Chairman and Chief Executive Officer (2000-2005) of IMS Health, Inc. (pharmaceutical and healthcare information solutions). In addition, Mr. Thomas serves as a member of the Board of Directors of Fortune Brands, Inc. (consumer products), and Interpublic Group of Companies, Inc. (marketing communication, 2004-present). |
Michael E. Wiley (61) |
| Year of Election or Appointment: 2008 Mr. Wiley also serves as a Director of Asia Pacific Exploration Consolidated (international oil and gas exploration and production, 2008-present). Mr. Wiley serves as a Director of Tesoro Corporation (independent oil refiner and marketer, 2005-present), and a Director of Bill Barrett Corporation (exploration and production, 2005-present). In addition, Mr. Wiley also serves as a Director of Post Oak Bank (privately-held bank, 2004-present). Previously, Mr. Wiley served as a member of the Board of Trustees of the University of Tulsa (2000-2006; 2007-2010), as a Senior Energy Advisor of Katzenbach Partners, LLC (consulting, 2006-2007), as an Advisory Director of Riverstone Holdings (private investment), Chairman, President, and CEO of Baker Hughes, Inc. (oilfield services, 2000-2004), and as Director of Spinnaker Exploration Company (exploration and production, 2001-2005). |
Annual Report
+ The information above includes each Trustee's principal occupation during the last five years and other information relating to the experience, attributes, and skills relevant to each Trustee's qualifications to serve as a Trustee, which led to the conclusion that each Trustee should serve as a Trustee for the fund.
Advisory Board Members and Executive Officers:
Correspondence intended for each executive officer, Edward C. Johnson 3d, and Peter S. Lynch may be sent to Fidelity Investments, 82 Devonshire Street, Boston, Massachusetts 02109.
Name, Age; Principal Occupation |
Edward C. Johnson 3d (81) |
| Year of Election or Appointment: 2011 Member of the Advisory Board of Fidelity's Equity and High Income Funds. Mr. Johnson serves as Chief Executive Officer, Chairman, and a Director of FMR LLC, and also serves as Chairman and Director of FIL Limited. Previously, Mr. Johnson served as a Trustee and Chairman of the Board of certain Fidelity Trusts, Chairman and a Director of FMR, Chairman and a Director of FMR Co., Inc., and President of FMR LLC (2006-2007). |
Peter S. Lynch (67) |
| Year of Election or Appointment: 2003 Member of the Advisory Board of Fidelity's Equity and High Income Funds. Mr. Lynch is Vice Chairman and a Director of FMR and FMR Co., Inc. In addition, Mr. Lynch serves as a Trustee of Boston College and as the Chairman of the Inner-City Scholarship Fund. Previously, Mr. Lynch served on the Special Olympics International Board of Directors (1997-2006). |
Kenneth B. Robins (42) |
| Year of Election or Appointment: 2008 President and Treasurer of Fidelity's Equity and High Income Funds. Mr. Robins also serves as President and Treasurer (2010-present) and Assistant Treasurer (2009-present) of other Fidelity funds and is an employee of Fidelity Investments (2004-present). Previously, Mr. Robins served as Deputy Treasurer of the Fidelity funds (2005-2008) and Treasurer and Chief Financial Officer of The North Carolina Capital Management Trust: Cash and Term Portfolios (2006-2008). |
Brian B. Hogan (47) |
| Year of Election or Appointment: 2009 Vice President of Equity and High Income Funds. Mr. Hogan also serves as President of FMR's Equity Division (2009-present). Previously, Mr. Hogan served as Senior Vice President, Equity Research of FMR (2006-2009) and as a portfolio manager. |
Thomas C. Hense (47) |
| Year of Election or Appointment: 2008 or 2010 Vice President of Fidelity's High Income (2008), Small Cap (2008), and Value (2010) Funds. Previously, Mr. Hense served as a portfolio manager for Fidelity's Institutional Money Management Group (Pyramis) (2003-2008). |
Scott C. Goebel (43) |
| Year of Election or Appointment: 2008 Secretary and Chief Legal Officer (CLO) of the Fidelity funds. Mr. Goebel also serves as Secretary of Fidelity Investments Money Management, Inc. (FIMM) (2010-present) and Fidelity Research and Analysis Company (FRAC) (2010-present); Secretary and CLO of The North Carolina Capital Management Trust: Cash and Term Portfolios (2008-present); General Counsel, Secretary, and Senior Vice President of FMR (2008-present) and FMR Co., Inc. (2008-present); employed by FMR LLC or an affiliate (2001-present); Chief Legal Officer of Fidelity Management & Research (Hong Kong) Limited (2008-present) and Assistant Secretary of Fidelity Management & Research (Japan) Inc. (2008-present), and Fidelity Management & Research (U.K.) Inc. (2008-present). Previously, Mr. Goebel served as Assistant Secretary of FIMM (2008-2010), FRAC (2008-2010), and the Funds (2007-2008) and as Vice President and Secretary of Fidelity Distributors Corporation (FDC) (2005-2007). |
William C. Coffey (42) |
| Year of Election or Appointment: 2009 Assistant Secretary of Fidelity's Equity and High Income Funds. Mr. Coffey also serves as Senior Vice President and Deputy General Counsel of FMR LLC (2010-present), and is an employee of Fidelity Investments. Previously, Mr. Coffey served as Vice President and Associate General Counsel of FMR LLC (2005-2009). |
Holly C. Laurent (57) |
| Year of Election or Appointment: 2008 Anti-Money Laundering (AML) Officer of the Fidelity funds. Ms. Laurent also serves as AML Officer of The North Carolina Capital Management Trust: Cash and Term Portfolios (2008-present) and is an employee of Fidelity Investments. Previously, Ms. Laurent was Senior Vice President and Head of Legal for Fidelity Business Services India Pvt. Ltd. (2006-2008), and Senior Vice President, Deputy General Counsel and Group Head for FMR LLC (2005-2006). |
Christine Reynolds (53) |
| Year of Election or Appointment: 2008 Chief Financial Officer of the Fidelity funds. Ms. Reynolds became President of Fidelity Pricing and Cash Management Services (FPCMS) in August 2008. Ms. Reynolds served as Chief Operating Officer of FPCMS (2007-2008). Previously, Ms. Reynolds served as President, Treasurer, and Anti-Money Laundering officer of the Fidelity funds (2004-2007). |
Kenneth A. Rathgeber (64) |
| Year of Election or Appointment: 2004 Chief Compliance Officer of Fidelity's Equity and High Income Funds. Mr. Rathgeber is Chief Compliance Officer of Fidelity Management & Research (Hong Kong) Limited (2008-present), Fidelity Management & Research (Japan) Inc. (2008-present), FMR (2005-present), FMR Co., Inc. (2005-present), Fidelity Management & Research (U.K.) Inc. (2005-present), Fidelity Research & Analysis Company (2005-present), Fidelity Investments Money Management, Inc. (2005-present), Pyramis Global Advisors, LLC (2005-present), and Strategic Advisers, Inc. (2005-present). |
Jeffrey S. Christian (50) |
| Year of Election or Appointment: 2009 Deputy Treasurer of the Fidelity funds. Mr. Christian is an employee of Fidelity Investments. Previously, Mr. Christian served as Chief Financial Officer (2008-2009) of certain Fidelity funds and Senior Vice President of Fidelity Pricing and Cash Management Services (FPCMS) (2004-2009). |
Joseph F. Zambello (54) |
| Year of Election or Appointment: 2011 Deputy Treasurer of the Fidelity funds. Mr. Zambello is an employee of Fidelity Investments. Previously, Mr. Zambello served as Vice President of FMR's Program Management Group (2009-2011) and Vice President of the Transfer Agent Oversight Group (2005-2009). |
Adrien E. Deberghes (44) |
| Year of Election or Appointment: 2008 Deputy Treasurer of Fidelity's Equity and High Income Funds. Mr. Deberghes also serves as Vice President and Assistant Treasurer of Fidelity Rutland Square Trust II and Fidelity Commonwealth Trust II (2011-present), Assistant Treasurer of other Fidelity funds (2010-present), and is an employee of Fidelity Investments (2008-present). Previously, Mr. Deberghes served as Senior Vice President of Mutual Fund Administration at State Street Corporation (2007-2008), Senior Director of Mutual Fund Administration at Investors Bank & Trust (2005-2007), and Director of Finance for Dunkin' Brands (2000-2005). |
Stephanie J. Dorsey (42) |
| Year of Election or Appointment: 2010 Assistant Treasurer of Fidelity's Equity and High Income Funds. Ms. Dorsey also serves as Deputy Treasurer of other Fidelity funds (2008-present) and is an employee of Fidelity Investments (2008-present). Previously, Ms. Dorsey served as Treasurer (2004-2008) of the JPMorgan Mutual Funds and Vice President (2004-2008) of JPMorgan Chase Bank. |
John R. Hebble (53) |
| Year of Election or Appointment: 2009 Assistant Treasurer of Fidelity's Equity and High Income Funds. Mr. Hebble also serves as President (2011-present), Treasurer, and Chief Financial Officer of The North Carolina Capital Management Trust: Cash and Term Portfolios (2008-present), President and Treasurer of other Fidelity funds (2008-present) and is an employee of Fidelity Investments. |
Gary W. Ryan (53) |
| Year of Election or Appointment: 2005 Assistant Treasurer of the Fidelity funds. Mr. Ryan is an employee of Fidelity Investments. Previously, Mr. Ryan served as Vice President of Fund Reporting in Fidelity Pricing and Cash Management Services (FPCMS) (1999-2005). |
Jonathan Davis (43) |
| Year of Election or Appointment: 2010 Assistant Treasurer of the Fidelity funds. Mr. Davis is also Assistant Treasurer of Fidelity Rutland Square Trust II and Fidelity Commonwealth Trust II. Mr. Davis is an employee of Fidelity Investments. Previously, Mr. Davis served as Vice President and Associate General Counsel of FMR LLC (2003-2010). |
Annual Report
The Board of Trustees of Advisor Value Leaders Fund voted to pay to shareholders of record at the opening of business on record date, the following distributions per share derived from capital gains realized from sales of portfolio securities, and dividends derived from net investment income:
| Pay Date | Record Date | Dividends | Capital Gains |
Institutional Class | 12/05/11 | 12/02/11 | $0.158 | $0.004 |
Institutional Class designates 100% of the dividend distributed during the fiscal year as qualifying for the dividends-received deduction for corporate shareholders.
Institutional Class designates 100% of the dividend distributed during the fiscal year as amounts which may be taken into account as a dividend for purposes of the maximum rate under section 1(h)(11) of the Internal Revenue Code.
The fund will notify shareholders in January 2012 of amounts for use in preparing 2011 income tax returns.
Annual Report
Board Approval of Investment Advisory Contracts and Management Fees
Fidelity Advisor Value Leaders Fund
Each year, the Board of Trustees, including the Independent Trustees (together, the Board), votes on the renewal of the management contract and sub-advisory agreements (together, the Advisory Contracts) for the fund. The Board, assisted by the advice of fund counsel and Independent Trustees' counsel, requests and considers a broad range of information relevant to the renewal of the Advisory Contracts throughout the year.
The Board meets regularly and considers at each of its meetings factors that are relevant to its annual consideration of the renewal of the fund's Advisory Contracts, including the services and support provided to the fund and its shareholders. The Board has established various standing committees, each composed of Independent Trustees with varying backgrounds, to which the Board has assigned specific subject matter responsibilities in order to enhance effective decision-making by the Board. The Board, acting directly and through its Committees, requests and receives information concerning the annual consideration of the renewal of the fund's Advisory Contracts. The Board also meets as needed to consider matters specifically related to the Board's annual consideration of the renewal of Advisory Contracts. Members of the Board may also meet with trustees of other Fidelity funds through ad hoc joint committees to discuss certain matters relevant to the Fidelity funds.
At its July 2011 meeting, the Board of Trustees, including the Independent Trustees, unanimously determined to renew the fund's Advisory Contracts. In reaching its determination, the Board considered all factors it believed relevant, including (i) the nature, extent, and quality of the services to be provided to the fund and its shareholders (including the investment performance of the fund); (ii) the competitiveness of the fund's management fee and total expense ratio; (iii) the total costs of the services to be provided by and the profits to be realized by Fidelity from its relationship with the fund; (iv) the extent to which economies of scale would be realized as the fund grows; and (v) whether fee levels reflect these economies of scale, if any, for the benefit of fund shareholders.
In considering whether to renew the Advisory Contracts for the fund, the Board reached a determination, with the assistance of fund counsel and Independent Trustees' counsel and through the exercise of its business judgment, that the renewal of the Advisory Contracts is in the best interests of the fund and its shareholders and that the compensation payable under the Advisory Contracts is fair and reasonable. The Board's decision to renew the Advisory Contracts was not based on any single factor, but rather was based on a comprehensive consideration of all the information provided to the Board at its meetings throughout the year. The Board, in reaching its determination to renew the Advisory Contracts, is aware that shareholders in the fund have a broad range of investment choices available to them, including a wide choice among mutual funds offered by Fidelity's competitors, and that the fund's shareholders, who have the opportunity to review and weigh the disclosure provided by the fund in its prospectus and other public disclosures, have chosen to invest in this fund, managed by Fidelity.
Annual Report
Nature, Extent, and Quality of Services Provided. The Board considered the staffing within the investment adviser, FMR, and the sub-advisers (together, the Investment Advisers), including the backgrounds of the fund's investment personnel and the fund's investment objective and discipline. The Independent Trustees also had discussions with senior management of Fidelity's investment operations and investment groups. The Board considered the structure of the portfolio manager compensation program and whether this structure provides appropriate incentives to act in the best interests of the fund.
Resources Dedicated to Investment Management and Support Services. The Board and the Fund Oversight and Research Committees reviewed the general qualifications and capabilities of the Investment Advisers' investment staff, including its size, education, experience, and resources, as well as the Investment Advisers' approach to recruiting, training, managing, and compensating investment personnel. The Board also noted that FMR has devoted increased resources to non-U.S. offices. The Board noted that Fidelity's analysts have extensive resources, tools and capabilities which allow them to conduct sophisticated quantitative and fundamental analysis, as well as credit analysis of issuers, counterparties and enhancers. The Board also believes that Fidelity's investment professionals have sufficient access to global information and data so as to provide competitive investment results over time, and that those professionals also have access to sophisticated tools which permit them to assess portfolio construction and risk and performance attribution characteristics continuously, as well as to transmit new information and research conclusions rapidly around the world. Additionally, in their deliberations, the Board considered the Investment Advisers' trading capabilities and resources which are an integral part of the investment management process.
Shareholder and Administrative Services. The Board considered (i) the nature, extent, quality, and cost of advisory, administrative, and shareholder services performed by the Investment Advisers and their affiliates under the Advisory Contracts and under separate agreements covering transfer agency, pricing and bookkeeping, and securities lending services for the fund; (ii) the nature and extent of the investment adviser's supervision of third party service providers, principally custodians and subcustodians; and (iii) the resources devoted to, and the record of compliance with, the fund's compliance policies and procedures. The Board also reviewed the allocation of fund brokerage, including allocations to brokers affiliated with the Investment Advisers, the use of brokerage commissions to pay fund expenses, and the use of "soft" commission dollars to pay for research services.
The Board noted that the growth of fund assets over time across the complex allows Fidelity to reinvest in the development of services designed to enhance the value or convenience of the Fidelity funds as investment vehicles. These services include 24-hour access to account information and market information through telephone representatives and over the Internet, investor education materials and asset allocation tools, and the expanded availability of Fidelity Investor Centers, with 35 new branches opening since 2010.
Annual Report
Board Approval of Investment Advisory Contracts and
Management Fees - continued
Investment in a Large Fund Family. The Board considered the benefits to shareholders of investing in a Fidelity fund, including the benefits of investing in a fund that is part of a large family of funds offering a variety of investment disciplines and providing a large variety of mutual fund investor services. The Board noted that Fidelity had taken, or had made recommendations that resulted in the Fidelity funds taking, a number of actions over the previous year that benefited particular funds, including (i) continuing to dedicate additional resources to investment research and support of the senior management team that oversees asset management; (ii) rationalizing product lines through the mergers of six funds into other funds; (iii) continuing to migrate the Freedom Funds to dedicated lower cost underlying funds; (iv) obtaining shareholder approval to broaden the investment strategies for Fidelity Consumer Finance Portfolio, Fidelity Emerging Asia Fund, and Fidelity Environment and Alternative Energy Portfolio; (v) contractually agreeing to reduce the management fees and impose other expense limitations on Spartan 500 Index Fund and U.S. Bond Index Fund in connection with launching new institutional classes of these funds; (vi) changing the name, primary and supplemental benchmarks, and investment policies of Fidelity Global Strategies Fund to support the fund's flexible investment mandate and global orientation; and (vii) reducing the transfer agency account fee rates on certain accounts.
Investment Performance. The Board considered whether the fund has operated in accordance with its investment objective, as well as its record of compliance with its investment restrictions. It also reviewed the fund's absolute investment performance for each class, as well as the fund's relative investment performance for each class measured over multiple periods against (i) a broad-based securities market index, and (ii) a peer group of mutual funds deemed appropriate by Fidelity and reviewed by the Board. The following charts considered by the Board show, over the one-, three-, and five-year periods ended December 31, 2010, the cumulative total returns of Institutional Class (Class I) and Class C of the fund, the cumulative total returns of a broad-based securities market index ("benchmark"), and a range of cumulative total returns of a peer group of mutual funds identified by Morningstar, Inc. as having an investment style similar to that of the fund based on underlying portfolio holdings. The returns of Institutional Class (Class I) and Class C show the performance of the highest and lowest performing classes, respectively (based on five-year performance). The box within each chart shows the 25th percentile return (bottom of box) and the 75th percentile return (top of box) of the peer group. Returns shown above the box are in the first quartile and returns shown below the box are in the fourth quartile. The percentage beaten numbers noted below each chart correspond to the percentile box and represent the percentage of funds in the peer group whose performance was equal to or lower than that of the class indicated.
Annual Report
Fidelity Advisor Value Leaders Fund

The Board reviewed the fund's relative investment performance against its peer group and noted that the performance of Institutional Class (Class I) of the fund was in the fourth quartile for all the periods shown. The Board also noted that the investment performance of the fund was lower than its benchmark for all the periods shown. The Board considered that the variations in performance among the fund's classes reflect the variations in class expenses, which result in lower performance for higher expense classes. The Board discussed with FMR actions that have been taken by FMR to improve the fund's disappointing performance relative to its peer group and benchmark. The Board also reviewed the fund's performance since inception as well as performance in the current year. The Board will continue to closely monitor the performance of the fund in the coming year and discuss with FMR other appropriate actions to address the performance of the fund.
The Board also considered that the fund's management fee is subject to upward or downward adjustment depending upon whether, and to what extent, the fund's investment performance for the performance period exceeds, or is exceeded by, the record (over the same period) of a Board-approved performance adjustment index. The Board noted that the performance adjustment provides FMR with a strong economic incentive to seek to achieve superior performance for the fund's shareholders and helps to more closely align the interests of FMR and the fund's shareholders.
Annual Report
Board Approval of Investment Advisory Contracts and
Management Fees - continued
Based on its review, the Board concluded that the nature, extent, and quality of services provided to the fund under the Advisory Contracts should benefit the fund's shareholders.
Competitiveness of Management Fee and Total Expense Ratio. The Board considered the fund's management fee and total expense ratio compared to "mapped groups" of competitive funds and classes. Fidelity creates "mapped groups" by combining similar Lipper investment objective categories that have comparable management fee characteristics. Combining Lipper investment objective categories aids the Board's management fee and total expense ratio comparisons by broadening the competitive group used for comparison and by reducing the number of universes to which various Fidelity funds are compared.
Management Fee. The Board considered two proprietary management fee comparisons for the 12-month periods shown in the chart below. The group of Lipper funds used by the Board for management fee comparisons is referred to below as the "Total Mapped Group." The Total Mapped Group comparison focuses on a fund's standing relative to the total universe of comparable funds available to investors in terms of gross management fees before expense reimbursements or caps, and without giving effect to the fund's performance adjustment. "TMG %" represents the percentage of funds in the Total Mapped Group that had management fees that were lower than the fund's. For example, a TMG % of 10% means that 90% of the funds in the Total Mapped Group had higher management fees than the fund. The "Asset-Size Peer Group" (ASPG) comparison focuses on a fund's standing relative to non-Fidelity funds similar in size to the fund within the Total Mapped Group. The ASPG represents at least 15% of the funds in the Total Mapped Group with comparable asset size and management fee characteristics, subject to a minimum of 50 funds (or all funds in the Total Mapped Group if fewer than 50). Additional information, such as the ASPG quartile in which the fund's management fee ranked and the impact of the fund's performance adjustment, is also included in the chart and considered by the Board.
Annual Report
Fidelity Advisor Value Leaders Fund

The Board noted that the fund's management fee ranked below the median of its Total Mapped Group and below the median of its ASPG for 2010. The Board also noted the effect of the fund's negative performance adjustment on the fund's management fee ranking. The Board noted that the performance adjustment for each year represents calculations for performance periods that differ from the periods shown in the performance charts above.
Based on its review, the Board concluded that the fund's management fee is fair and reasonable in light of the services that the fund receives and the other factors considered.
Total Expense Ratio. In its review of each class's total expense ratio, the Board considered the fund's management fee as well as other fund or class expenses, as applicable, such as transfer agent fees, pricing and bookkeeping fees, fund-paid 12b-1 fees, and custodial, legal, and audit fees. The Board also noted the effects of any waivers and reimbursements on fees and expenses, as well as the impact of the fund's performance adjustment. As part of its review, the Board also considered the current and historical total expense ratios of each class of the fund compared to competitive fund median expenses. Each class of the fund is compared to those funds and classes in the Total Mapped Group (used by the Board for management fee comparisons) that have a similar sales load structure.
The Board noted that the total expense ratio of each of Class A, Class B, Class C, and Institutional Class ranked below its competitive median for 2010 and the total expense ratio of Class T ranked above its competitive median for 2010. The Board considered that various factors, including 12b-1 fees, positive or negative performance adjustments, and relatively higher other expenses in the case of small fund size, can affect total expense ratios. The Board noted that the total expense ratio of Class T was above the competitive median primarily because of higher 12b-1 fees on Class T. Class T has a higher 12b-1 fee, but a lower front-end sales charge, than traditionally priced front-end sales charge classes. The Board noted that the fund offers multiple classes, each of which has a different sales load and 12b-1 fee structure, and that the multiple structures are intended to offer a range of pricing options for the intermediary market. The Board also noted that the total expense ratios of the classes vary primarily by the level of their 12b-1 fees, although differences in transfer agent fees may also cause expenses to vary from class to class.
Annual Report
Board Approval of Investment Advisory Contracts and
Management Fees - continued
Fees Charged to Other Fidelity Clients. The Board also considered Fidelity fee structures and other information with respect to clients of FMR and its affiliates, such as other mutual funds advised or subadvised by FMR or its affiliates, pension plan clients, and other institutional clients. In March 2010, the Board created an ad hoc joint committee with the board of other Fidelity funds (the Committee) to review and compare Fidelity's institutional investment advisory business with its business of providing services to the Fidelity funds, including the differences in services provided, fees charged, and costs incurred, as well as competition in their respective marketplaces.
Based on its review of total expense ratios and fees charged to other Fidelity clients, the Board concluded that the total expense ratio of each class of the fund was reasonable, although Class T was above the median of the universe presented for comparison, in light of the services that the fund and its shareholders receive and the other factors considered, including the findings of the Committee.
Costs of the Services and Profitability. The Board considered the revenues earned and the expenses incurred by Fidelity in conducting the business of developing, marketing, distributing, managing, administering and servicing the fund and its shareholders. The Board also considered the level of Fidelity's profits in respect of all the Fidelity funds.
On an annual basis, FMR presents to the Board Fidelity's profitability for the fund. Fidelity calculates the profitability for each fund, as well as aggregate profitability for groups of Fidelity funds and all Fidelity funds, using a series of detailed revenue and cost allocation methodologies which originate with the books and records of Fidelity on which Fidelity's audited financial statements are based. The Audit Committee of the Board reviews any significant changes from the prior year's methodologies.
PricewaterhouseCoopers LLP (PwC), independent registered public accounting firm and auditor to Fidelity and certain Fidelity funds, has been engaged annually by the Board as part of the Board's assessment of Fidelity's profitability analysis. PwC's engagement includes the review and assessment of Fidelity's methodologies used in determining the revenues and expenses attributable to Fidelity's mutual fund business, and completion of agreed-upon procedures surrounding the mathematical accuracy of fund profitability and its conformity to allocation methodologies. After considering PwC's reports issued under the engagement and information provided by Fidelity, the Board concluded that while other allocation methods may also be reasonable, Fidelity's profitability methodologies are reasonable in all material respects.
Annual Report
The Board also reviewed Fidelity's non-fund businesses and fall-out benefits related to the mutual fund business as well as cases where Fidelity's affiliates may benefit from or be related to the fund's business.
The Board considered the costs of the services provided by and the profits realized by Fidelity in connection with the operation of the fund and was satisfied that the profitability was not excessive in the circumstances.
Economies of Scale. The Board considered whether there have been economies of scale in respect of the management of the Fidelity funds, whether the Fidelity funds (including the fund) have appropriately benefited from any such economies of scale, and whether there is potential for realization of any further economies of scale. The Board considered the extent to which the fund will benefit from economies of scale through increased services to the fund, through waivers or reimbursements, or through fee or expense reductions. The Board also noted that in 2009, it and the board of other Fidelity funds created an ad hoc committee (the Economies of Scale Committee) to analyze whether FMR attains economies of scale in respect of the management and servicing of the Fidelity funds, whether the Fidelity funds have appropriately benefited from such economies of scale, and whether there is potential for realization of any further economies of scale.
The Board recognized that the fund's management contract incorporates a "group fee" structure, which provides for lower group fee rates as total fund assets under FMR's management increase, and for higher group fee rates as total fund assets under FMR's management decrease. FMR calculates the group fee rates based on a tiered asset "breakpoint" schedule that varies based on asset class. The Board considered that the group fee is designed to deliver the benefits of economies of scale to fund shareholders when total Fidelity fund assets increase, even if assets of any particular fund are unchanged or have declined, because some portion of Fidelity's costs are attributable to services provided to all Fidelity funds, and all funds benefit if those costs can be allocated among more assets. The Board concluded that, given the group fee structure, fund shareholders will benefit from lower management fees as assets under FMR's management increase at the fund complex level, regardless of whether Fidelity achieves any such economies of scale.
Annual Report
Board Approval of Investment Advisory Contracts and
Management Fees - continued
The Board concluded, taking into account the analysis of the Economies of Scale Committee, that any potential economies of scale are being appropriately shared between fund shareholders and Fidelity.
Additional Information Requested by the Board. In order to develop fully the factual basis for consideration of the Fidelity funds' Advisory Contracts, the Board requested and received additional information on certain topics, including (i) fund performance trends, actions to be taken by FMR to improve certain funds' overall performance, and Fidelity's long-term strategies for certain funds; (ii) portfolio manager changes that have occurred during the past year and length of portfolio manager tenure for different categories of funds over time; (iii) Fidelity's compensation structure for portfolio managers and other key personnel and strategies for attracting and retaining non-investment personnel; (iv) the amount of the investment that each portfolio manager has made in the Fidelity fund(s) that he or she manages; (v) historical trends in Fidelity's realization of fall-out benefits; (vi) Fidelity's group fee structures and the rationale for the individual fee rates of certain funds; (vii) fund profitability methodology and the impact of certain factors on fund profitability results; (viii) trends regarding industry use of performance fee structures and Fidelity's compliance practices with respect to performance adjustment calculations; (ix) the fee structures in place for certain other Fidelity clients; and (x) explanations regarding the relative total expense ratios of certain funds and classes, total expense competitive trends, and actions that might be taken by FMR to reduce total expense ratios for certain funds and classes.
Based on its evaluation of all of the conclusions noted above, and after considering all factors it believed relevant, the Board ultimately concluded that the advisory fee structures are fair and reasonable, and that the fund's Advisory Contracts should be renewed.
Annual Report
Investment Adviser
Fidelity Management & Research Company
Boston, MA
Investment Sub-Advisers
FMR Co., Inc.
Fidelity Management & Research
(U.K.) Inc.
Fidelity Management & Research
(Japan) Inc.
Fidelity Management & Research
(Hong Kong) Limited
General Distributor
Fidelity Distributors Corporation
Boston, MA
Transfer and Service Agents
Fidelity Investments Institutional Operations Company, Inc.
Boston, MA
Fidelity Service Company, Inc.
Boston, MA
Custodian
Brown Brothers Harriman & Company
Boston, MA
AVLFI-UANN-1211
1.793580.108
Item 2. Code of Ethics
As of the end of the period, October 31, 2011, Fidelity Advisor Series VIII (the trust) has adopted a code of ethics, as defined in Item 2 of Form N-CSR, that applies to its President and Treasurer and its Chief Financial Officer. A copy of the code of ethics is filed as an exhibit to this Form N-CSR.
Item 3. Audit Committee Financial Expert
The Board of Trustees of the trust has determined that Joseph Mauriello is an audit committee financial expert, as defined in Item 3 of Form N-CSR. Mr. Mauriello is independent for purposes of Item 3 of Form N-CSR.
Item 4. Principal Accountant Fees and Services
Fees and Services
The following table presents fees billed by Deloitte & Touche LLP, the member firms of Deloitte Touche Tohmatsu, and their respective affiliates (collectively, "Deloitte Entities") in each of the last two fiscal years for services rendered to Fidelity Advisor Emerging Markets Fund, Fidelity Advisor Europe Capital Appreciation Fund, and Fidelity Advisor International Capital Appreciation Fund (the "Funds"):
Services Billed by Deloitte Entities
October 31, 2011 FeesA
| Audit Fees | Audit-Related Fees | Tax Fees | All Other Fees |
Fidelity Advisor Emerging Markets Fund | $39,000 | $- | $6,800 | $300 |
Fidelity Advisor Europe Capital Appreciation Fund | $39,000 | $- | $5,700 | $300 |
Fidelity Advisor International Capital Appreciation Fund | $49,000 | $- | $6,800 | $300 |
October 31, 2010 FeesA
| Audit Fees | Audit-Related Fees | Tax Fees | All Other Fees |
Fidelity Advisor Emerging Markets Fund | $38,000 | $- | $6,600 | $- |
Fidelity Advisor Europe Capital Appreciation Fund | $38,000 | $- | $5,600 | $- |
Fidelity Advisor International Capital Appreciation Fund | $48,000 | $- | $6,600 | $- |
A Amounts may reflect rounding.
The following table presents fees billed by PricewaterhouseCoopers LLP ("PwC") in each of the last two fiscal years for services rendered to Fidelity Advisor Diversified International Fund, Fidelity Advisor Emerging Asia Fund, Fidelity Advisor Global Capital Appreciation Fund, Fidelity Advisor Overseas Fund, and Fidelity Advisor Value Leaders Fund (the "Funds"):
Services Billed by PwC
October 31, 2011 FeesA
| Audit Fees | Audit-Related Fees | Tax Fees | All Other Fees |
Fidelity Advisor Diversified International Fund | $59,000 | $- | $15,500 | $3,300 |
Fidelity Advisor Emerging Asia Fund | $64,000 | $- | $5,100 | $1,900 |
Fidelity Advisor Global Capital Appreciation Fund | $48,000 | $- | $5,100 | $1,700 |
Fidelity Advisor Overseas Fund | $63,000 | $- | $10,000 | $2,200 |
Fidelity Advisor Value Leaders Fund | $43,000 | $- | $4,300 | $1,700 |
October 31, 2010 FeesA
| Audit Fees | Audit-Related Fees | Tax Fees | All Other Fees |
Fidelity Advisor Diversified International Fund | $59,000 | $- | $33,700 | $3,600 |
Fidelity Advisor Emerging Asia Fund | $60,000 | $- | $4,900 | $1,800 |
Fidelity Advisor Global Capital Appreciation Fund | $44,000 | $- | $4,900 | $1,700 |
Fidelity Advisor Overseas Fund | $61,000 | $- | $9,800 | $2,200 |
Fidelity Advisor Value Leaders Fund | $42,000 | $- | $4,100 | $1,700 |
A Amounts may reflect rounding.
The following table presents fees billed by PwC and Deloitte Entities that were required to be approved by the Audit Committee for services that relate directly to the operations and financial reporting of the Funds and that are rendered on behalf of Fidelity Management & Research Company ("FMR") and entities controlling, controlled by, or under common control with FMR (not including any sub-adviser whose role is primarily portfolio management and is subcontracted with or overseen by another investment adviser) that provide ongoing services to the Funds ("Fund Service Providers"):
Services Billed by Deloitte Entities
| October 31, 2011A | October 31, 2010A |
Audit-Related Fees | $440,000 | $720,000 |
Tax Fees | $- | $- |
All Other Fees | $430,000 | $790,000 |
A Amounts may reflect rounding.
Services Billed by PwC
| October 31, 2011A | October 31, 2010A |
Audit-Related Fees | $3,835,000 | $2,150,000 |
Tax Fees | $- | $- |
All Other Fees | $- | $510,000 |
A Amounts may reflect rounding.
"Audit-Related Fees" represent fees billed for assurance and related services that are reasonably related to the performance of the fund audit or the review of the fund's financial statements and that are not reported under Audit Fees.
"Tax Fees" represent fees billed for tax compliance, tax advice or tax planning that relate directly to the operations and financial reporting of the fund.
"All Other Fees" represent fees billed for services provided to the fund or Fund Service Provider, a significant portion of which are assurance related, that relate directly to the operations and financial reporting of the fund, excluding those services that are reported under Audit Fees, Audit-Related Fees or Tax Fees.
Assurance services must be performed by an independent public accountant.
* * *
The aggregate non-audit fees billed by PwC and Deloitte Entities for services rendered to the Funds, FMR (not including any sub-adviser whose role is primarily portfolio management and is subcontracted with or overseen by another investment adviser), and any Fund Service Provider for each of the last two fiscal years of the Funds are as follows:
Billed By | October 31, 2011 A | October 31, 2010 A |
PwC | $5,885,000 | $5,270,000 |
Deloitte Entities | $980,000 | $1,620,000 |
A Amounts may reflect rounding.
The trust's Audit Committee has considered non-audit services that were not pre-approved that were provided by PwC and Deloitte Entities to Fund Service Providers to be compatible with maintaining the independence of PwC and Deloitte Entities in their audits of the Funds, taking into account representations from PwC and Deloitte Entities, in accordance with Public Company Accounting Oversight Board rules, regarding their independence from the Funds and their related entities and FMR's review of the appropriateness and permissibility under applicable law of such non-audit services prior to their provision to the Fund Service Providers.
Audit Committee Pre-Approval Policies and Procedures
The trust's Audit Committee must pre-approve all audit and non-audit services provided by a fund's independent registered public accounting firm relating to the operations or financial reporting of the fund. Prior to the commencement of any audit or non-audit services to a fund, the Audit Committee reviews the services to determine whether they are appropriate and permissible under applicable law.
The Audit Committee has adopted policies and procedures to, among other purposes, provide a framework for the Committee's consideration of non-audit services by the audit firms that audit the Fidelity funds. The policies and procedures require that any non-audit service provided by a fund audit firm to a Fidelity fund and any non-audit service provided by a fund auditor to a Fund Service Provider that relates directly to the operations and financial reporting of a Fidelity fund ("Covered Service") are subject to approval by the Audit Committee before such service is provided.
All Covered Services must be approved in advance of provision of the service either: (i) by formal resolution of the Audit Committee, or (ii) by oral or written approval of the service by the Chair of the Audit Committee (or if the Chair is unavailable, such other member of the Audit Committee as may be designated by the Chair to act in the Chair's absence). The approval contemplated by (ii) above is permitted where the Treasurer determines that action on such an engagement is necessary before the next meeting of the Audit Committee.
Non-audit services provided by a fund audit firm to a Fund Service Provider that do not relate directly to the operations and financial reporting of a Fidelity fund are reported to the Audit Committee on a periodic basis.
Non-Audit Services Approved Pursuant to Rule 2-01(c)(7)(i)(C) and (ii) of Regulation S-X ("De Minimis Exception")
There were no non-audit services approved or required to be approved by the Audit Committee pursuant to the De Minimis Exception during the Funds' last two fiscal years relating to services provided to (i) the Funds or (ii) any Fund Service Provider that relate directly to the operations and financial reporting of the Funds.
Item 5. Audit Committee of Listed Registrants
Not applicable.
Item 6. Investments
(a) Not applicable.
(b) Not applicable
Item 7. Disclosure of Proxy Voting Policies and Procedures for Closed-End Management Investment Companies
Not applicable.
Item 8. Portfolio Managers of Closed-End Management Investment Companies
Not applicable.
Item 9. Purchase of Equity Securities by Closed-End Management Investment Company and Affiliated Purchasers
Not applicable.
Item 10. Submission of Matters to a Vote of Security Holders
There were no material changes to the procedures by which shareholders may recommend nominees to the trust's Board of Trustees.
Item 11. Controls and Procedures
(a)(i) The President and Treasurer and the Chief Financial Officer have concluded that the trust's disclosure controls and procedures (as defined in Rule 30a-3(c) under the Investment Company Act) provide reasonable assurances that material information relating to the trust is made known to them by the appropriate persons, based on their evaluation of these controls and procedures as of a date within 90 days of the filing date of this report.
(a)(ii) There was no change in the trust's internal control over financial reporting (as defined in Rule 30a-3(d) under the Investment Company Act) that occurred during the second fiscal quarter of the period covered by this report that has materially affected, or is reasonably likely to materially affect, the trust's internal control over financial reporting.
Item 12. Exhibits
(a) | (1) | Code of Ethics pursuant to Item 2 of Form N-CSR is filed and attached hereto as EX-99.CODE ETH. |
(a) | (2) | Certification pursuant to Rule 30a-2(a) under the Investment Company Act of 1940 (17 CFR 270.30a-2(a)) is filed and attached hereto as Exhibit 99.CERT. |
(a) | (3) | Not applicable. |
(b) | | Certification pursuant to Rule 30a-2(b) under the Investment Company Act of 1940 (17 CFR 270.30a-2(b)) is furnished and attached hereto as Exhibit 99.906CERT. |
SIGNATURES
Pursuant to the requirements of the Securities Exchange Act of 1934 and the Investment Company Act of 1940, the registrant has duly caused this report to be signed on its behalf by the undersigned, thereunto duly authorized.
Fidelity Advisor Series VIII
By: | /s/Kenneth B. Robins |
| Kenneth B. Robins |
| President and Treasurer |
| |
Date: | December 28, 2011 |
Pursuant to the requirements of the Securities Exchange Act of 1934 and the Investment Company Act of 1940, this report has been signed below by the following persons on behalf of the registrant and in the capacities and on the dates indicated.
By: | /s/Kenneth B. Robins |
| Kenneth B. Robins |
| President and Treasurer |
| |
Date: | December 28, 2011 |
By: | /s/Christine Reynolds |
| Christine Reynolds |
| Chief Financial Officer |
| |
Date: | December 28, 2011 |