UNITED STATES
SECURITIES AND EXCHANGE COMMISSION
Washington, D.C. 20549
FORM N-CSR
CERTIFIED SHAREHOLDER REPORT OF REGISTERED
MANAGEMENT INVESTMENT COMPANIES
Investment Company Act file number 811-3855
Fidelity Advisor Series VIII
(Exact name of registrant as specified in charter)
82 Devonshire St., Boston, Massachusetts 02109
(Address of principal executive offices) (Zip code)
Scott C. Goebel, Secretary
82 Devonshire St.
Boston, Massachusetts 02109
(Name and address of agent for service)
Registrant's telephone number, including area code: 617-563-7000
Date of fiscal year end: | October 31 |
| |
Date of reporting period: | October 31, 2012 |
Item 1. Reports to Stockholders
(Fidelity Investment logo)(registered trademark)
Fidelity Advisor®
International
Capital Appreciation
Fund - Institutional Class
Annual Report
October 31, 2012
(Fidelity Cover Art)
Contents
Performance | (Click Here) | How the fund has done over time. |
Management's Discussion of Fund Performance | (Click Here) | The Portfolio Manager's review of fund performance and strategy. |
Shareholder Expense Example | (Click Here) | An example of shareholder expenses. |
Investment Changes | (Click Here) | A summary of major shifts in the fund's investments over the past six months. |
Investments | (Click Here) | A complete list of the fund's investments with their market values. |
Financial Statements | (Click Here) | Statements of assets and liabilities, operations, and changes in net assets, as well as financial highlights. |
Notes | (Click Here) | Notes to the financial statements. |
Report of Independent Registered Public Accounting Firm | (Click Here) | |
Trustees and Officers | (Click Here) | |
Distributions | (Click Here) | |
Board Approval of Investment Advisory Contracts and Management Fees | (Click Here) | |
To view a fund's proxy voting guidelines and proxy voting record for the 12-month period ended June 30, visit http://www.fidelity.com/proxyvotingresults or visit the Securities and Exchange Commission's (SEC) web site at http://www.sec.gov. You may also call 1-877-208-0098 to request a free copy of the proxy voting guidelines.
Standard & Poor's, S&P and S&P 500 are registered service marks of The McGraw-Hill Companies, Inc. and have been licensed for use by Fidelity Distributors Corporation.
Other third party marks appearing herein are the property of their respective owners.
All other marks appearing herein are registered or unregistered trademarks or service marks of FMR LLC or an affiliated company. © 2012 FMR LLC. All rights reserved.
Annual Report
This report and the financial statements contained herein are submitted for the general information of the shareholders of the fund. This report is not authorized for distribution to prospective investors in the fund unless preceded or accompanied by an effective prospectus.
A fund files its complete schedule of portfolio holdings with the SEC for the first and third quarters of each fiscal year on Form N-Q. Forms N-Q are available on the SEC's web site at http://www.sec.gov. A fund's Forms N-Q may be reviewed and copied at the SEC's Public Reference Room in Washington, DC. Information regarding the operation of the SEC's Public Reference Room may be obtained by calling 1-800-SEC-0330. For a complete list of a fund's portfolio holdings, view the most recent holdings listing, semiannual report, or annual report on Fidelity's web site at http://www.fidelity.com, http://www.advisor.fidelity.com, or http://www.401k.com, as applicable.
NOT FDIC INSURED • MAY LOSE VALUE • NO BANK GUARANTEE
Neither the fund nor Fidelity Distributors Corporation is a bank.
Annual Report
Average annual total return reflects the change in the value of an investment, assuming reinvestment of the class' distributions from dividend income and capital gains (the profits earned upon the sale of securities that have grown in value, if any) and assuming a constant rate of performance each year. The $10,000 table and the fund's returns do not reflect the deduction of taxes that a shareholder would pay on fund distributions or the redemption of fund shares. During periods of reimbursement by Fidelity, a fund's total return will be greater than it would be had the reimbursement not occurred. How a fund did yesterday is no guarantee of how it will do tomorrow.
Average Annual Total Returns
Periods ended October 31, 2012 | | Past 1
year | Past 5
years | Past 10
years |
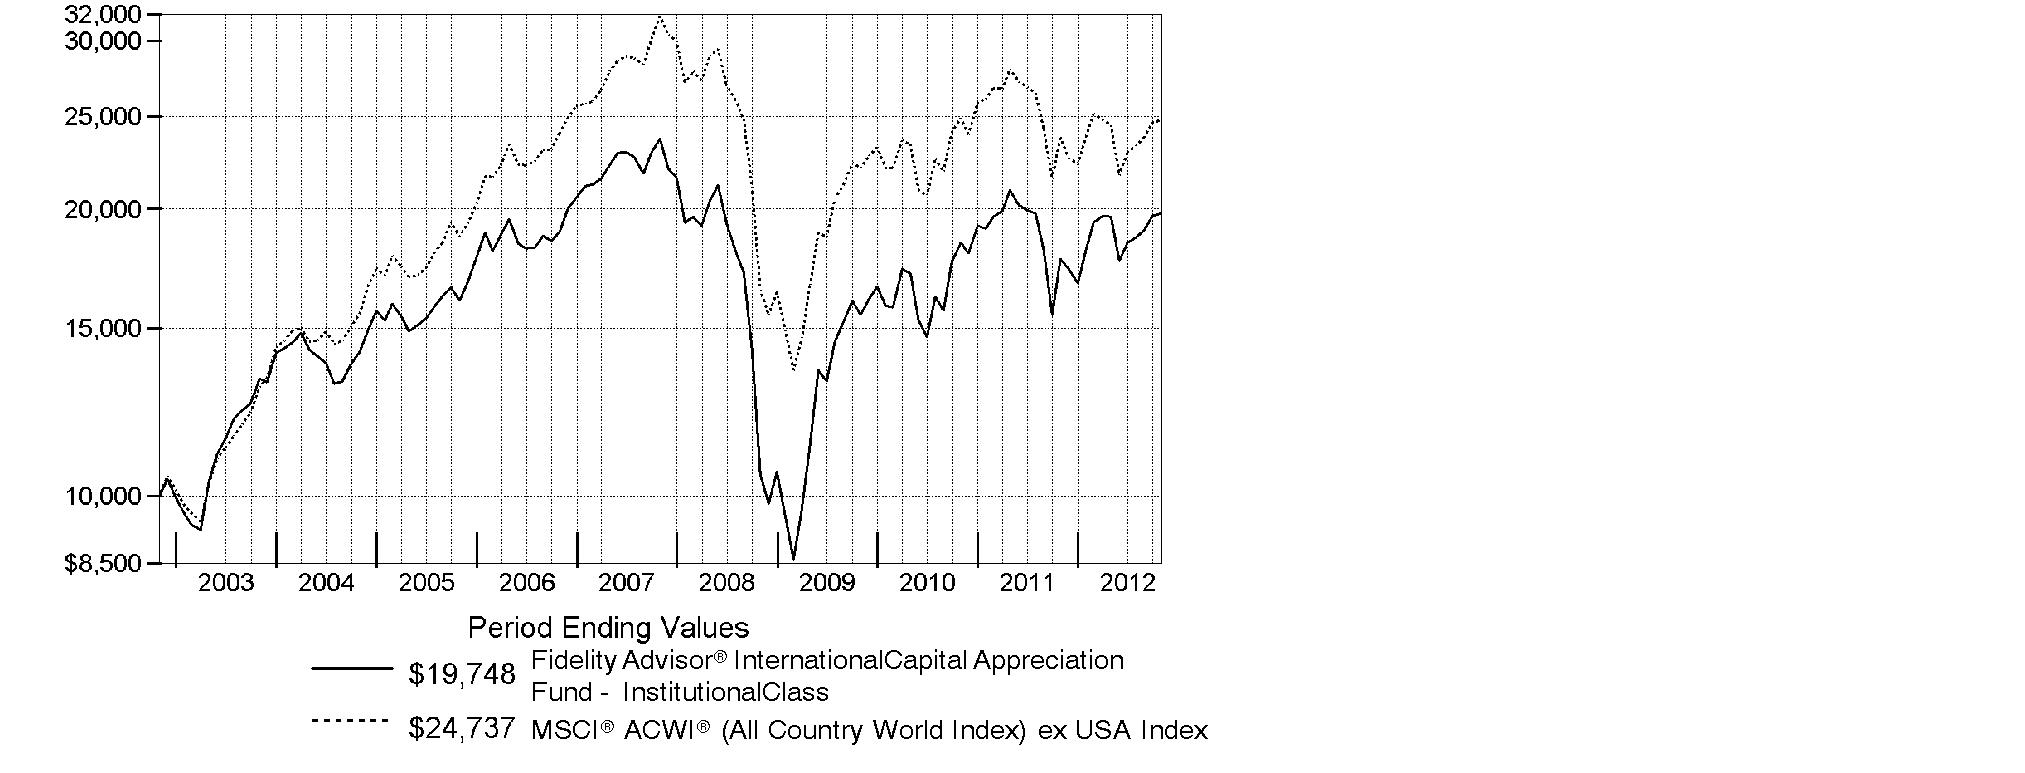
Institutional Class | | 11.56% | -3.56% | 7.04% |
$10,000 Over 10 Years
Let's say hypothetically that $10,000 was invested in Fidelity Advisor® International Capital Appreciation Fund - Institutional Class on October 31, 2002. The chart shows how the value of your investment would have changed, and also shows how the MSCI® ACWI® (All Country World Index) ex USA Index performed over the same period.
Annual Report
Market Recap: International stocks experienced pendulum-like swings during the 12 months ending October 31, 2012, finishing the period with a modest advance. The market faced periodic bouts of volatility this past year, as a number of macroeconomic concerns - including the eurozone debt crisis, the strength and pace of the U.S. economic recovery, and a slowdown in China's once-blistering growth - dominated headlines and weighed on investors. While a stronger U.S. dollar provided an additional head wind, foreign developed- and emerging-markets stocks still managed a gain for the 12 months, as the MSCI® ACWI® (All Country World Index) ex USA Index rose 4.11%, largely buttressed in the summertime by pledges of accommodative monetary action from eurozone officials, as well as signs that the U.S. housing market was on the mend. Within the index, Asia-Pacific ex Japan showed the most impressive gains, advancing roughly 11%. A number of core European components, most notably Germany (+11%), Switzerland (+10%) and the U.K. (+9%), benefited from optimism about the eurozone's ability to resolve its debt woes, which also helped the region outpace the index overall. Elsewhere, results from Canada (+3%) and the generally more volatile emerging markets (+2%) each fell short of the MSCI index, while Japan was among the few benchmark constituents to finish in the red, returning about -3%.
Comments from Sammy Simnegar, Portfolio Manager of Fidelity Advisor® International Capital Appreciation Fund: For the year, the fund's Institutional Class shares returned 11.56%, handily outpacing the MSCI index. Stock selection in consumer staples, consumer discretionary and materials meaningfully lifted relative performance. Within staples, a large overweighting in food, beverage and tobacco also helped. Geographically, the fund was aided by a sizable out-of-benchmark stake in the United States and by stock picking in Brazil, Indonesia and Italy. Our U.S. holdings also benefited from an appreciating dollar. Three of the four biggest relative contributors were Indonesian stocks: Global Mediacom, Ace Hardware Indonesia and Tower Bersama Infrastructure, a cellular tower operator. Thailand-based big-box discount retailer Siam Makro - which I sold - helped as well. All of the contributors I've mentioned were non-benchmark holdings. Conversely, financials and health care detracted. Geographically, Australia hurt. Not owning strong-performing South Korean benchmark component Samsung Electronics during the period's first half hampered results, as did overweightings in Australia's Iluka Resources and Fortescue Metals Group, the latter of which I sold.
The views expressed above reflect those of the portfolio manager(s) only through the end of the period as stated on the cover of this report and do not necessarily represent the views of Fidelity or any other person in the Fidelity organization. Any such views are subject to change at any time based upon market or other conditions and Fidelity disclaims any responsibility to update such views. These views may not be relied on as investment advice and, because investment decisions for a Fidelity fund are based on numerous factors, may not be relied on as an indication of trading intent on behalf of any Fidelity fund.
Annual Report
Shareholder Expense Example
As a shareholder of the Fund, you incur two types of costs: (1) transaction costs, including sales charges (loads) on purchase payments or redemption proceeds, redemption fees and (2) ongoing costs, including management fees, distribution and/or service (12b-1) fees and other Fund expenses. This Example is intended to help you understand your ongoing costs (in dollars) of investing in the Fund and to compare these costs with the ongoing costs of investing in other mutual funds.
The Example is based on an investment of $1,000 invested at the beginning of the period and held for the entire period (May 1, 2012 to October 31, 2012).
Actual Expenses
The first line of the accompanying table for each class of the Fund provides information about actual account values and actual expenses. You may use the information in this line, together with the amount you invested, to estimate the expenses that you paid over the period. Simply divide your account value by $1,000.00 (for example, an $8,600 account value divided by $1,000.00 = 8.6), then multiply the result by the number in the first line for a class of the Fund under the heading entitled "Expenses Paid During Period" to estimate the expenses you paid on your account during this period. In addition, the Fund, as a shareholder in the underlying Fidelity Central Funds, will indirectly bear its pro-rata share of the fees and expenses incurred by the underlying Fidelity Central Funds. These fees and expenses are not included in the Fund's annualized expense ratio used to calculate the expense estimate in the table below.
Hypothetical Example for Comparison Purposes
The second line of the accompanying table for each class of the Fund provides information about hypothetical account values and hypothetical expenses based on a Class' actual expense ratio and an assumed rate of return of 5% per year before expenses, which is not the Class' actual return. The hypothetical account values and expenses may not be used to estimate the actual ending account balance or expenses you paid for the period. You may use this information to compare the ongoing costs of investing in the Fund and other funds. To do so, compare this 5% hypothetical example with the 5% hypothetical examples that appear in the shareholder reports of the other funds. In addition, the Fund, as a shareholder in the underlying Fidelity Central Funds, will indirectly bear its pro-rata share of the fees and expenses incurred by the underlying Fidelity Central Funds. These fees and expenses are not included in the Fund's annualized expense ratio used to calculate the expense estimate in the table below.
Please note that the expenses shown in the table are meant to highlight your ongoing costs only and do not reflect any transaction costs. Therefore, the second line of the table is useful in comparing ongoing costs only, and will not help you determine the relative total costs of owning different funds. In addition, if these transactional costs were included, your costs would have been higher.
Annual Report
| Annualized
Expense Ratio | Beginning
Account Value
May 1, 2012 | Ending
Account Value
October 31, 2012 | Expenses Paid
During Period*
May 1, 2012 to October 31, 2012 |
Class A | 1.45% | | | |
Actual | | $ 1,000.00 | $ 1,005.40 | $ 7.31 |
HypotheticalA | | $ 1,000.00 | $ 1,017.85 | $ 7.35 |
Class T | 1.70% | | | |
Actual | | $ 1,000.00 | $ 1,004.60 | $ 8.57 |
HypotheticalA | | $ 1,000.00 | $ 1,016.59 | $ 8.62 |
Class B | 2.20% | | | |
Actual | | $ 1,000.00 | $ 1,001.00 | $ 11.07 |
HypotheticalA | | $ 1,000.00 | $ 1,014.08 | $ 11.14 |
Class C | 2.20% | | | |
Actual | | $ 1,000.00 | $ 1,001.00 | $ 11.07 |
HypotheticalA | | $ 1,000.00 | $ 1,014.08 | $ 11.14 |
Institutional Class | 1.20% | | | |
Actual | | $ 1,000.00 | $ 1,006.70 | $ 6.05 |
HypotheticalA | | $ 1,000.00 | $ 1,019.10 | $ 6.09 |
A 5% return per year before expenses
* Expenses are equal to each Class' annualized expense ratio, multiplied by the average account value over the period, multiplied by 184/366 (to reflect the one-half year period).
Annual Report
Investment Changes (Unaudited)
Top Five Stocks as of October 31, 2012 |
| % of fund's
net assets | % of fund's net assets
6 months ago |
Nestle SA (Switzerland, Food Products) | 1.6 | 1.7 |
BHP Billiton PLC ADR (United Kingdom, Metals & Mining) | 1.5 | 1.6 |
Samsung Electronics Co. Ltd. (Korea (South), Semiconductors & Semiconductor Equipment) | 1.3 | 0.0 |
Unilever PLC (United Kingdom, Food Products) | 1.0 | 1.0 |
British American Tobacco PLC (United Kingdom) (United Kingdom, Tobacco) | 0.9 | 1.4 |
| 6.3 | |
Top Five Market Sectors as of October 31, 2012 |
| % of fund's
net assets | % of fund's net assets
6 months ago |
Consumer Discretionary | 19.3 | 19.7 |
Consumer Staples | 19.0 | 21.5 |
Industrials | 17.3 | 13.8 |
Financials | 12.2 | 12.6 |
Information Technology | 10.8 | 8.8 |
Top Five Countries as of October 31, 2012 |
(excluding cash equivalents) | % of fund's
net assets | % of fund's net assets
6 months ago |
United States of America | 16.0 | 16.2 |
United Kingdom | 13.4 | 15.6 |
France | 8.6 | 7.9 |
Japan | 6.9 | 9.2 |
Germany | 5.4 | 3.8 |
Percentages are adjusted for the effect of open futures contracts, if applicable. |
Asset Allocation (% of fund's net assets) |
As of October 31, 2012 | As of April 30, 2012 |
 | Stocks 99.5% | | | Stocks 99.1% | |
 | Short-Term Investments and Net Other Assets (Liabilities) 0.5% | |  | Short-Term Investments and Net Other Assets (Liabilities) 0.9% | |

Annual Report
Investments October 31, 2012
Showing Percentage of Net Assets
Common Stocks - 98.9% |
| Shares | | Value |
Australia - 1.6% |
ALS Ltd. | 50,080 | | $ 481,906 |
Coca-Cola Amatil Ltd. | 31,792 | | 443,873 |
Iluka Resources Ltd. | 50,045 | | 515,336 |
Orica Ltd. | 18,382 | | 479,326 |
TOTAL AUSTRALIA | | 1,920,441 |
Austria - 0.4% |
Andritz AG | 8,098 | | 487,759 |
Bailiwick of Jersey - 0.5% |
Experian PLC | 35,600 | | 614,710 |
Belgium - 1.2% |
Anheuser-Busch InBev SA NV | 10,680 | | 893,181 |
Umicore SA | 9,677 | | 496,634 |
TOTAL BELGIUM | | 1,389,815 |
Bermuda - 0.8% |
Credicorp Ltd. (NY Shares) | 4,220 | | 545,815 |
Jardine Matheson Holdings Ltd. | 7,600 | | 468,160 |
TOTAL BERMUDA | | 1,013,975 |
Brazil - 3.8% |
BR Malls Participacoes SA | 36,300 | | 477,197 |
CCR SA | 53,400 | | 469,572 |
Cielo SA | 20,400 | | 504,714 |
Companhia de Bebidas das Americas (AmBev) (PN) sponsored ADR | 16,500 | | 673,035 |
Iguatemi Empresa de Shopping Centers SA | 33,800 | | 429,354 |
Itau Unibanco Holdings SA sponsored ADR | 45,750 | | 667,035 |
Multiplan Empreendimentos Imobiliarios SA | 15,900 | | 465,794 |
Qualicorp SA (a) | 41,000 | | 420,689 |
Souza Cruz SA | 34,300 | | 447,527 |
TOTAL BRAZIL | | 4,554,917 |
Canada - 0.6% |
Canadian National Railway Co. | 8,200 | | 708,053 |
Cayman Islands - 0.8% |
Baidu.com, Inc. sponsored ADR (a) | 4,200 | | 447,804 |
Sands China Ltd. | 140,000 | | 526,577 |
TOTAL CAYMAN ISLANDS | | 974,381 |
Common Stocks - continued |
| Shares | | Value |
Chile - 0.8% |
Embotelladora Andina SA Class A | 93,938 | | $ 472,472 |
Parque Arauco SA | 195,889 | | 447,432 |
TOTAL CHILE | | 919,904 |
Denmark - 1.1% |
FLSmidth & Co. A/S | 8,057 | | 475,971 |
Novo Nordisk A/S Series B sponsored ADR | 5,400 | | 865,566 |
TOTAL DENMARK | | 1,341,537 |
Finland - 0.8% |
Kone Oyj (B Shares) (d) | 7,500 | | 537,092 |
Nokian Tyres PLC | 11,214 | | 465,121 |
TOTAL FINLAND | | 1,002,213 |
France - 8.6% |
Air Liquide SA | 5,520 | | 651,082 |
Bollore | 1,305 | | 386,756 |
Bureau Veritas SA | 4,900 | | 520,348 |
Casino Guichard Perrachon SA | 5,282 | | 461,301 |
Christian Dior SA | 3,640 | | 522,517 |
Dassault Systemes SA | 4,400 | | 463,602 |
Edenred SA | 14,900 | | 431,155 |
Essilor International SA | 5,913 | | 533,041 |
Eurofins Scientific SA | 2,758 | | 426,471 |
Hermes International SCA | 1,480 | | 403,994 |
L'Oreal SA | 5,000 | | 636,863 |
LVMH Moet Hennessy - Louis Vuitton SA | 4,806 | | 781,154 |
Pernod Ricard SA | 5,800 | | 624,192 |
PPR SA | 3,300 | | 580,215 |
Publicis Groupe SA | 9,700 | | 522,582 |
Remy Cointreau SA (d) | 4,825 | | 500,439 |
Schneider Electric SA | 10,639 | | 665,148 |
Technip SA | 4,800 | | 540,650 |
Vivendi SA | 32,626 | | 667,519 |
TOTAL FRANCE | | 10,319,029 |
Germany - 4.8% |
adidas AG | 6,100 | | 519,695 |
BASF AG | 11,846 | | 981,594 |
Bayerische Motoren Werke AG (BMW) | 8,818 | | 702,340 |
Brenntag AG | 3,600 | | 453,735 |
Fresenius Medical Care AG & Co. KGaA sponsored ADR (d) | 7,700 | | 541,926 |
Henkel AG & Co. KGaA | 9,500 | | 614,686 |
Common Stocks - continued |
| Shares | | Value |
Germany - continued |
Hugo Boss AG | 4,700 | | $ 470,478 |
Linde AG | 3,500 | | 588,614 |
SAP AG | 12,210 | | 890,390 |
TOTAL GERMANY | | 5,763,458 |
Hong Kong - 1.0% |
AIA Group Ltd. | 182,200 | | 721,742 |
Galaxy Entertainment Group Ltd. (a) | 146,000 | | 502,048 |
TOTAL HONG KONG | | 1,223,790 |
India - 4.4% |
Asian Paints India Ltd. | 6,168 | | 443,780 |
Bajaj Auto Ltd. | 13,605 | | 459,303 |
Bosch Ltd. (a) | 2,592 | | 428,659 |
Colgate-Palmolive (India) | 18,317 | | 437,661 |
HDFC Bank Ltd. | 50,379 | | 591,549 |
Housing Development Finance Corp. Ltd. (a) | 40,528 | | 574,231 |
ITC Ltd. | 104,981 | | 551,294 |
Page Industries Ltd. | 7,002 | | 436,302 |
Smithkline Beecham Consumer Healthcare Ltd. | 8,424 | | 475,489 |
Titan Industries Ltd. (a) | 95,357 | | 459,550 |
TTK Prestige Ltd. (a) | 7,121 | | 424,276 |
TOTAL INDIA | | 5,282,094 |
Indonesia - 3.9% |
PT ACE Hardware Indonesia Tbk | 676,000 | | 492,658 |
PT Bank Central Asia Tbk | 546,000 | | 466,130 |
PT Bank Rakyat Indonesia Tbk | 620,500 | | 478,051 |
PT Global Mediacom Tbk | 1,932,000 | | 457,603 |
PT Jasa Marga Tbk | 751,500 | | 453,793 |
PT Mitra Adiperkasa Tbk | 598,000 | | 407,796 |
PT Modern Internasional Tbk (a) | 6,254,500 | | 481,865 |
PT Modern Internasional Tbk rights 11/8/12 (a) | 1,876,350 | | 37,117 |
PT Semen Gresik (Persero) Tbk | 307,000 | | 476,240 |
PT Surya Citra Media Tbk | 2,020,000 | | 410,097 |
PT Tower Bersama Infrastructure Tbk (a) | 950,000 | | 494,532 |
TOTAL INDONESIA | | 4,655,882 |
Ireland - 0.7% |
Accenture PLC Class A | 6,300 | | 424,683 |
Dragon Oil PLC | 47,300 | | 423,634 |
TOTAL IRELAND | | 848,317 |
Common Stocks - continued |
| Shares | | Value |
Israel - 0.4% |
Check Point Software Technologies Ltd. (a) | 9,700 | | $ 431,941 |
Italy - 1.9% |
Fiat Industrial SpA | 43,588 | | 472,029 |
Pirelli & C SpA (d) | 41,340 | | 478,763 |
Prada SpA | 60,100 | | 490,103 |
Saipem SpA | 11,108 | | 499,022 |
Salvatore Ferragamo Italia SpA (d) | 18,800 | | 381,841 |
TOTAL ITALY | | 2,321,758 |
Japan - 6.9% |
Daihatsu Motor Co. Ltd. | 28,000 | | 490,342 |
Daito Trust Construction Co. Ltd. | 4,300 | | 434,148 |
Fanuc Corp. | 4,300 | | 684,617 |
Fast Retailing Co. Ltd. | 2,300 | | 512,264 |
Hitachi Ltd. | 117,000 | | 619,955 |
Japan Tobacco, Inc. | 23,400 | | 646,629 |
Kansai Paint Co. Ltd. | 42,000 | | 451,935 |
Keyence Corp. | 1,940 | | 514,709 |
Komatsu Ltd. | 27,700 | | 580,163 |
Kubota Corp. | 50,000 | | 511,086 |
Nabtesco Corp. | 24,700 | | 459,780 |
Rakuten, Inc. | 51,700 | | 464,996 |
SMC Corp. | 3,400 | | 535,789 |
Sysmex Corp. | 9,700 | | 456,263 |
Unicharm Corp. | 8,600 | | 465,389 |
USS Co. Ltd. | 4,130 | | 434,056 |
TOTAL JAPAN | | 8,262,121 |
Korea (South) - 1.3% |
Samsung Electronics Co. Ltd. | 1,305 | | 1,567,934 |
Mexico - 1.3% |
Fomento Economico Mexicano SAB de CV sponsored ADR | 6,000 | | 543,660 |
Grupo Mexico SA de CV Series B | 170,600 | | 546,691 |
Grupo Televisa SA de CV (CPO) sponsored ADR | 21,400 | | 483,640 |
TOTAL MEXICO | | 1,573,991 |
Netherlands - 2.5% |
ASML Holding NV (Netherlands) | 11,400 | | 626,684 |
Core Laboratories NV | 4,475 | | 463,879 |
Heineken Holding NV (A Shares) | 11,100 | | 563,261 |
Kweichow Moutai Co. Ltd. (BNP Paribas Warrant Program) warrants 8/20/13 (a)(e) | 12,200 | | 483,795 |
Common Stocks - continued |
| Shares | | Value |
Netherlands - continued |
LyondellBasell Industries NV Class A | 8,090 | | $ 431,925 |
Yandex NV (a) | 17,300 | | 402,744 |
TOTAL NETHERLANDS | | 2,972,288 |
Nigeria - 0.7% |
Guaranty Trust Bank PLC | 3,615,519 | | 455,796 |
Nigerian Breweries PLC | 498,349 | | 384,566 |
TOTAL NIGERIA | | 840,362 |
Panama - 0.4% |
Intergroup Financial Services Corp. | 14,121 | | 451,872 |
Philippines - 2.4% |
Alliance Global Group, Inc. | 1,265,800 | | 458,275 |
International Container Terminal Services, Inc. | 265,800 | | 459,168 |
Metropolitan Bank & Trust Co. | 200,800 | | 464,136 |
Security Bank Corp. | 112,840 | | 444,496 |
SM Investments Corp. | 25,760 | | 503,291 |
SM Prime Holdings, Inc. | 1,440,950 | | 508,364 |
TOTAL PHILIPPINES | | 2,837,730 |
Portugal - 0.3% |
Jeronimo Martins SGPS SA | 24,500 | | 428,702 |
Russia - 1.4% |
Magnit OJSC GDR (Reg. S) | 14,395 | | 511,023 |
NOVATEK OAO GDR (Reg. S) | 4,400 | | 501,600 |
Sberbank (Savings Bank of the Russian Federation) | 219,300 | | 641,983 |
TOTAL RUSSIA | | 1,654,606 |
Singapore - 0.4% |
Jardine Cycle & Carriage Ltd. | 11,000 | | 444,040 |
South Africa - 1.7% |
Mr Price Group Ltd. | 31,700 | | 489,723 |
Nampak Ltd. | 128,000 | | 426,635 |
Naspers Ltd. Class N | 10,000 | | 649,213 |
Shoprite Holdings Ltd. | 25,400 | | 522,316 |
TOTAL SOUTH AFRICA | | 2,087,887 |
Spain - 1.0% |
Amadeus IT Holding SA Class A | 20,500 | | 507,508 |
Inditex SA | 5,219 | | 665,908 |
TOTAL SPAIN | | 1,173,416 |
Common Stocks - continued |
| Shares | | Value |
Sweden - 2.2% |
ASSA ABLOY AB (B Shares) | 16,006 | | $ 533,541 |
Atlas Copco AB (A Shares) | 27,000 | | 663,918 |
Elekta AB (B Shares) | 34,800 | | 495,801 |
Getinge AB (B Shares) | 14,600 | | 449,034 |
Swedish Match Co. AB | 14,200 | | 483,831 |
TOTAL SWEDEN | | 2,626,125 |
Switzerland - 5.3% |
Compagnie Financiere Richemont SA Series A | 11,208 | | 726,901 |
Dufry AG (a) | 3,660 | | 464,525 |
Nestle SA | 30,826 | | 1,956,208 |
Schindler Holding AG (Reg.) | 4,030 | | 521,438 |
SGS SA (Reg.) | 250 | | 529,368 |
Swatch Group AG (Bearer) | 1,460 | | 604,192 |
Syngenta AG (Switzerland) | 1,990 | | 775,880 |
UBS AG | 49,320 | | 739,977 |
TOTAL SWITZERLAND | | 6,318,489 |
Taiwan - 0.8% |
Taiwan Semiconductor Manufacturing Co. Ltd. sponsored ADR | 59,200 | | 941,280 |
Thailand - 1.6% |
C.P. ALL PCL (For. Reg.) | 402,000 | | 521,014 |
Home Product Center PCL (For. Reg.) | 1,145,280 | | 425,699 |
Kasikornbank PCL (For. Reg.) | 81,300 | | 477,144 |
Siam Commercial Bank PCL (For. Reg.) | 87,200 | | 457,750 |
TOTAL THAILAND | | 1,881,607 |
Turkey - 1.2% |
Coca-Cola Icecek A/S | 24,000 | | 465,941 |
TAV Havalimanlari Holding A/S | 97,000 | | 481,618 |
Turkiye Garanti Bankasi A/S | 114,000 | | 544,402 |
TOTAL TURKEY | | 1,491,961 |
United Kingdom - 13.4% |
Aggreko PLC | 14,300 | | 496,147 |
AMEC PLC | 25,411 | | 434,674 |
Antofagasta PLC | 26,200 | | 531,463 |
BHP Billiton PLC ADR | 27,689 | | 1,771,542 |
British American Tobacco PLC (United Kingdom) | 22,600 | | 1,120,951 |
Burberry Group PLC | 29,600 | | 556,963 |
Diageo PLC sponsored ADR | 7,800 | | 891,072 |
Halma PLC | 62,500 | | 415,944 |
Common Stocks - continued |
| Shares | | Value |
United Kingdom - continued |
IMI PLC | 32,700 | | $ 503,686 |
Imperial Tobacco Group PLC | 19,275 | | 727,858 |
InterContinental Hotel Group PLC ADR | 16,766 | | 412,779 |
Intertek Group PLC | 11,700 | | 532,252 |
Johnson Matthey PLC | 13,031 | | 472,937 |
Meggitt PLC | 78,600 | | 489,605 |
Prudential PLC | 52,499 | | 721,000 |
Reckitt Benckiser Group PLC | 11,500 | | 695,930 |
Rexam PLC | 68,400 | | 493,070 |
Rolls-Royce Group PLC | 46,500 | | 641,211 |
Rolls-Royce Group PLC Class C | 3,632,800 | | 5,862 |
Rotork PLC | 11,900 | | 437,459 |
SABMiller PLC | 16,300 | | 698,243 |
Spectris PLC | 17,300 | | 482,421 |
Standard Chartered PLC (United Kingdom) | 35,620 | | 841,246 |
The Weir Group PLC | 16,700 | | 469,462 |
Unilever PLC | 32,000 | | 1,193,702 |
TOTAL UNITED KINGDOM | | 16,037,479 |
United States of America - 16.0% |
Allergan, Inc. | 4,769 | | 428,828 |
Altria Group, Inc. | 11,000 | | 349,800 |
American Tower Corp. | 6,100 | | 459,269 |
Apple, Inc. | 693 | | 412,404 |
Caterpillar, Inc. | 5,400 | | 457,974 |
Citrix Systems, Inc. (a) | 5,900 | | 364,679 |
Coach, Inc. | 7,000 | | 392,350 |
Colgate-Palmolive Co. | 4,180 | | 438,733 |
Crown Castle International Corp. (a) | 6,600 | | 440,550 |
Cummins, Inc. | 5,020 | | 469,772 |
Danaher Corp. | 7,469 | | 386,371 |
Deere & Co. | 4,800 | | 410,112 |
EMC Corp. (a) | 17,700 | | 432,234 |
Estee Lauder Companies, Inc. Class A | 7,188 | | 442,925 |
FMC Corp. | 7,700 | | 412,104 |
FMC Technologies, Inc. (a) | 9,800 | | 400,820 |
Freeport-McMoRan Copper & Gold, Inc. | 11,284 | | 438,722 |
Google, Inc. Class A (a) | 520 | | 353,480 |
Intuitive Surgical, Inc. (a) | 800 | | 433,776 |
Joy Global, Inc. | 7,570 | | 472,747 |
KLA-Tencor Corp. | 9,200 | | 427,984 |
Limited Brands, Inc. | 8,800 | | 421,432 |
Common Stocks - continued |
| Shares | | Value |
United States of America - continued |
Lorillard, Inc. | 3,906 | | $ 453,135 |
MasterCard, Inc. Class A | 960 | | 442,493 |
McGraw-Hill Companies, Inc. | 8,015 | | 443,069 |
Mead Johnson Nutrition Co. Class A | 6,759 | | 416,760 |
Mettler-Toledo International, Inc. (a) | 2,600 | | 440,362 |
Monsanto Co. | 4,276 | | 368,035 |
Moody's Corp. | 9,300 | | 447,888 |
National Oilwell Varco, Inc. | 5,850 | | 431,145 |
NIKE, Inc. Class B | 4,600 | | 420,348 |
Oceaneering International, Inc. | 7,600 | | 397,708 |
Oracle Corp. | 14,180 | | 440,289 |
Perrigo Co. | 3,801 | | 437,153 |
Philip Morris International, Inc. | 5,342 | | 473,088 |
QUALCOMM, Inc. | 7,000 | | 410,025 |
Rockwood Holdings, Inc. | 9,400 | | 431,460 |
SBA Communications Corp. Class A (a) | 6,900 | | 459,747 |
Starbucks Corp. | 8,975 | | 411,953 |
The Coca-Cola Co. | 11,200 | | 416,416 |
TJX Companies, Inc. | 9,700 | | 403,811 |
Union Pacific Corp. | 3,500 | | 430,605 |
Visa, Inc. Class A | 3,200 | | 444,032 |
Waters Corp. (a) | 5,500 | | 449,955 |
Yum! Brands, Inc. | 7,000 | | 490,770 |
TOTAL UNITED STATES OF AMERICA | | 19,207,313 |
TOTAL COMMON STOCKS (Cost $105,494,246) |
118,573,177
|
Nonconvertible Preferred Stocks - 0.6% |
| | | |
Germany - 0.6% |
Volkswagen AG
(Cost $582,736) | 3,600 | |
744,716
|
Money Market Funds - 1.6% |
| Shares | | Value |
Fidelity Securities Lending Cash Central Fund, 0.19% (b)(c)
(Cost $1,864,522) | 1,864,522 | | $ 1,864,522 |
TOTAL INVESTMENT PORTFOLIO - 101.1% (Cost $107,941,504) | | 121,182,415 |
NET OTHER ASSETS (LIABILITIES) - (1.1)% | | (1,319,840) |
NET ASSETS - 100% | $ 119,862,575 |
Legend |
(a) Non-income producing |
(b) Affiliated fund that is available only to investment companies and other accounts managed by Fidelity Investments. The rate quoted is the annualized seven-day yield of the fund at period end. A complete unaudited listing of the fund's holdings as of its most recent quarter end is available upon request. In addition, each Fidelity Central Fund's financial statements, which are not covered by the Fund's Report of Independent Registered Public Accounting Firm, are available on the SEC's website or upon request. |
(c) Investment made with cash collateral received from securities on loan. |
(d) Security or a portion of the security is on loan at period end. |
(e) Security exempt from registration under Rule 144A of the Securities Act of 1933. These securities may be resold in transactions exempt from registration, normally to qualified institutional buyers. At the end of the period, the value of these securities amounted to $483,795 or 0.4% of net assets. |
Affiliated Central Funds |
Information regarding fiscal year to date income earned by the Fund from investments in Fidelity Central Funds is as follows: |
Fund | Income earned |
Fidelity Cash Central Fund | $ 436 |
Fidelity Securities Lending Cash Central Fund | 43,177 |
Total | $ 43,613 |
Other Information |
Categorizations in the Schedule of Investments are based on country or territory of incorporation. |
The following is a summary of the inputs used, as of October 31, 2012, involving the Fund's assets and liabilities carried at fair value. The inputs or methodology used for valuing securities may not be an indication of the risk associated with investing in those securities. For more information on valuation inputs, and their aggregation into the levels used in the table below, please refer to the Security Valuation section in the accompanying Notes to Financial Statements. |
Valuation Inputs at Reporting Date: |
Description | Total | Level 1 | Level 2 | Level 3 |
Investments in Securities: | | | | |
Equities: | | | | |
Consumer Discretionary | $ 23,396,344 | $ 23,359,227 | $ 37,117 | $ - |
Consumer Staples | 23,043,166 | 19,835,332 | 3,207,834 | - |
Energy | 4,093,132 | 4,093,132 | - | - |
Financials | 14,437,596 | 11,901,275 | 2,536,321 | - |
Health Care | 6,378,865 | 6,378,865 | - | - |
Industrials | 20,751,504 | 20,751,504 | - | - |
Information Technology | 12,969,933 | 11,452,859 | 1,517,074 | - |
Materials | 12,185,005 | 11,409,125 | 775,880 | - |
Telecommunication Services | 2,062,348 | 2,062,348 | - | - |
Money Market Funds | 1,864,522 | 1,864,522 | - | - |
Total Investments in Securities: | $ 121,182,415 | $ 113,108,189 | $ 8,074,226 | $ - |
The following is a summary of transfers between Level 1 and Level 2 for the period ended October 31, 2012. Transfers are assumed to have occurred at the beginning of the period, and are primarily attributable to the valuation techniques used for foreign equity securities, as discussed in the accompanying Notes to Financial Statements: |
Transfers | Total |
Level 1 to Level 2 | $ 0 |
Level 2 to Level 1 | $ 14,753,550 |
See accompanying notes which are an integral part of the financial statements.
Annual Report
Statement of Assets and Liabilities
| October 31, 2012 |
| | |
Assets | | |
Investment in securities, at value (including securities loaned of $1,753,785) - See accompanying schedule: Unaffiliated issuers (cost $106,076,982) | $ 119,317,893 | |
Fidelity Central Funds (cost $1,864,522) | 1,864,522 | |
Total Investments (cost $107,941,504) | | $ 121,182,415 |
Foreign currency held at value (cost $16,193) | | 16,193 |
Receivable for investments sold | | 2,065,672 |
Receivable for fund shares sold | | 101,786 |
Dividends receivable | | 299,498 |
Distributions receivable from Fidelity Central Funds | | 1,539 |
Receivable from investment adviser for expense reductions | | 24,134 |
Other receivables | | 269,625 |
Total assets | | 123,960,862 |
| | |
Liabilities | | |
Payable to custodian bank | $ 100,464 | |
Payable for investments purchased | 1,529,291 | |
Payable for fund shares redeemed | 291,050 | |
Accrued management fee | 95,137 | |
Distribution and service plan fees payable | 48,957 | |
Other affiliated payables | 34,491 | |
Other payables and accrued expenses | 134,375 | |
Collateral on securities loaned, at value | 1,864,522 | |
Total liabilities | | 4,098,287 |
| | |
Net Assets | | $ 119,862,575 |
Net Assets consist of: | | |
Paid in capital | | $ 211,267,935 |
Undistributed net investment income | | 532,563 |
Accumulated undistributed net realized gain (loss) on investments and foreign currency transactions | | (105,052,276) |
Net unrealized appreciation (depreciation) on investments and assets and liabilities in foreign currencies | | 13,114,353 |
Net Assets | | $ 119,862,575 |
See accompanying notes which are an integral part of the financial statements.
Annual Report
Financial Statements - continued
Statement of Assets and Liabilities - continued
| October 31, 2012 |
| | |
Calculation of Maximum Offering Price | | |
Class A:
Net Asset Value and redemption price per share ($40,624,485 ÷ 3,610,960 shares) | | $ 11.25 |
| | |
Maximum offering price per share (100/94.25 of $11.25) | | $ 11.94 |
Class T:
Net Asset Value and redemption price per share ($53,834,806 ÷ 4,882,971 shares) | | $ 11.03 |
| | |
Maximum offering price per share (100/96.50 of $11.03) | | $ 11.43 |
Class B:
Net Asset Value and offering price per share ($2,745,364 ÷ 268,552 shares)A | | $ 10.22 |
| | |
Class C:
Net Asset Value and offering price per share ($18,090,206 ÷ 1,776,200 shares)A | | $ 10.18 |
| | |
| | |
Institutional Class:
Net Asset Value, offering price and redemption price per share ($4,567,714 ÷ 381,117 shares) | | $ 11.99 |
A Redemption price per share is equal to net asset value less any applicable contingent deferred sales charge.
See accompanying notes which are an integral part of the financial statements.
Annual Report
Statement of Operations
| Year ended October 31, 2012 |
| | |
Investment Income | | |
Dividends | | $ 2,771,155 |
Income from Fidelity Central Funds | | 43,613 |
Income before foreign taxes withheld | | 2,814,768 |
Less foreign taxes withheld | | (210,901) |
Total income | | 2,603,867 |
| | |
Expenses | | |
Management fee
Basic fee | $ 860,534 | |
Performance adjustment | 292,951 | |
Transfer agent fees | 360,582 | |
Distribution and service plan fees | 597,133 | |
Accounting and security lending fees | 63,466 | |
Custodian fees and expenses | 139,257 | |
Independent trustees' compensation | 802 | |
Registration fees | 62,236 | |
Audit | 76,485 | |
Legal | 515 | |
Miscellaneous | 1,196 | |
Total expenses before reductions | 2,455,157 | |
Expense reductions | (445,311) | 2,009,846 |
Net investment income (loss) | | 594,021 |
Realized and Unrealized Gain (Loss) Net realized gain (loss) on: | | |
Investment securities: | | |
Unaffiliated issuers | 3,362,667 | |
Foreign currency transactions | (88,127) | |
Total net realized gain (loss) | | 3,274,540 |
Change in net unrealized appreciation (depreciation) on: Investment securities (net of increase in deferred foreign taxes of $38,920) | 8,560,477 | |
Assets and liabilities in foreign currencies | (9,406) | |
Total change in net unrealized appreciation (depreciation) | | 8,551,071 |
Net gain (loss) | | 11,825,611 |
Net increase (decrease) in net assets resulting from operations | | $ 12,419,632 |
See accompanying notes which are an integral part of the financial statements.
Annual Report
Financial Statements - continued
Statement of Changes in Net Assets
| Year ended
October 31,
2012 | Year ended
October 31,
2011 |
Increase (Decrease) in Net Assets | | |
Operations | | |
Net investment income (loss) | $ 594,021 | $ 730,290 |
Net realized gain (loss) | 3,274,540 | 8,411,487 |
Change in net unrealized appreciation (depreciation) | 8,551,071 | (14,294,405) |
Net increase (decrease) in net assets resulting
from operations | 12,419,632 | (5,152,628) |
Distributions to shareholders from net investment income | (721,694) | (760,710) |
Distributions to shareholders from net realized gain | (61,587) | (1,721,042) |
Total distributions | (783,281) | (2,481,752) |
Share transactions - net increase (decrease) | (20,248,751) | (24,900,583) |
Redemption fees | 1,999 | 3,558 |
Total increase (decrease) in net assets | (8,610,401) | (32,531,405) |
| | |
Net Assets | | |
Beginning of period | 128,472,976 | 161,004,381 |
End of period (including undistributed net investment income of $532,563 and undistributed net investment income of $717,375, respectively) | $ 119,862,575 | $ 128,472,976 |
See accompanying notes which are an integral part of the financial statements.
Annual Report
Financial Highlights - Class A
Years ended October 31, | 2012 | 2011 | 2010 | 2009 | 2008 |
Selected Per-Share Data | | | | | |
Net asset value, beginning of period | $ 10.21 | $ 10.85 | $ 9.34 | $ 6.39 | $ 18.64 |
Income from Investment Operations | | | | | |
Net investment income (loss)C | .08 | .08 F | .06 | .09 | .11 |
Net realized and unrealized gain (loss) | 1.05 | (.53) | 1.69 | 2.88 | (8.42) |
Total from investment operations | 1.13 | (.45) | 1.75 | 2.97 | (8.31) |
Distributions from net investment income | (.09) | (.08) | (.08) | (.02) | (.05) |
Distributions from net realized gain | (.01) | (.12) | (.16) | - | (3.89) |
Total distributions | (.09) I | (.19) J | (.24) | (.02) | (3.94) |
Redemption fees added to paid in capital C, H | - | - | - | - | - |
Net asset value, end of period | $ 11.25 | $ 10.21 | $ 10.85 | $ 9.34 | $ 6.39 |
Total Return A, B | 11.19% | (4.25)% | 18.98% | 46.61% | (55.70)% |
Ratios to Average Net AssetsD, G | | | | | |
Expenses before reductions | 1.78% | 1.64% | 1.45% | 1.27% | 1.42% |
Expenses net of fee waivers, if any | 1.45% | 1.45% | 1.45% | 1.27% | 1.42% |
Expenses net of all reductions | 1.41% | 1.38% | 1.27% | 1.15% | 1.25% |
Net investment income (loss) | .73% | .74% F | .66% | 1.22% | .95% |
Supplemental Data | | | | | |
Net assets, end of period (000 omitted) | $ 40,624 | $ 40,364 | $ 49,058 | $ 43,389 | $ 35,517 |
Portfolio turnover rate E | 142% | 254% | 490% | 414% | 394% |
A Total returns would have been lower if certain expenses had not been reduced during the applicable periods shown.
B Total returns do not include the effect of the sales charges.
C Calculated based on average shares outstanding during the period.
D Fees and expenses of any underlying Fidelity Central Funds are not included in the Fund's expense ratio. The Fund indirectly bears its proportionate share of the expenses of any underlying Fidelity Central Funds.
E Amount does not include the portfolio activity of any underlying Fidelity Central Funds.
F Investment income per share reflects a large, non-recurring dividend which amounted to $.03 per share. Excluding this non-recurring dividend, the ratio of net investment income (loss) to average net assets would have been .49%.
G Expense ratios reflect operating expenses of the class. Expenses before reductions do not reflect amounts reimbursed by the investment adviser or reductions from brokerage service arrangements or reductions from other expense offset arrangements and do not represent the amount paid by the class during periods when reimbursements or reductions occur. Expenses net of fee waivers reflect expenses after reimbursement by the investment adviser but prior to reductions from brokerage service arrangements or other expense offset arrangements. Expenses net of all reductions represent the net expenses paid by the class.
H Amount represents less than $.01 per share.
I Total distributions of $.09 per share is comprised of distributions from net investment income of $.085 and distributions from net realized gain of $.005 per share.
J Total distributions of $.19 per share is comprised of distributions from net investment income of $.077 and distributions from net realized gain of $.116 per share.
See accompanying notes which are an integral part of the financial statements.
Annual Report
Financial Highlights - Class T
Years ended October 31, | 2012 | 2011 | 2010 | 2009 | 2008 |
Selected Per-Share Data | | | | | |
Net asset value, beginning of period | $ 10.00 | $ 10.63 | $ 9.16 | $ 6.28 | $ 18.38 |
Income from Investment Operations | | | | | |
Net investment income (loss)C | .05 | .05F | .04 | .07 | .08 |
Net realized and unrealized gain (loss) | 1.04 | (.52) | 1.65 | 2.82 | (8.28) |
Total from investment operations | 1.09 | (.47) | 1.69 | 2.89 | (8.20) |
Distributions from net investment income | (.06) | (.05) | (.06) | (.01) | (.01) |
Distributions from net realized gain | (.01) | (.12) | (.16) | - | (3.89) |
Total distributions | (.06) I | (.16) J | (.22) | (.01) | (3.90) |
Redemption fees added to paid in capital C, H | - | - | - | - | - |
Net asset value, end of period | $ 11.03 | $ 10.00 | $ 10.63 | $ 9.16 | $ 6.28 |
Total ReturnA, B | 10.99% | (4.51)% | 18.65% | 46.23% | (55.79)% |
Ratios to Average Net AssetsD, G | | | | | |
Expenses before reductions | 2.03% | 1.88% | 1.69% | 1.52% | 1.65% |
Expenses net of fee waivers, if any | 1.70% | 1.70% | 1.69% | 1.52% | 1.65% |
Expenses net of all reductions | 1.66% | 1.62% | 1.51% | 1.41% | 1.48% |
Net investment income (loss) | .48% | .49% F | .42% | .96% | .71% |
Supplemental Data | | | | | |
Net assets, end of period (000 omitted) | $ 53,835 | $ 59,914 | $ 74,056 | $ 78,005 | $ 57,603 |
Portfolio turnover rate E | 142% | 254% | 490% | 414% | 394% |
A Total returns would have been lower if certain expenses had not been reduced during the applicable periods shown.
B Total returns do not include the effect of the sales charges.
C Calculated based on average shares outstanding during the period.
D Fees and expenses of any underlying Fidelity Central Funds are not included in the Fund's expense ratio. The Fund indirectly bears its proportionate share of the expenses of any underlying Fidelity Central Funds.
E Amount does not include the portfolio activity of any underlying Fidelity Central Funds.
F Investment income per share reflects a large, non-recurring dividend which amounted to $.03 per share. Excluding this non-recurring dividend, the ratio of net investment income (loss) to average net assets would have been .24%.
G Expense ratios reflect operating expenses of the class. Expenses before reductions do not reflect amounts reimbursed by the investment adviser or reductions from brokerage service arrangements or reductions from other expense offset arrangements and do not represent the amount paid by the class during periods when reimbursements or reductions occur. Expenses net of fee waivers reflect expenses after reimbursement by the investment adviser but prior to reductions from brokerage service arrangements or other expense offset arrangements. Expenses net of all reductions represent the net expenses paid by the class.
H Amount represents less than $.01 per share.
I Total distributions of $.06 per share is comprised of distributions from net investment income of $.056 and distributions from net realized gain of $.005 per share.
J Total distributions of $.16 per share is comprised of distributions from net investment income of $.047 and distributions from net realized gain of $.116 per share.
See accompanying notes which are an integral part of the financial statements.
Annual Report
Financial Highlights - Class B
Years ended October 31, | 2012 | 2011 | 2010 | 2009 | 2008 |
Selected Per-Share Data | | | | | |
Net asset value, beginning of period | $ 9.26 | $ 9.84 | $ 8.51 | $ 5.86 | $ 17.36 |
Income from Investment Operations | | | | | |
Net investment income (loss) C | - H | - F, H | (.01) | .03 | .02 |
Net realized and unrealized gain (loss) | .96 | (.48) | 1.53 | 2.63 | (7.75) |
Total from investment operations | .96 | (.48) | 1.52 | 2.66 | (7.73) |
Distributions from net investment income | - | (.01) | (.03) | (.01) | - |
Distributions from net realized gain | - | (.09) | (.16) | - | (3.77) |
Total distributions | - | (.10) | (.19) | (.01) | (3.77) |
Redemption fees added to paid in capital C,H | - | - | - | - | - |
Net asset value, end of period | $ 10.22 | $ 9.26 | $ 9.84 | $ 8.51 | $ 5.86 |
Total ReturnA, B | 10.37% | (4.99)% | 18.03% | 45.50% | (56.02)% |
Ratios to Average Net AssetsD, G | | | | | |
Expenses before reductions | 2.54% | 2.39% | 2.20% | 2.02% | 2.17% |
Expenses net of fee waivers, if any | 2.20% | 2.20% | 2.20% | 2.02% | 2.17% |
Expenses net of all reductions | 2.16% | 2.13% | 2.02% | 1.90% | 2.01% |
Net investment income (loss) | (.02)% | (.01)% F | (.09)% | .47% | .19% |
Supplemental Data | | | | | |
Net assets, end of period (000 omitted) | $ 2,745 | $ 4,241 | $ 8,737 | $ 10,661 | $ 10,356 |
Portfolio turnover rate E | 142% | 254% | 490% | 414% | 394% |
A Total returns would have been lower if certain expenses had not been reduced during the applicable periods shown.
B Total returns do not include the effect of the contingent deferred sales charge.
C Calculated based on average shares outstanding during the period.
D Fees and expenses of any underlying Fidelity Central Funds are not included in the Fund's expense ratio. The Fund indirectly bears its proportionate share of the expenses of any underlying Fidelity Central Funds.
E Amount does not include the portfolio activity of any underlying Fidelity Central Funds.
F Investment income per share reflects a large, non-recurring dividend which amounted to $.03 per share. Excluding this non-recurring dividend, the ratio of net investment income (loss) to average net assets would have been (.26) %.
G Expense ratios reflect operating expenses of the class. Expenses before reductions do not reflect amounts reimbursed by the investment adviser or reductions from brokerage service arrangements or reductions from other expense offset arrangements and do not represent the amount paid by the class during periods when reimbursements or reductions occur. Expenses net of fee waivers reflect expenses after reimbursement by the investment adviser but prior to reductions from brokerage service arrangements or other expense offset arrangements. Expenses net of all reductions represent the net expenses paid by the class.
H Amount represents less than $.01 per share.
See accompanying notes which are an integral part of the financial statements.
Annual Report
Financial Highlights - Class C
Years ended October 31, | 2012 | 2011 | 2010 | 2009 | 2008 |
Selected Per-Share Data | | | | | |
Net asset value, beginning of period | $ 9.23 | $ 9.84 | $ 8.51 | $ 5.87 | $ 17.42 |
Income from Investment Operations | | | | | |
Net investment income (loss) C | - H | -F, H | (.01) | .03 | .02 |
Net realized and unrealized gain (loss) | .96 | (.49) | 1.53 | 2.62 | (7.75) |
Total from investment operations | .96 | (.49) | 1.52 | 2.65 | (7.73) |
Distributions from net investment income | (.01) | (.01) | (.04) | (.01) | - |
Distributions from net realized gain | (.01) | (.11) | (.16) | - | (3.82) |
Total distributions | (.01) I | (.12) | (.19) J | (.01) | (3.82) |
Redemption fees added to paid in capital C,H | - | - | - | - | - |
Net asset value, end of period | $ 10.18 | $ 9.23 | $ 9.84 | $ 8.51 | $ 5.87 |
Total Return A, B | 10.41% | (5.07)% | 18.12% | 45.26% | (55.95)% |
Ratios to Average Net Assets D, G | | | | | |
Expenses before reductions | 2.53% | 2.39% | 2.20% | 2.02% | 2.16% |
Expenses net of fee waivers, if any | 2.20% | 2.20% | 2.20% | 2.02% | 2.16% |
Expenses net of all reductions | 2.16% | 2.13% | 2.02% | 1.90% | 2.00% |
Net investment income (loss) | (.02)% | (.01)% F | (.09)% | .47% | .20% |
Supplemental Data | | | | | |
Net assets, end of period (000 omitted) | $ 18,090 | $ 19,619 | $ 24,809 | $ 24,575 | $ 20,973 |
Portfolio turnover rate E | 142% | 254% | 490% | 414% | 394% |
A Total returns would have been lower if certain expenses had not been reduced during the applicable periods shown.
B Total returns do not include the effect of the contingent deferred sales charge.
C Calculated based on average shares outstanding during the period.
D Fees and expenses of any underlying Fidelity Central Funds are not included in the Fund's expense ratio. The Fund indirectly bears its proportionate share of the expenses of any underlying Fidelity Central Funds.
E Amount does not include the portfolio activity of any underlying Fidelity Central Funds.
F Investment income per share reflects a large, non-recurring dividend which amounted to $.03 per share. Excluding this non-recurring dividend, the ratio of net investment income (loss) to average net assets would have been (.26) %.
G Expense ratios reflect operating expenses of the class. Expenses before reductions do not reflect amounts reimbursed by the investment adviser or reductions from brokerage service arrangements or reductions from other expense offset arrangements and do not represent the amount paid by the class during periods when reimbursements or reductions occur. Expenses net of fee waivers reflect expenses after reimbursement by the investment adviser but prior to reductions from brokerage service arrangements or other expense offset arrangements. Expenses net of all reductions represent the net expenses paid by the class.
H Amount represents less than $.01 per share.
I Total distributions of $.01 per share is comprised of distributions from net investment income of $.005 and distributions from net realized gain of $.005 per share.
J Total distributions of $.19 per share is comprised of distributions from net investment income of $.037 and distributions from net realized gain of $.155 per share.
See accompanying notes which are an integral part of the financial statements.
Annual Report
Financial Highlights - Institutional Class
Years ended October 31, | 2012 | 2011 | 2010 | 2009 | 2008 |
Selected Per-Share Data | | | | | |
Net asset value, beginning of period | $ 10.87 | $ 11.54 | $ 9.91 | $ 6.77 | $ 19.49 |
Income from Investment Operations | | | | | |
Net investment income (loss) B | .11 | .12 E | .10 | .11 | .16 |
Net realized and unrealized gain (loss) | 1.13 | (.57) | 1.78 | 3.05 | (8.88) |
Total from investment operations | 1.24 | (.45) | 1.88 | 3.16 | (8.72) |
Distributions from net investment income | (.12) | (.11) | (.09) | (.02) | (.11) |
Distributions from net realized gain | (.01) | (.12) | (.16) | - | (3.89) |
Total distributions | (.12) H | (.22) I | (.25) | (.02) | (4.00) |
Redemption fees added to paid in capital B, G | - | - | - | - | - |
Net asset value, end of period | $ 11.99 | $ 10.87 | $ 11.54 | $ 9.91 | $ 6.77 |
Total ReturnA | 11.56% | (4.01)% | 19.22% | 46.85% | (55.51)% |
Ratios to Average Net AssetsC, F | | | | | |
Expenses before reductions | 1.48% | 1.35% | 1.19% | 1.00% | 1.12% |
Expenses net of fee waivers, if any | 1.20% | 1.20% | 1.19% | 1.00% | 1.12% |
Expenses net of all reductions | 1.16% | 1.12% | 1.01% | .89% | .95% |
Net investment income (loss) | .98% | 1.00% E | .93% | 1.48% | 1.24% |
Supplemental Data | | | | | |
Net assets, end of period (000 omitted) | $ 4,568 | $ 4,335 | $ 4,345 | $ 3,292 | $ 3,620 |
Portfolio turnover rateD | 142% | 254% | 490% | 414% | 394% |
A Total returns would have been lower if certain expenses had not been reduced during the applicable periods shown.
B Calculated based on average shares outstanding during the period.
C Fees and expenses of any underlying Fidelity Central Funds are not included in the Fund's expense ratio. The Fund indirectly bears its proportionate share of the expenses of any underlying Fidelity Central Funds.
D Amount does not include the portfolio activity of any underlying Fidelity Central Funds.
E Investment income per share reflects a large, non-recurring dividend which amounted to $.03 per share. Excluding this non-recurring dividend, the ratio of net investment income (loss) to average net assets would have been .74%.
F Expense ratios reflect operating expenses of the class. Expenses before reductions do not reflect amounts reimbursed by the investment adviser or reductions from brokerage service arrangements or reductions from other expense offset arrangements and do not represent the amount paid by the class during periods when reimbursements or reductions occur. Expenses net of fee waivers reflect expenses after reimbursement by the investment adviser but prior to reductions from brokerage service arrangements or other expense offset arrangements. Expenses net of all reductions represent the net expenses paid by the class.
G Amount represents less than $.01 per share.
H Total distributions of $.12 per share is comprised of distributions from net investment income of $.115 and distributions from net realized gain of $.005 per share.
I Total distributions of $.22 per share is comprised of distributions from net investment income of $.107 and distributions from net realized gain of $.116 per share.
See accompanying notes which are an integral part of the financial statements.
Annual Report
Notes to Financial Statements
For the period ended October 31, 2012
1. Organization.
Fidelity Advisor International Capital Appreciation Fund (the Fund) is a fund of Fidelity Advisor Series VIII (the Trust) and is authorized to issue an unlimited number of shares. The Trust is registered under the Investment Company Act of 1940, as amended (the 1940 Act), as an open-end management investment company organized as a Massachusetts business trust. The Fund offers Class A, Class T, Class C and Institutional Class shares, each of which, along with Class B shares, has equal rights as to assets and voting privileges. Effective after the close of business on September 1, 2010, Class B shares were closed to new accounts and additional purchases, except for exchanges and reinvestments. Each class has exclusive voting rights with respect to matters that affect that class. Class B shares will automatically convert to Class A shares after a holding period of seven years from the initial date of purchase. Investment income, realized and unrealized capital gains and losses, the common expenses of the Fund, and certain fund-level expense reductions, if any, are allocated on a pro-rata basis to each class based on the relative net assets of each class to the total net assets of the Fund. Each class differs with respect to transfer agent and distribution and service plan fees incurred. Certain expense reductions may also differ by class. The Fund's investments in emerging markets can be subject to social, economic, regulatory, and political uncertainties and can be extremely volatile.
2. Investments in Fidelity Central Funds.
The Fund invests in Fidelity Central Funds, which are open-end investment companies available only to other investment companies and accounts managed by Fidelity Management & Research Company (FMR) and its affiliates. The Fund's Schedule of Investments lists each of the Fidelity Central Funds held as of period end, if any, as an investment of the Fund, but does not include the underlying holdings of each Fidelity Central Fund. As an Investing Fund, the Fund indirectly bears its proportionate share of the expenses of the underlying Fidelity Central Funds.
The Money Market Central Funds seek preservation of capital and current income and are managed by Fidelity Investments Money Management, Inc. (FIMM), an affiliate of FMR.
A complete unaudited list of holdings for each Fidelity Central Fund is available upon request or at the Securities and Exchange Commission (the SEC) web site at www.sec.gov. In addition, the financial statements of the Fidelity Central Funds, which are not covered by the Fund's Report of Independent Registered Public Accounting Firm, are available on the SEC web site or upon request.
Annual Report
Notes to Financial Statements - continued
3. Significant Accounting Policies.
The financial statements have been prepared in conformity with accounting principles generally accepted in the United States of America (GAAP), which require management to make certain estimates and assumptions at the date of the financial statements. Actual results could differ from those estimates. Subsequent events, if any, through the date that the financial statements were issued have been evaluated in the preparation of the financial statements. The following summarizes the significant accounting policies of the Fund:
Security Valuation. Investments are valued as of 4:00 p.m. Eastern time on the last calendar day of the period. In accordance with valuation policies and procedures approved by the Board of Trustees (the Board), the Fund attempts to obtain prices from one or more third party pricing vendors or brokers to value its investments. When current market prices, quotations or rates are not readily available or reliable, securities will be fair valued in good faith by the FMR Fair Value Committee (the Committee), in accordance with procedures adopted by the Fund's Board. Factors used in determining fair value vary by security type and may include market or security specific events. The frequency with which these procedures are used cannot be predicted and they may be utilized to a significant extent. The Committee oversees the Fund's valuation policies and procedures and is responsible for approving and reporting to the Board all fair value determinations.
The Fund categorizes the inputs to valuation techniques used to value its investments into a disclosure hierarchy consisting of three levels as shown below:
Level 1 - quoted prices in active markets for identical investments
Level 2 - other significant observable inputs (including quoted prices for similar investments, interest rates, prepayment speeds, etc.)
Level 3 - unobservable inputs (including the Fund's own assumptions based on the best information available)
Valuation techniques used to value the Fund's investments by major category are as follows:
Equity securities, including restricted securities, for which market quotations are readily available, are valued at the last reported sale price or official closing price as reported by a third party pricing vendor on the primary market or exchange on which they are traded and are categorized as Level 1 in the hierarchy. In the event there were no sales during the day or closing prices are not available, securities are valued at the last quoted bid price or may be valued using the last available price and are generally categorized as Level 2 in the hierarchy. For foreign equity securities, when significant market or security specific events arise, comparisons to the valuation of American Depositary Receipts
Annual Report
3. Significant Accounting Policies - continued
Security Valuation - continued
(ADRs), futures contracts, Exchange-Traded Funds (ETFs) and certain indexes as well as quoted prices for similar securities are used and are categorized as Level 2 in the hierarchy. Utilizing these techniques may result in transfers between Level 1 and Level 2.
Investments in open-end mutual funds, including the Fidelity Central Funds, are valued at their closing net asset value (NAV) each business day and are categorized as Level 1 in the hierarchy.
Changes in valuation techniques may result in transfers in or out of an assigned level within the disclosure hierarchy. The aggregate value of investments by input level, as of October 31, 2012, including information on transfers between Levels 1 and 2, is included at the end of the Fund's Schedule of Investments.
Foreign Currency Translation. The Fund may use foreign currency contracts to facilitate transactions in foreign-denominated securities. Gains and losses from these transactions may arise from changes in the value of the foreign currency or if the counterparties do not perform under the contracts' terms.
Foreign-denominated assets, including investment securities, and liabilities are translated into U.S. dollars at the exchange rates at period end. Purchases and sales of investment securities, income and dividends received and expenses denominated in foreign currencies are translated into U.S. dollars at the exchange rate in effect on the transaction date.
The effects of exchange rate fluctuations on investments are included with the net realized and unrealized gain (loss) on investment securities. Other foreign currency transactions resulting in realized and unrealized gain (loss) are disclosed separately.
Investment Transactions and Income. For financial reporting purposes, the Fund's investment holdings and NAV include trades executed through the end of the last business day of the period. The NAV per share for processing shareholder transactions is calculated as of the close of business of the New York Stock Exchange (NYSE), normally 4:00 p.m. Eastern time and includes trades executed through the end of the prior business day. Gains and losses on securities sold are determined on the basis of identified cost and may include proceeds received from litigation. Dividend income is recorded on the ex-dividend date, except for certain dividends from foreign securities where the ex-dividend date may have passed, which are recorded as soon as the Fund is informed of the ex-dividend date. Non-cash dividends included in dividend income, if any, are recorded at the fair market value of the securities received. Interest income and distributions from the Fidelity Central Funds are accrued as earned. Investment income is recorded net of foreign taxes withheld where recovery of such taxes is uncertain.
Annual Report
Notes to Financial Statements - continued
3. Significant Accounting Policies - continued
Expenses. Expenses directly attributable to a fund are charged to that fund. Expenses attributable to more than one fund are allocated among the respective funds on the basis of relative net assets or other appropriate methods. Expense estimates are accrued in the period to which they relate and adjustments are made when actual amounts are known.
Income Tax Information and Distributions to Shareholders. Each year, the Fund intends to qualify as a regulated investment company under Subchapter M of the Internal Revenue Code, including distributing substantially all of its taxable income and realized gains. As a result, no provision for income taxes is required. As of October 31, 2012, the Fund did not have any unrecognized tax benefits in the financial statements; nor is the Fund aware of any tax positions for which it is reasonably possible that the total amounts of unrecognized tax benefits will significantly change in the next twelve months. The Fund files a U.S. federal tax return, in addition to state and local tax returns as required. A fund's federal income tax returns are subject to examination by the Internal Revenue Service (IRS) for a period of three fiscal years after they are filed. State and local tax returns may be subject to examination for an additional fiscal year depending on the jurisdiction. Foreign taxes are provided for based on the Fund's understanding of the tax rules and rates that exist in the foreign markets in which it invests. The Fund is subject to a tax imposed on capital gains by certain countries in which it invests. An estimated deferred tax liability for net unrealized appreciation on the applicable securities is included in Other payables and accrued expenses on the Statement of Assets & Liabilities.
Distributions are declared and recorded on the ex-dividend date. Income dividends and capital gain distributions are declared separately for each class. Income and capital gain distributions are determined in accordance with income tax regulations, which may differ from GAAP.
Capital accounts within the financial statements are adjusted for permanent book-tax differences. These adjustments have no impact on net assets or the results of operations. Temporary book-tax differences will reverse in a subsequent period.
Book-tax differences are primarily due to foreign currency transactions, passive foreign investment companies (PFIC), equity-debt classifications, capital loss carryforwards, and losses deferred due to wash sales.
The federal tax cost of investment securities and unrealized appreciation (depreciation) as of period end were as follows:
Gross unrealized appreciation | $ 14,580,827 |
Gross unrealized depreciation | (2,452,537) |
Net unrealized appreciation (depreciation) on securities and other investments | $ 12,128,290 |
| |
Tax Cost | $ 109,054,125 |
Annual Report
3. Significant Accounting Policies - continued
Income Tax Information and Distributions to Shareholders - continued
The tax-based components of distributable earnings as of period end were as follows:
Undistributed ordinary income | $ 532,563 |
Capital loss carryforward | $ (103,999,529) |
Net unrealized appreciation (depreciation) | $ 12,061,606 |
Capital loss carryforwards are only available to offset future capital gains of the Fund to the extent provided by regulations and may be limited. Under the Regulated Investment Company Modernization Act of 2010 (the Act), the Fund is permitted to carry forward capital losses incurred in taxable years beginning after December 22, 2010 for an unlimited period and such capital losses are required to be used prior to any losses that expire. Capital loss carryforwards were as follows:
Fiscal year of expiration | |
2016 | $ (80,031,657) |
2017 | (23,967,872) |
Total capital loss carryforward | $ (103,999,529) |
The tax character of distributions paid was as follows:
| October 31, 2012 | October 31, 2011 |
Ordinary Income | $ 783,281 | $ 2,481,752 |
Short-Term Trading (Redemption) Fees. Shares held by investors in the Fund less than 30 days are subject to a redemption fee equal to 1.00% of the net asset value of shares redeemed. All redemption fees, which reduce the proceeds of the shareholder redemption, are retained by the Fund and accounted for as an addition to paid in capital.
Restricted Securities. The Fund may invest in securities that are subject to legal or contractual restrictions on resale. These securities generally may be resold in transactions exempt from registration or to the public if the securities are registered. Disposal of these securities may involve time-consuming negotiations and expense, and prompt sale at an acceptable price may be difficult. Information regarding restricted securities is included at the end of the Fund's Schedule of Investments.
New Accounting Pronouncement. In December 2011, the Financial Accounting Standards Board issued Accounting Standard Update No. 2011-11, Disclosures about Offsetting Assets and Liabilities. The update creates new disclosure requirements requiring entities to disclose both gross and net information for derivatives and other financial instruments that are either offset in the Statement of Assets and Liabilities or
Annual Report
Notes to Financial Statements - continued
3. Significant Accounting Policies - continued
New Accounting Pronouncement - continued
subject to an enforceable master netting arrangement or similar agreement. The disclosure requirements are effective for annual reporting periods beginning on or after January 1, 2013, and interim periods within those annual periods. Management is currently evaluating the impact of the update's adoption on the Fund's financial statement disclosures.
4. Purchases and Sales of Investments.
Purchases and sales of securities, other than short-term securities, aggregated $171,987,771 and $190,378,005, respectively.
5. Fees and Other Transactions with Affiliates.
Management Fee. FMR and its affiliates provide the Fund with investment management related services for which the Fund pays a monthly management fee. The management fee is the sum of an individual fund fee rate that is based on an annual rate of .45% of the Fund's average net assets and an annualized group fee rate that averaged .26% during the period. The group fee rate is based upon the average net assets of all the mutual funds advised by FMR. The group fee rate decreases as assets under management increase and increases as assets under management decrease. In addition, the management fee is subject to a performance adjustment (up to a maximum of ± .20% of the Fund's average net assets over a 36 month performance period). The upward or downward adjustment to the management fee is based on the relative investment performance of the Institutional Class of the Fund as compared to an appropriate benchmark index. For the period, the total annual management fee rate, including the performance adjustment, was .95% of the Fund's average net assets.
Distribution and Service Plan Fees. In accordance with Rule 12b-1 of the 1940 Act, the Fund has adopted separate Distribution and Service Plans for each class of shares. Certain classes pay Fidelity Distributors Corporation (FDC), an affiliate of FMR, separate Distribution and Service Fees, each of which is based on an annual percentage of each class' average net assets. In addition, FDC may pay financial intermediaries for selling shares of the Fund and providing shareholder support services. For the period, the Distribution and Service Fee rates, total fees and amounts retained by FDC were as follows:
| Distribution
Fee | Service
Fee | Total Fees | Retained
by FDC |
Class A | -% | .25% | $ 99,529 | $ 1,057 |
Class T | .25% | .25% | 277,013 | 1,728 |
Class B | .75% | .25% | 33,850 | 25,495 |
Class C | .75% | .25% | 186,741 | 8,859 |
| | | $ 597,133 | $ 37,139 |
Annual Report
5. Fees and Other Transactions with Affiliates - continued
Sales Load. FDC may receive a front-end sales charge of up to 5.75% for selling Class A shares and 3.50% for selling Class T shares, some of which is paid to financial intermediaries for selling shares of the Fund. Depending on the holding period, FDC may receive contingent deferred sales charges levied on Class A, Class T, Class B, and Class C redemptions. The deferred sales charges range from 5.00% to 1.00% for Class B shares, 1.00% for Class C shares, 1.00% for certain purchases of Class A shares and .25% for certain purchases of Class T shares.
For the period, sales charge amounts retained by FDC were as follows:
| Retained
by FDC |
Class A | $ 6,896 |
Class T | 3,151 |
Class B* | 10,045 |
Class C* | 669 |
| $ 20,761 |
* When Class B and Class C shares are initially sold, FDC pays commissions from its own resources to financial intermediaries through which the sales are made.
Transfer Agent Fees. Fidelity Investments Institutional Operations Company, Inc. (FIIOC), an affiliate of FMR, is the transfer, dividend disbursing and shareholder servicing agent for each class of the Fund. FIIOC receives account fees and asset-based fees that vary according to the account size and type of account of the shareholders of the respective classes of the Fund. For the period, transfer agent fees for each class were as follows:
| Amount | % of
Average
Net Assets |
Class A | $ 119,875 | .30 |
Class T | 163,509 | .30 |
Class B | 10,211 | .30 |
Class C | 56,261 | .30 |
Institutional Class | 10,726 | .25 |
| $ 360,582 | |
Accounting and Security Lending Fees. Fidelity Service Company, Inc. (FSC), an affiliate of FMR, maintains the Fund's accounting records. The accounting fee is based on the level of average net assets for each month. Under a separate contract, FSC administers the security lending program. The security lending fee is based on the number and duration of lending transactions.
Annual Report
Notes to Financial Statements - continued
5. Fees and Other Transactions with Affiliates - continued
Brokerage Commissions. The Fund placed a portion of its portfolio transactions with brokerage firms which are affiliates of the investment adviser. The commissions paid to these affiliated firms were $843 for the period.
6. Committed Line of Credit.
The Fund participates with other funds managed by FMR or an affiliate in a $4.25 billion credit facility (the "line of credit") to be utilized for temporary or emergency purposes to fund shareholder redemptions or for other short-term liquidity purposes. The Fund has agreed to pay commitment fees on its pro-rata portion of the line of credit, which amounted to $336 and is reflected in Miscellaneous expenses on the Statement of Operations. During the period, there were no borrowings on this line of credit.
7. Security Lending.
The Fund lends portfolio securities through a lending agent from time to time in order to earn additional income. For equity securities, a lending agent is used and may loan securities to certain qualified borrowers, including Fidelity Capital Markets (FCM), a broker-dealer affiliated with the Fund. On the settlement date of the loan, the Fund receives collateral (in the form of U.S. Treasury obligations, letters of credit and/or cash) against the loaned securities and maintains collateral in an amount not less than 100% of the market value of the loaned securities during the period of the loan. The market value of the loaned securities is determined at the close of business of the Fund and any additional required collateral is delivered to the Fund on the next business day. If the borrower defaults on its obligation to return the securities loaned because of insolvency or other reasons, a fund could experience delays and costs in recovering the securities loaned or in gaining access to the collateral. Any cash collateral received is invested in the Fidelity Securities Lending Cash Central Fund. The value of loaned securities and cash collateral at period end are disclosed on the Fund's Statement of Assets and Liabilities. Security lending income represents the income earned on investing cash collateral, less rebates paid to borrowers and any lending agent fees associated with the loan, plus any premium payments received for lending certain types of securities. Security lending income is presented in the Statement of Operations as a component of income from Fidelity Central Funds. Total security lending income during the period amounted to $43,177. During the period, there were no securities loaned to FCM.
Annual Report
8. Expense Reductions.
FMR voluntarily agreed to reimburse each class to the extent annual operating expenses exceeded certain levels of average net assets as noted in the table below. Some expenses, for example interest expense, including commitment fees, are excluded from this reimbursement.
The following classes were in reimbursement during the period:
| Expense
Limitations | Reimbursement
from adviser |
| | |
Class A | 1.45% | $ 132,366 |
Class T | 1.70% | 181,526 |
Class B | 2.20% | 11,457 |
Class C | 2.20% | 62,372 |
Institutional Class | 1.20% | 12,038 |
| | $ 399,759 |
Many of the brokers with whom FMR places trades on behalf of the Fund provided services to the Fund in addition to trade execution. These services included payments of certain expenses on behalf of the Fund totaling $45,552 for the period.
9. Distributions to Shareholders.
Distributions to shareholders of each class were as follows:
Years ended October 31, | 2012 | 2011 |
From net investment income | | |
Class A | $ 338,785 | $ 351,944 |
Class T | 327,446 | 323,075 |
Class B | - | 9,663 |
Class C | 10,467 | 29,995 |
Institutional Class | 44,996 | 46,033 |
Total | $ 721,694 | $ 760,710 |
From net realized gain | | |
Class A | $ 19,929 | $ 529,480 |
Class T | 29,236 | 797,756 |
Class B | - | 70,707 |
Class C | 10,466 | 273,307 |
Institutional Class | 1,956 | 49,792 |
Total | $ 61,587 | $ 1,721,042 |
Annual Report
Notes to Financial Statements - continued
10. Share Transactions.
Transactions for each class of shares were as follows:
| Shares | Dollars |
Years ended October 31, | 2012 | 2011 | 2012 | 2011 |
Class A | | | | |
Shares sold | 501,429 | 721,944 | $ 5,286,360 | $ 7,956,982 |
Reinvestment of distributions | 32,796 | 72,790 | 324,358 | 801,552 |
Shares redeemed | (878,467) | (1,361,813) | (9,235,475) | (14,987,238) |
Net increase (decrease) | (344,242) | (567,079) | $ (3,624,757) | $ (6,228,704) |
Class T | | | | |
Shares sold | 474,830 | 879,812 | $ 4,927,589 | $ 9,150,890 |
Reinvestment of distributions | 35,814 | 101,007 | 347,751 | 1,092,104 |
Shares redeemed | (1,620,420) | (1,955,605) | (16,560,666) | (20,943,089) |
Net increase (decrease) | (1,109,776) | (974,786) | $ (11,285,326) | $ (10,700,095) |
Class B | | | | |
Shares sold | 5,681 | 9,370 | $ 54,950 | $ 93,679 |
Reinvestment of distributions | - | 7,318 | - | 73,635 |
Shares redeemed | (195,242) | (446,550) | (1,882,798) | (4,499,761) |
Net increase (decrease) | (189,561) | (429,862) | $ (1,827,848) | $ (4,332,447) |
Class C | | | | |
Shares sold | 139,534 | 194,812 | $ 1,345,653 | $ 1,945,397 |
Reinvestment of distributions | 2,090 | 27,032 | 18,836 | 271,185 |
Shares redeemed | (489,947) | (619,329) | (4,705,575) | (6,101,194) |
Net increase (decrease) | (348,323) | (397,485) | $ (3,341,086) | $ (3,884,612) |
Institutional Class | | | | |
Shares sold | 98,729 | 167,207 | $ 1,120,551 | $ 1,942,483 |
Reinvestment of distributions | 3,641 | 6,560 | 38,267 | 76,766 |
Shares redeemed | (120,081) | (151,382) | (1,328,552) | (1,773,974) |
Net increase (decrease) | (17,711) | 22,385 | $ (169,734) | $ 245,275 |
11. Other.
The Fund's organizational documents provide former and current trustees and officers with a limited indemnification against liabilities arising in connection with the performance of their duties to the Fund. In the normal course of business, the Fund may also enter into contracts that provide general indemnifications. The Fund's maximum exposure under these arrangements is unknown as this would be dependent on future claims that may be made against the Fund. The risk of material loss from such claims is considered remote.
Annual Report
To the Trustees of Fidelity Advisor Series VIII and Shareholders of Fidelity Advisor International Capital Appreciation Fund:
We have audited the accompanying statement of assets and liabilities of Fidelity Advisor International Capital Appreciation Fund (the Fund), a fund of Fidelity Advisor Series VIII, including the schedule of investments, as of October 31, 2012, and the related statement of operations for the year then ended, the statement of changes in net assets for each of the two years in the period then ended, and the financial highlights for each of the five years in the period then ended. These financial statements and financial highlights are the responsibility of the Fund's management. Our responsibility is to express an opinion on these financial statements and financial highlights based on our audits.
We conducted our audits in accordance with the standards of the Public Company Accounting Oversight Board (United States). Those standards require that we plan and perform the audit to obtain reasonable assurance about whether the financial statements and financial highlights are free of material misstatement. The Fund is not required to have, nor were we engaged to perform, an audit of its internal control over financial reporting. Our audits included consideration of internal control over financial reporting as a basis for designing audit procedures that are appropriate in the circumstances, but not for the purpose of expressing an opinion on the effectiveness of the Fund's internal control over financial reporting. Accordingly, we express no such opinion. An audit also includes examining, on a test basis, evidence supporting the amounts and disclosures in the financial statements, assessing the accounting principles used and significant estimates made by management, as well as evaluating the overall financial statement presentation. Our procedures included confirmation of securities owned as of October 31, 2012, by correspondence with the custodians and brokers; where replies were not received from brokers, we performed other auditing procedures. We believe that our audits provide a reasonable basis for our opinion.
In our opinion, the financial statements and financial highlights referred to above present fairly, in all material respects, the financial position of Fidelity Advisor International Capital Appreciation Fund as of October 31, 2012, the results of its operations for the year then ended, the changes in its net assets for each of the two years in the period then ended, and the financial highlights for each of the five years in the period then ended, in conformity with accounting principles generally accepted in the United States of America.
DELOITTE & TOUCHE LLP
Boston, Massachusetts
December 14, 2012
Annual Report
The Trustees, Members of the Advisory Board, and executive officers of the trust and fund, as applicable, are listed below. The Board of Trustees governs the fund and is responsible for protecting the interests of shareholders. The Trustees are experienced executives who meet periodically throughout the year to oversee the fund's activities, review contractual arrangements with companies that provide services to the fund, oversee management of the risks associated with such activities and contractual arrangements, and review the fund's performance. Except for James C. Curvey, each of the Trustees oversees 236 funds advised by FMR or an affiliate. Mr. Curvey oversees 443 funds advised by FMR or an affiliate.
The Trustees hold office without limit in time except that (a) any Trustee may resign; (b) any Trustee may be removed by written instrument, signed by at least two-thirds of the number of Trustees prior to such removal; (c) any Trustee who requests to be retired or who has become incapacitated by illness or injury may be retired by written instrument signed by a majority of the other Trustees; and (d) any Trustee may be removed at any special meeting of shareholders by a two-thirds vote of the outstanding voting securities of the trust. Each Trustee who is not an interested person (as defined in the 1940 Act) (Independent Trustee), shall retire not later than the last day of the calendar year in which his or her 75th birthday occurs. The Independent Trustees may waive this mandatory retirement age policy with respect to individual Trustees. The executive officers and Advisory Board Members hold office without limit in time, except that any officer and Advisory Board Member may resign or may be removed by a vote of a majority of the Trustees at any regular meeting or any special meeting of the Trustees. Except as indicated, each individual has held the office shown or other offices in the same company for the past five years.
Experience, Skills, Attributes, and Qualifications of the Fund's Trustees. The Governance and Nominating Committee has adopted a statement of policy that describes the experience, qualifications, attributes, and skills that are necessary and desirable for potential Independent Trustee candidates (Statement of Policy). The Board believes that each Trustee satisfied at the time he or she was initially elected or appointed a Trustee, and continues to satisfy, the standards contemplated by the Statement of Policy. The Governance and Nominating Committee also engages professional search firms to help identify potential Independent Trustee candidates who have the experience, qualifications, attributes, and skills consistent with the Statement of Policy. From time to time, additional criteria based on the composition and skills of the current Independent Trustees, as well as experience or skills that may be appropriate in light of future changes to board composition, business conditions, and regulatory or other developments, have also been considered by the professional search firms and the Governance and Nominating Committee. In addition, the Board takes into account the Trustees' commitment and participation in Board and committee meetings, as well as their leadership of standing and ad hoc committees throughout their tenure.
In determining that a particular Trustee was and continues to be qualified to serve as a Trustee, the Board has considered a variety of criteria, none of which, in isolation, was controlling. The Board believes that, collectively, the Trustees have balanced and diverse experience, qualifications, attributes, and skills, which allow the Board to operate effectively in governing the fund and protecting the interests of shareholders. Information about the specific experience, skills, attributes, and qualifications of each Trustee, which in each case led to the Board's conclusion that the Trustee should serve (or continue to serve) as a trustee of the fund, is provided below.
Annual Report
Trustees and Officers - continued
Board Structure and Oversight Function. James C. Curvey is an interested person (as defined in the 1940 Act) and currently serves as Chairman. The Trustees have determined that an interested Chairman is appropriate and benefits shareholders because an interested Chairman has a personal and professional stake in the quality and continuity of services provided to the fund. Independent Trustees exercise their informed business judgment to appoint an individual of their choosing to serve as Chairman, regardless of whether the Trustee happens to be independent or a member of management. The Independent Trustees have determined that they can act independently and effectively without having an Independent Trustee serve as Chairman and that a key structural component for assuring that they are in a position to do so is for the Independent Trustees to constitute a substantial majority for the Board. The Independent Trustees also regularly meet in executive session. Ned C. Lautenbach serves as Chairman of the Independent Trustees and as such (i) acts as a liaison between the Independent Trustees and management with respect to matters important to the Independent Trustees and (ii) with management prepares agendas for Board meetings.
Fidelity funds are overseen by different Boards of Trustees. The fund's Board oversees Fidelity's equity and high income funds and another Board oversees Fidelity's investment-grade bond, money market, and asset allocation funds. The asset allocation funds may invest in Fidelity funds overseen by the fund's Board. The use of separate Boards, each with its own committee structure, allows the Trustees of each group of Fidelity funds to focus on the unique issues of the funds they oversee, including common research, investment, and operational issues. On occasion, the separate Boards establish joint committees to address issues of overlapping consequences for the Fidelity funds overseen by each Board.
The Trustees operate using a system of committees to facilitate the timely and efficient consideration of all matters of importance to the Trustees, the fund, and fund shareholders and to facilitate compliance with legal and regulatory requirements and oversight of the fund's activities and associated risks. The Board, acting through its committees, has charged FMR and its affiliates with (i) identifying events or circumstances the occurrence of which could have demonstrably adverse effects on the fund's business and/or reputation; (ii) implementing processes and controls to lessen the possibility that such events or circumstances occur or to mitigate the effects of such events or circumstances if they do occur; and (iii) creating and maintaining a system designed to evaluate continuously business and market conditions in order to facilitate the identification and implementation processes described in (i) and (ii) above. Because the day-to-day operations and activities of the fund are carried out by or through FMR, its affiliates and other service providers, the fund's exposure to risks is mitigated but not eliminated by the processes overseen by the Trustees. While each of the Board's committees has responsibility for overseeing different aspects of the fund's activities, oversight is exercised primarily through the Operations, Audit, and Compliance Committees. In addition, the Independent Trustees have worked with FMR to enhance the Board's oversight of investment and financial risks, legal and regulatory risks, technology risks, and operational risks, including the development of additional risk reporting to the Board. For example, a working group comprised of Independent Trustees and FMR has worked and continues to work to review the Fidelity funds' valuation-related activities, reporting and risk management. Appropriate personnel, including but not limited to the fund's Chief Compliance Officer (CCO), FMR's internal auditor, the independent accountants, the fund's Treasurer and portfolio management personnel, make periodic reports to the Board's committees, as appropriate, including an annual review of FMR's risk management program for the Fidelity funds. The responsibilities of each standing committee, including their oversight responsibilities, are described further under "Standing Committees of the Fund's Trustees."
Annual Report
The fund's Statement of Additional Information (SAI) includes more information about the Trustees. To request a free copy, call Fidelity at 1-877-208-0098.
Interested Trustees*:
Correspondence intended for each Trustee who is an interested person may be sent to Fidelity Investments, 82 Devonshire Street, Boston, Massachusetts 02109.
Name, Age; Principal Occupations and Other Relevant Experience+ |
James C. Curvey (77) |
| Year of Election or Appointment: 2007 Mr. Curvey is Trustee and Chairman of the Board of Trustees of certain Trusts. Mr. Curvey also serves as Trustee (2007-present) of other investment companies advised by FMR. Mr. Curvey is a Director of Fidelity Investments Money Management, Inc. (2009-present), Director of Fidelity Research & Analysis Co. (2009-present) and Director of FMR and FMR Co., Inc. (2007-present). Mr. Curvey is also Vice Chairman (2007-present) and Director of FMR LLC. In addition, Mr. Curvey serves as an Overseer for the Boston Symphony Orchestra and a member of the Trustees of Villanova University. Previously, Mr. Curvey was the Vice Chairman (2006-2007) and Director (2000-2007) of FMR Corp. |
Ronald P. O'Hanley (55) |
| Year of Election or Appointment: 2011 Mr. O'Hanley is Director of FMR Co., Inc. (2010-present), Director of Fidelity Investments Money Management, Inc. (2010-present), Director of Fidelity Research & Analysis Company (2010-present), President of Fidelity Asset Management and Corporate Services and a member of Fidelity's Executive Committee (2010-present). Previously, Mr. O'Hanley served as President and Chief Executive Officer of BNY Mellon Asset Management (2007-2010). Mr. O'Hanley also served as Vice Chairman of Bank New York Mellon Corp. and a member of that firm's Executive Committee. Prior to the 2007 merger of The Bank of New York and Mellon Financial Corporation, he was Vice Chairman of Mellon Financial Corporation and President and Chief Executive Officer of Mellon Asset Management. He joined Mellon in February 1997. Mr. O'Hanley currently serves as Chairman of the Boston Public Library Foundation Board of Directors and sits on the Board of Directors of Beth Israel Deaconess Medical Center, the Board of Trustees of the Marine Biological Laboratory and the Advisory Board of the Maxwell School of Citizenship and Public Administration at Syracuse University. Mr. O'Hanley also chairs the Council on Asset Management for the Financial Services Roundtable and is a member of the Board of Directors of Institutional Investor's U.S. Institute. |
* Trustees have been determined to be "Interested Trustees" by virtue of, among other things, their affiliation with the trust or various entities under common control with FMR.
+ The information above includes each Trustee's principal occupation during the last five years and other information relating to the experience, attributes, and skills relevant to each Trustee's qualifications to serve as a Trustee, which led to the conclusion that each Trustee should serve as a Trustee for the fund.
Annual Report
Independent Trustees:
Correspondence intended for each Independent Trustee (that is, the Trustees other than the Interested Trustees) may be sent to Fidelity Investments, P.O. Box 55235, Boston, Massachusetts 02205-5235.
Name, Age; Principal Occupations and Other Relevant Experience+ |
Dennis J. Dirks (64) |
| Year of Election or Appointment: 2005 Prior to his retirement in May 2003, Mr. Dirks was Chief Operating Officer and a member of the Board of The Depository Trust & Clearing Corporation (DTCC). He also served as President, Chief Operating Officer, and Board member of The Depository Trust Company (DTC) and President and Board member of the National Securities Clearing Corporation (NSCC). In addition, Mr. Dirks served as Chief Executive Officer and Board member of the Government Securities Clearing Corporation, Chief Executive Officer and Board member of the Mortgage-Backed Securities Clearing Corporation, as a Trustee and a member of the Finance Committee of Manhattan College (2005-2008), and as a Trustee and a member of the Finance Committee of AHRC of Nassau County (2006-2008). Mr. Dirks is a member of the Independent Directors Council (IDC) Governing Council (2010-present) and Board of Directors for The Brookville Center for Children's Services, Inc. (2009-present). |
Alan J. Lacy (59) |
| Year of Election or Appointment: 2008 Mr. Lacy serves as Senior Adviser (2007-present) of Oak Hill Capital Partners, L.P. (private equity). Mr. Lacy also served as Chief Executive Officer (2000-2005) and Vice Chairman (2005-2006) of Sears Holdings Corporation and Sears, Roebuck and Co. (retail). In addition, Mr. Lacy serves as a member of the Board of Directors of Dave & Buster's Entertainment, Inc. (restaurant and entertainment complexes, 2010-present), Earth Fare, Inc. (retail grocery, 2012-present), The Hillman Companies, Inc. (hardware wholesalers, 2010-present), and Bristol-Myers Squibb Company (global pharmaceuticals, 2008-present). Mr. Lacy is a member of the Board of Trustees of The National Parks Conservation Association (2006-present). Previously, Mr. Lacy served as Chairman of the Board of Trustees of the National Parks Conservation Association (2008-2011) and as a member of the Board of Directors for the Western Union Company (global money transfer, 2006-2011). |
Ned C. Lautenbach (68) |
| Year of Election or Appointment: 2000 Mr. Lautenbach is Chairman of the Independent Trustees of the Equity and High Income Funds (2006-present). Mr. Lautenbach currently serves as the Lead Director of the Eaton Corporation Board of Directors (diversified industrial, 1997-present). Mr. Lautenbach is Chairman of the Board of Directors of the Philharmonic Center for the Arts in Naples, Florida (2012-present) and a member of the Council on Foreign Relations (1994-present). Previously, Mr. Lautenbach was a Partner/Advisory Partner at Clayton, Dubilier & Rice, LLC (private equity investment, 1998-2010), as well as a Director of Sony Corporation (2006-2007). |
Joseph Mauriello (68) |
| Year of Election or Appointment: 2008 Prior to his retirement in January 2006, Mr. Mauriello served in numerous senior management positions including Deputy Chairman and Chief Operating Officer (2004-2005), and Vice Chairman of Financial Services (2002-2004) of KPMG LLP US (professional services, 1965-2005). Mr. Mauriello currently serves as a member of the Board of Directors of XL Group plc. (global insurance and re-insurance, 2006-present). Previously, Mr. Mauriello served as a Director of the Hamilton Funds of the Bank of New York (2006-2007) and of Arcadia Resources Inc. (health care services and products, 2007-2012). |
Robert W. Selander (62) |
| Year of Election or Appointment: 2011 Previously, Mr. Selander served as a Member of the Advisory Board of Fidelity's Equity and High Income Funds (2011), Executive Vice Chairman (2010), Chief Executive Officer (2009-2010), and President and Chief Executive Officer (1997-2009) of Mastercard, Inc. |
Cornelia M. Small (68) |
| Year of Election or Appointment: 2005 Ms. Small is a member of the Board of Directors (2009-present) and Chair of the Investment Committee (2010-present) of the Teagle Foundation. Ms. Small also serves on the Investment Committee of the Berkshire Taconic Community Foundation (2008-present). Previously, Ms. Small served as Chairperson (2002-2008) and a member of the Investment Committee and Chairperson (2008-2012) and a member of the Board of Trustees of Smith College. In addition, Ms. Small served as Chief Investment Officer, Director of Global Equity Investments, and a member of the Board of Directors of Scudder, Stevens & Clark and Scudder Kemper Investments. |
William S. Stavropoulos (73) |
| Year of Election or Appointment: 2001 Mr. Stavropoulos is Vice Chairman of the Independent Trustees of the Equity and High Income Funds (2006-present). Mr. Stavropoulos serves as President and Founder of the Michigan Baseball Foundation, the Great Lakes Loons (2007-present). Mr. Stavropoulos is Chairman Emeritus of the Board of Directors of The Dow Chemical Company, where he previously served in numerous senior management positions, including President, CEO (1995-2000; 2002-2004), Chairman of the Executive Committee (2000-2006), and as a member of the Board of Directors (1990-2006). Currently, Mr. Stavropoulos is a Director of Univar Inc. (global distributor of commodity and specialty chemicals, Chairman from 2010-May 2012 and Lead Director from May 2012-present), Teradata Corporation (data warehousing and technology solutions, 2008-present), Maersk Inc. (industrial conglomerate), and Tyco International, Ltd. (multinational manufacturing and services, 2007-present), and a member of the Advisory Board for Metalmark Capital LLC (private equity investment, 2005-present). Mr. Stavropoulos is an operating advisor to Clayton, Dubilier & Rice, LLC (private equity investment). In addition, Mr. Stavropoulos is a member of the University of Notre Dame Advisory Council for the College of Science, a Trustee of the Rollin L. Gerstacker Foundation, and a Director of the Naples Philharmonic Center for the Arts. Previously, Mr. Stavropoulos served as a Director of Chemical Financial Corporation (bank holding company, 1993-2012). |
David M. Thomas (63) |
| Year of Election or Appointment: 2008 Previously, Mr. Thomas served as Executive Chairman (2005-2006) and Chairman and Chief Executive Officer (2000-2005) of IMS Health, Inc. (pharmaceutical and healthcare information solutions), and a Director of Fortune Brands, Inc. (consumer products, 2000-2011). In addition, Mr. Thomas serves as Non-Executive Chairman of the Board of Directors of Fortune Brands Home and Security (home and security products, 2011-present), and as a member of the Board of Directors of Interpublic Group of Companies, Inc. (marketing communication, 2004-present). |
Michael E. Wiley (62) |
| Year of Election or Appointment: 2008 Mr. Wiley also serves as a Director of Asia Pacific Exploration Consolidated (international oil and gas exploration and production, 2008-present). Mr. Wiley serves as a Director of Tesoro Corporation (independent oil refiner and marketer, 2005-present), and a Director of Bill Barrett Corporation (exploration and production, 2005-present). In addition, Mr. Wiley also serves as a Director of Post Oak Bank (privately-held bank, 2004-present). Previously, Mr. Wiley served as a member of the Board of Trustees of the University of Tulsa (2000-2006; 2007-2010), as a Senior Energy Advisor of Katzenbach Partners, LLC (consulting, 2006-2007), as an Advisory Director of Riverstone Holdings (private investment), Chairman, President, and CEO of Baker Hughes, Inc. (oilfield services, 2000-2004), and as Director of Spinnaker Exploration Company (exploration and production, 2001-2005). |
+ The information above includes each Trustee's principal occupation during the last five years and other information relating to the experience, attributes, and skills relevant to each Trustee's qualifications to serve as a Trustee, which led to the conclusion that each Trustee should serve as a Trustee for the fund.
Advisory Board Members and Executive Officers:
Correspondence intended for David A. Rosow and Garnett A. Smith may be sent to Fidelity Investments, P.O. Box 55235, Boston, Massachusetts 02205-5235. Correspondence intended for each executive officer, Edward C. Johnson 3d, and Peter S. Lynch may be sent to Fidelity Investments, 82 Devonshire Street, Boston, Massachusetts 02109.
Name, Age; Principal Occupation |
Edward C. Johnson 3d (82) |
| Year of Election or Appointment: 2011 Member of the Advisory Board of Fidelity's Equity and High Income Funds. Mr. Johnson serves as Chief Executive Officer, Chairman, and a Director of FMR LLC, and also serves as Chairman and Director of FIL Limited. Previously, Mr. Johnson served as a Trustee and Chairman of the Board of certain Fidelity Trusts, Chairman and a Director of FMR, Chairman and a Director of FMR Co., Inc., and President of FMR LLC (2006-2007). |
Peter S. Lynch (68) |
| Year of Election or Appointment: 2003 Member of the Advisory Board of Fidelity's Equity and High Income Funds. Mr. Lynch is Vice Chairman and a Director of FMR and FMR Co., Inc. In addition, Mr. Lynch serves as a Trustee of Boston College and as the Chairman of the Inner-City Scholarship Fund. Previously, Mr. Lynch served on the Special Olympics International Board of Directors (1997-2006). |
David A. Rosow (70) |
| Year of Election or Appointment: 2012 Member of the Advisory Board of Fidelity's Equity and High Income Funds. Chairman and Chief Executive Officer of International Golf Group, Inc. (golf course development, 1989-present). Previously, Mr. Rosow served as Chairman and Chief Executive Officer of Rosow & Company, Inc. (private investment company, 1989-2011), a Lead Director of Hudson United Bancorp (2001-2006) and as a Director of TD Banknorth (1996-2006). In addition, Mr. Rosow is a member (2008-present) and President (2009-present) of the Town Council of Palm Beach, Florida. |
Garnett A. Smith (65) |
| Year of Election or Appointment: 2012 Member of the Advisory Board of Fidelity's Equity and High Income Funds. Prior to Mr. Smith's retirement, he served as Chairman and Chief Executive Officer of Inbrand Corp. (manufacturer of personal absorbent products, 1990-1997). He also served as President (1986-1990) of Inbrand Corp. Prior to his employment with Inbrand Corp., he was employed by a retail fabric chain and North Carolina National Bank. In addition, Mr. Smith is a board member of the Jackson Hole Land Trust (2009-present). |
Kenneth B. Robins (43) |
| Year of Election or Appointment: 2008 President and Treasurer of Fidelity's Equity and High Income Funds. Mr. Robins also serves as President and Treasurer (2010-present) and Assistant Treasurer (2009-present) of other Fidelity funds and is an employee of Fidelity Investments (2004-present). Previously, Mr. Robins served as Deputy Treasurer of the Fidelity funds (2005-2008) and Treasurer and Chief Financial Officer of The North Carolina Capital Management Trust: Cash and Term Portfolios (2006-2008). |
Bruce T. Herring (47) |
| Year of Election or Appointment: 2006 Vice President of certain Equity Funds. Mr. Herring also serves as President of Fidelity Research & Analysis Company (2010-present), Chief Investment Officer and Director of Fidelity Management & Research (U.K.) Inc. (2010-present) and Group Chief Investment Officer of FMR. Previously, Mr. Herring served as Vice President (2005-2006) and Senior Vice President (2006-2007) of Fidelity Management & Research Company, Vice President of FMR Co., Inc. (2001-2007) and as a portfolio manager for Fidelity U.S. Equity Funds. |
Brian B. Hogan (48) |
| Year of Election or Appointment: 2009 Vice President of Equity and High Income Funds. Mr. Hogan also serves as President of FMR's Equity Division (2009-present). Previously, Mr. Hogan served as Senior Vice President, Equity Research of FMR (2006-2009) and as a portfolio manager. |
Scott C. Goebel (44) |
| Year of Election or Appointment: 2008 Secretary and Chief Legal Officer (CLO) of the Fidelity funds. Mr. Goebel also serves as Secretary of Fidelity Investments Money Management, Inc. (FIMM) (2010-present) and Fidelity Research and Analysis Company (FRAC) (2010-present); Secretary and CLO of The North Carolina Capital Management Trust: Cash and Term Portfolios (2008-present); General Counsel, Secretary, and Senior Vice President of FMR (2008-present) and FMR Co., Inc. (2008-present); employed by FMR LLC or an affiliate (2001-present); Chief Legal Officer of Fidelity Management & Research (Hong Kong) Limited (2008-present) and Assistant Secretary of Fidelity Management & Research (Japan) Inc. (2008-present), and Fidelity Management & Research (U.K.) Inc. (2008-present). Previously, Mr. Goebel served as Assistant Secretary of FIMM (2008-2010), FRAC (2008-2010), and the Funds (2007-2008) and as Vice President and Secretary of Fidelity Distributors Corporation (FDC) (2005-2007). |
William C. Coffey (43) |
| Year of Election or Appointment: 2009 Assistant Secretary of Fidelity's Equity and High Income Funds. Mr. Coffey also serves as Senior Vice President and Deputy General Counsel of FMR LLC (2010-present), and is an employee of Fidelity Investments. Previously, Mr. Coffey served as Vice President and Associate General Counsel of FMR LLC (2005-2009). |
Elizabeth Paige Baumann (44) |
| Year of Election or Appointment: 2012 Anti-Money Laundering (AML) Officer of the Fidelity funds. Ms. Baumann also serves as AML Officer of The North Carolina Capital Management Trust: Cash and Term Portfolios (2012-present), Chief AML Officer of FMR LLC (2012-present), and is an employee of Fidelity Investments. Previously, Ms. Baumann served as Vice President and Deputy Anti-Money Laundering Officer (2007-2012). |
Christine Reynolds (54) |
| Year of Election or Appointment: 2008 Chief Financial Officer of the Fidelity funds. Ms. Reynolds became President of Fidelity Pricing and Cash Management Services (FPCMS) in August 2008. Ms. Reynolds served as Chief Operating Officer of FPCMS (2007-2008). Previously, Ms. Reynolds served as President, Treasurer, and Anti-Money Laundering officer of the Fidelity funds (2004-2007). |
Joseph A. Hanlon (44) |
| Year of Election or Appointment: 2012 Chief Compliance Officer of Fidelity's Equity and High Income Funds. Mr. Hanlon serves as Compliance Officer of FMR, FMR Co., Inc., Fidelity Investments Money Management, Inc. (FIMM), Fidelity Research and Analysis Company (FRAC), Fidelity Management & Research (Japan) Inc., Fidelity Management & Research (U.K.) Inc., Fidelity Management & Research (Hong Kong), and Strategic Advisers, Inc. (2009-present), as Senior Vice President of the Fidelity Asset Management Division (2009-present), and is an employee of Fidelity Investments. |
Joseph F. Zambello (55) |
| Year of Election or Appointment: 2011 Deputy Treasurer of the Fidelity funds. Mr. Zambello is an employee of Fidelity Investments. Previously, Mr. Zambello served as Vice President of FMR's Program Management Group (2009-2011) and Vice President of the Transfer Agent Oversight Group (2005-2009). |
Adrien E. Deberghes (45) |
| Year of Election or Appointment: 2008 Deputy Treasurer of Fidelity's Equity and High Income Funds. Mr. Deberghes also serves as Vice President (2011-present) and Assistant Treasurer (2010-present) of other Fidelity funds, and is an employee of Fidelity Investments (2008-present). Previously, Mr. Deberghes served as Senior Vice President of Mutual Fund Administration at State Street Corporation (2007-2008), Senior Director of Mutual Fund Administration at Investors Bank & Trust (2005-2007), and Director of Finance for Dunkin' Brands (2000-2005). |
Stephen Sadoski (41) |
| Year of Election or Appointment: 2012 Deputy Treasurer of Fidelity's Equity and High Income Funds. Mr. Sadoski also serves as Assistant Treasurer of other Fidelity funds (2012-present) and is an employee of Fidelity Investments (2012-present). Previously, Mr. Sadoski served as an assistant chief accountant in the Division of Investment Management of the Securities and Exchange Commission (SEC) (2009-2012) and as a senior manager at Deloitte & Touche (1997-2009). |
Stephanie J. Dorsey (43) |
| Year of Election or Appointment: 2010 Assistant Treasurer of Fidelity's Equity and High Income Funds. Ms. Dorsey also serves as Deputy Treasurer of other Fidelity funds (2008-present) and is an employee of Fidelity Investments (2008-present). Previously, Ms. Dorsey served as Treasurer (2004-2008) of the JPMorgan Mutual Funds and Vice President (2004-2008) of JPMorgan Chase Bank. |
John R. Hebble (54) |
| Year of Election or Appointment: 2009 Assistant Treasurer of Fidelity's Equity and High Income Funds. Mr. Hebble also serves as President (2011-present), Treasurer, and Chief Financial Officer of The North Carolina Capital Management Trust: Cash and Term Portfolios (2008-present), President and Treasurer of other Fidelity funds (2008-present) and is an employee of Fidelity Investments. |
Gary W. Ryan (54) |
| Year of Election or Appointment: 2005 Assistant Treasurer of the Fidelity funds. Mr. Ryan is an employee of Fidelity Investments. Previously, Mr. Ryan served as Vice President of Fund Reporting in Fidelity Pricing and Cash Management Services (FPCMS) (1999-2005). |
Jonathan Davis (44) |
| Year of Election or Appointment: 2010 Assistant Treasurer of the Fidelity funds. Mr. Davis is also Assistant Treasurer of Fidelity Rutland Square Trust II and Fidelity Commonwealth Trust II. Mr. Davis is an employee of Fidelity Investments. Previously, Mr. Davis served as Vice President and Associate General Counsel of FMR LLC (2003-2010). |
Annual Report
Institutional Class designates 8% of the dividend distributed during the fiscal year as qualifying for the dividends-received deduction for corporate shareholders.
Institutional Class designates 100% of the dividend distributed during the fiscal year as amounts which may be taken into account as a dividend for purposes of the maximum rate under section 1(h)(11) of the Internal Revenue Code.
The amounts per share which represent income derived from sources within, and taxes paid to, foreign countries or possessions of the United States are as follows:
| Pay Date | Income | Taxes |
Institutional Class | 12/05/11 | $0.132 | $0.0117 |
The fund will notify shareholders in January 2013 of amounts for use in preparing 2012 income tax returns.
Annual Report
Board Approval of Investment Advisory Contracts and Management Fees
Fidelity Advisor International Capital Appreciation Fund
Each year, the Board of Trustees, including the Independent Trustees (together, the Board), votes on the renewal of the management contract and sub-advisory agreements (together, the Advisory Contracts) for the fund. The Board, assisted by the advice of fund counsel and Independent Trustees' counsel, requests and considers a broad range of information relevant to the renewal of the Advisory Contracts throughout the year.
The Board meets regularly and, at each of its meetings, considers factors that are relevant to its annual consideration of the renewal of the fund's Advisory Contracts, including the services and support provided to the fund and its shareholders. The Board has established various standing committees, each composed of and chaired by Independent Trustees with varying backgrounds, to which the Board has assigned specific subject matter responsibilities in order to enhance effective decision-making by the Board. The Board, acting directly and through its Committees, requests and receives information concerning the annual consideration of the renewal of the fund's Advisory Contracts. The Board also meets as needed to consider matters specifically related to the Board's annual consideration of the renewal of Advisory Contracts. Members of the Board may also meet with trustees of other Fidelity funds through ad hoc joint committees to discuss certain matters relevant to the Fidelity funds.
At its July 2012 meeting, the Board of Trustees, including the Independent Trustees, unanimously determined to renew the fund's Advisory Contracts. In reaching its determination, the Board considered all factors it believed relevant, including (i) the nature, extent, and quality of the services to be provided to the fund and its shareholders (including the investment performance of the fund); (ii) the competitiveness of the fund's management fee and total expense ratio relative to peer funds; (iii) the total costs of the services to be provided by and the profits to be realized by Fidelity from its relationship with the fund; (iv) the extent to which economies of scale exist and would be realized as the fund grows; and (v) whether fee levels reflect these economies of scale, if any, for the benefit of fund shareholders.
In considering whether to renew the Advisory Contracts for the fund, the Board reached a determination, with the assistance of fund counsel and Independent Trustees' counsel and through the exercise of its business judgment, that the renewal of the Advisory Contracts is in the best interests of the fund and its shareholders and that the compensation payable under the Advisory Contracts is fair and reasonable. The Board's decision to renew the Advisory Contracts was not based on any single factor, but rather was based on a comprehensive consideration of all the information provided to the Board at its meetings throughout the year. The Board, in reaching its determination to renew the Advisory Contracts, is aware that shareholders in the fund have a broad range of investment choices available to them, including a wide choice among mutual funds offered by Fidelity's competitors, and that the fund's shareholders, who have the opportunity to review and weigh the disclosure provided by the fund in its prospectus and other public disclosures, have chosen to invest in this fund, managed by Fidelity.
Annual Report
Nature, Extent, and Quality of Services Provided. The Board considered the staffing within the investment adviser, FMR, and the sub-advisers (together, the Investment Advisers), including the backgrounds of the fund's investment personnel, and also considered the fund's investment objective, strategies, and related investment philosophy. The Independent Trustees also had discussions with senior management of Fidelity's investment operations and investment groups. The Board considered the structure of the portfolio manager compensation program and whether this structure provides appropriate incentives to act in the best interests of the fund.
Resources Dedicated to Investment Management and Support Services. The Board and the Fund Oversight and Research Committees reviewed the general qualifications and capabilities of the Investment Advisers' investment staff, including its size, education, experience, and resources, as well as the Investment Advisers' approach to recruiting, training, managing, and compensating investment personnel. The Board also noted that FMR has continued to increase the resources devoted to non-U.S. offices, including expansion of Fidelity's global investment organization. The Board noted that Fidelity's analysts have extensive resources, tools and capabilities that allow them to conduct sophisticated quantitative and fundamental analysis, as well as credit analysis of issuers, counterparties and guarantors. The Board also believes that Fidelity's investment professionals have sufficient access to global information and data so as to provide competitive investment results over time, and that those professionals also have access to sophisticated tools that permit them to assess portfolio construction and risk and performance attribution characteristics continuously, as well as to transmit new information and research conclusions rapidly around the world. Additionally, in its deliberations, the Board considered the Investment Advisers' trading and risk management capabilities and resources, which are an integral part of the investment management process.
Shareholder and Administrative Services. The Board considered (i) the nature, extent, quality, and cost of advisory, administrative, and shareholder services performed by the Investment Advisers and their affiliates under the Advisory Contracts and under separate agreements covering transfer agency, pricing and bookkeeping, and securities lending services for the fund; (ii) the nature and extent of the supervision of third party service providers, principally custodians and subcustodians; and (iii) the resources devoted to, and the record of compliance with, the fund's compliance policies and procedures. The Board also reviewed the allocation of fund brokerage, including allocations to brokers affiliated with the Investment Advisers, the use of brokerage commissions to pay fund expenses, and the use of "soft" commission dollars to pay for research services.
Annual Report
Board Approval of Investment Advisory Contracts and
Management Fees - continued
The Board noted that the growth of fund assets over time across the complex allows Fidelity to reinvest in the development of services designed to enhance the value or convenience of the Fidelity funds as investment vehicles. These services include 24-hour access to account information and market information through telephone representatives and over the Internet, investor education materials and asset allocation tools, and the expanded availability of Fidelity Investor Centers.
Investment in a Large Fund Family. The Board considered the benefits to shareholders of investing in a Fidelity fund, including the benefits of investing in a fund that is part of a large family of funds offering a variety of investment disciplines and providing a large variety of mutual fund investor services. The Board noted that Fidelity had taken, or had made recommendations that resulted in the Fidelity funds taking, a number of actions over the previous year that benefited particular funds, including (i) continuing to dedicate additional resources to investment research and support of the senior management team that oversees asset management; (ii) persisting in efforts to enhance Fidelity's research capabilities, in particular, international research; (iii) launching new funds and making other enhancements to meet client needs for global and income-oriented solutions; (iv) continuing to launch dedicated lower cost underlying funds to meet investment management's portfolio construction needs related to expanding underlying fund options, specifically for the Freedom Fund product lines; (v) adopting a "Stock Selector" sector neutral investment approach and employing a team of portfolio managers who are sector specialists to manage certain funds; (vi) rationalizing product lines and gaining increased efficiencies through the mergers of several funds into other funds; (vii) strengthening the Spartan Index Fund product line by adding new funds and/or new low-cost institutional share classes, restructuring fund expenses to accommodate new classes, and reducing investment minimums for certain classes of shares; (viii) modifying the eligibility criteria for Institutional Class shares to increase their appeal to government entities and charitable investors; and (ix) reducing certain transfer agent fee rates.
Investment Performance. The Board considered whether the fund has operated in accordance with its investment objective, as well as its record of compliance with its investment restrictions. It also reviewed the fund's absolute investment performance for each class, as well as the fund's relative investment performance for each class measured over multiple periods against (i) a broad-based securities market index, and (ii) a custom peer group of mutual funds deemed appropriate by Fidelity and reviewed by the Board. The following charts considered by the Board show, over the one-, three-, and five-year periods ended December 31, 2011, the cumulative total returns of Institutional Class (Class I) and Class B of the fund, the cumulative total returns of a broad-based securities market index ("benchmark"), and a range of cumulative total returns of a custom peer group of mutual funds defined by FMR based on categories assigned by Morningstar, Inc. The returns of Institutional Class (Class I) and Class B show the performance of the highest and lowest performing classes, respectively (based on five-year performance). The box within each chart shows the 25th percentile return (top of box) and the 75th percentile return (bottom of box) of the peer group. Returns shown above the box are in the first quartile and returns shown below the box are in the fourth quartile. The percentage beaten numbers noted below each chart correspond to the percentile box and represent the percentage of funds in the peer group whose performance was equal to or lower than that of the class indicated. The fund's custom peer group, defined by FMR, is a peer group that FMR believes provides a more meaningful performance comparison than the peer group assigned by Morningstar, Inc., which assigns mutual funds to categories based on their investment styles as measured by their underlying portfolio holdings.
Annual Report
Fidelity Advisor International Capital Appreciation Fund
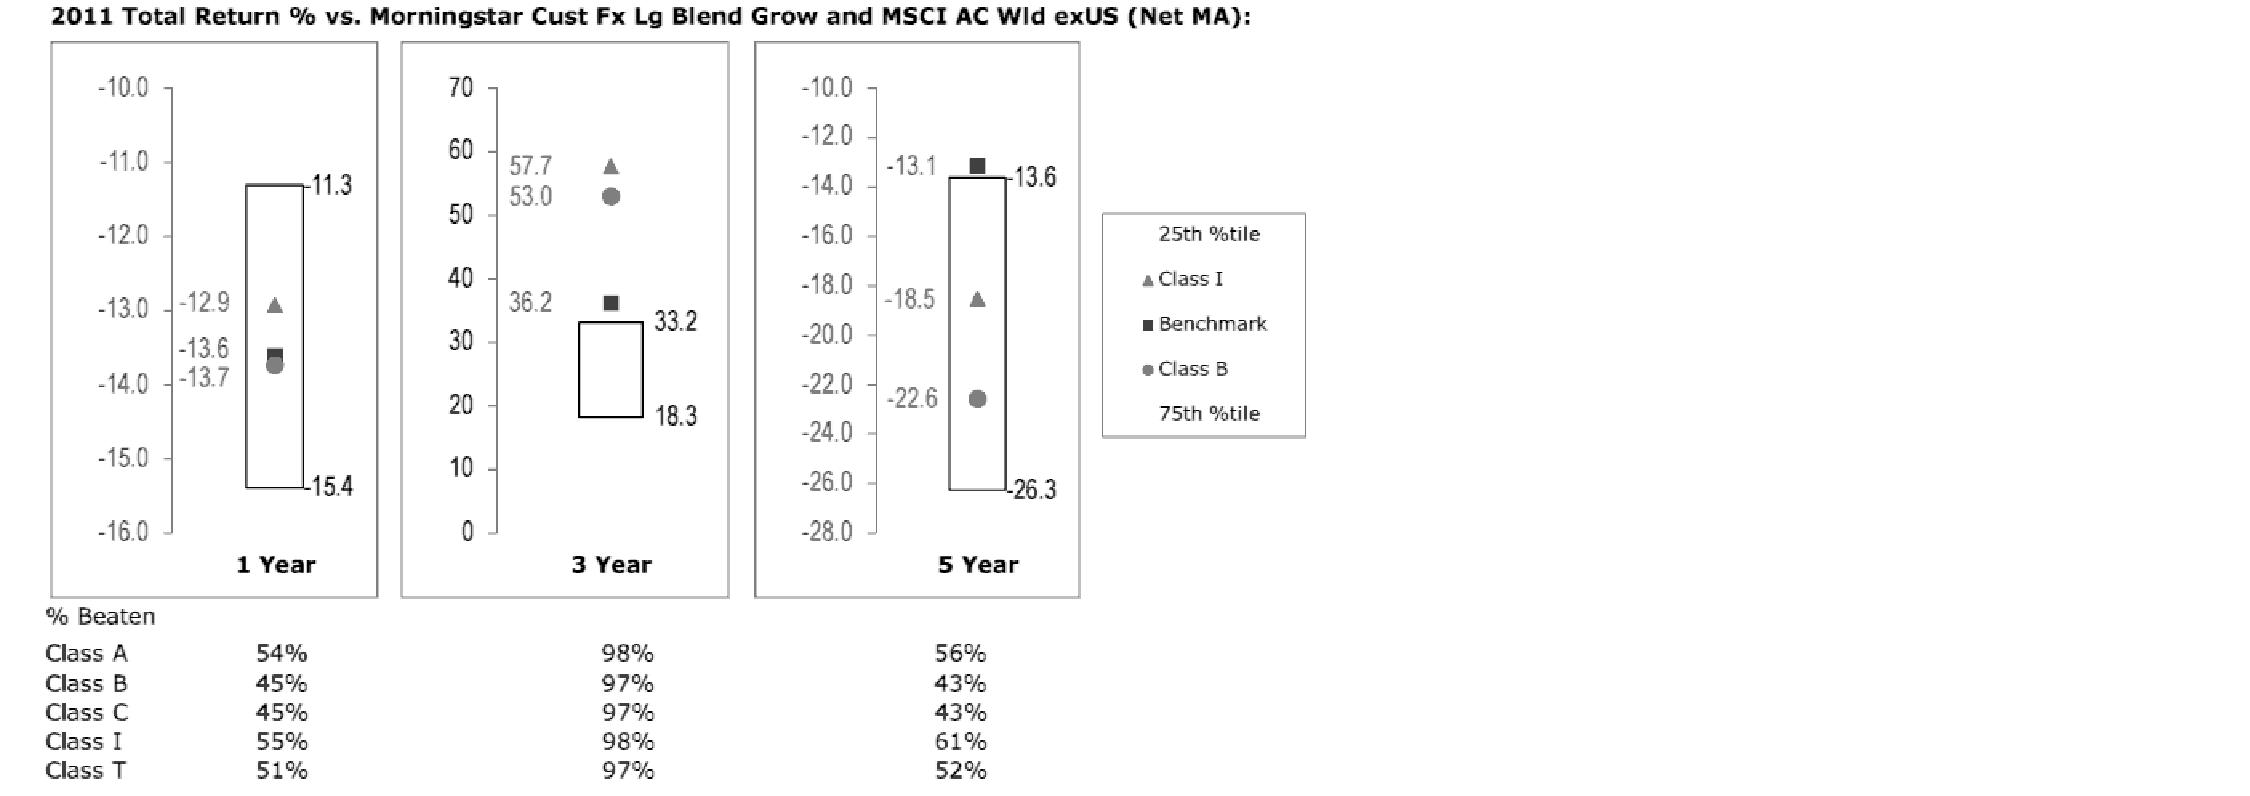
The Board reviewed the fund's relative investment performance against its peer group and noted that the performance of Institutional Class (Class I) of the fund was in the second quartile for the one- and five-year periods and the first quartile for the three-year period. The Board also noted that the investment performance of Institutional Class (Class I) of the fund compared favorably to its benchmark for the one- and three-year periods, although the fund's five-year cumulative total return was lower than its benchmark. The Board considered that the variations in performance among the fund's classes reflect the variations in class expenses, which result in lower performance for higher expense classes. The Board also reviewed the fund's performance since inception as well as performance in the current year.
Annual Report
Board Approval of Investment Advisory Contracts and
Management Fees - continued
The Board also considered that the fund's management fee is subject to upward or downward adjustment depending upon whether, and to what extent, the fund's investment performance for the performance period exceeds, or is exceeded by, the record (over the same period) of a Board-approved performance adjustment index. The Board noted that the performance adjustment provides FMR with a strong economic incentive to seek to achieve superior performance for the fund's shareholders and helps to more closely align the interests of FMR and the fund's shareholders.
Based on its review, the Board concluded that the nature, extent, and quality of services provided to the fund under the Advisory Contracts should benefit the fund's shareholders.
Competitiveness of Management Fee and Total Expense Ratio. The Board considered the fund's management fee and total expense ratio compared to "mapped groups" of competitive funds and classes. Fidelity creates "mapped groups" by combining similar Lipper investment objective categories that have comparable management fee characteristics. Combining Lipper investment objective categories aids the Board's management fee and total expense ratio comparisons by broadening the competitive group used for comparison and by reducing the number of universes to which various Fidelity funds are compared.
Management Fee. The Board considered two proprietary management fee comparisons for the 12-month periods shown in the chart below. The group of Lipper funds used by the Board for management fee comparisons is referred to below as the "Total Mapped Group." The Total Mapped Group comparison focuses on a fund's standing relative to the total universe of comparable funds available to investors in terms of gross management fees before expense reimbursements or caps, and without giving effect to the fund's performance adjustment. "TMG %" represents the percentage of funds in the Total Mapped Group that had management fees that were lower than the fund's. For example, a TMG % of 17% means that 83% of the funds in the Total Mapped Group had higher management fees than the fund. The "Asset-Size Peer Group" (ASPG) comparison focuses on a fund's standing relative to non-Fidelity funds similar in size to the fund within the Total Mapped Group. The ASPG represents at least 15% of the funds in the Total Mapped Group with comparable asset size and management fee characteristics, subject to a minimum of 50 funds (or all funds in the Total Mapped Group if fewer than 50). Additional information, such as the ASPG quartile in which the fund's management fee ranked and the impact of the fund's performance adjustment, is also included in the chart and considered by the Board.
Annual Report
Fidelity Advisor International Capital Appreciation Fund

The Board noted that the fund's management fee ranked below the median of its Total Mapped Group and below the median of its ASPG for 2011. The Board also noted the effect of the fund's positive performance adjustment on the fund's management fee ranking. The Board noted that the performance adjustment for each year represents calculations for performance periods that differ from the periods shown in the performance charts above.
Based on its review, the Board concluded that the fund's management fee is fair and reasonable in light of the services that the fund receives and the other factors considered.
Total Expense Ratio. In its review of each class's total expense ratio, the Board considered the fund's management fee as well as other fund or class expenses, as applicable, such as transfer agent fees, pricing and bookkeeping fees, fund-paid 12b-1 fees, and custodial, legal, and audit fees. The Board also noted the effects of any waivers and reimbursements on fees and expenses, as well as the impact of the fund's performance adjustment. As part of its review, the Board also considered the current and historical total expense ratios of each class of the fund compared to competitive fund median expenses. Each class of the fund is compared to those funds and classes in the Total Mapped Group (used by the Board for management fee comparisons) that have a similar sales load structure.
The Board noted that the total expense ratio of Class A ranked below its competitive median for 2011, the total expense ratio of Class B ranked equal to its competitive median for 2011, and the total expense ratio of each of Class T, Class C and Institutional Class ranked above its competitive median for 2011. The Board considered that various factors, including 12b-1 fees, positive or negative performance adjustments, and relatively higher other expenses in the case of small fund size, can affect total expense ratios. The Board noted that the total expense ratio of Class T was above the competitive median primarily because of higher 12b-1 fees on Class T. Class T has a higher 12b-1 fee, but a lower front-end sales charge, than traditionally priced front-end sales charge classes. The Board considered that Class T is primarily sold load-waived in the retirement plan market where its 0.50% 12b-1 fee is comparable to competing no-load, higher 12b-1 fee classes designed specifically for retirement plans. The Board noted that the fund offers multiple classes, each of which has a different sales load and 12b-1 fee structure, and that the multiple structures are intended to offer a range of pricing options for the intermediary market. The Board also noted that the total expense ratios of the classes vary primarily by the level of their 12b-1 fees, although differences in transfer agent fees may also cause expenses to vary from class to class.
Annual Report
Board Approval of Investment Advisory Contracts and
Management Fees - continued
Fees Charged to Other Fidelity Clients. The Board also considered Fidelity fee structures and other information with respect to clients of FMR and its affiliates, such as other mutual funds advised or subadvised by FMR or its affiliates, pension plan clients, and other institutional clients. The Board noted the findings of the 2010 ad hoc joint committee (created with the board of other Fidelity funds), which reviewed and compared Fidelity's institutional investment advisory business with its business of providing services to the Fidelity funds, including the differences in services provided, fees charged, and costs incurred, as well as competition in their respective marketplaces.
Based on its review of total expense ratios and fees charged to other Fidelity clients, the Board concluded that the total expense ratio of each class of the fund was reasonable, although in some cases above the median of the universe presented for comparison, in light of the services that the fund and its shareholders receive and the other factors considered.
Costs of the Services and Profitability. The Board considered the revenues earned and the expenses incurred by Fidelity in conducting the business of developing, marketing, distributing, managing, administering and servicing the fund and its shareholders. The Board also considered the level of Fidelity's profits in respect of all the Fidelity funds.
On an annual basis, FMR presents to the Board Fidelity's profitability for the fund. Fidelity calculates the profitability for each fund, as well as aggregate profitability for groups of Fidelity funds and all Fidelity funds, using a series of detailed revenue and cost allocation methodologies which originate with the books and records of Fidelity on which Fidelity's audited financial statements are based. The Audit Committee of the Board reviews any significant changes from the prior year's methodologies.
PricewaterhouseCoopers LLP (PwC), independent registered public accounting firm and auditor to Fidelity and certain Fidelity funds, has been engaged annually by the Board as part of the Board's assessment of Fidelity's profitability analysis. PwC's engagement includes the review and assessment of Fidelity's methodologies used in determining the revenues and expenses attributable to Fidelity's mutual fund business, and completion of agreed-upon procedures surrounding the mathematical accuracy of fund profitability and its conformity to allocation methodologies. After considering PwC's reports issued under the engagement and information provided by Fidelity, the Board concluded that while other allocation methods may also be reasonable, Fidelity's profitability methodologies are reasonable in all material respects.
Annual Report
The Board also reviewed Fidelity's non-fund businesses and fall-out benefits related to the mutual fund business as well as cases where Fidelity's affiliates may benefit from or be related to the fund's business.
The Board considered the costs of the services provided by and the profits realized by Fidelity in connection with the operation of the fund and was satisfied that the profitability was not excessive in the circumstances.
Economies of Scale. The Board considered whether there have been economies of scale in respect of the management of the Fidelity funds, whether the Fidelity funds (including the fund) have appropriately benefited from any such economies of scale, and whether there is potential for realization of any further economies of scale. The Board considered the extent to which the fund will benefit from economies of scale through increased services to the fund, through waivers or reimbursements, or through fee or expense reductions. The Board also noted that in 2009, it and the board of other Fidelity funds created an ad hoc committee (the Economies of Scale Committee) to analyze whether FMR attains economies of scale in respect of the management and servicing of the Fidelity funds, whether the Fidelity funds have appropriately benefited from such economies of scale, and whether there is potential for realization of any further economies of scale.
The Board recognized that the fund's management contract incorporates a "group fee" structure, which provides for lower group fee rates as total fund assets under FMR's management increase, and for higher group fee rates as total fund assets under FMR's management decrease. FMR calculates the group fee rates based on a tiered asset "breakpoint" schedule that varies based on asset class. The Board considered that the group fee is designed to deliver the benefits of economies of scale to fund shareholders when total Fidelity fund assets increase, even if assets of any particular fund are unchanged or have declined, because some portion of Fidelity's costs are attributable to services provided to all Fidelity funds, and all funds benefit if those costs can be allocated among more assets. The Board concluded that, given the group fee structure, fund shareholders will benefit from lower management fees as assets under FMR's management increase at the fund complex level, regardless of whether Fidelity achieves any such economies of scale.
Annual Report
Board Approval of Investment Advisory Contracts and
Management Fees - continued
The Board concluded, taking into account the analysis of the Economies of Scale Committee, that economies of scale, if any, are being appropriately shared between fund shareholders and Fidelity.
Additional Information Requested by the Board. In order to develop fully the factual basis for consideration of the Fidelity funds' Advisory Contracts, the Board requested and received additional information on certain topics, including (i) fund performance trends, actions to be taken by FMR to improve certain funds' overall performance, and Fidelity's long-term strategies for certain funds; (ii) the potential to further rationalize the Fidelity fund lineup with the possibility of achieving savings for the funds and Fidelity; (iii) Fidelity's compensation structure for portfolio managers and other key investment personnel; (iv) the amount of the investment that each portfolio manager has made in the Fidelity fund(s) that he or she manages; (v) the realization of fall-out benefits in certain Fidelity business units; (vi) Fidelity's group fee structures, the potential impact of regulatory changes on such structures, and the rationale for the individual fee rates of certain funds; (vii) fund profitability methodology, including Fidelity's cost allocation methodology, and the impact of certain factors on fund profitability results; (viii) trends regarding industry use of performance fee structures and the possibility of implementing performance fee structures for additional funds; and (ix) the impact of net redemptions from the Fidelity funds.
Based on its evaluation of all of the conclusions noted above, and after considering all factors it believed relevant, the Board ultimately concluded that the advisory fee structures are fair and reasonable, and that the fund's Advisory Contracts should be renewed.
Annual Report
Investment Adviser
Fidelity Management & Research Company
Boston, MA
Investment Sub-Advisers
FMR Co., Inc.
Fidelity Management & Research
(U.K.) Inc.
Fidelity Management & Research
(Hong Kong) Limited
Fidelity Management & Research
(Japan) Inc.
FIL Investment Advisors
FIL Investments (Japan) Limited
FIL Investment Advisors (UK) Limited
General Distributor
Fidelity Distributors Corporation
Smithfield, RI
Transfer and Service Agents
Fidelity Investments Institutional Operations Company, Inc.
Boston, MA
Fidelity Service Company, Inc.
Boston, MA
Custodian
Brown Brothers Harriman & Co.
Boston, MA
(Fidelity Investment logo)(registered trademark)
AICAPI-UANN-1212
1.784755.109
(Fidelity Investment logo)(registered trademark)
Fidelity Advisor®
International
Capital Appreciation
Fund - Class A, Class T, Class B
and Class C
Annual Report
October 31, 2012
(Fidelity Cover Art)
Contents
Performance | (Click Here) | How the fund has done over time. |
Management's Discussion of Fund Performance | (Click Here) | The Portfolio Manager's review of fund performance and strategy. |
Shareholder Expense Example | (Click Here) | An example of shareholder expenses. |
Investment Changes | (Click Here) | A summary of major shifts in the fund's investments over the past six months. |
Investments | (Click Here) | A complete list of the fund's investments with their market values. |
Financial Statements | (Click Here) | Statements of assets and liabilities, operations, and changes in net assets, as well as financial highlights. |
Notes | (Click Here) | Notes to the financial statements. |
Report of Independent Registered Public Accounting Firm | (Click Here) | |
Trustees and Officers | (Click Here) | |
Distributions | (Click Here) | |
Board Approval of Investment Advisory Contracts and Management Fees | (Click Here) | |
To view a fund's proxy voting guidelines and proxy voting record for the 12-month period ended June 30, visit http://www.fidelity.com/proxyvotingresults or visit the Securities and Exchange Commission's (SEC) web site at http://www.sec.gov. You may also call 1-877-208-0098 to request a free copy of the proxy voting guidelines.
Standard & Poor's, S&P and S&P 500 are registered service marks of The McGraw-Hill Companies, Inc. and have been licensed for use by Fidelity Distributors Corporation.
Other third party marks appearing herein are the property of their respective owners.
All other marks appearing herein are registered or unregistered trademarks or service marks of FMR LLC or an affiliated company. © 2012 FMR LLC. All rights reserved.
Annual Report
This report and the financial statements contained herein are submitted for the general information of the shareholders of the fund. This report is not authorized for distribution to prospective investors in the fund unless preceded or accompanied by an effective prospectus.
A fund files its complete schedule of portfolio holdings with the SEC for the first and third quarters of each fiscal year on Form N-Q. Forms N-Q are available on the SEC's web site at http://www.sec.gov. A fund's Forms N-Q may be reviewed and copied at the SEC's Public Reference Room in Washington, DC. Information regarding the operation of the SEC's Public Reference Room may be obtained by calling 1-800-SEC-0330. For a complete list of a fund's portfolio holdings, view the most recent holdings listing, semiannual report, or annual report on Fidelity's web site at http://www.fidelity.com, http://www.advisor.fidelity.com, or http://www.401k.com, as applicable.
NOT FDIC INSURED • MAY LOSE VALUE • NO BANK GUARANTEE
Neither the fund nor Fidelity Distributors Corporation is a bank.
Annual Report
Average annual total return reflects the change in the value of an investment, assuming reinvestment of the class' distributions from dividend income and capital gains (the profits earned upon the sale of securities that have grown in value, if any) and assuming a constant rate of performance each year. The $10,000 table and the fund's returns do not reflect the deduction of taxes that a shareholder would pay on fund distributions or the redemption of fund shares. During periods of reimbursement by Fidelity, a fund's total return will be greater than it would be had the reimbursement not occurred. How a fund did yesterday is no guarantee of how it will do tomorrow. Returns reflect the conversion of Class B shares to Class A shares after a maximum of seven years.
Average Annual Total Returns
Periods ended October 31, 2012 | Past 1
year | Past 5
years | Past 10
years |
Class A (incl. 5.75% sales charge) | 4.80% | -4.96% | 6.11% |
Class T (incl. 3.50% sales charge) | 7.11% | -4.74% | 6.11% |
Class B (incl. contingent deferred sales charge)A | 5.37% | -4.84% | 6.15% |
Class C (incl. contingent deferred sales charge)B | 9.41% | -4.55% | 5.95% |
A Class B shares' contingent deferred sales charges included in the past one year, past five years, and past ten years total return figures are 5%, 2%, and 0%, respectively.
B Class C shares' contingent deferred sales charges included in the past one year, past five years, and past ten years total return figures are 1%, 0%, and 0%, respectively.
Annual Report
$10,000 Over 10 Years
Let's say hypothetically that $10,000 was invested in Fidelity Advisor® International Capital Appreciation Fund - Class A on October 31, 2002, and the current 5.75% sales charge was paid. The chart shows how the value of your investment would have changed, and also shows how the MSCI® ACWI® (All Country World Index) ex USA Index performed over the same period.
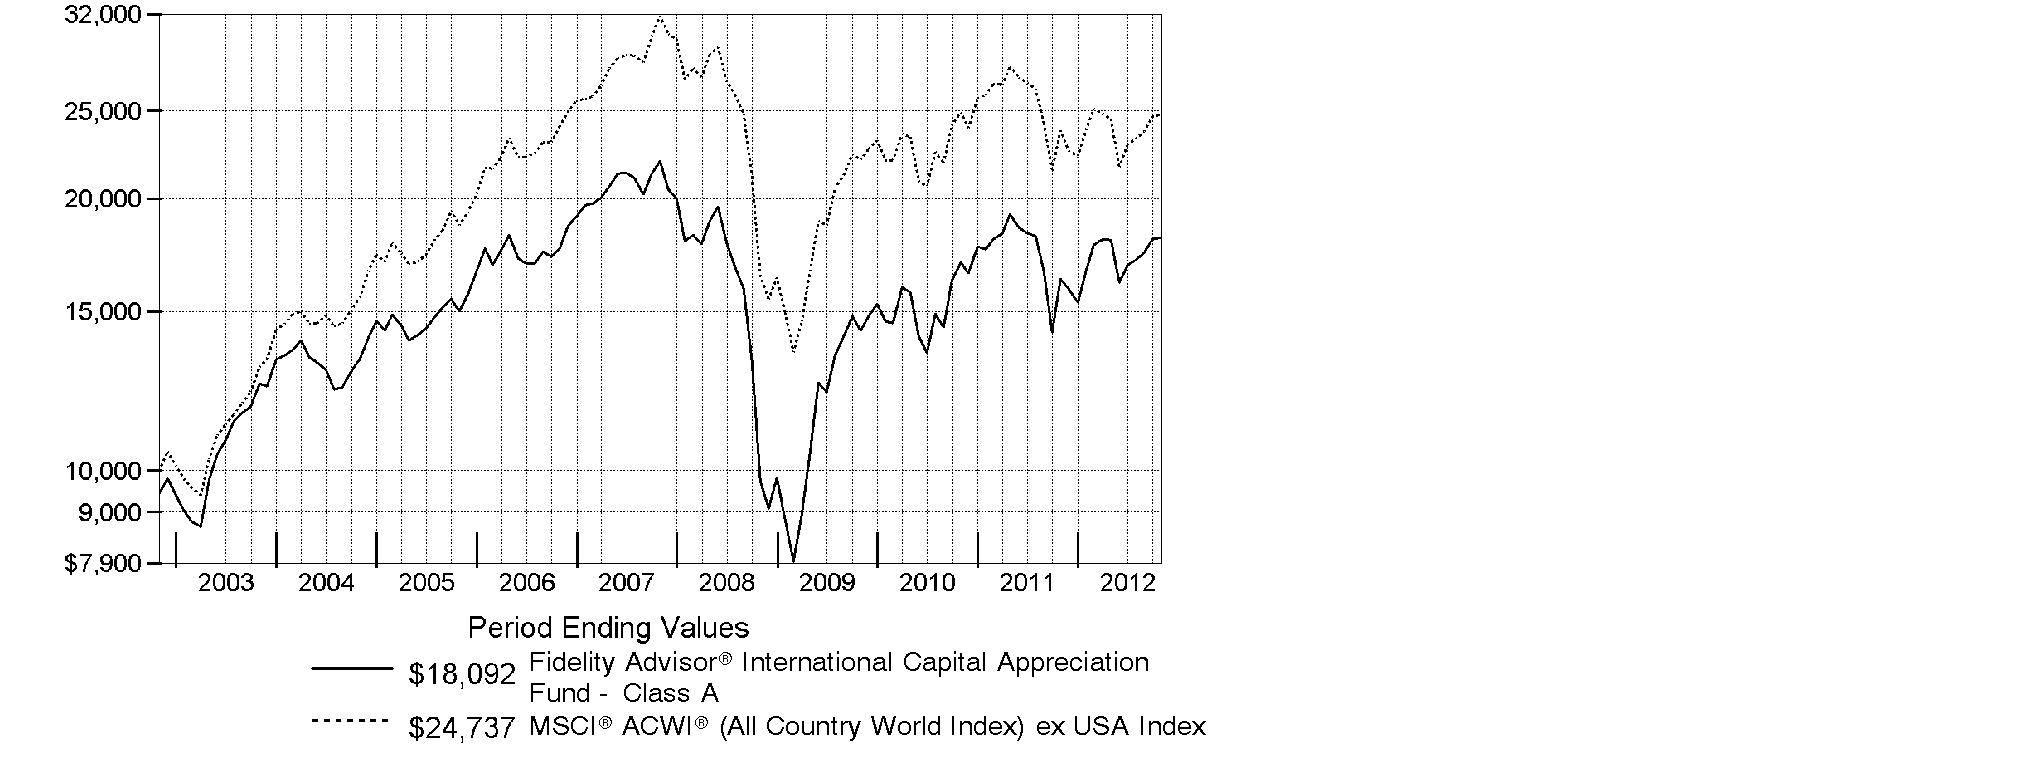
Annual Report
Market Recap: International stocks experienced pendulum-like swings during the 12 months ending October 31, 2012, finishing the period with a modest advance. The market faced periodic bouts of volatility this past year, as a number of macroeconomic concerns - including the eurozone debt crisis, the strength and pace of the U.S. economic recovery, and a slowdown in China's once-blistering growth - dominated headlines and weighed on investors. While a stronger U.S. dollar provided an additional head wind, foreign developed- and emerging-markets stocks still managed a gain for the 12 months, as the MSCI® ACWI® (All Country World Index) ex USA Index rose 4.11%, largely buttressed in the summertime by pledges of accommodative monetary action from eurozone officials, as well as signs that the U.S. housing market was on the mend. Within the index, Asia-Pacific ex Japan showed the most impressive gains, advancing roughly 11%. A number of core European components, most notably Germany (+11%), Switzerland (+10%) and the U.K. (+9%), benefited from optimism about the eurozone's ability to resolve its debt woes, which also helped the region outpace the index overall. Elsewhere, results from Canada (+3%) and the generally more volatile emerging markets (+2%) each fell short of the MSCI index, while Japan was among the few benchmark constituents to finish in the red, returning about -3%.
Comments from Sammy Simnegar, Portfolio Manager of Fidelity Advisor® International Capital Appreciation Fund: For the year, the fund's Class A, Class T, Class B and Class C shares returned 11.19%, 10.99%, 10.37% and 10.41%, respectively (excluding sales charges), handily outpacing the MSCI index. Stock selection in consumer staples, consumer discretionary and materials meaningfully lifted relative performance. Within staples, a large overweighting in food, beverage and tobacco also helped. Geographically, the fund was aided by a sizable out-of-benchmark stake in the United States and by stock picking in Brazil, Indonesia and Italy. Our U.S. holdings also benefited from an appreciating dollar. Three of the four biggest relative contributors were Indonesian stocks: Global Mediacom, Ace Hardware Indonesia and Tower Bersama Infrastructure, a cellular tower operator. Thailand-based big-box discount retailer Siam Makro - which I sold - helped as well. All of the contributors I've mentioned were non-benchmark holdings. Conversely, financials and health care detracted. Geographically, Australia hurt. Not owning strong-performing South Korean benchmark component Samsung Electronics during the period's first half hampered results, as did overweightings in Australia's Iluka Resources and Fortescue Metals Group, the latter of which I sold.
The views expressed above reflect those of the portfolio manager(s) only through the end of the period as stated on the cover of this report and do not necessarily represent the views of Fidelity or any other person in the Fidelity organization. Any such views are subject to change at any time based upon market or other conditions and Fidelity disclaims any responsibility to update such views. These views may not be relied on as investment advice and, because investment decisions for a Fidelity fund are based on numerous factors, may not be relied on as an indication of trading intent on behalf of any Fidelity fund.
Annual Report
Shareholder Expense Example
As a shareholder of the Fund, you incur two types of costs: (1) transaction costs, including sales charges (loads) on purchase payments or redemption proceeds, redemption fees and (2) ongoing costs, including management fees, distribution and/or service (12b-1) fees and other Fund expenses. This Example is intended to help you understand your ongoing costs (in dollars) of investing in the Fund and to compare these costs with the ongoing costs of investing in other mutual funds.
The Example is based on an investment of $1,000 invested at the beginning of the period and held for the entire period (May 1, 2012 to October 31, 2012).
Actual Expenses
The first line of the accompanying table for each class of the Fund provides information about actual account values and actual expenses. You may use the information in this line, together with the amount you invested, to estimate the expenses that you paid over the period. Simply divide your account value by $1,000.00 (for example, an $8,600 account value divided by $1,000.00 = 8.6), then multiply the result by the number in the first line for a class of the Fund under the heading entitled "Expenses Paid During Period" to estimate the expenses you paid on your account during this period. In addition, the Fund, as a shareholder in the underlying Fidelity Central Funds, will indirectly bear its pro-rata share of the fees and expenses incurred by the underlying Fidelity Central Funds. These fees and expenses are not included in the Fund's annualized expense ratio used to calculate the expense estimate in the table below.
Hypothetical Example for Comparison Purposes
The second line of the accompanying table for each class of the Fund provides information about hypothetical account values and hypothetical expenses based on a Class' actual expense ratio and an assumed rate of return of 5% per year before expenses, which is not the Class' actual return. The hypothetical account values and expenses may not be used to estimate the actual ending account balance or expenses you paid for the period. You may use this information to compare the ongoing costs of investing in the Fund and other funds. To do so, compare this 5% hypothetical example with the 5% hypothetical examples that appear in the shareholder reports of the other funds. In addition, the Fund, as a shareholder in the underlying Fidelity Central Funds, will indirectly bear its pro-rata share of the fees and expenses incurred by the underlying Fidelity Central Funds. These fees and expenses are not included in the Fund's annualized expense ratio used to calculate the expense estimate in the table below.
Please note that the expenses shown in the table are meant to highlight your ongoing costs only and do not reflect any transaction costs. Therefore, the second line of the table is useful in comparing ongoing costs only, and will not help you determine the relative total costs of owning different funds. In addition, if these transactional costs were included, your costs would have been higher.
Annual Report
| Annualized
Expense Ratio | Beginning
Account Value
May 1, 2012 | Ending
Account Value
October 31, 2012 | Expenses Paid
During Period*
May 1, 2012 to October 31, 2012 |
Class A | 1.45% | | | |
Actual | | $ 1,000.00 | $ 1,005.40 | $ 7.31 |
HypotheticalA | | $ 1,000.00 | $ 1,017.85 | $ 7.35 |
Class T | 1.70% | | | |
Actual | | $ 1,000.00 | $ 1,004.60 | $ 8.57 |
HypotheticalA | | $ 1,000.00 | $ 1,016.59 | $ 8.62 |
Class B | 2.20% | | | |
Actual | | $ 1,000.00 | $ 1,001.00 | $ 11.07 |
HypotheticalA | | $ 1,000.00 | $ 1,014.08 | $ 11.14 |
Class C | 2.20% | | | |
Actual | | $ 1,000.00 | $ 1,001.00 | $ 11.07 |
HypotheticalA | | $ 1,000.00 | $ 1,014.08 | $ 11.14 |
Institutional Class | 1.20% | | | |
Actual | | $ 1,000.00 | $ 1,006.70 | $ 6.05 |
HypotheticalA | | $ 1,000.00 | $ 1,019.10 | $ 6.09 |
A 5% return per year before expenses
* Expenses are equal to each Class' annualized expense ratio, multiplied by the average account value over the period, multiplied by 184/366 (to reflect the one-half year period).
Annual Report
Investment Changes (Unaudited)
Top Five Stocks as of October 31, 2012 |
| % of fund's
net assets | % of fund's net assets
6 months ago |
Nestle SA (Switzerland, Food Products) | 1.6 | 1.7 |
BHP Billiton PLC ADR (United Kingdom, Metals & Mining) | 1.5 | 1.6 |
Samsung Electronics Co. Ltd. (Korea (South), Semiconductors & Semiconductor Equipment) | 1.3 | 0.0 |
Unilever PLC (United Kingdom, Food Products) | 1.0 | 1.0 |
British American Tobacco PLC (United Kingdom) (United Kingdom, Tobacco) | 0.9 | 1.4 |
| 6.3 | |
Top Five Market Sectors as of October 31, 2012 |
| % of fund's
net assets | % of fund's net assets
6 months ago |
Consumer Discretionary | 19.3 | 19.7 |
Consumer Staples | 19.0 | 21.5 |
Industrials | 17.3 | 13.8 |
Financials | 12.2 | 12.6 |
Information Technology | 10.8 | 8.8 |
Top Five Countries as of October 31, 2012 |
(excluding cash equivalents) | % of fund's
net assets | % of fund's net assets
6 months ago |
United States of America | 16.0 | 16.2 |
United Kingdom | 13.4 | 15.6 |
France | 8.6 | 7.9 |
Japan | 6.9 | 9.2 |
Germany | 5.4 | 3.8 |
Percentages are adjusted for the effect of open futures contracts, if applicable. |
Asset Allocation (% of fund's net assets) |
As of October 31, 2012 | As of April 30, 2012 |
| Stocks 99.5% | | | Stocks 99.1% | |
| Short-Term Investments and Net Other Assets (Liabilities) 0.5% | | | Short-Term Investments and Net Other Assets (Liabilities) 0.9% | |

Annual Report
Investments October 31, 2012
Showing Percentage of Net Assets
Common Stocks - 98.9% |
| Shares | | Value |
Australia - 1.6% |
ALS Ltd. | 50,080 | | $ 481,906 |
Coca-Cola Amatil Ltd. | 31,792 | | 443,873 |
Iluka Resources Ltd. | 50,045 | | 515,336 |
Orica Ltd. | 18,382 | | 479,326 |
TOTAL AUSTRALIA | | 1,920,441 |
Austria - 0.4% |
Andritz AG | 8,098 | | 487,759 |
Bailiwick of Jersey - 0.5% |
Experian PLC | 35,600 | | 614,710 |
Belgium - 1.2% |
Anheuser-Busch InBev SA NV | 10,680 | | 893,181 |
Umicore SA | 9,677 | | 496,634 |
TOTAL BELGIUM | | 1,389,815 |
Bermuda - 0.8% |
Credicorp Ltd. (NY Shares) | 4,220 | | 545,815 |
Jardine Matheson Holdings Ltd. | 7,600 | | 468,160 |
TOTAL BERMUDA | | 1,013,975 |
Brazil - 3.8% |
BR Malls Participacoes SA | 36,300 | | 477,197 |
CCR SA | 53,400 | | 469,572 |
Cielo SA | 20,400 | | 504,714 |
Companhia de Bebidas das Americas (AmBev) (PN) sponsored ADR | 16,500 | | 673,035 |
Iguatemi Empresa de Shopping Centers SA | 33,800 | | 429,354 |
Itau Unibanco Holdings SA sponsored ADR | 45,750 | | 667,035 |
Multiplan Empreendimentos Imobiliarios SA | 15,900 | | 465,794 |
Qualicorp SA (a) | 41,000 | | 420,689 |
Souza Cruz SA | 34,300 | | 447,527 |
TOTAL BRAZIL | | 4,554,917 |
Canada - 0.6% |
Canadian National Railway Co. | 8,200 | | 708,053 |
Cayman Islands - 0.8% |
Baidu.com, Inc. sponsored ADR (a) | 4,200 | | 447,804 |
Sands China Ltd. | 140,000 | | 526,577 |
TOTAL CAYMAN ISLANDS | | 974,381 |
Common Stocks - continued |
| Shares | | Value |
Chile - 0.8% |
Embotelladora Andina SA Class A | 93,938 | | $ 472,472 |
Parque Arauco SA | 195,889 | | 447,432 |
TOTAL CHILE | | 919,904 |
Denmark - 1.1% |
FLSmidth & Co. A/S | 8,057 | | 475,971 |
Novo Nordisk A/S Series B sponsored ADR | 5,400 | | 865,566 |
TOTAL DENMARK | | 1,341,537 |
Finland - 0.8% |
Kone Oyj (B Shares) (d) | 7,500 | | 537,092 |
Nokian Tyres PLC | 11,214 | | 465,121 |
TOTAL FINLAND | | 1,002,213 |
France - 8.6% |
Air Liquide SA | 5,520 | | 651,082 |
Bollore | 1,305 | | 386,756 |
Bureau Veritas SA | 4,900 | | 520,348 |
Casino Guichard Perrachon SA | 5,282 | | 461,301 |
Christian Dior SA | 3,640 | | 522,517 |
Dassault Systemes SA | 4,400 | | 463,602 |
Edenred SA | 14,900 | | 431,155 |
Essilor International SA | 5,913 | | 533,041 |
Eurofins Scientific SA | 2,758 | | 426,471 |
Hermes International SCA | 1,480 | | 403,994 |
L'Oreal SA | 5,000 | | 636,863 |
LVMH Moet Hennessy - Louis Vuitton SA | 4,806 | | 781,154 |
Pernod Ricard SA | 5,800 | | 624,192 |
PPR SA | 3,300 | | 580,215 |
Publicis Groupe SA | 9,700 | | 522,582 |
Remy Cointreau SA (d) | 4,825 | | 500,439 |
Schneider Electric SA | 10,639 | | 665,148 |
Technip SA | 4,800 | | 540,650 |
Vivendi SA | 32,626 | | 667,519 |
TOTAL FRANCE | | 10,319,029 |
Germany - 4.8% |
adidas AG | 6,100 | | 519,695 |
BASF AG | 11,846 | | 981,594 |
Bayerische Motoren Werke AG (BMW) | 8,818 | | 702,340 |
Brenntag AG | 3,600 | | 453,735 |
Fresenius Medical Care AG & Co. KGaA sponsored ADR (d) | 7,700 | | 541,926 |
Henkel AG & Co. KGaA | 9,500 | | 614,686 |
Common Stocks - continued |
| Shares | | Value |
Germany - continued |
Hugo Boss AG | 4,700 | | $ 470,478 |
Linde AG | 3,500 | | 588,614 |
SAP AG | 12,210 | | 890,390 |
TOTAL GERMANY | | 5,763,458 |
Hong Kong - 1.0% |
AIA Group Ltd. | 182,200 | | 721,742 |
Galaxy Entertainment Group Ltd. (a) | 146,000 | | 502,048 |
TOTAL HONG KONG | | 1,223,790 |
India - 4.4% |
Asian Paints India Ltd. | 6,168 | | 443,780 |
Bajaj Auto Ltd. | 13,605 | | 459,303 |
Bosch Ltd. (a) | 2,592 | | 428,659 |
Colgate-Palmolive (India) | 18,317 | | 437,661 |
HDFC Bank Ltd. | 50,379 | | 591,549 |
Housing Development Finance Corp. Ltd. (a) | 40,528 | | 574,231 |
ITC Ltd. | 104,981 | | 551,294 |
Page Industries Ltd. | 7,002 | | 436,302 |
Smithkline Beecham Consumer Healthcare Ltd. | 8,424 | | 475,489 |
Titan Industries Ltd. (a) | 95,357 | | 459,550 |
TTK Prestige Ltd. (a) | 7,121 | | 424,276 |
TOTAL INDIA | | 5,282,094 |
Indonesia - 3.9% |
PT ACE Hardware Indonesia Tbk | 676,000 | | 492,658 |
PT Bank Central Asia Tbk | 546,000 | | 466,130 |
PT Bank Rakyat Indonesia Tbk | 620,500 | | 478,051 |
PT Global Mediacom Tbk | 1,932,000 | | 457,603 |
PT Jasa Marga Tbk | 751,500 | | 453,793 |
PT Mitra Adiperkasa Tbk | 598,000 | | 407,796 |
PT Modern Internasional Tbk (a) | 6,254,500 | | 481,865 |
PT Modern Internasional Tbk rights 11/8/12 (a) | 1,876,350 | | 37,117 |
PT Semen Gresik (Persero) Tbk | 307,000 | | 476,240 |
PT Surya Citra Media Tbk | 2,020,000 | | 410,097 |
PT Tower Bersama Infrastructure Tbk (a) | 950,000 | | 494,532 |
TOTAL INDONESIA | | 4,655,882 |
Ireland - 0.7% |
Accenture PLC Class A | 6,300 | | 424,683 |
Dragon Oil PLC | 47,300 | | 423,634 |
TOTAL IRELAND | | 848,317 |
Common Stocks - continued |
| Shares | | Value |
Israel - 0.4% |
Check Point Software Technologies Ltd. (a) | 9,700 | | $ 431,941 |
Italy - 1.9% |
Fiat Industrial SpA | 43,588 | | 472,029 |
Pirelli & C SpA (d) | 41,340 | | 478,763 |
Prada SpA | 60,100 | | 490,103 |
Saipem SpA | 11,108 | | 499,022 |
Salvatore Ferragamo Italia SpA (d) | 18,800 | | 381,841 |
TOTAL ITALY | | 2,321,758 |
Japan - 6.9% |
Daihatsu Motor Co. Ltd. | 28,000 | | 490,342 |
Daito Trust Construction Co. Ltd. | 4,300 | | 434,148 |
Fanuc Corp. | 4,300 | | 684,617 |
Fast Retailing Co. Ltd. | 2,300 | | 512,264 |
Hitachi Ltd. | 117,000 | | 619,955 |
Japan Tobacco, Inc. | 23,400 | | 646,629 |
Kansai Paint Co. Ltd. | 42,000 | | 451,935 |
Keyence Corp. | 1,940 | | 514,709 |
Komatsu Ltd. | 27,700 | | 580,163 |
Kubota Corp. | 50,000 | | 511,086 |
Nabtesco Corp. | 24,700 | | 459,780 |
Rakuten, Inc. | 51,700 | | 464,996 |
SMC Corp. | 3,400 | | 535,789 |
Sysmex Corp. | 9,700 | | 456,263 |
Unicharm Corp. | 8,600 | | 465,389 |
USS Co. Ltd. | 4,130 | | 434,056 |
TOTAL JAPAN | | 8,262,121 |
Korea (South) - 1.3% |
Samsung Electronics Co. Ltd. | 1,305 | | 1,567,934 |
Mexico - 1.3% |
Fomento Economico Mexicano SAB de CV sponsored ADR | 6,000 | | 543,660 |
Grupo Mexico SA de CV Series B | 170,600 | | 546,691 |
Grupo Televisa SA de CV (CPO) sponsored ADR | 21,400 | | 483,640 |
TOTAL MEXICO | | 1,573,991 |
Netherlands - 2.5% |
ASML Holding NV (Netherlands) | 11,400 | | 626,684 |
Core Laboratories NV | 4,475 | | 463,879 |
Heineken Holding NV (A Shares) | 11,100 | | 563,261 |
Kweichow Moutai Co. Ltd. (BNP Paribas Warrant Program) warrants 8/20/13 (a)(e) | 12,200 | | 483,795 |
Common Stocks - continued |
| Shares | | Value |
Netherlands - continued |
LyondellBasell Industries NV Class A | 8,090 | | $ 431,925 |
Yandex NV (a) | 17,300 | | 402,744 |
TOTAL NETHERLANDS | | 2,972,288 |
Nigeria - 0.7% |
Guaranty Trust Bank PLC | 3,615,519 | | 455,796 |
Nigerian Breweries PLC | 498,349 | | 384,566 |
TOTAL NIGERIA | | 840,362 |
Panama - 0.4% |
Intergroup Financial Services Corp. | 14,121 | | 451,872 |
Philippines - 2.4% |
Alliance Global Group, Inc. | 1,265,800 | | 458,275 |
International Container Terminal Services, Inc. | 265,800 | | 459,168 |
Metropolitan Bank & Trust Co. | 200,800 | | 464,136 |
Security Bank Corp. | 112,840 | | 444,496 |
SM Investments Corp. | 25,760 | | 503,291 |
SM Prime Holdings, Inc. | 1,440,950 | | 508,364 |
TOTAL PHILIPPINES | | 2,837,730 |
Portugal - 0.3% |
Jeronimo Martins SGPS SA | 24,500 | | 428,702 |
Russia - 1.4% |
Magnit OJSC GDR (Reg. S) | 14,395 | | 511,023 |
NOVATEK OAO GDR (Reg. S) | 4,400 | | 501,600 |
Sberbank (Savings Bank of the Russian Federation) | 219,300 | | 641,983 |
TOTAL RUSSIA | | 1,654,606 |
Singapore - 0.4% |
Jardine Cycle & Carriage Ltd. | 11,000 | | 444,040 |
South Africa - 1.7% |
Mr Price Group Ltd. | 31,700 | | 489,723 |
Nampak Ltd. | 128,000 | | 426,635 |
Naspers Ltd. Class N | 10,000 | | 649,213 |
Shoprite Holdings Ltd. | 25,400 | | 522,316 |
TOTAL SOUTH AFRICA | | 2,087,887 |
Spain - 1.0% |
Amadeus IT Holding SA Class A | 20,500 | | 507,508 |
Inditex SA | 5,219 | | 665,908 |
TOTAL SPAIN | | 1,173,416 |
Common Stocks - continued |
| Shares | | Value |
Sweden - 2.2% |
ASSA ABLOY AB (B Shares) | 16,006 | | $ 533,541 |
Atlas Copco AB (A Shares) | 27,000 | | 663,918 |
Elekta AB (B Shares) | 34,800 | | 495,801 |
Getinge AB (B Shares) | 14,600 | | 449,034 |
Swedish Match Co. AB | 14,200 | | 483,831 |
TOTAL SWEDEN | | 2,626,125 |
Switzerland - 5.3% |
Compagnie Financiere Richemont SA Series A | 11,208 | | 726,901 |
Dufry AG (a) | 3,660 | | 464,525 |
Nestle SA | 30,826 | | 1,956,208 |
Schindler Holding AG (Reg.) | 4,030 | | 521,438 |
SGS SA (Reg.) | 250 | | 529,368 |
Swatch Group AG (Bearer) | 1,460 | | 604,192 |
Syngenta AG (Switzerland) | 1,990 | | 775,880 |
UBS AG | 49,320 | | 739,977 |
TOTAL SWITZERLAND | | 6,318,489 |
Taiwan - 0.8% |
Taiwan Semiconductor Manufacturing Co. Ltd. sponsored ADR | 59,200 | | 941,280 |
Thailand - 1.6% |
C.P. ALL PCL (For. Reg.) | 402,000 | | 521,014 |
Home Product Center PCL (For. Reg.) | 1,145,280 | | 425,699 |
Kasikornbank PCL (For. Reg.) | 81,300 | | 477,144 |
Siam Commercial Bank PCL (For. Reg.) | 87,200 | | 457,750 |
TOTAL THAILAND | | 1,881,607 |
Turkey - 1.2% |
Coca-Cola Icecek A/S | 24,000 | | 465,941 |
TAV Havalimanlari Holding A/S | 97,000 | | 481,618 |
Turkiye Garanti Bankasi A/S | 114,000 | | 544,402 |
TOTAL TURKEY | | 1,491,961 |
United Kingdom - 13.4% |
Aggreko PLC | 14,300 | | 496,147 |
AMEC PLC | 25,411 | | 434,674 |
Antofagasta PLC | 26,200 | | 531,463 |
BHP Billiton PLC ADR | 27,689 | | 1,771,542 |
British American Tobacco PLC (United Kingdom) | 22,600 | | 1,120,951 |
Burberry Group PLC | 29,600 | | 556,963 |
Diageo PLC sponsored ADR | 7,800 | | 891,072 |
Halma PLC | 62,500 | | 415,944 |
Common Stocks - continued |
| Shares | | Value |
United Kingdom - continued |
IMI PLC | 32,700 | | $ 503,686 |
Imperial Tobacco Group PLC | 19,275 | | 727,858 |
InterContinental Hotel Group PLC ADR | 16,766 | | 412,779 |
Intertek Group PLC | 11,700 | | 532,252 |
Johnson Matthey PLC | 13,031 | | 472,937 |
Meggitt PLC | 78,600 | | 489,605 |
Prudential PLC | 52,499 | | 721,000 |
Reckitt Benckiser Group PLC | 11,500 | | 695,930 |
Rexam PLC | 68,400 | | 493,070 |
Rolls-Royce Group PLC | 46,500 | | 641,211 |
Rolls-Royce Group PLC Class C | 3,632,800 | | 5,862 |
Rotork PLC | 11,900 | | 437,459 |
SABMiller PLC | 16,300 | | 698,243 |
Spectris PLC | 17,300 | | 482,421 |
Standard Chartered PLC (United Kingdom) | 35,620 | | 841,246 |
The Weir Group PLC | 16,700 | | 469,462 |
Unilever PLC | 32,000 | | 1,193,702 |
TOTAL UNITED KINGDOM | | 16,037,479 |
United States of America - 16.0% |
Allergan, Inc. | 4,769 | | 428,828 |
Altria Group, Inc. | 11,000 | | 349,800 |
American Tower Corp. | 6,100 | | 459,269 |
Apple, Inc. | 693 | | 412,404 |
Caterpillar, Inc. | 5,400 | | 457,974 |
Citrix Systems, Inc. (a) | 5,900 | | 364,679 |
Coach, Inc. | 7,000 | | 392,350 |
Colgate-Palmolive Co. | 4,180 | | 438,733 |
Crown Castle International Corp. (a) | 6,600 | | 440,550 |
Cummins, Inc. | 5,020 | | 469,772 |
Danaher Corp. | 7,469 | | 386,371 |
Deere & Co. | 4,800 | | 410,112 |
EMC Corp. (a) | 17,700 | | 432,234 |
Estee Lauder Companies, Inc. Class A | 7,188 | | 442,925 |
FMC Corp. | 7,700 | | 412,104 |
FMC Technologies, Inc. (a) | 9,800 | | 400,820 |
Freeport-McMoRan Copper & Gold, Inc. | 11,284 | | 438,722 |
Google, Inc. Class A (a) | 520 | | 353,480 |
Intuitive Surgical, Inc. (a) | 800 | | 433,776 |
Joy Global, Inc. | 7,570 | | 472,747 |
KLA-Tencor Corp. | 9,200 | | 427,984 |
Limited Brands, Inc. | 8,800 | | 421,432 |
Common Stocks - continued |
| Shares | | Value |
United States of America - continued |
Lorillard, Inc. | 3,906 | | $ 453,135 |
MasterCard, Inc. Class A | 960 | | 442,493 |
McGraw-Hill Companies, Inc. | 8,015 | | 443,069 |
Mead Johnson Nutrition Co. Class A | 6,759 | | 416,760 |
Mettler-Toledo International, Inc. (a) | 2,600 | | 440,362 |
Monsanto Co. | 4,276 | | 368,035 |
Moody's Corp. | 9,300 | | 447,888 |
National Oilwell Varco, Inc. | 5,850 | | 431,145 |
NIKE, Inc. Class B | 4,600 | | 420,348 |
Oceaneering International, Inc. | 7,600 | | 397,708 |
Oracle Corp. | 14,180 | | 440,289 |
Perrigo Co. | 3,801 | | 437,153 |
Philip Morris International, Inc. | 5,342 | | 473,088 |
QUALCOMM, Inc. | 7,000 | | 410,025 |
Rockwood Holdings, Inc. | 9,400 | | 431,460 |
SBA Communications Corp. Class A (a) | 6,900 | | 459,747 |
Starbucks Corp. | 8,975 | | 411,953 |
The Coca-Cola Co. | 11,200 | | 416,416 |
TJX Companies, Inc. | 9,700 | | 403,811 |
Union Pacific Corp. | 3,500 | | 430,605 |
Visa, Inc. Class A | 3,200 | | 444,032 |
Waters Corp. (a) | 5,500 | | 449,955 |
Yum! Brands, Inc. | 7,000 | | 490,770 |
TOTAL UNITED STATES OF AMERICA | | 19,207,313 |
TOTAL COMMON STOCKS (Cost $105,494,246) |
118,573,177
|
Nonconvertible Preferred Stocks - 0.6% |
| | | |
Germany - 0.6% |
Volkswagen AG
(Cost $582,736) | 3,600 | |
744,716
|
Money Market Funds - 1.6% |
| Shares | | Value |
Fidelity Securities Lending Cash Central Fund, 0.19% (b)(c)
(Cost $1,864,522) | 1,864,522 | | $ 1,864,522 |
TOTAL INVESTMENT PORTFOLIO - 101.1% (Cost $107,941,504) | | 121,182,415 |
NET OTHER ASSETS (LIABILITIES) - (1.1)% | | (1,319,840) |
NET ASSETS - 100% | $ 119,862,575 |
Legend |
(a) Non-income producing |
(b) Affiliated fund that is available only to investment companies and other accounts managed by Fidelity Investments. The rate quoted is the annualized seven-day yield of the fund at period end. A complete unaudited listing of the fund's holdings as of its most recent quarter end is available upon request. In addition, each Fidelity Central Fund's financial statements, which are not covered by the Fund's Report of Independent Registered Public Accounting Firm, are available on the SEC's website or upon request. |
(c) Investment made with cash collateral received from securities on loan. |
(d) Security or a portion of the security is on loan at period end. |
(e) Security exempt from registration under Rule 144A of the Securities Act of 1933. These securities may be resold in transactions exempt from registration, normally to qualified institutional buyers. At the end of the period, the value of these securities amounted to $483,795 or 0.4% of net assets. |
Affiliated Central Funds |
Information regarding fiscal year to date income earned by the Fund from investments in Fidelity Central Funds is as follows: |
Fund | Income earned |
Fidelity Cash Central Fund | $ 436 |
Fidelity Securities Lending Cash Central Fund | 43,177 |
Total | $ 43,613 |
Other Information |
Categorizations in the Schedule of Investments are based on country or territory of incorporation. |
The following is a summary of the inputs used, as of October 31, 2012, involving the Fund's assets and liabilities carried at fair value. The inputs or methodology used for valuing securities may not be an indication of the risk associated with investing in those securities. For more information on valuation inputs, and their aggregation into the levels used in the table below, please refer to the Security Valuation section in the accompanying Notes to Financial Statements. |
Valuation Inputs at Reporting Date: |
Description | Total | Level 1 | Level 2 | Level 3 |
Investments in Securities: | | | | |
Equities: | | | | |
Consumer Discretionary | $ 23,396,344 | $ 23,359,227 | $ 37,117 | $ - |
Consumer Staples | 23,043,166 | 19,835,332 | 3,207,834 | - |
Energy | 4,093,132 | 4,093,132 | - | - |
Financials | 14,437,596 | 11,901,275 | 2,536,321 | - |
Health Care | 6,378,865 | 6,378,865 | - | - |
Industrials | 20,751,504 | 20,751,504 | - | - |
Information Technology | 12,969,933 | 11,452,859 | 1,517,074 | - |
Materials | 12,185,005 | 11,409,125 | 775,880 | - |
Telecommunication Services | 2,062,348 | 2,062,348 | - | - |
Money Market Funds | 1,864,522 | 1,864,522 | - | - |
Total Investments in Securities: | $ 121,182,415 | $ 113,108,189 | $ 8,074,226 | $ - |
The following is a summary of transfers between Level 1 and Level 2 for the period ended October 31, 2012. Transfers are assumed to have occurred at the beginning of the period, and are primarily attributable to the valuation techniques used for foreign equity securities, as discussed in the accompanying Notes to Financial Statements: |
Transfers | Total |
Level 1 to Level 2 | $ 0 |
Level 2 to Level 1 | $ 14,753,550 |
See accompanying notes which are an integral part of the financial statements.
Annual Report
Statement of Assets and Liabilities
| October 31, 2012 |
| | |
Assets | | |
Investment in securities, at value (including securities loaned of $1,753,785) - See accompanying schedule: Unaffiliated issuers (cost $106,076,982) | $ 119,317,893 | |
Fidelity Central Funds (cost $1,864,522) | 1,864,522 | |
Total Investments (cost $107,941,504) | | $ 121,182,415 |
Foreign currency held at value (cost $16,193) | | 16,193 |
Receivable for investments sold | | 2,065,672 |
Receivable for fund shares sold | | 101,786 |
Dividends receivable | | 299,498 |
Distributions receivable from Fidelity Central Funds | | 1,539 |
Receivable from investment adviser for expense reductions | | 24,134 |
Other receivables | | 269,625 |
Total assets | | 123,960,862 |
| | |
Liabilities | | |
Payable to custodian bank | $ 100,464 | |
Payable for investments purchased | 1,529,291 | |
Payable for fund shares redeemed | 291,050 | |
Accrued management fee | 95,137 | |
Distribution and service plan fees payable | 48,957 | |
Other affiliated payables | 34,491 | |
Other payables and accrued expenses | 134,375 | |
Collateral on securities loaned, at value | 1,864,522 | |
Total liabilities | | 4,098,287 |
| | |
Net Assets | | $ 119,862,575 |
Net Assets consist of: | | |
Paid in capital | | $ 211,267,935 |
Undistributed net investment income | | 532,563 |
Accumulated undistributed net realized gain (loss) on investments and foreign currency transactions | | (105,052,276) |
Net unrealized appreciation (depreciation) on investments and assets and liabilities in foreign currencies | | 13,114,353 |
Net Assets | | $ 119,862,575 |
See accompanying notes which are an integral part of the financial statements.
Annual Report
Financial Statements - continued
Statement of Assets and Liabilities - continued
| October 31, 2012 |
| | |
Calculation of Maximum Offering Price | | |
Class A:
Net Asset Value and redemption price per share ($40,624,485 ÷ 3,610,960 shares) | | $ 11.25 |
| | |
Maximum offering price per share (100/94.25 of $11.25) | | $ 11.94 |
Class T:
Net Asset Value and redemption price per share ($53,834,806 ÷ 4,882,971 shares) | | $ 11.03 |
| | |
Maximum offering price per share (100/96.50 of $11.03) | | $ 11.43 |
Class B:
Net Asset Value and offering price per share ($2,745,364 ÷ 268,552 shares)A | | $ 10.22 |
| | |
Class C:
Net Asset Value and offering price per share ($18,090,206 ÷ 1,776,200 shares)A | | $ 10.18 |
| | |
| | |
Institutional Class:
Net Asset Value, offering price and redemption price per share ($4,567,714 ÷ 381,117 shares) | | $ 11.99 |
A Redemption price per share is equal to net asset value less any applicable contingent deferred sales charge.
See accompanying notes which are an integral part of the financial statements.
Annual Report
Statement of Operations
| Year ended October 31, 2012 |
| | |
Investment Income | | |
Dividends | | $ 2,771,155 |
Income from Fidelity Central Funds | | 43,613 |
Income before foreign taxes withheld | | 2,814,768 |
Less foreign taxes withheld | | (210,901) |
Total income | | 2,603,867 |
| | |
Expenses | | |
Management fee
Basic fee | $ 860,534 | |
Performance adjustment | 292,951 | |
Transfer agent fees | 360,582 | |
Distribution and service plan fees | 597,133 | |
Accounting and security lending fees | 63,466 | |
Custodian fees and expenses | 139,257 | |
Independent trustees' compensation | 802 | |
Registration fees | 62,236 | |
Audit | 76,485 | |
Legal | 515 | |
Miscellaneous | 1,196 | |
Total expenses before reductions | 2,455,157 | |
Expense reductions | (445,311) | 2,009,846 |
Net investment income (loss) | | 594,021 |
Realized and Unrealized Gain (Loss) Net realized gain (loss) on: | | |
Investment securities: | | |
Unaffiliated issuers | 3,362,667 | |
Foreign currency transactions | (88,127) | |
Total net realized gain (loss) | | 3,274,540 |
Change in net unrealized appreciation (depreciation) on: Investment securities (net of increase in deferred foreign taxes of $38,920) | 8,560,477 | |
Assets and liabilities in foreign currencies | (9,406) | |
Total change in net unrealized appreciation (depreciation) | | 8,551,071 |
Net gain (loss) | | 11,825,611 |
Net increase (decrease) in net assets resulting from operations | | $ 12,419,632 |
See accompanying notes which are an integral part of the financial statements.
Annual Report
Financial Statements - continued
Statement of Changes in Net Assets
| Year ended
October 31,
2012 | Year ended
October 31,
2011 |
Increase (Decrease) in Net Assets | | |
Operations | | |
Net investment income (loss) | $ 594,021 | $ 730,290 |
Net realized gain (loss) | 3,274,540 | 8,411,487 |
Change in net unrealized appreciation (depreciation) | 8,551,071 | (14,294,405) |
Net increase (decrease) in net assets resulting
from operations | 12,419,632 | (5,152,628) |
Distributions to shareholders from net investment income | (721,694) | (760,710) |
Distributions to shareholders from net realized gain | (61,587) | (1,721,042) |
Total distributions | (783,281) | (2,481,752) |
Share transactions - net increase (decrease) | (20,248,751) | (24,900,583) |
Redemption fees | 1,999 | 3,558 |
Total increase (decrease) in net assets | (8,610,401) | (32,531,405) |
| | |
Net Assets | | |
Beginning of period | 128,472,976 | 161,004,381 |
End of period (including undistributed net investment income of $532,563 and undistributed net investment income of $717,375, respectively) | $ 119,862,575 | $ 128,472,976 |
See accompanying notes which are an integral part of the financial statements.
Annual Report
Financial Highlights - Class A
Years ended October 31, | 2012 | 2011 | 2010 | 2009 | 2008 |
Selected Per-Share Data | | | | | |
Net asset value, beginning of period | $ 10.21 | $ 10.85 | $ 9.34 | $ 6.39 | $ 18.64 |
Income from Investment Operations | | | | | |
Net investment income (loss)C | .08 | .08 F | .06 | .09 | .11 |
Net realized and unrealized gain (loss) | 1.05 | (.53) | 1.69 | 2.88 | (8.42) |
Total from investment operations | 1.13 | (.45) | 1.75 | 2.97 | (8.31) |
Distributions from net investment income | (.09) | (.08) | (.08) | (.02) | (.05) |
Distributions from net realized gain | (.01) | (.12) | (.16) | - | (3.89) |
Total distributions | (.09) I | (.19) J | (.24) | (.02) | (3.94) |
Redemption fees added to paid in capital C, H | - | - | - | - | - |
Net asset value, end of period | $ 11.25 | $ 10.21 | $ 10.85 | $ 9.34 | $ 6.39 |
Total Return A, B | 11.19% | (4.25)% | 18.98% | 46.61% | (55.70)% |
Ratios to Average Net AssetsD, G | | | | | |
Expenses before reductions | 1.78% | 1.64% | 1.45% | 1.27% | 1.42% |
Expenses net of fee waivers, if any | 1.45% | 1.45% | 1.45% | 1.27% | 1.42% |
Expenses net of all reductions | 1.41% | 1.38% | 1.27% | 1.15% | 1.25% |
Net investment income (loss) | .73% | .74% F | .66% | 1.22% | .95% |
Supplemental Data | | | | | |
Net assets, end of period (000 omitted) | $ 40,624 | $ 40,364 | $ 49,058 | $ 43,389 | $ 35,517 |
Portfolio turnover rate E | 142% | 254% | 490% | 414% | 394% |
A Total returns would have been lower if certain expenses had not been reduced during the applicable periods shown.
B Total returns do not include the effect of the sales charges.
C Calculated based on average shares outstanding during the period.
D Fees and expenses of any underlying Fidelity Central Funds are not included in the Fund's expense ratio. The Fund indirectly bears its proportionate share of the expenses of any underlying Fidelity Central Funds.
E Amount does not include the portfolio activity of any underlying Fidelity Central Funds.
F Investment income per share reflects a large, non-recurring dividend which amounted to $.03 per share. Excluding this non-recurring dividend, the ratio of net investment income (loss) to average net assets would have been .49%.
G Expense ratios reflect operating expenses of the class. Expenses before reductions do not reflect amounts reimbursed by the investment adviser or reductions from brokerage service arrangements or reductions from other expense offset arrangements and do not represent the amount paid by the class during periods when reimbursements or reductions occur. Expenses net of fee waivers reflect expenses after reimbursement by the investment adviser but prior to reductions from brokerage service arrangements or other expense offset arrangements. Expenses net of all reductions represent the net expenses paid by the class.
H Amount represents less than $.01 per share.
I Total distributions of $.09 per share is comprised of distributions from net investment income of $.085 and distributions from net realized gain of $.005 per share.
J Total distributions of $.19 per share is comprised of distributions from net investment income of $.077 and distributions from net realized gain of $.116 per share.
See accompanying notes which are an integral part of the financial statements.
Annual Report
Financial Highlights - Class T
Years ended October 31, | 2012 | 2011 | 2010 | 2009 | 2008 |
Selected Per-Share Data | | | | | |
Net asset value, beginning of period | $ 10.00 | $ 10.63 | $ 9.16 | $ 6.28 | $ 18.38 |
Income from Investment Operations | | | | | |
Net investment income (loss)C | .05 | .05F | .04 | .07 | .08 |
Net realized and unrealized gain (loss) | 1.04 | (.52) | 1.65 | 2.82 | (8.28) |
Total from investment operations | 1.09 | (.47) | 1.69 | 2.89 | (8.20) |
Distributions from net investment income | (.06) | (.05) | (.06) | (.01) | (.01) |
Distributions from net realized gain | (.01) | (.12) | (.16) | - | (3.89) |
Total distributions | (.06) I | (.16) J | (.22) | (.01) | (3.90) |
Redemption fees added to paid in capital C, H | - | - | - | - | - |
Net asset value, end of period | $ 11.03 | $ 10.00 | $ 10.63 | $ 9.16 | $ 6.28 |
Total ReturnA, B | 10.99% | (4.51)% | 18.65% | 46.23% | (55.79)% |
Ratios to Average Net AssetsD, G | | | | | |
Expenses before reductions | 2.03% | 1.88% | 1.69% | 1.52% | 1.65% |
Expenses net of fee waivers, if any | 1.70% | 1.70% | 1.69% | 1.52% | 1.65% |
Expenses net of all reductions | 1.66% | 1.62% | 1.51% | 1.41% | 1.48% |
Net investment income (loss) | .48% | .49% F | .42% | .96% | .71% |
Supplemental Data | | | | | |
Net assets, end of period (000 omitted) | $ 53,835 | $ 59,914 | $ 74,056 | $ 78,005 | $ 57,603 |
Portfolio turnover rate E | 142% | 254% | 490% | 414% | 394% |
A Total returns would have been lower if certain expenses had not been reduced during the applicable periods shown.
B Total returns do not include the effect of the sales charges.
C Calculated based on average shares outstanding during the period.
D Fees and expenses of any underlying Fidelity Central Funds are not included in the Fund's expense ratio. The Fund indirectly bears its proportionate share of the expenses of any underlying Fidelity Central Funds.
E Amount does not include the portfolio activity of any underlying Fidelity Central Funds.
F Investment income per share reflects a large, non-recurring dividend which amounted to $.03 per share. Excluding this non-recurring dividend, the ratio of net investment income (loss) to average net assets would have been .24%.
G Expense ratios reflect operating expenses of the class. Expenses before reductions do not reflect amounts reimbursed by the investment adviser or reductions from brokerage service arrangements or reductions from other expense offset arrangements and do not represent the amount paid by the class during periods when reimbursements or reductions occur. Expenses net of fee waivers reflect expenses after reimbursement by the investment adviser but prior to reductions from brokerage service arrangements or other expense offset arrangements. Expenses net of all reductions represent the net expenses paid by the class.
H Amount represents less than $.01 per share.
I Total distributions of $.06 per share is comprised of distributions from net investment income of $.056 and distributions from net realized gain of $.005 per share.
J Total distributions of $.16 per share is comprised of distributions from net investment income of $.047 and distributions from net realized gain of $.116 per share.
See accompanying notes which are an integral part of the financial statements.
Annual Report
Financial Highlights - Class B
Years ended October 31, | 2012 | 2011 | 2010 | 2009 | 2008 |
Selected Per-Share Data | | | | | |
Net asset value, beginning of period | $ 9.26 | $ 9.84 | $ 8.51 | $ 5.86 | $ 17.36 |
Income from Investment Operations | | | | | |
Net investment income (loss) C | - H | - F, H | (.01) | .03 | .02 |
Net realized and unrealized gain (loss) | .96 | (.48) | 1.53 | 2.63 | (7.75) |
Total from investment operations | .96 | (.48) | 1.52 | 2.66 | (7.73) |
Distributions from net investment income | - | (.01) | (.03) | (.01) | - |
Distributions from net realized gain | - | (.09) | (.16) | - | (3.77) |
Total distributions | - | (.10) | (.19) | (.01) | (3.77) |
Redemption fees added to paid in capital C,H | - | - | - | - | - |
Net asset value, end of period | $ 10.22 | $ 9.26 | $ 9.84 | $ 8.51 | $ 5.86 |
Total ReturnA, B | 10.37% | (4.99)% | 18.03% | 45.50% | (56.02)% |
Ratios to Average Net AssetsD, G | | | | | |
Expenses before reductions | 2.54% | 2.39% | 2.20% | 2.02% | 2.17% |
Expenses net of fee waivers, if any | 2.20% | 2.20% | 2.20% | 2.02% | 2.17% |
Expenses net of all reductions | 2.16% | 2.13% | 2.02% | 1.90% | 2.01% |
Net investment income (loss) | (.02)% | (.01)% F | (.09)% | .47% | .19% |
Supplemental Data | | | | | |
Net assets, end of period (000 omitted) | $ 2,745 | $ 4,241 | $ 8,737 | $ 10,661 | $ 10,356 |
Portfolio turnover rate E | 142% | 254% | 490% | 414% | 394% |
A Total returns would have been lower if certain expenses had not been reduced during the applicable periods shown.
B Total returns do not include the effect of the contingent deferred sales charge.
C Calculated based on average shares outstanding during the period.
D Fees and expenses of any underlying Fidelity Central Funds are not included in the Fund's expense ratio. The Fund indirectly bears its proportionate share of the expenses of any underlying Fidelity Central Funds.
E Amount does not include the portfolio activity of any underlying Fidelity Central Funds.
F Investment income per share reflects a large, non-recurring dividend which amounted to $.03 per share. Excluding this non-recurring dividend, the ratio of net investment income (loss) to average net assets would have been (.26) %.
G Expense ratios reflect operating expenses of the class. Expenses before reductions do not reflect amounts reimbursed by the investment adviser or reductions from brokerage service arrangements or reductions from other expense offset arrangements and do not represent the amount paid by the class during periods when reimbursements or reductions occur. Expenses net of fee waivers reflect expenses after reimbursement by the investment adviser but prior to reductions from brokerage service arrangements or other expense offset arrangements. Expenses net of all reductions represent the net expenses paid by the class.
H Amount represents less than $.01 per share.
See accompanying notes which are an integral part of the financial statements.
Annual Report
Financial Highlights - Class C
Years ended October 31, | 2012 | 2011 | 2010 | 2009 | 2008 |
Selected Per-Share Data | | | | | |
Net asset value, beginning of period | $ 9.23 | $ 9.84 | $ 8.51 | $ 5.87 | $ 17.42 |
Income from Investment Operations | | | | | |
Net investment income (loss) C | - H | -F, H | (.01) | .03 | .02 |
Net realized and unrealized gain (loss) | .96 | (.49) | 1.53 | 2.62 | (7.75) |
Total from investment operations | .96 | (.49) | 1.52 | 2.65 | (7.73) |
Distributions from net investment income | (.01) | (.01) | (.04) | (.01) | - |
Distributions from net realized gain | (.01) | (.11) | (.16) | - | (3.82) |
Total distributions | (.01) I | (.12) | (.19) J | (.01) | (3.82) |
Redemption fees added to paid in capital C,H | - | - | - | - | - |
Net asset value, end of period | $ 10.18 | $ 9.23 | $ 9.84 | $ 8.51 | $ 5.87 |
Total Return A, B | 10.41% | (5.07)% | 18.12% | 45.26% | (55.95)% |
Ratios to Average Net Assets D, G | | | | | |
Expenses before reductions | 2.53% | 2.39% | 2.20% | 2.02% | 2.16% |
Expenses net of fee waivers, if any | 2.20% | 2.20% | 2.20% | 2.02% | 2.16% |
Expenses net of all reductions | 2.16% | 2.13% | 2.02% | 1.90% | 2.00% |
Net investment income (loss) | (.02)% | (.01)% F | (.09)% | .47% | .20% |
Supplemental Data | | | | | |
Net assets, end of period (000 omitted) | $ 18,090 | $ 19,619 | $ 24,809 | $ 24,575 | $ 20,973 |
Portfolio turnover rate E | 142% | 254% | 490% | 414% | 394% |
A Total returns would have been lower if certain expenses had not been reduced during the applicable periods shown.
B Total returns do not include the effect of the contingent deferred sales charge.
C Calculated based on average shares outstanding during the period.
D Fees and expenses of any underlying Fidelity Central Funds are not included in the Fund's expense ratio. The Fund indirectly bears its proportionate share of the expenses of any underlying Fidelity Central Funds.
E Amount does not include the portfolio activity of any underlying Fidelity Central Funds.
F Investment income per share reflects a large, non-recurring dividend which amounted to $.03 per share. Excluding this non-recurring dividend, the ratio of net investment income (loss) to average net assets would have been (.26) %.
G Expense ratios reflect operating expenses of the class. Expenses before reductions do not reflect amounts reimbursed by the investment adviser or reductions from brokerage service arrangements or reductions from other expense offset arrangements and do not represent the amount paid by the class during periods when reimbursements or reductions occur. Expenses net of fee waivers reflect expenses after reimbursement by the investment adviser but prior to reductions from brokerage service arrangements or other expense offset arrangements. Expenses net of all reductions represent the net expenses paid by the class.
H Amount represents less than $.01 per share.
I Total distributions of $.01 per share is comprised of distributions from net investment income of $.005 and distributions from net realized gain of $.005 per share.
J Total distributions of $.19 per share is comprised of distributions from net investment income of $.037 and distributions from net realized gain of $.155 per share.
See accompanying notes which are an integral part of the financial statements.
Annual Report
Financial Highlights - Institutional Class
Years ended October 31, | 2012 | 2011 | 2010 | 2009 | 2008 |
Selected Per-Share Data | | | | | |
Net asset value, beginning of period | $ 10.87 | $ 11.54 | $ 9.91 | $ 6.77 | $ 19.49 |
Income from Investment Operations | | | | | |
Net investment income (loss) B | .11 | .12 E | .10 | .11 | .16 |
Net realized and unrealized gain (loss) | 1.13 | (.57) | 1.78 | 3.05 | (8.88) |
Total from investment operations | 1.24 | (.45) | 1.88 | 3.16 | (8.72) |
Distributions from net investment income | (.12) | (.11) | (.09) | (.02) | (.11) |
Distributions from net realized gain | (.01) | (.12) | (.16) | - | (3.89) |
Total distributions | (.12) H | (.22) I | (.25) | (.02) | (4.00) |
Redemption fees added to paid in capital B, G | - | - | - | - | - |
Net asset value, end of period | $ 11.99 | $ 10.87 | $ 11.54 | $ 9.91 | $ 6.77 |
Total ReturnA | 11.56% | (4.01)% | 19.22% | 46.85% | (55.51)% |
Ratios to Average Net AssetsC, F | | | | | |
Expenses before reductions | 1.48% | 1.35% | 1.19% | 1.00% | 1.12% |
Expenses net of fee waivers, if any | 1.20% | 1.20% | 1.19% | 1.00% | 1.12% |
Expenses net of all reductions | 1.16% | 1.12% | 1.01% | .89% | .95% |
Net investment income (loss) | .98% | 1.00% E | .93% | 1.48% | 1.24% |
Supplemental Data | | | | | |
Net assets, end of period (000 omitted) | $ 4,568 | $ 4,335 | $ 4,345 | $ 3,292 | $ 3,620 |
Portfolio turnover rateD | 142% | 254% | 490% | 414% | 394% |
A Total returns would have been lower if certain expenses had not been reduced during the applicable periods shown.
B Calculated based on average shares outstanding during the period.
C Fees and expenses of any underlying Fidelity Central Funds are not included in the Fund's expense ratio. The Fund indirectly bears its proportionate share of the expenses of any underlying Fidelity Central Funds.
D Amount does not include the portfolio activity of any underlying Fidelity Central Funds.
E Investment income per share reflects a large, non-recurring dividend which amounted to $.03 per share. Excluding this non-recurring dividend, the ratio of net investment income (loss) to average net assets would have been .74%.
F Expense ratios reflect operating expenses of the class. Expenses before reductions do not reflect amounts reimbursed by the investment adviser or reductions from brokerage service arrangements or reductions from other expense offset arrangements and do not represent the amount paid by the class during periods when reimbursements or reductions occur. Expenses net of fee waivers reflect expenses after reimbursement by the investment adviser but prior to reductions from brokerage service arrangements or other expense offset arrangements. Expenses net of all reductions represent the net expenses paid by the class.
G Amount represents less than $.01 per share.
H Total distributions of $.12 per share is comprised of distributions from net investment income of $.115 and distributions from net realized gain of $.005 per share.
I Total distributions of $.22 per share is comprised of distributions from net investment income of $.107 and distributions from net realized gain of $.116 per share.
See accompanying notes which are an integral part of the financial statements.
Annual Report
Notes to Financial Statements
For the period ended October 31, 2012
1. Organization.
Fidelity Advisor International Capital Appreciation Fund (the Fund) is a fund of Fidelity Advisor Series VIII (the Trust) and is authorized to issue an unlimited number of shares. The Trust is registered under the Investment Company Act of 1940, as amended (the 1940 Act), as an open-end management investment company organized as a Massachusetts business trust. The Fund offers Class A, Class T, Class C and Institutional Class shares, each of which, along with Class B shares, has equal rights as to assets and voting privileges. Effective after the close of business on September 1, 2010, Class B shares were closed to new accounts and additional purchases, except for exchanges and reinvestments. Each class has exclusive voting rights with respect to matters that affect that class. Class B shares will automatically convert to Class A shares after a holding period of seven years from the initial date of purchase. Investment income, realized and unrealized capital gains and losses, the common expenses of the Fund, and certain fund-level expense reductions, if any, are allocated on a pro-rata basis to each class based on the relative net assets of each class to the total net assets of the Fund. Each class differs with respect to transfer agent and distribution and service plan fees incurred. Certain expense reductions may also differ by class. The Fund's investments in emerging markets can be subject to social, economic, regulatory, and political uncertainties and can be extremely volatile.
2. Investments in Fidelity Central Funds.
The Fund invests in Fidelity Central Funds, which are open-end investment companies available only to other investment companies and accounts managed by Fidelity Management & Research Company (FMR) and its affiliates. The Fund's Schedule of Investments lists each of the Fidelity Central Funds held as of period end, if any, as an investment of the Fund, but does not include the underlying holdings of each Fidelity Central Fund. As an Investing Fund, the Fund indirectly bears its proportionate share of the expenses of the underlying Fidelity Central Funds.
The Money Market Central Funds seek preservation of capital and current income and are managed by Fidelity Investments Money Management, Inc. (FIMM), an affiliate of FMR.
A complete unaudited list of holdings for each Fidelity Central Fund is available upon request or at the Securities and Exchange Commission (the SEC) web site at www.sec.gov. In addition, the financial statements of the Fidelity Central Funds, which are not covered by the Fund's Report of Independent Registered Public Accounting Firm, are available on the SEC web site or upon request.
Annual Report
Notes to Financial Statements - continued
3. Significant Accounting Policies.
The financial statements have been prepared in conformity with accounting principles generally accepted in the United States of America (GAAP), which require management to make certain estimates and assumptions at the date of the financial statements. Actual results could differ from those estimates. Subsequent events, if any, through the date that the financial statements were issued have been evaluated in the preparation of the financial statements. The following summarizes the significant accounting policies of the Fund:
Security Valuation. Investments are valued as of 4:00 p.m. Eastern time on the last calendar day of the period. In accordance with valuation policies and procedures approved by the Board of Trustees (the Board), the Fund attempts to obtain prices from one or more third party pricing vendors or brokers to value its investments. When current market prices, quotations or rates are not readily available or reliable, securities will be fair valued in good faith by the FMR Fair Value Committee (the Committee), in accordance with procedures adopted by the Fund's Board. Factors used in determining fair value vary by security type and may include market or security specific events. The frequency with which these procedures are used cannot be predicted and they may be utilized to a significant extent. The Committee oversees the Fund's valuation policies and procedures and is responsible for approving and reporting to the Board all fair value determinations.
The Fund categorizes the inputs to valuation techniques used to value its investments into a disclosure hierarchy consisting of three levels as shown below:
Level 1 - quoted prices in active markets for identical investments
Level 2 - other significant observable inputs (including quoted prices for similar investments, interest rates, prepayment speeds, etc.)
Level 3 - unobservable inputs (including the Fund's own assumptions based on the best information available)
Valuation techniques used to value the Fund's investments by major category are as follows:
Equity securities, including restricted securities, for which market quotations are readily available, are valued at the last reported sale price or official closing price as reported by a third party pricing vendor on the primary market or exchange on which they are traded and are categorized as Level 1 in the hierarchy. In the event there were no sales during the day or closing prices are not available, securities are valued at the last quoted bid price or may be valued using the last available price and are generally categorized as Level 2 in the hierarchy. For foreign equity securities, when significant market or security specific events arise, comparisons to the valuation of American Depositary Receipts
Annual Report
3. Significant Accounting Policies - continued
Security Valuation - continued
(ADRs), futures contracts, Exchange-Traded Funds (ETFs) and certain indexes as well as quoted prices for similar securities are used and are categorized as Level 2 in the hierarchy. Utilizing these techniques may result in transfers between Level 1 and Level 2.
Investments in open-end mutual funds, including the Fidelity Central Funds, are valued at their closing net asset value (NAV) each business day and are categorized as Level 1 in the hierarchy.
Changes in valuation techniques may result in transfers in or out of an assigned level within the disclosure hierarchy. The aggregate value of investments by input level, as of October 31, 2012, including information on transfers between Levels 1 and 2, is included at the end of the Fund's Schedule of Investments.
Foreign Currency Translation. The Fund may use foreign currency contracts to facilitate transactions in foreign-denominated securities. Gains and losses from these transactions may arise from changes in the value of the foreign currency or if the counterparties do not perform under the contracts' terms.
Foreign-denominated assets, including investment securities, and liabilities are translated into U.S. dollars at the exchange rates at period end. Purchases and sales of investment securities, income and dividends received and expenses denominated in foreign currencies are translated into U.S. dollars at the exchange rate in effect on the transaction date.
The effects of exchange rate fluctuations on investments are included with the net realized and unrealized gain (loss) on investment securities. Other foreign currency transactions resulting in realized and unrealized gain (loss) are disclosed separately.
Investment Transactions and Income. For financial reporting purposes, the Fund's investment holdings and NAV include trades executed through the end of the last business day of the period. The NAV per share for processing shareholder transactions is calculated as of the close of business of the New York Stock Exchange (NYSE), normally 4:00 p.m. Eastern time and includes trades executed through the end of the prior business day. Gains and losses on securities sold are determined on the basis of identified cost and may include proceeds received from litigation. Dividend income is recorded on the ex-dividend date, except for certain dividends from foreign securities where the ex-dividend date may have passed, which are recorded as soon as the Fund is informed of the ex-dividend date. Non-cash dividends included in dividend income, if any, are recorded at the fair market value of the securities received. Interest income and distributions from the Fidelity Central Funds are accrued as earned. Investment income is recorded net of foreign taxes withheld where recovery of such taxes is uncertain.
Annual Report
Notes to Financial Statements - continued
3. Significant Accounting Policies - continued
Expenses. Expenses directly attributable to a fund are charged to that fund. Expenses attributable to more than one fund are allocated among the respective funds on the basis of relative net assets or other appropriate methods. Expense estimates are accrued in the period to which they relate and adjustments are made when actual amounts are known.
Income Tax Information and Distributions to Shareholders. Each year, the Fund intends to qualify as a regulated investment company under Subchapter M of the Internal Revenue Code, including distributing substantially all of its taxable income and realized gains. As a result, no provision for income taxes is required. As of October 31, 2012, the Fund did not have any unrecognized tax benefits in the financial statements; nor is the Fund aware of any tax positions for which it is reasonably possible that the total amounts of unrecognized tax benefits will significantly change in the next twelve months. The Fund files a U.S. federal tax return, in addition to state and local tax returns as required. A fund's federal income tax returns are subject to examination by the Internal Revenue Service (IRS) for a period of three fiscal years after they are filed. State and local tax returns may be subject to examination for an additional fiscal year depending on the jurisdiction. Foreign taxes are provided for based on the Fund's understanding of the tax rules and rates that exist in the foreign markets in which it invests. The Fund is subject to a tax imposed on capital gains by certain countries in which it invests. An estimated deferred tax liability for net unrealized appreciation on the applicable securities is included in Other payables and accrued expenses on the Statement of Assets & Liabilities.
Distributions are declared and recorded on the ex-dividend date. Income dividends and capital gain distributions are declared separately for each class. Income and capital gain distributions are determined in accordance with income tax regulations, which may differ from GAAP.
Capital accounts within the financial statements are adjusted for permanent book-tax differences. These adjustments have no impact on net assets or the results of operations. Temporary book-tax differences will reverse in a subsequent period.
Book-tax differences are primarily due to foreign currency transactions, passive foreign investment companies (PFIC), equity-debt classifications, capital loss carryforwards, and losses deferred due to wash sales.
The federal tax cost of investment securities and unrealized appreciation (depreciation) as of period end were as follows:
Gross unrealized appreciation | $ 14,580,827 |
Gross unrealized depreciation | (2,452,537) |
Net unrealized appreciation (depreciation) on securities and other investments | $ 12,128,290 |
| |
Tax Cost | $ 109,054,125 |
Annual Report
3. Significant Accounting Policies - continued
Income Tax Information and Distributions to Shareholders - continued
The tax-based components of distributable earnings as of period end were as follows:
Undistributed ordinary income | $ 532,563 |
Capital loss carryforward | $ (103,999,529) |
Net unrealized appreciation (depreciation) | $ 12,061,606 |
Capital loss carryforwards are only available to offset future capital gains of the Fund to the extent provided by regulations and may be limited. Under the Regulated Investment Company Modernization Act of 2010 (the Act), the Fund is permitted to carry forward capital losses incurred in taxable years beginning after December 22, 2010 for an unlimited period and such capital losses are required to be used prior to any losses that expire. Capital loss carryforwards were as follows:
Fiscal year of expiration | |
2016 | $ (80,031,657) |
2017 | (23,967,872) |
Total capital loss carryforward | $ (103,999,529) |
The tax character of distributions paid was as follows:
| October 31, 2012 | October 31, 2011 |
Ordinary Income | $ 783,281 | $ 2,481,752 |
Short-Term Trading (Redemption) Fees. Shares held by investors in the Fund less than 30 days are subject to a redemption fee equal to 1.00% of the net asset value of shares redeemed. All redemption fees, which reduce the proceeds of the shareholder redemption, are retained by the Fund and accounted for as an addition to paid in capital.
Restricted Securities. The Fund may invest in securities that are subject to legal or contractual restrictions on resale. These securities generally may be resold in transactions exempt from registration or to the public if the securities are registered. Disposal of these securities may involve time-consuming negotiations and expense, and prompt sale at an acceptable price may be difficult. Information regarding restricted securities is included at the end of the Fund's Schedule of Investments.
New Accounting Pronouncement. In December 2011, the Financial Accounting Standards Board issued Accounting Standard Update No. 2011-11, Disclosures about Offsetting Assets and Liabilities. The update creates new disclosure requirements requiring entities to disclose both gross and net information for derivatives and other financial instruments that are either offset in the Statement of Assets and Liabilities or
Annual Report
Notes to Financial Statements - continued
3. Significant Accounting Policies - continued
New Accounting Pronouncement - continued
subject to an enforceable master netting arrangement or similar agreement. The disclosure requirements are effective for annual reporting periods beginning on or after January 1, 2013, and interim periods within those annual periods. Management is currently evaluating the impact of the update's adoption on the Fund's financial statement disclosures.
4. Purchases and Sales of Investments.
Purchases and sales of securities, other than short-term securities, aggregated $171,987,771 and $190,378,005, respectively.
5. Fees and Other Transactions with Affiliates.
Management Fee. FMR and its affiliates provide the Fund with investment management related services for which the Fund pays a monthly management fee. The management fee is the sum of an individual fund fee rate that is based on an annual rate of .45% of the Fund's average net assets and an annualized group fee rate that averaged .26% during the period. The group fee rate is based upon the average net assets of all the mutual funds advised by FMR. The group fee rate decreases as assets under management increase and increases as assets under management decrease. In addition, the management fee is subject to a performance adjustment (up to a maximum of ± .20% of the Fund's average net assets over a 36 month performance period). The upward or downward adjustment to the management fee is based on the relative investment performance of the Institutional Class of the Fund as compared to an appropriate benchmark index. For the period, the total annual management fee rate, including the performance adjustment, was .95% of the Fund's average net assets.
Distribution and Service Plan Fees. In accordance with Rule 12b-1 of the 1940 Act, the Fund has adopted separate Distribution and Service Plans for each class of shares. Certain classes pay Fidelity Distributors Corporation (FDC), an affiliate of FMR, separate Distribution and Service Fees, each of which is based on an annual percentage of each class' average net assets. In addition, FDC may pay financial intermediaries for selling shares of the Fund and providing shareholder support services. For the period, the Distribution and Service Fee rates, total fees and amounts retained by FDC were as follows:
| Distribution
Fee | Service
Fee | Total Fees | Retained
by FDC |
Class A | -% | .25% | $ 99,529 | $ 1,057 |
Class T | .25% | .25% | 277,013 | 1,728 |
Class B | .75% | .25% | 33,850 | 25,495 |
Class C | .75% | .25% | 186,741 | 8,859 |
| | | $ 597,133 | $ 37,139 |
Annual Report
5. Fees and Other Transactions with Affiliates - continued
Sales Load. FDC may receive a front-end sales charge of up to 5.75% for selling Class A shares and 3.50% for selling Class T shares, some of which is paid to financial intermediaries for selling shares of the Fund. Depending on the holding period, FDC may receive contingent deferred sales charges levied on Class A, Class T, Class B, and Class C redemptions. The deferred sales charges range from 5.00% to 1.00% for Class B shares, 1.00% for Class C shares, 1.00% for certain purchases of Class A shares and .25% for certain purchases of Class T shares.
For the period, sales charge amounts retained by FDC were as follows:
| Retained
by FDC |
Class A | $ 6,896 |
Class T | 3,151 |
Class B* | 10,045 |
Class C* | 669 |
| $ 20,761 |
* When Class B and Class C shares are initially sold, FDC pays commissions from its own resources to financial intermediaries through which the sales are made.
Transfer Agent Fees. Fidelity Investments Institutional Operations Company, Inc. (FIIOC), an affiliate of FMR, is the transfer, dividend disbursing and shareholder servicing agent for each class of the Fund. FIIOC receives account fees and asset-based fees that vary according to the account size and type of account of the shareholders of the respective classes of the Fund. For the period, transfer agent fees for each class were as follows:
| Amount | % of
Average
Net Assets |
Class A | $ 119,875 | .30 |
Class T | 163,509 | .30 |
Class B | 10,211 | .30 |
Class C | 56,261 | .30 |
Institutional Class | 10,726 | .25 |
| $ 360,582 | |
Accounting and Security Lending Fees. Fidelity Service Company, Inc. (FSC), an affiliate of FMR, maintains the Fund's accounting records. The accounting fee is based on the level of average net assets for each month. Under a separate contract, FSC administers the security lending program. The security lending fee is based on the number and duration of lending transactions.
Annual Report
Notes to Financial Statements - continued
5. Fees and Other Transactions with Affiliates - continued
Brokerage Commissions. The Fund placed a portion of its portfolio transactions with brokerage firms which are affiliates of the investment adviser. The commissions paid to these affiliated firms were $843 for the period.
6. Committed Line of Credit.
The Fund participates with other funds managed by FMR or an affiliate in a $4.25 billion credit facility (the "line of credit") to be utilized for temporary or emergency purposes to fund shareholder redemptions or for other short-term liquidity purposes. The Fund has agreed to pay commitment fees on its pro-rata portion of the line of credit, which amounted to $336 and is reflected in Miscellaneous expenses on the Statement of Operations. During the period, there were no borrowings on this line of credit.
7. Security Lending.
The Fund lends portfolio securities through a lending agent from time to time in order to earn additional income. For equity securities, a lending agent is used and may loan securities to certain qualified borrowers, including Fidelity Capital Markets (FCM), a broker-dealer affiliated with the Fund. On the settlement date of the loan, the Fund receives collateral (in the form of U.S. Treasury obligations, letters of credit and/or cash) against the loaned securities and maintains collateral in an amount not less than 100% of the market value of the loaned securities during the period of the loan. The market value of the loaned securities is determined at the close of business of the Fund and any additional required collateral is delivered to the Fund on the next business day. If the borrower defaults on its obligation to return the securities loaned because of insolvency or other reasons, a fund could experience delays and costs in recovering the securities loaned or in gaining access to the collateral. Any cash collateral received is invested in the Fidelity Securities Lending Cash Central Fund. The value of loaned securities and cash collateral at period end are disclosed on the Fund's Statement of Assets and Liabilities. Security lending income represents the income earned on investing cash collateral, less rebates paid to borrowers and any lending agent fees associated with the loan, plus any premium payments received for lending certain types of securities. Security lending income is presented in the Statement of Operations as a component of income from Fidelity Central Funds. Total security lending income during the period amounted to $43,177. During the period, there were no securities loaned to FCM.
Annual Report
8. Expense Reductions.
FMR voluntarily agreed to reimburse each class to the extent annual operating expenses exceeded certain levels of average net assets as noted in the table below. Some expenses, for example interest expense, including commitment fees, are excluded from this reimbursement.
The following classes were in reimbursement during the period:
| Expense
Limitations | Reimbursement
from adviser |
| | |
Class A | 1.45% | $ 132,366 |
Class T | 1.70% | 181,526 |
Class B | 2.20% | 11,457 |
Class C | 2.20% | 62,372 |
Institutional Class | 1.20% | 12,038 |
| | $ 399,759 |
Many of the brokers with whom FMR places trades on behalf of the Fund provided services to the Fund in addition to trade execution. These services included payments of certain expenses on behalf of the Fund totaling $45,552 for the period.
9. Distributions to Shareholders.
Distributions to shareholders of each class were as follows:
Years ended October 31, | 2012 | 2011 |
From net investment income | | |
Class A | $ 338,785 | $ 351,944 |
Class T | 327,446 | 323,075 |
Class B | - | 9,663 |
Class C | 10,467 | 29,995 |
Institutional Class | 44,996 | 46,033 |
Total | $ 721,694 | $ 760,710 |
From net realized gain | | |
Class A | $ 19,929 | $ 529,480 |
Class T | 29,236 | 797,756 |
Class B | - | 70,707 |
Class C | 10,466 | 273,307 |
Institutional Class | 1,956 | 49,792 |
Total | $ 61,587 | $ 1,721,042 |
Annual Report
Notes to Financial Statements - continued
10. Share Transactions.
Transactions for each class of shares were as follows:
| Shares | Dollars |
Years ended October 31, | 2012 | 2011 | 2012 | 2011 |
Class A | | | | |
Shares sold | 501,429 | 721,944 | $ 5,286,360 | $ 7,956,982 |
Reinvestment of distributions | 32,796 | 72,790 | 324,358 | 801,552 |
Shares redeemed | (878,467) | (1,361,813) | (9,235,475) | (14,987,238) |
Net increase (decrease) | (344,242) | (567,079) | $ (3,624,757) | $ (6,228,704) |
Class T | | | | |
Shares sold | 474,830 | 879,812 | $ 4,927,589 | $ 9,150,890 |
Reinvestment of distributions | 35,814 | 101,007 | 347,751 | 1,092,104 |
Shares redeemed | (1,620,420) | (1,955,605) | (16,560,666) | (20,943,089) |
Net increase (decrease) | (1,109,776) | (974,786) | $ (11,285,326) | $ (10,700,095) |
Class B | | | | |
Shares sold | 5,681 | 9,370 | $ 54,950 | $ 93,679 |
Reinvestment of distributions | - | 7,318 | - | 73,635 |
Shares redeemed | (195,242) | (446,550) | (1,882,798) | (4,499,761) |
Net increase (decrease) | (189,561) | (429,862) | $ (1,827,848) | $ (4,332,447) |
Class C | | | | |
Shares sold | 139,534 | 194,812 | $ 1,345,653 | $ 1,945,397 |
Reinvestment of distributions | 2,090 | 27,032 | 18,836 | 271,185 |
Shares redeemed | (489,947) | (619,329) | (4,705,575) | (6,101,194) |
Net increase (decrease) | (348,323) | (397,485) | $ (3,341,086) | $ (3,884,612) |
Institutional Class | | | | |
Shares sold | 98,729 | 167,207 | $ 1,120,551 | $ 1,942,483 |
Reinvestment of distributions | 3,641 | 6,560 | 38,267 | 76,766 |
Shares redeemed | (120,081) | (151,382) | (1,328,552) | (1,773,974) |
Net increase (decrease) | (17,711) | 22,385 | $ (169,734) | $ 245,275 |
11. Other.
The Fund's organizational documents provide former and current trustees and officers with a limited indemnification against liabilities arising in connection with the performance of their duties to the Fund. In the normal course of business, the Fund may also enter into contracts that provide general indemnifications. The Fund's maximum exposure under these arrangements is unknown as this would be dependent on future claims that may be made against the Fund. The risk of material loss from such claims is considered remote.
Annual Report
To the Trustees of Fidelity Advisor Series VIII and Shareholders of Fidelity Advisor International Capital Appreciation Fund:
We have audited the accompanying statement of assets and liabilities of Fidelity Advisor International Capital Appreciation Fund (the Fund), a fund of Fidelity Advisor Series VIII, including the schedule of investments, as of October 31, 2012, and the related statement of operations for the year then ended, the statement of changes in net assets for each of the two years in the period then ended, and the financial highlights for each of the five years in the period then ended. These financial statements and financial highlights are the responsibility of the Fund's management. Our responsibility is to express an opinion on these financial statements and financial highlights based on our audits.
We conducted our audits in accordance with the standards of the Public Company Accounting Oversight Board (United States). Those standards require that we plan and perform the audit to obtain reasonable assurance about whether the financial statements and financial highlights are free of material misstatement. The Fund is not required to have, nor were we engaged to perform, an audit of its internal control over financial reporting. Our audits included consideration of internal control over financial reporting as a basis for designing audit procedures that are appropriate in the circumstances, but not for the purpose of expressing an opinion on the effectiveness of the Fund's internal control over financial reporting. Accordingly, we express no such opinion. An audit also includes examining, on a test basis, evidence supporting the amounts and disclosures in the financial statements, assessing the accounting principles used and significant estimates made by management, as well as evaluating the overall financial statement presentation. Our procedures included confirmation of securities owned as of October 31, 2012, by correspondence with the custodians and brokers; where replies were not received from brokers, we performed other auditing procedures. We believe that our audits provide a reasonable basis for our opinion.
In our opinion, the financial statements and financial highlights referred to above present fairly, in all material respects, the financial position of Fidelity Advisor International Capital Appreciation Fund as of October 31, 2012, the results of its operations for the year then ended, the changes in its net assets for each of the two years in the period then ended, and the financial highlights for each of the five years in the period then ended, in conformity with accounting principles generally accepted in the United States of America.
DELOITTE & TOUCHE LLP
Boston, Massachusetts
December 14, 2012
Annual Report
The Trustees, Members of the Advisory Board, and executive officers of the trust and fund, as applicable, are listed below. The Board of Trustees governs the fund and is responsible for protecting the interests of shareholders. The Trustees are experienced executives who meet periodically throughout the year to oversee the fund's activities, review contractual arrangements with companies that provide services to the fund, oversee management of the risks associated with such activities and contractual arrangements, and review the fund's performance. Except for James C. Curvey, each of the Trustees oversees 236 funds advised by FMR or an affiliate. Mr. Curvey oversees 443 funds advised by FMR or an affiliate.
The Trustees hold office without limit in time except that (a) any Trustee may resign; (b) any Trustee may be removed by written instrument, signed by at least two-thirds of the number of Trustees prior to such removal; (c) any Trustee who requests to be retired or who has become incapacitated by illness or injury may be retired by written instrument signed by a majority of the other Trustees; and (d) any Trustee may be removed at any special meeting of shareholders by a two-thirds vote of the outstanding voting securities of the trust. Each Trustee who is not an interested person (as defined in the 1940 Act) (Independent Trustee), shall retire not later than the last day of the calendar year in which his or her 75th birthday occurs. The Independent Trustees may waive this mandatory retirement age policy with respect to individual Trustees. The executive officers and Advisory Board Members hold office without limit in time, except that any officer and Advisory Board Member may resign or may be removed by a vote of a majority of the Trustees at any regular meeting or any special meeting of the Trustees. Except as indicated, each individual has held the office shown or other offices in the same company for the past five years.
Experience, Skills, Attributes, and Qualifications of the Fund's Trustees. The Governance and Nominating Committee has adopted a statement of policy that describes the experience, qualifications, attributes, and skills that are necessary and desirable for potential Independent Trustee candidates (Statement of Policy). The Board believes that each Trustee satisfied at the time he or she was initially elected or appointed a Trustee, and continues to satisfy, the standards contemplated by the Statement of Policy. The Governance and Nominating Committee also engages professional search firms to help identify potential Independent Trustee candidates who have the experience, qualifications, attributes, and skills consistent with the Statement of Policy. From time to time, additional criteria based on the composition and skills of the current Independent Trustees, as well as experience or skills that may be appropriate in light of future changes to board composition, business conditions, and regulatory or other developments, have also been considered by the professional search firms and the Governance and Nominating Committee. In addition, the Board takes into account the Trustees' commitment and participation in Board and committee meetings, as well as their leadership of standing and ad hoc committees throughout their tenure.
In determining that a particular Trustee was and continues to be qualified to serve as a Trustee, the Board has considered a variety of criteria, none of which, in isolation, was controlling. The Board believes that, collectively, the Trustees have balanced and diverse experience, qualifications, attributes, and skills, which allow the Board to operate effectively in governing the fund and protecting the interests of shareholders. Information about the specific experience, skills, attributes, and qualifications of each Trustee, which in each case led to the Board's conclusion that the Trustee should serve (or continue to serve) as a trustee of the fund, is provided below.
Annual Report
Trustees and Officers - continued
Board Structure and Oversight Function. James C. Curvey is an interested person (as defined in the 1940 Act) and currently serves as Chairman. The Trustees have determined that an interested Chairman is appropriate and benefits shareholders because an interested Chairman has a personal and professional stake in the quality and continuity of services provided to the fund. Independent Trustees exercise their informed business judgment to appoint an individual of their choosing to serve as Chairman, regardless of whether the Trustee happens to be independent or a member of management. The Independent Trustees have determined that they can act independently and effectively without having an Independent Trustee serve as Chairman and that a key structural component for assuring that they are in a position to do so is for the Independent Trustees to constitute a substantial majority for the Board. The Independent Trustees also regularly meet in executive session. Ned C. Lautenbach serves as Chairman of the Independent Trustees and as such (i) acts as a liaison between the Independent Trustees and management with respect to matters important to the Independent Trustees and (ii) with management prepares agendas for Board meetings.
Fidelity funds are overseen by different Boards of Trustees. The fund's Board oversees Fidelity's equity and high income funds and another Board oversees Fidelity's investment-grade bond, money market, and asset allocation funds. The asset allocation funds may invest in Fidelity funds overseen by the fund's Board. The use of separate Boards, each with its own committee structure, allows the Trustees of each group of Fidelity funds to focus on the unique issues of the funds they oversee, including common research, investment, and operational issues. On occasion, the separate Boards establish joint committees to address issues of overlapping consequences for the Fidelity funds overseen by each Board.
The Trustees operate using a system of committees to facilitate the timely and efficient consideration of all matters of importance to the Trustees, the fund, and fund shareholders and to facilitate compliance with legal and regulatory requirements and oversight of the fund's activities and associated risks. The Board, acting through its committees, has charged FMR and its affiliates with (i) identifying events or circumstances the occurrence of which could have demonstrably adverse effects on the fund's business and/or reputation; (ii) implementing processes and controls to lessen the possibility that such events or circumstances occur or to mitigate the effects of such events or circumstances if they do occur; and (iii) creating and maintaining a system designed to evaluate continuously business and market conditions in order to facilitate the identification and implementation processes described in (i) and (ii) above. Because the day-to-day operations and activities of the fund are carried out by or through FMR, its affiliates and other service providers, the fund's exposure to risks is mitigated but not eliminated by the processes overseen by the Trustees. While each of the Board's committees has responsibility for overseeing different aspects of the fund's activities, oversight is exercised primarily through the Operations, Audit, and Compliance Committees. In addition, the Independent Trustees have worked with FMR to enhance the Board's oversight of investment and financial risks, legal and regulatory risks, technology risks, and operational risks, including the development of additional risk reporting to the Board. For example, a working group comprised of Independent Trustees and FMR has worked and continues to work to review the Fidelity funds' valuation-related activities, reporting and risk management. Appropriate personnel, including but not limited to the fund's Chief Compliance Officer (CCO), FMR's internal auditor, the independent accountants, the fund's Treasurer and portfolio management personnel, make periodic reports to the Board's committees, as appropriate, including an annual review of FMR's risk management program for the Fidelity funds. The responsibilities of each standing committee, including their oversight responsibilities, are described further under "Standing Committees of the Fund's Trustees."
Annual Report
The fund's Statement of Additional Information (SAI) includes more information about the Trustees. To request a free copy, call Fidelity at 1-877-208-0098.
Interested Trustees*:
Correspondence intended for each Trustee who is an interested person may be sent to Fidelity Investments, 82 Devonshire Street, Boston, Massachusetts 02109.
Name, Age; Principal Occupations and Other Relevant Experience+ |
James C. Curvey (77) |
| Year of Election or Appointment: 2007 Mr. Curvey is Trustee and Chairman of the Board of Trustees of certain Trusts. Mr. Curvey also serves as Trustee (2007-present) of other investment companies advised by FMR. Mr. Curvey is a Director of Fidelity Investments Money Management, Inc. (2009-present), Director of Fidelity Research & Analysis Co. (2009-present) and Director of FMR and FMR Co., Inc. (2007-present). Mr. Curvey is also Vice Chairman (2007-present) and Director of FMR LLC. In addition, Mr. Curvey serves as an Overseer for the Boston Symphony Orchestra and a member of the Trustees of Villanova University. Previously, Mr. Curvey was the Vice Chairman (2006-2007) and Director (2000-2007) of FMR Corp. |
Ronald P. O'Hanley (55) |
| Year of Election or Appointment: 2011 Mr. O'Hanley is Director of FMR Co., Inc. (2010-present), Director of Fidelity Investments Money Management, Inc. (2010-present), Director of Fidelity Research & Analysis Company (2010-present), President of Fidelity Asset Management and Corporate Services and a member of Fidelity's Executive Committee (2010-present). Previously, Mr. O'Hanley served as President and Chief Executive Officer of BNY Mellon Asset Management (2007-2010). Mr. O'Hanley also served as Vice Chairman of Bank New York Mellon Corp. and a member of that firm's Executive Committee. Prior to the 2007 merger of The Bank of New York and Mellon Financial Corporation, he was Vice Chairman of Mellon Financial Corporation and President and Chief Executive Officer of Mellon Asset Management. He joined Mellon in February 1997. Mr. O'Hanley currently serves as Chairman of the Boston Public Library Foundation Board of Directors and sits on the Board of Directors of Beth Israel Deaconess Medical Center, the Board of Trustees of the Marine Biological Laboratory and the Advisory Board of the Maxwell School of Citizenship and Public Administration at Syracuse University. Mr. O'Hanley also chairs the Council on Asset Management for the Financial Services Roundtable and is a member of the Board of Directors of Institutional Investor's U.S. Institute. |
* Trustees have been determined to be "Interested Trustees" by virtue of, among other things, their affiliation with the trust or various entities under common control with FMR.
+ The information above includes each Trustee's principal occupation during the last five years and other information relating to the experience, attributes, and skills relevant to each Trustee's qualifications to serve as a Trustee, which led to the conclusion that each Trustee should serve as a Trustee for the fund.
Annual Report
Independent Trustees:
Correspondence intended for each Independent Trustee (that is, the Trustees other than the Interested Trustees) may be sent to Fidelity Investments, P.O. Box 55235, Boston, Massachusetts 02205-5235.
Name, Age; Principal Occupations and Other Relevant Experience+ |
Dennis J. Dirks (64) |
| Year of Election or Appointment: 2005 Prior to his retirement in May 2003, Mr. Dirks was Chief Operating Officer and a member of the Board of The Depository Trust & Clearing Corporation (DTCC). He also served as President, Chief Operating Officer, and Board member of The Depository Trust Company (DTC) and President and Board member of the National Securities Clearing Corporation (NSCC). In addition, Mr. Dirks served as Chief Executive Officer and Board member of the Government Securities Clearing Corporation, Chief Executive Officer and Board member of the Mortgage-Backed Securities Clearing Corporation, as a Trustee and a member of the Finance Committee of Manhattan College (2005-2008), and as a Trustee and a member of the Finance Committee of AHRC of Nassau County (2006-2008). Mr. Dirks is a member of the Independent Directors Council (IDC) Governing Council (2010-present) and Board of Directors for The Brookville Center for Children's Services, Inc. (2009-present). |
Alan J. Lacy (59) |
| Year of Election or Appointment: 2008 Mr. Lacy serves as Senior Adviser (2007-present) of Oak Hill Capital Partners, L.P. (private equity). Mr. Lacy also served as Chief Executive Officer (2000-2005) and Vice Chairman (2005-2006) of Sears Holdings Corporation and Sears, Roebuck and Co. (retail). In addition, Mr. Lacy serves as a member of the Board of Directors of Dave & Buster's Entertainment, Inc. (restaurant and entertainment complexes, 2010-present), Earth Fare, Inc. (retail grocery, 2012-present), The Hillman Companies, Inc. (hardware wholesalers, 2010-present), and Bristol-Myers Squibb Company (global pharmaceuticals, 2008-present). Mr. Lacy is a member of the Board of Trustees of The National Parks Conservation Association (2006-present). Previously, Mr. Lacy served as Chairman of the Board of Trustees of the National Parks Conservation Association (2008-2011) and as a member of the Board of Directors for the Western Union Company (global money transfer, 2006-2011). |
Ned C. Lautenbach (68) |
| Year of Election or Appointment: 2000 Mr. Lautenbach is Chairman of the Independent Trustees of the Equity and High Income Funds (2006-present). Mr. Lautenbach currently serves as the Lead Director of the Eaton Corporation Board of Directors (diversified industrial, 1997-present). Mr. Lautenbach is Chairman of the Board of Directors of the Philharmonic Center for the Arts in Naples, Florida (2012-present) and a member of the Council on Foreign Relations (1994-present). Previously, Mr. Lautenbach was a Partner/Advisory Partner at Clayton, Dubilier & Rice, LLC (private equity investment, 1998-2010), as well as a Director of Sony Corporation (2006-2007). |
Joseph Mauriello (68) |
| Year of Election or Appointment: 2008 Prior to his retirement in January 2006, Mr. Mauriello served in numerous senior management positions including Deputy Chairman and Chief Operating Officer (2004-2005), and Vice Chairman of Financial Services (2002-2004) of KPMG LLP US (professional services, 1965-2005). Mr. Mauriello currently serves as a member of the Board of Directors of XL Group plc. (global insurance and re-insurance, 2006-present). Previously, Mr. Mauriello served as a Director of the Hamilton Funds of the Bank of New York (2006-2007) and of Arcadia Resources Inc. (health care services and products, 2007-2012). |
Robert W. Selander (62) |
| Year of Election or Appointment: 2011 Previously, Mr. Selander served as a Member of the Advisory Board of Fidelity's Equity and High Income Funds (2011), Executive Vice Chairman (2010), Chief Executive Officer (2009-2010), and President and Chief Executive Officer (1997-2009) of Mastercard, Inc. |
Cornelia M. Small (68) |
| Year of Election or Appointment: 2005 Ms. Small is a member of the Board of Directors (2009-present) and Chair of the Investment Committee (2010-present) of the Teagle Foundation. Ms. Small also serves on the Investment Committee of the Berkshire Taconic Community Foundation (2008-present). Previously, Ms. Small served as Chairperson (2002-2008) and a member of the Investment Committee and Chairperson (2008-2012) and a member of the Board of Trustees of Smith College. In addition, Ms. Small served as Chief Investment Officer, Director of Global Equity Investments, and a member of the Board of Directors of Scudder, Stevens & Clark and Scudder Kemper Investments. |
William S. Stavropoulos (73) |
| Year of Election or Appointment: 2001 Mr. Stavropoulos is Vice Chairman of the Independent Trustees of the Equity and High Income Funds (2006-present). Mr. Stavropoulos serves as President and Founder of the Michigan Baseball Foundation, the Great Lakes Loons (2007-present). Mr. Stavropoulos is Chairman Emeritus of the Board of Directors of The Dow Chemical Company, where he previously served in numerous senior management positions, including President, CEO (1995-2000; 2002-2004), Chairman of the Executive Committee (2000-2006), and as a member of the Board of Directors (1990-2006). Currently, Mr. Stavropoulos is a Director of Univar Inc. (global distributor of commodity and specialty chemicals, Chairman from 2010-May 2012 and Lead Director from May 2012-present), Teradata Corporation (data warehousing and technology solutions, 2008-present), Maersk Inc. (industrial conglomerate), and Tyco International, Ltd. (multinational manufacturing and services, 2007-present), and a member of the Advisory Board for Metalmark Capital LLC (private equity investment, 2005-present). Mr. Stavropoulos is an operating advisor to Clayton, Dubilier & Rice, LLC (private equity investment). In addition, Mr. Stavropoulos is a member of the University of Notre Dame Advisory Council for the College of Science, a Trustee of the Rollin L. Gerstacker Foundation, and a Director of the Naples Philharmonic Center for the Arts. Previously, Mr. Stavropoulos served as a Director of Chemical Financial Corporation (bank holding company, 1993-2012). |
David M. Thomas (63) |
| Year of Election or Appointment: 2008 Previously, Mr. Thomas served as Executive Chairman (2005-2006) and Chairman and Chief Executive Officer (2000-2005) of IMS Health, Inc. (pharmaceutical and healthcare information solutions), and a Director of Fortune Brands, Inc. (consumer products, 2000-2011). In addition, Mr. Thomas serves as Non-Executive Chairman of the Board of Directors of Fortune Brands Home and Security (home and security products, 2011-present), and as a member of the Board of Directors of Interpublic Group of Companies, Inc. (marketing communication, 2004-present). |
Michael E. Wiley (62) |
| Year of Election or Appointment: 2008 Mr. Wiley also serves as a Director of Asia Pacific Exploration Consolidated (international oil and gas exploration and production, 2008-present). Mr. Wiley serves as a Director of Tesoro Corporation (independent oil refiner and marketer, 2005-present), and a Director of Bill Barrett Corporation (exploration and production, 2005-present). In addition, Mr. Wiley also serves as a Director of Post Oak Bank (privately-held bank, 2004-present). Previously, Mr. Wiley served as a member of the Board of Trustees of the University of Tulsa (2000-2006; 2007-2010), as a Senior Energy Advisor of Katzenbach Partners, LLC (consulting, 2006-2007), as an Advisory Director of Riverstone Holdings (private investment), Chairman, President, and CEO of Baker Hughes, Inc. (oilfield services, 2000-2004), and as Director of Spinnaker Exploration Company (exploration and production, 2001-2005). |
+ The information above includes each Trustee's principal occupation during the last five years and other information relating to the experience, attributes, and skills relevant to each Trustee's qualifications to serve as a Trustee, which led to the conclusion that each Trustee should serve as a Trustee for the fund.
Advisory Board Members and Executive Officers:
Correspondence intended for David A. Rosow and Garnett A. Smith may be sent to Fidelity Investments, P.O. Box 55235, Boston, Massachusetts 02205-5235. Correspondence intended for each executive officer, Edward C. Johnson 3d, and Peter S. Lynch may be sent to Fidelity Investments, 82 Devonshire Street, Boston, Massachusetts 02109.
Name, Age; Principal Occupation |
Edward C. Johnson 3d (82) |
| Year of Election or Appointment: 2011 Member of the Advisory Board of Fidelity's Equity and High Income Funds. Mr. Johnson serves as Chief Executive Officer, Chairman, and a Director of FMR LLC, and also serves as Chairman and Director of FIL Limited. Previously, Mr. Johnson served as a Trustee and Chairman of the Board of certain Fidelity Trusts, Chairman and a Director of FMR, Chairman and a Director of FMR Co., Inc., and President of FMR LLC (2006-2007). |
Peter S. Lynch (68) |
| Year of Election or Appointment: 2003 Member of the Advisory Board of Fidelity's Equity and High Income Funds. Mr. Lynch is Vice Chairman and a Director of FMR and FMR Co., Inc. In addition, Mr. Lynch serves as a Trustee of Boston College and as the Chairman of the Inner-City Scholarship Fund. Previously, Mr. Lynch served on the Special Olympics International Board of Directors (1997-2006). |
David A. Rosow (70) |
| Year of Election or Appointment: 2012 Member of the Advisory Board of Fidelity's Equity and High Income Funds. Chairman and Chief Executive Officer of International Golf Group, Inc. (golf course development, 1989-present). Previously, Mr. Rosow served as Chairman and Chief Executive Officer of Rosow & Company, Inc. (private investment company, 1989-2011), a Lead Director of Hudson United Bancorp (2001-2006) and as a Director of TD Banknorth (1996-2006). In addition, Mr. Rosow is a member (2008-present) and President (2009-present) of the Town Council of Palm Beach, Florida. |
Garnett A. Smith (65) |
| Year of Election or Appointment: 2012 Member of the Advisory Board of Fidelity's Equity and High Income Funds. Prior to Mr. Smith's retirement, he served as Chairman and Chief Executive Officer of Inbrand Corp. (manufacturer of personal absorbent products, 1990-1997). He also served as President (1986-1990) of Inbrand Corp. Prior to his employment with Inbrand Corp., he was employed by a retail fabric chain and North Carolina National Bank. In addition, Mr. Smith is a board member of the Jackson Hole Land Trust (2009-present). |
Kenneth B. Robins (43) |
| Year of Election or Appointment: 2008 President and Treasurer of Fidelity's Equity and High Income Funds. Mr. Robins also serves as President and Treasurer (2010-present) and Assistant Treasurer (2009-present) of other Fidelity funds and is an employee of Fidelity Investments (2004-present). Previously, Mr. Robins served as Deputy Treasurer of the Fidelity funds (2005-2008) and Treasurer and Chief Financial Officer of The North Carolina Capital Management Trust: Cash and Term Portfolios (2006-2008). |
Bruce T. Herring (47) |
| Year of Election or Appointment: 2006 Vice President of certain Equity Funds. Mr. Herring also serves as President of Fidelity Research & Analysis Company (2010-present), Chief Investment Officer and Director of Fidelity Management & Research (U.K.) Inc. (2010-present) and Group Chief Investment Officer of FMR. Previously, Mr. Herring served as Vice President (2005-2006) and Senior Vice President (2006-2007) of Fidelity Management & Research Company, Vice President of FMR Co., Inc. (2001-2007) and as a portfolio manager for Fidelity U.S. Equity Funds. |
Brian B. Hogan (48) |
| Year of Election or Appointment: 2009 Vice President of Equity and High Income Funds. Mr. Hogan also serves as President of FMR's Equity Division (2009-present). Previously, Mr. Hogan served as Senior Vice President, Equity Research of FMR (2006-2009) and as a portfolio manager. |
Scott C. Goebel (44) |
| Year of Election or Appointment: 2008 Secretary and Chief Legal Officer (CLO) of the Fidelity funds. Mr. Goebel also serves as Secretary of Fidelity Investments Money Management, Inc. (FIMM) (2010-present) and Fidelity Research and Analysis Company (FRAC) (2010-present); Secretary and CLO of The North Carolina Capital Management Trust: Cash and Term Portfolios (2008-present); General Counsel, Secretary, and Senior Vice President of FMR (2008-present) and FMR Co., Inc. (2008-present); employed by FMR LLC or an affiliate (2001-present); Chief Legal Officer of Fidelity Management & Research (Hong Kong) Limited (2008-present) and Assistant Secretary of Fidelity Management & Research (Japan) Inc. (2008-present), and Fidelity Management & Research (U.K.) Inc. (2008-present). Previously, Mr. Goebel served as Assistant Secretary of FIMM (2008-2010), FRAC (2008-2010), and the Funds (2007-2008) and as Vice President and Secretary of Fidelity Distributors Corporation (FDC) (2005-2007). |
William C. Coffey (43) |
| Year of Election or Appointment: 2009 Assistant Secretary of Fidelity's Equity and High Income Funds. Mr. Coffey also serves as Senior Vice President and Deputy General Counsel of FMR LLC (2010-present), and is an employee of Fidelity Investments. Previously, Mr. Coffey served as Vice President and Associate General Counsel of FMR LLC (2005-2009). |
Elizabeth Paige Baumann (44) |
| Year of Election or Appointment: 2012 Anti-Money Laundering (AML) Officer of the Fidelity funds. Ms. Baumann also serves as AML Officer of The North Carolina Capital Management Trust: Cash and Term Portfolios (2012-present), Chief AML Officer of FMR LLC (2012-present), and is an employee of Fidelity Investments. Previously, Ms. Baumann served as Vice President and Deputy Anti-Money Laundering Officer (2007-2012). |
Christine Reynolds (54) |
| Year of Election or Appointment: 2008 Chief Financial Officer of the Fidelity funds. Ms. Reynolds became President of Fidelity Pricing and Cash Management Services (FPCMS) in August 2008. Ms. Reynolds served as Chief Operating Officer of FPCMS (2007-2008). Previously, Ms. Reynolds served as President, Treasurer, and Anti-Money Laundering officer of the Fidelity funds (2004-2007). |
Joseph A. Hanlon (44) |
| Year of Election or Appointment: 2012 Chief Compliance Officer of Fidelity's Equity and High Income Funds. Mr. Hanlon serves as Compliance Officer of FMR, FMR Co., Inc., Fidelity Investments Money Management, Inc. (FIMM), Fidelity Research and Analysis Company (FRAC), Fidelity Management & Research (Japan) Inc., Fidelity Management & Research (U.K.) Inc., Fidelity Management & Research (Hong Kong), and Strategic Advisers, Inc. (2009-present), as Senior Vice President of the Fidelity Asset Management Division (2009-present), and is an employee of Fidelity Investments. |
Joseph F. Zambello (55) |
| Year of Election or Appointment: 2011 Deputy Treasurer of the Fidelity funds. Mr. Zambello is an employee of Fidelity Investments. Previously, Mr. Zambello served as Vice President of FMR's Program Management Group (2009-2011) and Vice President of the Transfer Agent Oversight Group (2005-2009). |
Adrien E. Deberghes (45) |
| Year of Election or Appointment: 2008 Deputy Treasurer of Fidelity's Equity and High Income Funds. Mr. Deberghes also serves as Vice President (2011-present) and Assistant Treasurer (2010-present) of other Fidelity funds, and is an employee of Fidelity Investments (2008-present). Previously, Mr. Deberghes served as Senior Vice President of Mutual Fund Administration at State Street Corporation (2007-2008), Senior Director of Mutual Fund Administration at Investors Bank & Trust (2005-2007), and Director of Finance for Dunkin' Brands (2000-2005). |
Stephen Sadoski (41) |
| Year of Election or Appointment: 2012 Deputy Treasurer of Fidelity's Equity and High Income Funds. Mr. Sadoski also serves as Assistant Treasurer of other Fidelity funds (2012-present) and is an employee of Fidelity Investments (2012-present). Previously, Mr. Sadoski served as an assistant chief accountant in the Division of Investment Management of the Securities and Exchange Commission (SEC) (2009-2012) and as a senior manager at Deloitte & Touche (1997-2009). |
Stephanie J. Dorsey (43) |
| Year of Election or Appointment: 2010 Assistant Treasurer of Fidelity's Equity and High Income Funds. Ms. Dorsey also serves as Deputy Treasurer of other Fidelity funds (2008-present) and is an employee of Fidelity Investments (2008-present). Previously, Ms. Dorsey served as Treasurer (2004-2008) of the JPMorgan Mutual Funds and Vice President (2004-2008) of JPMorgan Chase Bank. |
John R. Hebble (54) |
| Year of Election or Appointment: 2009 Assistant Treasurer of Fidelity's Equity and High Income Funds. Mr. Hebble also serves as President (2011-present), Treasurer, and Chief Financial Officer of The North Carolina Capital Management Trust: Cash and Term Portfolios (2008-present), President and Treasurer of other Fidelity funds (2008-present) and is an employee of Fidelity Investments. |
Gary W. Ryan (54) |
| Year of Election or Appointment: 2005 Assistant Treasurer of the Fidelity funds. Mr. Ryan is an employee of Fidelity Investments. Previously, Mr. Ryan served as Vice President of Fund Reporting in Fidelity Pricing and Cash Management Services (FPCMS) (1999-2005). |
Jonathan Davis (44) |
| Year of Election or Appointment: 2010 Assistant Treasurer of the Fidelity funds. Mr. Davis is also Assistant Treasurer of Fidelity Rutland Square Trust II and Fidelity Commonwealth Trust II. Mr. Davis is an employee of Fidelity Investments. Previously, Mr. Davis served as Vice President and Associate General Counsel of FMR LLC (2003-2010). |
Annual Report
Class A designates 10%, Class T designates 14%, and Class C designates 48% of the dividend distributed during the fiscal year as qualifying for the dividends-received deduction for corporate shareholders.
Class A designates 100%, Class T designates 100%, and Class C designates 100% of the dividend distributed during the fiscal year as amounts which may be taken into account as a dividend for purposes of the maximum rate under section 1(h)(11) of the Internal Revenue Code.
The amounts per share which represent income derived from sources within, and taxes paid to, foreign countries or possessions of the United States are as follows:
| Pay Date | Income | Taxes |
Class A | 12/05/11 | $0.102 | $0.0117 |
Class T | 12/05/11 | $0.073 | $0.0117 |
Class B | 12/05/11 | $0.000 | $0.0000 |
Class C | 12/05/11 | $0.022 | $0.0117 |
The fund will notify shareholders in January 2013 of amounts for use in preparing 2012 income tax returns.
Annual Report
Board Approval of Investment Advisory Contracts and Management Fees
Fidelity Advisor International Capital Appreciation Fund
Each year, the Board of Trustees, including the Independent Trustees (together, the Board), votes on the renewal of the management contract and sub-advisory agreements (together, the Advisory Contracts) for the fund. The Board, assisted by the advice of fund counsel and Independent Trustees' counsel, requests and considers a broad range of information relevant to the renewal of the Advisory Contracts throughout the year.
The Board meets regularly and, at each of its meetings, considers factors that are relevant to its annual consideration of the renewal of the fund's Advisory Contracts, including the services and support provided to the fund and its shareholders. The Board has established various standing committees, each composed of and chaired by Independent Trustees with varying backgrounds, to which the Board has assigned specific subject matter responsibilities in order to enhance effective decision-making by the Board. The Board, acting directly and through its Committees, requests and receives information concerning the annual consideration of the renewal of the fund's Advisory Contracts. The Board also meets as needed to consider matters specifically related to the Board's annual consideration of the renewal of Advisory Contracts. Members of the Board may also meet with trustees of other Fidelity funds through ad hoc joint committees to discuss certain matters relevant to the Fidelity funds.
At its July 2012 meeting, the Board of Trustees, including the Independent Trustees, unanimously determined to renew the fund's Advisory Contracts. In reaching its determination, the Board considered all factors it believed relevant, including (i) the nature, extent, and quality of the services to be provided to the fund and its shareholders (including the investment performance of the fund); (ii) the competitiveness of the fund's management fee and total expense ratio relative to peer funds; (iii) the total costs of the services to be provided by and the profits to be realized by Fidelity from its relationship with the fund; (iv) the extent to which economies of scale exist and would be realized as the fund grows; and (v) whether fee levels reflect these economies of scale, if any, for the benefit of fund shareholders.
In considering whether to renew the Advisory Contracts for the fund, the Board reached a determination, with the assistance of fund counsel and Independent Trustees' counsel and through the exercise of its business judgment, that the renewal of the Advisory Contracts is in the best interests of the fund and its shareholders and that the compensation payable under the Advisory Contracts is fair and reasonable. The Board's decision to renew the Advisory Contracts was not based on any single factor, but rather was based on a comprehensive consideration of all the information provided to the Board at its meetings throughout the year. The Board, in reaching its determination to renew the Advisory Contracts, is aware that shareholders in the fund have a broad range of investment choices available to them, including a wide choice among mutual funds offered by Fidelity's competitors, and that the fund's shareholders, who have the opportunity to review and weigh the disclosure provided by the fund in its prospectus and other public disclosures, have chosen to invest in this fund, managed by Fidelity.
Annual Report
Nature, Extent, and Quality of Services Provided. The Board considered the staffing within the investment adviser, FMR, and the sub-advisers (together, the Investment Advisers), including the backgrounds of the fund's investment personnel, and also considered the fund's investment objective, strategies, and related investment philosophy. The Independent Trustees also had discussions with senior management of Fidelity's investment operations and investment groups. The Board considered the structure of the portfolio manager compensation program and whether this structure provides appropriate incentives to act in the best interests of the fund.
Resources Dedicated to Investment Management and Support Services. The Board and the Fund Oversight and Research Committees reviewed the general qualifications and capabilities of the Investment Advisers' investment staff, including its size, education, experience, and resources, as well as the Investment Advisers' approach to recruiting, training, managing, and compensating investment personnel. The Board also noted that FMR has continued to increase the resources devoted to non-U.S. offices, including expansion of Fidelity's global investment organization. The Board noted that Fidelity's analysts have extensive resources, tools and capabilities that allow them to conduct sophisticated quantitative and fundamental analysis, as well as credit analysis of issuers, counterparties and guarantors. The Board also believes that Fidelity's investment professionals have sufficient access to global information and data so as to provide competitive investment results over time, and that those professionals also have access to sophisticated tools that permit them to assess portfolio construction and risk and performance attribution characteristics continuously, as well as to transmit new information and research conclusions rapidly around the world. Additionally, in its deliberations, the Board considered the Investment Advisers' trading and risk management capabilities and resources, which are an integral part of the investment management process.
Shareholder and Administrative Services. The Board considered (i) the nature, extent, quality, and cost of advisory, administrative, and shareholder services performed by the Investment Advisers and their affiliates under the Advisory Contracts and under separate agreements covering transfer agency, pricing and bookkeeping, and securities lending services for the fund; (ii) the nature and extent of the supervision of third party service providers, principally custodians and subcustodians; and (iii) the resources devoted to, and the record of compliance with, the fund's compliance policies and procedures. The Board also reviewed the allocation of fund brokerage, including allocations to brokers affiliated with the Investment Advisers, the use of brokerage commissions to pay fund expenses, and the use of "soft" commission dollars to pay for research services.
Annual Report
Board Approval of Investment Advisory Contracts and
Management Fees - continued
The Board noted that the growth of fund assets over time across the complex allows Fidelity to reinvest in the development of services designed to enhance the value or convenience of the Fidelity funds as investment vehicles. These services include 24-hour access to account information and market information through telephone representatives and over the Internet, investor education materials and asset allocation tools, and the expanded availability of Fidelity Investor Centers.
Investment in a Large Fund Family. The Board considered the benefits to shareholders of investing in a Fidelity fund, including the benefits of investing in a fund that is part of a large family of funds offering a variety of investment disciplines and providing a large variety of mutual fund investor services. The Board noted that Fidelity had taken, or had made recommendations that resulted in the Fidelity funds taking, a number of actions over the previous year that benefited particular funds, including (i) continuing to dedicate additional resources to investment research and support of the senior management team that oversees asset management; (ii) persisting in efforts to enhance Fidelity's research capabilities, in particular, international research; (iii) launching new funds and making other enhancements to meet client needs for global and income-oriented solutions; (iv) continuing to launch dedicated lower cost underlying funds to meet investment management's portfolio construction needs related to expanding underlying fund options, specifically for the Freedom Fund product lines; (v) adopting a "Stock Selector" sector neutral investment approach and employing a team of portfolio managers who are sector specialists to manage certain funds; (vi) rationalizing product lines and gaining increased efficiencies through the mergers of several funds into other funds; (vii) strengthening the Spartan Index Fund product line by adding new funds and/or new low-cost institutional share classes, restructuring fund expenses to accommodate new classes, and reducing investment minimums for certain classes of shares; (viii) modifying the eligibility criteria for Institutional Class shares to increase their appeal to government entities and charitable investors; and (ix) reducing certain transfer agent fee rates.
Investment Performance. The Board considered whether the fund has operated in accordance with its investment objective, as well as its record of compliance with its investment restrictions. It also reviewed the fund's absolute investment performance for each class, as well as the fund's relative investment performance for each class measured over multiple periods against (i) a broad-based securities market index, and (ii) a custom peer group of mutual funds deemed appropriate by Fidelity and reviewed by the Board. The following charts considered by the Board show, over the one-, three-, and five-year periods ended December 31, 2011, the cumulative total returns of Institutional Class (Class I) and Class B of the fund, the cumulative total returns of a broad-based securities market index ("benchmark"), and a range of cumulative total returns of a custom peer group of mutual funds defined by FMR based on categories assigned by Morningstar, Inc. The returns of Institutional Class (Class I) and Class B show the performance of the highest and lowest performing classes, respectively (based on five-year performance). The box within each chart shows the 25th percentile return (top of box) and the 75th percentile return (bottom of box) of the peer group. Returns shown above the box are in the first quartile and returns shown below the box are in the fourth quartile. The percentage beaten numbers noted below each chart correspond to the percentile box and represent the percentage of funds in the peer group whose performance was equal to or lower than that of the class indicated. The fund's custom peer group, defined by FMR, is a peer group that FMR believes provides a more meaningful performance comparison than the peer group assigned by Morningstar, Inc., which assigns mutual funds to categories based on their investment styles as measured by their underlying portfolio holdings.
Annual Report
Fidelity Advisor International Capital Appreciation Fund

The Board reviewed the fund's relative investment performance against its peer group and noted that the performance of Institutional Class (Class I) of the fund was in the second quartile for the one- and five-year periods and the first quartile for the three-year period. The Board also noted that the investment performance of Institutional Class (Class I) of the fund compared favorably to its benchmark for the one- and three-year periods, although the fund's five-year cumulative total return was lower than its benchmark. The Board considered that the variations in performance among the fund's classes reflect the variations in class expenses, which result in lower performance for higher expense classes. The Board also reviewed the fund's performance since inception as well as performance in the current year.
Annual Report
Board Approval of Investment Advisory Contracts and
Management Fees - continued
The Board also considered that the fund's management fee is subject to upward or downward adjustment depending upon whether, and to what extent, the fund's investment performance for the performance period exceeds, or is exceeded by, the record (over the same period) of a Board-approved performance adjustment index. The Board noted that the performance adjustment provides FMR with a strong economic incentive to seek to achieve superior performance for the fund's shareholders and helps to more closely align the interests of FMR and the fund's shareholders.
Based on its review, the Board concluded that the nature, extent, and quality of services provided to the fund under the Advisory Contracts should benefit the fund's shareholders.
Competitiveness of Management Fee and Total Expense Ratio. The Board considered the fund's management fee and total expense ratio compared to "mapped groups" of competitive funds and classes. Fidelity creates "mapped groups" by combining similar Lipper investment objective categories that have comparable management fee characteristics. Combining Lipper investment objective categories aids the Board's management fee and total expense ratio comparisons by broadening the competitive group used for comparison and by reducing the number of universes to which various Fidelity funds are compared.
Management Fee. The Board considered two proprietary management fee comparisons for the 12-month periods shown in the chart below. The group of Lipper funds used by the Board for management fee comparisons is referred to below as the "Total Mapped Group." The Total Mapped Group comparison focuses on a fund's standing relative to the total universe of comparable funds available to investors in terms of gross management fees before expense reimbursements or caps, and without giving effect to the fund's performance adjustment. "TMG %" represents the percentage of funds in the Total Mapped Group that had management fees that were lower than the fund's. For example, a TMG % of 17% means that 83% of the funds in the Total Mapped Group had higher management fees than the fund. The "Asset-Size Peer Group" (ASPG) comparison focuses on a fund's standing relative to non-Fidelity funds similar in size to the fund within the Total Mapped Group. The ASPG represents at least 15% of the funds in the Total Mapped Group with comparable asset size and management fee characteristics, subject to a minimum of 50 funds (or all funds in the Total Mapped Group if fewer than 50). Additional information, such as the ASPG quartile in which the fund's management fee ranked and the impact of the fund's performance adjustment, is also included in the chart and considered by the Board.
Annual Report
Fidelity Advisor International Capital Appreciation Fund
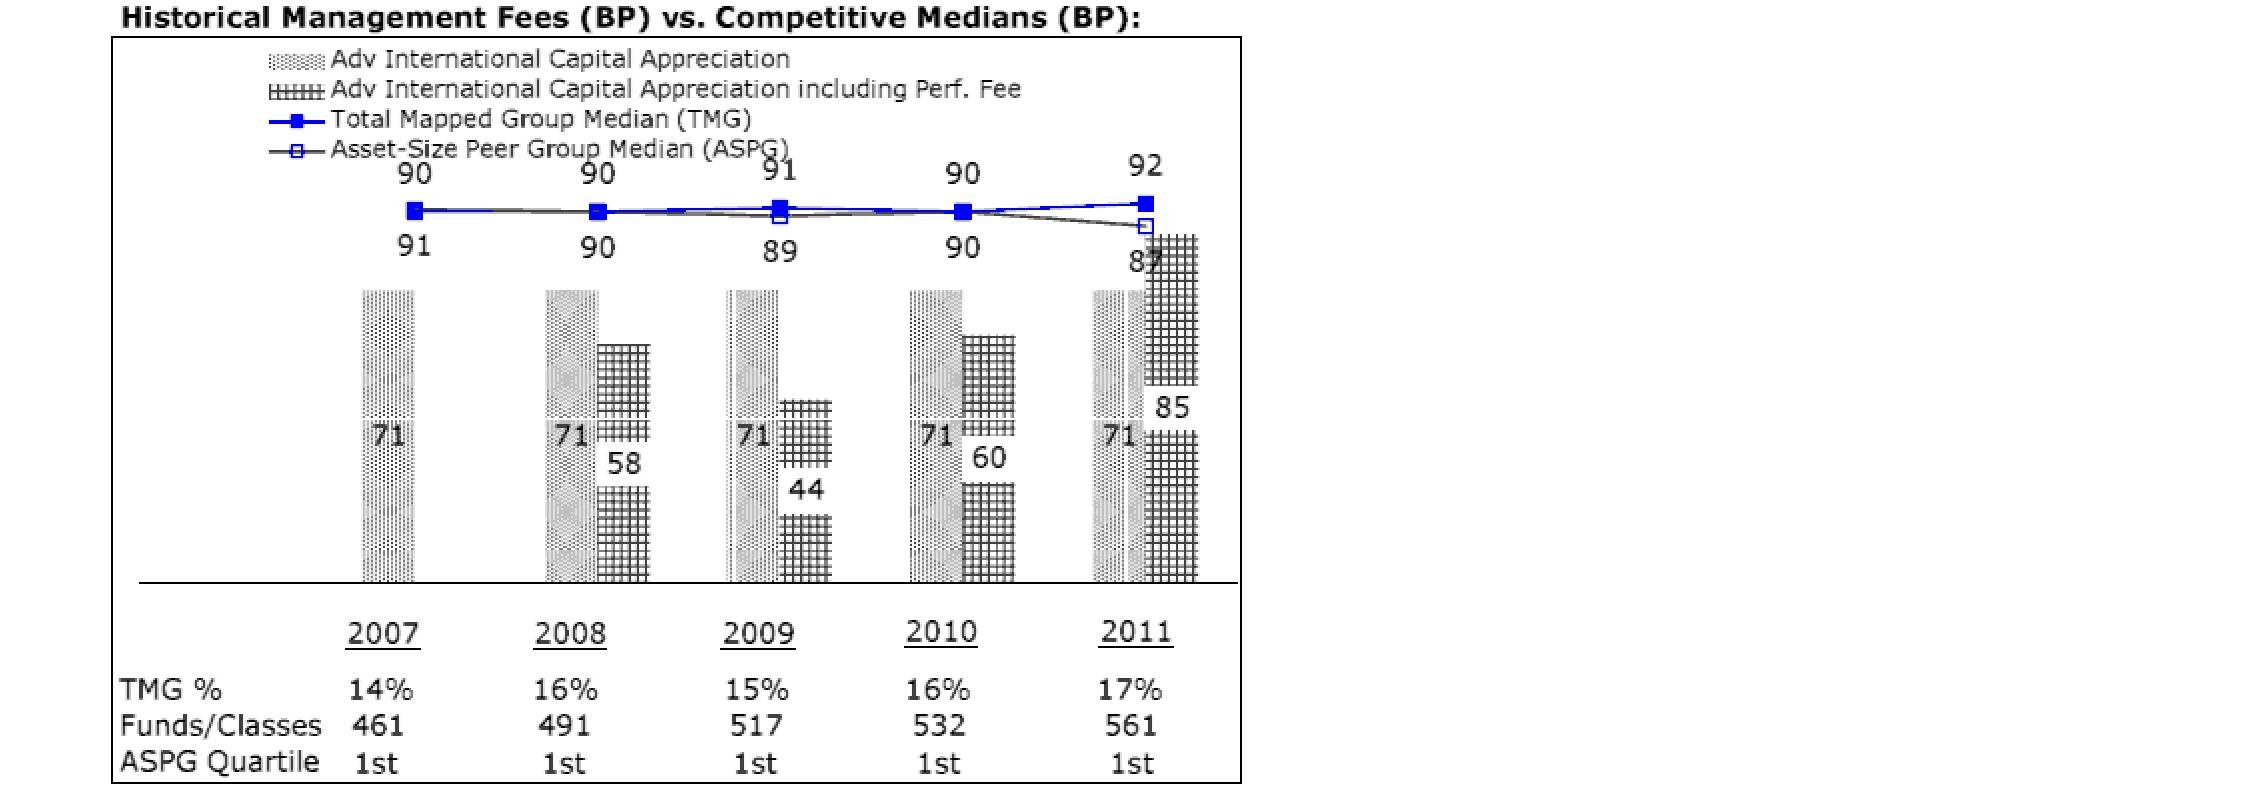
The Board noted that the fund's management fee ranked below the median of its Total Mapped Group and below the median of its ASPG for 2011. The Board also noted the effect of the fund's positive performance adjustment on the fund's management fee ranking. The Board noted that the performance adjustment for each year represents calculations for performance periods that differ from the periods shown in the performance charts above.
Based on its review, the Board concluded that the fund's management fee is fair and reasonable in light of the services that the fund receives and the other factors considered.
Total Expense Ratio. In its review of each class's total expense ratio, the Board considered the fund's management fee as well as other fund or class expenses, as applicable, such as transfer agent fees, pricing and bookkeeping fees, fund-paid 12b-1 fees, and custodial, legal, and audit fees. The Board also noted the effects of any waivers and reimbursements on fees and expenses, as well as the impact of the fund's performance adjustment. As part of its review, the Board also considered the current and historical total expense ratios of each class of the fund compared to competitive fund median expenses. Each class of the fund is compared to those funds and classes in the Total Mapped Group (used by the Board for management fee comparisons) that have a similar sales load structure.
The Board noted that the total expense ratio of Class A ranked below its competitive median for 2011, the total expense ratio of Class B ranked equal to its competitive median for 2011, and the total expense ratio of each of Class T, Class C and Institutional Class ranked above its competitive median for 2011. The Board considered that various factors, including 12b-1 fees, positive or negative performance adjustments, and relatively higher other expenses in the case of small fund size, can affect total expense ratios. The Board noted that the total expense ratio of Class T was above the competitive median primarily because of higher 12b-1 fees on Class T. Class T has a higher 12b-1 fee, but a lower front-end sales charge, than traditionally priced front-end sales charge classes. The Board considered that Class T is primarily sold load-waived in the retirement plan market where its 0.50% 12b-1 fee is comparable to competing no-load, higher 12b-1 fee classes designed specifically for retirement plans. The Board noted that the fund offers multiple classes, each of which has a different sales load and 12b-1 fee structure, and that the multiple structures are intended to offer a range of pricing options for the intermediary market. The Board also noted that the total expense ratios of the classes vary primarily by the level of their 12b-1 fees, although differences in transfer agent fees may also cause expenses to vary from class to class.
Annual Report
Board Approval of Investment Advisory Contracts and
Management Fees - continued
Fees Charged to Other Fidelity Clients. The Board also considered Fidelity fee structures and other information with respect to clients of FMR and its affiliates, such as other mutual funds advised or subadvised by FMR or its affiliates, pension plan clients, and other institutional clients. The Board noted the findings of the 2010 ad hoc joint committee (created with the board of other Fidelity funds), which reviewed and compared Fidelity's institutional investment advisory business with its business of providing services to the Fidelity funds, including the differences in services provided, fees charged, and costs incurred, as well as competition in their respective marketplaces.
Based on its review of total expense ratios and fees charged to other Fidelity clients, the Board concluded that the total expense ratio of each class of the fund was reasonable, although in some cases above the median of the universe presented for comparison, in light of the services that the fund and its shareholders receive and the other factors considered.
Costs of the Services and Profitability. The Board considered the revenues earned and the expenses incurred by Fidelity in conducting the business of developing, marketing, distributing, managing, administering and servicing the fund and its shareholders. The Board also considered the level of Fidelity's profits in respect of all the Fidelity funds.
On an annual basis, FMR presents to the Board Fidelity's profitability for the fund. Fidelity calculates the profitability for each fund, as well as aggregate profitability for groups of Fidelity funds and all Fidelity funds, using a series of detailed revenue and cost allocation methodologies which originate with the books and records of Fidelity on which Fidelity's audited financial statements are based. The Audit Committee of the Board reviews any significant changes from the prior year's methodologies.
PricewaterhouseCoopers LLP (PwC), independent registered public accounting firm and auditor to Fidelity and certain Fidelity funds, has been engaged annually by the Board as part of the Board's assessment of Fidelity's profitability analysis. PwC's engagement includes the review and assessment of Fidelity's methodologies used in determining the revenues and expenses attributable to Fidelity's mutual fund business, and completion of agreed-upon procedures surrounding the mathematical accuracy of fund profitability and its conformity to allocation methodologies. After considering PwC's reports issued under the engagement and information provided by Fidelity, the Board concluded that while other allocation methods may also be reasonable, Fidelity's profitability methodologies are reasonable in all material respects.
Annual Report
The Board also reviewed Fidelity's non-fund businesses and fall-out benefits related to the mutual fund business as well as cases where Fidelity's affiliates may benefit from or be related to the fund's business.
The Board considered the costs of the services provided by and the profits realized by Fidelity in connection with the operation of the fund and was satisfied that the profitability was not excessive in the circumstances.
Economies of Scale. The Board considered whether there have been economies of scale in respect of the management of the Fidelity funds, whether the Fidelity funds (including the fund) have appropriately benefited from any such economies of scale, and whether there is potential for realization of any further economies of scale. The Board considered the extent to which the fund will benefit from economies of scale through increased services to the fund, through waivers or reimbursements, or through fee or expense reductions. The Board also noted that in 2009, it and the board of other Fidelity funds created an ad hoc committee (the Economies of Scale Committee) to analyze whether FMR attains economies of scale in respect of the management and servicing of the Fidelity funds, whether the Fidelity funds have appropriately benefited from such economies of scale, and whether there is potential for realization of any further economies of scale.
The Board recognized that the fund's management contract incorporates a "group fee" structure, which provides for lower group fee rates as total fund assets under FMR's management increase, and for higher group fee rates as total fund assets under FMR's management decrease. FMR calculates the group fee rates based on a tiered asset "breakpoint" schedule that varies based on asset class. The Board considered that the group fee is designed to deliver the benefits of economies of scale to fund shareholders when total Fidelity fund assets increase, even if assets of any particular fund are unchanged or have declined, because some portion of Fidelity's costs are attributable to services provided to all Fidelity funds, and all funds benefit if those costs can be allocated among more assets. The Board concluded that, given the group fee structure, fund shareholders will benefit from lower management fees as assets under FMR's management increase at the fund complex level, regardless of whether Fidelity achieves any such economies of scale.
Annual Report
Board Approval of Investment Advisory Contracts and
Management Fees - continued
The Board concluded, taking into account the analysis of the Economies of Scale Committee, that economies of scale, if any, are being appropriately shared between fund shareholders and Fidelity.
Additional Information Requested by the Board. In order to develop fully the factual basis for consideration of the Fidelity funds' Advisory Contracts, the Board requested and received additional information on certain topics, including (i) fund performance trends, actions to be taken by FMR to improve certain funds' overall performance, and Fidelity's long-term strategies for certain funds; (ii) the potential to further rationalize the Fidelity fund lineup with the possibility of achieving savings for the funds and Fidelity; (iii) Fidelity's compensation structure for portfolio managers and other key investment personnel; (iv) the amount of the investment that each portfolio manager has made in the Fidelity fund(s) that he or she manages; (v) the realization of fall-out benefits in certain Fidelity business units; (vi) Fidelity's group fee structures, the potential impact of regulatory changes on such structures, and the rationale for the individual fee rates of certain funds; (vii) fund profitability methodology, including Fidelity's cost allocation methodology, and the impact of certain factors on fund profitability results; (viii) trends regarding industry use of performance fee structures and the possibility of implementing performance fee structures for additional funds; and (ix) the impact of net redemptions from the Fidelity funds.
Based on its evaluation of all of the conclusions noted above, and after considering all factors it believed relevant, the Board ultimately concluded that the advisory fee structures are fair and reasonable, and that the fund's Advisory Contracts should be renewed.
Annual Report
Investment Adviser
Fidelity Management & Research Company
Boston, MA
Investment Sub-Advisers
FMR Co., Inc.
Fidelity Management & Research
(U.K.) Inc.
Fidelity Management & Research
(Hong Kong) Limited
Fidelity Management & Research
(Japan) Inc.
FIL Investment Advisors
FIL Investments (Japan) Limited
FIL Investment Advisors (UK) Limited
General Distributor
Fidelity Distributors Corporation
Smithfield, RI
Transfer and Service Agents
Fidelity Investments Institutional Operations Company, Inc.
Boston, MA
Fidelity Service Company, Inc.
Boston, MA
Custodian
Brown Brothers Harriman & Co.
Boston, MA
(Fidelity Investment logo)(registered trademark)
AICAP-UANN-1212
1.784754.109
(Fidelity Investment logo)(registered trademark)
Fidelity Advisor®
Emerging Markets
Fund - Class A, Class T, Class B
and Class C
Annual Report
October 31, 2012
(Fidelity Cover Art)
Contents
Performance | (Click Here) | How the fund has done over time. |
Management's Discussion of Fund Performance | (Click Here) | The Portfolio Manager's review of fund performance and strategy. |
Shareholder Expense Example | (Click Here) | An example of shareholder expenses. |
Investment Changes | (Click Here) | A summary of major shifts in the fund's investments over the past six months. |
Investments | (Click Here) | A complete list of the fund's investments with their market values. |
Financial Statements | (Click Here) | Statements of assets and liabilities, operations, and changes in net assets, as well as financial highlights. |
Notes | (Click Here) | Notes to the financial statements. |
Report of Independent Registered Public Accounting Firm | (Click Here) | |
Trustees and Officers | (Click Here) | |
Distributions | (Click Here) | |
Board Approval of Investment Advisory Contracts and Management Fees | (Click Here) | |
To view a fund's proxy voting guidelines and proxy voting record for the 12-month period ended June 30, visit http://www.fidelity.com/proxyvotingresults or visit the Securities and Exchange Commission's (SEC) web site at http://www.sec.gov. You may also call 1-877-208-0098 to request a free copy of the proxy voting guidelines.
Standard & Poor's, S&P and S&P 500 are registered service marks of The McGraw-Hill Companies, Inc. and have been licensed for use by Fidelity Distributors Corporation.
Other third party marks appearing herein are the property of their respective owners.
All other marks appearing herein are registered or unregistered trademarks or service marks of FMR LLC or an affiliated company. © 2012 FMR LLC. All rights reserved.
Annual Report
This report and the financial statements contained herein are submitted for the general information of the shareholders of the fund. This report is not authorized for distribution to prospective investors in the fund unless preceded or accompanied by an effective prospectus.
A fund files its complete schedule of portfolio holdings with the SEC for the first and third quarters of each fiscal year on Form N-Q. Forms N-Q are available on the SEC's web site at http://www.sec.gov. A fund's Forms N-Q may be reviewed and copied at the SEC's Public Reference Room in Washington, DC. Information regarding the operation of the SEC's Public Reference Room may be obtained by calling 1-800-SEC-0330. For a complete list of a fund's portfolio holdings, view the most recent holdings listing, semiannual report, or annual report on Fidelity's web site at http://www.fidelity.com, http://advisor.fidelity.com, or http://www.401k.com, as applicable.
NOT FDIC INSURED • MAY LOSE VALUE • NO BANK GUARANTEE
Neither the fund nor Fidelity Distributors Corporation is a bank.
Annual Report
Average annual total return reflects the change in the value of an investment, assuming reinvestment of the class' distributions from dividend income and capital gains (the profits earned upon the sale of securities that have grown in value, if any) and assuming a constant rate of performance each year. The $10,000 table and the fund's returns do not reflect the deduction of taxes that a shareholder would pay on fund distributions or the redemption of fund shares. During periods of reimbursement by Fidelity, a fund's total return will be greater than it would be had the reimbursement not occurred. How a fund did yesterday is no guarantee of how it will do tomorrow. Returns reflect the conversion of Class B shares into Class A shares after a maximum of seven years.
Average Annual Total Returns
Periods ended October 31, 2012 | Past 1
year | Past 5
years | Life of
fund A |
Class A (incl. 5.75% sales charge) | -5.00% | -8.81% | 8.91% |
Class T (incl. 3.50% sales charge) | -3.03% | -8.61% | 8.92% |
Class B (incl. contingent deferred sales charge) B | -5.00% | -8.77% | 8.98% |
Class C (incl. contingent deferred sales charge) C | -1.00% | -8.42% | 8.84% |
A From March 29, 2004.
B Class B shares' contingent deferred sales charges included in the past one year, past five years, and life of fund total return figures are 5%, 2%, and 0%, respectively.
C Class C shares' contingent deferred sales charges included in the past one year, past five years, and life of fund total return figures are 1%, 0%, and 0%, respectively.
Annual Report
$10,000 Over Life of Fund
Let's say hypothetically that $10,000 was invested in Fidelity Advisor® Emerging Markets Fund - Class A on March 29, 2004, when the fund started, and the current 5.75% sales charge was paid. The chart shows how the value of your investment would have changed, and also shows how the MSCI® Emerging Markets Index performed over the same period.

Annual Report
Market Recap: Emerging-markets stocks gained 2.98% for the year ending October 31, 2012, as measured by the MSCI® Emerging Markets Index. After some early choppiness, the index rallied strongly in the first two months of 2012 but retreated from March through May amid renewed concerns about Europe's sovereign debt crisis and continued economic sluggishness in key countries such as China and Brazil. A general uptrend in the final five months of the period lifted the index into positive territory for the full year, despite the head wind of a generally stronger U.S. dollar. Major benchmark component Brazil was a drag on performance, falling roughly 13%. The nation's inflation rate crept higher while economic growth ebbed, creating an unfavorable backdrop for stocks here. India's market retreated about 5%, while Russia gave up 4%. Conversely, Hong Kong advanced approximately 17%, aided by rebounding shares of property developers, while South Africa added 7%, China rose roughly 5% and South Korea and Taiwan gained about 4% and 1%, respectively. Sentiment about Chinese stocks improved following the government's September approval of massive outlays for infrastructure projects, in hopes of halting that nation's economic slowdown. However, China's ongoing transition to new Communist Party leadership created uncertainty that kept some investors on the sidelines.
Comments from Robert von Rekowsky, Portfolio Manager of Fidelity Advisor® Emerging Markets Fund for most of the period covered by this report: For the year, the fund's Class A, Class T, Class B and Class C shares returned 0.80%, 0.49%, 0.00% and 0.00%, respectively (excluding sales charges), lagging the MSCI index. Relative performance was hurt the most by out-of-benchmark exposure to emerging-markets stocks listed in the United States, the United Kingdom and Canada, along with my picks in Taiwan and Hong Kong. Important individual detractors included OGX Petroleo e Gas Participacoes, a Brazilian producer of crude oil and natural gas. Given the company's significant downward revisions in its production and earnings targets, I sold the stock. Similar comments apply to an out-of-index position in Canadian gold-mining stock Eldorado Gold, which I also sold. Further weighing on our results was a non-index stake in China-based Yantai Changyu Pioneer Wine and underweighting the strong-performing shares of Taiwan Semiconductor Manufacturing. Conversely, stock selection in Indonesia helped. An out-of-benchmark stake in Indonesian cellular tower operator Tower Bersama Infrastructure paid off, as did underweighting Brazilian iron ore and nickel producer Vale and a sizable overweighting in Chinese automaker Great Wall Motor, which outperformed.
Note to shareholders: On October 1, 2012, Sammy Simnegar became Portfolio Manager of the fund.
The views expressed above reflect those of the portfolio manager(s) only through the end of the period as stated on the cover of this report and do not necessarily represent the views of Fidelity or any other person in the Fidelity organization. Any such views are subject to change at any time based upon market or other conditions and Fidelity disclaims any responsibility to update such views. These views may not be relied on as investment advice and, because investment decisions for a Fidelity fund are based on numerous factors, may not be relied on as an indication of trading intent on behalf of any Fidelity fund.
Annual Report
Shareholder Expense Example
As a shareholder of the Fund, you incur two types of costs: (1) transaction costs, including sales charges (loads) on purchase payments or redemption proceeds, redemption fees and (2) ongoing costs, including management fees, distribution and/or service (12b-1) fees and other Fund expenses. This Example is intended to help you understand your ongoing costs (in dollars) of investing in the Fund and to compare these costs with the ongoing costs of investing in other mutual funds.
The Example is based on an investment of $1,000 invested at the beginning of the period and held for the entire period (May 1, 2012 to October 31, 2012).
Actual Expenses
The first line of the accompanying table for each class of the Fund provides information about actual account values and actual expenses. You may use the information in this line, together with the amount you invested, to estimate the expenses that you paid over the period. Simply divide your account value by $1,000.00 (for example, an $8,600 account value divided by $1,000.00 = 8.6), then multiply the result by the number in the first line for a class of the Fund under the heading entitled "Expenses Paid During Period" to estimate the expenses you paid on your account during this period. In addition, the Fund, as a shareholder in the underlying Fidelity Central Funds, will indirectly bear its pro-rata share of the fees and expenses incurred by the underlying Fidelity Central Funds. These fees and expenses are not included in the Fund's annualized expense ratio used to calculate the expense estimate in the table below.
Hypothetical Example for Comparison Purposes
The second line of the accompanying table for each class of the Fund provides information about hypothetical account values and hypothetical expenses based on a Class' actual expense ratio and an assumed rate of return of 5% per year before expenses, which is not the Class' actual return. The hypothetical account values and expenses may not be used to estimate the actual ending account balance or expenses you paid for the period. You may use this information to compare the ongoing costs of investing in the Fund and other funds. To do so, compare this 5% hypothetical example with the 5% hypothetical examples that appear in the shareholder reports of the other funds. In addition, the Fund, as a shareholder in the underlying Fidelity Central Funds, will indirectly bear its pro-rata share of the fees and expenses incurred by the underlying Fidelity Central Funds. These fees and expenses are not included in the Fund's annualized expense ratio used to calculate the expense estimate in the table below.
Please note that the expenses shown in the table are meant to highlight your ongoing costs only and do not reflect any transaction costs. Therefore, the second line of the table is useful in comparing ongoing costs only, and will not help you determine the relative total costs of owning different funds. In addition, if these transactional costs were included, your costs would have been higher.
Annual Report
| Annualized
Expense Ratio | Beginning
Account Value
May 1, 2012 | Ending
Account Value
October 31, 2012 | Expenses Paid
During Period*
May 1, 2012
to October 31, 2012 |
Class A | 1.51% | | | |
Actual | | $ 1,000.00 | $ 963.40 | $ 7.45 |
HypotheticalA | | $ 1,000.00 | $ 1,017.55 | $ 7.66 |
Class T | 1.77% | | | |
Actual | | $ 1,000.00 | $ 962.30 | $ 8.73 |
HypotheticalA | | $ 1,000.00 | $ 1,016.24 | $ 8.97 |
Class B | 2.26% | | | |
Actual | | $ 1,000.00 | $ 959.80 | $ 11.13 |
HypotheticalA | | $ 1,000.00 | $ 1,013.77 | $ 11.44 |
Class C | 2.26% | | | |
Actual | | $ 1,000.00 | $ 959.70 | $ 11.13 |
HypotheticalA | | $ 1,000.00 | $ 1,013.77 | $ 11.44 |
Institutional Class | 1.19% | | | |
Actual | | $ 1,000.00 | $ 964.90 | $ 5.88 |
HypotheticalA | | $ 1,000.00 | $ 1,019.15 | $ 6.04 |
A 5% return per year before expenses
* Expenses are equal to each Class' annualized expense ratio, multiplied by the average account value over the period, multiplied by 184/366 (to reflect the one-half year period).
Annual Report
Investment Changes (Unaudited)
Top Five Stocks as of October 31, 2012 |
| % of fund's
net assets | % of fund's net assets
6 months ago |
Samsung Electronics Co. Ltd. (Korea (South), Semiconductors & Semiconductor Equipment) | 4.4 | 5.1 |
iShares MSCI Emerging Markets Index ETF (United States of America, Investment Companies) | 1.9 | 0.0 |
Vale SA (PN-A) (Brazil, Metals & Mining) | 1.7 | 0.9 |
Hyundai Motor Co. (Korea (South), Automobiles) | 1.6 | 2.0 |
Sberbank (Savings Bank of the Russian Federation) (Russia, Commercial Banks) | 1.6 | 1.5 |
| 11.2 | |
Top Five Market Sectors as of October 31, 2012 |
| % of fund's
net assets | % of fund's net assets
6 months ago |
Financials | 22.3 | 20.3 |
Consumer Discretionary | 18.0 | 12.4 |
Information Technology | 13.5 | 14.7 |
Consumer Staples | 11.0 | 9.7 |
Materials | 10.3 | 9.8 |
Top Five Countries as of October 31, 2012 |
(excluding cash equivalents) | % of fund's
net assets | % of fund's net assets
6 months ago |
Korea (South) | 13.4 | 20.5 |
Brazil | 12.1 | 10.9 |
India | 7.8 | 4.3 |
Indonesia | 7.2 | 6.9 |
Cayman Islands | 5.8 | 5.8 |
Percentages are adjusted for the effect of open futures contracts, if applicable. |
Asset Allocation (% of fund's net assets) |
As of October 31, 2012 | As of April 30, 2012 |
| Stocks and Investment Companies 98.5% | | | Stocks 98.9% | |
 | Bonds 0.0% | |  | Bonds 0.1% | |
| Short-Term
Investments and
Net Other Assets
(Liabilities) 1.5% | | | Short-Term
Investments and
Net Other Assets
(Liabilities) 1.0% | |

Annual Report
Investments October 31, 2012
Showing Percentage of Net Assets
Common Stocks - 96.3% |
| Shares | | Value |
Australia - 0.3% |
Iluka Resources Ltd. | 132,607 | | $ 1,365,515 |
Bailiwick of Jersey - 0.2% |
Randgold Resources Ltd. sponsored ADR | 8,150 | | 974,659 |
Bermuda - 1.8% |
Brilliance China Automotive Holdings Ltd. (a) | 1,220,000 | | 1,523,810 |
Credicorp Ltd. (NY Shares) | 37,250 | | 4,817,915 |
Digital China Holdings Ltd. (H Shares) | 612,000 | | 1,029,733 |
Great Eagle Holdings Ltd. | 196,000 | | 581,674 |
Jardine Matheson Holdings Ltd. | 1,600 | | 98,560 |
TOTAL BERMUDA | | 8,051,692 |
Brazil - 12.1% |
BR Malls Participacoes SA | 214,700 | | 2,822,427 |
Brasil Foods SA | 89,300 | | 1,624,596 |
CCR SA | 296,700 | | 2,609,026 |
Cetip SA - Mercados Organizado | 126,502 | | 1,457,447 |
Cielo SA | 124,900 | | 3,090,138 |
Companhia Brasileira de Distribuicao Grupo Pao de Acucar sponsored ADR (d) | 48,151 | | 2,250,578 |
Companhia de Bebidas das Americas (AmBev) (PN) sponsored ADR | 155,376 | | 6,337,787 |
Companhia de Saneamento Basico do Estado de Sao Paulo (SABESP) | 36,100 | | 1,528,213 |
Companhia de Saneamento de Minas Gerais | 76,100 | | 1,796,231 |
Gerdau SA sponsored ADR | 255,671 | | 2,247,348 |
Itau Unibanco Holdings SA sponsored ADR | 459,800 | | 6,703,884 |
Localiza Rent A Car SA | 5,200 | | 91,145 |
Mills Estruturas e Servicos de Engenharia SA | 82,900 | | 1,271,020 |
Multiplan Empreendimentos Imobiliarios SA | 100,008 | | 2,929,754 |
Multiplus SA | 124,924 | | 2,902,520 |
Qualicorp SA (a) | 180,900 | | 1,856,161 |
Souza Cruz SA | 4,300 | | 56,104 |
Totvs SA | 36,247 | | 737,058 |
Ultrapar Participacoes SA | 151,800 | | 3,183,910 |
Usinas Siderurgicas de Minas Gerais SA - Usiminas (PN-A) (non-vtg.) | 221,216 | | 1,068,476 |
Vale SA (PN-A) | 418,900 | | 7,497,115 |
TOTAL BRAZIL | | 54,060,938 |
British Virgin Islands - 1.1% |
Arcos Dorados Holdings, Inc. | 169,602 | | 2,189,562 |
Common Stocks - continued |
| Shares | | Value |
British Virgin Islands - continued |
Gem Diamonds Ltd. (a) | 120,445 | | $ 327,996 |
Mail.ru Group Ltd. GDR (e) | 71,200 | | 2,374,520 |
TOTAL BRITISH VIRGIN ISLANDS | | 4,892,078 |
Canada - 0.4% |
Africa Oil Corp. (a) | 4,541 | | 45,103 |
First Quantum Minerals Ltd. | 68,600 | | 1,541,997 |
Ivanplats Ltd. Class A (f) | 84,516 | | 353,381 |
TOTAL CANADA | | 1,940,481 |
Cayman Islands - 5.8% |
Anta Sports Products Ltd. | 705,000 | | 600,383 |
Baidu.com, Inc. sponsored ADR (a) | 20,500 | | 2,185,710 |
Belle International Holdings Ltd. | 637,000 | | 1,186,867 |
Chailease Holding Co. Ltd. | 442,000 | | 786,854 |
Changyou.com Ltd. (A Shares) ADR (d) | 34,032 | | 845,695 |
Country Garden Holdings Co. Ltd. | 228,012 | | 91,498 |
ENN Energy Holdings Ltd. | 38,000 | | 158,128 |
Eurasia Drilling Co. Ltd. GDR (Reg. S) | 74,563 | | 2,579,880 |
Golden Eagle Retail Group Ltd. (H Shares) | 466,000 | | 1,022,187 |
Hengan International Group Co. Ltd. | 293,500 | | 2,673,673 |
Hengdeli Holdings Ltd. | 7,136,000 | | 2,246,675 |
Intime Department Store Group Co. Ltd. | 459,500 | | 544,282 |
KWG Property Holding Ltd. | 613,000 | | 365,425 |
MStar Semiconductor, Inc. | 33,000 | | 279,613 |
NetEase.com, Inc. sponsored ADR (a)(d) | 24,400 | | 1,317,600 |
Sands China Ltd. | 136,000 | | 511,532 |
SINA Corp. (a) | 17,000 | | 928,710 |
Tencent Holdings Ltd. | 200,700 | | 7,095,670 |
Vinda International Holdings Ltd. | 483,000 | | 674,326 |
TOTAL CAYMAN ISLANDS | | 26,094,708 |
Chile - 0.7% |
CAP SA | 34,629 | | 1,193,788 |
Sociedad Quimica y Minera de Chile SA (PN-B) sponsored ADR (d) | 30,700 | | 1,775,995 |
TOTAL CHILE | | 2,969,783 |
China - 3.2% |
Air China Ltd. (H Shares) | 1,014,000 | | 719,608 |
China Communications Construction Co. Ltd. (H Shares) | 1,480,000 | | 1,388,327 |
China Communications Services Corp. Ltd. (H Shares) | 3,200,000 | | 1,804,375 |
China Minsheng Banking Corp. Ltd. (H Shares) | 2,518,000 | | 2,290,553 |
Common Stocks - continued |
| Shares | | Value |
China - continued |
China Railway Construction Corp. Ltd. (H Shares) | 723,500 | | $ 718,828 |
China Shenhua Energy Co. Ltd. (H Shares) | 133,000 | | 566,319 |
Dongfeng Motor Group Co. Ltd. (H Shares) | 712,000 | | 881,956 |
Great Wall Motor Co. Ltd. (H Shares) | 1,345,000 | | 3,696,557 |
Huadian Power International Corp. Ltd. (H Shares) (a) | 1,978,000 | | 502,792 |
Tsingtao Brewery Co. Ltd. (H Shares) | 12,000 | | 64,877 |
Yantai Changyu Pioneer Wine Co. (B Shares) | 296,321 | | 1,502,242 |
TOTAL CHINA | | 14,136,434 |
Colombia - 1.5% |
Almacenes Exito SA | 118,316 | | 2,255,528 |
BanColombia SA sponsored ADR | 27,635 | | 1,769,193 |
Ecopetrol SA ADR (d) | 47,075 | | 2,787,311 |
TOTAL COLOMBIA | | 6,812,032 |
Czech Republic - 0.2% |
Philip Morris CR A/S | 1,697 | | 909,217 |
Finland - 0.6% |
Kone Oyj (B Shares) (d) | 3,300 | | 236,321 |
Nokian Tyres PLC | 57,500 | | 2,384,916 |
TOTAL FINLAND | | 2,621,237 |
France - 0.5% |
LVMH Moet Hennessy - Louis Vuitton SA | 14,555 | | 2,365,729 |
Hong Kong - 2.7% |
AIA Group Ltd. | 20,200 | | 80,018 |
China Mobile Ltd. | 76,500 | | 848,519 |
CNOOC Ltd. | 3,231,000 | | 6,649,323 |
Dah Chong Hong Holdings Ltd. | 1,312,000 | | 1,237,504 |
Galaxy Entertainment Group Ltd. (a) | 257,000 | | 883,743 |
Guangdong Investment Ltd. | 1,608,000 | | 1,315,439 |
Shenzhen Investment Ltd. | 1,058,000 | | 281,221 |
Singamas Container Holdings Ltd. | 2,222,000 | | 561,947 |
TOTAL HONG KONG | | 11,857,714 |
India - 7.8% |
Axis Bank Ltd. | 84,973 | | 1,867,653 |
Bajaj Auto Ltd. | 51,655 | | 1,743,866 |
Bharat Heavy Electricals Ltd. | 291,383 | | 1,217,413 |
GlaxoSmithKline Pharmaceuticals Ltd. | 8,424 | | 313,914 |
HDFC Bank Ltd. | 165,304 | | 1,940,996 |
Hindustan Unilever Ltd. | 341,491 | | 3,469,175 |
Common Stocks - continued |
| Shares | | Value |
India - continued |
Housing Development Finance Corp. Ltd. | 171,833 | | $ 2,434,660 |
ICICI Bank Ltd. | 195,871 | | 3,811,187 |
ITC Ltd. | 141,436 | | 742,733 |
Jaypee Infratech Ltd. | 465,878 | | 413,450 |
Larsen & Toubro Ltd. | 69,363 | | 2,097,262 |
Mahindra & Mahindra Financial Services Ltd. | 127,846 | | 2,059,246 |
Tata Consultancy Services Ltd. | 135,749 | | 3,318,982 |
Tata Motors Ltd. | 669,790 | | 3,185,055 |
Tata Steel Ltd. | 265,598 | | 1,936,020 |
Tech Mahindra Ltd. (a) | 39,361 | | 693,838 |
Titan Industries Ltd. | 259,455 | | 1,250,380 |
Ultratech Cemco Ltd. | 68,604 | | 2,545,252 |
TOTAL INDIA | | 35,041,082 |
Indonesia - 7.2% |
PT AKR Corporindo Tbk | 156,500 | | 72,506 |
PT Astra International Tbk | 5,616,000 | | 4,706,779 |
PT Bank Central Asia Tbk | 93,000 | | 79,396 |
PT Bank Mandiri (Persero) Tbk | 4,429,000 | | 3,804,174 |
PT Bank Rakyat Indonesia Tbk | 5,943,500 | | 4,579,044 |
PT Bank Tabungan Negara Tbk | 27,500 | | 4,352 |
PT Bumi Serpong Damai Tbk | 9,802,600 | | 1,265,505 |
PT Ciputra Development Tbk | 523,000 | | 37,026 |
PT Gadjah Tunggal Tbk | 1,131,000 | | 256,108 |
PT Global Mediacom Tbk | 8,869,500 | | 2,100,784 |
PT Indocement Tunggal Prakarsa Tbk | 1,327,000 | | 2,956,552 |
PT Indofood Sukses Makmur Tbk | 1,038,500 | | 773,060 |
PT Jasa Marga Tbk | 1,544,500 | | 932,646 |
PT Media Nusantara Citra Tbk | 547,500 | | 161,029 |
PT Mitra Adiperkasa Tbk | 3,145,000 | | 2,144,681 |
PT Pembangunan Perumahan Persero Tbk | 2,558,000 | | 205,065 |
PT Resource Alam Indonesia Tbk | 1,307,500 | | 387,960 |
PT Semen Gresik (Persero) Tbk | 1,457,500 | | 2,260,974 |
PT Summarecon Agung Tbk | 233,500 | | 42,543 |
PT Telkomunikasi Indonesia Tbk Series B | 898,500 | | 912,566 |
PT Tower Bersama Infrastructure Tbk (a) | 5,952,500 | | 3,098,633 |
PT United Tractors Tbk | 643,500 | | 1,413,617 |
PT Wijaya Karya Persero Tbk | 1,249,000 | | 178,149 |
TOTAL INDONESIA | | 32,373,149 |
Ireland - 0.3% |
Dragon Oil PLC | 138,794 | | 1,243,082 |
Common Stocks - continued |
| Shares | | Value |
Israel - 1.0% |
Check Point Software Technologies Ltd. (a) | 53,800 | | $ 2,395,714 |
Israel Chemicals Ltd. | 170,200 | | 2,129,883 |
TOTAL ISRAEL | | 4,525,597 |
Italy - 0.4% |
Prada SpA | 230,500 | | 1,879,678 |
Japan - 0.0% |
Fanuc Corp. | 600 | | 95,528 |
Korea (South) - 13.4% |
Cheil Worldwide, Inc. | 4,100 | | 78,968 |
CJ Corp. | 3,978 | | 388,562 |
Cosmax, Inc. | 1,030 | | 45,959 |
DGB Financial Group Co. Ltd. | 63,170 | | 799,532 |
Dongbu Insurance Co. Ltd. | 42,452 | | 1,925,354 |
Grand Korea Leisure Co. Ltd. | 6,840 | | 192,593 |
Hana Financial Group, Inc. | 25,630 | | 746,343 |
Honam Petrochemical Corp. | 2,069 | | 423,167 |
Hotel Shilla Co. | 50,202 | | 2,117,995 |
Hyundai Glovis Co. Ltd. | 1,380 | | 287,310 |
Hyundai Heavy Industries Co. Ltd. | 14,092 | | 2,959,744 |
Hyundai Hysco Co. Ltd. | 61,940 | | 2,476,873 |
Hyundai Mobis | 7,129 | | 1,817,689 |
Hyundai Motor Co. | 35,154 | | 7,238,309 |
Hyundai Wia Corp. | 4,046 | | 654,963 |
Industrial Bank of Korea | 102,590 | | 1,129,100 |
Interflex Co. Ltd. | 737 | | 42,044 |
Kia Motors Corp. | 83,109 | | 4,619,200 |
Korea Zinc Co. Ltd. | 679 | | 278,993 |
KT Corp. | 1,960 | | 66,552 |
KT&G Corp. | 41,016 | | 3,126,082 |
LG Chemical Ltd. | 13,292 | | 3,730,421 |
LG Corp. | 12,052 | | 736,172 |
Lotte Samkang Co. Ltd. | 2,450 | | 1,642,591 |
NHN Corp. | 349 | | 80,823 |
Samsung C&T Corp. | 13,146 | | 714,981 |
Samsung Electronics Co. Ltd. | 16,312 | | 19,598,571 |
Samsung Heavy Industries Ltd. | 11,960 | | 365,825 |
Silicon Works Co. Ltd. | 13,935 | | 357,219 |
SK Energy Co. Ltd. | 473 | | 69,628 |
Common Stocks - continued |
| Shares | | Value |
Korea (South) - continued |
Sung Kwang Bend Co. Ltd. | 37,451 | | $ 906,804 |
TK Corp. (a) | 14,543 | | 368,804 |
TOTAL KOREA (SOUTH) | | 59,987,171 |
Luxembourg - 0.5% |
L'Occitane Ltd. | 644,750 | | 2,009,111 |
Malaysia - 0.3% |
Bumiputra-Commerce Holdings Bhd | 30,400 | | 76,150 |
Malayan Banking Bhd | 423,000 | | 1,254,002 |
TOTAL MALAYSIA | | 1,330,152 |
Mexico - 3.1% |
CEMEX SA de CV sponsored ADR | 280,203 | | 2,533,035 |
Coca-Cola FEMSA SAB de CV Series L | 51,300 | | 657,529 |
Fomento Economico Mexicano SAB de CV unit | 239,000 | | 2,152,351 |
Grupo Financiero Banorte SAB de CV Series O | 615,800 | | 3,421,372 |
Grupo Mexico SA de CV Series B | 455,900 | | 1,460,941 |
Grupo Televisa SA de CV | 814,500 | | 3,702,386 |
TOTAL MEXICO | | 13,927,614 |
Netherlands - 0.6% |
ASML Holding NV (Netherlands) | 12,400 | | 681,656 |
Yandex NV (a) | 84,000 | | 1,955,520 |
TOTAL NETHERLANDS | | 2,637,176 |
Nigeria - 0.6% |
Guaranty Trust Bank PLC GDR (Reg. S) | 465,259 | | 2,884,606 |
Panama - 0.9% |
Banco Latinoamericano de Exporaciones SA (BLADEX) Series E | 53,100 | | 1,194,750 |
Copa Holdings SA Class A | 28,228 | | 2,620,123 |
TOTAL PANAMA | | 3,814,873 |
Philippines - 2.6% |
Alliance Global Group, Inc. | 2,777,400 | | 1,005,540 |
Ayala Corp. | 74,860 | | 806,885 |
International Container Terminal Services, Inc. | 1,304,700 | | 2,253,861 |
Manila Water Co., Inc. | 320,200 | | 225,932 |
Metropolitan Bank & Trust Co. | 434,280 | | 1,003,810 |
Philippine National Bank (a) | 342,750 | | 600,438 |
PUREGOLD Price Club, Inc. | 966,700 | | 704,444 |
Security Bank Corp. | 681,320 | | 2,683,837 |
Common Stocks - continued |
| Shares | | Value |
Philippines - continued |
SM Investments Corp. | 53,800 | | $ 1,051,129 |
SM Prime Holdings, Inc. | 3,666,400 | | 1,293,499 |
TOTAL PHILIPPINES | | 11,629,375 |
Poland - 0.5% |
Bank Polska Kasa Opieki SA | 50,400 | | 2,420,034 |
Russia - 3.8% |
M Video OJSC (a) | 71,100 | | 559,452 |
Magnit OJSC GDR (Reg. S) | 2,600 | | 92,300 |
Mechel Steel Group OAO sponsored ADR | 21,596 | | 137,135 |
Mobile TeleSystems OJSC sponsored ADR | 67,079 | | 1,149,734 |
NOVATEK OAO GDR (Reg. S) | 30,898 | | 3,522,372 |
Raspadskaya OAO (a) | 130,700 | | 257,729 |
Sberbank (Savings Bank of the Russian Federation) | 2,447,000 | | 7,163,397 |
Tatneft OAO sponsored ADR | 26,800 | | 1,038,232 |
TNK-BP Holding | 37,100 | | 75,736 |
Uralkali OJSC GDR (Reg. S) | 71,400 | | 2,797,452 |
TOTAL RUSSIA | | 16,793,539 |
Singapore - 0.4% |
Keppel Corp. Ltd. | 201,000 | | 1,756,567 |
South Africa - 5.6% |
African Bank Investments Ltd. | 760,647 | | 2,572,145 |
AVI Ltd. | 273,957 | | 1,806,654 |
Bidvest Group Ltd. | 60,500 | | 1,444,007 |
FirstRand Ltd. | 703,000 | | 2,333,428 |
Foschini Ltd. | 48,124 | | 698,717 |
Imperial Holdings Ltd. | 144,536 | | 3,283,572 |
Life Healthcare Group Holdings Ltd. | 795,429 | | 3,008,092 |
Mr Price Group Ltd. | 175,100 | | 2,705,062 |
Nampak Ltd. | 153,200 | | 510,628 |
Naspers Ltd. Class N | 67,800 | | 4,401,665 |
Shoprite Holdings Ltd. | 72,600 | | 1,492,919 |
Tongaat Hulett Ltd. | 48,900 | | 767,001 |
TOTAL SOUTH AFRICA | | 25,023,890 |
Switzerland - 1.0% |
Compagnie Financiere Richemont SA Series A | 18,368 | | 1,191,267 |
Dufry AG (a) | 14,500 | | 1,840,331 |
Swatch Group AG (Bearer) | 3,140 | | 1,299,427 |
TOTAL SWITZERLAND | | 4,331,025 |
Common Stocks - continued |
| Shares | | Value |
Taiwan - 3.6% |
ASUSTeK Computer, Inc. | 147,000 | | $ 1,575,180 |
Chipbond Technology Corp. | 476,000 | | 806,642 |
Far EasTone Telecommunications Co. Ltd. | 571,000 | | 1,317,542 |
MediaTek, Inc. | 130,610 | | 1,450,974 |
Novatek Microelectronics Corp. | 377,000 | | 1,419,719 |
Radiant Opto-Electronics Corp. | 174,220 | | 724,674 |
Taiwan Semiconductor Manufacturing Co. Ltd. | 1,817,000 | | 5,536,981 |
Unified-President Enterprises Corp. | 1,757,010 | | 3,103,790 |
TOTAL TAIWAN | | 15,935,502 |
Thailand - 4.0% |
Advanced Info Service PCL (For. Reg.) | 541,000 | | 3,483,779 |
Asian Property Development PCL (For. Reg.) | 3,641,700 | | 1,033,022 |
Bangkok Bank Public Co. Ltd. (For. Reg.) | 311,800 | | 1,840,098 |
Bangkok Expressway PCL (For.Reg.) | 1,161,500 | | 1,050,917 |
Bumrungrad Hospital PCL (For. Reg.) | 204,300 | | 504,588 |
C.P. ALL PCL (For. Reg.) | 1,329,200 | | 1,722,716 |
Hemaraj Land & Development PCL | 2,018,100 | | 206,613 |
Home Product Center PCL (For. Reg.) | 3,271,400 | | 1,215,975 |
Kasikornbank PCL (For. Reg.) | 13,100 | | 76,883 |
PTT PCL (For. Reg.) | 186,700 | | 1,935,787 |
Siam Commercial Bank PCL (For. Reg.) | 875,400 | | 4,595,351 |
TOTAL THAILAND | | 17,665,729 |
Turkey - 3.3% |
Coca-Cola Icecek A/S | 115,050 | | 2,233,607 |
Enka Insaat ve Sanayi A/S | 388,000 | | 1,030,338 |
TAV Havalimanlari Holding A/S | 117,000 | | 580,920 |
Turk Hava Yollari AO (a) | 577,000 | | 1,335,872 |
Turkiye Garanti Bankasi A/S | 882,375 | | 4,213,741 |
Turkiye Halk Bankasi A/S | 334,000 | | 2,944,045 |
Turkiye Is Bankasi A/S Series C | 696,000 | | 2,368,536 |
Turkiye Petrol Rafinerile A/S | 5,000 | | 122,176 |
TOTAL TURKEY | | 14,829,235 |
United Arab Emirates - 0.1% |
NMC Health PLC | 197,935 | | 578,146 |
United Kingdom - 1.9% |
Afren PLC (a) | 196,400 | | 436,427 |
Aggreko PLC | 49,800 | | 1,727,842 |
Antofagasta PLC | 22,800 | | 462,494 |
British American Tobacco PLC (United Kingdom) | 9,800 | | 486,076 |
Common Stocks - continued |
| Shares | | Value |
United Kingdom - continued |
Ophir Energy PLC (a) | 155,855 | | $ 1,394,629 |
Prudential PLC | 6,766 | | 92,922 |
Standard Chartered PLC (United Kingdom) | 87,687 | | 2,070,924 |
Tullow Oil PLC | 75,700 | | 1,715,139 |
TOTAL UNITED KINGDOM | | 8,386,453 |
United States of America - 2.3% |
Colgate-Palmolive Co. | 20,750 | | 2,177,920 |
Cummins, Inc. | 16,000 | | 1,497,280 |
Freeport-McMoRan Copper & Gold, Inc. | 2,200 | | 85,536 |
Mead Johnson Nutrition Co. Class A | 31,400 | | 1,936,124 |
Philip Morris International, Inc. | 15,400 | | 1,363,824 |
Rockwood Holdings, Inc. | 16,136 | | 740,642 |
Yum! Brands, Inc. | 32,900 | | 2,306,619 |
TOTAL UNITED STATES OF AMERICA | | 10,107,945 |
TOTAL COMMON STOCKS (Cost $389,278,649) |
430,258,476
|
Nonconvertible Preferred Stocks - 0.3% |
| | | |
Russia - 0.3% |
Surgutneftegaz JSC
(Cost $1,770,114) | 2,465,300 | |
1,526,945
|
Investment Companies - 1.9% |
| | | |
United States of America - 1.9% |
iShares MSCI Emerging Markets Index ETF
(Cost $8,638,844) | 206,300 | |
8,480,993
|
Money Market Funds - 2.3% |
| Shares | | Value |
Fidelity Cash Central Fund, 0.19% (b) | 4,384,369 | | $ 4,384,369 |
Fidelity Securities Lending Cash Central Fund, 0.19% (b)(c) | 5,712,675 | | 5,712,675 |
TOTAL MONEY MARKET FUNDS (Cost $10,097,044) |
10,097,044
|
TOTAL INVESTMENT PORTFOLIO - 100.8% (Cost $409,784,651) | | 450,363,458 |
NET OTHER ASSETS (LIABILITIES) - (0.8)% | | (3,606,527) |
NET ASSETS - 100% | $ 446,756,931 |
Security Type Abbreviations |
ETF | - | Exchange-Traded Fund |
Legend |
(a) Non-income producing |
(b) Affiliated fund that is available only to investment companies and other accounts managed by Fidelity Investments. The rate quoted is the annualized seven-day yield of the fund at period end. A complete unaudited listing of the fund's holdings as of its most recent quarter end is available upon request. In addition, each Fidelity Central Fund's financial statements, which are not covered by the Fund's Report of Independent Registered Public Accounting Firm, are available on the SEC's website or upon request. |
(c) Investment made with cash collateral received from securities on loan. |
(d) Security or a portion of the security is on loan at period end. |
(e) Security exempt from registration under Rule 144A of the Securities Act of 1933. These securities may be resold in transactions exempt from registration, normally to qualified institutional buyers. At the end of the period, the value of these securities amounted to $2,374,520 or 0.5% of net assets. |
(f) Restricted securities - Investment in securities not registered under the Securities Act of 1933 (excluding 144A issues). At the end of the period, the value of restricted securities (excluding 144A issues) amounted to $353,381 or 0.1% of net assets. |
Additional information on each restricted holding is as follows: |
Security | Acquisition Date | Acquisition Cost |
Ivanplats Ltd. Class A | 10/23/12 | $ 409,319 |
Affiliated Central Funds |
Information regarding fiscal year to date income earned by the Fund from investments in Fidelity Central Funds is as follows: |
Fund | Income earned |
Fidelity Cash Central Fund | $ 7,460 |
Fidelity Securities Lending Cash Central Fund | 43,262 |
Total | $ 50,722 |
Other Information |
Categorizations in the Schedule of Investments are based on country or territory of incorporation. |
The following is a summary of the inputs used, as of October 31, 2012, involving the Fund's assets and liabilities carried at fair value. The inputs or methodology used for valuing securities may not be an indication of the risk associated with investing in those securities. For more information on valuation inputs, and their aggregation into the levels used in the tables below, please refer to the Security Valuation section in the accompanying Notes to Financial Statements. |
Valuation Inputs at Reporting Date: |
Description | Total | Level 1 | Level 2 | Level 3 |
Investments in Securities: | | | | |
Equities: | | | | |
Consumer Discretionary | $ 80,637,364 | $ 77,452,309 | $ 3,185,055 | $ - |
Consumer Staples | 48,845,783 | 48,359,707 | 486,076 | - |
Energy | 29,279,959 | 22,630,636 | 6,649,323 | - |
Financials | 100,654,462 | 94,809,357 | 5,845,105 | - |
Health Care | 6,260,901 | 6,260,901 | - | - |
Industrials | 41,305,536 | 41,305,536 | - | - |
Information Technology | 60,522,984 | 54,304,347 | 6,218,637 | - |
Materials | 46,069,997 | 45,716,616 | 353,381 | - |
Telecommunication Services | 12,681,700 | 10,854,063 | 1,827,637 | - |
Utilities | 5,526,735 | 5,526,735 | - | - |
Investment Companies | 8,480,993 | 8,480,993 | - | - |
Money Market Funds | 10,097,044 | 10,097,044 | - | - |
Total Investments in Securities: | $ 450,363,458 | $ 425,798,244 | $ 24,565,214 | $ - |
The following is a summary of transfers between Level 1 and Level 2 for the period ended October 31, 2012. Transfers are assumed to have occurred at the beginning of the period, and are primarily attributable to the valuation techniques used for foreign equity securities, as discussed in the accompanying Notes to Financial Statements: |
Transfers | Total |
Level 1 to Level 2 | $ 0 |
Level 2 to Level 1 | $ 139,799,616 |
See accompanying notes which are an integral part of the financial statements.
Annual Report
Statement of Assets and Liabilities
| October 31, 2012 |
| | |
Assets | | |
Investment in securities, at value (including securities loaned of $5,388,473) - See accompanying schedule: Unaffiliated issuers (cost $399,687,607) | $ 440,266,414 | |
Fidelity Central Funds (cost $10,097,044) | 10,097,044 | |
Total Investments (cost $409,784,651) | | $ 450,363,458 |
Foreign currency held at value (cost $2,052,273) | | 2,055,362 |
Receivable for investments sold | | 13,824,327 |
Receivable for fund shares sold | | 585,819 |
Dividends receivable | | 788,052 |
Distributions receivable from Fidelity Central Funds | | 3,720 |
Other receivables | | 117,995 |
Total assets | | 467,738,733 |
| | |
Liabilities | | |
Payable for investments purchased | $ 13,391,194 | |
Payable for fund shares redeemed | 1,191,647 | |
Accrued management fee | 303,353 | |
Distribution and service plan fees payable | 127,529 | |
Other affiliated payables | 123,639 | |
Other payables and accrued expenses | 131,765 | |
Collateral on securities loaned, at value | 5,712,675 | |
Total liabilities | | 20,981,802 |
| | |
Net Assets | | $ 446,756,931 |
Net Assets consist of: | | |
Paid in capital | | $ 496,573,932 |
Undistributed net investment income | | 3,650,889 |
Accumulated undistributed net realized gain (loss) on investments and foreign currency transactions | | (94,029,988) |
Net unrealized appreciation (depreciation) on investments and assets and liabilities in foreign currencies | | 40,562,098 |
Net Assets | | $ 446,756,931 |
See accompanying notes which are an integral part of the financial statements.
Annual Report
Statement of Assets and Liabilities - continued
| October 31, 2012 |
| | |
Calculation of Maximum Offering Price
Class A: Net Asset Value and redemption price per share ($160,464,051 ÷ 7,823,731 shares) | | $ 20.51 |
| | |
Maximum offering price per share (100/94.25 of $20.51) | | $ 21.76 |
Class T:
Net Asset Value and redemption price per share ($58,918,896 ÷ 2,882,427 shares) | | $ 20.44 |
| | |
Maximum offering price per share (100/96.50 of $20.44) | | $ 21.18 |
Class B:
Net Asset Value and offering price per share ($15,994,337 ÷ 798,410 shares)A | | $ 20.03 |
| | |
Class C:
Net Asset Value and offering price per share ($65,598,078 ÷ 3,279,478 shares)A | | $ 20.00 |
| | |
Institutional Class:
Net Asset Value, offering price and redemption price per share ($145,781,569 ÷ 7,071,858 shares) | | $ 20.61 |
A Redemption price per share is equal to net asset value less any applicable contingent deferred sales charge.
See accompanying notes which are an integral part of the financial statements.
Annual Report
Financial Statements - continued
Statement of Operations
| Year ended October 31, 2012 |
| | |
Investment Income | | |
Dividends | | $ 13,641,617 |
Interest | | 15,720 |
Income from Fidelity Central Funds | | 50,722 |
Income before foreign taxes withheld | | 13,708,059 |
Less foreign taxes withheld | | (1,382,128) |
Total income | | 12,325,931 |
| | |
Expenses | | |
Management fee | $ 3,917,194 | |
Transfer agent fees | 1,353,640 | |
Distribution and service plan fees | 1,686,210 | |
Accounting and security lending fees | 252,997 | |
Custodian fees and expenses | 447,931 | |
Independent trustees' compensation | 3,218 | |
Registration fees | 78,584 | |
Audit | 77,247 | |
Legal | 1,862 | |
Miscellaneous | 5,916 | |
Total expenses before reductions | 7,824,799 | |
Expense reductions | (300,874) | 7,523,925 |
Net investment income (loss) | | 4,802,006 |
Realized and Unrealized Gain (Loss) Net realized gain (loss) on: | | |
Investment securities: | | |
Unaffiliated issuers | (15,547,306) | |
Foreign currency transactions | (677,809) | |
Total net realized gain (loss) | | (16,225,115) |
Change in net unrealized appreciation (depreciation) on: Investment securities | 13,461,681 | |
Assets and liabilities in foreign currencies | 45,412 | |
Total change in net unrealized appreciation (depreciation) | | 13,507,093 |
Net gain (loss) | | (2,718,022) |
Net increase (decrease) in net assets resulting from operations | | $ 2,083,984 |
See accompanying notes which are an integral part of the financial statements.
Annual Report
Statement of Changes in Net Assets
| Year ended
October 31,
2012 | Year ended
October 31,
2011 |
Increase (Decrease) in Net Assets | | |
Operations | | |
Net investment income (loss) | $ 4,802,006 | $ 5,371,636 |
Net realized gain (loss) | (16,225,115) | 51,309,170 |
Change in net unrealized appreciation (depreciation) | 13,507,093 | (134,170,344) |
Net increase (decrease) in net assets resulting
from operations | 2,083,984 | (77,489,538) |
Distributions to shareholders from net investment income | (3,344,878) | (3,137,543) |
Distributions to shareholders from net realized gain | - | (3,336,770) |
Total distributions | (3,344,878) | (6,474,313) |
Share transactions - net increase (decrease) | (68,179,764) | (114,129,705) |
Redemption fees | 103,376 | 141,338 |
Total increase (decrease) in net assets | (69,337,282) | (197,952,218) |
| | |
Net Assets | | |
Beginning of period | 516,094,213 | 714,046,431 |
End of period (including undistributed net investment income of $3,650,889 and undistributed net investment income of $2,180,940, respectively) | $ 446,756,931 | $ 516,094,213 |
See accompanying notes which are an integral part of the financial statements.
Annual Report
Financial Highlights - Class A
Years ended October 31, | 2012 | 2011 | 2010 | 2009 | 2008 |
Selected Per-Share Data | | | | | |
Net asset value, beginning of period | $ 20.50 | $ 23.71 | $ 19.20 | $ 12.59 | $ 32.75 |
Income from Investment Operations | | | | | |
Net investment income (loss) C | .22 | .21 | .12 | .10 | .24 |
Net realized and unrealized gain (loss) | (.06) | (3.19) | 4.59 | 6.64 | (19.61) |
Total from investment operations | .16 | (2.98) | 4.71 | 6.74 | (19.37) |
Distributions from net investment income | (.15) | (.11) | (.07) | (.14) | (.02) |
Distributions from net realized gain | - | (.13) | (.13) | - | (.79) |
Total distributions | (.15) | (.24) | (.20) | (.14) | (.81) |
Redemption fees added to paid in capital C | - G | .01 | - G | .01 | .02 |
Net asset value, end of period | $ 20.51 | $ 20.50 | $ 23.71 | $ 19.20 | $ 12.59 |
Total Return A, B | .80% | (12.69)% | 24.69% | 54.54% | (60.55)% |
Ratios to Average Net Assets D, F | | | | | |
Expenses before reductions | 1.54% | 1.54% | 1.56% | 1.60% | 1.59% |
Expenses net of fee waivers, if any | 1.54% | 1.54% | 1.56% | 1.60% | 1.59% |
Expenses net of all reductions | 1.48% | 1.47% | 1.50% | 1.53% | 1.53% |
Net investment income (loss) | 1.07% | .92% | .59% | .70% | .94% |
Supplemental Data | | | | | |
Net assets, end of period (000 omitted) | $ 160,464 | $ 202,477 | $ 286,970 | $ 216,187 | $ 122,911 |
Portfolio turnover rate E | 177% | 122% | 86% | 85% | 61% |
A Total returns would have been lower if certain expenses had not been reduced during the applicable periods shown.
B Total returns do not include the effect of the sales charges.
C Calculated based on average shares outstanding during the period.
D Fees and expenses of any underlying Fidelity Central Funds are not included in the Fund's expense ratio. The Fund indirectly bears its proportionate share of the expenses of any underlying Fidelity Central Funds.
E Amount does not include the portfolio activity of any underlying Fidelity Central Funds.
F Expense ratios reflect operating expenses of the class. Expenses before reductions do not reflect amounts reimbursed by the investment adviser or reductions from brokerage service arrangements or reductions from other expense offset arrangements and do not represent the amount paid by the class during periods when reimbursements or reductions occur. Expenses net of fee waivers reflect expenses after reimbursement by the investment adviser but prior to reductions from brokerage service arrangements or other expense offset arrangements. Expenses net of all reductions represent the net expenses paid by the class.
G Amount represents less than $.01 per share.
See accompanying notes which are an integral part of the financial statements.
Annual Report
Financial Highlights - Class T
Years ended October 31, | 2012 | 2011 | 2010 | 2009 | 2008 |
Selected Per-Share Data | | | | | |
Net asset value, beginning of period | $ 20.43 | $ 23.61 | $ 19.14 | $ 12.49 | $ 32.52 |
Income from Investment Operations | | | | | |
Net investment income (loss) C | .16 | .15 | .07 | .07 | .17 |
Net realized and unrealized gain (loss) | (.06) | (3.18) | 4.57 | 6.64 | (19.48) |
Total from investment operations | .10 | (3.03) | 4.64 | 6.71 | (19.31) |
Distributions from net investment income | (.09) | (.04) | (.04) | (.07) | - |
Distributions from net realized gain | - | (.13) | (.13) | - | (.74) |
Total distributions | (.09) | (.16) H | (.17) | (.07) | (.74) |
Redemption fees added to paid in capital C | - G | .01 | - G | .01 | .02 |
Net asset value, end of period | $ 20.44 | $ 20.43 | $ 23.61 | $ 19.14 | $ 12.49 |
Total Return A, B | .49% | (12.89)% | 24.38% | 54.17% | (60.66)% |
Ratios to Average Net Assets D, F | | | | | |
Expenses before reductions | 1.80% | 1.79% | 1.81% | 1.87% | 1.84% |
Expenses net of fee waivers, if any | 1.80% | 1.79% | 1.81% | 1.85% | 1.84% |
Expenses net of all reductions | 1.73% | 1.73% | 1.76% | 1.78% | 1.79% |
Net investment income (loss) | .81% | .66% | .33% | .44% | .69% |
Supplemental Data | | | | | |
Net assets, end of period (000 omitted) | $ 58,919 | $ 73,146 | $ 104,417 | $ 86,959 | $ 47,300 |
Portfolio turnover rate E | 177% | 122% | 86% | 85% | 61% |
A Total returns would have been lower if certain expenses had not been reduced during the applicable periods shown.
B Total returns do not include the effect of the sales charges.
C Calculated based on average shares outstanding during the period.
D Fees and expenses of any underlying Fidelity Central Funds are not included in the Fund's expense ratio. The Fund indirectly bears its proportionate share of the expenses of any underlying Fidelity Central Funds.
E Amount does not include the portfolio activity of any underlying Fidelity Central Funds.
F Expense ratios reflect operating expenses of the class. Expenses before reductions do not reflect amounts reimbursed by the investment adviser or reductions from brokerage service arrangements or reductions from other expense offset arrangements and do not represent the amount paid by the class during periods when reimbursements or reductions occur. Expenses net of fee waivers reflect expenses after reimbursement by the investment adviser but prior to reductions from brokerage service arrangements or other expense offset arrangements. Expenses net of all reductions represent the net expenses paid by the class.
G Amount represents less than $.01 per share.
H Total distributions of $.16 per share is comprised of distributions from net investment income of $.037 and distributions from net realized gain of $.125 per share.
See accompanying notes which are an integral part of the financial statements.
Annual Report
Financial Highlights - Class B
Years ended October 31, | 2012 | 2011 | 2010 | 2009 | 2008 |
Selected Per-Share Data | | | | | |
Net asset value, beginning of period | $ 20.03 | $ 23.14 | $ 18.80 | $ 12.26 | $ 32.03 |
Income from Investment Operations | | | | | |
Net investment income (loss) C | .06 | .04 | (.03) | (.01) | .04 |
Net realized and unrealized gain (loss) | (.06) | (3.13) | 4.49 | 6.55 | (19.13) |
Total from investment operations | - | (3.09) | 4.46 | 6.54 | (19.09) |
Distributions from net investment income | - | (.01) | - | - | - |
Distributions from net realized gain | - | (.03) | (.12) | - | (.70) |
Total distributions | - | (.03) H | (.12) | - | (.70) |
Redemption fees added to paid in capital C | - G | .01 | - G | - G | .02 |
Net asset value, end of period | $ 20.03 | $ 20.03 | $ 23.14 | $ 18.80 | $ 12.26 |
Total Return A, B | -% | (13.33)% | 23.77% | 53.34% | (60.83)% |
Ratios to Average Net Assets D, F | | | | | |
Expenses before reductions | 2.29% | 2.29% | 2.32% | 2.36% | 2.35% |
Expenses net of fee waivers, if any | 2.29% | 2.29% | 2.32% | 2.35% | 2.35% |
Expenses net of all reductions | 2.23% | 2.22% | 2.26% | 2.28% | 2.30% |
Net investment income (loss) | .32% | .16% | (.17)% | (.05)% | .18% |
Supplemental Data | | | | | |
Net assets, end of period (000 omitted) | $ 15,994 | $ 21,304 | $ 31,159 | $ 27,580 | $ 17,307 |
Portfolio turnover rate E | 177% | 122% | 86% | 85% | 61% |
A Total returns would have been lower if certain expenses had not been reduced during the applicable periods shown.
B Total returns do not include the effect of the contingent deferred sales charge.
C Calculated based on average shares outstanding during the period.
D Fees and expenses of any underlying Fidelity Central Funds are not included in the Fund's expense ratio. The Fund indirectly bears its proportionate share of the expenses of any underlying Fidelity Central Funds.
E Amount does not include the portfolio activity of any underlying Fidelity Central Funds.
F Expense ratios reflect operating expenses of the class. Expenses before reductions do not reflect amounts reimbursed by the investment adviser or reductions from brokerage service arrangements or reductions from other expense offset arrangements and do not represent the amount paid by the class during periods when reimbursements or reductions occur. Expenses net of fee waivers reflect expenses after reimbursement by the investment adviser but prior to reductions from brokerage service arrangements or other expense offset arrangements. Expenses net of all reductions represent the net expenses paid by the class.
G Amount represents less than $.01 per share.
H Total distributions of $.03 per share is comprised of distributions from net investment income of $.005 and distributions from net realized gain of $.025 per share.
See accompanying notes which are an integral part of the financial statements.
Annual Report
Financial Highlights - Class C
Years ended October 31, | 2012 | 2011 | 2010 | 2009 | 2008 |
Selected Per-Share Data | | | | | |
Net asset value, beginning of period | $ 20.00 | $ 23.13 | $ 18.80 | $ 12.26 | $ 32.04 |
Income from Investment Operations | | | | | |
Net investment income (loss) C | .06 | .04 | (.03) | (.01) | .05 |
Net realized and unrealized gain (loss) | (.06) | (3.12) | 4.49 | 6.54 | (19.15) |
Total from investment operations | - | (3.08) | 4.46 | 6.53 | (19.10) |
Distributions from net investment income | - | (.01) | - | - | - |
Distributions from net realized gain | - | (.05) | (.13) | - | (.70) |
Total distributions | - | (.06) | (.13) | - | (.70) |
Redemption fees added to paid in capital C | - G | .01 | - G | .01 | .02 |
Net asset value, end of period | $ 20.00 | $ 20.00 | $ 23.13 | $ 18.80 | $ 12.26 |
Total Return A, B | -% | (13.33)% | 23.80% | 53.34% | (60.84)% |
Ratios to Average Net Assets D, F | | | | | |
Expenses before reductions | 2.29% | 2.28% | 2.30% | 2.34% | 2.34% |
Expenses net of fee waivers, if any | 2.29% | 2.28% | 2.30% | 2.34% | 2.34% |
Expenses net of all reductions | 2.23% | 2.22% | 2.24% | 2.28% | 2.29% |
Net investment income (loss) | .32% | .17% | (.15)% | (.05)% | .19% |
Supplemental Data | | | | | |
Net assets, end of period (000 omitted) | $ 65,598 | $ 80,855 | $ 106,711 | $ 83,939 | $ 44,878 |
Portfolio turnover rate E | 177% | 122% | 86% | 85% | 61% |
A Total returns would have been lower if certain expenses had not been reduced during the applicable periods shown.
B Total returns do not include the effect of the contingent deferred sales charge.
C Calculated based on average shares outstanding during the period.
D Fees and expenses of any underlying Fidelity Central Funds are not included in the Fund's expense ratio. The Fund indirectly bears its proportionate share of the expenses of any underlying Fidelity Central Funds.
E Amount does not include the portfolio activity of any underlying Fidelity Central Funds.
F Expense ratios reflect operating expenses of the class. Expenses before reductions do not reflect amounts reimbursed by the investment adviser or reductions from brokerage service arrangements or reductions from other expense offset arrangements and do not represent the amount paid by the class during periods when reimbursements or reductions occur. Expenses net of fee waivers reflect expenses after reimbursement by the investment adviser but prior to reductions from brokerage service arrangements or other expense offset arrangements. Expenses net of all reductions represent the net expenses paid by the class.
G Amount represents less than $.01 per share.
See accompanying notes which are an integral part of the financial statements.
Annual Report
Financial Highlights - Institutional Class
Years ended October 31, | 2012 | 2011 | 2010 | 2009 | 2008 |
Selected Per-Share Data | | | | | |
Net asset value, beginning of period | $ 20.63 | $ 23.87 | $ 19.29 | $ 12.71 | $ 33.02 |
Income from Investment Operations | | | | | |
Net investment income (loss) B | .28 | .29 | .20 | .15 | .31 |
Net realized and unrealized gain (loss) | (.06) | (3.21) | 4.62 | 6.65 | (19.76) |
Total from investment operations | .22 | (2.92) | 4.82 | 6.80 | (19.45) |
Distributions from net investment income | (.24) | (.20) | (.11) | (.23) | (.09) |
Distributions from net realized gain | - | (.13) | (.13) | - | (.79) |
Total distributions | (.24) | (.33) | (.24) | (.23) | (.88) |
Redemption fees added to paid in capital B | - F | .01 | - F | .01 | .02 |
Net asset value, end of period | $ 20.61 | $ 20.63 | $ 23.87 | $ 19.29 | $ 12.71 |
Total Return A | 1.08% | (12.41)% | 25.15% | 54.97% | (60.42)% |
Ratios to Average Net Assets C, E | | | | | |
Expenses before reductions | 1.22% | 1.21% | 1.22% | 1.30% | 1.27% |
Expenses net of fee waivers, if any | 1.22% | 1.21% | 1.22% | 1.30% | 1.27% |
Expenses net of all reductions | 1.16% | 1.14% | 1.17% | 1.23% | 1.21% |
Net investment income (loss) | 1.39% | 1.25% | .93% | .99% | 1.26% |
Supplemental Data | | | | | |
Net assets, end of period (000 omitted) | $ 145,782 | $ 138,312 | $ 184,789 | $ 106,713 | $ 47,557 |
Portfolio turnover rate D | 177% | 122% | 86% | 85% | 61% |
A Total returns would have been lower if certain expenses had not been reduced during the applicable periods shown.
B Calculated based on average shares outstanding during the period.
C Fees and expenses of any underlying Fidelity Central Funds are not included in the Fund's expense ratio. The Fund indirectly bears its proportionate share of the expenses of any underlying Fidelity Central Funds.
D Amount does not include the portfolio activity of any underlying Fidelity Central Funds.
E Expense ratios reflect operating expenses of the class. Expenses before reductions do not reflect amounts reimbursed by the investment adviser or reductions from brokerage service arrangements or reductions from other expense offset arrangements and do not represent the amount paid by the class during periods when reimbursements or reductions occur. Expenses net of fee waivers reflect expenses after reimbursement by the investment adviser but prior to reductions from brokerage service arrangements or other expense offset arrangements. Expenses net of all reductions represent the net expenses paid by the class.
F Amount represents less than $.01 per share.
See accompanying notes which are an integral part of the financial statements.
Annual Report
Notes to Financial Statements
For the period ended October 31, 2012
1. Organization.
Fidelity Advisor Emerging Markets Fund (the Fund) is a fund of Fidelity Advisor Series VIII (the Trust) and is authorized to issue an unlimited number of shares. The Trust is registered under the Investment Company Act of 1940, as amended (the 1940 Act), as an open-end management investment company organized as a Massachusetts business trust. The Fund offers Class A, Class T, Class C and Institutional Class shares, each of which, along with Class B shares, has equal rights as to assets and voting privileges. Effective after the close of business on September 1, 2010, Class B shares were closed to new accounts and additional purchases, except for exchanges and reinvestments. Each class has exclusive voting rights with respect to matters that affect that class. Class B shares will automatically convert to Class A shares after a holding period of seven years from the initial date of purchase. Investment income, realized and unrealized capital gains and losses, the common expenses of the Fund, and certain fund-level expense reductions, if any, are allocated on a pro-rata basis to each class based on the relative net assets of each class to the total net assets of the Fund. Each class differs with respect to transfer agent and distribution and service plan fees incurred. Certain expense reductions may also differ by class. The Fund's investments in emerging markets can be subject to social, economic, regulatory, and political uncertainties and can be extremely volatile.
2. Investments in Fidelity Central Funds.
The Fund invests in Fidelity Central Funds, which are open-end investment companies available only to other investment companies and accounts managed by Fidelity Management & Research Company (FMR) and its affiliates. The Fund's Schedule of Investments lists each of the Fidelity Central Funds held as of period end, if any, as an investment of the Fund, but does not include the underlying holdings of each Fidelity Central Fund. As an Investing Fund, the Fund indirectly bears its proportionate share of the expenses of the underlying Fidelity Central Funds.
The Money Market Central Funds seek preservation of capital and current income and are managed by Fidelity Investments Money Management, Inc. (FIMM), an affiliate of FMR.
A complete unaudited list of holdings for each Fidelity Central Fund is available upon request or at the Securities and Exchange Commission (the SEC) web site at www.sec.gov. In addition, the financial statements of the Fidelity Central Funds, which are not covered by the Fund's Report of Independent Registered Public Accounting Firm, are available on the SEC web site or upon request.
Annual Report
Notes to Financial Statements - continued
3. Significant Accounting Policies.
The financial statements have been prepared in conformity with accounting principles generally accepted in the United States of America (GAAP), which require management to make certain estimates and assumptions at the date of the financial statements. Actual results could differ from those estimates. Subsequent events, if any, through the date that the financial statements were issued have been evaluated in the preparation of the financial statements. The following summarizes the significant accounting policies of the Fund:
Security Valuation. Investments are valued as of 4:00 p.m. Eastern time on the last calendar day of the period. In accordance with valuation policies and procedures approved by the Board of Trustees (the Board), the Fund attempts to obtain prices from one or more third party pricing vendors or brokers to value its investments. When current market prices, quotations or rates are not readily available or reliable, securities will be fair valued in good faith by the FMR Fair Value Committee (the Committee), in accordance with procedures adopted by the Fund's Board. Factors used in determining fair value vary by security type and may include market or security specific events. The frequency with which these procedures are used cannot be predicted and they may be utilized to a significant extent. The Committee oversees the Fund's valuation policies and procedures and is responsible for approving and reporting to the Board all fair value determinations.
The Fund categorizes the inputs to valuation techniques used to value its investments into a disclosure hierarchy consisting of three levels as shown below:
Level 1 - quoted prices in active markets for identical investments
Level 2 - other significant observable inputs (including quoted prices for similar investments, interest rates, prepayment speeds, etc.)
Level 3 - unobservable inputs (including the Fund's own assumptions based on the best information available)
Valuation techniques used to value the Fund's investments by major category are as follows:
Equity securities, including restricted securities, for which market quotations are readily available, are valued at the last reported sale price or official closing price as reported by a third party pricing vendor on the primary market or exchange on which they are traded and are categorized as Level 1 in the hierarchy. In the event there were no sales during the day or closing prices are not available, securities are valued at the last quoted bid price or may be valued using the last available price and are generally categorized as Level 2 in the hierarchy. For foreign equity securities, when significant market or security specific events arise, comparisons to the valuation of American Depositary Receipts
Annual Report
3. Significant Accounting Policies - continued
Security Valuation - continued
(ADRs), futures contracts, Exchange-Traded Funds (ETFs) and certain indexes as well as quoted prices for similar securities are used and are categorized as Level 2 in the hierarchy. Utilizing these techniques may result in transfers between Level 1 and Level 2. For restricted equity securities and private placements where observable inputs are limited, assumptions about market activity and risk are used and these securities are generally categorized as Level 3 in the hierarchy.
ETFs are valued at their last sale price or official closing price as reported by a third party pricing vendor on the primary market or exchange on which they are traded and are categorized as Level 1 in the hierarchy. In the event there were no sales during the day but the exchange reports a closing bid level, ETFs are valued at the closing bid and would be categorized as Level 1 in the hierarchy. In the event there was no closing bid, ETFs may be valued by another method that the Board believes reflects fair value in accordance with the Board's fair value pricing policies and may be categorized as Level 2 in the hierarchy.
Investments in open-end mutual funds, including the Fidelity Central Funds, are valued at their closing net asset value (NAV) each business day and are categorized as Level 1 in the hierarchy.
Changes in valuation techniques may result in transfers in or out of an assigned level within the disclosure hierarchy. The aggregate value of investments by input level, as of October 31, 2012, including information on transfers between Levels 1 and 2, is included at the end of the Fund's Schedule of Investments.
Foreign Currency Translation. The Fund may use foreign currency contracts to facilitate transactions in foreign-denominated securities. Gains and losses from these transactions may arise from changes in the value of the foreign currency or if the counterparties do not perform under the contracts' terms.
Foreign-denominated assets, including investment securities, and liabilities are translated into U.S. dollars at the exchange rates at period end. Purchases and sales of investment securities, income and dividends received and expenses denominated in foreign currencies are translated into U.S. dollars at the exchange rate in effect on the transaction date.
The effects of exchange rate fluctuations on investments are included with the net realized and unrealized gain (loss) on investment securities. Other foreign currency transactions resulting in realized and unrealized gain (loss) are disclosed separately.
Investment Transactions and Income. For financial reporting purposes, the Fund's investment holdings and NAV include trades executed through the end of the last
Annual Report
Notes to Financial Statements - continued
3. Significant Accounting Policies - continued
Investment Transactions and Income - continued
business day of the period. The NAV per share for processing shareholder transactions is calculated as of the close of business of the New York Stock Exchange (NYSE), normally 4:00 p.m. Eastern time and includes trades executed through the end of the prior business day. Gains and losses on securities sold are determined on the basis of identified cost and may include proceeds received from litigation. Dividend income is recorded on the ex-dividend date, except for certain dividends from foreign securities where the ex-dividend date may have passed, which are recorded as soon as the Fund is informed of the ex-dividend date. Non-cash dividends included in dividend income, if any, are recorded at the fair market value of the securities received. Interest income and distributions from the Fidelity Central Funds are accrued as earned. Interest income includes coupon interest and amortization of premium and accretion of discount on debt securities. Investment income is recorded net of foreign taxes withheld where recovery of such taxes is uncertain.
Expenses. Expenses directly attributable to a fund are charged to that fund. Expenses attributable to more than one fund are allocated among the respective funds on the basis of relative net assets or other appropriate methods. Expense estimates are accrued in the period to which they relate and adjustments are made when actual amounts are known.
Income Tax Information and Distributions to Shareholders. Each year, the Fund intends to qualify as a regulated investment company under Subchapter M of the Internal Revenue Code, including distributing substantially all of its taxable income and realized gains. As a result, no provision for income taxes is required. As of October 31, 2012, the Fund did not have any unrecognized tax benefits in the financial statements; nor is the Fund aware of any tax positions for which it is reasonably possible that the total amounts of unrecognized tax benefits will significantly change in the next twelve months. The Fund files a U.S. federal tax return, in addition to state and local tax returns as required. A fund's federal income tax returns are subject to examination by the Internal Revenue Service (IRS) for a period of three fiscal years after they are filed. State and local tax returns may be subject to examination for an additional fiscal year depending on the jurisdiction. Foreign taxes are provided for based on the Fund's understanding of the tax rules and rates that exist in the foreign markets in which it invests.
Distributions are declared and recorded on the ex-dividend date. Income dividends and capital gain distributions are declared separately for each class. Income and capital gain distributions are determined in accordance with income tax regulations, which may differ from GAAP.
Annual Report
3. Significant Accounting Policies - continued
Income Tax Information and Distributions to Shareholders - continued
Capital accounts within the financial statements are adjusted for permanent book-tax differences. These adjustments have no impact on net assets or the results of operations. Temporary book-tax differences will reverse in a subsequent period.
Book-tax differences are primarily due to foreign currency transactions, passive foreign investment companies (PFIC), contingent interest, capital loss carryforwards and losses deferred due to wash sales.
The federal tax cost of investment securities and unrealized appreciation (depreciation) as of period end were as follows:
Gross unrealized appreciation | $ 52,123,160 |
Gross unrealized depreciation | (12,894,768) |
Net unrealized appreciation (depreciation) on securities and other investments | $ 39,228,392 |
| |
Tax Cost | $ 411,135,066 |
The tax-based components of distributable earnings as of period end were as follows:
Undistributed ordinary income | $ 3,650,890 |
Capital loss carryforward | $ (92,679,576) |
Net unrealized appreciation (depreciation) | $ 39,211,683 |
Capital loss carryforwards are only available to offset future capital gains of the Fund to the extent provided by regulations and may be limited. Under the Regulated Investment Company Modernization Act of 2010 (the Act), the Fund is permitted to carry forward capital losses incurred in taxable years beginning after December 22, 2010 for an unlimited period and such capital losses are required to be used prior to any losses that expire. Capital loss carryforwards were as follows:
Fiscal year of expiration | |
2017 | $ (70,963,758) |
No expiration | |
Short-term | (21,715,818) |
Total capital loss carryforward | $ (92,679,576) |
The tax character of distributions paid was as follows:
| October 31, 2012 | October 31, 2011 |
Ordinary Income | $ 3,344,878 | $ 6,474,313 |
Annual Report
Notes to Financial Statements - continued
3. Significant Accounting Policies - continued
Short-Term Trading (Redemption) Fees. Shares held by investors in the Fund less than 90 days are subject to a redemption fee equal to 1.50% of the net asset value of shares redeemed. All redemption fees, which reduce the proceeds of the shareholder redemption, are retained by the Fund and accounted for as an addition to paid in capital.
Restricted Securities. The Fund may invest in securities that are subject to legal or contractual restrictions on resale. These securities generally may be resold in transactions exempt from registration or to the public if the securities are registered. Disposal of these securities may involve time-consuming negotiations and expense, and prompt sale at an acceptable price may be difficult. Information regarding restricted securities is included at the end of the Fund's Schedule of Investments.
New Accounting Pronouncement. In December 2011, the Financial Accounting Standards Board issued Accounting Standard Update No. 2011-11, Disclosures about Offsetting Assets and Liabilities. The update creates new disclosure requirements requiring entities to disclose both gross and net information for derivatives and other financial instruments that are either offset in the Statement of Assets and Liabilities or subject to an enforceable master netting arrangement or similar agreement. The disclosure requirements are effective for annual reporting periods beginning on or after January 1, 2013, and interim periods within those annual periods. Management is currently evaluating the impact of the update's adoption on the Fund's financial statement disclosures.
4. Purchases and Sales of Investments.
Purchases and sales of securities, other than short-term securities, aggregated $846,408,176 and $910,774,840, respectively.
5. Fees and Other Transactions with Affiliates.
Management Fee. FMR and its affiliates provide the Fund with investment management related services for which the Fund pays a monthly management fee. The management fee is the sum of an individual fund fee rate that is based on an annual rate of .55% of the Fund's average net assets and an annualized group fee rate that averaged .26% during the period. The group fee rate is based upon the average net assets of all the mutual funds advised by FMR. The group fee rate decreases as assets under management increase and increases as assets under management decrease. For the period, the total annual management fee rate was .81% of the Fund's average net assets.
Distribution and Service Plan Fees. In accordance with Rule 12b-1 of the 1940 Act, the Fund has adopted separate Distribution and Service Plans for each class of shares. Certain classes pay Fidelity Distributors Corporation (FDC), an affiliate of FMR,
Annual Report
5. Fees and Other Transactions with Affiliates - continued
Distribution and Service Plan Fees - continued
separate Distribution and Service Fees, each of which is based on an annual percentage of each class' average net assets. In addition, FDC may pay financial intermediaries for selling shares of the Fund and providing shareholder support services. For the period, the Distribution and Service Fee rates, total fees and amounts retained by FDC were as follows:
| Distribution
Fee | Service
Fee | Total
Fees | Retained
by FDC |
Class A | -% | .25% | $ 444,791 | $ 9,780 |
Class T | .25% | .25% | 332,276 | 1,103 |
Class B | .75% | .25% | 185,960 | 139,714 |
Class C | .75% | .25% | 723,183 | 69,609 |
| | | $ 1,686,210 | $ 220,206 |
Sales Load. FDC may receive a front-end sales charge of up to 5.75% for selling Class A shares and 3.50% for selling Class T shares, some of which is paid to financial intermediaries for selling shares of the Fund. Depending on the holding period, FDC may receive contingent deferred sales charges levied on Class A, Class T, Class B, and Class C redemptions. The deferred sales charges range from 5.00% to 1.00% for Class B shares, 1.00% for Class C shares, 1.00% for certain purchases of Class A shares and .25% for certain purchases of Class T shares.
For the period, sales charge amounts retained by FDC were as follows:
| Retained
by FDC |
Class A | $ 71,044 |
Class T | 15,613 |
Class B* | 34,783 |
Class C* | 5,665 |
| $ 127,105 |
* When Class B and Class C shares are initially sold, FDC pays commissions from its own resources to financial intermediaries through which the sales are made.
Transfer Agent Fees. Fidelity Investments Institutional Operations Company, Inc. (FIIOC), an affiliate of FMR, is the transfer, dividend disbursing and shareholder servicing agent for each class of the Fund. FIIOC receives account fees and asset-based fees that vary according to the account size and type of account of the shareholders of the respective classes of the Fund. FIIOC pays for typesetting, printing and mailing of
Annual Report
Notes to Financial Statements - continued
5. Fees and Other Transactions with Affiliates - continued
Transfer Agent Fees - continued
shareholder reports, except proxy statements. For the period, transfer agent fees for each class were as follows:
| Amount | % of
Average
Net Assets |
Class A | $ 532,515 | .30 |
Class T | 204,047 | .31 |
Class B | 55,675 | .30 |
Class C | 216,916 | .30 |
Institutional Class | 344,487 | .23 |
| $ 1,353,640 | |
Accounting and Security Lending Fees. Fidelity Service Company, Inc. (FSC), an affiliate of FMR, maintains the Fund's accounting records. The accounting fee is based on the level of average net assets for each month. Under a separate contract, FSC administers the security lending program. The security lending fee is based on the number and duration of lending transactions.
Brokerage Commissions. The Fund placed a portion of its portfolio transactions with brokerage firms which are affiliates of the investment adviser. The commissions paid to these affiliated firms were $311 for the period.
6. Committed Line of Credit.
The Fund participates with other funds managed by FMR or an affiliate in a $4.25 billion credit facility (the "line of credit") to be utilized for temporary or emergency purposes to fund shareholder redemptions or for other short-term liquidity purposes. The Fund has agreed to pay commitment fees on its pro-rata portion of the line of credit, which amounted to $1,351 and is reflected in Miscellaneous expenses on the Statement of Operations. During the period, there were no borrowings on this line of credit.
7. Security Lending.
The Fund lends portfolio securities through a lending agent from time to time in order to earn additional income. For equity securities, a lending agent is used and may loan securities to certain qualified borrowers, including Fidelity Capital Markets (FCM), a broker-dealer affiliated with the Fund. On the settlement date of the loan, the Fund receives collateral (in the form of U.S. Treasury obligations, letters of credit and/or cash) against the loaned securities and maintains collateral in an amount not less than 100% of the market value of the loaned securities during the period of the loan. The market value of the loaned securities is determined at the close of business of the Fund and any
Annual Report
7. Security Lending - continued
additional required collateral is delivered to the Fund on the next business day. If the borrower defaults on its obligation to return the securities loaned because of insolvency or other reasons, a fund could experience delays and costs in recovering the securities loaned or in gaining access to the collateral. Any cash collateral received is invested in the Fidelity Securities Lending Cash Central Fund. The value of loaned securities and cash collateral at period end are disclosed on the Fund's Statement of Assets and Liabilities. At period end, there were no security loans outstanding with FCM. Security lending income represents the income earned on investing cash collateral, less rebates paid to borrowers and any lending agent fees associated with the loan, plus any premium payments received for lending certain types of securities. Security lending income is presented in the Statement of Operations as a component of income from Fidelity Central Funds. Total security lending income during the period amounted to $43,262, including $2 from securities loaned to FCM.
8. Expense Reductions.
Many of the brokers with whom FMR places trades on behalf of the Fund provided services to the Fund in addition to trade execution. These services included payments of certain expenses on behalf of the Fund totaling $300,809 for the period. In addition, through arrangements with the Fund's custodian, credits realized as a result of uninvested cash balances were used to reduce the Fund's expenses. During the period, these credits reduced the Fund's custody expenses by $65.
9. Distributions to Shareholders.
Distributions to shareholders of each class were as follows:
Years ended October 31, | 2012 | 2011 |
From net investment income | | |
Class A | $ 1,451,148 | $ 1,359,820 |
Class T | 312,643 | 162,957 |
Class B | - | 6,606 |
Class C | - | 23,592 |
Institutional Class | 1,581,087 | 1,584,568 |
Total | $ 3,344,878 | $ 3,137,543 |
From net realized gain | | |
Class A | $ - | $ 1,530,131 |
Class T | - | 550,254 |
Class B | - | 33,415 |
Class C | - | 232,626 |
Institutional Class | - | 990,344 |
Total | $ - | $ 3,336,770 |
Annual Report
Notes to Financial Statements - continued
10. Share Transactions.
Transactions for each class of shares were as follows:
| Shares | Dollars |
Years ended October 31, | 2012 | 2011 | 2012 | 2011 |
Class A | | | | |
Shares sold | 2,037,152 | 2,979,791 | $ 41,195,109 | $ 70,086,728 |
Reinvestment of distributions | 66,178 | 111,230 | 1,330,840 | 2,675,569 |
Shares redeemed | (4,154,283) | (5,317,665) | (83,269,620) | (123,086,641) |
Net increase (decrease) | (2,050,953) | (2,226,644) | $ (40,743,671) | $ (50,324,344) |
Class T | | | | |
Shares sold | 596,352 | 883,154 | $ 12,026,705 | $ 20,610,023 |
Reinvestment of distributions | 14,784 | 28,248 | 297,017 | 678,402 |
Shares redeemed | (1,309,634) | (1,752,649) | (26,275,018) | (40,710,223) |
Net increase (decrease) | (698,498) | (841,247) | $ (13,951,296) | $ (19,421,798) |
Class B | | | | |
Shares sold | 26,111 | 68,462 | $ 526,389 | $ 1,586,905 |
Reinvestment of distributions | - | 1,377 | - | 32,616 |
Shares redeemed | (291,336) | (352,710) | (5,756,960) | (8,040,387) |
Net increase (decrease) | (265,225) | (282,871) | $ (5,230,571) | $ (6,420,866) |
Class C | | | | |
Shares sold | 549,601 | 956,543 | $ 10,991,315 | $ 22,080,298 |
Reinvestment of distributions | - | 9,045 | - | 213,702 |
Shares redeemed | (1,313,083) | (1,536,376) | (25,757,063) | (34,998,720) |
Net increase (decrease) | (763,482) | (570,788) | $ (14,765,748) | $ (12,704,720) |
Institutional Class | | | | |
Shares sold | 2,860,043 | 2,773,126 | $ 57,283,970 | $ 64,258,215 |
Reinvestment of distributions | 61,950 | 73,837 | 1,248,917 | 1,781,181 |
Shares redeemed | (2,554,172) | (3,885,014) | (52,021,365) | (91,297,373) |
Net increase (decrease) | 367,821 | (1,038,051) | $ 6,511,522 | $ (25,257,977) |
11. Other.
The Fund's organizational documents provide former and current trustees and officers with a limited indemnification against liabilities arising in connection with the performance of their duties to the Fund. In the normal course of business, the Fund may also enter into contracts that provide general indemnifications. The Fund's maximum exposure under these arrangements is unknown as this would be dependent on future claims that may be made against the Fund. The risk of material loss from such claims is considered remote.
Annual Report
To the Trustees of Fidelity Advisor Series VIII and Shareholders of Fidelity Advisor Emerging Markets Fund:
We have audited the accompanying statement of assets and liabilities of Fidelity Advisor Emerging Markets Fund (the Fund), a fund of Fidelity Advisor Series VIII, including the schedule of investments, as of October 31, 2012, and the related statement of operations for the year then ended, the statement of changes in net assets for each of the two years in the period then ended, and the financial highlights for each of the five years in the period then ended. These financial statements and financial highlights are the responsibility of the Fund's management. Our responsibility is to express an opinion on these financial statements and financial highlights based on our audits.
We conducted our audits in accordance with the standards of the Public Company Accounting Oversight Board (United States). Those standards require that we plan and perform the audit to obtain reasonable assurance about whether the financial statements and financial highlights are free of material misstatement. The Fund is not required to have, nor were we engaged to perform, an audit of its internal control over financial reporting. Our audits included consideration of internal control over financial reporting as a basis for designing audit procedures that are appropriate in the circumstances, but not for the purpose of expressing an opinion on the effectiveness of the Fund's internal control over financial reporting. Accordingly, we express no such opinion. An audit also includes examining, on a test basis, evidence supporting the amounts and disclosures in the financial statements, assessing the accounting principles used and significant estimates made by management, as well as evaluating the overall financial statement presentation. Our procedures included confirmation of securities owned as of October 31, 2012, by correspondence with the custodians and brokers; where replies were not received from brokers, we performed other auditing procedures. We believe that our audits provide a reasonable basis for our opinion.
In our opinion, the financial statements and financial highlights referred to above present fairly, in all material respects, the financial position of Fidelity Advisor Emerging Markets Fund as of October 31, 2012, the results of its operations for the year then ended, the changes in its net assets for each of the two years in the period then ended, and the financial highlights for each of the five years in the period then ended, in conformity with accounting principles generally accepted in the United States of America.
DELOITTE & TOUCHE LLP
Boston, Massachusetts
December 14, 2012
Annual Report
The Trustees, Members of the Advisory Board, and executive officers of the trust and fund, as applicable, are listed below. The Board of Trustees governs the fund and is responsible for protecting the interests of shareholders. The Trustees are experienced executives who meet periodically throughout the year to oversee the fund's activities, review contractual arrangements with companies that provide services to the fund, oversee management of the risks associated with such activities and contractual arrangements, and review the fund's performance. Except for James C. Curvey, each of the Trustees oversees 236 funds advised by FMR or an affiliate. Mr. Curvey oversees 443 funds advised by FMR or an affiliate.
The Trustees hold office without limit in time except that (a) any Trustee may resign; (b) any Trustee may be removed by written instrument, signed by at least two-thirds of the number of Trustees prior to such removal; (c) any Trustee who requests to be retired or who has become incapacitated by illness or injury may be retired by written instrument signed by a majority of the other Trustees; and (d) any Trustee may be removed at any special meeting of shareholders by a two-thirds vote of the outstanding voting securities of the trust. Each Trustee who is not an interested person (as defined in the 1940 Act) (Independent Trustee), shall retire not later than the last day of the calendar year in which his or her 75th birthday occurs. The Independent Trustees may waive this mandatory retirement age policy with respect to individual Trustees. The executive officers and Advisory Board Members hold office without limit in time, except that any officer and Advisory Board Member may resign or may be removed by a vote of a majority of the Trustees at any regular meeting or any special meeting of the Trustees. Except as indicated, each individual has held the office shown or other offices in the same company for the past five years.
Experience, Skills, Attributes, and Qualifications of the Fund's Trustees. The Governance and Nominating Committee has adopted a statement of policy that describes the experience, qualifications, attributes, and skills that are necessary and desirable for potential Independent Trustee candidates (Statement of Policy). The Board believes that each Trustee satisfied at the time he or she was initially elected or appointed a Trustee, and continues to satisfy, the standards contemplated by the Statement of Policy. The Governance and Nominating Committee also engages professional search firms to help identify potential Independent Trustee candidates who have the experience, qualifications, attributes, and skills consistent with the Statement of Policy. From time to time, additional criteria based on the composition and skills of the current Independent Trustees, as well as experience or skills that may be appropriate in light of future changes to board composition, business conditions, and regulatory or other developments, have also been considered by the professional search firms and the Governance and Nominating Committee. In addition, the Board takes into account the Trustees' commitment and participation in Board and committee meetings, as well as their leadership of standing and ad hoc committees throughout their tenure.
In determining that a particular Trustee was and continues to be qualified to serve as a Trustee, the Board has considered a variety of criteria, none of which, in isolation, was controlling. The Board believes that, collectively, the Trustees have balanced and diverse experience, qualifications, attributes, and skills, which allow the Board to operate effectively in governing the fund and protecting the interests of shareholders. Information about the specific experience, skills, attributes, and qualifications of each Trustee, which in each case led to the Board's conclusion that the Trustee should serve (or continue to serve) as a trustee of the fund, is provided below.
Annual Report
Trustees and Officers - continued
Board Structure and Oversight Function. James C. Curvey is an interested person (as defined in the 1940 Act) and currently serves as Chairman. The Trustees have determined that an interested Chairman is appropriate and benefits shareholders because an interested Chairman has a personal and professional stake in the quality and continuity of services provided to the fund. Independent Trustees exercise their informed business judgment to appoint an individual of their choosing to serve as Chairman, regardless of whether the Trustee happens to be independent or a member of management. The Independent Trustees have determined that they can act independently and effectively without having an Independent Trustee serve as Chairman and that a key structural component for assuring that they are in a position to do so is for the Independent Trustees to constitute a substantial majority for the Board. The Independent Trustees also regularly meet in executive session. Ned C. Lautenbach serves as Chairman of the Independent Trustees and as such (i) acts as a liaison between the Independent Trustees and management with respect to matters important to the Independent Trustees and (ii) with management prepares agendas for Board meetings.
Fidelity funds are overseen by different Boards of Trustees. The fund's Board oversees Fidelity's equity and high income funds and another Board oversees Fidelity's investment-grade bond, money market, and asset allocation funds. The asset allocation funds may invest in Fidelity funds overseen by the fund's Board. The use of separate Boards, each with its own committee structure, allows the Trustees of each group of Fidelity funds to focus on the unique issues of the funds they oversee, including common research, investment, and operational issues. On occasion, the separate Boards establish joint committees to address issues of overlapping consequences for the Fidelity funds overseen by each Board.
The Trustees operate using a system of committees to facilitate the timely and efficient consideration of all matters of importance to the Trustees, the fund, and fund shareholders and to facilitate compliance with legal and regulatory requirements and oversight of the fund's activities and associated risks. The Board, acting through its committees, has charged FMR and its affiliates with (i) identifying events or circumstances the occurrence of which could have demonstrably adverse effects on the fund's business and/or reputation; (ii) implementing processes and controls to lessen the possibility that such events or circumstances occur or to mitigate the effects of such events or circumstances if they do occur; and (iii) creating and maintaining a system designed to evaluate continuously business and market conditions in order to facilitate the identification and implementation processes described in (i) and (ii) above. Because the day-to-day operations and activities of the fund are carried out by or through FMR, its affiliates and other service providers, the fund's exposure to risks is mitigated but not eliminated by the processes overseen by the Trustees. While each of the Board's committees has responsibility for overseeing different aspects of the fund's activities, oversight is exercised primarily through the Operations, Audit, and Compliance Committees. In addition, the Independent Trustees have worked with FMR to enhance the Board's oversight of investment and financial risks, legal and regulatory risks, technology risks, and operational risks, including the development of additional risk reporting to the Board. For example, a working group comprised of Independent Trustees and FMR has worked and continues to work to review the Fidelity funds' valuation-related activities, reporting and risk management. Appropriate personnel, including but not limited to the fund's Chief Compliance Officer (CCO), FMR's internal auditor, the independent accountants, the fund's Treasurer and portfolio management personnel, make periodic reports to the Board's committees, as appropriate, including an annual review of FMR's risk management program for the Fidelity funds. The responsibilities of each standing committee, including their oversight responsibilities, are described further under "Standing Committees of the Fund's Trustees."
Annual Report
The fund's Statement of Additional Information (SAI) includes more information about the Trustees. To request a free copy, call Fidelity at 1-877-208-0098.
Interested Trustees*:
Correspondence intended for each Trustee who is an interested person may be sent to Fidelity Investments, 82 Devonshire Street, Boston, Massachusetts 02109.
Name, Age; Principal Occupations and Other Relevant Experience+ |
James C. Curvey (77) |
| Year of Election or Appointment: 2007 Mr. Curvey is Trustee and Chairman of the Board of Trustees of certain Trusts. Mr. Curvey also serves as Trustee (2007-present) of other investment companies advised by FMR. Mr. Curvey is a Director of Fidelity Investments Money Management, Inc. (2009-present), Director of Fidelity Research & Analysis Co. (2009-present) and Director of FMR and FMR Co., Inc. (2007-present). Mr. Curvey is also Vice Chairman (2007-present) and Director of FMR LLC. In addition, Mr. Curvey serves as an Overseer for the Boston Symphony Orchestra and a member of the Trustees of Villanova University. Previously, Mr. Curvey was the Vice Chairman (2006-2007) and Director (2000-2007) of FMR Corp. |
Ronald P. O'Hanley (55) |
| Year of Election or Appointment: 2011 Mr. O'Hanley is Director of FMR Co., Inc. (2010-present), Director of Fidelity Investments Money Management, Inc. (2010-present), Director of Fidelity Research & Analysis Company (2010-present), President of Fidelity Asset Management and Corporate Services and a member of Fidelity's Executive Committee (2010-present). Previously, Mr. O'Hanley served as President and Chief Executive Officer of BNY Mellon Asset Management (2007-2010). Mr. O'Hanley also served as Vice Chairman of Bank New York Mellon Corp. and a member of that firm's Executive Committee. Prior to the 2007 merger of The Bank of New York and Mellon Financial Corporation, he was Vice Chairman of Mellon Financial Corporation and President and Chief Executive Officer of Mellon Asset Management. He joined Mellon in February 1997. Mr. O'Hanley currently serves as Chairman of the Boston Public Library Foundation Board of Directors and sits on the Board of Directors of Beth Israel Deaconess Medical Center, the Board of Trustees of the Marine Biological Laboratory and the Advisory Board of the Maxwell School of Citizenship and Public Administration at Syracuse University. Mr. O'Hanley also chairs the Council on Asset Management for the Financial Services Roundtable and is a member of the Board of Directors of Institutional Investor's U.S. Institute. |
* Trustees have been determined to be "Interested Trustees" by virtue of, among other things, their affiliation with the trust or various entities under common control with FMR.
+ The information above includes each Trustee's principal occupation during the last five years and other information relating to the experience, attributes, and skills relevant to each Trustee's qualifications to serve as a Trustee, which led to the conclusion that each Trustee should serve as a Trustee for the fund.
Annual Report
Independent Trustees:
Correspondence intended for each Independent Trustee (that is, the Trustees other than the Interested Trustees) may be sent to Fidelity Investments, P.O. Box 55235, Boston, Massachusetts 02205-5235.
Name, Age; Principal Occupations and Other Relevant Experience+ |
Dennis J. Dirks (64) |
| Year of Election or Appointment: 2005 Prior to his retirement in May 2003, Mr. Dirks was Chief Operating Officer and a member of the Board of The Depository Trust & Clearing Corporation (DTCC). He also served as President, Chief Operating Officer, and Board member of The Depository Trust Company (DTC) and President and Board member of the National Securities Clearing Corporation (NSCC). In addition, Mr. Dirks served as Chief Executive Officer and Board member of the Government Securities Clearing Corporation, Chief Executive Officer and Board member of the Mortgage-Backed Securities Clearing Corporation, as a Trustee and a member of the Finance Committee of Manhattan College (2005-2008), and as a Trustee and a member of the Finance Committee of AHRC of Nassau County (2006-2008). Mr. Dirks is a member of the Independent Directors Council (IDC) Governing Council (2010-present) and Board of Directors for The Brookville Center for Children's Services, Inc. (2009-present). |
Alan J. Lacy (59) |
| Year of Election or Appointment: 2008 Mr. Lacy serves as Senior Adviser (2007-present) of Oak Hill Capital Partners, L.P. (private equity). Mr. Lacy also served as Chief Executive Officer (2000-2005) and Vice Chairman (2005-2006) of Sears Holdings Corporation and Sears, Roebuck and Co. (retail). In addition, Mr. Lacy serves as a member of the Board of Directors of Dave & Buster's Entertainment, Inc. (restaurant and entertainment complexes, 2010-present), Earth Fare, Inc. (retail grocery, 2012-present), The Hillman Companies, Inc. (hardware wholesalers, 2010-present), and Bristol-Myers Squibb Company (global pharmaceuticals, 2008-present). Mr. Lacy is a member of the Board of Trustees of The National Parks Conservation Association (2006-present). Previously, Mr. Lacy served as Chairman of the Board of Trustees of the National Parks Conservation Association (2008-2011) and as a member of the Board of Directors for the Western Union Company (global money transfer, 2006-2011). |
Ned C. Lautenbach (68) |
| Year of Election or Appointment: 2000 Mr. Lautenbach is Chairman of the Independent Trustees of the Equity and High Income Funds (2006-present). Mr. Lautenbach currently serves as the Lead Director of the Eaton Corporation Board of Directors (diversified industrial, 1997-present). Mr. Lautenbach is Chairman of the Board of Directors of the Philharmonic Center for the Arts in Naples, Florida (2012-present) and a member of the Council on Foreign Relations (1994-present). Previously, Mr. Lautenbach was a Partner/Advisory Partner at Clayton, Dubilier & Rice, LLC (private equity investment, 1998-2010), as well as a Director of Sony Corporation (2006-2007). |
Joseph Mauriello (68) |
| Year of Election or Appointment: 2008 Prior to his retirement in January 2006, Mr. Mauriello served in numerous senior management positions including Deputy Chairman and Chief Operating Officer (2004-2005), and Vice Chairman of Financial Services (2002-2004) of KPMG LLP US (professional services, 1965-2005). Mr. Mauriello currently serves as a member of the Board of Directors of XL Group plc. (global insurance and re-insurance, 2006-present). Previously, Mr. Mauriello served as a Director of the Hamilton Funds of the Bank of New York (2006-2007) and of Arcadia Resources Inc. (health care services and products, 2007-2012). |
Robert W. Selander (62) |
| Year of Election or Appointment: 2011 Previously, Mr. Selander served as a Member of the Advisory Board of Fidelity's Equity and High Income Funds (2011), Executive Vice Chairman (2010), Chief Executive Officer (2009-2010), and President and Chief Executive Officer (1997-2009) of Mastercard, Inc. |
Cornelia M. Small (68) |
| Year of Election or Appointment: 2005 Ms. Small is a member of the Board of Directors (2009-present) and Chair of the Investment Committee (2010-present) of the Teagle Foundation. Ms. Small also serves on the Investment Committee of the Berkshire Taconic Community Foundation (2008-present). Previously, Ms. Small served as Chairperson (2002-2008) and a member of the Investment Committee and Chairperson (2008-2012) and a member of the Board of Trustees of Smith College. In addition, Ms. Small served as Chief Investment Officer, Director of Global Equity Investments, and a member of the Board of Directors of Scudder, Stevens & Clark and Scudder Kemper Investments. |
William S. Stavropoulos (73) |
| Year of Election or Appointment: 2001 Mr. Stavropoulos is Vice Chairman of the Independent Trustees of the Equity and High Income Funds (2006-present). Mr. Stavropoulos serves as President and Founder of the Michigan Baseball Foundation, the Great Lakes Loons (2007-present). Mr. Stavropoulos is Chairman Emeritus of the Board of Directors of The Dow Chemical Company, where he previously served in numerous senior management positions, including President, CEO (1995-2000; 2002-2004), Chairman of the Executive Committee (2000-2006), and as a member of the Board of Directors (1990-2006). Currently, Mr. Stavropoulos is a Director of Univar Inc. (global distributor of commodity and specialty chemicals, Chairman from 2010-May 2012 and Lead Director from May 2012-present), Teradata Corporation (data warehousing and technology solutions, 2008-present), Maersk Inc. (industrial conglomerate), and Tyco International, Ltd. (multinational manufacturing and services, 2007-present), and a member of the Advisory Board for Metalmark Capital LLC (private equity investment, 2005-present). Mr. Stavropoulos is an operating advisor to Clayton, Dubilier & Rice, LLC (private equity investment). In addition, Mr. Stavropoulos is a member of the University of Notre Dame Advisory Council for the College of Science, a Trustee of the Rollin L. Gerstacker Foundation, and a Director of the Naples Philharmonic Center for the Arts. Previously, Mr. Stavropoulos served as a Director of Chemical Financial Corporation (bank holding company, 1993-2012). |
David M. Thomas (63) |
| Year of Election or Appointment: 2008 Previously, Mr. Thomas served as Executive Chairman (2005-2006) and Chairman and Chief Executive Officer (2000-2005) of IMS Health, Inc. (pharmaceutical and healthcare information solutions), and a Director of Fortune Brands, Inc. (consumer products, 2000-2011). In addition, Mr. Thomas serves as Non-Executive Chairman of the Board of Directors of Fortune Brands Home and Security (home and security products, 2011-present), and as a member of the Board of Directors of Interpublic Group of Companies, Inc. (marketing communication, 2004-present). |
Michael E. Wiley (62) |
| Year of Election or Appointment: 2008 Mr. Wiley also serves as a Director of Asia Pacific Exploration Consolidated (international oil and gas exploration and production, 2008-present). Mr. Wiley serves as a Director of Tesoro Corporation (independent oil refiner and marketer, 2005-present), and a Director of Bill Barrett Corporation (exploration and production, 2005-present). In addition, Mr. Wiley also serves as a Director of Post Oak Bank (privately-held bank, 2004-present). Previously, Mr. Wiley served as a member of the Board of Trustees of the University of Tulsa (2000-2006; 2007-2010), as a Senior Energy Advisor of Katzenbach Partners, LLC (consulting, 2006-2007), as an Advisory Director of Riverstone Holdings (private investment), Chairman, President, and CEO of Baker Hughes, Inc. (oilfield services, 2000-2004), and as Director of Spinnaker Exploration Company (exploration and production, 2001-2005). |
+ The information above includes each Trustee's principal occupation during the last five years and other information relating to the experience, attributes, and skills relevant to each Trustee's qualifications to serve as a Trustee, which led to the conclusion that each Trustee should serve as a Trustee for the fund.
Advisory Board Members and Executive Officers:
Correspondence intended for David A. Rosow and Garnett A. Smith may be sent to Fidelity Investments, P.O. Box 55235, Boston, Massachusetts 02205-5235. Correspondence intended for each executive officer, Edward C. Johnson 3d, and Peter S. Lynch may be sent to Fidelity Investments, 82 Devonshire Street, Boston, Massachusetts 02109.
Name, Age; Principal Occupation |
Edward C. Johnson 3d (82) |
| Year of Election or Appointment: 2011 Member of the Advisory Board of Fidelity's Equity and High Income Funds. Mr. Johnson serves as Chief Executive Officer, Chairman, and a Director of FMR LLC, and also serves as Chairman and Director of FIL Limited. Previously, Mr. Johnson served as a Trustee and Chairman of the Board of certain Fidelity Trusts, Chairman and a Director of FMR, Chairman and a Director of FMR Co., Inc., and President of FMR LLC (2006-2007). |
Peter S. Lynch (68) |
| Year of Election or Appointment: 2003 Member of the Advisory Board of Fidelity's Equity and High Income Funds. Mr. Lynch is Vice Chairman and a Director of FMR and FMR Co., Inc. In addition, Mr. Lynch serves as a Trustee of Boston College and as the Chairman of the Inner-City Scholarship Fund. Previously, Mr. Lynch served on the Special Olympics International Board of Directors (1997-2006). |
David A. Rosow (70) |
| Year of Election or Appointment: 2012 Member of the Advisory Board of Fidelity's Equity and High Income Funds. Chairman and Chief Executive Officer of International Golf Group, Inc. (golf course development, 1989-present). Previously, Mr. Rosow served as Chairman and Chief Executive Officer of Rosow & Company, Inc. (private investment company, 1989-2011), a Lead Director of Hudson United Bancorp (2001-2006) and as a Director of TD Banknorth (1996-2006). In addition, Mr. Rosow is a member (2008-present) and President (2009-present) of the Town Council of Palm Beach, Florida. |
Garnett A. Smith (65) |
| Year of Election or Appointment: 2012 Member of the Advisory Board of Fidelity's Equity and High Income Funds. Prior to Mr. Smith's retirement, he served as Chairman and Chief Executive Officer of Inbrand Corp. (manufacturer of personal absorbent products, 1990-1997). He also served as President (1986-1990) of Inbrand Corp. Prior to his employment with Inbrand Corp., he was employed by a retail fabric chain and North Carolina National Bank. In addition, Mr. Smith is a board member of the Jackson Hole Land Trust (2009-present). |
Kenneth B. Robins (43) |
| Year of Election or Appointment: 2008 President and Treasurer of Fidelity's Equity and High Income Funds. Mr. Robins also serves as President and Treasurer (2010-present) and Assistant Treasurer (2009-present) of other Fidelity funds and is an employee of Fidelity Investments (2004-present). Previously, Mr. Robins served as Deputy Treasurer of the Fidelity funds (2005-2008) and Treasurer and Chief Financial Officer of The North Carolina Capital Management Trust: Cash and Term Portfolios (2006-2008). |
Bruce T. Herring (47) |
| Year of Election or Appointment: 2006 Vice President of certain Equity Funds. Mr. Herring also serves as President of Fidelity Research & Analysis Company (2010-present), Chief Investment Officer and Director of Fidelity Management & Research (U.K.) Inc. (2010-present) and Group Chief Investment Officer of FMR. Previously, Mr. Herring served as Vice President (2005-2006) and Senior Vice President (2006-2007) of Fidelity Management & Research Company, Vice President of FMR Co., Inc. (2001-2007) and as a portfolio manager for Fidelity U.S. Equity Funds. |
Brian B. Hogan (48) |
| Year of Election or Appointment: 2009 Vice President of Equity and High Income Funds. Mr. Hogan also serves as President of FMR's Equity Division (2009-present). Previously, Mr. Hogan served as Senior Vice President, Equity Research of FMR (2006-2009) and as a portfolio manager. |
Scott C. Goebel (44) |
| Year of Election or Appointment: 2008 Secretary and Chief Legal Officer (CLO) of the Fidelity funds. Mr. Goebel also serves as Secretary of Fidelity Investments Money Management, Inc. (FIMM) (2010-present) and Fidelity Research and Analysis Company (FRAC) (2010-present); Secretary and CLO of The North Carolina Capital Management Trust: Cash and Term Portfolios (2008-present); General Counsel, Secretary, and Senior Vice President of FMR (2008-present) and FMR Co., Inc. (2008-present); employed by FMR LLC or an affiliate (2001-present); Chief Legal Officer of Fidelity Management & Research (Hong Kong) Limited (2008-present) and Assistant Secretary of Fidelity Management & Research (Japan) Inc. (2008-present), and Fidelity Management & Research (U.K.) Inc. (2008-present). Previously, Mr. Goebel served as Assistant Secretary of FIMM (2008-2010), FRAC (2008-2010), and the Funds (2007-2008) and as Vice President and Secretary of Fidelity Distributors Corporation (FDC) (2005-2007). |
William C. Coffey (43) |
| Year of Election or Appointment: 2009 Assistant Secretary of Fidelity's Equity and High Income Funds. Mr. Coffey also serves as Senior Vice President and Deputy General Counsel of FMR LLC (2010-present), and is an employee of Fidelity Investments. Previously, Mr. Coffey served as Vice President and Associate General Counsel of FMR LLC (2005-2009). |
Elizabeth Paige Baumann (44) |
| Year of Election or Appointment: 2012 Anti-Money Laundering (AML) Officer of the Fidelity funds. Ms. Baumann also serves as AML Officer of The North Carolina Capital Management Trust: Cash and Term Portfolios (2012-present), Chief AML Officer of FMR LLC (2012-present), and is an employee of Fidelity Investments. Previously, Ms. Baumann served as Vice President and Deputy Anti-Money Laundering Officer (2007-2012). |
Christine Reynolds (54) |
| Year of Election or Appointment: 2008 Chief Financial Officer of the Fidelity funds. Ms. Reynolds became President of Fidelity Pricing and Cash Management Services (FPCMS) in August 2008. Ms. Reynolds served as Chief Operating Officer of FPCMS (2007-2008). Previously, Ms. Reynolds served as President, Treasurer, and Anti-Money Laundering officer of the Fidelity funds (2004-2007). |
Joseph A. Hanlon (44) |
| Year of Election or Appointment: 2012 Chief Compliance Officer of Fidelity's Equity and High Income Funds. Mr. Hanlon serves as Compliance Officer of FMR, FMR Co., Inc., Fidelity Investments Money Management, Inc. (FIMM), Fidelity Research and Analysis Company (FRAC), Fidelity Management & Research (Japan) Inc., Fidelity Management & Research (U.K.) Inc., Fidelity Management & Research (Hong Kong), and Strategic Advisers, Inc. (2009-present), as Senior Vice President of the Fidelity Asset Management Division (2009-present), and is an employee of Fidelity Investments. |
Joseph F. Zambello (55) |
| Year of Election or Appointment: 2011 Deputy Treasurer of the Fidelity funds. Mr. Zambello is an employee of Fidelity Investments. Previously, Mr. Zambello served as Vice President of FMR's Program Management Group (2009-2011) and Vice President of the Transfer Agent Oversight Group (2005-2009). |
Adrien E. Deberghes (45) |
| Year of Election or Appointment: 2008 Deputy Treasurer of Fidelity's Equity and High Income Funds. Mr. Deberghes also serves as Vice President (2011-present) and Assistant Treasurer (2010-present) of other Fidelity funds, and is an employee of Fidelity Investments (2008-present). Previously, Mr. Deberghes served as Senior Vice President of Mutual Fund Administration at State Street Corporation (2007-2008), Senior Director of Mutual Fund Administration at Investors Bank & Trust (2005-2007), and Director of Finance for Dunkin' Brands (2000-2005). |
Stephen Sadoski (41) |
| Year of Election or Appointment: 2012 Deputy Treasurer of Fidelity's Equity and High Income Funds. Mr. Sadoski also serves as Assistant Treasurer of other Fidelity funds (2012-present) and is an employee of Fidelity Investments (2012-present). Previously, Mr. Sadoski served as an assistant chief accountant in the Division of Investment Management of the Securities and Exchange Commission (SEC) (2009-2012) and as a senior manager at Deloitte & Touche (1997-2009). |
Stephanie J. Dorsey (43) |
| Year of Election or Appointment: 2010 Assistant Treasurer of Fidelity's Equity and High Income Funds. Ms. Dorsey also serves as Deputy Treasurer of other Fidelity funds (2008-present) and is an employee of Fidelity Investments (2008-present). Previously, Ms. Dorsey served as Treasurer (2004-2008) of the JPMorgan Mutual Funds and Vice President (2004-2008) of JPMorgan Chase Bank. |
John R. Hebble (54) |
| Year of Election or Appointment: 2009 Assistant Treasurer of Fidelity's Equity and High Income Funds. Mr. Hebble also serves as President (2011-present), Treasurer, and Chief Financial Officer of The North Carolina Capital Management Trust: Cash and Term Portfolios (2008-present), President and Treasurer of other Fidelity funds (2008-present) and is an employee of Fidelity Investments. |
Gary W. Ryan (54) |
| Year of Election or Appointment: 2005 Assistant Treasurer of the Fidelity funds. Mr. Ryan is an employee of Fidelity Investments. Previously, Mr. Ryan served as Vice President of Fund Reporting in Fidelity Pricing and Cash Management Services (FPCMS) (1999-2005). |
Jonathan Davis (44) |
| Year of Election or Appointment: 2010 Assistant Treasurer of the Fidelity funds. Mr. Davis is also Assistant Treasurer of Fidelity Rutland Square Trust II and Fidelity Commonwealth Trust II. Mr. Davis is an employee of Fidelity Investments. Previously, Mr. Davis served as Vice President and Associate General Counsel of FMR LLC (2003-2010). |
Annual Report
Class A designates 100%; Class T designates 100% of the dividend distributed during the fiscal year as amounts which may be taken into account as a dividend for purposes of the maximum rate under section 1(h)(11) of the Internal Revenue Code.
The amounts per share which represent income derived from sources within, and taxes paid to, foreign countries or possessions of the United States are as follows:
| Pay Date | Income | Taxes |
Class A | 12/05/11 | $0.223 | $0.0728 |
| | | |
Class T | 12/05/11 | $0.162 | $0.0728 |
| | | |
Class B | 12/05/11 | $0.000 | $0.0000 |
| | | |
Class C | 12/05/11 | $0.000 | $0.0000 |
The fund will notify shareholders in January 2013 of amounts for use in preparing 2012 income tax returns.
Annual Report
Board Approval of Investment Advisory Contracts and Management Fees
Fidelity Advisor Emerging Markets Fund
Each year, the Board of Trustees, including the Independent Trustees (together, the Board), votes on the renewal of the management contract and sub-advisory agreements (together, the Advisory Contracts) for the fund. The Board, assisted by the advice of fund counsel and Independent Trustees' counsel, requests and considers a broad range of information relevant to the renewal of the Advisory Contracts throughout the year.
The Board meets regularly and, at each of its meetings, considers factors that are relevant to its annual consideration of the renewal of the fund's Advisory Contracts, including the services and support provided to the fund and its shareholders. The Board has established various standing committees, each composed of and chaired by Independent Trustees with varying backgrounds, to which the Board has assigned specific subject matter responsibilities in order to enhance effective decision-making by the Board. The Board, acting directly and through its Committees, requests and receives information concerning the annual consideration of the renewal of the fund's Advisory Contracts. The Board also meets as needed to consider matters specifically related to the Board's annual consideration of the renewal of Advisory Contracts. Members of the Board may also meet with trustees of other Fidelity funds through ad hoc joint committees to discuss certain matters relevant to the Fidelity funds.
At its July 2012 meeting, the Board of Trustees, including the Independent Trustees, unanimously determined to renew the fund's Advisory Contracts. In reaching its determination, the Board considered all factors it believed relevant, including (i) the nature, extent, and quality of the services to be provided to the fund and its shareholders (including the investment performance of the fund); (ii) the competitiveness of the fund's management fee and total expense ratio relative to peer funds; (iii) the total costs of the services to be provided by and the profits to be realized by Fidelity from its relationship with the fund; (iv) the extent to which economies of scale exist and would be realized as the fund grows; and (v) whether fee levels reflect these economies of scale, if any, for the benefit of fund shareholders.
In considering whether to renew the Advisory Contracts for the fund, the Board reached a determination, with the assistance of fund counsel and Independent Trustees' counsel and through the exercise of its business judgment, that the renewal of the Advisory Contracts is in the best interests of the fund and its shareholders and that the compensation payable under the Advisory Contracts is fair and reasonable. The Board's decision to renew the Advisory Contracts was not based on any single factor, but rather was based on a comprehensive consideration of all the information provided to the Board at its meetings throughout the year. The Board, in reaching its determination to renew the Advisory Contracts, is aware that shareholders in the fund have a broad range of investment choices available to them, including a wide choice among mutual funds offered by Fidelity's competitors, and that the fund's shareholders, who have the opportunity to review and weigh the disclosure provided by the fund in its prospectus and other public disclosures, have chosen to invest in this fund, managed by Fidelity.
Annual Report
Nature, Extent, and Quality of Services Provided. The Board considered the staffing within the investment adviser, FMR, and the sub-advisers (together, the Investment Advisers), including the backgrounds of the fund's investment personnel, and also considered the fund's investment objective, strategies, and related investment philosophy. The Independent Trustees also had discussions with senior management of Fidelity's investment operations and investment groups. The Board considered the structure of the portfolio manager compensation program and whether this structure provides appropriate incentives to act in the best interests of the fund.
Resources Dedicated to Investment Management and Support Services. The Board and the Fund Oversight and Research Committees reviewed the general qualifications and capabilities of the Investment Advisers' investment staff, including its size, education, experience, and resources, as well as the Investment Advisers' approach to recruiting, training, managing, and compensating investment personnel. The Board also noted that FMR has continued to increase the resources devoted to non-U.S. offices, including expansion of Fidelity's global investment organization. The Board noted that Fidelity's analysts have extensive resources, tools and capabilities that allow them to conduct sophisticated quantitative and fundamental analysis, as well as credit analysis of issuers, counterparties and guarantors. The Board also believes that Fidelity's investment professionals have sufficient access to global information and data so as to provide competitive investment results over time, and that those professionals also have access to sophisticated tools that permit them to assess portfolio construction and risk and performance attribution characteristics continuously, as well as to transmit new information and research conclusions rapidly around the world. Additionally, in its deliberations, the Board considered the Investment Advisers' trading and risk management capabilities and resources, which are an integral part of the investment management process.
Shareholder and Administrative Services. The Board considered (i) the nature, extent, quality, and cost of advisory, administrative, and shareholder services performed by the Investment Advisers and their affiliates under the Advisory Contracts and under separate agreements covering transfer agency, pricing and bookkeeping, and securities lending services for the fund; (ii) the nature and extent of the supervision of third party service providers, principally custodians and subcustodians; and (iii) the resources devoted to, and the record of compliance with, the fund's compliance policies and procedures. The Board also reviewed the allocation of fund brokerage, including allocations to brokers affiliated with the Investment Advisers, the use of brokerage commissions to pay fund expenses, and the use of "soft" commission dollars to pay for research services.
Annual Report
Board Approval of Investment Advisory Contracts and
Management Fees - continued
The Board noted that the growth of fund assets over time across the complex allows Fidelity to reinvest in the development of services designed to enhance the value or convenience of the Fidelity funds as investment vehicles. These services include 24-hour access to account information and market information through telephone representatives and over the Internet, investor education materials and asset allocation tools, and the expanded availability of Fidelity Investor Centers.
Investment in a Large Fund Family. The Board considered the benefits to shareholders of investing in a Fidelity fund, including the benefits of investing in a fund that is part of a large family of funds offering a variety of investment disciplines and providing a large variety of mutual fund investor services. The Board noted that Fidelity had taken, or had made recommendations that resulted in the Fidelity funds taking, a number of actions over the previous year that benefited particular funds, including (i) continuing to dedicate additional resources to investment research and support of the senior management team that oversees asset management; (ii) persisting in efforts to enhance Fidelity's research capabilities, in particular, international research; (iii) launching new funds and making other enhancements to meet client needs for global and income-oriented solutions; (iv) continuing to launch dedicated lower cost underlying funds to meet investment management's portfolio construction needs related to expanding underlying fund options, specifically for the Freedom Fund product lines; (v) adopting a "Stock Selector" sector neutral investment approach and employing a team of portfolio managers who are sector specialists to manage certain funds; (vi) rationalizing product lines and gaining increased efficiencies through the mergers of several funds into other funds; (vii) strengthening the Spartan Index Fund product line by adding new funds and/or new low-cost institutional share classes, restructuring fund expenses to accommodate new classes, and reducing investment minimums for certain classes of shares; (viii) modifying the eligibility criteria for Institutional Class shares to increase their appeal to government entities and charitable investors; and (ix) reducing certain transfer agent fee rates.
Investment Performance. The Board considered whether the fund has operated in accordance with its investment objective, as well as its record of compliance with its investment restrictions. It also reviewed the fund's absolute investment performance for each class, as well as the fund's relative investment performance for each class measured over multiple periods against (i) a broad-based securities market index, and (ii) a peer group of mutual funds deemed appropriate by Fidelity and reviewed by the Board. The following charts considered by the Board show, over the one-, three-, and five-year periods ended December 31, 2011, the cumulative total returns of Institutional Class (Class I) and Class B of the fund, the cumulative total returns of a broad-based securities market index ("benchmark"), and a range of cumulative total returns of a peer group of mutual funds identified by Morningstar, Inc. as having an investment style similar to that of the fund based on underlying portfolio holdings. The returns of Institutional Class (Class I) and Class B show the performance of the highest and lowest performing classes, respectively (based on five-year performance). The box within each chart shows the 25th percentile return (top of box) and the 75th percentile return (bottom of box) of the peer group. Returns shown above the box are in the first quartile and returns shown below the box are in the fourth quartile. The percentage beaten numbers noted below each chart correspond to the percentile box and represent the percentage of funds in the peer group whose performance was equal to or lower than that of the class indicated.
Annual Report
Fidelity Advisor Emerging Markets Fund
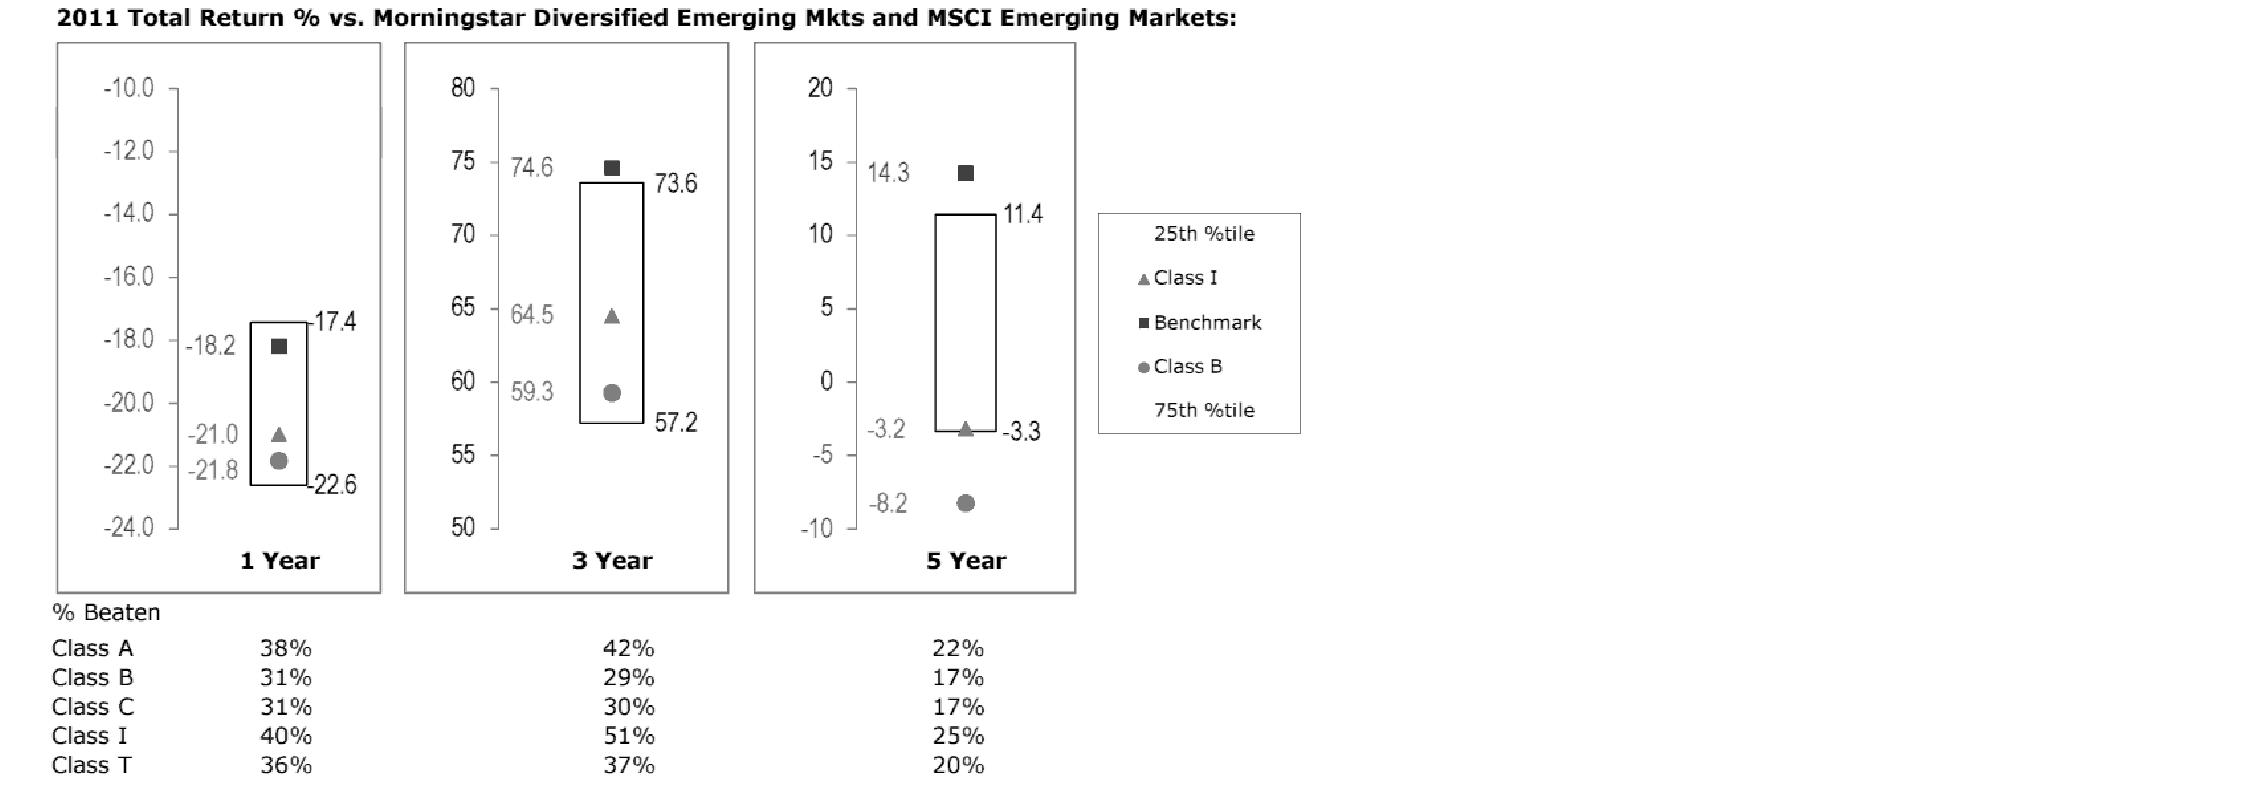
The Board reviewed the fund's relative investment performance against its peer group and noted that the performance of Institutional Class (Class I) of the fund was in the third quartile for the one- and five-year periods and the second quartile for the three-year period. The Board also noted that the investment performance of the fund was lower than its benchmark for all the periods shown. The Board considered that the variations in performance among the fund's classes reflect the variations in class expenses, which result in lower performance for higher expense classes. The Board discussed with FMR the fact that the fund underperformed its benchmark for each period measured. The Board also reviewed the fund's performance since inception as well as performance in the current year. The Board will continue to closely monitor performance of the fund in the coming year and discuss with FMR if other actions to address performance are appropriate.
Based on its review, the Board concluded that the nature, extent, and quality of services provided to the fund under the Advisory Contracts should benefit the fund's shareholders.
Annual Report
Board Approval of Investment Advisory Contracts and
Management Fees - continued
Competitiveness of Management Fee and Total Expense Ratio. The Board considered the fund's management fee and total expense ratio compared to "mapped groups" of competitive funds and classes. Fidelity creates "mapped groups" by combining similar Lipper investment objective categories that have comparable management fee characteristics. Combining Lipper investment objective categories aids the Board's management fee and total expense ratio comparisons by broadening the competitive group used for comparison and by reducing the number of universes to which various Fidelity funds are compared.
Management Fee. The Board considered two proprietary management fee comparisons for the 12-month periods shown in the chart below. The group of Lipper funds used by the Board for management fee comparisons is referred to below as the "Total Mapped Group." The Total Mapped Group comparison focuses on a fund's standing relative to the total universe of comparable funds available to investors in terms of gross management fees before expense reimbursements or caps. "TMG %" represents the percentage of funds in the Total Mapped Group that had management fees that were lower than the fund's. For example, a TMG % of 13% means that 87% of the funds in the Total Mapped Group had higher management fees than the fund. The "Asset-Size Peer Group" (ASPG) comparison focuses on a fund's standing relative to non-Fidelity funds similar in size to the fund within the Total Mapped Group. The ASPG represents at least 15% of the funds in the Total Mapped Group with comparable asset size and management fee characteristics, subject to a minimum of 50 funds (or all funds in the Total Mapped Group if fewer than 50). Additional information, such as the ASPG quartile in which the fund's management fee ranked, is also included in the chart and considered by the Board.
Fidelity Advisor Emerging Markets Fund

Annual Report
The Board noted that the fund's management fee ranked below the median of its Total Mapped Group and below the median of its ASPG for 2011.
Based on its review, the Board concluded that the fund's management fee is fair and reasonable in light of the services that the fund receives and the other factors considered.
Total Expense Ratio. In its review of each class's total expense ratio, the Board considered the fund's management fee as well as other fund or class expenses, as applicable, such as transfer agent fees, pricing and bookkeeping fees, fund-paid 12b-1 fees, and custodial, legal, and audit fees. The Board also noted the effects of any waivers and reimbursements on fees and expenses. As part of its review, the Board also considered the current and historical total expense ratios of each class of the fund compared to competitive fund median expenses. Each class of the fund is compared to those funds and classes in the Total Mapped Group (used by the Board for management fee comparisons) that have a similar sales load structure.
The Board noted that the total expense ratio of each of Class A, Class B, Class C, and Institutional Class ranked below its competitive median for 2011 and the total expense ratio of Class T ranked above its competitive median for 2011. The Board considered that various factors, including 12b-1 fees, positive or negative performance adjustments, and relatively higher other expenses in the case of small fund size, can affect total expense ratios. The Board noted that the total expense ratio of Class T was above the competitive median primarily because of higher 12b-1 fees on Class T. Class T has a higher 12b-1 fee, but a lower front-end sales charge, than traditionally priced front-end sales charge classes. The Board considered that Class T is primarily sold load-waived in the retirement plan market where its 0.50% 12b-1 fee is comparable to competing no-load, higher 12b-1 fee classes designed specifically for retirement plans. The Board noted that the fund offers multiple classes, each of which has a different sales load and 12b-1 fee structure, and that the multiple structures are intended to offer a range of pricing options for the intermediary market. The Board also noted that the total expense ratios of the classes vary primarily by the level of their 12b-1 fees, although differences in transfer agent fees may also cause expenses to vary from class to class.
Fees Charged to Other Fidelity Clients. The Board also considered Fidelity fee structures and other information with respect to clients of FMR and its affiliates, such as other mutual funds advised or subadvised by FMR or its affiliates, pension plan clients, and other institutional clients. The Board noted the findings of the 2010 ad hoc joint committee (created with the board of other Fidelity funds), which reviewed and compared Fidelity's institutional investment advisory business with its business of providing services to the Fidelity funds, including the differences in services provided, fees charged, and costs incurred, as well as competition in their respective marketplaces.
Annual Report
Board Approval of Investment Advisory Contracts and
Management Fees - continued
Based on its review of total expense ratios and fees charged to other Fidelity clients, the Board concluded that the total expense ratio of each class of the fund was reasonable, although Class T was above the median of the universe presented for comparison, in light of the services that the fund and its shareholders receive and the other factors considered.
Costs of the Services and Profitability. The Board considered the revenues earned and the expenses incurred by Fidelity in conducting the business of developing, marketing, distributing, managing, administering and servicing the fund and its shareholders. The Board also considered the level of Fidelity's profits in respect of all the Fidelity funds.
On an annual basis, FMR presents to the Board Fidelity's profitability for the fund. Fidelity calculates the profitability for each fund, as well as aggregate profitability for groups of Fidelity funds and all Fidelity funds, using a series of detailed revenue and cost allocation methodologies which originate with the books and records of Fidelity on which Fidelity's audited financial statements are based. The Audit Committee of the Board reviews any significant changes from the prior year's methodologies.
PricewaterhouseCoopers LLP (PwC), independent registered public accounting firm and auditor to Fidelity and certain Fidelity funds, has been engaged annually by the Board as part of the Board's assessment of Fidelity's profitability analysis. PwC's engagement includes the review and assessment of Fidelity's methodologies used in determining the revenues and expenses attributable to Fidelity's mutual fund business, and completion of agreed-upon procedures surrounding the mathematical accuracy of fund profitability and its conformity to allocation methodologies. After considering PwC's reports issued under the engagement and information provided by Fidelity, the Board concluded that while other allocation methods may also be reasonable, Fidelity's profitability methodologies are reasonable in all material respects.
The Board also reviewed Fidelity's non-fund businesses and fall-out benefits related to the mutual fund business as well as cases where Fidelity's affiliates may benefit from or be related to the fund's business.
The Board considered the costs of the services provided by and the profits realized by Fidelity in connection with the operation of the fund and was satisfied that the profitability was not excessive in the circumstances.
Economies of Scale. The Board considered whether there have been economies of scale in respect of the management of the Fidelity funds, whether the Fidelity funds (including the fund) have appropriately benefited from any such economies of scale, and whether there is potential for realization of any further economies of scale. The Board considered the extent to which the fund will benefit from economies of scale through increased services to the fund, through waivers or reimbursements, or through fee or expense reductions. The Board also noted that in 2009, it and the board of other Fidelity funds created an ad hoc committee (the Economies of Scale Committee) to analyze whether FMR attains economies of scale in respect of the management and servicing of the Fidelity funds, whether the Fidelity funds have appropriately benefited from such economies of scale, and whether there is potential for realization of any further economies of scale.
Annual Report
The Board recognized that the fund's management contract incorporates a "group fee" structure, which provides for lower group fee rates as total fund assets under FMR's management increase, and for higher group fee rates as total fund assets under FMR's management decrease. FMR calculates the group fee rates based on a tiered asset "breakpoint" schedule that varies based on asset class. The Board considered that the group fee is designed to deliver the benefits of economies of scale to fund shareholders when total Fidelity fund assets increase, even if assets of any particular fund are unchanged or have declined, because some portion of Fidelity's costs are attributable to services provided to all Fidelity funds, and all funds benefit if those costs can be allocated among more assets. The Board concluded that, given the group fee structure, fund shareholders will benefit from lower management fees as assets under FMR's management increase at the fund complex level, regardless of whether Fidelity achieves any such economies of scale.
The Board concluded, taking into account the analysis of the Economies of Scale Committee, that economies of scale, if any, are being appropriately shared between fund shareholders and Fidelity.
Additional Information Requested by the Board. In order to develop fully the factual basis for consideration of the Fidelity funds' Advisory Contracts, the Board requested and received additional information on certain topics, including (i) fund performance trends, actions to be taken by FMR to improve certain funds' overall performance, and Fidelity's long-term strategies for certain funds; (ii) the potential to further rationalize the Fidelity fund lineup with the possibility of achieving savings for the funds and Fidelity; (iii) Fidelity's compensation structure for portfolio managers and other key investment personnel; (iv) the amount of the investment that each portfolio manager has made in the Fidelity fund(s) that he or she manages; (v) the realization of fall-out benefits in certain Fidelity business units; (vi) Fidelity's group fee structures, the potential impact of regulatory changes on such structures, and the rationale for the individual fee rates of certain funds; (vii) fund profitability methodology, including Fidelity's cost allocation methodology, and the impact of certain factors on fund profitability results; (viii) trends regarding industry use of performance fee structures and the possibility of implementing performance fee structures for additional funds; and (ix) the impact of net redemptions from the Fidelity funds.
Based on its evaluation of all of the conclusions noted above, and after considering all factors it believed relevant, the Board ultimately concluded that the advisory fee structures are fair and reasonable, and that the fund's Advisory Contracts should be renewed.
Annual Report
Investment Adviser
Fidelity Management & Research Company
Boston, MA
Investment Sub-Advisers
FMR Co., Inc.
Fidelity Management & Research
(U.K.) Inc.
Fidelity Management & Research
(Hong Kong) Limited
FIL Investments (Japan) Limited
Fidelity Management & Research
(Japan) Inc.
FIL Investment Advisors (UK) Limited
FIL Investment Advisors
General Distributor
Fidelity Distributors Corporation
Smithfield, RI
Transfer and Service Agents
Fidelity Investments Institutional Operations Company, Inc.
Boston, MA
Fidelity Service Company, Inc.
Boston, MA
Custodian
JPMorgan Chase Bank
New York, NY
(Fidelity Investment logo)(registered trademark)
FAEM-UANN-1212
1.809005.108
(Fidelity Investment logo)(registered trademark)
Fidelity Advisor®
Emerging Markets
Fund - Institutional Class
Annual Report
October 31, 2012
(Fidelity Cover Art)
Contents
Performance | (Click Here) | How the fund has done over time. |
Management's Discussion of Fund Performance | (Click Here) | The Portfolio Manager's review of fund performance and strategy. |
Shareholder Expense Example | (Click Here) | An example of shareholder expenses. |
Investment Changes | (Click Here) | A summary of major shifts in the fund's investments over the past six months. |
Investments | (Click Here) | A complete list of the fund's investments with their market values. |
Financial Statements | (Click Here) | Statements of assets and liabilities, operations, and changes in net assets, as well as financial highlights. |
Notes | (Click Here) | Notes to the financial statements. |
Report of Independent Registered Public Accounting Firm | (Click Here) | |
Trustees and Officers | (Click Here) | |
Distributions | (Click Here) | |
Board Approval of Investment Advisory Contracts and Management Fees | (Click Here) | |
To view a fund's proxy voting guidelines and proxy voting record for the 12-month period ended June 30, visit http://www.fidelity.com/proxyvotingresults or visit the Securities and Exchange Commission's (SEC) web site at http://www.sec.gov. You may also call 1-877-208-0098 to request a free copy of the proxy voting guidelines.
Standard & Poor's, S&P and S&P 500 are registered service marks of The McGraw-Hill Companies, Inc. and have been licensed for use by Fidelity Distributors Corporation.
Other third party marks appearing herein are the property of their respective owners.
All other marks appearing herein are registered or unregistered trademarks or service marks of FMR LLC or an affiliated company. © 2012 FMR LLC. All rights reserved.
Annual Report
This report and the financial statements contained herein are submitted for the general information of the shareholders of the fund. This report is not authorized for distribution to prospective investors in the fund unless preceded or accompanied by an effective prospectus.
A fund files its complete schedule of portfolio holdings with the SEC for the first and third quarters of each fiscal year on Form N-Q. Forms N-Q are available on the SEC's web site at http://www.sec.gov. A fund's Forms N-Q may be reviewed and copied at the SEC's Public Reference Room in Washington, DC. Information regarding the operation of the SEC's Public Reference Room may be obtained by calling 1-800-SEC-0330. For a complete list of a fund's portfolio holdings, view the most recent holdings listing, semiannual report, or annual report on Fidelity's web site at http://www.fidelity.com, http://www.advisor.fidelity.com, or http://www.401k.com, as applicable.
NOT FDIC INSURED • MAY LOSE VALUE • NO BANK GUARANTEE
Neither the fund nor Fidelity Distributors Corporation is a bank.
Annual Report
Average annual total return reflects the change in the value of an investment, assuming reinvestment of the class' distributions from dividend income and capital gains (the profits earned upon the sale of securities that have grown in value, if any) and assuming a constant rate of performance each year. The $10,000 table and the fund's returns do not reflect the deduction of taxes that a shareholder would pay on fund distributions or the redemption of fund shares. During periods of reimbursement by Fidelity, a fund's total return will be greater than it would be had the reimbursement not occurred. How a fund did yesterday is no guarantee of how it will do tomorrow.
Average Annual Total Returns
Periods ended October 31, 2012 | Past 1
year | Past 5
years | Life of
fundA |
Institutional Class | 1.08% | -7.43% | 9.99% |
A From March 29, 2004.
$10,000 Over Life of Fund
Let's say hypothetically that $10,000 was invested in Fidelity Advisor® Emerging Markets Fund - Institutional Class on March 29, 2004, when the fund started. The chart shows how the value of your investment would have changed, and also shows how the MSCI® Emerging Markets Index performed over the same period.
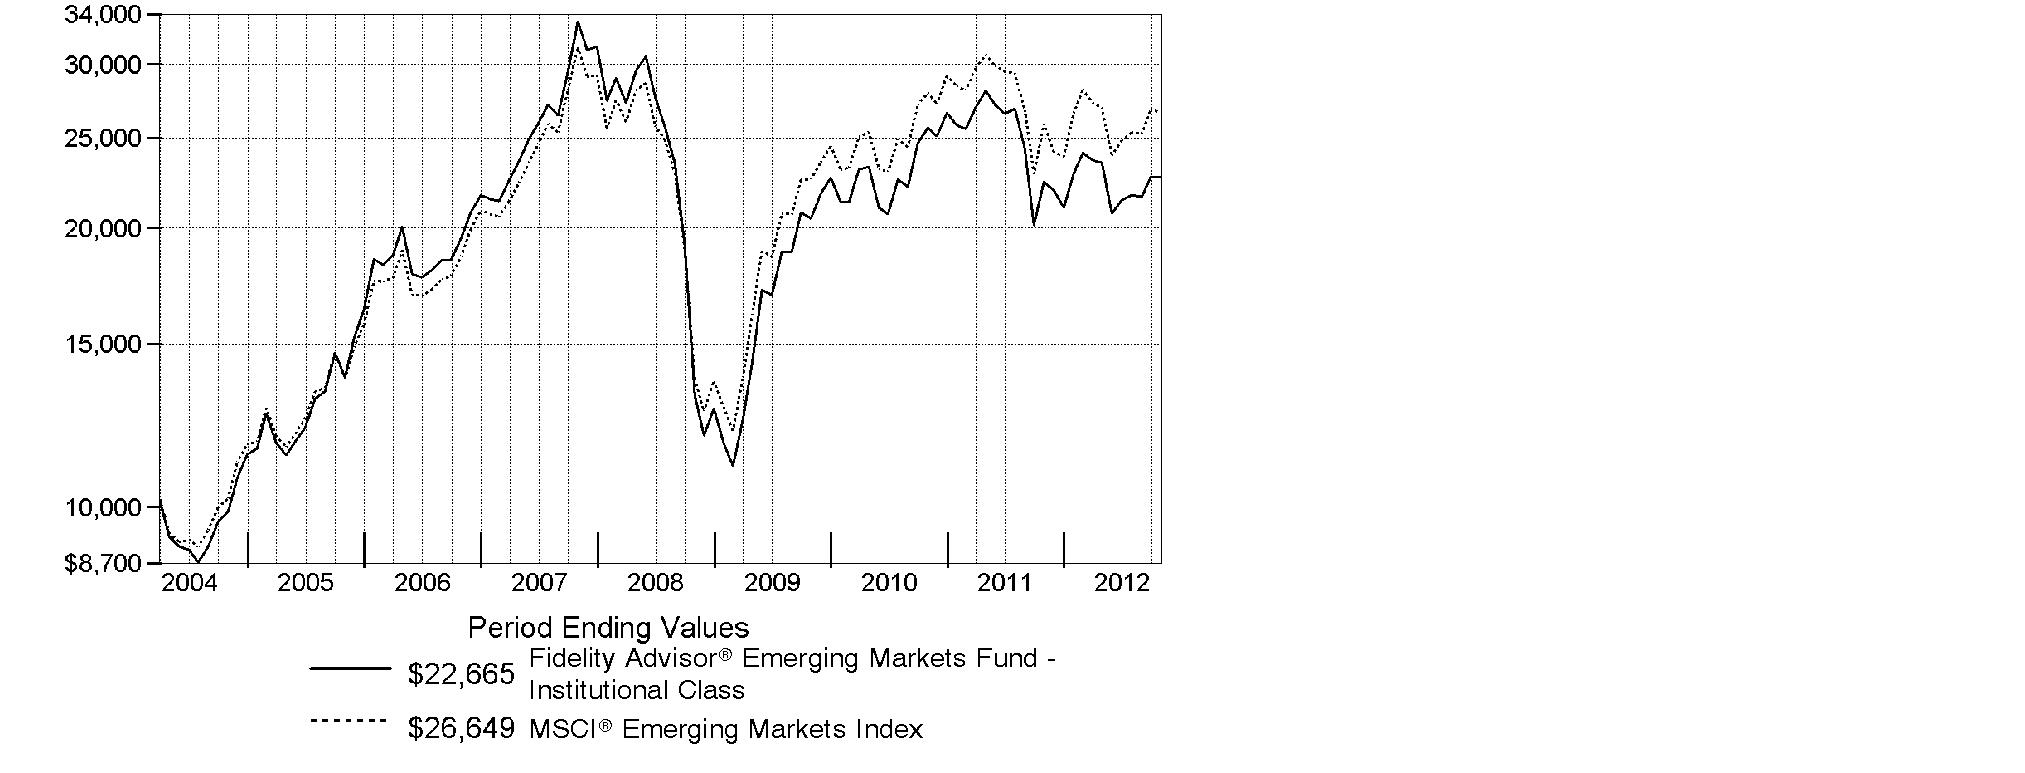
Annual Report
Market Recap: Emerging-markets stocks gained 2.98% for the year ending October 31, 2012, as measured by the MSCI® Emerging Markets Index. After some early choppiness, the index rallied strongly in the first two months of 2012 but retreated from March through May amid renewed concerns about Europe's sovereign debt crisis and continued economic sluggishness in key countries such as China and Brazil. A general uptrend in the final five months of the period lifted the index into positive territory for the full year, despite the head wind of a generally stronger U.S. dollar. Major benchmark component Brazil was a drag on performance, falling roughly 13%. The nation's inflation rate crept higher while economic growth ebbed, creating an unfavorable backdrop for stocks here. India's market retreated about 5%, while Russia gave up 4%. Conversely, Hong Kong advanced approximately 17%, aided by rebounding shares of property developers, while South Africa added 7%, China rose roughly 5% and South Korea and Taiwan gained about 4% and 1%, respectively. Sentiment about Chinese stocks improved following the government's September approval of massive outlays for infrastructure projects, in hopes of halting that nation's economic slowdown. However, China's ongoing transition to new Communist Party leadership created uncertainty that kept some investors on the sidelines.
Comments from Robert von Rekowsky, Portfolio Manager of Fidelity Advisor® Emerging Markets Fund for most of the period covered by this report: For the year, the fund's Institutional Class shares returned 1.08%, lagging the MSCI index. Relative performance was hurt the most by out-of-benchmark exposure to emerging-markets stocks listed in the United States, the United Kingdom and Canada, along with my picks in Taiwan and Hong Kong. Important individual detractors included OGX Petroleo e Gas Participacoes, a Brazilian producer of crude oil and natural gas. Given the company's significant downward revisions in its production and earnings targets, I sold the stock. Similar comments apply to an out-of-index position in Canadian gold-mining stock Eldorado Gold, which I also sold. Further weighing on our results was a non-index stake in China-based Yantai Changyu Pioneer Wine and underweighting the strong-performing shares of Taiwan Semiconductor Manufacturing. Conversely, stock selection in Indonesia helped. An out-of-benchmark stake in Indonesian cellular tower operator Tower Bersama Infrastructure paid off, as did underweighting Brazilian iron ore and nickel producer Vale and a sizable overweighting in Chinese automaker Great Wall Motor, which outperformed.
Note to shareholders: On October 1, 2012, Sammy Simnegar became Portfolio Manager of the fund.
The views expressed above reflect those of the portfolio manager(s) only through the end of the period as stated on the cover of this report and do not necessarily represent the views of Fidelity or any other person in the Fidelity organization. Any such views are subject to change at any time based upon market or other conditions and Fidelity disclaims any responsibility to update such views. These views may not be relied on as investment advice and, because investment decisions for a Fidelity fund are based on numerous factors, may not be relied on as an indication of trading intent on behalf of any Fidelity fund.
Annual Report
Shareholder Expense Example
As a shareholder of the Fund, you incur two types of costs: (1) transaction costs, including sales charges (loads) on purchase payments or redemption proceeds, redemption fees and (2) ongoing costs, including management fees, distribution and/or service (12b-1) fees and other Fund expenses. This Example is intended to help you understand your ongoing costs (in dollars) of investing in the Fund and to compare these costs with the ongoing costs of investing in other mutual funds.
The Example is based on an investment of $1,000 invested at the beginning of the period and held for the entire period (May 1, 2012 to October 31, 2012).
Actual Expenses
The first line of the accompanying table for each class of the Fund provides information about actual account values and actual expenses. You may use the information in this line, together with the amount you invested, to estimate the expenses that you paid over the period. Simply divide your account value by $1,000.00 (for example, an $8,600 account value divided by $1,000.00 = 8.6), then multiply the result by the number in the first line for a class of the Fund under the heading entitled "Expenses Paid During Period" to estimate the expenses you paid on your account during this period. In addition, the Fund, as a shareholder in the underlying Fidelity Central Funds, will indirectly bear its pro-rata share of the fees and expenses incurred by the underlying Fidelity Central Funds. These fees and expenses are not included in the Fund's annualized expense ratio used to calculate the expense estimate in the table below.
Hypothetical Example for Comparison Purposes
The second line of the accompanying table for each class of the Fund provides information about hypothetical account values and hypothetical expenses based on a Class' actual expense ratio and an assumed rate of return of 5% per year before expenses, which is not the Class' actual return. The hypothetical account values and expenses may not be used to estimate the actual ending account balance or expenses you paid for the period. You may use this information to compare the ongoing costs of investing in the Fund and other funds. To do so, compare this 5% hypothetical example with the 5% hypothetical examples that appear in the shareholder reports of the other funds. In addition, the Fund, as a shareholder in the underlying Fidelity Central Funds, will indirectly bear its pro-rata share of the fees and expenses incurred by the underlying Fidelity Central Funds. These fees and expenses are not included in the Fund's annualized expense ratio used to calculate the expense estimate in the table below.
Please note that the expenses shown in the table are meant to highlight your ongoing costs only and do not reflect any transaction costs. Therefore, the second line of the table is useful in comparing ongoing costs only, and will not help you determine the relative total costs of owning different funds. In addition, if these transactional costs were included, your costs would have been higher.
Annual Report
| Annualized
Expense Ratio | Beginning
Account Value
May 1, 2012 | Ending
Account Value
October 31, 2012 | Expenses Paid
During Period*
May 1, 2012
to October 31, 2012 |
Class A | 1.51% | | | |
Actual | | $ 1,000.00 | $ 963.40 | $ 7.45 |
HypotheticalA | | $ 1,000.00 | $ 1,017.55 | $ 7.66 |
Class T | 1.77% | | | |
Actual | | $ 1,000.00 | $ 962.30 | $ 8.73 |
HypotheticalA | | $ 1,000.00 | $ 1,016.24 | $ 8.97 |
Class B | 2.26% | | | |
Actual | | $ 1,000.00 | $ 959.80 | $ 11.13 |
HypotheticalA | | $ 1,000.00 | $ 1,013.77 | $ 11.44 |
Class C | 2.26% | | | |
Actual | | $ 1,000.00 | $ 959.70 | $ 11.13 |
HypotheticalA | | $ 1,000.00 | $ 1,013.77 | $ 11.44 |
Institutional Class | 1.19% | | | |
Actual | | $ 1,000.00 | $ 964.90 | $ 5.88 |
HypotheticalA | | $ 1,000.00 | $ 1,019.15 | $ 6.04 |
A 5% return per year before expenses
* Expenses are equal to each Class' annualized expense ratio, multiplied by the average account value over the period, multiplied by 184/366 (to reflect the one-half year period).
Annual Report
Investment Changes (Unaudited)
Top Five Stocks as of October 31, 2012 |
| % of fund's
net assets | % of fund's net assets
6 months ago |
Samsung Electronics Co. Ltd. (Korea (South), Semiconductors & Semiconductor Equipment) | 4.4 | 5.1 |
iShares MSCI Emerging Markets Index ETF (United States of America, Investment Companies) | 1.9 | 0.0 |
Vale SA (PN-A) (Brazil, Metals & Mining) | 1.7 | 0.9 |
Hyundai Motor Co. (Korea (South), Automobiles) | 1.6 | 2.0 |
Sberbank (Savings Bank of the Russian Federation) (Russia, Commercial Banks) | 1.6 | 1.5 |
| 11.2 | |
Top Five Market Sectors as of October 31, 2012 |
| % of fund's
net assets | % of fund's net assets
6 months ago |
Financials | 22.3 | 20.3 |
Consumer Discretionary | 18.0 | 12.4 |
Information Technology | 13.5 | 14.7 |
Consumer Staples | 11.0 | 9.7 |
Materials | 10.3 | 9.8 |
Top Five Countries as of October 31, 2012 |
(excluding cash equivalents) | % of fund's
net assets | % of fund's net assets
6 months ago |
Korea (South) | 13.4 | 20.5 |
Brazil | 12.1 | 10.9 |
India | 7.8 | 4.3 |
Indonesia | 7.2 | 6.9 |
Cayman Islands | 5.8 | 5.8 |
Percentages are adjusted for the effect of open futures contracts, if applicable. |
Asset Allocation (% of fund's net assets) |
As of October 31, 2012 | As of April 30, 2012 |
| Stocks and Investment Companies 98.5% | | | Stocks 98.9% | |
| Bonds 0.0% | | | Bonds 0.1% | |
| Short-Term
Investments and
Net Other Assets
(Liabilities) 1.5% | | | Short-Term
Investments and
Net Other Assets
(Liabilities) 1.0% | |

Annual Report
Investments October 31, 2012
Showing Percentage of Net Assets
Common Stocks - 96.3% |
| Shares | | Value |
Australia - 0.3% |
Iluka Resources Ltd. | 132,607 | | $ 1,365,515 |
Bailiwick of Jersey - 0.2% |
Randgold Resources Ltd. sponsored ADR | 8,150 | | 974,659 |
Bermuda - 1.8% |
Brilliance China Automotive Holdings Ltd. (a) | 1,220,000 | | 1,523,810 |
Credicorp Ltd. (NY Shares) | 37,250 | | 4,817,915 |
Digital China Holdings Ltd. (H Shares) | 612,000 | | 1,029,733 |
Great Eagle Holdings Ltd. | 196,000 | | 581,674 |
Jardine Matheson Holdings Ltd. | 1,600 | | 98,560 |
TOTAL BERMUDA | | 8,051,692 |
Brazil - 12.1% |
BR Malls Participacoes SA | 214,700 | | 2,822,427 |
Brasil Foods SA | 89,300 | | 1,624,596 |
CCR SA | 296,700 | | 2,609,026 |
Cetip SA - Mercados Organizado | 126,502 | | 1,457,447 |
Cielo SA | 124,900 | | 3,090,138 |
Companhia Brasileira de Distribuicao Grupo Pao de Acucar sponsored ADR (d) | 48,151 | | 2,250,578 |
Companhia de Bebidas das Americas (AmBev) (PN) sponsored ADR | 155,376 | | 6,337,787 |
Companhia de Saneamento Basico do Estado de Sao Paulo (SABESP) | 36,100 | | 1,528,213 |
Companhia de Saneamento de Minas Gerais | 76,100 | | 1,796,231 |
Gerdau SA sponsored ADR | 255,671 | | 2,247,348 |
Itau Unibanco Holdings SA sponsored ADR | 459,800 | | 6,703,884 |
Localiza Rent A Car SA | 5,200 | | 91,145 |
Mills Estruturas e Servicos de Engenharia SA | 82,900 | | 1,271,020 |
Multiplan Empreendimentos Imobiliarios SA | 100,008 | | 2,929,754 |
Multiplus SA | 124,924 | | 2,902,520 |
Qualicorp SA (a) | 180,900 | | 1,856,161 |
Souza Cruz SA | 4,300 | | 56,104 |
Totvs SA | 36,247 | | 737,058 |
Ultrapar Participacoes SA | 151,800 | | 3,183,910 |
Usinas Siderurgicas de Minas Gerais SA - Usiminas (PN-A) (non-vtg.) | 221,216 | | 1,068,476 |
Vale SA (PN-A) | 418,900 | | 7,497,115 |
TOTAL BRAZIL | | 54,060,938 |
British Virgin Islands - 1.1% |
Arcos Dorados Holdings, Inc. | 169,602 | | 2,189,562 |
Common Stocks - continued |
| Shares | | Value |
British Virgin Islands - continued |
Gem Diamonds Ltd. (a) | 120,445 | | $ 327,996 |
Mail.ru Group Ltd. GDR (e) | 71,200 | | 2,374,520 |
TOTAL BRITISH VIRGIN ISLANDS | | 4,892,078 |
Canada - 0.4% |
Africa Oil Corp. (a) | 4,541 | | 45,103 |
First Quantum Minerals Ltd. | 68,600 | | 1,541,997 |
Ivanplats Ltd. Class A (f) | 84,516 | | 353,381 |
TOTAL CANADA | | 1,940,481 |
Cayman Islands - 5.8% |
Anta Sports Products Ltd. | 705,000 | | 600,383 |
Baidu.com, Inc. sponsored ADR (a) | 20,500 | | 2,185,710 |
Belle International Holdings Ltd. | 637,000 | | 1,186,867 |
Chailease Holding Co. Ltd. | 442,000 | | 786,854 |
Changyou.com Ltd. (A Shares) ADR (d) | 34,032 | | 845,695 |
Country Garden Holdings Co. Ltd. | 228,012 | | 91,498 |
ENN Energy Holdings Ltd. | 38,000 | | 158,128 |
Eurasia Drilling Co. Ltd. GDR (Reg. S) | 74,563 | | 2,579,880 |
Golden Eagle Retail Group Ltd. (H Shares) | 466,000 | | 1,022,187 |
Hengan International Group Co. Ltd. | 293,500 | | 2,673,673 |
Hengdeli Holdings Ltd. | 7,136,000 | | 2,246,675 |
Intime Department Store Group Co. Ltd. | 459,500 | | 544,282 |
KWG Property Holding Ltd. | 613,000 | | 365,425 |
MStar Semiconductor, Inc. | 33,000 | | 279,613 |
NetEase.com, Inc. sponsored ADR (a)(d) | 24,400 | | 1,317,600 |
Sands China Ltd. | 136,000 | | 511,532 |
SINA Corp. (a) | 17,000 | | 928,710 |
Tencent Holdings Ltd. | 200,700 | | 7,095,670 |
Vinda International Holdings Ltd. | 483,000 | | 674,326 |
TOTAL CAYMAN ISLANDS | | 26,094,708 |
Chile - 0.7% |
CAP SA | 34,629 | | 1,193,788 |
Sociedad Quimica y Minera de Chile SA (PN-B) sponsored ADR (d) | 30,700 | | 1,775,995 |
TOTAL CHILE | | 2,969,783 |
China - 3.2% |
Air China Ltd. (H Shares) | 1,014,000 | | 719,608 |
China Communications Construction Co. Ltd. (H Shares) | 1,480,000 | | 1,388,327 |
China Communications Services Corp. Ltd. (H Shares) | 3,200,000 | | 1,804,375 |
China Minsheng Banking Corp. Ltd. (H Shares) | 2,518,000 | | 2,290,553 |
Common Stocks - continued |
| Shares | | Value |
China - continued |
China Railway Construction Corp. Ltd. (H Shares) | 723,500 | | $ 718,828 |
China Shenhua Energy Co. Ltd. (H Shares) | 133,000 | | 566,319 |
Dongfeng Motor Group Co. Ltd. (H Shares) | 712,000 | | 881,956 |
Great Wall Motor Co. Ltd. (H Shares) | 1,345,000 | | 3,696,557 |
Huadian Power International Corp. Ltd. (H Shares) (a) | 1,978,000 | | 502,792 |
Tsingtao Brewery Co. Ltd. (H Shares) | 12,000 | | 64,877 |
Yantai Changyu Pioneer Wine Co. (B Shares) | 296,321 | | 1,502,242 |
TOTAL CHINA | | 14,136,434 |
Colombia - 1.5% |
Almacenes Exito SA | 118,316 | | 2,255,528 |
BanColombia SA sponsored ADR | 27,635 | | 1,769,193 |
Ecopetrol SA ADR (d) | 47,075 | | 2,787,311 |
TOTAL COLOMBIA | | 6,812,032 |
Czech Republic - 0.2% |
Philip Morris CR A/S | 1,697 | | 909,217 |
Finland - 0.6% |
Kone Oyj (B Shares) (d) | 3,300 | | 236,321 |
Nokian Tyres PLC | 57,500 | | 2,384,916 |
TOTAL FINLAND | | 2,621,237 |
France - 0.5% |
LVMH Moet Hennessy - Louis Vuitton SA | 14,555 | | 2,365,729 |
Hong Kong - 2.7% |
AIA Group Ltd. | 20,200 | | 80,018 |
China Mobile Ltd. | 76,500 | | 848,519 |
CNOOC Ltd. | 3,231,000 | | 6,649,323 |
Dah Chong Hong Holdings Ltd. | 1,312,000 | | 1,237,504 |
Galaxy Entertainment Group Ltd. (a) | 257,000 | | 883,743 |
Guangdong Investment Ltd. | 1,608,000 | | 1,315,439 |
Shenzhen Investment Ltd. | 1,058,000 | | 281,221 |
Singamas Container Holdings Ltd. | 2,222,000 | | 561,947 |
TOTAL HONG KONG | | 11,857,714 |
India - 7.8% |
Axis Bank Ltd. | 84,973 | | 1,867,653 |
Bajaj Auto Ltd. | 51,655 | | 1,743,866 |
Bharat Heavy Electricals Ltd. | 291,383 | | 1,217,413 |
GlaxoSmithKline Pharmaceuticals Ltd. | 8,424 | | 313,914 |
HDFC Bank Ltd. | 165,304 | | 1,940,996 |
Hindustan Unilever Ltd. | 341,491 | | 3,469,175 |
Common Stocks - continued |
| Shares | | Value |
India - continued |
Housing Development Finance Corp. Ltd. | 171,833 | | $ 2,434,660 |
ICICI Bank Ltd. | 195,871 | | 3,811,187 |
ITC Ltd. | 141,436 | | 742,733 |
Jaypee Infratech Ltd. | 465,878 | | 413,450 |
Larsen & Toubro Ltd. | 69,363 | | 2,097,262 |
Mahindra & Mahindra Financial Services Ltd. | 127,846 | | 2,059,246 |
Tata Consultancy Services Ltd. | 135,749 | | 3,318,982 |
Tata Motors Ltd. | 669,790 | | 3,185,055 |
Tata Steel Ltd. | 265,598 | | 1,936,020 |
Tech Mahindra Ltd. (a) | 39,361 | | 693,838 |
Titan Industries Ltd. | 259,455 | | 1,250,380 |
Ultratech Cemco Ltd. | 68,604 | | 2,545,252 |
TOTAL INDIA | | 35,041,082 |
Indonesia - 7.2% |
PT AKR Corporindo Tbk | 156,500 | | 72,506 |
PT Astra International Tbk | 5,616,000 | | 4,706,779 |
PT Bank Central Asia Tbk | 93,000 | | 79,396 |
PT Bank Mandiri (Persero) Tbk | 4,429,000 | | 3,804,174 |
PT Bank Rakyat Indonesia Tbk | 5,943,500 | | 4,579,044 |
PT Bank Tabungan Negara Tbk | 27,500 | | 4,352 |
PT Bumi Serpong Damai Tbk | 9,802,600 | | 1,265,505 |
PT Ciputra Development Tbk | 523,000 | | 37,026 |
PT Gadjah Tunggal Tbk | 1,131,000 | | 256,108 |
PT Global Mediacom Tbk | 8,869,500 | | 2,100,784 |
PT Indocement Tunggal Prakarsa Tbk | 1,327,000 | | 2,956,552 |
PT Indofood Sukses Makmur Tbk | 1,038,500 | | 773,060 |
PT Jasa Marga Tbk | 1,544,500 | | 932,646 |
PT Media Nusantara Citra Tbk | 547,500 | | 161,029 |
PT Mitra Adiperkasa Tbk | 3,145,000 | | 2,144,681 |
PT Pembangunan Perumahan Persero Tbk | 2,558,000 | | 205,065 |
PT Resource Alam Indonesia Tbk | 1,307,500 | | 387,960 |
PT Semen Gresik (Persero) Tbk | 1,457,500 | | 2,260,974 |
PT Summarecon Agung Tbk | 233,500 | | 42,543 |
PT Telkomunikasi Indonesia Tbk Series B | 898,500 | | 912,566 |
PT Tower Bersama Infrastructure Tbk (a) | 5,952,500 | | 3,098,633 |
PT United Tractors Tbk | 643,500 | | 1,413,617 |
PT Wijaya Karya Persero Tbk | 1,249,000 | | 178,149 |
TOTAL INDONESIA | | 32,373,149 |
Ireland - 0.3% |
Dragon Oil PLC | 138,794 | | 1,243,082 |
Common Stocks - continued |
| Shares | | Value |
Israel - 1.0% |
Check Point Software Technologies Ltd. (a) | 53,800 | | $ 2,395,714 |
Israel Chemicals Ltd. | 170,200 | | 2,129,883 |
TOTAL ISRAEL | | 4,525,597 |
Italy - 0.4% |
Prada SpA | 230,500 | | 1,879,678 |
Japan - 0.0% |
Fanuc Corp. | 600 | | 95,528 |
Korea (South) - 13.4% |
Cheil Worldwide, Inc. | 4,100 | | 78,968 |
CJ Corp. | 3,978 | | 388,562 |
Cosmax, Inc. | 1,030 | | 45,959 |
DGB Financial Group Co. Ltd. | 63,170 | | 799,532 |
Dongbu Insurance Co. Ltd. | 42,452 | | 1,925,354 |
Grand Korea Leisure Co. Ltd. | 6,840 | | 192,593 |
Hana Financial Group, Inc. | 25,630 | | 746,343 |
Honam Petrochemical Corp. | 2,069 | | 423,167 |
Hotel Shilla Co. | 50,202 | | 2,117,995 |
Hyundai Glovis Co. Ltd. | 1,380 | | 287,310 |
Hyundai Heavy Industries Co. Ltd. | 14,092 | | 2,959,744 |
Hyundai Hysco Co. Ltd. | 61,940 | | 2,476,873 |
Hyundai Mobis | 7,129 | | 1,817,689 |
Hyundai Motor Co. | 35,154 | | 7,238,309 |
Hyundai Wia Corp. | 4,046 | | 654,963 |
Industrial Bank of Korea | 102,590 | | 1,129,100 |
Interflex Co. Ltd. | 737 | | 42,044 |
Kia Motors Corp. | 83,109 | | 4,619,200 |
Korea Zinc Co. Ltd. | 679 | | 278,993 |
KT Corp. | 1,960 | | 66,552 |
KT&G Corp. | 41,016 | | 3,126,082 |
LG Chemical Ltd. | 13,292 | | 3,730,421 |
LG Corp. | 12,052 | | 736,172 |
Lotte Samkang Co. Ltd. | 2,450 | | 1,642,591 |
NHN Corp. | 349 | | 80,823 |
Samsung C&T Corp. | 13,146 | | 714,981 |
Samsung Electronics Co. Ltd. | 16,312 | | 19,598,571 |
Samsung Heavy Industries Ltd. | 11,960 | | 365,825 |
Silicon Works Co. Ltd. | 13,935 | | 357,219 |
SK Energy Co. Ltd. | 473 | | 69,628 |
Common Stocks - continued |
| Shares | | Value |
Korea (South) - continued |
Sung Kwang Bend Co. Ltd. | 37,451 | | $ 906,804 |
TK Corp. (a) | 14,543 | | 368,804 |
TOTAL KOREA (SOUTH) | | 59,987,171 |
Luxembourg - 0.5% |
L'Occitane Ltd. | 644,750 | | 2,009,111 |
Malaysia - 0.3% |
Bumiputra-Commerce Holdings Bhd | 30,400 | | 76,150 |
Malayan Banking Bhd | 423,000 | | 1,254,002 |
TOTAL MALAYSIA | | 1,330,152 |
Mexico - 3.1% |
CEMEX SA de CV sponsored ADR | 280,203 | | 2,533,035 |
Coca-Cola FEMSA SAB de CV Series L | 51,300 | | 657,529 |
Fomento Economico Mexicano SAB de CV unit | 239,000 | | 2,152,351 |
Grupo Financiero Banorte SAB de CV Series O | 615,800 | | 3,421,372 |
Grupo Mexico SA de CV Series B | 455,900 | | 1,460,941 |
Grupo Televisa SA de CV | 814,500 | | 3,702,386 |
TOTAL MEXICO | | 13,927,614 |
Netherlands - 0.6% |
ASML Holding NV (Netherlands) | 12,400 | | 681,656 |
Yandex NV (a) | 84,000 | | 1,955,520 |
TOTAL NETHERLANDS | | 2,637,176 |
Nigeria - 0.6% |
Guaranty Trust Bank PLC GDR (Reg. S) | 465,259 | | 2,884,606 |
Panama - 0.9% |
Banco Latinoamericano de Exporaciones SA (BLADEX) Series E | 53,100 | | 1,194,750 |
Copa Holdings SA Class A | 28,228 | | 2,620,123 |
TOTAL PANAMA | | 3,814,873 |
Philippines - 2.6% |
Alliance Global Group, Inc. | 2,777,400 | | 1,005,540 |
Ayala Corp. | 74,860 | | 806,885 |
International Container Terminal Services, Inc. | 1,304,700 | | 2,253,861 |
Manila Water Co., Inc. | 320,200 | | 225,932 |
Metropolitan Bank & Trust Co. | 434,280 | | 1,003,810 |
Philippine National Bank (a) | 342,750 | | 600,438 |
PUREGOLD Price Club, Inc. | 966,700 | | 704,444 |
Security Bank Corp. | 681,320 | | 2,683,837 |
Common Stocks - continued |
| Shares | | Value |
Philippines - continued |
SM Investments Corp. | 53,800 | | $ 1,051,129 |
SM Prime Holdings, Inc. | 3,666,400 | | 1,293,499 |
TOTAL PHILIPPINES | | 11,629,375 |
Poland - 0.5% |
Bank Polska Kasa Opieki SA | 50,400 | | 2,420,034 |
Russia - 3.8% |
M Video OJSC (a) | 71,100 | | 559,452 |
Magnit OJSC GDR (Reg. S) | 2,600 | | 92,300 |
Mechel Steel Group OAO sponsored ADR | 21,596 | | 137,135 |
Mobile TeleSystems OJSC sponsored ADR | 67,079 | | 1,149,734 |
NOVATEK OAO GDR (Reg. S) | 30,898 | | 3,522,372 |
Raspadskaya OAO (a) | 130,700 | | 257,729 |
Sberbank (Savings Bank of the Russian Federation) | 2,447,000 | | 7,163,397 |
Tatneft OAO sponsored ADR | 26,800 | | 1,038,232 |
TNK-BP Holding | 37,100 | | 75,736 |
Uralkali OJSC GDR (Reg. S) | 71,400 | | 2,797,452 |
TOTAL RUSSIA | | 16,793,539 |
Singapore - 0.4% |
Keppel Corp. Ltd. | 201,000 | | 1,756,567 |
South Africa - 5.6% |
African Bank Investments Ltd. | 760,647 | | 2,572,145 |
AVI Ltd. | 273,957 | | 1,806,654 |
Bidvest Group Ltd. | 60,500 | | 1,444,007 |
FirstRand Ltd. | 703,000 | | 2,333,428 |
Foschini Ltd. | 48,124 | | 698,717 |
Imperial Holdings Ltd. | 144,536 | | 3,283,572 |
Life Healthcare Group Holdings Ltd. | 795,429 | | 3,008,092 |
Mr Price Group Ltd. | 175,100 | | 2,705,062 |
Nampak Ltd. | 153,200 | | 510,628 |
Naspers Ltd. Class N | 67,800 | | 4,401,665 |
Shoprite Holdings Ltd. | 72,600 | | 1,492,919 |
Tongaat Hulett Ltd. | 48,900 | | 767,001 |
TOTAL SOUTH AFRICA | | 25,023,890 |
Switzerland - 1.0% |
Compagnie Financiere Richemont SA Series A | 18,368 | | 1,191,267 |
Dufry AG (a) | 14,500 | | 1,840,331 |
Swatch Group AG (Bearer) | 3,140 | | 1,299,427 |
TOTAL SWITZERLAND | | 4,331,025 |
Common Stocks - continued |
| Shares | | Value |
Taiwan - 3.6% |
ASUSTeK Computer, Inc. | 147,000 | | $ 1,575,180 |
Chipbond Technology Corp. | 476,000 | | 806,642 |
Far EasTone Telecommunications Co. Ltd. | 571,000 | | 1,317,542 |
MediaTek, Inc. | 130,610 | | 1,450,974 |
Novatek Microelectronics Corp. | 377,000 | | 1,419,719 |
Radiant Opto-Electronics Corp. | 174,220 | | 724,674 |
Taiwan Semiconductor Manufacturing Co. Ltd. | 1,817,000 | | 5,536,981 |
Unified-President Enterprises Corp. | 1,757,010 | | 3,103,790 |
TOTAL TAIWAN | | 15,935,502 |
Thailand - 4.0% |
Advanced Info Service PCL (For. Reg.) | 541,000 | | 3,483,779 |
Asian Property Development PCL (For. Reg.) | 3,641,700 | | 1,033,022 |
Bangkok Bank Public Co. Ltd. (For. Reg.) | 311,800 | | 1,840,098 |
Bangkok Expressway PCL (For.Reg.) | 1,161,500 | | 1,050,917 |
Bumrungrad Hospital PCL (For. Reg.) | 204,300 | | 504,588 |
C.P. ALL PCL (For. Reg.) | 1,329,200 | | 1,722,716 |
Hemaraj Land & Development PCL | 2,018,100 | | 206,613 |
Home Product Center PCL (For. Reg.) | 3,271,400 | | 1,215,975 |
Kasikornbank PCL (For. Reg.) | 13,100 | | 76,883 |
PTT PCL (For. Reg.) | 186,700 | | 1,935,787 |
Siam Commercial Bank PCL (For. Reg.) | 875,400 | | 4,595,351 |
TOTAL THAILAND | | 17,665,729 |
Turkey - 3.3% |
Coca-Cola Icecek A/S | 115,050 | | 2,233,607 |
Enka Insaat ve Sanayi A/S | 388,000 | | 1,030,338 |
TAV Havalimanlari Holding A/S | 117,000 | | 580,920 |
Turk Hava Yollari AO (a) | 577,000 | | 1,335,872 |
Turkiye Garanti Bankasi A/S | 882,375 | | 4,213,741 |
Turkiye Halk Bankasi A/S | 334,000 | | 2,944,045 |
Turkiye Is Bankasi A/S Series C | 696,000 | | 2,368,536 |
Turkiye Petrol Rafinerile A/S | 5,000 | | 122,176 |
TOTAL TURKEY | | 14,829,235 |
United Arab Emirates - 0.1% |
NMC Health PLC | 197,935 | | 578,146 |
United Kingdom - 1.9% |
Afren PLC (a) | 196,400 | | 436,427 |
Aggreko PLC | 49,800 | | 1,727,842 |
Antofagasta PLC | 22,800 | | 462,494 |
British American Tobacco PLC (United Kingdom) | 9,800 | | 486,076 |
Common Stocks - continued |
| Shares | | Value |
United Kingdom - continued |
Ophir Energy PLC (a) | 155,855 | | $ 1,394,629 |
Prudential PLC | 6,766 | | 92,922 |
Standard Chartered PLC (United Kingdom) | 87,687 | | 2,070,924 |
Tullow Oil PLC | 75,700 | | 1,715,139 |
TOTAL UNITED KINGDOM | | 8,386,453 |
United States of America - 2.3% |
Colgate-Palmolive Co. | 20,750 | | 2,177,920 |
Cummins, Inc. | 16,000 | | 1,497,280 |
Freeport-McMoRan Copper & Gold, Inc. | 2,200 | | 85,536 |
Mead Johnson Nutrition Co. Class A | 31,400 | | 1,936,124 |
Philip Morris International, Inc. | 15,400 | | 1,363,824 |
Rockwood Holdings, Inc. | 16,136 | | 740,642 |
Yum! Brands, Inc. | 32,900 | | 2,306,619 |
TOTAL UNITED STATES OF AMERICA | | 10,107,945 |
TOTAL COMMON STOCKS (Cost $389,278,649) |
430,258,476
|
Nonconvertible Preferred Stocks - 0.3% |
| | | |
Russia - 0.3% |
Surgutneftegaz JSC
(Cost $1,770,114) | 2,465,300 | |
1,526,945
|
Investment Companies - 1.9% |
| | | |
United States of America - 1.9% |
iShares MSCI Emerging Markets Index ETF
(Cost $8,638,844) | 206,300 | |
8,480,993
|
Money Market Funds - 2.3% |
| Shares | | Value |
Fidelity Cash Central Fund, 0.19% (b) | 4,384,369 | | $ 4,384,369 |
Fidelity Securities Lending Cash Central Fund, 0.19% (b)(c) | 5,712,675 | | 5,712,675 |
TOTAL MONEY MARKET FUNDS (Cost $10,097,044) |
10,097,044
|
TOTAL INVESTMENT PORTFOLIO - 100.8% (Cost $409,784,651) | | 450,363,458 |
NET OTHER ASSETS (LIABILITIES) - (0.8)% | | (3,606,527) |
NET ASSETS - 100% | $ 446,756,931 |
Security Type Abbreviations |
ETF | - | Exchange-Traded Fund |
Legend |
(a) Non-income producing |
(b) Affiliated fund that is available only to investment companies and other accounts managed by Fidelity Investments. The rate quoted is the annualized seven-day yield of the fund at period end. A complete unaudited listing of the fund's holdings as of its most recent quarter end is available upon request. In addition, each Fidelity Central Fund's financial statements, which are not covered by the Fund's Report of Independent Registered Public Accounting Firm, are available on the SEC's website or upon request. |
(c) Investment made with cash collateral received from securities on loan. |
(d) Security or a portion of the security is on loan at period end. |
(e) Security exempt from registration under Rule 144A of the Securities Act of 1933. These securities may be resold in transactions exempt from registration, normally to qualified institutional buyers. At the end of the period, the value of these securities amounted to $2,374,520 or 0.5% of net assets. |
(f) Restricted securities - Investment in securities not registered under the Securities Act of 1933 (excluding 144A issues). At the end of the period, the value of restricted securities (excluding 144A issues) amounted to $353,381 or 0.1% of net assets. |
Additional information on each restricted holding is as follows: |
Security | Acquisition Date | Acquisition Cost |
Ivanplats Ltd. Class A | 10/23/12 | $ 409,319 |
Affiliated Central Funds |
Information regarding fiscal year to date income earned by the Fund from investments in Fidelity Central Funds is as follows: |
Fund | Income earned |
Fidelity Cash Central Fund | $ 7,460 |
Fidelity Securities Lending Cash Central Fund | 43,262 |
Total | $ 50,722 |
Other Information |
Categorizations in the Schedule of Investments are based on country or territory of incorporation. |
The following is a summary of the inputs used, as of October 31, 2012, involving the Fund's assets and liabilities carried at fair value. The inputs or methodology used for valuing securities may not be an indication of the risk associated with investing in those securities. For more information on valuation inputs, and their aggregation into the levels used in the tables below, please refer to the Security Valuation section in the accompanying Notes to Financial Statements. |
Valuation Inputs at Reporting Date: |
Description | Total | Level 1 | Level 2 | Level 3 |
Investments in Securities: | | | | |
Equities: | | | | |
Consumer Discretionary | $ 80,637,364 | $ 77,452,309 | $ 3,185,055 | $ - |
Consumer Staples | 48,845,783 | 48,359,707 | 486,076 | - |
Energy | 29,279,959 | 22,630,636 | 6,649,323 | - |
Financials | 100,654,462 | 94,809,357 | 5,845,105 | - |
Health Care | 6,260,901 | 6,260,901 | - | - |
Industrials | 41,305,536 | 41,305,536 | - | - |
Information Technology | 60,522,984 | 54,304,347 | 6,218,637 | - |
Materials | 46,069,997 | 45,716,616 | 353,381 | - |
Telecommunication Services | 12,681,700 | 10,854,063 | 1,827,637 | - |
Utilities | 5,526,735 | 5,526,735 | - | - |
Investment Companies | 8,480,993 | 8,480,993 | - | - |
Money Market Funds | 10,097,044 | 10,097,044 | - | - |
Total Investments in Securities: | $ 450,363,458 | $ 425,798,244 | $ 24,565,214 | $ - |
The following is a summary of transfers between Level 1 and Level 2 for the period ended October 31, 2012. Transfers are assumed to have occurred at the beginning of the period, and are primarily attributable to the valuation techniques used for foreign equity securities, as discussed in the accompanying Notes to Financial Statements: |
Transfers | Total |
Level 1 to Level 2 | $ 0 |
Level 2 to Level 1 | $ 139,799,616 |
See accompanying notes which are an integral part of the financial statements.
Annual Report
Statement of Assets and Liabilities
| October 31, 2012 |
| | |
Assets | | |
Investment in securities, at value (including securities loaned of $5,388,473) - See accompanying schedule: Unaffiliated issuers (cost $399,687,607) | $ 440,266,414 | |
Fidelity Central Funds (cost $10,097,044) | 10,097,044 | |
Total Investments (cost $409,784,651) | | $ 450,363,458 |
Foreign currency held at value (cost $2,052,273) | | 2,055,362 |
Receivable for investments sold | | 13,824,327 |
Receivable for fund shares sold | | 585,819 |
Dividends receivable | | 788,052 |
Distributions receivable from Fidelity Central Funds | | 3,720 |
Other receivables | | 117,995 |
Total assets | | 467,738,733 |
| | |
Liabilities | | |
Payable for investments purchased | $ 13,391,194 | |
Payable for fund shares redeemed | 1,191,647 | |
Accrued management fee | 303,353 | |
Distribution and service plan fees payable | 127,529 | |
Other affiliated payables | 123,639 | |
Other payables and accrued expenses | 131,765 | |
Collateral on securities loaned, at value | 5,712,675 | |
Total liabilities | | 20,981,802 |
| | |
Net Assets | | $ 446,756,931 |
Net Assets consist of: | | |
Paid in capital | | $ 496,573,932 |
Undistributed net investment income | | 3,650,889 |
Accumulated undistributed net realized gain (loss) on investments and foreign currency transactions | | (94,029,988) |
Net unrealized appreciation (depreciation) on investments and assets and liabilities in foreign currencies | | 40,562,098 |
Net Assets | | $ 446,756,931 |
See accompanying notes which are an integral part of the financial statements.
Annual Report
Statement of Assets and Liabilities - continued
| October 31, 2012 |
| | |
Calculation of Maximum Offering Price
Class A: Net Asset Value and redemption price per share ($160,464,051 ÷ 7,823,731 shares) | | $ 20.51 |
| | |
Maximum offering price per share (100/94.25 of $20.51) | | $ 21.76 |
Class T:
Net Asset Value and redemption price per share ($58,918,896 ÷ 2,882,427 shares) | | $ 20.44 |
| | |
Maximum offering price per share (100/96.50 of $20.44) | | $ 21.18 |
Class B:
Net Asset Value and offering price per share ($15,994,337 ÷ 798,410 shares)A | | $ 20.03 |
| | |
Class C:
Net Asset Value and offering price per share ($65,598,078 ÷ 3,279,478 shares)A | | $ 20.00 |
| | |
Institutional Class:
Net Asset Value, offering price and redemption price per share ($145,781,569 ÷ 7,071,858 shares) | | $ 20.61 |
A Redemption price per share is equal to net asset value less any applicable contingent deferred sales charge.
See accompanying notes which are an integral part of the financial statements.
Annual Report
Financial Statements - continued
Statement of Operations
| Year ended October 31, 2012 |
| | |
Investment Income | | |
Dividends | | $ 13,641,617 |
Interest | | 15,720 |
Income from Fidelity Central Funds | | 50,722 |
Income before foreign taxes withheld | | 13,708,059 |
Less foreign taxes withheld | | (1,382,128) |
Total income | | 12,325,931 |
| | |
Expenses | | |
Management fee | $ 3,917,194 | |
Transfer agent fees | 1,353,640 | |
Distribution and service plan fees | 1,686,210 | |
Accounting and security lending fees | 252,997 | |
Custodian fees and expenses | 447,931 | |
Independent trustees' compensation | 3,218 | |
Registration fees | 78,584 | |
Audit | 77,247 | |
Legal | 1,862 | |
Miscellaneous | 5,916 | |
Total expenses before reductions | 7,824,799 | |
Expense reductions | (300,874) | 7,523,925 |
Net investment income (loss) | | 4,802,006 |
Realized and Unrealized Gain (Loss) Net realized gain (loss) on: | | |
Investment securities: | | |
Unaffiliated issuers | (15,547,306) | |
Foreign currency transactions | (677,809) | |
Total net realized gain (loss) | | (16,225,115) |
Change in net unrealized appreciation (depreciation) on: Investment securities | 13,461,681 | |
Assets and liabilities in foreign currencies | 45,412 | |
Total change in net unrealized appreciation (depreciation) | | 13,507,093 |
Net gain (loss) | | (2,718,022) |
Net increase (decrease) in net assets resulting from operations | | $ 2,083,984 |
See accompanying notes which are an integral part of the financial statements.
Annual Report
Statement of Changes in Net Assets
| Year ended
October 31,
2012 | Year ended
October 31,
2011 |
Increase (Decrease) in Net Assets | | |
Operations | | |
Net investment income (loss) | $ 4,802,006 | $ 5,371,636 |
Net realized gain (loss) | (16,225,115) | 51,309,170 |
Change in net unrealized appreciation (depreciation) | 13,507,093 | (134,170,344) |
Net increase (decrease) in net assets resulting
from operations | 2,083,984 | (77,489,538) |
Distributions to shareholders from net investment income | (3,344,878) | (3,137,543) |
Distributions to shareholders from net realized gain | - | (3,336,770) |
Total distributions | (3,344,878) | (6,474,313) |
Share transactions - net increase (decrease) | (68,179,764) | (114,129,705) |
Redemption fees | 103,376 | 141,338 |
Total increase (decrease) in net assets | (69,337,282) | (197,952,218) |
| | |
Net Assets | | |
Beginning of period | 516,094,213 | 714,046,431 |
End of period (including undistributed net investment income of $3,650,889 and undistributed net investment income of $2,180,940, respectively) | $ 446,756,931 | $ 516,094,213 |
See accompanying notes which are an integral part of the financial statements.
Annual Report
Financial Highlights - Class A
Years ended October 31, | 2012 | 2011 | 2010 | 2009 | 2008 |
Selected Per-Share Data | | | | | |
Net asset value, beginning of period | $ 20.50 | $ 23.71 | $ 19.20 | $ 12.59 | $ 32.75 |
Income from Investment Operations | | | | | |
Net investment income (loss) C | .22 | .21 | .12 | .10 | .24 |
Net realized and unrealized gain (loss) | (.06) | (3.19) | 4.59 | 6.64 | (19.61) |
Total from investment operations | .16 | (2.98) | 4.71 | 6.74 | (19.37) |
Distributions from net investment income | (.15) | (.11) | (.07) | (.14) | (.02) |
Distributions from net realized gain | - | (.13) | (.13) | - | (.79) |
Total distributions | (.15) | (.24) | (.20) | (.14) | (.81) |
Redemption fees added to paid in capital C | - G | .01 | - G | .01 | .02 |
Net asset value, end of period | $ 20.51 | $ 20.50 | $ 23.71 | $ 19.20 | $ 12.59 |
Total Return A, B | .80% | (12.69)% | 24.69% | 54.54% | (60.55)% |
Ratios to Average Net Assets D, F | | | | | |
Expenses before reductions | 1.54% | 1.54% | 1.56% | 1.60% | 1.59% |
Expenses net of fee waivers, if any | 1.54% | 1.54% | 1.56% | 1.60% | 1.59% |
Expenses net of all reductions | 1.48% | 1.47% | 1.50% | 1.53% | 1.53% |
Net investment income (loss) | 1.07% | .92% | .59% | .70% | .94% |
Supplemental Data | | | | | |
Net assets, end of period (000 omitted) | $ 160,464 | $ 202,477 | $ 286,970 | $ 216,187 | $ 122,911 |
Portfolio turnover rate E | 177% | 122% | 86% | 85% | 61% |
A Total returns would have been lower if certain expenses had not been reduced during the applicable periods shown.
B Total returns do not include the effect of the sales charges.
C Calculated based on average shares outstanding during the period.
D Fees and expenses of any underlying Fidelity Central Funds are not included in the Fund's expense ratio. The Fund indirectly bears its proportionate share of the expenses of any underlying Fidelity Central Funds.
E Amount does not include the portfolio activity of any underlying Fidelity Central Funds.
F Expense ratios reflect operating expenses of the class. Expenses before reductions do not reflect amounts reimbursed by the investment adviser or reductions from brokerage service arrangements or reductions from other expense offset arrangements and do not represent the amount paid by the class during periods when reimbursements or reductions occur. Expenses net of fee waivers reflect expenses after reimbursement by the investment adviser but prior to reductions from brokerage service arrangements or other expense offset arrangements. Expenses net of all reductions represent the net expenses paid by the class.
G Amount represents less than $.01 per share.
See accompanying notes which are an integral part of the financial statements.
Annual Report
Financial Highlights - Class T
Years ended October 31, | 2012 | 2011 | 2010 | 2009 | 2008 |
Selected Per-Share Data | | | | | |
Net asset value, beginning of period | $ 20.43 | $ 23.61 | $ 19.14 | $ 12.49 | $ 32.52 |
Income from Investment Operations | | | | | |
Net investment income (loss) C | .16 | .15 | .07 | .07 | .17 |
Net realized and unrealized gain (loss) | (.06) | (3.18) | 4.57 | 6.64 | (19.48) |
Total from investment operations | .10 | (3.03) | 4.64 | 6.71 | (19.31) |
Distributions from net investment income | (.09) | (.04) | (.04) | (.07) | - |
Distributions from net realized gain | - | (.13) | (.13) | - | (.74) |
Total distributions | (.09) | (.16) H | (.17) | (.07) | (.74) |
Redemption fees added to paid in capital C | - G | .01 | - G | .01 | .02 |
Net asset value, end of period | $ 20.44 | $ 20.43 | $ 23.61 | $ 19.14 | $ 12.49 |
Total Return A, B | .49% | (12.89)% | 24.38% | 54.17% | (60.66)% |
Ratios to Average Net Assets D, F | | | | | |
Expenses before reductions | 1.80% | 1.79% | 1.81% | 1.87% | 1.84% |
Expenses net of fee waivers, if any | 1.80% | 1.79% | 1.81% | 1.85% | 1.84% |
Expenses net of all reductions | 1.73% | 1.73% | 1.76% | 1.78% | 1.79% |
Net investment income (loss) | .81% | .66% | .33% | .44% | .69% |
Supplemental Data | | | | | |
Net assets, end of period (000 omitted) | $ 58,919 | $ 73,146 | $ 104,417 | $ 86,959 | $ 47,300 |
Portfolio turnover rate E | 177% | 122% | 86% | 85% | 61% |
A Total returns would have been lower if certain expenses had not been reduced during the applicable periods shown.
B Total returns do not include the effect of the sales charges.
C Calculated based on average shares outstanding during the period.
D Fees and expenses of any underlying Fidelity Central Funds are not included in the Fund's expense ratio. The Fund indirectly bears its proportionate share of the expenses of any underlying Fidelity Central Funds.
E Amount does not include the portfolio activity of any underlying Fidelity Central Funds.
F Expense ratios reflect operating expenses of the class. Expenses before reductions do not reflect amounts reimbursed by the investment adviser or reductions from brokerage service arrangements or reductions from other expense offset arrangements and do not represent the amount paid by the class during periods when reimbursements or reductions occur. Expenses net of fee waivers reflect expenses after reimbursement by the investment adviser but prior to reductions from brokerage service arrangements or other expense offset arrangements. Expenses net of all reductions represent the net expenses paid by the class.
G Amount represents less than $.01 per share.
H Total distributions of $.16 per share is comprised of distributions from net investment income of $.037 and distributions from net realized gain of $.125 per share.
See accompanying notes which are an integral part of the financial statements.
Annual Report
Financial Highlights - Class B
Years ended October 31, | 2012 | 2011 | 2010 | 2009 | 2008 |
Selected Per-Share Data | | | | | |
Net asset value, beginning of period | $ 20.03 | $ 23.14 | $ 18.80 | $ 12.26 | $ 32.03 |
Income from Investment Operations | | | | | |
Net investment income (loss) C | .06 | .04 | (.03) | (.01) | .04 |
Net realized and unrealized gain (loss) | (.06) | (3.13) | 4.49 | 6.55 | (19.13) |
Total from investment operations | - | (3.09) | 4.46 | 6.54 | (19.09) |
Distributions from net investment income | - | (.01) | - | - | - |
Distributions from net realized gain | - | (.03) | (.12) | - | (.70) |
Total distributions | - | (.03) H | (.12) | - | (.70) |
Redemption fees added to paid in capital C | - G | .01 | - G | - G | .02 |
Net asset value, end of period | $ 20.03 | $ 20.03 | $ 23.14 | $ 18.80 | $ 12.26 |
Total Return A, B | -% | (13.33)% | 23.77% | 53.34% | (60.83)% |
Ratios to Average Net Assets D, F | | | | | |
Expenses before reductions | 2.29% | 2.29% | 2.32% | 2.36% | 2.35% |
Expenses net of fee waivers, if any | 2.29% | 2.29% | 2.32% | 2.35% | 2.35% |
Expenses net of all reductions | 2.23% | 2.22% | 2.26% | 2.28% | 2.30% |
Net investment income (loss) | .32% | .16% | (.17)% | (.05)% | .18% |
Supplemental Data | | | | | |
Net assets, end of period (000 omitted) | $ 15,994 | $ 21,304 | $ 31,159 | $ 27,580 | $ 17,307 |
Portfolio turnover rate E | 177% | 122% | 86% | 85% | 61% |
A Total returns would have been lower if certain expenses had not been reduced during the applicable periods shown.
B Total returns do not include the effect of the contingent deferred sales charge.
C Calculated based on average shares outstanding during the period.
D Fees and expenses of any underlying Fidelity Central Funds are not included in the Fund's expense ratio. The Fund indirectly bears its proportionate share of the expenses of any underlying Fidelity Central Funds.
E Amount does not include the portfolio activity of any underlying Fidelity Central Funds.
F Expense ratios reflect operating expenses of the class. Expenses before reductions do not reflect amounts reimbursed by the investment adviser or reductions from brokerage service arrangements or reductions from other expense offset arrangements and do not represent the amount paid by the class during periods when reimbursements or reductions occur. Expenses net of fee waivers reflect expenses after reimbursement by the investment adviser but prior to reductions from brokerage service arrangements or other expense offset arrangements. Expenses net of all reductions represent the net expenses paid by the class.
G Amount represents less than $.01 per share.
H Total distributions of $.03 per share is comprised of distributions from net investment income of $.005 and distributions from net realized gain of $.025 per share.
See accompanying notes which are an integral part of the financial statements.
Annual Report
Financial Highlights - Class C
Years ended October 31, | 2012 | 2011 | 2010 | 2009 | 2008 |
Selected Per-Share Data | | | | | |
Net asset value, beginning of period | $ 20.00 | $ 23.13 | $ 18.80 | $ 12.26 | $ 32.04 |
Income from Investment Operations | | | | | |
Net investment income (loss) C | .06 | .04 | (.03) | (.01) | .05 |
Net realized and unrealized gain (loss) | (.06) | (3.12) | 4.49 | 6.54 | (19.15) |
Total from investment operations | - | (3.08) | 4.46 | 6.53 | (19.10) |
Distributions from net investment income | - | (.01) | - | - | - |
Distributions from net realized gain | - | (.05) | (.13) | - | (.70) |
Total distributions | - | (.06) | (.13) | - | (.70) |
Redemption fees added to paid in capital C | - G | .01 | - G | .01 | .02 |
Net asset value, end of period | $ 20.00 | $ 20.00 | $ 23.13 | $ 18.80 | $ 12.26 |
Total Return A, B | -% | (13.33)% | 23.80% | 53.34% | (60.84)% |
Ratios to Average Net Assets D, F | | | | | |
Expenses before reductions | 2.29% | 2.28% | 2.30% | 2.34% | 2.34% |
Expenses net of fee waivers, if any | 2.29% | 2.28% | 2.30% | 2.34% | 2.34% |
Expenses net of all reductions | 2.23% | 2.22% | 2.24% | 2.28% | 2.29% |
Net investment income (loss) | .32% | .17% | (.15)% | (.05)% | .19% |
Supplemental Data | | | | | |
Net assets, end of period (000 omitted) | $ 65,598 | $ 80,855 | $ 106,711 | $ 83,939 | $ 44,878 |
Portfolio turnover rate E | 177% | 122% | 86% | 85% | 61% |
A Total returns would have been lower if certain expenses had not been reduced during the applicable periods shown.
B Total returns do not include the effect of the contingent deferred sales charge.
C Calculated based on average shares outstanding during the period.
D Fees and expenses of any underlying Fidelity Central Funds are not included in the Fund's expense ratio. The Fund indirectly bears its proportionate share of the expenses of any underlying Fidelity Central Funds.
E Amount does not include the portfolio activity of any underlying Fidelity Central Funds.
F Expense ratios reflect operating expenses of the class. Expenses before reductions do not reflect amounts reimbursed by the investment adviser or reductions from brokerage service arrangements or reductions from other expense offset arrangements and do not represent the amount paid by the class during periods when reimbursements or reductions occur. Expenses net of fee waivers reflect expenses after reimbursement by the investment adviser but prior to reductions from brokerage service arrangements or other expense offset arrangements. Expenses net of all reductions represent the net expenses paid by the class.
G Amount represents less than $.01 per share.
See accompanying notes which are an integral part of the financial statements.
Annual Report
Financial Highlights - Institutional Class
Years ended October 31, | 2012 | 2011 | 2010 | 2009 | 2008 |
Selected Per-Share Data | | | | | |
Net asset value, beginning of period | $ 20.63 | $ 23.87 | $ 19.29 | $ 12.71 | $ 33.02 |
Income from Investment Operations | | | | | |
Net investment income (loss) B | .28 | .29 | .20 | .15 | .31 |
Net realized and unrealized gain (loss) | (.06) | (3.21) | 4.62 | 6.65 | (19.76) |
Total from investment operations | .22 | (2.92) | 4.82 | 6.80 | (19.45) |
Distributions from net investment income | (.24) | (.20) | (.11) | (.23) | (.09) |
Distributions from net realized gain | - | (.13) | (.13) | - | (.79) |
Total distributions | (.24) | (.33) | (.24) | (.23) | (.88) |
Redemption fees added to paid in capital B | - F | .01 | - F | .01 | .02 |
Net asset value, end of period | $ 20.61 | $ 20.63 | $ 23.87 | $ 19.29 | $ 12.71 |
Total Return A | 1.08% | (12.41)% | 25.15% | 54.97% | (60.42)% |
Ratios to Average Net Assets C, E | | | | | |
Expenses before reductions | 1.22% | 1.21% | 1.22% | 1.30% | 1.27% |
Expenses net of fee waivers, if any | 1.22% | 1.21% | 1.22% | 1.30% | 1.27% |
Expenses net of all reductions | 1.16% | 1.14% | 1.17% | 1.23% | 1.21% |
Net investment income (loss) | 1.39% | 1.25% | .93% | .99% | 1.26% |
Supplemental Data | | | | | |
Net assets, end of period (000 omitted) | $ 145,782 | $ 138,312 | $ 184,789 | $ 106,713 | $ 47,557 |
Portfolio turnover rate D | 177% | 122% | 86% | 85% | 61% |
A Total returns would have been lower if certain expenses had not been reduced during the applicable periods shown.
B Calculated based on average shares outstanding during the period.
C Fees and expenses of any underlying Fidelity Central Funds are not included in the Fund's expense ratio. The Fund indirectly bears its proportionate share of the expenses of any underlying Fidelity Central Funds.
D Amount does not include the portfolio activity of any underlying Fidelity Central Funds.
E Expense ratios reflect operating expenses of the class. Expenses before reductions do not reflect amounts reimbursed by the investment adviser or reductions from brokerage service arrangements or reductions from other expense offset arrangements and do not represent the amount paid by the class during periods when reimbursements or reductions occur. Expenses net of fee waivers reflect expenses after reimbursement by the investment adviser but prior to reductions from brokerage service arrangements or other expense offset arrangements. Expenses net of all reductions represent the net expenses paid by the class.
F Amount represents less than $.01 per share.
See accompanying notes which are an integral part of the financial statements.
Annual Report
Notes to Financial Statements
For the period ended October 31, 2012
1. Organization.
Fidelity Advisor Emerging Markets Fund (the Fund) is a fund of Fidelity Advisor Series VIII (the Trust) and is authorized to issue an unlimited number of shares. The Trust is registered under the Investment Company Act of 1940, as amended (the 1940 Act), as an open-end management investment company organized as a Massachusetts business trust. The Fund offers Class A, Class T, Class C and Institutional Class shares, each of which, along with Class B shares, has equal rights as to assets and voting privileges. Effective after the close of business on September 1, 2010, Class B shares were closed to new accounts and additional purchases, except for exchanges and reinvestments. Each class has exclusive voting rights with respect to matters that affect that class. Class B shares will automatically convert to Class A shares after a holding period of seven years from the initial date of purchase. Investment income, realized and unrealized capital gains and losses, the common expenses of the Fund, and certain fund-level expense reductions, if any, are allocated on a pro-rata basis to each class based on the relative net assets of each class to the total net assets of the Fund. Each class differs with respect to transfer agent and distribution and service plan fees incurred. Certain expense reductions may also differ by class. The Fund's investments in emerging markets can be subject to social, economic, regulatory, and political uncertainties and can be extremely volatile.
2. Investments in Fidelity Central Funds.
The Fund invests in Fidelity Central Funds, which are open-end investment companies available only to other investment companies and accounts managed by Fidelity Management & Research Company (FMR) and its affiliates. The Fund's Schedule of Investments lists each of the Fidelity Central Funds held as of period end, if any, as an investment of the Fund, but does not include the underlying holdings of each Fidelity Central Fund. As an Investing Fund, the Fund indirectly bears its proportionate share of the expenses of the underlying Fidelity Central Funds.
The Money Market Central Funds seek preservation of capital and current income and are managed by Fidelity Investments Money Management, Inc. (FIMM), an affiliate of FMR.
A complete unaudited list of holdings for each Fidelity Central Fund is available upon request or at the Securities and Exchange Commission (the SEC) web site at www.sec.gov. In addition, the financial statements of the Fidelity Central Funds, which are not covered by the Fund's Report of Independent Registered Public Accounting Firm, are available on the SEC web site or upon request.
Annual Report
Notes to Financial Statements - continued
3. Significant Accounting Policies.
The financial statements have been prepared in conformity with accounting principles generally accepted in the United States of America (GAAP), which require management to make certain estimates and assumptions at the date of the financial statements. Actual results could differ from those estimates. Subsequent events, if any, through the date that the financial statements were issued have been evaluated in the preparation of the financial statements. The following summarizes the significant accounting policies of the Fund:
Security Valuation. Investments are valued as of 4:00 p.m. Eastern time on the last calendar day of the period. In accordance with valuation policies and procedures approved by the Board of Trustees (the Board), the Fund attempts to obtain prices from one or more third party pricing vendors or brokers to value its investments. When current market prices, quotations or rates are not readily available or reliable, securities will be fair valued in good faith by the FMR Fair Value Committee (the Committee), in accordance with procedures adopted by the Fund's Board. Factors used in determining fair value vary by security type and may include market or security specific events. The frequency with which these procedures are used cannot be predicted and they may be utilized to a significant extent. The Committee oversees the Fund's valuation policies and procedures and is responsible for approving and reporting to the Board all fair value determinations.
The Fund categorizes the inputs to valuation techniques used to value its investments into a disclosure hierarchy consisting of three levels as shown below:
Level 1 - quoted prices in active markets for identical investments
Level 2 - other significant observable inputs (including quoted prices for similar investments, interest rates, prepayment speeds, etc.)
Level 3 - unobservable inputs (including the Fund's own assumptions based on the best information available)
Valuation techniques used to value the Fund's investments by major category are as follows:
Equity securities, including restricted securities, for which market quotations are readily available, are valued at the last reported sale price or official closing price as reported by a third party pricing vendor on the primary market or exchange on which they are traded and are categorized as Level 1 in the hierarchy. In the event there were no sales during the day or closing prices are not available, securities are valued at the last quoted bid price or may be valued using the last available price and are generally categorized as Level 2 in the hierarchy. For foreign equity securities, when significant market or security specific events arise, comparisons to the valuation of American Depositary Receipts
Annual Report
3. Significant Accounting Policies - continued
Security Valuation - continued
(ADRs), futures contracts, Exchange-Traded Funds (ETFs) and certain indexes as well as quoted prices for similar securities are used and are categorized as Level 2 in the hierarchy. Utilizing these techniques may result in transfers between Level 1 and Level 2. For restricted equity securities and private placements where observable inputs are limited, assumptions about market activity and risk are used and these securities are generally categorized as Level 3 in the hierarchy.
ETFs are valued at their last sale price or official closing price as reported by a third party pricing vendor on the primary market or exchange on which they are traded and are categorized as Level 1 in the hierarchy. In the event there were no sales during the day but the exchange reports a closing bid level, ETFs are valued at the closing bid and would be categorized as Level 1 in the hierarchy. In the event there was no closing bid, ETFs may be valued by another method that the Board believes reflects fair value in accordance with the Board's fair value pricing policies and may be categorized as Level 2 in the hierarchy.
Investments in open-end mutual funds, including the Fidelity Central Funds, are valued at their closing net asset value (NAV) each business day and are categorized as Level 1 in the hierarchy.
Changes in valuation techniques may result in transfers in or out of an assigned level within the disclosure hierarchy. The aggregate value of investments by input level, as of October 31, 2012, including information on transfers between Levels 1 and 2, is included at the end of the Fund's Schedule of Investments.
Foreign Currency Translation. The Fund may use foreign currency contracts to facilitate transactions in foreign-denominated securities. Gains and losses from these transactions may arise from changes in the value of the foreign currency or if the counterparties do not perform under the contracts' terms.
Foreign-denominated assets, including investment securities, and liabilities are translated into U.S. dollars at the exchange rates at period end. Purchases and sales of investment securities, income and dividends received and expenses denominated in foreign currencies are translated into U.S. dollars at the exchange rate in effect on the transaction date.
The effects of exchange rate fluctuations on investments are included with the net realized and unrealized gain (loss) on investment securities. Other foreign currency transactions resulting in realized and unrealized gain (loss) are disclosed separately.
Investment Transactions and Income. For financial reporting purposes, the Fund's investment holdings and NAV include trades executed through the end of the last
Annual Report
Notes to Financial Statements - continued
3. Significant Accounting Policies - continued
Investment Transactions and Income - continued
business day of the period. The NAV per share for processing shareholder transactions is calculated as of the close of business of the New York Stock Exchange (NYSE), normally 4:00 p.m. Eastern time and includes trades executed through the end of the prior business day. Gains and losses on securities sold are determined on the basis of identified cost and may include proceeds received from litigation. Dividend income is recorded on the ex-dividend date, except for certain dividends from foreign securities where the ex-dividend date may have passed, which are recorded as soon as the Fund is informed of the ex-dividend date. Non-cash dividends included in dividend income, if any, are recorded at the fair market value of the securities received. Interest income and distributions from the Fidelity Central Funds are accrued as earned. Interest income includes coupon interest and amortization of premium and accretion of discount on debt securities. Investment income is recorded net of foreign taxes withheld where recovery of such taxes is uncertain.
Expenses. Expenses directly attributable to a fund are charged to that fund. Expenses attributable to more than one fund are allocated among the respective funds on the basis of relative net assets or other appropriate methods. Expense estimates are accrued in the period to which they relate and adjustments are made when actual amounts are known.
Income Tax Information and Distributions to Shareholders. Each year, the Fund intends to qualify as a regulated investment company under Subchapter M of the Internal Revenue Code, including distributing substantially all of its taxable income and realized gains. As a result, no provision for income taxes is required. As of October 31, 2012, the Fund did not have any unrecognized tax benefits in the financial statements; nor is the Fund aware of any tax positions for which it is reasonably possible that the total amounts of unrecognized tax benefits will significantly change in the next twelve months. The Fund files a U.S. federal tax return, in addition to state and local tax returns as required. A fund's federal income tax returns are subject to examination by the Internal Revenue Service (IRS) for a period of three fiscal years after they are filed. State and local tax returns may be subject to examination for an additional fiscal year depending on the jurisdiction. Foreign taxes are provided for based on the Fund's understanding of the tax rules and rates that exist in the foreign markets in which it invests.
Distributions are declared and recorded on the ex-dividend date. Income dividends and capital gain distributions are declared separately for each class. Income and capital gain distributions are determined in accordance with income tax regulations, which may differ from GAAP.
Annual Report
3. Significant Accounting Policies - continued
Income Tax Information and Distributions to Shareholders - continued
Capital accounts within the financial statements are adjusted for permanent book-tax differences. These adjustments have no impact on net assets or the results of operations. Temporary book-tax differences will reverse in a subsequent period.
Book-tax differences are primarily due to foreign currency transactions, passive foreign investment companies (PFIC), contingent interest, capital loss carryforwards and losses deferred due to wash sales.
The federal tax cost of investment securities and unrealized appreciation (depreciation) as of period end were as follows:
Gross unrealized appreciation | $ 52,123,160 |
Gross unrealized depreciation | (12,894,768) |
Net unrealized appreciation (depreciation) on securities and other investments | $ 39,228,392 |
| |
Tax Cost | $ 411,135,066 |
The tax-based components of distributable earnings as of period end were as follows:
Undistributed ordinary income | $ 3,650,890 |
Capital loss carryforward | $ (92,679,576) |
Net unrealized appreciation (depreciation) | $ 39,211,683 |
Capital loss carryforwards are only available to offset future capital gains of the Fund to the extent provided by regulations and may be limited. Under the Regulated Investment Company Modernization Act of 2010 (the Act), the Fund is permitted to carry forward capital losses incurred in taxable years beginning after December 22, 2010 for an unlimited period and such capital losses are required to be used prior to any losses that expire. Capital loss carryforwards were as follows:
Fiscal year of expiration | |
2017 | $ (70,963,758) |
No expiration | |
Short-term | (21,715,818) |
Total capital loss carryforward | $ (92,679,576) |
The tax character of distributions paid was as follows:
| October 31, 2012 | October 31, 2011 |
Ordinary Income | $ 3,344,878 | $ 6,474,313 |
Annual Report
Notes to Financial Statements - continued
3. Significant Accounting Policies - continued
Short-Term Trading (Redemption) Fees. Shares held by investors in the Fund less than 90 days are subject to a redemption fee equal to 1.50% of the net asset value of shares redeemed. All redemption fees, which reduce the proceeds of the shareholder redemption, are retained by the Fund and accounted for as an addition to paid in capital.
Restricted Securities. The Fund may invest in securities that are subject to legal or contractual restrictions on resale. These securities generally may be resold in transactions exempt from registration or to the public if the securities are registered. Disposal of these securities may involve time-consuming negotiations and expense, and prompt sale at an acceptable price may be difficult. Information regarding restricted securities is included at the end of the Fund's Schedule of Investments.
New Accounting Pronouncement. In December 2011, the Financial Accounting Standards Board issued Accounting Standard Update No. 2011-11, Disclosures about Offsetting Assets and Liabilities. The update creates new disclosure requirements requiring entities to disclose both gross and net information for derivatives and other financial instruments that are either offset in the Statement of Assets and Liabilities or subject to an enforceable master netting arrangement or similar agreement. The disclosure requirements are effective for annual reporting periods beginning on or after January 1, 2013, and interim periods within those annual periods. Management is currently evaluating the impact of the update's adoption on the Fund's financial statement disclosures.
4. Purchases and Sales of Investments.
Purchases and sales of securities, other than short-term securities, aggregated $846,408,176 and $910,774,840, respectively.
5. Fees and Other Transactions with Affiliates.
Management Fee. FMR and its affiliates provide the Fund with investment management related services for which the Fund pays a monthly management fee. The management fee is the sum of an individual fund fee rate that is based on an annual rate of .55% of the Fund's average net assets and an annualized group fee rate that averaged .26% during the period. The group fee rate is based upon the average net assets of all the mutual funds advised by FMR. The group fee rate decreases as assets under management increase and increases as assets under management decrease. For the period, the total annual management fee rate was .81% of the Fund's average net assets.
Distribution and Service Plan Fees. In accordance with Rule 12b-1 of the 1940 Act, the Fund has adopted separate Distribution and Service Plans for each class of shares. Certain classes pay Fidelity Distributors Corporation (FDC), an affiliate of FMR,
Annual Report
5. Fees and Other Transactions with Affiliates - continued
Distribution and Service Plan Fees - continued
separate Distribution and Service Fees, each of which is based on an annual percentage of each class' average net assets. In addition, FDC may pay financial intermediaries for selling shares of the Fund and providing shareholder support services. For the period, the Distribution and Service Fee rates, total fees and amounts retained by FDC were as follows:
| Distribution
Fee | Service
Fee | Total
Fees | Retained
by FDC |
Class A | -% | .25% | $ 444,791 | $ 9,780 |
Class T | .25% | .25% | 332,276 | 1,103 |
Class B | .75% | .25% | 185,960 | 139,714 |
Class C | .75% | .25% | 723,183 | 69,609 |
| | | $ 1,686,210 | $ 220,206 |
Sales Load. FDC may receive a front-end sales charge of up to 5.75% for selling Class A shares and 3.50% for selling Class T shares, some of which is paid to financial intermediaries for selling shares of the Fund. Depending on the holding period, FDC may receive contingent deferred sales charges levied on Class A, Class T, Class B, and Class C redemptions. The deferred sales charges range from 5.00% to 1.00% for Class B shares, 1.00% for Class C shares, 1.00% for certain purchases of Class A shares and .25% for certain purchases of Class T shares.
For the period, sales charge amounts retained by FDC were as follows:
| Retained
by FDC |
Class A | $ 71,044 |
Class T | 15,613 |
Class B* | 34,783 |
Class C* | 5,665 |
| $ 127,105 |
* When Class B and Class C shares are initially sold, FDC pays commissions from its own resources to financial intermediaries through which the sales are made.
Transfer Agent Fees. Fidelity Investments Institutional Operations Company, Inc. (FIIOC), an affiliate of FMR, is the transfer, dividend disbursing and shareholder servicing agent for each class of the Fund. FIIOC receives account fees and asset-based fees that vary according to the account size and type of account of the shareholders of the respective classes of the Fund. FIIOC pays for typesetting, printing and mailing of
Annual Report
Notes to Financial Statements - continued
5. Fees and Other Transactions with Affiliates - continued
Transfer Agent Fees - continued
shareholder reports, except proxy statements. For the period, transfer agent fees for each class were as follows:
| Amount | % of
Average
Net Assets |
Class A | $ 532,515 | .30 |
Class T | 204,047 | .31 |
Class B | 55,675 | .30 |
Class C | 216,916 | .30 |
Institutional Class | 344,487 | .23 |
| $ 1,353,640 | |
Accounting and Security Lending Fees. Fidelity Service Company, Inc. (FSC), an affiliate of FMR, maintains the Fund's accounting records. The accounting fee is based on the level of average net assets for each month. Under a separate contract, FSC administers the security lending program. The security lending fee is based on the number and duration of lending transactions.
Brokerage Commissions. The Fund placed a portion of its portfolio transactions with brokerage firms which are affiliates of the investment adviser. The commissions paid to these affiliated firms were $311 for the period.
6. Committed Line of Credit.
The Fund participates with other funds managed by FMR or an affiliate in a $4.25 billion credit facility (the "line of credit") to be utilized for temporary or emergency purposes to fund shareholder redemptions or for other short-term liquidity purposes. The Fund has agreed to pay commitment fees on its pro-rata portion of the line of credit, which amounted to $1,351 and is reflected in Miscellaneous expenses on the Statement of Operations. During the period, there were no borrowings on this line of credit.
7. Security Lending.
The Fund lends portfolio securities through a lending agent from time to time in order to earn additional income. For equity securities, a lending agent is used and may loan securities to certain qualified borrowers, including Fidelity Capital Markets (FCM), a broker-dealer affiliated with the Fund. On the settlement date of the loan, the Fund receives collateral (in the form of U.S. Treasury obligations, letters of credit and/or cash) against the loaned securities and maintains collateral in an amount not less than 100% of the market value of the loaned securities during the period of the loan. The market value of the loaned securities is determined at the close of business of the Fund and any
Annual Report
7. Security Lending - continued
additional required collateral is delivered to the Fund on the next business day. If the borrower defaults on its obligation to return the securities loaned because of insolvency or other reasons, a fund could experience delays and costs in recovering the securities loaned or in gaining access to the collateral. Any cash collateral received is invested in the Fidelity Securities Lending Cash Central Fund. The value of loaned securities and cash collateral at period end are disclosed on the Fund's Statement of Assets and Liabilities. At period end, there were no security loans outstanding with FCM. Security lending income represents the income earned on investing cash collateral, less rebates paid to borrowers and any lending agent fees associated with the loan, plus any premium payments received for lending certain types of securities. Security lending income is presented in the Statement of Operations as a component of income from Fidelity Central Funds. Total security lending income during the period amounted to $43,262, including $2 from securities loaned to FCM.
8. Expense Reductions.
Many of the brokers with whom FMR places trades on behalf of the Fund provided services to the Fund in addition to trade execution. These services included payments of certain expenses on behalf of the Fund totaling $300,809 for the period. In addition, through arrangements with the Fund's custodian, credits realized as a result of uninvested cash balances were used to reduce the Fund's expenses. During the period, these credits reduced the Fund's custody expenses by $65.
9. Distributions to Shareholders.
Distributions to shareholders of each class were as follows:
Years ended October 31, | 2012 | 2011 |
From net investment income | | |
Class A | $ 1,451,148 | $ 1,359,820 |
Class T | 312,643 | 162,957 |
Class B | - | 6,606 |
Class C | - | 23,592 |
Institutional Class | 1,581,087 | 1,584,568 |
Total | $ 3,344,878 | $ 3,137,543 |
From net realized gain | | |
Class A | $ - | $ 1,530,131 |
Class T | - | 550,254 |
Class B | - | 33,415 |
Class C | - | 232,626 |
Institutional Class | - | 990,344 |
Total | $ - | $ 3,336,770 |
Annual Report
Notes to Financial Statements - continued
10. Share Transactions.
Transactions for each class of shares were as follows:
| Shares | Dollars |
Years ended October 31, | 2012 | 2011 | 2012 | 2011 |
Class A | | | | |
Shares sold | 2,037,152 | 2,979,791 | $ 41,195,109 | $ 70,086,728 |
Reinvestment of distributions | 66,178 | 111,230 | 1,330,840 | 2,675,569 |
Shares redeemed | (4,154,283) | (5,317,665) | (83,269,620) | (123,086,641) |
Net increase (decrease) | (2,050,953) | (2,226,644) | $ (40,743,671) | $ (50,324,344) |
Class T | | | | |
Shares sold | 596,352 | 883,154 | $ 12,026,705 | $ 20,610,023 |
Reinvestment of distributions | 14,784 | 28,248 | 297,017 | 678,402 |
Shares redeemed | (1,309,634) | (1,752,649) | (26,275,018) | (40,710,223) |
Net increase (decrease) | (698,498) | (841,247) | $ (13,951,296) | $ (19,421,798) |
Class B | | | | |
Shares sold | 26,111 | 68,462 | $ 526,389 | $ 1,586,905 |
Reinvestment of distributions | - | 1,377 | - | 32,616 |
Shares redeemed | (291,336) | (352,710) | (5,756,960) | (8,040,387) |
Net increase (decrease) | (265,225) | (282,871) | $ (5,230,571) | $ (6,420,866) |
Class C | | | | |
Shares sold | 549,601 | 956,543 | $ 10,991,315 | $ 22,080,298 |
Reinvestment of distributions | - | 9,045 | - | 213,702 |
Shares redeemed | (1,313,083) | (1,536,376) | (25,757,063) | (34,998,720) |
Net increase (decrease) | (763,482) | (570,788) | $ (14,765,748) | $ (12,704,720) |
Institutional Class | | | | |
Shares sold | 2,860,043 | 2,773,126 | $ 57,283,970 | $ 64,258,215 |
Reinvestment of distributions | 61,950 | 73,837 | 1,248,917 | 1,781,181 |
Shares redeemed | (2,554,172) | (3,885,014) | (52,021,365) | (91,297,373) |
Net increase (decrease) | 367,821 | (1,038,051) | $ 6,511,522 | $ (25,257,977) |
11. Other.
The Fund's organizational documents provide former and current trustees and officers with a limited indemnification against liabilities arising in connection with the performance of their duties to the Fund. In the normal course of business, the Fund may also enter into contracts that provide general indemnifications. The Fund's maximum exposure under these arrangements is unknown as this would be dependent on future claims that may be made against the Fund. The risk of material loss from such claims is considered remote.
Annual Report
To the Trustees of Fidelity Advisor Series VIII and Shareholders of Fidelity Advisor Emerging Markets Fund:
We have audited the accompanying statement of assets and liabilities of Fidelity Advisor Emerging Markets Fund (the Fund), a fund of Fidelity Advisor Series VIII, including the schedule of investments, as of October 31, 2012, and the related statement of operations for the year then ended, the statement of changes in net assets for each of the two years in the period then ended, and the financial highlights for each of the five years in the period then ended. These financial statements and financial highlights are the responsibility of the Fund's management. Our responsibility is to express an opinion on these financial statements and financial highlights based on our audits.
We conducted our audits in accordance with the standards of the Public Company Accounting Oversight Board (United States). Those standards require that we plan and perform the audit to obtain reasonable assurance about whether the financial statements and financial highlights are free of material misstatement. The Fund is not required to have, nor were we engaged to perform, an audit of its internal control over financial reporting. Our audits included consideration of internal control over financial reporting as a basis for designing audit procedures that are appropriate in the circumstances, but not for the purpose of expressing an opinion on the effectiveness of the Fund's internal control over financial reporting. Accordingly, we express no such opinion. An audit also includes examining, on a test basis, evidence supporting the amounts and disclosures in the financial statements, assessing the accounting principles used and significant estimates made by management, as well as evaluating the overall financial statement presentation. Our procedures included confirmation of securities owned as of October 31, 2012, by correspondence with the custodians and brokers; where replies were not received from brokers, we performed other auditing procedures. We believe that our audits provide a reasonable basis for our opinion.
In our opinion, the financial statements and financial highlights referred to above present fairly, in all material respects, the financial position of Fidelity Advisor Emerging Markets Fund as of October 31, 2012, the results of its operations for the year then ended, the changes in its net assets for each of the two years in the period then ended, and the financial highlights for each of the five years in the period then ended, in conformity with accounting principles generally accepted in the United States of America.
DELOITTE & TOUCHE LLP
Boston, Massachusetts
December 14, 2012
Annual Report
The Trustees, Members of the Advisory Board, and executive officers of the trust and fund, as applicable, are listed below. The Board of Trustees governs the fund and is responsible for protecting the interests of shareholders. The Trustees are experienced executives who meet periodically throughout the year to oversee the fund's activities, review contractual arrangements with companies that provide services to the fund, oversee management of the risks associated with such activities and contractual arrangements, and review the fund's performance. Except for James C. Curvey, each of the Trustees oversees 236 funds advised by FMR or an affiliate. Mr. Curvey oversees 443 funds advised by FMR or an affiliate.
The Trustees hold office without limit in time except that (a) any Trustee may resign; (b) any Trustee may be removed by written instrument, signed by at least two-thirds of the number of Trustees prior to such removal; (c) any Trustee who requests to be retired or who has become incapacitated by illness or injury may be retired by written instrument signed by a majority of the other Trustees; and (d) any Trustee may be removed at any special meeting of shareholders by a two-thirds vote of the outstanding voting securities of the trust. Each Trustee who is not an interested person (as defined in the 1940 Act) (Independent Trustee), shall retire not later than the last day of the calendar year in which his or her 75th birthday occurs. The Independent Trustees may waive this mandatory retirement age policy with respect to individual Trustees. The executive officers and Advisory Board Members hold office without limit in time, except that any officer and Advisory Board Member may resign or may be removed by a vote of a majority of the Trustees at any regular meeting or any special meeting of the Trustees. Except as indicated, each individual has held the office shown or other offices in the same company for the past five years.
Experience, Skills, Attributes, and Qualifications of the Fund's Trustees. The Governance and Nominating Committee has adopted a statement of policy that describes the experience, qualifications, attributes, and skills that are necessary and desirable for potential Independent Trustee candidates (Statement of Policy). The Board believes that each Trustee satisfied at the time he or she was initially elected or appointed a Trustee, and continues to satisfy, the standards contemplated by the Statement of Policy. The Governance and Nominating Committee also engages professional search firms to help identify potential Independent Trustee candidates who have the experience, qualifications, attributes, and skills consistent with the Statement of Policy. From time to time, additional criteria based on the composition and skills of the current Independent Trustees, as well as experience or skills that may be appropriate in light of future changes to board composition, business conditions, and regulatory or other developments, have also been considered by the professional search firms and the Governance and Nominating Committee. In addition, the Board takes into account the Trustees' commitment and participation in Board and committee meetings, as well as their leadership of standing and ad hoc committees throughout their tenure.
In determining that a particular Trustee was and continues to be qualified to serve as a Trustee, the Board has considered a variety of criteria, none of which, in isolation, was controlling. The Board believes that, collectively, the Trustees have balanced and diverse experience, qualifications, attributes, and skills, which allow the Board to operate effectively in governing the fund and protecting the interests of shareholders. Information about the specific experience, skills, attributes, and qualifications of each Trustee, which in each case led to the Board's conclusion that the Trustee should serve (or continue to serve) as a trustee of the fund, is provided below.
Annual Report
Trustees and Officers - continued
Board Structure and Oversight Function. James C. Curvey is an interested person (as defined in the 1940 Act) and currently serves as Chairman. The Trustees have determined that an interested Chairman is appropriate and benefits shareholders because an interested Chairman has a personal and professional stake in the quality and continuity of services provided to the fund. Independent Trustees exercise their informed business judgment to appoint an individual of their choosing to serve as Chairman, regardless of whether the Trustee happens to be independent or a member of management. The Independent Trustees have determined that they can act independently and effectively without having an Independent Trustee serve as Chairman and that a key structural component for assuring that they are in a position to do so is for the Independent Trustees to constitute a substantial majority for the Board. The Independent Trustees also regularly meet in executive session. Ned C. Lautenbach serves as Chairman of the Independent Trustees and as such (i) acts as a liaison between the Independent Trustees and management with respect to matters important to the Independent Trustees and (ii) with management prepares agendas for Board meetings.
Fidelity funds are overseen by different Boards of Trustees. The fund's Board oversees Fidelity's equity and high income funds and another Board oversees Fidelity's investment-grade bond, money market, and asset allocation funds. The asset allocation funds may invest in Fidelity funds overseen by the fund's Board. The use of separate Boards, each with its own committee structure, allows the Trustees of each group of Fidelity funds to focus on the unique issues of the funds they oversee, including common research, investment, and operational issues. On occasion, the separate Boards establish joint committees to address issues of overlapping consequences for the Fidelity funds overseen by each Board.
The Trustees operate using a system of committees to facilitate the timely and efficient consideration of all matters of importance to the Trustees, the fund, and fund shareholders and to facilitate compliance with legal and regulatory requirements and oversight of the fund's activities and associated risks. The Board, acting through its committees, has charged FMR and its affiliates with (i) identifying events or circumstances the occurrence of which could have demonstrably adverse effects on the fund's business and/or reputation; (ii) implementing processes and controls to lessen the possibility that such events or circumstances occur or to mitigate the effects of such events or circumstances if they do occur; and (iii) creating and maintaining a system designed to evaluate continuously business and market conditions in order to facilitate the identification and implementation processes described in (i) and (ii) above. Because the day-to-day operations and activities of the fund are carried out by or through FMR, its affiliates and other service providers, the fund's exposure to risks is mitigated but not eliminated by the processes overseen by the Trustees. While each of the Board's committees has responsibility for overseeing different aspects of the fund's activities, oversight is exercised primarily through the Operations, Audit, and Compliance Committees. In addition, the Independent Trustees have worked with FMR to enhance the Board's oversight of investment and financial risks, legal and regulatory risks, technology risks, and operational risks, including the development of additional risk reporting to the Board. For example, a working group comprised of Independent Trustees and FMR has worked and continues to work to review the Fidelity funds' valuation-related activities, reporting and risk management. Appropriate personnel, including but not limited to the fund's Chief Compliance Officer (CCO), FMR's internal auditor, the independent accountants, the fund's Treasurer and portfolio management personnel, make periodic reports to the Board's committees, as appropriate, including an annual review of FMR's risk management program for the Fidelity funds. The responsibilities of each standing committee, including their oversight responsibilities, are described further under "Standing Committees of the Fund's Trustees."
Annual Report
The fund's Statement of Additional Information (SAI) includes more information about the Trustees. To request a free copy, call Fidelity at 1-877-208-0098.
Interested Trustees*:
Correspondence intended for each Trustee who is an interested person may be sent to Fidelity Investments, 82 Devonshire Street, Boston, Massachusetts 02109.
Name, Age; Principal Occupations and Other Relevant Experience+ |
James C. Curvey (77) |
| Year of Election or Appointment: 2007 Mr. Curvey is Trustee and Chairman of the Board of Trustees of certain Trusts. Mr. Curvey also serves as Trustee (2007-present) of other investment companies advised by FMR. Mr. Curvey is a Director of Fidelity Investments Money Management, Inc. (2009-present), Director of Fidelity Research & Analysis Co. (2009-present) and Director of FMR and FMR Co., Inc. (2007-present). Mr. Curvey is also Vice Chairman (2007-present) and Director of FMR LLC. In addition, Mr. Curvey serves as an Overseer for the Boston Symphony Orchestra and a member of the Trustees of Villanova University. Previously, Mr. Curvey was the Vice Chairman (2006-2007) and Director (2000-2007) of FMR Corp. |
Ronald P. O'Hanley (55) |
| Year of Election or Appointment: 2011 Mr. O'Hanley is Director of FMR Co., Inc. (2010-present), Director of Fidelity Investments Money Management, Inc. (2010-present), Director of Fidelity Research & Analysis Company (2010-present), President of Fidelity Asset Management and Corporate Services and a member of Fidelity's Executive Committee (2010-present). Previously, Mr. O'Hanley served as President and Chief Executive Officer of BNY Mellon Asset Management (2007-2010). Mr. O'Hanley also served as Vice Chairman of Bank New York Mellon Corp. and a member of that firm's Executive Committee. Prior to the 2007 merger of The Bank of New York and Mellon Financial Corporation, he was Vice Chairman of Mellon Financial Corporation and President and Chief Executive Officer of Mellon Asset Management. He joined Mellon in February 1997. Mr. O'Hanley currently serves as Chairman of the Boston Public Library Foundation Board of Directors and sits on the Board of Directors of Beth Israel Deaconess Medical Center, the Board of Trustees of the Marine Biological Laboratory and the Advisory Board of the Maxwell School of Citizenship and Public Administration at Syracuse University. Mr. O'Hanley also chairs the Council on Asset Management for the Financial Services Roundtable and is a member of the Board of Directors of Institutional Investor's U.S. Institute. |
* Trustees have been determined to be "Interested Trustees" by virtue of, among other things, their affiliation with the trust or various entities under common control with FMR.
+ The information above includes each Trustee's principal occupation during the last five years and other information relating to the experience, attributes, and skills relevant to each Trustee's qualifications to serve as a Trustee, which led to the conclusion that each Trustee should serve as a Trustee for the fund.
Annual Report
Independent Trustees:
Correspondence intended for each Independent Trustee (that is, the Trustees other than the Interested Trustees) may be sent to Fidelity Investments, P.O. Box 55235, Boston, Massachusetts 02205-5235.
Name, Age; Principal Occupations and Other Relevant Experience+ |
Dennis J. Dirks (64) |
| Year of Election or Appointment: 2005 Prior to his retirement in May 2003, Mr. Dirks was Chief Operating Officer and a member of the Board of The Depository Trust & Clearing Corporation (DTCC). He also served as President, Chief Operating Officer, and Board member of The Depository Trust Company (DTC) and President and Board member of the National Securities Clearing Corporation (NSCC). In addition, Mr. Dirks served as Chief Executive Officer and Board member of the Government Securities Clearing Corporation, Chief Executive Officer and Board member of the Mortgage-Backed Securities Clearing Corporation, as a Trustee and a member of the Finance Committee of Manhattan College (2005-2008), and as a Trustee and a member of the Finance Committee of AHRC of Nassau County (2006-2008). Mr. Dirks is a member of the Independent Directors Council (IDC) Governing Council (2010-present) and Board of Directors for The Brookville Center for Children's Services, Inc. (2009-present). |
Alan J. Lacy (59) |
| Year of Election or Appointment: 2008 Mr. Lacy serves as Senior Adviser (2007-present) of Oak Hill Capital Partners, L.P. (private equity). Mr. Lacy also served as Chief Executive Officer (2000-2005) and Vice Chairman (2005-2006) of Sears Holdings Corporation and Sears, Roebuck and Co. (retail). In addition, Mr. Lacy serves as a member of the Board of Directors of Dave & Buster's Entertainment, Inc. (restaurant and entertainment complexes, 2010-present), Earth Fare, Inc. (retail grocery, 2012-present), The Hillman Companies, Inc. (hardware wholesalers, 2010-present), and Bristol-Myers Squibb Company (global pharmaceuticals, 2008-present). Mr. Lacy is a member of the Board of Trustees of The National Parks Conservation Association (2006-present). Previously, Mr. Lacy served as Chairman of the Board of Trustees of the National Parks Conservation Association (2008-2011) and as a member of the Board of Directors for the Western Union Company (global money transfer, 2006-2011). |
Ned C. Lautenbach (68) |
| Year of Election or Appointment: 2000 Mr. Lautenbach is Chairman of the Independent Trustees of the Equity and High Income Funds (2006-present). Mr. Lautenbach currently serves as the Lead Director of the Eaton Corporation Board of Directors (diversified industrial, 1997-present). Mr. Lautenbach is Chairman of the Board of Directors of the Philharmonic Center for the Arts in Naples, Florida (2012-present) and a member of the Council on Foreign Relations (1994-present). Previously, Mr. Lautenbach was a Partner/Advisory Partner at Clayton, Dubilier & Rice, LLC (private equity investment, 1998-2010), as well as a Director of Sony Corporation (2006-2007). |
Joseph Mauriello (68) |
| Year of Election or Appointment: 2008 Prior to his retirement in January 2006, Mr. Mauriello served in numerous senior management positions including Deputy Chairman and Chief Operating Officer (2004-2005), and Vice Chairman of Financial Services (2002-2004) of KPMG LLP US (professional services, 1965-2005). Mr. Mauriello currently serves as a member of the Board of Directors of XL Group plc. (global insurance and re-insurance, 2006-present). Previously, Mr. Mauriello served as a Director of the Hamilton Funds of the Bank of New York (2006-2007) and of Arcadia Resources Inc. (health care services and products, 2007-2012). |
Robert W. Selander (62) |
| Year of Election or Appointment: 2011 Previously, Mr. Selander served as a Member of the Advisory Board of Fidelity's Equity and High Income Funds (2011), Executive Vice Chairman (2010), Chief Executive Officer (2009-2010), and President and Chief Executive Officer (1997-2009) of Mastercard, Inc. |
Cornelia M. Small (68) |
| Year of Election or Appointment: 2005 Ms. Small is a member of the Board of Directors (2009-present) and Chair of the Investment Committee (2010-present) of the Teagle Foundation. Ms. Small also serves on the Investment Committee of the Berkshire Taconic Community Foundation (2008-present). Previously, Ms. Small served as Chairperson (2002-2008) and a member of the Investment Committee and Chairperson (2008-2012) and a member of the Board of Trustees of Smith College. In addition, Ms. Small served as Chief Investment Officer, Director of Global Equity Investments, and a member of the Board of Directors of Scudder, Stevens & Clark and Scudder Kemper Investments. |
William S. Stavropoulos (73) |
| Year of Election or Appointment: 2001 Mr. Stavropoulos is Vice Chairman of the Independent Trustees of the Equity and High Income Funds (2006-present). Mr. Stavropoulos serves as President and Founder of the Michigan Baseball Foundation, the Great Lakes Loons (2007-present). Mr. Stavropoulos is Chairman Emeritus of the Board of Directors of The Dow Chemical Company, where he previously served in numerous senior management positions, including President, CEO (1995-2000; 2002-2004), Chairman of the Executive Committee (2000-2006), and as a member of the Board of Directors (1990-2006). Currently, Mr. Stavropoulos is a Director of Univar Inc. (global distributor of commodity and specialty chemicals, Chairman from 2010-May 2012 and Lead Director from May 2012-present), Teradata Corporation (data warehousing and technology solutions, 2008-present), Maersk Inc. (industrial conglomerate), and Tyco International, Ltd. (multinational manufacturing and services, 2007-present), and a member of the Advisory Board for Metalmark Capital LLC (private equity investment, 2005-present). Mr. Stavropoulos is an operating advisor to Clayton, Dubilier & Rice, LLC (private equity investment). In addition, Mr. Stavropoulos is a member of the University of Notre Dame Advisory Council for the College of Science, a Trustee of the Rollin L. Gerstacker Foundation, and a Director of the Naples Philharmonic Center for the Arts. Previously, Mr. Stavropoulos served as a Director of Chemical Financial Corporation (bank holding company, 1993-2012). |
David M. Thomas (63) |
| Year of Election or Appointment: 2008 Previously, Mr. Thomas served as Executive Chairman (2005-2006) and Chairman and Chief Executive Officer (2000-2005) of IMS Health, Inc. (pharmaceutical and healthcare information solutions), and a Director of Fortune Brands, Inc. (consumer products, 2000-2011). In addition, Mr. Thomas serves as Non-Executive Chairman of the Board of Directors of Fortune Brands Home and Security (home and security products, 2011-present), and as a member of the Board of Directors of Interpublic Group of Companies, Inc. (marketing communication, 2004-present). |
Michael E. Wiley (62) |
| Year of Election or Appointment: 2008 Mr. Wiley also serves as a Director of Asia Pacific Exploration Consolidated (international oil and gas exploration and production, 2008-present). Mr. Wiley serves as a Director of Tesoro Corporation (independent oil refiner and marketer, 2005-present), and a Director of Bill Barrett Corporation (exploration and production, 2005-present). In addition, Mr. Wiley also serves as a Director of Post Oak Bank (privately-held bank, 2004-present). Previously, Mr. Wiley served as a member of the Board of Trustees of the University of Tulsa (2000-2006; 2007-2010), as a Senior Energy Advisor of Katzenbach Partners, LLC (consulting, 2006-2007), as an Advisory Director of Riverstone Holdings (private investment), Chairman, President, and CEO of Baker Hughes, Inc. (oilfield services, 2000-2004), and as Director of Spinnaker Exploration Company (exploration and production, 2001-2005). |
+ The information above includes each Trustee's principal occupation during the last five years and other information relating to the experience, attributes, and skills relevant to each Trustee's qualifications to serve as a Trustee, which led to the conclusion that each Trustee should serve as a Trustee for the fund.
Advisory Board Members and Executive Officers:
Correspondence intended for David A. Rosow and Garnett A. Smith may be sent to Fidelity Investments, P.O. Box 55235, Boston, Massachusetts 02205-5235. Correspondence intended for each executive officer, Edward C. Johnson 3d, and Peter S. Lynch may be sent to Fidelity Investments, 82 Devonshire Street, Boston, Massachusetts 02109.
Name, Age; Principal Occupation |
Edward C. Johnson 3d (82) |
| Year of Election or Appointment: 2011 Member of the Advisory Board of Fidelity's Equity and High Income Funds. Mr. Johnson serves as Chief Executive Officer, Chairman, and a Director of FMR LLC, and also serves as Chairman and Director of FIL Limited. Previously, Mr. Johnson served as a Trustee and Chairman of the Board of certain Fidelity Trusts, Chairman and a Director of FMR, Chairman and a Director of FMR Co., Inc., and President of FMR LLC (2006-2007). |
Peter S. Lynch (68) |
| Year of Election or Appointment: 2003 Member of the Advisory Board of Fidelity's Equity and High Income Funds. Mr. Lynch is Vice Chairman and a Director of FMR and FMR Co., Inc. In addition, Mr. Lynch serves as a Trustee of Boston College and as the Chairman of the Inner-City Scholarship Fund. Previously, Mr. Lynch served on the Special Olympics International Board of Directors (1997-2006). |
David A. Rosow (70) |
| Year of Election or Appointment: 2012 Member of the Advisory Board of Fidelity's Equity and High Income Funds. Chairman and Chief Executive Officer of International Golf Group, Inc. (golf course development, 1989-present). Previously, Mr. Rosow served as Chairman and Chief Executive Officer of Rosow & Company, Inc. (private investment company, 1989-2011), a Lead Director of Hudson United Bancorp (2001-2006) and as a Director of TD Banknorth (1996-2006). In addition, Mr. Rosow is a member (2008-present) and President (2009-present) of the Town Council of Palm Beach, Florida. |
Garnett A. Smith (65) |
| Year of Election or Appointment: 2012 Member of the Advisory Board of Fidelity's Equity and High Income Funds. Prior to Mr. Smith's retirement, he served as Chairman and Chief Executive Officer of Inbrand Corp. (manufacturer of personal absorbent products, 1990-1997). He also served as President (1986-1990) of Inbrand Corp. Prior to his employment with Inbrand Corp., he was employed by a retail fabric chain and North Carolina National Bank. In addition, Mr. Smith is a board member of the Jackson Hole Land Trust (2009-present). |
Kenneth B. Robins (43) |
| Year of Election or Appointment: 2008 President and Treasurer of Fidelity's Equity and High Income Funds. Mr. Robins also serves as President and Treasurer (2010-present) and Assistant Treasurer (2009-present) of other Fidelity funds and is an employee of Fidelity Investments (2004-present). Previously, Mr. Robins served as Deputy Treasurer of the Fidelity funds (2005-2008) and Treasurer and Chief Financial Officer of The North Carolina Capital Management Trust: Cash and Term Portfolios (2006-2008). |
Bruce T. Herring (47) |
| Year of Election or Appointment: 2006 Vice President of certain Equity Funds. Mr. Herring also serves as President of Fidelity Research & Analysis Company (2010-present), Chief Investment Officer and Director of Fidelity Management & Research (U.K.) Inc. (2010-present) and Group Chief Investment Officer of FMR. Previously, Mr. Herring served as Vice President (2005-2006) and Senior Vice President (2006-2007) of Fidelity Management & Research Company, Vice President of FMR Co., Inc. (2001-2007) and as a portfolio manager for Fidelity U.S. Equity Funds. |
Brian B. Hogan (48) |
| Year of Election or Appointment: 2009 Vice President of Equity and High Income Funds. Mr. Hogan also serves as President of FMR's Equity Division (2009-present). Previously, Mr. Hogan served as Senior Vice President, Equity Research of FMR (2006-2009) and as a portfolio manager. |
Scott C. Goebel (44) |
| Year of Election or Appointment: 2008 Secretary and Chief Legal Officer (CLO) of the Fidelity funds. Mr. Goebel also serves as Secretary of Fidelity Investments Money Management, Inc. (FIMM) (2010-present) and Fidelity Research and Analysis Company (FRAC) (2010-present); Secretary and CLO of The North Carolina Capital Management Trust: Cash and Term Portfolios (2008-present); General Counsel, Secretary, and Senior Vice President of FMR (2008-present) and FMR Co., Inc. (2008-present); employed by FMR LLC or an affiliate (2001-present); Chief Legal Officer of Fidelity Management & Research (Hong Kong) Limited (2008-present) and Assistant Secretary of Fidelity Management & Research (Japan) Inc. (2008-present), and Fidelity Management & Research (U.K.) Inc. (2008-present). Previously, Mr. Goebel served as Assistant Secretary of FIMM (2008-2010), FRAC (2008-2010), and the Funds (2007-2008) and as Vice President and Secretary of Fidelity Distributors Corporation (FDC) (2005-2007). |
William C. Coffey (43) |
| Year of Election or Appointment: 2009 Assistant Secretary of Fidelity's Equity and High Income Funds. Mr. Coffey also serves as Senior Vice President and Deputy General Counsel of FMR LLC (2010-present), and is an employee of Fidelity Investments. Previously, Mr. Coffey served as Vice President and Associate General Counsel of FMR LLC (2005-2009). |
Elizabeth Paige Baumann (44) |
| Year of Election or Appointment: 2012 Anti-Money Laundering (AML) Officer of the Fidelity funds. Ms. Baumann also serves as AML Officer of The North Carolina Capital Management Trust: Cash and Term Portfolios (2012-present), Chief AML Officer of FMR LLC (2012-present), and is an employee of Fidelity Investments. Previously, Ms. Baumann served as Vice President and Deputy Anti-Money Laundering Officer (2007-2012). |
Christine Reynolds (54) |
| Year of Election or Appointment: 2008 Chief Financial Officer of the Fidelity funds. Ms. Reynolds became President of Fidelity Pricing and Cash Management Services (FPCMS) in August 2008. Ms. Reynolds served as Chief Operating Officer of FPCMS (2007-2008). Previously, Ms. Reynolds served as President, Treasurer, and Anti-Money Laundering officer of the Fidelity funds (2004-2007). |
Joseph A. Hanlon (44) |
| Year of Election or Appointment: 2012 Chief Compliance Officer of Fidelity's Equity and High Income Funds. Mr. Hanlon serves as Compliance Officer of FMR, FMR Co., Inc., Fidelity Investments Money Management, Inc. (FIMM), Fidelity Research and Analysis Company (FRAC), Fidelity Management & Research (Japan) Inc., Fidelity Management & Research (U.K.) Inc., Fidelity Management & Research (Hong Kong), and Strategic Advisers, Inc. (2009-present), as Senior Vice President of the Fidelity Asset Management Division (2009-present), and is an employee of Fidelity Investments. |
Joseph F. Zambello (55) |
| Year of Election or Appointment: 2011 Deputy Treasurer of the Fidelity funds. Mr. Zambello is an employee of Fidelity Investments. Previously, Mr. Zambello served as Vice President of FMR's Program Management Group (2009-2011) and Vice President of the Transfer Agent Oversight Group (2005-2009). |
Adrien E. Deberghes (45) |
| Year of Election or Appointment: 2008 Deputy Treasurer of Fidelity's Equity and High Income Funds. Mr. Deberghes also serves as Vice President (2011-present) and Assistant Treasurer (2010-present) of other Fidelity funds, and is an employee of Fidelity Investments (2008-present). Previously, Mr. Deberghes served as Senior Vice President of Mutual Fund Administration at State Street Corporation (2007-2008), Senior Director of Mutual Fund Administration at Investors Bank & Trust (2005-2007), and Director of Finance for Dunkin' Brands (2000-2005). |
Stephen Sadoski (41) |
| Year of Election or Appointment: 2012 Deputy Treasurer of Fidelity's Equity and High Income Funds. Mr. Sadoski also serves as Assistant Treasurer of other Fidelity funds (2012-present) and is an employee of Fidelity Investments (2012-present). Previously, Mr. Sadoski served as an assistant chief accountant in the Division of Investment Management of the Securities and Exchange Commission (SEC) (2009-2012) and as a senior manager at Deloitte & Touche (1997-2009). |
Stephanie J. Dorsey (43) |
| Year of Election or Appointment: 2010 Assistant Treasurer of Fidelity's Equity and High Income Funds. Ms. Dorsey also serves as Deputy Treasurer of other Fidelity funds (2008-present) and is an employee of Fidelity Investments (2008-present). Previously, Ms. Dorsey served as Treasurer (2004-2008) of the JPMorgan Mutual Funds and Vice President (2004-2008) of JPMorgan Chase Bank. |
John R. Hebble (54) |
| Year of Election or Appointment: 2009 Assistant Treasurer of Fidelity's Equity and High Income Funds. Mr. Hebble also serves as President (2011-present), Treasurer, and Chief Financial Officer of The North Carolina Capital Management Trust: Cash and Term Portfolios (2008-present), President and Treasurer of other Fidelity funds (2008-present) and is an employee of Fidelity Investments. |
Gary W. Ryan (54) |
| Year of Election or Appointment: 2005 Assistant Treasurer of the Fidelity funds. Mr. Ryan is an employee of Fidelity Investments. Previously, Mr. Ryan served as Vice President of Fund Reporting in Fidelity Pricing and Cash Management Services (FPCMS) (1999-2005). |
Jonathan Davis (44) |
| Year of Election or Appointment: 2010 Assistant Treasurer of the Fidelity funds. Mr. Davis is also Assistant Treasurer of Fidelity Rutland Square Trust II and Fidelity Commonwealth Trust II. Mr. Davis is an employee of Fidelity Investments. Previously, Mr. Davis served as Vice President and Associate General Counsel of FMR LLC (2003-2010). |
Annual Report
Institutional Class designates 96% of the dividends distributed during the fiscal year as amounts which may be taken into account as a dividend for purposes of the maximum rate under section 1(h)(11) of the Internal Revenue Code.
The amounts per share which represent income derived from sources within, and taxes paid to, foreign countries or possessions of the United States are as follows:
| Pay Date | Income | Taxes |
Institutional Class | 12/05/11 | $0.310 | $0.0728 |
The fund will notify shareholders in January 2013 of amounts for use in preparing 2012 income tax returns.
Annual Report
Board Approval of Investment Advisory Contracts and Management Fees
Fidelity Advisor Emerging Markets Fund
Each year, the Board of Trustees, including the Independent Trustees (together, the Board), votes on the renewal of the management contract and sub-advisory agreements (together, the Advisory Contracts) for the fund. The Board, assisted by the advice of fund counsel and Independent Trustees' counsel, requests and considers a broad range of information relevant to the renewal of the Advisory Contracts throughout the year.
The Board meets regularly and, at each of its meetings, considers factors that are relevant to its annual consideration of the renewal of the fund's Advisory Contracts, including the services and support provided to the fund and its shareholders. The Board has established various standing committees, each composed of and chaired by Independent Trustees with varying backgrounds, to which the Board has assigned specific subject matter responsibilities in order to enhance effective decision-making by the Board. The Board, acting directly and through its Committees, requests and receives information concerning the annual consideration of the renewal of the fund's Advisory Contracts. The Board also meets as needed to consider matters specifically related to the Board's annual consideration of the renewal of Advisory Contracts. Members of the Board may also meet with trustees of other Fidelity funds through ad hoc joint committees to discuss certain matters relevant to the Fidelity funds.
At its July 2012 meeting, the Board of Trustees, including the Independent Trustees, unanimously determined to renew the fund's Advisory Contracts. In reaching its determination, the Board considered all factors it believed relevant, including (i) the nature, extent, and quality of the services to be provided to the fund and its shareholders (including the investment performance of the fund); (ii) the competitiveness of the fund's management fee and total expense ratio relative to peer funds; (iii) the total costs of the services to be provided by and the profits to be realized by Fidelity from its relationship with the fund; (iv) the extent to which economies of scale exist and would be realized as the fund grows; and (v) whether fee levels reflect these economies of scale, if any, for the benefit of fund shareholders.
In considering whether to renew the Advisory Contracts for the fund, the Board reached a determination, with the assistance of fund counsel and Independent Trustees' counsel and through the exercise of its business judgment, that the renewal of the Advisory Contracts is in the best interests of the fund and its shareholders and that the compensation payable under the Advisory Contracts is fair and reasonable. The Board's decision to renew the Advisory Contracts was not based on any single factor, but rather was based on a comprehensive consideration of all the information provided to the Board at its meetings throughout the year. The Board, in reaching its determination to renew the Advisory Contracts, is aware that shareholders in the fund have a broad range of investment choices available to them, including a wide choice among mutual funds offered by Fidelity's competitors, and that the fund's shareholders, who have the opportunity to review and weigh the disclosure provided by the fund in its prospectus and other public disclosures, have chosen to invest in this fund, managed by Fidelity.
Annual Report
Nature, Extent, and Quality of Services Provided. The Board considered the staffing within the investment adviser, FMR, and the sub-advisers (together, the Investment Advisers), including the backgrounds of the fund's investment personnel, and also considered the fund's investment objective, strategies, and related investment philosophy. The Independent Trustees also had discussions with senior management of Fidelity's investment operations and investment groups. The Board considered the structure of the portfolio manager compensation program and whether this structure provides appropriate incentives to act in the best interests of the fund.
Resources Dedicated to Investment Management and Support Services. The Board and the Fund Oversight and Research Committees reviewed the general qualifications and capabilities of the Investment Advisers' investment staff, including its size, education, experience, and resources, as well as the Investment Advisers' approach to recruiting, training, managing, and compensating investment personnel. The Board also noted that FMR has continued to increase the resources devoted to non-U.S. offices, including expansion of Fidelity's global investment organization. The Board noted that Fidelity's analysts have extensive resources, tools and capabilities that allow them to conduct sophisticated quantitative and fundamental analysis, as well as credit analysis of issuers, counterparties and guarantors. The Board also believes that Fidelity's investment professionals have sufficient access to global information and data so as to provide competitive investment results over time, and that those professionals also have access to sophisticated tools that permit them to assess portfolio construction and risk and performance attribution characteristics continuously, as well as to transmit new information and research conclusions rapidly around the world. Additionally, in its deliberations, the Board considered the Investment Advisers' trading and risk management capabilities and resources, which are an integral part of the investment management process.
Shareholder and Administrative Services. The Board considered (i) the nature, extent, quality, and cost of advisory, administrative, and shareholder services performed by the Investment Advisers and their affiliates under the Advisory Contracts and under separate agreements covering transfer agency, pricing and bookkeeping, and securities lending services for the fund; (ii) the nature and extent of the supervision of third party service providers, principally custodians and subcustodians; and (iii) the resources devoted to, and the record of compliance with, the fund's compliance policies and procedures. The Board also reviewed the allocation of fund brokerage, including allocations to brokers affiliated with the Investment Advisers, the use of brokerage commissions to pay fund expenses, and the use of "soft" commission dollars to pay for research services.
Annual Report
Board Approval of Investment Advisory Contracts and
Management Fees - continued
The Board noted that the growth of fund assets over time across the complex allows Fidelity to reinvest in the development of services designed to enhance the value or convenience of the Fidelity funds as investment vehicles. These services include 24-hour access to account information and market information through telephone representatives and over the Internet, investor education materials and asset allocation tools, and the expanded availability of Fidelity Investor Centers.
Investment in a Large Fund Family. The Board considered the benefits to shareholders of investing in a Fidelity fund, including the benefits of investing in a fund that is part of a large family of funds offering a variety of investment disciplines and providing a large variety of mutual fund investor services. The Board noted that Fidelity had taken, or had made recommendations that resulted in the Fidelity funds taking, a number of actions over the previous year that benefited particular funds, including (i) continuing to dedicate additional resources to investment research and support of the senior management team that oversees asset management; (ii) persisting in efforts to enhance Fidelity's research capabilities, in particular, international research; (iii) launching new funds and making other enhancements to meet client needs for global and income-oriented solutions; (iv) continuing to launch dedicated lower cost underlying funds to meet investment management's portfolio construction needs related to expanding underlying fund options, specifically for the Freedom Fund product lines; (v) adopting a "Stock Selector" sector neutral investment approach and employing a team of portfolio managers who are sector specialists to manage certain funds; (vi) rationalizing product lines and gaining increased efficiencies through the mergers of several funds into other funds; (vii) strengthening the Spartan Index Fund product line by adding new funds and/or new low-cost institutional share classes, restructuring fund expenses to accommodate new classes, and reducing investment minimums for certain classes of shares; (viii) modifying the eligibility criteria for Institutional Class shares to increase their appeal to government entities and charitable investors; and (ix) reducing certain transfer agent fee rates.
Investment Performance. The Board considered whether the fund has operated in accordance with its investment objective, as well as its record of compliance with its investment restrictions. It also reviewed the fund's absolute investment performance for each class, as well as the fund's relative investment performance for each class measured over multiple periods against (i) a broad-based securities market index, and (ii) a peer group of mutual funds deemed appropriate by Fidelity and reviewed by the Board. The following charts considered by the Board show, over the one-, three-, and five-year periods ended December 31, 2011, the cumulative total returns of Institutional Class (Class I) and Class B of the fund, the cumulative total returns of a broad-based securities market index ("benchmark"), and a range of cumulative total returns of a peer group of mutual funds identified by Morningstar, Inc. as having an investment style similar to that of the fund based on underlying portfolio holdings. The returns of Institutional Class (Class I) and Class B show the performance of the highest and lowest performing classes, respectively (based on five-year performance). The box within each chart shows the 25th percentile return (top of box) and the 75th percentile return (bottom of box) of the peer group. Returns shown above the box are in the first quartile and returns shown below the box are in the fourth quartile. The percentage beaten numbers noted below each chart correspond to the percentile box and represent the percentage of funds in the peer group whose performance was equal to or lower than that of the class indicated.
Annual Report
Fidelity Advisor Emerging Markets Fund

The Board reviewed the fund's relative investment performance against its peer group and noted that the performance of Institutional Class (Class I) of the fund was in the third quartile for the one- and five-year periods and the second quartile for the three-year period. The Board also noted that the investment performance of the fund was lower than its benchmark for all the periods shown. The Board considered that the variations in performance among the fund's classes reflect the variations in class expenses, which result in lower performance for higher expense classes. The Board discussed with FMR the fact that the fund underperformed its benchmark for each period measured. The Board also reviewed the fund's performance since inception as well as performance in the current year. The Board will continue to closely monitor performance of the fund in the coming year and discuss with FMR if other actions to address performance are appropriate.
Based on its review, the Board concluded that the nature, extent, and quality of services provided to the fund under the Advisory Contracts should benefit the fund's shareholders.
Annual Report
Board Approval of Investment Advisory Contracts and
Management Fees - continued
Competitiveness of Management Fee and Total Expense Ratio. The Board considered the fund's management fee and total expense ratio compared to "mapped groups" of competitive funds and classes. Fidelity creates "mapped groups" by combining similar Lipper investment objective categories that have comparable management fee characteristics. Combining Lipper investment objective categories aids the Board's management fee and total expense ratio comparisons by broadening the competitive group used for comparison and by reducing the number of universes to which various Fidelity funds are compared.
Management Fee. The Board considered two proprietary management fee comparisons for the 12-month periods shown in the chart below. The group of Lipper funds used by the Board for management fee comparisons is referred to below as the "Total Mapped Group." The Total Mapped Group comparison focuses on a fund's standing relative to the total universe of comparable funds available to investors in terms of gross management fees before expense reimbursements or caps. "TMG %" represents the percentage of funds in the Total Mapped Group that had management fees that were lower than the fund's. For example, a TMG % of 13% means that 87% of the funds in the Total Mapped Group had higher management fees than the fund. The "Asset-Size Peer Group" (ASPG) comparison focuses on a fund's standing relative to non-Fidelity funds similar in size to the fund within the Total Mapped Group. The ASPG represents at least 15% of the funds in the Total Mapped Group with comparable asset size and management fee characteristics, subject to a minimum of 50 funds (or all funds in the Total Mapped Group if fewer than 50). Additional information, such as the ASPG quartile in which the fund's management fee ranked, is also included in the chart and considered by the Board.
Fidelity Advisor Emerging Markets Fund
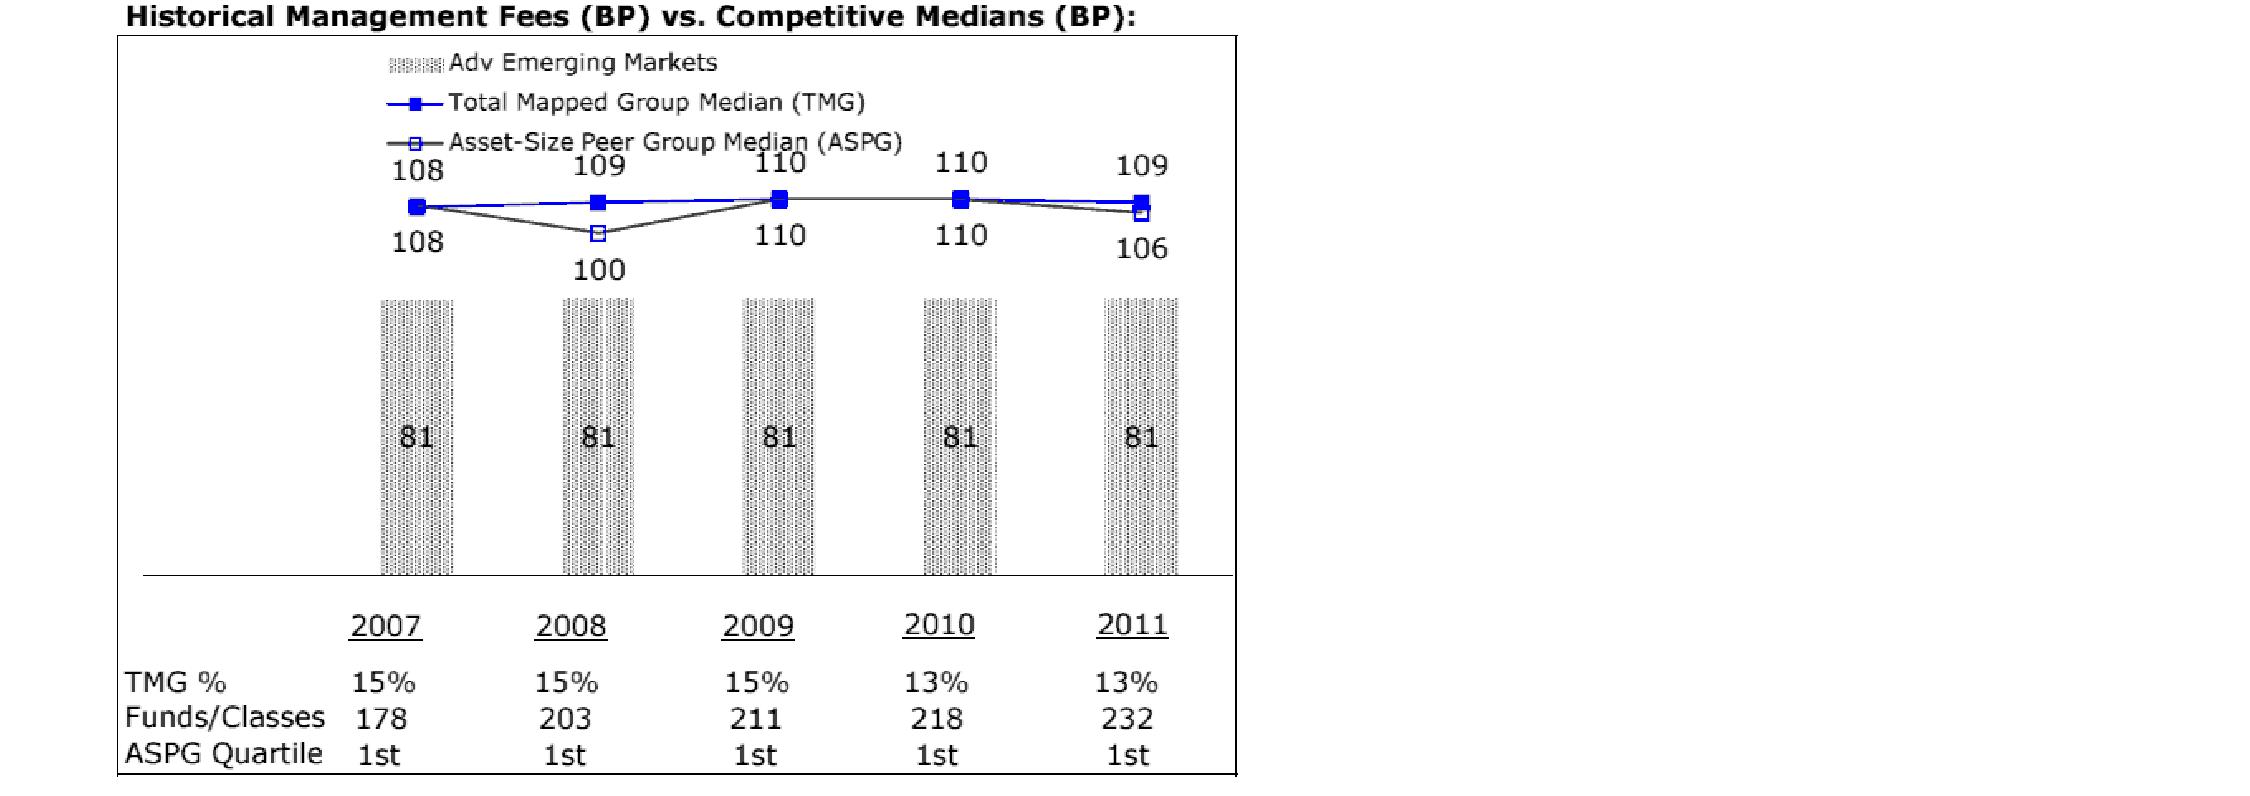
Annual Report
The Board noted that the fund's management fee ranked below the median of its Total Mapped Group and below the median of its ASPG for 2011.
Based on its review, the Board concluded that the fund's management fee is fair and reasonable in light of the services that the fund receives and the other factors considered.
Total Expense Ratio. In its review of each class's total expense ratio, the Board considered the fund's management fee as well as other fund or class expenses, as applicable, such as transfer agent fees, pricing and bookkeeping fees, fund-paid 12b-1 fees, and custodial, legal, and audit fees. The Board also noted the effects of any waivers and reimbursements on fees and expenses. As part of its review, the Board also considered the current and historical total expense ratios of each class of the fund compared to competitive fund median expenses. Each class of the fund is compared to those funds and classes in the Total Mapped Group (used by the Board for management fee comparisons) that have a similar sales load structure.
The Board noted that the total expense ratio of each of Class A, Class B, Class C, and Institutional Class ranked below its competitive median for 2011 and the total expense ratio of Class T ranked above its competitive median for 2011. The Board considered that various factors, including 12b-1 fees, positive or negative performance adjustments, and relatively higher other expenses in the case of small fund size, can affect total expense ratios. The Board noted that the total expense ratio of Class T was above the competitive median primarily because of higher 12b-1 fees on Class T. Class T has a higher 12b-1 fee, but a lower front-end sales charge, than traditionally priced front-end sales charge classes. The Board considered that Class T is primarily sold load-waived in the retirement plan market where its 0.50% 12b-1 fee is comparable to competing no-load, higher 12b-1 fee classes designed specifically for retirement plans. The Board noted that the fund offers multiple classes, each of which has a different sales load and 12b-1 fee structure, and that the multiple structures are intended to offer a range of pricing options for the intermediary market. The Board also noted that the total expense ratios of the classes vary primarily by the level of their 12b-1 fees, although differences in transfer agent fees may also cause expenses to vary from class to class.
Fees Charged to Other Fidelity Clients. The Board also considered Fidelity fee structures and other information with respect to clients of FMR and its affiliates, such as other mutual funds advised or subadvised by FMR or its affiliates, pension plan clients, and other institutional clients. The Board noted the findings of the 2010 ad hoc joint committee (created with the board of other Fidelity funds), which reviewed and compared Fidelity's institutional investment advisory business with its business of providing services to the Fidelity funds, including the differences in services provided, fees charged, and costs incurred, as well as competition in their respective marketplaces.
Annual Report
Board Approval of Investment Advisory Contracts and
Management Fees - continued
Based on its review of total expense ratios and fees charged to other Fidelity clients, the Board concluded that the total expense ratio of each class of the fund was reasonable, although Class T was above the median of the universe presented for comparison, in light of the services that the fund and its shareholders receive and the other factors considered.
Costs of the Services and Profitability. The Board considered the revenues earned and the expenses incurred by Fidelity in conducting the business of developing, marketing, distributing, managing, administering and servicing the fund and its shareholders. The Board also considered the level of Fidelity's profits in respect of all the Fidelity funds.
On an annual basis, FMR presents to the Board Fidelity's profitability for the fund. Fidelity calculates the profitability for each fund, as well as aggregate profitability for groups of Fidelity funds and all Fidelity funds, using a series of detailed revenue and cost allocation methodologies which originate with the books and records of Fidelity on which Fidelity's audited financial statements are based. The Audit Committee of the Board reviews any significant changes from the prior year's methodologies.
PricewaterhouseCoopers LLP (PwC), independent registered public accounting firm and auditor to Fidelity and certain Fidelity funds, has been engaged annually by the Board as part of the Board's assessment of Fidelity's profitability analysis. PwC's engagement includes the review and assessment of Fidelity's methodologies used in determining the revenues and expenses attributable to Fidelity's mutual fund business, and completion of agreed-upon procedures surrounding the mathematical accuracy of fund profitability and its conformity to allocation methodologies. After considering PwC's reports issued under the engagement and information provided by Fidelity, the Board concluded that while other allocation methods may also be reasonable, Fidelity's profitability methodologies are reasonable in all material respects.
The Board also reviewed Fidelity's non-fund businesses and fall-out benefits related to the mutual fund business as well as cases where Fidelity's affiliates may benefit from or be related to the fund's business.
The Board considered the costs of the services provided by and the profits realized by Fidelity in connection with the operation of the fund and was satisfied that the profitability was not excessive in the circumstances.
Economies of Scale. The Board considered whether there have been economies of scale in respect of the management of the Fidelity funds, whether the Fidelity funds (including the fund) have appropriately benefited from any such economies of scale, and whether there is potential for realization of any further economies of scale. The Board considered the extent to which the fund will benefit from economies of scale through increased services to the fund, through waivers or reimbursements, or through fee or expense reductions. The Board also noted that in 2009, it and the board of other Fidelity funds created an ad hoc committee (the Economies of Scale Committee) to analyze whether FMR attains economies of scale in respect of the management and servicing of the Fidelity funds, whether the Fidelity funds have appropriately benefited from such economies of scale, and whether there is potential for realization of any further economies of scale.
Annual Report
The Board recognized that the fund's management contract incorporates a "group fee" structure, which provides for lower group fee rates as total fund assets under FMR's management increase, and for higher group fee rates as total fund assets under FMR's management decrease. FMR calculates the group fee rates based on a tiered asset "breakpoint" schedule that varies based on asset class. The Board considered that the group fee is designed to deliver the benefits of economies of scale to fund shareholders when total Fidelity fund assets increase, even if assets of any particular fund are unchanged or have declined, because some portion of Fidelity's costs are attributable to services provided to all Fidelity funds, and all funds benefit if those costs can be allocated among more assets. The Board concluded that, given the group fee structure, fund shareholders will benefit from lower management fees as assets under FMR's management increase at the fund complex level, regardless of whether Fidelity achieves any such economies of scale.
The Board concluded, taking into account the analysis of the Economies of Scale Committee, that economies of scale, if any, are being appropriately shared between fund shareholders and Fidelity.
Additional Information Requested by the Board. In order to develop fully the factual basis for consideration of the Fidelity funds' Advisory Contracts, the Board requested and received additional information on certain topics, including (i) fund performance trends, actions to be taken by FMR to improve certain funds' overall performance, and Fidelity's long-term strategies for certain funds; (ii) the potential to further rationalize the Fidelity fund lineup with the possibility of achieving savings for the funds and Fidelity; (iii) Fidelity's compensation structure for portfolio managers and other key investment personnel; (iv) the amount of the investment that each portfolio manager has made in the Fidelity fund(s) that he or she manages; (v) the realization of fall-out benefits in certain Fidelity business units; (vi) Fidelity's group fee structures, the potential impact of regulatory changes on such structures, and the rationale for the individual fee rates of certain funds; (vii) fund profitability methodology, including Fidelity's cost allocation methodology, and the impact of certain factors on fund profitability results; (viii) trends regarding industry use of performance fee structures and the possibility of implementing performance fee structures for additional funds; and (ix) the impact of net redemptions from the Fidelity funds.
Based on its evaluation of all of the conclusions noted above, and after considering all factors it believed relevant, the Board ultimately concluded that the advisory fee structures are fair and reasonable, and that the fund's Advisory Contracts should be renewed.
Annual Report
Investment Adviser
Fidelity Management & Research Company
Boston, MA
Investment Sub-Advisers
FMR Co., Inc.
Fidelity Management & Research
(U.K.) Inc.
Fidelity Management & Research
(Hong Kong) Limited
FIL Investments (Japan) Limited
Fidelity Management & Research
(Japan) Inc.
FIL Investment Advisors (UK) Limited
FIL Investment Advisors
General Distributor
Fidelity Distributors Corporation
Smithfield, RI
Transfer and Service Agents
Fidelity Investments Institutional Operations Company, Inc.
Boston, MA
Fidelity Service Company, Inc.
Boston, MA
Custodian
JPMorgan Chase Bank
New York, NY
(Fidelity Investment logo)(registered trademark)
FAEMI-UANN-1212
1.809006.108
(Fidelity Investment logo)(registered trademark)
Fidelity Advisor®
Diversified International
Fund - Class A, Class T, Class B
and Class C
Annual Report
October 31, 2012
(Fidelity Cover Art)
Contents
Performance | (Click Here) | How the fund has done over time. |
Management's Discussion of Fund Performance | (Click Here) | The Portfolio Manager's review of fund performance and strategy. |
Shareholder Expense Example | (Click Here) | An example of shareholder expenses. |
Investment Changes | (Click Here) | A summary of major shifts in the fund's investments over the past six months. |
Investments | (Click Here) | A complete list of the fund's investments with their market values. |
Financial Statements | (Click Here) | Statements of assets and liabilities, operations, and changes in net assets, as well as financial highlights. |
Notes | (Click Here) | Notes to the financial statements. |
Report of Independent Registered Public Accounting Firm | (Click Here) | |
Trustees and Officers | (Click Here) | |
Distributions | (Click Here) | |
Board Approval of Investment Advisory Contracts and Management Fees | (Click Here) | |
To view a fund's proxy voting guidelines and proxy voting record for the 12-month period ended June 30, visit http://www.fidelity.com/proxyvotingresults or visit the Securities and Exchange Commission's (SEC) web site at http://www.sec.gov. You may also call 1-877-208-0098 to request a free copy of the proxy voting guidelines.
Standard & Poor's, S&P and S&P 500 are registered service marks of The McGraw-Hill Companies, Inc. and have been licensed for use by Fidelity Distributors Corporation.
Other third party marks appearing herein are the property of their respective owners.
All other marks appearing herein are registered or unregistered trademarks or service marks of FMR LLC or an affiliated company. © 2012 FMR LLC. All rights reserved.
Annual Report
This report and the financial statements contained herein are submitted for the general information of the shareholders of the fund. This report is not authorized for distribution to prospective investors in the fund unless preceded or accompanied by an effective prospectus.
A fund files its complete schedule of portfolio holdings with the SEC for the first and third quarters of each fiscal year on Form N-Q. Forms N-Q are available on the SEC's web site at http://www.sec.gov. A fund's Forms N-Q may be reviewed and copied at the SEC's Public Reference Room in Washington, DC. Information regarding the operation of the SEC's Public Reference Room may be obtained by calling 1-800-SEC-0330. For a complete list of a fund's portfolio holdings, view the most recent holdings listing, semiannual report, or annual report on Fidelity's web site at http://www.fidelity.com, http://www.advisor.fidelity.com, or http://www.401k.com, as applicable.
NOT FDIC INSURED • MAY LOSE VALUE • NO BANK GUARANTEE
Neither the fund nor Fidelity Distributors Corporation is a bank.
Annual Report
Average annual total return reflects the change in the value of an investment, assuming reinvestment of the class' distributions from dividend income and capital gains (the profits earned upon the sale of securities that have grown in value, if any) and assuming a constant rate of performance each year. The $10,000 table and the fund's returns do not reflect the deduction of taxes that a shareholder would pay on fund distributions or the redemption of fund shares. During periods of reimbursement by Fidelity, a fund's total return will be greater than it would be had the reimbursement not occurred. How a fund did yesterday is no guarantee of how it will do tomorrow. Returns reflect the conversion of Class B shares to Class A shares after a maximum of seven years.
Average Annual Total Returns
Periods ended October 31, 2012 | Past 1
year | Past 5
years | Past 10
years |
Class A (incl. 5.75% sales charge) | 2.23% | -7.19% | 6.71% |
Class T (incl. 3.50% sales charge) | 4.39% | -6.98% | 6.69% |
Class B (incl. contingent deferred sales charge) A | 2.64% | -7.13% | 6.70% |
Class C (incl. contingent deferred sales charge) B | 6.71% | -6.77% | 6.52% |
A Class B shares' contingent deferred sales charges included in the past one year, past five years, and past ten years total return figures are 5%, 2%, and 0%, respectively.
B Class C shares' contingent deferred sales charges included in the past one year, past five years, and past ten years total return figures are 1%, 0%, and 0%, respectively.
Annual Report
$10,000 Over 10 Years
Let's say hypothetically that $10,000 was invested in Fidelity Advisor® Diversified International Fund - Class A on October 31, 2002, and the current 5.75% sales charge was paid. The chart shows how the value of your investment would have changed, and also shows how the MSCI® EAFE® Index performed over the same period.
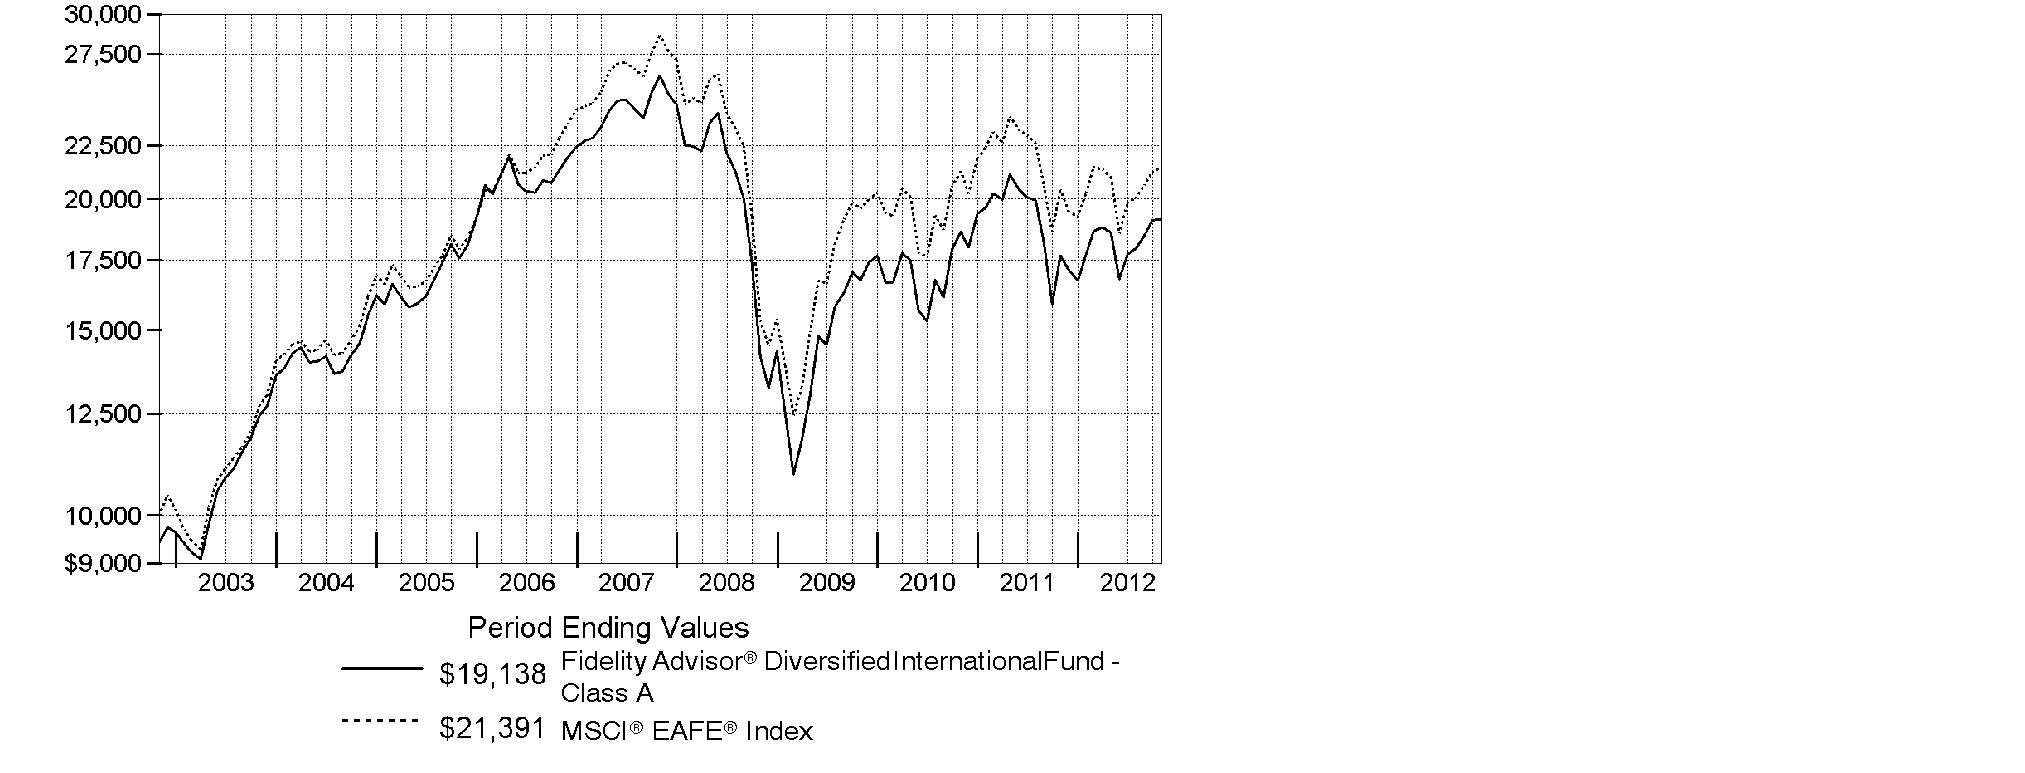
Annual Report
Market Recap: International stocks experienced pendulum-like swings during the 12 months ending October 31, 2012, finishing the period with a modest advance. The market faced periodic bouts of volatility this past year, as a number of macroeconomic concerns - including the eurozone debt crisis, the strength and pace of the U.S. economic recovery, and a slowdown in China's once-blistering growth - dominated headlines and weighed on investors. While a stronger U.S. dollar provided an additional head wind, foreign developed- and emerging-markets stocks still managed a gain for the 12 months, as the MSCI® ACWI® (All Country World Index) ex USA Index rose 4.11%, largely buttressed in the summertime by pledges of accommodative monetary action from eurozone officials, as well as signs that the U.S. housing market was on the mend. Within the index, Asia-Pacific ex Japan showed the most impressive gains, advancing roughly 11%. A number of core European components, most notably Germany (+11%), Switzerland (+10%) and the U.K. (+9%), benefited from optimism about the eurozone's ability to resolve its debt woes, which also helped the region outpace the index overall. Elsewhere, results from Canada (+3%) and the generally more volatile emerging markets (+2%) each fell short of the MSCI index, while Japan was among the few benchmark constituents to finish in the red, returning about -3%.
Comments from William Bower, Portfolio Manager of Fidelity Advisor® Diversified International Fund: For the year, the fund's Class A, Class T, Class B and Class C shares returned 8.47%, 8.17%, 7.64% and 7.71%, respectively (excluding sales charges), solidly outperforming the 4.76% gain of the MSCI® EAFE® Index. Stock selection in information technology, consumer staples, health care and consumer discretionary helped relative performance. Geographically, the fund benefited from security selection in Europe - particularly Spain and France - and Japan. Top individual contributors included Danish pharmaceuticals firm Novo Nordisk, U.S. consumer electronics giant Apple, Belgian brewer Anheuser-Busch InBev, South Korean snack maker Orion, Japanese drugstore operator Cosmos Pharmaceutical, Spanish online retailer Inditex and not owning Spanish telecommunications company and index component Telefonica. Conversely, stock selection in energy and an underweighting in financials hurt. Among the main detractors were Canadian energy exploration and production companies Niko Resources and Petrominerales, Japanese Internet retailer Rakuten, Australian gold firm Newcrest Mining and Chinese search engine company Baidu, which is listed in the Cayman Islands. Some of the stocks mentioned in this review were not in the index, and Niko was not held at period end.
The views expressed above reflect those of the portfolio manager(s) only through the end of the period as stated on the cover of this report and do not necessarily represent the views of Fidelity or any other person in the Fidelity organization. Any such views are subject to change at any time based upon market or other conditions and Fidelity disclaims any responsibility to update such views. These views may not be relied on as investment advice and, because investment decisions for a Fidelity fund are based on numerous factors, may not be relied on as an indication of trading intent on behalf of any Fidelity fund.
Annual Report
Shareholder Expense Example
As a shareholder of the Fund, you incur two types of costs: (1) transaction costs, including sales charges (loads) on purchase payments or redemption proceeds, redemption fees and (2) ongoing costs, including management fees, distribution and/or service (12b-1) fees and other Fund expenses. This Example is intended to help you understand your ongoing costs (in dollars) of investing in the Fund and to compare these costs with the ongoing costs of investing in other mutual funds.
The Example is based on an investment of $1,000 invested at the beginning of the period and held for the entire period (May 1, 2012 to October 31, 2012).
Actual Expenses
The first line of the accompanying table for each class of the Fund provides information about actual account values and actual expenses. You may use the information in this line, together with the amount you invested, to estimate the expenses that you paid over the period. Simply divide your account value by $1,000.00 (for example, an $8,600 account value divided by $1,000.00 = 8.6), then multiply the result by the number in the first line for a class of the Fund under the heading entitled "Expenses Paid During Period" to estimate the expenses you paid on your account during this period. In addition, the Fund, as a shareholder in the underlying Fidelity Central Funds, will indirectly bear its pro-rata share of the fees and expenses incurred by the underlying Fidelity Central Funds. These fees and expenses are not included in the Fund's annualized expense ratio used to calculate the expense estimate in the table below.
Hypothetical Example for Comparison Purposes
The second line of the accompanying table for each class of the Fund provides information about hypothetical account values and hypothetical expenses based on a Class' actual expense ratio and an assumed rate of return of 5% per year before expenses, which is not the Class' actual return. The hypothetical account values and expenses may not be used to estimate the actual ending account balance or expenses you paid for the period. You may use this information to compare the ongoing costs of investing in the Fund and other funds. To do so, compare this 5% hypothetical example with the 5% hypothetical examples that appear in the shareholder reports of the other funds. In addition, the Fund, as a shareholder in the underlying Fidelity Central Funds, will indirectly bear its pro-rata share of the fees and expenses incurred by the underlying Fidelity Central Funds. These fees and expenses are not included in the Fund's annualized expense ratio used to calculate the expense estimate in the table below.
Please note that the expenses shown in the table are meant to highlight your ongoing costs only and do not reflect any transaction costs. Therefore, the second line of the table is useful in comparing ongoing costs only, and will not help you determine the relative total costs of owning different funds. In addition, if these transactional costs were included, your costs would have been higher.
Annual Report
| Annualized
Expense Ratio | Beginning
Account Value
May 1, 2012 | Ending
Account Value
October 31, 2012 | Expenses Paid
During Period*
May 1, 2012
to October 31, 2012 |
Class A | 1.32% | | | |
Actual | | $ 1,000.00 | $ 1,029.60 | $ 6.73 |
Hypothetical A | | $ 1,000.00 | $ 1,018.50 | $ 6.70 |
Class T | 1.57% | | | |
Actual | | $ 1,000.00 | $ 1,027.90 | $ 8.00 |
Hypothetical A | | $ 1,000.00 | $ 1,017.24 | $ 7.96 |
Class B | 2.07% | | | |
Actual | | $ 1,000.00 | $ 1,025.40 | $ 10.54 |
Hypothetical A | | $ 1,000.00 | $ 1,014.73 | $ 10.48 |
Class C | 2.05% | | | |
Actual | | $ 1,000.00 | $ 1,026.00 | $ 10.44 |
Hypothetical A | | $ 1,000.00 | $ 1,014.83 | $ 10.38 |
Institutional Class | .99% | | | |
Actual | | $ 1,000.00 | $ 1,031.80 | $ 5.06 |
Hypothetical A | | $ 1,000.00 | $ 1,020.16 | $ 5.03 |
A 5% return per year before expenses
* Expenses are equal to each Class' annualized expense ratio, multiplied by the average account value over the period, multiplied by 184/366 (to reflect the one-half year period).
Annual Report
Investment Changes (Unaudited)
Top Five Stocks as of October 31, 2012 |
| % of fund's
net assets | % of fund's net assets
6 months ago |
Novo Nordisk A/S Series B (Denmark, Pharmaceuticals) | 2.7 | 2.6 |
Sanofi SA (France, Pharmaceuticals) | 2.6 | 1.9 |
Royal Dutch Shell PLC Class B (United Kingdom, Oil, Gas & Consumable Fuels) | 2.3 | 3.1 |
Anheuser-Busch InBev SA NV (Belgium, Beverages) | 2.2 | 1.7 |
BHP Billiton Ltd. sponsored ADR (Australia, Metals & Mining) | 2.1 | 2.1 |
| 11.9 | |
Top Five Market Sectors as of October 31, 2012 |
| % of fund's
net assets | % of fund's net assets
6 months ago |
Financials | 15.6 | 15.1 |
Consumer Discretionary | 15.4 | 16.1 |
Consumer Staples | 15.4 | 12.7 |
Health Care | 12.9 | 10.6 |
Information Technology | 10.3 | 10.6 |
Top Five Countries as of October 31, 2012 |
(excluding cash equivalents) | % of fund's
net assets | % of fund's net assets
6 months ago |
United Kingdom | 17.6 | 17.9 |
Japan | 15.0 | 15.7 |
Germany | 8.8 | 8.1 |
France | 8.6 | 7.3 |
Switzerland | 5.0 | 4.2 |
Percentages are adjusted for the effect of open futures contracts, if applicable. |
Asset Allocation (% of fund's net assets) |
As of October 31, 2012 | As of April 30, 2012 |
| Stocks 98.3% | | | Stocks 95.6% | |
 | Other Investments 0.0%* | | | Other Investments 0.0%* | |
| Short-Term
Investments and
Net Other Assets
(Liabilities) 1.7% | | | Short-Term
Investments and
Net Other Assets
(Liabilities) 4.4% | |
* Amount represents less than 0.1% |

Annual Report
Investments October 31, 2012
Showing Percentage of Net Assets
Common Stocks - 96.9% |
| Shares | | Value (000s) |
Australia - 4.3% |
Australia & New Zealand Banking Group Ltd. | 521,018 | | $ 13,764 |
BHP Billiton Ltd. sponsored ADR (d) | 569,136 | | 40,261 |
CSL Ltd. | 150,024 | | 7,397 |
Iluka Resources Ltd. | 236,843 | | 2,439 |
Newcrest Mining Ltd. | 280,117 | | 7,685 |
Origin Energy Ltd. | 297,766 | | 3,511 |
Spark Infrastructure Group unit | 1,390,264 | | 2,439 |
Telstra Corp. Ltd. | 1,209,105 | | 5,196 |
TOTAL AUSTRALIA | | 82,692 |
Bailiwick of Guernsey - 0.7% |
Resolution Ltd. | 3,544,018 | | 12,485 |
Bailiwick of Jersey - 1.4% |
Experian PLC | 836,500 | | 14,444 |
Randgold Resources Ltd. sponsored ADR | 42,300 | | 5,059 |
Shire PLC | 135,100 | | 3,799 |
WPP PLC | 326,324 | | 4,218 |
TOTAL BAILIWICK OF JERSEY | | 27,520 |
Belgium - 2.3% |
Anheuser-Busch InBev SA NV | 504,331 | | 42,178 |
UCB SA | 35,400 | | 2,065 |
TOTAL BELGIUM | | 44,243 |
Bermuda - 0.5% |
Assured Guaranty Ltd. | 290,700 | | 4,038 |
Clear Media Ltd. | 10,117,000 | | 5,222 |
TOTAL BERMUDA | | 9,260 |
Brazil - 1.3% |
Anhanguera Educacional Participacoes SA | 216,900 | | 3,802 |
BR Malls Participacoes SA | 72,700 | | 956 |
Estacio Participacoes SA | 202,800 | | 3,864 |
Kroton Educacional SA unit (a) | 128,700 | | 2,573 |
Porto Seguro SA | 204,300 | | 2,173 |
Qualicorp SA (a) | 447,000 | | 4,587 |
Souza Cruz SA | 287,400 | | 3,750 |
Tractebel Energia SA | 181,600 | | 3,129 |
TOTAL BRAZIL | | 24,834 |
British Virgin Islands - 0.2% |
Mail.ru Group Ltd. GDR (Reg. S) | 105,400 | | 3,515 |
Common Stocks - continued |
| Shares | | Value (000s) |
Canada - 3.4% |
Alimentation Couche-Tard, Inc. Class B (sub. vtg.) | 67,100 | | $ 3,296 |
ARC Resources Ltd. (d) | 76,700 | | 1,862 |
Canadian Natural Resources Ltd. | 235,500 | | 7,097 |
Catamaran Corp. (a) | 43,800 | | 2,057 |
CGI Group, Inc. Class A (sub. vtg.) (a) | 107,500 | | 2,812 |
Fairfax Financial Holdings Ltd. (sub. vtg.) | 14,900 | | 5,528 |
Franco-Nevada Corp. | 74,000 | | 4,261 |
Goldcorp, Inc. | 172,400 | | 7,794 |
Painted Pony Petroleum Ltd. (a)(e) | 170,900 | | 1,848 |
Painted Pony Petroleum Ltd. Class A (a) | 420,800 | | 4,550 |
Penn West Petroleum Ltd. | 156,300 | | 2,030 |
Petrobank Energy & Resources Ltd. (a) | 267,200 | | 3,671 |
Petrominerales Ltd. (d) | 119,814 | | 961 |
Suncor Energy, Inc. | 319,700 | | 10,730 |
Tourmaline Oil Corp. (a) | 150,000 | | 4,956 |
TransForce, Inc. | 23,300 | | 425 |
Turquoise Hill Resources Ltd. (a) | 233,521 | | 1,826 |
TOTAL CANADA | | 65,704 |
Cayman Islands - 1.5% |
Baidu.com, Inc. sponsored ADR (a) | 100,500 | | 10,715 |
Haitian International Holdings Ltd. | 653,000 | | 806 |
Hengan International Group Co. Ltd. | 801,000 | | 7,297 |
HiSoft Technology International Ltd. ADR (a) | 178,100 | | 1,850 |
Sands China Ltd. | 2,052,800 | | 7,721 |
TOTAL CAYMAN ISLANDS | | 28,389 |
Curacao - 0.4% |
Schlumberger Ltd. | 105,300 | | 7,322 |
Denmark - 3.0% |
Novo Nordisk A/S Series B | 318,608 | | 51,070 |
William Demant Holding A/S (a) | 82,847 | | 7,125 |
TOTAL DENMARK | | 58,195 |
France - 8.6% |
Alstom SA | 49,900 | | 1,704 |
Arkema SA | 74,800 | | 6,820 |
AXA SA | 386,800 | | 6,149 |
BNP Paribas SA | 446,143 | | 22,443 |
Bureau Veritas SA | 75,000 | | 7,965 |
Edenred SA | 143,610 | | 4,156 |
Essilor International SA | 137,858 | | 12,428 |
Common Stocks - continued |
| Shares | | Value (000s) |
France - continued |
Eurofins Scientific SA | 37,700 | | $ 5,830 |
JC Decaux SA | 128,200 | | 2,713 |
LVMH Moet Hennessy - Louis Vuitton SA | 58,229 | | 9,464 |
PPR SA | 87,700 | | 15,420 |
Publicis Groupe SA | 131,600 | | 7,090 |
Sanofi SA | 565,091 | | 49,631 |
Schneider Electric SA | 69,000 | | 4,314 |
Vivendi SA | 457,385 | | 9,358 |
TOTAL FRANCE | | 165,485 |
Germany - 7.4% |
adidas AG | 139,100 | | 11,851 |
Allianz AG | 93,617 | | 11,608 |
BASF AG | 271,541 | | 22,501 |
Bayer AG | 273,952 | | 23,858 |
Brenntag AG | 16,500 | | 2,080 |
CompuGROUP Holding AG | 132,400 | | 2,403 |
Deutsche Post AG | 232,375 | | 4,607 |
ElringKlinger AG | 90,000 | | 2,499 |
Fresenius Medical Care AG & Co. KGaA | 77,500 | | 5,445 |
Fresenius SE & Co. KGaA | 109,500 | | 12,490 |
Linde AG | 99,947 | | 16,809 |
SAP AG | 345,306 | | 25,181 |
TOTAL GERMANY | | 141,332 |
Hong Kong - 1.3% |
AIA Group Ltd. | 3,326,800 | | 13,178 |
Galaxy Entertainment Group Ltd. (a) | 2,108,000 | | 7,249 |
Henderson Land Development Co. Ltd. | 721,863 | | 5,002 |
TOTAL HONG KONG | | 25,429 |
India - 2.3% |
Apollo Hospitals Enterprise Ltd. | 13,241 | | 192 |
Bajaj Auto Ltd. | 96,460 | | 3,256 |
Colgate-Palmolive (India) | 84,807 | | 2,026 |
Godrej Consumer Products Ltd. | 153,019 | | 2,052 |
HDFC Bank Ltd. | 1,127,531 | | 13,239 |
Housing Development Finance Corp. Ltd. | 659,905 | | 9,350 |
ITC Ltd. | 989,338 | | 5,195 |
Mahindra & Mahindra Financial Services Ltd. | 187,963 | | 3,028 |
Pidilite Industries Ltd. (a) | 514,340 | | 1,838 |
Common Stocks - continued |
| Shares | | Value (000s) |
India - continued |
Shriram Transport Finance Co. Ltd. | 171,963 | | $ 1,998 |
Smithkline Beecham Consumer Healthcare Ltd. | 34,102 | | 1,925 |
TOTAL INDIA | | 44,099 |
Ireland - 0.6% |
Accenture PLC Class A | 102,100 | | 6,883 |
Elan Corp. PLC sponsored ADR (a) | 254,700 | | 2,751 |
Ryanair Holdings PLC sponsored ADR | 61,600 | | 1,987 |
TOTAL IRELAND | | 11,621 |
Isle of Man - 0.0% |
3Legs Resources PLC (a) | 645,100 | | 416 |
Israel - 0.1% |
Rami Levi Chain Stores Hashikma Marketing 2006 Ltd. | 78,398 | | 2,336 |
Italy - 1.7% |
ENI SpA | 382,800 | | 8,809 |
Fiat Industrial SpA | 523,000 | | 5,664 |
Prada SpA | 701,200 | | 5,718 |
Prysmian SpA | 29,800 | | 573 |
Saipem SpA | 251,240 | | 11,287 |
TOTAL ITALY | | 32,051 |
Japan - 15.0% |
ABC-Mart, Inc. | 100,000 | | 4,384 |
Aeon Credit Service Co. Ltd. | 509,400 | | 10,810 |
Aozora Bank Ltd. | 1,007,000 | | 2,838 |
Calbee, Inc. (d) | 95,200 | | 8,741 |
Cosmos Pharmaceutical Corp. (d) | 106,600 | | 10,509 |
Denso Corp. | 92,900 | | 2,908 |
Don Quijote Co. Ltd. | 283,200 | | 11,157 |
Fanuc Corp. | 60,500 | | 9,632 |
Fast Retailing Co. Ltd. | 25,800 | | 5,746 |
Hitachi Ltd. | 3,632,000 | | 19,245 |
Honda Motor Co. Ltd. sponsored ADR | 597,906 | | 18,033 |
Hoya Corp. | 238,700 | | 4,832 |
Itochu Corp. | 577,000 | | 5,775 |
Japan Tobacco, Inc. | 890,400 | | 24,605 |
JS Group Corp. | 210,700 | | 4,658 |
JSR Corp. | 464,500 | | 7,960 |
Keyence Corp. | 61,600 | | 16,343 |
Mitsubishi UFJ Financial Group, Inc. | 1,459,900 | | 6,605 |
Nintendo Co. Ltd. | 17,400 | | 2,241 |
Common Stocks - continued |
| Shares | | Value (000s) |
Japan - continued |
Nitto Denko Corp. | 83,200 | | $ 3,773 |
ORIX Corp. | 294,300 | | 30,230 |
Rakuten, Inc. | 2,289,600 | | 20,593 |
Seven & i Holdings Co., Ltd. | 474,700 | | 14,640 |
Seven Bank Ltd. | 1,121,800 | | 3,204 |
SHIMANO, Inc. | 93,800 | | 5,910 |
SMC Corp. | 61,600 | | 9,707 |
Softbank Corp. | 466,400 | | 14,764 |
Unicharm Corp. | 69,500 | | 3,761 |
USS Co. Ltd. | 18,600 | | 1,955 |
Yahoo! Japan Corp. | 5,812 | | 2,000 |
TOTAL JAPAN | | 287,559 |
Korea (South) - 2.5% |
AMOREPACIFIC Corp. | 4,423 | | 5,030 |
Hyundai Motor Co. | 33,442 | | 6,886 |
LG Household & Health Care Ltd. | 5,491 | | 3,228 |
Orion Corp. | 12,572 | | 11,807 |
Samsung Electronics Co. Ltd. | 17,735 | | 21,308 |
TOTAL KOREA (SOUTH) | | 48,259 |
Mexico - 0.7% |
America Movil SAB de CV Series L sponsored ADR | 295,900 | | 7,483 |
Fomento Economico Mexicano SAB de CV sponsored ADR | 14,600 | | 1,323 |
Mexichem SAB de CV | 849,600 | | 4,210 |
TOTAL MEXICO | | 13,016 |
Netherlands - 2.7% |
AEGON NV | 2,237,900 | | 12,516 |
ASML Holding NV (Netherlands) | 156,700 | | 8,614 |
DE Master Blenders 1753 NV (a) | 644,600 | | 7,878 |
Gemalto NV | 55,000 | | 4,963 |
Heineken NV (Bearer) | 78,700 | | 4,852 |
NXP Semiconductors NV (a) | 216,400 | | 5,250 |
Unilever NV (Certificaten Van Aandelen) (Bearer) | 221,000 | | 8,123 |
TOTAL NETHERLANDS | | 52,196 |
Nigeria - 0.2% |
Nigerian Breweries PLC | 4,795,344 | | 3,700 |
Common Stocks - continued |
| Shares | | Value (000s) |
Norway - 1.1% |
DnB NOR ASA | 350,799 | | $ 4,381 |
Telenor ASA | 822,000 | | 16,162 |
TOTAL NORWAY | | 20,543 |
Singapore - 0.3% |
Avago Technologies Ltd. | 54,200 | | 1,790 |
First Resources Ltd. | 1,100,000 | | 1,849 |
United Overseas Bank Ltd. | 182,000 | | 2,726 |
TOTAL SINGAPORE | | 6,365 |
South Africa - 0.7% |
Life Healthcare Group Holdings Ltd. | 641,500 | | 2,426 |
Nampak Ltd. | 573,700 | | 1,912 |
Naspers Ltd. Class N | 86,400 | | 5,609 |
Shoprite Holdings Ltd. | 52,800 | | 1,086 |
Tiger Brands Ltd. | 82,000 | | 2,606 |
TOTAL SOUTH AFRICA | | 13,639 |
Spain - 3.4% |
Amadeus IT Holding SA Class A | 230,600 | | 5,709 |
Banco Bilbao Vizcaya Argentaria SA | 722,253 | | 6,035 |
Grifols SA ADR | 248,495 | | 6,252 |
Inditex SA | 262,272 | | 33,464 |
Prosegur Compania de Seguridad SA (Reg.) | 1,557,860 | | 8,481 |
Repsol YPF SA | 243,602 | | 4,869 |
TOTAL SPAIN | | 64,810 |
Sweden - 1.3% |
ASSA ABLOY AB (B Shares) | 59,600 | | 1,987 |
Atlas Copco AB (A Shares) | 81,100 | | 1,994 |
H&M Hennes & Mauritz AB (B Shares) | 73,663 | | 2,493 |
Svenska Handelsbanken AB (A Shares) | 196,300 | | 6,724 |
Swedbank AB (A Shares) | 414,600 | | 7,688 |
Swedish Match Co. AB | 140,200 | | 4,777 |
TOTAL SWEDEN | | 25,663 |
Switzerland - 5.0% |
Kuehne & Nagel International AG | 32,840 | | 3,833 |
Nestle SA | 552,587 | | 35,067 |
Roche Holding AG (participation certificate) | 36,535 | | 7,026 |
SGS SA (Reg.) | 1,910 | | 4,044 |
Syngenta AG (Switzerland) | 50,470 | | 19,678 |
Common Stocks - continued |
| Shares | | Value (000s) |
Switzerland - continued |
UBS AG | 1,130,550 | | $ 16,962 |
Zurich Financial Services AG | 37,441 | | 9,227 |
TOTAL SWITZERLAND | | 95,837 |
Taiwan - 0.5% |
HIWIN Technologies Corp. | 11,150 | | 72 |
Taiwan Semiconductor Manufacturing Co. Ltd. sponsored ADR | 550,300 | | 8,750 |
TOTAL TAIWAN | | 8,822 |
United Kingdom - 17.6% |
Aggreko PLC | 57,700 | | 2,002 |
Babcock International Group PLC | 119,000 | | 1,878 |
Barclays PLC | 3,640,520 | | 13,462 |
Barratt Developments PLC (a) | 423,200 | | 1,295 |
BG Group PLC | 387,092 | | 7,168 |
British American Tobacco PLC sponsored ADR | 158,000 | | 15,699 |
Capita Group PLC | 361,700 | | 4,220 |
Compass Group PLC | 213,400 | | 2,342 |
Diageo PLC | 168,843 | | 4,827 |
Domino's Pizza UK & IRL PLC | 305,400 | | 2,491 |
Filtrona PLC | 693,600 | | 6,414 |
GlaxoSmithKline PLC | 1,155,800 | | 25,899 |
Hikma Pharmaceuticals PLC | 227,188 | | 2,711 |
HSBC Holdings PLC sponsored ADR | 732,600 | | 36,161 |
IMI PLC | 66,800 | | 1,029 |
Imperial Tobacco Group PLC | 282,905 | | 10,683 |
Inchcape PLC | 764,692 | | 4,961 |
InterContinental Hotel Group PLC | 175,880 | | 4,352 |
Intertek Group PLC | 234,300 | | 10,659 |
Kingfisher PLC | 431,900 | | 2,018 |
London Stock Exchange Group PLC | 126,200 | | 1,987 |
Meggitt PLC | 748,900 | | 4,665 |
Michael Page International PLC | 662,900 | | 3,855 |
National Grid PLC | 273,948 | | 3,124 |
Next PLC | 302,200 | | 17,390 |
Persimmon PLC | 90,400 | | 1,160 |
Reckitt Benckiser Group PLC | 371,713 | | 22,494 |
Rolls-Royce Group PLC | 1,257,600 | | 17,342 |
Rolls-Royce Group PLC Class C | 95,577,600 | | 154 |
Royal Dutch Shell PLC Class B (United Kingdom) | 1,256,415 | | 44,442 |
Serco Group PLC | 429,704 | | 3,928 |
Standard Chartered PLC (United Kingdom) | 188,494 | | 4,452 |
Common Stocks - continued |
| Shares | | Value (000s) |
United Kingdom - continued |
Taylor Wimpey PLC | 4,477,700 | | $ 4,415 |
Tesco PLC | 451,200 | | 2,329 |
Travis Perkins PLC | 126,400 | | 2,203 |
Vodafone Group PLC sponsored ADR | 1,432,300 | | 38,987 |
Whitbread PLC | 115,147 | | 4,367 |
TOTAL UNITED KINGDOM | | 337,565 |
United States of America - 4.9% |
Allergan, Inc. | 42,200 | | 3,795 |
Apple, Inc. | 18,100 | | 10,771 |
Beam, Inc. | 55,600 | | 3,089 |
Cognizant Technology Solutions Corp. Class A (a) | 49,300 | | 3,286 |
Cummins, Inc. | 32,200 | | 3,013 |
D.R. Horton, Inc. | 46,400 | | 973 |
Facebook, Inc. Class B (a)(f) | 131,847 | | 2,506 |
Freeport-McMoRan Copper & Gold, Inc. | 48,000 | | 1,866 |
Gilead Sciences, Inc. (a) | 80,400 | | 5,400 |
Las Vegas Sands Corp. | 83,800 | | 3,892 |
MasterCard, Inc. Class A | 19,440 | | 8,960 |
McGraw-Hill Companies, Inc. | 111,000 | | 6,136 |
Noble Energy, Inc. | 75,600 | | 7,183 |
Polycom, Inc. (a) | 275,000 | | 2,756 |
PriceSmart, Inc. | 26,300 | | 2,183 |
Virgin Media, Inc. (d) | 99,500 | | 3,258 |
ViroPharma, Inc. (a) | 107,100 | | 2,704 |
Visa, Inc. Class A | 76,900 | | 10,671 |
VMware, Inc. Class A (a) | 25,300 | | 2,145 |
Workday, Inc. | 21,200 | | 1,028 |
Yum! Brands, Inc. | 102,800 | | 7,207 |
TOTAL UNITED STATES OF AMERICA | | 92,822 |
TOTAL COMMON STOCKS (Cost $1,613,286) |
1,857,724
|
Nonconvertible Preferred Stocks - 1.4% |
| | | |
Germany - 1.4% |
Henkel AG & Co. KGaA | 66,600 | | 5,318 |
ProSiebenSat.1 Media AG | 179,600 | | 5,005 |
Volkswagen AG | 80,200 | | 16,591 |
TOTAL NONCONVERTIBLE PREFERRED STOCKS (Cost $16,635) |
26,914
|
Master Notes - 0.0% |
| Principal
Amount (000s) | | Value (000s) |
Canada - 0.0% |
OZ Optics Ltd. 5% 11/5/14 (f)
(Cost $10) | | $ 10 | | $ 10 |
Money Market Funds - 2.7% |
| Shares | | |
Fidelity Cash Central Fund, 0.19% (b) | 38,341,533 | | 38,342 |
Fidelity Securities Lending Cash Central Fund, 0.19% (b)(c) | 12,479,420 | | 12,479 |
TOTAL MONEY MARKET FUNDS (Cost $50,821) |
50,821
|
TOTAL INVESTMENT PORTFOLIO - 101.0% (Cost $1,680,752) | | 1,935,469 |
NET OTHER ASSETS (LIABILITIES) - (1.0)% | | (18,471) |
NET ASSETS - 100% | $ 1,916,998 |
Legend |
(a) Non-income producing |
(b) Affiliated fund that is available only to investment companies and other accounts managed by Fidelity Investments. The rate quoted is the annualized seven-day yield of the fund at period end. A complete unaudited listing of the fund's holdings as of its most recent quarter end is available upon request. In addition, each Fidelity Central Fund's financial statements, which are not covered by the Fund's Report of Independent Registered Public Accounting Firm, are available on the SEC's website or upon request. |
(c) Investment made with cash collateral received from securities on loan. |
(d) Security or a portion of the security is on loan at period end. |
(e) Security exempt from registration under Rule 144A of the Securities Act of 1933. These securities may be resold in transactions exempt from registration, normally to qualified institutional buyers. At the end of the period, the value of these securities amounted to $1,848,000 or 0.1% of net assets. |
(f) Restricted securities - Investment in securities not registered under the Securities Act of 1933 (excluding 144A issues). At the end of the period, the value of restricted securities (excluding 144A issues) amounted to $2,516,000 or 0.1% of net assets. |
Additional information on each restricted holding is as follows: |
Security | Acquisition Date | Acquisition Cost (000s) |
Facebook, Inc. Class B | 3/31/11 | $ 3,296 |
OZ Optics Ltd. 5% 11/5/14 | 11/5/10 | $ 10 |
Affiliated Central Funds |
Information regarding fiscal year to date income earned by the Fund from investments in Fidelity Central Funds is as follows: |
Fund | Income earned
(Amounts in thousands) |
Fidelity Cash Central Fund | $ 64 |
Fidelity Securities Lending Cash Central Fund | 1,352 |
Total | $ 1,416 |
Other Information |
Categorizations in the Schedule of Investments are based on country or territory of incorporation. |
The following is a summary of the inputs used, as of October 31, 2012, involving the Fund's assets and liabilities carried at fair value. The inputs or methodology used for valuing securities may not be an indication of the risk associated with investing in those securities. For more information on valuation inputs, and their aggregation into the levels used in the tables below, please refer to the Security Valuation section in the accompanying Notes to Financial Statements. |
Valuation Inputs at Reporting Date: |
Description
(Amounts in thousands) | Total | Level 1 | Level 2 | Level 3 |
Investments in Securities: | | | | |
Equities: | | | | |
Consumer Discretionary | $ 299,651 | $ 291,081 | $ 8,570 | $ - |
Consumer Staples | 290,259 | 235,131 | 55,128 | - |
Energy | 132,712 | 79,461 | 53,251 | - |
Financials | 300,947 | 232,128 | 68,819 | - |
Health Care | 249,341 | 113,497 | 135,844 | - |
Industrials | 153,856 | 153,856 | - | - |
Information Technology | 194,124 | 157,823 | 36,301 | - |
Materials | 163,106 | 143,428 | 19,678 | - |
Telecommunication Services | 91,950 | 91,950 | - | - |
Utilities | 8,692 | 5,568 | 3,124 | - |
Master Notes | 10 | - | - | 10 |
Money Market Funds | 50,821 | 50,821 | - | - |
Total Investments in Securities: | $ 1,935,469 | $ 1,554,744 | $ 380,715 | $ 10 |
The following is a summary of transfers between Level 1 and Level 2 for the period ended October 31, 2012. Transfers are assumed to have occurred at the beginning of the period, and are primarily attributable to the valuation techniques used for foreign equity securities, as discussed in the accompanying Notes to Financial Statements: |
Transfers | Total (000s) |
Level 1 to Level 2 | $ 0 |
Level 2 to Level 1 | $ 372,598 |
See accompanying notes which are an integral part of the financial statements.
Annual Report
Statement of Assets and Liabilities
Amounts in thousands (except per-share amounts) | October 31, 2012 |
| | |
Assets | | |
Investment in securities, at value (including securities loaned of $12,172) - See accompanying schedule: Unaffiliated issuers (cost $1,629,931) | $ 1,884,648 | |
Fidelity Central Funds (cost $50,821) | 50,821 | |
Total Investments (cost $1,680,752) | | $ 1,935,469 |
Receivable for investments sold | | 1,844 |
Receivable for fund shares sold | | 1,867 |
Dividends receivable | | 3,546 |
Interest receivable | | 1 |
Distributions receivable from Fidelity Central Funds | | 14 |
Other receivables | | 201 |
Total assets | | 1,942,942 |
| | |
Liabilities | | |
Payable for investments purchased | $ 3,498 | |
Payable for fund shares redeemed | 5,169 | |
Accrued management fee | 1,142 | |
Distribution and service plan fees payable | 548 | |
Other affiliated payables | 499 | |
Other payables and accrued expenses | 2,609 | |
Collateral on securities loaned, at value | 12,479 | |
Total liabilities | | 25,944 |
| | |
Net Assets | | $ 1,916,998 |
Net Assets consist of: | | |
Paid in capital | | $ 4,658,392 |
Undistributed net investment income | | 21,468 |
Accumulated undistributed net realized gain (loss) on investments and foreign currency transactions | | (3,015,093) |
Net unrealized appreciation (depreciation) on investments and assets and liabilities in foreign currencies | | 252,231 |
Net Assets | | $ 1,916,998 |
See accompanying notes which are an integral part of the financial statements.
Annual Report
Financial Statements - continued
Statement of Assets and Liabilities - continued
Amounts in thousands (except per-share amounts) | October 31, 2012 |
| | |
Calculation of Maximum Offering Price Class A:
Net Asset Value and redemption price per share ($761,847 ÷ 48,744 shares) | | $ 15.63 |
| | |
Maximum offering price per share (100/94.25 of $15.63) | | $ 16.58 |
Class T:
Net Asset Value and redemption price per share ($303,930 ÷ 19,618 shares) | | $ 15.49 |
| | |
Maximum offering price per share (100/96.50 of $15.49) | | $ 16.05 |
Class B:
Net Asset Value and offering price per share ($59,414 ÷ 3,974 shares)A | | $ 14.95 |
| | |
Class C:
Net Asset Value and offering price per share ($245,665 ÷ 16,415 shares)A | | $ 14.97 |
| | |
Institutional Class:
Net Asset Value, offering price and redemption price per share ($546,142 ÷ 34,356 shares) | | $ 15.90 |
A Redemption price per share is equal to net asset value less any applicable contingent deferred sales charge.
See accompanying notes which are an integral part of the financial statements.
Annual Report
Statement of Operations
Amounts in thousands | Year ended October 31, 2012 |
| | |
Investment Income | | |
Dividends | | $ 54,040 |
Income from Fidelity Central Funds | | 1,416 |
Income before foreign taxes withheld | | 55,456 |
Less foreign taxes withheld | | (3,781) |
Total income | | 51,675 |
| | |
Expenses | | |
Management fee | $ 14,593 | |
Transfer agent fees | 5,571 | |
Distribution and service plan fees | 7,059 | |
Accounting and security lending fees | 921 | |
Custodian fees and expenses | 301 | |
Independent trustees' compensation | 14 | |
Registration fees | 104 | |
Audit | 81 | |
Legal | 9 | |
Miscellaneous | 26 | |
Total expenses before reductions | 28,679 | |
Expense reductions | (249) | 28,430 |
Net investment income (loss) | | 23,245 |
Realized and Unrealized Gain (Loss) Net realized gain (loss) on: | | |
Investment securities: | | |
Unaffiliated issuers | 40,399 | |
Foreign currency transactions | (602) | |
Total net realized gain (loss) | | 39,797 |
Change in net unrealized appreciation (depreciation) on: Investment securities | 88,510 | |
Assets and liabilities in foreign currencies | (112) | |
Total change in net unrealized appreciation (depreciation) | | 88,398 |
Net gain (loss) | | 128,195 |
Net increase (decrease) in net assets resulting from operations | | $ 151,440 |
See accompanying notes which are an integral part of the financial statements.
Annual Report
Financial Statements - continued
Statement of Changes in Net Assets
Amounts in thousands | Year ended
October 31,
2012 | Year ended
October 31,
2011 |
Increase (Decrease) in Net Assets | | |
Operations | | |
Net investment income (loss) | $ 23,245 | $ 43,005 |
Net realized gain (loss) | 39,797 | 251,468 |
Change in net unrealized appreciation (depreciation) | 88,398 | (392,112) |
Net increase (decrease) in net assets resulting
from operations | 151,440 | (97,639) |
Distributions to shareholders from net investment income | (28,136) | (45,397) |
Distributions to shareholders from net realized gain | - | (8,026) |
Total distributions | (28,136) | (53,423) |
Share transactions - net increase (decrease) | (644,922) | (1,225,390) |
Redemption fees | 42 | 65 |
Total increase (decrease) in net assets | (521,576) | (1,376,387) |
| | |
Net Assets | | |
Beginning of period | 2,438,574 | 3,814,961 |
End of period (including undistributed net investment income of $21,468 and undistributed net investment income of $26,393, respectively) | $ 1,916,998 | $ 2,438,574 |
See accompanying notes which are an integral part of the financial statements.
Annual Report
Financial Highlights - Class A
Years ended October 31, | 2012 | 2011 | 2010 | 2009 | 2008 |
Selected Per-Share Data | | | | | |
Net asset value, beginning of period | $ 14.61 | $ 15.63 | $ 14.25 | $ 12.57 | $ 26.62 |
Income from Investment Operations | | | | | |
Net investment income (loss) C | .18 | .22 F | .14 | .17 | .36 |
Net realized and unrealized gain (loss) | 1.03 | (1.01) | 1.44 | 1.96 | (11.15) |
Total from investment operations | 1.21 | (.79) | 1.58 | 2.13 | (10.79) |
Distributions from net investment income | (.19) | (.20) | (.19) | (.45) | (.24) |
Distributions from net realized gain | - | (.03) | (.01) | - | (3.02) |
Total distributions | (.19) | (.23) | (.20) | (.45) | (3.26) |
Redemption fees added to paid in capital C,H | - | - | - | - | - |
Net asset value, end of period | $ 15.63 | $ 14.61 | $ 15.63 | $ 14.25 | $ 12.57 |
Total Return A,B | 8.47% | (5.15)% | 11.17% | 18.16% | (45.95)% |
Ratios to Average Net Assets D,G | | | | | |
Expenses before reductions | 1.32% | 1.31% | 1.32% | 1.34% | 1.26% |
Expenses net of fee waivers, if any | 1.32% | 1.31% | 1.32% | 1.34% | 1.26% |
Expenses net of all reductions | 1.31% | 1.29% | 1.30% | 1.31% | 1.22% |
Net investment income (loss) | 1.20% | 1.38% F | .95% | 1.43% | 1.80% |
Supplemental Data | | | | | |
Net assets, end of period (in millions) | $ 762 | $ 916 | $ 1,302 | $ 1,662 | $ 2,004 |
Portfolio turnover rate E | 34% | 48% | 59% | 92% | 88% |
A Total returns would have been lower if certain expenses had not been reduced during the applicable periods shown.
B Total returns do not include the effect of the sales charges.
C Calculated based on average shares outstanding during the period.
D Fees and expenses of any underlying Fidelity Central Funds are not included in the Fund's expense ratio. The Fund indirectly bears its proportionate share of the expenses of any underlying Fidelity Central Funds.
E Amount does not include the portfolio activity of any underlying Fidelity Central Funds.
F Investment income per share reflects a large, non-recurring dividend which amounted to $.06 per share. Excluding this non-recurring dividend, the ratio of net investment income (loss) to average net assets would have been .98%.
G Expense ratios reflect operating expenses of the class. Expenses before reductions do not reflect amounts reimbursed by the investment adviser or reductions from brokerage service arrangements or reductions from other expense offset arrangements and do not represent the amount paid by the class during periods when reimbursements or reductions occur. Expenses net of fee waivers reflect expenses after reimbursement by the investment adviser but prior to reductions from brokerage service arrangements or other expense offset arrangements. Expenses net of all reductions represent the net expenses paid by the class.
H Amount represents less than $.01 per share.
See accompanying notes which are an integral part of the financial statements.
Annual Report
Financial Highlights - Class T
Years ended October 31, | 2012 | 2011 | 2010 | 2009 | 2008 |
Selected Per-Share Data | | | | | |
Net asset value, beginning of period | $ 14.46 | $ 15.47 | $ 14.11 | $ 12.42 | $ 26.30 |
Income from Investment Operations | | | | | |
Net investment income (loss) C | .14 | .18 F | .10 | .14 | .31 |
Net realized and unrealized gain (loss) | 1.03 | (.99) | 1.43 | 1.94 | (11.01) |
Total from investment operations | 1.17 | (.81) | 1.53 | 2.08 | (10.70) |
Distributions from net investment income | (.14) | (.16) | (.16) | (.39) | (.16) |
Distributions from net realized gain | - | (.03) | (.01) | - | (3.02) |
Total distributions | (.14) | (.20) I | (.17) | (.39) | (3.18) |
Redemption fees added to paid in capital C,H | - | - | - | - | - |
Net asset value, end of period | $ 15.49 | $ 14.46 | $ 15.47 | $ 14.11 | $ 12.42 |
Total Return A,B | 8.17% | (5.35)% | 10.88% | 17.84% | (46.04)% |
Ratios to Average Net Assets D,G | | | | | |
Expenses before reductions | 1.58% | 1.55% | 1.55% | 1.58% | 1.49% |
Expenses net of fee waivers, if any | 1.58% | 1.55% | 1.55% | 1.58% | 1.49% |
Expenses net of all reductions | 1.57% | 1.53% | 1.53% | 1.55% | 1.44% |
Net investment income (loss) | .94% | 1.14% F | .71% | 1.19% | 1.57% |
Supplemental Data | | | | | |
Net assets, end of period (in millions) | $ 304 | $ 404 | $ 621 | $ 832 | $ 1,110 |
Portfolio turnover rate E | 34% | 48% | 59% | 92% | 88% |
A Total returns would have been lower if certain expenses had not been reduced during the applicable periods shown.
B Total returns do not include the effect of the sales charges.
C Calculated based on average shares outstanding during the period.
D Fees and expenses of any underlying Fidelity Central Funds are not included in the Fund's expense ratio. The Fund indirectly bears its proportionate share of the expenses of any underlying Fidelity Central Funds.
E Amount does not include the portfolio activity of any underlying Fidelity Central Funds.
F Investment income per share reflects a large, non-recurring dividend which amounted to $.06 per share. Excluding this non-recurring dividend, the ratio of net investment income (loss) to average net assets would have been .74%.
G Expense ratios reflect operating expenses of the class. Expenses before reductions do not reflect amounts reimbursed by the investment adviser or reductions from brokerage service arrangements or reductions from other expense offset arrangements and do not represent the amount paid by the class during periods when reimbursements or reductions occur. Expenses net of fee waivers reflect expenses after reimbursement by the investment adviser but prior to reductions from brokerage service arrangements or other expense offset arrangements. Expenses net of all reductions represent the net expenses paid by the class.
H Amount represents less than $.01 per share.
I Total distributions of $.20 per share is comprised of distributions from net investment income of $.164 and distributions from net realized gain of $.034 per share.
See accompanying notes which are an integral part of the financial statements.
Annual Report
Financial Highlights - Class B
Years ended October 31, | 2012 | 2011 | 2010 | 2009 | 2008 |
Selected Per-Share Data | | | | | |
Net asset value, beginning of period | $ 13.91 | $ 14.91 | $ 13.61 | $ 11.95 | $ 25.44 |
Income from Investment Operations | | | | | |
Net investment income (loss) C | .06 | .09 F | .02 | .08 | .18 |
Net realized and unrealized gain (loss) | 1.00 | (.96) | 1.38 | 1.88 | (10.62) |
Total from investment operations | 1.06 | (.87) | 1.40 | 1.96 | (10.44) |
Distributions from net investment income | (.02) | (.10) | (.09) | (.30) | (.03) |
Distributions from net realized gain | - | (.03) | (.01) | - | (3.02) |
Total distributions | (.02) | (.13) | (.10) | (.30) | (3.05) |
Redemption fees added to paid in capital C,H | - | - | - | - | - |
Net asset value, end of period | $ 14.95 | $ 13.91 | $ 14.91 | $ 13.61 | $ 11.95 |
Total Return A,B | 7.64% | (5.89)% | 10.34% | 17.25% | (46.39)% |
Ratios to Average Net Assets D,G | | | | | |
Expenses before reductions | 2.08% | 2.08% | 2.09% | 2.10% | 2.08% |
Expenses net of fee waivers, if any | 2.08% | 2.08% | 2.09% | 2.10% | 2.08% |
Expenses net of all reductions | 2.07% | 2.06% | 2.07% | 2.07% | 2.04% |
Net investment income (loss) | .44% | .61% F | .18% | .67% | .97% |
Supplemental Data | | | | | |
Net assets, end of period (in millions) | $ 59 | $ 94 | $ 157 | $ 191 | $ 221 |
Portfolio turnover rate E | 34% | 48% | 59% | 92% | 88% |
A Total returns would have been lower if certain expenses had not been reduced during the applicable periods shown.
B Total returns do not include the effect of the contingent deferred sales charge.
C Calculated based on average shares outstanding during the period.
D Fees and expenses of any underlying Fidelity Central Funds are not included in the Fund's expense ratio. The Fund indirectly bears its proportionate share of the expenses of any underlying Fidelity Central Funds.
E Amount does not include the portfolio activity of any underlying Fidelity Central Funds.
F Investment income per share reflects a large, non-recurring dividend which amounted to $.06 per share. Excluding this non-recurring dividend, the ratio of net investment income (loss) to average net assets would have been .21%.
G Expense ratios reflect operating expenses of the class. Expenses before reductions do not reflect amounts reimbursed by the investment adviser or reductions from brokerage service arrangements or reductions from other expense offset arrangements and do not represent the amount paid by the class during periods when reimbursements or reductions occur. Expenses net of fee waivers reflect expenses after reimbursement by the investment adviser but prior to reductions from brokerage service arrangements or other expense offset arrangements. Expenses net of all reductions represent the net expenses paid by the class.
H Amount represents less than $.01 per share.
See accompanying notes which are an integral part of the financial statements.
Annual Report
Financial Highlights - Class C
Years ended October 31, | 2012 | 2011 | 2010 | 2009 | 2008 |
Selected Per-Share Data | | | | | |
Net asset value, beginning of period | $ 13.95 | $ 14.95 | $ 13.65 | $ 11.98 | $ 25.50 |
Income from Investment Operations | | | | | |
Net investment income (loss) C | .06 | .10 F | .03 | .08 | .20 |
Net realized and unrealized gain (loss) | 1.01 | (.96) | 1.38 | 1.89 | (10.64) |
Total from investment operations | 1.07 | (.86) | 1.41 | 1.97 | (10.44) |
Distributions from net investment income | (.05) | (.11) | (.10) | (.30) | (.06) |
Distributions from net realized gain | - | (.03) | (.01) | - | (3.02) |
Total distributions | (.05) | (.14) | (.11) | (.30) | (3.08) |
Redemption fees added to paid in capital C,H | - | - | - | - | - |
Net asset value, end of period | $ 14.97 | $ 13.95 | $ 14.95 | $ 13.65 | $ 11.98 |
Total Return A,B | 7.71% | (5.83)% | 10.32% | 17.24% | (46.33)% |
Ratios to Average Net Assets D,G | | | | | |
Expenses before reductions | 2.06% | 2.05% | 2.06% | 2.09% | 2.01% |
Expenses net of fee waivers, if any | 2.06% | 2.05% | 2.06% | 2.09% | 2.01% |
Expenses net of all reductions | 2.05% | 2.03% | 2.04% | 2.06% | 1.97% |
Net investment income (loss) | .46% | .64% F | .21% | .68% | 1.04% |
Supplemental Data | | | | | |
Net assets, end of period (in millions) | $ 246 | $ 302 | $ 419 | $ 502 | $ 618 |
Portfolio turnover rate E | 34% | 48% | 59% | 92% | 88% |
A Total returns would have been lower if certain expenses had not been reduced during the applicable periods shown.
B Total returns do not include the effect of the contingent deferred sales charge.
C Calculated based on average shares outstanding during the period.
D Fees and expenses of any underlying Fidelity Central Funds are not included in the Fund's expense ratio. The Fund indirectly bears its proportionate share of the expenses of any underlying Fidelity Central Funds.
E Amount does not include the portfolio activity of any underlying Fidelity Central Funds.
F Investment income per share reflects a large, non-recurring dividend which amounted to $.06 per share. Excluding this non-recurring dividend, the ratio of net investment income (loss) to average net assets would have been .24%.
G Expense ratios reflect operating expenses of the class. Expenses before reductions do not reflect amounts reimbursed by the investment adviser or reductions from brokerage service arrangements or reductions from other expense offset arrangements and do not represent the amount paid by the class during periods when reimbursements or reductions occur. Expenses net of fee waivers reflect expenses after reimbursement by the investment adviser but prior to reductions from brokerage service arrangements or other expense offset arrangements. Expenses net of all reductions represent the net expenses paid by the class.
H Amount represents less than $.01 per share.
See accompanying notes which are an integral part of the financial statements.
Annual Report
Financial Highlights - Institutional Class
Years ended October 31, | 2012 | 2011 | 2010 | 2009 | 2008 |
Selected Per-Share Data | | | | | |
Net asset value, beginning of period | $ 14.87 | $ 15.90 | $ 14.48 | $ 12.81 | $ 27.06 |
Income from Investment Operations | | | | | |
Net investment income (loss) B | .23 | .28 E | .19 | .21 | .41 |
Net realized and unrealized gain (loss) | 1.05 | (1.03) | 1.47 | 1.98 | (11.34) |
Total from investment operations | 1.28 | (.75) | 1.66 | 2.19 | (10.93) |
Distributions from net investment income | (.25) | (.25) | (.23) | (.52) | (.30) |
Distributions from net realized gain | - | (.03) | (.01) | - | (3.02) |
Total distributions | (.25) | (.28) | (.24) | (.52) | (3.32) |
Redemption fees added to paid in capital B,G | - | - | - | - | - |
Net asset value, end of period | $ 15.90 | $ 14.87 | $ 15.90 | $ 14.48 | $ 12.81 |
Total Return A | 8.83% | (4.85)% | 11.55% | 18.45% | (45.79)% |
Ratios to Average Net Assets C,F | | | | | |
Expenses before reductions | 1.00% | .99% | .99% | 1.07% | .99% |
Expenses net of fee waivers, if any | 1.00% | .99% | .99% | 1.07% | .99% |
Expenses net of all reductions | .99% | .97% | .97% | 1.04% | .94% |
Net investment income (loss) | 1.52% | 1.70% E | 1.28% | 1.70% | 2.07% |
Supplemental Data | | | | | |
Net assets, end of period (in millions) | $ 546 | $ 723 | $ 1,316 | $ 1,540 | $ 2,235 |
Portfolio turnover rate D | 34% | 48% | 59% | 92% | 88% |
A Total returns would have been lower if certain expenses had not been reduced during the applicable periods shown.
B Calculated based on average shares outstanding during the period.
C Fees and expenses of any underlying Fidelity Central Funds are not included in the Fund's expense ratio. The Fund indirectly bears its proportionate share of the expenses of any underlying Fidelity Central Funds.
D Amount does not include the portfolio activity of any underlying Fidelity Central Funds.
E Investment income per share reflects a large, non-recurring dividend which amounted to $.06 per share. Excluding this non-recurring dividend, the ratio of net investment income (loss) to average net assets would have been 1.30%.
F Expense ratios reflect operating expenses of the class. Expenses before reductions do not reflect amounts reimbursed by the investment adviser or reductions from brokerage service arrangements or reductions from other expense offset arrangements and do not represent the amount paid by the class during periods when reimbursements or reductions occur. Expenses net of fee waivers reflect expenses after reimbursement by the investment adviser but prior to reductions from brokerage service arrangements or other expense offset arrangements. Expenses net of all reductions represent the net expenses paid by the class.
G Amount represents less than $.01 per share.
See accompanying notes which are an integral part of the financial statements.
Annual Report
Notes to Financial Statements
For the period ended October 31, 2012
(Amounts in thousands except percentages)
1. Organization.
Fidelity Advisor Diversified International Fund (the Fund) is a fund of Fidelity Advisor Series VIII (the Trust) and is authorized to issue an unlimited number of shares. The Trust is registered under the Investment Company Act of 1940, as amended (the 1940 Act), as an open-end management investment company organized as a Massachusetts business trust. The Fund offers Class A, Class T, Class C and Institutional Class shares, each of which, along with Class B shares, has equal rights as to assets and voting privileges. Effective after the close of business on September 1, 2010, Class B shares were closed to new accounts and additional purchases, except for exchanges and reinvestments. Each class has exclusive voting rights with respect to matters that affect that class. Class B shares will automatically convert to Class A shares after a holding period of seven years from the initial date of purchase. Investment income, realized and unrealized capital gains and losses, the common expenses of the Fund, and certain fund-level expense reductions, if any, are allocated on a pro-rata basis to each class based on the relative net assets of each class to the total net assets of the Fund. Each class differs with respect to transfer agent and distribution and service plan fees incurred. Certain expense reductions may also differ by class.
2. Investments in Fidelity Central Funds.
The Fund invests in Fidelity Central Funds, which are open-end investment companies available only to other investment companies and accounts managed by Fidelity Management & Research Company (FMR) and its affiliates. The Fund's Schedule of Investments lists each of the Fidelity Central Funds held as of period end, if any, as an investment of the Fund, but does not include the underlying holdings of each Fidelity Central Fund. As an Investing Fund, the Fund indirectly bears its proportionate share of the expenses of the underlying Fidelity Central Funds.
The Money Market Central Funds seek preservation of capital and current income and are managed by Fidelity Investments Money Management, Inc. (FIMM), an affiliate of FMR.
A complete unaudited list of holdings for each Fidelity Central Fund is available upon request or at the Securities and Exchange Commission (the SEC) web site at www.sec.gov. In addition, the financial statements of the Fidelity Central Funds, which are not covered by the Fund's Report of Independent Registered Public Accounting Firm, are available on the SEC web site or upon request.
3. Significant Accounting Policies.
The financial statements have been prepared in conformity with accounting principles generally accepted in the United States of America (GAAP), which require management to make certain estimates and assumptions at the date of the financial statements. Actual results could differ from those estimates. Subsequent events, if any, through the
Annual Report
Notes to Financial Statements - continued
(Amounts in thousands except percentages)
3. Significant Accounting Policies - continued
date that the financial statements were issued have been evaluated in the preparation of the financial statements. The following summarizes the significant accounting policies of the Fund:
Security Valuation. Investments are valued as of 4:00 p.m. Eastern time on the last calendar day of the period. In accordance with valuation policies and procedures approved by the Board of Trustees (the Board), the Fund attempts to obtain prices from one or more third party pricing vendors or brokers to value its investments. When current market prices, quotations or rates are not readily available or reliable, securities will be fair valued in good faith by the FMR Fair Value Committee (the Committee), in accordance with procedures adopted by the Fund's Board. Factors used in determining fair value vary by security type and may include market or security specific events. The frequency with which these procedures are used cannot be predicted and they may be utilized to a significant extent. The Committee oversees the Fund's valuation policies and procedures and is responsible for approving and reporting to the Board all fair value determinations.
The Fund categorizes the inputs to valuation techniques used to value its investments into a disclosure hierarchy consisting of three levels as shown below:
Level 1 - quoted prices in active markets for identical investments
Level 2 - other significant observable inputs (including quoted prices for similar investments, interest rates, prepayment speeds, etc.)
Level 3 - unobservable inputs (including the Fund's own assumptions based on the best information available)
Valuation techniques used to value the Fund's investments by major category are as follows:
Equity securities, including restricted securities, for which market quotations are readily available, are valued at the last reported sale price or official closing price as reported by a third party pricing vendor on the primary market or exchange on which they are traded and are categorized as Level 1 in the hierarchy. In the event there were no sales during the day or closing prices are not available, securities are valued at the last quoted bid price or may be valued using the last available price and are generally categorized as Level 2 in the hierarchy. For foreign equity securities, when significant market or security specific events arise, comparisons to the valuation of American Depositary Receipts (ADRs), futures contracts, Exchange-Traded Funds (ETFs) and certain indexes as well as quoted prices for similar securities are used and are categorized as Level 2 in the hierarchy. Utilizing these techniques may result in transfers between Level 1 and Level 2. For restricted equity securities and private placements where observable inputs are
Annual Report
3. Significant Accounting Policies - continued
Security Valuation - continued
limited, assumptions about market activity and risk are used and these securities are generally categorized as Level 3 in the hierarchy.
Debt securities, including restricted securities, are valued based on evaluated prices received from third party pricing vendors or from brokers who make markets in such securities. For master notes, pricing vendors utilize matrix pricing which considers yield or price of bonds of comparable quality, coupon, maturity and type as well as broker-supplied prices and are generally categorized as Level 2 in the hierarchy. When independent prices are unavailable or unreliable, debt securities may be valued utilizing pricing methodologies which consider similar factors that would be used by third party pricing vendors. These are generally categorized as Level 2 in the hierarchy but may be Level 3 depending on the circumstances.
Investments in open-end mutual funds, including the Fidelity Central Funds, are valued at their closing net asset value (NAV) each business day and are categorized as Level 1 in the hierarchy.
Changes in valuation techniques may result in transfers in or out of an assigned level within the disclosure hierarchy. The aggregate value of investments by input level, as of October 31, 2012, including information on transfers between Levels 1 and 2, is included at the end of the Fund's Schedule of Investments.
Foreign Currency Translation. The Fund may use foreign currency contracts to facilitate transactions in foreign-denominated securities. Gains and losses from these transactions may arise from changes in the value of the foreign currency or if the counterparties do not perform under the contracts' terms.
Foreign-denominated assets, including investment securities, and liabilities are translated into U.S. dollars at the exchange rates at period end. Purchases and sales of investment securities, income and dividends received and expenses denominated in foreign currencies are translated into U.S. dollars at the exchange rate in effect on the transaction date.
The effects of exchange rate fluctuations on investments are included with the net realized and unrealized gain (loss) on investment securities. Other foreign currency transactions resulting in realized and unrealized gain (loss) are disclosed separately.
Investment Transactions and Income. For financial reporting purposes, the Fund's investment holdings and NAV include trades executed through the end of the last business day of the period. The NAV per share for processing shareholder transactions is calculated as of the close of business of the New York Stock Exchange (NYSE), normally 4:00 p.m. Eastern time and includes trades executed through the end of the prior
Annual Report
Notes to Financial Statements - continued
(Amounts in thousands except percentages)
3. Significant Accounting Policies - continued
Investment Transactions and Income - continued
business day. Gains and losses on securities sold are determined on the basis of identified cost and may include proceeds received from litigation. Dividend income is recorded on the ex-dividend date, except for certain dividends from foreign securities where the ex-dividend date may have passed, which are recorded as soon as the Fund is informed of the ex-dividend date. Non-cash dividends included in dividend income, if any, are recorded at the fair market value of the securities received. Distributions received on securities that represent a return of capital or capital gain are recorded as a reduction of cost of investments and/or as a realized gain. The Fund estimates the components of distributions received that may be considered return of capital distributions or capital gain distributions. Interest income and distributions from the Fidelity Central Funds are accrued as earned. Interest income includes coupon interest and amortization of premium and accretion of discount on debt securities. Investment income is recorded net of foreign taxes withheld where recovery of such taxes is uncertain.
Expenses. Expenses directly attributable to a fund are charged to that fund. Expenses attributable to more than one fund are allocated among the respective funds on the basis of relative net assets or other appropriate methods. Expense estimates are accrued in the period to which they relate and adjustments are made when actual amounts are known.
Deferred Trustee Compensation. Under a Deferred Compensation Plan (the Plan), independent Trustees may elect to defer receipt of a portion of their annual compensation. Deferred amounts are invested in a cross-section of Fidelity funds, are marked-to-market and remain in the Fund until distributed in accordance with the Plan. The investment of deferred amounts and the offsetting payable to the Trustees are included in the accompanying Statement of Assets and Liabilities.
Income Tax Information and Distributions to Shareholders. Each year, the Fund intends to qualify as a regulated investment company under Subchapter M of the Internal Revenue Code, including distributing substantially all of its taxable income and realized gains. As a result, no provision for income taxes is required. As of October 31, 2012, the Fund did not have any unrecognized tax benefits in the financial statements; nor is the Fund aware of any tax positions for which it is reasonably possible that the total amounts of unrecognized tax benefits will significantly change in the next twelve months. The Fund files a U.S. federal tax return, in addition to state and local tax returns as required. A fund's federal income tax returns are subject to examination by the Internal Revenue Service (IRS) for a period of three fiscal years after they are filed. State and local tax returns may be subject to examination for an additional fiscal year depending on the jurisdiction. Foreign taxes are provided for based on the Fund's understanding of the tax rules and rates that exist in the foreign markets in which it invests.
Annual Report
3. Significant Accounting Policies - continued
Income Tax Information and Distributions to Shareholders - continued
Distributions are declared and recorded on the ex-dividend date. Income dividends and capital gain distributions are declared separately for each class. Income and capital gain distributions are determined in accordance with income tax regulations, which may differ from GAAP.
Capital accounts within the financial statements are adjusted for permanent book-tax differences. These adjustments have no impact on net assets or the results of operations. Temporary book-tax differences will reverse in a subsequent period.
Book-tax differences are primarily due to foreign currency transactions, passive foreign investment companies (PFIC), deferred trustees compensation, capital loss carryforwards and losses deferred due to wash sales.
The federal tax cost of investment securities and unrealized appreciation (depreciation) as of period end were as follows:
Gross unrealized appreciation | $ 343,637 |
Gross unrealized depreciation | (109,482) |
Net unrealized appreciation (depreciation) on securities and other investments | $ 243,155 |
| |
Tax Cost | $ 1,701,314 |
The tax-based components of distributable earnings as of period end were as follows:
Undistributed ordinary income | $ 28,636 |
Capital loss carryforward | $ (3,001,620) |
Net unrealized appreciation (depreciation) | $ 243,063 |
Capital loss carryforwards are only available to offset future capital gains of the Fund to the extent provided by regulations and may be limited. Under the Regulated Investment Company Modernization Act of 2010 (the Act), the Fund is permitted to carry forward capital losses incurred in taxable years beginning after December 22, 2010 for an unlimited period and such capital losses are required to be used prior to any losses that expire. Capital loss carryforwards were as follows:
Fiscal year of expiration | |
2017 | $ (3,001,625) |
Annual Report
Notes to Financial Statements - continued
(Amounts in thousands except percentages)
3. Significant Accounting Policies - continued
Income Tax Information and Distributions to Shareholders - continued
The tax character of distributions paid was as follows:
| October 31,
2012 | October 31,
2011 |
Ordinary Income | $ 28,136 | $ 53,424 |
Short-Term Trading (Redemption) Fees. Shares held by investors in the Fund less than 30 days are subject to a redemption fee equal to 1.00% of the net asset value of shares redeemed. All redemption fees, which reduce the proceeds of the shareholder redemption, are retained by the Fund and accounted for as an addition to paid in capital.
Restricted Securities. The Fund may invest in securities that are subject to legal or contractual restrictions on resale. These securities generally may be resold in transactions exempt from registration or to the public if the securities are registered. Disposal of these securities may involve time-consuming negotiations and expense, and prompt sale at an acceptable price may be difficult. Information regarding restricted securities is included at the end of the Fund's Schedule of Investments.
New Accounting Pronouncement. In December 2011, the Financial Accounting Standards Board issued Accounting Standard Update No. 2011-11, Disclosures about Offsetting Assets and Liabilities. The update creates new disclosure requirements requiring entities to disclose both gross and net information for derivatives and other financial instruments that are either offset in the Statement of Assets and Liabilities or subject to an enforceable master netting arrangement or similar agreement. The disclosure requirements are effective for annual reporting periods beginning on or after January 1, 2013, and interim periods within those annual periods. Management is currently evaluating the impact of the update's adoption on the Fund's financial statement disclosures.
4. Purchases and Sales of Investments.
Purchases and sales of securities, other than short-term securities, aggregated $681,681 and $1,307,803, respectively.
5. Fees and Other Transactions with Affiliates.
Management Fee. FMR and its affiliates provide the Fund with investment management related services for which the Fund pays a monthly management fee. The management fee is the sum of an individual fund fee rate that is based on an annual rate of .45% of the Fund's average net assets and an annualized group fee rate that averaged .26% during the period. The group fee rate is based upon the average net assets of all the
Annual Report
5. Fees and Other Transactions with Affiliates - continued
Management Fee - continued
mutual funds advised by FMR. The group fee rate decreases as assets under management increase and increases as assets under management decrease. For the period, the total annual management fee rate was .71% of the Fund's average net assets.
Distribution and Service Plan Fees. In accordance with Rule 12b-1 of the 1940 Act, the Fund has adopted separate Distribution and Service Plans for each class of shares. Certain classes pay Fidelity Distributors Corporation (FDC), an affiliate of FMR, separate Distribution and Service Fees, each of which is based on an annual percentage of each class' average net assets. In addition, FDC may pay financial intermediaries for selling shares of the Fund and providing shareholder support services. For the period, the Distribution and Service Fee rates, total fees and amounts retained by FDC were as follows:
| Distribution
Fee | Service
Fee | Total Fees | Retained
by FDC |
Class A | -% | .25% | $ 2,002 | $ 53 |
Class T | .25% | .25% | 1,687 | 7 |
Class B | .75% | .25% | 740 | 556 |
Class C | .75% | .25% | 2,630 | 108 |
| | | $ 7,059 | $ 724 |
Sales Load. FDC may receive a front-end sales charge of up to 5.75% for selling Class A shares and 3.50% for selling Class T shares, some of which is paid to financial intermediaries for selling shares of the Fund. Depending on the holding period, FDC may receive contingent deferred sales charges levied on Class A, Class T, Class B, and Class C redemptions. The deferred sales charges range from 5.00% to 1.00% for Class B shares, 1.00% for Class C shares, 1.00% for certain purchases of Class A shares and .25% for certain purchases of Class T shares.
For the period, sales charge amounts retained by FDC were as follows:
| Retained
by FDC |
Class A | $ 70 |
Class T | 20 |
Class B* | 99 |
Class C* | 9 |
| $ 198 |
* When Class B and Class C shares are initially sold, FDC pays commissions from its own resources to financial intermediaries through which the sales are made.
Annual Report
Notes to Financial Statements - continued
(Amounts in thousands except percentages)
5. Fees and Other Transactions with Affiliates - continued
Transfer Agent Fees. Fidelity Investments Institutional Operations Company, Inc. (FIIOC), an affiliate of FMR, is the transfer, dividend disbursing and shareholder servicing agent for each class of the Fund. FIIOC receives account fees and asset-based fees that vary according to the account size and type of account of the shareholders of the respective classes of the Fund. FIIOC pays for typesetting, printing and mailing of shareholder reports, except proxy statements. For the period, transfer agent fees for each class were as follows:
| Amount | % of
Average
Net Assets |
Class A | $ 2,329 | .29 |
Class T | 1,002 | .30 |
Class B | 223 | .30 |
Class C | 736 | .28 |
Institutional Class | 1,281 | .22 |
| $ 5,571 | |
Accounting and Security Lending Fees. Fidelity Service Company, Inc. (FSC), an affiliate of FMR, maintains the Fund's accounting records. The accounting fee is based on the level of average net assets for each month. Under a separate contract, FSC administers the security lending program. The security lending fee is based on the number and duration of lending transactions.
Brokerage Commissions. The Fund placed a portion of its portfolio transactions with brokerage firms which are affiliates of the investment adviser. The commissions paid to these affiliated firms were $3 for the period.
6. Committed Line of Credit.
The Fund participates with other funds managed by FMR or an affiliate in a $4.25 billion credit facility (the "line of credit") to be utilized for temporary or emergency purposes to fund shareholder redemptions or for other short-term liquidity purposes. The Fund has agreed to pay commitment fees on its pro-rata portion of the line of credit, which amounted to $6 and is reflected in Miscellaneous expenses on the Statement of Operations. During the period, there were no borrowings on this line of credit.
7. Security Lending.
The Fund lends portfolio securities through a lending agent from time to time in order to earn additional income. For equity securities, a lending agent is used and may loan securities to certain qualified borrowers, including Fidelity Capital Markets (FCM), a broker-dealer affiliated with the Fund. On the settlement date of the loan, the Fund receives collateral (in the form of U.S. Treasury obligations, letters of credit and/or cash)
Annual Report
7. Security Lending - continued
against the loaned securities and maintains collateral in an amount not less than 100% of the market value of the loaned securities during the period of the loan. The market value of the loaned securities is determined at the close of business of the Fund and any additional required collateral is delivered to the Fund on the next business day. If the borrower defaults on its obligation to return the securities loaned because of insolvency or other reasons, a fund could experience delays and costs in recovering the securities loaned or in gaining access to the collateral. Any cash collateral received is invested in the Fidelity Securities Lending Cash Central Fund. The value of loaned securities and cash collateral at period end are disclosed on the Fund's Statement of Assets and Liabilities. Security lending income represents the income earned on investing cash collateral, less rebates paid to borrowers and any lending agent fees associated with the loan, plus any premium payments received for lending certain types of securities. Security lending income is presented in the Statement of Operations as a component of income from Fidelity Central Funds. Total security lending income during the period amounted to $1,352. During the period, there were no securities loaned to FCM.
8. Expense Reductions.
Many of the brokers with whom FMR places trades on behalf of the Fund provided services to the Fund in addition to trade execution. These services included payments of certain expenses on behalf of the Fund totaling $249 for the period.
9. Distributions to Shareholders.
Distributions to shareholders of each class were as follows:
Years ended October 31, | 2012 | 2011 |
From net investment income | | |
Class A | $ 11,830 | $ 15,976 |
Class T | 3,677 | 6,296 |
Class B | 137 | 993 |
Class C | 1,044 | 2,886 |
Institutional Class | 11,448 | 19,246 |
Total | $ 28,136 | $ 45,397 |
From net realized gain | | |
Class A | $ - | $ 2,738 |
Class T | - | 1,311 |
Class B | - | 343 |
Class C | - | 927 |
Institutional Class | - | 2,707 |
Total | $ - | $ 8,026 |
Annual Report
Notes to Financial Statements - continued
(Amounts in thousands except percentages)
10. Share Transactions.
Transactions for each class of shares were as follows:
| Shares | Dollars |
Years ended October 31, | 2012 | 2011 | 2012 | 2011 |
Class A | | | | |
Shares sold | 7,355 | 9,002 | $ 107,661 | $ 142,807 |
Reinvestment of distributions | 768 | 1,034 | 10,735 | 16,424 |
Shares redeemed | (22,053) | (30,677) | (321,084) | (486,880) |
Net increase (decrease) | (13,930) | (20,641) | $ (202,688) | $ (327,649) |
Class T | | | | |
Shares sold | 1,704 | 2,789 | $ 24,709 | $ 43,918 |
Reinvestment of distributions | 246 | 447 | 3,415 | 7,039 |
Shares redeemed | (10,272) | (15,458) | (148,591) | (243,511) |
Net increase (decrease) | (8,322) | (12,222) | $ (120,467) | $ (192,554) |
Class B | | | | |
Shares sold | 22 | 58 | $ 305 | $ 888 |
Reinvestment of distributions | 9 | 75 | 118 | 1,145 |
Shares redeemed | (2,779) | (3,940) | (39,153) | (60,055) |
Net increase (decrease) | (2,748) | (3,807) | $ (38,730) | $ (58,022) |
Class C | | | | |
Shares sold | 700 | 1,225 | $ 9,812 | $ 18,824 |
Reinvestment of distributions | 60 | 191 | 813 | 2,917 |
Shares redeemed | (5,985) | (7,773) | (83,760) | (118,247) |
Net increase (decrease) | (5,225) | (6,357) | $ (73,135) | $ (96,506) |
Institutional Class | | | | |
Shares sold | 7,200 | 10,009 | $ 106,131 | $ 160,916 |
Reinvestment of distributions | 640 | 1,047 | 9,062 | 16,863 |
Shares redeemed | (22,132) | (45,174) | (325,095) | (728,438) |
Net increase (decrease) | (14,292) | (34,118) | $ (209,902) | $ (550,659) |
11. Other.
The Fund's organizational documents provide former and current trustees and officers with a limited indemnification against liabilities arising in connection with the performance of their duties to the Fund. In the normal course of business, the Fund may also enter into contracts that provide general indemnifications. The Fund's maximum exposure under these arrangements is unknown as this would be dependent on future claims that may be made against the Fund. The risk of material loss from such claims is considered remote.
Annual Report
To the Trustees of Fidelity Advisor Series VIII and the Shareholders of Fidelity Advisor Diversified International Fund:
In our opinion, the accompanying statement of assets and liabilities, including the schedule of investments, and the related statements of operations and of changes in net assets and the financial highlights present fairly, in all material respects, the financial position of Fidelity Advisor Diversified International Fund (a fund of Fidelity Advisor Series VIII) at October 31, 2012, the results of its operations for the year then ended, the changes in its net assets for each of the two years in the period then ended and the financial highlights for each of the five years in the period then ended, in conformity with accounting principles generally accepted in the United States of America. These financial statements and financial highlights (hereafter referred to as "financial statements") are the responsibility of the Fidelity Advisor Diversified International Fund's management. Our responsibility is to express an opinion on these financial statements based on our audits. We conducted our audits of these financial statements in accordance with the standards of the Public Company Accounting Oversight Board (United States). Those standards require that we plan and perform the audit to obtain reasonable assurance about whether the financial statements are free of material misstatement. An audit includes examining, on a test basis, evidence supporting the amounts and disclosures in the financial statements, assessing the accounting principles used and significant estimates made by management, and evaluating the overall financial statement presentation. We believe that our audits, which included confirmation of securities at October 31, 2012 by correspondence with the custodian and brokers, provide a reasonable basis for our opinion.
PricewaterhouseCoopers LLP
Boston, Massachusetts
December 14, 2012
Annual Report
The Trustees, Members of the Advisory Board, and executive officers of the trust and fund, as applicable, are listed below. The Board of Trustees governs the fund and is responsible for protecting the interests of shareholders. The Trustees are experienced executives who meet periodically throughout the year to oversee the fund's activities, review contractual arrangements with companies that provide services to the fund, oversee management of the risks associated with such activities and contractual arrangements, and review the fund's performance. Except for James C. Curvey, each of the Trustees oversees 236 funds advised by FMR or an affiliate. Mr. Curvey oversees 443 funds advised by FMR or an affiliate.
The Trustees hold office without limit in time except that (a) any Trustee may resign; (b) any Trustee may be removed by written instrument, signed by at least two-thirds of the number of Trustees prior to such removal; (c) any Trustee who requests to be retired or who has become incapacitated by illness or injury may be retired by written instrument signed by a majority of the other Trustees; and (d) any Trustee may be removed at any special meeting of shareholders by a two-thirds vote of the outstanding voting securities of the trust. Each Trustee who is not an interested person (as defined in the 1940 Act) (Independent Trustee), shall retire not later than the last day of the calendar year in which his or her 75th birthday occurs. The Independent Trustees may waive this mandatory retirement age policy with respect to individual Trustees. The executive officers and Advisory Board Members hold office without limit in time, except that any officer and Advisory Board Member may resign or may be removed by a vote of a majority of the Trustees at any regular meeting or any special meeting of the Trustees. Except as indicated, each individual has held the office shown or other offices in the same company for the past five years.
Experience, Skills, Attributes, and Qualifications of the Fund's Trustees. The Governance and Nominating Committee has adopted a statement of policy that describes the experience, qualifications, attributes, and skills that are necessary and desirable for potential Independent Trustee candidates (Statement of Policy). The Board believes that each Trustee satisfied at the time he or she was initially elected or appointed a Trustee, and continues to satisfy, the standards contemplated by the Statement of Policy. The Governance and Nominating Committee also engages professional search firms to help identify potential Independent Trustee candidates who have the experience, qualifications, attributes, and skills consistent with the Statement of Policy. From time to time, additional criteria based on the composition and skills of the current Independent Trustees, as well as experience or skills that may be appropriate in light of future changes to board composition, business conditions, and regulatory or other developments, have also been considered by the professional search firms and the Governance and Nominating Committee. In addition, the Board takes into account the Trustees' commitment and participation in Board and committee meetings, as well as their leadership of standing and ad hoc committees throughout their tenure.
In determining that a particular Trustee was and continues to be qualified to serve as a Trustee, the Board has considered a variety of criteria, none of which, in isolation, was controlling. The Board believes that, collectively, the Trustees have balanced and diverse experience, qualifications, attributes, and skills, which allow the Board to operate effectively in governing the fund and protecting the interests of shareholders. Information about the specific experience, skills, attributes, and qualifications of each Trustee, which in each case led to the Board's conclusion that the Trustee should serve (or continue to serve) as a trustee of the fund, is provided below.
Annual Report
Trustees and Officers - continued
Board Structure and Oversight Function. James C. Curvey is an interested person (as defined in the 1940 Act) and currently serves as Chairman. The Trustees have determined that an interested Chairman is appropriate and benefits shareholders because an interested Chairman has a personal and professional stake in the quality and continuity of services provided to the fund. Independent Trustees exercise their informed business judgment to appoint an individual of their choosing to serve as Chairman, regardless of whether the Trustee happens to be independent or a member of management. The Independent Trustees have determined that they can act independently and effectively without having an Independent Trustee serve as Chairman and that a key structural component for assuring that they are in a position to do so is for the Independent Trustees to constitute a substantial majority for the Board. The Independent Trustees also regularly meet in executive session. Ned C. Lautenbach serves as Chairman of the Independent Trustees and as such (i) acts as a liaison between the Independent Trustees and management with respect to matters important to the Independent Trustees and (ii) with management prepares agendas for Board meetings.
Fidelity funds are overseen by different Boards of Trustees. The fund's Board oversees Fidelity's equity and high income funds and another Board oversees Fidelity's investment-grade bond, money market, and asset allocation funds. The asset allocation funds may invest in Fidelity funds overseen by the fund's Board. The use of separate Boards, each with its own committee structure, allows the Trustees of each group of Fidelity funds to focus on the unique issues of the funds they oversee, including common research, investment, and operational issues. On occasion, the separate Boards establish joint committees to address issues of overlapping consequences for the Fidelity funds overseen by each Board.
The Trustees operate using a system of committees to facilitate the timely and efficient consideration of all matters of importance to the Trustees, the fund, and fund shareholders and to facilitate compliance with legal and regulatory requirements and oversight of the fund's activities and associated risks. The Board, acting through its committees, has charged FMR and its affiliates with (i) identifying events or circumstances the occurrence of which could have demonstrably adverse effects on the fund's business and/or reputation; (ii) implementing processes and controls to lessen the possibility that such events or circumstances occur or to mitigate the effects of such events or circumstances if they do occur; and (iii) creating and maintaining a system designed to evaluate continuously business and market conditions in order to facilitate the identification and implementation processes described in (i) and (ii) above. Because the day-to-day operations and activities of the fund are carried out by or through FMR, its affiliates and other service providers, the fund's exposure to risks is mitigated but not eliminated by the processes overseen by the Trustees. While each of the Board's committees has responsibility for overseeing different aspects of the fund's activities, oversight is exercised primarily through the Operations, Audit, and Compliance Committees. In addition, the Independent Trustees have worked with FMR to enhance the Board's oversight of investment and financial risks, legal and regulatory risks, technology risks, and operational risks, including the development of additional risk reporting to the Board. For example, a working group comprised of Independent Trustees and FMR has worked and continues to work to review the Fidelity funds' valuation-related activities, reporting and risk management. Appropriate personnel, including but not limited to the fund's Chief Compliance Officer (CCO), FMR's internal auditor, the independent accountants, the fund's Treasurer and portfolio management personnel, make periodic reports to the Board's committees, as appropriate, including an annual review of FMR's risk management program for the Fidelity funds. The responsibilities of each standing committee, including their oversight responsibilities, are described further under "Standing Committees of the Fund's Trustees."
Annual Report
The fund's Statement of Additional Information (SAI) includes more information about the Trustees. To request a free copy, call Fidelity at 1-877-208-0098.
Interested Trustees*:
Correspondence intended for each Trustee who is an interested person may be sent to Fidelity Investments, 82 Devonshire Street, Boston, Massachusetts 02109.
Name, Age; Principal Occupations and Other Relevant Experience+ |
James C. Curvey (77) |
| Year of Election or Appointment: 2007 Mr. Curvey is Trustee and Chairman of the Board of Trustees of certain Trusts. Mr. Curvey also serves as Trustee (2007-present) of other investment companies advised by FMR. Mr. Curvey is a Director of Fidelity Investments Money Management, Inc. (2009-present), Director of Fidelity Research & Analysis Co. (2009-present) and Director of FMR and FMR Co., Inc. (2007-present). Mr. Curvey is also Vice Chairman (2007-present) and Director of FMR LLC. In addition, Mr. Curvey serves as an Overseer for the Boston Symphony Orchestra and a member of the Trustees of Villanova University. Previously, Mr. Curvey was the Vice Chairman (2006-2007) and Director (2000-2007) of FMR Corp. |
Ronald P. O'Hanley (55) |
| Year of Election or Appointment: 2011 Mr. O'Hanley is Director of FMR Co., Inc. (2010-present), Director of Fidelity Investments Money Management, Inc. (2010-present), Director of Fidelity Research & Analysis Company (2010-present), President of Fidelity Asset Management and Corporate Services and a member of Fidelity's Executive Committee (2010-present). Previously, Mr. O'Hanley served as President and Chief Executive Officer of BNY Mellon Asset Management (2007-2010). Mr. O'Hanley also served as Vice Chairman of Bank New York Mellon Corp. and a member of that firm's Executive Committee. Prior to the 2007 merger of The Bank of New York and Mellon Financial Corporation, he was Vice Chairman of Mellon Financial Corporation and President and Chief Executive Officer of Mellon Asset Management. He joined Mellon in February 1997. Mr. O'Hanley currently serves as Chairman of the Boston Public Library Foundation Board of Directors and sits on the Board of Directors of Beth Israel Deaconess Medical Center, the Board of Trustees of the Marine Biological Laboratory and the Advisory Board of the Maxwell School of Citizenship and Public Administration at Syracuse University. Mr. O'Hanley also chairs the Council on Asset Management for the Financial Services Roundtable and is a member of the Board of Directors of Institutional Investor's U.S. Institute. |
* Trustees have been determined to be "Interested Trustees" by virtue of, among other things, their affiliation with the trust or various entities under common control with FMR.
+ The information above includes each Trustee's principal occupation during the last five years and other information relating to the experience, attributes, and skills relevant to each Trustee's qualifications to serve as a Trustee, which led to the conclusion that each Trustee should serve as a Trustee for the fund.
Annual Report
Independent Trustees:
Correspondence intended for each Independent Trustee (that is, the Trustees other than the Interested Trustees) may be sent to Fidelity Investments, P.O. Box 55235, Boston, Massachusetts 02205-5235.
Name, Age; Principal Occupations and Other Relevant Experience+ |
Dennis J. Dirks (64) |
| Year of Election or Appointment: 2005 Prior to his retirement in May 2003, Mr. Dirks was Chief Operating Officer and a member of the Board of The Depository Trust & Clearing Corporation (DTCC). He also served as President, Chief Operating Officer, and Board member of The Depository Trust Company (DTC) and President and Board member of the National Securities Clearing Corporation (NSCC). In addition, Mr. Dirks served as Chief Executive Officer and Board member of the Government Securities Clearing Corporation, Chief Executive Officer and Board member of the Mortgage-Backed Securities Clearing Corporation, as a Trustee and a member of the Finance Committee of Manhattan College (2005-2008), and as a Trustee and a member of the Finance Committee of AHRC of Nassau County (2006-2008). Mr. Dirks is a member of the Independent Directors Council (IDC) Governing Council (2010-present) and Board of Directors for The Brookville Center for Children's Services, Inc. (2009-present). |
Alan J. Lacy (59) |
| Year of Election or Appointment: 2008 Mr. Lacy serves as Senior Adviser (2007-present) of Oak Hill Capital Partners, L.P. (private equity). Mr. Lacy also served as Chief Executive Officer (2000-2005) and Vice Chairman (2005-2006) of Sears Holdings Corporation and Sears, Roebuck and Co. (retail). In addition, Mr. Lacy serves as a member of the Board of Directors of Dave & Buster's Entertainment, Inc. (restaurant and entertainment complexes, 2010-present), Earth Fare, Inc. (retail grocery, 2012-present), The Hillman Companies, Inc. (hardware wholesalers, 2010-present), and Bristol-Myers Squibb Company (global pharmaceuticals, 2008-present). Mr. Lacy is a member of the Board of Trustees of The National Parks Conservation Association (2006-present). Previously, Mr. Lacy served as Chairman of the Board of Trustees of the National Parks Conservation Association (2008-2011) and as a member of the Board of Directors for the Western Union Company (global money transfer, 2006-2011). |
Ned C. Lautenbach (68) |
| Year of Election or Appointment: 2000 Mr. Lautenbach is Chairman of the Independent Trustees of the Equity and High Income Funds (2006-present). Mr. Lautenbach currently serves as the Lead Director of the Eaton Corporation Board of Directors (diversified industrial, 1997-present). Mr. Lautenbach is Chairman of the Board of Directors of the Philharmonic Center for the Arts in Naples, Florida (2012-present) and a member of the Council on Foreign Relations (1994-present). Previously, Mr. Lautenbach was a Partner/Advisory Partner at Clayton, Dubilier & Rice, LLC (private equity investment, 1998-2010), as well as a Director of Sony Corporation (2006-2007). |
Joseph Mauriello (68) |
| Year of Election or Appointment: 2008 Prior to his retirement in January 2006, Mr. Mauriello served in numerous senior management positions including Deputy Chairman and Chief Operating Officer (2004-2005), and Vice Chairman of Financial Services (2002-2004) of KPMG LLP US (professional services, 1965-2005). Mr. Mauriello currently serves as a member of the Board of Directors of XL Group plc. (global insurance and re-insurance, 2006-present). Previously, Mr. Mauriello served as a Director of the Hamilton Funds of the Bank of New York (2006-2007) and of Arcadia Resources Inc. (health care services and products, 2007-2012). |
Robert W. Selander (62) |
| Year of Election or Appointment: 2011 Previously, Mr. Selander served as a Member of the Advisory Board of Fidelity's Equity and High Income Funds (2011), Executive Vice Chairman (2010), Chief Executive Officer (2009-2010), and President and Chief Executive Officer (1997-2009) of Mastercard, Inc. |
Cornelia M. Small (68) |
| Year of Election or Appointment: 2005 Ms. Small is a member of the Board of Directors (2009-present) and Chair of the Investment Committee (2010-present) of the Teagle Foundation. Ms. Small also serves on the Investment Committee of the Berkshire Taconic Community Foundation (2008-present). Previously, Ms. Small served as Chairperson (2002-2008) and a member of the Investment Committee and Chairperson (2008-2012) and a member of the Board of Trustees of Smith College. In addition, Ms. Small served as Chief Investment Officer, Director of Global Equity Investments, and a member of the Board of Directors of Scudder, Stevens & Clark and Scudder Kemper Investments. |
William S. Stavropoulos (73) |
| Year of Election or Appointment: 2001 Mr. Stavropoulos is Vice Chairman of the Independent Trustees of the Equity and High Income Funds (2006-present). Mr. Stavropoulos serves as President and Founder of the Michigan Baseball Foundation, the Great Lakes Loons (2007-present). Mr. Stavropoulos is Chairman Emeritus of the Board of Directors of The Dow Chemical Company, where he previously served in numerous senior management positions, including President, CEO (1995-2000; 2002-2004), Chairman of the Executive Committee (2000-2006), and as a member of the Board of Directors (1990-2006). Currently, Mr. Stavropoulos is a Director of Univar Inc. (global distributor of commodity and specialty chemicals, Chairman from 2010-May 2012 and Lead Director from May 2012-present), Teradata Corporation (data warehousing and technology solutions, 2008-present), Maersk Inc. (industrial conglomerate), and Tyco International, Ltd. (multinational manufacturing and services, 2007-present), and a member of the Advisory Board for Metalmark Capital LLC (private equity investment, 2005-present). Mr. Stavropoulos is an operating advisor to Clayton, Dubilier & Rice, LLC (private equity investment). In addition, Mr. Stavropoulos is a member of the University of Notre Dame Advisory Council for the College of Science, a Trustee of the Rollin L. Gerstacker Foundation, and a Director of the Naples Philharmonic Center for the Arts. Previously, Mr. Stavropoulos served as a Director of Chemical Financial Corporation (bank holding company, 1993-2012). |
David M. Thomas (63) |
| Year of Election or Appointment: 2008 Previously, Mr. Thomas served as Executive Chairman (2005-2006) and Chairman and Chief Executive Officer (2000-2005) of IMS Health, Inc. (pharmaceutical and healthcare information solutions), and a Director of Fortune Brands, Inc. (consumer products, 2000-2011). In addition, Mr. Thomas serves as Non-Executive Chairman of the Board of Directors of Fortune Brands Home and Security (home and security products, 2011-present), and as a member of the Board of Directors of Interpublic Group of Companies, Inc. (marketing communication, 2004-present). |
Michael E. Wiley (62) |
| Year of Election or Appointment: 2008 Mr. Wiley also serves as a Director of Asia Pacific Exploration Consolidated (international oil and gas exploration and production, 2008-present). Mr. Wiley serves as a Director of Tesoro Corporation (independent oil refiner and marketer, 2005-present), and a Director of Bill Barrett Corporation (exploration and production, 2005-present). In addition, Mr. Wiley also serves as a Director of Post Oak Bank (privately-held bank, 2004-present). Previously, Mr. Wiley served as a member of the Board of Trustees of the University of Tulsa (2000-2006; 2007-2010), as a Senior Energy Advisor of Katzenbach Partners, LLC (consulting, 2006-2007), as an Advisory Director of Riverstone Holdings (private investment), Chairman, President, and CEO of Baker Hughes, Inc. (oilfield services, 2000-2004), and as Director of Spinnaker Exploration Company (exploration and production, 2001-2005). |
+ The information above includes each Trustee's principal occupation during the last five years and other information relating to the experience, attributes, and skills relevant to each Trustee's qualifications to serve as a Trustee, which led to the conclusion that each Trustee should serve as a Trustee for the fund.
Advisory Board Members and Executive Officers:
Correspondence intended for David A. Rosow and Garnett A. Smith may be sent to Fidelity Investments, P.O. Box 55235, Boston, Massachusetts 02205-5235. Correspondence intended for each executive officer, Edward C. Johnson 3d, and Peter S. Lynch may be sent to Fidelity Investments, 82 Devonshire Street, Boston, Massachusetts 02109.
Name, Age; Principal Occupation |
Edward C. Johnson 3d (82) |
| Year of Election or Appointment: 2011 Member of the Advisory Board of Fidelity's Equity and High Income Funds. Mr. Johnson serves as Chief Executive Officer, Chairman, and a Director of FMR LLC, and also serves as Chairman and Director of FIL Limited. Previously, Mr. Johnson served as a Trustee and Chairman of the Board of certain Fidelity Trusts, Chairman and a Director of FMR, Chairman and a Director of FMR Co., Inc., and President of FMR LLC (2006-2007). |
Peter S. Lynch (68) |
| Year of Election or Appointment: 2003 Member of the Advisory Board of Fidelity's Equity and High Income Funds. Mr. Lynch is Vice Chairman and a Director of FMR and FMR Co., Inc. In addition, Mr. Lynch serves as a Trustee of Boston College and as the Chairman of the Inner-City Scholarship Fund. Previously, Mr. Lynch served on the Special Olympics International Board of Directors (1997-2006). |
David A. Rosow (70) |
| Year of Election or Appointment: 2012 Member of the Advisory Board of Fidelity's Equity and High Income Funds. Chairman and Chief Executive Officer of International Golf Group, Inc. (golf course development, 1989-present). Previously, Mr. Rosow served as Chairman and Chief Executive Officer of Rosow & Company, Inc. (private investment company, 1989-2011), a Lead Director of Hudson United Bancorp (2001-2006) and as a Director of TD Banknorth (1996-2006). In addition, Mr. Rosow is a member (2008-present) and President (2009-present) of the Town Council of Palm Beach, Florida. |
Garnett A. Smith (65) |
| Year of Election or Appointment: 2012 Member of the Advisory Board of Fidelity's Equity and High Income Funds. Prior to Mr. Smith's retirement, he served as Chairman and Chief Executive Officer of Inbrand Corp. (manufacturer of personal absorbent products, 1990-1997). He also served as President (1986-1990) of Inbrand Corp. Prior to his employment with Inbrand Corp., he was employed by a retail fabric chain and North Carolina National Bank. In addition, Mr. Smith is a board member of the Jackson Hole Land Trust (2009-present). |
Kenneth B. Robins (43) |
| Year of Election or Appointment: 2008 President and Treasurer of Fidelity's Equity and High Income Funds. Mr. Robins also serves as President and Treasurer (2010-present) and Assistant Treasurer (2009-present) of other Fidelity funds and is an employee of Fidelity Investments (2004-present). Previously, Mr. Robins served as Deputy Treasurer of the Fidelity funds (2005-2008) and Treasurer and Chief Financial Officer of The North Carolina Capital Management Trust: Cash and Term Portfolios (2006-2008). |
Bruce T. Herring (47) |
| Year of Election or Appointment: 2006 Vice President of certain Equity Funds. Mr. Herring also serves as President of Fidelity Research & Analysis Company (2010-present), Chief Investment Officer and Director of Fidelity Management & Research (U.K.) Inc. (2010-present) and Group Chief Investment Officer of FMR. Previously, Mr. Herring served as Vice President (2005-2006) and Senior Vice President (2006-2007) of Fidelity Management & Research Company, Vice President of FMR Co., Inc. (2001-2007) and as a portfolio manager for Fidelity U.S. Equity Funds. |
Brian B. Hogan (48) |
| Year of Election or Appointment: 2009 Vice President of Equity and High Income Funds. Mr. Hogan also serves as President of FMR's Equity Division (2009-present). Previously, Mr. Hogan served as Senior Vice President, Equity Research of FMR (2006-2009) and as a portfolio manager. |
Scott C. Goebel (44) |
| Year of Election or Appointment: 2008 Secretary and Chief Legal Officer (CLO) of the Fidelity funds. Mr. Goebel also serves as Secretary of Fidelity Investments Money Management, Inc. (FIMM) (2010-present) and Fidelity Research and Analysis Company (FRAC) (2010-present); Secretary and CLO of The North Carolina Capital Management Trust: Cash and Term Portfolios (2008-present); General Counsel, Secretary, and Senior Vice President of FMR (2008-present) and FMR Co., Inc. (2008-present); employed by FMR LLC or an affiliate (2001-present); Chief Legal Officer of Fidelity Management & Research (Hong Kong) Limited (2008-present) and Assistant Secretary of Fidelity Management & Research (Japan) Inc. (2008-present), and Fidelity Management & Research (U.K.) Inc. (2008-present). Previously, Mr. Goebel served as Assistant Secretary of FIMM (2008-2010), FRAC (2008-2010), and the Funds (2007-2008) and as Vice President and Secretary of Fidelity Distributors Corporation (FDC) (2005-2007). |
William C. Coffey (43) |
| Year of Election or Appointment: 2009 Assistant Secretary of Fidelity's Equity and High Income Funds. Mr. Coffey also serves as Senior Vice President and Deputy General Counsel of FMR LLC (2010-present), and is an employee of Fidelity Investments. Previously, Mr. Coffey served as Vice President and Associate General Counsel of FMR LLC (2005-2009). |
Elizabeth Paige Baumann (44) |
| Year of Election or Appointment: 2012 Anti-Money Laundering (AML) Officer of the Fidelity funds. Ms. Baumann also serves as AML Officer of The North Carolina Capital Management Trust: Cash and Term Portfolios (2012-present), Chief AML Officer of FMR LLC (2012-present), and is an employee of Fidelity Investments. Previously, Ms. Baumann served as Vice President and Deputy Anti-Money Laundering Officer (2007-2012). |
Christine Reynolds (54) |
| Year of Election or Appointment: 2008 Chief Financial Officer of the Fidelity funds. Ms. Reynolds became President of Fidelity Pricing and Cash Management Services (FPCMS) in August 2008. Ms. Reynolds served as Chief Operating Officer of FPCMS (2007-2008). Previously, Ms. Reynolds served as President, Treasurer, and Anti-Money Laundering officer of the Fidelity funds (2004-2007). |
Joseph A. Hanlon (44) |
| Year of Election or Appointment: 2012 Chief Compliance Officer of Fidelity's Equity and High Income Funds. Mr. Hanlon serves as Compliance Officer of FMR, FMR Co., Inc., Fidelity Investments Money Management, Inc. (FIMM), Fidelity Research and Analysis Company (FRAC), Fidelity Management & Research (Japan) Inc., Fidelity Management & Research (U.K.) Inc., Fidelity Management & Research (Hong Kong), and Strategic Advisers, Inc. (2009-present), as Senior Vice President of the Fidelity Asset Management Division (2009-present), and is an employee of Fidelity Investments. |
Joseph F. Zambello (55) |
| Year of Election or Appointment: 2011 Deputy Treasurer of the Fidelity funds. Mr. Zambello is an employee of Fidelity Investments. Previously, Mr. Zambello served as Vice Presidentof FMR's Program Management Group (2009-2011) and Vice President of the Transfer Agent Oversight Group (2005-2009). |
Adrien E. Deberghes (45) |
| Year of Election or Appointment: 2008 Deputy Treasurer of Fidelity's Equity and High Income Funds. Mr. Deberghes also serves as Vice President (2011-present) and Assistant Treasurer (2010-present) of other Fidelity funds, and is an employee of Fidelity Investments (2008-present). Previously, Mr. Deberghes served as Senior Vice President of Mutual Fund Administration at State Street Corporation (2007-2008), Senior Director of Mutual Fund Administration at Investors Bank & Trust (2005-2007), and Director of Finance for Dunkin' Brands (2000-2005). |
Stephen Sadoski (41) |
| Year of Election or Appointment: 2012 Deputy Treasurer of Fidelity's Equity and High Income Funds. Mr. Sadoski also serves as Assistant Treasurer of other Fidelity funds (2012-present) and is an employee of Fidelity Investments (2012-present). Previously, Mr. Sadoski served as an assistant chief accountant in the Division of Investment Management of the Securities and Exchange Commission (SEC) (2009-2012) and as a senior manager at Deloitte & Touche (1997-2009). |
Stephanie J. Dorsey (43) |
| Year of Election or Appointment: 2010 Assistant Treasurer of Fidelity's Equity and High Income Funds. Ms. Dorsey also serves as Deputy Treasurer of other Fidelity funds (2008-present) and is an employee of Fidelity Investments (2008-present). Previously, Ms. Dorsey served as Treasurer (2004-2008) of the JPMorgan Mutual Funds and Vice President (2004-2008) of JPMorgan Chase Bank. |
John R. Hebble (54) |
| Year of Election or Appointment: 2009 Assistant Treasurer of Fidelity's Equity and High Income Funds. Mr. Hebble also serves as President (2011-present), Treasurer, and Chief Financial Officer of The North Carolina Capital Management Trust: Cash and Term Portfolios (2008-present), President and Treasurer of other Fidelity funds (2008-present) and is an employee of Fidelity Investments. |
Gary W. Ryan (54) |
| Year of Election or Appointment: 2005 Assistant Treasurer of the Fidelity funds. Mr. Ryan is an employee of Fidelity Investments. Previously, Mr. Ryan served as Vice President of Fund Reporting in Fidelity Pricing and Cash Management Services (FPCMS) (1999-2005). |
Jonathan Davis (44) |
| Year of Election or Appointment: 2010 Assistant Treasurer of the Fidelity funds. Mr. Davis is also Assistant Treasurer of Fidelity Rutland Square Trust II and Fidelity Commonwealth Trust II. Mr. Davis is an employee of Fidelity Investments. Previously, Mr. Davis served as Vice President and Associate General Counsel of FMR LLC (2003-2010). |
Annual Report
The Board of Trustees of Advisor Diversified International Fund voted to pay to shareholders of record at the opening of business on record date, the following distributions per share derived from capital gains realized from sales of portfolio securities, and dividends derived from net investment income:
| Pay Date | Record Date | Dividends | Capital Gains |
Class A | 12/10/12 | 12/07/12 | $0.209 | $0.061 |
Class T | 12/10/12 | 12/07/12 | $0.163 | $0.061 |
Class B | 12/10/12 | 12/07/12 | $0.058 | $0.061 |
Class C | 12/10/12 | 12/07/12 | $0.093 | $0.061 |
Class A, Class T, Class B, and Class C designates 100%, of each dividend distributed during the fiscal year as amounts which may be taken into account as a dividend for purposes of the maximum rate under section 1(h)(11) of the Internal Revenue Code.
The amounts per share which represent income derived from sources within, and taxes paid to, foreign countries or possessions of the United States are as follows:
| Pay Date | Income | Taxes |
Class A | 12/05/11 | $0.213 | $0.0190 |
Class T | 12/05/11 | $0.155 | $0.0190 |
Class B | 12/05/11 | $0.040 | $0.0190 |
Class C | 12/05/11 | $0.069 | $0.0190 |
The fund will notify shareholders in January 2013 of amounts for use in preparing 2012 income tax returns.
Annual Report
Board Approval of Investment Advisory Contracts and Management Fees
Fidelity Advisor Diversified International Fund
Each year, the Board of Trustees, including the Independent Trustees (together, the Board), votes on the renewal of the management contract and sub-advisory agreements (together, the Advisory Contracts) for the fund. The Board, assisted by the advice of fund counsel and Independent Trustees' counsel, requests and considers a broad range of information relevant to the renewal of the Advisory Contracts throughout the year.
The Board meets regularly and, at each of its meetings, considers factors that are relevant to its annual consideration of the renewal of the fund's Advisory Contracts, including the services and support provided to the fund and its shareholders. The Board has established various standing committees, each composed of and chaired by Independent Trustees with varying backgrounds, to which the Board has assigned specific subject matter responsibilities in order to enhance effective decision-making by the Board. The Board, acting directly and through its Committees, requests and receives information concerning the annual consideration of the renewal of the fund's Advisory Contracts. The Board also meets as needed to consider matters specifically related to the Board's annual consideration of the renewal of Advisory Contracts. Members of the Board may also meet with trustees of other Fidelity funds through ad hoc joint committees to discuss certain matters relevant to the Fidelity funds.
At its July 2012 meeting, the Board of Trustees, including the Independent Trustees, unanimously determined to renew the fund's Advisory Contracts. In reaching its determination, the Board considered all factors it believed relevant, including (i) the nature, extent, and quality of the services to be provided to the fund and its shareholders (including the investment performance of the fund); (ii) the competitiveness of the fund's management fee and total expense ratio relative to peer funds; (iii) the total costs of the services to be provided by and the profits to be realized by Fidelity from its relationship with the fund; (iv) the extent to which economies of scale exist and would be realized as the fund grows; and (v) whether fee levels reflect these economies of scale, if any, for the benefit of fund shareholders.
In considering whether to renew the Advisory Contracts for the fund, the Board reached a determination, with the assistance of fund counsel and Independent Trustees' counsel and through the exercise of its business judgment, that the renewal of the Advisory Contracts is in the best interests of the fund and its shareholders and that the compensation payable under the Advisory Contracts is fair and reasonable. The Board's decision to renew the Advisory Contracts was not based on any single factor, but rather was based on a comprehensive consideration of all the information provided to the Board at its meetings throughout the year. The Board, in reaching its determination to renew the Advisory Contracts, is aware that shareholders in the fund have a broad range of investment choices available to them, including a wide choice among mutual funds offered by Fidelity's competitors, and that the fund's shareholders, who have the opportunity to review and weigh the disclosure provided by the fund in its prospectus and other public disclosures, have chosen to invest in this fund, managed by Fidelity.
Annual Report
Nature, Extent, and Quality of Services Provided. The Board considered the staffing within the investment adviser, FMR, and the sub-advisers (together, the Investment Advisers), including the backgrounds of the fund's investment personnel, and also considered the fund's investment objective, strategies, and related investment philosophy. The Independent Trustees also had discussions with senior management of Fidelity's investment operations and investment groups. The Board considered the structure of the portfolio manager compensation program and whether this structure provides appropriate incentives to act in the best interests of the fund.
Resources Dedicated to Investment Management and Support Services. The Board and the Fund Oversight and Research Committees reviewed the general qualifications and capabilities of the Investment Advisers' investment staff, including its size, education, experience, and resources, as well as the Investment Advisers' approach to recruiting, training, managing, and compensating investment personnel. The Board also noted that FMR has continued to increase the resources devoted to non-U.S. offices, including expansion of Fidelity's global investment organization. The Board noted that Fidelity's analysts have extensive resources, tools and capabilities that allow them to conduct sophisticated quantitative and fundamental analysis, as well as credit analysis of issuers, counterparties and guarantors. The Board also believes that Fidelity's investment professionals have sufficient access to global information and data so as to provide competitive investment results over time, and that those professionals also have access to sophisticated tools that permit them to assess portfolio construction and risk and performance attribution characteristics continuously, as well as to transmit new information and research conclusions rapidly around the world. Additionally, in its deliberations, the Board considered the Investment Advisers' trading and risk management capabilities and resources, which are an integral part of the investment management process.
Shareholder and Administrative Services. The Board considered (i) the nature, extent, quality, and cost of advisory, administrative, and shareholder services performed by the Investment Advisers and their affiliates under the Advisory Contracts and under separate agreements covering transfer agency, pricing and bookkeeping, and securities lending services for the fund; (ii) the nature and extent of the supervision of third party service providers, principally custodians and subcustodians; and (iii) the resources devoted to, and the record of compliance with, the fund's compliance policies and procedures. The Board also reviewed the allocation of fund brokerage, including allocations to brokers affiliated with the Investment Advisers, the use of brokerage commissions to pay fund expenses, and the use of "soft" commission dollars to pay for research services.
The Board noted that the growth of fund assets over time across the complex allows Fidelity to reinvest in the development of services designed to enhance the value or convenience of the Fidelity funds as investment vehicles. These services include 24-hour access to account information and market information through telephone representatives and over the Internet, investor education materials and asset allocation tools, and the expanded availability of Fidelity Investor Centers.
Annual Report
Board Approval of Investment Advisory Contracts and
Management Fees - continued
Investment in a Large Fund Family. The Board considered the benefits to shareholders of investing in a Fidelity fund, including the benefits of investing in a fund that is part of a large family of funds offering a variety of investment disciplines and providing a large variety of mutual fund investor services. The Board noted that Fidelity had taken, or had made recommendations that resulted in the Fidelity funds taking, a number of actions over the previous year that benefited particular funds, including (i) continuing to dedicate additional resources to investment research and support of the senior management team that oversees asset management; (ii) persisting in efforts to enhance Fidelity's research capabilities, in particular, international research; (iii) launching new funds and making other enhancements to meet client needs for global and income-oriented solutions; (iv) continuing to launch dedicated lower cost underlying funds to meet investment management's portfolio construction needs related to expanding underlying fund options, specifically for the Freedom Fund product lines; (v) adopting a "Stock Selector" sector neutral investment approach and employing a team of portfolio managers who are sector specialists to manage certain funds; (vi) rationalizing product lines and gaining increased efficiencies through the mergers of several funds into other funds; (vii) strengthening the Spartan Index Fund product line by adding new funds and/or new low-cost institutional share classes, restructuring fund expenses to accommodate new classes, and reducing investment minimums for certain classes of shares; (viii) modifying the eligibility criteria for Institutional Class shares to increase their appeal to government entities and charitable investors; and (ix) reducing certain transfer agent fee rates.
Investment Performance. The Board considered whether the fund has operated in accordance with its investment objective, as well as its record of compliance with its investment restrictions. It also reviewed the fund's absolute investment performance for each class, as well as the fund's relative investment performance for each class measured over multiple periods against (i) a broad-based securities market index, and (ii) a peer group of mutual funds deemed appropriate by Fidelity and reviewed by the Board. The following charts considered by the Board show, over the one-, three-, and five-year periods ended December 31, 2011, the cumulative total returns of Institutional Class (Class I) and Class B of the fund, the cumulative total returns of a broad-based securities market index ("benchmark"), and a range of cumulative total returns of a peer group of mutual funds identified by Morningstar, Inc. as having an investment style similar to that of the fund based on underlying portfolio holdings. The returns of Institutional Class (Class I) and Class B show the performance of the highest and lowest performing classes, respectively (based on five-year performance). The box within each chart shows the 25th percentile return (top of box) and the 75th percentile return (bottom of box) of the peer group. Returns shown above the box are in the first quartile and returns shown below the box are in the fourth quartile. The percentage beaten numbers noted below each chart correspond to the percentile box and represent the percentage of funds in the peer group whose performance was equal to or lower than that of the class indicated.
Annual Report
Fidelity Advisor Diversified International Fund
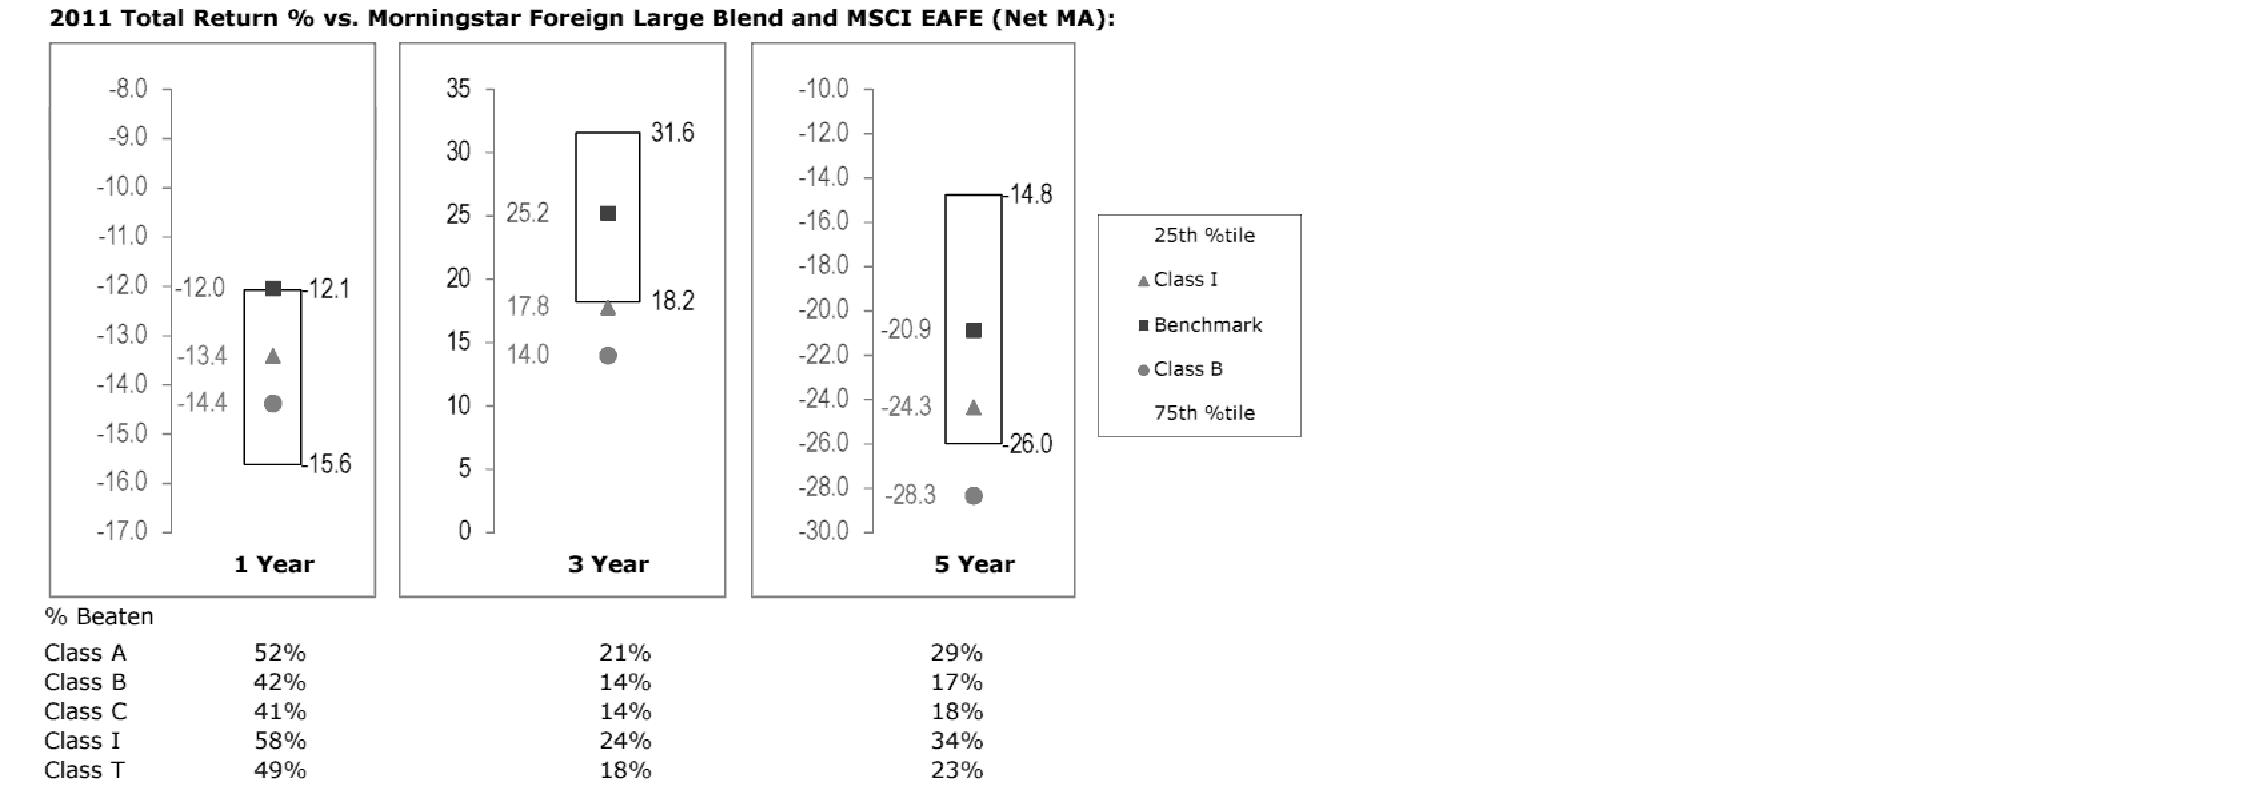
The Board reviewed the fund's relative investment performance against its peer group and noted that the performance of Institutional Class (Class I) of the fund was in the second quartile for the one-year period, the fourth quartile for the three-year period, and the third quartile for the five-year period. The Board also noted that the investment performance of the fund was lower than its benchmark for all the periods shown. The Board considered that the variations in performance among the fund's classes reflect the variations in class expenses, which result in lower performance for higher expense classes. The Board discussed with FMR the fact that the fund underperformed its benchmark for each period measured. The Board also reviewed the fund's performance since inception as well as performance in the current year. The Board will continue to closely monitor performance of the fund in the coming year and discuss with FMR if other actions to address performance are appropriate.
Based on its review, the Board concluded that the nature, extent, and quality of services provided to the fund under the Advisory Contracts should benefit the fund's shareholders.
Competitiveness of Management Fee and Total Expense Ratio. The Board considered the fund's management fee and total expense ratio compared to "mapped groups" of competitive funds and classes. Fidelity creates "mapped groups" by combining similar Lipper investment objective categories that have comparable management fee characteristics. Combining Lipper investment objective categories aids the Board's management fee and total expense ratio comparisons by broadening the competitive group used for comparison and by reducing the number of universes to which various Fidelity funds are compared.
Annual Report
Board Approval of Investment Advisory Contracts and
Management Fees - continued
Management Fee. The Board considered two proprietary management fee comparisons for the 12-month periods shown in the chart below. The group of Lipper funds used by the Board for management fee comparisons is referred to below as the "Total Mapped Group." The Total Mapped Group comparison focuses on a fund's standing relative to the total universe of comparable funds available to investors in terms of gross management fees before expense reimbursements or caps. "TMG %" represents the percentage of funds in the Total Mapped Group that had management fees that were lower than the fund's. For example, a TMG % of 17% means that 83% of the funds in the Total Mapped Group had higher management fees than the fund. The "Asset-Size Peer Group" (ASPG) comparison focuses on a fund's standing relative to non-Fidelity funds similar in size to the fund within the Total Mapped Group. The ASPG represents at least 15% of the funds in the Total Mapped Group with comparable asset size and management fee characteristics, subject to a minimum of 50 funds (or all funds in the Total Mapped Group if fewer than 50). Additional information, such as the ASPG quartile in which the fund's management fee ranked, is also included in the chart and considered by the Board.
Fidelity Advisor Diversified International Fund

The Board noted that the fund's management fee ranked below the median of its Total Mapped Group and below the median of its ASPG for 2011.
Based on its review, the Board concluded that the fund's management fee is fair and reasonable in light of the services that the fund receives and the other factors considered.
Total Expense Ratio. In its review of each class's total expense ratio, the Board considered the fund's management fee as well as other fund or class expenses, as applicable, such as transfer agent fees, pricing and bookkeeping fees, fund-paid 12b-1 fees, and custodial, legal, and audit fees. The Board also noted the effects of any waivers and reimbursements on fees and expenses. As part of its review, the Board also considered the current and historical total expense ratios of each class of the fund compared to competitive fund median expenses. Each class of the fund is compared to those funds and classes in the Total Mapped Group (used by the Board for management fee comparisons) that have a similar sales load structure.
Annual Report
The Board noted that the total expense ratio of each of Class A, Class B, Class C, and Institutional Class ranked below its competitive median for 2011 and the total expense ratio of Class T ranked above its competitive median for 2011. The Board considered that various factors, including 12b-1 fees, positive or negative performance adjustments, and relatively higher other expenses in the case of small fund size, can affect total expense ratios. The Board noted that the total expense ratio of Class T was above the competitive median primarily because of higher 12b-1 fees on Class T. Class T has a higher 12b-1 fee, but a lower front-end sales charge, than traditionally priced front-end sales charge classes. The Board considered that Class T is primarily sold load-waived in the retirement plan market where its 0.50% 12b-1 fee is comparable to competing no-load, higher 12b-1 fee classes designed specifically for retirement plans. The Board noted that the fund offers multiple classes, each of which has a different sales load and 12b-1 fee structure, and that the multiple structures are intended to offer a range of pricing options for the intermediary market. The Board also noted that the total expense ratios of the classes vary primarily by the level of their 12b-1 fees, although differences in transfer agent fees may also cause expenses to vary from class to class.
Fees Charged to Other Fidelity Clients. The Board also considered Fidelity fee structures and other information with respect to clients of FMR and its affiliates, such as other mutual funds advised or subadvised by FMR or its affiliates, pension plan clients, and other institutional clients. The Board noted the findings of the 2010 ad hoc joint committee (created with the board of other Fidelity funds), which reviewed and compared Fidelity's institutional investment advisory business with its business of providing services to the Fidelity funds, including the differences in services provided, fees charged, and costs incurred, as well as competition in their respective marketplaces.
Based on its review of total expense ratios and fees charged to other Fidelity clients, the Board concluded that the total expense ratio of each class of the fund was reasonable, although Class T was above the median of the universe presented for comparison, in light of the services that the fund and its shareholders receive and the other factors considered.
Costs of the Services and Profitability. The Board considered the revenues earned and the expenses incurred by Fidelity in conducting the business of developing, marketing, distributing, managing, administering and servicing the fund and its shareholders. The Board also considered the level of Fidelity's profits in respect of all the Fidelity funds.
Annual Report
Board Approval of Investment Advisory Contracts and
Management Fees - continued
On an annual basis, FMR presents to the Board Fidelity's profitability for the fund. Fidelity calculates the profitability for each fund, as well as aggregate profitability for groups of Fidelity funds and all Fidelity funds, using a series of detailed revenue and cost allocation methodologies which originate with the books and records of Fidelity on which Fidelity's audited financial statements are based. The Audit Committee of the Board reviews any significant changes from the prior year's methodologies.
PricewaterhouseCoopers LLP (PwC), independent registered public accounting firm and auditor to Fidelity and certain Fidelity funds, has been engaged annually by the Board as part of the Board's assessment of Fidelity's profitability analysis. PwC's engagement includes the review and assessment of Fidelity's methodologies used in determining the revenues and expenses attributable to Fidelity's mutual fund business, and completion of agreed-upon procedures surrounding the mathematical accuracy of fund profitability and its conformity to allocation methodologies. After considering PwC's reports issued under the engagement and information provided by Fidelity, the Board concluded that while other allocation methods may also be reasonable, Fidelity's profitability methodologies are reasonable in all material respects.
The Board also reviewed Fidelity's non-fund businesses and fall-out benefits related to the mutual fund business as well as cases where Fidelity's affiliates may benefit from or be related to the fund's business.
The Board considered the costs of the services provided by and the profits realized by Fidelity in connection with the operation of the fund and was satisfied that the profitability was not excessive in the circumstances.
Economies of Scale. The Board considered whether there have been economies of scale in respect of the management of the Fidelity funds, whether the Fidelity funds (including the fund) have appropriately benefited from any such economies of scale, and whether there is potential for realization of any further economies of scale. The Board considered the extent to which the fund will benefit from economies of scale through increased services to the fund, through waivers or reimbursements, or through fee or expense reductions. The Board also noted that in 2009, it and the board of other Fidelity funds created an ad hoc committee (the Economies of Scale Committee) to analyze whether FMR attains economies of scale in respect of the management and servicing of the Fidelity funds, whether the Fidelity funds have appropriately benefited from such economies of scale, and whether there is potential for realization of any further economies of scale.
The Board recognized that the fund's management contract incorporates a "group fee" structure, which provides for lower group fee rates as total fund assets under FMR's management increase, and for higher group fee rates as total fund assets under FMR's management decrease. FMR calculates the group fee rates based on a tiered asset "breakpoint" schedule that varies based on asset class. The Board considered that the group fee is designed to deliver the benefits of economies of scale to fund shareholders when total Fidelity fund assets increase, even if assets of any particular fund are unchanged or have declined, because some portion of Fidelity's costs are attributable to services provided to all Fidelity funds, and all funds benefit if those costs can be allocated among more assets. The Board concluded that, given the group fee structure, fund shareholders will benefit from lower management fees as assets under FMR's management increase at the fund complex level, regardless of whether Fidelity achieves any such economies of scale.
Annual Report
The Board concluded, taking into account the analysis of the Economies of Scale Committee, that economies of scale, if any, are being appropriately shared between fund shareholders and Fidelity.
Additional Information Requested by the Board. In order to develop fully the factual basis for consideration of the Fidelity funds' Advisory Contracts, the Board requested and received additional information on certain topics, including (i) fund performance trends, actions to be taken by FMR to improve certain funds' overall performance, and Fidelity's long-term strategies for certain funds; (ii) the potential to further rationalize the Fidelity fund lineup with the possibility of achieving savings for the funds and Fidelity; (iii) Fidelity's compensation structure for portfolio managers and other key investment personnel; (iv) the amount of the investment that each portfolio manager has made in the Fidelity fund(s) that he or she manages; (v) the realization of fall-out benefits in certain Fidelity business units; (vi) Fidelity's group fee structures, the potential impact of regulatory changes on such structures, and the rationale for the individual fee rates of certain funds; (vii) fund profitability methodology, including Fidelity's cost allocation methodology, and the impact of certain factors on fund profitability results; (viii) trends regarding industry use of performance fee structures and the possibility of implementing performance fee structures for additional funds; and (ix) the impact of net redemptions from the Fidelity funds.
Based on its evaluation of all of the conclusions noted above, and after considering all factors it believed relevant, the Board ultimately concluded that the advisory fee structures are fair and reasonable, and that the fund's Advisory Contracts should be renewed.
Annual Report
Investment Adviser
Fidelity Management & Research Company
Boston, MA
Investment Sub-Advisers
FMR Co., Inc.
Fidelity Management & Research
(U.K.) Inc.
FIL Investment Advisors
FIL Investments (Japan) Limited
FIL Investment Advisors (UK) Limited
Fidelity Management & Research
(Hong Kong) Limited
Fidelity Management & Research
(Japan) Inc.
General Distributor
Fidelity Distributors Corporation
Smithfield, RI
Transfer and Service Agents
Fidelity Investments Institutional Operations Company, Inc.
Boston, MA
Fidelity Service Company, Inc.
Boston, MA
Custodian
State Street Bank and Trust Company
Quincy, MA
(Fidelity Investment logo)(registered trademark)
ADIF-UANN-1212
1.784735.109
(Fidelity Investment logo)(registered trademark)
Fidelity Advisor®
Diversified International
Fund - Institutional Class
Annual Report
October 31, 2012
(Fidelity Cover Art)
Contents
Performance | (Click Here) | How the fund has done over time. |
Management's Discussion of Fund Performance | (Click Here) | The Portfolio Manager's review of fund performance and strategy. |
Shareholder Expense Example | (Click Here) | An example of shareholder expenses. |
Investment Changes | (Click Here) | A summary of major shifts in the fund's investments over the past six months. |
Investments | (Click Here) | A complete list of the fund's investments with their market values. |
Financial Statements | (Click Here) | Statements of assets and liabilities, operations, and changes in net assets, as well as financial highlights. |
Notes | (Click Here) | Notes to the financial statements. |
Report of Independent Registered Public Accounting Firm | (Click Here) | |
Trustees and Officers | (Click Here) | |
Distributions | (Click Here) | |
Board Approval of Investment Advisory Contracts and Management Fees | (Click Here) | |
To view a fund's proxy voting guidelines and proxy voting record for the 12-month period ended June 30, visit http://www.fidelity.com/proxyvotingresults or visit the Securities and Exchange Commission's (SEC) web site at http://www.sec.gov. You may also call 1-877-208-0098 to request a free copy of the proxy voting guidelines.
Standard & Poor's, S&P and S&P 500 are registered service marks of The McGraw-Hill Companies, Inc. and have been licensed for use by Fidelity Distributors Corporation.
Other third party marks appearing herein are the property of their respective owners.
All other marks appearing herein are registered or unregistered trademarks or service marks of FMR LLC or an affiliated company. © 2012 FMR LLC. All rights reserved.
Annual Report
This report and the financial statements contained herein are submitted for the general information of the shareholders of the fund. This report is not authorized for distribution to prospective investors in the fund unless preceded or accompanied by an effective prospectus.
A fund files its complete schedule of portfolio holdings with the SEC for the first and third quarters of each fiscal year on Form N-Q. Forms N-Q are available on the SEC's web site at http://www.sec.gov. A fund's Forms N-Q may be reviewed and copied at the SEC's Public Reference Room in Washington, DC. Information regarding the operation of the SEC's Public Reference Room may be obtained by calling 1-800-SEC-0330. For a complete list of a fund's portfolio holdings, view the most recent holdings listing, semiannual report, or annual report on Fidelity's web site at http://www.fidelity.com, http://www.advisor.fidelity.com, or http://www.401k.com, as applicable.
NOT FDIC INSURED • MAY LOSE VALUE • NO BANK GUARANTEE
Neither the fund nor Fidelity Distributors Corporation is a bank.
Annual Report
Average annual total return reflects the change in the value of an investment, assuming reinvestment of the class' distributions from dividend income and capital gains (the profits earned upon the sale of securities that have grown in value, if any) and assuming a constant rate of performance each year. The $10,000 table and the fund's returns do not reflect the deduction of taxes that a shareholder would pay on fund distributions or the redemption of fund shares. During periods of reimbursement by Fidelity, a fund's total return will be greater than it would be had the reimbursement not occurred. How a fund did yesterday is no guarantee of how it will do tomorrow.
Average Annual Total Returns
Periods ended October 31, 2012 | Past 1
year | Past 5
years | Past 10
years |
Institutional Class | 8.83% | -5.80% | 7.67% |
$10,000 Over 10 Years
Let's say hypothetically that $10,000 was invested in Fidelity Advisor® Diversified International Fund - Institutional Class on October 31, 2002. The chart shows how the value of your investment would have changed, and also shows how the MSCI ® EAFE® Index performed over the same period.
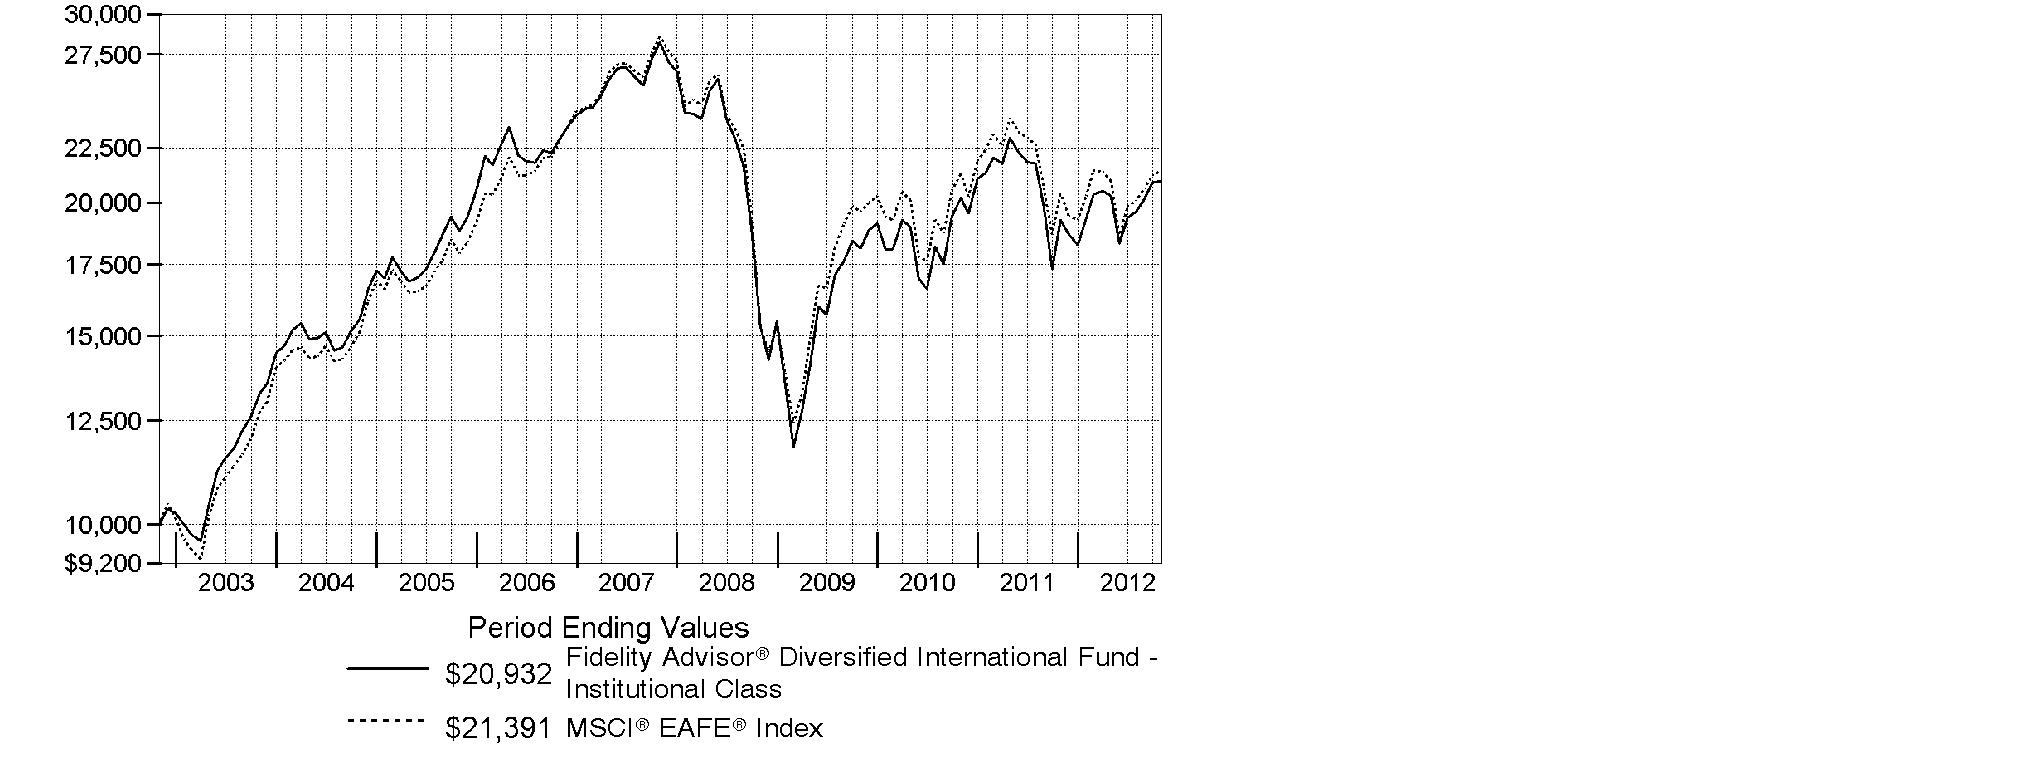
Annual Report
Market Recap: International stocks experienced pendulum-like swings during the 12 months ending October 31, 2012, finishing the period with a modest advance. The market faced periodic bouts of volatility this past year, as a number of macroeconomic concerns - including the eurozone debt crisis, the strength and pace of the U.S. economic recovery, and a slowdown in China's once-blistering growth - dominated headlines and weighed on investors. While a stronger U.S. dollar provided an additional head wind, foreign developed- and emerging-markets stocks still managed a gain for the 12 months, as the MSCI® ACWI® (All Country World Index) ex USA Index rose 4.11%, largely buttressed in the summertime by pledges of accommodative monetary action from eurozone officials, as well as signs that the U.S. housing market was on the mend. Within the index, Asia-Pacific ex Japan showed the most impressive gains, advancing roughly 11%. A number of core European components, most notably Germany (+11%), Switzerland (+10%) and the U.K. (+9%), benefited from optimism about the eurozone's ability to resolve its debt woes, which also helped the region outpace the index overall. Elsewhere, results from Canada (+3%) and the generally more volatile emerging markets (+2%) each fell short of the MSCI index, while Japan was among the few benchmark constituents to finish in the red, returning about -3%.
Comments from William Bower, Portfolio Manager of Fidelity Advisor® Diversified International Fund: For the year, the fund's Institutional Class shares returned 8.83%, solidly outperforming the 4.76% gain of the MSCI® EAFE® Index. Stock selection in information technology, consumer staples, health care and consumer discretionary helped relative performance. Geographically, the fund benefited from security selection in Europe - particularly Spain and France - and Japan. Top individual contributors included Danish pharmaceuticals firm Novo Nordisk, U.S. consumer electronics giant Apple, Belgian brewer Anheuser-Busch InBev, South Korean snack maker Orion, Japanese drugstore operator Cosmos Pharmaceutical, Spanish online retailer Inditex and not owning Spanish telecommunications company and index component Telefonica. Conversely, stock selection in energy and an underweighting in financials hurt. Among the main detractors were Canadian energy exploration and production companies Niko Resources and Petrominerales, Japanese Internet retailer Rakuten, Australian gold firm Newcrest Mining and Chinese search engine company Baidu, which is listed in the Cayman Islands. Some of the stocks mentioned in this review were not in the index, and Niko was not held at period end.
The views expressed above reflect those of the portfolio manager(s) only through the end of the period as stated on the cover of this report and do not necessarily represent the views of Fidelity or any other person in the Fidelity organization. Any such views are subject to change at any time based upon market or other conditions and Fidelity disclaims any responsibility to update such views. These views may not be relied on as investment advice and, because investment decisions for a Fidelity fund are based on numerous factors, may not be relied on as an indication of trading intent on behalf of any Fidelity fund.
Annual Report
Shareholder Expense Example
As a shareholder of the Fund, you incur two types of costs: (1) transaction costs, including sales charges (loads) on purchase payments or redemption proceeds, redemption fees and (2) ongoing costs, including management fees, distribution and/or service (12b-1) fees and other Fund expenses. This Example is intended to help you understand your ongoing costs (in dollars) of investing in the Fund and to compare these costs with the ongoing costs of investing in other mutual funds.
The Example is based on an investment of $1,000 invested at the beginning of the period and held for the entire period (May 1, 2012 to October 31, 2012).
Actual Expenses
The first line of the accompanying table for each class of the Fund provides information about actual account values and actual expenses. You may use the information in this line, together with the amount you invested, to estimate the expenses that you paid over the period. Simply divide your account value by $1,000.00 (for example, an $8,600 account value divided by $1,000.00 = 8.6), then multiply the result by the number in the first line for a class of the Fund under the heading entitled "Expenses Paid During Period" to estimate the expenses you paid on your account during this period. In addition, the Fund, as a shareholder in the underlying Fidelity Central Funds, will indirectly bear its pro-rata share of the fees and expenses incurred by the underlying Fidelity Central Funds. These fees and expenses are not included in the Fund's annualized expense ratio used to calculate the expense estimate in the table below.
Hypothetical Example for Comparison Purposes
The second line of the accompanying table for each class of the Fund provides information about hypothetical account values and hypothetical expenses based on a Class' actual expense ratio and an assumed rate of return of 5% per year before expenses, which is not the Class' actual return. The hypothetical account values and expenses may not be used to estimate the actual ending account balance or expenses you paid for the period. You may use this information to compare the ongoing costs of investing in the Fund and other funds. To do so, compare this 5% hypothetical example with the 5% hypothetical examples that appear in the shareholder reports of the other funds. In addition, the Fund, as a shareholder in the underlying Fidelity Central Funds, will indirectly bear its pro-rata share of the fees and expenses incurred by the underlying Fidelity Central Funds. These fees and expenses are not included in the Fund's annualized expense ratio used to calculate the expense estimate in the table below.
Please note that the expenses shown in the table are meant to highlight your ongoing costs only and do not reflect any transaction costs. Therefore, the second line of the table is useful in comparing ongoing costs only, and will not help you determine the relative total costs of owning different funds. In addition, if these transactional costs were included, your costs would have been higher.
Annual Report
Shareholder Expense Example - continued
| Annualized
Expense Ratio | Beginning
Account Value
May 1, 2012 | Ending
Account Value
October 31, 2012 | Expenses Paid
During Period*
May 1, 2012
to October 31, 2012 |
Class A | 1.32% | | | |
Actual | | $ 1,000.00 | $ 1,029.60 | $ 6.73 |
Hypothetical A | | $ 1,000.00 | $ 1,018.50 | $ 6.70 |
Class T | 1.57% | | | |
Actual | | $ 1,000.00 | $ 1,027.90 | $ 8.00 |
Hypothetical A | | $ 1,000.00 | $ 1,017.24 | $ 7.96 |
Class B | 2.07% | | | |
Actual | | $ 1,000.00 | $ 1,025.40 | $ 10.54 |
Hypothetical A | | $ 1,000.00 | $ 1,014.73 | $ 10.48 |
Class C | 2.05% | | | |
Actual | | $ 1,000.00 | $ 1,026.00 | $ 10.44 |
Hypothetical A | | $ 1,000.00 | $ 1,014.83 | $ 10.38 |
Institutional Class | .99% | | | |
Actual | | $ 1,000.00 | $ 1,031.80 | $ 5.06 |
Hypothetical A | | $ 1,000.00 | $ 1,020.16 | $ 5.03 |
A 5% return per year before expenses
* Expenses are equal to each Class' annualized expense ratio, multiplied by the average account value over the period, multiplied by 184/366 (to reflect the one-half year period).
Annual Report
Investment Changes (Unaudited)
Top Five Stocks as of October 31, 2012 |
| % of fund's
net assets | % of fund's net assets
6 months ago |
Novo Nordisk A/S Series B (Denmark, Pharmaceuticals) | 2.7 | 2.6 |
Sanofi SA (France, Pharmaceuticals) | 2.6 | 1.9 |
Royal Dutch Shell PLC Class B (United Kingdom, Oil, Gas & Consumable Fuels) | 2.3 | 3.1 |
Anheuser-Busch InBev SA NV (Belgium, Beverages) | 2.2 | 1.7 |
BHP Billiton Ltd. sponsored ADR (Australia, Metals & Mining) | 2.1 | 2.1 |
| 11.9 | |
Top Five Market Sectors as of October 31, 2012 |
| % of fund's
net assets | % of fund's net assets
6 months ago |
Financials | 15.6 | 15.1 |
Consumer Discretionary | 15.4 | 16.1 |
Consumer Staples | 15.4 | 12.7 |
Health Care | 12.9 | 10.6 |
Information Technology | 10.3 | 10.6 |
Top Five Countries as of October 31, 2012 |
(excluding cash equivalents) | % of fund's
net assets | % of fund's net assets
6 months ago |
United Kingdom | 17.6 | 17.9 |
Japan | 15.0 | 15.7 |
Germany | 8.8 | 8.1 |
France | 8.6 | 7.3 |
Switzerland | 5.0 | 4.2 |
Percentages are adjusted for the effect of open futures contracts, if applicable. |
Asset Allocation (% of fund's net assets) |
As of October 31, 2012 | As of April 30, 2012 |
| Stocks 98.3% | | | Stocks 95.6% | |
| Other Investments 0.0%* | | | Other Investments 0.0%* | |
| Short-Term
Investments and
Net Other Assets
(Liabilities) 1.7% | | | Short-Term
Investments and
Net Other Assets
(Liabilities) 4.4% | |
* Amount represents less than 0.1% |

Annual Report
Investments October 31, 2012
Showing Percentage of Net Assets
Common Stocks - 96.9% |
| Shares | | Value (000s) |
Australia - 4.3% |
Australia & New Zealand Banking Group Ltd. | 521,018 | | $ 13,764 |
BHP Billiton Ltd. sponsored ADR (d) | 569,136 | | 40,261 |
CSL Ltd. | 150,024 | | 7,397 |
Iluka Resources Ltd. | 236,843 | | 2,439 |
Newcrest Mining Ltd. | 280,117 | | 7,685 |
Origin Energy Ltd. | 297,766 | | 3,511 |
Spark Infrastructure Group unit | 1,390,264 | | 2,439 |
Telstra Corp. Ltd. | 1,209,105 | | 5,196 |
TOTAL AUSTRALIA | | 82,692 |
Bailiwick of Guernsey - 0.7% |
Resolution Ltd. | 3,544,018 | | 12,485 |
Bailiwick of Jersey - 1.4% |
Experian PLC | 836,500 | | 14,444 |
Randgold Resources Ltd. sponsored ADR | 42,300 | | 5,059 |
Shire PLC | 135,100 | | 3,799 |
WPP PLC | 326,324 | | 4,218 |
TOTAL BAILIWICK OF JERSEY | | 27,520 |
Belgium - 2.3% |
Anheuser-Busch InBev SA NV | 504,331 | | 42,178 |
UCB SA | 35,400 | | 2,065 |
TOTAL BELGIUM | | 44,243 |
Bermuda - 0.5% |
Assured Guaranty Ltd. | 290,700 | | 4,038 |
Clear Media Ltd. | 10,117,000 | | 5,222 |
TOTAL BERMUDA | | 9,260 |
Brazil - 1.3% |
Anhanguera Educacional Participacoes SA | 216,900 | | 3,802 |
BR Malls Participacoes SA | 72,700 | | 956 |
Estacio Participacoes SA | 202,800 | | 3,864 |
Kroton Educacional SA unit (a) | 128,700 | | 2,573 |
Porto Seguro SA | 204,300 | | 2,173 |
Qualicorp SA (a) | 447,000 | | 4,587 |
Souza Cruz SA | 287,400 | | 3,750 |
Tractebel Energia SA | 181,600 | | 3,129 |
TOTAL BRAZIL | | 24,834 |
British Virgin Islands - 0.2% |
Mail.ru Group Ltd. GDR (Reg. S) | 105,400 | | 3,515 |
Common Stocks - continued |
| Shares | | Value (000s) |
Canada - 3.4% |
Alimentation Couche-Tard, Inc. Class B (sub. vtg.) | 67,100 | | $ 3,296 |
ARC Resources Ltd. (d) | 76,700 | | 1,862 |
Canadian Natural Resources Ltd. | 235,500 | | 7,097 |
Catamaran Corp. (a) | 43,800 | | 2,057 |
CGI Group, Inc. Class A (sub. vtg.) (a) | 107,500 | | 2,812 |
Fairfax Financial Holdings Ltd. (sub. vtg.) | 14,900 | | 5,528 |
Franco-Nevada Corp. | 74,000 | | 4,261 |
Goldcorp, Inc. | 172,400 | | 7,794 |
Painted Pony Petroleum Ltd. (a)(e) | 170,900 | | 1,848 |
Painted Pony Petroleum Ltd. Class A (a) | 420,800 | | 4,550 |
Penn West Petroleum Ltd. | 156,300 | | 2,030 |
Petrobank Energy & Resources Ltd. (a) | 267,200 | | 3,671 |
Petrominerales Ltd. (d) | 119,814 | | 961 |
Suncor Energy, Inc. | 319,700 | | 10,730 |
Tourmaline Oil Corp. (a) | 150,000 | | 4,956 |
TransForce, Inc. | 23,300 | | 425 |
Turquoise Hill Resources Ltd. (a) | 233,521 | | 1,826 |
TOTAL CANADA | | 65,704 |
Cayman Islands - 1.5% |
Baidu.com, Inc. sponsored ADR (a) | 100,500 | | 10,715 |
Haitian International Holdings Ltd. | 653,000 | | 806 |
Hengan International Group Co. Ltd. | 801,000 | | 7,297 |
HiSoft Technology International Ltd. ADR (a) | 178,100 | | 1,850 |
Sands China Ltd. | 2,052,800 | | 7,721 |
TOTAL CAYMAN ISLANDS | | 28,389 |
Curacao - 0.4% |
Schlumberger Ltd. | 105,300 | | 7,322 |
Denmark - 3.0% |
Novo Nordisk A/S Series B | 318,608 | | 51,070 |
William Demant Holding A/S (a) | 82,847 | | 7,125 |
TOTAL DENMARK | | 58,195 |
France - 8.6% |
Alstom SA | 49,900 | | 1,704 |
Arkema SA | 74,800 | | 6,820 |
AXA SA | 386,800 | | 6,149 |
BNP Paribas SA | 446,143 | | 22,443 |
Bureau Veritas SA | 75,000 | | 7,965 |
Edenred SA | 143,610 | | 4,156 |
Essilor International SA | 137,858 | | 12,428 |
Common Stocks - continued |
| Shares | | Value (000s) |
France - continued |
Eurofins Scientific SA | 37,700 | | $ 5,830 |
JC Decaux SA | 128,200 | | 2,713 |
LVMH Moet Hennessy - Louis Vuitton SA | 58,229 | | 9,464 |
PPR SA | 87,700 | | 15,420 |
Publicis Groupe SA | 131,600 | | 7,090 |
Sanofi SA | 565,091 | | 49,631 |
Schneider Electric SA | 69,000 | | 4,314 |
Vivendi SA | 457,385 | | 9,358 |
TOTAL FRANCE | | 165,485 |
Germany - 7.4% |
adidas AG | 139,100 | | 11,851 |
Allianz AG | 93,617 | | 11,608 |
BASF AG | 271,541 | | 22,501 |
Bayer AG | 273,952 | | 23,858 |
Brenntag AG | 16,500 | | 2,080 |
CompuGROUP Holding AG | 132,400 | | 2,403 |
Deutsche Post AG | 232,375 | | 4,607 |
ElringKlinger AG | 90,000 | | 2,499 |
Fresenius Medical Care AG & Co. KGaA | 77,500 | | 5,445 |
Fresenius SE & Co. KGaA | 109,500 | | 12,490 |
Linde AG | 99,947 | | 16,809 |
SAP AG | 345,306 | | 25,181 |
TOTAL GERMANY | | 141,332 |
Hong Kong - 1.3% |
AIA Group Ltd. | 3,326,800 | | 13,178 |
Galaxy Entertainment Group Ltd. (a) | 2,108,000 | | 7,249 |
Henderson Land Development Co. Ltd. | 721,863 | | 5,002 |
TOTAL HONG KONG | | 25,429 |
India - 2.3% |
Apollo Hospitals Enterprise Ltd. | 13,241 | | 192 |
Bajaj Auto Ltd. | 96,460 | | 3,256 |
Colgate-Palmolive (India) | 84,807 | | 2,026 |
Godrej Consumer Products Ltd. | 153,019 | | 2,052 |
HDFC Bank Ltd. | 1,127,531 | | 13,239 |
Housing Development Finance Corp. Ltd. | 659,905 | | 9,350 |
ITC Ltd. | 989,338 | | 5,195 |
Mahindra & Mahindra Financial Services Ltd. | 187,963 | | 3,028 |
Pidilite Industries Ltd. (a) | 514,340 | | 1,838 |
Common Stocks - continued |
| Shares | | Value (000s) |
India - continued |
Shriram Transport Finance Co. Ltd. | 171,963 | | $ 1,998 |
Smithkline Beecham Consumer Healthcare Ltd. | 34,102 | | 1,925 |
TOTAL INDIA | | 44,099 |
Ireland - 0.6% |
Accenture PLC Class A | 102,100 | | 6,883 |
Elan Corp. PLC sponsored ADR (a) | 254,700 | | 2,751 |
Ryanair Holdings PLC sponsored ADR | 61,600 | | 1,987 |
TOTAL IRELAND | | 11,621 |
Isle of Man - 0.0% |
3Legs Resources PLC (a) | 645,100 | | 416 |
Israel - 0.1% |
Rami Levi Chain Stores Hashikma Marketing 2006 Ltd. | 78,398 | | 2,336 |
Italy - 1.7% |
ENI SpA | 382,800 | | 8,809 |
Fiat Industrial SpA | 523,000 | | 5,664 |
Prada SpA | 701,200 | | 5,718 |
Prysmian SpA | 29,800 | | 573 |
Saipem SpA | 251,240 | | 11,287 |
TOTAL ITALY | | 32,051 |
Japan - 15.0% |
ABC-Mart, Inc. | 100,000 | | 4,384 |
Aeon Credit Service Co. Ltd. | 509,400 | | 10,810 |
Aozora Bank Ltd. | 1,007,000 | | 2,838 |
Calbee, Inc. (d) | 95,200 | | 8,741 |
Cosmos Pharmaceutical Corp. (d) | 106,600 | | 10,509 |
Denso Corp. | 92,900 | | 2,908 |
Don Quijote Co. Ltd. | 283,200 | | 11,157 |
Fanuc Corp. | 60,500 | | 9,632 |
Fast Retailing Co. Ltd. | 25,800 | | 5,746 |
Hitachi Ltd. | 3,632,000 | | 19,245 |
Honda Motor Co. Ltd. sponsored ADR | 597,906 | | 18,033 |
Hoya Corp. | 238,700 | | 4,832 |
Itochu Corp. | 577,000 | | 5,775 |
Japan Tobacco, Inc. | 890,400 | | 24,605 |
JS Group Corp. | 210,700 | | 4,658 |
JSR Corp. | 464,500 | | 7,960 |
Keyence Corp. | 61,600 | | 16,343 |
Mitsubishi UFJ Financial Group, Inc. | 1,459,900 | | 6,605 |
Nintendo Co. Ltd. | 17,400 | | 2,241 |
Common Stocks - continued |
| Shares | | Value (000s) |
Japan - continued |
Nitto Denko Corp. | 83,200 | | $ 3,773 |
ORIX Corp. | 294,300 | | 30,230 |
Rakuten, Inc. | 2,289,600 | | 20,593 |
Seven & i Holdings Co., Ltd. | 474,700 | | 14,640 |
Seven Bank Ltd. | 1,121,800 | | 3,204 |
SHIMANO, Inc. | 93,800 | | 5,910 |
SMC Corp. | 61,600 | | 9,707 |
Softbank Corp. | 466,400 | | 14,764 |
Unicharm Corp. | 69,500 | | 3,761 |
USS Co. Ltd. | 18,600 | | 1,955 |
Yahoo! Japan Corp. | 5,812 | | 2,000 |
TOTAL JAPAN | | 287,559 |
Korea (South) - 2.5% |
AMOREPACIFIC Corp. | 4,423 | | 5,030 |
Hyundai Motor Co. | 33,442 | | 6,886 |
LG Household & Health Care Ltd. | 5,491 | | 3,228 |
Orion Corp. | 12,572 | | 11,807 |
Samsung Electronics Co. Ltd. | 17,735 | | 21,308 |
TOTAL KOREA (SOUTH) | | 48,259 |
Mexico - 0.7% |
America Movil SAB de CV Series L sponsored ADR | 295,900 | | 7,483 |
Fomento Economico Mexicano SAB de CV sponsored ADR | 14,600 | | 1,323 |
Mexichem SAB de CV | 849,600 | | 4,210 |
TOTAL MEXICO | | 13,016 |
Netherlands - 2.7% |
AEGON NV | 2,237,900 | | 12,516 |
ASML Holding NV (Netherlands) | 156,700 | | 8,614 |
DE Master Blenders 1753 NV (a) | 644,600 | | 7,878 |
Gemalto NV | 55,000 | | 4,963 |
Heineken NV (Bearer) | 78,700 | | 4,852 |
NXP Semiconductors NV (a) | 216,400 | | 5,250 |
Unilever NV (Certificaten Van Aandelen) (Bearer) | 221,000 | | 8,123 |
TOTAL NETHERLANDS | | 52,196 |
Nigeria - 0.2% |
Nigerian Breweries PLC | 4,795,344 | | 3,700 |
Common Stocks - continued |
| Shares | | Value (000s) |
Norway - 1.1% |
DnB NOR ASA | 350,799 | | $ 4,381 |
Telenor ASA | 822,000 | | 16,162 |
TOTAL NORWAY | | 20,543 |
Singapore - 0.3% |
Avago Technologies Ltd. | 54,200 | | 1,790 |
First Resources Ltd. | 1,100,000 | | 1,849 |
United Overseas Bank Ltd. | 182,000 | | 2,726 |
TOTAL SINGAPORE | | 6,365 |
South Africa - 0.7% |
Life Healthcare Group Holdings Ltd. | 641,500 | | 2,426 |
Nampak Ltd. | 573,700 | | 1,912 |
Naspers Ltd. Class N | 86,400 | | 5,609 |
Shoprite Holdings Ltd. | 52,800 | | 1,086 |
Tiger Brands Ltd. | 82,000 | | 2,606 |
TOTAL SOUTH AFRICA | | 13,639 |
Spain - 3.4% |
Amadeus IT Holding SA Class A | 230,600 | | 5,709 |
Banco Bilbao Vizcaya Argentaria SA | 722,253 | | 6,035 |
Grifols SA ADR | 248,495 | | 6,252 |
Inditex SA | 262,272 | | 33,464 |
Prosegur Compania de Seguridad SA (Reg.) | 1,557,860 | | 8,481 |
Repsol YPF SA | 243,602 | | 4,869 |
TOTAL SPAIN | | 64,810 |
Sweden - 1.3% |
ASSA ABLOY AB (B Shares) | 59,600 | | 1,987 |
Atlas Copco AB (A Shares) | 81,100 | | 1,994 |
H&M Hennes & Mauritz AB (B Shares) | 73,663 | | 2,493 |
Svenska Handelsbanken AB (A Shares) | 196,300 | | 6,724 |
Swedbank AB (A Shares) | 414,600 | | 7,688 |
Swedish Match Co. AB | 140,200 | | 4,777 |
TOTAL SWEDEN | | 25,663 |
Switzerland - 5.0% |
Kuehne & Nagel International AG | 32,840 | | 3,833 |
Nestle SA | 552,587 | | 35,067 |
Roche Holding AG (participation certificate) | 36,535 | | 7,026 |
SGS SA (Reg.) | 1,910 | | 4,044 |
Syngenta AG (Switzerland) | 50,470 | | 19,678 |
Common Stocks - continued |
| Shares | | Value (000s) |
Switzerland - continued |
UBS AG | 1,130,550 | | $ 16,962 |
Zurich Financial Services AG | 37,441 | | 9,227 |
TOTAL SWITZERLAND | | 95,837 |
Taiwan - 0.5% |
HIWIN Technologies Corp. | 11,150 | | 72 |
Taiwan Semiconductor Manufacturing Co. Ltd. sponsored ADR | 550,300 | | 8,750 |
TOTAL TAIWAN | | 8,822 |
United Kingdom - 17.6% |
Aggreko PLC | 57,700 | | 2,002 |
Babcock International Group PLC | 119,000 | | 1,878 |
Barclays PLC | 3,640,520 | | 13,462 |
Barratt Developments PLC (a) | 423,200 | | 1,295 |
BG Group PLC | 387,092 | | 7,168 |
British American Tobacco PLC sponsored ADR | 158,000 | | 15,699 |
Capita Group PLC | 361,700 | | 4,220 |
Compass Group PLC | 213,400 | | 2,342 |
Diageo PLC | 168,843 | | 4,827 |
Domino's Pizza UK & IRL PLC | 305,400 | | 2,491 |
Filtrona PLC | 693,600 | | 6,414 |
GlaxoSmithKline PLC | 1,155,800 | | 25,899 |
Hikma Pharmaceuticals PLC | 227,188 | | 2,711 |
HSBC Holdings PLC sponsored ADR | 732,600 | | 36,161 |
IMI PLC | 66,800 | | 1,029 |
Imperial Tobacco Group PLC | 282,905 | | 10,683 |
Inchcape PLC | 764,692 | | 4,961 |
InterContinental Hotel Group PLC | 175,880 | | 4,352 |
Intertek Group PLC | 234,300 | | 10,659 |
Kingfisher PLC | 431,900 | | 2,018 |
London Stock Exchange Group PLC | 126,200 | | 1,987 |
Meggitt PLC | 748,900 | | 4,665 |
Michael Page International PLC | 662,900 | | 3,855 |
National Grid PLC | 273,948 | | 3,124 |
Next PLC | 302,200 | | 17,390 |
Persimmon PLC | 90,400 | | 1,160 |
Reckitt Benckiser Group PLC | 371,713 | | 22,494 |
Rolls-Royce Group PLC | 1,257,600 | | 17,342 |
Rolls-Royce Group PLC Class C | 95,577,600 | | 154 |
Royal Dutch Shell PLC Class B (United Kingdom) | 1,256,415 | | 44,442 |
Serco Group PLC | 429,704 | | 3,928 |
Standard Chartered PLC (United Kingdom) | 188,494 | | 4,452 |
Common Stocks - continued |
| Shares | | Value (000s) |
United Kingdom - continued |
Taylor Wimpey PLC | 4,477,700 | | $ 4,415 |
Tesco PLC | 451,200 | | 2,329 |
Travis Perkins PLC | 126,400 | | 2,203 |
Vodafone Group PLC sponsored ADR | 1,432,300 | | 38,987 |
Whitbread PLC | 115,147 | | 4,367 |
TOTAL UNITED KINGDOM | | 337,565 |
United States of America - 4.9% |
Allergan, Inc. | 42,200 | | 3,795 |
Apple, Inc. | 18,100 | | 10,771 |
Beam, Inc. | 55,600 | | 3,089 |
Cognizant Technology Solutions Corp. Class A (a) | 49,300 | | 3,286 |
Cummins, Inc. | 32,200 | | 3,013 |
D.R. Horton, Inc. | 46,400 | | 973 |
Facebook, Inc. Class B (a)(f) | 131,847 | | 2,506 |
Freeport-McMoRan Copper & Gold, Inc. | 48,000 | | 1,866 |
Gilead Sciences, Inc. (a) | 80,400 | | 5,400 |
Las Vegas Sands Corp. | 83,800 | | 3,892 |
MasterCard, Inc. Class A | 19,440 | | 8,960 |
McGraw-Hill Companies, Inc. | 111,000 | | 6,136 |
Noble Energy, Inc. | 75,600 | | 7,183 |
Polycom, Inc. (a) | 275,000 | | 2,756 |
PriceSmart, Inc. | 26,300 | | 2,183 |
Virgin Media, Inc. (d) | 99,500 | | 3,258 |
ViroPharma, Inc. (a) | 107,100 | | 2,704 |
Visa, Inc. Class A | 76,900 | | 10,671 |
VMware, Inc. Class A (a) | 25,300 | | 2,145 |
Workday, Inc. | 21,200 | | 1,028 |
Yum! Brands, Inc. | 102,800 | | 7,207 |
TOTAL UNITED STATES OF AMERICA | | 92,822 |
TOTAL COMMON STOCKS (Cost $1,613,286) |
1,857,724
|
Nonconvertible Preferred Stocks - 1.4% |
| | | |
Germany - 1.4% |
Henkel AG & Co. KGaA | 66,600 | | 5,318 |
ProSiebenSat.1 Media AG | 179,600 | | 5,005 |
Volkswagen AG | 80,200 | | 16,591 |
TOTAL NONCONVERTIBLE PREFERRED STOCKS (Cost $16,635) |
26,914
|
Master Notes - 0.0% |
| Principal
Amount (000s) | | Value (000s) |
Canada - 0.0% |
OZ Optics Ltd. 5% 11/5/14 (f)
(Cost $10) | | $ 10 | | $ 10 |
Money Market Funds - 2.7% |
| Shares | | |
Fidelity Cash Central Fund, 0.19% (b) | 38,341,533 | | 38,342 |
Fidelity Securities Lending Cash Central Fund, 0.19% (b)(c) | 12,479,420 | | 12,479 |
TOTAL MONEY MARKET FUNDS (Cost $50,821) |
50,821
|
TOTAL INVESTMENT PORTFOLIO - 101.0% (Cost $1,680,752) | | 1,935,469 |
NET OTHER ASSETS (LIABILITIES) - (1.0)% | | (18,471) |
NET ASSETS - 100% | $ 1,916,998 |
Legend |
(a) Non-income producing |
(b) Affiliated fund that is available only to investment companies and other accounts managed by Fidelity Investments. The rate quoted is the annualized seven-day yield of the fund at period end. A complete unaudited listing of the fund's holdings as of its most recent quarter end is available upon request. In addition, each Fidelity Central Fund's financial statements, which are not covered by the Fund's Report of Independent Registered Public Accounting Firm, are available on the SEC's website or upon request. |
(c) Investment made with cash collateral received from securities on loan. |
(d) Security or a portion of the security is on loan at period end. |
(e) Security exempt from registration under Rule 144A of the Securities Act of 1933. These securities may be resold in transactions exempt from registration, normally to qualified institutional buyers. At the end of the period, the value of these securities amounted to $1,848,000 or 0.1% of net assets. |
(f) Restricted securities - Investment in securities not registered under the Securities Act of 1933 (excluding 144A issues). At the end of the period, the value of restricted securities (excluding 144A issues) amounted to $2,516,000 or 0.1% of net assets. |
Additional information on each restricted holding is as follows: |
Security | Acquisition Date | Acquisition Cost (000s) |
Facebook, Inc. Class B | 3/31/11 | $ 3,296 |
OZ Optics Ltd. 5% 11/5/14 | 11/5/10 | $ 10 |
Affiliated Central Funds |
Information regarding fiscal year to date income earned by the Fund from investments in Fidelity Central Funds is as follows: |
Fund | Income earned
(Amounts in thousands) |
Fidelity Cash Central Fund | $ 64 |
Fidelity Securities Lending Cash Central Fund | 1,352 |
Total | $ 1,416 |
Other Information |
Categorizations in the Schedule of Investments are based on country or territory of incorporation. |
The following is a summary of the inputs used, as of October 31, 2012, involving the Fund's assets and liabilities carried at fair value. The inputs or methodology used for valuing securities may not be an indication of the risk associated with investing in those securities. For more information on valuation inputs, and their aggregation into the levels used in the tables below, please refer to the Security Valuation section in the accompanying Notes to Financial Statements. |
Valuation Inputs at Reporting Date: |
Description
(Amounts in thousands) | Total | Level 1 | Level 2 | Level 3 |
Investments in Securities: | | | | |
Equities: | | | | |
Consumer Discretionary | $ 299,651 | $ 291,081 | $ 8,570 | $ - |
Consumer Staples | 290,259 | 235,131 | 55,128 | - |
Energy | 132,712 | 79,461 | 53,251 | - |
Financials | 300,947 | 232,128 | 68,819 | - |
Health Care | 249,341 | 113,497 | 135,844 | - |
Industrials | 153,856 | 153,856 | - | - |
Information Technology | 194,124 | 157,823 | 36,301 | - |
Materials | 163,106 | 143,428 | 19,678 | - |
Telecommunication Services | 91,950 | 91,950 | - | - |
Utilities | 8,692 | 5,568 | 3,124 | - |
Master Notes | 10 | - | - | 10 |
Money Market Funds | 50,821 | 50,821 | - | - |
Total Investments in Securities: | $ 1,935,469 | $ 1,554,744 | $ 380,715 | $ 10 |
The following is a summary of transfers between Level 1 and Level 2 for the period ended October 31, 2012. Transfers are assumed to have occurred at the beginning of the period, and are primarily attributable to the valuation techniques used for foreign equity securities, as discussed in the accompanying Notes to Financial Statements: |
Transfers | Total (000s) |
Level 1 to Level 2 | $ 0 |
Level 2 to Level 1 | $ 372,598 |
See accompanying notes which are an integral part of the financial statements.
Annual Report
Statement of Assets and Liabilities
Amounts in thousands (except per-share amounts) | October 31, 2012 |
| | |
Assets | | |
Investment in securities, at value (including securities loaned of $12,172) - See accompanying schedule: Unaffiliated issuers (cost $1,629,931) | $ 1,884,648 | |
Fidelity Central Funds (cost $50,821) | 50,821 | |
Total Investments (cost $1,680,752) | | $ 1,935,469 |
Receivable for investments sold | | 1,844 |
Receivable for fund shares sold | | 1,867 |
Dividends receivable | | 3,546 |
Interest receivable | | 1 |
Distributions receivable from Fidelity Central Funds | | 14 |
Other receivables | | 201 |
Total assets | | 1,942,942 |
| | |
Liabilities | | |
Payable for investments purchased | $ 3,498 | |
Payable for fund shares redeemed | 5,169 | |
Accrued management fee | 1,142 | |
Distribution and service plan fees payable | 548 | |
Other affiliated payables | 499 | |
Other payables and accrued expenses | 2,609 | |
Collateral on securities loaned, at value | 12,479 | |
Total liabilities | | 25,944 |
| | |
Net Assets | | $ 1,916,998 |
Net Assets consist of: | | |
Paid in capital | | $ 4,658,392 |
Undistributed net investment income | | 21,468 |
Accumulated undistributed net realized gain (loss) on investments and foreign currency transactions | | (3,015,093) |
Net unrealized appreciation (depreciation) on investments and assets and liabilities in foreign currencies | | 252,231 |
Net Assets | | $ 1,916,998 |
See accompanying notes which are an integral part of the financial statements.
Annual Report
Statement of Assets and Liabilities - continued
Amounts in thousands (except per-share amounts) | October 31, 2012 |
| | |
Calculation of Maximum Offering Price Class A:
Net Asset Value and redemption price per share ($761,847 ÷ 48,744 shares) | | $ 15.63 |
| | |
Maximum offering price per share (100/94.25 of $15.63) | | $ 16.58 |
Class T:
Net Asset Value and redemption price per share ($303,930 ÷ 19,618 shares) | | $ 15.49 |
| | |
Maximum offering price per share (100/96.50 of $15.49) | | $ 16.05 |
Class B:
Net Asset Value and offering price per share ($59,414 ÷ 3,974 shares)A | | $ 14.95 |
| | |
Class C:
Net Asset Value and offering price per share ($245,665 ÷ 16,415 shares)A | | $ 14.97 |
| | |
Institutional Class:
Net Asset Value, offering price and redemption price per share ($546,142 ÷ 34,356 shares) | | $ 15.90 |
A Redemption price per share is equal to net asset value less any applicable contingent deferred sales charge.
See accompanying notes which are an integral part of the financial statements.
Annual Report
Financial Statements - continued
Statement of Operations
Amounts in thousands | Year ended October 31, 2012 |
| | |
Investment Income | | |
Dividends | | $ 54,040 |
Income from Fidelity Central Funds | | 1,416 |
Income before foreign taxes withheld | | 55,456 |
Less foreign taxes withheld | | (3,781) |
Total income | | 51,675 |
| | |
Expenses | | |
Management fee | $ 14,593 | |
Transfer agent fees | 5,571 | |
Distribution and service plan fees | 7,059 | |
Accounting and security lending fees | 921 | |
Custodian fees and expenses | 301 | |
Independent trustees' compensation | 14 | |
Registration fees | 104 | |
Audit | 81 | |
Legal | 9 | |
Miscellaneous | 26 | |
Total expenses before reductions | 28,679 | |
Expense reductions | (249) | 28,430 |
Net investment income (loss) | | 23,245 |
Realized and Unrealized Gain (Loss) Net realized gain (loss) on: | | |
Investment securities: | | |
Unaffiliated issuers | 40,399 | |
Foreign currency transactions | (602) | |
Total net realized gain (loss) | | 39,797 |
Change in net unrealized appreciation (depreciation) on: Investment securities | 88,510 | |
Assets and liabilities in foreign currencies | (112) | |
Total change in net unrealized appreciation (depreciation) | | 88,398 |
Net gain (loss) | | 128,195 |
Net increase (decrease) in net assets resulting from operations | | $ 151,440 |
See accompanying notes which are an integral part of the financial statements.
Annual Report
Statement of Changes in Net Assets
Amounts in thousands | Year ended
October 31,
2012 | Year ended
October 31,
2011 |
Increase (Decrease) in Net Assets | | |
Operations | | |
Net investment income (loss) | $ 23,245 | $ 43,005 |
Net realized gain (loss) | 39,797 | 251,468 |
Change in net unrealized appreciation (depreciation) | 88,398 | (392,112) |
Net increase (decrease) in net assets resulting
from operations | 151,440 | (97,639) |
Distributions to shareholders from net investment income | (28,136) | (45,397) |
Distributions to shareholders from net realized gain | - | (8,026) |
Total distributions | (28,136) | (53,423) |
Share transactions - net increase (decrease) | (644,922) | (1,225,390) |
Redemption fees | 42 | 65 |
Total increase (decrease) in net assets | (521,576) | (1,376,387) |
| | |
Net Assets | | |
Beginning of period | 2,438,574 | 3,814,961 |
End of period (including undistributed net investment income of $21,468 and undistributed net investment income of $26,393, respectively) | $ 1,916,998 | $ 2,438,574 |
See accompanying notes which are an integral part of the financial statements.
Annual Report
Financial Highlights - Class A
Years ended October 31, | 2012 | 2011 | 2010 | 2009 | 2008 |
Selected Per-Share Data | | | | | |
Net asset value, beginning of period | $ 14.61 | $ 15.63 | $ 14.25 | $ 12.57 | $ 26.62 |
Income from Investment Operations | | | | | |
Net investment income (loss) C | .18 | .22 F | .14 | .17 | .36 |
Net realized and unrealized gain (loss) | 1.03 | (1.01) | 1.44 | 1.96 | (11.15) |
Total from investment operations | 1.21 | (.79) | 1.58 | 2.13 | (10.79) |
Distributions from net investment income | (.19) | (.20) | (.19) | (.45) | (.24) |
Distributions from net realized gain | - | (.03) | (.01) | - | (3.02) |
Total distributions | (.19) | (.23) | (.20) | (.45) | (3.26) |
Redemption fees added to paid in capital C,H | - | - | - | - | - |
Net asset value, end of period | $ 15.63 | $ 14.61 | $ 15.63 | $ 14.25 | $ 12.57 |
Total Return A,B | 8.47% | (5.15)% | 11.17% | 18.16% | (45.95)% |
Ratios to Average Net Assets D,G | | | | | |
Expenses before reductions | 1.32% | 1.31% | 1.32% | 1.34% | 1.26% |
Expenses net of fee waivers, if any | 1.32% | 1.31% | 1.32% | 1.34% | 1.26% |
Expenses net of all reductions | 1.31% | 1.29% | 1.30% | 1.31% | 1.22% |
Net investment income (loss) | 1.20% | 1.38% F | .95% | 1.43% | 1.80% |
Supplemental Data | | | | | |
Net assets, end of period (in millions) | $ 762 | $ 916 | $ 1,302 | $ 1,662 | $ 2,004 |
Portfolio turnover rate E | 34% | 48% | 59% | 92% | 88% |
A Total returns would have been lower if certain expenses had not been reduced during the applicable periods shown.
B Total returns do not include the effect of the sales charges.
C Calculated based on average shares outstanding during the period.
D Fees and expenses of any underlying Fidelity Central Funds are not included in the Fund's expense ratio. The Fund indirectly bears its proportionate share of the expenses of any underlying Fidelity Central Funds.
E Amount does not include the portfolio activity of any underlying Fidelity Central Funds.
F Investment income per share reflects a large, non-recurring dividend which amounted to $.06 per share. Excluding this non-recurring dividend, the ratio of net investment income (loss) to average net assets would have been .98%.
G Expense ratios reflect operating expenses of the class. Expenses before reductions do not reflect amounts reimbursed by the investment adviser or reductions from brokerage service arrangements or reductions from other expense offset arrangements and do not represent the amount paid by the class during periods when reimbursements or reductions occur. Expenses net of fee waivers reflect expenses after reimbursement by the investment adviser but prior to reductions from brokerage service arrangements or other expense offset arrangements. Expenses net of all reductions represent the net expenses paid by the class.
H Amount represents less than $.01 per share.
See accompanying notes which are an integral part of the financial statements.
Annual Report
Financial Highlights - Class T
Years ended October 31, | 2012 | 2011 | 2010 | 2009 | 2008 |
Selected Per-Share Data | | | | | |
Net asset value, beginning of period | $ 14.46 | $ 15.47 | $ 14.11 | $ 12.42 | $ 26.30 |
Income from Investment Operations | | | | | |
Net investment income (loss) C | .14 | .18 F | .10 | .14 | .31 |
Net realized and unrealized gain (loss) | 1.03 | (.99) | 1.43 | 1.94 | (11.01) |
Total from investment operations | 1.17 | (.81) | 1.53 | 2.08 | (10.70) |
Distributions from net investment income | (.14) | (.16) | (.16) | (.39) | (.16) |
Distributions from net realized gain | - | (.03) | (.01) | - | (3.02) |
Total distributions | (.14) | (.20) I | (.17) | (.39) | (3.18) |
Redemption fees added to paid in capital C,H | - | - | - | - | - |
Net asset value, end of period | $ 15.49 | $ 14.46 | $ 15.47 | $ 14.11 | $ 12.42 |
Total Return A,B | 8.17% | (5.35)% | 10.88% | 17.84% | (46.04)% |
Ratios to Average Net Assets D,G | | | | | |
Expenses before reductions | 1.58% | 1.55% | 1.55% | 1.58% | 1.49% |
Expenses net of fee waivers, if any | 1.58% | 1.55% | 1.55% | 1.58% | 1.49% |
Expenses net of all reductions | 1.57% | 1.53% | 1.53% | 1.55% | 1.44% |
Net investment income (loss) | .94% | 1.14% F | .71% | 1.19% | 1.57% |
Supplemental Data | | | | | |
Net assets, end of period (in millions) | $ 304 | $ 404 | $ 621 | $ 832 | $ 1,110 |
Portfolio turnover rate E | 34% | 48% | 59% | 92% | 88% |
A Total returns would have been lower if certain expenses had not been reduced during the applicable periods shown.
B Total returns do not include the effect of the sales charges.
C Calculated based on average shares outstanding during the period.
D Fees and expenses of any underlying Fidelity Central Funds are not included in the Fund's expense ratio. The Fund indirectly bears its proportionate share of the expenses of any underlying Fidelity Central Funds.
E Amount does not include the portfolio activity of any underlying Fidelity Central Funds.
F Investment income per share reflects a large, non-recurring dividend which amounted to $.06 per share. Excluding this non-recurring dividend, the ratio of net investment income (loss) to average net assets would have been .74%.
G Expense ratios reflect operating expenses of the class. Expenses before reductions do not reflect amounts reimbursed by the investment adviser or reductions from brokerage service arrangements or reductions from other expense offset arrangements and do not represent the amount paid by the class during periods when reimbursements or reductions occur. Expenses net of fee waivers reflect expenses after reimbursement by the investment adviser but prior to reductions from brokerage service arrangements or other expense offset arrangements. Expenses net of all reductions represent the net expenses paid by the class.
H Amount represents less than $.01 per share.
I Total distributions of $.20 per share is comprised of distributions from net investment income of $.164 and distributions from net realized gain of $.034 per share.
See accompanying notes which are an integral part of the financial statements.
Annual Report
Financial Highlights - Class B
Years ended October 31, | 2012 | 2011 | 2010 | 2009 | 2008 |
Selected Per-Share Data | | | | | |
Net asset value, beginning of period | $ 13.91 | $ 14.91 | $ 13.61 | $ 11.95 | $ 25.44 |
Income from Investment Operations | | | | | |
Net investment income (loss) C | .06 | .09 F | .02 | .08 | .18 |
Net realized and unrealized gain (loss) | 1.00 | (.96) | 1.38 | 1.88 | (10.62) |
Total from investment operations | 1.06 | (.87) | 1.40 | 1.96 | (10.44) |
Distributions from net investment income | (.02) | (.10) | (.09) | (.30) | (.03) |
Distributions from net realized gain | - | (.03) | (.01) | - | (3.02) |
Total distributions | (.02) | (.13) | (.10) | (.30) | (3.05) |
Redemption fees added to paid in capital C,H | - | - | - | - | - |
Net asset value, end of period | $ 14.95 | $ 13.91 | $ 14.91 | $ 13.61 | $ 11.95 |
Total Return A,B | 7.64% | (5.89)% | 10.34% | 17.25% | (46.39)% |
Ratios to Average Net Assets D,G | | | | | |
Expenses before reductions | 2.08% | 2.08% | 2.09% | 2.10% | 2.08% |
Expenses net of fee waivers, if any | 2.08% | 2.08% | 2.09% | 2.10% | 2.08% |
Expenses net of all reductions | 2.07% | 2.06% | 2.07% | 2.07% | 2.04% |
Net investment income (loss) | .44% | .61% F | .18% | .67% | .97% |
Supplemental Data | | | | | |
Net assets, end of period (in millions) | $ 59 | $ 94 | $ 157 | $ 191 | $ 221 |
Portfolio turnover rate E | 34% | 48% | 59% | 92% | 88% |
A Total returns would have been lower if certain expenses had not been reduced during the applicable periods shown.
B Total returns do not include the effect of the contingent deferred sales charge.
C Calculated based on average shares outstanding during the period.
D Fees and expenses of any underlying Fidelity Central Funds are not included in the Fund's expense ratio. The Fund indirectly bears its proportionate share of the expenses of any underlying Fidelity Central Funds.
E Amount does not include the portfolio activity of any underlying Fidelity Central Funds.
F Investment income per share reflects a large, non-recurring dividend which amounted to $.06 per share. Excluding this non-recurring dividend, the ratio of net investment income (loss) to average net assets would have been .21%.
G Expense ratios reflect operating expenses of the class. Expenses before reductions do not reflect amounts reimbursed by the investment adviser or reductions from brokerage service arrangements or reductions from other expense offset arrangements and do not represent the amount paid by the class during periods when reimbursements or reductions occur. Expenses net of fee waivers reflect expenses after reimbursement by the investment adviser but prior to reductions from brokerage service arrangements or other expense offset arrangements. Expenses net of all reductions represent the net expenses paid by the class.
H Amount represents less than $.01 per share.
See accompanying notes which are an integral part of the financial statements.
Annual Report
Financial Highlights - Class C
Years ended October 31, | 2012 | 2011 | 2010 | 2009 | 2008 |
Selected Per-Share Data | | | | | |
Net asset value, beginning of period | $ 13.95 | $ 14.95 | $ 13.65 | $ 11.98 | $ 25.50 |
Income from Investment Operations | | | | | |
Net investment income (loss) C | .06 | .10 F | .03 | .08 | .20 |
Net realized and unrealized gain (loss) | 1.01 | (.96) | 1.38 | 1.89 | (10.64) |
Total from investment operations | 1.07 | (.86) | 1.41 | 1.97 | (10.44) |
Distributions from net investment income | (.05) | (.11) | (.10) | (.30) | (.06) |
Distributions from net realized gain | - | (.03) | (.01) | - | (3.02) |
Total distributions | (.05) | (.14) | (.11) | (.30) | (3.08) |
Redemption fees added to paid in capital C,H | - | - | - | - | - |
Net asset value, end of period | $ 14.97 | $ 13.95 | $ 14.95 | $ 13.65 | $ 11.98 |
Total Return A,B | 7.71% | (5.83)% | 10.32% | 17.24% | (46.33)% |
Ratios to Average Net Assets D,G | | | | | |
Expenses before reductions | 2.06% | 2.05% | 2.06% | 2.09% | 2.01% |
Expenses net of fee waivers, if any | 2.06% | 2.05% | 2.06% | 2.09% | 2.01% |
Expenses net of all reductions | 2.05% | 2.03% | 2.04% | 2.06% | 1.97% |
Net investment income (loss) | .46% | .64% F | .21% | .68% | 1.04% |
Supplemental Data | | | | | |
Net assets, end of period (in millions) | $ 246 | $ 302 | $ 419 | $ 502 | $ 618 |
Portfolio turnover rate E | 34% | 48% | 59% | 92% | 88% |
A Total returns would have been lower if certain expenses had not been reduced during the applicable periods shown.
B Total returns do not include the effect of the contingent deferred sales charge.
C Calculated based on average shares outstanding during the period.
D Fees and expenses of any underlying Fidelity Central Funds are not included in the Fund's expense ratio. The Fund indirectly bears its proportionate share of the expenses of any underlying Fidelity Central Funds.
E Amount does not include the portfolio activity of any underlying Fidelity Central Funds.
F Investment income per share reflects a large, non-recurring dividend which amounted to $.06 per share. Excluding this non-recurring dividend, the ratio of net investment income (loss) to average net assets would have been .24%.
G Expense ratios reflect operating expenses of the class. Expenses before reductions do not reflect amounts reimbursed by the investment adviser or reductions from brokerage service arrangements or reductions from other expense offset arrangements and do not represent the amount paid by the class during periods when reimbursements or reductions occur. Expenses net of fee waivers reflect expenses after reimbursement by the investment adviser but prior to reductions from brokerage service arrangements or other expense offset arrangements. Expenses net of all reductions represent the net expenses paid by the class.
H Amount represents less than $.01 per share.
See accompanying notes which are an integral part of the financial statements.
Annual Report
Financial Highlights - Institutional Class
Years ended October 31, | 2012 | 2011 | 2010 | 2009 | 2008 |
Selected Per-Share Data | | | | | |
Net asset value, beginning of period | $ 14.87 | $ 15.90 | $ 14.48 | $ 12.81 | $ 27.06 |
Income from Investment Operations | | | | | |
Net investment income (loss) B | .23 | .28 E | .19 | .21 | .41 |
Net realized and unrealized gain (loss) | 1.05 | (1.03) | 1.47 | 1.98 | (11.34) |
Total from investment operations | 1.28 | (.75) | 1.66 | 2.19 | (10.93) |
Distributions from net investment income | (.25) | (.25) | (.23) | (.52) | (.30) |
Distributions from net realized gain | - | (.03) | (.01) | - | (3.02) |
Total distributions | (.25) | (.28) | (.24) | (.52) | (3.32) |
Redemption fees added to paid in capital B,G | - | - | - | - | - |
Net asset value, end of period | $ 15.90 | $ 14.87 | $ 15.90 | $ 14.48 | $ 12.81 |
Total Return A | 8.83% | (4.85)% | 11.55% | 18.45% | (45.79)% |
Ratios to Average Net Assets C,F | | | | | |
Expenses before reductions | 1.00% | .99% | .99% | 1.07% | .99% |
Expenses net of fee waivers, if any | 1.00% | .99% | .99% | 1.07% | .99% |
Expenses net of all reductions | .99% | .97% | .97% | 1.04% | .94% |
Net investment income (loss) | 1.52% | 1.70% E | 1.28% | 1.70% | 2.07% |
Supplemental Data | | | | | |
Net assets, end of period (in millions) | $ 546 | $ 723 | $ 1,316 | $ 1,540 | $ 2,235 |
Portfolio turnover rate D | 34% | 48% | 59% | 92% | 88% |
A Total returns would have been lower if certain expenses had not been reduced during the applicable periods shown.
B Calculated based on average shares outstanding during the period.
C Fees and expenses of any underlying Fidelity Central Funds are not included in the Fund's expense ratio. The Fund indirectly bears its proportionate share of the expenses of any underlying Fidelity Central Funds.
D Amount does not include the portfolio activity of any underlying Fidelity Central Funds.
E Investment income per share reflects a large, non-recurring dividend which amounted to $.06 per share. Excluding this non-recurring dividend, the ratio of net investment income (loss) to average net assets would have been 1.30%.
F Expense ratios reflect operating expenses of the class. Expenses before reductions do not reflect amounts reimbursed by the investment adviser or reductions from brokerage service arrangements or reductions from other expense offset arrangements and do not represent the amount paid by the class during periods when reimbursements or reductions occur. Expenses net of fee waivers reflect expenses after reimbursement by the investment adviser but prior to reductions from brokerage service arrangements or other expense offset arrangements. Expenses net of all reductions represent the net expenses paid by the class.
G Amount represents less than $.01 per share.
See accompanying notes which are an integral part of the financial statements.
Annual Report
Notes to Financial Statements
For the period ended October 31, 2012
(Amounts in thousands except percentages)
1. Organization.
Fidelity Advisor Diversified International Fund (the Fund) is a fund of Fidelity Advisor Series VIII (the Trust) and is authorized to issue an unlimited number of shares. The Trust is registered under the Investment Company Act of 1940, as amended (the 1940 Act), as an open-end management investment company organized as a Massachusetts business trust. The Fund offers Class A, Class T, Class C and Institutional Class shares, each of which, along with Class B shares, has equal rights as to assets and voting privileges. Effective after the close of business on September 1, 2010, Class B shares were closed to new accounts and additional purchases, except for exchanges and reinvestments. Each class has exclusive voting rights with respect to matters that affect that class. Class B shares will automatically convert to Class A shares after a holding period of seven years from the initial date of purchase. Investment income, realized and unrealized capital gains and losses, the common expenses of the Fund, and certain fund-level expense reductions, if any, are allocated on a pro-rata basis to each class based on the relative net assets of each class to the total net assets of the Fund. Each class differs with respect to transfer agent and distribution and service plan fees incurred. Certain expense reductions may also differ by class.
2. Investments in Fidelity Central Funds.
The Fund invests in Fidelity Central Funds, which are open-end investment companies available only to other investment companies and accounts managed by Fidelity Management & Research Company (FMR) and its affiliates. The Fund's Schedule of Investments lists each of the Fidelity Central Funds held as of period end, if any, as an investment of the Fund, but does not include the underlying holdings of each Fidelity Central Fund. As an Investing Fund, the Fund indirectly bears its proportionate share of the expenses of the underlying Fidelity Central Funds.
The Money Market Central Funds seek preservation of capital and current income and are managed by Fidelity Investments Money Management, Inc. (FIMM), an affiliate of FMR.
A complete unaudited list of holdings for each Fidelity Central Fund is available upon request or at the Securities and Exchange Commission (the SEC) web site at www.sec.gov. In addition, the financial statements of the Fidelity Central Funds, which are not covered by the Fund's Report of Independent Registered Public Accounting Firm, are available on the SEC web site or upon request.
3. Significant Accounting Policies.
The financial statements have been prepared in conformity with accounting principles generally accepted in the United States of America (GAAP), which require management to make certain estimates and assumptions at the date of the financial statements. Actual results could differ from those estimates. Subsequent events, if any, through the
Annual Report
Notes to Financial Statements - continued
(Amounts in thousands except percentages)
3. Significant Accounting Policies - continued
date that the financial statements were issued have been evaluated in the preparation of the financial statements. The following summarizes the significant accounting policies of the Fund:
Security Valuation. Investments are valued as of 4:00 p.m. Eastern time on the last calendar day of the period. In accordance with valuation policies and procedures approved by the Board of Trustees (the Board), the Fund attempts to obtain prices from one or more third party pricing vendors or brokers to value its investments. When current market prices, quotations or rates are not readily available or reliable, securities will be fair valued in good faith by the FMR Fair Value Committee (the Committee), in accordance with procedures adopted by the Fund's Board. Factors used in determining fair value vary by security type and may include market or security specific events. The frequency with which these procedures are used cannot be predicted and they may be utilized to a significant extent. The Committee oversees the Fund's valuation policies and procedures and is responsible for approving and reporting to the Board all fair value determinations.
The Fund categorizes the inputs to valuation techniques used to value its investments into a disclosure hierarchy consisting of three levels as shown below:
Level 1 - quoted prices in active markets for identical investments
Level 2 - other significant observable inputs (including quoted prices for similar investments, interest rates, prepayment speeds, etc.)
Level 3 - unobservable inputs (including the Fund's own assumptions based on the best information available)
Valuation techniques used to value the Fund's investments by major category are as follows:
Equity securities, including restricted securities, for which market quotations are readily available, are valued at the last reported sale price or official closing price as reported by a third party pricing vendor on the primary market or exchange on which they are traded and are categorized as Level 1 in the hierarchy. In the event there were no sales during the day or closing prices are not available, securities are valued at the last quoted bid price or may be valued using the last available price and are generally categorized as Level 2 in the hierarchy. For foreign equity securities, when significant market or security specific events arise, comparisons to the valuation of American Depositary Receipts (ADRs), futures contracts, Exchange-Traded Funds (ETFs) and certain indexes as well as quoted prices for similar securities are used and are categorized as Level 2 in the hierarchy. Utilizing these techniques may result in transfers between Level 1 and Level 2. For restricted equity securities and private placements where observable inputs are
Annual Report
3. Significant Accounting Policies - continued
Security Valuation - continued
limited, assumptions about market activity and risk are used and these securities are generally categorized as Level 3 in the hierarchy.
Debt securities, including restricted securities, are valued based on evaluated prices received from third party pricing vendors or from brokers who make markets in such securities. For master notes, pricing vendors utilize matrix pricing which considers yield or price of bonds of comparable quality, coupon, maturity and type as well as broker-supplied prices and are generally categorized as Level 2 in the hierarchy. When independent prices are unavailable or unreliable, debt securities may be valued utilizing pricing methodologies which consider similar factors that would be used by third party pricing vendors. These are generally categorized as Level 2 in the hierarchy but may be Level 3 depending on the circumstances.
Investments in open-end mutual funds, including the Fidelity Central Funds, are valued at their closing net asset value (NAV) each business day and are categorized as Level 1 in the hierarchy.
Changes in valuation techniques may result in transfers in or out of an assigned level within the disclosure hierarchy. The aggregate value of investments by input level, as of October 31, 2012, including information on transfers between Levels 1 and 2, is included at the end of the Fund's Schedule of Investments.
Foreign Currency Translation. The Fund may use foreign currency contracts to facilitate transactions in foreign-denominated securities. Gains and losses from these transactions may arise from changes in the value of the foreign currency or if the counterparties do not perform under the contracts' terms.
Foreign-denominated assets, including investment securities, and liabilities are translated into U.S. dollars at the exchange rates at period end. Purchases and sales of investment securities, income and dividends received and expenses denominated in foreign currencies are translated into U.S. dollars at the exchange rate in effect on the transaction date.
The effects of exchange rate fluctuations on investments are included with the net realized and unrealized gain (loss) on investment securities. Other foreign currency transactions resulting in realized and unrealized gain (loss) are disclosed separately.
Investment Transactions and Income. For financial reporting purposes, the Fund's investment holdings and NAV include trades executed through the end of the last business day of the period. The NAV per share for processing shareholder transactions is calculated as of the close of business of the New York Stock Exchange (NYSE), normally 4:00 p.m. Eastern time and includes trades executed through the end of the prior
Annual Report
Notes to Financial Statements - continued
(Amounts in thousands except percentages)
3. Significant Accounting Policies - continued
Investment Transactions and Income - continued
business day. Gains and losses on securities sold are determined on the basis of identified cost and may include proceeds received from litigation. Dividend income is recorded on the ex-dividend date, except for certain dividends from foreign securities where the ex-dividend date may have passed, which are recorded as soon as the Fund is informed of the ex-dividend date. Non-cash dividends included in dividend income, if any, are recorded at the fair market value of the securities received. Distributions received on securities that represent a return of capital or capital gain are recorded as a reduction of cost of investments and/or as a realized gain. The Fund estimates the components of distributions received that may be considered return of capital distributions or capital gain distributions. Interest income and distributions from the Fidelity Central Funds are accrued as earned. Interest income includes coupon interest and amortization of premium and accretion of discount on debt securities. Investment income is recorded net of foreign taxes withheld where recovery of such taxes is uncertain.
Expenses. Expenses directly attributable to a fund are charged to that fund. Expenses attributable to more than one fund are allocated among the respective funds on the basis of relative net assets or other appropriate methods. Expense estimates are accrued in the period to which they relate and adjustments are made when actual amounts are known.
Deferred Trustee Compensation. Under a Deferred Compensation Plan (the Plan), independent Trustees may elect to defer receipt of a portion of their annual compensation. Deferred amounts are invested in a cross-section of Fidelity funds, are marked-to-market and remain in the Fund until distributed in accordance with the Plan. The investment of deferred amounts and the offsetting payable to the Trustees are included in the accompanying Statement of Assets and Liabilities.
Income Tax Information and Distributions to Shareholders. Each year, the Fund intends to qualify as a regulated investment company under Subchapter M of the Internal Revenue Code, including distributing substantially all of its taxable income and realized gains. As a result, no provision for income taxes is required. As of October 31, 2012, the Fund did not have any unrecognized tax benefits in the financial statements; nor is the Fund aware of any tax positions for which it is reasonably possible that the total amounts of unrecognized tax benefits will significantly change in the next twelve months. The Fund files a U.S. federal tax return, in addition to state and local tax returns as required. A fund's federal income tax returns are subject to examination by the Internal Revenue Service (IRS) for a period of three fiscal years after they are filed. State and local tax returns may be subject to examination for an additional fiscal year depending on the jurisdiction. Foreign taxes are provided for based on the Fund's understanding of the tax rules and rates that exist in the foreign markets in which it invests.
Annual Report
3. Significant Accounting Policies - continued
Income Tax Information and Distributions to Shareholders - continued
Distributions are declared and recorded on the ex-dividend date. Income dividends and capital gain distributions are declared separately for each class. Income and capital gain distributions are determined in accordance with income tax regulations, which may differ from GAAP.
Capital accounts within the financial statements are adjusted for permanent book-tax differences. These adjustments have no impact on net assets or the results of operations. Temporary book-tax differences will reverse in a subsequent period.
Book-tax differences are primarily due to foreign currency transactions, passive foreign investment companies (PFIC), deferred trustees compensation, capital loss carryforwards and losses deferred due to wash sales.
The federal tax cost of investment securities and unrealized appreciation (depreciation) as of period end were as follows:
Gross unrealized appreciation | $ 343,637 |
Gross unrealized depreciation | (109,482) |
Net unrealized appreciation (depreciation) on securities and other investments | $ 243,155 |
| |
Tax Cost | $ 1,701,314 |
The tax-based components of distributable earnings as of period end were as follows:
Undistributed ordinary income | $ 28,636 |
Capital loss carryforward | $ (3,001,620) |
Net unrealized appreciation (depreciation) | $ 243,063 |
Capital loss carryforwards are only available to offset future capital gains of the Fund to the extent provided by regulations and may be limited. Under the Regulated Investment Company Modernization Act of 2010 (the Act), the Fund is permitted to carry forward capital losses incurred in taxable years beginning after December 22, 2010 for an unlimited period and such capital losses are required to be used prior to any losses that expire. Capital loss carryforwards were as follows:
Fiscal year of expiration | |
2017 | $ (3,001,625) |
Annual Report
Notes to Financial Statements - continued
(Amounts in thousands except percentages)
3. Significant Accounting Policies - continued
Income Tax Information and Distributions to Shareholders - continued
The tax character of distributions paid was as follows:
| October 31,
2012 | October 31,
2011 |
Ordinary Income | $ 28,136 | $ 53,424 |
Short-Term Trading (Redemption) Fees. Shares held by investors in the Fund less than 30 days are subject to a redemption fee equal to 1.00% of the net asset value of shares redeemed. All redemption fees, which reduce the proceeds of the shareholder redemption, are retained by the Fund and accounted for as an addition to paid in capital.
Restricted Securities. The Fund may invest in securities that are subject to legal or contractual restrictions on resale. These securities generally may be resold in transactions exempt from registration or to the public if the securities are registered. Disposal of these securities may involve time-consuming negotiations and expense, and prompt sale at an acceptable price may be difficult. Information regarding restricted securities is included at the end of the Fund's Schedule of Investments.
New Accounting Pronouncement. In December 2011, the Financial Accounting Standards Board issued Accounting Standard Update No. 2011-11, Disclosures about Offsetting Assets and Liabilities. The update creates new disclosure requirements requiring entities to disclose both gross and net information for derivatives and other financial instruments that are either offset in the Statement of Assets and Liabilities or subject to an enforceable master netting arrangement or similar agreement. The disclosure requirements are effective for annual reporting periods beginning on or after January 1, 2013, and interim periods within those annual periods. Management is currently evaluating the impact of the update's adoption on the Fund's financial statement disclosures.
4. Purchases and Sales of Investments.
Purchases and sales of securities, other than short-term securities, aggregated $681,681 and $1,307,803, respectively.
5. Fees and Other Transactions with Affiliates.
Management Fee. FMR and its affiliates provide the Fund with investment management related services for which the Fund pays a monthly management fee. The management fee is the sum of an individual fund fee rate that is based on an annual rate of .45% of the Fund's average net assets and an annualized group fee rate that averaged .26% during the period. The group fee rate is based upon the average net assets of all the
Annual Report
5. Fees and Other Transactions with Affiliates - continued
Management Fee - continued
mutual funds advised by FMR. The group fee rate decreases as assets under management increase and increases as assets under management decrease. For the period, the total annual management fee rate was .71% of the Fund's average net assets.
Distribution and Service Plan Fees. In accordance with Rule 12b-1 of the 1940 Act, the Fund has adopted separate Distribution and Service Plans for each class of shares. Certain classes pay Fidelity Distributors Corporation (FDC), an affiliate of FMR, separate Distribution and Service Fees, each of which is based on an annual percentage of each class' average net assets. In addition, FDC may pay financial intermediaries for selling shares of the Fund and providing shareholder support services. For the period, the Distribution and Service Fee rates, total fees and amounts retained by FDC were as follows:
| Distribution
Fee | Service
Fee | Total Fees | Retained
by FDC |
Class A | -% | .25% | $ 2,002 | $ 53 |
Class T | .25% | .25% | 1,687 | 7 |
Class B | .75% | .25% | 740 | 556 |
Class C | .75% | .25% | 2,630 | 108 |
| | | $ 7,059 | $ 724 |
Sales Load. FDC may receive a front-end sales charge of up to 5.75% for selling Class A shares and 3.50% for selling Class T shares, some of which is paid to financial intermediaries for selling shares of the Fund. Depending on the holding period, FDC may receive contingent deferred sales charges levied on Class A, Class T, Class B, and Class C redemptions. The deferred sales charges range from 5.00% to 1.00% for Class B shares, 1.00% for Class C shares, 1.00% for certain purchases of Class A shares and .25% for certain purchases of Class T shares.
For the period, sales charge amounts retained by FDC were as follows:
| Retained
by FDC |
Class A | $ 70 |
Class T | 20 |
Class B* | 99 |
Class C* | 9 |
| $ 198 |
* When Class B and Class C shares are initially sold, FDC pays commissions from its own resources to financial intermediaries through which the sales are made.
Annual Report
Notes to Financial Statements - continued
(Amounts in thousands except percentages)
5. Fees and Other Transactions with Affiliates - continued
Transfer Agent Fees. Fidelity Investments Institutional Operations Company, Inc. (FIIOC), an affiliate of FMR, is the transfer, dividend disbursing and shareholder servicing agent for each class of the Fund. FIIOC receives account fees and asset-based fees that vary according to the account size and type of account of the shareholders of the respective classes of the Fund. FIIOC pays for typesetting, printing and mailing of shareholder reports, except proxy statements. For the period, transfer agent fees for each class were as follows:
| Amount | % of
Average
Net Assets |
Class A | $ 2,329 | .29 |
Class T | 1,002 | .30 |
Class B | 223 | .30 |
Class C | 736 | .28 |
Institutional Class | 1,281 | .22 |
| $ 5,571 | |
Accounting and Security Lending Fees. Fidelity Service Company, Inc. (FSC), an affiliate of FMR, maintains the Fund's accounting records. The accounting fee is based on the level of average net assets for each month. Under a separate contract, FSC administers the security lending program. The security lending fee is based on the number and duration of lending transactions.
Brokerage Commissions. The Fund placed a portion of its portfolio transactions with brokerage firms which are affiliates of the investment adviser. The commissions paid to these affiliated firms were $3 for the period.
6. Committed Line of Credit.
The Fund participates with other funds managed by FMR or an affiliate in a $4.25 billion credit facility (the "line of credit") to be utilized for temporary or emergency purposes to fund shareholder redemptions or for other short-term liquidity purposes. The Fund has agreed to pay commitment fees on its pro-rata portion of the line of credit, which amounted to $6 and is reflected in Miscellaneous expenses on the Statement of Operations. During the period, there were no borrowings on this line of credit.
7. Security Lending.
The Fund lends portfolio securities through a lending agent from time to time in order to earn additional income. For equity securities, a lending agent is used and may loan securities to certain qualified borrowers, including Fidelity Capital Markets (FCM), a broker-dealer affiliated with the Fund. On the settlement date of the loan, the Fund receives collateral (in the form of U.S. Treasury obligations, letters of credit and/or cash)
Annual Report
7. Security Lending - continued
against the loaned securities and maintains collateral in an amount not less than 100% of the market value of the loaned securities during the period of the loan. The market value of the loaned securities is determined at the close of business of the Fund and any additional required collateral is delivered to the Fund on the next business day. If the borrower defaults on its obligation to return the securities loaned because of insolvency or other reasons, a fund could experience delays and costs in recovering the securities loaned or in gaining access to the collateral. Any cash collateral received is invested in the Fidelity Securities Lending Cash Central Fund. The value of loaned securities and cash collateral at period end are disclosed on the Fund's Statement of Assets and Liabilities. Security lending income represents the income earned on investing cash collateral, less rebates paid to borrowers and any lending agent fees associated with the loan, plus any premium payments received for lending certain types of securities. Security lending income is presented in the Statement of Operations as a component of income from Fidelity Central Funds. Total security lending income during the period amounted to $1,352. During the period, there were no securities loaned to FCM.
8. Expense Reductions.
Many of the brokers with whom FMR places trades on behalf of the Fund provided services to the Fund in addition to trade execution. These services included payments of certain expenses on behalf of the Fund totaling $249 for the period.
9. Distributions to Shareholders.
Distributions to shareholders of each class were as follows:
Years ended October 31, | 2012 | 2011 |
From net investment income | | |
Class A | $ 11,830 | $ 15,976 |
Class T | 3,677 | 6,296 |
Class B | 137 | 993 |
Class C | 1,044 | 2,886 |
Institutional Class | 11,448 | 19,246 |
Total | $ 28,136 | $ 45,397 |
From net realized gain | | |
Class A | $ - | $ 2,738 |
Class T | - | 1,311 |
Class B | - | 343 |
Class C | - | 927 |
Institutional Class | - | 2,707 |
Total | $ - | $ 8,026 |
Annual Report
Notes to Financial Statements - continued
(Amounts in thousands except percentages)
10. Share Transactions.
Transactions for each class of shares were as follows:
| Shares | Dollars |
Years ended October 31, | 2012 | 2011 | 2012 | 2011 |
Class A | | | | |
Shares sold | 7,355 | 9,002 | $ 107,661 | $ 142,807 |
Reinvestment of distributions | 768 | 1,034 | 10,735 | 16,424 |
Shares redeemed | (22,053) | (30,677) | (321,084) | (486,880) |
Net increase (decrease) | (13,930) | (20,641) | $ (202,688) | $ (327,649) |
Class T | | | | |
Shares sold | 1,704 | 2,789 | $ 24,709 | $ 43,918 |
Reinvestment of distributions | 246 | 447 | 3,415 | 7,039 |
Shares redeemed | (10,272) | (15,458) | (148,591) | (243,511) |
Net increase (decrease) | (8,322) | (12,222) | $ (120,467) | $ (192,554) |
Class B | | | | |
Shares sold | 22 | 58 | $ 305 | $ 888 |
Reinvestment of distributions | 9 | 75 | 118 | 1,145 |
Shares redeemed | (2,779) | (3,940) | (39,153) | (60,055) |
Net increase (decrease) | (2,748) | (3,807) | $ (38,730) | $ (58,022) |
Class C | | | | |
Shares sold | 700 | 1,225 | $ 9,812 | $ 18,824 |
Reinvestment of distributions | 60 | 191 | 813 | 2,917 |
Shares redeemed | (5,985) | (7,773) | (83,760) | (118,247) |
Net increase (decrease) | (5,225) | (6,357) | $ (73,135) | $ (96,506) |
Institutional Class | | | | |
Shares sold | 7,200 | 10,009 | $ 106,131 | $ 160,916 |
Reinvestment of distributions | 640 | 1,047 | 9,062 | 16,863 |
Shares redeemed | (22,132) | (45,174) | (325,095) | (728,438) |
Net increase (decrease) | (14,292) | (34,118) | $ (209,902) | $ (550,659) |
11. Other.
The Fund's organizational documents provide former and current trustees and officers with a limited indemnification against liabilities arising in connection with the performance of their duties to the Fund. In the normal course of business, the Fund may also enter into contracts that provide general indemnifications. The Fund's maximum exposure under these arrangements is unknown as this would be dependent on future claims that may be made against the Fund. The risk of material loss from such claims is considered remote.
Annual Report
To the Trustees of Fidelity Advisor Series VIII and the Shareholders of Fidelity Advisor Diversified International Fund:
In our opinion, the accompanying statement of assets and liabilities, including the schedule of investments, and the related statements of operations and of changes in net assets and the financial highlights present fairly, in all material respects, the financial position of Fidelity Advisor Diversified International Fund (a fund of Fidelity Advisor Series VIII) at October 31, 2012, the results of its operations for the year then ended, the changes in its net assets for each of the two years in the period then ended and the financial highlights for each of the five years in the period then ended, in conformity with accounting principles generally accepted in the United States of America. These financial statements and financial highlights (hereafter referred to as "financial statements") are the responsibility of the Fidelity Advisor Diversified International Fund's management. Our responsibility is to express an opinion on these financial statements based on our audits. We conducted our audits of these financial statements in accordance with the standards of the Public Company Accounting Oversight Board (United States). Those standards require that we plan and perform the audit to obtain reasonable assurance about whether the financial statements are free of material misstatement. An audit includes examining, on a test basis, evidence supporting the amounts and disclosures in the financial statements, assessing the accounting principles used and significant estimates made by management, and evaluating the overall financial statement presentation. We believe that our audits, which included confirmation of securities at October 31, 2012 by correspondence with the custodian and brokers, provide a reasonable basis for our opinion.
PricewaterhouseCoopers LLP
Boston, Massachusetts
December 14, 2012
Annual Report
The Trustees, Members of the Advisory Board, and executive officers of the trust and fund, as applicable, are listed below. The Board of Trustees governs the fund and is responsible for protecting the interests of shareholders. The Trustees are experienced executives who meet periodically throughout the year to oversee the fund's activities, review contractual arrangements with companies that provide services to the fund, oversee management of the risks associated with such activities and contractual arrangements, and review the fund's performance. Except for James C. Curvey, each of the Trustees oversees 236 funds advised by FMR or an affiliate. Mr. Curvey oversees 443 funds advised by FMR or an affiliate.
The Trustees hold office without limit in time except that (a) any Trustee may resign; (b) any Trustee may be removed by written instrument, signed by at least two-thirds of the number of Trustees prior to such removal; (c) any Trustee who requests to be retired or who has become incapacitated by illness or injury may be retired by written instrument signed by a majority of the other Trustees; and (d) any Trustee may be removed at any special meeting of shareholders by a two-thirds vote of the outstanding voting securities of the trust. Each Trustee who is not an interested person (as defined in the 1940 Act) (Independent Trustee), shall retire not later than the last day of the calendar year in which his or her 75th birthday occurs. The Independent Trustees may waive this mandatory retirement age policy with respect to individual Trustees. The executive officers and Advisory Board Members hold office without limit in time, except that any officer and Advisory Board Member may resign or may be removed by a vote of a majority of the Trustees at any regular meeting or any special meeting of the Trustees. Except as indicated, each individual has held the office shown or other offices in the same company for the past five years.
Experience, Skills, Attributes, and Qualifications of the Fund's Trustees. The Governance and Nominating Committee has adopted a statement of policy that describes the experience, qualifications, attributes, and skills that are necessary and desirable for potential Independent Trustee candidates (Statement of Policy). The Board believes that each Trustee satisfied at the time he or she was initially elected or appointed a Trustee, and continues to satisfy, the standards contemplated by the Statement of Policy. The Governance and Nominating Committee also engages professional search firms to help identify potential Independent Trustee candidates who have the experience, qualifications, attributes, and skills consistent with the Statement of Policy. From time to time, additional criteria based on the composition and skills of the current Independent Trustees, as well as experience or skills that may be appropriate in light of future changes to board composition, business conditions, and regulatory or other developments, have also been considered by the professional search firms and the Governance and Nominating Committee. In addition, the Board takes into account the Trustees' commitment and participation in Board and committee meetings, as well as their leadership of standing and ad hoc committees throughout their tenure.
In determining that a particular Trustee was and continues to be qualified to serve as a Trustee, the Board has considered a variety of criteria, none of which, in isolation, was controlling. The Board believes that, collectively, the Trustees have balanced and diverse experience, qualifications, attributes, and skills, which allow the Board to operate effectively in governing the fund and protecting the interests of shareholders. Information about the specific experience, skills, attributes, and qualifications of each Trustee, which in each case led to the Board's conclusion that the Trustee should serve (or continue to serve) as a trustee of the fund, is provided below.
Annual Report
Trustees and Officers - continued
Board Structure and Oversight Function. James C. Curvey is an interested person (as defined in the 1940 Act) and currently serves as Chairman. The Trustees have determined that an interested Chairman is appropriate and benefits shareholders because an interested Chairman has a personal and professional stake in the quality and continuity of services provided to the fund. Independent Trustees exercise their informed business judgment to appoint an individual of their choosing to serve as Chairman, regardless of whether the Trustee happens to be independent or a member of management. The Independent Trustees have determined that they can act independently and effectively without having an Independent Trustee serve as Chairman and that a key structural component for assuring that they are in a position to do so is for the Independent Trustees to constitute a substantial majority for the Board. The Independent Trustees also regularly meet in executive session. Ned C. Lautenbach serves as Chairman of the Independent Trustees and as such (i) acts as a liaison between the Independent Trustees and management with respect to matters important to the Independent Trustees and (ii) with management prepares agendas for Board meetings.
Fidelity funds are overseen by different Boards of Trustees. The fund's Board oversees Fidelity's equity and high income funds and another Board oversees Fidelity's investment-grade bond, money market, and asset allocation funds. The asset allocation funds may invest in Fidelity funds overseen by the fund's Board. The use of separate Boards, each with its own committee structure, allows the Trustees of each group of Fidelity funds to focus on the unique issues of the funds they oversee, including common research, investment, and operational issues. On occasion, the separate Boards establish joint committees to address issues of overlapping consequences for the Fidelity funds overseen by each Board.
The Trustees operate using a system of committees to facilitate the timely and efficient consideration of all matters of importance to the Trustees, the fund, and fund shareholders and to facilitate compliance with legal and regulatory requirements and oversight of the fund's activities and associated risks. The Board, acting through its committees, has charged FMR and its affiliates with (i) identifying events or circumstances the occurrence of which could have demonstrably adverse effects on the fund's business and/or reputation; (ii) implementing processes and controls to lessen the possibility that such events or circumstances occur or to mitigate the effects of such events or circumstances if they do occur; and (iii) creating and maintaining a system designed to evaluate continuously business and market conditions in order to facilitate the identification and implementation processes described in (i) and (ii) above. Because the day-to-day operations and activities of the fund are carried out by or through FMR, its affiliates and other service providers, the fund's exposure to risks is mitigated but not eliminated by the processes overseen by the Trustees. While each of the Board's committees has responsibility for overseeing different aspects of the fund's activities, oversight is exercised primarily through the Operations, Audit, and Compliance Committees. In addition, the Independent Trustees have worked with FMR to enhance the Board's oversight of investment and financial risks, legal and regulatory risks, technology risks, and operational risks, including the development of additional risk reporting to the Board. For example, a working group comprised of Independent Trustees and FMR has worked and continues to work to review the Fidelity funds' valuation-related activities, reporting and risk management. Appropriate personnel, including but not limited to the fund's Chief Compliance Officer (CCO), FMR's internal auditor, the independent accountants, the fund's Treasurer and portfolio management personnel, make periodic reports to the Board's committees, as appropriate, including an annual review of FMR's risk management program for the Fidelity funds. The responsibilities of each standing committee, including their oversight responsibilities, are described further under "Standing Committees of the Fund's Trustees."
Annual Report
The fund's Statement of Additional Information (SAI) includes more information about the Trustees. To request a free copy, call Fidelity at 1-877-208-0098.
Interested Trustees*:
Correspondence intended for each Trustee who is an interested person may be sent to Fidelity Investments, 82 Devonshire Street, Boston, Massachusetts 02109.
Name, Age; Principal Occupations and Other Relevant Experience+ |
James C. Curvey (77) |
| Year of Election or Appointment: 2007 Mr. Curvey is Trustee and Chairman of the Board of Trustees of certain Trusts. Mr. Curvey also serves as Trustee (2007-present) of other investment companies advised by FMR. Mr. Curvey is a Director of Fidelity Investments Money Management, Inc. (2009-present), Director of Fidelity Research & Analysis Co. (2009-present) and Director of FMR and FMR Co., Inc. (2007-present). Mr. Curvey is also Vice Chairman (2007-present) and Director of FMR LLC. In addition, Mr. Curvey serves as an Overseer for the Boston Symphony Orchestra and a member of the Trustees of Villanova University. Previously, Mr. Curvey was the Vice Chairman (2006-2007) and Director (2000-2007) of FMR Corp. |
Ronald P. O'Hanley (55) |
| Year of Election or Appointment: 2011 Mr. O'Hanley is Director of FMR Co., Inc. (2010-present), Director of Fidelity Investments Money Management, Inc. (2010-present), Director of Fidelity Research & Analysis Company (2010-present), President of Fidelity Asset Management and Corporate Services and a member of Fidelity's Executive Committee (2010-present). Previously, Mr. O'Hanley served as President and Chief Executive Officer of BNY Mellon Asset Management (2007-2010). Mr. O'Hanley also served as Vice Chairman of Bank New York Mellon Corp. and a member of that firm's Executive Committee. Prior to the 2007 merger of The Bank of New York and Mellon Financial Corporation, he was Vice Chairman of Mellon Financial Corporation and President and Chief Executive Officer of Mellon Asset Management. He joined Mellon in February 1997. Mr. O'Hanley currently serves as Chairman of the Boston Public Library Foundation Board of Directors and sits on the Board of Directors of Beth Israel Deaconess Medical Center, the Board of Trustees of the Marine Biological Laboratory and the Advisory Board of the Maxwell School of Citizenship and Public Administration at Syracuse University. Mr. O'Hanley also chairs the Council on Asset Management for the Financial Services Roundtable and is a member of the Board of Directors of Institutional Investor's U.S. Institute. |
* Trustees have been determined to be "Interested Trustees" by virtue of, among other things, their affiliation with the trust or various entities under common control with FMR.
+ The information above includes each Trustee's principal occupation during the last five years and other information relating to the experience, attributes, and skills relevant to each Trustee's qualifications to serve as a Trustee, which led to the conclusion that each Trustee should serve as a Trustee for the fund.
Annual Report
Independent Trustees:
Correspondence intended for each Independent Trustee (that is, the Trustees other than the Interested Trustees) may be sent to Fidelity Investments, P.O. Box 55235, Boston, Massachusetts 02205-5235.
Name, Age; Principal Occupations and Other Relevant Experience+ |
Dennis J. Dirks (64) |
| Year of Election or Appointment: 2005 Prior to his retirement in May 2003, Mr. Dirks was Chief Operating Officer and a member of the Board of The Depository Trust & Clearing Corporation (DTCC). He also served as President, Chief Operating Officer, and Board member of The Depository Trust Company (DTC) and President and Board member of the National Securities Clearing Corporation (NSCC). In addition, Mr. Dirks served as Chief Executive Officer and Board member of the Government Securities Clearing Corporation, Chief Executive Officer and Board member of the Mortgage-Backed Securities Clearing Corporation, as a Trustee and a member of the Finance Committee of Manhattan College (2005-2008), and as a Trustee and a member of the Finance Committee of AHRC of Nassau County (2006-2008). Mr. Dirks is a member of the Independent Directors Council (IDC) Governing Council (2010-present) and Board of Directors for The Brookville Center for Children's Services, Inc. (2009-present). |
Alan J. Lacy (59) |
| Year of Election or Appointment: 2008 Mr. Lacy serves as Senior Adviser (2007-present) of Oak Hill Capital Partners, L.P. (private equity). Mr. Lacy also served as Chief Executive Officer (2000-2005) and Vice Chairman (2005-2006) of Sears Holdings Corporation and Sears, Roebuck and Co. (retail). In addition, Mr. Lacy serves as a member of the Board of Directors of Dave & Buster's Entertainment, Inc. (restaurant and entertainment complexes, 2010-present), Earth Fare, Inc. (retail grocery, 2012-present), The Hillman Companies, Inc. (hardware wholesalers, 2010-present), and Bristol-Myers Squibb Company (global pharmaceuticals, 2008-present). Mr. Lacy is a member of the Board of Trustees of The National Parks Conservation Association (2006-present). Previously, Mr. Lacy served as Chairman of the Board of Trustees of the National Parks Conservation Association (2008-2011) and as a member of the Board of Directors for the Western Union Company (global money transfer, 2006-2011). |
Ned C. Lautenbach (68) |
| Year of Election or Appointment: 2000 Mr. Lautenbach is Chairman of the Independent Trustees of the Equity and High Income Funds (2006-present). Mr. Lautenbach currently serves as the Lead Director of the Eaton Corporation Board of Directors (diversified industrial, 1997-present). Mr. Lautenbach is Chairman of the Board of Directors of the Philharmonic Center for the Arts in Naples, Florida (2012-present) and a member of the Council on Foreign Relations (1994-present). Previously, Mr. Lautenbach was a Partner/Advisory Partner at Clayton, Dubilier & Rice, LLC (private equity investment, 1998-2010), as well as a Director of Sony Corporation (2006-2007). |
Joseph Mauriello (68) |
| Year of Election or Appointment: 2008 Prior to his retirement in January 2006, Mr. Mauriello served in numerous senior management positions including Deputy Chairman and Chief Operating Officer (2004-2005), and Vice Chairman of Financial Services (2002-2004) of KPMG LLP US (professional services, 1965-2005). Mr. Mauriello currently serves as a member of the Board of Directors of XL Group plc. (global insurance and re-insurance, 2006-present). Previously, Mr. Mauriello served as a Director of the Hamilton Funds of the Bank of New York (2006-2007) and of Arcadia Resources Inc. (health care services and products, 2007-2012). |
Robert W. Selander (62) |
| Year of Election or Appointment: 2011 Previously, Mr. Selander served as a Member of the Advisory Board of Fidelity's Equity and High Income Funds (2011), Executive Vice Chairman (2010), Chief Executive Officer (2009-2010), and President and Chief Executive Officer (1997-2009) of Mastercard, Inc. |
Cornelia M. Small (68) |
| Year of Election or Appointment: 2005 Ms. Small is a member of the Board of Directors (2009-present) and Chair of the Investment Committee (2010-present) of the Teagle Foundation. Ms. Small also serves on the Investment Committee of the Berkshire Taconic Community Foundation (2008-present). Previously, Ms. Small served as Chairperson (2002-2008) and a member of the Investment Committee and Chairperson (2008-2012) and a member of the Board of Trustees of Smith College. In addition, Ms. Small served as Chief Investment Officer, Director of Global Equity Investments, and a member of the Board of Directors of Scudder, Stevens & Clark and Scudder Kemper Investments. |
William S. Stavropoulos (73) |
| Year of Election or Appointment: 2001 Mr. Stavropoulos is Vice Chairman of the Independent Trustees of the Equity and High Income Funds (2006-present). Mr. Stavropoulos serves as President and Founder of the Michigan Baseball Foundation, the Great Lakes Loons (2007-present). Mr. Stavropoulos is Chairman Emeritus of the Board of Directors of The Dow Chemical Company, where he previously served in numerous senior management positions, including President, CEO (1995-2000; 2002-2004), Chairman of the Executive Committee (2000-2006), and as a member of the Board of Directors (1990-2006). Currently, Mr. Stavropoulos is a Director of Univar Inc. (global distributor of commodity and specialty chemicals, Chairman from 2010-May 2012 and Lead Director from May 2012-present), Teradata Corporation (data warehousing and technology solutions, 2008-present), Maersk Inc. (industrial conglomerate), and Tyco International, Ltd. (multinational manufacturing and services, 2007-present), and a member of the Advisory Board for Metalmark Capital LLC (private equity investment, 2005-present). Mr. Stavropoulos is an operating advisor to Clayton, Dubilier & Rice, LLC (private equity investment). In addition, Mr. Stavropoulos is a member of the University of Notre Dame Advisory Council for the College of Science, a Trustee of the Rollin L. Gerstacker Foundation, and a Director of the Naples Philharmonic Center for the Arts. Previously, Mr. Stavropoulos served as a Director of Chemical Financial Corporation (bank holding company, 1993-2012). |
David M. Thomas (63) |
| Year of Election or Appointment: 2008 Previously, Mr. Thomas served as Executive Chairman (2005-2006) and Chairman and Chief Executive Officer (2000-2005) of IMS Health, Inc. (pharmaceutical and healthcare information solutions), and a Director of Fortune Brands, Inc. (consumer products, 2000-2011). In addition, Mr. Thomas serves as Non-Executive Chairman of the Board of Directors of Fortune Brands Home and Security (home and security products, 2011-present), and as a member of the Board of Directors of Interpublic Group of Companies, Inc. (marketing communication, 2004-present). |
Michael E. Wiley (62) |
| Year of Election or Appointment: 2008 Mr. Wiley also serves as a Director of Asia Pacific Exploration Consolidated (international oil and gas exploration and production, 2008-present). Mr. Wiley serves as a Director of Tesoro Corporation (independent oil refiner and marketer, 2005-present), and a Director of Bill Barrett Corporation (exploration and production, 2005-present). In addition, Mr. Wiley also serves as a Director of Post Oak Bank (privately-held bank, 2004-present). Previously, Mr. Wiley served as a member of the Board of Trustees of the University of Tulsa (2000-2006; 2007-2010), as a Senior Energy Advisor of Katzenbach Partners, LLC (consulting, 2006-2007), as an Advisory Director of Riverstone Holdings (private investment), Chairman, President, and CEO of Baker Hughes, Inc. (oilfield services, 2000-2004), and as Director of Spinnaker Exploration Company (exploration and production, 2001-2005). |
+ The information above includes each Trustee's principal occupation during the last five years and other information relating to the experience, attributes, and skills relevant to each Trustee's qualifications to serve as a Trustee, which led to the conclusion that each Trustee should serve as a Trustee for the fund.
Advisory Board Members and Executive Officers:
Correspondence intended for David A. Rosow and Garnett A. Smith may be sent to Fidelity Investments, P.O. Box 55235, Boston, Massachusetts 02205-5235. Correspondence intended for each executive officer, Edward C. Johnson 3d, and Peter S. Lynch may be sent to Fidelity Investments, 82 Devonshire Street, Boston, Massachusetts 02109.
Name, Age; Principal Occupation |
Edward C. Johnson 3d (82) |
| Year of Election or Appointment: 2011 Member of the Advisory Board of Fidelity's Equity and High Income Funds. Mr. Johnson serves as Chief Executive Officer, Chairman, and a Director of FMR LLC, and also serves as Chairman and Director of FIL Limited. Previously, Mr. Johnson served as a Trustee and Chairman of the Board of certain Fidelity Trusts, Chairman and a Director of FMR, Chairman and a Director of FMR Co., Inc., and President of FMR LLC (2006-2007). |
Peter S. Lynch (68) |
| Year of Election or Appointment: 2003 Member of the Advisory Board of Fidelity's Equity and High Income Funds. Mr. Lynch is Vice Chairman and a Director of FMR and FMR Co., Inc. In addition, Mr. Lynch serves as a Trustee of Boston College and as the Chairman of the Inner-City Scholarship Fund. Previously, Mr. Lynch served on the Special Olympics International Board of Directors (1997-2006). |
David A. Rosow (70) |
| Year of Election or Appointment: 2012 Member of the Advisory Board of Fidelity's Equity and High Income Funds. Chairman and Chief Executive Officer of International Golf Group, Inc. (golf course development, 1989-present). Previously, Mr. Rosow served as Chairman and Chief Executive Officer of Rosow & Company, Inc. (private investment company, 1989-2011), a Lead Director of Hudson United Bancorp (2001-2006) and as a Director of TD Banknorth (1996-2006). In addition, Mr. Rosow is a member (2008-present) and President (2009-present) of the Town Council of Palm Beach, Florida. |
Garnett A. Smith (65) |
| Year of Election or Appointment: 2012 Member of the Advisory Board of Fidelity's Equity and High Income Funds. Prior to Mr. Smith's retirement, he served as Chairman and Chief Executive Officer of Inbrand Corp. (manufacturer of personal absorbent products, 1990-1997). He also served as President (1986-1990) of Inbrand Corp. Prior to his employment with Inbrand Corp., he was employed by a retail fabric chain and North Carolina National Bank. In addition, Mr. Smith is a board member of the Jackson Hole Land Trust (2009-present). |
Kenneth B. Robins (43) |
| Year of Election or Appointment: 2008 President and Treasurer of Fidelity's Equity and High Income Funds. Mr. Robins also serves as President and Treasurer (2010-present) and Assistant Treasurer (2009-present) of other Fidelity funds and is an employee of Fidelity Investments (2004-present). Previously, Mr. Robins served as Deputy Treasurer of the Fidelity funds (2005-2008) and Treasurer and Chief Financial Officer of The North Carolina Capital Management Trust: Cash and Term Portfolios (2006-2008). |
Bruce T. Herring (47) |
| Year of Election or Appointment: 2006 Vice President of certain Equity Funds. Mr. Herring also serves as President of Fidelity Research & Analysis Company (2010-present), Chief Investment Officer and Director of Fidelity Management & Research (U.K.) Inc. (2010-present) and Group Chief Investment Officer of FMR. Previously, Mr. Herring served as Vice President (2005-2006) and Senior Vice President (2006-2007) of Fidelity Management & Research Company, Vice President of FMR Co., Inc. (2001-2007) and as a portfolio manager for Fidelity U.S. Equity Funds. |
Brian B. Hogan (48) |
| Year of Election or Appointment: 2009 Vice President of Equity and High Income Funds. Mr. Hogan also serves as President of FMR's Equity Division (2009-present). Previously, Mr. Hogan served as Senior Vice President, Equity Research of FMR (2006-2009) and as a portfolio manager. |
Scott C. Goebel (44) |
| Year of Election or Appointment: 2008 Secretary and Chief Legal Officer (CLO) of the Fidelity funds. Mr. Goebel also serves as Secretary of Fidelity Investments Money Management, Inc. (FIMM) (2010-present) and Fidelity Research and Analysis Company (FRAC) (2010-present); Secretary and CLO of The North Carolina Capital Management Trust: Cash and Term Portfolios (2008-present); General Counsel, Secretary, and Senior Vice President of FMR (2008-present) and FMR Co., Inc. (2008-present); employed by FMR LLC or an affiliate (2001-present); Chief Legal Officer of Fidelity Management & Research (Hong Kong) Limited (2008-present) and Assistant Secretary of Fidelity Management & Research (Japan) Inc. (2008-present), and Fidelity Management & Research (U.K.) Inc. (2008-present). Previously, Mr. Goebel served as Assistant Secretary of FIMM (2008-2010), FRAC (2008-2010), and the Funds (2007-2008) and as Vice President and Secretary of Fidelity Distributors Corporation (FDC) (2005-2007). |
William C. Coffey (43) |
| Year of Election or Appointment: 2009 Assistant Secretary of Fidelity's Equity and High Income Funds. Mr. Coffey also serves as Senior Vice President and Deputy General Counsel of FMR LLC (2010-present), and is an employee of Fidelity Investments. Previously, Mr. Coffey served as Vice President and Associate General Counsel of FMR LLC (2005-2009). |
Elizabeth Paige Baumann (44) |
| Year of Election or Appointment: 2012 Anti-Money Laundering (AML) Officer of the Fidelity funds. Ms. Baumann also serves as AML Officer of The North Carolina Capital Management Trust: Cash and Term Portfolios (2012-present), Chief AML Officer of FMR LLC (2012-present), and is an employee of Fidelity Investments. Previously, Ms. Baumann served as Vice President and Deputy Anti-Money Laundering Officer (2007-2012). |
Christine Reynolds (54) |
| Year of Election or Appointment: 2008 Chief Financial Officer of the Fidelity funds. Ms. Reynolds became President of Fidelity Pricing and Cash Management Services (FPCMS) in August 2008. Ms. Reynolds served as Chief Operating Officer of FPCMS (2007-2008). Previously, Ms. Reynolds served as President, Treasurer, and Anti-Money Laundering officer of the Fidelity funds (2004-2007). |
Joseph A. Hanlon (44) |
| Year of Election or Appointment: 2012 Chief Compliance Officer of Fidelity's Equity and High Income Funds. Mr. Hanlon serves as Compliance Officer of FMR, FMR Co., Inc., Fidelity Investments Money Management, Inc. (FIMM), Fidelity Research and Analysis Company (FRAC), Fidelity Management & Research (Japan) Inc., Fidelity Management & Research (U.K.) Inc., Fidelity Management & Research (Hong Kong), and Strategic Advisers, Inc. (2009-present), as Senior Vice President of the Fidelity Asset Management Division (2009-present), and is an employee of Fidelity Investments. |
Joseph F. Zambello (55) |
| Year of Election or Appointment: 2011 Deputy Treasurer of the Fidelity funds. Mr. Zambello is an employee of Fidelity Investments. Previously, Mr. Zambello served as Vice Presidentof FMR's Program Management Group (2009-2011) and Vice President of the Transfer Agent Oversight Group (2005-2009). |
Adrien E. Deberghes (45) |
| Year of Election or Appointment: 2008 Deputy Treasurer of Fidelity's Equity and High Income Funds. Mr. Deberghes also serves as Vice President (2011-present) and Assistant Treasurer (2010-present) of other Fidelity funds, and is an employee of Fidelity Investments (2008-present). Previously, Mr. Deberghes served as Senior Vice President of Mutual Fund Administration at State Street Corporation (2007-2008), Senior Director of Mutual Fund Administration at Investors Bank & Trust (2005-2007), and Director of Finance for Dunkin' Brands (2000-2005). |
Stephen Sadoski (41) |
| Year of Election or Appointment: 2012 Deputy Treasurer of Fidelity's Equity and High Income Funds. Mr. Sadoski also serves as Assistant Treasurer of other Fidelity funds (2012-present) and is an employee of Fidelity Investments (2012-present). Previously, Mr. Sadoski served as an assistant chief accountant in the Division of Investment Management of the Securities and Exchange Commission (SEC) (2009-2012) and as a senior manager at Deloitte & Touche (1997-2009). |
Stephanie J. Dorsey (43) |
| Year of Election or Appointment: 2010 Assistant Treasurer of Fidelity's Equity and High Income Funds. Ms. Dorsey also serves as Deputy Treasurer of other Fidelity funds (2008-present) and is an employee of Fidelity Investments (2008-present). Previously, Ms. Dorsey served as Treasurer (2004-2008) of the JPMorgan Mutual Funds and Vice President (2004-2008) of JPMorgan Chase Bank. |
John R. Hebble (54) |
| Year of Election or Appointment: 2009 Assistant Treasurer of Fidelity's Equity and High Income Funds. Mr. Hebble also serves as President (2011-present), Treasurer, and Chief Financial Officer of The North Carolina Capital Management Trust: Cash and Term Portfolios (2008-present), President and Treasurer of other Fidelity funds (2008-present) and is an employee of Fidelity Investments. |
Gary W. Ryan (54) |
| Year of Election or Appointment: 2005 Assistant Treasurer of the Fidelity funds. Mr. Ryan is an employee of Fidelity Investments. Previously, Mr. Ryan served as Vice President of Fund Reporting in Fidelity Pricing and Cash Management Services (FPCMS) (1999-2005). |
Jonathan Davis (44) |
| Year of Election or Appointment: 2010 Assistant Treasurer of the Fidelity funds. Mr. Davis is also Assistant Treasurer of Fidelity Rutland Square Trust II and Fidelity Commonwealth Trust II. Mr. Davis is an employee of Fidelity Investments. Previously, Mr. Davis served as Vice President and Associate General Counsel of FMR LLC (2003-2010). |
Annual Report
The Board of Trustees of Advisor Diversified International Fund voted to pay to shareholders of record at the opening of business on record date, the following distributions per share derived from capital gains realized from sales of portfolio securities, and dividends derived from net investment income:
| Pay Date | Record Date | Dividends | Capital Gains |
Class I | 12/10/12 | 12/07/12 | $0.261 | $0.061 |
Class I designates 100% of the dividends distributed during the fiscal year as amounts which may be taken into account as a dividend for purposes of the maximum rate under section 1(h)(11) of the Internal Revenue Code.
The amounts per share which represent income derived from sources within, and taxes paid to, foreign countries or possessions of the United States are as follows:
| Pay Date | Income | Taxes |
Class I | 12/05/11 | $0.271 | $0.0190 |
The fund will notify shareholders in January 2013 of amounts for use in preparing 2012 income tax returns.
Annual Report
Board Approval of Investment Advisory Contracts and Management Fees
Fidelity Advisor Diversified International Fund
Each year, the Board of Trustees, including the Independent Trustees (together, the Board), votes on the renewal of the management contract and sub-advisory agreements (together, the Advisory Contracts) for the fund. The Board, assisted by the advice of fund counsel and Independent Trustees' counsel, requests and considers a broad range of information relevant to the renewal of the Advisory Contracts throughout the year.
The Board meets regularly and, at each of its meetings, considers factors that are relevant to its annual consideration of the renewal of the fund's Advisory Contracts, including the services and support provided to the fund and its shareholders. The Board has established various standing committees, each composed of and chaired by Independent Trustees with varying backgrounds, to which the Board has assigned specific subject matter responsibilities in order to enhance effective decision-making by the Board. The Board, acting directly and through its Committees, requests and receives information concerning the annual consideration of the renewal of the fund's Advisory Contracts. The Board also meets as needed to consider matters specifically related to the Board's annual consideration of the renewal of Advisory Contracts. Members of the Board may also meet with trustees of other Fidelity funds through ad hoc joint committees to discuss certain matters relevant to the Fidelity funds.
At its July 2012 meeting, the Board of Trustees, including the Independent Trustees, unanimously determined to renew the fund's Advisory Contracts. In reaching its determination, the Board considered all factors it believed relevant, including (i) the nature, extent, and quality of the services to be provided to the fund and its shareholders (including the investment performance of the fund); (ii) the competitiveness of the fund's management fee and total expense ratio relative to peer funds; (iii) the total costs of the services to be provided by and the profits to be realized by Fidelity from its relationship with the fund; (iv) the extent to which economies of scale exist and would be realized as the fund grows; and (v) whether fee levels reflect these economies of scale, if any, for the benefit of fund shareholders.
In considering whether to renew the Advisory Contracts for the fund, the Board reached a determination, with the assistance of fund counsel and Independent Trustees' counsel and through the exercise of its business judgment, that the renewal of the Advisory Contracts is in the best interests of the fund and its shareholders and that the compensation payable under the Advisory Contracts is fair and reasonable. The Board's decision to renew the Advisory Contracts was not based on any single factor, but rather was based on a comprehensive consideration of all the information provided to the Board at its meetings throughout the year. The Board, in reaching its determination to renew the Advisory Contracts, is aware that shareholders in the fund have a broad range of investment choices available to them, including a wide choice among mutual funds offered by Fidelity's competitors, and that the fund's shareholders, who have the opportunity to review and weigh the disclosure provided by the fund in its prospectus and other public disclosures, have chosen to invest in this fund, managed by Fidelity.
Annual Report
Nature, Extent, and Quality of Services Provided. The Board considered the staffing within the investment adviser, FMR, and the sub-advisers (together, the Investment Advisers), including the backgrounds of the fund's investment personnel, and also considered the fund's investment objective, strategies, and related investment philosophy. The Independent Trustees also had discussions with senior management of Fidelity's investment operations and investment groups. The Board considered the structure of the portfolio manager compensation program and whether this structure provides appropriate incentives to act in the best interests of the fund.
Resources Dedicated to Investment Management and Support Services. The Board and the Fund Oversight and Research Committees reviewed the general qualifications and capabilities of the Investment Advisers' investment staff, including its size, education, experience, and resources, as well as the Investment Advisers' approach to recruiting, training, managing, and compensating investment personnel. The Board also noted that FMR has continued to increase the resources devoted to non-U.S. offices, including expansion of Fidelity's global investment organization. The Board noted that Fidelity's analysts have extensive resources, tools and capabilities that allow them to conduct sophisticated quantitative and fundamental analysis, as well as credit analysis of issuers, counterparties and guarantors. The Board also believes that Fidelity's investment professionals have sufficient access to global information and data so as to provide competitive investment results over time, and that those professionals also have access to sophisticated tools that permit them to assess portfolio construction and risk and performance attribution characteristics continuously, as well as to transmit new information and research conclusions rapidly around the world. Additionally, in its deliberations, the Board considered the Investment Advisers' trading and risk management capabilities and resources, which are an integral part of the investment management process.
Shareholder and Administrative Services. The Board considered (i) the nature, extent, quality, and cost of advisory, administrative, and shareholder services performed by the Investment Advisers and their affiliates under the Advisory Contracts and under separate agreements covering transfer agency, pricing and bookkeeping, and securities lending services for the fund; (ii) the nature and extent of the supervision of third party service providers, principally custodians and subcustodians; and (iii) the resources devoted to, and the record of compliance with, the fund's compliance policies and procedures. The Board also reviewed the allocation of fund brokerage, including allocations to brokers affiliated with the Investment Advisers, the use of brokerage commissions to pay fund expenses, and the use of "soft" commission dollars to pay for research services.
The Board noted that the growth of fund assets over time across the complex allows Fidelity to reinvest in the development of services designed to enhance the value or convenience of the Fidelity funds as investment vehicles. These services include 24-hour access to account information and market information through telephone representatives and over the Internet, investor education materials and asset allocation tools, and the expanded availability of Fidelity Investor Centers.
Annual Report
Board Approval of Investment Advisory Contracts and
Management Fees - continued
Investment in a Large Fund Family. The Board considered the benefits to shareholders of investing in a Fidelity fund, including the benefits of investing in a fund that is part of a large family of funds offering a variety of investment disciplines and providing a large variety of mutual fund investor services. The Board noted that Fidelity had taken, or had made recommendations that resulted in the Fidelity funds taking, a number of actions over the previous year that benefited particular funds, including (i) continuing to dedicate additional resources to investment research and support of the senior management team that oversees asset management; (ii) persisting in efforts to enhance Fidelity's research capabilities, in particular, international research; (iii) launching new funds and making other enhancements to meet client needs for global and income-oriented solutions; (iv) continuing to launch dedicated lower cost underlying funds to meet investment management's portfolio construction needs related to expanding underlying fund options, specifically for the Freedom Fund product lines; (v) adopting a "Stock Selector" sector neutral investment approach and employing a team of portfolio managers who are sector specialists to manage certain funds; (vi) rationalizing product lines and gaining increased efficiencies through the mergers of several funds into other funds; (vii) strengthening the Spartan Index Fund product line by adding new funds and/or new low-cost institutional share classes, restructuring fund expenses to accommodate new classes, and reducing investment minimums for certain classes of shares; (viii) modifying the eligibility criteria for Institutional Class shares to increase their appeal to government entities and charitable investors; and (ix) reducing certain transfer agent fee rates.
Investment Performance. The Board considered whether the fund has operated in accordance with its investment objective, as well as its record of compliance with its investment restrictions. It also reviewed the fund's absolute investment performance for each class, as well as the fund's relative investment performance for each class measured over multiple periods against (i) a broad-based securities market index, and (ii) a peer group of mutual funds deemed appropriate by Fidelity and reviewed by the Board. The following charts considered by the Board show, over the one-, three-, and five-year periods ended December 31, 2011, the cumulative total returns of Institutional Class (Class I) and Class B of the fund, the cumulative total returns of a broad-based securities market index ("benchmark"), and a range of cumulative total returns of a peer group of mutual funds identified by Morningstar, Inc. as having an investment style similar to that of the fund based on underlying portfolio holdings. The returns of Institutional Class (Class I) and Class B show the performance of the highest and lowest performing classes, respectively (based on five-year performance). The box within each chart shows the 25th percentile return (top of box) and the 75th percentile return (bottom of box) of the peer group. Returns shown above the box are in the first quartile and returns shown below the box are in the fourth quartile. The percentage beaten numbers noted below each chart correspond to the percentile box and represent the percentage of funds in the peer group whose performance was equal to or lower than that of the class indicated.
Annual Report
Fidelity Advisor Diversified International Fund

The Board reviewed the fund's relative investment performance against its peer group and noted that the performance of Institutional Class (Class I) of the fund was in the second quartile for the one-year period, the fourth quartile for the three-year period, and the third quartile for the five-year period. The Board also noted that the investment performance of the fund was lower than its benchmark for all the periods shown. The Board considered that the variations in performance among the fund's classes reflect the variations in class expenses, which result in lower performance for higher expense classes. The Board discussed with FMR the fact that the fund underperformed its benchmark for each period measured. The Board also reviewed the fund's performance since inception as well as performance in the current year. The Board will continue to closely monitor performance of the fund in the coming year and discuss with FMR if other actions to address performance are appropriate.
Based on its review, the Board concluded that the nature, extent, and quality of services provided to the fund under the Advisory Contracts should benefit the fund's shareholders.
Competitiveness of Management Fee and Total Expense Ratio. The Board considered the fund's management fee and total expense ratio compared to "mapped groups" of competitive funds and classes. Fidelity creates "mapped groups" by combining similar Lipper investment objective categories that have comparable management fee characteristics. Combining Lipper investment objective categories aids the Board's management fee and total expense ratio comparisons by broadening the competitive group used for comparison and by reducing the number of universes to which various Fidelity funds are compared.
Annual Report
Board Approval of Investment Advisory Contracts and
Management Fees - continued
Management Fee. The Board considered two proprietary management fee comparisons for the 12-month periods shown in the chart below. The group of Lipper funds used by the Board for management fee comparisons is referred to below as the "Total Mapped Group." The Total Mapped Group comparison focuses on a fund's standing relative to the total universe of comparable funds available to investors in terms of gross management fees before expense reimbursements or caps. "TMG %" represents the percentage of funds in the Total Mapped Group that had management fees that were lower than the fund's. For example, a TMG % of 17% means that 83% of the funds in the Total Mapped Group had higher management fees than the fund. The "Asset-Size Peer Group" (ASPG) comparison focuses on a fund's standing relative to non-Fidelity funds similar in size to the fund within the Total Mapped Group. The ASPG represents at least 15% of the funds in the Total Mapped Group with comparable asset size and management fee characteristics, subject to a minimum of 50 funds (or all funds in the Total Mapped Group if fewer than 50). Additional information, such as the ASPG quartile in which the fund's management fee ranked, is also included in the chart and considered by the Board.
Fidelity Advisor Diversified International Fund
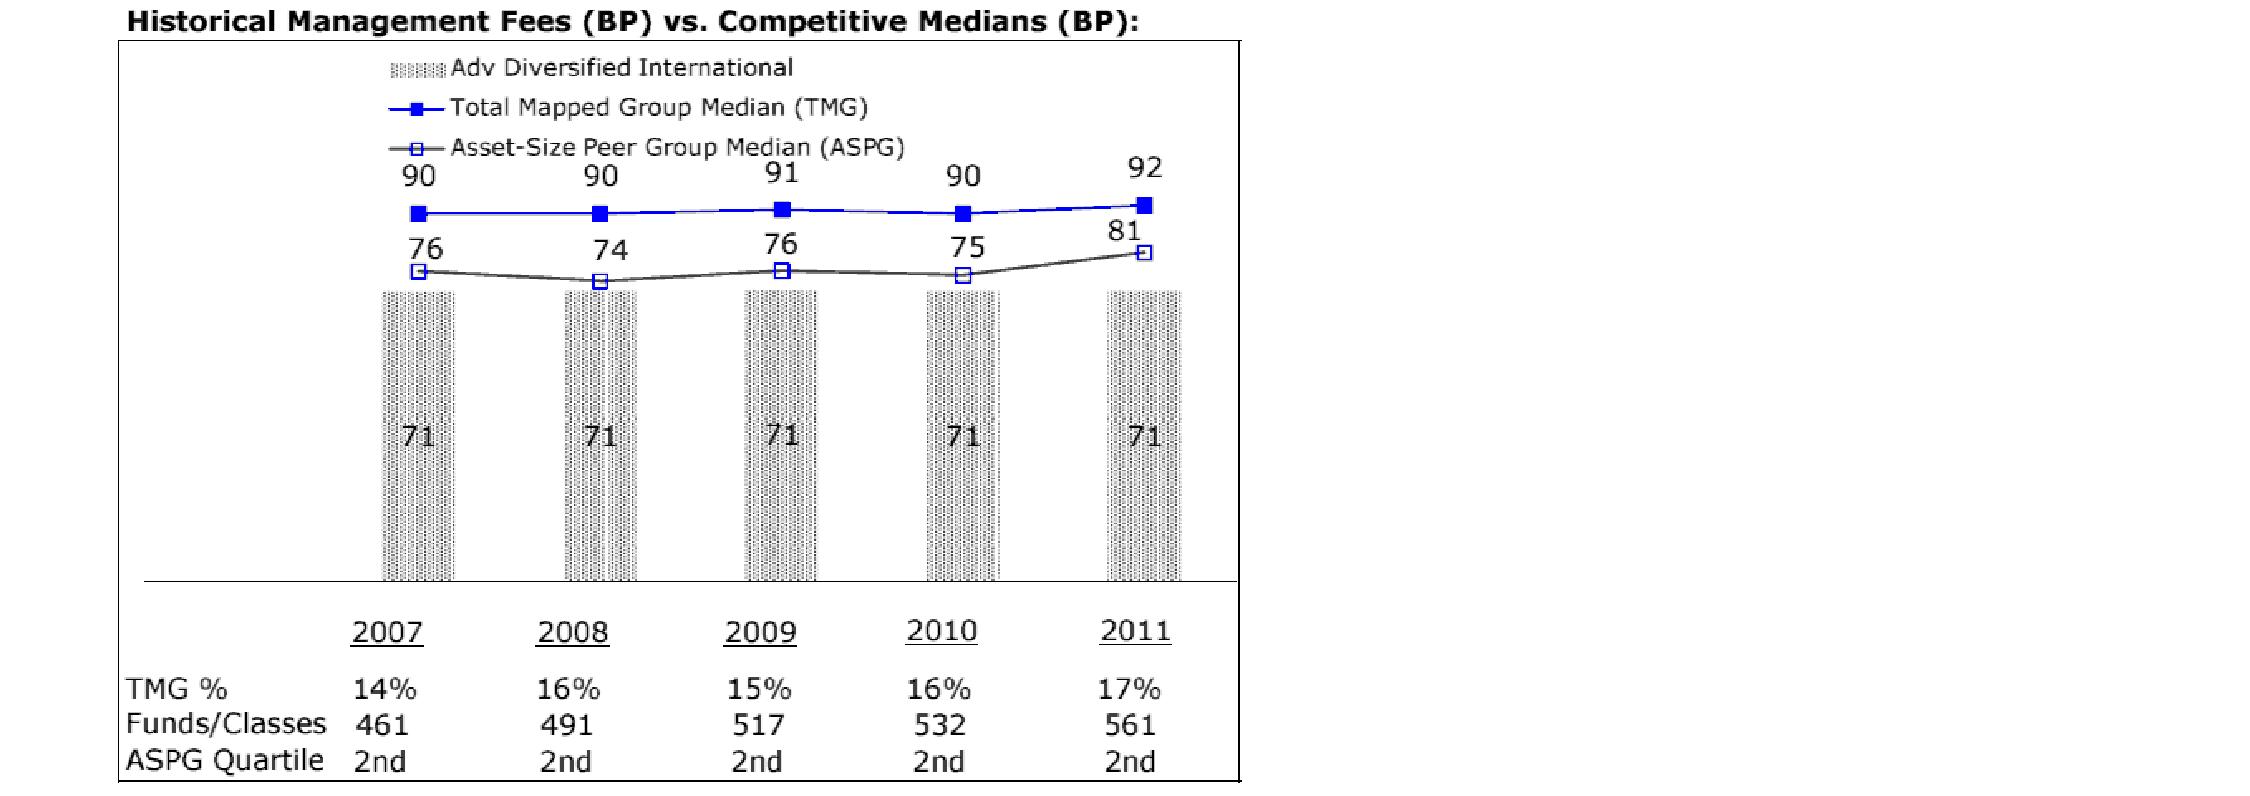
The Board noted that the fund's management fee ranked below the median of its Total Mapped Group and below the median of its ASPG for 2011.
Based on its review, the Board concluded that the fund's management fee is fair and reasonable in light of the services that the fund receives and the other factors considered.
Total Expense Ratio. In its review of each class's total expense ratio, the Board considered the fund's management fee as well as other fund or class expenses, as applicable, such as transfer agent fees, pricing and bookkeeping fees, fund-paid 12b-1 fees, and custodial, legal, and audit fees. The Board also noted the effects of any waivers and reimbursements on fees and expenses. As part of its review, the Board also considered the current and historical total expense ratios of each class of the fund compared to competitive fund median expenses. Each class of the fund is compared to those funds and classes in the Total Mapped Group (used by the Board for management fee comparisons) that have a similar sales load structure.
Annual Report
The Board noted that the total expense ratio of each of Class A, Class B, Class C, and Institutional Class ranked below its competitive median for 2011 and the total expense ratio of Class T ranked above its competitive median for 2011. The Board considered that various factors, including 12b-1 fees, positive or negative performance adjustments, and relatively higher other expenses in the case of small fund size, can affect total expense ratios. The Board noted that the total expense ratio of Class T was above the competitive median primarily because of higher 12b-1 fees on Class T. Class T has a higher 12b-1 fee, but a lower front-end sales charge, than traditionally priced front-end sales charge classes. The Board considered that Class T is primarily sold load-waived in the retirement plan market where its 0.50% 12b-1 fee is comparable to competing no-load, higher 12b-1 fee classes designed specifically for retirement plans. The Board noted that the fund offers multiple classes, each of which has a different sales load and 12b-1 fee structure, and that the multiple structures are intended to offer a range of pricing options for the intermediary market. The Board also noted that the total expense ratios of the classes vary primarily by the level of their 12b-1 fees, although differences in transfer agent fees may also cause expenses to vary from class to class.
Fees Charged to Other Fidelity Clients. The Board also considered Fidelity fee structures and other information with respect to clients of FMR and its affiliates, such as other mutual funds advised or subadvised by FMR or its affiliates, pension plan clients, and other institutional clients. The Board noted the findings of the 2010 ad hoc joint committee (created with the board of other Fidelity funds), which reviewed and compared Fidelity's institutional investment advisory business with its business of providing services to the Fidelity funds, including the differences in services provided, fees charged, and costs incurred, as well as competition in their respective marketplaces.
Based on its review of total expense ratios and fees charged to other Fidelity clients, the Board concluded that the total expense ratio of each class of the fund was reasonable, although Class T was above the median of the universe presented for comparison, in light of the services that the fund and its shareholders receive and the other factors considered.
Costs of the Services and Profitability. The Board considered the revenues earned and the expenses incurred by Fidelity in conducting the business of developing, marketing, distributing, managing, administering and servicing the fund and its shareholders. The Board also considered the level of Fidelity's profits in respect of all the Fidelity funds.
Annual Report
Board Approval of Investment Advisory Contracts and
Management Fees - continued
On an annual basis, FMR presents to the Board Fidelity's profitability for the fund. Fidelity calculates the profitability for each fund, as well as aggregate profitability for groups of Fidelity funds and all Fidelity funds, using a series of detailed revenue and cost allocation methodologies which originate with the books and records of Fidelity on which Fidelity's audited financial statements are based. The Audit Committee of the Board reviews any significant changes from the prior year's methodologies.
PricewaterhouseCoopers LLP (PwC), independent registered public accounting firm and auditor to Fidelity and certain Fidelity funds, has been engaged annually by the Board as part of the Board's assessment of Fidelity's profitability analysis. PwC's engagement includes the review and assessment of Fidelity's methodologies used in determining the revenues and expenses attributable to Fidelity's mutual fund business, and completion of agreed-upon procedures surrounding the mathematical accuracy of fund profitability and its conformity to allocation methodologies. After considering PwC's reports issued under the engagement and information provided by Fidelity, the Board concluded that while other allocation methods may also be reasonable, Fidelity's profitability methodologies are reasonable in all material respects.
The Board also reviewed Fidelity's non-fund businesses and fall-out benefits related to the mutual fund business as well as cases where Fidelity's affiliates may benefit from or be related to the fund's business.
The Board considered the costs of the services provided by and the profits realized by Fidelity in connection with the operation of the fund and was satisfied that the profitability was not excessive in the circumstances.
Economies of Scale. The Board considered whether there have been economies of scale in respect of the management of the Fidelity funds, whether the Fidelity funds (including the fund) have appropriately benefited from any such economies of scale, and whether there is potential for realization of any further economies of scale. The Board considered the extent to which the fund will benefit from economies of scale through increased services to the fund, through waivers or reimbursements, or through fee or expense reductions. The Board also noted that in 2009, it and the board of other Fidelity funds created an ad hoc committee (the Economies of Scale Committee) to analyze whether FMR attains economies of scale in respect of the management and servicing of the Fidelity funds, whether the Fidelity funds have appropriately benefited from such economies of scale, and whether there is potential for realization of any further economies of scale.
The Board recognized that the fund's management contract incorporates a "group fee" structure, which provides for lower group fee rates as total fund assets under FMR's management increase, and for higher group fee rates as total fund assets under FMR's management decrease. FMR calculates the group fee rates based on a tiered asset "breakpoint" schedule that varies based on asset class. The Board considered that the group fee is designed to deliver the benefits of economies of scale to fund shareholders when total Fidelity fund assets increase, even if assets of any particular fund are unchanged or have declined, because some portion of Fidelity's costs are attributable to services provided to all Fidelity funds, and all funds benefit if those costs can be allocated among more assets. The Board concluded that, given the group fee structure, fund shareholders will benefit from lower management fees as assets under FMR's management increase at the fund complex level, regardless of whether Fidelity achieves any such economies of scale.
Annual Report
The Board concluded, taking into account the analysis of the Economies of Scale Committee, that economies of scale, if any, are being appropriately shared between fund shareholders and Fidelity.
Additional Information Requested by the Board. In order to develop fully the factual basis for consideration of the Fidelity funds' Advisory Contracts, the Board requested and received additional information on certain topics, including (i) fund performance trends, actions to be taken by FMR to improve certain funds' overall performance, and Fidelity's long-term strategies for certain funds; (ii) the potential to further rationalize the Fidelity fund lineup with the possibility of achieving savings for the funds and Fidelity; (iii) Fidelity's compensation structure for portfolio managers and other key investment personnel; (iv) the amount of the investment that each portfolio manager has made in the Fidelity fund(s) that he or she manages; (v) the realization of fall-out benefits in certain Fidelity business units; (vi) Fidelity's group fee structures, the potential impact of regulatory changes on such structures, and the rationale for the individual fee rates of certain funds; (vii) fund profitability methodology, including Fidelity's cost allocation methodology, and the impact of certain factors on fund profitability results; (viii) trends regarding industry use of performance fee structures and the possibility of implementing performance fee structures for additional funds; and (ix) the impact of net redemptions from the Fidelity funds.
Based on its evaluation of all of the conclusions noted above, and after considering all factors it believed relevant, the Board ultimately concluded that the advisory fee structures are fair and reasonable, and that the fund's Advisory Contracts should be renewed.
Annual Report
Investment Adviser
Fidelity Management & Research Company
Boston, MA
Investment Sub-Advisers
FMR Co., Inc.
Fidelity Management & Research
(U.K.) Inc.
FIL Investment Advisors
FIL Investments (Japan) Limited
FIL Investment Advisors (UK) Limited
Fidelity Management & Research
(Hong Kong) Limited
Fidelity Management & Research
(Japan) Inc.
General Distributor
Fidelity Distributors Corporation
Smithfield, RI
Transfer and Service Agents
Fidelity Investments Institutional Operations Company, Inc.
Boston, MA
Fidelity Service Company, Inc.
Boston, MA
Custodian
State Street Bank and Trust Company
Quincy, MA
(Fidelity Investment logo)(registered trademark)
ADIFI-UANN-1212
1.784736.109
(Fidelity Investment logo)(registered trademark)
Fidelity Advisor®
Emerging Asia
Fund - Class A, Class T, Class B
and Class C
Annual Report
October 31, 2012
(Fidelity Cover Art)
Contents
Performance | (Click Here) | How the fund has done over time. |
Management's Discussion of Fund Performance | (Click Here) | The Portfolio Manager's review of fund performance and strategy. |
Shareholder Expense Example | (Click Here) | An example of shareholder expenses. |
Investment Changes | (Click Here) | A summary of major shifts in the fund's investments over the past six months. |
Investments | (Click Here) | A complete list of the fund's investments with their market values. |
Financial Statements | (Click Here) | Statements of assets and liabilities, operations, and changes in net assets, as well as financial highlights. |
Notes | (Click Here) | Notes to financial statements. |
Report of Independent Registered Public Accounting Firm | (Click Here) | |
Trustees and Officers | (Click Here) | |
Distributions | (Click Here) | |
Board Approval of Investment Advisory Contracts and Management Fees | (Click Here) | |
To view a fund's proxy voting guidelines and proxy voting record for the 12-month period ended June 30, visit http://www.fidelity.com/proxyvotingresults or visit the Securities and Exchange Commission's (SEC) web site at http://www.sec.gov. You may also call 1-877-208-0098 to request a free copy of the proxy voting guidelines.
Standard & Poor's, S&P and S&P 500 are registered service marks of The McGraw-Hill Companies, Inc. and have been licensed for use by Fidelity Distributors Corporation.
Other third party marks appearing herein are the property of their respective owners.
All other marks appearing herein are registered or unregistered trademarks or service marks of FMR LLC or an affiliated company. © 2012 FMR LLC. All rights reserved.
Annual Report
This report and the financial statements contained herein are submitted for the general information of the shareholders of the fund. This report is not authorized for distribution to prospective investors in the fund unless preceded or accompanied by an effective prospectus.
A fund files its complete schedule of portfolio holdings with the SEC for the first and third quarters of each fiscal year on Form N-Q. Forms N-Q are available on the SEC's web site at http://www.sec.gov. A fund's Forms N-Q may be reviewed and copied at the SEC's Public Reference Room in Washington, DC. Information regarding the operation of the SEC's Public Reference Room may be obtained by calling 1-800-SEC-0330. For a complete list of a fund's portfolio holdings, view the most recent holdings listing, semiannual report, or annual report on Fidelity's web site at http://www.fidelity.com, http://www.advisor.fidelity.com, or http://www.401k.com, as applicable.
NOT FDIC INSURED • MAY LOSE VALUE • NO BANK GUARANTEE
Neither the fund nor Fidelity Distributors Corporation is a bank.
Annual Report
Average annual total return reflects the change in the value of an investment, assuming reinvestment of the class' distributions from dividend income and capital gains (the profits earned upon the sale of securities that have grown in value, if any) and assuming a constant rate of performance each year. The $10,000 table and the fund's returns do not reflect the deduction of taxes that a shareholder would pay on fund distributions or the redemption of fund shares. During periods of reimbursement by Fidelity, a fund's total return will be greater than it would be had the reimbursement not occurred. How a fund did yesterday is no guarantee of how it will do tomorrow. Returns reflect the conversion of Class B shares to Class A shares after a maximum of seven years.
Average Annual Total Returns
Periods ended October 31, 2012 | Past 1
year | Past 5
years | Past 10 years |
Class A (incl. 5.75% sales charge) | 0.25% | -1.78% | 15.25% |
Class T (incl. 3.50% sales charge) | 2.33% | -1.59% | 15.21% |
Class B (incl. contingent deferred sales charge) A | 0.51% | -1.69% | 15.33% |
Class C (incl. contingent deferred sales charge) B | 4.57% | -1.35% | 15.07% |
A Class B shares' contingent deferred sales charges included in the past one year, past five years, and past ten years total return figures are 5%, 2%, and 0%, respectively.
B Class C shares' contingent deferred sales charge included in the past one year, past five years, and past ten years total return figures are 1%, 0%, and 0%, respectively.
Annual Report
$10,000 Over 10 Years
Let's say hypothetically that $10,000 was invested in Fidelity Advisor® Emerging Asia Fund - Class A on October 31, 2002, and the current 5.75% sales charge was paid. The chart shows how the value of your investment would have changed, and also shows how the MSCI® AC (All Country) Asia ex Japan Index performed over the same period.
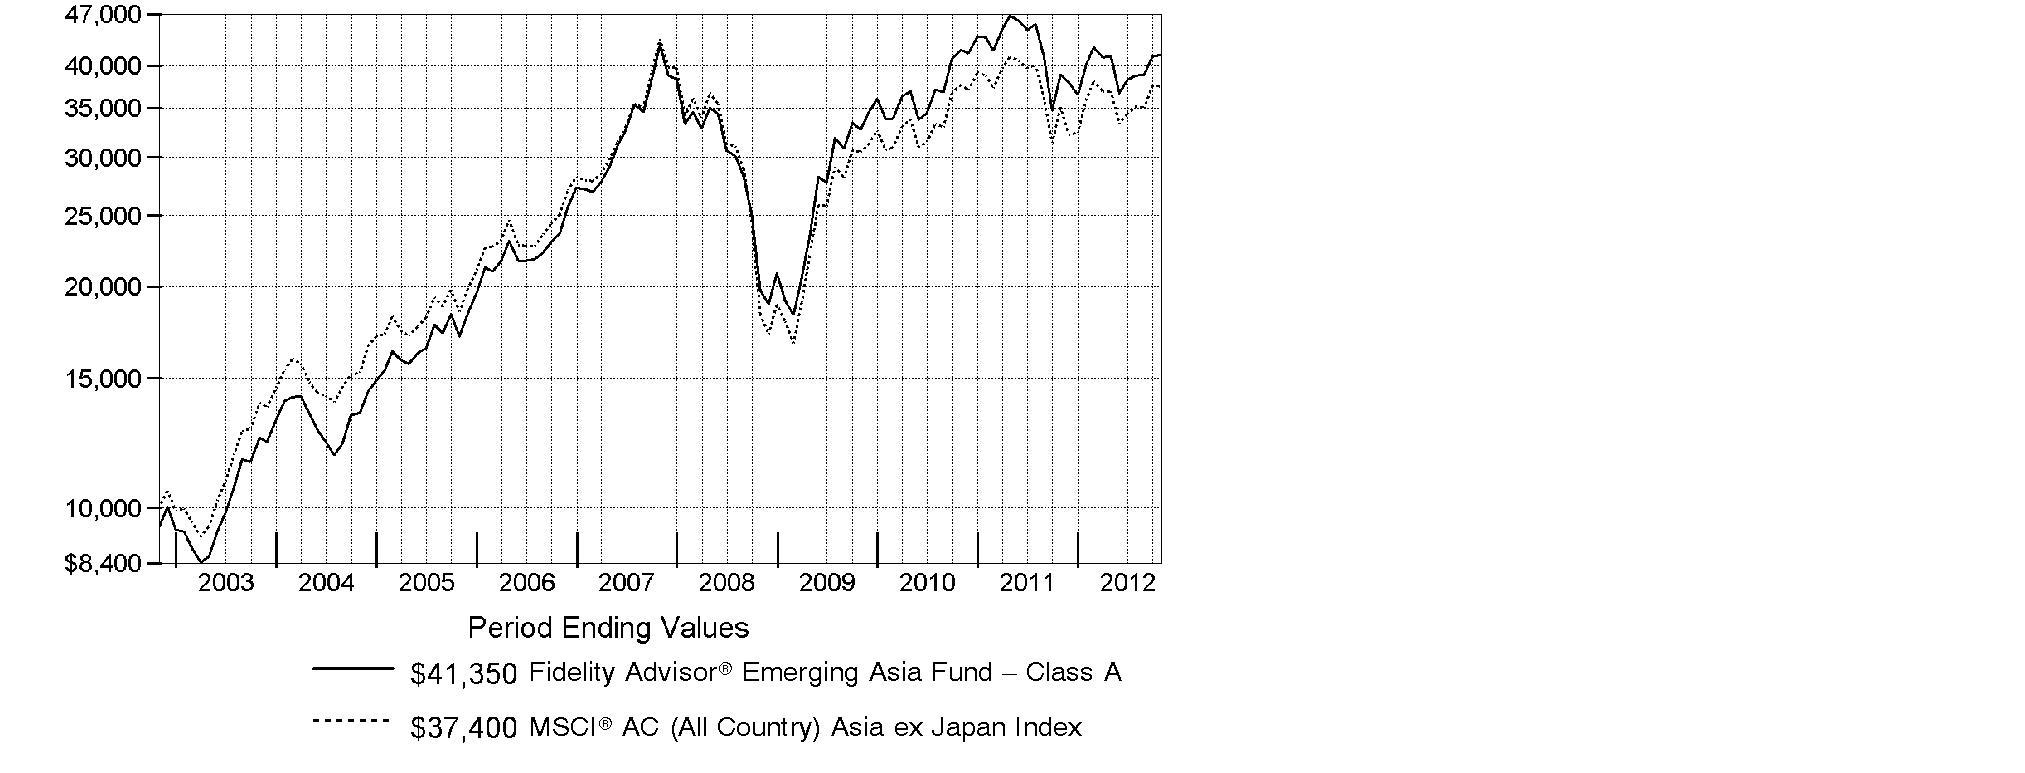
Annual Report
Market Recap: For the 12 months ending October 31, 2012, stock markets in emerging Asia finished with a solid gain, as reflected in the 6.50% advance of the MSCI® AC (All Country) Asia ex Japan Index. After some early choppiness, the index enjoyed a strong rally in the first two months of 2012, but fell back into negative territory from March through May amid renewed concerns about Europe's sovereign debt crisis and continued economic sluggishness in key countries such as China and South Korea. A rally over the final five months of the period lifted the index back into the black and enabled it to finish near its high for the period. Among important index components, Hong Kong advanced 17%, aided by rebounding share prices of property developers, while Singapore added roughly 14%, China rose about 5% and South Korea gained approximately 4%. Sentiment about Chinese stocks improved following the government's September announcement of massive outlays for infrastructure projects, in hopes of halting that nation's economic slowdown. However, China's ongoing transition to new Communist Party leadership created uncertainty that kept some investors on the sidelines. Conversely, India was a drag on the index, its stock market falling by roughly 5%. Technology-heavy Taiwan, with a gain of about 1%, also underperformed.
Comments from Colin Chickles, Portfolio Manager of Fidelity Advisor® Emerging Asia Fund: For the year, the fund's Class A, Class T, Class B and Class C shares returned 6.36%, 6.04%, 5.51% and 5.57%, respectively (excluding sales charges), lagging the MSCI index. Versus the index, positioning in Hong Kong, China and South Korea weighed on performance. At the stock level, Korean automaker Kia Motors was the biggest relative detractor. The company's third-quarter earnings fell short of forecasts, due in part to a nine-week strike that hampered production. Other detractors included Banpu, a Thailand-based thermal coal producer, and not owning strong-performing Chinese Internet stock Tencent Holdings until September. Conversely, performance was especially helped by stock picking and an underweighting in Taiwan, security selection in Indonesia, and an overweighting in the strong-performing Thai market. Not owning Taiwan-based smartphone maker HTC and Indian IT services provider Infosys, two weak-performing benchmark components, paid off. An overweighting in benchmark heavyweight Samsung Electronics also contributed to relative performance and was the fund's top absolute contributor, as well as its largest position during the period. The company emerged as Apple's major competitor in the smartphone space.
The views expressed above reflect those of the portfolio manager(s) only through the end of the period as stated on the cover of this report and do not necessarily represent the views of Fidelity or any other person in the Fidelity organization. Any such views are subject to change at any time based upon market or other conditions and Fidelity disclaims any responsibility to update such views. These views may not be relied on as investment advice and, because investment decisions for a Fidelity fund are based on numerous factors, may not be relied on as an indication of trading intent on behalf of any Fidelity fund.
Annual Report
Shareholder Expense Example
As a shareholder of the Fund, you incur two types of costs: (1) transaction costs, including sales charges (loads) on purchase payments or redemption proceeds, redemption fees and (2) ongoing costs, including management fees, distribution and/or service (12b-1) fees and other Fund expenses. This Example is intended to help you understand your ongoing costs (in dollars) of investing in the Fund and to compare these costs with the ongoing costs of investing in other mutual funds.
The Example is based on an investment of $1,000 invested at the beginning of the period and held for the entire period (May 1, 2012 to October 31, 2012).
Actual Expenses
The first line of the accompanying table for each class of the Fund provides information about actual account values and actual expenses. You may use the information in this line, together with the amount you invested, to estimate the expenses that you paid over the period. Simply divide your account value by $1,000.00 (for example, an $8,600 account value divided by $1,000.00 = 8.6), then multiply the result by the number in the first line for a class of the Fund under the heading entitled "Expenses Paid During Period" to estimate the expenses you paid on your account during this period. In addition, the Fund, as a shareholder in the underlying Fidelity Central Funds, will indirectly bear its pro-rata share of the fees and expenses incurred by the underlying Fidelity Central Funds. These fees and expenses are not included in the Fund's annualized expense ratio used to calculate the expense estimate in the table below.
Hypothetical Example for Comparison Purposes
The second line of the accompanying table for each class of the Fund provides information about hypothetical account values and hypothetical expenses based on a Class' actual expense ratio and an assumed rate of return of 5% per year before expenses, which is not the Class' actual return. The hypothetical account values and expenses may not be used to estimate the actual ending account balance or expenses you paid for the period. You may use this information to compare the ongoing costs of investing in the Fund and other funds. To do so, compare this 5% hypothetical example with the 5% hypothetical examples that appear in the shareholder reports of the other funds. In addition, the Fund, as a shareholder in the underlying Fidelity Central Funds, will indirectly bear its pro-rata share of the fees and expenses incurred by the underlying Fidelity Central Funds. These fees and expenses are not included in the Fund's annualized expense ratio used to calculate the expense estimate in the table below.
Please note that the expenses shown in the table are meant to highlight your ongoing costs only and do not reflect any transaction costs. Therefore, the second line of the table is useful in comparing ongoing costs only, and will not help you determine the relative total costs of owning different funds. In addition, if these transactional costs were included, your costs would have been higher.
Annual Report
| Annualized
Expense Ratio | Beginning
Account Value
May 1, 2012 | Ending
Account Value
October 31, 2012 | Expenses Paid
During Period*
May 1, 2012
to October 31, 2012 |
Class A | 1.41% | | | |
Actual | | $ 1,000.00 | $ 1,004.90 | $ 7.11 |
Hypothetical A | | $ 1,000.00 | $ 1,018.05 | $ 7.15 |
Class T | 1.69% | | | |
Actual | | $ 1,000.00 | $ 1,003.20 | $ 8.51 |
Hypothetical A | | $ 1,000.00 | $ 1,016.64 | $ 8.57 |
Class B | 2.18% | | | |
Actual | | $ 1,000.00 | $ 1,000.70 | $ 10.96 |
Hypothetical A | | $ 1,000.00 | $ 1,014.18 | $ 11.04 |
Class C | 2.15% | | | |
Actual | | $ 1,000.00 | $ 1,001.10 | $ 10.81 |
Hypothetical A | | $ 1,000.00 | $ 1,014.33 | $ 10.89 |
Institutional Class | 1.10% | | | |
Actual | | $ 1,000.00 | $ 1,006.10 | $ 5.55 |
Hypothetical A | | $ 1,000.00 | $ 1,019.61 | $ 5.58 |
A 5% return per year before expenses
* Expenses are equal to each Class' annualized expense ratio, multiplied by the average account value over the period, multiplied by 184/366 (to reflect the one-half year period).
Annual Report
Investment Changes (Unaudited)
Top Ten Stocks as of October 31, 2012 |
| % of fund's
net assets | % of fund's net assets
6 months ago |
Samsung Electronics Co. Ltd. | 6.4 | 7.3 |
China Construction Bank Corp. (H Shares) | 2.4 | 2.3 |
AIA Group Ltd. | 2.3 | 1.7 |
Industrial & Commercial Bank of China Ltd.
(H Shares) | 2.2 | 1.8 |
Tencent Holdings Ltd. | 1.7 | 0.0 |
POSCO | 1.6 | 1.4 |
Hyundai Motor Co. | 1.6 | 1.9 |
Taiwan Semiconductor Manufacturing Co. Ltd. | 1.5 | 4.1 |
Hon Hai Precision Industry Co. Ltd. (Foxconn) | 1.5 | 1.3 |
China Petroleum & Chemical Corp. (H Shares) | 1.3 | 1.9 |
| 22.5 | |
Top Five Market Sectors as of October 31, 2012 |
| % of fund's
net assets | % of fund's net assets
6 months ago |
Financials | 31.4 | 28.0 |
Information Technology | 19.2 | 21.0 |
Industrials | 8.8 | 9.0 |
Consumer Discretionary | 8.8 | 8.7 |
Telecommunication Services | 7.3 | 7.7 |
Asset Allocation (% of fund's net assets) |
As of October 31, 2012 | As of April 30, 2012 |
 | Stocks 99.8% | | | Stocks 97.2% | |
 | Short-Term
Investments and
Net Other Assets (Liabilities) 0.2% | | | Short-Term
Investments and
Net Other Assets (Liabilities) 2.8% | |

Annual Report
Investments October 31, 2012
Showing Percentage of Net Assets
Common Stocks - 99.8% |
| Shares | | Value |
Australia - 0.7% |
Origin Energy Ltd. | 86,705 | | $ 1,022,447 |
Spark Infrastructure Group unit | 676,407 | | 1,186,624 |
TOTAL AUSTRALIA | | 2,209,071 |
Bermuda - 1.3% |
BW Offshore Ltd. | 139,400 | | 81,909 |
Cafe de Coral Holdings Ltd. | 122,000 | | 361,275 |
Cheung Kong Infrastructure Holdings Ltd. | 238,000 | | 1,394,210 |
Genting Hong Kong Ltd. (a) | 490,000 | | 156,800 |
Kunlun Energy Co. Ltd. | 778,000 | | 1,445,565 |
Man Wah Holdings Ltd. | 510,000 | | 313,895 |
Oriental Watch Holdings Ltd. | 1,474,000 | | 441,246 |
TOTAL BERMUDA | | 4,194,900 |
Canada - 0.0% |
Turquoise Hill Resources Ltd. (a) | 14,600 | | 114,169 |
Cayman Islands - 6.9% |
7 Days Group Holdings Ltd. ADR (a) | 24,800 | | 298,840 |
AirMedia Group, Inc. ADR (a) | 36,833 | | 83,611 |
Anta Sports Products Ltd. | 566,000 | | 482,010 |
Anton Oilfield Services Group | 722,000 | | 217,996 |
Baidu.com, Inc. sponsored ADR (a) | 3,300 | | 351,846 |
Chailease Holding Co. Ltd. | 98,000 | | 174,461 |
Changyou.com Ltd. (A Shares) ADR | 20,800 | | 516,880 |
China Kanghui Holdings sponsored ADR (a) | 6,600 | | 201,960 |
China Lodging Group Ltd. ADR (a)(d) | 20,500 | | 348,910 |
China Medical System Holdings Ltd. | 615,000 | | 354,714 |
China Metal Recycling (Holdings) Ltd. | 273,000 | | 272,998 |
China Shineway Pharmaceutical Group Ltd. | 399,000 | | 638,396 |
Chu Kong Petroleum & Natural Gas Steel Pipe Holdings Ltd. | 410,000 | | 166,644 |
Coastal Energy Co. (a) | 7,300 | | 137,192 |
ENN Energy Holdings Ltd. | 172,000 | | 715,737 |
Ginko International Co. Ltd. | 13,000 | | 159,552 |
Gourmet Master Co. Ltd. | 22,050 | | 156,260 |
HiSoft Technology International Ltd. ADR (a) | 11,900 | | 123,641 |
Hopefluent Group Holdings Ltd. | 538,000 | | 154,804 |
Ju Teng International Holdings Ltd. | 1,316,000 | | 526,397 |
Kingsoft Corp. Ltd. | 542,000 | | 314,708 |
KWG Property Holding Ltd. | 1,503,000 | | 895,976 |
Lee & Man Paper Manufacturing Ltd. | 1,893,000 | | 994,124 |
Longfor Properties Co. Ltd. | 981,000 | | 1,731,612 |
Melco PBL Entertainment (Macau) Ltd. sponsored ADR (a) | 43,600 | | 632,636 |
Common Stocks - continued |
| Shares | | Value |
Cayman Islands - continued |
Mindray Medical International Ltd. sponsored ADR | 4,600 | | $ 156,446 |
O-Net Communications Group Ltd. | 703,000 | | 185,954 |
Samson Holding Ltd. | 4,000,000 | | 572,900 |
Sands China Ltd. | 452,000 | | 1,700,092 |
SOHO China Ltd. | 772,000 | | 524,957 |
SouFun Holdings Ltd. ADR (d) | 35,900 | | 648,713 |
Tencent Holdings Ltd. | 159,500 | | 5,639,060 |
Tiangong International Co. Ltd. | 782,000 | | 188,688 |
Vinda International Holdings Ltd. | 76,000 | | 106,105 |
VST Holdings Ltd. | 914,000 | | 160,391 |
Wynn Macau Ltd. | 380,000 | | 1,076,251 |
Xueda Education Group sponsored ADR (a) | 88,200 | | 254,016 |
Yingde Gases Group Co. Ltd. | 360,000 | | 341,417 |
Youyuan International Holdings Ltd. | 1,946,000 | | 477,081 |
Zhen Ding Technology Holding Ltd. | 48,000 | | 126,861 |
TOTAL CAYMAN ISLANDS | | 22,810,837 |
China - 12.3% |
Air China Ltd. (H Shares) | 3,704,000 | | 2,628,628 |
Changsha Zoomlion Heavy Industry Science & Technology Development Co. Ltd. (H Shares) | 351,000 | | 472,828 |
China Communications Construction Co. Ltd. (H Shares) | 2,373,000 | | 2,226,013 |
China Communications Services Corp. Ltd. (H Shares) | 3,598,000 | | 2,028,795 |
China Construction Bank Corp. (H Shares) | 10,477,000 | | 7,894,876 |
China Longyuan Power Grid Corp. Ltd. (H Shares) | 729,000 | | 475,023 |
China Petroleum & Chemical Corp. (H Shares) | 4,230,000 | | 4,457,900 |
China Railway Construction Corp. Ltd. (H Shares) | 2,583,000 | | 2,566,319 |
China Railway Group Ltd. (H Shares) | 1,873,000 | | 954,620 |
China Southern Airlines Ltd. (H Shares) | 2,514,000 | | 1,190,493 |
China Suntien Green Energy Corp. Ltd. (H Shares) | 2,431,000 | | 495,607 |
Chongqing Machinery & Electric Co. Ltd. (H Shares) | 1,610,000 | | 245,134 |
CITIC Securities Co. Ltd. (H Shares) | 314,500 | | 590,039 |
Great Wall Motor Co. Ltd. (H Shares) | 362,500 | | 996,284 |
Guangshen Railway Co. Ltd. (H Shares) | 1,244,000 | | 428,575 |
Guangzhou R&F Properties Co. Ltd. (H Shares) | 443,200 | | 544,990 |
Harbin Power Equipment Co. Ltd. (H Shares) | 2,030,000 | | 1,678,996 |
Huaneng Renewables Corp. Ltd. (H Shares) (a) | 1,874,000 | | 236,969 |
Industrial & Commercial Bank of China Ltd. (H Shares) | 11,217,000 | | 7,424,882 |
Ping An Insurance Group Co. China Ltd. (H Shares) | 406,500 | | 3,220,508 |
TOTAL CHINA | | 40,757,479 |
Hong Kong - 14.7% |
AIA Group Ltd. | 1,893,000 | | 7,498,674 |
Common Stocks - continued |
| Shares | | Value |
Hong Kong - continued |
Beijing Enterprises Holdings Ltd. | 117,000 | | $ 755,589 |
BOC Hong Kong (Holdings) Ltd. | 1,270,000 | | 3,908,297 |
Cheung Kong Holdings Ltd. | 295,000 | | 4,358,359 |
China Everbright International | 889,000 | | 457,689 |
China Everbright Ltd. | 266,000 | | 387,156 |
China Mobile Ltd. | 383,500 | | 4,253,685 |
China Power International Development Ltd. | 2,191,000 | | 596,514 |
China Resources Power Holdings Co. Ltd. | 540,000 | | 1,156,638 |
CITIC Pacific Ltd. | 1,587,000 | | 2,023,156 |
City Telecom (HK) Ltd. (CTI) | 1,484,000 | | 340,325 |
CNOOC Ltd. | 1,143,500 | | 2,353,296 |
Galaxy Entertainment Group Ltd. (a) | 372,000 | | 1,279,192 |
HKT Trust / HKT Ltd. unit | 2,169,942 | | 2,013,133 |
Hysan Development Co. Ltd. | 314,000 | | 1,387,668 |
Lenovo Group Ltd. | 1,964,000 | | 1,578,792 |
Magnificent Estates Ltd. | 1,922,000 | | 92,999 |
New World Development Co. Ltd. | 1,522,151 | | 2,352,936 |
PCCW Ltd. | 7,763,000 | | 3,135,230 |
Power Assets Holdings Ltd. | 470,500 | | 4,000,742 |
Singamas Container Holdings Ltd. | 842,000 | | 212,943 |
Sun Hung Kai Properties Ltd. | 279,000 | | 3,884,375 |
Vitasoy International Holdings Ltd. | 394,000 | | 374,170 |
Wing Hang Bank Ltd. | 50,000 | | 530,319 |
TOTAL HONG KONG | | 48,931,877 |
India - 11.6% |
Aditya Birla Nuvo Ltd. | 37,660 | | 636,136 |
Apollo Tyres Ltd. (a) | 433,261 | | 690,898 |
Axis Bank Ltd. | 76,498 | | 1,681,378 |
Bajaj Auto Ltd. | 20,000 | | 675,197 |
Britannia Industries Ltd. (a) | 15,444 | | 138,825 |
Cairn India Ltd. | 110,428 | | 690,624 |
Cox & Kings India Ltd. | 69,582 | | 177,431 |
Dena Bank | 289,157 | | 571,005 |
Dish TV India Ltd. (a) | 183,743 | | 257,490 |
Gateway Distriparks Ltd. | 178,612 | | 474,871 |
Godrej Consumer Products Ltd. | 31,940 | | 428,241 |
Grasim Industries Ltd. | 47,858 | | 3,113,313 |
Hathway Cable & Datacom Ltd. (a) | 138,178 | | 602,097 |
HCL Infosystems Ltd. | 318,811 | | 251,825 |
Hindalco Industries Ltd. | 821,522 | | 1,779,544 |
Hindustan Unilever Ltd. | 265,513 | | 2,697,322 |
Common Stocks - continued |
| Shares | | Value |
India - continued |
Housing Development Finance Corp. Ltd. | 251,690 | | $ 3,566,135 |
ICICI Bank Ltd. | 80,680 | | 1,569,842 |
IDBI Bank Ltd. | 198,940 | | 343,121 |
INFO Edge India Ltd. | 9,106 | | 59,302 |
Infotech Enterprises Ltd. | 84,807 | | 296,245 |
Ipca Laboratories Ltd. | 40,891 | | 348,909 |
ITC Ltd. | 386,986 | | 2,032,207 |
Jubilant Foodworks Ltd. (a) | 9,696 | | 227,601 |
Mahindra & Mahindra Financial Services Ltd. | 45,566 | | 733,942 |
Manappuram General Finance & Leasing Ltd. | 315,220 | | 215,888 |
Maruti Suzuki India Ltd. | 34,538 | | 923,003 |
McLeod Russel India Ltd. (a) | 83,197 | | 467,901 |
MindTree Consulting Ltd. | 22,528 | | 276,026 |
Muthoot Finance Ltd. (a) | 123,681 | | 426,062 |
NIIT Technologies Ltd. | 77,144 | | 421,959 |
NTPC Ltd. | 268,892 | | 826,341 |
Opto Circuits India Ltd. | 107,200 | | 239,384 |
Petronet LNG Ltd. | 393,494 | | 1,230,103 |
Power Grid Corp. of India Ltd. | 669,420 | | 1,418,342 |
Rolta India Ltd. | 342,801 | | 413,489 |
Shriram City Union Finance Ltd. (a) | 20,215 | | 293,372 |
Simplex Infrastructures Ltd. | 32,233 | | 121,941 |
SREI Infrastructure Finance Ltd. | 870,179 | | 434,240 |
Strides Arcolab Ltd. | 41,354 | | 687,235 |
Tata Chemicals Ltd. (a) | 128,558 | | 756,104 |
Tata Consultancy Services Ltd. | 88,447 | | 2,162,476 |
Tata Steel Ltd. | 275,521 | | 2,008,351 |
Tech Mahindra Ltd. (a) | 31,879 | | 561,948 |
TTK Prestige Ltd. (a) | 3,024 | | 180,173 |
Yes Bank Ltd. | 69,097 | | 528,581 |
Zydus Wellness Ltd. | 7,735 | | 63,053 |
TOTAL INDIA | | 38,699,473 |
Indonesia - 5.2% |
PT ACE Hardware Indonesia Tbk | 452,500 | | 329,775 |
PT Bank Bukopin Tbk | 7,892,500 | | 525,891 |
PT Bank Central Asia Tbk | 2,249,000 | | 1,920,013 |
PT Bank Rakyat Indonesia Tbk | 5,340,500 | | 4,114,475 |
PT BISI International Tbk | 1,735,500 | | 193,334 |
PT Ciputra Development Tbk | 4,363,000 | | 308,884 |
PT Global Mediacom Tbk | 5,349,000 | | 1,266,936 |
PT Kalbe Farma Tbk | 9,237,500 | | 932,883 |
Common Stocks - continued |
| Shares | | Value |
Indonesia - continued |
PT Media Nusantara Citra Tbk | 697,500 | | $ 205,146 |
PT Pembangunan Perumahan Persero Tbk | 7,025,500 | | 563,208 |
PT Telkomunikasi Indonesia Tbk Series B | 3,842,500 | | 3,902,655 |
PT Tempo Scan Pacific Tbk | 1,234,000 | | 414,329 |
PT Unilever Indonesia Tbk | 767,500 | | 2,081,550 |
PT XL Axiata Tbk | 982,000 | | 700,330 |
TOTAL INDONESIA | | 17,459,409 |
Japan - 0.1% |
Suzuki Motor Corp. | 14,800 | | 335,192 |
Korea (South) - 21.1% |
AMOREPACIFIC Corp. | 682 | | 775,626 |
BS Financial Group, Inc. | 194,180 | | 2,199,467 |
Chong Kun Dang Pharmaceutical Corp. | 23,160 | | 737,079 |
CJ CheilJedang Corp. | 2,482 | | 779,666 |
CJ Corp. | 14,408 | | 1,407,341 |
DGB Financial Group Co. Ltd. | 153,660 | | 1,944,849 |
Dongbu Insurance Co. Ltd. | 10,400 | | 471,678 |
Hana Financial Group, Inc. | 77,910 | | 2,268,731 |
Hanjin Shipping Co. Ltd. (a) | 61,740 | | 688,001 |
Hotel Shilla Co. | 23,094 | | 974,323 |
Hyundai Hysco Co. Ltd. | 28,800 | | 1,151,662 |
Hyundai Merchant Marine Co. Ltd. (a) | 8,200 | | 197,419 |
Hyundai Motor Co. | 25,174 | | 5,183,399 |
Hyundai Steel Co. | 15,467 | | 1,113,581 |
Hyundai Wia Corp. | 7,287 | | 1,179,613 |
ICD Co. Ltd. | 28,696 | | 350,041 |
Industrial Bank of Korea | 96,490 | | 1,061,964 |
Jcontentree Corp. (a) | 147,818 | | 552,460 |
KCC Corp. | 1,444 | | 405,261 |
Kia Motors Corp. | 57,125 | | 3,175,008 |
Korea Zinc Co. Ltd. | 2,169 | | 891,217 |
LG International Corp. | 33,990 | | 1,234,504 |
LG Telecom Ltd. | 75,570 | | 483,090 |
LIG Non-Life Insurance Co. Ltd. | 11,190 | | 285,313 |
Lotte Samkang Co. Ltd. | 3,184 | | 2,134,698 |
Nong Shim Co. Ltd. | 3,466 | | 820,152 |
Osstem Implant Co. Ltd. (a) | 13,388 | | 388,015 |
Paradise Co. Ltd. | 8,847 | | 148,083 |
POSCO | 17,242 | | 5,421,494 |
Samsung Electronics Co. Ltd. | 17,649 | | 21,204,963 |
Samsung Fire & Marine Insurance Co. Ltd. | 10,549 | | 2,307,521 |
Common Stocks - continued |
| Shares | | Value |
Korea (South) - continued |
Samsung Heavy Industries Ltd. | 80,390 | | $ 2,458,917 |
SBS Contents Hub Co. Ltd. | 12,352 | | 185,226 |
SK Chemicals Co. Ltd. | 7,914 | | 487,766 |
SK Energy Co. Ltd. | 13,146 | | 1,935,150 |
SK Holdings Co. Ltd. | 13,892 | | 1,936,665 |
Soulbrain Co. Ltd. | 16,567 | | 667,044 |
Sungwoo Hitech Co. Ltd. | 77,695 | | 755,344 |
TOTAL KOREA (SOUTH) | | 70,362,331 |
Malaysia - 2.2% |
Bumiputra-Commerce Holdings Bhd | 1,007,600 | | 2,523,962 |
Glomac Bhd | 1,063,500 | | 295,029 |
Hong Leong Bank Bhd | 98,800 | | 476,160 |
Lafarge Malayan Cement Bhd | 230,600 | | 738,132 |
Malaysian Plantations Bhd | 508,000 | | 678,779 |
Maxis Bhd | 570,000 | | 1,302,429 |
Telekom Malaysia Bhd | 486,400 | | 954,915 |
TIME dotCom Bhd (a) | 293,300 | | 337,016 |
TOTAL MALAYSIA | | 7,306,422 |
Papua New Guinea - 0.0% |
Oil Search Ltd. ADR | 20,314 | | 156,887 |
Philippines - 1.2% |
Cebu Air, Inc. | 254,000 | | 353,499 |
Manila Water Co., Inc. | 2,068,100 | | 1,459,243 |
PUREGOLD Price Club, Inc. | 954,100 | | 695,263 |
Security Bank Corp. | 262,470 | | 1,033,915 |
Universal Robina Corp. | 249,000 | | 435,599 |
TOTAL PHILIPPINES | | 3,977,519 |
Singapore - 3.6% |
Ascendas Real Estate Investment Trust | 900,000 | | 1,741,269 |
Avago Technologies Ltd. | 39,700 | | 1,311,291 |
First Resources Ltd. | 471,000 | | 791,564 |
Global Logistic Properties Ltd. | 574,000 | | 1,209,362 |
Hutchison Port Holdings Trust | 1,187,000 | | 925,860 |
Mapletree Industrial (REIT) | 966,000 | | 1,108,706 |
Mapletree Logistics Trust (REIT) | 1,826,000 | | 1,661,633 |
Petra Foods Ltd. | 89,000 | | 191,162 |
StarHub Ltd. | 266,000 | | 802,492 |
Common Stocks - continued |
| Shares | | Value |
Singapore - continued |
UOL Group Ltd. | 404,000 | | $ 1,874,602 |
Yanlord Land Group Ltd. (a) | 401,000 | | 414,215 |
TOTAL SINGAPORE | | 12,032,156 |
Taiwan - 9.2% |
ASUSTeK Computer, Inc. | 239,000 | | 2,561,007 |
Chicony Electronics Co. Ltd. | 1,034,075 | | 2,269,230 |
Chinatrust Financial Holding Co. Ltd. | 4,162,688 | | 2,294,395 |
Chipbond Technology Corp. | 459,000 | | 777,833 |
E Sun Financial Holdings Co. Ltd. | 131,096 | | 65,750 |
ECLAT Textile Co. Ltd. | 13,000 | | 38,453 |
Far EasTone Telecommunications Co. Ltd. | 623,000 | | 1,437,528 |
FLEXium Interconnect, Inc. | 27,273 | | 111,109 |
Hon Hai Precision Industry Co. Ltd. (Foxconn) | 1,624,590 | | 4,933,281 |
Insyde Software Corp. | 131,195 | | 387,162 |
MediaTek, Inc. | 259,000 | | 2,877,285 |
Merida Industry Co. Ltd. | 40,000 | | 153,372 |
Novatek Microelectronics Corp. | 175,000 | | 659,021 |
Quanta Computer, Inc. | 544,000 | | 1,244,067 |
Radiant Opto-Electronics Corp. | 356,360 | | 1,482,292 |
Taiwan Semiconductor Manufacturing Co. Ltd. | 1,659,393 | | 5,056,702 |
Unified-President Enterprises Corp. | 1,316,150 | | 2,325,003 |
Wistron Corp. | 1,012,355 | | 972,152 |
Wowprime Corp. | 13,000 | | 182,472 |
Yang Ming Marine Transport Corp. | 2,065,000 | | 805,923 |
TOTAL TAIWAN | | 30,634,037 |
Thailand - 7.1% |
Advanced Info Service PCL (For. Reg.) | 306,200 | | 1,971,780 |
Bangchak Petroleum PCL (For. Reg.) | 308,700 | | 264,212 |
Bangkok Bank Public Co. Ltd. NVDR | 462,600 | | 2,669,716 |
Bangkok Expressway PCL (For.Reg.) | 382,700 | | 346,264 |
Banpu PCL (For. Reg.) | 82,800 | | 1,058,285 |
Charoen Pokphand Foods PCL (For. Reg.) | 994,000 | | 1,142,436 |
Home Product Center PCL (For. Reg.) | 364,560 | | 135,506 |
LPN Development PCL (For. Reg.) | 1,860,100 | | 1,097,744 |
Preuksa Real Estate PCL (For. Reg.) | 908,400 | | 580,523 |
PTT Global Chemical PCL (For. Reg.) | 659,667 | | 1,312,021 |
PTT PCL (For. Reg.) | 356,500 | | 3,696,348 |
Robinsons Department Store PCL (For. Reg.) | 85,300 | | 168,959 |
Siam Commercial Bank PCL (For. Reg.) | 685,100 | | 3,596,384 |
Siam Makro PCL (For. Reg.) | 61,100 | | 916,400 |
Common Stocks - continued |
| Shares | | Value |
Thailand - continued |
Sino Thai Engineering & Construction PCL (For. Reg.) | 901,600 | | $ 629,092 |
Supalai PCL (For. Reg.) | 496,100 | | 310,568 |
Thai Tap Water Supply PCL | 1,488,500 | | 383,409 |
Thai Union Frozen Products PCL (For. Reg.) | 627,920 | | 1,474,087 |
Thanachart Capital PCL (For. Reg.) | 541,600 | | 653,381 |
Total Access Communication PCL (For. Reg.) | 312,300 | | 883,340 |
Toyo-Thai Corp. PCL NVDR | 211,900 | | 188,271 |
TOTAL THAILAND | | 23,478,726 |
United Kingdom - 0.9% |
HSBC Holdings PLC (Hong Kong) | 97,278 | | 958,588 |
Standard Chartered PLC (Hong Kong) | 64,228 | | 1,534,832 |
Vedanta Resources PLC | 24,900 | | 455,668 |
TOTAL UNITED KINGDOM | | 2,949,088 |
United States of America - 1.7% |
China Natural Gas, Inc. (a)(d) | 13,300 | | 9,975 |
Citigroup, Inc. | 37,800 | | 1,413,342 |
Cognizant Technology Solutions Corp. Class A (a) | 30,900 | | 2,059,485 |
Freeport-McMoRan Copper & Gold, Inc. | 46,100 | | 1,792,368 |
Las Vegas Sands Corp. | 7,100 | | 329,724 |
Yum! Brands, Inc. | 1,500 | | 105,165 |
TOTAL UNITED STATES OF AMERICA | | 5,710,059 |
TOTAL COMMON STOCKS (Cost $286,878,616) |
332,119,632
|
Money Market Funds - 0.3% |
| | | |
Fidelity Cash Central Fund, 0.19% (b) | 410,290 | | 410,290 |
Fidelity Securities Lending Cash Central Fund, 0.19% (b)(c) | 572,450 | | 572,450 |
TOTAL MONEY MARKET FUNDS (Cost $982,740) |
982,740
|
TOTAL INVESTMENT PORTFOLIO - 100.1% (Cost $287,861,356) | | 333,102,372 |
NET OTHER ASSETS (LIABILITIES) - (0.1)% | | (393,905) |
NET ASSETS - 100% | $ 332,708,467 |
Legend |
(a) Non-income producing |
(b) Affiliated fund that is available only to investment companies and other accounts managed by Fidelity Investments. The rate quoted is the annualized seven-day yield of the fund at period end. A complete unaudited listing of the fund's holdings as of its most recent quarter end is available upon request. In addition, each Fidelity Central Fund's financial statements, which are not covered by the Fund's Report of Independent Registered Public Accounting Firm, are available on the SEC's website or upon request. |
(c) Investment made with cash collateral received from securities on loan. |
(d) Security or a portion of the security is on loan at period end. |
Affiliated Central Funds |
Information regarding fiscal year to date income earned by the Fund from investments in Fidelity Central Funds is as follows: |
Fund | Income earned |
Fidelity Cash Central Fund | $ 5,440 |
Fidelity Securities Lending Cash Central Fund | 76,377 |
Total | $ 81,817 |
Other Information |
Categorizations in the Schedule of Investments are based on country or territory of incorporation. |
The following is a summary of the inputs used, as of October 31, 2012, involving the Fund's assets and liabilities carried at fair value. The inputs or methodology used for valuing securities may not be an indication of the risk associated with investing in those securities. For more information on valuation inputs, and their aggregation into the levels used in the tables below, please refer to the Security Valuation section in the accompanying Notes to Financial Statements. |
Valuation Inputs at Reporting Date: |
Description | Total | Level 1 | Level 2 | Level 3 |
Investments in Securities: | | | | |
Equities: | | | | |
Consumer Discretionary | $ 28,200,037 | $ 28,200,037 | $ - | $ - |
Consumer Staples | 21,064,364 | 21,064,364 | - | - |
Energy | 19,410,165 | 12,598,969 | 6,811,196 | - |
Financials | 103,430,096 | 100,901,666 | 2,528,430 | - |
Health Care | 5,258,902 | 5,258,902 | - | - |
Industrials | 29,214,156 | 29,214,156 | - | - |
Information Technology | 63,058,660 | 58,001,958 | 5,056,702 | - |
Materials | 24,076,742 | 15,541,935 | 8,534,807 | - |
Telecommunication Services | 24,546,743 | 16,050,078 | 8,496,665 | - |
Utilities | 13,859,767 | 13,859,767 | - | - |
Money Market Funds | 982,740 | 982,740 | - | - |
Total Investments in Securities: | $ 333,102,372 | $ 301,674,572 | $ 31,427,800 | $ - |
The following is a summary of transfers between Level 1 and Level 2 for the period ended October 31, 2012. Transfers are assumed to have occurred at the beginning of the period, and are primarily attributable to the valuation techniques used for foreign equity securities, as discussed in the accompanying Notes to Financial Statements: |
Transfers | Total |
Level 1 to Level 2 | $ 0 |
Level 2 to Level 1 | $ 171,173,915 |
See accompanying notes which are an integral part of the financial statements.
Annual Report
Statement of Assets and Liabilities
| October 31, 2012 |
| | |
Assets | | |
Investment in securities, at value (including securities loaned of $563,050) - See accompanying schedule: Unaffiliated issuers (cost $286,878,616) | $ 332,119,632 | |
Fidelity Central Funds (cost $982,740) | 982,740 | |
Total Investments (cost $287,861,356) | | $ 333,102,372 |
Foreign currency held at value (cost $836,202) | | 818,705 |
Receivable for investments sold | | 2,988,040 |
Receivable for fund shares sold | | 241,286 |
Dividends receivable | | 125,964 |
Distributions receivable from Fidelity Central Funds | | 931 |
Other receivables | | 221,322 |
Total assets | | 337,498,620 |
| | |
Liabilities | | |
Payable for investments purchased | $ 2,917,131 | |
Payable for fund shares redeemed | 755,540 | |
Accrued management fee | 197,294 | |
Distribution and service plan fees payable | 123,811 | |
Other affiliated payables | 89,318 | |
Other payables and accrued expenses | 134,609 | |
Collateral on securities loaned, at value | 572,450 | |
Total liabilities | | 4,790,153 |
| | |
Net Assets | | $ 332,708,467 |
Net Assets consist of: | | |
Paid in capital | | $ 298,443,279 |
Undistributed net investment income | | 2,899,067 |
Accumulated undistributed net realized gain (loss) on investments and foreign currency transactions | | (13,828,339) |
Net unrealized appreciation (depreciation) on investments and assets and liabilities in foreign currencies | | 45,194,460 |
Net Assets | | $ 332,708,467 |
See accompanying notes which are an integral part of the financial statements.
Annual Report
Financial Statements - continued
Statement of Assets and Liabilities - continued
| October 31, 2012 |
| | |
Calculation of Maximum Offering Price Class A:
Net Asset Value and redemption price per share ($160,426,790 ÷ 5,557,506 shares) | | $ 28.87 |
| | |
Maximum offering price per share (100/94.25 of $28.87) | | $ 30.63 |
Class T:
Net Asset Value and redemption price per share ($49,358,848 ÷ 1,754,694 shares) | | $ 28.13 |
| | |
Maximum offering price per share (100/96.50 of $28.13) | | $ 29.15 |
Class B:
Net Asset Value and offering price per share ($15,823,278 ÷ 591,021 shares)A | | $ 26.77 |
| | |
Class C:
Net Asset Value and offering price per share ($67,073,559 ÷ 2,528,151 shares)A | | $ 26.53 |
| | |
Institutional Class:
Net Asset Value, offering price and redemption price per share ($40,025,992 ÷ 1,348,976 shares) | | $ 29.67 |
A Redemption price per share is equal to net asset value less any applicable contingent deferred sales charge.
See accompanying notes which are an integral part of the financial statements.
Annual Report
Statement of Operations
| Year ended October 31, 2012 |
| | |
Investment Income | | |
Dividends | | $ 10,185,651 |
Income from Fidelity Central Funds | | 81,817 |
Income before foreign taxes withheld | | 10,267,468 |
Less foreign taxes withheld | | (944,562) |
Total income | | 9,322,906 |
| | |
Expenses | | |
Management fee | $ 2,521,012 | |
Transfer agent fees | 965,466 | |
Distribution and service plan fees | 1,584,458 | |
Accounting and security lending fees | 184,659 | |
Custodian fees and expenses | 252,056 | |
Independent trustees' compensation | 2,366 | |
Registration fees | 82,723 | |
Audit | 122,257 | |
Legal | 1,582 | |
Interest | 1,221 | |
Miscellaneous | 3,887 | |
Total expenses before reductions | 5,721,687 | |
Expense reductions | (111,304) | 5,610,383 |
Net investment income (loss) | | 3,712,523 |
Realized and Unrealized Gain (Loss) Net realized gain (loss) on: | | |
Investment securities: | | |
Unaffiliated issuers | (12,276,777) | |
Foreign currency transactions | (43,492) | |
Total net realized gain (loss) | | (12,320,269) |
Change in net unrealized appreciation (depreciation) on: Investment securities | 27,243,935 | |
Assets and liabilities in foreign currencies | (31,478) | |
Total change in net unrealized appreciation (depreciation) | | 27,212,457 |
Net gain (loss) | | 14,892,188 |
Net increase (decrease) in net assets resulting from operations | | $ 18,604,711 |
See accompanying notes which are an integral part of the financial statements.
Annual Report
Financial Statements - continued
Statement of Changes in Net Assets
| Year ended
October 31,
2012 | Year ended
October 31,
2011 |
Increase (Decrease) in Net Assets | | |
Operations | | |
Net investment income (loss) | $ 3,712,523 | $ 3,977,993 |
Net realized gain (loss) | (12,320,269) | 22,771,263 |
Change in net unrealized appreciation (depreciation) | 27,212,457 | (61,670,156) |
Net increase (decrease) in net assets resulting
from operations | 18,604,711 | (34,920,900) |
Distributions to shareholders from net investment income | (3,170,802) | (1,974,190) |
Distributions to shareholders from net realized gain | (16,643,937) | (23,691,402) |
Total distributions | (19,814,739) | (25,665,592) |
Share transactions - net increase (decrease) | (50,574,411) | 32,289,855 |
Redemption fees | 36,772 | 135,689 |
Total increase (decrease) in net assets | (51,747,667) | (28,160,948) |
| | |
Net Assets | | |
Beginning of period | 384,456,134 | 412,617,082 |
End of period (including undistributed net investment income of $2,899,067 and undistributed net investment income of $2,634,151, respectively) | $ 332,708,467 | $ 384,456,134 |
See accompanying notes which are an integral part of the financial statements.
Annual Report
Financial Highlights - Class A
Years ended October 31, | 2012 | 2011 | 2010 | 2009 | 2008 |
Selected Per-Share Data | | | | | |
Net asset value, beginning of period | $ 28.70 | $ 32.97 | $ 25.96 | $ 15.74 | $ 37.55 |
Income from Investment Operations | | | | | |
Net investment income (loss) C | .34 | .35 | .25 | .19 | .19 |
Net realized and unrealized gain (loss) | 1.37 | (2.62) | 7.09 | 10.07 | (18.72) |
Total from investment operations | 1.71 | (2.27) | 7.34 | 10.26 | (18.53) |
Distributions from net investment income | (.31) | (.20) | (.12) | (.05) | (.23) |
Distributions from net realized gain | (1.23) | (1.81) | (.22) | - | (3.06) |
Total distributions | (1.54) | (2.01) | (.34) | (.05) | (3.29) |
Redemption fees added to paid in capital C | - H | .01 | .01 | .01 | .01 |
Net asset value, end of period | $ 28.87 | $ 28.70 | $ 32.97 | $ 25.96 | $ 15.74 |
Total Return A,B | 6.36% | (7.44)% | 28.53% | 65.43% | (53.66)% |
Ratios to Average Net Assets D,F | | | | | |
Expenses before reductions | 1.42% | 1.39% | 1.44% | 1.54% | 1.50% |
Expenses net of fee waivers, if any | 1.42% | 1.39% | 1.44% | 1.50% | 1.50% |
Expenses net of all reductions | 1.38% | 1.35% | 1.40% | 1.41% | 1.41% |
Net investment income (loss) | 1.24% | 1.12% | .86% | .94% | .73% |
Supplemental Data | | | | | |
Net assets, end of period (000 omitted) | $ 160,427 | $ 179,346 | $ 189,255 | $ 131,564 | $ 71,722 |
Portfolio turnover rate E | 95% | 119% | 138% | 91% | 92% G |
A Total returns would have been lower if certain expenses had not been reduced during the applicable periods shown.
B Total returns do not include the effect of the sales charges.
C Calculated based on average shares outstanding during the period.
D Fees and expenses of any underlying Fidelity Central Funds are not included in the Fund's expense ratio. The Fund indirectly bears its proportionate share of the expenses of any underlying Fidelity Central Funds.
E Amount does not include the portfolio activity of any underlying Fidelity Central Funds.
F Expense ratios reflect operating expenses of the class. Expenses before reductions do not reflect amounts reimbursed by the investment adviser or reductions from brokerage service arrangements or reductions from other expense offset arrangements and do not represent the amount paid by the class during periods when reimbursements or reductions occur. Expenses net of fee waivers reflect expenses after reimbursement by the investment adviser but prior to reductions from brokerage service arrangements or other expense offset arrangements. Expenses net of all reductions represent the net expenses paid by the class.
G The portfolio turnover rate does not include the assets acquired in the merger.
H Amount represents less than $.01 per share.
See accompanying notes which are an integral part of the financial statements.
Annual Report
Financial Highlights - Class T
Years ended October 31, | 2012 | 2011 | 2010 | 2009 | 2008 |
Selected Per-Share Data | | | | | |
Net asset value, beginning of period | $ 27.98 | $ 32.20 | $ 25.40 | $ 15.43 | $ 36.88 |
Income from Investment Operations | | | | | |
Net investment income (loss) C | .25 | .25 | .15 | .14 | .12 |
Net realized and unrealized gain (loss) | 1.33 | (2.55) | 6.94 | 9.86 | (18.38) |
Total from investment operations | 1.58 | (2.30) | 7.09 | 10.00 | (18.26) |
Distributions from net investment income | (.20) | (.12) | (.08) | (.04) | (.14) |
Distributions from net realized gain | (1.23) | (1.81) | (.22) | - | (3.06) |
Total distributions | (1.43) | (1.93) | (.30) | (.04) | (3.20) |
Redemption fees added to paid in capital C | - H | .01 | .01 | .01 | .01 |
Net asset value, end of period | $ 28.13 | $ 27.98 | $ 32.20 | $ 25.40 | $ 15.43 |
Total Return A,B | 6.04% | (7.70)% | 28.13% | 65.06% | (53.79)% |
Ratios to Average Net Assets D,F | | | | | |
Expenses before reductions | 1.70% | 1.70% | 1.74% | 1.84% | 1.80% |
Expenses net of fee waivers, if any | 1.70% | 1.69% | 1.74% | 1.75% | 1.75% |
Expenses net of all reductions | 1.67% | 1.65% | 1.70% | 1.66% | 1.66% |
Net investment income (loss) | .95% | .82% | .55% | .69% | .48% |
Supplemental Data | | | | | |
Net assets, end of period (000 omitted) | $ 49,359 | $ 55,452 | $ 61,620 | $ 45,259 | $ 25,205 |
Portfolio turnover rate E | 95% | 119% | 138% | 91% | 92% G |
A Total returns would have been lower if certain expenses had not been reduced during the applicable periods shown.
B Total returns do not include the effect of the sales charges.
C Calculated based on average shares outstanding during the period.
D Fees and expenses of any underlying Fidelity Central Funds are not included in the Fund's expense ratio. The Fund indirectly bears its proportionate share of the expenses of any underlying Fidelity Central Funds.
E Amount does not include the portfolio activity of any underlying Fidelity Central Funds.
F Expense ratios reflect operating expenses of the class. Expenses before reductions do not reflect amounts reimbursed by the investment adviser or reductions from brokerage service arrangements or reductions from other expense offset arrangements and do not represent the amount paid by the class during periods when reimbursements or reductions occur. Expenses net of fee waivers reflect expenses after reimbursement by the investment adviser but prior to reductions from brokerage service arrangements or other expense offset arrangements. Expenses net of all reductions represent the net expenses paid by the class.
G The portfolio turnover rate does not include the assets acquired in the merger.
H Amount represents less than $.01 per share.
See accompanying notes which are an integral part of the financial statements.
Annual Report
Financial Highlights - Class B
Years ended October 31, | 2012 | 2011 | 2010 | 2009 | 2008 |
Selected Per-Share Data | | | | | |
Net asset value, beginning of period | $ 26.62 | $ 30.72 | $ 24.29 | $ 14.82 | $ 35.55 |
Income from Investment Operations | | | | | |
Net investment income (loss) C | .12 | .10 | .02 | .04 | (.01) |
Net realized and unrealized gain (loss) | 1.26 | (2.44) | 6.61 | 9.45 | (17.68) |
Total from investment operations | 1.38 | (2.34) | 6.63 | 9.49 | (17.69) |
Distributions from net investment income | - | - | - | (.03) | - |
Distributions from net realized gain | (1.23) | (1.77) | (.21) | - | (3.05) |
Total distributions | (1.23) | (1.77) | (.21) | (.03) | (3.05) |
Redemption fees added to paid in capital C | - H | .01 | .01 | .01 | .01 |
Net asset value, end of period | $ 26.77 | $ 26.62 | $ 30.72 | $ 24.29 | $ 14.82 |
Total Return A,B | 5.51% | (8.16)% | 27.48% | 64.23% | (54.01)% |
Ratios to Average Net Assets D,F | | | | | |
Expenses before reductions | 2.19% | 2.19% | 2.24% | 2.32% | 2.29% |
Expenses net of fee waivers, if any | 2.19% | 2.18% | 2.24% | 2.25% | 2.25% |
Expenses net of all reductions | 2.16% | 2.15% | 2.20% | 2.16% | 2.16% |
Net investment income (loss) | .46% | .32% | .06% | .19% | (.02)% |
Supplemental Data | | | | | |
Net assets, end of period (000 omitted) | $ 15,823 | $ 20,831 | $ 29,611 | $ 25,750 | $ 17,040 |
Portfolio turnover rate E | 95% | 119% | 138% | 91% | 92% G |
A Total returns would have been lower if certain expenses had not been reduced during the applicable periods shown.
B Total returns do not include the effect of the contingent deferred sales charge.
C Calculated based on average shares outstanding during the period.
D Fees and expenses of any underlying Fidelity Central Funds are not included in the Fund's expense ratio. The Fund indirectly bears its proportionate share of the expenses of any underlying Fidelity Central Funds.
E Amount does not include the portfolio activity of any underlying Fidelity Central Funds.
F Expense ratios reflect operating expenses of the class. Expenses before reductions do not reflect amounts reimbursed by the investment adviser or reductions from brokerage service arrangements or reductions from other expense offset arrangements and do not represent the amount paid by the class during periods when reimbursements or reductions occur. Expenses net of fee waivers reflect expenses after reimbursement by the investment adviser but prior to reductions from brokerage service arrangements or other expense offset arrangements. Expenses net of all reductions represent the net expenses paid by the class.
G The portfolio turnover rate does not include the assets acquired in the merger.
H Amount represents less than $.01 per share.
See accompanying notes which are an integral part of the financial statements.
Annual Report
Financial Highlights - Class C
Years ended October 31, | 2012 | 2011 | 2010 | 2009 | 2008 |
Selected Per-Share Data | | | | | |
Net asset value, beginning of period | $ 26.44 | $ 30.58 | $ 24.19 | $ 14.76 | $ 35.48 |
Income from Investment Operations | | | | | |
Net investment income (loss) C | .13 | .11 | .03 | .04 | - H |
Net realized and unrealized gain (loss) | 1.25 | (2.41) | 6.59 | 9.41 | (17.63) |
Total from investment operations | 1.38 | (2.30) | 6.62 | 9.45 | (17.63) |
Distributions from net investment income | (.06) | (.04) | (.02) | (.03) | (.04) |
Distributions from net realized gain | (1.23) | (1.81) | (.22) | - | (3.06) |
Total distributions | (1.29) | (1.85) | (.24) | (.03) | (3.10) |
Redemption fees added to paid in capital C | - H | .01 | .01 | .01 | .01 |
Net asset value, end of period | $ 26.53 | $ 26.44 | $ 30.58 | $ 24.19 | $ 14.76 |
Total Return A,B | 5.57% | (8.10)% | 27.58% | 64.21% | (54.02)% |
Ratios to Average Net Assets D,F | | | | | |
Expenses before reductions | 2.16% | 2.13% | 2.17% | 2.28% | 2.25% |
Expenses net of fee waivers, if any | 2.16% | 2.13% | 2.17% | 2.25% | 2.25% |
Expenses net of all reductions | 2.13% | 2.10% | 2.13% | 2.16% | 2.16% |
Net investment income (loss) | .49% | .37% | .12% | .19% | (.02)% |
Supplemental Data | | | | | |
Net assets, end of period (000 omitted) | $ 67,074 | $ 78,939 | $ 87,089 | $ 59,491 | $ 30,577 |
Portfolio turnover rate E | 95% | 119% | 138% | 91% | 92% G |
A Total returns would have been lower if certain expenses had not been reduced during the applicable periods shown.
B Total returns do not include the effect of the contingent deferred sales charge.
C Calculated based on average shares outstanding during the period.
D Fees and expenses of any underlying Fidelity Central Funds are not included in the Fund's expense ratio. The Fund indirectly bears its proportionate share of the expenses of any underlying Fidelity Central Funds.
E Amount does not include the portfolio activity of any underlying Fidelity Central Funds.
F Expense ratios reflect operating expenses of the class. Expenses before reductions do not reflect amounts reimbursed by the investment adviser or reductions from brokerage service arrangements or reductions from other expense offset arrangements and do not represent the amount paid by the class during periods when reimbursements or reductions occur. Expenses net of fee waivers reflect expenses after reimbursement by the investment adviser but prior to reductions from brokerage service arrangements or other expense offset arrangements. Expenses net of all reductions represent the net expenses paid by the class.
G The portfolio turnover rate does not include the assets acquired in the merger.
H Amount represents less than $.01 per share.
See accompanying notes which are an integral part of the financial statements.
Annual Report
Financial Highlights - Institutional Class
Years ended October 31, | 2012 | 2011 | 2010 | 2009 | 2008 |
Selected Per-Share Data | | | | | |
Net asset value, beginning of period | $ 29.49 | $ 33.80 | $ 26.58 | $ 16.07 | $ 38.25 |
Income from Investment Operations | | | | | |
Net investment income (loss) B | .44 | .46 | .34 | .26 | .27 |
Net realized and unrealized gain (loss) | 1.39 | (2.69) | 7.26 | 10.29 | (19.09) |
Total from investment operations | 1.83 | (2.23) | 7.60 | 10.55 | (18.82) |
Distributions from net investment income | (.42) | (.29) | (.17) | (.05) | (.31) |
Distributions from net realized gain | (1.23) | (1.81) | (.22) | - | (3.06) |
Total distributions | (1.65) | (2.09) H | (.39) | (.05) | (3.37) |
Redemption fees added to paid in capital B | - G | .01 | .01 | .01 | .01 |
Net asset value, end of period | $ 29.67 | $ 29.49 | $ 33.80 | $ 26.58 | $ 16.07 |
Total Return A | 6.64% | (7.13)% | 28.87% | 65.94% | (53.53)% |
Ratios to Average Net Assets C,E | | | | | |
Expenses before reductions | 1.11% | 1.10% | 1.14% | 1.25% | 1.20% |
Expenses net of fee waivers, if any | 1.11% | 1.10% | 1.14% | 1.25% | 1.20% |
Expenses net of all reductions | 1.08% | 1.06% | 1.10% | 1.16% | 1.11% |
Net investment income (loss) | 1.54% | 1.41% | 1.16% | 1.18% | 1.03% |
Supplemental Data | | | | | |
Net assets, end of period (000 omitted) | $ 40,026 | $ 49,888 | $ 45,042 | $ 23,888 | $ 5,933 |
Portfolio turnover rate D | 95% | 119% | 138% | 91% | 92% F |
A Total returns would have been lower if certain expenses had not been reduced during the applicable periods shown.
B Calculated based on average shares outstanding during the period.
C Fees and expenses of any underlying Fidelity Central Funds are not included in the Fund's expense ratio. The Fund indirectly bears its proportionate share of the expenses of any underlying Fidelity Central Funds.
D Amount does not include the portfolio activity of any underlying Fidelity Central Funds.
E Expense ratios reflect operating expenses of the class. Expenses before reductions do not reflect amounts reimbursed by the investment adviser or reductions from brokerage service arrangements or reductions from other expense offset arrangements and do not represent the amount paid by the class during periods when reimbursements or reductions occur. Expenses net of fee waivers reflect expenses after reimbursement by the investment adviser but prior to reductions from brokerage service arrangements or other expense offset arrangements. Expenses net of all reductions represent the net expenses paid by the class.
F The portfolio turnover rate does not include the assets acquired in the merger.
G Amount represents less than $.01 per share.
H Total distributions of $2.09 per share is comprised of distributions from net investment income of $.288 and distributions from net realized gain of $1.805 per share.
See accompanying notes which are an integral part of the financial statements.
Annual Report
Notes to Financial Statements
For the period ended October 31, 2012
1. Organization.
Fidelity Advisor Emerging Asia Fund (the Fund) is a fund of Fidelity Advisor Series VIII (the Trust) and is authorized to issue an unlimited number of shares. The Trust is registered under the Investment Company Act of 1940, as amended (the 1940 Act), as an open-end management investment company organized as a Massachusetts business trust. The Fund offers Class A, Class T, Class C and Institutional Class shares, each of which, along with Class B shares, has equal rights as to assets and voting privileges. Effective after the close of business on September 1, 2010, Class B shares were closed to new accounts and additional purchases, except for exchanges and reinvestments. Each class has exclusive voting rights with respect to matters that affect that class. Class B shares will automatically convert to Class A shares after a holding period of seven years from the initial date of purchase. Investment income, realized and unrealized capital gains and losses, the common expenses of the Fund, and certain fund-level expense reductions, if any, are allocated on a pro-rata basis to each class based on the relative net assets of each class to the total net assets of the Fund. Each class differs with respect to transfer agent and distribution and service plan fees incurred. Certain expense reductions may also differ by class. The Fund's investments in emerging markets can be subject to social, economic, regulatory, and political uncertainties and can be extremely volatile.
2. Investments in Fidelity Central Funds.
The Fund invests in Fidelity Central Funds, which are open-end investment companies available only to other investment companies and accounts managed by Fidelity Management & Research Company (FMR) and its affiliates. The Fund's Schedule of Investments lists each of the Fidelity Central Funds held as of period end, if any, as an investment of the Fund, but does not include the underlying holdings of each Fidelity Central Fund. As an Investing Fund, the Fund indirectly bears its proportionate share of the expenses of the underlying Fidelity Central Funds.
The Money Market Central Funds seek preservation of capital and current income and are managed by Fidelity Investments Money Management, Inc. (FIMM), an affiliate of FMR.
A complete unaudited list of holdings for each Fidelity Central Fund is available upon request or at the Securities and Exchange Commission (the SEC) web site at www.sec.gov. In addition, the financial statements of the Fidelity Central Funds, which are not covered by the Fund's Report of Independent Registered Public Accounting Firm, are available on the SEC web site or upon request.
Annual Report
Notes to Financial Statements - continued
3. Significant Accounting Policies.
The financial statements have been prepared in conformity with accounting principles generally accepted in the United States of America (GAAP), which require management to make certain estimates and assumptions at the date of the financial statements. Actual results could differ from those estimates. Subsequent events, if any, through the date that the financial statements were issued have been evaluated in the preparation of the financial statements. The following summarizes the significant accounting policies of the Fund:
Security Valuation. Investments are valued as of 4:00 p.m. Eastern time on the last calendar day of the period. In accordance with valuation policies and procedures approved by the Board of Trustees (the Board), the Fund attempts to obtain prices from one or more third party pricing vendors or brokers to value its investments. When current market prices, quotations or rates are not readily available or reliable, securities will be fair valued in good faith by the FMR Fair Value Committee (the Committee), in accordance with procedures adopted by the Fund's Board. Factors used in determining fair value vary by security type and may include market or security specific events. The frequency with which these procedures are used cannot be predicted and they may be utilized to a significant extent. The Committee oversees the Fund's valuation policies and procedures and is responsible for approving and reporting to the Board all fair value determinations.
The Fund categorizes the inputs to valuation techniques used to value its investments into a disclosure hierarchy consisting of three levels as shown below:
Level 1 - quoted prices in active markets for identical investments
Level 2 - other significant observable inputs (including quoted prices for similar investments, interest rates, prepayment speeds, etc.)
Level 3 - unobservable inputs (including the Fund's own assumptions based on the best information available)
Valuation techniques used to value the Fund's investments by major category are as follows:
Equity securities, including restricted securities, for which market quotations are readily available, are valued at the last reported sale price or official closing price as reported by a third party pricing vendor on the primary market or exchange on which they are traded and are categorized as Level 1 in the hierarchy. In the event there were no sales during the day or closing prices are not available, securities are valued at the last quoted bid price or may be valued using the last available price and are generally categorized as Level 2 in the hierarchy. For foreign equity securities, when significant market or security specific events arise, comparisons to the valuation of American Depositary Receipts
Annual Report
3. Significant Accounting Policies - continued
Security Valuation - continued
(ADRs), futures contracts, Exchange-Traded Funds (ETFs) and certain indexes as well as quoted prices for similar securities are used and are categorized as Level 2 in the hierarchy. Utilizing these techniques may result in transfers between Level 1 and Level 2.
Investments in open-end mutual funds, including the Fidelity Central Funds, are valued at their closing net asset value (NAV) each business day and are categorized as Level 1 in the hierarchy.
Changes in valuation techniques may result in transfers in or out of an assigned level within the disclosure hierarchy. The aggregate value of investments by input level, as of October 31, 2012, including information on transfers between Levels 1 and 2, is included at the end of the Fund's Schedule of Investments.
Foreign Currency Translation. The Fund may use foreign currency contracts to facilitate transactions in foreign-denominated securities. Gains and losses from these transactions may arise from changes in the value of the foreign currency or if the counterparties do not perform under the contracts' terms.
Foreign-denominated assets, including investment securities, and liabilities are translated into U.S. dollars at the exchange rates at period end. Purchases and sales of investment securities, income and dividends received and expenses denominated in foreign currencies are translated into U.S. dollars at the exchange rate in effect on the transaction date.
The effects of exchange rate fluctuations on investments are included with the net realized and unrealized gain (loss) on investment securities. Other foreign currency transactions resulting in realized and unrealized gain (loss) are disclosed separately.
Investment Transactions and Income. For financial reporting purposes, the Fund's investment holdings and NAV include trades executed through the end of the last business day of the period. The NAV per share for processing shareholder transactions is calculated as of the close of business of the New York Stock Exchange (NYSE), normally 4:00 p.m. Eastern time and includes trades executed through the end of the prior business day. Gains and losses on securities sold are determined on the basis of identified cost. Dividend income is recorded on the ex-dividend date, except for certain dividends from foreign securities where the ex-dividend date may have passed, which are recorded as soon as the Fund is informed of the ex-dividend date. Non-cash dividends included in dividend income, if any, are recorded at the fair market value of the securities received. Interest income and distributions from the Fidelity Central Funds are accrued as earned. Investment income is recorded net of foreign taxes withheld where recovery of such taxes is uncertain.
Annual Report
Notes to Financial Statements - continued
3. Significant Accounting Policies - continued
Expenses. Expenses directly attributable to a fund are charged to that fund. Expenses attributable to more than one fund are allocated among the respective funds on the basis of relative net assets or other appropriate methods. Expense estimates are accrued in the period to which they relate and adjustments are made when actual amounts are known.
Income Tax Information and Distributions to Shareholders. Each year, the Fund intends to qualify as a regulated investment company under Subchapter M of the Internal Revenue Code, including distributing substantially all of its taxable income and realized gains. As a result, no provision for income taxes is required. As of October 31, 2012, the Fund did not have any unrecognized tax benefits in the financial statements; nor is the Fund aware of any tax positions for which it is reasonably possible that the total amounts of unrecognized tax benefits will significantly change in the next twelve months. The Fund files a U.S. federal tax return, in addition to state and local tax returns as required. A fund's federal income tax returns are subject to examination by the Internal Revenue Service (IRS) for a period of three fiscal years after they are filed. State and local tax returns may be subject to examination for an additional fiscal year depending on the jurisdiction. Foreign taxes are provided for based on the Fund's understanding of the tax rules and rates that exist in the foreign markets in which it invests. The Fund received a final ruling from the Authority for Advance Ruling in India regarding the applicability of taxes imposed by the country on realized capital gains under the US/India tax treaty. The ruling entitled the Fund to a refund of capital gains taxes paid in prior years and exempts the Fund from taxes on future realized gains. The India Central Board of Direct Taxation may challenge the ruling at any time which could result in the reversal of some or all of the benefits recorded by the Fund.
Distributions are declared and recorded on the ex-dividend date. Income dividends and capital gain distributions are declared separately for each class. Income and capital gain distributions are determined in accordance with income tax regulations, which may differ from GAAP. In addition, the Fund claimed a portion of the payment made to redeeming shareholders as a distribution for income tax purposes.
Capital accounts within the financial statements are adjusted for permanent book-tax differences. These adjustments have no impact on net assets or the results of operations. Temporary book-tax differences will reverse in a subsequent period.
Book-tax differences are primarily due to foreign currency transactions, passive foreign investment companies (PFIC), capital loss carryforwards and losses deferred due to wash sales.
Annual Report
3. Significant Accounting Policies - continued
Income Tax Information and Distributions to Shareholders - continued
The federal tax cost of investment securities and unrealized appreciation (depreciation) as of period end were as follows:
Gross unrealized appreciation | $ 54,784,892 |
Gross unrealized depreciation | (11,531,850) |
Net unrealized appreciation (depreciation) on securities and other investments | $ 43,253,042 |
| |
Tax Cost | $ 289,849,330 |
The tax-based components of distributable earnings as of period end were as follows:
Undistributed ordinary income | $ 3,944,451 |
Capital loss carryforward | $ (12,885,749) |
Net unrealized appreciation (depreciation) | $ 43,206,486 |
Capital loss carryforwards are only available to offset future capital gains of the Fund to the extent provided by regulations and may be limited. Under the Regulated Investment Company Modernization Act of 2010 (the Act), the Fund is permitted to carry forward capital losses incurred in taxable years beginning after December 22, 2010 for an unlimited period and such capital losses are required to be used prior to any losses that expire. Capital loss carryforwards were as follows:
No expiration | |
Short-term | $ (12,885,749) |
The tax character of distributions paid was as follows:
| October 31, 2012 | October 31, 2011 |
Ordinary Income | $ 3,170,802 | $ 3,521,543 |
Long-term Capital Gains | 16,643,937 | 22,144,049 |
Total | $ 19,814,739 | $ 25,665,592 |
Short-Term Trading (Redemption) Fees. Shares held by investors in the Fund less than 90 days are subject to a redemption fee equal to 1.50% of the net asset value of shares redeemed. All redemption fees, which reduce the proceeds of the shareholder redemption, are retained by the Fund and accounted for as an addition to paid in capital.
Annual Report
Notes to Financial Statements - continued
3. Significant Accounting Policies - continued
New Accounting Pronouncement. In December 2011, the Financial Accounting Standards Board issued Accounting Standard Update No. 2011-11, Disclosures about Offsetting Assets and Liabilities. The update creates new disclosure requirements requiring entities to disclose both gross and net information for derivatives and other financial instruments that are either offset in the Statement of Assets and Liabilities or subject to an enforceable master netting arrangement or similar agreement. The disclosure requirements are effective for annual reporting periods beginning on or after January 1, 2013, and interim periods within those annual periods. Management is currently evaluating the impact of the update's adoption on the Fund's financial statement disclosures.
4. Purchases and Sales of Investments.
Purchases and sales of securities, other than short-term securities, aggregated $335,090,032 and $397,339,994, respectively.
5. Fees and Other Transactions with Affiliates.
Management Fee. FMR and its affiliates provide the Fund with investment management related services for which the Fund pays a monthly management fee. The management fee is the sum of an individual fund fee rate that is based on an annual rate of .45% of the Fund's average net assets and an annualized group fee rate that averaged .26% during the period. The group fee rate is based upon the average net assets of all the mutual funds advised by FMR. The group fee rate decreases as assets under management increase and increases as assets under management decrease. For the period, the total annual management fee rate was .71% of the Fund's average net assets.
Distribution and Service Plan Fees. In accordance with Rule 12b-1 of the 1940 Act, the Fund has adopted separate Distribution and Service Plans for each class of shares. Certain classes pay Fidelity Distributors Corporation (FDC), an affiliate of FMR, separate Distribution and Service Fees, each of which is based on an annual percentage of each class' average net assets. In addition, FDC may pay financial intermediaries for selling shares of the Fund and providing shareholder support services. For the period, the Distribution and Service Fee rates, total fees and amounts retained by FDC were as follows:
| Distribution
Fee | Service
Fee | Total
Fees | Retained
by FDC |
Class A | -% | .25% | $ 420,135 | $ 10,027 |
Class T | .25% | .25% | 257,066 | 1,438 |
Class B | .75% | .25% | 178,138 | 133,870 |
Class C | .75% | .25% | 729,119 | 98,947 |
| | | $ 1,584,458 | $ 244,282 |
Annual Report
5. Fees and Other Transactions with Affiliates - continued
Sales Load. FDC may receive a front-end sales charge of up to 5.75% for selling Class A shares and 3.50% for selling Class T shares, some of which is paid to financial intermediaries for selling shares of the Fund. Depending on the holding period, FDC may receive contingent deferred sales charges levied on Class A, Class T, Class B, and Class C redemptions. The deferred sales charges range from 5.00% to 1.00% for Class B shares, 1.00% for Class C shares, 1.00% for certain purchases of Class A shares and .25% for certain purchases of Class T shares.
For the period, sales charge amounts retained by FDC were as follows:
| Retained
by FDC |
Class A | $ 53,901 |
Class T | 11,098 |
Class B* | 30,233 |
Class C* | 11,782 |
| $ 107,014 |
* When Class B and Class C shares are initially sold, FDC pays commissions from its own resources to financial intermediaries through which the sales are made.
Transfer Agent Fees. Fidelity Investments Institutional Operations Company, Inc. (FIIOC), an affiliate of FMR, is the transfer, dividend disbursing and shareholder servicing agent for each class of the Fund. FIIOC receives account fees and asset-based fees that vary according to the account size and type of account of the shareholders of the respective classes of the Fund. FIIOC pays for typesetting, printing and mailing of shareholder reports, except proxy statements. For the period, transfer agent fees for each class were as follows:
| Amount | % of
Average
Net Assets |
Class A | $ 460,834 | .27 |
Class T | 159,449 | .31 |
Class B | 53,240 | .30 |
Class C | 192,502 | .26 |
Institutional Class | 99,441 | .22 |
| $ 965,466 | |
Accounting and Security Lending Fees. Fidelity Service Company, Inc. (FSC), an affiliate of FMR, maintains the Fund's accounting records. The accounting fee is based on the level of average net assets for each month. Under a separate contract, FSC
Annual Report
Notes to Financial Statements - continued
5. Fees and Other Transactions with Affiliates - continued
Accounting and Security Lending Fees - continued
administers the security lending program. The security lending fee is based on the number and duration of lending transactions.
Brokerage Commissions. The Fund placed a portion of its portfolio transactions with brokerage firms which are affiliates of the investment adviser. The commissions paid to these affiliated firms were $252 for the period.
Interfund Lending Program. Pursuant to an Exemptive Order issued by the SEC, the Fund, along with other registered investment companies having management contracts with FMR, may participate in an interfund lending program. This program provides an alternative credit facility allowing the funds to borrow from, or lend money to, other participating affiliated funds. At period end, there were no interfund loans outstanding. The Fund's activity in this program during the period for which loans were outstanding was as follows:
Borrower or Lender | Average Loan
Balance | Weighted Average Interest Rate | Interest
Expense |
Borrower | $ 6,028,737 | .38% | $ 1,221 |
6. Committed Line of Credit.
The Fund participates with other funds managed by FMR or an affiliate in a $4.25 billion credit facility (the "line of credit") to be utilized for temporary or emergency purposes to fund shareholder redemptions or for other short-term liquidity purposes. The Fund has agreed to pay commitment fees on its pro-rata portion of the line of credit, which amounted to $992 and is reflected in Miscellaneous expenses on the Statement of Operations. During the period, there were no borrowings on this line of credit.
7. Security Lending.
The Fund lends portfolio securities through a lending agent from time to time in order to earn additional income. For equity securities, a lending agent is used and may loan securities to certain qualified borrowers, including Fidelity Capital Markets (FCM), a broker-dealer affiliated with the Fund. On the settlement date of the loan, the Fund receives collateral (in the form of U.S. Treasury obligations, letters of credit and/or cash) against the loaned securities and maintains collateral in an amount not less than 100% of the market value of the loaned securities during the period of the loan. The market value of the loaned securities is determined at the close of business of the Fund and any additional required collateral is delivered to the Fund on the next business day. If the borrower defaults on its obligation to return the securities loaned because of insolvency or other reasons, a fund could experience delays and costs in recovering the securities
Annual Report
7. Security Lending - continued
loaned or in gaining access to the collateral. Any cash collateral received is invested in the Fidelity Securities Lending Cash Central Fund. The value of loaned securities and cash collateral at period end are disclosed on the Fund's Statement of Assets and Liabilities. Security lending income represents the income earned on investing cash collateral, less rebates paid to borrowers and any lending agent fees associated with the loan, plus any premium payments received for lending certain types of securities. Security lending income is presented in the Statement of Operations as a component of income from Fidelity Central Funds. Total security lending income during the period amounted to $76,377. During the period, there were no securities loaned to FCM.
8. Expense Reductions.
Many of the brokers with whom FMR places trades on behalf of the Fund provided services to the Fund in addition to trade execution. These services included payments of certain expenses on behalf of the Fund totaling $111,304 for the period.
9. Distributions to Shareholders.
Distributions to shareholders of each class were as follows:
Years ended October 31, | 2012 | 2011 |
From net investment income | | |
Class A | $ 1,898,062 | $ 1,195,236 |
Class T | 399,045 | 238,089 |
Class C | 179,759 | 129,641 |
Institutional Class | 693,936 | 411,224 |
Total | $ 3,170,802 | $ 1,974,190 |
From net realized gain | | |
Class A | $ 7,604,616 | $ 10,575,420 |
Class T | 2,417,855 | 3,522,540 |
Class B | 945,064 | 1,697,909 |
Class C | 3,624,620 | 5,318,244 |
Institutional Class | 2,051,782 | 2,577,289 |
Total | $ 16,643,937 | $ 23,691,402 |
Annual Report
Notes to Financial Statements - continued
10. Share Transactions.
Transactions for each class of shares were as follows:
| Shares | Dollars |
Years ended October 31, | 2012 | 2011 | 2012 | 2011 |
Class A | | | | |
Shares sold | 989,897 | 2,202,556 | $ 27,425,901 | $ 71,049,522 |
Reinvestment of distributions | 303,306 | 309,654 | 8,125,561 | 9,819,123 |
Shares redeemed | (1,983,648) | (2,005,332) | (54,478,732) | (62,867,653) |
Net increase (decrease) | (690,445) | 506,878 | $ (18,927,270) | $ 18,000,992 |
Class T | | | | |
Shares sold | 243,741 | 487,526 | $ 6,578,292 | $ 15,326,473 |
Reinvestment of distributions | 105,156 | 118,542 | 2,751,935 | 3,673,606 |
Shares redeemed | (575,900) | (538,208) | (15,451,183) | (16,492,902) |
Net increase (decrease) | (227,003) | 67,860 | $ (6,120,956) | $ 2,507,177 |
Class B | | | | |
Shares sold | 12,950 | 65,556 | $ 335,990 | $ 2,016,841 |
Reinvestment of distributions | 30,756 | 44,891 | 769,523 | 1,329,672 |
Shares redeemed | (235,196) | (291,995) | (6,006,764) | (8,641,379) |
Net increase (decrease) | (191,490) | (181,548) | $ (4,901,251) | $ (5,294,866) |
Class C | | | | |
Shares sold | 321,798 | 976,733 | $ 8,176,407 | $ 29,282,683 |
Reinvestment of distributions | 125,179 | 152,906 | 3,103,186 | 4,496,965 |
Shares redeemed | (903,872) | (992,268) | (22,892,814) | (28,874,366) |
Net increase (decrease) | (456,895) | 137,371 | $ (11,613,221) | $ 4,905,282 |
Institutional Class | | | | |
Shares sold | 751,216 | 1,196,148 | $ 21,500,312 | $ 38,645,718 |
Reinvestment of distributions | 64,226 | 57,110 | 1,763,657 | 1,854,949 |
Shares redeemed | (1,158,394) | (893,992) | (32,275,682) | (28,329,397) |
Net increase (decrease) | (342,952) | 359,266 | $ (9,011,713) | $ 12,171,270 |
11. Other.
The Fund's organizational documents provide former and current trustees and officers with a limited indemnification against liabilities arising in connection with the performance of their duties to the Fund. In the normal course of business, the Fund may also enter into contracts that provide general indemnifications. The Fund's maximum exposure under these arrangements is unknown as this would be dependent on future claims that may be made against the Fund. The risk of material loss from such claims is considered remote.
Annual Report
To the Trustees of Fidelity Advisor Series VIII and the Shareholders of Fidelity Advisor Emerging Asia Fund:
In our opinion, the accompanying statement of assets and liabilities, including the schedule of investments, and the related statements of operations and of changes in net assets and the financial highlights present fairly, in all material respects, the financial position of Fidelity Advisor Emerging Asia Fund (a fund of Fidelity Advisor Series VIII) at October 31, 2012, the results of its operations for the year then ended, the changes in its net assets for each of the two years in the period then ended and the financial highlights for each of the five years in the period then ended, in conformity with accounting principles generally accepted in the United States of America. These financial statements and financial highlights (hereafter referred to as "financial statements") are the responsibility of the Fidelity Advisor Emerging Asia Fund's management. Our responsibility is to express an opinion on these financial statements based on our audits. We conducted our audits of these financial statements in accordance with the standards of the Public Company Accounting Oversight Board (United States). Those standards require that we plan and perform the audit to obtain reasonable assurance about whether the financial statements are free of material misstatement. An audit includes examining, on a test basis, evidence supporting the amounts and disclosures in the financial statements, assessing the accounting principles used and significant estimates made by management, and evaluating the overall financial statement presentation. We believe that our audits, which included confirmation of securities at October 31, 2012 by correspondence with the custodian and brokers, provide a reasonable basis for our opinion.
PricewaterhouseCoopers LLP
Boston, Massachusetts
December 14, 2012
Annual Report
The Trustees, Members of the Advisory Board, and executive officers of the trust and fund, as applicable, are listed below. The Board of Trustees governs the fund and is responsible for protecting the interests of shareholders. The Trustees are experienced executives who meet periodically throughout the year to oversee the fund's activities, review contractual arrangements with companies that provide services to the fund, oversee management of the risks associated with such activities and contractual arrangements, and review the fund's performance. Except for James C. Curvey, each of the Trustees oversees 236 funds advised by FMR or an affiliate. Mr. Curvey oversees 443 funds advised by FMR or an affiliate.
The Trustees hold office without limit in time except that (a) any Trustee may resign; (b) any Trustee may be removed by written instrument, signed by at least two-thirds of the number of Trustees prior to such removal; (c) any Trustee who requests to be retired or who has become incapacitated by illness or injury may be retired by written instrument signed by a majority of the other Trustees; and (d) any Trustee may be removed at any special meeting of shareholders by a two-thirds vote of the outstanding voting securities of the trust. Each Trustee who is not an interested person (as defined in the 1940 Act) (Independent Trustee), shall retire not later than the last day of the calendar year in which his or her 75th birthday occurs. The Independent Trustees may waive this mandatory retirement age policy with respect to individual Trustees. The executive officers and Advisory Board Members hold office without limit in time, except that any officer and Advisory Board Member may resign or may be removed by a vote of a majority of the Trustees at any regular meeting or any special meeting of the Trustees. Except as indicated, each individual has held the office shown or other offices in the same company for the past five years.
Experience, Skills, Attributes, and Qualifications of the Fund's Trustees. The Governance and Nominating Committee has adopted a statement of policy that describes the experience, qualifications, attributes, and skills that are necessary and desirable for potential Independent Trustee candidates (Statement of Policy). The Board believes that each Trustee satisfied at the time he or she was initially elected or appointed a Trustee, and continues to satisfy, the standards contemplated by the Statement of Policy. The Governance and Nominating Committee also engages professional search firms to help identify potential Independent Trustee candidates who have the experience, qualifications, attributes, and skills consistent with the Statement of Policy. From time to time, additional criteria based on the composition and skills of the current Independent Trustees, as well as experience or skills that may be appropriate in light of future changes to board composition, business conditions, and regulatory or other developments, have also been considered by the professional search firms and the Governance and Nominating Committee. In addition, the Board takes into account the Trustees' commitment and participation in Board and committee meetings, as well as their leadership of standing and ad hoc committees throughout their tenure.
In determining that a particular Trustee was and continues to be qualified to serve as a Trustee, the Board has considered a variety of criteria, none of which, in isolation, was controlling. The Board believes that, collectively, the Trustees have balanced and diverse experience, qualifications, attributes, and skills, which allow the Board to operate effectively in governing the fund and protecting the interests of shareholders. Information about the specific experience, skills, attributes, and qualifications of each Trustee, which in each case led to the Board's conclusion that the Trustee should serve (or continue to serve) as a trustee of the fund, is provided below.
Annual Report
Board Structure and Oversight Function. James C. Curvey is an interested person (as defined in the 1940 Act) and currently serves as Chairman. The Trustees have determined that an interested Chairman is appropriate and benefits shareholders because an interested Chairman has a personal and professional stake in the quality and continuity of services provided to the fund. Independent Trustees exercise their informed business judgment to appoint an individual of their choosing to serve as Chairman, regardless of whether the Trustee happens to be independent or a member of management. The Independent Trustees have determined that they can act independently and effectively without having an Independent Trustee serve as Chairman and that a key structural component for assuring that they are in a position to do so is for the Independent Trustees to constitute a substantial majority for the Board. The Independent Trustees also regularly meet in executive session. Ned C. Lautenbach serves as Chairman of the Independent Trustees and as such (i) acts as a liaison between the Independent Trustees and management with respect to matters important to the Independent Trustees and (ii) with management prepares agendas for Board meetings.
Fidelity funds are overseen by different Boards of Trustees. The fund's Board oversees Fidelity's equity and high income funds and another Board oversees Fidelity's investment-grade bond, money market, and asset allocation funds. The asset allocation funds may invest in Fidelity funds overseen by the fund's Board. The use of separate Boards, each with its own committee structure, allows the Trustees of each group of Fidelity funds to focus on the unique issues of the funds they oversee, including common research, investment, and operational issues. On occasion, the separate Boards establish joint committees to address issues of overlapping consequences for the Fidelity funds overseen by each Board.
The Trustees operate using a system of committees to facilitate the timely and efficient consideration of all matters of importance to the Trustees, the fund, and fund shareholders and to facilitate compliance with legal and regulatory requirements and oversight of the fund's activities and associated risks. The Board, acting through its committees, has charged FMR and its affiliates with (i) identifying events or circumstances the occurrence of which could have demonstrably adverse effects on the fund's business and/or reputation; (ii) implementing processes and controls to lessen the possibility that such events or circumstances occur or to mitigate the effects of such events or circumstances if they do occur; and (iii) creating and maintaining a system designed to evaluate continuously business and market conditions in order to facilitate the identification and implementation processes described in (i) and (ii) above. Because the day-to-day operations and activities of the fund's are carried out by or through FMR, its affiliates and other service providers, the fund's exposure to risks is mitigated but not eliminated by the processes overseen by the Trustees. While each of the Board's committees has responsibility for overseeing different aspects of the fund's activities, oversight is exercised primarily through the Operations, Audit, and Compliance Committees. In addition, the Independent Trustees have worked with FMR to enhance the Board's oversight of investment and financial risks, legal and regulatory risks, technology risks, and operational risks, including the development of additional risk reporting to the Board. For example, a working group comprised of Independent Trustees and FMR has worked and continues to work to review the Fidelity funds' valuation-related activities, reporting and risk management. Appropriate personnel, including but not limited to the fund's Chief Compliance Officer (CCO), FMR's internal auditor, the independent accountants, the fund's Treasurer and portfolio management personnel, make periodic reports to the Board's committees, as appropriate, including an annual review of FMR's risk management program for the Fidelity funds. The responsibilities of each standing committee, including their oversight responsibilities, are described further under "Standing Committees of the Fund's Trustees."
Annual Report
Trustees and Officers - continued
The fund's Statement of Additional Information (SAI) includes more information about the Trustees. To request a free copy, call Fidelity at 1-877-208-0098.
Interested Trustees*:
Correspondence intended for each Trustee who is an interested person may be sent to Fidelity Investments, 82 Devonshire Street, Boston, Massachusetts 02109.
Name, Age; Principal Occupations and Other Relevant Experience+ |
James C. Curvey (77) |
| Year of Election or Appointment: 2007 Mr. Curvey is Trustee and Chairman of the Board of Trustees of certain Trusts. Mr. Curvey also serves as Trustee (2007-present) of other investment companies advised by FMR. Mr. Curvey is a Director of Fidelity Investments Money Management, Inc. (2009-present), Director of Fidelity Research & Analysis Co. (2009-present) and Director of FMR and FMR Co., Inc. (2007-present). Mr. Curvey is also Vice Chairman (2007-present) and Director of FMR LLC. In addition, Mr. Curvey serves as an Overseer for the Boston Symphony Orchestra and a member of the Trustees of Villanova University. Previously, Mr. Curvey was the Vice Chairman (2006-2007) and Director (2000-2007) of FMR Corp. |
Ronald P. O'Hanley (55) |
| Year of Election or Appointment: 2011 Mr. O'Hanley is Director of FMR Co., Inc. (2010-present), Director of Fidelity Investments Money Management, Inc. (2010-present), Director of Fidelity Research & Analysis Company (2010-present), President of Fidelity Asset Management and Corporate Services and a member of Fidelity's Executive Committee (2010-present). Previously, Mr. O'Hanley served as President and Chief Executive Officer of BNY Mellon Asset Management (2007-2010). Mr. O'Hanley also served as Vice Chairman of Bank New York Mellon Corp. and a member of that firm's Executive Committee. Prior to the 2007 merger of The Bank of New York and Mellon Financial Corporation, he was Vice Chairman of Mellon Financial Corporation and President and Chief Executive Officer of Mellon Asset Management. He joined Mellon in February 1997. Mr. O'Hanley currently serves as Chairman of the Boston Public Library Foundation Board of Directors and sits on the Board of Directors of Beth Israel Deaconess Medical Center, the Board of Trustees of the Marine Biological Laboratory and the Advisory Board of the Maxwell School of Citizenship and Public Administration at Syracuse University. Mr. O'Hanley also chairs the Council on Asset Management for the Financial Services Roundtable and is a member of the Board of Directors of Institutional Investor's U.S. Institute. |
* Trustees have been determined to be "Interested Trustees" by virtue of, among other things, their affiliation with the trust or various entities under common control with FMR.
+ The information above includes each Trustee's principal occupation during the last five years and other information relating to the experience, attributes, and skills relevant to each Trustee's qualifications to serve as a Trustee, which led to the conclusion that each Trustee should serve as a Trustee for the fund.
Annual Report
Trustees and Officers - continued
Independent Trustees:
Correspondence intended for each Independent Trustee (that is, the Trustees other than the Interested Trustees) may be sent to Fidelity Investments, P.O. Box 55235, Boston, Massachusetts 02205-5235.
Name, Age; Principal Occupations and Other Relevant Experience+ |
Dennis J. Dirks (64) |
| Year of Election or Appointment: 2005 Prior to his retirement in May 2003, Mr. Dirks was Chief Operating Officer and a member of the Board of The Depository Trust & Clearing Corporation (DTCC). He also served as President, Chief Operating Officer, and Board member of The Depository Trust Company (DTC) and President and Board member of the National Securities Clearing Corporation (NSCC). In addition, Mr. Dirks served as Chief Executive Officer and Board member of the Government Securities Clearing Corporation, Chief Executive Officer and Board member of the Mortgage-Backed Securities Clearing Corporation, as a Trustee and a member of the Finance Committee of Manhattan College (2005-2008), and as a Trustee and a member of the Finance Committee of AHRC of Nassau County (2006-2008). Mr. Dirks is a member of the Independent Directors Council (IDC) Governing Council (2010-present) and Board of Directors for The Brookville Center for Children's Services, Inc. (2009-present). |
Alan J. Lacy (59) |
| Year of Election or Appointment: 2008 Mr. Lacy serves as Senior Adviser (2007-present) of Oak Hill Capital Partners, L.P. (private equity). Mr. Lacy also served as Chief Executive Officer (2000-2005) and Vice Chairman (2005-2006) of Sears Holdings Corporation and Sears, Roebuck and Co. (retail). In addition, Mr. Lacy serves as a member of the Board of Directors of Dave & Buster's Entertainment, Inc. (restaurant and entertainment complexes, 2010-present), Earth Fare, Inc. (retail grocery, 2012-present), The Hillman Companies, Inc. (hardware wholesalers, 2010-present), and Bristol-Myers Squibb Company (global pharmaceuticals, 2008-present). Mr. Lacy is a member of the Board of Trustees of The National Parks Conservation Association (2006-present). Previously, Mr. Lacy served as Chairman of the Board of Trustees of the National Parks Conservation Association (2008-2011) and as a member of the Board of Directors for the Western Union Company (global money transfer, 2006-2011). |
Ned C. Lautenbach (68) |
| Year of Election or Appointment: 2000 Mr. Lautenbach is Chairman of the Independent Trustees of the Equity and High Income Funds (2006-present). Mr. Lautenbach currently serves as the Lead Director of the Eaton Corporation Board of Directors (diversified industrial, 1997-present). Mr. Lautenbach is Chairman of the Board of Directors of the Philharmonic Center for the Arts in Naples, Florida (2012-present) and a member of the Council on Foreign Relations (1994-present). Previously, Mr. Lautenbach was a Partner/Advisory Partner at Clayton, Dubilier & Rice, LLC (private equity investment, 1998-2010), as well as a Director of Sony Corporation (2006-2007). |
Joseph Mauriello (68) |
| Year of Election or Appointment: 2008 Prior to his retirement in January 2006, Mr. Mauriello served in numerous senior management positions including Deputy Chairman and Chief Operating Officer (2004-2005), and Vice Chairman of Financial Services (2002-2004) of KPMG LLP US (professional services, 1965-2005). Mr. Mauriello currently serves as a member of the Board of Directors of XL Group plc. (global insurance and re-insurance, 2006-present). Previously, Mr. Mauriello served as a Director of the Hamilton Funds of the Bank of New York (2006-2007) and of Arcadia Resources Inc. (health care services and products, 2007-2012). |
Robert W. Selander (62) |
| Year of Election or Appointment: 2011 Previously, Mr. Selander served as a Member of the Advisory Board of Fidelity's Equity and High Income Funds (2011), Executive Vice Chairman (2010), Chief Executive Officer (2009-2010), and President and Chief Executive Officer (1997-2009) of Mastercard, Inc. |
Cornelia M. Small (68) |
| Year of Election or Appointment: 2005 Ms. Small is a member of the Board of Directors (2009-present) and Chair of the Investment Committee (2010-present) of the Teagle Foundation. Ms. Small also serves on the Investment Committee of the Berkshire Taconic Community Foundation (2008-present). Previously, Ms. Small served as Chairperson (2002-2008) and a member of the Investment Committee and Chairperson (2008-2012) and a member of the Board of Trustees of Smith College. In addition, Ms. Small served as Chief Investment Officer, Director of Global Equity Investments, and a member of the Board of Directors of Scudder, Stevens & Clark and Scudder Kemper Investments. |
William S. Stavropoulos (73) |
| Year of Election or Appointment: 2001 Mr. Stavropoulos is Vice Chairman of the Independent Trustees of the Equity and High Income Funds (2006-present). Mr. Stavropoulos serves as President and Founder of the Michigan Baseball Foundation, the Great Lakes Loons (2007-present). Mr. Stavropoulos is Chairman Emeritus of the Board of Directors of The Dow Chemical Company, where he previously served in numerous senior management positions, including President, CEO (1995-2000; 2002-2004), Chairman of the Executive Committee (2000-2006), and as a member of the Board of Directors (1990-2006). Currently, Mr. Stavropoulos is a Director of Univar Inc. (global distributor of commodity and specialty chemicals, Chairman from 2010-May 2012 and Lead Director from May 2012-present), Teradata Corporation (data warehousing and technology solutions, 2008-present), Maersk Inc. (industrial conglomerate), and Tyco International, Ltd. (multinational manufacturing and services, 2007-present), and a member of the Advisory Board for Metalmark Capital LLC (private equity investment, 2005-present). Mr. Stavropoulos is an operating advisor to Clayton, Dubilier & Rice, LLC (private equity investment). In addition, Mr. Stavropoulos is a member of the University of Notre Dame Advisory Council for the College of Science, a Trustee of the Rollin L. Gerstacker Foundation, and a Director of the Naples Philharmonic Center for the Arts. Previously, Mr. Stavropoulos served as a Director of Chemical Financial Corporation (bank holding company, 1993-2012). |
David M. Thomas (63) |
| Year of Election or Appointment: 2008 Previously, Mr. Thomas served as Executive Chairman (2005-2006) and Chairman and Chief Executive Officer (2000-2005) of IMS Health, Inc. (pharmaceutical and healthcare information solutions), and a Director of Fortune Brands, Inc. (consumer products, 2000-2011). In addition, Mr. Thomas serves as Non-Executive Chairman of the Board of Directors of Fortune Brands Home and Security (home and security products, 2011-present), and as a member of the Board of Directors of Interpublic Group of Companies, Inc. (marketing communication, 2004-present). |
Michael E. Wiley (62) |
| Year of Election or Appointment: 2008 Mr. Wiley also serves as a Director of Asia Pacific Exploration Consolidated (international oil and gas exploration and production, 2008-present). Mr. Wiley serves as a Director of Tesoro Corporation (independent oil refiner and marketer, 2005-present), and a Director of Bill Barrett Corporation (exploration and production, 2005-present). In addition, Mr. Wiley also serves as a Director of Post Oak Bank (privately-held bank, 2004-present). Previously, Mr. Wiley served as a member of the Board of Trustees of the University of Tulsa (2000-2006; 2007-2010), as a Senior Energy Advisor of Katzenbach Partners, LLC (consulting, 2006-2007), as an Advisory Director of Riverstone Holdings (private investment), Chairman, President, and CEO of Baker Hughes, Inc. (oilfield services, 2000-2004), and as Director of Spinnaker Exploration Company (exploration and production, 2001-2005). |
+ The information above includes each Trustee's principal occupation during the last five years and other information relating to the experience, attributes, and skills relevant to each Trustee's qualifications to serve as a Trustee, which led to the conclusion that each Trustee should serve as a Trustee for the fund.
Advisory Board Members and Executive Officers:
Correspondence intended for David A. Rosow and Garnett A. Smith may be sent to Fidelity Investments, P.O. Box 55235, Boston, Massachusetts 02205-5235. Correspondence intended for each executive officer, Edward C. Johnson 3d, and Peter S. Lynch may be sent to Fidelity Investments, 82 Devonshire Street, Boston, Massachusetts 02109.
Name, Age; Principal Occupation |
Edward C. Johnson 3d (82) |
| Year of Election or Appointment: 2011 Member of the Advisory Board of Fidelity's Equity and High Income Funds. Mr. Johnson serves as Chief Executive Officer, Chairman, and a Director of FMR LLC, and also serves as Chairman and Director of FIL Limited. Previously, Mr. Johnson served as a Trustee and Chairman of the Board of certain Fidelity Trusts, Chairman and a Director of FMR, Chairman and a Director of FMR Co., Inc., and President of FMR LLC (2006-2007). |
Peter S. Lynch (68) |
| Year of Election or Appointment: 2003 Member of the Advisory Board of Fidelity's Equity and High Income Funds. Mr. Lynch is Vice Chairman and a Director of FMR and FMR Co., Inc. In addition, Mr. Lynch serves as a Trustee of Boston College and as the Chairman of the Inner-City Scholarship Fund. Previously, Mr. Lynch served on the Special Olympics International Board of Directors (1997-2006). |
David A. Rosow (70) |
| Year of Election or Appointment: 2012 Member of the Advisory Board of Fidelity's Equity and High Income Funds. Chairman and Chief Executive Officer of International Golf Group, Inc. (golf course development, 1989-present). Previously, Mr. Rosow served as Chairman and Chief Executive Officer of Rosow & Company, Inc. (private investment company, 1989-2011), a Lead Director of Hudson United Bancorp (2001-2006) and as a Director of TD Banknorth (1996-2006). In addition, Mr. Rosow is a member (2008-present) and President (2009-present) of the Town Council of Palm Beach, Florida. |
Garnett A. Smith (65) |
| Year of Election or Appointment: 2012 Member of the Advisory Board of Fidelity's Equity and High Income Funds. Prior to Mr. Smith's retirement, he served as Chairman and Chief Executive Officer of Inbrand Corp. (manufacturer of personal absorbent products, 1990-1997). He also served as President (1986-1990) of Inbrand Corp. Prior to his employment with Inbrand Corp., he was employed by a retail fabric chain and North Carolina National Bank. In addition, Mr. Smith is a board member of the Jackson Hole Land Trust (2009-present). |
Kenneth B. Robins (43) |
| Year of Election or Appointment: 2008 President and Treasurer of Fidelity's Equity and High Income Funds. Mr. Robins also serves as President and Treasurer (2010-present) and Assistant Treasurer (2009-present) of other Fidelity funds and is an employee of Fidelity Investments (2004-present). Previously, Mr. Robins served as Deputy Treasurer of the Fidelity funds (2005-2008) and Treasurer and Chief Financial Officer of The North Carolina Capital Management Trust: Cash and Term Portfolios (2006-2008). |
Bruce T. Herring (47) |
| Year of Election or Appointment: 2006 Vice President of certain Equity Funds. Mr. Herring also serves as President of Fidelity Research & Analysis Company (2010-present), Chief Investment Officer and Director of Fidelity Management & Research (U.K.) Inc. (2010-present) and Group Chief Investment Officer of FMR. Previously, Mr. Herring served as Vice President (2005-2006) and Senior Vice President (2006-2007) of Fidelity Management & Research Company, Vice President of FMR Co., Inc. (2001-2007) and as a portfolio manager for Fidelity U.S. Equity Funds. |
Brian B. Hogan (48) |
| Year of Election or Appointment: 2009 Vice President of Equity and High Income Funds. Mr. Hogan also serves as President of FMR's Equity Division (2009-present). Previously, Mr. Hogan served as Senior Vice President, Equity Research of FMR (2006-2009) and as a portfolio manager. |
Scott C. Goebel (44) |
| Year of Election or Appointment: 2008 Secretary and Chief Legal Officer (CLO) of the Fidelity funds. Mr. Goebel also serves as Secretary of Fidelity Investments Money Management, Inc. (FIMM) (2010-present) and Fidelity Research and Analysis Company (FRAC) (2010-present); Secretary and CLO of The North Carolina Capital Management Trust: Cash and Term Portfolios (2008-present); General Counsel, Secretary, and Senior Vice President of FMR (2008-present) and FMR Co., Inc. (2008-present); employed by FMR LLC or an affiliate (2001-present); Chief Legal Officer of Fidelity Management & Research (Hong Kong) Limited (2008-present) and Assistant Secretary of Fidelity Management & Research (Japan) Inc. (2008-present), and Fidelity Management & Research (U.K.) Inc. (2008-present). Previously, Mr. Goebel served as Assistant Secretary of FIMM (2008-2010), FRAC (2008-2010), and the Funds (2007-2008) and as Vice President and Secretary of Fidelity Distributors Corporation (FDC) (2005-2007). |
William C. Coffey (43) |
| Year of Election or Appointment: 2009 Assistant Secretary of Fidelity's Equity and High Income Funds. Mr. Coffey also serves as Senior Vice President and Deputy General Counsel of FMR LLC (2010-present), and is an employee of Fidelity Investments. Previously, Mr. Coffey served as Vice President and Associate General Counsel of FMR LLC (2005-2009). |
Elizabeth Paige Baumann (44) |
| Year of Election or Appointment: 2012 Anti-Money Laundering (AML) Officer of the Fidelity funds. Ms. Baumann also serves as AML Officer of The North Carolina Capital Management Trust: Cash and Term Portfolios (2012-present), Chief AML Officer of FMR LLC (2012-present), and is an employee of Fidelity Investments. Previously, Ms. Baumann served as Vice President and Deputy Anti-Money Laundering Officer (2007-2012). |
Christine Reynolds (54) |
| Year of Election or Appointment: 2008 Chief Financial Officer of the Fidelity funds. Ms. Reynolds became President of Fidelity Pricing and Cash Management Services (FPCMS) in August 2008. Ms. Reynolds served as Chief Operating Officer of FPCMS (2007-2008). Previously, Ms. Reynolds served as President, Treasurer, and Anti-Money Laundering officer of the Fidelity funds (2004-2007). |
Joseph A. Hanlon (44) |
| Year of Election or Appointment: 2012 Chief Compliance Officer of Fidelity's Equity and High Income Funds. Mr. Hanlon serves as Compliance Officer of FMR, FMR Co., Inc., Fidelity Investments Money Management, Inc. (FIMM), Fidelity Research and Analysis Company (FRAC), Fidelity Management & Research (Japan) Inc., Fidelity Management & Research (U.K.) Inc., Fidelity Management & Research (Hong Kong), and Strategic Advisers, Inc. (2009-present), as Senior Vice President of the Fidelity Asset Management Division (2009-present), and is an employee of Fidelity Investments. |
Joseph F. Zambello (55) |
| Year of Election or Appointment: 2011 Deputy Treasurer of the Fidelity funds. Mr. Zambello is an employee of Fidelity Investments. Previously, Mr. Zambello served as Vice President of FMR's Program Management Group (2009-2011) and Vice President of the Transfer Agent Oversight Group (2005-2009). |
Adrien E. Deberghes (45) |
| Year of Election or Appointment: 2008 Deputy Treasurer of Fidelity's Equity and High Income Funds. Mr. Deberghes also serves as Vice President (2011-present) and Assistant Treasurer (2010-present) of other Fidelity funds, and is an employee of Fidelity Investments (2008-present). Previously, Mr. Deberghes served as Senior Vice President of Mutual Fund Administration at State Street Corporation (2007-2008), Senior Director of Mutual Fund Administration at Investors Bank & Trust (2005-2007), and Director of Finance for Dunkin' Brands (2000-2005). |
Stephen Sadoski (41) |
| Year of Election or Appointment: 2012 Deputy Treasurer of Fidelity's Equity and High Income Funds. Mr. Sadoski also serves as Assistant Treasurer of other Fidelity funds (2012-present) and is an employee of Fidelity Investments (2012-present). Previously, Mr. Sadoski served as an assistant chief accountant in the Division of Investment Management of the Securities and Exchange Commission (SEC) (2009-2012) and as a senior manager at Deloitte & Touche (1997-2009). |
Stephanie J. Dorsey (43) |
| Year of Election or Appointment: 2010 Assistant Treasurer of Fidelity's Equity and High Income Funds. Ms. Dorsey also serves as Deputy Treasurer of other Fidelity funds (2008-present) and is an employee of Fidelity Investments (2008-present). Previously, Ms. Dorsey served as Treasurer (2004-2008) of the JPMorgan Mutual Funds and Vice President (2004-2008) of JPMorgan Chase Bank. |
John R. Hebble (54) |
| Year of Election or Appointment: 2009 Assistant Treasurer of Fidelity's Equity and High Income Funds. Mr. Hebble also serves as President (2011-present), Treasurer, and Chief Financial Officer of The North Carolina Capital Management Trust: Cash and Term Portfolios (2008-present), President and Treasurer of other Fidelity funds (2008-present) and is an employee of Fidelity Investments. |
Gary W. Ryan (54) |
| Year of Election or Appointment: 2005 Assistant Treasurer of the Fidelity funds. Mr. Ryan is an employee of Fidelity Investments. Previously, Mr. Ryan served as Vice President of Fund Reporting in Fidelity Pricing and Cash Management Services (FPCMS) (1999-2005). |
Jonathan Davis (44) |
| Year of Election or Appointment: 2010 Assistant Treasurer of the Fidelity funds. Mr. Davis is also Assistant Treasurer of Fidelity Rutland Square Trust II and Fidelity Commonwealth Trust II. Mr. Davis is an employee of Fidelity Investments. Previously, Mr. Davis served as Vice President and Associate General Counsel of FMR LLC (2003-2010). |
Annual Report
The Board of Trustees of Advisor Emerging Asia Fund voted to pay to shareholders of record at the opening of business on record date, the following distributions per share derived from capital gains realized from sales of portfolio securities, and dividends derived from net investment income:
| Pay Date | Record Date | Dividends | Capital Gains |
Class A | 12/10/12 | 12/07/12 | $0.329 | $0.092 |
Class T | 12/10/12 | 12/07/12 | $0.245 | $0.092 |
Class B | 12/10/12 | 12/07/12 | $0.091 | $0.092 |
Class C | 12/10/12 | 12/07/12 | $0.121 | $0.092 |
Class A designates 100%, Class T designates 100%, and Class C designates 100% of the dividends distributed during the fiscal year as amounts which may be taken into account as a dividend for purposes of the maximum rate under section 1(h)(11) of the Internal Revenue Code.
The amounts per share which represent income derived from sources within, and taxes paid to, foreign countries or possessions of the United States are as follows:
| Pay Date | Income | Taxes |
Class A | 12/05/11 | $0.406 | $0.0994 |
Class T | 12/05/11 | $0.302 | $0.0994 |
Class B | 12/05/11 | $0.000 | $0.0000 |
Class C | 12/05/11 | $0.160 | $0.0994 |
The fund will notify shareholders in January 2013 of amounts for use in preparing 2012 income tax returns.
Annual Report
Board Approval of Investment Advisory Contracts and Management Fees
Fidelity Advisor Emerging Asia Fund
Each year, the Board of Trustees, including the Independent Trustees (together, the Board), votes on the renewal of the management contract and sub-advisory agreements (together, the Advisory Contracts) for the fund. The Board, assisted by the advice of fund counsel and Independent Trustees' counsel, requests and considers a broad range of information relevant to the renewal of the Advisory Contracts throughout the year.
The Board meets regularly and, at each of its meetings, considers factors that are relevant to its annual consideration of the renewal of the fund's Advisory Contracts, including the services and support provided to the fund and its shareholders. The Board has established various standing committees, each composed of and chaired by Independent Trustees with varying backgrounds, to which the Board has assigned specific subject matter responsibilities in order to enhance effective decision-making by the Board. The Board, acting directly and through its Committees, requests and receives information concerning the annual consideration of the renewal of the fund's Advisory Contracts. The Board also meets as needed to consider matters specifically related to the Board's annual consideration of the renewal of Advisory Contracts. Members of the Board may also meet with trustees of other Fidelity funds through ad hoc joint committees to discuss certain matters relevant to the Fidelity funds.
At its July 2012 meeting, the Board of Trustees, including the Independent Trustees, unanimously determined to renew the fund's Advisory Contracts. In reaching its determination, the Board considered all factors it believed relevant, including (i) the nature, extent, and quality of the services to be provided to the fund and its shareholders (including the investment performance of the fund); (ii) the competitiveness of the fund's management fee and total expense ratio relative to peer funds; (iii) the total costs of the services to be provided by and the profits to be realized by Fidelity from its relationship with the fund; (iv) the extent to which economies of scale exist and would be realized as the fund grows; and (v) whether fee levels reflect these economies of scale, if any, for the benefit of fund shareholders.
In considering whether to renew the Advisory Contracts for the fund, the Board reached a determination, with the assistance of fund counsel and Independent Trustees' counsel and through the exercise of its business judgment, that the renewal of the Advisory Contracts is in the best interests of the fund and its shareholders and that the compensation payable under the Advisory Contracts is fair and reasonable. The Board's decision to renew the Advisory Contracts was not based on any single factor, but rather was based on a comprehensive consideration of all the information provided to the Board at its meetings throughout the year. The Board, in reaching its determination to renew the Advisory Contracts, is aware that shareholders in the fund have a broad range of investment choices available to them, including a wide choice among mutual funds offered by Fidelity's competitors, and that the fund's shareholders, who have the opportunity to review and weigh the disclosure provided by the fund in its prospectus and other public disclosures, have chosen to invest in this fund, managed by Fidelity.
Annual Report
Board Approval of Investment Advisory Contracts and
Management Fees - continued
Nature, Extent, and Quality of Services Provided. The Board considered the staffing within the investment adviser, FMR, and the sub-advisers (together, the Investment Advisers), including the backgrounds of the fund's investment personnel, and also considered the fund's investment objective, strategies, and related investment philosophy. The Independent Trustees also had discussions with senior management of Fidelity's investment operations and investment groups. The Board considered the structure of the portfolio manager compensation program and whether this structure provides appropriate incentives to act in the best interests of the fund.
Resources Dedicated to Investment Management and Support Services. The Board and the Fund Oversight and Research Committees reviewed the general qualifications and capabilities of the Investment Advisers' investment staff, including its size, education, experience, and resources, as well as the Investment Advisers' approach to recruiting, training, managing, and compensating investment personnel. The Board also noted that FMR has continued to increase the resources devoted to non-U.S. offices, including expansion of Fidelity's global investment organization. The Board noted that Fidelity's analysts have extensive resources, tools and capabilities that allow them to conduct sophisticated quantitative and fundamental analysis, as well as credit analysis of issuers, counterparties and guarantors. The Board also believes that Fidelity's investment professionals have sufficient access to global information and data so as to provide competitive investment results over time, and that those professionals also have access to sophisticated tools that permit them to assess portfolio construction and risk and performance attribution characteristics continuously, as well as to transmit new information and research conclusions rapidly around the world. Additionally, in its deliberations, the Board considered the Investment Advisers' trading and risk management capabilities and resources, which are an integral part of the investment management process.
Shareholder and Administrative Services. The Board considered (i) the nature, extent, quality, and cost of advisory, administrative, and shareholder services performed by the Investment Advisers and their affiliates under the Advisory Contracts and under separate agreements covering transfer agency, pricing and bookkeeping, and securities lending services for the fund; (ii) the nature and extent of the supervision of third party service providers, principally custodians and subcustodians; and (iii) the resources devoted to, and the record of compliance with, the fund's compliance policies and procedures. The Board also reviewed the allocation of fund brokerage, including allocations to brokers affiliated with the Investment Advisers, the use of brokerage commissions to pay fund expenses, and the use of "soft" commission dollars to pay for research services.
Annual Report
The Board noted that the growth of fund assets over time across the complex allows Fidelity to reinvest in the development of services designed to enhance the value or convenience of the Fidelity funds as investment vehicles. These services include 24-hour access to account information and market information through telephone representatives and over the Internet, investor education materials and asset allocation tools, and the expanded availability of Fidelity Investor Centers.
Investment in a Large Fund Family. The Board considered the benefits to shareholders of investing in a Fidelity fund, including the benefits of investing in a fund that is part of a large family of funds offering a variety of investment disciplines and providing a large variety of mutual fund investor services. The Board noted that Fidelity had taken, or had made recommendations that resulted in the Fidelity funds taking, a number of actions over the previous year that benefited particular funds, including (i) continuing to dedicate additional resources to investment research and support of the senior management team that oversees asset management; (ii) persisting in efforts to enhance Fidelity's research capabilities, in particular, international research; (iii) launching new funds and making other enhancements to meet client needs for global and income-oriented solutions; (iv) continuing to launch dedicated lower cost underlying funds to meet investment management's portfolio construction needs related to expanding underlying fund options, specifically for the Freedom Fund product lines; (v) adopting a "Stock Selector" sector neutral investment approach and employing a team of portfolio managers who are sector specialists to manage certain funds; (vi) rationalizing product lines and gaining increased efficiencies through the mergers of several funds into other funds; (vii) strengthening the Spartan Index Fund product line by adding new funds and/or new low-cost institutional share classes, restructuring fund expenses to accommodate new classes, and reducing investment minimums for certain classes of shares; (viii) modifying the eligibility criteria for Institutional Class shares to increase their appeal to government entities and charitable investors; and (ix) reducing certain transfer agent fee rates.
Investment Performance. The Board considered whether the fund has operated in accordance with its investment objective, as well as its record of compliance with its investment restrictions. It also reviewed the fund's absolute investment performance for each class, as well as the fund's relative investment performance for each class measured over multiple periods against a broad-based securities market index. The Board noted that FMR believes that no meaningful peer group exists for the fund principally because most other funds in the fund's third-party peer group have different and/or broader investment mandates than the fund's more specialized strategies. The following charts considered by the Board show, over the one-, three-, and five-year periods ended December 31, 2011, the cumulative total returns of Institutional Class (Class I) and Class B of the fund and the cumulative total returns of a broad-based securities market index ("benchmark"). The returns of Institutional Class (Class I) and Class B show the performance of the highest and lowest performing classes, respectively (based on five-year performance).
Annual Report
Board Approval of Investment Advisory Contracts and
Management Fees - continued
Fidelity Advisor Emerging Asia Fund
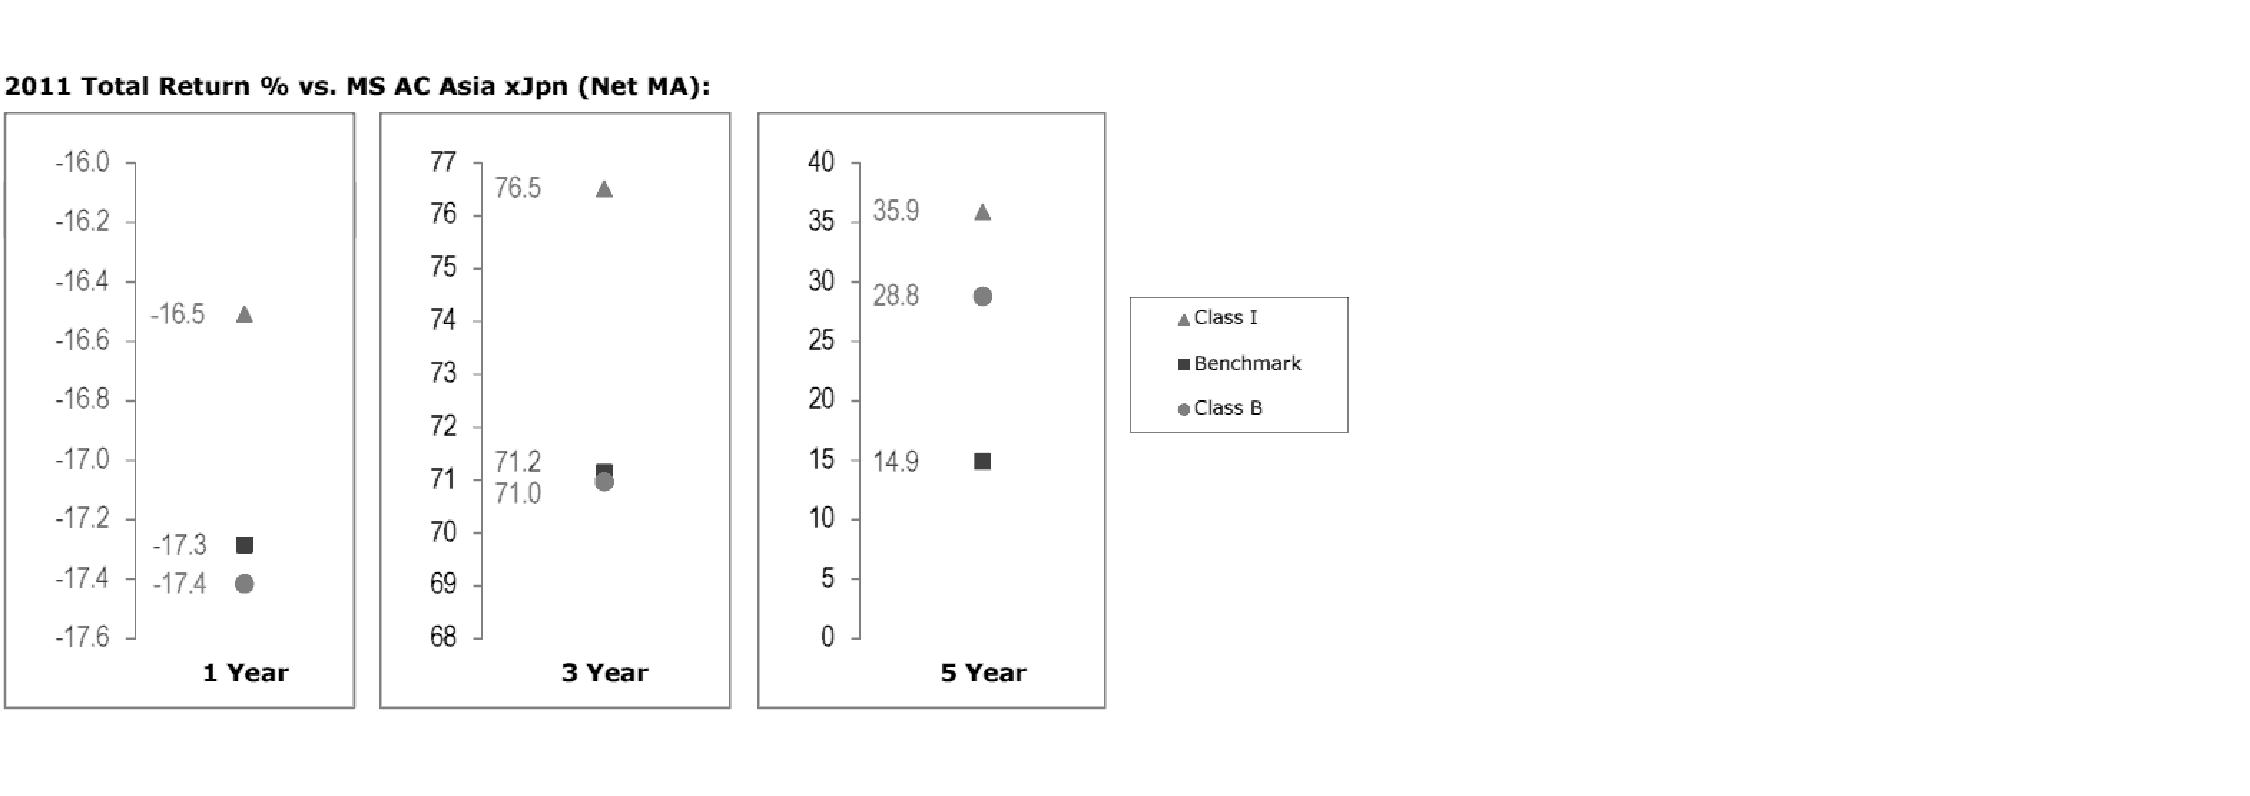
The Board noted that the investment performance of Institutional Class (Class I) of the fund compared favorably to its benchmark for all the periods shown. The Board considered that the variations in performance among the fund's classes reflect the variations in class expenses, which result in lower performance for higher expense classes. The Board also reviewed the fund's performance since inception as well as performance in the current year.
Based on its review, the Board concluded that the nature, extent, and quality of services provided to the fund under the Advisory Contracts should benefit the fund's shareholders.
Competitiveness of Management Fee and Total Expense Ratio. The Board considered the fund's management fee and total expense ratio compared to "mapped groups" of competitive funds and classes. Fidelity creates "mapped groups" by combining similar Lipper investment objective categories that have comparable management fee characteristics. Combining Lipper investment objective categories aids the Board's management fee and total expense ratio comparisons by broadening the competitive group used for comparison and by reducing the number of universes to which various Fidelity funds are compared.
Management Fee. The Board considered two proprietary management fee comparisons for the 12-month periods shown in the chart below. The group of Lipper funds used by the Board for management fee comparisons is referred to below as the "Total Mapped Group." The Total Mapped Group comparison focuses on a fund's standing relative to the total universe of comparable funds available to investors in terms of gross management fees before expense reimbursements or caps. "TMG %" represents the percentage of funds in the Total Mapped Group that had management fees that were lower than the fund's. For example, a TMG % of 7% means that 93% of the funds in the Total Mapped Group had higher management fees than the fund. The "Asset-Size Peer Group" (ASPG) comparison focuses on a fund's standing relative to non-Fidelity funds similar in size to the fund within the Total Mapped Group. The ASPG represents at least 15% of the funds in the Total Mapped Group with comparable asset size and management fee characteristics, subject to a minimum of 50 funds (or all funds in the Total Mapped Group if fewer than 50). Additional information, such as the ASPG quartile in which the fund's management fee ranked, is also included in the chart and considered by the Board.
Annual Report
Fidelity Advisor Emerging Asia Fund

The Board noted that the fund's management fee ranked below the median of its Total Mapped Group and below the median of its ASPG for 2011.
Based on its review, the Board concluded that the fund's management fee is fair and reasonable in light of the services that the fund receives and the other factors considered.
Total Expense Ratio. In its review of each class's total expense ratio, the Board considered the fund's management fee as well as other fund or class expenses, as applicable, such as transfer agent fees, pricing and bookkeeping fees, fund-paid 12b-1 fees, and custodial, legal, and audit fees. The Board also noted the effects of any waivers and reimbursements on fees and expenses. As part of its review, the Board also considered the current and historical total expense ratios of each class of the fund compared to competitive fund median expenses. Each class of the fund is compared to those funds and classes in the Total Mapped Group (used by the Board for management fee comparisons) that have a similar sales load structure.
Annual Report
Board Approval of Investment Advisory Contracts and
Management Fees - continued
The Board noted that the total expense ratio of each class ranked below its competitive median for 2011.
Fees Charged to Other Fidelity Clients. The Board also considered Fidelity fee structures and other information with respect to clients of FMR and its affiliates, such as other mutual funds advised or subadvised by FMR or its affiliates, pension plan clients, and other institutional clients. The Board noted the findings of the 2010 ad hoc joint committee (created with the board of other Fidelity funds), which reviewed and compared Fidelity's institutional investment advisory business with its business of providing services to the Fidelity funds, including the differences in services provided, fees charged, and costs incurred, as well as competition in their respective marketplaces.
Based on its review of total expense ratios and fees charged to other Fidelity clients, the Board concluded that the total expense ratio of each class of the fund was reasonable in light of the services that the fund and its shareholders receive and the other factors considered.
Costs of the Services and Profitability. The Board considered the revenues earned and the expenses incurred by Fidelity in conducting the business of developing, marketing, distributing, managing, administering and servicing the fund and its shareholders. The Board also considered the level of Fidelity's profits in respect of all the Fidelity funds.
On an annual basis, FMR presents to the Board Fidelity's profitability for the fund. Fidelity calculates the profitability for each fund, as well as aggregate profitability for groups of Fidelity funds and all Fidelity funds, using a series of detailed revenue and cost allocation methodologies which originate with the books and records of Fidelity on which Fidelity's audited financial statements are based. The Audit Committee of the Board reviews any significant changes from the prior year's methodologies.
PricewaterhouseCoopers LLP (PwC), independent registered public accounting firm and auditor to Fidelity and certain Fidelity funds, has been engaged annually by the Board as part of the Board's assessment of Fidelity's profitability analysis. PwC's engagement includes the review and assessment of Fidelity's methodologies used in determining the revenues and expenses attributable to Fidelity's mutual fund business, and completion of agreed-upon procedures surrounding the mathematical accuracy of fund profitability and its conformity to allocation methodologies. After considering PwC's reports issued under the engagement and information provided by Fidelity, the Board concluded that while other allocation methods may also be reasonable, Fidelity's profitability methodologies are reasonable in all material respects.
Annual Report
The Board also reviewed Fidelity's non-fund businesses and fall-out benefits related to the mutual fund business as well as cases where Fidelity's affiliates may benefit from or be related to the fund's business.
The Board considered the costs of the services provided by and the profits realized by Fidelity in connection with the operation of the fund and was satisfied that the profitability was not excessive in the circumstances.
Economies of Scale. The Board considered whether there have been economies of scale in respect of the management of the Fidelity funds, whether the Fidelity funds (including the fund) have appropriately benefited from any such economies of scale, and whether there is potential for realization of any further economies of scale. The Board considered the extent to which the fund will benefit from economies of scale through increased services to the fund, through waivers or reimbursements, or through fee or expense reductions. The Board also noted that in 2009, it and the board of other Fidelity funds created an ad hoc committee (the Economies of Scale Committee) to analyze whether FMR attains economies of scale in respect of the management and servicing of the Fidelity funds, whether the Fidelity funds have appropriately benefited from such economies of scale, and whether there is potential for realization of any further economies of scale.
The Board recognized that the fund's management contract incorporates a "group fee" structure, which provides for lower group fee rates as total fund assets under FMR's management increase, and for higher group fee rates as total fund assets under FMR's management decrease. FMR calculates the group fee rates based on a tiered asset "breakpoint" schedule that varies based on asset class. The Board considered that the group fee is designed to deliver the benefits of economies of scale to fund shareholders when total Fidelity fund assets increase, even if assets of any particular fund are unchanged or have declined, because some portion of Fidelity's costs are attributable to services provided to all Fidelity funds, and all funds benefit if those costs can be allocated among more assets. The Board concluded that, given the group fee structure, fund shareholders will benefit from lower management fees as assets under FMR's management increase at the fund complex level, regardless of whether Fidelity achieves any such economies of scale.
The Board concluded, taking into account the analysis of the Economies of Scale Committee, that economies of scale, if any, are being appropriately shared between fund shareholders and Fidelity.
Additional Information Requested by the Board. In order to develop fully the factual basis for consideration of the Fidelity funds' Advisory Contracts, the Board requested and received additional information on certain topics, including (i) fund performance trends, actions to be taken by FMR to improve certain funds' overall performance, and Fidelity's long-term strategies for certain funds; (ii) the potential to further rationalize the Fidelity fund lineup with the possibility of achieving savings for the funds and Fidelity; (iii) Fidelity's compensation structure for portfolio managers and other key investment personnel; (iv) the amount of the investment that each portfolio manager has made in the Fidelity fund(s) that he or she manages; (v) the realization of fall-out benefits in certain Fidelity business units; (vi) Fidelity's group fee structures, the potential impact of regulatory changes on such structures, and the rationale for the individual fee rates of certain funds; (vii) fund profitability methodology, including Fidelity's cost allocation methodology, and the impact of certain factors on fund profitability results; (viii) trends regarding industry use of performance fee structures and the possibility of implementing performance fee structures for additional funds; and (ix) the impact of net redemptions from the Fidelity funds.
Annual Report
Board Approval of Investment Advisory Contracts and
Management Fees - continued
Based on its evaluation of all of the conclusions noted above, and after considering all factors it believed relevant, the Board ultimately concluded that the advisory fee structures are fair and reasonable, and that the fund's Advisory Contracts should be renewed.
Annual Report
Investment Adviser
Fidelity Management & Research Company
Boston, MA
Investment Sub-Advisers
FMR Co., Inc.
Fidelity Management & Research
(U.K.) Inc.
FIL Investment Advisors
FIL Investment Advisors (UK) Limited
FIL Investments (Japan) Limited
Fidelity Management & Research (Hong Kong) Limited
Fidelity Management & Research (Japan) Inc.
General Distributor
Fidelity Distributors Corporation
Smithfield, RI
Transfer and Service Agents
Fidelity Investments Institutional Operations Company, Inc.
Boston, MA
Fidelity Service Company, Inc.
Boston, MA
Custodian
Brown Brothers Harriman & Co.
Boston, MA
(Fidelity Investment logo)(registered trademark)
AEA-UANN-1212
1.784737.109
(Fidelity Investment logo)(registered trademark)
Fidelity Advisor®
Emerging Asia
Fund - Institutional Class
Annual Report
October 31, 2012
(Fidelity Cover Art)
Contents
Performance | (Click Here) | How the fund has done over time. |
Management's Discussion of Fund Performance | (Click Here) | The Portfolio Manager's review of fund performance and strategy. |
Shareholder Expense Example | (Click Here) | An example of shareholder expenses. |
Investment Changes | (Click Here) | A summary of major shifts in the fund's investments over the past six months. |
Investments | (Click Here) | A complete list of the fund's investments with their market values. |
Financial Statements | (Click Here) | Statements of assets and liabilities, operations, and changes in net assets, as well as financial highlights. |
Notes | (Click Here) | Notes to financial statements. |
Report of Independent Registered Public Accounting Firm | (Click Here) | |
Trustees and Officers | (Click Here) | |
Distributions | (Click Here) | |
Board Approval of Investment Advisory Contracts and Management Fees | (Click Here) | |
To view a fund's proxy voting guidelines and proxy voting record for the 12-month period ended June 30, visit http://www.fidelity.com/proxyvotingresults or visit the Securities and Exchange Commission's (SEC) web site at http://www.sec.gov. You may also call 1-877-208-0098 to request a free copy of the proxy voting guidelines.
Standard & Poor's, S&P and S&P 500 are registered service marks of The McGraw-Hill Companies, Inc. and have been licensed for use by Fidelity Distributors Corporation.
Other third party marks appearing herein are the property of their respective owners.
All other marks appearing herein are registered or unregistered trademarks or service marks of FMR LLC or an affiliated company. © 2012 FMR LLC. All rights reserved.
Annual Report
This report and the financial statements contained herein are submitted for the general information of the shareholders of the fund. This report is not authorized for distribution to prospective investors in the fund unless preceded or accompanied by an effective prospectus.
A fund files its complete schedule of portfolio holdings with the SEC for the first and third quarters of each fiscal year on Form N-Q. Forms N-Q are available on the SEC's web site at http://www.sec.gov. A fund's Forms N-Q may be reviewed and copied at the SEC's Public Reference Room in Washington, DC. Information regarding the operation of the SEC's Public Reference Room may be obtained by calling 1-800-SEC-0330. For a complete list of a fund's portfolio holdings, view the most recent holdings listing, semiannual report, or annual report on Fidelity's web site at http://www.fidelity.com, http://www.advisor.fidelity.com, or http://www.401k.com, as applicable.
NOT FDIC INSURED • MAY LOSE VALUE • NO BANK GUARANTEE
Neither the fund nor Fidelity Distributors Corporation is a bank.
Annual Report
Average annual total return reflects the change in the value of an investment, assuming reinvestment of the class' distributions from dividend income and capital gains (the profits earned upon the sale of securities that have grown in value, if any) and assuming a constant rate of performance each year. The $10,000 table and the fund's returns do not reflect the deduction of taxes that a shareholder would pay on fund distributions or the redemption of fund shares. During periods of reimbursement by Fidelity, a fund's total return will be greater than it would be had the reimbursement not occurred. How a fund did yesterday is no guarantee of how it will do tomorrow.
Average Annual Total Returns
Periods ended October 31, 2012 | Past 1
year | Past 5
years | Past 10
years |
Institutional Class | 6.64% | -0.32% | 16.24% |
$10,000 Over 10 Years
Let's say hypothetically that $10,000 was invested in Fidelity Advisor® Emerging Asia Fund - Institutional Class on October 31, 2002. The chart shows how the value of your investment would have changed, and also shows how the MSCI® AC (All Country) Asia ex Japan Index performed over the same period.
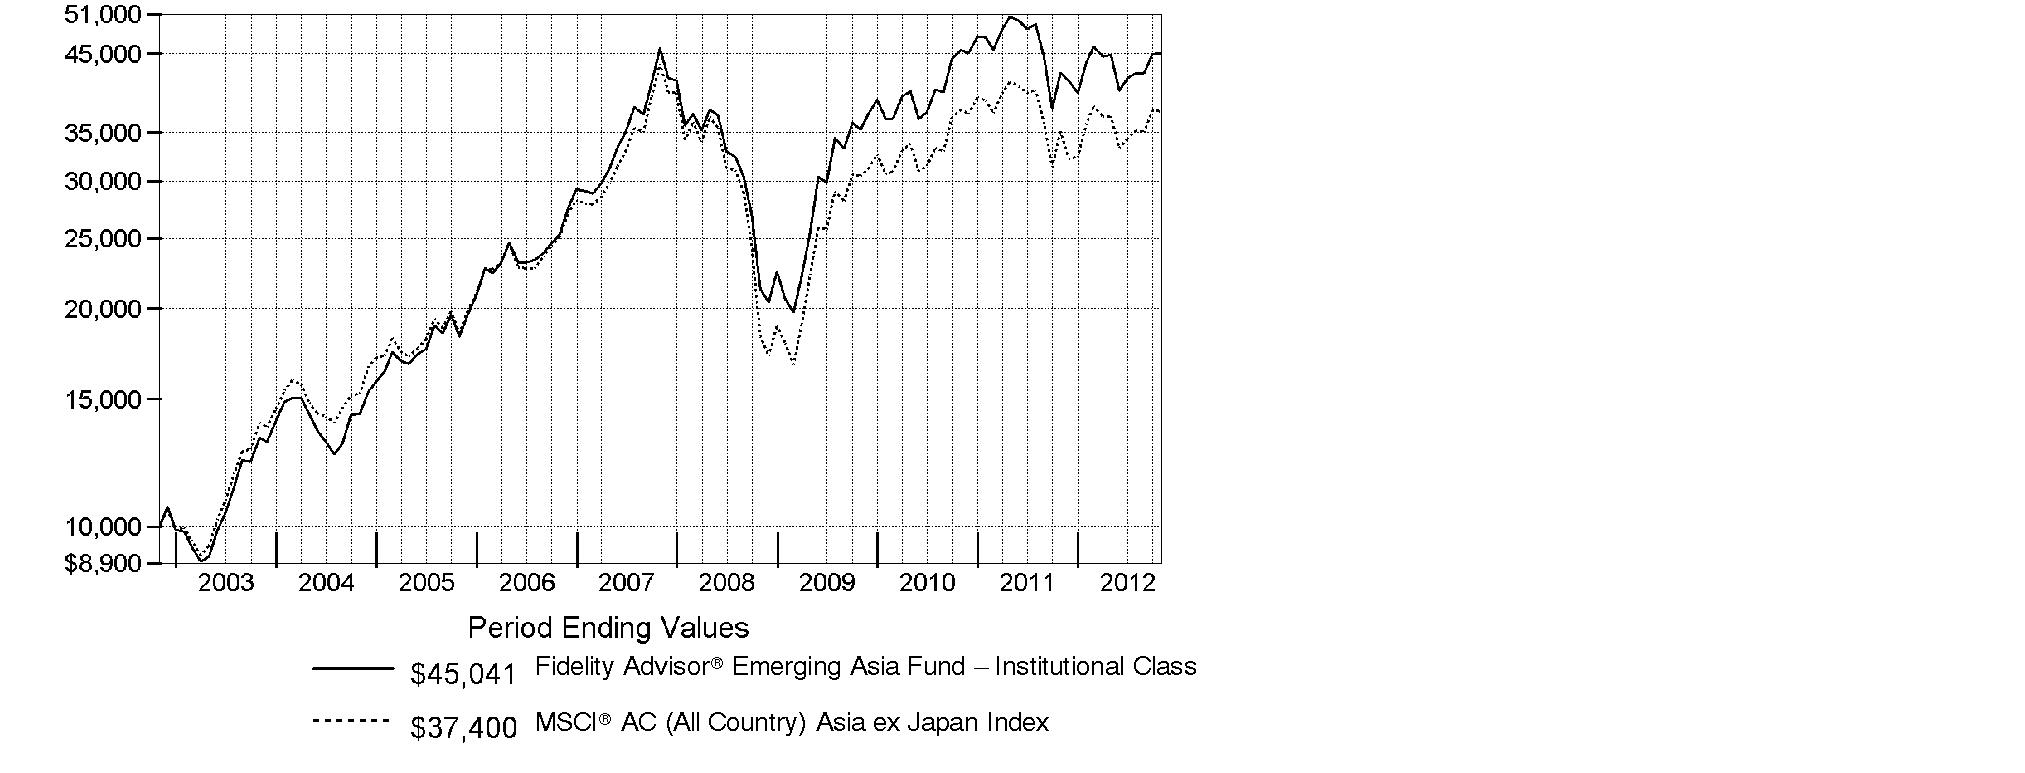
Annual Report
Market Recap: For the 12 months ending October 31, 2012, stock markets in emerging Asia finished with a solid gain, as reflected in the 6.50% advance of the MSCI® AC (All Country) Asia ex Japan Index. After some early choppiness, the index enjoyed a strong rally in the first two months of 2012, but fell back into negative territory from March through May amid renewed concerns about Europe's sovereign debt crisis and continued economic sluggishness in key countries such as China and South Korea. A rally over the final five months of the period lifted the index back into the black and enabled it to finish near its high for the period. Among important index components, Hong Kong advanced 17%, aided by rebounding share prices of property developers, while Singapore added roughly 14%, China rose about 5% and South Korea gained approximately 4%. Sentiment about Chinese stocks improved following the government's September announcement of massive outlays for infrastructure projects, in hopes of halting that nation's economic slowdown. However, China's ongoing transition to new Communist Party leadership created uncertainty that kept some investors on the sidelines. Conversely, India was a drag on the index, its stock market falling by roughly 5%. Technology-heavy Taiwan, with a gain of about 1%, also underperformed.
Comments from Colin Chickles, Portfolio Manager of Fidelity Advisor® Emerging Asia Fund: For the year, the fund's Institutional Class shares returned 6.64%, edging the MSCI index. Versus the index, positioning in Hong Kong, China and South Korea weighed on performance. At the stock level, Korean automaker Kia Motors was the biggest relative detractor. The company's third-quarter earnings fell short of forecasts, due in part to a nine-week strike that hampered production. Other detractors included Banpu, a Thailand-based thermal coal producer, and not owning strong-performing Chinese Internet stock Tencent Holdings until September. Conversely, performance was especially helped by stock picking and an underweighting in Taiwan, security selection in Indonesia, and an overweighting in the strong-performing Thai market. Not owning Taiwan-based smartphone maker HTC and Indian IT services provider Infosys, two weak-performing benchmark components, paid off. An overweighting in benchmark heavyweight Samsung Electronics also contributed to relative performance and was the fund's top absolute contributor, as well as its largest position during the period. The company emerged as Apple's major competitor in the smartphone space.
The views expressed above reflect those of the portfolio manager(s) only through the end of the period as stated on the cover of this report and do not necessarily represent the views of Fidelity or any other person in the Fidelity organization. Any such views are subject to change at any time based upon market or other conditions and Fidelity disclaims any responsibility to update such views. These views may not be relied on as investment advice and, because investment decisions for a Fidelity fund are based on numerous factors, may not be relied on as an indication of trading intent on behalf of any Fidelity fund.
Annual Report
Shareholder Expense Example
As a shareholder of the Fund, you incur two types of costs: (1) transaction costs, including sales charges (loads) on purchase payments or redemption proceeds, redemption fees and (2) ongoing costs, including management fees, distribution and/or service (12b-1) fees and other Fund expenses. This Example is intended to help you understand your ongoing costs (in dollars) of investing in the Fund and to compare these costs with the ongoing costs of investing in other mutual funds.
The Example is based on an investment of $1,000 invested at the beginning of the period and held for the entire period (May 1, 2012 to October 31, 2012).
Actual Expenses
The first line of the accompanying table for each class of the Fund provides information about actual account values and actual expenses. You may use the information in this line, together with the amount you invested, to estimate the expenses that you paid over the period. Simply divide your account value by $1,000.00 (for example, an $8,600 account value divided by $1,000.00 = 8.6), then multiply the result by the number in the first line for a class of the Fund under the heading entitled "Expenses Paid During Period" to estimate the expenses you paid on your account during this period. In addition, the Fund, as a shareholder in the underlying Fidelity Central Funds, will indirectly bear its pro-rata share of the fees and expenses incurred by the underlying Fidelity Central Funds. These fees and expenses are not included in the Fund's annualized expense ratio used to calculate the expense estimate in the table below.
Hypothetical Example for Comparison Purposes
The second line of the accompanying table for each class of the Fund provides information about hypothetical account values and hypothetical expenses based on a Class' actual expense ratio and an assumed rate of return of 5% per year before expenses, which is not the Class' actual return. The hypothetical account values and expenses may not be used to estimate the actual ending account balance or expenses you paid for the period. You may use this information to compare the ongoing costs of investing in the Fund and other funds. To do so, compare this 5% hypothetical example with the 5% hypothetical examples that appear in the shareholder reports of the other funds. In addition, the Fund, as a shareholder in the underlying Fidelity Central Funds, will indirectly bear its pro-rata share of the fees and expenses incurred by the underlying Fidelity Central Funds. These fees and expenses are not included in the Fund's annualized expense ratio used to calculate the expense estimate in the table below.
Please note that the expenses shown in the table are meant to highlight your ongoing costs only and do not reflect any transaction costs. Therefore, the second line of the table is useful in comparing ongoing costs only, and will not help you determine the relative total costs of owning different funds. In addition, if these transactional costs were included, your costs would have been higher.
Annual Report
Shareholder Expense Example - continued
| Annualized
Expense Ratio | Beginning
Account Value
May 1, 2012 | Ending
Account Value
October 31, 2012 | Expenses Paid
During Period*
May 1, 2012
to October 31, 2012 |
Class A | 1.41% | | | |
Actual | | $ 1,000.00 | $ 1,004.90 | $ 7.11 |
Hypothetical A | | $ 1,000.00 | $ 1,018.05 | $ 7.15 |
Class T | 1.69% | | | |
Actual | | $ 1,000.00 | $ 1,003.20 | $ 8.51 |
Hypothetical A | | $ 1,000.00 | $ 1,016.64 | $ 8.57 |
Class B | 2.18% | | | |
Actual | | $ 1,000.00 | $ 1,000.70 | $ 10.96 |
Hypothetical A | | $ 1,000.00 | $ 1,014.18 | $ 11.04 |
Class C | 2.15% | | | |
Actual | | $ 1,000.00 | $ 1,001.10 | $ 10.81 |
Hypothetical A | | $ 1,000.00 | $ 1,014.33 | $ 10.89 |
Institutional Class | 1.10% | | | |
Actual | | $ 1,000.00 | $ 1,006.10 | $ 5.55 |
Hypothetical A | | $ 1,000.00 | $ 1,019.61 | $ 5.58 |
A 5% return per year before expenses
* Expenses are equal to each Class' annualized expense ratio, multiplied by the average account value over the period, multiplied by 184/366 (to reflect the one-half year period).
Annual Report
Investment Changes (Unaudited)
Top Ten Stocks as of October 31, 2012 |
| % of fund's
net assets | % of fund's net assets
6 months ago |
Samsung Electronics Co. Ltd. | 6.4 | 7.3 |
China Construction Bank Corp. (H Shares) | 2.4 | 2.3 |
AIA Group Ltd. | 2.3 | 1.7 |
Industrial & Commercial Bank of China Ltd.
(H Shares) | 2.2 | 1.8 |
Tencent Holdings Ltd. | 1.7 | 0.0 |
POSCO | 1.6 | 1.4 |
Hyundai Motor Co. | 1.6 | 1.9 |
Taiwan Semiconductor Manufacturing Co. Ltd. | 1.5 | 4.1 |
Hon Hai Precision Industry Co. Ltd. (Foxconn) | 1.5 | 1.3 |
China Petroleum & Chemical Corp. (H Shares) | 1.3 | 1.9 |
| 22.5 | |
Top Five Market Sectors as of October 31, 2012 |
| % of fund's
net assets | % of fund's net assets
6 months ago |
Financials | 31.4 | 28.0 |
Information Technology | 19.2 | 21.0 |
Industrials | 8.8 | 9.0 |
Consumer Discretionary | 8.8 | 8.7 |
Telecommunication Services | 7.3 | 7.7 |
Asset Allocation (% of fund's net assets) |
As of October 31, 2012 | As of April 30, 2012 |
| Stocks 99.8% | | | Stocks 97.2% | |
| Short-Term
Investments and
Net Other Assets (Liabilities) 0.2% | | | Short-Term
Investments and
Net Other Assets (Liabilities) 2.8% | |

Annual Report
Investments October 31, 2012
Showing Percentage of Net Assets
Common Stocks - 99.8% |
| Shares | | Value |
Australia - 0.7% |
Origin Energy Ltd. | 86,705 | | $ 1,022,447 |
Spark Infrastructure Group unit | 676,407 | | 1,186,624 |
TOTAL AUSTRALIA | | 2,209,071 |
Bermuda - 1.3% |
BW Offshore Ltd. | 139,400 | | 81,909 |
Cafe de Coral Holdings Ltd. | 122,000 | | 361,275 |
Cheung Kong Infrastructure Holdings Ltd. | 238,000 | | 1,394,210 |
Genting Hong Kong Ltd. (a) | 490,000 | | 156,800 |
Kunlun Energy Co. Ltd. | 778,000 | | 1,445,565 |
Man Wah Holdings Ltd. | 510,000 | | 313,895 |
Oriental Watch Holdings Ltd. | 1,474,000 | | 441,246 |
TOTAL BERMUDA | | 4,194,900 |
Canada - 0.0% |
Turquoise Hill Resources Ltd. (a) | 14,600 | | 114,169 |
Cayman Islands - 6.9% |
7 Days Group Holdings Ltd. ADR (a) | 24,800 | | 298,840 |
AirMedia Group, Inc. ADR (a) | 36,833 | | 83,611 |
Anta Sports Products Ltd. | 566,000 | | 482,010 |
Anton Oilfield Services Group | 722,000 | | 217,996 |
Baidu.com, Inc. sponsored ADR (a) | 3,300 | | 351,846 |
Chailease Holding Co. Ltd. | 98,000 | | 174,461 |
Changyou.com Ltd. (A Shares) ADR | 20,800 | | 516,880 |
China Kanghui Holdings sponsored ADR (a) | 6,600 | | 201,960 |
China Lodging Group Ltd. ADR (a)(d) | 20,500 | | 348,910 |
China Medical System Holdings Ltd. | 615,000 | | 354,714 |
China Metal Recycling (Holdings) Ltd. | 273,000 | | 272,998 |
China Shineway Pharmaceutical Group Ltd. | 399,000 | | 638,396 |
Chu Kong Petroleum & Natural Gas Steel Pipe Holdings Ltd. | 410,000 | | 166,644 |
Coastal Energy Co. (a) | 7,300 | | 137,192 |
ENN Energy Holdings Ltd. | 172,000 | | 715,737 |
Ginko International Co. Ltd. | 13,000 | | 159,552 |
Gourmet Master Co. Ltd. | 22,050 | | 156,260 |
HiSoft Technology International Ltd. ADR (a) | 11,900 | | 123,641 |
Hopefluent Group Holdings Ltd. | 538,000 | | 154,804 |
Ju Teng International Holdings Ltd. | 1,316,000 | | 526,397 |
Kingsoft Corp. Ltd. | 542,000 | | 314,708 |
KWG Property Holding Ltd. | 1,503,000 | | 895,976 |
Lee & Man Paper Manufacturing Ltd. | 1,893,000 | | 994,124 |
Longfor Properties Co. Ltd. | 981,000 | | 1,731,612 |
Melco PBL Entertainment (Macau) Ltd. sponsored ADR (a) | 43,600 | | 632,636 |
Common Stocks - continued |
| Shares | | Value |
Cayman Islands - continued |
Mindray Medical International Ltd. sponsored ADR | 4,600 | | $ 156,446 |
O-Net Communications Group Ltd. | 703,000 | | 185,954 |
Samson Holding Ltd. | 4,000,000 | | 572,900 |
Sands China Ltd. | 452,000 | | 1,700,092 |
SOHO China Ltd. | 772,000 | | 524,957 |
SouFun Holdings Ltd. ADR (d) | 35,900 | | 648,713 |
Tencent Holdings Ltd. | 159,500 | | 5,639,060 |
Tiangong International Co. Ltd. | 782,000 | | 188,688 |
Vinda International Holdings Ltd. | 76,000 | | 106,105 |
VST Holdings Ltd. | 914,000 | | 160,391 |
Wynn Macau Ltd. | 380,000 | | 1,076,251 |
Xueda Education Group sponsored ADR (a) | 88,200 | | 254,016 |
Yingde Gases Group Co. Ltd. | 360,000 | | 341,417 |
Youyuan International Holdings Ltd. | 1,946,000 | | 477,081 |
Zhen Ding Technology Holding Ltd. | 48,000 | | 126,861 |
TOTAL CAYMAN ISLANDS | | 22,810,837 |
China - 12.3% |
Air China Ltd. (H Shares) | 3,704,000 | | 2,628,628 |
Changsha Zoomlion Heavy Industry Science & Technology Development Co. Ltd. (H Shares) | 351,000 | | 472,828 |
China Communications Construction Co. Ltd. (H Shares) | 2,373,000 | | 2,226,013 |
China Communications Services Corp. Ltd. (H Shares) | 3,598,000 | | 2,028,795 |
China Construction Bank Corp. (H Shares) | 10,477,000 | | 7,894,876 |
China Longyuan Power Grid Corp. Ltd. (H Shares) | 729,000 | | 475,023 |
China Petroleum & Chemical Corp. (H Shares) | 4,230,000 | | 4,457,900 |
China Railway Construction Corp. Ltd. (H Shares) | 2,583,000 | | 2,566,319 |
China Railway Group Ltd. (H Shares) | 1,873,000 | | 954,620 |
China Southern Airlines Ltd. (H Shares) | 2,514,000 | | 1,190,493 |
China Suntien Green Energy Corp. Ltd. (H Shares) | 2,431,000 | | 495,607 |
Chongqing Machinery & Electric Co. Ltd. (H Shares) | 1,610,000 | | 245,134 |
CITIC Securities Co. Ltd. (H Shares) | 314,500 | | 590,039 |
Great Wall Motor Co. Ltd. (H Shares) | 362,500 | | 996,284 |
Guangshen Railway Co. Ltd. (H Shares) | 1,244,000 | | 428,575 |
Guangzhou R&F Properties Co. Ltd. (H Shares) | 443,200 | | 544,990 |
Harbin Power Equipment Co. Ltd. (H Shares) | 2,030,000 | | 1,678,996 |
Huaneng Renewables Corp. Ltd. (H Shares) (a) | 1,874,000 | | 236,969 |
Industrial & Commercial Bank of China Ltd. (H Shares) | 11,217,000 | | 7,424,882 |
Ping An Insurance Group Co. China Ltd. (H Shares) | 406,500 | | 3,220,508 |
TOTAL CHINA | | 40,757,479 |
Hong Kong - 14.7% |
AIA Group Ltd. | 1,893,000 | | 7,498,674 |
Common Stocks - continued |
| Shares | | Value |
Hong Kong - continued |
Beijing Enterprises Holdings Ltd. | 117,000 | | $ 755,589 |
BOC Hong Kong (Holdings) Ltd. | 1,270,000 | | 3,908,297 |
Cheung Kong Holdings Ltd. | 295,000 | | 4,358,359 |
China Everbright International | 889,000 | | 457,689 |
China Everbright Ltd. | 266,000 | | 387,156 |
China Mobile Ltd. | 383,500 | | 4,253,685 |
China Power International Development Ltd. | 2,191,000 | | 596,514 |
China Resources Power Holdings Co. Ltd. | 540,000 | | 1,156,638 |
CITIC Pacific Ltd. | 1,587,000 | | 2,023,156 |
City Telecom (HK) Ltd. (CTI) | 1,484,000 | | 340,325 |
CNOOC Ltd. | 1,143,500 | | 2,353,296 |
Galaxy Entertainment Group Ltd. (a) | 372,000 | | 1,279,192 |
HKT Trust / HKT Ltd. unit | 2,169,942 | | 2,013,133 |
Hysan Development Co. Ltd. | 314,000 | | 1,387,668 |
Lenovo Group Ltd. | 1,964,000 | | 1,578,792 |
Magnificent Estates Ltd. | 1,922,000 | | 92,999 |
New World Development Co. Ltd. | 1,522,151 | | 2,352,936 |
PCCW Ltd. | 7,763,000 | | 3,135,230 |
Power Assets Holdings Ltd. | 470,500 | | 4,000,742 |
Singamas Container Holdings Ltd. | 842,000 | | 212,943 |
Sun Hung Kai Properties Ltd. | 279,000 | | 3,884,375 |
Vitasoy International Holdings Ltd. | 394,000 | | 374,170 |
Wing Hang Bank Ltd. | 50,000 | | 530,319 |
TOTAL HONG KONG | | 48,931,877 |
India - 11.6% |
Aditya Birla Nuvo Ltd. | 37,660 | | 636,136 |
Apollo Tyres Ltd. (a) | 433,261 | | 690,898 |
Axis Bank Ltd. | 76,498 | | 1,681,378 |
Bajaj Auto Ltd. | 20,000 | | 675,197 |
Britannia Industries Ltd. (a) | 15,444 | | 138,825 |
Cairn India Ltd. | 110,428 | | 690,624 |
Cox & Kings India Ltd. | 69,582 | | 177,431 |
Dena Bank | 289,157 | | 571,005 |
Dish TV India Ltd. (a) | 183,743 | | 257,490 |
Gateway Distriparks Ltd. | 178,612 | | 474,871 |
Godrej Consumer Products Ltd. | 31,940 | | 428,241 |
Grasim Industries Ltd. | 47,858 | | 3,113,313 |
Hathway Cable & Datacom Ltd. (a) | 138,178 | | 602,097 |
HCL Infosystems Ltd. | 318,811 | | 251,825 |
Hindalco Industries Ltd. | 821,522 | | 1,779,544 |
Hindustan Unilever Ltd. | 265,513 | | 2,697,322 |
Common Stocks - continued |
| Shares | | Value |
India - continued |
Housing Development Finance Corp. Ltd. | 251,690 | | $ 3,566,135 |
ICICI Bank Ltd. | 80,680 | | 1,569,842 |
IDBI Bank Ltd. | 198,940 | | 343,121 |
INFO Edge India Ltd. | 9,106 | | 59,302 |
Infotech Enterprises Ltd. | 84,807 | | 296,245 |
Ipca Laboratories Ltd. | 40,891 | | 348,909 |
ITC Ltd. | 386,986 | | 2,032,207 |
Jubilant Foodworks Ltd. (a) | 9,696 | | 227,601 |
Mahindra & Mahindra Financial Services Ltd. | 45,566 | | 733,942 |
Manappuram General Finance & Leasing Ltd. | 315,220 | | 215,888 |
Maruti Suzuki India Ltd. | 34,538 | | 923,003 |
McLeod Russel India Ltd. (a) | 83,197 | | 467,901 |
MindTree Consulting Ltd. | 22,528 | | 276,026 |
Muthoot Finance Ltd. (a) | 123,681 | | 426,062 |
NIIT Technologies Ltd. | 77,144 | | 421,959 |
NTPC Ltd. | 268,892 | | 826,341 |
Opto Circuits India Ltd. | 107,200 | | 239,384 |
Petronet LNG Ltd. | 393,494 | | 1,230,103 |
Power Grid Corp. of India Ltd. | 669,420 | | 1,418,342 |
Rolta India Ltd. | 342,801 | | 413,489 |
Shriram City Union Finance Ltd. (a) | 20,215 | | 293,372 |
Simplex Infrastructures Ltd. | 32,233 | | 121,941 |
SREI Infrastructure Finance Ltd. | 870,179 | | 434,240 |
Strides Arcolab Ltd. | 41,354 | | 687,235 |
Tata Chemicals Ltd. (a) | 128,558 | | 756,104 |
Tata Consultancy Services Ltd. | 88,447 | | 2,162,476 |
Tata Steel Ltd. | 275,521 | | 2,008,351 |
Tech Mahindra Ltd. (a) | 31,879 | | 561,948 |
TTK Prestige Ltd. (a) | 3,024 | | 180,173 |
Yes Bank Ltd. | 69,097 | | 528,581 |
Zydus Wellness Ltd. | 7,735 | | 63,053 |
TOTAL INDIA | | 38,699,473 |
Indonesia - 5.2% |
PT ACE Hardware Indonesia Tbk | 452,500 | | 329,775 |
PT Bank Bukopin Tbk | 7,892,500 | | 525,891 |
PT Bank Central Asia Tbk | 2,249,000 | | 1,920,013 |
PT Bank Rakyat Indonesia Tbk | 5,340,500 | | 4,114,475 |
PT BISI International Tbk | 1,735,500 | | 193,334 |
PT Ciputra Development Tbk | 4,363,000 | | 308,884 |
PT Global Mediacom Tbk | 5,349,000 | | 1,266,936 |
PT Kalbe Farma Tbk | 9,237,500 | | 932,883 |
Common Stocks - continued |
| Shares | | Value |
Indonesia - continued |
PT Media Nusantara Citra Tbk | 697,500 | | $ 205,146 |
PT Pembangunan Perumahan Persero Tbk | 7,025,500 | | 563,208 |
PT Telkomunikasi Indonesia Tbk Series B | 3,842,500 | | 3,902,655 |
PT Tempo Scan Pacific Tbk | 1,234,000 | | 414,329 |
PT Unilever Indonesia Tbk | 767,500 | | 2,081,550 |
PT XL Axiata Tbk | 982,000 | | 700,330 |
TOTAL INDONESIA | | 17,459,409 |
Japan - 0.1% |
Suzuki Motor Corp. | 14,800 | | 335,192 |
Korea (South) - 21.1% |
AMOREPACIFIC Corp. | 682 | | 775,626 |
BS Financial Group, Inc. | 194,180 | | 2,199,467 |
Chong Kun Dang Pharmaceutical Corp. | 23,160 | | 737,079 |
CJ CheilJedang Corp. | 2,482 | | 779,666 |
CJ Corp. | 14,408 | | 1,407,341 |
DGB Financial Group Co. Ltd. | 153,660 | | 1,944,849 |
Dongbu Insurance Co. Ltd. | 10,400 | | 471,678 |
Hana Financial Group, Inc. | 77,910 | | 2,268,731 |
Hanjin Shipping Co. Ltd. (a) | 61,740 | | 688,001 |
Hotel Shilla Co. | 23,094 | | 974,323 |
Hyundai Hysco Co. Ltd. | 28,800 | | 1,151,662 |
Hyundai Merchant Marine Co. Ltd. (a) | 8,200 | | 197,419 |
Hyundai Motor Co. | 25,174 | | 5,183,399 |
Hyundai Steel Co. | 15,467 | | 1,113,581 |
Hyundai Wia Corp. | 7,287 | | 1,179,613 |
ICD Co. Ltd. | 28,696 | | 350,041 |
Industrial Bank of Korea | 96,490 | | 1,061,964 |
Jcontentree Corp. (a) | 147,818 | | 552,460 |
KCC Corp. | 1,444 | | 405,261 |
Kia Motors Corp. | 57,125 | | 3,175,008 |
Korea Zinc Co. Ltd. | 2,169 | | 891,217 |
LG International Corp. | 33,990 | | 1,234,504 |
LG Telecom Ltd. | 75,570 | | 483,090 |
LIG Non-Life Insurance Co. Ltd. | 11,190 | | 285,313 |
Lotte Samkang Co. Ltd. | 3,184 | | 2,134,698 |
Nong Shim Co. Ltd. | 3,466 | | 820,152 |
Osstem Implant Co. Ltd. (a) | 13,388 | | 388,015 |
Paradise Co. Ltd. | 8,847 | | 148,083 |
POSCO | 17,242 | | 5,421,494 |
Samsung Electronics Co. Ltd. | 17,649 | | 21,204,963 |
Samsung Fire & Marine Insurance Co. Ltd. | 10,549 | | 2,307,521 |
Common Stocks - continued |
| Shares | | Value |
Korea (South) - continued |
Samsung Heavy Industries Ltd. | 80,390 | | $ 2,458,917 |
SBS Contents Hub Co. Ltd. | 12,352 | | 185,226 |
SK Chemicals Co. Ltd. | 7,914 | | 487,766 |
SK Energy Co. Ltd. | 13,146 | | 1,935,150 |
SK Holdings Co. Ltd. | 13,892 | | 1,936,665 |
Soulbrain Co. Ltd. | 16,567 | | 667,044 |
Sungwoo Hitech Co. Ltd. | 77,695 | | 755,344 |
TOTAL KOREA (SOUTH) | | 70,362,331 |
Malaysia - 2.2% |
Bumiputra-Commerce Holdings Bhd | 1,007,600 | | 2,523,962 |
Glomac Bhd | 1,063,500 | | 295,029 |
Hong Leong Bank Bhd | 98,800 | | 476,160 |
Lafarge Malayan Cement Bhd | 230,600 | | 738,132 |
Malaysian Plantations Bhd | 508,000 | | 678,779 |
Maxis Bhd | 570,000 | | 1,302,429 |
Telekom Malaysia Bhd | 486,400 | | 954,915 |
TIME dotCom Bhd (a) | 293,300 | | 337,016 |
TOTAL MALAYSIA | | 7,306,422 |
Papua New Guinea - 0.0% |
Oil Search Ltd. ADR | 20,314 | | 156,887 |
Philippines - 1.2% |
Cebu Air, Inc. | 254,000 | | 353,499 |
Manila Water Co., Inc. | 2,068,100 | | 1,459,243 |
PUREGOLD Price Club, Inc. | 954,100 | | 695,263 |
Security Bank Corp. | 262,470 | | 1,033,915 |
Universal Robina Corp. | 249,000 | | 435,599 |
TOTAL PHILIPPINES | | 3,977,519 |
Singapore - 3.6% |
Ascendas Real Estate Investment Trust | 900,000 | | 1,741,269 |
Avago Technologies Ltd. | 39,700 | | 1,311,291 |
First Resources Ltd. | 471,000 | | 791,564 |
Global Logistic Properties Ltd. | 574,000 | | 1,209,362 |
Hutchison Port Holdings Trust | 1,187,000 | | 925,860 |
Mapletree Industrial (REIT) | 966,000 | | 1,108,706 |
Mapletree Logistics Trust (REIT) | 1,826,000 | | 1,661,633 |
Petra Foods Ltd. | 89,000 | | 191,162 |
StarHub Ltd. | 266,000 | | 802,492 |
Common Stocks - continued |
| Shares | | Value |
Singapore - continued |
UOL Group Ltd. | 404,000 | | $ 1,874,602 |
Yanlord Land Group Ltd. (a) | 401,000 | | 414,215 |
TOTAL SINGAPORE | | 12,032,156 |
Taiwan - 9.2% |
ASUSTeK Computer, Inc. | 239,000 | | 2,561,007 |
Chicony Electronics Co. Ltd. | 1,034,075 | | 2,269,230 |
Chinatrust Financial Holding Co. Ltd. | 4,162,688 | | 2,294,395 |
Chipbond Technology Corp. | 459,000 | | 777,833 |
E Sun Financial Holdings Co. Ltd. | 131,096 | | 65,750 |
ECLAT Textile Co. Ltd. | 13,000 | | 38,453 |
Far EasTone Telecommunications Co. Ltd. | 623,000 | | 1,437,528 |
FLEXium Interconnect, Inc. | 27,273 | | 111,109 |
Hon Hai Precision Industry Co. Ltd. (Foxconn) | 1,624,590 | | 4,933,281 |
Insyde Software Corp. | 131,195 | | 387,162 |
MediaTek, Inc. | 259,000 | | 2,877,285 |
Merida Industry Co. Ltd. | 40,000 | | 153,372 |
Novatek Microelectronics Corp. | 175,000 | | 659,021 |
Quanta Computer, Inc. | 544,000 | | 1,244,067 |
Radiant Opto-Electronics Corp. | 356,360 | | 1,482,292 |
Taiwan Semiconductor Manufacturing Co. Ltd. | 1,659,393 | | 5,056,702 |
Unified-President Enterprises Corp. | 1,316,150 | | 2,325,003 |
Wistron Corp. | 1,012,355 | | 972,152 |
Wowprime Corp. | 13,000 | | 182,472 |
Yang Ming Marine Transport Corp. | 2,065,000 | | 805,923 |
TOTAL TAIWAN | | 30,634,037 |
Thailand - 7.1% |
Advanced Info Service PCL (For. Reg.) | 306,200 | | 1,971,780 |
Bangchak Petroleum PCL (For. Reg.) | 308,700 | | 264,212 |
Bangkok Bank Public Co. Ltd. NVDR | 462,600 | | 2,669,716 |
Bangkok Expressway PCL (For.Reg.) | 382,700 | | 346,264 |
Banpu PCL (For. Reg.) | 82,800 | | 1,058,285 |
Charoen Pokphand Foods PCL (For. Reg.) | 994,000 | | 1,142,436 |
Home Product Center PCL (For. Reg.) | 364,560 | | 135,506 |
LPN Development PCL (For. Reg.) | 1,860,100 | | 1,097,744 |
Preuksa Real Estate PCL (For. Reg.) | 908,400 | | 580,523 |
PTT Global Chemical PCL (For. Reg.) | 659,667 | | 1,312,021 |
PTT PCL (For. Reg.) | 356,500 | | 3,696,348 |
Robinsons Department Store PCL (For. Reg.) | 85,300 | | 168,959 |
Siam Commercial Bank PCL (For. Reg.) | 685,100 | | 3,596,384 |
Siam Makro PCL (For. Reg.) | 61,100 | | 916,400 |
Common Stocks - continued |
| Shares | | Value |
Thailand - continued |
Sino Thai Engineering & Construction PCL (For. Reg.) | 901,600 | | $ 629,092 |
Supalai PCL (For. Reg.) | 496,100 | | 310,568 |
Thai Tap Water Supply PCL | 1,488,500 | | 383,409 |
Thai Union Frozen Products PCL (For. Reg.) | 627,920 | | 1,474,087 |
Thanachart Capital PCL (For. Reg.) | 541,600 | | 653,381 |
Total Access Communication PCL (For. Reg.) | 312,300 | | 883,340 |
Toyo-Thai Corp. PCL NVDR | 211,900 | | 188,271 |
TOTAL THAILAND | | 23,478,726 |
United Kingdom - 0.9% |
HSBC Holdings PLC (Hong Kong) | 97,278 | | 958,588 |
Standard Chartered PLC (Hong Kong) | 64,228 | | 1,534,832 |
Vedanta Resources PLC | 24,900 | | 455,668 |
TOTAL UNITED KINGDOM | | 2,949,088 |
United States of America - 1.7% |
China Natural Gas, Inc. (a)(d) | 13,300 | | 9,975 |
Citigroup, Inc. | 37,800 | | 1,413,342 |
Cognizant Technology Solutions Corp. Class A (a) | 30,900 | | 2,059,485 |
Freeport-McMoRan Copper & Gold, Inc. | 46,100 | | 1,792,368 |
Las Vegas Sands Corp. | 7,100 | | 329,724 |
Yum! Brands, Inc. | 1,500 | | 105,165 |
TOTAL UNITED STATES OF AMERICA | | 5,710,059 |
TOTAL COMMON STOCKS (Cost $286,878,616) |
332,119,632
|
Money Market Funds - 0.3% |
| | | |
Fidelity Cash Central Fund, 0.19% (b) | 410,290 | | 410,290 |
Fidelity Securities Lending Cash Central Fund, 0.19% (b)(c) | 572,450 | | 572,450 |
TOTAL MONEY MARKET FUNDS (Cost $982,740) |
982,740
|
TOTAL INVESTMENT PORTFOLIO - 100.1% (Cost $287,861,356) | | 333,102,372 |
NET OTHER ASSETS (LIABILITIES) - (0.1)% | | (393,905) |
NET ASSETS - 100% | $ 332,708,467 |
Legend |
(a) Non-income producing |
(b) Affiliated fund that is available only to investment companies and other accounts managed by Fidelity Investments. The rate quoted is the annualized seven-day yield of the fund at period end. A complete unaudited listing of the fund's holdings as of its most recent quarter end is available upon request. In addition, each Fidelity Central Fund's financial statements, which are not covered by the Fund's Report of Independent Registered Public Accounting Firm, are available on the SEC's website or upon request. |
(c) Investment made with cash collateral received from securities on loan. |
(d) Security or a portion of the security is on loan at period end. |
Affiliated Central Funds |
Information regarding fiscal year to date income earned by the Fund from investments in Fidelity Central Funds is as follows: |
Fund | Income earned |
Fidelity Cash Central Fund | $ 5,440 |
Fidelity Securities Lending Cash Central Fund | 76,377 |
Total | $ 81,817 |
Other Information |
Categorizations in the Schedule of Investments are based on country or territory of incorporation. |
The following is a summary of the inputs used, as of October 31, 2012, involving the Fund's assets and liabilities carried at fair value. The inputs or methodology used for valuing securities may not be an indication of the risk associated with investing in those securities. For more information on valuation inputs, and their aggregation into the levels used in the tables below, please refer to the Security Valuation section in the accompanying Notes to Financial Statements. |
Valuation Inputs at Reporting Date: |
Description | Total | Level 1 | Level 2 | Level 3 |
Investments in Securities: | | | | |
Equities: | | | | |
Consumer Discretionary | $ 28,200,037 | $ 28,200,037 | $ - | $ - |
Consumer Staples | 21,064,364 | 21,064,364 | - | - |
Energy | 19,410,165 | 12,598,969 | 6,811,196 | - |
Financials | 103,430,096 | 100,901,666 | 2,528,430 | - |
Health Care | 5,258,902 | 5,258,902 | - | - |
Industrials | 29,214,156 | 29,214,156 | - | - |
Information Technology | 63,058,660 | 58,001,958 | 5,056,702 | - |
Materials | 24,076,742 | 15,541,935 | 8,534,807 | - |
Telecommunication Services | 24,546,743 | 16,050,078 | 8,496,665 | - |
Utilities | 13,859,767 | 13,859,767 | - | - |
Money Market Funds | 982,740 | 982,740 | - | - |
Total Investments in Securities: | $ 333,102,372 | $ 301,674,572 | $ 31,427,800 | $ - |
The following is a summary of transfers between Level 1 and Level 2 for the period ended October 31, 2012. Transfers are assumed to have occurred at the beginning of the period, and are primarily attributable to the valuation techniques used for foreign equity securities, as discussed in the accompanying Notes to Financial Statements: |
Transfers | Total |
Level 1 to Level 2 | $ 0 |
Level 2 to Level 1 | $ 171,173,915 |
See accompanying notes which are an integral part of the financial statements.
Annual Report
Statement of Assets and Liabilities
| October 31, 2012 |
| | |
Assets | | |
Investment in securities, at value (including securities loaned of $563,050) - See accompanying schedule: Unaffiliated issuers (cost $286,878,616) | $ 332,119,632 | |
Fidelity Central Funds (cost $982,740) | 982,740 | |
Total Investments (cost $287,861,356) | | $ 333,102,372 |
Foreign currency held at value (cost $836,202) | | 818,705 |
Receivable for investments sold | | 2,988,040 |
Receivable for fund shares sold | | 241,286 |
Dividends receivable | | 125,964 |
Distributions receivable from Fidelity Central Funds | | 931 |
Other receivables | | 221,322 |
Total assets | | 337,498,620 |
| | |
Liabilities | | |
Payable for investments purchased | $ 2,917,131 | |
Payable for fund shares redeemed | 755,540 | |
Accrued management fee | 197,294 | |
Distribution and service plan fees payable | 123,811 | |
Other affiliated payables | 89,318 | |
Other payables and accrued expenses | 134,609 | |
Collateral on securities loaned, at value | 572,450 | |
Total liabilities | | 4,790,153 |
| | |
Net Assets | | $ 332,708,467 |
Net Assets consist of: | | |
Paid in capital | | $ 298,443,279 |
Undistributed net investment income | | 2,899,067 |
Accumulated undistributed net realized gain (loss) on investments and foreign currency transactions | | (13,828,339) |
Net unrealized appreciation (depreciation) on investments and assets and liabilities in foreign currencies | | 45,194,460 |
Net Assets | | $ 332,708,467 |
See accompanying notes which are an integral part of the financial statements.
Annual Report
Statement of Assets and Liabilities - continued
| October 31, 2012 |
| | |
Calculation of Maximum Offering Price Class A:
Net Asset Value and redemption price per share ($160,426,790 ÷ 5,557,506 shares) | | $ 28.87 |
| | |
Maximum offering price per share (100/94.25 of $28.87) | | $ 30.63 |
Class T:
Net Asset Value and redemption price per share ($49,358,848 ÷ 1,754,694 shares) | | $ 28.13 |
| | |
Maximum offering price per share (100/96.50 of $28.13) | | $ 29.15 |
Class B:
Net Asset Value and offering price per share ($15,823,278 ÷ 591,021 shares)A | | $ 26.77 |
| | |
Class C:
Net Asset Value and offering price per share ($67,073,559 ÷ 2,528,151 shares)A | | $ 26.53 |
| | |
Institutional Class:
Net Asset Value, offering price and redemption price per share ($40,025,992 ÷ 1,348,976 shares) | | $ 29.67 |
A Redemption price per share is equal to net asset value less any applicable contingent deferred sales charge.
See accompanying notes which are an integral part of the financial statements.
Annual Report
Financial Statements - continued
Statement of Operations
| Year ended October 31, 2012 |
| | |
Investment Income | | |
Dividends | | $ 10,185,651 |
Income from Fidelity Central Funds | | 81,817 |
Income before foreign taxes withheld | | 10,267,468 |
Less foreign taxes withheld | | (944,562) |
Total income | | 9,322,906 |
| | |
Expenses | | |
Management fee | $ 2,521,012 | |
Transfer agent fees | 965,466 | |
Distribution and service plan fees | 1,584,458 | |
Accounting and security lending fees | 184,659 | |
Custodian fees and expenses | 252,056 | |
Independent trustees' compensation | 2,366 | |
Registration fees | 82,723 | |
Audit | 122,257 | |
Legal | 1,582 | |
Interest | 1,221 | |
Miscellaneous | 3,887 | |
Total expenses before reductions | 5,721,687 | |
Expense reductions | (111,304) | 5,610,383 |
Net investment income (loss) | | 3,712,523 |
Realized and Unrealized Gain (Loss) Net realized gain (loss) on: | | |
Investment securities: | | |
Unaffiliated issuers | (12,276,777) | |
Foreign currency transactions | (43,492) | |
Total net realized gain (loss) | | (12,320,269) |
Change in net unrealized appreciation (depreciation) on: Investment securities | 27,243,935 | |
Assets and liabilities in foreign currencies | (31,478) | |
Total change in net unrealized appreciation (depreciation) | | 27,212,457 |
Net gain (loss) | | 14,892,188 |
Net increase (decrease) in net assets resulting from operations | | $ 18,604,711 |
See accompanying notes which are an integral part of the financial statements.
Annual Report
Statement of Changes in Net Assets
| Year ended
October 31,
2012 | Year ended
October 31,
2011 |
Increase (Decrease) in Net Assets | | |
Operations | | |
Net investment income (loss) | $ 3,712,523 | $ 3,977,993 |
Net realized gain (loss) | (12,320,269) | 22,771,263 |
Change in net unrealized appreciation (depreciation) | 27,212,457 | (61,670,156) |
Net increase (decrease) in net assets resulting
from operations | 18,604,711 | (34,920,900) |
Distributions to shareholders from net investment income | (3,170,802) | (1,974,190) |
Distributions to shareholders from net realized gain | (16,643,937) | (23,691,402) |
Total distributions | (19,814,739) | (25,665,592) |
Share transactions - net increase (decrease) | (50,574,411) | 32,289,855 |
Redemption fees | 36,772 | 135,689 |
Total increase (decrease) in net assets | (51,747,667) | (28,160,948) |
| | |
Net Assets | | |
Beginning of period | 384,456,134 | 412,617,082 |
End of period (including undistributed net investment income of $2,899,067 and undistributed net investment income of $2,634,151, respectively) | $ 332,708,467 | $ 384,456,134 |
See accompanying notes which are an integral part of the financial statements.
Annual Report
Financial Highlights - Class A
Years ended October 31, | 2012 | 2011 | 2010 | 2009 | 2008 |
Selected Per-Share Data | | | | | |
Net asset value, beginning of period | $ 28.70 | $ 32.97 | $ 25.96 | $ 15.74 | $ 37.55 |
Income from Investment Operations | | | | | |
Net investment income (loss) C | .34 | .35 | .25 | .19 | .19 |
Net realized and unrealized gain (loss) | 1.37 | (2.62) | 7.09 | 10.07 | (18.72) |
Total from investment operations | 1.71 | (2.27) | 7.34 | 10.26 | (18.53) |
Distributions from net investment income | (.31) | (.20) | (.12) | (.05) | (.23) |
Distributions from net realized gain | (1.23) | (1.81) | (.22) | - | (3.06) |
Total distributions | (1.54) | (2.01) | (.34) | (.05) | (3.29) |
Redemption fees added to paid in capital C | - H | .01 | .01 | .01 | .01 |
Net asset value, end of period | $ 28.87 | $ 28.70 | $ 32.97 | $ 25.96 | $ 15.74 |
Total Return A,B | 6.36% | (7.44)% | 28.53% | 65.43% | (53.66)% |
Ratios to Average Net Assets D,F | | | | | |
Expenses before reductions | 1.42% | 1.39% | 1.44% | 1.54% | 1.50% |
Expenses net of fee waivers, if any | 1.42% | 1.39% | 1.44% | 1.50% | 1.50% |
Expenses net of all reductions | 1.38% | 1.35% | 1.40% | 1.41% | 1.41% |
Net investment income (loss) | 1.24% | 1.12% | .86% | .94% | .73% |
Supplemental Data | | | | | |
Net assets, end of period (000 omitted) | $ 160,427 | $ 179,346 | $ 189,255 | $ 131,564 | $ 71,722 |
Portfolio turnover rate E | 95% | 119% | 138% | 91% | 92% G |
A Total returns would have been lower if certain expenses had not been reduced during the applicable periods shown.
B Total returns do not include the effect of the sales charges.
C Calculated based on average shares outstanding during the period.
D Fees and expenses of any underlying Fidelity Central Funds are not included in the Fund's expense ratio. The Fund indirectly bears its proportionate share of the expenses of any underlying Fidelity Central Funds.
E Amount does not include the portfolio activity of any underlying Fidelity Central Funds.
F Expense ratios reflect operating expenses of the class. Expenses before reductions do not reflect amounts reimbursed by the investment adviser or reductions from brokerage service arrangements or reductions from other expense offset arrangements and do not represent the amount paid by the class during periods when reimbursements or reductions occur. Expenses net of fee waivers reflect expenses after reimbursement by the investment adviser but prior to reductions from brokerage service arrangements or other expense offset arrangements. Expenses net of all reductions represent the net expenses paid by the class.
G The portfolio turnover rate does not include the assets acquired in the merger.
H Amount represents less than $.01 per share.
See accompanying notes which are an integral part of the financial statements.
Annual Report
Financial Highlights - Class T
Years ended October 31, | 2012 | 2011 | 2010 | 2009 | 2008 |
Selected Per-Share Data | | | | | |
Net asset value, beginning of period | $ 27.98 | $ 32.20 | $ 25.40 | $ 15.43 | $ 36.88 |
Income from Investment Operations | | | | | |
Net investment income (loss) C | .25 | .25 | .15 | .14 | .12 |
Net realized and unrealized gain (loss) | 1.33 | (2.55) | 6.94 | 9.86 | (18.38) |
Total from investment operations | 1.58 | (2.30) | 7.09 | 10.00 | (18.26) |
Distributions from net investment income | (.20) | (.12) | (.08) | (.04) | (.14) |
Distributions from net realized gain | (1.23) | (1.81) | (.22) | - | (3.06) |
Total distributions | (1.43) | (1.93) | (.30) | (.04) | (3.20) |
Redemption fees added to paid in capital C | - H | .01 | .01 | .01 | .01 |
Net asset value, end of period | $ 28.13 | $ 27.98 | $ 32.20 | $ 25.40 | $ 15.43 |
Total Return A,B | 6.04% | (7.70)% | 28.13% | 65.06% | (53.79)% |
Ratios to Average Net Assets D,F | | | | | |
Expenses before reductions | 1.70% | 1.70% | 1.74% | 1.84% | 1.80% |
Expenses net of fee waivers, if any | 1.70% | 1.69% | 1.74% | 1.75% | 1.75% |
Expenses net of all reductions | 1.67% | 1.65% | 1.70% | 1.66% | 1.66% |
Net investment income (loss) | .95% | .82% | .55% | .69% | .48% |
Supplemental Data | | | | | |
Net assets, end of period (000 omitted) | $ 49,359 | $ 55,452 | $ 61,620 | $ 45,259 | $ 25,205 |
Portfolio turnover rate E | 95% | 119% | 138% | 91% | 92% G |
A Total returns would have been lower if certain expenses had not been reduced during the applicable periods shown.
B Total returns do not include the effect of the sales charges.
C Calculated based on average shares outstanding during the period.
D Fees and expenses of any underlying Fidelity Central Funds are not included in the Fund's expense ratio. The Fund indirectly bears its proportionate share of the expenses of any underlying Fidelity Central Funds.
E Amount does not include the portfolio activity of any underlying Fidelity Central Funds.
F Expense ratios reflect operating expenses of the class. Expenses before reductions do not reflect amounts reimbursed by the investment adviser or reductions from brokerage service arrangements or reductions from other expense offset arrangements and do not represent the amount paid by the class during periods when reimbursements or reductions occur. Expenses net of fee waivers reflect expenses after reimbursement by the investment adviser but prior to reductions from brokerage service arrangements or other expense offset arrangements. Expenses net of all reductions represent the net expenses paid by the class.
G The portfolio turnover rate does not include the assets acquired in the merger.
H Amount represents less than $.01 per share.
See accompanying notes which are an integral part of the financial statements.
Annual Report
Financial Highlights - Class B
Years ended October 31, | 2012 | 2011 | 2010 | 2009 | 2008 |
Selected Per-Share Data | | | | | |
Net asset value, beginning of period | $ 26.62 | $ 30.72 | $ 24.29 | $ 14.82 | $ 35.55 |
Income from Investment Operations | | | | | |
Net investment income (loss) C | .12 | .10 | .02 | .04 | (.01) |
Net realized and unrealized gain (loss) | 1.26 | (2.44) | 6.61 | 9.45 | (17.68) |
Total from investment operations | 1.38 | (2.34) | 6.63 | 9.49 | (17.69) |
Distributions from net investment income | - | - | - | (.03) | - |
Distributions from net realized gain | (1.23) | (1.77) | (.21) | - | (3.05) |
Total distributions | (1.23) | (1.77) | (.21) | (.03) | (3.05) |
Redemption fees added to paid in capital C | - H | .01 | .01 | .01 | .01 |
Net asset value, end of period | $ 26.77 | $ 26.62 | $ 30.72 | $ 24.29 | $ 14.82 |
Total Return A,B | 5.51% | (8.16)% | 27.48% | 64.23% | (54.01)% |
Ratios to Average Net Assets D,F | | | | | |
Expenses before reductions | 2.19% | 2.19% | 2.24% | 2.32% | 2.29% |
Expenses net of fee waivers, if any | 2.19% | 2.18% | 2.24% | 2.25% | 2.25% |
Expenses net of all reductions | 2.16% | 2.15% | 2.20% | 2.16% | 2.16% |
Net investment income (loss) | .46% | .32% | .06% | .19% | (.02)% |
Supplemental Data | | | | | |
Net assets, end of period (000 omitted) | $ 15,823 | $ 20,831 | $ 29,611 | $ 25,750 | $ 17,040 |
Portfolio turnover rate E | 95% | 119% | 138% | 91% | 92% G |
A Total returns would have been lower if certain expenses had not been reduced during the applicable periods shown.
B Total returns do not include the effect of the contingent deferred sales charge.
C Calculated based on average shares outstanding during the period.
D Fees and expenses of any underlying Fidelity Central Funds are not included in the Fund's expense ratio. The Fund indirectly bears its proportionate share of the expenses of any underlying Fidelity Central Funds.
E Amount does not include the portfolio activity of any underlying Fidelity Central Funds.
F Expense ratios reflect operating expenses of the class. Expenses before reductions do not reflect amounts reimbursed by the investment adviser or reductions from brokerage service arrangements or reductions from other expense offset arrangements and do not represent the amount paid by the class during periods when reimbursements or reductions occur. Expenses net of fee waivers reflect expenses after reimbursement by the investment adviser but prior to reductions from brokerage service arrangements or other expense offset arrangements. Expenses net of all reductions represent the net expenses paid by the class.
G The portfolio turnover rate does not include the assets acquired in the merger.
H Amount represents less than $.01 per share.
See accompanying notes which are an integral part of the financial statements.
Annual Report
Financial Highlights - Class C
Years ended October 31, | 2012 | 2011 | 2010 | 2009 | 2008 |
Selected Per-Share Data | | | | | |
Net asset value, beginning of period | $ 26.44 | $ 30.58 | $ 24.19 | $ 14.76 | $ 35.48 |
Income from Investment Operations | | | | | |
Net investment income (loss) C | .13 | .11 | .03 | .04 | - H |
Net realized and unrealized gain (loss) | 1.25 | (2.41) | 6.59 | 9.41 | (17.63) |
Total from investment operations | 1.38 | (2.30) | 6.62 | 9.45 | (17.63) |
Distributions from net investment income | (.06) | (.04) | (.02) | (.03) | (.04) |
Distributions from net realized gain | (1.23) | (1.81) | (.22) | - | (3.06) |
Total distributions | (1.29) | (1.85) | (.24) | (.03) | (3.10) |
Redemption fees added to paid in capital C | - H | .01 | .01 | .01 | .01 |
Net asset value, end of period | $ 26.53 | $ 26.44 | $ 30.58 | $ 24.19 | $ 14.76 |
Total Return A,B | 5.57% | (8.10)% | 27.58% | 64.21% | (54.02)% |
Ratios to Average Net Assets D,F | | | | | |
Expenses before reductions | 2.16% | 2.13% | 2.17% | 2.28% | 2.25% |
Expenses net of fee waivers, if any | 2.16% | 2.13% | 2.17% | 2.25% | 2.25% |
Expenses net of all reductions | 2.13% | 2.10% | 2.13% | 2.16% | 2.16% |
Net investment income (loss) | .49% | .37% | .12% | .19% | (.02)% |
Supplemental Data | | | | | |
Net assets, end of period (000 omitted) | $ 67,074 | $ 78,939 | $ 87,089 | $ 59,491 | $ 30,577 |
Portfolio turnover rate E | 95% | 119% | 138% | 91% | 92% G |
A Total returns would have been lower if certain expenses had not been reduced during the applicable periods shown.
B Total returns do not include the effect of the contingent deferred sales charge.
C Calculated based on average shares outstanding during the period.
D Fees and expenses of any underlying Fidelity Central Funds are not included in the Fund's expense ratio. The Fund indirectly bears its proportionate share of the expenses of any underlying Fidelity Central Funds.
E Amount does not include the portfolio activity of any underlying Fidelity Central Funds.
F Expense ratios reflect operating expenses of the class. Expenses before reductions do not reflect amounts reimbursed by the investment adviser or reductions from brokerage service arrangements or reductions from other expense offset arrangements and do not represent the amount paid by the class during periods when reimbursements or reductions occur. Expenses net of fee waivers reflect expenses after reimbursement by the investment adviser but prior to reductions from brokerage service arrangements or other expense offset arrangements. Expenses net of all reductions represent the net expenses paid by the class.
G The portfolio turnover rate does not include the assets acquired in the merger.
H Amount represents less than $.01 per share.
See accompanying notes which are an integral part of the financial statements.
Annual Report
Financial Highlights - Institutional Class
Years ended October 31, | 2012 | 2011 | 2010 | 2009 | 2008 |
Selected Per-Share Data | | | | | |
Net asset value, beginning of period | $ 29.49 | $ 33.80 | $ 26.58 | $ 16.07 | $ 38.25 |
Income from Investment Operations | | | | | |
Net investment income (loss) B | .44 | .46 | .34 | .26 | .27 |
Net realized and unrealized gain (loss) | 1.39 | (2.69) | 7.26 | 10.29 | (19.09) |
Total from investment operations | 1.83 | (2.23) | 7.60 | 10.55 | (18.82) |
Distributions from net investment income | (.42) | (.29) | (.17) | (.05) | (.31) |
Distributions from net realized gain | (1.23) | (1.81) | (.22) | - | (3.06) |
Total distributions | (1.65) | (2.09) H | (.39) | (.05) | (3.37) |
Redemption fees added to paid in capital B | - G | .01 | .01 | .01 | .01 |
Net asset value, end of period | $ 29.67 | $ 29.49 | $ 33.80 | $ 26.58 | $ 16.07 |
Total Return A | 6.64% | (7.13)% | 28.87% | 65.94% | (53.53)% |
Ratios to Average Net Assets C,E | | | | | |
Expenses before reductions | 1.11% | 1.10% | 1.14% | 1.25% | 1.20% |
Expenses net of fee waivers, if any | 1.11% | 1.10% | 1.14% | 1.25% | 1.20% |
Expenses net of all reductions | 1.08% | 1.06% | 1.10% | 1.16% | 1.11% |
Net investment income (loss) | 1.54% | 1.41% | 1.16% | 1.18% | 1.03% |
Supplemental Data | | | | | |
Net assets, end of period (000 omitted) | $ 40,026 | $ 49,888 | $ 45,042 | $ 23,888 | $ 5,933 |
Portfolio turnover rate D | 95% | 119% | 138% | 91% | 92% F |
A Total returns would have been lower if certain expenses had not been reduced during the applicable periods shown.
B Calculated based on average shares outstanding during the period.
C Fees and expenses of any underlying Fidelity Central Funds are not included in the Fund's expense ratio. The Fund indirectly bears its proportionate share of the expenses of any underlying Fidelity Central Funds.
D Amount does not include the portfolio activity of any underlying Fidelity Central Funds.
E Expense ratios reflect operating expenses of the class. Expenses before reductions do not reflect amounts reimbursed by the investment adviser or reductions from brokerage service arrangements or reductions from other expense offset arrangements and do not represent the amount paid by the class during periods when reimbursements or reductions occur. Expenses net of fee waivers reflect expenses after reimbursement by the investment adviser but prior to reductions from brokerage service arrangements or other expense offset arrangements. Expenses net of all reductions represent the net expenses paid by the class.
F The portfolio turnover rate does not include the assets acquired in the merger.
G Amount represents less than $.01 per share.
H Total distributions of $2.09 per share is comprised of distributions from net investment income of $.288 and distributions from net realized gain of $1.805 per share.
See accompanying notes which are an integral part of the financial statements.
Annual Report
Notes to Financial Statements
For the period ended October 31, 2012
1. Organization.
Fidelity Advisor Emerging Asia Fund (the Fund) is a fund of Fidelity Advisor Series VIII (the Trust) and is authorized to issue an unlimited number of shares. The Trust is registered under the Investment Company Act of 1940, as amended (the 1940 Act), as an open-end management investment company organized as a Massachusetts business trust. The Fund offers Class A, Class T, Class C and Institutional Class shares, each of which, along with Class B shares, has equal rights as to assets and voting privileges. Effective after the close of business on September 1, 2010, Class B shares were closed to new accounts and additional purchases, except for exchanges and reinvestments. Each class has exclusive voting rights with respect to matters that affect that class. Class B shares will automatically convert to Class A shares after a holding period of seven years from the initial date of purchase. Investment income, realized and unrealized capital gains and losses, the common expenses of the Fund, and certain fund-level expense reductions, if any, are allocated on a pro-rata basis to each class based on the relative net assets of each class to the total net assets of the Fund. Each class differs with respect to transfer agent and distribution and service plan fees incurred. Certain expense reductions may also differ by class. The Fund's investments in emerging markets can be subject to social, economic, regulatory, and political uncertainties and can be extremely volatile.
2. Investments in Fidelity Central Funds.
The Fund invests in Fidelity Central Funds, which are open-end investment companies available only to other investment companies and accounts managed by Fidelity Management & Research Company (FMR) and its affiliates. The Fund's Schedule of Investments lists each of the Fidelity Central Funds held as of period end, if any, as an investment of the Fund, but does not include the underlying holdings of each Fidelity Central Fund. As an Investing Fund, the Fund indirectly bears its proportionate share of the expenses of the underlying Fidelity Central Funds.
The Money Market Central Funds seek preservation of capital and current income and are managed by Fidelity Investments Money Management, Inc. (FIMM), an affiliate of FMR.
A complete unaudited list of holdings for each Fidelity Central Fund is available upon request or at the Securities and Exchange Commission (the SEC) web site at www.sec.gov. In addition, the financial statements of the Fidelity Central Funds, which are not covered by the Fund's Report of Independent Registered Public Accounting Firm, are available on the SEC web site or upon request.
Annual Report
Notes to Financial Statements - continued
3. Significant Accounting Policies.
The financial statements have been prepared in conformity with accounting principles generally accepted in the United States of America (GAAP), which require management to make certain estimates and assumptions at the date of the financial statements. Actual results could differ from those estimates. Subsequent events, if any, through the date that the financial statements were issued have been evaluated in the preparation of the financial statements. The following summarizes the significant accounting policies of the Fund:
Security Valuation. Investments are valued as of 4:00 p.m. Eastern time on the last calendar day of the period. In accordance with valuation policies and procedures approved by the Board of Trustees (the Board), the Fund attempts to obtain prices from one or more third party pricing vendors or brokers to value its investments. When current market prices, quotations or rates are not readily available or reliable, securities will be fair valued in good faith by the FMR Fair Value Committee (the Committee), in accordance with procedures adopted by the Fund's Board. Factors used in determining fair value vary by security type and may include market or security specific events. The frequency with which these procedures are used cannot be predicted and they may be utilized to a significant extent. The Committee oversees the Fund's valuation policies and procedures and is responsible for approving and reporting to the Board all fair value determinations.
The Fund categorizes the inputs to valuation techniques used to value its investments into a disclosure hierarchy consisting of three levels as shown below:
Level 1 - quoted prices in active markets for identical investments
Level 2 - other significant observable inputs (including quoted prices for similar investments, interest rates, prepayment speeds, etc.)
Level 3 - unobservable inputs (including the Fund's own assumptions based on the best information available)
Valuation techniques used to value the Fund's investments by major category are as follows:
Equity securities, including restricted securities, for which market quotations are readily available, are valued at the last reported sale price or official closing price as reported by a third party pricing vendor on the primary market or exchange on which they are traded and are categorized as Level 1 in the hierarchy. In the event there were no sales during the day or closing prices are not available, securities are valued at the last quoted bid price or may be valued using the last available price and are generally categorized as Level 2 in the hierarchy. For foreign equity securities, when significant market or security specific events arise, comparisons to the valuation of American Depositary Receipts
Annual Report
3. Significant Accounting Policies - continued
Security Valuation - continued
(ADRs), futures contracts, Exchange-Traded Funds (ETFs) and certain indexes as well as quoted prices for similar securities are used and are categorized as Level 2 in the hierarchy. Utilizing these techniques may result in transfers between Level 1 and Level 2.
Investments in open-end mutual funds, including the Fidelity Central Funds, are valued at their closing net asset value (NAV) each business day and are categorized as Level 1 in the hierarchy.
Changes in valuation techniques may result in transfers in or out of an assigned level within the disclosure hierarchy. The aggregate value of investments by input level, as of October 31, 2012, including information on transfers between Levels 1 and 2, is included at the end of the Fund's Schedule of Investments.
Foreign Currency Translation. The Fund may use foreign currency contracts to facilitate transactions in foreign-denominated securities. Gains and losses from these transactions may arise from changes in the value of the foreign currency or if the counterparties do not perform under the contracts' terms.
Foreign-denominated assets, including investment securities, and liabilities are translated into U.S. dollars at the exchange rates at period end. Purchases and sales of investment securities, income and dividends received and expenses denominated in foreign currencies are translated into U.S. dollars at the exchange rate in effect on the transaction date.
The effects of exchange rate fluctuations on investments are included with the net realized and unrealized gain (loss) on investment securities. Other foreign currency transactions resulting in realized and unrealized gain (loss) are disclosed separately.
Investment Transactions and Income. For financial reporting purposes, the Fund's investment holdings and NAV include trades executed through the end of the last business day of the period. The NAV per share for processing shareholder transactions is calculated as of the close of business of the New York Stock Exchange (NYSE), normally 4:00 p.m. Eastern time and includes trades executed through the end of the prior business day. Gains and losses on securities sold are determined on the basis of identified cost. Dividend income is recorded on the ex-dividend date, except for certain dividends from foreign securities where the ex-dividend date may have passed, which are recorded as soon as the Fund is informed of the ex-dividend date. Non-cash dividends included in dividend income, if any, are recorded at the fair market value of the securities received. Interest income and distributions from the Fidelity Central Funds are accrued as earned. Investment income is recorded net of foreign taxes withheld where recovery of such taxes is uncertain.
Annual Report
Notes to Financial Statements - continued
3. Significant Accounting Policies - continued
Expenses. Expenses directly attributable to a fund are charged to that fund. Expenses attributable to more than one fund are allocated among the respective funds on the basis of relative net assets or other appropriate methods. Expense estimates are accrued in the period to which they relate and adjustments are made when actual amounts are known.
Income Tax Information and Distributions to Shareholders. Each year, the Fund intends to qualify as a regulated investment company under Subchapter M of the Internal Revenue Code, including distributing substantially all of its taxable income and realized gains. As a result, no provision for income taxes is required. As of October 31, 2012, the Fund did not have any unrecognized tax benefits in the financial statements; nor is the Fund aware of any tax positions for which it is reasonably possible that the total amounts of unrecognized tax benefits will significantly change in the next twelve months. The Fund files a U.S. federal tax return, in addition to state and local tax returns as required. A fund's federal income tax returns are subject to examination by the Internal Revenue Service (IRS) for a period of three fiscal years after they are filed. State and local tax returns may be subject to examination for an additional fiscal year depending on the jurisdiction. Foreign taxes are provided for based on the Fund's understanding of the tax rules and rates that exist in the foreign markets in which it invests. The Fund received a final ruling from the Authority for Advance Ruling in India regarding the applicability of taxes imposed by the country on realized capital gains under the US/India tax treaty. The ruling entitled the Fund to a refund of capital gains taxes paid in prior years and exempts the Fund from taxes on future realized gains. The India Central Board of Direct Taxation may challenge the ruling at any time which could result in the reversal of some or all of the benefits recorded by the Fund.
Distributions are declared and recorded on the ex-dividend date. Income dividends and capital gain distributions are declared separately for each class. Income and capital gain distributions are determined in accordance with income tax regulations, which may differ from GAAP. In addition, the Fund claimed a portion of the payment made to redeeming shareholders as a distribution for income tax purposes.
Capital accounts within the financial statements are adjusted for permanent book-tax differences. These adjustments have no impact on net assets or the results of operations. Temporary book-tax differences will reverse in a subsequent period.
Book-tax differences are primarily due to foreign currency transactions, passive foreign investment companies (PFIC), capital loss carryforwards and losses deferred due to wash sales.
Annual Report
3. Significant Accounting Policies - continued
Income Tax Information and Distributions to Shareholders - continued
The federal tax cost of investment securities and unrealized appreciation (depreciation) as of period end were as follows:
Gross unrealized appreciation | $ 54,784,892 |
Gross unrealized depreciation | (11,531,850) |
Net unrealized appreciation (depreciation) on securities and other investments | $ 43,253,042 |
| |
Tax Cost | $ 289,849,330 |
The tax-based components of distributable earnings as of period end were as follows:
Undistributed ordinary income | $ 3,944,451 |
Capital loss carryforward | $ (12,885,749) |
Net unrealized appreciation (depreciation) | $ 43,206,486 |
Capital loss carryforwards are only available to offset future capital gains of the Fund to the extent provided by regulations and may be limited. Under the Regulated Investment Company Modernization Act of 2010 (the Act), the Fund is permitted to carry forward capital losses incurred in taxable years beginning after December 22, 2010 for an unlimited period and such capital losses are required to be used prior to any losses that expire. Capital loss carryforwards were as follows:
No expiration | |
Short-term | $ (12,885,749) |
The tax character of distributions paid was as follows:
| October 31, 2012 | October 31, 2011 |
Ordinary Income | $ 3,170,802 | $ 3,521,543 |
Long-term Capital Gains | 16,643,937 | 22,144,049 |
Total | $ 19,814,739 | $ 25,665,592 |
Short-Term Trading (Redemption) Fees. Shares held by investors in the Fund less than 90 days are subject to a redemption fee equal to 1.50% of the net asset value of shares redeemed. All redemption fees, which reduce the proceeds of the shareholder redemption, are retained by the Fund and accounted for as an addition to paid in capital.
Annual Report
Notes to Financial Statements - continued
3. Significant Accounting Policies - continued
New Accounting Pronouncement. In December 2011, the Financial Accounting Standards Board issued Accounting Standard Update No. 2011-11, Disclosures about Offsetting Assets and Liabilities. The update creates new disclosure requirements requiring entities to disclose both gross and net information for derivatives and other financial instruments that are either offset in the Statement of Assets and Liabilities or subject to an enforceable master netting arrangement or similar agreement. The disclosure requirements are effective for annual reporting periods beginning on or after January 1, 2013, and interim periods within those annual periods. Management is currently evaluating the impact of the update's adoption on the Fund's financial statement disclosures.
4. Purchases and Sales of Investments.
Purchases and sales of securities, other than short-term securities, aggregated $335,090,032 and $397,339,994, respectively.
5. Fees and Other Transactions with Affiliates.
Management Fee. FMR and its affiliates provide the Fund with investment management related services for which the Fund pays a monthly management fee. The management fee is the sum of an individual fund fee rate that is based on an annual rate of .45% of the Fund's average net assets and an annualized group fee rate that averaged .26% during the period. The group fee rate is based upon the average net assets of all the mutual funds advised by FMR. The group fee rate decreases as assets under management increase and increases as assets under management decrease. For the period, the total annual management fee rate was .71% of the Fund's average net assets.
Distribution and Service Plan Fees. In accordance with Rule 12b-1 of the 1940 Act, the Fund has adopted separate Distribution and Service Plans for each class of shares. Certain classes pay Fidelity Distributors Corporation (FDC), an affiliate of FMR, separate Distribution and Service Fees, each of which is based on an annual percentage of each class' average net assets. In addition, FDC may pay financial intermediaries for selling shares of the Fund and providing shareholder support services. For the period, the Distribution and Service Fee rates, total fees and amounts retained by FDC were as follows:
| Distribution
Fee | Service
Fee | Total
Fees | Retained
by FDC |
Class A | -% | .25% | $ 420,135 | $ 10,027 |
Class T | .25% | .25% | 257,066 | 1,438 |
Class B | .75% | .25% | 178,138 | 133,870 |
Class C | .75% | .25% | 729,119 | 98,947 |
| | | $ 1,584,458 | $ 244,282 |
Annual Report
5. Fees and Other Transactions with Affiliates - continued
Sales Load. FDC may receive a front-end sales charge of up to 5.75% for selling Class A shares and 3.50% for selling Class T shares, some of which is paid to financial intermediaries for selling shares of the Fund. Depending on the holding period, FDC may receive contingent deferred sales charges levied on Class A, Class T, Class B, and Class C redemptions. The deferred sales charges range from 5.00% to 1.00% for Class B shares, 1.00% for Class C shares, 1.00% for certain purchases of Class A shares and .25% for certain purchases of Class T shares.
For the period, sales charge amounts retained by FDC were as follows:
| Retained
by FDC |
Class A | $ 53,901 |
Class T | 11,098 |
Class B* | 30,233 |
Class C* | 11,782 |
| $ 107,014 |
* When Class B and Class C shares are initially sold, FDC pays commissions from its own resources to financial intermediaries through which the sales are made.
Transfer Agent Fees. Fidelity Investments Institutional Operations Company, Inc. (FIIOC), an affiliate of FMR, is the transfer, dividend disbursing and shareholder servicing agent for each class of the Fund. FIIOC receives account fees and asset-based fees that vary according to the account size and type of account of the shareholders of the respective classes of the Fund. FIIOC pays for typesetting, printing and mailing of shareholder reports, except proxy statements. For the period, transfer agent fees for each class were as follows:
| Amount | % of
Average
Net Assets |
Class A | $ 460,834 | .27 |
Class T | 159,449 | .31 |
Class B | 53,240 | .30 |
Class C | 192,502 | .26 |
Institutional Class | 99,441 | .22 |
| $ 965,466 | |
Accounting and Security Lending Fees. Fidelity Service Company, Inc. (FSC), an affiliate of FMR, maintains the Fund's accounting records. The accounting fee is based on the level of average net assets for each month. Under a separate contract, FSC
Annual Report
Notes to Financial Statements - continued
5. Fees and Other Transactions with Affiliates - continued
Accounting and Security Lending Fees - continued
administers the security lending program. The security lending fee is based on the number and duration of lending transactions.
Brokerage Commissions. The Fund placed a portion of its portfolio transactions with brokerage firms which are affiliates of the investment adviser. The commissions paid to these affiliated firms were $252 for the period.
Interfund Lending Program. Pursuant to an Exemptive Order issued by the SEC, the Fund, along with other registered investment companies having management contracts with FMR, may participate in an interfund lending program. This program provides an alternative credit facility allowing the funds to borrow from, or lend money to, other participating affiliated funds. At period end, there were no interfund loans outstanding. The Fund's activity in this program during the period for which loans were outstanding was as follows:
Borrower or Lender | Average Loan
Balance | Weighted Average Interest Rate | Interest
Expense |
Borrower | $ 6,028,737 | .38% | $ 1,221 |
6. Committed Line of Credit.
The Fund participates with other funds managed by FMR or an affiliate in a $4.25 billion credit facility (the "line of credit") to be utilized for temporary or emergency purposes to fund shareholder redemptions or for other short-term liquidity purposes. The Fund has agreed to pay commitment fees on its pro-rata portion of the line of credit, which amounted to $992 and is reflected in Miscellaneous expenses on the Statement of Operations. During the period, there were no borrowings on this line of credit.
7. Security Lending.
The Fund lends portfolio securities through a lending agent from time to time in order to earn additional income. For equity securities, a lending agent is used and may loan securities to certain qualified borrowers, including Fidelity Capital Markets (FCM), a broker-dealer affiliated with the Fund. On the settlement date of the loan, the Fund receives collateral (in the form of U.S. Treasury obligations, letters of credit and/or cash) against the loaned securities and maintains collateral in an amount not less than 100% of the market value of the loaned securities during the period of the loan. The market value of the loaned securities is determined at the close of business of the Fund and any additional required collateral is delivered to the Fund on the next business day. If the borrower defaults on its obligation to return the securities loaned because of insolvency or other reasons, a fund could experience delays and costs in recovering the securities
Annual Report
7. Security Lending - continued
loaned or in gaining access to the collateral. Any cash collateral received is invested in the Fidelity Securities Lending Cash Central Fund. The value of loaned securities and cash collateral at period end are disclosed on the Fund's Statement of Assets and Liabilities. Security lending income represents the income earned on investing cash collateral, less rebates paid to borrowers and any lending agent fees associated with the loan, plus any premium payments received for lending certain types of securities. Security lending income is presented in the Statement of Operations as a component of income from Fidelity Central Funds. Total security lending income during the period amounted to $76,377. During the period, there were no securities loaned to FCM.
8. Expense Reductions.
Many of the brokers with whom FMR places trades on behalf of the Fund provided services to the Fund in addition to trade execution. These services included payments of certain expenses on behalf of the Fund totaling $111,304 for the period.
9. Distributions to Shareholders.
Distributions to shareholders of each class were as follows:
Years ended October 31, | 2012 | 2011 |
From net investment income | | |
Class A | $ 1,898,062 | $ 1,195,236 |
Class T | 399,045 | 238,089 |
Class C | 179,759 | 129,641 |
Institutional Class | 693,936 | 411,224 |
Total | $ 3,170,802 | $ 1,974,190 |
From net realized gain | | |
Class A | $ 7,604,616 | $ 10,575,420 |
Class T | 2,417,855 | 3,522,540 |
Class B | 945,064 | 1,697,909 |
Class C | 3,624,620 | 5,318,244 |
Institutional Class | 2,051,782 | 2,577,289 |
Total | $ 16,643,937 | $ 23,691,402 |
Annual Report
Notes to Financial Statements - continued
10. Share Transactions.
Transactions for each class of shares were as follows:
| Shares | Dollars |
Years ended October 31, | 2012 | 2011 | 2012 | 2011 |
Class A | | | | |
Shares sold | 989,897 | 2,202,556 | $ 27,425,901 | $ 71,049,522 |
Reinvestment of distributions | 303,306 | 309,654 | 8,125,561 | 9,819,123 |
Shares redeemed | (1,983,648) | (2,005,332) | (54,478,732) | (62,867,653) |
Net increase (decrease) | (690,445) | 506,878 | $ (18,927,270) | $ 18,000,992 |
Class T | | | | |
Shares sold | 243,741 | 487,526 | $ 6,578,292 | $ 15,326,473 |
Reinvestment of distributions | 105,156 | 118,542 | 2,751,935 | 3,673,606 |
Shares redeemed | (575,900) | (538,208) | (15,451,183) | (16,492,902) |
Net increase (decrease) | (227,003) | 67,860 | $ (6,120,956) | $ 2,507,177 |
Class B | | | | |
Shares sold | 12,950 | 65,556 | $ 335,990 | $ 2,016,841 |
Reinvestment of distributions | 30,756 | 44,891 | 769,523 | 1,329,672 |
Shares redeemed | (235,196) | (291,995) | (6,006,764) | (8,641,379) |
Net increase (decrease) | (191,490) | (181,548) | $ (4,901,251) | $ (5,294,866) |
Class C | | | | |
Shares sold | 321,798 | 976,733 | $ 8,176,407 | $ 29,282,683 |
Reinvestment of distributions | 125,179 | 152,906 | 3,103,186 | 4,496,965 |
Shares redeemed | (903,872) | (992,268) | (22,892,814) | (28,874,366) |
Net increase (decrease) | (456,895) | 137,371 | $ (11,613,221) | $ 4,905,282 |
Institutional Class | | | | |
Shares sold | 751,216 | 1,196,148 | $ 21,500,312 | $ 38,645,718 |
Reinvestment of distributions | 64,226 | 57,110 | 1,763,657 | 1,854,949 |
Shares redeemed | (1,158,394) | (893,992) | (32,275,682) | (28,329,397) |
Net increase (decrease) | (342,952) | 359,266 | $ (9,011,713) | $ 12,171,270 |
11. Other.
The Fund's organizational documents provide former and current trustees and officers with a limited indemnification against liabilities arising in connection with the performance of their duties to the Fund. In the normal course of business, the Fund may also enter into contracts that provide general indemnifications. The Fund's maximum exposure under these arrangements is unknown as this would be dependent on future claims that may be made against the Fund. The risk of material loss from such claims is considered remote.
Annual Report
To the Trustees of Fidelity Advisor Series VIII and the Shareholders of Fidelity Advisor Emerging Asia Fund:
In our opinion, the accompanying statement of assets and liabilities, including the schedule of investments, and the related statements of operations and of changes in net assets and the financial highlights present fairly, in all material respects, the financial position of Fidelity Advisor Emerging Asia Fund (a fund of Fidelity Advisor Series VIII) at October 31, 2012, the results of its operations for the year then ended, the changes in its net assets for each of the two years in the period then ended and the financial highlights for each of the five years in the period then ended, in conformity with accounting principles generally accepted in the United States of America. These financial statements and financial highlights (hereafter referred to as "financial statements") are the responsibility of the Fidelity Advisor Emerging Asia Fund's management. Our responsibility is to express an opinion on these financial statements based on our audits. We conducted our audits of these financial statements in accordance with the standards of the Public Company Accounting Oversight Board (United States). Those standards require that we plan and perform the audit to obtain reasonable assurance about whether the financial statements are free of material misstatement. An audit includes examining, on a test basis, evidence supporting the amounts and disclosures in the financial statements, assessing the accounting principles used and significant estimates made by management, and evaluating the overall financial statement presentation. We believe that our audits, which included confirmation of securities at October 31, 2012 by correspondence with the custodian and brokers, provide a reasonable basis for our opinion.
PricewaterhouseCoopers LLP
Boston, Massachusetts
December 14, 2012
Annual Report
The Trustees, Members of the Advisory Board, and executive officers of the trust and fund, as applicable, are listed below. The Board of Trustees governs the fund and is responsible for protecting the interests of shareholders. The Trustees are experienced executives who meet periodically throughout the year to oversee the fund's activities, review contractual arrangements with companies that provide services to the fund, oversee management of the risks associated with such activities and contractual arrangements, and review the fund's performance. Except for James C. Curvey, each of the Trustees oversees 236 funds advised by FMR or an affiliate. Mr. Curvey oversees 443 funds advised by FMR or an affiliate.
The Trustees hold office without limit in time except that (a) any Trustee may resign; (b) any Trustee may be removed by written instrument, signed by at least two-thirds of the number of Trustees prior to such removal; (c) any Trustee who requests to be retired or who has become incapacitated by illness or injury may be retired by written instrument signed by a majority of the other Trustees; and (d) any Trustee may be removed at any special meeting of shareholders by a two-thirds vote of the outstanding voting securities of the trust. Each Trustee who is not an interested person (as defined in the 1940 Act) (Independent Trustee), shall retire not later than the last day of the calendar year in which his or her 75th birthday occurs. The Independent Trustees may waive this mandatory retirement age policy with respect to individual Trustees. The executive officers and Advisory Board Members hold office without limit in time, except that any officer and Advisory Board Member may resign or may be removed by a vote of a majority of the Trustees at any regular meeting or any special meeting of the Trustees. Except as indicated, each individual has held the office shown or other offices in the same company for the past five years.
Experience, Skills, Attributes, and Qualifications of the Fund's Trustees. The Governance and Nominating Committee has adopted a statement of policy that describes the experience, qualifications, attributes, and skills that are necessary and desirable for potential Independent Trustee candidates (Statement of Policy). The Board believes that each Trustee satisfied at the time he or she was initially elected or appointed a Trustee, and continues to satisfy, the standards contemplated by the Statement of Policy. The Governance and Nominating Committee also engages professional search firms to help identify potential Independent Trustee candidates who have the experience, qualifications, attributes, and skills consistent with the Statement of Policy. From time to time, additional criteria based on the composition and skills of the current Independent Trustees, as well as experience or skills that may be appropriate in light of future changes to board composition, business conditions, and regulatory or other developments, have also been considered by the professional search firms and the Governance and Nominating Committee. In addition, the Board takes into account the Trustees' commitment and participation in Board and committee meetings, as well as their leadership of standing and ad hoc committees throughout their tenure.
In determining that a particular Trustee was and continues to be qualified to serve as a Trustee, the Board has considered a variety of criteria, none of which, in isolation, was controlling. The Board believes that, collectively, the Trustees have balanced and diverse experience, qualifications, attributes, and skills, which allow the Board to operate effectively in governing the fund and protecting the interests of shareholders. Information about the specific experience, skills, attributes, and qualifications of each Trustee, which in each case led to the Board's conclusion that the Trustee should serve (or continue to serve) as a trustee of the fund, is provided below.
Annual Report
Board Structure and Oversight Function. James C. Curvey is an interested person (as defined in the 1940 Act) and currently serves as Chairman. The Trustees have determined that an interested Chairman is appropriate and benefits shareholders because an interested Chairman has a personal and professional stake in the quality and continuity of services provided to the fund. Independent Trustees exercise their informed business judgment to appoint an individual of their choosing to serve as Chairman, regardless of whether the Trustee happens to be independent or a member of management. The Independent Trustees have determined that they can act independently and effectively without having an Independent Trustee serve as Chairman and that a key structural component for assuring that they are in a position to do so is for the Independent Trustees to constitute a substantial majority for the Board. The Independent Trustees also regularly meet in executive session. Ned C. Lautenbach serves as Chairman of the Independent Trustees and as such (i) acts as a liaison between the Independent Trustees and management with respect to matters important to the Independent Trustees and (ii) with management prepares agendas for Board meetings.
Fidelity funds are overseen by different Boards of Trustees. The fund's Board oversees Fidelity's equity and high income funds and another Board oversees Fidelity's investment-grade bond, money market, and asset allocation funds. The asset allocation funds may invest in Fidelity funds overseen by the fund's Board. The use of separate Boards, each with its own committee structure, allows the Trustees of each group of Fidelity funds to focus on the unique issues of the funds they oversee, including common research, investment, and operational issues. On occasion, the separate Boards establish joint committees to address issues of overlapping consequences for the Fidelity funds overseen by each Board.
The Trustees operate using a system of committees to facilitate the timely and efficient consideration of all matters of importance to the Trustees, the fund, and fund shareholders and to facilitate compliance with legal and regulatory requirements and oversight of the fund's activities and associated risks. The Board, acting through its committees, has charged FMR and its affiliates with (i) identifying events or circumstances the occurrence of which could have demonstrably adverse effects on the fund's business and/or reputation; (ii) implementing processes and controls to lessen the possibility that such events or circumstances occur or to mitigate the effects of such events or circumstances if they do occur; and (iii) creating and maintaining a system designed to evaluate continuously business and market conditions in order to facilitate the identification and implementation processes described in (i) and (ii) above. Because the day-to-day operations and activities of the fund's are carried out by or through FMR, its affiliates and other service providers, the fund's exposure to risks is mitigated but not eliminated by the processes overseen by the Trustees. While each of the Board's committees has responsibility for overseeing different aspects of the fund's activities, oversight is exercised primarily through the Operations, Audit, and Compliance Committees. In addition, the Independent Trustees have worked with FMR to enhance the Board's oversight of investment and financial risks, legal and regulatory risks, technology risks, and operational risks, including the development of additional risk reporting to the Board. For example, a working group comprised of Independent Trustees and FMR has worked and continues to work to review the Fidelity funds' valuation-related activities, reporting and risk management. Appropriate personnel, including but not limited to the fund's Chief Compliance Officer (CCO), FMR's internal auditor, the independent accountants, the fund's Treasurer and portfolio management personnel, make periodic reports to the Board's committees, as appropriate, including an annual review of FMR's risk management program for the Fidelity funds. The responsibilities of each standing committee, including their oversight responsibilities, are described further under "Standing Committees of the Fund's Trustees."
Annual Report
Trustees and Officers - continued
The fund's Statement of Additional Information (SAI) includes more information about the Trustees. To request a free copy, call Fidelity at 1-877-208-0098.
Interested Trustees*:
Correspondence intended for each Trustee who is an interested person may be sent to Fidelity Investments, 82 Devonshire Street, Boston, Massachusetts 02109.
Name, Age; Principal Occupations and Other Relevant Experience+ |
James C. Curvey (77) |
| Year of Election or Appointment: 2007 Mr. Curvey is Trustee and Chairman of the Board of Trustees of certain Trusts. Mr. Curvey also serves as Trustee (2007-present) of other investment companies advised by FMR. Mr. Curvey is a Director of Fidelity Investments Money Management, Inc. (2009-present), Director of Fidelity Research & Analysis Co. (2009-present) and Director of FMR and FMR Co., Inc. (2007-present). Mr. Curvey is also Vice Chairman (2007-present) and Director of FMR LLC. In addition, Mr. Curvey serves as an Overseer for the Boston Symphony Orchestra and a member of the Trustees of Villanova University. Previously, Mr. Curvey was the Vice Chairman (2006-2007) and Director (2000-2007) of FMR Corp. |
Ronald P. O'Hanley (55) |
| Year of Election or Appointment: 2011 Mr. O'Hanley is Director of FMR Co., Inc. (2010-present), Director of Fidelity Investments Money Management, Inc. (2010-present), Director of Fidelity Research & Analysis Company (2010-present), President of Fidelity Asset Management and Corporate Services and a member of Fidelity's Executive Committee (2010-present). Previously, Mr. O'Hanley served as President and Chief Executive Officer of BNY Mellon Asset Management (2007-2010). Mr. O'Hanley also served as Vice Chairman of Bank New York Mellon Corp. and a member of that firm's Executive Committee. Prior to the 2007 merger of The Bank of New York and Mellon Financial Corporation, he was Vice Chairman of Mellon Financial Corporation and President and Chief Executive Officer of Mellon Asset Management. He joined Mellon in February 1997. Mr. O'Hanley currently serves as Chairman of the Boston Public Library Foundation Board of Directors and sits on the Board of Directors of Beth Israel Deaconess Medical Center, the Board of Trustees of the Marine Biological Laboratory and the Advisory Board of the Maxwell School of Citizenship and Public Administration at Syracuse University. Mr. O'Hanley also chairs the Council on Asset Management for the Financial Services Roundtable and is a member of the Board of Directors of Institutional Investor's U.S. Institute. |
* Trustees have been determined to be "Interested Trustees" by virtue of, among other things, their affiliation with the trust or various entities under common control with FMR.
+ The information above includes each Trustee's principal occupation during the last five years and other information relating to the experience, attributes, and skills relevant to each Trustee's qualifications to serve as a Trustee, which led to the conclusion that each Trustee should serve as a Trustee for the fund.
Annual Report
Trustees and Officers - continued
Independent Trustees:
Correspondence intended for each Independent Trustee (that is, the Trustees other than the Interested Trustees) may be sent to Fidelity Investments, P.O. Box 55235, Boston, Massachusetts 02205-5235.
Name, Age; Principal Occupations and Other Relevant Experience+ |
Dennis J. Dirks (64) |
| Year of Election or Appointment: 2005 Prior to his retirement in May 2003, Mr. Dirks was Chief Operating Officer and a member of the Board of The Depository Trust & Clearing Corporation (DTCC). He also served as President, Chief Operating Officer, and Board member of The Depository Trust Company (DTC) and President and Board member of the National Securities Clearing Corporation (NSCC). In addition, Mr. Dirks served as Chief Executive Officer and Board member of the Government Securities Clearing Corporation, Chief Executive Officer and Board member of the Mortgage-Backed Securities Clearing Corporation, as a Trustee and a member of the Finance Committee of Manhattan College (2005-2008), and as a Trustee and a member of the Finance Committee of AHRC of Nassau County (2006-2008). Mr. Dirks is a member of the Independent Directors Council (IDC) Governing Council (2010-present) and Board of Directors for The Brookville Center for Children's Services, Inc. (2009-present). |
Alan J. Lacy (59) |
| Year of Election or Appointment: 2008 Mr. Lacy serves as Senior Adviser (2007-present) of Oak Hill Capital Partners, L.P. (private equity). Mr. Lacy also served as Chief Executive Officer (2000-2005) and Vice Chairman (2005-2006) of Sears Holdings Corporation and Sears, Roebuck and Co. (retail). In addition, Mr. Lacy serves as a member of the Board of Directors of Dave & Buster's Entertainment, Inc. (restaurant and entertainment complexes, 2010-present), Earth Fare, Inc. (retail grocery, 2012-present), The Hillman Companies, Inc. (hardware wholesalers, 2010-present), and Bristol-Myers Squibb Company (global pharmaceuticals, 2008-present). Mr. Lacy is a member of the Board of Trustees of The National Parks Conservation Association (2006-present). Previously, Mr. Lacy served as Chairman of the Board of Trustees of the National Parks Conservation Association (2008-2011) and as a member of the Board of Directors for the Western Union Company (global money transfer, 2006-2011). |
Ned C. Lautenbach (68) |
| Year of Election or Appointment: 2000 Mr. Lautenbach is Chairman of the Independent Trustees of the Equity and High Income Funds (2006-present). Mr. Lautenbach currently serves as the Lead Director of the Eaton Corporation Board of Directors (diversified industrial, 1997-present). Mr. Lautenbach is Chairman of the Board of Directors of the Philharmonic Center for the Arts in Naples, Florida (2012-present) and a member of the Council on Foreign Relations (1994-present). Previously, Mr. Lautenbach was a Partner/Advisory Partner at Clayton, Dubilier & Rice, LLC (private equity investment, 1998-2010), as well as a Director of Sony Corporation (2006-2007). |
Joseph Mauriello (68) |
| Year of Election or Appointment: 2008 Prior to his retirement in January 2006, Mr. Mauriello served in numerous senior management positions including Deputy Chairman and Chief Operating Officer (2004-2005), and Vice Chairman of Financial Services (2002-2004) of KPMG LLP US (professional services, 1965-2005). Mr. Mauriello currently serves as a member of the Board of Directors of XL Group plc. (global insurance and re-insurance, 2006-present). Previously, Mr. Mauriello served as a Director of the Hamilton Funds of the Bank of New York (2006-2007) and of Arcadia Resources Inc. (health care services and products, 2007-2012). |
Robert W. Selander (62) |
| Year of Election or Appointment: 2011 Previously, Mr. Selander served as a Member of the Advisory Board of Fidelity's Equity and High Income Funds (2011), Executive Vice Chairman (2010), Chief Executive Officer (2009-2010), and President and Chief Executive Officer (1997-2009) of Mastercard, Inc. |
Cornelia M. Small (68) |
| Year of Election or Appointment: 2005 Ms. Small is a member of the Board of Directors (2009-present) and Chair of the Investment Committee (2010-present) of the Teagle Foundation. Ms. Small also serves on the Investment Committee of the Berkshire Taconic Community Foundation (2008-present). Previously, Ms. Small served as Chairperson (2002-2008) and a member of the Investment Committee and Chairperson (2008-2012) and a member of the Board of Trustees of Smith College. In addition, Ms. Small served as Chief Investment Officer, Director of Global Equity Investments, and a member of the Board of Directors of Scudder, Stevens & Clark and Scudder Kemper Investments. |
William S. Stavropoulos (73) |
| Year of Election or Appointment: 2001 Mr. Stavropoulos is Vice Chairman of the Independent Trustees of the Equity and High Income Funds (2006-present). Mr. Stavropoulos serves as President and Founder of the Michigan Baseball Foundation, the Great Lakes Loons (2007-present). Mr. Stavropoulos is Chairman Emeritus of the Board of Directors of The Dow Chemical Company, where he previously served in numerous senior management positions, including President, CEO (1995-2000; 2002-2004), Chairman of the Executive Committee (2000-2006), and as a member of the Board of Directors (1990-2006). Currently, Mr. Stavropoulos is a Director of Univar Inc. (global distributor of commodity and specialty chemicals, Chairman from 2010-May 2012 and Lead Director from May 2012-present), Teradata Corporation (data warehousing and technology solutions, 2008-present), Maersk Inc. (industrial conglomerate), and Tyco International, Ltd. (multinational manufacturing and services, 2007-present), and a member of the Advisory Board for Metalmark Capital LLC (private equity investment, 2005-present). Mr. Stavropoulos is an operating advisor to Clayton, Dubilier & Rice, LLC (private equity investment). In addition, Mr. Stavropoulos is a member of the University of Notre Dame Advisory Council for the College of Science, a Trustee of the Rollin L. Gerstacker Foundation, and a Director of the Naples Philharmonic Center for the Arts. Previously, Mr. Stavropoulos served as a Director of Chemical Financial Corporation (bank holding company, 1993-2012). |
David M. Thomas (63) |
| Year of Election or Appointment: 2008 Previously, Mr. Thomas served as Executive Chairman (2005-2006) and Chairman and Chief Executive Officer (2000-2005) of IMS Health, Inc. (pharmaceutical and healthcare information solutions), and a Director of Fortune Brands, Inc. (consumer products, 2000-2011). In addition, Mr. Thomas serves as Non-Executive Chairman of the Board of Directors of Fortune Brands Home and Security (home and security products, 2011-present), and as a member of the Board of Directors of Interpublic Group of Companies, Inc. (marketing communication, 2004-present). |
Michael E. Wiley (62) |
| Year of Election or Appointment: 2008 Mr. Wiley also serves as a Director of Asia Pacific Exploration Consolidated (international oil and gas exploration and production, 2008-present). Mr. Wiley serves as a Director of Tesoro Corporation (independent oil refiner and marketer, 2005-present), and a Director of Bill Barrett Corporation (exploration and production, 2005-present). In addition, Mr. Wiley also serves as a Director of Post Oak Bank (privately-held bank, 2004-present). Previously, Mr. Wiley served as a member of the Board of Trustees of the University of Tulsa (2000-2006; 2007-2010), as a Senior Energy Advisor of Katzenbach Partners, LLC (consulting, 2006-2007), as an Advisory Director of Riverstone Holdings (private investment), Chairman, President, and CEO of Baker Hughes, Inc. (oilfield services, 2000-2004), and as Director of Spinnaker Exploration Company (exploration and production, 2001-2005). |
+ The information above includes each Trustee's principal occupation during the last five years and other information relating to the experience, attributes, and skills relevant to each Trustee's qualifications to serve as a Trustee, which led to the conclusion that each Trustee should serve as a Trustee for the fund.
Advisory Board Members and Executive Officers:
Correspondence intended for David A. Rosow and Garnett A. Smith may be sent to Fidelity Investments, P.O. Box 55235, Boston, Massachusetts 02205-5235. Correspondence intended for each executive officer, Edward C. Johnson 3d, and Peter S. Lynch may be sent to Fidelity Investments, 82 Devonshire Street, Boston, Massachusetts 02109.
Name, Age; Principal Occupation |
Edward C. Johnson 3d (82) |
| Year of Election or Appointment: 2011 Member of the Advisory Board of Fidelity's Equity and High Income Funds. Mr. Johnson serves as Chief Executive Officer, Chairman, and a Director of FMR LLC, and also serves as Chairman and Director of FIL Limited. Previously, Mr. Johnson served as a Trustee and Chairman of the Board of certain Fidelity Trusts, Chairman and a Director of FMR, Chairman and a Director of FMR Co., Inc., and President of FMR LLC (2006-2007). |
Peter S. Lynch (68) |
| Year of Election or Appointment: 2003 Member of the Advisory Board of Fidelity's Equity and High Income Funds. Mr. Lynch is Vice Chairman and a Director of FMR and FMR Co., Inc. In addition, Mr. Lynch serves as a Trustee of Boston College and as the Chairman of the Inner-City Scholarship Fund. Previously, Mr. Lynch served on the Special Olympics International Board of Directors (1997-2006). |
David A. Rosow (70) |
| Year of Election or Appointment: 2012 Member of the Advisory Board of Fidelity's Equity and High Income Funds. Chairman and Chief Executive Officer of International Golf Group, Inc. (golf course development, 1989-present). Previously, Mr. Rosow served as Chairman and Chief Executive Officer of Rosow & Company, Inc. (private investment company, 1989-2011), a Lead Director of Hudson United Bancorp (2001-2006) and as a Director of TD Banknorth (1996-2006). In addition, Mr. Rosow is a member (2008-present) and President (2009-present) of the Town Council of Palm Beach, Florida. |
Garnett A. Smith (65) |
| Year of Election or Appointment: 2012 Member of the Advisory Board of Fidelity's Equity and High Income Funds. Prior to Mr. Smith's retirement, he served as Chairman and Chief Executive Officer of Inbrand Corp. (manufacturer of personal absorbent products, 1990-1997). He also served as President (1986-1990) of Inbrand Corp. Prior to his employment with Inbrand Corp., he was employed by a retail fabric chain and North Carolina National Bank. In addition, Mr. Smith is a board member of the Jackson Hole Land Trust (2009-present). |
Kenneth B. Robins (43) |
| Year of Election or Appointment: 2008 President and Treasurer of Fidelity's Equity and High Income Funds. Mr. Robins also serves as President and Treasurer (2010-present) and Assistant Treasurer (2009-present) of other Fidelity funds and is an employee of Fidelity Investments (2004-present). Previously, Mr. Robins served as Deputy Treasurer of the Fidelity funds (2005-2008) and Treasurer and Chief Financial Officer of The North Carolina Capital Management Trust: Cash and Term Portfolios (2006-2008). |
Bruce T. Herring (47) |
| Year of Election or Appointment: 2006 Vice President of certain Equity Funds. Mr. Herring also serves as President of Fidelity Research & Analysis Company (2010-present), Chief Investment Officer and Director of Fidelity Management & Research (U.K.) Inc. (2010-present) and Group Chief Investment Officer of FMR. Previously, Mr. Herring served as Vice President (2005-2006) and Senior Vice President (2006-2007) of Fidelity Management & Research Company, Vice President of FMR Co., Inc. (2001-2007) and as a portfolio manager for Fidelity U.S. Equity Funds. |
Brian B. Hogan (48) |
| Year of Election or Appointment: 2009 Vice President of Equity and High Income Funds. Mr. Hogan also serves as President of FMR's Equity Division (2009-present). Previously, Mr. Hogan served as Senior Vice President, Equity Research of FMR (2006-2009) and as a portfolio manager. |
Scott C. Goebel (44) |
| Year of Election or Appointment: 2008 Secretary and Chief Legal Officer (CLO) of the Fidelity funds. Mr. Goebel also serves as Secretary of Fidelity Investments Money Management, Inc. (FIMM) (2010-present) and Fidelity Research and Analysis Company (FRAC) (2010-present); Secretary and CLO of The North Carolina Capital Management Trust: Cash and Term Portfolios (2008-present); General Counsel, Secretary, and Senior Vice President of FMR (2008-present) and FMR Co., Inc. (2008-present); employed by FMR LLC or an affiliate (2001-present); Chief Legal Officer of Fidelity Management & Research (Hong Kong) Limited (2008-present) and Assistant Secretary of Fidelity Management & Research (Japan) Inc. (2008-present), and Fidelity Management & Research (U.K.) Inc. (2008-present). Previously, Mr. Goebel served as Assistant Secretary of FIMM (2008-2010), FRAC (2008-2010), and the Funds (2007-2008) and as Vice President and Secretary of Fidelity Distributors Corporation (FDC) (2005-2007). |
William C. Coffey (43) |
| Year of Election or Appointment: 2009 Assistant Secretary of Fidelity's Equity and High Income Funds. Mr. Coffey also serves as Senior Vice President and Deputy General Counsel of FMR LLC (2010-present), and is an employee of Fidelity Investments. Previously, Mr. Coffey served as Vice President and Associate General Counsel of FMR LLC (2005-2009). |
Elizabeth Paige Baumann (44) |
| Year of Election or Appointment: 2012 Anti-Money Laundering (AML) Officer of the Fidelity funds. Ms. Baumann also serves as AML Officer of The North Carolina Capital Management Trust: Cash and Term Portfolios (2012-present), Chief AML Officer of FMR LLC (2012-present), and is an employee of Fidelity Investments. Previously, Ms. Baumann served as Vice President and Deputy Anti-Money Laundering Officer (2007-2012). |
Christine Reynolds (54) |
| Year of Election or Appointment: 2008 Chief Financial Officer of the Fidelity funds. Ms. Reynolds became President of Fidelity Pricing and Cash Management Services (FPCMS) in August 2008. Ms. Reynolds served as Chief Operating Officer of FPCMS (2007-2008). Previously, Ms. Reynolds served as President, Treasurer, and Anti-Money Laundering officer of the Fidelity funds (2004-2007). |
Joseph A. Hanlon (44) |
| Year of Election or Appointment: 2012 Chief Compliance Officer of Fidelity's Equity and High Income Funds. Mr. Hanlon serves as Compliance Officer of FMR, FMR Co., Inc., Fidelity Investments Money Management, Inc. (FIMM), Fidelity Research and Analysis Company (FRAC), Fidelity Management & Research (Japan) Inc., Fidelity Management & Research (U.K.) Inc., Fidelity Management & Research (Hong Kong), and Strategic Advisers, Inc. (2009-present), as Senior Vice President of the Fidelity Asset Management Division (2009-present), and is an employee of Fidelity Investments. |
Joseph F. Zambello (55) |
| Year of Election or Appointment: 2011 Deputy Treasurer of the Fidelity funds. Mr. Zambello is an employee of Fidelity Investments. Previously, Mr. Zambello served as Vice President of FMR's Program Management Group (2009-2011) and Vice President of the Transfer Agent Oversight Group (2005-2009). |
Adrien E. Deberghes (45) |
| Year of Election or Appointment: 2008 Deputy Treasurer of Fidelity's Equity and High Income Funds. Mr. Deberghes also serves as Vice President (2011-present) and Assistant Treasurer (2010-present) of other Fidelity funds, and is an employee of Fidelity Investments (2008-present). Previously, Mr. Deberghes served as Senior Vice President of Mutual Fund Administration at State Street Corporation (2007-2008), Senior Director of Mutual Fund Administration at Investors Bank & Trust (2005-2007), and Director of Finance for Dunkin' Brands (2000-2005). |
Stephen Sadoski (41) |
| Year of Election or Appointment: 2012 Deputy Treasurer of Fidelity's Equity and High Income Funds. Mr. Sadoski also serves as Assistant Treasurer of other Fidelity funds (2012-present) and is an employee of Fidelity Investments (2012-present). Previously, Mr. Sadoski served as an assistant chief accountant in the Division of Investment Management of the Securities and Exchange Commission (SEC) (2009-2012) and as a senior manager at Deloitte & Touche (1997-2009). |
Stephanie J. Dorsey (43) |
| Year of Election or Appointment: 2010 Assistant Treasurer of Fidelity's Equity and High Income Funds. Ms. Dorsey also serves as Deputy Treasurer of other Fidelity funds (2008-present) and is an employee of Fidelity Investments (2008-present). Previously, Ms. Dorsey served as Treasurer (2004-2008) of the JPMorgan Mutual Funds and Vice President (2004-2008) of JPMorgan Chase Bank. |
John R. Hebble (54) |
| Year of Election or Appointment: 2009 Assistant Treasurer of Fidelity's Equity and High Income Funds. Mr. Hebble also serves as President (2011-present), Treasurer, and Chief Financial Officer of The North Carolina Capital Management Trust: Cash and Term Portfolios (2008-present), President and Treasurer of other Fidelity funds (2008-present) and is an employee of Fidelity Investments. |
Gary W. Ryan (54) |
| Year of Election or Appointment: 2005 Assistant Treasurer of the Fidelity funds. Mr. Ryan is an employee of Fidelity Investments. Previously, Mr. Ryan served as Vice President of Fund Reporting in Fidelity Pricing and Cash Management Services (FPCMS) (1999-2005). |
Jonathan Davis (44) |
| Year of Election or Appointment: 2010 Assistant Treasurer of the Fidelity funds. Mr. Davis is also Assistant Treasurer of Fidelity Rutland Square Trust II and Fidelity Commonwealth Trust II. Mr. Davis is an employee of Fidelity Investments. Previously, Mr. Davis served as Vice President and Associate General Counsel of FMR LLC (2003-2010). |
Annual Report
The Board of Trustees of Advisor Emerging Asia Fund voted to pay to shareholders of record at the opening of business on record date, the following distributions per share derived from capital gains realized from sales of portfolio securities, and dividends derived from net investment income:
| Pay Date | Record Date | Dividends | Capital Gains |
Institutional Class | 12/10/12 | 12/07/12 | $0.413 | $0.092 |
Institutional Class designates 100% of the dividends distributed during the fiscal year as amounts which may be taken into account as a dividend for purposes of the maximum rate under section 1(h)(11) of the Internal Revenue Code.
The amounts per share which represent income derived from sources within, and taxes paid to, foreign countries or possessions of the United States are $0.515 and $0.0994 for the dividend paid 12/05/11.
The fund will notify shareholders in January 2013 of amounts for use in preparing 2012 income tax returns.
Annual Report
Board Approval of Investment Advisory Contracts and Management Fees
Fidelity Advisor Emerging Asia Fund
Each year, the Board of Trustees, including the Independent Trustees (together, the Board), votes on the renewal of the management contract and sub-advisory agreements (together, the Advisory Contracts) for the fund. The Board, assisted by the advice of fund counsel and Independent Trustees' counsel, requests and considers a broad range of information relevant to the renewal of the Advisory Contracts throughout the year.
The Board meets regularly and, at each of its meetings, considers factors that are relevant to its annual consideration of the renewal of the fund's Advisory Contracts, including the services and support provided to the fund and its shareholders. The Board has established various standing committees, each composed of and chaired by Independent Trustees with varying backgrounds, to which the Board has assigned specific subject matter responsibilities in order to enhance effective decision-making by the Board. The Board, acting directly and through its Committees, requests and receives information concerning the annual consideration of the renewal of the fund's Advisory Contracts. The Board also meets as needed to consider matters specifically related to the Board's annual consideration of the renewal of Advisory Contracts. Members of the Board may also meet with trustees of other Fidelity funds through ad hoc joint committees to discuss certain matters relevant to the Fidelity funds.
At its July 2012 meeting, the Board of Trustees, including the Independent Trustees, unanimously determined to renew the fund's Advisory Contracts. In reaching its determination, the Board considered all factors it believed relevant, including (i) the nature, extent, and quality of the services to be provided to the fund and its shareholders (including the investment performance of the fund); (ii) the competitiveness of the fund's management fee and total expense ratio relative to peer funds; (iii) the total costs of the services to be provided by and the profits to be realized by Fidelity from its relationship with the fund; (iv) the extent to which economies of scale exist and would be realized as the fund grows; and (v) whether fee levels reflect these economies of scale, if any, for the benefit of fund shareholders.
In considering whether to renew the Advisory Contracts for the fund, the Board reached a determination, with the assistance of fund counsel and Independent Trustees' counsel and through the exercise of its business judgment, that the renewal of the Advisory Contracts is in the best interests of the fund and its shareholders and that the compensation payable under the Advisory Contracts is fair and reasonable. The Board's decision to renew the Advisory Contracts was not based on any single factor, but rather was based on a comprehensive consideration of all the information provided to the Board at its meetings throughout the year. The Board, in reaching its determination to renew the Advisory Contracts, is aware that shareholders in the fund have a broad range of investment choices available to them, including a wide choice among mutual funds offered by Fidelity's competitors, and that the fund's shareholders, who have the opportunity to review and weigh the disclosure provided by the fund in its prospectus and other public disclosures, have chosen to invest in this fund, managed by Fidelity.
Annual Report
Board Approval of Investment Advisory Contracts and
Management Fees - continued
Nature, Extent, and Quality of Services Provided. The Board considered the staffing within the investment adviser, FMR, and the sub-advisers (together, the Investment Advisers), including the backgrounds of the fund's investment personnel, and also considered the fund's investment objective, strategies, and related investment philosophy. The Independent Trustees also had discussions with senior management of Fidelity's investment operations and investment groups. The Board considered the structure of the portfolio manager compensation program and whether this structure provides appropriate incentives to act in the best interests of the fund.
Resources Dedicated to Investment Management and Support Services. The Board and the Fund Oversight and Research Committees reviewed the general qualifications and capabilities of the Investment Advisers' investment staff, including its size, education, experience, and resources, as well as the Investment Advisers' approach to recruiting, training, managing, and compensating investment personnel. The Board also noted that FMR has continued to increase the resources devoted to non-U.S. offices, including expansion of Fidelity's global investment organization. The Board noted that Fidelity's analysts have extensive resources, tools and capabilities that allow them to conduct sophisticated quantitative and fundamental analysis, as well as credit analysis of issuers, counterparties and guarantors. The Board also believes that Fidelity's investment professionals have sufficient access to global information and data so as to provide competitive investment results over time, and that those professionals also have access to sophisticated tools that permit them to assess portfolio construction and risk and performance attribution characteristics continuously, as well as to transmit new information and research conclusions rapidly around the world. Additionally, in its deliberations, the Board considered the Investment Advisers' trading and risk management capabilities and resources, which are an integral part of the investment management process.
Shareholder and Administrative Services. The Board considered (i) the nature, extent, quality, and cost of advisory, administrative, and shareholder services performed by the Investment Advisers and their affiliates under the Advisory Contracts and under separate agreements covering transfer agency, pricing and bookkeeping, and securities lending services for the fund; (ii) the nature and extent of the supervision of third party service providers, principally custodians and subcustodians; and (iii) the resources devoted to, and the record of compliance with, the fund's compliance policies and procedures. The Board also reviewed the allocation of fund brokerage, including allocations to brokers affiliated with the Investment Advisers, the use of brokerage commissions to pay fund expenses, and the use of "soft" commission dollars to pay for research services.
Annual Report
The Board noted that the growth of fund assets over time across the complex allows Fidelity to reinvest in the development of services designed to enhance the value or convenience of the Fidelity funds as investment vehicles. These services include 24-hour access to account information and market information through telephone representatives and over the Internet, investor education materials and asset allocation tools, and the expanded availability of Fidelity Investor Centers.
Investment in a Large Fund Family. The Board considered the benefits to shareholders of investing in a Fidelity fund, including the benefits of investing in a fund that is part of a large family of funds offering a variety of investment disciplines and providing a large variety of mutual fund investor services. The Board noted that Fidelity had taken, or had made recommendations that resulted in the Fidelity funds taking, a number of actions over the previous year that benefited particular funds, including (i) continuing to dedicate additional resources to investment research and support of the senior management team that oversees asset management; (ii) persisting in efforts to enhance Fidelity's research capabilities, in particular, international research; (iii) launching new funds and making other enhancements to meet client needs for global and income-oriented solutions; (iv) continuing to launch dedicated lower cost underlying funds to meet investment management's portfolio construction needs related to expanding underlying fund options, specifically for the Freedom Fund product lines; (v) adopting a "Stock Selector" sector neutral investment approach and employing a team of portfolio managers who are sector specialists to manage certain funds; (vi) rationalizing product lines and gaining increased efficiencies through the mergers of several funds into other funds; (vii) strengthening the Spartan Index Fund product line by adding new funds and/or new low-cost institutional share classes, restructuring fund expenses to accommodate new classes, and reducing investment minimums for certain classes of shares; (viii) modifying the eligibility criteria for Institutional Class shares to increase their appeal to government entities and charitable investors; and (ix) reducing certain transfer agent fee rates.
Investment Performance. The Board considered whether the fund has operated in accordance with its investment objective, as well as its record of compliance with its investment restrictions. It also reviewed the fund's absolute investment performance for each class, as well as the fund's relative investment performance for each class measured over multiple periods against a broad-based securities market index. The Board noted that FMR believes that no meaningful peer group exists for the fund principally because most other funds in the fund's third-party peer group have different and/or broader investment mandates than the fund's more specialized strategies. The following charts considered by the Board show, over the one-, three-, and five-year periods ended December 31, 2011, the cumulative total returns of Institutional Class (Class I) and Class B of the fund and the cumulative total returns of a broad-based securities market index ("benchmark"). The returns of Institutional Class (Class I) and Class B show the performance of the highest and lowest performing classes, respectively (based on five-year performance).
Annual Report
Board Approval of Investment Advisory Contracts and
Management Fees - continued
Fidelity Advisor Emerging Asia Fund

The Board noted that the investment performance of Institutional Class (Class I) of the fund compared favorably to its benchmark for all the periods shown. The Board considered that the variations in performance among the fund's classes reflect the variations in class expenses, which result in lower performance for higher expense classes. The Board also reviewed the fund's performance since inception as well as performance in the current year.
Based on its review, the Board concluded that the nature, extent, and quality of services provided to the fund under the Advisory Contracts should benefit the fund's shareholders.
Competitiveness of Management Fee and Total Expense Ratio. The Board considered the fund's management fee and total expense ratio compared to "mapped groups" of competitive funds and classes. Fidelity creates "mapped groups" by combining similar Lipper investment objective categories that have comparable management fee characteristics. Combining Lipper investment objective categories aids the Board's management fee and total expense ratio comparisons by broadening the competitive group used for comparison and by reducing the number of universes to which various Fidelity funds are compared.
Management Fee. The Board considered two proprietary management fee comparisons for the 12-month periods shown in the chart below. The group of Lipper funds used by the Board for management fee comparisons is referred to below as the "Total Mapped Group." The Total Mapped Group comparison focuses on a fund's standing relative to the total universe of comparable funds available to investors in terms of gross management fees before expense reimbursements or caps. "TMG %" represents the percentage of funds in the Total Mapped Group that had management fees that were lower than the fund's. For example, a TMG % of 7% means that 93% of the funds in the Total Mapped Group had higher management fees than the fund. The "Asset-Size Peer Group" (ASPG) comparison focuses on a fund's standing relative to non-Fidelity funds similar in size to the fund within the Total Mapped Group. The ASPG represents at least 15% of the funds in the Total Mapped Group with comparable asset size and management fee characteristics, subject to a minimum of 50 funds (or all funds in the Total Mapped Group if fewer than 50). Additional information, such as the ASPG quartile in which the fund's management fee ranked, is also included in the chart and considered by the Board.
Annual Report
Fidelity Advisor Emerging Asia Fund
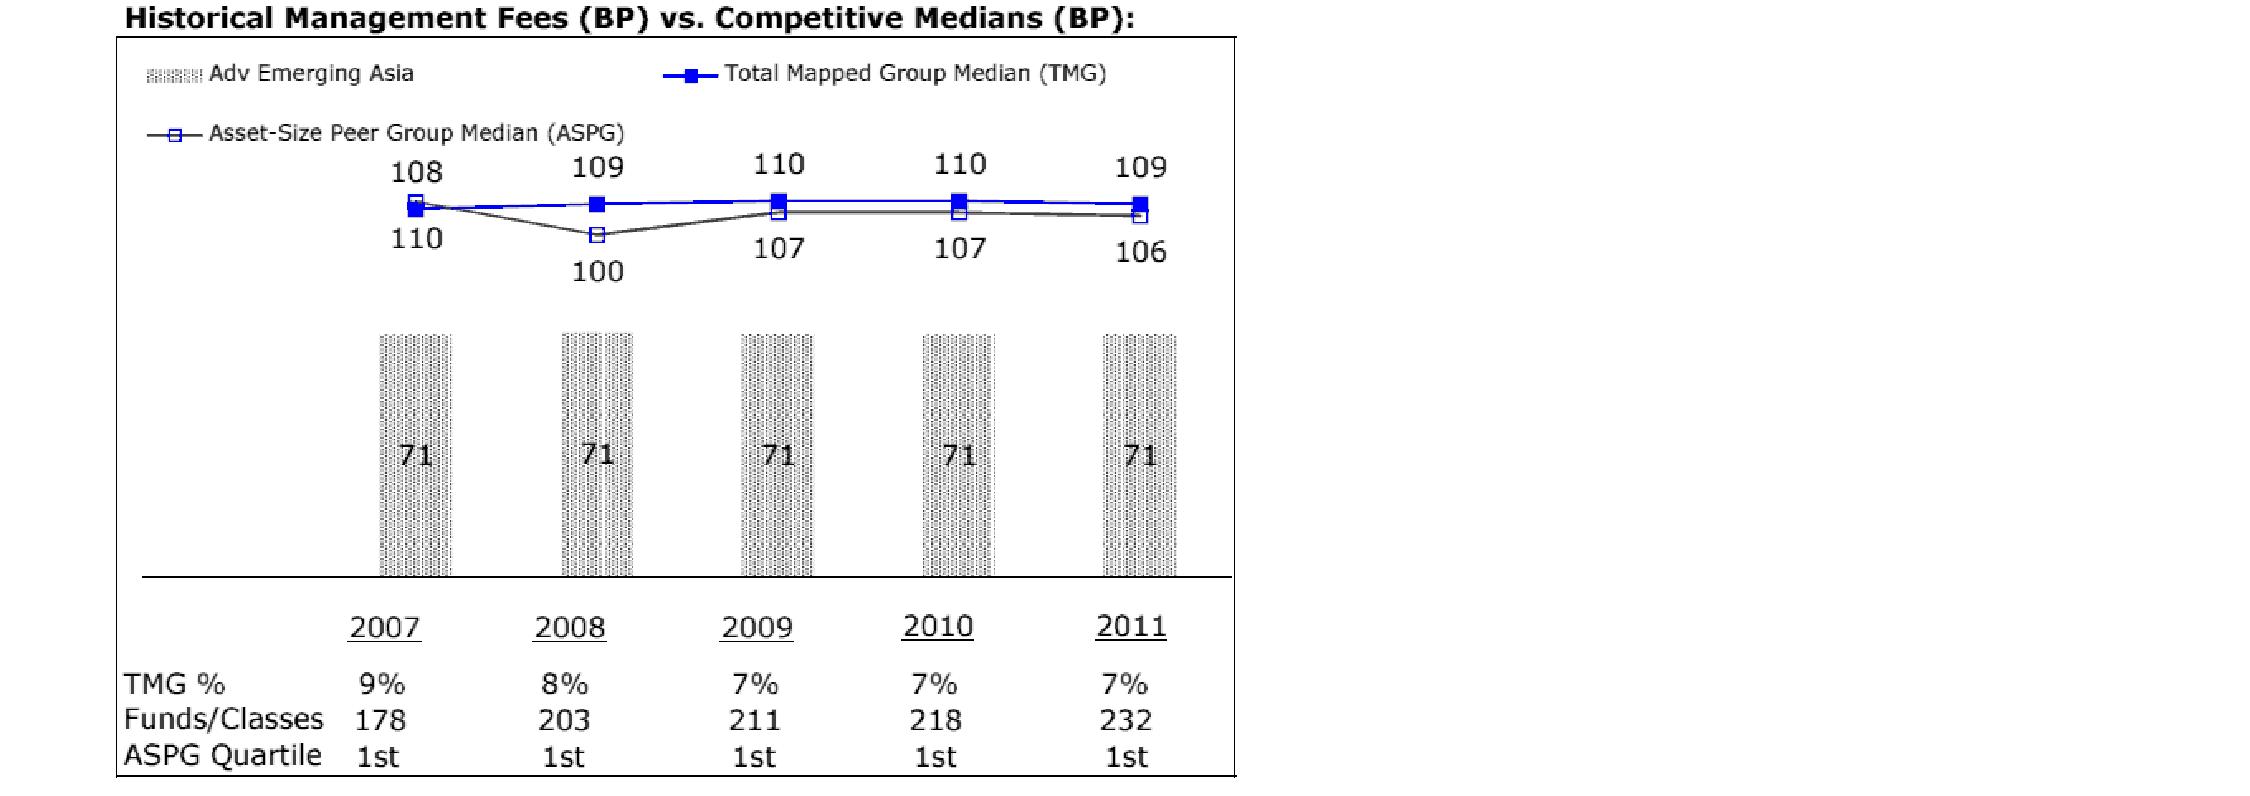
The Board noted that the fund's management fee ranked below the median of its Total Mapped Group and below the median of its ASPG for 2011.
Based on its review, the Board concluded that the fund's management fee is fair and reasonable in light of the services that the fund receives and the other factors considered.
Total Expense Ratio. In its review of each class's total expense ratio, the Board considered the fund's management fee as well as other fund or class expenses, as applicable, such as transfer agent fees, pricing and bookkeeping fees, fund-paid 12b-1 fees, and custodial, legal, and audit fees. The Board also noted the effects of any waivers and reimbursements on fees and expenses. As part of its review, the Board also considered the current and historical total expense ratios of each class of the fund compared to competitive fund median expenses. Each class of the fund is compared to those funds and classes in the Total Mapped Group (used by the Board for management fee comparisons) that have a similar sales load structure.
Annual Report
Board Approval of Investment Advisory Contracts and
Management Fees - continued
The Board noted that the total expense ratio of each class ranked below its competitive median for 2011.
Fees Charged to Other Fidelity Clients. The Board also considered Fidelity fee structures and other information with respect to clients of FMR and its affiliates, such as other mutual funds advised or subadvised by FMR or its affiliates, pension plan clients, and other institutional clients. The Board noted the findings of the 2010 ad hoc joint committee (created with the board of other Fidelity funds), which reviewed and compared Fidelity's institutional investment advisory business with its business of providing services to the Fidelity funds, including the differences in services provided, fees charged, and costs incurred, as well as competition in their respective marketplaces.
Based on its review of total expense ratios and fees charged to other Fidelity clients, the Board concluded that the total expense ratio of each class of the fund was reasonable in light of the services that the fund and its shareholders receive and the other factors considered.
Costs of the Services and Profitability. The Board considered the revenues earned and the expenses incurred by Fidelity in conducting the business of developing, marketing, distributing, managing, administering and servicing the fund and its shareholders. The Board also considered the level of Fidelity's profits in respect of all the Fidelity funds.
On an annual basis, FMR presents to the Board Fidelity's profitability for the fund. Fidelity calculates the profitability for each fund, as well as aggregate profitability for groups of Fidelity funds and all Fidelity funds, using a series of detailed revenue and cost allocation methodologies which originate with the books and records of Fidelity on which Fidelity's audited financial statements are based. The Audit Committee of the Board reviews any significant changes from the prior year's methodologies.
PricewaterhouseCoopers LLP (PwC), independent registered public accounting firm and auditor to Fidelity and certain Fidelity funds, has been engaged annually by the Board as part of the Board's assessment of Fidelity's profitability analysis. PwC's engagement includes the review and assessment of Fidelity's methodologies used in determining the revenues and expenses attributable to Fidelity's mutual fund business, and completion of agreed-upon procedures surrounding the mathematical accuracy of fund profitability and its conformity to allocation methodologies. After considering PwC's reports issued under the engagement and information provided by Fidelity, the Board concluded that while other allocation methods may also be reasonable, Fidelity's profitability methodologies are reasonable in all material respects.
Annual Report
The Board also reviewed Fidelity's non-fund businesses and fall-out benefits related to the mutual fund business as well as cases where Fidelity's affiliates may benefit from or be related to the fund's business.
The Board considered the costs of the services provided by and the profits realized by Fidelity in connection with the operation of the fund and was satisfied that the profitability was not excessive in the circumstances.
Economies of Scale. The Board considered whether there have been economies of scale in respect of the management of the Fidelity funds, whether the Fidelity funds (including the fund) have appropriately benefited from any such economies of scale, and whether there is potential for realization of any further economies of scale. The Board considered the extent to which the fund will benefit from economies of scale through increased services to the fund, through waivers or reimbursements, or through fee or expense reductions. The Board also noted that in 2009, it and the board of other Fidelity funds created an ad hoc committee (the Economies of Scale Committee) to analyze whether FMR attains economies of scale in respect of the management and servicing of the Fidelity funds, whether the Fidelity funds have appropriately benefited from such economies of scale, and whether there is potential for realization of any further economies of scale.
The Board recognized that the fund's management contract incorporates a "group fee" structure, which provides for lower group fee rates as total fund assets under FMR's management increase, and for higher group fee rates as total fund assets under FMR's management decrease. FMR calculates the group fee rates based on a tiered asset "breakpoint" schedule that varies based on asset class. The Board considered that the group fee is designed to deliver the benefits of economies of scale to fund shareholders when total Fidelity fund assets increase, even if assets of any particular fund are unchanged or have declined, because some portion of Fidelity's costs are attributable to services provided to all Fidelity funds, and all funds benefit if those costs can be allocated among more assets. The Board concluded that, given the group fee structure, fund shareholders will benefit from lower management fees as assets under FMR's management increase at the fund complex level, regardless of whether Fidelity achieves any such economies of scale.
The Board concluded, taking into account the analysis of the Economies of Scale Committee, that economies of scale, if any, are being appropriately shared between fund shareholders and Fidelity.
Additional Information Requested by the Board. In order to develop fully the factual basis for consideration of the Fidelity funds' Advisory Contracts, the Board requested and received additional information on certain topics, including (i) fund performance trends, actions to be taken by FMR to improve certain funds' overall performance, and Fidelity's long-term strategies for certain funds; (ii) the potential to further rationalize the Fidelity fund lineup with the possibility of achieving savings for the funds and Fidelity; (iii) Fidelity's compensation structure for portfolio managers and other key investment personnel; (iv) the amount of the investment that each portfolio manager has made in the Fidelity fund(s) that he or she manages; (v) the realization of fall-out benefits in certain Fidelity business units; (vi) Fidelity's group fee structures, the potential impact of regulatory changes on such structures, and the rationale for the individual fee rates of certain funds; (vii) fund profitability methodology, including Fidelity's cost allocation methodology, and the impact of certain factors on fund profitability results; (viii) trends regarding industry use of performance fee structures and the possibility of implementing performance fee structures for additional funds; and (ix) the impact of net redemptions from the Fidelity funds.
Annual Report
Board Approval of Investment Advisory Contracts and
Management Fees - continued
Based on its evaluation of all of the conclusions noted above, and after considering all factors it believed relevant, the Board ultimately concluded that the advisory fee structures are fair and reasonable, and that the fund's Advisory Contracts should be renewed.
Annual Report
Investment Adviser
Fidelity Management & Research Company
Boston, MA
Investment Sub-Advisers
FMR Co., Inc.
Fidelity Management & Research
(U.K.) Inc.
FIL Investment Advisors
FIL Investment Advisors (UK) Limited
FIL Investments (Japan) Limited
Fidelity Management & Research (Hong Kong) Limited
Fidelity Management & Research (Japan) Inc.
General Distributor
Fidelity Distributors Corporation
Smithfield, RI
Transfer and Service Agents
Fidelity Investments Institutional Operations Company, Inc.
Boston, MA
Fidelity Service Company, Inc.
Boston, MA
Custodian
Brown Brothers Harriman & Co.
Boston, MA
(Fidelity Investment logo)(registered trademark)
AEAI-UANN-1212
1.784738.109
(Fidelity Investment logo)(registered trademark)
Fidelity Advisor®
Overseas
Fund - Class A, Class T, Class B and Class C
Annual Report
October 31, 2012
(Fidelity Cover Art)
Contents
Performance | (Click Here) | How the fund has done over time. |
Management's Discussion of Fund Performance | (Click Here) | The Portfolio Manager's review of fund performance and strategy. |
Shareholder Expense Example | (Click Here) | An example of shareholder expenses. |
Investment Changes | (Click Here) | A summary of major shifts in the fund's investments over the past six months. |
Investments | (Click Here) | A complete list of the fund's investments with their market values. |
Financial Statements | (Click Here) | Statements of assets and liabilities, operations, and changes in net assets, as well as financial highlights. |
Notes | (Click Here) | Notes to the financial statements. |
Report of Independent Registered Public Accounting Firm | (Click Here) | |
Trustees and Officers | (Click Here) | |
Distributions | (Click Here) | |
Board Approval of Investment Advisory Contracts and Management Fees | (Click Here) | |
To view a fund's proxy voting guidelines and proxy voting record for the 12-month period ended June 30, visit http://www.fidelity.com/proxyvotingresults or visit the Securities and Exchange Commission's (SEC) web site at http://www.sec.gov. You may also call 1-877-208-0098 to request a free copy of the proxy voting guidelines.
Standard & Poor's, S&P and S&P 500 are registered service marks of The McGraw-Hill Companies, Inc. and have been licensed for use by Fidelity Distributors Corporation.
Other third party marks appearing herein are the property of their respective owners.
All other marks appearing herein are registered or unregistered trademarks or service marks of FMR LLC or an affiliated company. © 2012 FMR LLC. All rights reserved.
Annual Report
This report and the financial statements contained herein are submitted for the general information of the shareholders of the fund. This report is not authorized for distribution to prospective investors in the fund unless preceded or accompanied by an effective prospectus.
A fund files its complete schedule of portfolio holdings with the SEC for the first and third quarters of each fiscal year on Form N-Q. Forms N-Q are available on the SEC's web site at http://www.sec.gov. A fund's Forms N-Q may be reviewed and copied at the SEC's Public Reference Room in Washington, DC. Information regarding the operation of the SEC's Public Reference Room may be obtained by calling 1-800-SEC-0330. For a complete list of a fund's portfolio holdings, view the most recent holdings listing, semiannual report, or annual report on Fidelity's web site at http://www.fidelity.com, http://www.advisor.fidelity.com, or http://www.401k.com, as applicable.
NOT FDIC INSURED • MAY LOSE VALUE • NO BANK GUARANTEE
Neither the fund nor Fidelity Distributors Corporation is a bank.
Annual Report
Average annual total return reflects the change in the value of an investment, assuming reinvestment of the class' distributions from dividend income and capital gains (the profits earned upon the sale of securities that have grown in value, if any) and assuming a constant rate of performance each year. The $10,000 table and the fund's returns do not reflect the deduction of taxes that a shareholder would pay on fund distributions or the redemption of fund shares. During periods of reimbursement by Fidelity, a fund's total return will be greater than it would be had the reimbursement not occurred. How a fund did yesterday is no guarantee of how it will do tomorrow. Returns reflect the conversion of Class B shares to Class A shares after a maximum of seven years.
Average Annual Total Returns
Periods ended October 31, 2012 | Past 1
year | Past 5
years | Past 10
years |
Class A (incl. 5.75% sales charge) | -0.55% | -7.37% | 6.27% |
Class T (incl. 3.50% sales charge) | 1.63% | -7.10% | 6.35% |
Class B (incl. contingent deferred sales charge) A | -0.28% | -7.31% | 6.29% |
Class C (incl. contingent deferred sales charge) B | 3.78% | -6.96% | 6.09% |
A Class B shares' contingent deferred sales charges included in the past one year, past five year, and past ten year total return figures are 5%, 2%, and 0%, respectively.
B Class C shares' contingent deferred sales charges included in the past one year, past five year, and past ten year total return figures are 1%, 0%, and 0%, respectively.
Annual Report
$10,000 Over 10 Years
Let's say hypothetically that $10,000 was invested in Fidelity Advisor® Overseas Fund - Class A on October 31, 2002, and the current 5.75% sales charge was paid. The chart shows how the value of your investment would have changed, and also shows how the MSCI® EAFE® Index performed over the same period.
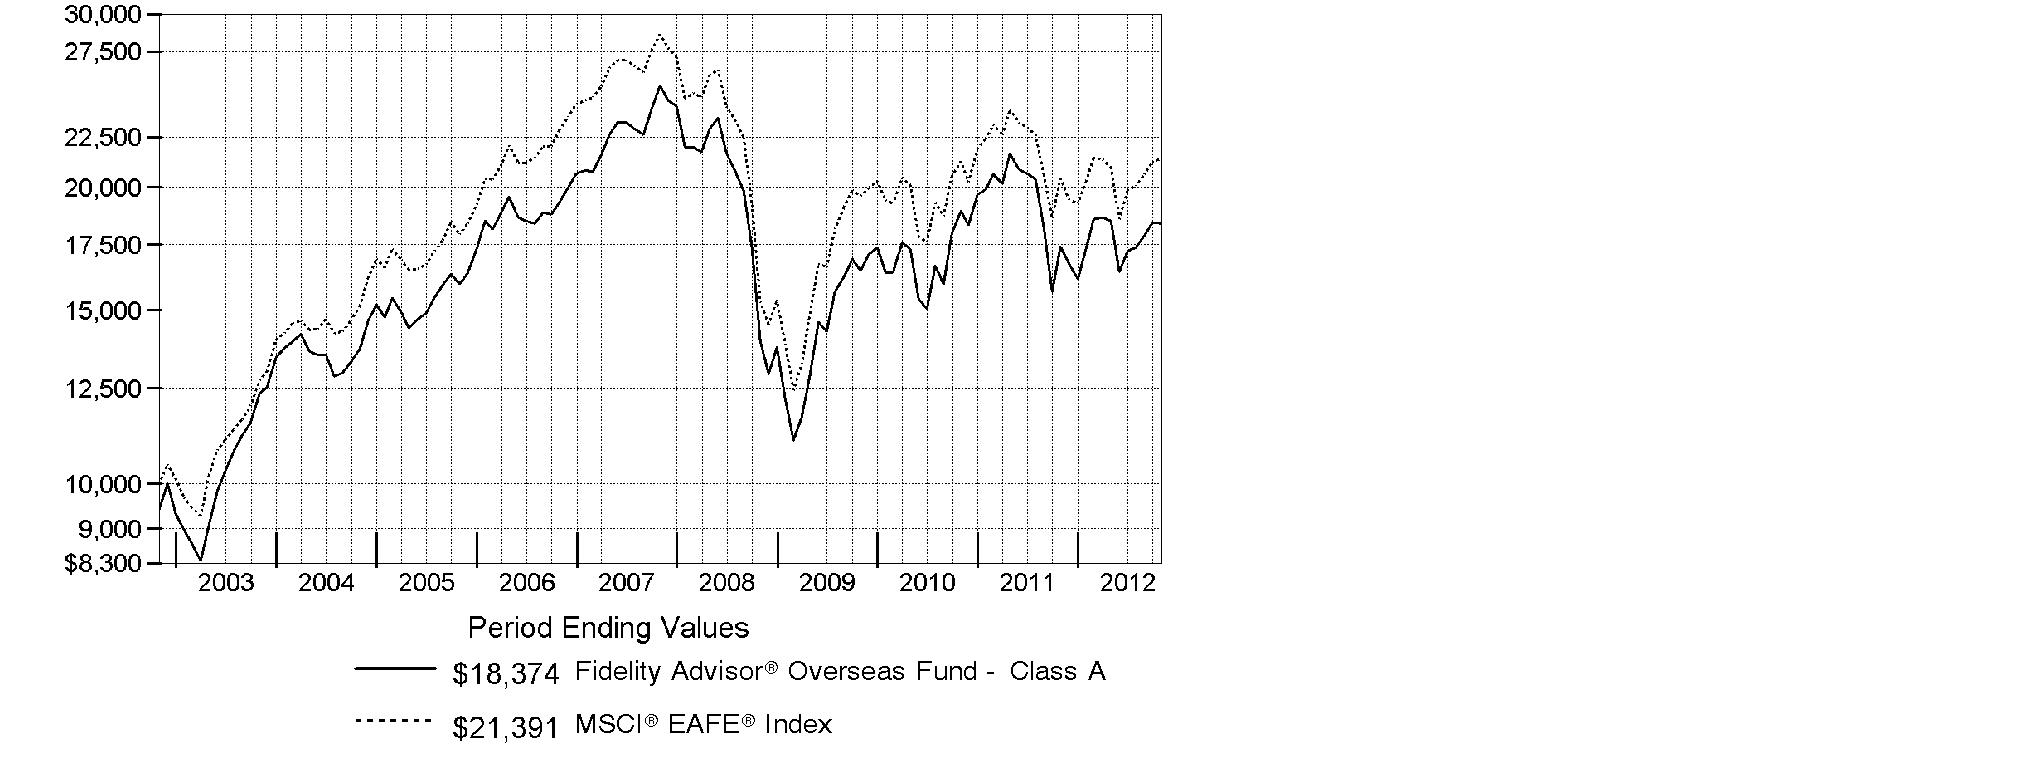
Annual Report
Market Recap: International stocks experienced pendulum-like swings during the 12 months ending October 31, 2012, finishing the period with a modest advance. The market faced periodic bouts of volatility this past year, as a number of macroeconomic concerns - including the eurozone debt crisis, the strength and pace of the U.S. economic recovery, and a slowdown in China's once-blistering growth - dominated headlines and weighed on investors. While a stronger U.S. dollar provided an additional head wind, foreign developed- and emerging-markets stocks still managed a gain for the 12 months, as the MSCI® ACWI® (All Country World Index) ex USA Index rose 4.11%, largely buttressed in the summertime by pledges of accommodative monetary action from eurozone officials, as well as signs that the U.S. housing market was on the mend. Within the index, Asia-Pacific ex Japan showed the most impressive gains, advancing roughly 11%. A number of core European components, most notably Germany (+11%), Switzerland (+10%) and the U.K. (+9%), benefited from optimism about the eurozone's ability to resolve its debt woes, which also helped the region outpace the index overall. Elsewhere, results from Canada (+3%) and the generally more volatile emerging markets (+2%) each fell short of the MSCI index, while Japan was among the few benchmark constituents to finish in the red, returning about -3%.
Comments from Graeme Rockett, Portfolio Manager of Fidelity Advisor® Overseas Fund: For the year, the fund's Class A, Class T, Class B and Class C shares gained 5.51%, 5.32%, 4.72% and 4.78%, respectively (excluding sales charges), versus the 4.76% return of the MSCI® EAFE® Index. Stock selection drove overall performance, most notably leading Chinese Internet firm Tencent Holdings and computer/consumer electronics giant Apple. Choices in health care also helped, with a stake in Denmark-based pharmaceuticals firm Novo Nordisk the fund's top contributor, gaining from its strong position as a global leader in diabetes care. Meaningful stakes in U.K.-based William Hill and Ireland's Paddy Power, two international betting and gaming companies, also were winners. Conversely, several picks in retailing hurt, including Japan-based e-commerce websites Start Today and Rakuten, and Hengdeli Holdings - a retailer of high-end Swiss watches in China. A mild winter and high sheepskin costs pounded shares of Deckers Outdoor, the U.S.-based maker of the UGG® Australia line of footwear. Many of the stocks I've mentioned were not in the index, and I sold Start Today by period end.
The views expressed above reflect those of the portfolio manager(s) only through the end of the period as stated on the cover of this report and do not necessarily represent the views of Fidelity or any other person in the Fidelity organization. Any such views are subject to change at any time based upon market or other conditions and Fidelity disclaims any responsibility to update such views. These views may not be relied on as investment advice and, because investment decisions for a Fidelity fund are based on numerous factors, may not be relied on as an indication of trading intent on behalf of any Fidelity fund.
Annual Report
Shareholder Expense Example
As a shareholder of the Fund, you incur two types of costs: (1) transaction costs, including sales charges (loads) on purchase payments or redemption proceeds, redemption fees and (2) ongoing costs, including management fees, distribution and/or service (12b-1) fees and other Fund expenses. This Example is intended to help you understand your ongoing costs (in dollars) of investing in the Fund and to compare these costs with the ongoing costs of investing in other mutual funds.
The Example is based on an investment of $1,000 invested at the beginning of the period and held for the entire period (May 1, 2012 to October 31, 2012).
Actual Expenses
The first line of the accompanying table for each class of the Fund provides information about actual account values and actual expenses. You may use the information in this line, together with the amount you invested, to estimate the expenses that you paid over the period. Simply divide your account value by $1,000.00 (for example, an $8,600 account value divided by $1,000.00 = 8.6), then multiply the result by the number in the first line for a class of the Fund under the heading entitled "Expenses Paid During Period" to estimate the expenses you paid on your account during this period. In addition, the Fund, as a shareholder in the underlying Fidelity Central Funds, will indirectly bear its pro-rata share of the fees and expenses incurred by the underlying Fidelity Central Funds. These fees and expenses are not included in the Fund's annualized expense ratio used to calculate the expense estimate in the table below.
Hypothetical Example for Comparison Purposes
The second line of the accompanying table for each class of the Fund provides information about hypothetical account values and hypothetical expenses based on a Class' actual expense ratio and an assumed rate of return of 5% per year before expenses, which is not the Class' actual return. The hypothetical account values and expenses may not be used to estimate the actual ending account balance or expenses you paid for the period. You may use this information to compare the ongoing costs of investing in the Fund and other funds. To do so, compare this 5% hypothetical example with the 5% hypothetical examples that appear in the shareholder reports of the other funds. In addition, the Fund, as a shareholder in the underlying Fidelity Central Funds, will indirectly bear its pro-rata share of the fees and expenses incurred by the underlying Fidelity Central Funds. These fees and expenses are not included in the Fund's annualized expense ratio used to calculate the expense estimate in the table below.
Please note that the expenses shown in the table are meant to highlight your ongoing costs only and do not reflect any transaction costs. Therefore, the second line of the table is useful in comparing ongoing costs only, and will not help you determine the relative total costs of owning different funds. In addition, if these transactional costs were included, your costs would have been higher.
Annual Report
| Annualized Expense Ratio | Beginning
Account Value
May 1, 2012 | Ending
Account Value
October 31, 2012 | Expenses Paid
During Period*
May 1, 2012 to
October 31, 2012 |
Class A | 1.41% | | | |
Actual | | $ 1,000.00 | $ 994.70 | $ 7.07 |
HypotheticalA | | $ 1,000.00 | $ 1,018.05 | $ 7.15 |
Class T | 1.59% | | | |
Actual | | $ 1,000.00 | $ 993.10 | $ 7.97 |
HypotheticalA | | $ 1,000.00 | $ 1,017.14 | $ 8.06 |
Class B | 2.17% | | | |
Actual | | $ 1,000.00 | $ 990.20 | $ 10.86 |
HypotheticalA | | $ 1,000.00 | $ 1,014.23 | $ 10.99 |
Class C | 2.17% | | | |
Actual | | $ 1,000.00 | $ 991.00 | $ 10.86 |
HypotheticalA | | $ 1,000.00 | $ 1,014.23 | $ 10.99 |
Institutional Class | 1.08% | | | |
Actual | | $ 1,000.00 | $ 995.90 | $ 5.42 |
HypotheticalA | | $ 1,000.00 | $ 1,019.71 | $ 5.48 |
A 5% return per year before expenses
* Expenses are equal to each Class' annualized expense ratio, multiplied by the average account value over the period, multiplied by 184/366 (to reflect the one-half year period).
Annual Report
Investment Changes (Unaudited)
Top Five Stocks as of October 31, 2012 |
| % of fund's
net assets | % of fund's net assets
6 months ago |
Sanofi SA (France, Pharmaceuticals) | 2.9 | 1.8 |
Nestle SA (Switzerland, Food Products) | 2.8 | 1.0 |
Novo Nordisk A/S Series B (Denmark, Pharmaceuticals) | 2.7 | 2.7 |
Royal Dutch Shell PLC (United Kingdom Oil, Gas & Consumable Fuels) | 2.2 | 1.1 |
Rakuten, Inc. (Japan, Internet & Catalog Retail) | 2.1 | 2.4 |
| 12.7 | |
Top Five Market Sectors as of October 31, 2012 |
| % of fund's
net assets | % of fund's net assets
6 months ago |
Financials | 17.9 | 15.1 |
Consumer Discretionary | 16.6 | 25.4 |
Consumer Staples | 15.6 | 11.6 |
Information Technology | 12.0 | 12.3 |
Health Care | 9.9 | 6.3 |
Top Five Countries as of October 31, 2012 |
(excluding cash equivalents) | % of fund's
net assets | % of fund's net assets
6 months ago |
United Kingdom | 24.2 | 19.9 |
Japan | 12.9 | 13.8 |
France | 12.4 | 12.1 |
Switzerland | 8.4 | 8.7 |
Germany | 7.2 | 11.4 |
Percentages are adjusted for the effect of open futures contracts, if applicable. |
Asset Allocation (% of fund's net assets) |
As of October 31, 2012 | As of April 30, 2012 |
| Stocks 98.7% | | | Stocks 98.0% | |
| Short-Term Investments and Net Other Assets (Liabilities) 1.3% | | | Short-Term Investments and Net Other Assets (Liabilities) 2.0% | |

Annual Report
Investments October 31, 2012
Showing Percentage of Net Assets
Common Stocks - 97.5% |
| Shares | | Value (000s) |
Australia - 4.1% |
BHP Billiton Ltd. | 211,768 | | $ 7,498 |
CSL Ltd. | 147,600 | | 7,278 |
Fortescue Metals Group Ltd. (d) | 208,017 | | 881 |
Macquarie Group Ltd. | 43,810 | | 1,451 |
Newcrest Mining Ltd. | 108,586 | | 2,979 |
Westfield Group unit | 426,827 | | 4,723 |
TOTAL AUSTRALIA | | 24,810 |
Bailiwick of Jersey - 0.7% |
Wolseley PLC | 30,300 | | 1,325 |
WPP PLC | 247,196 | | 3,195 |
TOTAL BAILIWICK OF JERSEY | | 4,520 |
Belgium - 0.5% |
Ageas | 41,090 | | 1,046 |
UCB SA | 29,600 | | 1,726 |
TOTAL BELGIUM | | 2,772 |
Bermuda - 1.1% |
Clear Media Ltd. | 1,278,000 | | 660 |
Oriental Watch Holdings Ltd. | 2,992,000 | | 896 |
Shenzhen International Holdings Ltd. | 7,820,000 | | 646 |
Signet Jewelers Ltd. | 82,600 | | 4,275 |
TOTAL BERMUDA | | 6,477 |
Brazil - 0.4% |
Souza Cruz SA | 205,800 | | 2,685 |
British Virgin Islands - 0.8% |
Gem Diamonds Ltd. (a) | 339,700 | | 925 |
Mail.ru Group Ltd.: | | | |
GDR (e) | 4,200 | | 140 |
GDR (Reg. S) | 113,200 | | 3,775 |
TOTAL BRITISH VIRGIN ISLANDS | | 4,840 |
Canada - 0.2% |
Yamana Gold, Inc. | 60,500 | | 1,222 |
Cayman Islands - 3.0% |
Baidu.com, Inc. sponsored ADR (a) | 13,500 | | 1,439 |
Hengdeli Holdings Ltd. | 18,578,000 | | 5,849 |
Noah Holdings Ltd. sponsored ADR (d) | 129,100 | | 646 |
Common Stocks - continued |
| Shares | | Value (000s) |
Cayman Islands - continued |
Tencent Holdings Ltd. | 266,800 | | $ 9,433 |
YouKu.com, Inc. ADR (a) | 38,800 | | 768 |
TOTAL CAYMAN ISLANDS | | 18,135 |
Denmark - 2.9% |
Danske Bank A/S (a) | 51,111 | | 799 |
Novo Nordisk A/S: | | | |
Series B | 19,863 | | 3,184 |
Series B sponsored ADR | 83,800 | | 13,432 |
TOTAL DENMARK | | 17,415 |
France - 12.4% |
Alstom SA | 109,436 | | 3,738 |
Atos Origin SA | 37,816 | | 2,539 |
AXA SA | 39,958 | | 635 |
AXA SA sponsored ADR | 67,200 | | 1,070 |
Beneteau SA | 86,400 | | 863 |
BNP Paribas SA | 62,616 | | 3,150 |
Club Mediterranee SA (a) | 53,000 | | 842 |
Danone SA | 118,422 | | 7,279 |
Essilor International SA | 13,262 | | 1,196 |
Gameloft SA (a) | 239,900 | | 1,642 |
GDF Suez | 85,511 | | 1,962 |
Iliad SA | 15,066 | | 2,321 |
Ingenico SA | 40,014 | | 2,118 |
Ipsos SA | 57,360 | | 2,016 |
Lafarge SA (Bearer) | 16,200 | | 949 |
LVMH Moet Hennessy - Louis Vuitton SA | 35,419 | | 5,757 |
Pernod Ricard SA | 72,700 | | 7,824 |
Safran SA | 52,800 | | 2,101 |
Sanofi SA | 80,690 | | 7,087 |
Sanofi SA sponsored ADR | 230,300 | | 10,099 |
Societe Generale Series A (a) | 35,613 | | 1,132 |
Total SA | 94,200 | | 4,745 |
Unibail-Rodamco | 19,000 | | 4,281 |
TOTAL FRANCE | | 75,346 |
Germany - 6.0% |
adidas AG | 31,900 | | 2,718 |
Allianz AG | 32,906 | | 4,080 |
Bayer AG | 55,340 | | 4,819 |
Commerzbank AG (a) | 235,000 | | 450 |
Deutsche Bank AG | 32,500 | | 1,480 |
Common Stocks - continued |
| Shares | | Value (000s) |
Germany - continued |
Deutsche Boerse AG | 58,469 | | $ 3,165 |
Deutsche Post AG | 108,546 | | 2,152 |
GSW Immobilien AG | 25,200 | | 1,037 |
K&S AG | 23,400 | | 1,107 |
Linde AG | 13,429 | | 2,258 |
Muenchener Rueckversicherungs AG | 11,355 | | 1,825 |
SAP AG | 126,552 | | 9,229 |
SAP AG sponsored ADR (d) | 21,800 | | 1,589 |
Tom Tailor Holding AG | 28,200 | | 601 |
TOTAL GERMANY | | 36,510 |
Hong Kong - 1.8% |
AIA Group Ltd. | 921,000 | | 3,648 |
Cheung Kong Holdings Ltd. | 74,000 | | 1,093 |
Henderson Land Development Co. Ltd. | 310,353 | | 2,150 |
Hutchison Whampoa Ltd. | 138,000 | | 1,358 |
Television Broadcasts Ltd. | 370,000 | | 2,757 |
TOTAL HONG KONG | | 11,006 |
Ireland - 3.1% |
CRH PLC | 213,332 | | 3,971 |
Glanbia PLC | 184,500 | | 1,751 |
Kingspan Group PLC (United Kingdom) | 257,600 | | 2,704 |
Paddy Power PLC (Ireland) | 140,400 | | 10,362 |
TOTAL IRELAND | | 18,788 |
Israel - 0.2% |
Rami Levi Chain Stores Hashikma Marketing 2006 Ltd. | 33,700 | | 1,004 |
Italy - 1.4% |
Assicurazioni Generali SpA | 71,400 | | 1,161 |
Brunello Cucinelli SpA | 4,900 | | 87 |
ENI SpA | 96,700 | | 2,225 |
ENI SpA sponsored ADR (d) | 22,300 | | 1,023 |
Saipem SpA | 93,432 | | 4,197 |
TOTAL ITALY | | 8,693 |
Japan - 12.9% |
Calbee, Inc. | 23,300 | | 2,139 |
Cosmos Pharmaceutical Corp. | 49,700 | | 4,900 |
Dai-ichi Mutual Life Insurance Co. | 866 | | 998 |
Denso Corp. | 33,000 | | 1,033 |
Hitachi Ltd. | 691,000 | | 3,661 |
Common Stocks - continued |
| Shares | | Value (000s) |
Japan - continued |
Honda Motor Co. Ltd. | 107,600 | | $ 3,235 |
Japan Tobacco, Inc. | 58,000 | | 1,603 |
Kakaku.com, Inc. | 136,200 | | 4,666 |
KDDI Corp. | 37,700 | | 2,928 |
Keyence Corp. | 17,800 | | 4,723 |
Mitsubishi Corp. | 152,100 | | 2,715 |
Mitsubishi UFJ Financial Group, Inc. | 1,175,800 | | 5,319 |
Mitsubishi UFJ Financial Group, Inc. sponsored ADR | 179,900 | | 808 |
MS&AD Insurance Group Holdings, Inc. | 79,900 | | 1,354 |
NKSJ Holdings, Inc. | 45,000 | | 820 |
Nomura Holdings, Inc. | 204,200 | | 738 |
ORIX Corp. | 33,070 | | 3,397 |
Rakuten, Inc. | 1,408,700 | | 12,670 |
Softbank Corp. | 158,700 | | 5,024 |
Sumitomo Mitsui Financial Group, Inc. | 138,000 | | 4,217 |
Tokio Marine Holdings, Inc. | 71,800 | | 1,900 |
Toyota Motor Corp. | 133,900 | | 5,163 |
Unicharm Corp. | 46,200 | | 2,500 |
Yahoo! Japan Corp. | 5,911 | | 2,034 |
TOTAL JAPAN | | 78,545 |
Kenya - 0.1% |
East African Breweries Ltd. | 116,216 | | 328 |
Korea (South) - 0.7% |
Samsung Electronics Co. Ltd. | 3,353 | | 4,029 |
Luxembourg - 0.1% |
ArcelorMittal SA Class A unit (d) | 55,600 | | 821 |
Netherlands - 2.0% |
AEGON NV | 109,900 | | 615 |
ASML Holding NV | 24,100 | | 1,325 |
ING Groep NV: | | | |
(Certificaten Van Aandelen) (a) | 173,010 | | 1,539 |
sponsored ADR (a) | 59,300 | | 525 |
Koninklijke Philips Electronics NV | 202,806 | | 5,079 |
Koninklijke Philips Electronics NV (depositary receipt) (NY Reg.) | 81,000 | | 2,031 |
Yandex NV (a) | 50,800 | | 1,183 |
TOTAL NETHERLANDS | | 12,297 |
Common Stocks - continued |
| Shares | | Value (000s) |
Nigeria - 0.2% |
Guinness Nigeria PLC | 384,138 | | $ 644 |
Nigerian Breweries PLC | 1,015,224 | | 783 |
TOTAL NIGERIA | | 1,427 |
Norway - 1.5% |
DnB NOR ASA | 208,600 | | 2,605 |
Schibsted ASA (B Shares) | 139,300 | | 5,216 |
StatoilHydro ASA | 9,400 | | 232 |
StatoilHydro ASA sponsored ADR | 55,700 | | 1,367 |
TOTAL NORWAY | | 9,420 |
Singapore - 0.3% |
United Overseas Bank Ltd. | 101,627 | | 1,522 |
South Africa - 0.2% |
City Lodge Hotels Ltd. | 32,800 | | 348 |
Life Healthcare Group Holdings Ltd. | 310,300 | | 1,173 |
TOTAL SOUTH AFRICA | | 1,521 |
Spain - 1.2% |
Banco Bilbao Vizcaya Argentaria SA | 255,571 | | 2,136 |
Banco Santander SA (Spain) | 127,661 | | 961 |
Grifols SA ADR | 75,600 | | 1,902 |
Iberdrola SA | 392,500 | | 2,030 |
TOTAL SPAIN | | 7,029 |
Sweden - 1.8% |
Nordea Bank AB | 166,600 | | 1,513 |
Svenska Cellulosa AB (SCA) (B Shares) | 219,300 | | 4,272 |
Swedbank AB (A Shares) | 51,612 | | 957 |
Swedish Match Co. AB | 120,200 | | 4,096 |
TOTAL SWEDEN | | 10,838 |
Switzerland - 8.4% |
Adecco SA (Reg.) | 86,391 | | 4,178 |
Compagnie Financiere Richemont SA Series A | 58,178 | | 3,773 |
Credit Suisse Group | 50,181 | | 1,167 |
Credit Suisse Group sponsored ADR | 23,296 | | 544 |
Nestle SA | 272,727 | | 17,314 |
Roche Holding AG (participation certificate) | 30,371 | | 5,841 |
Sika AG (Bearer) | 1,180 | | 2,462 |
Swatch Group AG (Bearer) | 6,200 | | 2,566 |
Swiss Re Ltd. | 21,960 | | 1,517 |
Syngenta AG (Switzerland) | 16,570 | | 6,460 |
Common Stocks - continued |
| Shares | | Value (000s) |
Switzerland - continued |
UBS AG | 170,978 | | $ 2,565 |
UBS AG (NY Shares) | 53,077 | | 797 |
Zurich Financial Services AG | 8,097 | | 1,995 |
TOTAL SWITZERLAND | | 51,179 |
Taiwan - 0.3% |
MediaTek, Inc. | 112,000 | | 1,244 |
Wowprime Corp. | 60,000 | | 842 |
TOTAL TAIWAN | | 2,086 |
Thailand - 0.3% |
Thai Beverage PCL | 4,673,000 | | 1,666 |
United Kingdom - 24.2% |
Aggreko PLC | 44,800 | | 1,554 |
Anglo American PLC (United Kingdom) | 117,359 | | 3,604 |
ASOS PLC (a) | 93,600 | | 3,406 |
Aviva PLC | 184,200 | | 986 |
Barclays PLC | 841,627 | | 3,112 |
Barclays PLC sponsored ADR (d) | 24,700 | | 366 |
BG Group PLC | 281,418 | | 5,211 |
BHP Billiton PLC | 192,986 | | 6,185 |
BP PLC sponsored ADR | 120,466 | | 5,167 |
Brammer PLC | 364,800 | | 1,414 |
British American Tobacco PLC (United Kingdom) | 27,800 | | 1,379 |
British Land Co. PLC | 299,700 | | 2,556 |
Centrica PLC | 672,000 | | 3,515 |
Dechra Pharmaceuticals PLC | 73,200 | | 729 |
Diageo PLC | 432,597 | | 12,367 |
Hays PLC | 2,622,000 | | 3,448 |
HSBC Holdings PLC: | | | |
(United Kingdom) | 63,100 | | 622 |
sponsored ADR | 212,833 | | 10,505 |
Imperial Tobacco Group PLC | 97,186 | | 3,670 |
Intertek Group PLC | 85,300 | | 3,880 |
Johnson Matthey PLC | 82,119 | | 2,980 |
Legal & General Group PLC | 527,691 | | 1,141 |
Lloyds Banking Group PLC (a) | 2,479,699 | | 1,633 |
M&C Saatchi PLC | 887,505 | | 2,660 |
Michael Page International PLC | 573,100 | | 3,333 |
Prudential PLC | 125,264 | | 1,720 |
Reckitt Benckiser Group PLC | 106,200 | | 6,427 |
Rio Tinto PLC | 118,832 | | 5,936 |
Common Stocks - continued |
| Shares | | Value (000s) |
United Kingdom - continued |
Rio Tinto PLC sponsored ADR | 9,100 | | $ 455 |
Rolls-Royce Group PLC | 164,274 | | 2,265 |
Rolls-Royce Group PLC Class C | 12,484,824 | | 20 |
Royal Bank of Scotland Group PLC (a) | 120,080 | | 536 |
Royal Dutch Shell PLC: | | | |
Class A (United Kingdom) | 188,233 | | 6,459 |
Class B (United Kingdom) | 197,675 | | 6,992 |
SABMiller PLC | 223,900 | | 9,591 |
Standard Chartered PLC (United Kingdom) | 146,813 | | 3,467 |
Sthree PLC | 190,600 | | 924 |
Vodafone Group PLC | 3,495,369 | | 9,492 |
William Hill PLC | 866,100 | | 4,724 |
Xstrata PLC | 172,600 | | 2,727 |
TOTAL UNITED KINGDOM | | 147,158 |
United States of America - 4.7% |
Amazon.com, Inc. (a) | 6,800 | | 1,583 |
Apple, Inc. | 4,500 | | 2,678 |
Deckers Outdoor Corp. (a)(d) | 83,200 | | 2,382 |
Dunkin' Brands Group, Inc. (d) | 59,700 | | 1,851 |
GNC Holdings, Inc. | 81,800 | | 3,163 |
Google, Inc. Class A (a) | 10,200 | | 6,934 |
Life Technologies Corp. (a) | 20,300 | | 993 |
MercadoLibre, Inc. | 18,800 | | 1,579 |
Monsanto Co. | 14,500 | | 1,248 |
Visa, Inc. Class A | 44,700 | | 6,203 |
TOTAL UNITED STATES OF AMERICA | | 28,614 |
TOTAL COMMON STOCKS (Cost $573,798) |
592,703
|
Nonconvertible Preferred Stocks - 1.2% |
| | | |
Germany - 1.2% |
Volkswagen AG
(Cost $6,046) | 35,900 | |
7,426
|
Money Market Funds - 2.4% |
| Shares | | Value (000s) |
Fidelity Cash Central Fund, 0.19% (b) | 7,629,808 | | $ 7,630 |
Fidelity Securities Lending Cash Central Fund, 0.19% (b)(c) | 6,890,900 | | 6,891 |
TOTAL MONEY MARKET FUNDS (Cost $14,521) |
14,521
|
TOTAL INVESTMENT PORTFOLIO - 101.1% (Cost $594,365) | | 614,650 |
NET OTHER ASSETS (LIABILITIES) - (1.1)% | | (6,982) |
NET ASSETS - 100% | $ 607,668 |
Legend |
(a) Non-income producing |
(b) Affiliated fund that is available only to investment companies and other accounts managed by Fidelity Investments. The rate quoted is the annualized seven-day yield of the fund at period end. A complete unaudited listing of the fund's holdings as of its most recent quarter end is available upon request. In addition, each Fidelity Central Fund's financial statements, which are not covered by the Fund's Report of Independent Registered Public Accounting Firm, are available on the SEC's website or upon request. |
(c) Investment made with cash collateral received from securities on loan. |
(d) Security or a portion of the security is on loan at period end. |
(e) Security exempt from registration under Rule 144A of the Securities Act of 1933. These securities may be resold in transactions exempt from registration, normally to qualified institutional buyers. At the end of the period, the value of these securities amounted to $140,000 or 0.0% of net assets. |
Affiliated Central Funds |
Information regarding fiscal year to date income earned by the Fund from investments in Fidelity Central Funds is as follows: |
Fund | Income earned
(Amounts in thousands) |
Fidelity Cash Central Fund | $ 12 |
Fidelity Securities Lending Cash Central Fund | 447 |
Total | $ 459 |
Other Information |
Categorizations in the Schedule of Investments are based on country or territory of incorporation. |
The following is a summary of the inputs used, as of October 31, 2012, involving the Fund's assets and liabilities carried at fair value. The inputs or methodology used for valuing securities may not be an indication of the risk associated with investing in those securities. For more information on valuation inputs, and their aggregation into the levels used in the tables below, please refer to the Security Valuation section in the accompanying Notes to Financial Statements. |
Valuation Inputs at Reporting Date: |
Description
(Amounts in thousands) | Total | Level 1 | Level 2 | Level 3 |
Investments in Securities: | | | | |
Equities: | | | | |
Consumer Discretionary | $ 102,919 | $ 91,326 | $ 11,593 | $ - |
Consumer Staples | 94,222 | 80,476 | 13,746 | - |
Energy | 37,618 | 16,965 | 20,653 | - |
Financials | 106,175 | 76,829 | 29,346 | - |
Health Care | 59,459 | 49,188 | 10,271 | - |
Industrials | 44,865 | 39,786 | 5,079 | - |
Information Technology | 72,931 | 63,702 | 9,229 | - |
Materials | 54,668 | 24,618 | 30,050 | - |
Telecommunication Services | 19,765 | 10,273 | 9,492 | - |
Utilities | 7,507 | 7,507 | - | - |
Money Market Funds | 14,521 | 14,521 | - | - |
Total Investments in Securities: | $ 614,650 | $ 475,191 | $ 139,459 | $ - |
The following is a summary of transfers between Level 1 and Level 2 for the period ended October 31, 2012. Transfers are assumed to have occurred at the beginning of the period, and are primarily attributable to the valuation techniques used for foreign equity securities, as discussed in the accompanying Notes to Financial Statements: |
Transfers | Total (000s) |
Level 1 to Level 2 | $ 0 |
Level 2 to Level 1 | $ 103,477 |
See accompanying notes which are an integral part of the financial statements.
Annual Report
Statement of Assets and Liabilities
Amounts in thousands (except per-share amounts) | October 31, 2012 |
| | |
Assets | | |
Investment in securities, at value (including securities loaned of $6,638) - See accompanying schedule: Unaffiliated issuers (cost $579,844) | $ 600,129 | |
Fidelity Central Funds (cost $14,521) | 14,521 | |
Total Investments (cost $594,365) | | $ 614,650 |
Foreign currency held at value (cost $335) | | 335 |
Receivable for investments sold | | 297 |
Receivable for fund shares sold | | 788 |
Dividends receivable | | 1,524 |
Distributions receivable from Fidelity Central Funds | | 9 |
Other receivables | | 235 |
Total assets | | 617,838 |
| | |
Liabilities | | |
Payable for investments purchased | $ 1,698 | |
Payable for fund shares redeemed | 790 | |
Accrued management fee | 421 | |
Distribution and service plan fees payable | 143 | |
Other affiliated payables | 142 | |
Other payables and accrued expenses | 85 | |
Collateral on securities loaned, at value | 6,891 | |
Total liabilities | | 10,170 |
| | |
Net Assets | | $ 607,668 |
Net Assets consist of: | | |
Paid in capital | | $ 722,896 |
Undistributed net investment income | | 8,714 |
Accumulated undistributed net realized gain (loss) on investments and foreign currency transactions | | (144,176) |
Net unrealized appreciation (depreciation) on investments and assets and liabilities in foreign currencies | | 20,234 |
Net Assets | | $ 607,668 |
See accompanying notes which are an integral part of the financial statements.
Annual Report
Statement of Assets and Liabilities - continued
Amounts in thousands (except per-share amounts) | October 31, 2012 |
| | |
Calculation of Maximum Offering Price Class A:
Net Asset Value and redemption price per share ($60,378 ÷ 3,603 shares) | | $ 16.76 |
| | |
Maximum offering price per share (100/94.25 of $16.76) | | $ 17.78 |
Class T:
Net Asset Value and redemption price per share ($270,883 ÷ 15,782 shares) | | $ 17.16 |
| | |
Maximum offering price per share (100/96.50 of $17.16) | | $ 17.78 |
Class B:
Net Asset Value and offering price per share ($3,022 ÷ 186 shares)A | | $ 16.25 |
| | |
Class C:
Net Asset Value and offering price per share ($16,100 ÷ 980 shares)A | | $ 16.43 |
| | |
Institutional Class:
Net Asset Value, offering price and redemption price per share ($257,285 ÷ 15,037 shares) | | $ 17.11 |
A Redemption price per share is equal to net asset value less any applicable contingent deferred sales charge.
See accompanying notes which are an integral part of the financial statements.
Annual Report
Financial Statements - continued
Statement of Operations
Amounts in thousands | Year ended October 31, 2012 |
| | |
Investment Income | | |
Dividends | | $ 17,934 |
Income from Fidelity Central Funds | | 459 |
Income before foreign taxes withheld | | 18,393 |
Less foreign taxes withheld | | (1,162) |
Total income | | 17,231 |
| | |
Expenses | | |
Management fee
Basic fee | $ 4,446 | |
Performance adjustment | (112) | |
Transfer agent fees | 1,436 | |
Distribution and service plan fees | 1,751 | |
Accounting and security lending fees | 316 | |
Custodian fees and expenses | 110 | |
Independent trustees' compensation | 4 | |
Registration fees | 70 | |
Audit | 74 | |
Legal | 3 | |
Interest | - | |
Miscellaneous | 9 | |
Total expenses before reductions | 8,107 | |
Expense reductions | (105) | 8,002 |
Net investment income (loss) | | 9,229 |
Realized and Unrealized Gain (Loss) Net realized gain (loss) on: | | |
Investment securities: | | |
Unaffiliated issuers | (23,539) | |
Foreign currency transactions | (114) | |
Total net realized gain (loss) | | (23,653) |
Change in net unrealized appreciation (depreciation) on: Investment securities | 44,968 | |
Assets and liabilities in foreign currencies | (109) | |
Total change in net unrealized appreciation (depreciation) | | 44,859 |
Net gain (loss) | | 21,206 |
Net increase (decrease) in net assets resulting from operations | | $ 30,435 |
See accompanying notes which are an integral part of the financial statements.
Annual Report
Statement of Changes in Net Assets
Amounts in thousands | Year ended
October 31,
2012 | Year ended
October 31,
2011 |
Increase (Decrease) in Net Assets | | |
Operations | | |
Net investment income (loss) | $ 9,229 | $ 10,269 |
Net realized gain (loss) | (23,653) | 139,082 |
Change in net unrealized appreciation (depreciation) | 44,859 | (202,787) |
Net increase (decrease) in net assets resulting
from operations | 30,435 | (53,436) |
Distributions to shareholders from net investment income | (10,172) | (12,982) |
Distributions to shareholders from net realized gain | - | (2,756) |
Total distributions | (10,172) | (15,738) |
Share transactions - net increase (decrease) | (148,253) | (342,819) |
Redemption fees | 13 | 20 |
Total increase (decrease) in net assets | (127,977) | (411,973) |
| | |
Net Assets | | |
Beginning of period | 735,645 | 1,147,618 |
End of period (including undistributed net investment income of $8,714 and undistributed net investment income of $9,657, respectively) | $ 607,668 | $ 735,645 |
See accompanying notes which are an integral part of the financial statements.
Annual Report
Financial Highlights - Class A
Years ended October 31, | 2012 | 2011 | 2010 | 2009 | 2008 |
Selected Per-Share Data | | | | | |
Net asset value, beginning of period | $ 16.13 | $ 17.77 | $ 15.68 | $ 13.56 | $ 26.85 |
Income from Investment Operations | | | | | |
Net investment income (loss) C | .23 | .16 | .17 | .24 | .38 |
Net realized and unrealized gain (loss) | .64 | (1.54) | 2.16 | 2.12 | (11.56) |
Total from investment operations | .87 | (1.38) | 2.33 | 2.36 | (11.18) |
Distributions from net investment income | (.24) | (.21) | (.21) | (.24) | (.33) |
Distributions from net realized gain | - | (.05) | (.03) | - | (1.78) |
Total distributions | (.24) | (.26) | (.24) | (.24) | (2.11) |
Redemption fees added to paid in capital C,G | - | - | - | - | - |
Net asset value, end of period | $ 16.76 | $ 16.13 | $ 17.77 | $ 15.68 | $ 13.56 |
Total Return A,B | 5.51% | (7.95)% | 14.99% | 17.97% | (45.08)% |
Ratios to Average Net Assets D,F | | | | | |
Expenses before reductions | 1.33% | 1.34% | 1.36% | 1.36% | 1.35% |
Expenses net of fee waivers, if any | 1.33% | 1.34% | 1.36% | 1.36% | 1.35% |
Expenses net of all reductions | 1.32% | 1.32% | 1.33% | 1.33% | 1.32% |
Net investment income (loss) | 1.43% | .90% | 1.04% | 1.79% | 1.83% |
Supplemental Data | | | | | |
Net assets, end of period (in millions) | $ 60 | $ 60 | $ 70 | $ 72 | $ 73 |
Portfolio turnover rate E | 36% | 44% | 53% | 83% | 79% |
A Total returns would have been lower if certain expenses had not been reduced during the applicable periods shown.
B Total returns do not include the effect of the sales charges.
C Calculated based on average shares outstanding during the period.
D Fees and expenses of any underlying Fidelity Central Funds are not included in the Fund's expense ratio. The Fund indirectly bears its proportionate share of the expenses of any underlying Fidelity Central Funds.
E Amount does not include the portfolio activity of any underlying Fidelity Central Funds.
F Expense ratios reflect operating expenses of the class. Expenses before reductions do not reflect amounts reimbursed by the investment adviser or reductions from brokerage service arrangements or reductions from other expense offset arrangements and do not represent the amount paid by the class during periods when reimbursements or reductions occur. Expenses net of fee waivers reflect expenses after reimbursement by the investment adviser but prior to reductions from brokerage service arrangements or other expense offset arrangements. Expenses net of all reductions represent the net expenses paid by the class.
G Amount represents less than $.01 per share.
See accompanying notes which are an integral part of the financial statements.
Annual Report
Financial Highlights - Class T
Years ended October 31, | 2012 | 2011 | 2010 | 2009 | 2008 |
Selected Per-Share Data | | | | | |
Net asset value, beginning of period | $ 16.50 | $ 18.18 | $ 16.03 | $ 13.84 | $ 27.35 |
Income from Investment Operations | | | | | |
Net investment income (loss) C | .20 | .13 | .14 | .22 | .36 |
Net realized and unrealized gain (loss) | .66 | (1.59) | 2.23 | 2.17 | (11.82) |
Total from investment operations | .86 | (1.46) | 2.37 | 2.39 | (11.46) |
Distributions from net investment income | (.20) | (.17) | (.19) | (.20) | (.27) |
Distributions from net realized gain | - | (.05) | (.03) | - | (1.78) |
Total distributions | (.20) | (.22) | (.22) | (.20) | (2.05) |
Redemption fees added to paid in capital C,G | - | - | - | - | - |
Net asset value, end of period | $ 17.16 | $ 16.50 | $ 18.18 | $ 16.03 | $ 13.84 |
Total Return A,B | 5.32% | (8.17)% | 14.88% | 17.70% | (45.18)% |
Ratios to Average Net Assets D,F | | | | | |
Expenses before reductions | 1.51% | 1.52% | 1.53% | 1.57% | 1.51% |
Expenses net of fee waivers, if any | 1.51% | 1.51% | 1.53% | 1.57% | 1.51% |
Expenses net of all reductions | 1.50% | 1.49% | 1.50% | 1.54% | 1.48% |
Net investment income (loss) | 1.25% | .73% | .86% | 1.58% | 1.67% |
Supplemental Data | | | | | |
Net assets, end of period (in millions) | $ 271 | $ 305 | $ 371 | $ 367 | $ 345 |
Portfolio turnover rate E | 36% | 44% | 53% | 83% | 79% |
A Total returns would have been lower if certain expenses had not been reduced during the applicable periods shown.
B Total returns do not include the effect of the sales charges.
C Calculated based on average shares outstanding during the period.
D Fees and expenses of any underlying Fidelity Central Funds are not included in the Fund's expense ratio. The Fund indirectly bears its proportionate share of the expenses of any underlying Fidelity Central Funds.
E Amount does not include the portfolio activity of any underlying Fidelity Central Funds.
F Expense ratios reflect operating expenses of the class. Expenses before reductions do not reflect amounts reimbursed by the investment adviser or reductions from brokerage service arrangements or reductions from other expense offset arrangements and do not represent the amount paid by the class during periods when reimbursements or reductions occur. Expenses net of fee waivers reflect expenses after reimbursement by the investment adviser but prior to reductions from brokerage service arrangements or other expense offset arrangements. Expenses net of all reductions represent the net expenses paid by the class.
G Amount represents less than $.01 per share.
See accompanying notes which are an integral part of the financial statements.
Annual Report
Financial Highlights - Class B
Years ended October 31, | 2012 | 2011 | 2010 | 2009 | 2008 |
Selected Per-Share Data | | | | | |
Net asset value, beginning of period | $ 15.58 | $ 17.18 | $ 15.16 | $ 13.02 | $ 25.79 |
Income from Investment Operations | | | | | |
Net investment income (loss) C | .10 | .03 | .04 | .13 | .22 |
Net realized and unrealized gain (loss) | .63 | (1.51) | 2.10 | 2.08 | (11.14) |
Total from investment operations | .73 | (1.48) | 2.14 | 2.21 | (10.92) |
Distributions from net investment income | (.06) | (.08) | (.09) | (.07) | (.07) |
Distributions from net realized gain | - | (.05) | (.03) | - | (1.78) |
Total distributions | (.06) | (.12) H | (.12) | (.07) | (1.85) |
Redemption fees added to paid in capital C,G | - | - | - | - | - |
Net asset value, end of period | $ 16.25 | $ 15.58 | $ 17.18 | $ 15.16 | $ 13.02 |
Total Return A,B | 4.72% | (8.67)% | 14.15% | 17.09% | (45.50)% |
Ratios to Average Net Assets D,F | | | | | |
Expenses before reductions | 2.09% | 2.10% | 2.11% | 2.12% | 2.10% |
Expenses net of fee waivers, if any | 2.09% | 2.09% | 2.11% | 2.12% | 2.10% |
Expenses net of all reductions | 2.07% | 2.07% | 2.09% | 2.08% | 2.08% |
Net investment income (loss) | .67% | .15% | .28% | 1.04% | 1.07% |
Supplemental Data | | | | | |
Net assets, end of period (in millions) | $ 3 | $ 4 | $ 7 | $ 8 | $ 10 |
Portfolio turnover rate E | 36% | 44% | 53% | 83% | 79% |
A Total returns would have been lower if certain expenses had not been reduced during the applicable periods shown.
B Total returns do not include the effect of the contingent deferred sales charge.
C Calculated based on average shares outstanding during the period.
D Fees and expenses of any underlying Fidelity Central Funds are not included in the Fund's expense ratio. The Fund indirectly bears its proportionate share of the expenses of any underlying Fidelity Central Funds.
E Amount does not include the portfolio activity of any underlying Fidelity Central Funds.
F Expense ratios reflect operating expenses of the class. Expenses before reductions do not reflect amounts reimbursed by the investment adviser or reductions from brokerage service arrangements or reductions from other expense offset arrangements and do not represent the amount paid by the class during periods when reimbursements or reductions occur. Expenses net of fee waivers reflect expenses after reimbursement by the investment adviser but prior to reductions from brokerage service arrangements or other expense offset arrangements. Expenses net of all reductions represent the net expenses paid by the class.
G Amount represents less than $.01 per share.
H Total distributions of $.12 per share is comprised of distributions from net investment income of $.079 and distributions from net realized gain of $.045 per share.
See accompanying notes which are an integral part of the financial statements.
Annual Report
Financial Highlights - Class C
Years ended October 31, | 2012 | 2011 | 2010 | 2009 | 2008 |
Selected Per-Share Data | | | | | |
Net asset value, beginning of period | $ 15.78 | $ 17.39 | $ 15.36 | $ 13.22 | $ 26.22 |
Income from Investment Operations | | | | | |
Net investment income (loss) C | .11 | .03 | .05 | .14 | .22 |
Net realized and unrealized gain (loss) | .64 | (1.52) | 2.12 | 2.09 | (11.31) |
Total from investment operations | .75 | (1.49) | 2.17 | 2.23 | (11.09) |
Distributions from net investment income | (.10) | (.07) | (.11) | (.09) | (.13) |
Distributions from net realized gain | - | (.05) | (.03) | - | (1.78) |
Total distributions | (.10) | (.12) | (.14) | (.09) | (1.91) |
Redemption fees added to paid in capital C,G | - | - | - | - | - |
Net asset value, end of period | $ 16.43 | $ 15.78 | $ 17.39 | $ 15.36 | $ 13.22 |
Total Return A,B | 4.78% | (8.67)% | 14.17% | 17.06% | (45.50)% |
Ratios to Average Net Assets D,F | | | | | |
Expenses before reductions | 2.09% | 2.09% | 2.10% | 2.11% | 2.09% |
Expenses net of fee waivers, if any | 2.09% | 2.09% | 2.10% | 2.11% | 2.09% |
Expenses net of all reductions | 2.07% | 2.07% | 2.08% | 2.08% | 2.07% |
Net investment income (loss) | .67% | .15% | .29% | 1.05% | 1.08% |
Supplemental Data | | | | | |
Net assets, end of period (in millions) | $ 16 | $ 19 | $ 22 | $ 23 | $ 22 |
Portfolio turnover rate E | 36% | 44% | 53% | 83% | 79% |
A Total returns would have been lower if certain expenses had not been reduced during the applicable periods shown.
B Total returns do not include the effect of the contingent deferred sales charge.
C Calculated based on average shares outstanding during the period.
D Fees and expenses of any underlying Fidelity Central Funds are not included in the Fund's expense ratio. The Fund indirectly bears its proportionate share of the expenses of any underlying Fidelity Central Funds.
E Amount does not include the portfolio activity of any underlying Fidelity Central Funds.
F Expense ratios reflect operating expenses of the class. Expenses before reductions do not reflect amounts reimbursed by the investment adviser or reductions from brokerage service arrangements or reductions from other expense offset arrangements and do not represent the amount paid by the class during periods when reimbursements or reductions occur. Expenses net of fee waivers reflect expenses after reimbursement by the investment adviser but prior to reductions from brokerage service arrangements or other expense offset arrangements. Expenses net of all reductions represent the net expenses paid by the class.
G Amount represents less than $.01 per share.
See accompanying notes which are an integral part of the financial statements.
Annual Report
Financial Highlights - Institutional Class
Years ended October 31, | 2012 | 2011 | 2010 | 2009 | 2008 |
Selected Per-Share Data | | | | | |
Net asset value, beginning of period | $ 16.45 | $ 18.10 | $ 15.95 | $ 13.83 | $ 27.35 |
Income from Investment Operations | | | | | |
Net investment income (loss) B | .29 | .23 | .22 | .29 | .45 |
Net realized and unrealized gain (loss) | .65 | (1.59) | 2.23 | 2.14 | (11.78) |
Total from investment operations | .94 | (1.36) | 2.45 | 2.43 | (11.33) |
Distributions from net investment income | (.28) | (.24) | (.27) | (.31) | (.41) |
Distributions from net realized gain | - | (.05) | (.03) | - | (1.78) |
Total distributions | (.28) | (.29) | (.30) | (.31) | (2.19) |
Redemption fees added to paid in capital B,F | - | - | - | - | - |
Net asset value, end of period | $ 17.11 | $ 16.45 | $ 18.10 | $ 15.95 | $ 13.83 |
Total Return A | 5.91% | (7.70)% | 15.49% | 18.32% | (44.92)% |
Ratios to Average Net Assets C,E | | | | | |
Expenses before reductions | .99% | 1.00% | 1.01% | 1.06% | 1.01% |
Expenses net of fee waivers, if any | .99% | .99% | 1.01% | 1.06% | 1.01% |
Expenses net of all reductions | .97% | .97% | .98% | 1.02% | .98% |
Net investment income (loss) | 1.77% | 1.25% | 1.39% | 2.10% | 2.17% |
Supplemental Data | | | | | |
Net assets, end of period (in millions) | $ 257 | $ 349 | $ 678 | $ 727 | $ 551 |
Portfolio turnover rate D | 36% | 44% | 53% | 83% | 79% |
A Total returns would have been lower if certain expenses had not been reduced during the applicable periods shown.
B Calculated based on average shares outstanding during the period.
C Fees and expenses of any underlying Fidelity Central Funds are not included in the Fund's expense ratio. The Fund indirectly bears its proportionate share of the expenses of any underlying Fidelity Central Funds.
D Amount does not include the portfolio activity of any underlying Fidelity Central Funds.
E Expense ratios reflect operating expenses of the class. Expenses before reductions do not reflect amounts reimbursed by the investment adviser or reductions from brokerage service arrangements or reductions from other expense offset arrangements and do not represent the amount paid by the class during periods when reimbursements or reductions occur. Expenses net of fee waivers reflect expenses after reimbursement by the investment adviser but prior to reductions from brokerage service arrangements or other expense offset arrangements. Expenses net of all reductions represent the net expenses paid by the class.
F Amount represents less than $.01 per share.
See accompanying notes which are an integral part of the financial statements.
Annual Report
Notes to Financial Statements
For the period ended October 31, 2012
(Amounts in thousands except percentages)
1. Organization.
Fidelity Advisor Overseas Fund (the Fund) is a fund of Fidelity Advisor Series VIII (the Trust) and is authorized to issue an unlimited number of shares. The Trust is registered under the Investment Company Act of 1940, as amended (the 1940 Act), as an open-end management investment company organized as a Massachusetts business trust. The Fund offers Class A, Class T, Class C, and Institutional Class shares, each of which, along with Class B shares, has equal rights as to assets and voting privileges. Effective after the close of business on September 1, 2010, Class B shares were closed to new accounts and additional purchases, except for exchanges and reinvestments. Each class has exclusive voting rights with respect to matters that affect that class. Class B shares will automatically convert to Class A shares after a holding period of seven years from the initial date of purchase. Investment income, realized and unrealized capital gains and losses, the common expenses of the Fund, and certain fund-level expense reductions, if any, are allocated on a pro-rata basis to each class based on the relative net assets of each class to the total net assets of the Fund. Each class differs with respect to transfer agent and distribution and service plan fees incurred. Certain expense reductions may also differ by class.
2. Investments in Fidelity Central Funds.
The Fund invests in Fidelity Central Funds, which are open-end investment companies available only to other investment companies and accounts managed by Fidelity Management & Research Company (FMR) and its affiliates. The Fund's Schedule of Investments lists each of the Fidelity Central Funds held as of period end, if any, as an investment of the Fund, but does not include the underlying holdings of each Fidelity Central Fund. As an Investing Fund, the Fund indirectly bears its proportionate share of the expenses of the underlying Fidelity Central Funds.
The Money Market Central Funds seek preservation of capital and current income and are managed by Fidelity Investments Money Management, Inc. (FIMM), an affiliate of FMR.
A complete unaudited list of holdings for each Fidelity Central Fund is available upon request or at the Securities and Exchange Commission (the SEC) web site at www.sec.gov. In addition, the financial statements of the Fidelity Central Funds, which are not covered by the Fund's Report of Independent Registered Public Accounting Firm, are available on the SEC web site or upon request.
3. Significant Accounting Policies.
The financial statements have been prepared in conformity with accounting principles generally accepted in the United States of America (GAAP), which require management to make certain estimates and assumptions at the date of the financial statements.
Annual Report
Notes to Financial Statements - continued
(Amounts in thousands except percentages)
3. Significant Accounting Policies - continued
Actual results could differ from those estimates. Subsequent events, if any, through the date that the financial statements were issued have been evaluated in the preparation of the financial statements. The following summarizes the significant accounting policies of the Fund:
Security Valuation. Investments are valued as of 4:00 p.m. Eastern time on the last calendar day of the period. In accordance with valuation policies and procedures approved by the Board of Trustees (the Board), the Fund attempts to obtain prices from one or more third party pricing vendors or brokers to value its investments. When current market prices, quotations or rates are not readily available or reliable, securities will be fair valued in good faith by the FMR Fair Value Committee (the Committee), in accordance with procedures adopted by the Fund's Board. Factors used in determining fair value vary by security type and may include market or security specific events. The frequency with which these procedures are used cannot be predicted and they may be utilized to a significant extent. The Committee oversees the Fund's valuation policies and procedures and is responsible for approving and reporting to the Board all fair value determinations.
The Fund categorizes the inputs to valuation techniques used to value its investments into a disclosure hierarchy consisting of three levels as shown below:
Level 1 - quoted prices in active markets for identical investments
Level 2 - other significant observable inputs (including quoted prices for similar investments, interest rates, prepayment speeds, etc.)
Level 3 - unobservable inputs (including the Fund's own assumptions based on the best information available)
Valuation techniques used to value the Fund's investments by major category are as follows:
Equity securities, including restricted securities, for which market quotations are readily available, are valued at the last reported sale price or official closing price as reported by a third party pricing vendor on the primary market or exchange on which they are traded and are categorized as Level 1 in the hierarchy. In the event there were no sales during the day or closing prices are not available, securities are valued at the last quoted bid price or may be valued using the last available price and are generally categorized as Level 2 in the hierarchy. For foreign equity securities, when significant market or security specific events arise, comparisons to the valuation of American Depositary Receipts (ADRs), futures contracts, Exchange-Traded Funds (ETFs) and certain indexes as well as quoted prices for similar securities are used and are categorized as Level 2 in the hierarchy. Utilizing these techniques may result in transfers between Level 1 and Level 2.
Annual Report
3. Significant Accounting Policies - continued
Security Valuation - continued
Investments in open-end mutual funds, including the Fidelity Central Funds, are valued at their closing net asset value (NAV) each business day and are categorized as Level 1 in the hierarchy.
Changes in valuation techniques may result in transfers in or out of an assigned level within the disclosure hierarchy. The aggregate value of investments by input level, as of October 31, 2012, including information on transfers between Levels 1 and 2, is included at the end of the Fund's Schedule of Investments.
Foreign Currency Translation. The Fund may use foreign currency contracts to facilitate transactions in foreign-denominated securities. Gains and losses from these transactions may arise from changes in the value of the foreign currency or if the counterparties do not perform under the contracts' terms.
Foreign-denominated assets, including investment securities, and liabilities are translated into U.S. dollars at the exchange rates at period end. Purchases and sales of investment securities, income and dividends received and expenses denominated in foreign currencies are translated into U.S. dollars at the exchange rate in effect on the transaction date.
The effects of exchange rate fluctuations on investments are included with the net realized and unrealized gain (loss) on investment securities. Other foreign currency transactions resulting in realized and unrealized gain (loss) are disclosed separately.
Investment Transactions and Income. For financial reporting purposes, the Fund's investment holdings and NAV include trades executed through the end of the last business day of the period. The NAV per share for processing shareholder transactions is calculated as of the close of business of the New York Stock Exchange (NYSE), normally 4:00 p.m. Eastern time and includes trades executed through the end of the prior business day. Gains and losses on securities sold are determined on the basis of identified cost and may include proceeds received from litigation. Dividend income is recorded on the ex-dividend date, except for certain dividends from foreign securities where the ex-dividend date may have passed, which are recorded as soon as the Fund is informed of the ex-dividend date. Non-cash dividends included in dividend income, if any, are recorded at the fair market value of the securities received. Interest income and distributions from the Fidelity Central Funds are accrued as earned. Investment income is recorded net of foreign taxes withheld where recovery of such taxes is uncertain.
Annual Report
Notes to Financial Statements - continued
(Amounts in thousands except percentages)
3. Significant Accounting Policies - continued
Expenses. Expenses directly attributable to a fund are charged to that fund. Expenses attributable to more than one fund are allocated among the respective funds on the basis of relative net assets or other appropriate methods. Expense estimates are accrued in the period to which they relate and adjustments are made when actual amounts are known.
Income Tax Information and Distributions to Shareholders. Each year, the Fund intends to qualify as a regulated investment company under Subchapter M of the Internal Revenue Code, including distributing substantially all of its taxable income and realized gains. As a result, no provision for income taxes is required. As of October 31, 2012, the Fund did not have any unrecognized tax benefits in the financial statements; nor is the Fund aware of any tax positions for which it is reasonably possible that the total amounts of unrecognized tax benefits will significantly change in the next twelve months. The Fund files a U.S. federal tax return, in addition to state and local tax returns as required. A fund's federal income tax returns are subject to examination by the Internal Revenue Service (IRS) for a period of three fiscal years after they are filed. State and local tax returns may be subject to examination for an additional fiscal year depending on the jurisdiction. Foreign taxes are provided for based on the Fund's understanding of the tax rules and rates that exist in the foreign markets in which it invests.
Distributions are declared and recorded on the ex-dividend date. Income dividends and capital gain distributions are declared separately for each class. Income and capital gain distributions are determined in accordance with income tax regulations, which may differ from GAAP.
Capital accounts within the financial statements are adjusted for permanent book-tax differences. These adjustments have no impact on net assets or the results of operations. Temporary book-tax differences will reverse in a subsequent period.
Book-tax differences are primarily due to foreign currency transactions, passive foreign investment companies (PFIC), deferred trustees compensation, capital loss carryforwards and losses deferred due to wash sales.
The federal tax cost of investment securities and unrealized appreciation (depreciation) as of period end were as follows:
Gross unrealized appreciation | $ 82,781 |
Gross unrealized depreciation | (75,413) |
Net unrealized appreciation (depreciation) on securities and other investments | $ 7,368 |
| |
Tax Cost | $ 607,282 |
Annual Report
3. Significant Accounting Policies - continued
Income Tax Information and Distributions to Shareholders - continued
The tax-based components of distributable earnings as of period end were as follows:
Undistributed ordinary income | $ 10,074 |
Capital loss carryforward | $ (132,619) |
Net unrealized appreciation (depreciation) | $ 7,317 |
Capital loss carryforwards are only available to offset future capital gains of the Fund to the extent provided by regulations and may be limited. Under the Regulated Investment Company Modernization Act of 2010 (the Act), the Fund is permitted to carry forward capital losses incurred in taxable years beginning after December 22, 2010 for an unlimited period and such capital losses are required to be used prior to any losses that expire. Capital loss carryforwards were as follows:
Fiscal year of expiration | |
| |
2017 | $ (104,924) |
No expiration | |
Short-term | (11,858) |
Long-term | (15,837) |
Total no expiration | (27,695) |
Total capital loss carryforward | $ (132,619) |
The tax character of distributions paid was as follows:
| October 31, 2012 | October 31, 2011 |
Ordinary Income | $ 10,172 | $ 15,738 |
Short-Term Trading (Redemption) Fees. Shares held by investors in the Fund less than 30 days are subject to a redemption fee equal to 1.00% of the net asset value of shares redeemed. All redemption fees, which reduce the proceeds of the shareholder redemption, are retained by the Fund and accounted for as an addition to paid in capital.
Restricted Securities. The Fund may invest in securities that are subject to legal or contractual restrictions on resale. These securities generally may be resold in transactions exempt from registration or to the public if the securities are registered. Disposal of these securities may involve time-consuming negotiations and expense, and prompt sale at an acceptable price may be difficult. Information regarding restricted securities is included at the end of the Fund's Schedule of Investments.
Annual Report
Notes to Financial Statements - continued
(Amounts in thousands except percentages)
3. Significant Accounting Policies - continued
New Accounting Pronouncement. In December 2011, the Financial Accounting Standards Board issued Accounting Standard Update No. 2011-11, Disclosures about Offsetting Assets and Liabilities. The update creates new disclosure requirements requiring entities to disclose both gross and net information for derivatives and other financial instruments that are either offset in the Statement of Assets and Liabilities or subject to an enforceable master netting arrangement or similar agreement. The disclosure requirements are effective for annual reporting periods beginning on or after January 1, 2013, and interim periods within those annual periods. Management is currently evaluating the impact of the update's adoption on the Fund's financial statement disclosures.
4. Purchases and Sales of Investments.
Purchases and sales of securities, other than short-term securities, aggregated $224,677 and $365,737, respectively.
5. Fees and Other Transactions with Affiliates.
Management Fee. FMR and its affiliates provide the Fund with investment management related services for which the Fund pays a monthly management fee. The management fee is the sum of an individual fund fee rate that is based on an annual rate of .45% of the Fund's average net assets and an annualized group fee rate that averaged .26% during the period. The group fee rate is based upon the average net assets of all the mutual funds advised by FMR. The group fee rate decreases as assets under management increase and increases as assets under management decrease. In addition, the management fee is subject to a performance adjustment (up to a maximum of ± .20% of the Fund's average net assets over a 36 month performance period). The upward or downward adjustment to the management fee is based on the investment performance of the asset-weighted return of all classes as compared to an appropriate benchmark index. For the period, the total annual management fee rate, including the performance adjustment, was .69% of the Fund's average net assets.
Distribution and Service Plan Fees. In accordance with Rule 12b-1 of the 1940 Act, the Fund has adopted separate Distribution and Service Plans for each class of shares. Certain classes pay Fidelity Distributors Corporation (FDC), an affiliate of FMR, separate Distribution and Service Fees, each of which is based on an annual percentage of each class' average net assets. In addition, FDC may pay financial intermediaries for selling shares of the Fund and providing shareholder support services. For the period, the Distribution and Service Fee rates, total fees and amounts retained by FDC were as follows:
Annual Report
5. Fees and Other Transactions with Affiliates - continued
Distribution and Service Plan Fees - continued
| Distribution
Fee | Service
Fee | Total Fees | Retained
by FDC |
Class A | -% | .25% | $ 148 | $ 3 |
Class T | .25% | .25% | 1,400 | 15 |
Class B | .75% | .25% | 35 | 26 |
Class C | .75% | .25% | 168 | 10 |
| | | $ 1,751 | $ 54 |
Sales Load. FDC may receive a front-end sales charge of up to 5.75% for selling Class A shares and 3.50% for selling Class T shares, some of which is paid to financial intermediaries for selling shares of the Fund. Depending on the holding period, FDC may receive contingent deferred sales charges levied on Class A, Class T, Class B, and Class C redemptions. The deferred sales charges range from 5.00% to 1.00% for Class B shares, 1.00% for Class C shares, 1.00% for certain purchases of Class A shares and .25% for certain purchases of Class T shares.
For the period, sales charge amounts retained by FDC were as follows:
| Retained
by FDC |
Class A | $ 4 |
Class T | 3 |
Class B* | 5 |
Class C* | 1 |
| $ 13 |
* When Class B and Class C shares are initially sold, FDC pays commissions from its own resources to financial intermediaries through which the sales are made.
Transfer Agent Fees. Fidelity Investments Institutional Operations Company, Inc. (FIIOC), an affiliate of FMR, is the transfer, dividend disbursing and shareholder servicing agent for each class of the Fund. FIIOC receives account fees and asset-based fees that vary according to the account size and type of account of the shareholders of the respective classes of the Fund. FIIOC pays for typesetting, printing and mailing of shareholder reports, except proxy statements. For the period, transfer agent fees for each class were as follows:
Annual Report
Notes to Financial Statements - continued
(Amounts in thousands except percentages)
5. Fees and Other Transactions with Affiliates - continued
Transfer Agent Fees - continued
| Amount | % of
Average
Net Assets |
Class A | $ 178 | .30 |
Class T | 641 | .23 |
Class B | 10 | .30 |
Class C | 51 | .30 |
Institutional Class | 556 | .21 |
| $ 1,436 | |
Accounting and Security Lending Fees. Fidelity Service Company, Inc. (FSC), an affiliate of FMR, maintains the Fund's accounting records. The accounting fee is based on the level of average net assets for each month. Under a separate contract, FSC administers the security lending program. The security lending fee is based on the number and duration of lending transactions.
Brokerage Commissions. The Fund placed a portion of its portfolio transactions with brokerage firms which are affiliates of the investment adviser. The commissions paid to these affiliated firms were four hundred ninety dollars for the period.
Interfund Lending Program. Pursuant to an Exemptive Order issued by the SEC, the Fund, along with other registered investment companies having management contracts with FMR, may participate in an interfund lending program. This program provides an alternative credit facility allowing the funds to borrow from, or lend money to, other participating affiliated funds. At period end, there were no interfund loans outstanding. The Fund's activity in this program during the period for which loans were outstanding was as follows:
Borrower or Lender | Average Loan
Balance | Weighted Average Interest Rate | Interest Expense |
Borrower | $ 9,917 | .32% | $ -* |
* Amount represents one hundred seventy-eight dollars.
6. Committed Line of Credit.
The Fund participates with other funds managed by FMR or an affiliate in a $4.25 billion credit facility (the "line of credit") to be utilized for temporary or emergency purposes to fund shareholder redemptions or for other short-term liquidity purposes. The Fund has agreed to pay commitment fees on its pro-rata portion of the line of credit, which amounted to $2 and is reflected in Miscellaneous expenses on the Statement of Operations. During the period, there were no borrowings on this line of credit.
Annual Report
7. Security Lending.
The Fund lends portfolio securities through a lending agent from time to time in order to earn additional income. For equity securities, a lending agent is used and may loan securities to certain qualified borrowers, including Fidelity Capital Markets (FCM), a broker-dealer affiliated with the Fund. On the settlement date of the loan, the Fund receives collateral (in the form of U.S. Treasury obligations, letters of credit and/or cash) against the loaned securities and maintains collateral in an amount not less than 100% of the market value of the loaned securities during the period of the loan. The market value of the loaned securities is determined at the close of business of the Fund and any additional required collateral is delivered to the Fund on the next business day. If the borrower defaults on its obligation to return the securities loaned because of insolvency or other reasons, a fund could experience delays and costs in recovering the securities loaned or in gaining access to the collateral. Any cash collateral received is invested in the Fidelity Securities Lending Cash Central Fund. The value of loaned securities and cash collateral at period end are disclosed on the Fund's Statement of Assets and Liabilities. Security lending income represents the income earned on investing cash collateral, less rebates paid to borrowers and any lending agent fees associated with the loan, plus any premium payments received for lending certain types of securities. Security lending income is presented in the Statement of Operations as a component of income from Fidelity Central Funds. Total security lending income during the period amounted to $447. During the period, there were no securities loaned to FCM.
8. Expense Reductions.
Many of the brokers with whom FMR places trades on behalf of the Fund provided services to the Fund in addition to trade execution. These services included payments of certain expenses on behalf of the Fund totaling $105 for the period.
9. Distributions to Shareholders.
Distributions to shareholders of each class were as follows:
Years ended October 31, | 2012 | 2011 |
From net investment income | | |
Class A | $ 862 | $ 829 |
Class T | 3,589 | 3,501 |
Class B | 16 | 30 |
Class C | 112 | 89 |
Institutional Class | 5,593 | 8,533 |
Total | $ 10,172 | $ 12,982 |
Annual Report
Notes to Financial Statements - continued
(Amounts in thousands except percentages)
9. Distributions to Shareholders - continued
Years ended October 31, | 2012 | 2011 |
From net realized gain | | |
Class A | $ - | $ 178 |
Class T | - | 911 |
Class B | - | 17 |
Class C | - | 57 |
Institutional Class | - | 1,593 |
Total | $ - | $ 2,756 |
10. Share Transactions.
Transactions for each class of shares were as follows:
| Shares | Dollars |
Years ended October 31, | 2012 | 2011 | 2012 | 2011 |
Class A | | | | |
Shares sold | 700 | 644 | $ 11,104 | $ 11,749 |
Reinvestment of distributions | 52 | 51 | 791 | 919 |
Shares redeemed | (848) | (937) | (13,551) | (16,834) |
Net increase (decrease) | (96) | (242) | $ (1,656) | $ (4,166) |
Class T | | | | |
Shares sold | 2,695 | 3,310 | $ 44,183 | $ 61,021 |
Reinvestment of distributions | 223 | 232 | 3,491 | 4,288 |
Shares redeemed | (5,589) | (5,489) | (91,072) | (101,187) |
Net increase (decrease) | (2,671) | (1,947) | $ (43,398) | $ (35,878) |
Class B | | | | |
Shares sold | 2 | 12 | $ 26 | $ 219 |
Reinvestment of distributions | 1 | 2 | 14 | 41 |
Shares redeemed | (84) | (144) | (1,311) | (2,540) |
Net increase (decrease) | (81) | (130) | $ (1,271) | $ (2,280) |
Class C | | | | |
Shares sold | 103 | 165 | $ 1,613 | $ 2,956 |
Reinvestment of distributions | 6 | 7 | 94 | 125 |
Shares redeemed | (317) | (271) | (4,983) | (4,750) |
Net increase (decrease) | (208) | (99) | $ (3,276) | $ (1,669) |
Institutional Class | | | | |
Shares sold | 2,281 | 2,965 | $ 36,498 | $ 53,805 |
Reinvestment of distributions | 353 | 544 | 5,475 | 9,988 |
Shares redeemed | (8,781) | (19,770) | (140,625) | (362,619) |
Net increase (decrease) | (6,147) | (16,261) | $ (98,652) | $ (298,826) |
Annual Report
11. Other.
The Fund's organizational documents provide former and current trustees and officers with a limited indemnification against liabilities arising in connection with the performance of their duties to the Fund. In the normal course of business, the Fund may also enter into contracts that provide general indemnifications. The Fund's maximum exposure under these arrangements is unknown as this would be dependent on future claims that may be made against the Fund. The risk of material loss from such claims is considered remote.
At the end of the period, Strategic Advisers International II Fund was the owner of record of 14% of the total outstanding shares of the Fund.
Annual Report
To the Trustees of Fidelity Advisor Series VIII and the Shareholders of Fidelity Advisor Overseas Fund:
In our opinion, the accompanying statement of assets and liabilities, including the schedule of investments, and the related statements of operations and of changes in net assets and the financial highlights present fairly, in all material respects, the financial position of Fidelity Advisor Overseas Fund (a fund of Fidelity Advisor Series VIII) at October 31, 2012, the results of its operations for the year then ended, the changes in its net assets for each of the two years in the period then ended and the financial highlights for each of the five years in the period then ended, in conformity with accounting principles generally accepted in the United States of America. These financial statements and financial highlights (hereafter referred to as "financial statements") are the responsibility of the Fidelity Advisor Overseas Fund's management. Our responsibility is to express an opinion on these financial statements based on our audits. We conducted our audits of these financial statements in accordance with the standards of the Public Company Accounting Oversight Board (United States). Those standards require that we plan and perform the audit to obtain reasonable assurance about whether the financial statements are free of material misstatement. An audit includes examining, on a test basis, evidence supporting the amounts and disclosures in the financial statements, assessing the accounting principles used and significant estimates made by management, and evaluating the overall financial statement presentation. We believe that our audits, which included confirmation of securities at October 31, 2012 by correspondence with the custodian and brokers, provide a reasonable basis for our opinion.
PricewaterhouseCoopers LLP
Boston, Massachusetts
December 14, 2012
Annual Report
The Trustees, Members of the Advisory Board, and executive officers of the trust and fund, as applicable, are listed below. The Board of Trustees governs the fund and is responsible for protecting the interests of shareholders. The Trustees are experienced executives who meet periodically throughout the year to oversee the fund's activities, review contractual arrangements with companies that provide services to the fund, oversee management of the risks associated with such activities and contractual arrangements, and review the fund's performance. Except for James C. Curvey, each of the Trustees oversees 236 funds advised by FMR or an affiliate. Mr. Curvey oversees 443 funds advised by FMR or an affiliate.
The Trustees hold office without limit in time except that (a) any Trustee may resign; (b) any Trustee may be removed by written instrument, signed by at least two-thirds of the number of Trustees prior to such removal; (c) any Trustee who requests to be retired or who has become incapacitated by illness or injury may be retired by written instrument signed by a majority of the other Trustees; and (d) any Trustee may be removed at any special meeting of shareholders by a two-thirds vote of the outstanding voting securities of the trust. Each Trustee who is not an interested person (as defined in the 1940 Act) (Independent Trustee), shall retire not later than the last day of the calendar year in which his or her 75th birthday occurs. The Independent Trustees may waive this mandatory retirement age policy with respect to individual Trustees. The executive officers and Advisory Board Members hold office without limit in time, except that any officer and Advisory Board Member may resign or may be removed by a vote of a majority of the Trustees at any regular meeting or any special meeting of the Trustees. Except as indicated, each individual has held the office shown or other offices in the same company for the past five years.
Experience, Skills, Attributes, and Qualifications of the Fund's Trustees. The Governance and Nominating Committee has adopted a statement of policy that describes the experience, qualifications, attributes, and skills that are necessary and desirable for potential Independent Trustee candidates (Statement of Policy). The Board believes that each Trustee satisfied at the time he or she was initially elected or appointed a Trustee, and continues to satisfy, the standards contemplated by the Statement of Policy. The Governance and Nominating Committee also engages professional search firms to help identify potential Independent Trustee candidates who have the experience, qualifications, attributes, and skills consistent with the Statement of Policy. From time to time, additional criteria based on the composition and skills of the current Independent Trustees, as well as experience or skills that may be appropriate in light of future changes to board composition, business conditions, and regulatory or other developments, have also been considered by the professional search firms and the Governance and Nominating Committee. In addition, the Board takes into account the Trustees' commitment and participation in Board and committee meetings, as well as their leadership of standing and ad hoc committees throughout their tenure.
In determining that a particular Trustee was and continues to be qualified to serve as a Trustee, the Board has considered a variety of criteria, none of which, in isolation, was controlling. The Board believes that, collectively, the Trustees have balanced and diverse experience, qualifications, attributes, and skills, which allow the Board to operate effectively in governing the fund and protecting the interests of shareholders. Information about the specific experience, skills, attributes, and qualifications of each Trustee, which in each case led to the Board's conclusion that the Trustee should serve (or continue to serve) as a trustee of the fund, is provided below.
Annual Report
Trustees and Officers - continued
Board Structure and Oversight Function. James C. Curvey is an interested person (as defined in the 1940 Act) and currently serves as Chairman. The Trustees have determined that an interested Chairman is appropriate and benefits shareholders because an interested Chairman has a personal and professional stake in the quality and continuity of services provided to the fund. Independent Trustees exercise their informed business judgment to appoint an individual of their choosing to serve as Chairman, regardless of whether the Trustee happens to be independent or a member of management. The Independent Trustees have determined that they can act independently and effectively without having an Independent Trustee serve as Chairman and that a key structural component for assuring that they are in a position to do so is for the Independent Trustees to constitute a substantial majority for the Board. The Independent Trustees also regularly meet in executive session. Ned C. Lautenbach serves as Chairman of the Independent Trustees and as such (i) acts as a liaison between the Independent Trustees and management with respect to matters important to the Independent Trustees and (ii) with management prepares agendas for Board meetings.
Fidelity funds are overseen by different Boards of Trustees. The fund's Board oversees Fidelity's equity and high income funds and another Board oversees Fidelity's investment-grade bond, money market, and asset allocation funds. The asset allocation funds may invest in Fidelity funds overseen by the fund's Board. The use of separate Boards, each with its own committee structure, allows the Trustees of each group of Fidelity funds to focus on the unique issues of the funds they oversee, including common research, investment, and operational issues. On occasion, the separate Boards establish joint committees to address issues of overlapping consequences for the Fidelity funds overseen by each Board.
The Trustees operate using a system of committees to facilitate the timely and efficient consideration of all matters of importance to the Trustees, the fund, and fund shareholders and to facilitate compliance with legal and regulatory requirements and oversight of the fund's activities and associated risks. The Board, acting through its committees, has charged FMR and its affiliates with (i) identifying events or circumstances the occurrence of which could have demonstrably adverse effects on the fund's business and/or reputation; (ii) implementing processes and controls to lessen the possibility that such events or circumstances occur or to mitigate the effects of such events or circumstances if they do occur; and (iii) creating and maintaining a system designed to evaluate continuously business and market conditions in order to facilitate the identification and implementation processes described in (i) and (ii) above. Because the day-to-day operations and activities of the fund are carried out by or through FMR, its affiliates and other service providers, the fund's exposure to risks is mitigated but not eliminated by the processes overseen by the Trustees. While each of the Board's committees has responsibility for overseeing different aspects of the fund's activities, oversight is exercised primarily through the Operations, Audit, and Compliance Committees. In addition, the Independent Trustees have worked with FMR to enhance the Board's oversight of investment and financial risks, legal and regulatory risks, technology risks, and operational risks, including the development of additional risk reporting to the Board. For example, a working group comprised of Independent Trustees and FMR has worked and continues to work to review the Fidelity funds' valuation-related activities, reporting and risk management. Appropriate personnel, including but not limited to the fund's Chief Compliance Officer (CCO), FMR's internal auditor, the independent accountants, the fund's Treasurer and portfolio management personnel, make periodic reports to the Board's committees, as appropriate, including an annual review of FMR's risk management program for the Fidelity funds. The responsibilities of each standing committee, including their oversight responsibilities, are described further under "Standing Committees of the Fund's Trustees."
Annual Report
The fund's Statement of Additional Information (SAI) includes more information about the Trustees. To request a free copy, call Fidelity at 1-877-208-0098.
Interested Trustees*:
Correspondence intended for each Trustee who is an interested person may be sent to Fidelity Investments, 82 Devonshire Street, Boston, Massachusetts 02109.
Name, Age; Principal Occupations and Other Relevant Experience+ |
James C. Curvey (77) |
| Year of Election or Appointment: 2007 Mr. Curvey is Trustee and Chairman of the Board of Trustees of certain Trusts. Mr. Curvey also serves as Trustee (2007-present) of other investment companies advised by FMR. Mr. Curvey is a Director of Fidelity Investments Money Management, Inc. (2009-present), Director of Fidelity Research & Analysis Co. (2009-present) and Director of FMR and FMR Co., Inc. (2007-present). Mr. Curvey is also Vice Chairman (2007-present) and Director of FMR LLC. In addition, Mr. Curvey serves as an Overseer for the Boston Symphony Orchestra and a member of the Trustees of Villanova University. Previously, Mr. Curvey was the Vice Chairman (2006-2007) and Director (2000-2007) of FMR Corp. |
Ronald P. O'Hanley (55) |
| Year of Election or Appointment: 2011 Mr. O'Hanley is Director of FMR Co., Inc. (2010-present), Director of Fidelity Investments Money Management, Inc. (2010-present), Director of Fidelity Research & Analysis Company (2010-present), President of Fidelity Asset Management and Corporate Services and a member of Fidelity's Executive Committee (2010-present). Previously, Mr. O'Hanley served as President and Chief Executive Officer of BNY Mellon Asset Management (2007-2010). Mr. O'Hanley also served as Vice Chairman of Bank New York Mellon Corp. and a member of that firm's Executive Committee. Prior to the 2007 merger of The Bank of New York and Mellon Financial Corporation, he was Vice Chairman of Mellon Financial Corporation and President and Chief Executive Officer of Mellon Asset Management. He joined Mellon in February 1997. Mr. O'Hanley currently serves as Chairman of the Boston Public Library Foundation Board of Directors and sits on the Board of Directors of Beth Israel Deaconess Medical Center, the Board of Trustees of the Marine Biological Laboratory and the Advisory Board of the Maxwell School of Citizenship and Public Administration at Syracuse University. Mr. O'Hanley also chairs the Council on Asset Management for the Financial Services Roundtable and is a member of the Board of Directors of Institutional Investor's U.S. Institute. |
* Trustees have been determined to be "Interested Trustees" by virtue of, among other things, their affiliation with the trust or various entities under common control with FMR.
+ The information above includes each Trustee's principal occupation during the last five years and other information relating to the experience, attributes, and skills relevant to each Trustee's qualifications to serve as a Trustee, which led to the conclusion that each Trustee should serve as a Trustee for the fund.
Annual Report
Independent Trustees:
Correspondence intended for each Independent Trustee (that is, the Trustees other than the Interested Trustees) may be sent to Fidelity Investments, P.O. Box 55235, Boston, Massachusetts 02205-5235.
Name, Age; Principal Occupations and Other Relevant Experience+ |
Dennis J. Dirks (64) |
| Year of Election or Appointment: 2005 Prior to his retirement in May 2003, Mr. Dirks was Chief Operating Officer and a member of the Board of The Depository Trust & Clearing Corporation (DTCC). He also served as President, Chief Operating Officer, and Board member of The Depository Trust Company (DTC) and President and Board member of the National Securities Clearing Corporation (NSCC). In addition, Mr. Dirks served as Chief Executive Officer and Board member of the Government Securities Clearing Corporation, Chief Executive Officer and Board member of the Mortgage-Backed Securities Clearing Corporation, as a Trustee and a member of the Finance Committee of Manhattan College (2005-2008), and as a Trustee and a member of the Finance Committee of AHRC of Nassau County (2006-2008). Mr. Dirks is a member of the Independent Directors Council (IDC) Governing Council (2010-present) and Board of Directors for The Brookville Center for Children's Services, Inc. (2009-present). |
Alan J. Lacy (59) |
| Year of Election or Appointment: 2008 Mr. Lacy serves as Senior Adviser (2007-present) of Oak Hill Capital Partners, L.P. (private equity). Mr. Lacy also served as Chief Executive Officer (2000-2005) and Vice Chairman (2005-2006) of Sears Holdings Corporation and Sears, Roebuck and Co. (retail). In addition, Mr. Lacy serves as a member of the Board of Directors of Dave & Buster's Entertainment, Inc. (restaurant and entertainment complexes, 2010-present), Earth Fare, Inc. (retail grocery, 2012-present), The Hillman Companies, Inc. (hardware wholesalers, 2010-present), and Bristol-Myers Squibb Company (global pharmaceuticals, 2008-present). Mr. Lacy is a member of the Board of Trustees of The National Parks Conservation Association (2006-present). Previously, Mr. Lacy served as Chairman of the Board of Trustees of the National Parks Conservation Association (2008-2011) and as a member of the Board of Directors for the Western Union Company (global money transfer, 2006-2011). |
Ned C. Lautenbach (68) |
| Year of Election or Appointment: 2000 Mr. Lautenbach is Chairman of the Independent Trustees of the Equity and High Income Funds (2006-present). Mr. Lautenbach currently serves as the Lead Director of the Eaton Corporation Board of Directors (diversified industrial, 1997-present). Mr. Lautenbach is Chairman of the Board of Directors of the Philharmonic Center for the Arts in Naples, Florida (2012-present) and a member of the Council on Foreign Relations (1994-present). Previously, Mr. Lautenbach was a Partner/Advisory Partner at Clayton, Dubilier & Rice, LLC (private equity investment, 1998-2010), as well as a Director of Sony Corporation (2006-2007). |
Joseph Mauriello (68) |
| Year of Election or Appointment: 2008 Prior to his retirement in January 2006, Mr. Mauriello served in numerous senior management positions including Deputy Chairman and Chief Operating Officer (2004-2005), and Vice Chairman of Financial Services (2002-2004) of KPMG LLP US (professional services, 1965-2005). Mr. Mauriello currently serves as a member of the Board of Directors of XL Group plc. (global insurance and re-insurance, 2006-present). Previously, Mr. Mauriello served as a Director of the Hamilton Funds of the Bank of New York (2006-2007) and of Arcadia Resources Inc. (health care services and products, 2007-2012). |
Robert W. Selander (62) |
| Year of Election or Appointment: 2011 Previously, Mr. Selander served as a Member of the Advisory Board of Fidelity's Equity and High Income Funds (2011), Executive Vice Chairman (2010), Chief Executive Officer (2009-2010), and President and Chief Executive Officer (1997-2009) of Mastercard, Inc. |
Cornelia M. Small (68) |
| Year of Election or Appointment: 2005 Ms. Small is a member of the Board of Directors (2009-present) and Chair of the Investment Committee (2010-present) of the Teagle Foundation. Ms. Small also serves on the Investment Committee of the Berkshire Taconic Community Foundation (2008-present). Previously, Ms. Small served as Chairperson (2002-2008) and a member of the Investment Committee and Chairperson (2008-2012) and a member of the Board of Trustees of Smith College. In addition, Ms. Small served as Chief Investment Officer, Director of Global Equity Investments, and a member of the Board of Directors of Scudder, Stevens & Clark and Scudder Kemper Investments. |
William S. Stavropoulos (73) |
| Year of Election or Appointment: 2001 Mr. Stavropoulos is Vice Chairman of the Independent Trustees of the Equity and High Income Funds (2006-present). Mr. Stavropoulos serves as President and Founder of the Michigan Baseball Foundation, the Great Lakes Loons (2007-present). Mr. Stavropoulos is Chairman Emeritus of the Board of Directors of The Dow Chemical Company, where he previously served in numerous senior management positions, including President, CEO (1995-2000; 2002-2004), Chairman of the Executive Committee (2000-2006), and as a member of the Board of Directors (1990-2006). Currently, Mr. Stavropoulos is a Director of Univar Inc. (global distributor of commodity and specialty chemicals, Chairman from 2010-May 2012 and Lead Director from May 2012-present), Teradata Corporation (data warehousing and technology solutions, 2008-present), Maersk Inc. (industrial conglomerate), and Tyco International, Ltd. (multinational manufacturing and services, 2007-present), and a member of the Advisory Board for Metalmark Capital LLC (private equity investment, 2005-present). Mr. Stavropoulos is an operating advisor to Clayton, Dubilier & Rice, LLC (private equity investment). In addition, Mr. Stavropoulos is a member of the University of Notre Dame Advisory Council for the College of Science, a Trustee of the Rollin L. Gerstacker Foundation, and a Director of the Naples Philharmonic Center for the Arts. Previously, Mr. Stavropoulos served as a Director of Chemical Financial Corporation (bank holding company, 1993-2012). |
David M. Thomas (63) |
| Year of Election or Appointment: 2008 Previously, Mr. Thomas served as Executive Chairman (2005-2006) and Chairman and Chief Executive Officer (2000-2005) of IMS Health, Inc. (pharmaceutical and healthcare information solutions), and a Director of Fortune Brands, Inc. (consumer products, 2000-2011). In addition, Mr. Thomas serves as Non-Executive Chairman of the Board of Directors of Fortune Brands Home and Security (home and security products, 2011-present), and as a member of the Board of Directors of Interpublic Group of Companies, Inc. (marketing communication, 2004-present). |
Michael E. Wiley (62) |
| Year of Election or Appointment: 2008 Mr. Wiley also serves as a Director of Asia Pacific Exploration Consolidated (international oil and gas exploration and production, 2008-present). Mr. Wiley serves as a Director of Tesoro Corporation (independent oil refiner and marketer, 2005-present), and a Director of Bill Barrett Corporation (exploration and production, 2005-present). In addition, Mr. Wiley also serves as a Director of Post Oak Bank (privately-held bank, 2004-present). Previously, Mr. Wiley served as a member of the Board of Trustees of the University of Tulsa (2000-2006; 2007-2010), as a Senior Energy Advisor of Katzenbach Partners, LLC (consulting, 2006-2007), as an Advisory Director of Riverstone Holdings (private investment), Chairman, President, and CEO of Baker Hughes, Inc. (oilfield services, 2000-2004), and as Director of Spinnaker Exploration Company (exploration and production, 2001-2005). |
+ The information above includes each Trustee's principal occupation during the last five years and other information relating to the experience, attributes, and skills relevant to each Trustee's qualifications to serve as a Trustee, which led to the conclusion that each Trustee should serve as a Trustee for the fund.
Advisory Board Members and Executive Officers:
Correspondence intended for David A. Rosow and Garnett A. Smith may be sent to Fidelity Investments, P.O. Box 55235, Boston, Massachusetts 02205-5235. Correspondence intended for each executive officer, Edward C. Johnson 3d, and Peter S. Lynch may be sent to Fidelity Investments, 82 Devonshire Street, Boston, Massachusetts 02109.
Name, Age; Principal Occupation |
Edward C. Johnson 3d (82) |
| Year of Election or Appointment: 2011 Member of the Advisory Board of Fidelity's Equity and High Income Funds. Mr. Johnson serves as Chief Executive Officer, Chairman, and a Director of FMR LLC, and also serves as Chairman and Director of FIL Limited. Previously, Mr. Johnson served as a Trustee and Chairman of the Board of certain Fidelity Trusts, Chairman and a Director of FMR, Chairman and a Director of FMR Co., Inc., and President of FMR LLC (2006-2007). |
Peter S. Lynch (68) |
| Year of Election or Appointment: 2003 Member of the Advisory Board of Fidelity's Equity and High Income Funds. Mr. Lynch is Vice Chairman and a Director of FMR and FMR Co., Inc. In addition, Mr. Lynch serves as a Trustee of Boston College and as the Chairman of the Inner-City Scholarship Fund. Previously, Mr. Lynch served on the Special Olympics International Board of Directors (1997-2006). |
David A. Rosow (70) |
| Year of Election or Appointment: 2012 Member of the Advisory Board of Fidelity's Equity and High Income Funds. Chairman and Chief Executive Officer of International Golf Group, Inc. (golf course development, 1989-present). Previously, Mr. Rosow served as Chairman and Chief Executive Officer of Rosow & Company, Inc. (private investment company, 1989-2011), a Lead Director of Hudson United Bancorp (2001-2006) and as a Director of TD Banknorth (1996-2006). In addition, Mr. Rosow is a member (2008-present) and President (2009-present) of the Town Council of Palm Beach, Florida. |
Garnett A. Smith (65) |
| Year of Election or Appointment: 2012 Member of the Advisory Board of Fidelity's Equity and High Income Funds. Prior to Mr. Smith's retirement, he served as Chairman and Chief Executive Officer of Inbrand Corp. (manufacturer of personal absorbent products, 1990-1997). He also served as President (1986-1990) of Inbrand Corp. Prior to his employment with Inbrand Corp., he was employed by a retail fabric chain and North Carolina National Bank. In addition, Mr. Smith is a board member of the Jackson Hole Land Trust (2009-present). |
Kenneth B. Robins (43) |
| Year of Election or Appointment: 2008 President and Treasurer of Fidelity's Equity and High Income Funds. Mr. Robins also serves as President and Treasurer (2010-present) and Assistant Treasurer (2009-present) of other Fidelity funds and is an employee of Fidelity Investments (2004-present). Previously, Mr. Robins served as Deputy Treasurer of the Fidelity funds (2005-2008) and Treasurer and Chief Financial Officer of The North Carolina Capital Management Trust: Cash and Term Portfolios (2006-2008). |
Bruce T. Herring (47) |
| Year of Election or Appointment: 2006 Vice President of certain Equity Funds. Mr. Herring also serves as President of Fidelity Research & Analysis Company (2010-present), Chief Investment Officer and Director of Fidelity Management & Research (U.K.) Inc. (2010-present) and Group Chief Investment Officer of FMR. Previously, Mr. Herring served as Vice President (2005-2006) and Senior Vice President (2006-2007) of Fidelity Management & Research Company, Vice President of FMR Co., Inc. (2001-2007) and as a portfolio manager for Fidelity U.S. Equity Funds. |
Brian B. Hogan (48) |
| Year of Election or Appointment: 2009 Vice President of Equity and High Income Funds. Mr. Hogan also serves as President of FMR's Equity Division (2009-present). Previously, Mr. Hogan served as Senior Vice President, Equity Research of FMR (2006-2009) and as a portfolio manager. |
Scott C. Goebel (44) |
| Year of Election or Appointment: 2008 Secretary and Chief Legal Officer (CLO) of the Fidelity funds. Mr. Goebel also serves as Secretary of Fidelity Investments Money Management, Inc. (FIMM) (2010-present) and Fidelity Research and Analysis Company (FRAC) (2010-present); Secretary and CLO of The North Carolina Capital Management Trust: Cash and Term Portfolios (2008-present); General Counsel, Secretary, and Senior Vice President of FMR (2008-present) and FMR Co., Inc. (2008-present); employed by FMR LLC or an affiliate (2001-present); Chief Legal Officer of Fidelity Management & Research (Hong Kong) Limited (2008-present) and Assistant Secretary of Fidelity Management & Research (Japan) Inc. (2008-present), and Fidelity Management & Research (U.K.) Inc. (2008-present). Previously, Mr. Goebel served as Assistant Secretary of FIMM (2008-2010), FRAC (2008-2010), and the Funds (2007-2008) and as Vice President and Secretary of Fidelity Distributors Corporation (FDC) (2005-2007). |
William C. Coffey (43) |
| Year of Election or Appointment: 2009 Assistant Secretary of Fidelity's Equity and High Income Funds. Mr. Coffey also serves as Senior Vice President and Deputy General Counsel of FMR LLC (2010-present), and is an employee of Fidelity Investments. Previously, Mr. Coffey served as Vice President and Associate General Counsel of FMR LLC (2005-2009). |
Elizabeth Paige Baumann (44) |
| Year of Election or Appointment: 2012 Anti-Money Laundering (AML) Officer of the Fidelity funds. Ms. Baumann also serves as AML Officer of The North Carolina Capital Management Trust: Cash and Term Portfolios (2012-present), Chief AML Officer of FMR LLC (2012-present), and is an employee of Fidelity Investments. Previously, Ms. Baumann served as Vice President and Deputy Anti-Money Laundering Officer (2007-2012). |
Christine Reynolds (54) |
| Year of Election or Appointment: 2008 Chief Financial Officer of the Fidelity funds. Ms. Reynolds became President of Fidelity Pricing and Cash Management Services (FPCMS) in August 2008. Ms. Reynolds served as Chief Operating Officer of FPCMS (2007-2008). Previously, Ms. Reynolds served as President, Treasurer, and Anti-Money Laundering officer of the Fidelity funds (2004-2007). |
Joseph A. Hanlon (44) |
| Year of Election or Appointment: 2012 Chief Compliance Officer of Fidelity's Equity and High Income Funds. Mr. Hanlon serves as Compliance Officer of FMR, FMR Co., Inc., Fidelity Investments Money Management, Inc. (FIMM), Fidelity Research and Analysis Company (FRAC), Fidelity Management & Research (Japan) Inc., Fidelity Management & Research (U.K.) Inc., Fidelity Management & Research (Hong Kong), and Strategic Advisers, Inc. (2009-present), as Senior Vice President of the Fidelity Asset Management Division (2009-present), and is an employee of Fidelity Investments. |
Joseph F. Zambello (55) |
| Year of Election or Appointment: 2011 Deputy Treasurer of the Fidelity funds. Mr. Zambello is an employee of Fidelity Investments. Previously, Mr. Zambello served as Vice President of FMR's Program Management Group (2009-2011) and Vice President of the Transfer Agent Oversight Group (2005-2009). |
Adrien E. Deberghes (45) |
| Year of Election or Appointment: 2008 Deputy Treasurer of Fidelity's Equity and High Income Funds. Mr. Deberghes also serves as Vice President (2011-present) and Assistant Treasurer (2010-present) of other Fidelity funds, and is an employee of Fidelity Investments (2008-present). Previously, Mr. Deberghes served as Senior Vice President of Mutual Fund Administration at State Street Corporation (2007-2008), Senior Director of Mutual Fund Administration at Investors Bank & Trust (2005-2007), and Director of Finance for Dunkin' Brands (2000-2005). |
Stephen Sadoski (41) |
| Year of Election or Appointment: 2012 Deputy Treasurer of Fidelity's Equity and High Income Funds. Mr. Sadoski also serves as Assistant Treasurer of other Fidelity funds (2012-present) and is an employee of Fidelity Investments (2012-present). Previously, Mr. Sadoski served as an assistant chief accountant in the Division of Investment Management of the Securities and Exchange Commission (SEC) (2009-2012) and as a senior manager at Deloitte & Touche (1997-2009). |
Stephanie J. Dorsey (43) |
| Year of Election or Appointment: 2010 Assistant Treasurer of Fidelity's Equity and High Income Funds. Ms. Dorsey also serves as Deputy Treasurer of other Fidelity funds (2008-present) and is an employee of Fidelity Investments (2008-present). Previously, Ms. Dorsey served as Treasurer (2004-2008) of the JPMorgan Mutual Funds and Vice President (2004-2008) of JPMorgan Chase Bank. |
John R. Hebble (54) |
| Year of Election or Appointment: 2009 Assistant Treasurer of Fidelity's Equity and High Income Funds. Mr. Hebble also serves as President (2011-present), Treasurer, and Chief Financial Officer of The North Carolina Capital Management Trust: Cash and Term Portfolios (2008-present), President and Treasurer of other Fidelity funds (2008-present) and is an employee of Fidelity Investments. |
Gary W. Ryan (54) |
| Year of Election or Appointment: 2005 Assistant Treasurer of the Fidelity funds. Mr. Ryan is an employee of Fidelity Investments. Previously, Mr. Ryan served as Vice President of Fund Reporting in Fidelity Pricing and Cash Management Services (FPCMS) (1999-2005). |
Jonathan Davis (44) |
| Year of Election or Appointment: 2010 Assistant Treasurer of the Fidelity funds. Mr. Davis is also Assistant Treasurer of Fidelity Rutland Square Trust II and Fidelity Commonwealth Trust II. Mr. Davis is an employee of Fidelity Investments. Previously, Mr. Davis served as Vice President and Associate General Counsel of FMR LLC (2003-2010). |
Annual Report
The Board of Trustees of Fidelity Advisor Overseas Fund voted to pay to shareholders of record at the opening of business on record date, the following distributions per share derived from capital gains realized from sales of portfolio securities, and dividends derived from net investment income:
| Pay Date | Record Date | Dividends | Capital Gains |
Class A | 12/10/12 | 12/07/12 | $0.249 | $0.041 |
Class T | 12/10/12 | 12/07/12 | $0.206 | $0.041 |
Class B | 12/10/12 | 12/07/12 | $0.070 | $0.041 |
Class C | 12/10/12 | 12/07/12 | $0.098 | $0.041 |
Class A designates 100%, Class T designates 100%, Class B designates 100%, and Class C designates 100% of the dividends distributed during the fiscal year as amounts which may be taken into account as a dividend for purposes of the maximum rate under section 1(h)(11) of the Internal Revenue Code.
The amounts per share which represent income derived from sources within, and taxes paid to, foreign countries or possessions of the United States are as follows:
| Pay Date | Income | Taxes |
Class A | 12/5/2011 | $0.256 | $0.0199 |
Class T | 12/5/2011 | $0.218 | $0.0199 |
Class B | 12/5/2011 | $0.080 | $0.0199 |
Class C | 12/5/2011 | $0.116 | $0.0199 |
The fund will notify shareholders in January 2013 of amounts for use in preparing 2012 income tax returns.
Annual Report
Board Approval of Investment Advisory Contracts and Management Fees
Fidelity Advisor Overseas Fund
Each year, the Board of Trustees, including the Independent Trustees (together, the Board), votes on the renewal of the management contract and sub-advisory agreements (together, the Advisory Contracts) for the fund. The Board, assisted by the advice of fund counsel and Independent Trustees' counsel, requests and considers a broad range of information relevant to the renewal of the Advisory Contracts throughout the year.
The Board meets regularly and, at each of its meetings, considers factors that are relevant to its annual consideration of the renewal of the fund's Advisory Contracts, including the services and support provided to the fund and its shareholders. The Board has established various standing committees, each composed of and chaired by Independent Trustees with varying backgrounds, to which the Board has assigned specific subject matter responsibilities in order to enhance effective decision-making by the Board. The Board, acting directly and through its Committees, requests and receives information concerning the annual consideration of the renewal of the fund's Advisory Contracts. The Board also meets as needed to consider matters specifically related to the Board's annual consideration of the renewal of Advisory Contracts. Members of the Board may also meet with trustees of other Fidelity funds through ad hoc joint committees to discuss certain matters relevant to the Fidelity funds.
At its July 2012 meeting, the Board of Trustees, including the Independent Trustees, unanimously determined to renew the fund's Advisory Contracts. In reaching its determination, the Board considered all factors it believed relevant, including (i) the nature, extent, and quality of the services to be provided to the fund and its shareholders (including the investment performance of the fund); (ii) the competitiveness of the fund's management fee and total expense ratio relative to peer funds; (iii) the total costs of the services to be provided by and the profits to be realized by Fidelity from its relationship with the fund; (iv) the extent to which economies of scale exist and would be realized as the fund grows; and (v) whether fee levels reflect these economies of scale, if any, for the benefit of fund shareholders.
In considering whether to renew the Advisory Contracts for the fund, the Board reached a determination, with the assistance of fund counsel and Independent Trustees' counsel and through the exercise of its business judgment, that the renewal of the Advisory Contracts is in the best interests of the fund and its shareholders and that the compensation payable under the Advisory Contracts is fair and reasonable. The Board's decision to renew the Advisory Contracts was not based on any single factor, but rather was based on a comprehensive consideration of all the information provided to the Board at its meetings throughout the year. The Board, in reaching its determination to renew the Advisory Contracts, is aware that shareholders in the fund have a broad range of investment choices available to them, including a wide choice among mutual funds offered by Fidelity's competitors, and that the fund's shareholders, who have the opportunity to review and weigh the disclosure provided by the fund in its prospectus and other public disclosures, have chosen to invest in this fund, managed by Fidelity.
Annual Report
Nature, Extent, and Quality of Services Provided. The Board considered the staffing within the investment adviser, FMR, and the sub-advisers (together, the Investment Advisers), including the backgrounds of the fund's investment personnel, and also considered the fund's investment objective, strategies, and related investment philosophy. The Independent Trustees also had discussions with senior management of Fidelity's investment operations and investment groups. The Board considered the structure of the portfolio manager compensation program and whether this structure provides appropriate incentives to act in the best interests of the fund.
Resources Dedicated to Investment Management and Support Services. The Board and the Fund Oversight and Research Committees reviewed the general qualifications and capabilities of the Investment Advisers' investment staff, including its size, education, experience, and resources, as well as the Investment Advisers' approach to recruiting, training, managing, and compensating investment personnel. The Board also noted that FMR has continued to increase the resources devoted to non-U.S. offices, including expansion of Fidelity's global investment organization. The Board noted that Fidelity's analysts have extensive resources, tools and capabilities that allow them to conduct sophisticated quantitative and fundamental analysis, as well as credit analysis of issuers, counterparties and guarantors. The Board also believes that Fidelity's investment professionals have sufficient access to global information and data so as to provide competitive investment results over time, and that those professionals also have access to sophisticated tools that permit them to assess portfolio construction and risk and performance attribution characteristics continuously, as well as to transmit new information and research conclusions rapidly around the world. Additionally, in its deliberations, the Board considered the Investment Advisers' trading and risk management capabilities and resources, which are an integral part of the investment management process.
Shareholder and Administrative Services. The Board considered (i) the nature, extent, quality, and cost of advisory, administrative, and shareholder services performed by the Investment Advisers and their affiliates under the Advisory Contracts and under separate agreements covering transfer agency, pricing and bookkeeping, and securities lending services for the fund; (ii) the nature and extent of the supervision of third party service providers, principally custodians and subcustodians; and (iii) the resources devoted to, and the record of compliance with, the fund's compliance policies and procedures. The Board also reviewed the allocation of fund brokerage, including allocations to brokers affiliated with the Investment Advisers, the use of brokerage commissions to pay fund expenses, and the use of "soft" commission dollars to pay for research services.
Annual Report
Board Approval of Investment Advisory Contracts and
Management Fees - continued
The Board noted that the growth of fund assets over time across the complex allows Fidelity to reinvest in the development of services designed to enhance the value or convenience of the Fidelity funds as investment vehicles. These services include 24-hour access to account information and market information through telephone representatives and over the Internet, investor education materials and asset allocation tools, and the expanded availability of Fidelity Investor Centers.
Investment in a Large Fund Family. The Board considered the benefits to shareholders of investing in a Fidelity fund, including the benefits of investing in a fund that is part of a large family of funds offering a variety of investment disciplines and providing a large variety of mutual fund investor services. The Board noted that Fidelity had taken, or had made recommendations that resulted in the Fidelity funds taking, a number of actions over the previous year that benefited particular funds, including (i) continuing to dedicate additional resources to investment research and support of the senior management team that oversees asset management; (ii) persisting in efforts to enhance Fidelity's research capabilities, in particular, international research; (iii) launching new funds and making other enhancements to meet client needs for global and income-oriented solutions; (iv) continuing to launch dedicated lower cost underlying funds to meet investment management's portfolio construction needs related to expanding underlying fund options, specifically for the Freedom Fund product lines; (v) adopting a "Stock Selector" sector neutral investment approach and employing a team of portfolio managers who are sector specialists to manage certain funds; (vi) rationalizing product lines and gaining increased efficiencies through the mergers of several funds into other funds; (vii) strengthening the Spartan Index Fund product line by adding new funds and/or new low-cost institutional share classes, restructuring fund expenses to accommodate new classes, and reducing investment minimums for certain classes of shares; (viii) modifying the eligibility criteria for Institutional Class shares to increase their appeal to government entities and charitable investors; and (ix) reducing certain transfer agent fee rates.
Investment Performance. The Board considered whether the fund has operated in accordance with its investment objective, as well as its record of compliance with its investment restrictions. It also reviewed the fund's absolute investment performance for each class, as well as the fund's relative investment performance for each class measured over multiple periods against (i) a broad-based securities market index, and (ii) a peer group of mutual funds deemed appropriate by Fidelity and reviewed by the Board. The following charts considered by the Board show, over the one-, three-, and five-year periods ended December 31, 2011, the cumulative total returns of Institutional Class (Class I) and Class B of the fund, the cumulative total returns of a broad-based securities market index ("benchmark"), and a range of cumulative total returns of a peer group of mutual funds identified by Morningstar, Inc. as having an investment style similar to that of the fund based on underlying portfolio holdings. The returns of Institutional Class (Class I) and Class B show the performance of the highest and lowest performing classes, respectively (based on five-year performance). The box within each chart shows the 25th percentile return (top of box) and the 75th percentile return (bottom of box) of the peer group. Returns shown above the box are in the first quartile and returns shown below the box are in the fourth quartile. The percentage beaten numbers noted below each chart correspond to the percentile box and represent the percentage of funds in the peer group whose performance was equal to or lower than that of the class indicated.
Annual Report
Fidelity Advisor Overseas Fund

The Board reviewed the fund's relative investment performance against its peer group and noted that the performance of Institutional Class (Class I) of the fund was in the fourth quartile for the one-year period, the third quartile for the three-year period, and the second quartile for the five-year period. The Board also noted that the investment performance of the fund was lower than its benchmark for the one- and three-year periods, although the five-year cumulative total return of Institutional Class (Class I) compared favorably to its benchmark. The Board considered that the variations in performance among the fund's classes reflect the variations in class expenses, which result in lower performance for higher expense classes. The Board discussed with FMR actions to improve the fund's disappointing performance relative to its peer group and benchmark. The Board also reviewed the fund's performance since inception as well as performance in the current year. The Board will continue to closely monitor the performance of the fund in the coming year and discuss with FMR other appropriate actions to address the performance of the fund.
Annual Report
Board Approval of Investment Advisory Contracts and
Management Fees - continued
The Board also considered that the fund's management fee is subject to upward or downward adjustment depending upon whether, and to what extent, the fund's investment performance for the performance period exceeds, or is exceeded by, the record (over the same period) of a Board-approved performance adjustment index. The Board noted that the performance adjustment provides FMR with a strong economic incentive to seek to achieve superior performance for the fund's shareholders and helps to more closely align the interests of FMR and the fund's shareholders.
Based on its review, the Board concluded that the nature, extent, and quality of services provided to the fund under the Advisory Contracts should benefit the fund's shareholders.
Competitiveness of Management Fee and Total Expense Ratio. The Board considered the fund's management fee and total expense ratio compared to "mapped groups" of competitive funds and classes. Fidelity creates "mapped groups" by combining similar Lipper investment objective categories that have comparable management fee characteristics. Combining Lipper investment objective categories aids the Board's management fee and total expense ratio comparisons by broadening the competitive group used for comparison and by reducing the number of universes to which various Fidelity funds are compared.
Management Fee. The Board considered two proprietary management fee comparisons for the 12-month periods shown in the chart below. The group of Lipper funds used by the Board for management fee comparisons is referred to below as the "Total Mapped Group." The Total Mapped Group comparison focuses on a fund's standing relative to the total universe of comparable funds available to investors in terms of gross management fees before expense reimbursements or caps, and without giving effect to the fund's performance adjustment. "TMG %" represents the percentage of funds in the Total Mapped Group that had management fees that were lower than the fund's. For example, a TMG % of 17% means that 83% of the funds in the Total Mapped Group had higher management fees than the fund. The "Asset-Size Peer Group" (ASPG) comparison focuses on a fund's standing relative to non-Fidelity funds similar in size to the fund within the Total Mapped Group. The ASPG represents at least 15% of the funds in the Total Mapped Group with comparable asset size and management fee characteristics, subject to a minimum of 50 funds (or all funds in the Total Mapped Group if fewer than 50). Additional information, such as the ASPG quartile in which the fund's management fee ranked and the impact of the fund's performance adjustment, is also included in the chart and considered by the Board.
Annual Report
Fidelity Advisor Overseas Fund

The Board noted that the fund's management fee ranked below the median of its Total Mapped Group and below the median of its ASPG for 2011. The Board also noted the effect of the fund's negative performance adjustment on the fund's management fee ranking. The Board noted that the performance adjustment for each year represents calculations for performance periods that differ from the periods shown in the performance charts above.
Based on its review, the Board concluded that the fund's management fee is fair and reasonable in light of the services that the fund receives and the other factors considered.
Total Expense Ratio. In its review of each class's total expense ratio, the Board considered the fund's management fee as well as other fund or class expenses, as applicable, such as transfer agent fees, pricing and bookkeeping fees, fund-paid 12b-1 fees, and custodial, legal, and audit fees. The Board also noted the effects of any waivers and reimbursements on fees and expenses, as well as the impact of the fund's performance adjustment. As part of its review, the Board also considered the current and historical total expense ratios of each class of the fund compared to competitive fund median expenses. Each class of the fund is compared to those funds and classes in the Total Mapped Group (used by the Board for management fee comparisons) that have a similar sales load structure.
The Board noted that the total expense ratio of each of Class A, Class B, Class C, and Institutional Class ranked below its competitive median for 2011 and the total expense ratio of Class T ranked above its competitive median for 2011. The Board considered that various factors, including 12b-1 fees, positive or negative performance adjustments, and relatively higher other expenses in the case of small fund size, can affect total expense ratios. The Board noted that the total expense ratio of Class T was above the competitive median primarily because of higher 12b-1 fees on Class T. Class T has a higher 12b-1 fee, but a lower front-end sales charge, than traditionally priced front-end sales charge classes. The Board considered that Class T is primarily sold load-waived in the retirement plan market where its 0.50% 12b-1 fee is comparable to competing no-load, higher 12b-1 fee classes designed specifically for retirement plans. The Board noted that the fund offers multiple classes, each of which has a different sales load and 12b-1 fee structure, and that the multiple structures are intended to offer a range of pricing options for the intermediary market. The Board also noted that the total expense ratios of the classes vary primarily by the level of their 12b-1 fees, although differences in transfer agent fees may also cause expenses to vary from class to class.
Annual Report
Board Approval of Investment Advisory Contracts and
Management Fees - continued
Fees Charged to Other Fidelity Clients. The Board also considered Fidelity fee structures and other information with respect to clients of FMR and its affiliates, such as other mutual funds advised or subadvised by FMR or its affiliates, pension plan clients, and other institutional clients. The Board noted the findings of the 2010 ad hoc joint committee (created with the board of other Fidelity funds), which reviewed and compared Fidelity's institutional investment advisory business with its business of providing services to the Fidelity funds, including the differences in services provided, fees charged, and costs incurred, as well as competition in their respective marketplaces.
Based on its review of total expense ratios and fees charged to other Fidelity clients, the Board concluded that the total expense ratio of each class of the fund was reasonable, although Class T was above the median of the universe presented for comparison, in light of the services that the fund and its shareholders receive and the other factors considered.
Costs of the Services and Profitability. The Board considered the revenues earned and the expenses incurred by Fidelity in conducting the business of developing, marketing, distributing, managing, administering and servicing the fund and its shareholders. The Board also considered the level of Fidelity's profits in respect of all the Fidelity funds.
On an annual basis, FMR presents to the Board Fidelity's profitability for the fund. Fidelity calculates the profitability for each fund, as well as aggregate profitability for groups of Fidelity funds and all Fidelity funds, using a series of detailed revenue and cost allocation methodologies which originate with the books and records of Fidelity on which Fidelity's audited financial statements are based. The Audit Committee of the Board reviews any significant changes from the prior year's methodologies.
PricewaterhouseCoopers LLP (PwC), independent registered public accounting firm and auditor to Fidelity and certain Fidelity funds, has been engaged annually by the Board as part of the Board's assessment of Fidelity's profitability analysis. PwC's engagement includes the review and assessment of Fidelity's methodologies used in determining the revenues and expenses attributable to Fidelity's mutual fund business, and completion of agreed-upon procedures surrounding the mathematical accuracy of fund profitability and its conformity to allocation methodologies. After considering PwC's reports issued under the engagement and information provided by Fidelity, the Board concluded that while other allocation methods may also be reasonable, Fidelity's profitability methodologies are reasonable in all material respects.
Annual Report
The Board also reviewed Fidelity's non-fund businesses and fall-out benefits related to the mutual fund business as well as cases where Fidelity's affiliates may benefit from or be related to the fund's business.
The Board considered the costs of the services provided by and the profits realized by Fidelity in connection with the operation of the fund and was satisfied that the profitability was not excessive in the circumstances.
Economies of Scale. The Board considered whether there have been economies of scale in respect of the management of the Fidelity funds, whether the Fidelity funds (including the fund) have appropriately benefited from any such economies of scale, and whether there is potential for realization of any further economies of scale. The Board considered the extent to which the fund will benefit from economies of scale through increased services to the fund, through waivers or reimbursements, or through fee or expense reductions. The Board also noted that in 2009, it and the board of other Fidelity funds created an ad hoc committee (the Economies of Scale Committee) to analyze whether FMR attains economies of scale in respect of the management and servicing of the Fidelity funds, whether the Fidelity funds have appropriately benefited from such economies of scale, and whether there is potential for realization of any further economies of scale.
The Board recognized that the fund's management contract incorporates a "group fee" structure, which provides for lower group fee rates as total fund assets under FMR's management increase, and for higher group fee rates as total fund assets under FMR's management decrease. FMR calculates the group fee rates based on a tiered asset "breakpoint" schedule that varies based on asset class. The Board considered that the group fee is designed to deliver the benefits of economies of scale to fund shareholders when total Fidelity fund assets increase, even if assets of any particular fund are unchanged or have declined, because some portion of Fidelity's costs are attributable to services provided to all Fidelity funds, and all funds benefit if those costs can be allocated among more assets. The Board concluded that, given the group fee structure, fund shareholders will benefit from lower management fees as assets under FMR's management increase at the fund complex level, regardless of whether Fidelity achieves any such economies of scale.
Annual Report
Board Approval of Investment Advisory Contracts and
Management Fees - continued
The Board concluded, taking into account the analysis of the Economies of Scale Committee, that economies of scale, if any, are being appropriately shared between fund shareholders and Fidelity.
Additional Information Requested by the Board. In order to develop fully the factual basis for consideration of the Fidelity funds' Advisory Contracts, the Board requested and received additional information on certain topics, including (i) fund performance trends, actions to be taken by FMR to improve certain funds' overall performance, and Fidelity's long-term strategies for certain funds; (ii) the potential to further rationalize the Fidelity fund lineup with the possibility of achieving savings for the funds and Fidelity; (iii) Fidelity's compensation structure for portfolio managers and other key investment personnel; (iv) the amount of the investment that each portfolio manager has made in the Fidelity fund(s) that he or she manages; (v) the realization of fall-out benefits in certain Fidelity business units; (vi) Fidelity's group fee structures, the potential impact of regulatory changes on such structures, and the rationale for the individual fee rates of certain funds; (vii) fund profitability methodology, including Fidelity's cost allocation methodology, and the impact of certain factors on fund profitability results; (viii) trends regarding industry use of performance fee structures and the possibility of implementing performance fee structures for additional funds; and (ix) the impact of net redemptions from the Fidelity funds.
Based on its evaluation of all of the conclusions noted above, and after considering all factors it believed relevant, the Board ultimately concluded that the advisory fee structures are fair and reasonable, and that the fund's Advisory Contracts should be renewed.
Annual Report
Investment Adviser
Fidelity Management & Research Company
Boston, MA
Investment Sub-Advisers
FMR Co., Inc.
Fidelity Management & Research
(U.K.) Inc.
Fidelity Management & Research
(Hong Kong) Limited
Fidelity Management & Research
(Japan) Inc.
FIL Investment Advisors (UK) Limited
FIL Investments (Japan) Limited
FIL Investment Advisors
General Distributor
Fidelity Distributors Corporation
Smithfield, RI
Transfer and Service Agents
Fidelity Investments Institutional
Operations Company, Inc.
Boston, MA
Fidelity Service Company, Inc.
Boston, MA
Custodian
The Northern Trust Company
Chicago, IL
(Fidelity Investment logo)(registered trademark)
OS-UANN-1212
1.784767.109
(Fidelity Investment logo)(registered trademark)
Fidelity Advisor®
Overseas
Fund - Institutional Class
Annual Report
October 31, 2012
(Fidelity Cover Art)
Contents
Performance | (Click Here) | How the fund has done over time. |
Management's Discussion of Fund Performance | (Click Here) | The Portfolio Manager's review of fund performance and strategy. |
Shareholder Expense Example | (Click Here) | An example of shareholder expenses. |
Investment Changes | (Click Here) | A summary of major shifts in the fund's investments over the past six months. |
Investments | (Click Here) | A complete list of the fund's investments with their market values. |
Financial Statements | (Click Here) | Statements of assets and liabilities, operations, and changes in net assets,
as well as financial highlights. |
Notes | (Click Here) | Notes to the financial statements. |
Report of Independent Registered Public Accounting Firm | (Click Here) | |
Trustees and Officers | (Click Here) | |
Board Approval of Investment Advisory Contracts and Management Fees | (Click Here) | |
To view a fund's proxy voting guidelines and proxy voting record for the 12-month period ended June 30, visit http://www.fidelity.com/proxyvotingresults or visit the Securities and Exchange Commission's (SEC) web site at http://www.sec.gov. You may also call 1-877-208-0098 to request a free copy of the proxy voting guidelines.
Standard & Poor's, S&P and S&P 500 are registered service marks of The McGraw-Hill Companies, Inc. and have been licensed for use by Fidelity Distributors Corporation.
Other third party marks appearing herein are the property of their respective owners.
All other marks appearing herein are registered or unregistered trademarks or service marks of FMR LLC or an affiliated company. © 2012 FMR LLC. All rights reserved.
Annual Report
This report and the financial statements contained herein are submitted for the general information of the shareholders of the fund. This report is not authorized for distribution to prospective investors in the fund unless preceded or accompanied by an effective prospectus.
A fund files its complete schedule of portfolio holdings with the SEC for the first and third quarters of each fiscal year on Form N-Q. Forms N-Q are available on the SEC's web site at http://www.sec.gov. A fund's Forms N-Q may be reviewed and copied at the SEC's Public Reference Room in Washington, DC. Information regarding the operation of the SEC's Public Reference Room may be obtained by calling 1-800-SEC-0330. For a complete list of a fund's portfolio holdings, view the most recent holdings listing, semiannual report, or annual report on Fidelity's web site at http://www.fidelity.com, http://www.advisor.fidelity.com, or http://www.401k.com, as applicable.
NOT FDIC INSURED • MAY LOSE VALUE • NO BANK GUARANTEE
Neither the fund nor Fidelity Distributors Corporation is a bank.
Annual Report
Average annual total return reflects the change in the value of an investment, assuming reinvestment of the class' distributions from dividend income and capital gains (the profits earned upon the sale of securities that have grown in value, if any) and assuming a constant rate of performance each year. The $10,000 table and the fund's returns do not reflect the deduction of taxes that a shareholder would pay on fund distributions or the redemption of fund shares. During periods of reimbursement by Fidelity, a fund's total return will be greater than it would be had the reimbursement not occurred. How a fund did yesterday is no guarantee of how it will do tomorrow.
Average Annual Total Returns
Periods ended October 31, 2012 | | Past 1
year | Past 5
years | Past 10
years |
Institutional Class | | 5.91% | -5.95% | 7.28% |
$10,000 Over 10 Years
Let's say hypothetically that $10,000 was invested in Fidelity Advisor® Overseas Fund - Institutional Class on October 31, 2002. The chart shows how the value of your investment would have changed, and also shows how the MSCI® EAFE® Index performed over the same period.
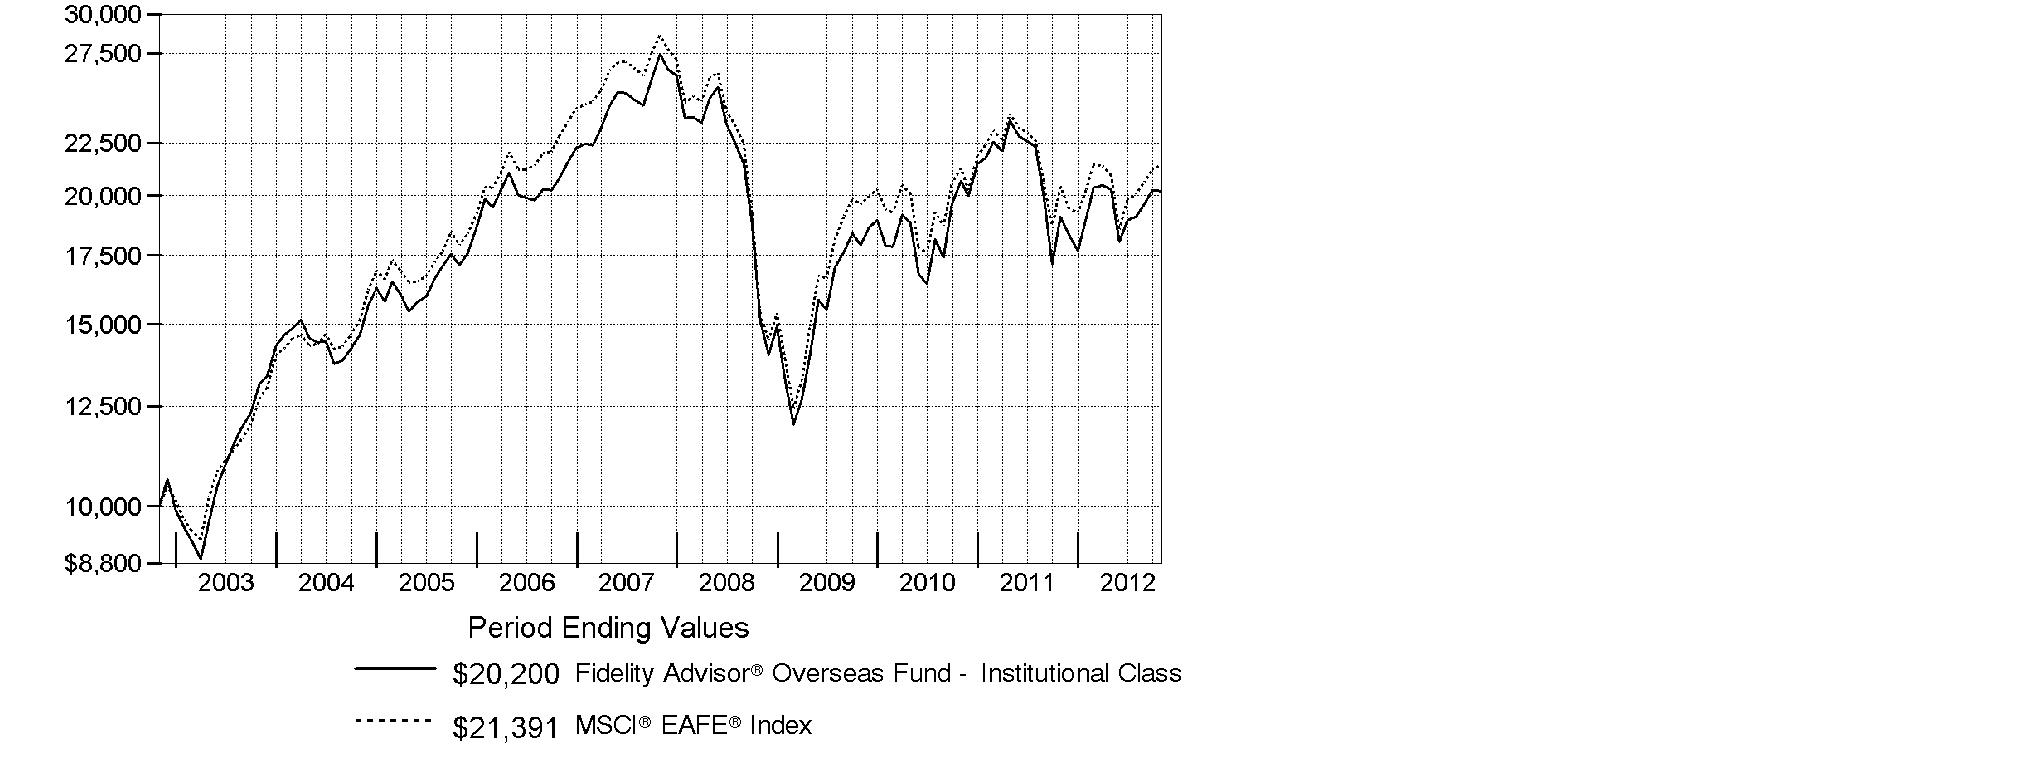
Annual Report
Market Recap: International stocks experienced pendulum-like swings during the 12 months ending October 31, 2012, finishing the period with a modest advance. The market faced periodic bouts of volatility this past year, as a number of macroeconomic concerns - including the eurozone debt crisis, the strength and pace of the U.S. economic recovery, and a slowdown in China's once-blistering growth - dominated headlines and weighed on investors. While a stronger U.S. dollar provided an additional head wind, foreign developed- and emerging-markets stocks still managed a gain for the 12 months, as the MSCI® ACWI® (All Country World Index) ex USA Index rose 4.11%, largely buttressed in the summertime by pledges of accommodative monetary action from eurozone officials, as well as signs that the U.S. housing market was on the mend. Within the index, Asia-Pacific ex Japan showed the most impressive gains, advancing roughly 11%. A number of core European components, most notably Germany (+11%), Switzerland (+10%) and the U.K. (+9%), benefited from optimism about the eurozone's ability to resolve its debt woes, which also helped the region outpace the index overall. Elsewhere, results from Canada (+3%) and the generally more volatile emerging markets (+2%) each fell short of the MSCI index, while Japan was among the few benchmark constituents to finish in the red, returning about -3%.
Comments from Graeme Rockett, Portfolio Manager of Fidelity Advisor® Overseas Fund: For the year, the fund's Institutional Class shares gained 5.91%, surpassing the 4.76% return of the MSCI® EAFE® Index. Stock selection drove overall performance, most notably leading Chinese Internet firm Tencent Holdings and computer/consumer electronics giant Apple. Choices in health care also helped, with a stake in Denmark-based pharmaceuticals firm Novo Nordisk the fund's top contributor, gaining from its strong position as a global leader in diabetes care. Meaningful stakes in U.K.-based William Hill and Ireland's Paddy Power, two international betting and gaming companies, also were winners. Conversely, several picks in retailing hurt, including Japan-based e-commerce websites Start Today and Rakuten, and Hengdeli Holdings - a retailer of high-end Swiss watches in China. A mild winter and high sheepskin costs pounded shares of Deckers Outdoor, the U.S.-based maker of the UGG® Australia line of footwear. Many of the stocks I've mentioned were not in the index, and I sold Start Today by period end.
The views expressed above reflect those of the portfolio manager(s) only through the end of the period as stated on the cover of this report and do not necessarily represent the views of Fidelity or any other person in the Fidelity organization. Any such views are subject to change at any time based upon market or other conditions and Fidelity disclaims any responsibility to update such views. These views may not be relied on as investment advice and, because investment decisions for a Fidelity fund are based on numerous factors, may not be relied on as an indication of trading intent on behalf of any Fidelity fund.
Annual Report
Shareholder Expense Example
As a shareholder of the Fund, you incur two types of costs: (1) transaction costs, including sales charges (loads) on purchase payments or redemption proceeds, redemption fees and (2) ongoing costs, including management fees, distribution and/or service (12b-1) fees and other Fund expenses. This Example is intended to help you understand your ongoing costs (in dollars) of investing in the Fund and to compare these costs with the ongoing costs of investing in other mutual funds.
The Example is based on an investment of $1,000 invested at the beginning of the period and held for the entire period (May 1, 2012 to October 31, 2012).
Actual Expenses
The first line of the accompanying table for each class of the Fund provides information about actual account values and actual expenses. You may use the information in this line, together with the amount you invested, to estimate the expenses that you paid over the period. Simply divide your account value by $1,000.00 (for example, an $8,600 account value divided by $1,000.00 = 8.6), then multiply the result by the number in the first line for a class of the Fund under the heading entitled "Expenses Paid During Period" to estimate the expenses you paid on your account during this period. In addition, the Fund, as a shareholder in the underlying Fidelity Central Funds, will indirectly bear its pro-rata share of the fees and expenses incurred by the underlying Fidelity Central Funds. These fees and expenses are not included in the Fund's annualized expense ratio used to calculate the expense estimate in the table below.
Hypothetical Example for Comparison Purposes
The second line of the accompanying table for each class of the Fund provides information about hypothetical account values and hypothetical expenses based on a Class' actual expense ratio and an assumed rate of return of 5% per year before expenses, which is not the Class' actual return. The hypothetical account values and expenses may not be used to estimate the actual ending account balance or expenses you paid for the period. You may use this information to compare the ongoing costs of investing in the Fund and other funds. To do so, compare this 5% hypothetical example with the 5% hypothetical examples that appear in the shareholder reports of the other funds. In addition, the Fund, as a shareholder in the underlying Fidelity Central Funds, will indirectly bear its pro-rata share of the fees and expenses incurred by the underlying Fidelity Central Funds. These fees and expenses are not included in the Fund's annualized expense ratio used to calculate the expense estimate in the table below.
Please note that the expenses shown in the table are meant to highlight your ongoing costs only and do not reflect any transaction costs. Therefore, the second line of the table is useful in comparing ongoing costs only, and will not help you determine the relative total costs of owning different funds. In addition, if these transactional costs were included, your costs would have been higher.
Annual Report
| Annualized Expense Ratio | Beginning
Account Value
May 1, 2012 | Ending
Account Value
October 31, 2012 | Expenses Paid
During Period*
May 1, 2012 to
October 31, 2012 |
Class A | 1.41% | | | |
Actual | | $ 1,000.00 | $ 994.70 | $ 7.07 |
HypotheticalA | | $ 1,000.00 | $ 1,018.05 | $ 7.15 |
Class T | 1.59% | | | |
Actual | | $ 1,000.00 | $ 993.10 | $ 7.97 |
HypotheticalA | | $ 1,000.00 | $ 1,017.14 | $ 8.06 |
Class B | 2.17% | | | |
Actual | | $ 1,000.00 | $ 990.20 | $ 10.86 |
HypotheticalA | | $ 1,000.00 | $ 1,014.23 | $ 10.99 |
Class C | 2.17% | | | |
Actual | | $ 1,000.00 | $ 991.00 | $ 10.86 |
HypotheticalA | | $ 1,000.00 | $ 1,014.23 | $ 10.99 |
Institutional Class | 1.08% | | | |
Actual | | $ 1,000.00 | $ 995.90 | $ 5.42 |
HypotheticalA | | $ 1,000.00 | $ 1,019.71 | $ 5.48 |
A 5% return per year before expenses
* Expenses are equal to each Class' annualized expense ratio, multiplied by the average account value over the period, multiplied by 184/366 (to reflect the one-half year period).
Annual Report
Investment Changes (Unaudited)
Top Five Stocks as of October 31, 2012 |
| % of fund's
net assets | % of fund's net assets
6 months ago |
Sanofi SA (France, Pharmaceuticals) | 2.9 | 1.8 |
Nestle SA (Switzerland, Food Products) | 2.8 | 1.0 |
Novo Nordisk A/S Series B (Denmark, Pharmaceuticals) | 2.7 | 2.7 |
Royal Dutch Shell PLC (United Kingdom Oil, Gas & Consumable Fuels) | 2.2 | 1.1 |
Rakuten, Inc. (Japan, Internet & Catalog Retail) | 2.1 | 2.4 |
| 12.7 | |
Top Five Market Sectors as of October 31, 2012 |
| % of fund's
net assets | % of fund's net assets
6 months ago |
Financials | 17.9 | 15.1 |
Consumer Discretionary | 16.6 | 25.4 |
Consumer Staples | 15.6 | 11.6 |
Information Technology | 12.0 | 12.3 |
Health Care | 9.9 | 6.3 |
Top Five Countries as of October 31, 2012 |
(excluding cash equivalents) | % of fund's
net assets | % of fund's net assets
6 months ago |
United Kingdom | 24.2 | 19.9 |
Japan | 12.9 | 13.8 |
France | 12.4 | 12.1 |
Switzerland | 8.4 | 8.7 |
Germany | 7.2 | 11.4 |
Percentages are adjusted for the effect of open futures contracts, if applicable. |
Asset Allocation (% of fund's net assets) |
As of October 31, 2012 | As of April 30, 2012 |
| Stocks 98.7% | | | Stocks 98.0% | |
| Short-Term Investments and Net Other Assets (Liabilities) 1.3% | | | Short-Term Investments and Net Other Assets (Liabilities) 2.0% | |

Annual Report
Investments October 31, 2012
Showing Percentage of Net Assets
Common Stocks - 97.5% |
| Shares | | Value (000s) |
Australia - 4.1% |
BHP Billiton Ltd. | 211,768 | | $ 7,498 |
CSL Ltd. | 147,600 | | 7,278 |
Fortescue Metals Group Ltd. (d) | 208,017 | | 881 |
Macquarie Group Ltd. | 43,810 | | 1,451 |
Newcrest Mining Ltd. | 108,586 | | 2,979 |
Westfield Group unit | 426,827 | | 4,723 |
TOTAL AUSTRALIA | | 24,810 |
Bailiwick of Jersey - 0.7% |
Wolseley PLC | 30,300 | | 1,325 |
WPP PLC | 247,196 | | 3,195 |
TOTAL BAILIWICK OF JERSEY | | 4,520 |
Belgium - 0.5% |
Ageas | 41,090 | | 1,046 |
UCB SA | 29,600 | | 1,726 |
TOTAL BELGIUM | | 2,772 |
Bermuda - 1.1% |
Clear Media Ltd. | 1,278,000 | | 660 |
Oriental Watch Holdings Ltd. | 2,992,000 | | 896 |
Shenzhen International Holdings Ltd. | 7,820,000 | | 646 |
Signet Jewelers Ltd. | 82,600 | | 4,275 |
TOTAL BERMUDA | | 6,477 |
Brazil - 0.4% |
Souza Cruz SA | 205,800 | | 2,685 |
British Virgin Islands - 0.8% |
Gem Diamonds Ltd. (a) | 339,700 | | 925 |
Mail.ru Group Ltd.: | | | |
GDR (e) | 4,200 | | 140 |
GDR (Reg. S) | 113,200 | | 3,775 |
TOTAL BRITISH VIRGIN ISLANDS | | 4,840 |
Canada - 0.2% |
Yamana Gold, Inc. | 60,500 | | 1,222 |
Cayman Islands - 3.0% |
Baidu.com, Inc. sponsored ADR (a) | 13,500 | | 1,439 |
Hengdeli Holdings Ltd. | 18,578,000 | | 5,849 |
Noah Holdings Ltd. sponsored ADR (d) | 129,100 | | 646 |
Common Stocks - continued |
| Shares | | Value (000s) |
Cayman Islands - continued |
Tencent Holdings Ltd. | 266,800 | | $ 9,433 |
YouKu.com, Inc. ADR (a) | 38,800 | | 768 |
TOTAL CAYMAN ISLANDS | | 18,135 |
Denmark - 2.9% |
Danske Bank A/S (a) | 51,111 | | 799 |
Novo Nordisk A/S: | | | |
Series B | 19,863 | | 3,184 |
Series B sponsored ADR | 83,800 | | 13,432 |
TOTAL DENMARK | | 17,415 |
France - 12.4% |
Alstom SA | 109,436 | | 3,738 |
Atos Origin SA | 37,816 | | 2,539 |
AXA SA | 39,958 | | 635 |
AXA SA sponsored ADR | 67,200 | | 1,070 |
Beneteau SA | 86,400 | | 863 |
BNP Paribas SA | 62,616 | | 3,150 |
Club Mediterranee SA (a) | 53,000 | | 842 |
Danone SA | 118,422 | | 7,279 |
Essilor International SA | 13,262 | | 1,196 |
Gameloft SA (a) | 239,900 | | 1,642 |
GDF Suez | 85,511 | | 1,962 |
Iliad SA | 15,066 | | 2,321 |
Ingenico SA | 40,014 | | 2,118 |
Ipsos SA | 57,360 | | 2,016 |
Lafarge SA (Bearer) | 16,200 | | 949 |
LVMH Moet Hennessy - Louis Vuitton SA | 35,419 | | 5,757 |
Pernod Ricard SA | 72,700 | | 7,824 |
Safran SA | 52,800 | | 2,101 |
Sanofi SA | 80,690 | | 7,087 |
Sanofi SA sponsored ADR | 230,300 | | 10,099 |
Societe Generale Series A (a) | 35,613 | | 1,132 |
Total SA | 94,200 | | 4,745 |
Unibail-Rodamco | 19,000 | | 4,281 |
TOTAL FRANCE | | 75,346 |
Germany - 6.0% |
adidas AG | 31,900 | | 2,718 |
Allianz AG | 32,906 | | 4,080 |
Bayer AG | 55,340 | | 4,819 |
Commerzbank AG (a) | 235,000 | | 450 |
Deutsche Bank AG | 32,500 | | 1,480 |
Common Stocks - continued |
| Shares | | Value (000s) |
Germany - continued |
Deutsche Boerse AG | 58,469 | | $ 3,165 |
Deutsche Post AG | 108,546 | | 2,152 |
GSW Immobilien AG | 25,200 | | 1,037 |
K&S AG | 23,400 | | 1,107 |
Linde AG | 13,429 | | 2,258 |
Muenchener Rueckversicherungs AG | 11,355 | | 1,825 |
SAP AG | 126,552 | | 9,229 |
SAP AG sponsored ADR (d) | 21,800 | | 1,589 |
Tom Tailor Holding AG | 28,200 | | 601 |
TOTAL GERMANY | | 36,510 |
Hong Kong - 1.8% |
AIA Group Ltd. | 921,000 | | 3,648 |
Cheung Kong Holdings Ltd. | 74,000 | | 1,093 |
Henderson Land Development Co. Ltd. | 310,353 | | 2,150 |
Hutchison Whampoa Ltd. | 138,000 | | 1,358 |
Television Broadcasts Ltd. | 370,000 | | 2,757 |
TOTAL HONG KONG | | 11,006 |
Ireland - 3.1% |
CRH PLC | 213,332 | | 3,971 |
Glanbia PLC | 184,500 | | 1,751 |
Kingspan Group PLC (United Kingdom) | 257,600 | | 2,704 |
Paddy Power PLC (Ireland) | 140,400 | | 10,362 |
TOTAL IRELAND | | 18,788 |
Israel - 0.2% |
Rami Levi Chain Stores Hashikma Marketing 2006 Ltd. | 33,700 | | 1,004 |
Italy - 1.4% |
Assicurazioni Generali SpA | 71,400 | | 1,161 |
Brunello Cucinelli SpA | 4,900 | | 87 |
ENI SpA | 96,700 | | 2,225 |
ENI SpA sponsored ADR (d) | 22,300 | | 1,023 |
Saipem SpA | 93,432 | | 4,197 |
TOTAL ITALY | | 8,693 |
Japan - 12.9% |
Calbee, Inc. | 23,300 | | 2,139 |
Cosmos Pharmaceutical Corp. | 49,700 | | 4,900 |
Dai-ichi Mutual Life Insurance Co. | 866 | | 998 |
Denso Corp. | 33,000 | | 1,033 |
Hitachi Ltd. | 691,000 | | 3,661 |
Common Stocks - continued |
| Shares | | Value (000s) |
Japan - continued |
Honda Motor Co. Ltd. | 107,600 | | $ 3,235 |
Japan Tobacco, Inc. | 58,000 | | 1,603 |
Kakaku.com, Inc. | 136,200 | | 4,666 |
KDDI Corp. | 37,700 | | 2,928 |
Keyence Corp. | 17,800 | | 4,723 |
Mitsubishi Corp. | 152,100 | | 2,715 |
Mitsubishi UFJ Financial Group, Inc. | 1,175,800 | | 5,319 |
Mitsubishi UFJ Financial Group, Inc. sponsored ADR | 179,900 | | 808 |
MS&AD Insurance Group Holdings, Inc. | 79,900 | | 1,354 |
NKSJ Holdings, Inc. | 45,000 | | 820 |
Nomura Holdings, Inc. | 204,200 | | 738 |
ORIX Corp. | 33,070 | | 3,397 |
Rakuten, Inc. | 1,408,700 | | 12,670 |
Softbank Corp. | 158,700 | | 5,024 |
Sumitomo Mitsui Financial Group, Inc. | 138,000 | | 4,217 |
Tokio Marine Holdings, Inc. | 71,800 | | 1,900 |
Toyota Motor Corp. | 133,900 | | 5,163 |
Unicharm Corp. | 46,200 | | 2,500 |
Yahoo! Japan Corp. | 5,911 | | 2,034 |
TOTAL JAPAN | | 78,545 |
Kenya - 0.1% |
East African Breweries Ltd. | 116,216 | | 328 |
Korea (South) - 0.7% |
Samsung Electronics Co. Ltd. | 3,353 | | 4,029 |
Luxembourg - 0.1% |
ArcelorMittal SA Class A unit (d) | 55,600 | | 821 |
Netherlands - 2.0% |
AEGON NV | 109,900 | | 615 |
ASML Holding NV | 24,100 | | 1,325 |
ING Groep NV: | | | |
(Certificaten Van Aandelen) (a) | 173,010 | | 1,539 |
sponsored ADR (a) | 59,300 | | 525 |
Koninklijke Philips Electronics NV | 202,806 | | 5,079 |
Koninklijke Philips Electronics NV (depositary receipt) (NY Reg.) | 81,000 | | 2,031 |
Yandex NV (a) | 50,800 | | 1,183 |
TOTAL NETHERLANDS | | 12,297 |
Common Stocks - continued |
| Shares | | Value (000s) |
Nigeria - 0.2% |
Guinness Nigeria PLC | 384,138 | | $ 644 |
Nigerian Breweries PLC | 1,015,224 | | 783 |
TOTAL NIGERIA | | 1,427 |
Norway - 1.5% |
DnB NOR ASA | 208,600 | | 2,605 |
Schibsted ASA (B Shares) | 139,300 | | 5,216 |
StatoilHydro ASA | 9,400 | | 232 |
StatoilHydro ASA sponsored ADR | 55,700 | | 1,367 |
TOTAL NORWAY | | 9,420 |
Singapore - 0.3% |
United Overseas Bank Ltd. | 101,627 | | 1,522 |
South Africa - 0.2% |
City Lodge Hotels Ltd. | 32,800 | | 348 |
Life Healthcare Group Holdings Ltd. | 310,300 | | 1,173 |
TOTAL SOUTH AFRICA | | 1,521 |
Spain - 1.2% |
Banco Bilbao Vizcaya Argentaria SA | 255,571 | | 2,136 |
Banco Santander SA (Spain) | 127,661 | | 961 |
Grifols SA ADR | 75,600 | | 1,902 |
Iberdrola SA | 392,500 | | 2,030 |
TOTAL SPAIN | | 7,029 |
Sweden - 1.8% |
Nordea Bank AB | 166,600 | | 1,513 |
Svenska Cellulosa AB (SCA) (B Shares) | 219,300 | | 4,272 |
Swedbank AB (A Shares) | 51,612 | | 957 |
Swedish Match Co. AB | 120,200 | | 4,096 |
TOTAL SWEDEN | | 10,838 |
Switzerland - 8.4% |
Adecco SA (Reg.) | 86,391 | | 4,178 |
Compagnie Financiere Richemont SA Series A | 58,178 | | 3,773 |
Credit Suisse Group | 50,181 | | 1,167 |
Credit Suisse Group sponsored ADR | 23,296 | | 544 |
Nestle SA | 272,727 | | 17,314 |
Roche Holding AG (participation certificate) | 30,371 | | 5,841 |
Sika AG (Bearer) | 1,180 | | 2,462 |
Swatch Group AG (Bearer) | 6,200 | | 2,566 |
Swiss Re Ltd. | 21,960 | | 1,517 |
Syngenta AG (Switzerland) | 16,570 | | 6,460 |
Common Stocks - continued |
| Shares | | Value (000s) |
Switzerland - continued |
UBS AG | 170,978 | | $ 2,565 |
UBS AG (NY Shares) | 53,077 | | 797 |
Zurich Financial Services AG | 8,097 | | 1,995 |
TOTAL SWITZERLAND | | 51,179 |
Taiwan - 0.3% |
MediaTek, Inc. | 112,000 | | 1,244 |
Wowprime Corp. | 60,000 | | 842 |
TOTAL TAIWAN | | 2,086 |
Thailand - 0.3% |
Thai Beverage PCL | 4,673,000 | | 1,666 |
United Kingdom - 24.2% |
Aggreko PLC | 44,800 | | 1,554 |
Anglo American PLC (United Kingdom) | 117,359 | | 3,604 |
ASOS PLC (a) | 93,600 | | 3,406 |
Aviva PLC | 184,200 | | 986 |
Barclays PLC | 841,627 | | 3,112 |
Barclays PLC sponsored ADR (d) | 24,700 | | 366 |
BG Group PLC | 281,418 | | 5,211 |
BHP Billiton PLC | 192,986 | | 6,185 |
BP PLC sponsored ADR | 120,466 | | 5,167 |
Brammer PLC | 364,800 | | 1,414 |
British American Tobacco PLC (United Kingdom) | 27,800 | | 1,379 |
British Land Co. PLC | 299,700 | | 2,556 |
Centrica PLC | 672,000 | | 3,515 |
Dechra Pharmaceuticals PLC | 73,200 | | 729 |
Diageo PLC | 432,597 | | 12,367 |
Hays PLC | 2,622,000 | | 3,448 |
HSBC Holdings PLC: | | | |
(United Kingdom) | 63,100 | | 622 |
sponsored ADR | 212,833 | | 10,505 |
Imperial Tobacco Group PLC | 97,186 | | 3,670 |
Intertek Group PLC | 85,300 | | 3,880 |
Johnson Matthey PLC | 82,119 | | 2,980 |
Legal & General Group PLC | 527,691 | | 1,141 |
Lloyds Banking Group PLC (a) | 2,479,699 | | 1,633 |
M&C Saatchi PLC | 887,505 | | 2,660 |
Michael Page International PLC | 573,100 | | 3,333 |
Prudential PLC | 125,264 | | 1,720 |
Reckitt Benckiser Group PLC | 106,200 | | 6,427 |
Rio Tinto PLC | 118,832 | | 5,936 |
Common Stocks - continued |
| Shares | | Value (000s) |
United Kingdom - continued |
Rio Tinto PLC sponsored ADR | 9,100 | | $ 455 |
Rolls-Royce Group PLC | 164,274 | | 2,265 |
Rolls-Royce Group PLC Class C | 12,484,824 | | 20 |
Royal Bank of Scotland Group PLC (a) | 120,080 | | 536 |
Royal Dutch Shell PLC: | | | |
Class A (United Kingdom) | 188,233 | | 6,459 |
Class B (United Kingdom) | 197,675 | | 6,992 |
SABMiller PLC | 223,900 | | 9,591 |
Standard Chartered PLC (United Kingdom) | 146,813 | | 3,467 |
Sthree PLC | 190,600 | | 924 |
Vodafone Group PLC | 3,495,369 | | 9,492 |
William Hill PLC | 866,100 | | 4,724 |
Xstrata PLC | 172,600 | | 2,727 |
TOTAL UNITED KINGDOM | | 147,158 |
United States of America - 4.7% |
Amazon.com, Inc. (a) | 6,800 | | 1,583 |
Apple, Inc. | 4,500 | | 2,678 |
Deckers Outdoor Corp. (a)(d) | 83,200 | | 2,382 |
Dunkin' Brands Group, Inc. (d) | 59,700 | | 1,851 |
GNC Holdings, Inc. | 81,800 | | 3,163 |
Google, Inc. Class A (a) | 10,200 | | 6,934 |
Life Technologies Corp. (a) | 20,300 | | 993 |
MercadoLibre, Inc. | 18,800 | | 1,579 |
Monsanto Co. | 14,500 | | 1,248 |
Visa, Inc. Class A | 44,700 | | 6,203 |
TOTAL UNITED STATES OF AMERICA | | 28,614 |
TOTAL COMMON STOCKS (Cost $573,798) |
592,703
|
Nonconvertible Preferred Stocks - 1.2% |
| | | |
Germany - 1.2% |
Volkswagen AG
(Cost $6,046) | 35,900 | |
7,426
|
Money Market Funds - 2.4% |
| Shares | | Value (000s) |
Fidelity Cash Central Fund, 0.19% (b) | 7,629,808 | | $ 7,630 |
Fidelity Securities Lending Cash Central Fund, 0.19% (b)(c) | 6,890,900 | | 6,891 |
TOTAL MONEY MARKET FUNDS (Cost $14,521) |
14,521
|
TOTAL INVESTMENT PORTFOLIO - 101.1% (Cost $594,365) | | 614,650 |
NET OTHER ASSETS (LIABILITIES) - (1.1)% | | (6,982) |
NET ASSETS - 100% | $ 607,668 |
Legend |
(a) Non-income producing |
(b) Affiliated fund that is available only to investment companies and other accounts managed by Fidelity Investments. The rate quoted is the annualized seven-day yield of the fund at period end. A complete unaudited listing of the fund's holdings as of its most recent quarter end is available upon request. In addition, each Fidelity Central Fund's financial statements, which are not covered by the Fund's Report of Independent Registered Public Accounting Firm, are available on the SEC's website or upon request. |
(c) Investment made with cash collateral received from securities on loan. |
(d) Security or a portion of the security is on loan at period end. |
(e) Security exempt from registration under Rule 144A of the Securities Act of 1933. These securities may be resold in transactions exempt from registration, normally to qualified institutional buyers. At the end of the period, the value of these securities amounted to $140,000 or 0.0% of net assets. |
Affiliated Central Funds |
Information regarding fiscal year to date income earned by the Fund from investments in Fidelity Central Funds is as follows: |
Fund | Income earned
(Amounts in thousands) |
Fidelity Cash Central Fund | $ 12 |
Fidelity Securities Lending Cash Central Fund | 447 |
Total | $ 459 |
Other Information |
Categorizations in the Schedule of Investments are based on country or territory of incorporation. |
The following is a summary of the inputs used, as of October 31, 2012, involving the Fund's assets and liabilities carried at fair value. The inputs or methodology used for valuing securities may not be an indication of the risk associated with investing in those securities. For more information on valuation inputs, and their aggregation into the levels used in the tables below, please refer to the Security Valuation section in the accompanying Notes to Financial Statements. |
Valuation Inputs at Reporting Date: |
Description
(Amounts in thousands) | Total | Level 1 | Level 2 | Level 3 |
Investments in Securities: | | | | |
Equities: | | | | |
Consumer Discretionary | $ 102,919 | $ 91,326 | $ 11,593 | $ - |
Consumer Staples | 94,222 | 80,476 | 13,746 | - |
Energy | 37,618 | 16,965 | 20,653 | - |
Financials | 106,175 | 76,829 | 29,346 | - |
Health Care | 59,459 | 49,188 | 10,271 | - |
Industrials | 44,865 | 39,786 | 5,079 | - |
Information Technology | 72,931 | 63,702 | 9,229 | - |
Materials | 54,668 | 24,618 | 30,050 | - |
Telecommunication Services | 19,765 | 10,273 | 9,492 | - |
Utilities | 7,507 | 7,507 | - | - |
Money Market Funds | 14,521 | 14,521 | - | - |
Total Investments in Securities: | $ 614,650 | $ 475,191 | $ 139,459 | $ - |
The following is a summary of transfers between Level 1 and Level 2 for the period ended October 31, 2012. Transfers are assumed to have occurred at the beginning of the period, and are primarily attributable to the valuation techniques used for foreign equity securities, as discussed in the accompanying Notes to Financial Statements: |
Transfers | Total (000s) |
Level 1 to Level 2 | $ 0 |
Level 2 to Level 1 | $ 103,477 |
See accompanying notes which are an integral part of the financial statements.
Annual Report
Statement of Assets and Liabilities
Amounts in thousands (except per-share amounts) | October 31, 2012 |
| | |
Assets | | |
Investment in securities, at value (including securities loaned of $6,638) - See accompanying schedule: Unaffiliated issuers (cost $579,844) | $ 600,129 | |
Fidelity Central Funds (cost $14,521) | 14,521 | |
Total Investments (cost $594,365) | | $ 614,650 |
Foreign currency held at value (cost $335) | | 335 |
Receivable for investments sold | | 297 |
Receivable for fund shares sold | | 788 |
Dividends receivable | | 1,524 |
Distributions receivable from Fidelity Central Funds | | 9 |
Other receivables | | 235 |
Total assets | | 617,838 |
| | |
Liabilities | | |
Payable for investments purchased | $ 1,698 | |
Payable for fund shares redeemed | 790 | |
Accrued management fee | 421 | |
Distribution and service plan fees payable | 143 | |
Other affiliated payables | 142 | |
Other payables and accrued expenses | 85 | |
Collateral on securities loaned, at value | 6,891 | |
Total liabilities | | 10,170 |
| | |
Net Assets | | $ 607,668 |
Net Assets consist of: | | |
Paid in capital | | $ 722,896 |
Undistributed net investment income | | 8,714 |
Accumulated undistributed net realized gain (loss) on investments and foreign currency transactions | | (144,176) |
Net unrealized appreciation (depreciation) on investments and assets and liabilities in foreign currencies | | 20,234 |
Net Assets | | $ 607,668 |
See accompanying notes which are an integral part of the financial statements.
Annual Report
Statement of Assets and Liabilities - continued
Amounts in thousands (except per-share amounts) | October 31, 2012 |
| | |
Calculation of Maximum Offering Price Class A:
Net Asset Value and redemption price per share ($60,378 ÷ 3,603 shares) | | $ 16.76 |
| | |
Maximum offering price per share (100/94.25 of $16.76) | | $ 17.78 |
Class T:
Net Asset Value and redemption price per share ($270,883 ÷ 15,782 shares) | | $ 17.16 |
| | |
Maximum offering price per share (100/96.50 of $17.16) | | $ 17.78 |
Class B:
Net Asset Value and offering price per share ($3,022 ÷ 186 shares)A | | $ 16.25 |
| | |
Class C:
Net Asset Value and offering price per share ($16,100 ÷ 980 shares)A | | $ 16.43 |
| | |
Institutional Class:
Net Asset Value, offering price and redemption price per share ($257,285 ÷ 15,037 shares) | | $ 17.11 |
A Redemption price per share is equal to net asset value less any applicable contingent deferred sales charge.
See accompanying notes which are an integral part of the financial statements.
Annual Report
Financial Statements - continued
Statement of Operations
Amounts in thousands | Year ended October 31, 2012 |
| | |
Investment Income | | |
Dividends | | $ 17,934 |
Income from Fidelity Central Funds | | 459 |
Income before foreign taxes withheld | | 18,393 |
Less foreign taxes withheld | | (1,162) |
Total income | | 17,231 |
| | |
Expenses | | |
Management fee
Basic fee | $ 4,446 | |
Performance adjustment | (112) | |
Transfer agent fees | 1,436 | |
Distribution and service plan fees | 1,751 | |
Accounting and security lending fees | 316 | |
Custodian fees and expenses | 110 | |
Independent trustees' compensation | 4 | |
Registration fees | 70 | |
Audit | 74 | |
Legal | 3 | |
Interest | - | |
Miscellaneous | 9 | |
Total expenses before reductions | 8,107 | |
Expense reductions | (105) | 8,002 |
Net investment income (loss) | | 9,229 |
Realized and Unrealized Gain (Loss) Net realized gain (loss) on: | | |
Investment securities: | | |
Unaffiliated issuers | (23,539) | |
Foreign currency transactions | (114) | |
Total net realized gain (loss) | | (23,653) |
Change in net unrealized appreciation (depreciation) on: Investment securities | 44,968 | |
Assets and liabilities in foreign currencies | (109) | |
Total change in net unrealized appreciation (depreciation) | | 44,859 |
Net gain (loss) | | 21,206 |
Net increase (decrease) in net assets resulting from operations | | $ 30,435 |
See accompanying notes which are an integral part of the financial statements.
Annual Report
Statement of Changes in Net Assets
Amounts in thousands | Year ended
October 31,
2012 | Year ended
October 31,
2011 |
Increase (Decrease) in Net Assets | | |
Operations | | |
Net investment income (loss) | $ 9,229 | $ 10,269 |
Net realized gain (loss) | (23,653) | 139,082 |
Change in net unrealized appreciation (depreciation) | 44,859 | (202,787) |
Net increase (decrease) in net assets resulting
from operations | 30,435 | (53,436) |
Distributions to shareholders from net investment income | (10,172) | (12,982) |
Distributions to shareholders from net realized gain | - | (2,756) |
Total distributions | (10,172) | (15,738) |
Share transactions - net increase (decrease) | (148,253) | (342,819) |
Redemption fees | 13 | 20 |
Total increase (decrease) in net assets | (127,977) | (411,973) |
| | |
Net Assets | | |
Beginning of period | 735,645 | 1,147,618 |
End of period (including undistributed net investment income of $8,714 and undistributed net investment income of $9,657, respectively) | $ 607,668 | $ 735,645 |
See accompanying notes which are an integral part of the financial statements.
Annual Report
Financial Highlights - Class A
Years ended October 31, | 2012 | 2011 | 2010 | 2009 | 2008 |
Selected Per-Share Data | | | | | |
Net asset value, beginning of period | $ 16.13 | $ 17.77 | $ 15.68 | $ 13.56 | $ 26.85 |
Income from Investment Operations | | | | | |
Net investment income (loss) C | .23 | .16 | .17 | .24 | .38 |
Net realized and unrealized gain (loss) | .64 | (1.54) | 2.16 | 2.12 | (11.56) |
Total from investment operations | .87 | (1.38) | 2.33 | 2.36 | (11.18) |
Distributions from net investment income | (.24) | (.21) | (.21) | (.24) | (.33) |
Distributions from net realized gain | - | (.05) | (.03) | - | (1.78) |
Total distributions | (.24) | (.26) | (.24) | (.24) | (2.11) |
Redemption fees added to paid in capital C,G | - | - | - | - | - |
Net asset value, end of period | $ 16.76 | $ 16.13 | $ 17.77 | $ 15.68 | $ 13.56 |
Total Return A,B | 5.51% | (7.95)% | 14.99% | 17.97% | (45.08)% |
Ratios to Average Net Assets D,F | | | | | |
Expenses before reductions | 1.33% | 1.34% | 1.36% | 1.36% | 1.35% |
Expenses net of fee waivers, if any | 1.33% | 1.34% | 1.36% | 1.36% | 1.35% |
Expenses net of all reductions | 1.32% | 1.32% | 1.33% | 1.33% | 1.32% |
Net investment income (loss) | 1.43% | .90% | 1.04% | 1.79% | 1.83% |
Supplemental Data | | | | | |
Net assets, end of period (in millions) | $ 60 | $ 60 | $ 70 | $ 72 | $ 73 |
Portfolio turnover rate E | 36% | 44% | 53% | 83% | 79% |
A Total returns would have been lower if certain expenses had not been reduced during the applicable periods shown.
B Total returns do not include the effect of the sales charges.
C Calculated based on average shares outstanding during the period.
D Fees and expenses of any underlying Fidelity Central Funds are not included in the Fund's expense ratio. The Fund indirectly bears its proportionate share of the expenses of any underlying Fidelity Central Funds.
E Amount does not include the portfolio activity of any underlying Fidelity Central Funds.
F Expense ratios reflect operating expenses of the class. Expenses before reductions do not reflect amounts reimbursed by the investment adviser or reductions from brokerage service arrangements or reductions from other expense offset arrangements and do not represent the amount paid by the class during periods when reimbursements or reductions occur. Expenses net of fee waivers reflect expenses after reimbursement by the investment adviser but prior to reductions from brokerage service arrangements or other expense offset arrangements. Expenses net of all reductions represent the net expenses paid by the class.
G Amount represents less than $.01 per share.
See accompanying notes which are an integral part of the financial statements.
Annual Report
Financial Highlights - Class T
Years ended October 31, | 2012 | 2011 | 2010 | 2009 | 2008 |
Selected Per-Share Data | | | | | |
Net asset value, beginning of period | $ 16.50 | $ 18.18 | $ 16.03 | $ 13.84 | $ 27.35 |
Income from Investment Operations | | | | | |
Net investment income (loss) C | .20 | .13 | .14 | .22 | .36 |
Net realized and unrealized gain (loss) | .66 | (1.59) | 2.23 | 2.17 | (11.82) |
Total from investment operations | .86 | (1.46) | 2.37 | 2.39 | (11.46) |
Distributions from net investment income | (.20) | (.17) | (.19) | (.20) | (.27) |
Distributions from net realized gain | - | (.05) | (.03) | - | (1.78) |
Total distributions | (.20) | (.22) | (.22) | (.20) | (2.05) |
Redemption fees added to paid in capital C,G | - | - | - | - | - |
Net asset value, end of period | $ 17.16 | $ 16.50 | $ 18.18 | $ 16.03 | $ 13.84 |
Total Return A,B | 5.32% | (8.17)% | 14.88% | 17.70% | (45.18)% |
Ratios to Average Net Assets D,F | | | | | |
Expenses before reductions | 1.51% | 1.52% | 1.53% | 1.57% | 1.51% |
Expenses net of fee waivers, if any | 1.51% | 1.51% | 1.53% | 1.57% | 1.51% |
Expenses net of all reductions | 1.50% | 1.49% | 1.50% | 1.54% | 1.48% |
Net investment income (loss) | 1.25% | .73% | .86% | 1.58% | 1.67% |
Supplemental Data | | | | | |
Net assets, end of period (in millions) | $ 271 | $ 305 | $ 371 | $ 367 | $ 345 |
Portfolio turnover rate E | 36% | 44% | 53% | 83% | 79% |
A Total returns would have been lower if certain expenses had not been reduced during the applicable periods shown.
B Total returns do not include the effect of the sales charges.
C Calculated based on average shares outstanding during the period.
D Fees and expenses of any underlying Fidelity Central Funds are not included in the Fund's expense ratio. The Fund indirectly bears its proportionate share of the expenses of any underlying Fidelity Central Funds.
E Amount does not include the portfolio activity of any underlying Fidelity Central Funds.
F Expense ratios reflect operating expenses of the class. Expenses before reductions do not reflect amounts reimbursed by the investment adviser or reductions from brokerage service arrangements or reductions from other expense offset arrangements and do not represent the amount paid by the class during periods when reimbursements or reductions occur. Expenses net of fee waivers reflect expenses after reimbursement by the investment adviser but prior to reductions from brokerage service arrangements or other expense offset arrangements. Expenses net of all reductions represent the net expenses paid by the class.
G Amount represents less than $.01 per share.
See accompanying notes which are an integral part of the financial statements.
Annual Report
Financial Highlights - Class B
Years ended October 31, | 2012 | 2011 | 2010 | 2009 | 2008 |
Selected Per-Share Data | | | | | |
Net asset value, beginning of period | $ 15.58 | $ 17.18 | $ 15.16 | $ 13.02 | $ 25.79 |
Income from Investment Operations | | | | | |
Net investment income (loss) C | .10 | .03 | .04 | .13 | .22 |
Net realized and unrealized gain (loss) | .63 | (1.51) | 2.10 | 2.08 | (11.14) |
Total from investment operations | .73 | (1.48) | 2.14 | 2.21 | (10.92) |
Distributions from net investment income | (.06) | (.08) | (.09) | (.07) | (.07) |
Distributions from net realized gain | - | (.05) | (.03) | - | (1.78) |
Total distributions | (.06) | (.12) H | (.12) | (.07) | (1.85) |
Redemption fees added to paid in capital C,G | - | - | - | - | - |
Net asset value, end of period | $ 16.25 | $ 15.58 | $ 17.18 | $ 15.16 | $ 13.02 |
Total Return A,B | 4.72% | (8.67)% | 14.15% | 17.09% | (45.50)% |
Ratios to Average Net Assets D,F | | | | | |
Expenses before reductions | 2.09% | 2.10% | 2.11% | 2.12% | 2.10% |
Expenses net of fee waivers, if any | 2.09% | 2.09% | 2.11% | 2.12% | 2.10% |
Expenses net of all reductions | 2.07% | 2.07% | 2.09% | 2.08% | 2.08% |
Net investment income (loss) | .67% | .15% | .28% | 1.04% | 1.07% |
Supplemental Data | | | | | |
Net assets, end of period (in millions) | $ 3 | $ 4 | $ 7 | $ 8 | $ 10 |
Portfolio turnover rate E | 36% | 44% | 53% | 83% | 79% |
A Total returns would have been lower if certain expenses had not been reduced during the applicable periods shown.
B Total returns do not include the effect of the contingent deferred sales charge.
C Calculated based on average shares outstanding during the period.
D Fees and expenses of any underlying Fidelity Central Funds are not included in the Fund's expense ratio. The Fund indirectly bears its proportionate share of the expenses of any underlying Fidelity Central Funds.
E Amount does not include the portfolio activity of any underlying Fidelity Central Funds.
F Expense ratios reflect operating expenses of the class. Expenses before reductions do not reflect amounts reimbursed by the investment adviser or reductions from brokerage service arrangements or reductions from other expense offset arrangements and do not represent the amount paid by the class during periods when reimbursements or reductions occur. Expenses net of fee waivers reflect expenses after reimbursement by the investment adviser but prior to reductions from brokerage service arrangements or other expense offset arrangements. Expenses net of all reductions represent the net expenses paid by the class.
G Amount represents less than $.01 per share.
H Total distributions of $.12 per share is comprised of distributions from net investment income of $.079 and distributions from net realized gain of $.045 per share.
See accompanying notes which are an integral part of the financial statements.
Annual Report
Financial Highlights - Class C
Years ended October 31, | 2012 | 2011 | 2010 | 2009 | 2008 |
Selected Per-Share Data | | | | | |
Net asset value, beginning of period | $ 15.78 | $ 17.39 | $ 15.36 | $ 13.22 | $ 26.22 |
Income from Investment Operations | | | | | |
Net investment income (loss) C | .11 | .03 | .05 | .14 | .22 |
Net realized and unrealized gain (loss) | .64 | (1.52) | 2.12 | 2.09 | (11.31) |
Total from investment operations | .75 | (1.49) | 2.17 | 2.23 | (11.09) |
Distributions from net investment income | (.10) | (.07) | (.11) | (.09) | (.13) |
Distributions from net realized gain | - | (.05) | (.03) | - | (1.78) |
Total distributions | (.10) | (.12) | (.14) | (.09) | (1.91) |
Redemption fees added to paid in capital C,G | - | - | - | - | - |
Net asset value, end of period | $ 16.43 | $ 15.78 | $ 17.39 | $ 15.36 | $ 13.22 |
Total Return A,B | 4.78% | (8.67)% | 14.17% | 17.06% | (45.50)% |
Ratios to Average Net Assets D,F | | | | | |
Expenses before reductions | 2.09% | 2.09% | 2.10% | 2.11% | 2.09% |
Expenses net of fee waivers, if any | 2.09% | 2.09% | 2.10% | 2.11% | 2.09% |
Expenses net of all reductions | 2.07% | 2.07% | 2.08% | 2.08% | 2.07% |
Net investment income (loss) | .67% | .15% | .29% | 1.05% | 1.08% |
Supplemental Data | | | | | |
Net assets, end of period (in millions) | $ 16 | $ 19 | $ 22 | $ 23 | $ 22 |
Portfolio turnover rate E | 36% | 44% | 53% | 83% | 79% |
A Total returns would have been lower if certain expenses had not been reduced during the applicable periods shown.
B Total returns do not include the effect of the contingent deferred sales charge.
C Calculated based on average shares outstanding during the period.
D Fees and expenses of any underlying Fidelity Central Funds are not included in the Fund's expense ratio. The Fund indirectly bears its proportionate share of the expenses of any underlying Fidelity Central Funds.
E Amount does not include the portfolio activity of any underlying Fidelity Central Funds.
F Expense ratios reflect operating expenses of the class. Expenses before reductions do not reflect amounts reimbursed by the investment adviser or reductions from brokerage service arrangements or reductions from other expense offset arrangements and do not represent the amount paid by the class during periods when reimbursements or reductions occur. Expenses net of fee waivers reflect expenses after reimbursement by the investment adviser but prior to reductions from brokerage service arrangements or other expense offset arrangements. Expenses net of all reductions represent the net expenses paid by the class.
G Amount represents less than $.01 per share.
See accompanying notes which are an integral part of the financial statements.
Annual Report
Financial Highlights - Institutional Class
Years ended October 31, | 2012 | 2011 | 2010 | 2009 | 2008 |
Selected Per-Share Data | | | | | |
Net asset value, beginning of period | $ 16.45 | $ 18.10 | $ 15.95 | $ 13.83 | $ 27.35 |
Income from Investment Operations | | | | | |
Net investment income (loss) B | .29 | .23 | .22 | .29 | .45 |
Net realized and unrealized gain (loss) | .65 | (1.59) | 2.23 | 2.14 | (11.78) |
Total from investment operations | .94 | (1.36) | 2.45 | 2.43 | (11.33) |
Distributions from net investment income | (.28) | (.24) | (.27) | (.31) | (.41) |
Distributions from net realized gain | - | (.05) | (.03) | - | (1.78) |
Total distributions | (.28) | (.29) | (.30) | (.31) | (2.19) |
Redemption fees added to paid in capital B,F | - | - | - | - | - |
Net asset value, end of period | $ 17.11 | $ 16.45 | $ 18.10 | $ 15.95 | $ 13.83 |
Total Return A | 5.91% | (7.70)% | 15.49% | 18.32% | (44.92)% |
Ratios to Average Net Assets C,E | | | | | |
Expenses before reductions | .99% | 1.00% | 1.01% | 1.06% | 1.01% |
Expenses net of fee waivers, if any | .99% | .99% | 1.01% | 1.06% | 1.01% |
Expenses net of all reductions | .97% | .97% | .98% | 1.02% | .98% |
Net investment income (loss) | 1.77% | 1.25% | 1.39% | 2.10% | 2.17% |
Supplemental Data | | | | | |
Net assets, end of period (in millions) | $ 257 | $ 349 | $ 678 | $ 727 | $ 551 |
Portfolio turnover rate D | 36% | 44% | 53% | 83% | 79% |
A Total returns would have been lower if certain expenses had not been reduced during the applicable periods shown.
B Calculated based on average shares outstanding during the period.
C Fees and expenses of any underlying Fidelity Central Funds are not included in the Fund's expense ratio. The Fund indirectly bears its proportionate share of the expenses of any underlying Fidelity Central Funds.
D Amount does not include the portfolio activity of any underlying Fidelity Central Funds.
E Expense ratios reflect operating expenses of the class. Expenses before reductions do not reflect amounts reimbursed by the investment adviser or reductions from brokerage service arrangements or reductions from other expense offset arrangements and do not represent the amount paid by the class during periods when reimbursements or reductions occur. Expenses net of fee waivers reflect expenses after reimbursement by the investment adviser but prior to reductions from brokerage service arrangements or other expense offset arrangements. Expenses net of all reductions represent the net expenses paid by the class.
F Amount represents less than $.01 per share.
See accompanying notes which are an integral part of the financial statements.
Annual Report
Notes to Financial Statements
For the period ended October 31, 2012
(Amounts in thousands except percentages)
1. Organization.
Fidelity Advisor Overseas Fund (the Fund) is a fund of Fidelity Advisor Series VIII (the Trust) and is authorized to issue an unlimited number of shares. The Trust is registered under the Investment Company Act of 1940, as amended (the 1940 Act), as an open-end management investment company organized as a Massachusetts business trust. The Fund offers Class A, Class T, Class C, and Institutional Class shares, each of which, along with Class B shares, has equal rights as to assets and voting privileges. Effective after the close of business on September 1, 2010, Class B shares were closed to new accounts and additional purchases, except for exchanges and reinvestments. Each class has exclusive voting rights with respect to matters that affect that class. Class B shares will automatically convert to Class A shares after a holding period of seven years from the initial date of purchase. Investment income, realized and unrealized capital gains and losses, the common expenses of the Fund, and certain fund-level expense reductions, if any, are allocated on a pro-rata basis to each class based on the relative net assets of each class to the total net assets of the Fund. Each class differs with respect to transfer agent and distribution and service plan fees incurred. Certain expense reductions may also differ by class.
2. Investments in Fidelity Central Funds.
The Fund invests in Fidelity Central Funds, which are open-end investment companies available only to other investment companies and accounts managed by Fidelity Management & Research Company (FMR) and its affiliates. The Fund's Schedule of Investments lists each of the Fidelity Central Funds held as of period end, if any, as an investment of the Fund, but does not include the underlying holdings of each Fidelity Central Fund. As an Investing Fund, the Fund indirectly bears its proportionate share of the expenses of the underlying Fidelity Central Funds.
The Money Market Central Funds seek preservation of capital and current income and are managed by Fidelity Investments Money Management, Inc. (FIMM), an affiliate of FMR.
A complete unaudited list of holdings for each Fidelity Central Fund is available upon request or at the Securities and Exchange Commission (the SEC) web site at www.sec.gov. In addition, the financial statements of the Fidelity Central Funds, which are not covered by the Fund's Report of Independent Registered Public Accounting Firm, are available on the SEC web site or upon request.
3. Significant Accounting Policies.
The financial statements have been prepared in conformity with accounting principles generally accepted in the United States of America (GAAP), which require management to make certain estimates and assumptions at the date of the financial statements.
Annual Report
Notes to Financial Statements - continued
(Amounts in thousands except percentages)
3. Significant Accounting Policies - continued
Actual results could differ from those estimates. Subsequent events, if any, through the date that the financial statements were issued have been evaluated in the preparation of the financial statements. The following summarizes the significant accounting policies of the Fund:
Security Valuation. Investments are valued as of 4:00 p.m. Eastern time on the last calendar day of the period. In accordance with valuation policies and procedures approved by the Board of Trustees (the Board), the Fund attempts to obtain prices from one or more third party pricing vendors or brokers to value its investments. When current market prices, quotations or rates are not readily available or reliable, securities will be fair valued in good faith by the FMR Fair Value Committee (the Committee), in accordance with procedures adopted by the Fund's Board. Factors used in determining fair value vary by security type and may include market or security specific events. The frequency with which these procedures are used cannot be predicted and they may be utilized to a significant extent. The Committee oversees the Fund's valuation policies and procedures and is responsible for approving and reporting to the Board all fair value determinations.
The Fund categorizes the inputs to valuation techniques used to value its investments into a disclosure hierarchy consisting of three levels as shown below:
Level 1 - quoted prices in active markets for identical investments
Level 2 - other significant observable inputs (including quoted prices for similar investments, interest rates, prepayment speeds, etc.)
Level 3 - unobservable inputs (including the Fund's own assumptions based on the best information available)
Valuation techniques used to value the Fund's investments by major category are as follows:
Equity securities, including restricted securities, for which market quotations are readily available, are valued at the last reported sale price or official closing price as reported by a third party pricing vendor on the primary market or exchange on which they are traded and are categorized as Level 1 in the hierarchy. In the event there were no sales during the day or closing prices are not available, securities are valued at the last quoted bid price or may be valued using the last available price and are generally categorized as Level 2 in the hierarchy. For foreign equity securities, when significant market or security specific events arise, comparisons to the valuation of American Depositary Receipts (ADRs), futures contracts, Exchange-Traded Funds (ETFs) and certain indexes as well as quoted prices for similar securities are used and are categorized as Level 2 in the hierarchy. Utilizing these techniques may result in transfers between Level 1 and Level 2.
Annual Report
3. Significant Accounting Policies - continued
Security Valuation - continued
Investments in open-end mutual funds, including the Fidelity Central Funds, are valued at their closing net asset value (NAV) each business day and are categorized as Level 1 in the hierarchy.
Changes in valuation techniques may result in transfers in or out of an assigned level within the disclosure hierarchy. The aggregate value of investments by input level, as of October 31, 2012, including information on transfers between Levels 1 and 2, is included at the end of the Fund's Schedule of Investments.
Foreign Currency Translation. The Fund may use foreign currency contracts to facilitate transactions in foreign-denominated securities. Gains and losses from these transactions may arise from changes in the value of the foreign currency or if the counterparties do not perform under the contracts' terms.
Foreign-denominated assets, including investment securities, and liabilities are translated into U.S. dollars at the exchange rates at period end. Purchases and sales of investment securities, income and dividends received and expenses denominated in foreign currencies are translated into U.S. dollars at the exchange rate in effect on the transaction date.
The effects of exchange rate fluctuations on investments are included with the net realized and unrealized gain (loss) on investment securities. Other foreign currency transactions resulting in realized and unrealized gain (loss) are disclosed separately.
Investment Transactions and Income. For financial reporting purposes, the Fund's investment holdings and NAV include trades executed through the end of the last business day of the period. The NAV per share for processing shareholder transactions is calculated as of the close of business of the New York Stock Exchange (NYSE), normally 4:00 p.m. Eastern time and includes trades executed through the end of the prior business day. Gains and losses on securities sold are determined on the basis of identified cost and may include proceeds received from litigation. Dividend income is recorded on the ex-dividend date, except for certain dividends from foreign securities where the ex-dividend date may have passed, which are recorded as soon as the Fund is informed of the ex-dividend date. Non-cash dividends included in dividend income, if any, are recorded at the fair market value of the securities received. Interest income and distributions from the Fidelity Central Funds are accrued as earned. Investment income is recorded net of foreign taxes withheld where recovery of such taxes is uncertain.
Annual Report
Notes to Financial Statements - continued
(Amounts in thousands except percentages)
3. Significant Accounting Policies - continued
Expenses. Expenses directly attributable to a fund are charged to that fund. Expenses attributable to more than one fund are allocated among the respective funds on the basis of relative net assets or other appropriate methods. Expense estimates are accrued in the period to which they relate and adjustments are made when actual amounts are known.
Income Tax Information and Distributions to Shareholders. Each year, the Fund intends to qualify as a regulated investment company under Subchapter M of the Internal Revenue Code, including distributing substantially all of its taxable income and realized gains. As a result, no provision for income taxes is required. As of October 31, 2012, the Fund did not have any unrecognized tax benefits in the financial statements; nor is the Fund aware of any tax positions for which it is reasonably possible that the total amounts of unrecognized tax benefits will significantly change in the next twelve months. The Fund files a U.S. federal tax return, in addition to state and local tax returns as required. A fund's federal income tax returns are subject to examination by the Internal Revenue Service (IRS) for a period of three fiscal years after they are filed. State and local tax returns may be subject to examination for an additional fiscal year depending on the jurisdiction. Foreign taxes are provided for based on the Fund's understanding of the tax rules and rates that exist in the foreign markets in which it invests.
Distributions are declared and recorded on the ex-dividend date. Income dividends and capital gain distributions are declared separately for each class. Income and capital gain distributions are determined in accordance with income tax regulations, which may differ from GAAP.
Capital accounts within the financial statements are adjusted for permanent book-tax differences. These adjustments have no impact on net assets or the results of operations. Temporary book-tax differences will reverse in a subsequent period.
Book-tax differences are primarily due to foreign currency transactions, passive foreign investment companies (PFIC), deferred trustees compensation, capital loss carryforwards and losses deferred due to wash sales.
The federal tax cost of investment securities and unrealized appreciation (depreciation) as of period end were as follows:
Gross unrealized appreciation | $ 82,781 |
Gross unrealized depreciation | (75,413) |
Net unrealized appreciation (depreciation) on securities and other investments | $ 7,368 |
| |
Tax Cost | $ 607,282 |
Annual Report
3. Significant Accounting Policies - continued
Income Tax Information and Distributions to Shareholders - continued
The tax-based components of distributable earnings as of period end were as follows:
Undistributed ordinary income | $ 10,074 |
Capital loss carryforward | $ (132,619) |
Net unrealized appreciation (depreciation) | $ 7,317 |
Capital loss carryforwards are only available to offset future capital gains of the Fund to the extent provided by regulations and may be limited. Under the Regulated Investment Company Modernization Act of 2010 (the Act), the Fund is permitted to carry forward capital losses incurred in taxable years beginning after December 22, 2010 for an unlimited period and such capital losses are required to be used prior to any losses that expire. Capital loss carryforwards were as follows:
Fiscal year of expiration | |
| |
2017 | $ (104,924) |
No expiration | |
Short-term | (11,858) |
Long-term | (15,837) |
Total no expiration | (27,695) |
Total capital loss carryforward | $ (132,619) |
The tax character of distributions paid was as follows:
| October 31, 2012 | October 31, 2011 |
Ordinary Income | $ 10,172 | $ 15,738 |
Short-Term Trading (Redemption) Fees. Shares held by investors in the Fund less than 30 days are subject to a redemption fee equal to 1.00% of the net asset value of shares redeemed. All redemption fees, which reduce the proceeds of the shareholder redemption, are retained by the Fund and accounted for as an addition to paid in capital.
Restricted Securities. The Fund may invest in securities that are subject to legal or contractual restrictions on resale. These securities generally may be resold in transactions exempt from registration or to the public if the securities are registered. Disposal of these securities may involve time-consuming negotiations and expense, and prompt sale at an acceptable price may be difficult. Information regarding restricted securities is included at the end of the Fund's Schedule of Investments.
Annual Report
Notes to Financial Statements - continued
(Amounts in thousands except percentages)
3. Significant Accounting Policies - continued
New Accounting Pronouncement. In December 2011, the Financial Accounting Standards Board issued Accounting Standard Update No. 2011-11, Disclosures about Offsetting Assets and Liabilities. The update creates new disclosure requirements requiring entities to disclose both gross and net information for derivatives and other financial instruments that are either offset in the Statement of Assets and Liabilities or subject to an enforceable master netting arrangement or similar agreement. The disclosure requirements are effective for annual reporting periods beginning on or after January 1, 2013, and interim periods within those annual periods. Management is currently evaluating the impact of the update's adoption on the Fund's financial statement disclosures.
4. Purchases and Sales of Investments.
Purchases and sales of securities, other than short-term securities, aggregated $224,677 and $365,737, respectively.
5. Fees and Other Transactions with Affiliates.
Management Fee. FMR and its affiliates provide the Fund with investment management related services for which the Fund pays a monthly management fee. The management fee is the sum of an individual fund fee rate that is based on an annual rate of .45% of the Fund's average net assets and an annualized group fee rate that averaged .26% during the period. The group fee rate is based upon the average net assets of all the mutual funds advised by FMR. The group fee rate decreases as assets under management increase and increases as assets under management decrease. In addition, the management fee is subject to a performance adjustment (up to a maximum of ± .20% of the Fund's average net assets over a 36 month performance period). The upward or downward adjustment to the management fee is based on the investment performance of the asset-weighted return of all classes as compared to an appropriate benchmark index. For the period, the total annual management fee rate, including the performance adjustment, was .69% of the Fund's average net assets.
Distribution and Service Plan Fees. In accordance with Rule 12b-1 of the 1940 Act, the Fund has adopted separate Distribution and Service Plans for each class of shares. Certain classes pay Fidelity Distributors Corporation (FDC), an affiliate of FMR, separate Distribution and Service Fees, each of which is based on an annual percentage of each class' average net assets. In addition, FDC may pay financial intermediaries for selling shares of the Fund and providing shareholder support services. For the period, the Distribution and Service Fee rates, total fees and amounts retained by FDC were as follows:
Annual Report
5. Fees and Other Transactions with Affiliates - continued
Distribution and Service Plan Fees - continued
| Distribution
Fee | Service
Fee | Total Fees | Retained
by FDC |
Class A | -% | .25% | $ 148 | $ 3 |
Class T | .25% | .25% | 1,400 | 15 |
Class B | .75% | .25% | 35 | 26 |
Class C | .75% | .25% | 168 | 10 |
| | | $ 1,751 | $ 54 |
Sales Load. FDC may receive a front-end sales charge of up to 5.75% for selling Class A shares and 3.50% for selling Class T shares, some of which is paid to financial intermediaries for selling shares of the Fund. Depending on the holding period, FDC may receive contingent deferred sales charges levied on Class A, Class T, Class B, and Class C redemptions. The deferred sales charges range from 5.00% to 1.00% for Class B shares, 1.00% for Class C shares, 1.00% for certain purchases of Class A shares and .25% for certain purchases of Class T shares.
For the period, sales charge amounts retained by FDC were as follows:
| Retained
by FDC |
Class A | $ 4 |
Class T | 3 |
Class B* | 5 |
Class C* | 1 |
| $ 13 |
* When Class B and Class C shares are initially sold, FDC pays commissions from its own resources to financial intermediaries through which the sales are made.
Transfer Agent Fees. Fidelity Investments Institutional Operations Company, Inc. (FIIOC), an affiliate of FMR, is the transfer, dividend disbursing and shareholder servicing agent for each class of the Fund. FIIOC receives account fees and asset-based fees that vary according to the account size and type of account of the shareholders of the respective classes of the Fund. FIIOC pays for typesetting, printing and mailing of shareholder reports, except proxy statements. For the period, transfer agent fees for each class were as follows:
Annual Report
Notes to Financial Statements - continued
(Amounts in thousands except percentages)
5. Fees and Other Transactions with Affiliates - continued
Transfer Agent Fees - continued
| Amount | % of
Average
Net Assets |
Class A | $ 178 | .30 |
Class T | 641 | .23 |
Class B | 10 | .30 |
Class C | 51 | .30 |
Institutional Class | 556 | .21 |
| $ 1,436 | |
Accounting and Security Lending Fees. Fidelity Service Company, Inc. (FSC), an affiliate of FMR, maintains the Fund's accounting records. The accounting fee is based on the level of average net assets for each month. Under a separate contract, FSC administers the security lending program. The security lending fee is based on the number and duration of lending transactions.
Brokerage Commissions. The Fund placed a portion of its portfolio transactions with brokerage firms which are affiliates of the investment adviser. The commissions paid to these affiliated firms were four hundred ninety dollars for the period.
Interfund Lending Program. Pursuant to an Exemptive Order issued by the SEC, the Fund, along with other registered investment companies having management contracts with FMR, may participate in an interfund lending program. This program provides an alternative credit facility allowing the funds to borrow from, or lend money to, other participating affiliated funds. At period end, there were no interfund loans outstanding. The Fund's activity in this program during the period for which loans were outstanding was as follows:
Borrower or Lender | Average Loan
Balance | Weighted Average Interest Rate | Interest Expense |
Borrower | $ 9,917 | .32% | $ -* |
* Amount represents one hundred seventy-eight dollars.
6. Committed Line of Credit.
The Fund participates with other funds managed by FMR or an affiliate in a $4.25 billion credit facility (the "line of credit") to be utilized for temporary or emergency purposes to fund shareholder redemptions or for other short-term liquidity purposes. The Fund has agreed to pay commitment fees on its pro-rata portion of the line of credit, which amounted to $2 and is reflected in Miscellaneous expenses on the Statement of Operations. During the period, there were no borrowings on this line of credit.
Annual Report
7. Security Lending.
The Fund lends portfolio securities through a lending agent from time to time in order to earn additional income. For equity securities, a lending agent is used and may loan securities to certain qualified borrowers, including Fidelity Capital Markets (FCM), a broker-dealer affiliated with the Fund. On the settlement date of the loan, the Fund receives collateral (in the form of U.S. Treasury obligations, letters of credit and/or cash) against the loaned securities and maintains collateral in an amount not less than 100% of the market value of the loaned securities during the period of the loan. The market value of the loaned securities is determined at the close of business of the Fund and any additional required collateral is delivered to the Fund on the next business day. If the borrower defaults on its obligation to return the securities loaned because of insolvency or other reasons, a fund could experience delays and costs in recovering the securities loaned or in gaining access to the collateral. Any cash collateral received is invested in the Fidelity Securities Lending Cash Central Fund. The value of loaned securities and cash collateral at period end are disclosed on the Fund's Statement of Assets and Liabilities. Security lending income represents the income earned on investing cash collateral, less rebates paid to borrowers and any lending agent fees associated with the loan, plus any premium payments received for lending certain types of securities. Security lending income is presented in the Statement of Operations as a component of income from Fidelity Central Funds. Total security lending income during the period amounted to $447. During the period, there were no securities loaned to FCM.
8. Expense Reductions.
Many of the brokers with whom FMR places trades on behalf of the Fund provided services to the Fund in addition to trade execution. These services included payments of certain expenses on behalf of the Fund totaling $105 for the period.
9. Distributions to Shareholders.
Distributions to shareholders of each class were as follows:
Years ended October 31, | 2012 | 2011 |
From net investment income | | |
Class A | $ 862 | $ 829 |
Class T | 3,589 | 3,501 |
Class B | 16 | 30 |
Class C | 112 | 89 |
Institutional Class | 5,593 | 8,533 |
Total | $ 10,172 | $ 12,982 |
Annual Report
Notes to Financial Statements - continued
(Amounts in thousands except percentages)
9. Distributions to Shareholders - continued
Years ended October 31, | 2012 | 2011 |
From net realized gain | | |
Class A | $ - | $ 178 |
Class T | - | 911 |
Class B | - | 17 |
Class C | - | 57 |
Institutional Class | - | 1,593 |
Total | $ - | $ 2,756 |
10. Share Transactions.
Transactions for each class of shares were as follows:
| Shares | Dollars |
Years ended October 31, | 2012 | 2011 | 2012 | 2011 |
Class A | | | | |
Shares sold | 700 | 644 | $ 11,104 | $ 11,749 |
Reinvestment of distributions | 52 | 51 | 791 | 919 |
Shares redeemed | (848) | (937) | (13,551) | (16,834) |
Net increase (decrease) | (96) | (242) | $ (1,656) | $ (4,166) |
Class T | | | | |
Shares sold | 2,695 | 3,310 | $ 44,183 | $ 61,021 |
Reinvestment of distributions | 223 | 232 | 3,491 | 4,288 |
Shares redeemed | (5,589) | (5,489) | (91,072) | (101,187) |
Net increase (decrease) | (2,671) | (1,947) | $ (43,398) | $ (35,878) |
Class B | | | | |
Shares sold | 2 | 12 | $ 26 | $ 219 |
Reinvestment of distributions | 1 | 2 | 14 | 41 |
Shares redeemed | (84) | (144) | (1,311) | (2,540) |
Net increase (decrease) | (81) | (130) | $ (1,271) | $ (2,280) |
Class C | | | | |
Shares sold | 103 | 165 | $ 1,613 | $ 2,956 |
Reinvestment of distributions | 6 | 7 | 94 | 125 |
Shares redeemed | (317) | (271) | (4,983) | (4,750) |
Net increase (decrease) | (208) | (99) | $ (3,276) | $ (1,669) |
Institutional Class | | | | |
Shares sold | 2,281 | 2,965 | $ 36,498 | $ 53,805 |
Reinvestment of distributions | 353 | 544 | 5,475 | 9,988 |
Shares redeemed | (8,781) | (19,770) | (140,625) | (362,619) |
Net increase (decrease) | (6,147) | (16,261) | $ (98,652) | $ (298,826) |
Annual Report
11. Other.
The Fund's organizational documents provide former and current trustees and officers with a limited indemnification against liabilities arising in connection with the performance of their duties to the Fund. In the normal course of business, the Fund may also enter into contracts that provide general indemnifications. The Fund's maximum exposure under these arrangements is unknown as this would be dependent on future claims that may be made against the Fund. The risk of material loss from such claims is considered remote.
At the end of the period, Strategic Advisers International II Fund was the owner of record of 14% of the total outstanding shares of the Fund.
Annual Report
To the Trustees of Fidelity Advisor Series VIII and the Shareholders of Fidelity Advisor Overseas Fund:
In our opinion, the accompanying statement of assets and liabilities, including the schedule of investments, and the related statements of operations and of changes in net assets and the financial highlights present fairly, in all material respects, the financial position of Fidelity Advisor Overseas Fund (a fund of Fidelity Advisor Series VIII) at October 31, 2012, the results of its operations for the year then ended, the changes in its net assets for each of the two years in the period then ended and the financial highlights for each of the five years in the period then ended, in conformity with accounting principles generally accepted in the United States of America. These financial statements and financial highlights (hereafter referred to as "financial statements") are the responsibility of the Fidelity Advisor Overseas Fund's management. Our responsibility is to express an opinion on these financial statements based on our audits. We conducted our audits of these financial statements in accordance with the standards of the Public Company Accounting Oversight Board (United States). Those standards require that we plan and perform the audit to obtain reasonable assurance about whether the financial statements are free of material misstatement. An audit includes examining, on a test basis, evidence supporting the amounts and disclosures in the financial statements, assessing the accounting principles used and significant estimates made by management, and evaluating the overall financial statement presentation. We believe that our audits, which included confirmation of securities at October 31, 2012 by correspondence with the custodian and brokers, provide a reasonable basis for our opinion.
PricewaterhouseCoopers LLP
Boston, Massachusetts
December 14, 2012
Annual Report
The Trustees, Members of the Advisory Board, and executive officers of the trust and fund, as applicable, are listed below. The Board of Trustees governs the fund and is responsible for protecting the interests of shareholders. The Trustees are experienced executives who meet periodically throughout the year to oversee the fund's activities, review contractual arrangements with companies that provide services to the fund, oversee management of the risks associated with such activities and contractual arrangements, and review the fund's performance. Except for James C. Curvey, each of the Trustees oversees 236 funds advised by FMR or an affiliate. Mr. Curvey oversees 443 funds advised by FMR or an affiliate.
The Trustees hold office without limit in time except that (a) any Trustee may resign; (b) any Trustee may be removed by written instrument, signed by at least two-thirds of the number of Trustees prior to such removal; (c) any Trustee who requests to be retired or who has become incapacitated by illness or injury may be retired by written instrument signed by a majority of the other Trustees; and (d) any Trustee may be removed at any special meeting of shareholders by a two-thirds vote of the outstanding voting securities of the trust. Each Trustee who is not an interested person (as defined in the 1940 Act) (Independent Trustee), shall retire not later than the last day of the calendar year in which his or her 75th birthday occurs. The Independent Trustees may waive this mandatory retirement age policy with respect to individual Trustees. The executive officers and Advisory Board Members hold office without limit in time, except that any officer and Advisory Board Member may resign or may be removed by a vote of a majority of the Trustees at any regular meeting or any special meeting of the Trustees. Except as indicated, each individual has held the office shown or other offices in the same company for the past five years.
Experience, Skills, Attributes, and Qualifications of the Fund's Trustees. The Governance and Nominating Committee has adopted a statement of policy that describes the experience, qualifications, attributes, and skills that are necessary and desirable for potential Independent Trustee candidates (Statement of Policy). The Board believes that each Trustee satisfied at the time he or she was initially elected or appointed a Trustee, and continues to satisfy, the standards contemplated by the Statement of Policy. The Governance and Nominating Committee also engages professional search firms to help identify potential Independent Trustee candidates who have the experience, qualifications, attributes, and skills consistent with the Statement of Policy. From time to time, additional criteria based on the composition and skills of the current Independent Trustees, as well as experience or skills that may be appropriate in light of future changes to board composition, business conditions, and regulatory or other developments, have also been considered by the professional search firms and the Governance and Nominating Committee. In addition, the Board takes into account the Trustees' commitment and participation in Board and committee meetings, as well as their leadership of standing and ad hoc committees throughout their tenure.
In determining that a particular Trustee was and continues to be qualified to serve as a Trustee, the Board has considered a variety of criteria, none of which, in isolation, was controlling. The Board believes that, collectively, the Trustees have balanced and diverse experience, qualifications, attributes, and skills, which allow the Board to operate effectively in governing the fund and protecting the interests of shareholders. Information about the specific experience, skills, attributes, and qualifications of each Trustee, which in each case led to the Board's conclusion that the Trustee should serve (or continue to serve) as a trustee of the fund, is provided below.
Annual Report
Trustees and Officers - continued
Board Structure and Oversight Function. James C. Curvey is an interested person (as defined in the 1940 Act) and currently serves as Chairman. The Trustees have determined that an interested Chairman is appropriate and benefits shareholders because an interested Chairman has a personal and professional stake in the quality and continuity of services provided to the fund. Independent Trustees exercise their informed business judgment to appoint an individual of their choosing to serve as Chairman, regardless of whether the Trustee happens to be independent or a member of management. The Independent Trustees have determined that they can act independently and effectively without having an Independent Trustee serve as Chairman and that a key structural component for assuring that they are in a position to do so is for the Independent Trustees to constitute a substantial majority for the Board. The Independent Trustees also regularly meet in executive session. Ned C. Lautenbach serves as Chairman of the Independent Trustees and as such (i) acts as a liaison between the Independent Trustees and management with respect to matters important to the Independent Trustees and (ii) with management prepares agendas for Board meetings.
Fidelity funds are overseen by different Boards of Trustees. The fund's Board oversees Fidelity's equity and high income funds and another Board oversees Fidelity's investment-grade bond, money market, and asset allocation funds. The asset allocation funds may invest in Fidelity funds overseen by the fund's Board. The use of separate Boards, each with its own committee structure, allows the Trustees of each group of Fidelity funds to focus on the unique issues of the funds they oversee, including common research, investment, and operational issues. On occasion, the separate Boards establish joint committees to address issues of overlapping consequences for the Fidelity funds overseen by each Board.
The Trustees operate using a system of committees to facilitate the timely and efficient consideration of all matters of importance to the Trustees, the fund, and fund shareholders and to facilitate compliance with legal and regulatory requirements and oversight of the fund's activities and associated risks. The Board, acting through its committees, has charged FMR and its affiliates with (i) identifying events or circumstances the occurrence of which could have demonstrably adverse effects on the fund's business and/or reputation; (ii) implementing processes and controls to lessen the possibility that such events or circumstances occur or to mitigate the effects of such events or circumstances if they do occur; and (iii) creating and maintaining a system designed to evaluate continuously business and market conditions in order to facilitate the identification and implementation processes described in (i) and (ii) above. Because the day-to-day operations and activities of the fund are carried out by or through FMR, its affiliates and other service providers, the fund's exposure to risks is mitigated but not eliminated by the processes overseen by the Trustees. While each of the Board's committees has responsibility for overseeing different aspects of the fund's activities, oversight is exercised primarily through the Operations, Audit, and Compliance Committees. In addition, the Independent Trustees have worked with FMR to enhance the Board's oversight of investment and financial risks, legal and regulatory risks, technology risks, and operational risks, including the development of additional risk reporting to the Board. For example, a working group comprised of Independent Trustees and FMR has worked and continues to work to review the Fidelity funds' valuation-related activities, reporting and risk management. Appropriate personnel, including but not limited to the fund's Chief Compliance Officer (CCO), FMR's internal auditor, the independent accountants, the fund's Treasurer and portfolio management personnel, make periodic reports to the Board's committees, as appropriate, including an annual review of FMR's risk management program for the Fidelity funds. The responsibilities of each standing committee, including their oversight responsibilities, are described further under "Standing Committees of the Fund's Trustees."
Annual Report
The fund's Statement of Additional Information (SAI) includes more information about the Trustees. To request a free copy, call Fidelity at 1-877-208-0098.
Interested Trustees*:
Correspondence intended for each Trustee who is an interested person may be sent to Fidelity Investments, 82 Devonshire Street, Boston, Massachusetts 02109.
Name, Age; Principal Occupations and Other Relevant Experience+ |
James C. Curvey (77) |
| Year of Election or Appointment: 2007 Mr. Curvey is Trustee and Chairman of the Board of Trustees of certain Trusts. Mr. Curvey also serves as Trustee (2007-present) of other investment companies advised by FMR. Mr. Curvey is a Director of Fidelity Investments Money Management, Inc. (2009-present), Director of Fidelity Research & Analysis Co. (2009-present) and Director of FMR and FMR Co., Inc. (2007-present). Mr. Curvey is also Vice Chairman (2007-present) and Director of FMR LLC. In addition, Mr. Curvey serves as an Overseer for the Boston Symphony Orchestra and a member of the Trustees of Villanova University. Previously, Mr. Curvey was the Vice Chairman (2006-2007) and Director (2000-2007) of FMR Corp. |
Ronald P. O'Hanley (55) |
| Year of Election or Appointment: 2011 Mr. O'Hanley is Director of FMR Co., Inc. (2010-present), Director of Fidelity Investments Money Management, Inc. (2010-present), Director of Fidelity Research & Analysis Company (2010-present), President of Fidelity Asset Management and Corporate Services and a member of Fidelity's Executive Committee (2010-present). Previously, Mr. O'Hanley served as President and Chief Executive Officer of BNY Mellon Asset Management (2007-2010). Mr. O'Hanley also served as Vice Chairman of Bank New York Mellon Corp. and a member of that firm's Executive Committee. Prior to the 2007 merger of The Bank of New York and Mellon Financial Corporation, he was Vice Chairman of Mellon Financial Corporation and President and Chief Executive Officer of Mellon Asset Management. He joined Mellon in February 1997. Mr. O'Hanley currently serves as Chairman of the Boston Public Library Foundation Board of Directors and sits on the Board of Directors of Beth Israel Deaconess Medical Center, the Board of Trustees of the Marine Biological Laboratory and the Advisory Board of the Maxwell School of Citizenship and Public Administration at Syracuse University. Mr. O'Hanley also chairs the Council on Asset Management for the Financial Services Roundtable and is a member of the Board of Directors of Institutional Investor's U.S. Institute. |
* Trustees have been determined to be "Interested Trustees" by virtue of, among other things, their affiliation with the trust or various entities under common control with FMR.
+ The information above includes each Trustee's principal occupation during the last five years and other information relating to the experience, attributes, and skills relevant to each Trustee's qualifications to serve as a Trustee, which led to the conclusion that each Trustee should serve as a Trustee for the fund.
Annual Report
Independent Trustees:
Correspondence intended for each Independent Trustee (that is, the Trustees other than the Interested Trustees) may be sent to Fidelity Investments, P.O. Box 55235, Boston, Massachusetts 02205-5235.
Name, Age; Principal Occupations and Other Relevant Experience+ |
Dennis J. Dirks (64) |
| Year of Election or Appointment: 2005 Prior to his retirement in May 2003, Mr. Dirks was Chief Operating Officer and a member of the Board of The Depository Trust & Clearing Corporation (DTCC). He also served as President, Chief Operating Officer, and Board member of The Depository Trust Company (DTC) and President and Board member of the National Securities Clearing Corporation (NSCC). In addition, Mr. Dirks served as Chief Executive Officer and Board member of the Government Securities Clearing Corporation, Chief Executive Officer and Board member of the Mortgage-Backed Securities Clearing Corporation, as a Trustee and a member of the Finance Committee of Manhattan College (2005-2008), and as a Trustee and a member of the Finance Committee of AHRC of Nassau County (2006-2008). Mr. Dirks is a member of the Independent Directors Council (IDC) Governing Council (2010-present) and Board of Directors for The Brookville Center for Children's Services, Inc. (2009-present). |
Alan J. Lacy (59) |
| Year of Election or Appointment: 2008 Mr. Lacy serves as Senior Adviser (2007-present) of Oak Hill Capital Partners, L.P. (private equity). Mr. Lacy also served as Chief Executive Officer (2000-2005) and Vice Chairman (2005-2006) of Sears Holdings Corporation and Sears, Roebuck and Co. (retail). In addition, Mr. Lacy serves as a member of the Board of Directors of Dave & Buster's Entertainment, Inc. (restaurant and entertainment complexes, 2010-present), Earth Fare, Inc. (retail grocery, 2012-present), The Hillman Companies, Inc. (hardware wholesalers, 2010-present), and Bristol-Myers Squibb Company (global pharmaceuticals, 2008-present). Mr. Lacy is a member of the Board of Trustees of The National Parks Conservation Association (2006-present). Previously, Mr. Lacy served as Chairman of the Board of Trustees of the National Parks Conservation Association (2008-2011) and as a member of the Board of Directors for the Western Union Company (global money transfer, 2006-2011). |
Ned C. Lautenbach (68) |
| Year of Election or Appointment: 2000 Mr. Lautenbach is Chairman of the Independent Trustees of the Equity and High Income Funds (2006-present). Mr. Lautenbach currently serves as the Lead Director of the Eaton Corporation Board of Directors (diversified industrial, 1997-present). Mr. Lautenbach is Chairman of the Board of Directors of the Philharmonic Center for the Arts in Naples, Florida (2012-present) and a member of the Council on Foreign Relations (1994-present). Previously, Mr. Lautenbach was a Partner/Advisory Partner at Clayton, Dubilier & Rice, LLC (private equity investment, 1998-2010), as well as a Director of Sony Corporation (2006-2007). |
Joseph Mauriello (68) |
| Year of Election or Appointment: 2008 Prior to his retirement in January 2006, Mr. Mauriello served in numerous senior management positions including Deputy Chairman and Chief Operating Officer (2004-2005), and Vice Chairman of Financial Services (2002-2004) of KPMG LLP US (professional services, 1965-2005). Mr. Mauriello currently serves as a member of the Board of Directors of XL Group plc. (global insurance and re-insurance, 2006-present). Previously, Mr. Mauriello served as a Director of the Hamilton Funds of the Bank of New York (2006-2007) and of Arcadia Resources Inc. (health care services and products, 2007-2012). |
Robert W. Selander (62) |
| Year of Election or Appointment: 2011 Previously, Mr. Selander served as a Member of the Advisory Board of Fidelity's Equity and High Income Funds (2011), Executive Vice Chairman (2010), Chief Executive Officer (2009-2010), and President and Chief Executive Officer (1997-2009) of Mastercard, Inc. |
Cornelia M. Small (68) |
| Year of Election or Appointment: 2005 Ms. Small is a member of the Board of Directors (2009-present) and Chair of the Investment Committee (2010-present) of the Teagle Foundation. Ms. Small also serves on the Investment Committee of the Berkshire Taconic Community Foundation (2008-present). Previously, Ms. Small served as Chairperson (2002-2008) and a member of the Investment Committee and Chairperson (2008-2012) and a member of the Board of Trustees of Smith College. In addition, Ms. Small served as Chief Investment Officer, Director of Global Equity Investments, and a member of the Board of Directors of Scudder, Stevens & Clark and Scudder Kemper Investments. |
William S. Stavropoulos (73) |
| Year of Election or Appointment: 2001 Mr. Stavropoulos is Vice Chairman of the Independent Trustees of the Equity and High Income Funds (2006-present). Mr. Stavropoulos serves as President and Founder of the Michigan Baseball Foundation, the Great Lakes Loons (2007-present). Mr. Stavropoulos is Chairman Emeritus of the Board of Directors of The Dow Chemical Company, where he previously served in numerous senior management positions, including President, CEO (1995-2000; 2002-2004), Chairman of the Executive Committee (2000-2006), and as a member of the Board of Directors (1990-2006). Currently, Mr. Stavropoulos is a Director of Univar Inc. (global distributor of commodity and specialty chemicals, Chairman from 2010-May 2012 and Lead Director from May 2012-present), Teradata Corporation (data warehousing and technology solutions, 2008-present), Maersk Inc. (industrial conglomerate), and Tyco International, Ltd. (multinational manufacturing and services, 2007-present), and a member of the Advisory Board for Metalmark Capital LLC (private equity investment, 2005-present). Mr. Stavropoulos is an operating advisor to Clayton, Dubilier & Rice, LLC (private equity investment). In addition, Mr. Stavropoulos is a member of the University of Notre Dame Advisory Council for the College of Science, a Trustee of the Rollin L. Gerstacker Foundation, and a Director of the Naples Philharmonic Center for the Arts. Previously, Mr. Stavropoulos served as a Director of Chemical Financial Corporation (bank holding company, 1993-2012). |
David M. Thomas (63) |
| Year of Election or Appointment: 2008 Previously, Mr. Thomas served as Executive Chairman (2005-2006) and Chairman and Chief Executive Officer (2000-2005) of IMS Health, Inc. (pharmaceutical and healthcare information solutions), and a Director of Fortune Brands, Inc. (consumer products, 2000-2011). In addition, Mr. Thomas serves as Non-Executive Chairman of the Board of Directors of Fortune Brands Home and Security (home and security products, 2011-present), and as a member of the Board of Directors of Interpublic Group of Companies, Inc. (marketing communication, 2004-present). |
Michael E. Wiley (62) |
| Year of Election or Appointment: 2008 Mr. Wiley also serves as a Director of Asia Pacific Exploration Consolidated (international oil and gas exploration and production, 2008-present). Mr. Wiley serves as a Director of Tesoro Corporation (independent oil refiner and marketer, 2005-present), and a Director of Bill Barrett Corporation (exploration and production, 2005-present). In addition, Mr. Wiley also serves as a Director of Post Oak Bank (privately-held bank, 2004-present). Previously, Mr. Wiley served as a member of the Board of Trustees of the University of Tulsa (2000-2006; 2007-2010), as a Senior Energy Advisor of Katzenbach Partners, LLC (consulting, 2006-2007), as an Advisory Director of Riverstone Holdings (private investment), Chairman, President, and CEO of Baker Hughes, Inc. (oilfield services, 2000-2004), and as Director of Spinnaker Exploration Company (exploration and production, 2001-2005). |
+ The information above includes each Trustee's principal occupation during the last five years and other information relating to the experience, attributes, and skills relevant to each Trustee's qualifications to serve as a Trustee, which led to the conclusion that each Trustee should serve as a Trustee for the fund.
Advisory Board Members and Executive Officers:
Correspondence intended for David A. Rosow and Garnett A. Smith may be sent to Fidelity Investments, P.O. Box 55235, Boston, Massachusetts 02205-5235. Correspondence intended for each executive officer, Edward C. Johnson 3d, and Peter S. Lynch may be sent to Fidelity Investments, 82 Devonshire Street, Boston, Massachusetts 02109.
Name, Age; Principal Occupation |
Edward C. Johnson 3d (82) |
| Year of Election or Appointment: 2011 Member of the Advisory Board of Fidelity's Equity and High Income Funds. Mr. Johnson serves as Chief Executive Officer, Chairman, and a Director of FMR LLC, and also serves as Chairman and Director of FIL Limited. Previously, Mr. Johnson served as a Trustee and Chairman of the Board of certain Fidelity Trusts, Chairman and a Director of FMR, Chairman and a Director of FMR Co., Inc., and President of FMR LLC (2006-2007). |
Peter S. Lynch (68) |
| Year of Election or Appointment: 2003 Member of the Advisory Board of Fidelity's Equity and High Income Funds. Mr. Lynch is Vice Chairman and a Director of FMR and FMR Co., Inc. In addition, Mr. Lynch serves as a Trustee of Boston College and as the Chairman of the Inner-City Scholarship Fund. Previously, Mr. Lynch served on the Special Olympics International Board of Directors (1997-2006). |
David A. Rosow (70) |
| Year of Election or Appointment: 2012 Member of the Advisory Board of Fidelity's Equity and High Income Funds. Chairman and Chief Executive Officer of International Golf Group, Inc. (golf course development, 1989-present). Previously, Mr. Rosow served as Chairman and Chief Executive Officer of Rosow & Company, Inc. (private investment company, 1989-2011), a Lead Director of Hudson United Bancorp (2001-2006) and as a Director of TD Banknorth (1996-2006). In addition, Mr. Rosow is a member (2008-present) and President (2009-present) of the Town Council of Palm Beach, Florida. |
Garnett A. Smith (65) |
| Year of Election or Appointment: 2012 Member of the Advisory Board of Fidelity's Equity and High Income Funds. Prior to Mr. Smith's retirement, he served as Chairman and Chief Executive Officer of Inbrand Corp. (manufacturer of personal absorbent products, 1990-1997). He also served as President (1986-1990) of Inbrand Corp. Prior to his employment with Inbrand Corp., he was employed by a retail fabric chain and North Carolina National Bank. In addition, Mr. Smith is a board member of the Jackson Hole Land Trust (2009-present). |
Kenneth B. Robins (43) |
| Year of Election or Appointment: 2008 President and Treasurer of Fidelity's Equity and High Income Funds. Mr. Robins also serves as President and Treasurer (2010-present) and Assistant Treasurer (2009-present) of other Fidelity funds and is an employee of Fidelity Investments (2004-present). Previously, Mr. Robins served as Deputy Treasurer of the Fidelity funds (2005-2008) and Treasurer and Chief Financial Officer of The North Carolina Capital Management Trust: Cash and Term Portfolios (2006-2008). |
Bruce T. Herring (47) |
| Year of Election or Appointment: 2006 Vice President of certain Equity Funds. Mr. Herring also serves as President of Fidelity Research & Analysis Company (2010-present), Chief Investment Officer and Director of Fidelity Management & Research (U.K.) Inc. (2010-present) and Group Chief Investment Officer of FMR. Previously, Mr. Herring served as Vice President (2005-2006) and Senior Vice President (2006-2007) of Fidelity Management & Research Company, Vice President of FMR Co., Inc. (2001-2007) and as a portfolio manager for Fidelity U.S. Equity Funds. |
Brian B. Hogan (48) |
| Year of Election or Appointment: 2009 Vice President of Equity and High Income Funds. Mr. Hogan also serves as President of FMR's Equity Division (2009-present). Previously, Mr. Hogan served as Senior Vice President, Equity Research of FMR (2006-2009) and as a portfolio manager. |
Scott C. Goebel (44) |
| Year of Election or Appointment: 2008 Secretary and Chief Legal Officer (CLO) of the Fidelity funds. Mr. Goebel also serves as Secretary of Fidelity Investments Money Management, Inc. (FIMM) (2010-present) and Fidelity Research and Analysis Company (FRAC) (2010-present); Secretary and CLO of The North Carolina Capital Management Trust: Cash and Term Portfolios (2008-present); General Counsel, Secretary, and Senior Vice President of FMR (2008-present) and FMR Co., Inc. (2008-present); employed by FMR LLC or an affiliate (2001-present); Chief Legal Officer of Fidelity Management & Research (Hong Kong) Limited (2008-present) and Assistant Secretary of Fidelity Management & Research (Japan) Inc. (2008-present), and Fidelity Management & Research (U.K.) Inc. (2008-present). Previously, Mr. Goebel served as Assistant Secretary of FIMM (2008-2010), FRAC (2008-2010), and the Funds (2007-2008) and as Vice President and Secretary of Fidelity Distributors Corporation (FDC) (2005-2007). |
William C. Coffey (43) |
| Year of Election or Appointment: 2009 Assistant Secretary of Fidelity's Equity and High Income Funds. Mr. Coffey also serves as Senior Vice President and Deputy General Counsel of FMR LLC (2010-present), and is an employee of Fidelity Investments. Previously, Mr. Coffey served as Vice President and Associate General Counsel of FMR LLC (2005-2009). |
Elizabeth Paige Baumann (44) |
| Year of Election or Appointment: 2012 Anti-Money Laundering (AML) Officer of the Fidelity funds. Ms. Baumann also serves as AML Officer of The North Carolina Capital Management Trust: Cash and Term Portfolios (2012-present), Chief AML Officer of FMR LLC (2012-present), and is an employee of Fidelity Investments. Previously, Ms. Baumann served as Vice President and Deputy Anti-Money Laundering Officer (2007-2012). |
Christine Reynolds (54) |
| Year of Election or Appointment: 2008 Chief Financial Officer of the Fidelity funds. Ms. Reynolds became President of Fidelity Pricing and Cash Management Services (FPCMS) in August 2008. Ms. Reynolds served as Chief Operating Officer of FPCMS (2007-2008). Previously, Ms. Reynolds served as President, Treasurer, and Anti-Money Laundering officer of the Fidelity funds (2004-2007). |
Joseph A. Hanlon (44) |
| Year of Election or Appointment: 2012 Chief Compliance Officer of Fidelity's Equity and High Income Funds. Mr. Hanlon serves as Compliance Officer of FMR, FMR Co., Inc., Fidelity Investments Money Management, Inc. (FIMM), Fidelity Research and Analysis Company (FRAC), Fidelity Management & Research (Japan) Inc., Fidelity Management & Research (U.K.) Inc., Fidelity Management & Research (Hong Kong), and Strategic Advisers, Inc. (2009-present), as Senior Vice President of the Fidelity Asset Management Division (2009-present), and is an employee of Fidelity Investments. |
Joseph F. Zambello (55) |
| Year of Election or Appointment: 2011 Deputy Treasurer of the Fidelity funds. Mr. Zambello is an employee of Fidelity Investments. Previously, Mr. Zambello served as Vice President of FMR's Program Management Group (2009-2011) and Vice President of the Transfer Agent Oversight Group (2005-2009). |
Adrien E. Deberghes (45) |
| Year of Election or Appointment: 2008 Deputy Treasurer of Fidelity's Equity and High Income Funds. Mr. Deberghes also serves as Vice President (2011-present) and Assistant Treasurer (2010-present) of other Fidelity funds, and is an employee of Fidelity Investments (2008-present). Previously, Mr. Deberghes served as Senior Vice President of Mutual Fund Administration at State Street Corporation (2007-2008), Senior Director of Mutual Fund Administration at Investors Bank & Trust (2005-2007), and Director of Finance for Dunkin' Brands (2000-2005). |
Stephen Sadoski (41) |
| Year of Election or Appointment: 2012 Deputy Treasurer of Fidelity's Equity and High Income Funds. Mr. Sadoski also serves as Assistant Treasurer of other Fidelity funds (2012-present) and is an employee of Fidelity Investments (2012-present). Previously, Mr. Sadoski served as an assistant chief accountant in the Division of Investment Management of the Securities and Exchange Commission (SEC) (2009-2012) and as a senior manager at Deloitte & Touche (1997-2009). |
Stephanie J. Dorsey (43) |
| Year of Election or Appointment: 2010 Assistant Treasurer of Fidelity's Equity and High Income Funds. Ms. Dorsey also serves as Deputy Treasurer of other Fidelity funds (2008-present) and is an employee of Fidelity Investments (2008-present). Previously, Ms. Dorsey served as Treasurer (2004-2008) of the JPMorgan Mutual Funds and Vice President (2004-2008) of JPMorgan Chase Bank. |
John R. Hebble (54) |
| Year of Election or Appointment: 2009 Assistant Treasurer of Fidelity's Equity and High Income Funds. Mr. Hebble also serves as President (2011-present), Treasurer, and Chief Financial Officer of The North Carolina Capital Management Trust: Cash and Term Portfolios (2008-present), President and Treasurer of other Fidelity funds (2008-present) and is an employee of Fidelity Investments. |
Gary W. Ryan (54) |
| Year of Election or Appointment: 2005 Assistant Treasurer of the Fidelity funds. Mr. Ryan is an employee of Fidelity Investments. Previously, Mr. Ryan served as Vice President of Fund Reporting in Fidelity Pricing and Cash Management Services (FPCMS) (1999-2005). |
Jonathan Davis (44) |
| Year of Election or Appointment: 2010 Assistant Treasurer of the Fidelity funds. Mr. Davis is also Assistant Treasurer of Fidelity Rutland Square Trust II and Fidelity Commonwealth Trust II. Mr. Davis is an employee of Fidelity Investments. Previously, Mr. Davis served as Vice President and Associate General Counsel of FMR LLC (2003-2010). |
Annual Report
Distributions (Unaudited)
The Board of Trustees of Fidelity Advisor Overseas Fund voted to pay to shareholders of record at the opening of business on record date, the following distributions per share derived from capital gains realized from sales of portfolio securities, and dividends derived from net investment income:
| Pay Date | Record Date | Dividends | Capital Gains |
Institutional Class | 12/10/12 | 12/07/12 | $0.314 | $0.041 |
Institutional Class designates 100% of the dividend distributed during the fiscal year as amounts which may be taken into account as a dividend for purposes of the maximum rate under section 1(h)(11) of the Internal Revenue Code.
The amounts per share which represent income derived from sources within, and taxes paid to, foreign countries or possessions of the United States are as follows:
| Pay Date | Income | Taxes |
Institutional Class | 12/05/11 | $0.303 | $0.0199 |
The fund will notify shareholders in January 2013 of amounts for use in preparing 2012 income tax returns.
Annual Report
Board Approval of Investment Advisory Contracts and Management Fees
Fidelity Advisor Overseas Fund
Each year, the Board of Trustees, including the Independent Trustees (together, the Board), votes on the renewal of the management contract and sub-advisory agreements (together, the Advisory Contracts) for the fund. The Board, assisted by the advice of fund counsel and Independent Trustees' counsel, requests and considers a broad range of information relevant to the renewal of the Advisory Contracts throughout the year.
The Board meets regularly and, at each of its meetings, considers factors that are relevant to its annual consideration of the renewal of the fund's Advisory Contracts, including the services and support provided to the fund and its shareholders. The Board has established various standing committees, each composed of and chaired by Independent Trustees with varying backgrounds, to which the Board has assigned specific subject matter responsibilities in order to enhance effective decision-making by the Board. The Board, acting directly and through its Committees, requests and receives information concerning the annual consideration of the renewal of the fund's Advisory Contracts. The Board also meets as needed to consider matters specifically related to the Board's annual consideration of the renewal of Advisory Contracts. Members of the Board may also meet with trustees of other Fidelity funds through ad hoc joint committees to discuss certain matters relevant to the Fidelity funds.
At its July 2012 meeting, the Board of Trustees, including the Independent Trustees, unanimously determined to renew the fund's Advisory Contracts. In reaching its determination, the Board considered all factors it believed relevant, including (i) the nature, extent, and quality of the services to be provided to the fund and its shareholders (including the investment performance of the fund); (ii) the competitiveness of the fund's management fee and total expense ratio relative to peer funds; (iii) the total costs of the services to be provided by and the profits to be realized by Fidelity from its relationship with the fund; (iv) the extent to which economies of scale exist and would be realized as the fund grows; and (v) whether fee levels reflect these economies of scale, if any, for the benefit of fund shareholders.
In considering whether to renew the Advisory Contracts for the fund, the Board reached a determination, with the assistance of fund counsel and Independent Trustees' counsel and through the exercise of its business judgment, that the renewal of the Advisory Contracts is in the best interests of the fund and its shareholders and that the compensation payable under the Advisory Contracts is fair and reasonable. The Board's decision to renew the Advisory Contracts was not based on any single factor, but rather was based on a comprehensive consideration of all the information provided to the Board at its meetings throughout the year. The Board, in reaching its determination to renew the Advisory Contracts, is aware that shareholders in the fund have a broad range of investment choices available to them, including a wide choice among mutual funds offered by Fidelity's competitors, and that the fund's shareholders, who have the opportunity to review and weigh the disclosure provided by the fund in its prospectus and other public disclosures, have chosen to invest in this fund, managed by Fidelity.
Annual Report
Nature, Extent, and Quality of Services Provided. The Board considered the staffing within the investment adviser, FMR, and the sub-advisers (together, the Investment Advisers), including the backgrounds of the fund's investment personnel, and also considered the fund's investment objective, strategies, and related investment philosophy. The Independent Trustees also had discussions with senior management of Fidelity's investment operations and investment groups. The Board considered the structure of the portfolio manager compensation program and whether this structure provides appropriate incentives to act in the best interests of the fund.
Resources Dedicated to Investment Management and Support Services. The Board and the Fund Oversight and Research Committees reviewed the general qualifications and capabilities of the Investment Advisers' investment staff, including its size, education, experience, and resources, as well as the Investment Advisers' approach to recruiting, training, managing, and compensating investment personnel. The Board also noted that FMR has continued to increase the resources devoted to non-U.S. offices, including expansion of Fidelity's global investment organization. The Board noted that Fidelity's analysts have extensive resources, tools and capabilities that allow them to conduct sophisticated quantitative and fundamental analysis, as well as credit analysis of issuers, counterparties and guarantors. The Board also believes that Fidelity's investment professionals have sufficient access to global information and data so as to provide competitive investment results over time, and that those professionals also have access to sophisticated tools that permit them to assess portfolio construction and risk and performance attribution characteristics continuously, as well as to transmit new information and research conclusions rapidly around the world. Additionally, in its deliberations, the Board considered the Investment Advisers' trading and risk management capabilities and resources, which are an integral part of the investment management process.
Shareholder and Administrative Services. The Board considered (i) the nature, extent, quality, and cost of advisory, administrative, and shareholder services performed by the Investment Advisers and their affiliates under the Advisory Contracts and under separate agreements covering transfer agency, pricing and bookkeeping, and securities lending services for the fund; (ii) the nature and extent of the supervision of third party service providers, principally custodians and subcustodians; and (iii) the resources devoted to, and the record of compliance with, the fund's compliance policies and procedures. The Board also reviewed the allocation of fund brokerage, including allocations to brokers affiliated with the Investment Advisers, the use of brokerage commissions to pay fund expenses, and the use of "soft" commission dollars to pay for research services.
Annual Report
Board Approval of Investment Advisory Contracts and
Management Fees - continued
The Board noted that the growth of fund assets over time across the complex allows Fidelity to reinvest in the development of services designed to enhance the value or convenience of the Fidelity funds as investment vehicles. These services include 24-hour access to account information and market information through telephone representatives and over the Internet, investor education materials and asset allocation tools, and the expanded availability of Fidelity Investor Centers.
Investment in a Large Fund Family. The Board considered the benefits to shareholders of investing in a Fidelity fund, including the benefits of investing in a fund that is part of a large family of funds offering a variety of investment disciplines and providing a large variety of mutual fund investor services. The Board noted that Fidelity had taken, or had made recommendations that resulted in the Fidelity funds taking, a number of actions over the previous year that benefited particular funds, including (i) continuing to dedicate additional resources to investment research and support of the senior management team that oversees asset management; (ii) persisting in efforts to enhance Fidelity's research capabilities, in particular, international research; (iii) launching new funds and making other enhancements to meet client needs for global and income-oriented solutions; (iv) continuing to launch dedicated lower cost underlying funds to meet investment management's portfolio construction needs related to expanding underlying fund options, specifically for the Freedom Fund product lines; (v) adopting a "Stock Selector" sector neutral investment approach and employing a team of portfolio managers who are sector specialists to manage certain funds; (vi) rationalizing product lines and gaining increased efficiencies through the mergers of several funds into other funds; (vii) strengthening the Spartan Index Fund product line by adding new funds and/or new low-cost institutional share classes, restructuring fund expenses to accommodate new classes, and reducing investment minimums for certain classes of shares; (viii) modifying the eligibility criteria for Institutional Class shares to increase their appeal to government entities and charitable investors; and (ix) reducing certain transfer agent fee rates.
Investment Performance. The Board considered whether the fund has operated in accordance with its investment objective, as well as its record of compliance with its investment restrictions. It also reviewed the fund's absolute investment performance for each class, as well as the fund's relative investment performance for each class measured over multiple periods against (i) a broad-based securities market index, and (ii) a peer group of mutual funds deemed appropriate by Fidelity and reviewed by the Board. The following charts considered by the Board show, over the one-, three-, and five-year periods ended December 31, 2011, the cumulative total returns of Institutional Class (Class I) and Class B of the fund, the cumulative total returns of a broad-based securities market index ("benchmark"), and a range of cumulative total returns of a peer group of mutual funds identified by Morningstar, Inc. as having an investment style similar to that of the fund based on underlying portfolio holdings. The returns of Institutional Class (Class I) and Class B show the performance of the highest and lowest performing classes, respectively (based on five-year performance). The box within each chart shows the 25th percentile return (top of box) and the 75th percentile return (bottom of box) of the peer group. Returns shown above the box are in the first quartile and returns shown below the box are in the fourth quartile. The percentage beaten numbers noted below each chart correspond to the percentile box and represent the percentage of funds in the peer group whose performance was equal to or lower than that of the class indicated.
Annual Report
Fidelity Advisor Overseas Fund
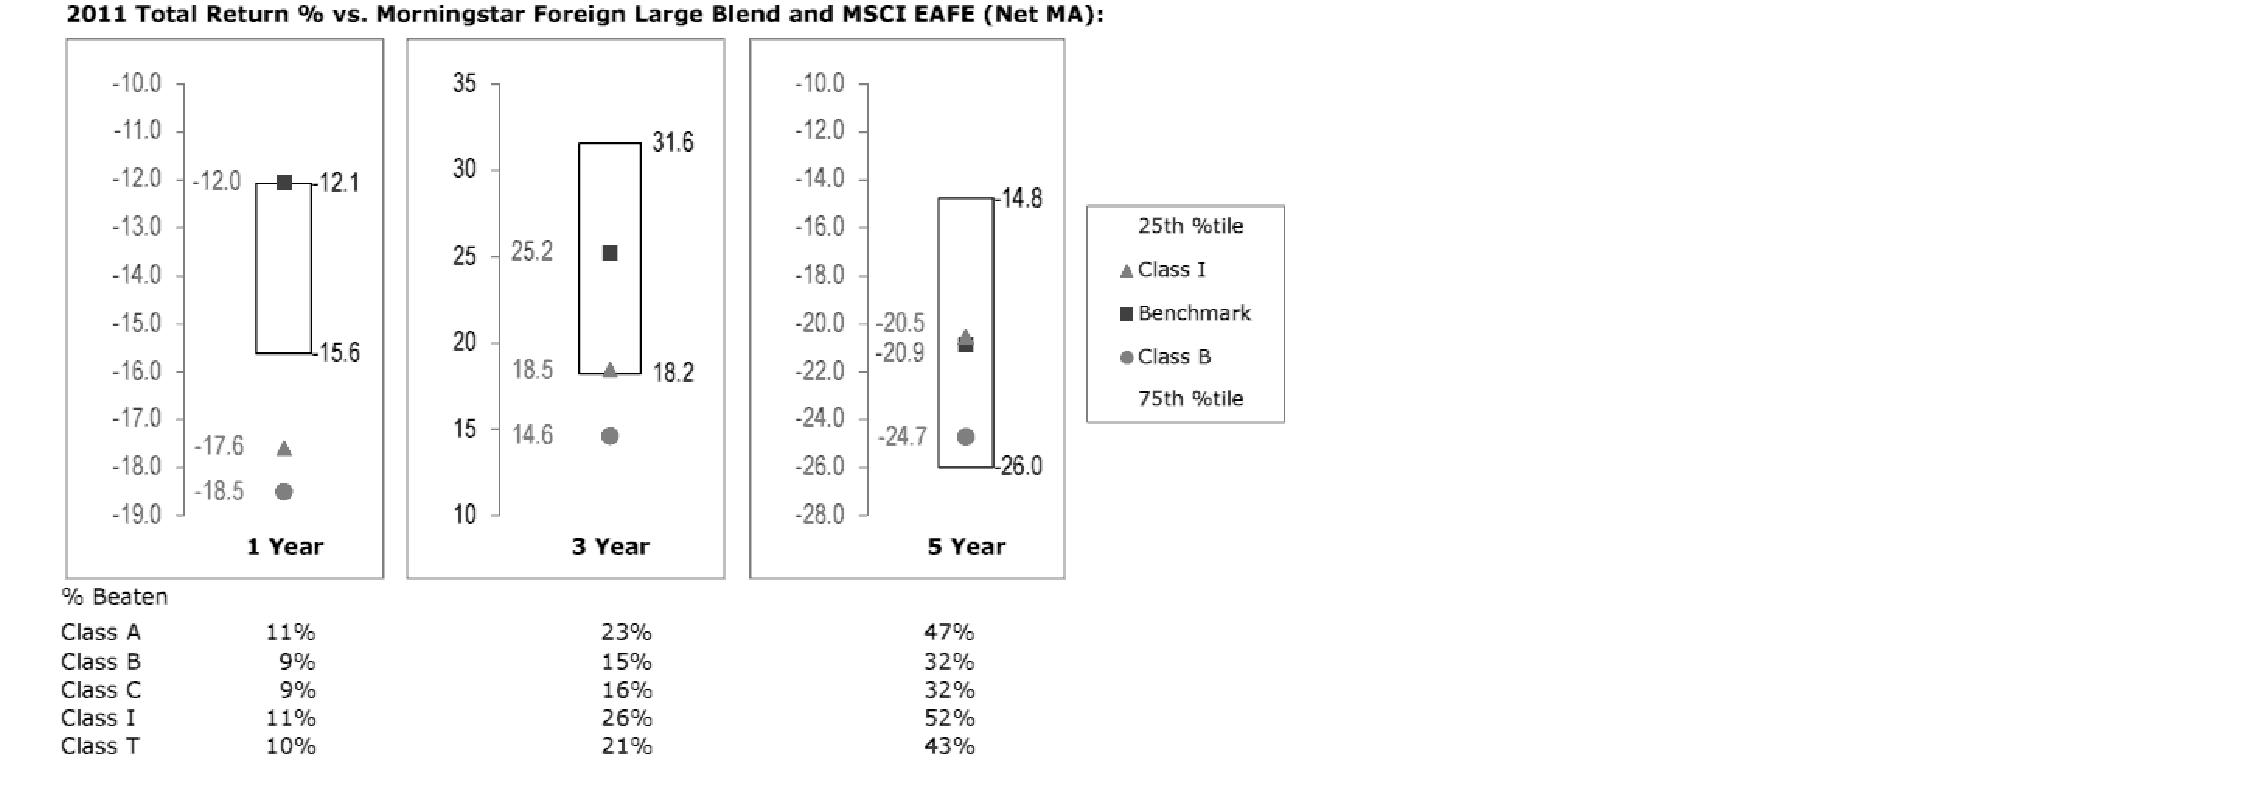
The Board reviewed the fund's relative investment performance against its peer group and noted that the performance of Institutional Class (Class I) of the fund was in the fourth quartile for the one-year period, the third quartile for the three-year period, and the second quartile for the five-year period. The Board also noted that the investment performance of the fund was lower than its benchmark for the one- and three-year periods, although the five-year cumulative total return of Institutional Class (Class I) compared favorably to its benchmark. The Board considered that the variations in performance among the fund's classes reflect the variations in class expenses, which result in lower performance for higher expense classes. The Board discussed with FMR actions to improve the fund's disappointing performance relative to its peer group and benchmark. The Board also reviewed the fund's performance since inception as well as performance in the current year. The Board will continue to closely monitor the performance of the fund in the coming year and discuss with FMR other appropriate actions to address the performance of the fund.
Annual Report
Board Approval of Investment Advisory Contracts and
Management Fees - continued
The Board also considered that the fund's management fee is subject to upward or downward adjustment depending upon whether, and to what extent, the fund's investment performance for the performance period exceeds, or is exceeded by, the record (over the same period) of a Board-approved performance adjustment index. The Board noted that the performance adjustment provides FMR with a strong economic incentive to seek to achieve superior performance for the fund's shareholders and helps to more closely align the interests of FMR and the fund's shareholders.
Based on its review, the Board concluded that the nature, extent, and quality of services provided to the fund under the Advisory Contracts should benefit the fund's shareholders.
Competitiveness of Management Fee and Total Expense Ratio. The Board considered the fund's management fee and total expense ratio compared to "mapped groups" of competitive funds and classes. Fidelity creates "mapped groups" by combining similar Lipper investment objective categories that have comparable management fee characteristics. Combining Lipper investment objective categories aids the Board's management fee and total expense ratio comparisons by broadening the competitive group used for comparison and by reducing the number of universes to which various Fidelity funds are compared.
Management Fee. The Board considered two proprietary management fee comparisons for the 12-month periods shown in the chart below. The group of Lipper funds used by the Board for management fee comparisons is referred to below as the "Total Mapped Group." The Total Mapped Group comparison focuses on a fund's standing relative to the total universe of comparable funds available to investors in terms of gross management fees before expense reimbursements or caps, and without giving effect to the fund's performance adjustment. "TMG %" represents the percentage of funds in the Total Mapped Group that had management fees that were lower than the fund's. For example, a TMG % of 17% means that 83% of the funds in the Total Mapped Group had higher management fees than the fund. The "Asset-Size Peer Group" (ASPG) comparison focuses on a fund's standing relative to non-Fidelity funds similar in size to the fund within the Total Mapped Group. The ASPG represents at least 15% of the funds in the Total Mapped Group with comparable asset size and management fee characteristics, subject to a minimum of 50 funds (or all funds in the Total Mapped Group if fewer than 50). Additional information, such as the ASPG quartile in which the fund's management fee ranked and the impact of the fund's performance adjustment, is also included in the chart and considered by the Board.
Annual Report
Fidelity Advisor Overseas Fund
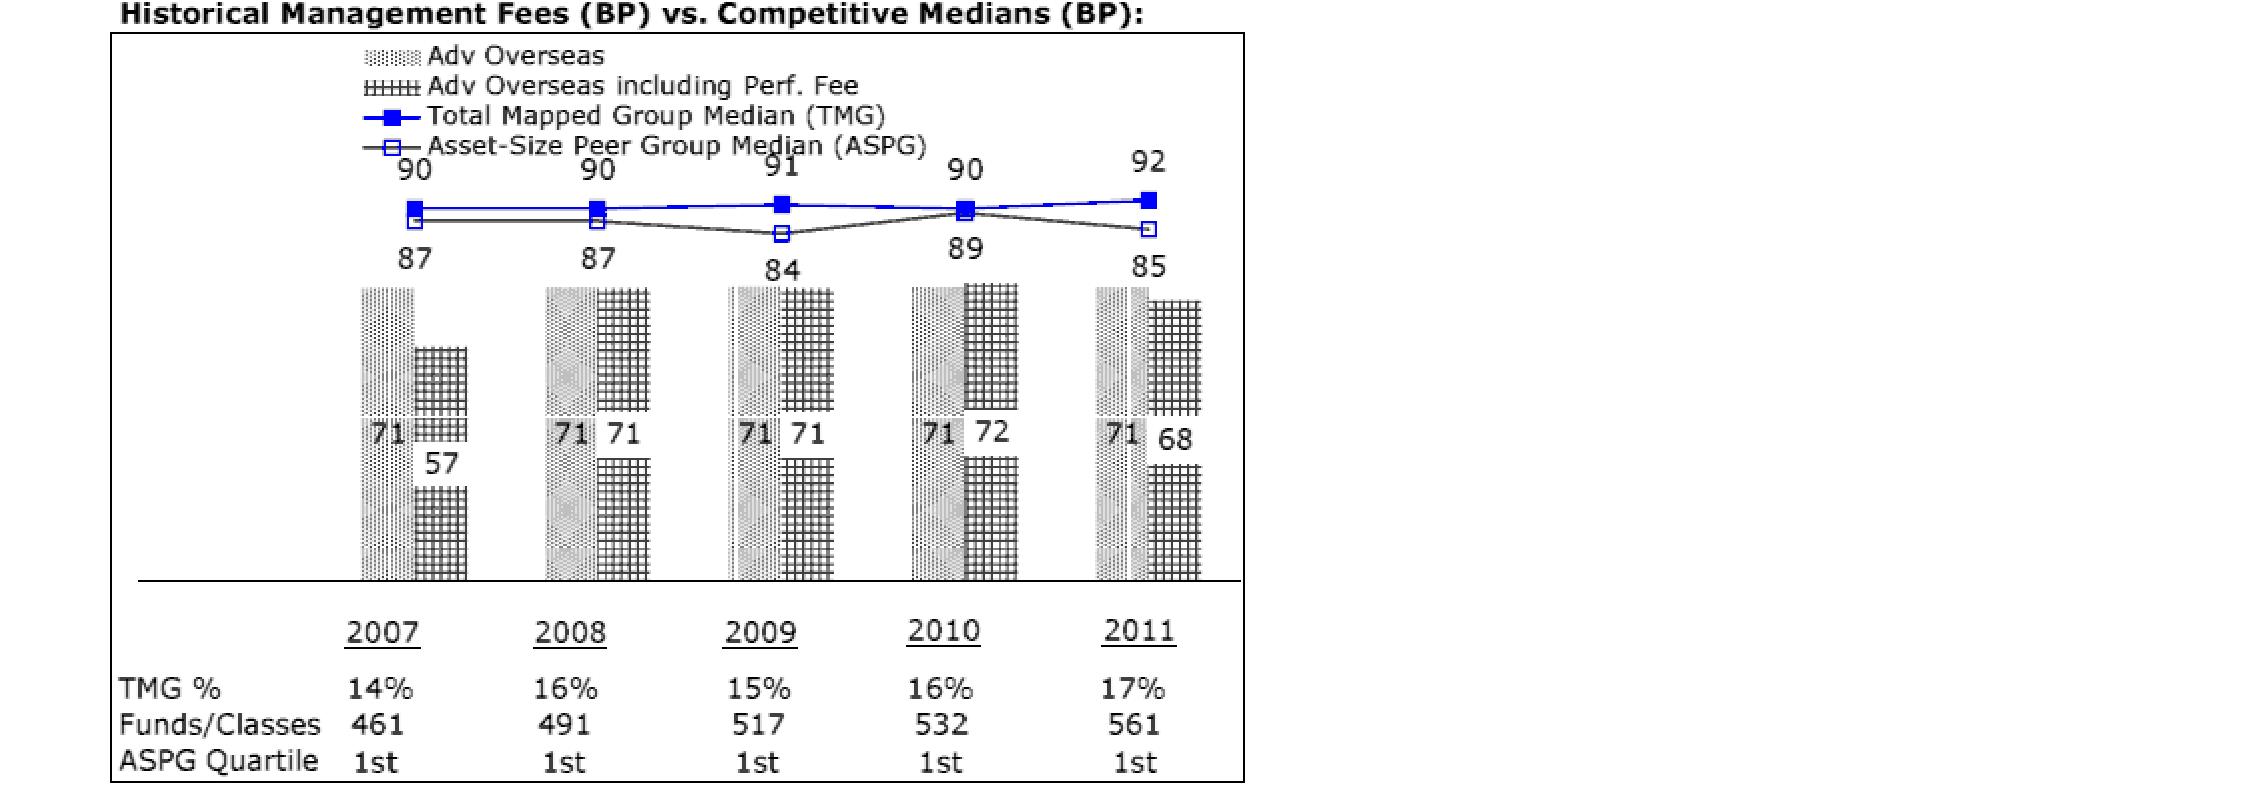
The Board noted that the fund's management fee ranked below the median of its Total Mapped Group and below the median of its ASPG for 2011. The Board also noted the effect of the fund's negative performance adjustment on the fund's management fee ranking. The Board noted that the performance adjustment for each year represents calculations for performance periods that differ from the periods shown in the performance charts above.
Based on its review, the Board concluded that the fund's management fee is fair and reasonable in light of the services that the fund receives and the other factors considered.
Total Expense Ratio. In its review of each class's total expense ratio, the Board considered the fund's management fee as well as other fund or class expenses, as applicable, such as transfer agent fees, pricing and bookkeeping fees, fund-paid 12b-1 fees, and custodial, legal, and audit fees. The Board also noted the effects of any waivers and reimbursements on fees and expenses, as well as the impact of the fund's performance adjustment. As part of its review, the Board also considered the current and historical total expense ratios of each class of the fund compared to competitive fund median expenses. Each class of the fund is compared to those funds and classes in the Total Mapped Group (used by the Board for management fee comparisons) that have a similar sales load structure.
The Board noted that the total expense ratio of each of Class A, Class B, Class C, and Institutional Class ranked below its competitive median for 2011 and the total expense ratio of Class T ranked above its competitive median for 2011. The Board considered that various factors, including 12b-1 fees, positive or negative performance adjustments, and relatively higher other expenses in the case of small fund size, can affect total expense ratios. The Board noted that the total expense ratio of Class T was above the competitive median primarily because of higher 12b-1 fees on Class T. Class T has a higher 12b-1 fee, but a lower front-end sales charge, than traditionally priced front-end sales charge classes. The Board considered that Class T is primarily sold load-waived in the retirement plan market where its 0.50% 12b-1 fee is comparable to competing no-load, higher 12b-1 fee classes designed specifically for retirement plans. The Board noted that the fund offers multiple classes, each of which has a different sales load and 12b-1 fee structure, and that the multiple structures are intended to offer a range of pricing options for the intermediary market. The Board also noted that the total expense ratios of the classes vary primarily by the level of their 12b-1 fees, although differences in transfer agent fees may also cause expenses to vary from class to class.
Annual Report
Board Approval of Investment Advisory Contracts and
Management Fees - continued
Fees Charged to Other Fidelity Clients. The Board also considered Fidelity fee structures and other information with respect to clients of FMR and its affiliates, such as other mutual funds advised or subadvised by FMR or its affiliates, pension plan clients, and other institutional clients. The Board noted the findings of the 2010 ad hoc joint committee (created with the board of other Fidelity funds), which reviewed and compared Fidelity's institutional investment advisory business with its business of providing services to the Fidelity funds, including the differences in services provided, fees charged, and costs incurred, as well as competition in their respective marketplaces.
Based on its review of total expense ratios and fees charged to other Fidelity clients, the Board concluded that the total expense ratio of each class of the fund was reasonable, although Class T was above the median of the universe presented for comparison, in light of the services that the fund and its shareholders receive and the other factors considered.
Costs of the Services and Profitability. The Board considered the revenues earned and the expenses incurred by Fidelity in conducting the business of developing, marketing, distributing, managing, administering and servicing the fund and its shareholders. The Board also considered the level of Fidelity's profits in respect of all the Fidelity funds.
On an annual basis, FMR presents to the Board Fidelity's profitability for the fund. Fidelity calculates the profitability for each fund, as well as aggregate profitability for groups of Fidelity funds and all Fidelity funds, using a series of detailed revenue and cost allocation methodologies which originate with the books and records of Fidelity on which Fidelity's audited financial statements are based. The Audit Committee of the Board reviews any significant changes from the prior year's methodologies.
PricewaterhouseCoopers LLP (PwC), independent registered public accounting firm and auditor to Fidelity and certain Fidelity funds, has been engaged annually by the Board as part of the Board's assessment of Fidelity's profitability analysis. PwC's engagement includes the review and assessment of Fidelity's methodologies used in determining the revenues and expenses attributable to Fidelity's mutual fund business, and completion of agreed-upon procedures surrounding the mathematical accuracy of fund profitability and its conformity to allocation methodologies. After considering PwC's reports issued under the engagement and information provided by Fidelity, the Board concluded that while other allocation methods may also be reasonable, Fidelity's profitability methodologies are reasonable in all material respects.
Annual Report
The Board also reviewed Fidelity's non-fund businesses and fall-out benefits related to the mutual fund business as well as cases where Fidelity's affiliates may benefit from or be related to the fund's business.
The Board considered the costs of the services provided by and the profits realized by Fidelity in connection with the operation of the fund and was satisfied that the profitability was not excessive in the circumstances.
Economies of Scale. The Board considered whether there have been economies of scale in respect of the management of the Fidelity funds, whether the Fidelity funds (including the fund) have appropriately benefited from any such economies of scale, and whether there is potential for realization of any further economies of scale. The Board considered the extent to which the fund will benefit from economies of scale through increased services to the fund, through waivers or reimbursements, or through fee or expense reductions. The Board also noted that in 2009, it and the board of other Fidelity funds created an ad hoc committee (the Economies of Scale Committee) to analyze whether FMR attains economies of scale in respect of the management and servicing of the Fidelity funds, whether the Fidelity funds have appropriately benefited from such economies of scale, and whether there is potential for realization of any further economies of scale.
The Board recognized that the fund's management contract incorporates a "group fee" structure, which provides for lower group fee rates as total fund assets under FMR's management increase, and for higher group fee rates as total fund assets under FMR's management decrease. FMR calculates the group fee rates based on a tiered asset "breakpoint" schedule that varies based on asset class. The Board considered that the group fee is designed to deliver the benefits of economies of scale to fund shareholders when total Fidelity fund assets increase, even if assets of any particular fund are unchanged or have declined, because some portion of Fidelity's costs are attributable to services provided to all Fidelity funds, and all funds benefit if those costs can be allocated among more assets. The Board concluded that, given the group fee structure, fund shareholders will benefit from lower management fees as assets under FMR's management increase at the fund complex level, regardless of whether Fidelity achieves any such economies of scale.
Annual Report
Board Approval of Investment Advisory Contracts and
Management Fees - continued
The Board concluded, taking into account the analysis of the Economies of Scale Committee, that economies of scale, if any, are being appropriately shared between fund shareholders and Fidelity.
Additional Information Requested by the Board. In order to develop fully the factual basis for consideration of the Fidelity funds' Advisory Contracts, the Board requested and received additional information on certain topics, including (i) fund performance trends, actions to be taken by FMR to improve certain funds' overall performance, and Fidelity's long-term strategies for certain funds; (ii) the potential to further rationalize the Fidelity fund lineup with the possibility of achieving savings for the funds and Fidelity; (iii) Fidelity's compensation structure for portfolio managers and other key investment personnel; (iv) the amount of the investment that each portfolio manager has made in the Fidelity fund(s) that he or she manages; (v) the realization of fall-out benefits in certain Fidelity business units; (vi) Fidelity's group fee structures, the potential impact of regulatory changes on such structures, and the rationale for the individual fee rates of certain funds; (vii) fund profitability methodology, including Fidelity's cost allocation methodology, and the impact of certain factors on fund profitability results; (viii) trends regarding industry use of performance fee structures and the possibility of implementing performance fee structures for additional funds; and (ix) the impact of net redemptions from the Fidelity funds.
Based on its evaluation of all of the conclusions noted above, and after considering all factors it believed relevant, the Board ultimately concluded that the advisory fee structures are fair and reasonable, and that the fund's Advisory Contracts should be renewed.
Annual Report
Investment Adviser
Fidelity Management & Research Company
Boston, MA
Investment Sub-Advisers
FMR Co., Inc.
Fidelity Management & Research
(U.K.) Inc.
Fidelity Management & Research
(Hong Kong) Limited
Fidelity Management & Research (Japan) Inc.
FIL Investment Advisors (UK) Limited
FIL Investments (Japan) Limited
FIL Investment Advisors
General Distributor
Fidelity Distributors Corporation
Smithfield, RI
Transfer and Service Agents
Fidelity Investments Institutional Operations Company, Inc.
Boston, MA
Fidelity Service Company, Inc.
Boston, MA
Custodian
The Northern Trust Company
Chicago, IL
(Fidelity Investment logo)(registered trademark)
OSI-UANN-1212
1.784768.109
(Fidelity Investment logo)(registered trademark)
Fidelity Advisor®
Global Capital Appreciation
Fund - Class A, Class T, Class B
and Class C
Annual Report
October 31, 2012
(Fidelity Cover Art)
Contents
Performance | (Click Here) | How the fund has done over time. |
Management's Discussion of Fund Performance | (Click Here) | The Portfolio Manager's review of fund performance and strategy. |
Shareholder Expense Example | (Click Here) | An example of shareholder expenses. |
Investment Changes | (Click Here) | A summary of major shifts in the fund's investments over the past six months. |
Investments | (Click Here) | A complete list of the fund's investments with their market values. |
Financial Statements | (Click Here) | Statements of assets and liabilities, operations, and changes in net assets, as well as financial highlights. |
Notes | (Click Here) | Notes to financial statements. |
Report of Independent Registered Public Accounting Firm | (Click Here) | |
Trustees and Officers | (Click Here) | |
Board Approval of Investment Advisory Contracts and Management Fees | (Click Here) | |
To view a fund's proxy voting guidelines and proxy voting record for the 12-month period ended June 30, visit http://www.fidelity.com/proxyvotingresults or visit the Securities and Exchange Commission's (SEC) web site at http://www.sec.gov. You may also call 1-877-208-0098 to request a free copy of the proxy voting guidelines.
Standard & Poor's, S&P and S&P 500 are registered service marks of The McGraw-Hill Companies, Inc. and have been licensed for use by Fidelity Distributors Corporation.
Other third party marks appearing herein are the property of their respective owners.
All other marks appearing herein are registered or unregistered trademarks or service marks of FMR LLC or an affiliated company. © 2012 FMR LLC. All rights reserved.
Annual Report
This report and the financial statements contained herein are submitted for the general information of the shareholders of the fund. This report is not authorized for distribution to prospective investors in the fund unless preceded or accompanied by an effective prospectus.
A fund files its complete schedule of portfolio holdings with the SEC for the first and third quarters of each fiscal year on Form N-Q. Forms N-Q are available on the SEC's web site at http://www.sec.gov. A fund's Forms N-Q may be reviewed and copied at the SEC's Public Reference Room in Washington, DC. Information regarding the operation of the SEC's Public Reference Room may be obtained by calling 1-800-SEC-0330. For a complete list of a fund's portfolio holdings, view the most recent holdings listing, semiannual report, or annual report on Fidelity's web site at http://www.fidelity.com, http://www.advisor.fidelity.com, or http://www.401k.com, as applicable.
NOT FDIC INSURED • MAY LOSE VALUE • NO BANK GUARANTEE
Neither the fund nor Fidelity Distributors Corporation is a bank.
Annual Report
Average annual total return reflects the change in the value of an investment, assuming reinvestment of the class' distributions from dividend income and capital gains (the profits earned upon the sale of securities that have grown in value, if any) and assuming a constant rate of performance each year. The $10,000 table and the fund's returns do not reflect the deduction of taxes that a shareholder would pay on fund distributions or the redemption of fund shares. During periods of reimbursement by Fidelity, a fund's total return will be greater than it would be had the reimbursement not occurred. How a fund did yesterday is no guarantee of how it will do tomorrow. Returns reflect the conversion of Class B shares to Class A shares after a maximum of seven years.
Average Annual Total Returns
Periods ended October 31, 2012 | Past 1
year | Past 5
years | Past 10
years |
Class A (incl. 5.75% sales charge) | 2.42% | -5.86% | 4.41% |
Class T (incl. 3.50% sales charge) | 4.58% | -5.64% | 4.41% |
Class B (incl. contingent deferred sales charge)A | 2.89% | -5.78% | 4.49% |
Class C (incl. contingent deferred sales charge)B | 6.79% | -5.46% | 4.25% |
A Class B shares' contingent deferred sales charges included in the past one year, past five years, and past ten years total return figures are 5%, 2%, and 0%, respectively.
B Class C shares' contingent deferred sales charges included in the past one year, past five years, and past ten years total return figures are 1%, 0%, and 0%, respectively.
Annual Report
$10,000 Over 10 Years
Let's say hypothetically that $10,000 was invested in Fidelity Advisor® Global Capital Appreciation Fund - Class A on October 31, 2002, and the current 5.75% sales charge was paid. The chart shows how the value of your investment would have changed, and also shows how the MSCI® ACWI® (All Country World Index) Index performed over the same period.
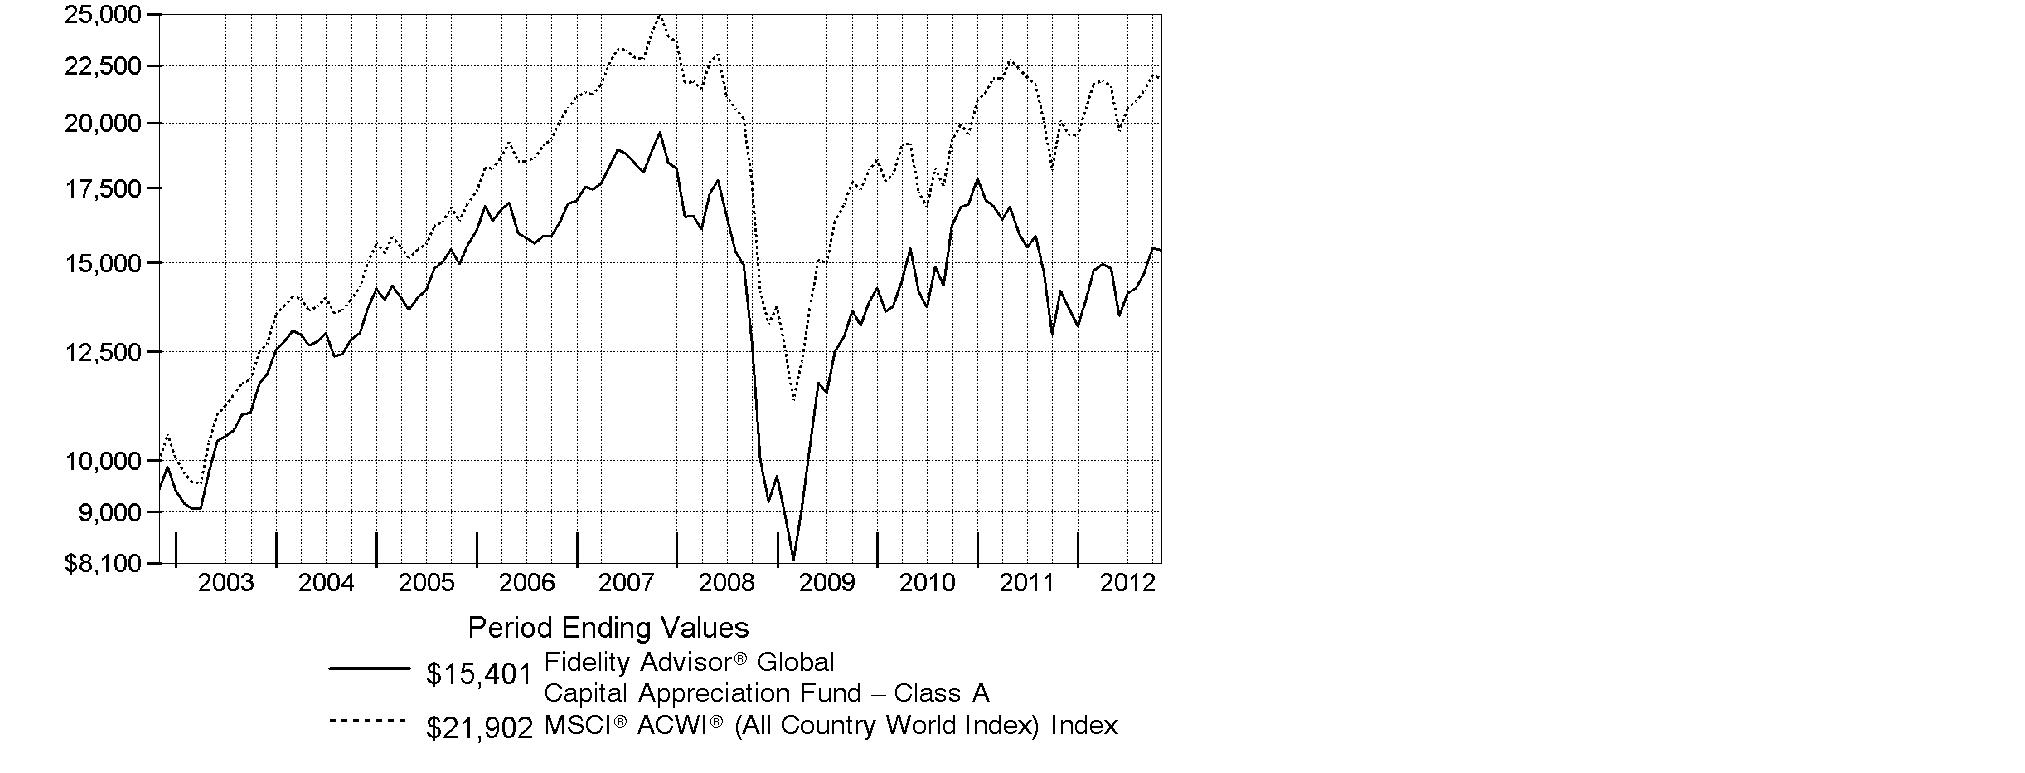
Annual Report
Market Recap: Global stocks experienced pendulum-like swings during the 12 months ending October 31, 2012, finishing the period with a solid advance. The market faced periodic bouts of volatility this past year, as a number of macroeconomic concerns - including the eurozone debt crisis, the strength and pace of the U.S. economic recovery, and a slowdown in China's once-blistering growth - dominated headlines and weighed on investors. While a stronger U.S. dollar provided an additional head wind for foreign investments, stocks worldwide rose 8.96% for the 12 months, as measured by the MSCI® ACWI® (All Country World Index) Index, largely buttressed in the summer by pledges of accommodative monetary action from eurozone officials, as well as signs that the U.S. housing market was on the mend. Within the index, the U.S. showed the most impressive gain among major markets, advancing 15%, closely followed by Asia-Pacific ex Japan (+10%). A number of core European components, most notably Germany (+11%), Switzerland (+10%) and the U.K. (+9%), benefited from optimism about the eurozone's ability to resolve its debt woes. However, continued weakness in peripheral European markets caused the region to lag the index overall. Elsewhere, results from Canada (+3%) and the generally more volatile emerging markets (+2%) each fell short of the MSCI index, while Japan was among the few benchmark constituents to finish in the red, returning about -3%.
Comments from Thomas Allen, Portfolio Manager of Fidelity Advisor® Global Capital Appreciation Fund: For the year, the fund's Class A, Class T, Class B and Class C shares returned 8.67%, 8.38%, 7.89% and 7.79%, respectively (excluding sales charges), trailing the MSCI index. Stock picking and an overweighting in Japan proved counterproductive, along with my choices in Russia. A modest cash position further dampened results. At the stock level, Japanese price-comparison site Kakaku.com detracted the most, as disappointing earnings and untimely ownership hurt. Other detractors included Russian drug company Pharmstandard, U.S. glass manufacturer Corning and Proto, a Japan-based provider of online data on used cars. Conversely, stock selection in India stood out as a significant positive, although much of the benefit there was offset by a large overweighting in that relatively weak market. My picks in Brazil, the United Kingdom and the Netherlands bolstered results as well. Noteworthy individual contributors included Indian restaurant chain Jubilant FoodWorks, Dutch holding Gemalto - a leading provider of digital security solutions - and Carsales.com, an Australian website for used-car data. Most stocks I've mentioned were not part of the benchmark, and all of the detractors I've referenced were sold from the fund by period end.
The views expressed above reflect those of the portfolio manager(s) only through the end of the period as stated on the cover of this report and do not necessarily represent the views of Fidelity or any other person in the Fidelity organization. Any such views are subject to change at any time based upon market or other conditions and Fidelity disclaims any responsibility to update such views. These views may not be relied on as investment advice and, because investment decisions for a Fidelity fund are based on numerous factors, may not be relied on as an indication of trading intent on behalf of any Fidelity fund.
Annual Report
Shareholder Expense Example
As a shareholder of the Fund, you incur two types of costs: (1) transaction costs, including sales charges (loads) on purchase payments or redemption proceeds, redemption fees and (2) ongoing costs, including management fees, distribution and/or service (12b-1) fees and other Fund expenses. This Example is intended to help you understand your ongoing costs (in dollars) of investing in the Fund and to compare these costs with the ongoing costs of investing in other mutual funds.
The Example is based on an investment of $1,000 invested at the beginning of the period and held for the entire period (May 1, 2012 to October 31, 2012).
Actual Expenses
The first line of the accompanying table for each class of the Fund provides information about actual account values and actual expenses. You may use the information in this line, together with the amount you invested, to estimate the expenses that you paid over the period. Simply divide your account value by $1,000.00 (for example, an $8,600 account value divided by $1,000.00 = 8.6), then multiply the result by the number in the first line for a class of the Fund under the heading entitled "Expenses Paid During Period" to estimate the expenses you paid on your account during this period. In addition, the Fund, as a shareholder in the underlying Fidelity Central Funds, will indirectly bear its pro-rata share of the fees and expenses incurred by the underlying Fidelity Central Funds. These fees and expenses are not included in the Fund's annualized expense ratio used to calculate the expense estimate in the table below.
Hypothetical Example for Comparison Purposes
The second line of the accompanying table for each class of the Fund provides information about hypothetical account values and hypothetical expenses based on a Class' actual expense ratio and an assumed rate of return of 5% per year before expenses, which is not the Class' actual return. The hypothetical account values and expenses may not be used to estimate the actual ending account balance or expenses you paid for the period. You may use this information to compare the ongoing costs of investing in the Fund and other funds. To do so, compare this 5% hypothetical example with the 5% hypothetical examples that appear in the shareholder reports of the other funds. In addition, the Fund, as a shareholder in the underlying Fidelity Central Funds, will indirectly bear its pro-rata share of the fees and expenses incurred by the underlying Fidelity Central Funds. These fees and expenses are not included in the Fund's annualized expense ratio used to calculate the expense estimate in the table below.
Please note that the expenses shown in the table are meant to highlight your ongoing costs only and do not reflect any transaction costs. Therefore, the second line of the table is useful in comparing ongoing costs only, and will not help you determine the relative total costs of owning different funds. In addition, if these transactional costs were included, your costs would have been higher.
Annual Report
| Annualized
Expense Ratio | Beginning
Account Value
May 1, 2012 | Ending
Account Value
October 31, 2012 | Expenses Paid
During Period*
May 1, 2012 to October 31, 2012 |
Class A | 1.40% | | | |
Actual | | $ 1,000.00 | $ 1,037.90 | $ 7.17 |
HypotheticalA | | $ 1,000.00 | $ 1,018.10 | $ 7.10 |
Class T | 1.70% | | | |
Actual | | $ 1,000.00 | $ 1,035.90 | $ 8.70 |
HypotheticalA | | $ 1,000.00 | $ 1,016.59 | $ 8.62 |
Class B | 2.17% | | | |
Actual | | $ 1,000.00 | $ 1,034.00 | $ 11.09 |
HypotheticalA | | $ 1,000.00 | $ 1,014.23 | $ 10.99 |
Class C | 2.16% | | | |
Actual | | $ 1,000.00 | $ 1,032.90 | $ 11.04 |
Hypothetical A | | $ 1,000.00 | $ 1,014.28 | $ 10.94 |
Institutional Class | .91% | | | |
Actual | | $ 1,000.00 | $ 1,039.50 | $ 4.67 |
HypotheticalA | | $ 1,000.00 | $ 1,020.56 | $ 4.62 |
A 5% return per year before expenses
* Expenses are equal to each Class' annualized expense ratio, multiplied by the average account value over the period, multiplied by 184/366 (to reflect the one-half year period).
Annual Report
Investment Changes (Unaudited)
Top Five Stocks as of October 31, 2012 |
| % of fund's
net assets | % of fund's net assets
6 months ago |
Jubilant Foodworks Ltd. (India, Hotels, Restaurants & Leisure) | 1.7 | 1.5 |
Sanofi SA sponsored ADR (France, Pharmaceuticals) | 1.4 | 1.6 |
Google, Inc. Class A (United States of America, Internet Software & Services) | 1.3 | 1.4 |
Wyndham Worldwide Corp. (United States of America, Hotels, Restaurants & Leisure) | 1.2 | 0.3 |
The Walt Disney Co. (United States of America, Media) | 1.2 | 1.3 |
| 6.8 | |
Top Five Market Sectors as of October 31, 2012 |
| % of fund's
net assets | % of fund's net assets
6 months ago |
Consumer Discretionary | 22.0 | 22.7 |
Information Technology | 20.6 | 21.7 |
Financials | 14.7 | 13.2 |
Industrials | 12.2 | 8.9 |
Health Care | 8.9 | 10.3 |
Top Five Countries as of October 31, 2012 |
(excluding cash equivalents) | % of fund's
net assets | % of fund's net assets
6 months ago |
United States of America | 38.7 | 42.9 |
Japan | 9.5 | 13.6 |
India | 6.7 | 6.0 |
United Kingdom | 4.4 | 3.9 |
Korea (South) | 3.6 | 1.9 |
Percentages are adjusted for the effect of open futures contracts, if applicable. |
Asset Allocation (% of fund's net assets) |
As of October 31, 2012 | As of April 30, 2012 |
| Stocks 98.8% | | | Stocks 99.9% | |
| Short-Term
Investments and
Net Other Assets (Liabilities) 1.2% | | | Short-Term
Investments and
Net Other Assets (Liabilities) 0.1% | |

Annual Report
Investments October 31, 2012
Showing Percentage of Net Assets
Common Stocks - 98.8% |
| Shares | | Value |
Australia - 1.7% |
Carsales.com Ltd. | 99,645 | | $ 771,636 |
Flexigroup Ltd. | 53,144 | | 218,458 |
Goodman Group unit | 29,684 | | 136,504 |
Nufarm Ltd. | 24,640 | | 147,071 |
TOTAL AUSTRALIA | | 1,273,669 |
Austria - 0.5% |
OMV AG | 4,700 | | 171,792 |
Schoeller-Bleckmann Oilfield Equipment AG | 2,100 | | 202,647 |
TOTAL AUSTRIA | | 374,439 |
Bailiwick of Jersey - 0.3% |
Delphi Automotive PLC | 1,800 | | 56,592 |
Experian PLC | 11,000 | | 189,938 |
TOTAL BAILIWICK OF JERSEY | | 246,530 |
Belgium - 0.8% |
Anheuser-Busch InBev SA NV ADR | 7,000 | | 586,600 |
Bermuda - 0.8% |
China Foods Ltd. | 190,000 | | 192,205 |
China Resources Gas Group Ltd. | 88,000 | | 195,075 |
Fairwood Holdings Ltd. | 66,000 | | 138,471 |
Soundwill Holdings Ltd. | 38,000 | | 69,135 |
TOTAL BERMUDA | | 594,886 |
Brazil - 2.3% |
Abril Educacao SA unit | 11,300 | | 204,185 |
CCR SA | 31,600 | | 277,874 |
Companhia de Bebidas das Americas (AmBev) (PN) | 5,000 | | 204,328 |
Mills Estruturas e Servicos de Engenharia SA | 13,300 | | 203,915 |
Multiplus SA | 8,100 | | 188,198 |
Qualicorp SA (a) | 21,000 | | 215,475 |
Totvs SA | 21,100 | | 429,054 |
TOTAL BRAZIL | | 1,723,029 |
British Virgin Islands - 0.4% |
Mail.ru Group Ltd. GDR (Reg. S) | 8,800 | | 293,480 |
Canada - 1.8% |
Canadian National Railway Co. | 1,500 | | 129,522 |
Canadian Natural Resources Ltd. | 7,100 | | 213,977 |
CGI Group, Inc. Class A (sub. vtg.) (a) | 5,800 | | 151,744 |
Petrobank Energy & Resources Ltd. (a) | 15,700 | | 215,674 |
Common Stocks - continued |
| Shares | | Value |
Canada - continued |
Sandstorm Gold Ltd. (a) | 18,500 | | $ 259,139 |
Suncor Energy, Inc. | 6,400 | | 214,797 |
Westshore Terminals Investment Corp. | 7,200 | | 204,159 |
TOTAL CANADA | | 1,389,012 |
Cayman Islands - 3.5% |
AAC Acoustic Technology Holdings, Inc. | 55,000 | | 196,579 |
China Medical System Holdings Ltd. | 351,000 | | 202,446 |
China State Construction International Holdings Ltd. | 168,000 | | 200,081 |
Cimc Enric Holdings Ltd. | 316,000 | | 229,557 |
Nagacorp Ltd. | 364,000 | | 202,430 |
NetDragon WebSoft, Inc. | 287,000 | | 306,625 |
Pico Far East Holdings Ltd. | 674,000 | | 165,238 |
Sa Sa International Holdings Ltd. | 286,000 | | 196,693 |
Shenzhou International Group Holdings Ltd. | 175,000 | | 340,966 |
SITC International Holdings Co. Ltd. | 191,000 | | 50,769 |
SOHO China Ltd. | 291,500 | | 198,219 |
Tencent Holdings Ltd. | 6,000 | | 212,128 |
Towngas China Co. Ltd. | 257,000 | | 202,283 |
TOTAL CAYMAN ISLANDS | | 2,704,014 |
Finland - 0.3% |
KCI Konecranes Oyj | 6,300 | | 199,244 |
France - 3.5% |
BNP Paribas SA | 5,000 | | 251,518 |
Club Mediterranee SA (a) | 22,500 | | 357,251 |
Compagnie Generale de Geophysique SA sponsored ADR (d) | 11,800 | | 383,264 |
Eurofins Scientific SA | 1,400 | | 216,483 |
Ingenico SA | 7,760 | | 410,774 |
Sanofi SA sponsored ADR | 24,000 | | 1,052,400 |
TOTAL FRANCE | | 2,671,690 |
Germany - 2.2% |
Aareal Bank AG (a) | 10,646 | | 228,370 |
adidas AG | 2,500 | | 212,990 |
Bertrandt AG | 2,400 | | 200,800 |
Carl Zeiss Meditec AG | 7,400 | | 202,956 |
Isra Vision AG | 2,500 | | 69,555 |
KUKA AG (a) | 6,600 | | 197,868 |
MTU Aero Engines Holdings AG | 2,300 | | 193,119 |
Common Stocks - continued |
| Shares | | Value |
Germany - continued |
Rational AG | 800 | | $ 202,303 |
SAP AG | 2,824 | | 205,935 |
TOTAL GERMANY | | 1,713,896 |
Hong Kong - 0.3% |
Galaxy Entertainment Group Ltd. (a) | 57,000 | | 196,005 |
India - 6.7% |
Bata India Ltd. (a) | 11,393 | | 180,874 |
Cipla Ltd. | 13,138 | | 88,710 |
ICRA Ltd. | 6,228 | | 157,995 |
IndusInd Bank Ltd. | 28,365 | | 199,577 |
INFO Edge India Ltd. | 121,252 | | 789,642 |
Ipca Laboratories Ltd. | 27,605 | | 235,544 |
Jubilant Foodworks Ltd. (a) | 55,955 | | 1,313,466 |
Manappuram General Finance & Leasing Ltd. | 520,816 | | 356,697 |
Max India Ltd. (a) | 64,536 | | 290,385 |
Oracle Finance Services Software Ltd. (a) | 3,317 | | 178,793 |
Page Industries Ltd. | 4,642 | | 289,248 |
Pidilite Industries Ltd. (a) | 56,696 | | 202,632 |
Smithkline Beecham Consumer Healthcare Ltd. | 1,614 | | 91,102 |
Sobha Developers Ltd. (a) | 30,974 | | 206,551 |
Speciality Restaurants Ltd. | 55,563 | | 188,515 |
Talwalkars Better Value Fitness Ltd. | 28,910 | | 103,970 |
Tata Consultancy Services Ltd. | 7,907 | | 193,321 |
TOTAL INDIA | | 5,067,022 |
Indonesia - 0.8% |
PT Global Mediacom Tbk | 1,003,000 | | 237,565 |
PT Holcim Indonesia Tbk | 607,000 | | 205,387 |
PT Surya Semesta Internusa Tbk | 1,560,000 | | 191,649 |
TOTAL INDONESIA | | 634,601 |
Ireland - 1.5% |
Paddy Power PLC (Ireland) | 4,200 | | 309,972 |
Trinity Biotech PLC sponsored ADR | 60,641 | | 857,464 |
TOTAL IRELAND | | 1,167,436 |
Israel - 0.2% |
Mellanox Technologies Ltd. (a) | 1,900 | | 146,243 |
Italy - 1.1% |
De Longhi SpA | 18,200 | | 242,269 |
ENI SpA | 13,400 | | 308,346 |
Common Stocks - continued |
| Shares | | Value |
Italy - continued |
Gentium SpA sponsored ADR (a) | 4,100 | | $ 45,633 |
Prada SpA | 26,400 | | 215,286 |
TOTAL ITALY | | 811,534 |
Japan - 9.5% |
Ajinomoto Co., Inc. | 18,000 | | 274,859 |
ARNEST ONE Corp. | 10,200 | | 151,409 |
Asahi Glass Co. Ltd. | 23,000 | | 156,157 |
CAC Corp. | 22,700 | | 191,086 |
Chiyoda Corp. | 14,000 | | 225,880 |
cocokara fine HOLDINGS, Inc. | 6,100 | | 205,396 |
Cosmos Pharmaceutical Corp. | 2,500 | | 246,461 |
Credit Saison Co. Ltd. | 6,700 | | 147,126 |
Hamakyorex Co. Ltd. | 3,400 | | 106,008 |
Hitachi Capital Corp. | 15,200 | | 291,700 |
IT Holdings Corp. | 22,400 | | 278,913 |
J Trust Co. Ltd. | 15,300 | | 225,197 |
Kanto Natural Gas Development | 36,000 | | 190,304 |
Micronics Japan Co. Ltd. | 10,100 | | 36,690 |
Mitsubishi UFJ Lease & Finance Co. Ltd. | 4,250 | | 183,139 |
Monex Group, Inc. | 769 | | 130,816 |
Nihon Kohden Corp. | 8,100 | | 301,048 |
NSD Co. Ltd. | 22,800 | | 218,204 |
ORIX Corp. | 2,510 | | 257,823 |
Otsuka Corp. | 3,800 | | 309,884 |
Otsuka Holdings Co. Ltd. | 6,400 | | 197,139 |
Park24 Co. Ltd. | 11,300 | | 194,208 |
Relo Holdings Corp. | 9,200 | | 305,860 |
Ryoyo Electro Corp. | 16,500 | | 164,938 |
Sekisui House Ltd. | 23,000 | | 234,811 |
Shinsei Bank Ltd. | 242,000 | | 354,679 |
Ship Healthcare Holdings, Inc. | 13,500 | | 450,338 |
The Suruga Bank Ltd. | 24,000 | | 288,012 |
Tohokushinsha Film Corp. | 15,100 | | 105,925 |
Toshiba Plant Systems & Services Corp. | 24,000 | | 324,991 |
Tsutsumi Jewelry Co. Ltd. | 15,500 | | 355,512 |
Utoc Corp. | 18,700 | | 54,580 |
Wacom Co. Ltd. | 34 | | 98,767 |
TOTAL JAPAN | | 7,257,860 |
Korea (South) - 3.6% |
Cheil Worldwide, Inc. | 10,120 | | 194,915 |
Common Stocks - continued |
| Shares | | Value |
Korea (South) - continued |
GS Retail Co. Ltd. | 7,240 | | $ 211,824 |
Hyundai Greenfood Co. Ltd. | 12,480 | | 207,176 |
Hyundai Wia Corp. | 1,166 | | 188,751 |
KT Skylife Co. Ltd. (a) | 7,650 | | 212,944 |
LG Household & Health Care Ltd. | 561 | | 329,812 |
LIG Non-Life Insurance Co. Ltd. | 6,710 | | 171,086 |
Lotte Samkang Co. Ltd. | 382 | | 256,110 |
Orion Corp. | 224 | | 210,375 |
Paradise Co. Ltd. | 14,721 | | 246,403 |
Sajo Industries Co. Ltd. | 3,501 | | 180,778 |
Suprema, Inc. | 12,490 | | 214,215 |
UBIVELOX, Inc. (a) | 4,129 | | 100,544 |
TOTAL KOREA (SOUTH) | | 2,724,933 |
Luxembourg - 1.2% |
Altisource Portfolio Solutions SA (a) | 6,300 | | 715,050 |
L'Occitane Ltd. | 68,500 | | 213,453 |
TOTAL LUXEMBOURG | | 928,503 |
Mexico - 1.7% |
Alsea SAB de CV | 251,900 | | 403,994 |
America Movil SAB de CV Series L sponsored ADR | 10,100 | | 255,429 |
Embotelladoras Arca SAB de CC | 27,200 | | 197,363 |
Fomento Economico Mexicano SAB de CV unit | 22,100 | | 199,025 |
Grupo Financiero Banorte SAB de CV Series O | 37,400 | | 207,794 |
TOTAL MEXICO | | 1,263,605 |
Netherlands - 1.9% |
Brunel International NV | 4,200 | | 202,238 |
Gemalto NV | 6,356 | | 573,552 |
LyondellBasell Industries NV Class A | 4,900 | | 261,611 |
Unilever NV (Certificaten Van Aandelen) (Bearer) | 11,915 | | 437,932 |
TOTAL NETHERLANDS | | 1,475,333 |
New Zealand - 0.1% |
Summerset Group Holdings Ltd. | 55,476 | | 92,159 |
Norway - 0.4% |
TGS Nopec Geophysical Co. ASA | 9,700 | | 330,065 |
Panama - 0.8% |
Copa Holdings SA Class A | 2,702 | | 250,800 |
McDermott International, Inc. (a) | 33,900 | | 363,069 |
TOTAL PANAMA | | 613,869 |
Common Stocks - continued |
| Shares | | Value |
Philippines - 1.1% |
Bank of the Philippine Islands (BPI) | 103,660 | | $ 204,293 |
EastWest Banking Corp. | 385,000 | | 222,944 |
First Gen Corp. (a) | 425,000 | | 231,113 |
Vista Land & Lifescapes, Inc. | 1,755,000 | | 204,964 |
TOTAL PHILIPPINES | | 863,314 |
Russia - 0.9% |
Gazprom OAO sponsored ADR (Reg. S) | 18,700 | | 170,825 |
Vozrozhdenie Bank (a) | 27,400 | | 481,338 |
TOTAL RUSSIA | | 652,163 |
Singapore - 0.3% |
Breadtalk Group Ltd. | 209,000 | | 102,804 |
Global Logistic Properties Ltd. | 45,000 | | 94,811 |
TOTAL SINGAPORE | | 197,615 |
South Africa - 1.8% |
Assore Ltd. | 4,900 | | 202,315 |
DataTec Ltd. | 32,000 | | 198,555 |
Life Healthcare Group Holdings Ltd. | 52,000 | | 196,650 |
Naspers Ltd. Class N | 3,600 | | 233,717 |
Omnia Holdings Ltd. | 13,800 | | 204,279 |
Super Group Ltd. (a) | 179,100 | | 320,166 |
TOTAL SOUTH AFRICA | | 1,355,682 |
Sweden - 1.2% |
AarhusKarlshamn AB | 16,600 | | 653,198 |
DIBS Payment Services AB | 7,300 | | 57,230 |
Hexagon AB (B Shares) | 8,400 | | 193,255 |
TOTAL SWEDEN | | 903,683 |
Switzerland - 0.2% |
Syngenta AG (Switzerland) | 380 | | 148,158 |
Thailand - 1.5% |
Asian Property Development PCL (For. Reg.) | 1,117,900 | | 317,109 |
Berli Jucker PCL | 125,400 | | 262,698 |
Hemaraj Land & Development PCL NVDR | 1,883,000 | | 192,782 |
Kasikornbank PCL (For. Reg.) | 38,000 | | 223,019 |
Supalai PCL (For. Reg.) | 209,400 | | 131,088 |
TOTAL THAILAND | | 1,126,696 |
Turkey - 0.8% |
Koza Altin Isletmeleri A/S | 9,000 | | 195,816 |
Common Stocks - continued |
| Shares | | Value |
Turkey - continued |
Turkiye Halk Bankasi A/S | 23,000 | | $ 202,734 |
Yazicilar Holding A/S | 26,000 | | 208,145 |
TOTAL TURKEY | | 606,695 |
United Kingdom - 4.4% |
Aberdeen Asset Management PLC | 71,400 | | 373,895 |
Anite Group PLC | 89,700 | | 204,392 |
Ashtead Group PLC | 45,600 | | 274,480 |
Barclays PLC | 33,613 | | 124,292 |
Dechra Pharmaceuticals PLC | 8,500 | | 84,633 |
Domino Printing Sciences PLC | 21,300 | | 186,301 |
Genus PLC | 8,300 | | 195,286 |
Great Portland Estates PLC | 9,700 | | 73,195 |
Hikma Pharmaceuticals PLC | 16,713 | | 199,448 |
HSBC Holdings PLC (United Kingdom) | 21,000 | | 207,045 |
iomart Group PLC | 76,318 | | 245,085 |
Michael Page International PLC | 31,300 | | 182,039 |
Moneysupermarket.com Group PLC | 255,800 | | 553,148 |
Oxford Instruments PLC | 9,000 | | 195,199 |
Speedy Hire PLC | 411,500 | | 214,159 |
Whitbread PLC | 111 | | 4,209 |
TOTAL UNITED KINGDOM | | 3,316,806 |
United States of America - 38.7% |
Aceto Corp. | 46,300 | | 463,926 |
Alliance Data Systems Corp. (a) | 3,800 | | 543,590 |
American Public Education, Inc. (a) | 8,100 | | 295,083 |
Amgen, Inc. | 6,600 | | 571,197 |
AMN Healthcare Services, Inc. (a) | 24,500 | | 243,040 |
Apache Corp. | 3,900 | | 322,725 |
Apple, Inc. | 681 | | 405,263 |
Barrett Business Services, Inc. | 22,800 | | 680,124 |
Baxter International, Inc. | 800 | | 50,104 |
BB&T Corp. | 7,600 | | 220,020 |
Biogen Idec, Inc. (a) | 600 | | 82,932 |
Blucora, Inc. (a) | 18,335 | | 321,779 |
Brocade Communications Systems, Inc. (a) | 35,500 | | 188,150 |
Celgene Corp. (a) | 1,800 | | 131,976 |
Chart Industries, Inc. (a) | 2,600 | | 184,054 |
Chuys Holdings, Inc. | 700 | | 17,101 |
Computer Task Group, Inc. (a) | 35,900 | | 669,535 |
Corporate Executive Board Co. | 8,600 | | 386,656 |
Common Stocks - continued |
| Shares | | Value |
United States of America - continued |
Corrections Corp. of America | 7,100 | | $ 238,915 |
Cracker Barrel Old Country Store, Inc. | 5,100 | | 324,615 |
Discovery Communications, Inc. (a) | 3,000 | | 177,060 |
eBay, Inc. (a) | 11,000 | | 531,190 |
EPAM Systems, Inc. | 2,300 | | 41,354 |
Equifax, Inc. | 7,100 | | 355,284 |
Expedia, Inc. | 4,500 | | 266,175 |
Fiesta Restaurant Group, Inc. (a) | 32,600 | | 430,972 |
First Commonwealth Financial Corp. | 104,700 | | 685,785 |
Fiserv, Inc. (a) | 5,250 | | 393,435 |
FleetCor Technologies, Inc. (a) | 4,400 | | 208,604 |
FMC Corp. | 5,800 | | 310,416 |
Foot Locker, Inc. | 5,400 | | 180,900 |
Francescas Holdings Corp. (a) | 6,600 | | 194,898 |
General Electric Co. | 30,700 | | 646,542 |
Google, Inc. Class A (a) | 1,500 | | 1,019,655 |
Group 1 Automotive, Inc. | 3,800 | | 235,638 |
Guidance Software, Inc. (a) | 19,100 | | 232,638 |
Heartland Payment Systems, Inc. | 6,500 | | 169,520 |
Hess Corp. | 7,700 | | 402,402 |
HollyFrontier Corp. | 6,100 | | 235,643 |
Huntington Bancshares, Inc. | 20,000 | | 127,800 |
Icahn Enterprises LP rights | 8,000 | | 0 |
International Paper Co. | 2,000 | | 71,660 |
Jarden Corp. | 15,300 | | 761,940 |
Landec Corp. (a) | 49,500 | | 535,590 |
Lincoln National Corp. | 3,100 | | 76,849 |
Lithia Motors, Inc. Class A (sub. vtg.) | 6,200 | | 212,040 |
LKQ Corp. (a) | 10,600 | | 221,434 |
LSI Industries, Inc. | 29,300 | | 198,654 |
Lydall, Inc. (a) | 6,800 | | 87,788 |
Marathon Petroleum Corp. | 7,800 | | 428,454 |
Maximus, Inc. | 5,500 | | 303,490 |
Mentor Graphics Corp. (a) | 18,300 | | 284,016 |
Merck & Co., Inc. | 6,300 | | 287,469 |
Murphy Oil Corp. | 5,400 | | 324,000 |
Natus Medical, Inc. (a) | 16,300 | | 184,190 |
Papa John's International, Inc. (a) | 5,200 | | 277,264 |
PDF Solutions, Inc. (a) | 46,700 | | 618,308 |
Penske Automotive Group, Inc. | 15,300 | | 468,180 |
Phillips 66 | 8,800 | | 415,008 |
Polaris Industries, Inc. | 2,200 | | 185,900 |
Common Stocks - continued |
| Shares | | Value |
United States of America - continued |
Portfolio Recovery Associates, Inc. (a) | 1,200 | | $ 125,580 |
PPG Industries, Inc. | 1,100 | | 128,788 |
PrivateBancorp, Inc. | 3,200 | | 51,712 |
PVH Corp. | 1,300 | | 142,987 |
QEP Resources, Inc. | 7,800 | | 226,200 |
Rayonier, Inc. | 2,300 | | 112,723 |
Ross Stores, Inc. | 8,200 | | 499,790 |
Snap-On, Inc. | 900 | | 69,597 |
Sonic Automotive, Inc. Class A (sub. vtg.) | 43,000 | | 834,200 |
SurModics, Inc. (a) | 6,100 | | 109,678 |
Synopsys, Inc. (a) | 25,400 | | 817,880 |
Synta Pharmaceuticals Corp. (a) | 15,900 | | 125,133 |
Sypris Solutions, Inc. | 15,200 | | 95,760 |
Teletech Holdings, Inc. (a) | 14,400 | | 242,496 |
The Walt Disney Co. | 18,800 | | 922,516 |
Time Warner Cable, Inc. | 4,300 | | 426,173 |
TJX Companies, Inc. | 3,800 | | 158,194 |
Total System Services, Inc. | 32,000 | | 719,680 |
U.S. Bancorp | 4,600 | | 152,766 |
Valero Energy Corp. | 11,400 | | 331,740 |
Valspar Corp. | 8,900 | | 498,667 |
Viacom, Inc. Class B (non-vtg.) | 5,000 | | 256,350 |
W.R. Grace & Co. (a) | 9,000 | | 577,440 |
Wal-Mart Stores, Inc. | 5,300 | | 397,606 |
Walter Investment Management Corp. | 15,700 | | 758,781 |
Wells Fargo & Co. | 14,500 | | 488,505 |
Western Refining, Inc. | 4,800 | | 119,376 |
Wyndham Worldwide Corp. | 18,800 | | 947,520 |
TOTAL UNITED STATES OF AMERICA | | 29,466,768 |
TOTAL COMMON STOCKS (Cost $67,701,745) |
75,117,237
|
Money Market Funds - 0.4% |
| Shares | | Value |
Fidelity Cash Central Fund, 0.19% (b) | 60,014 | | $ 60,014 |
Fidelity Securities Lending Cash Central Fund, 0.19% (b)(c) | 260,000 | | 260,000 |
TOTAL MONEY MARKET FUNDS (Cost $320,014) |
320,014
|
TOTAL INVESTMENT PORTFOLIO - 99.2% (Cost $68,021,759) | | 75,437,251 |
NET OTHER ASSETS (LIABILITIES) - 0.8% | | 625,378 |
NET ASSETS - 100% | $ 76,062,629 |
Legend |
(a) Non-income producing |
(b) Affiliated fund that is available only to investment companies and other accounts managed by Fidelity Investments. The rate quoted is the annualized seven-day yield of the fund at period end. A complete unaudited listing of the fund's holdings as of its most recent quarter end is available upon request. In addition, each Fidelity Central Fund's financial statements, which are not covered by the Fund's Report of Independent Registered Public Accounting Firm, are available on the SEC's website or upon request. |
(c) Investment made with cash collateral received from securities on loan. |
(d) Security or a portion of the security is on loan at period end. |
Affiliated Central Funds |
Information regarding fiscal year to date income earned by the Fund from investments in Fidelity Central Funds is as follows: |
Fund | Income earned |
Fidelity Cash Central Fund | $ 1,682 |
Fidelity Securities Lending Cash Central Fund | 20,307 |
Total | $ 21,989 |
Other Information |
Categorizations in the Schedule of Investments are based on country or territory of incorporation. |
The following is a summary of the inputs used, as of October 31, 2012, involving the Fund's assets and liabilities carried at fair value. The inputs or methodology used for valuing securities may not be an indication of the risk associated with investing in those securities. For more information on valuation inputs, and their aggregation into the levels used in the table below, please refer to the Security Valuation section in the accompanying Notes to Financial Statements. |
Valuation Inputs at Reporting Date: |
Description | Total | Level 1 | Level 2 | Level 3 |
Investments in Securities: | | | | |
Equities: | | | | |
Consumer Discretionary | $ 16,662,301 | $ 16,662,301 | $ - | $ - |
Consumer Staples | 4,977,778 | 4,539,846 | 437,932 | - |
Energy | 5,570,308 | 5,261,962 | 308,346 | - |
Financials | 11,029,756 | 10,498,842 | 530,914 | - |
Health Care | 6,619,531 | 6,619,531 | - | - |
Industrials | 9,338,644 | 9,338,644 | - | - |
Information Technology | 16,086,050 | 15,880,115 | 205,935 | - |
Materials | 3,948,969 | 3,800,811 | 148,158 | - |
Telecommunication Services | 255,429 | 255,429 | - | - |
Utilities | 628,471 | 628,471 | - | - |
Money Market Funds | 320,014 | 320,014 | - | - |
Total Investments in Securities: | $ 75,437,251 | $ 73,805,966 | $ 1,631,285 | $ - |
The following is a summary of transfers between Level 1 and Level 2 for the period ended October 31, 2012. Transfers are assumed to have occurred at the beginning of the period, and are primarily attributable to the valuation techniques used for foreign equity securities, as discussed in the accompanying Notes to Financial Statements: |
Transfers | Total |
Level 1 to Level 2 | $ 0 |
Level 2 to Level 1 | $ 10,603,563 |
See accompanying notes which are an integral part of the financial statements.
Annual Report
Statement of Assets and Liabilities
| October 31, 2012 |
| | |
Assets | | |
Investment in securities, at value (including securities loaned of $259,840) - See accompanying schedule: Unaffiliated issuers (cost $67,701,745) | $ 75,117,237 | |
Fidelity Central Funds (cost $320,014) | 320,014 | |
Total Investments (cost $68,021,759) | | $ 75,437,251 |
Cash | | 18,776 |
Foreign currency held at value (cost $10,536) | | 10,536 |
Receivable for investments sold | | 1,862,118 |
Receivable for fund shares sold | | 25,012 |
Dividends receivable | | 59,492 |
Distributions receivable from Fidelity Central Funds | | 849 |
Other receivables | | 69,966 |
Total assets | | 77,484,000 |
| | |
Liabilities | | |
Payable for investments purchased | $ 787,739 | |
Payable for fund shares redeemed | 235,250 | |
Accrued management fee | 37,378 | |
Distribution and service plan fees payable | 21,660 | |
Other affiliated payables | 19,921 | |
Other payables and accrued expenses | 59,423 | |
Collateral on securities loaned, at value | 260,000 | |
Total liabilities | | 1,421,371 |
| | |
Net Assets | | $ 76,062,629 |
Net Assets consist of: | | |
Paid in capital | | $ 102,304,518 |
Distributions in excess of net investment income | | (48,305) |
Accumulated undistributed net realized gain (loss) on investments and foreign currency transactions | | (33,594,220) |
Net unrealized appreciation (depreciation) on investments and assets and liabilities in foreign currencies | | 7,400,636 |
Net Assets | | $ 76,062,629 |
See accompanying notes which are an integral part of the financial statements.
Annual Report
Statement of Assets and Liabilities - continued
| October 31, 2012 |
| | |
Calculation of Maximum Offering Price
Class A:
Net Asset Value and redemption price per share
($26,961,296 ÷ 2,592,971 shares) | | $ 10.40 |
| | |
Maximum offering price per share (100/94.25 of $10.40) | | $ 11.03 |
Class T:
Net Asset Value and redemption price per share ($15,730,837 ÷ 1,559,807 shares) | | $ 10.09 |
| | |
Maximum offering price per share (100/96.50 of $10.09) | | $ 10.46 |
Class B:
Net Asset Value and offering price per share ($1,401,494 ÷ 148,693 shares)A | | $ 9.43 |
| | |
Class C:
Net Asset Value and offering price per share ($9,420,804 ÷ 1,000,885 shares)A | | $ 9.41 |
| | |
| | |
Institutional Class:
Net Asset Value, offering price and redemption price per share ($22,548,198 ÷ 2,091,464 shares) | | $ 10.78 |
A Redemption price per share is equal to net asset value less any applicable contingent deferred sales charge.
See accompanying notes which are an integral part of the financial statements.
Annual Report
Financial Statements - continued
Statement of Operations
| Year ended October 31, 2012 |
| | |
Investment Income | | |
Dividends | | $ 1,393,654 |
Interest | | 2 |
Income from Fidelity Central Funds | | 21,989 |
Income before foreign taxes withheld | | 1,415,645 |
Less foreign taxes withheld | | (72,356) |
Total income | | 1,343,289 |
| | |
Expenses | | |
Management fee
Basic fee | $ 584,893 | |
Performance adjustment | (124,577) | |
Transfer agent fees | 218,147 | |
Distribution and service plan fees | 278,013 | |
Accounting and security lending fees | 43,254 | |
Custodian fees and expenses | 85,371 | |
Independent trustees' compensation | 558 | |
Registration fees | 66,707 | |
Audit | 73,511 | |
Legal | 333 | |
Miscellaneous | 1,266 | |
Total expenses before reductions | 1,227,476 | |
Expense reductions | (21,799) | 1,205,677 |
Net investment income (loss) | | 137,612 |
Realized and Unrealized Gain (Loss) Net realized gain (loss) on: | | |
Investment securities: | | |
Unaffiliated issuers | (8,549,404) | |
Foreign currency transactions | (292,648) | |
Total net realized gain (loss) | | (8,842,052) |
Change in net unrealized appreciation (depreciation) on: Investment securities | 14,577,096 | |
Assets and liabilities in foreign currencies | 81,010 | |
Total change in net unrealized appreciation (depreciation) | | 14,658,106 |
Net gain (loss) | | 5,816,054 |
Net increase (decrease) in net assets resulting from operations | | $ 5,953,666 |
See accompanying notes which are an integral part of the financial statements.
Annual Report
Statement of Changes in Net Assets
| Year ended
October 31,
2012 | Year ended
October 31,
2011 |
Increase (Decrease) in Net Assets | | |
Operations | | |
Net investment income (loss) | $ 137,612 | $ (393,823) |
Net realized gain (loss) | (8,842,052) | (13,816,008) |
Change in net unrealized appreciation (depreciation) | 14,658,106 | (16,449,325) |
Net increase (decrease) in net assets resulting
from operations | 5,953,666 | (30,659,156) |
Distributions to shareholders from net realized gain | - | (352,610) |
Share transactions - net increase (decrease) | (32,721,810) | 56,562,275 |
Redemption fees | 954 | 6,577 |
Total increase (decrease) in net assets | (26,767,190) | 25,557,086 |
| | |
Net Assets | | |
Beginning of period | 102,829,819 | 77,272,733 |
End of period (including distributions in excess of net investment income of $48,305 and undistributed net investment income of $0, respectively) | $ 76,062,629 | $ 102,829,819 |
See accompanying notes which are an integral part of the financial statements.
Annual Report
Financial Highlights - Class A
Years ended October 31, | 2012 | 2011 | 2010 | 2009 | 2008 |
Selected Per-Share Data | | | | | |
Net asset value, beginning of period | $ 9.57 | $ 11.41 | $ 9.04 | $ 6.88 | $ 15.38 |
Income from Investment Operations | | | | | |
Net investment income (loss)C | .02 | (.03) | .01 | .04 | .04 |
Net realized and unrealized gain (loss) | .81 | (1.76) | 2.47 | 2.13 | (6.74) |
Total from investment operations | .83 | (1.79) | 2.48 | 2.17 | (6.70) |
Distributions from net investment income | - | - | (.03) | (.01) | - |
Distributions from net realized gain | - | (.05) | (.08) | - | (1.80) |
Total distributions | - | (.05) | (.11) | (.01) | (1.80) |
Redemption fees added to paid in capital C, G | - | - | - | - | - |
Net asset value, end of period | $ 10.40 | $ 9.57 | $ 11.41 | $ 9.04 | $ 6.88 |
Total ReturnA, B | 8.67% | (15.81)% | 27.68% | 31.68% | (48.99)% |
Ratios to Average Net Assets D, F | | | | | |
Expenses before reductions | 1.43% | 1.51% | 1.89% | 2.22% | 1.90% |
Expenses net of fee waivers, if any | 1.43% | 1.45% | 1.50% | 1.50% | 1.50% |
Expenses net of all reductions | 1.40% | 1.43% | 1.44% | 1.43% | 1.41% |
Net investment income (loss) | .22% | (.24)% | .13% | .53% | .38% |
Supplemental Data | | | | | |
Net assets, end of period (000 omitted) | $ 26,961 | $ 36,367 | $ 30,383 | $ 6,997 | $ 6,904 |
Portfolio turnover rate E | 155% | 140% | 179% | 258% | 257% |
A Total returns would have been lower if certain expenses had not been reduced during the applicable periods shown.
B Total returns do not include the effect of the sales charges.
C Calculated based on average shares outstanding during the period.
D Fees and expenses of any underlying Fidelity Central Funds are not included in the Fund's expense ratio. The Fund indirectly bears its proportionate share of the expenses of any underlying Fidelity Central Funds.
E Amount does not include the portfolio activity of any underlying Fidelity Central Funds.
F Expense ratios reflect operating expenses of the class. Expenses before reductions do not reflect amounts reimbursed by the investment adviser or reductions from brokerage service arrangements or reductions from other expense offset arrangements and do not represent the amount paid by the class during periods when reimbursements or reductions occur. Expenses net of fee waivers reflect expenses after reimbursement by the investment adviser but prior to reductions from brokerage service arrangements or other expense offset arrangements. Expenses net of all reductions represent the net expenses paid by the class.
G Amount represents less than $.01 per share.
See accompanying notes which are an integral part of the financial statements.
Annual Report
Financial Highlights - Class T
Years ended October 31, | 2012 | 2011 | 2010 | 2009 | 2008 |
Selected Per-Share Data | | | | | |
Net asset value, beginning of period | $ 9.31 | $ 11.11 | $ 8.82 | $ 6.72 | $ 15.05 |
Income from Investment Operations | | | | | |
Net investment income (loss)C | - | (.05) | (.01) | .02 | .01 |
Net realized and unrealized gain (loss) | .78 | (1.72) | 2.39 | 2.09 | (6.59) |
Total from investment operations | .78 | (1.77) | 2.38 | 2.11 | (6.58) |
Distributions from net investment income | - | - | (.01) | (.01) | - |
Distributions from net realized gain | - | (.03) | (.08) | - | (1.75) |
Total distributions | - | (.03) | (.09) | (.01) | (1.75) |
Redemption fees added to paid in capital C, G | - | - | - | - | - |
Net asset value, end of period | $ 10.09 | $ 9.31 | $ 11.11 | $ 8.82 | $ 6.72 |
Total ReturnA, B | 8.38% | (15.97)% | 27.20% | 31.50% | (49.12)% |
Ratios to Average Net Assets D, F | | | | | |
Expenses before reductions | 1.71% | 1.80% | 2.32% | 2.50% | 2.17% |
Expenses net of fee waivers, if any | 1.70% | 1.70% | 1.75% | 1.75% | 1.75% |
Expenses net of all reductions | 1.68% | 1.68% | 1.70% | 1.69% | 1.66% |
Net investment income (loss) | (.05)% | (.49)% | (.13)% | .27% | .13% |
Supplemental Data | | | | | |
Net assets, end of period (000 omitted) | $ 15,731 | $ 24,180 | $ 23,237 | $ 10,494 | $ 8,104 |
Portfolio turnover rateE | 155% | 140% | 179% | 258% | 257% |
A Total returns would have been lower if certain expenses had not been reduced during the applicable periods shown.
B Total returns do not include the effect of the sales charges.
C Calculated based on average shares outstanding during the period.
D Fees and expenses of any underlying Fidelity Central Funds are not included in the Fund's expense ratio. The Fund indirectly bears its proportionate share of the expenses of any underlying Fidelity Central Funds.
E Amount does not include the portfolio activity of any underlying Fidelity Central Funds.
F Expense ratios reflect operating expenses of the class. Expenses before reductions do not reflect amounts reimbursed by the investment adviser or reductions from brokerage service arrangements or reductions from other expense offset arrangements and do not represent the amount paid by the class during periods when reimbursements or reductions occur. Expenses net of fee waivers reflect expenses after reimbursement by the investment adviser but prior to reductions from brokerage service arrangements or other expense offset arrangements. Expenses net of all reductions represent the net expenses paid by the class.
G Amount represents less than $.01 per share.
See accompanying notes which are an integral part of the financial statements.
Annual Report
Financial Highlights - Class B
Years ended October 31, | 2012 | 2011 | 2010 | 2009 | 2008 |
Selected Per-Share Data | | | | | |
Net asset value, beginning of period | $ 8.74 | $ 10.46 | $ 8.31 | $ 6.37 | $ 14.34 |
Income from Investment Operations | | | | | |
Net investment income (loss) C | (.05) | (.10) | (.06) | (.02) | (.04) |
Net realized and unrealized gain (loss) | .74 | (1.62) | 2.26 | 1.97 | (6.25) |
Total from investment operations | .69 | (1.72) | 2.20 | 1.95 | (6.29) |
Distributions from net investment income | - | - | - | (.01) | - |
Distributions from net realized gain | - | - G | (.05) | - | (1.68) |
Total distributions | - | - G | (.05) | (.01) | (1.68) |
Redemption fees added to paid in capital C, G | - | - | - | - | - |
Net asset value, end of period | $ 9.43 | $ 8.74 | $ 10.46 | $ 8.31 | $ 6.37 |
Total ReturnA, B | 7.89% | (16.42)% | 26.64% | 30.62% | (49.33)% |
Ratios to Average Net Assets D, F | | | | | |
Expenses before reductions | 2.19% | 2.32% | 2.82% | 2.98% | 2.66% |
Expenses net of fee waivers, if any | 2.19% | 2.20% | 2.25% | 2.25% | 2.25% |
Expenses net of all reductions | 2.17% | 2.18% | 2.19% | 2.18% | 2.16% |
Net investment income (loss) | (.54)% | (.99)% | (.62)% | (.22)% | (.37)% |
Supplemental Data | | | | | |
Net assets, end of period (000 omitted) | $ 1,401 | $ 1,926 | $ 2,731 | $ 2,162 | $ 1,918 |
Portfolio turnover rate E | 155% | 140% | 179% | 258% | 257% |
A Total returns would have been lower if certain expenses had not been reduced during the applicable periods shown.
B Total returns do not include the effect of the contingent deferred sales charge.
C Calculated based on average shares outstanding during the period.
D Fees and expenses of any underlying Fidelity Central Funds are not included in the Fund's expense ratio. The Fund indirectly bears its proportionate share of the expenses of any underlying Fidelity Central Funds.
E Amount does not include the portfolio activity of any underlying Fidelity Central Funds.
F Expense ratios reflect operating expenses of the class. Expenses before reductions do not reflect amounts reimbursed by the investment adviser or reductions from brokerage service arrangements or reductions from other expense offset arrangements and do not represent the amount paid by the class during periods when reimbursements or reductions occur. Expenses net of fee waivers reflect expenses after reimbursement by the investment adviser but prior to reductions from brokerage service arrangements or other expense offset arrangements. Expenses net of all reductions represent the net expenses paid by the class.
G Amount represents less than $.01 per share.
See accompanying notes which are an integral part of the financial statements.
Annual Report
Financial Highlights - Class C
Years ended October 31, | 2012 | 2011 | 2010 | 2009 | 2008 |
Selected Per-Share Data | | | | | |
Net asset value, beginning of period | $ 8.73 | $ 10.46 | $ 8.31 | $ 6.37 | $ 14.36 |
Income from Investment Operations | | | | | |
Net investment income (loss) C | (.05) | (.10) | (.06) | (.02) | (.04) |
Net realized and unrealized gain (loss) | .73 | (1.61) | 2.27 | 1.97 | (6.26) |
Total from investment operations | .68 | (1.71) | 2.21 | 1.95 | (6.30) |
Distributions from net investment income | - | - | - | (.01) | - |
Distributions from net realized gain | - | (.02) | (.06) | - | (1.69) |
Total distributions | - | (.02) | (.06) | (.01) | (1.69) |
Redemption fees added to paid in capital C, G | - | - | - | - | - |
Net asset value, end of period | $ 9.41 | $ 8.73 | $ 10.46 | $ 8.31 | $ 6.37 |
Total Return A, B | 7.79% | (16.38)% | 26.68% | 30.62% | (49.35)% |
Ratios to Average Net Assets D, F | | | | | |
Expenses before reductions | 2.18% | 2.28% | 2.77% | 2.97% | 2.63% |
Expenses net of fee waivers, if any | 2.18% | 2.20% | 2.25% | 2.25% | 2.25% |
Expenses net of all reductions | 2.16% | 2.18% | 2.20% | 2.18% | 2.16% |
Net investment income (loss) | (.53)% | (.99)% | (.63)% | (.22)% | (.37)% |
Supplemental Data | | | | | |
Net assets, end of period (000 omitted) | $ 9,421 | $ 11,632 | $ 7,986 | $ 3,378 | $ 2,697 |
Portfolio turnover rate E | 155% | 140% | 179% | 258% | 257% |
A Total returns would have been lower if certain expenses had not been reduced during the applicable periods shown.
B Total returns do not include the effect of the contingent deferred sales charge.
C Calculated based on average shares outstanding during the period.
D Fees and expenses of any underlying Fidelity Central Funds are not included in the Fund's expense ratio. The Fund indirectly bears its proportionate share of the expenses of any underlying Fidelity Central Funds.
E Amount does not include the portfolio activity of any underlying Fidelity Central Funds.
F Expense ratios reflect operating expenses of the class. Expenses before reductions do not reflect amounts reimbursed by the investment adviser or reductions from brokerage service arrangements or reductions from other expense offset arrangements and do not represent the amount paid by the class during periods when reimbursements or reductions occur. Expenses net of fee waivers reflect expenses after reimbursement by the investment adviser but prior to reductions from brokerage service arrangements or other expense offset arrangements. Expenses net of all reductions represent the net expenses paid by the class.
G Amount represents less than $.01 per share.
See accompanying notes which are an integral part of the financial statements.
Annual Report
Financial Highlights - Institutional Class
Years ended October 31, | 2012 | 2011 | 2010 | 2009 | 2008 |
Selected Per-Share Data | | | | | |
Net asset value, beginning of period | $ 9.88 | $ 11.76 | $ 9.31 | $ 7.07 | $ 15.76 |
Income from Investment Operations | | | | | |
Net investment income (loss) B | .06 | - F | .04 | .06 | .07 |
Net realized and unrealized gain (loss) | .84 | (1.82) | 2.54 | 2.20 | (6.93) |
Total from investment operations | .90 | (1.82) | 2.58 | 2.26 | (6.86) |
Distributions from net investment income | - | - | (.05) | (.02) | - |
Distributions from net realized gain | - | (.06) | (.08) | - | (1.83) |
Total distributions | - | (.06) | (.13) | (.02) | (1.83) |
Redemption fees added to paid in capital B, F | - | - | - | - | - |
Net asset value, end of period | $ 10.78 | $ 9.88 | $ 11.76 | $ 9.31 | $ 7.07 |
Total Return A | 9.11% | (15.60)% | 28.00% | 32.03% | (48.89)% |
Ratios to Average Net Assets C, E | | | | | |
Expenses before reductions | 1.06% | 1.18% | 1.43% | 1.88% | 1.51% |
Expenses net of fee waivers, if any | 1.06% | 1.17% | 1.25% | 1.25% | 1.25% |
Expenses net of all reductions | 1.03% | 1.15% | 1.19% | 1.18% | 1.16% |
Net investment income (loss) | .59% | .04% | .38% | .78% | .63% |
Supplemental Data | | | | | |
Net assets, end of period (000 omitted) | $ 22,548 | $ 28,725 | $ 12,936 | $ 1,148 | $ 1,166 |
Portfolio turnover rate D | 155% | 140% | 179% | 258% | 257% |
A Total returns would have been lower if certain expenses had not been reduced during the applicable periods shown.
B Calculated based on average shares outstanding during the period.
C Fees and expenses of any underlying Fidelity Central Funds are not included in the Fund's expense ratio. The Fund indirectly bears its proportionate share of the expenses of any underlying Fidelity Central Funds.
D Amount does not include the portfolio activity of any underlying Fidelity Central Funds.
E Expense ratios reflect operating expenses of the class. Expenses before reductions do not reflect amounts reimbursed by the investment adviser or reductions from brokerage service arrangements or reductions from other expense offset arrangements and do not represent the amount paid by the class during periods when reimbursements or reductions occur. Expenses net of fee waivers reflect expenses after reimbursement by the investment adviser but prior to reductions from brokerage service arrangements or other expense offset arrangements. Expenses net of all reductions represent the net expenses paid by the class.
F Amount represents less than $.01 per share.
See accompanying notes which are an integral part of the financial statements.
Annual Report
Notes to Financial Statements
For the period ended October 31, 2012
1. Organization.
Fidelity Advisor Global Capital Appreciation Fund (the Fund) is a fund of Fidelity Advisor Series VIII (the Trust) and is authorized to issue an unlimited number of shares. The Trust is registered under the Investment Company Act of 1940, as amended (the 1940 Act), as an open-end management investment company organized as a Massachusetts business trust. The Fund offers Class A, Class T, Class C, and Institutional Class shares, each of which, along with Class B shares, has equal rights as to assets and voting privileges. Effective after the close of business on September 1, 2010, Class B shares were closed to new accounts and additional purchases, except for exchanges and reinvestments. Each class has exclusive voting rights with respect to matters that affect that class. Class B shares will automatically convert to Class A shares after a holding period of seven years from the initial date of purchase. Investment income, realized and unrealized capital gains and losses, the common expenses of the Fund, and certain fund-level expense reductions, if any, are allocated on a pro-rata basis to each class based on the relative net assets of each class to the total net assets of the Fund. Each class differs with respect to transfer agent and distribution and service plan fees incurred. Certain expense reductions may also differ by class. The Fund's investments in emerging markets can be subject to social, economic, regulatory, and political uncertainties and can be extremely volatile.
2. Investments in Fidelity Central Funds.
The Fund invests in Fidelity Central Funds, which are open-end investment companies available only to other investment companies and accounts managed by Fidelity Management & Research Company (FMR) and its affiliates. The Fund's Schedule of Investments lists each of the Fidelity Central Funds held as of period end, if any, as an investment of the Fund, but does not include the underlying holdings of each Fidelity Central Fund. As an Investing Fund, the Fund indirectly bears its proportionate share of the expenses of the underlying Fidelity Central Funds.
The Money Market Central Funds seek preservation of capital and current income and are managed by Fidelity Investments Money Management, Inc. (FIMM), an affiliate of FMR.
A complete unaudited list of holdings for each Fidelity Central Fund is available upon request or at the Securities and Exchange Commission (the SEC) web site at www.sec.gov. In addition, the financial statements of the Fidelity Central Funds, which are not covered by the Fund's Report of Independent Registered Public Accounting Firm, are available on the SEC web site or upon request.
Annual Report
3. Significant Accounting Policies.
The financial statements have been prepared in conformity with accounting principles generally accepted in the United States of America (GAAP), which require management to make certain estimates and assumptions at the date of the financial statements. Actual results could differ from those estimates. Subsequent events, if any, through the date that the financial statements were issued have been evaluated in the preparation of the financial statements. The following summarizes the significant accounting policies of the Fund:
Security Valuation. Investments are valued as of 4:00 p.m. Eastern time on the last calendar day of the period. In accordance with valuation policies and procedures approved by the Board of Trustees (the Board), the Fund attempts to obtain prices from one or more third party pricing vendors or brokers to value its investments. When current market prices, quotations or rates are not readily available or reliable, securities will be fair valued in good faith by the FMR Fair Value Committee (the Committee), in accordance with procedures adopted by the Fund's Board. Factors used in determining fair value vary by security type and may include market or security specific events. The frequency with which these procedures are used cannot be predicted and they may be utilized to a significant extent. The Committee oversees the Fund's valuation policies and procedures and is responsible for approving and reporting to the Board all fair value determinations.
The Fund categorizes the inputs to valuation techniques used to value its investments into a disclosure hierarchy consisting of three levels as shown below:
Level 1 - quoted prices in active markets for identical investments
Level 2 - other significant observable inputs (including quoted prices for similar investments, interest rates, prepayment speeds, etc.)
Level 3 - unobservable inputs (including the Fund's own assumptions based on the best information available)
Valuation techniques used to value the Fund's investments by major category are as follows:
Equity securities, including restricted securities, for which market quotations are readily available, are valued at the last reported sale price or official closing price as reported by a third party pricing vendor on the primary market or exchange on which they are traded and are categorized as Level 1 in the hierarchy. In the event there were no sales during the day or closing prices are not available, securities are valued at the last quoted bid price or may be valued using the last available price and are generally categorized as Level 2 in the hierarchy. For foreign equity securities, when significant market or security specific events arise, comparisons to the valuation of American Depositary Receipts
Annual Report
Notes to Financial Statements - continued
3. Significant Accounting Policies - continued
Security Valuation - continued
(ADRs), futures contracts, Exchange-Traded Funds (ETFs) and certain indexes as well as quoted prices for similar securities are used and are categorized as Level 2 in the hierarchy. Utilizing these techniques may result in transfers between Level 1 and Level 2.
Investments in open-end mutual funds, including the Fidelity Central Funds, are valued at their closing net asset value (NAV) each business day and are categorized as Level 1 in the hierarchy.
Changes in valuation techniques may result in transfers in or out of an assigned level within the disclosure hierarchy. The aggregate value of investments by input level, as of October 31, 2012, including information on transfers between Levels 1 and 2, is included at the end of the applicable Fund's Schedule of Investments.
Foreign Currency Translation. The Fund may use foreign currency contracts to facilitate transactions in foreign-denominated securities. Gains and losses from these transactions may arise from changes in the value of the foreign currency or if the counterparties do not perform under the contracts' terms.
Foreign-denominated assets, including investment securities, and liabilities are translated into U.S. dollars at the exchange rates at period end. Purchases and sales of investment securities, income and dividends received and expenses denominated in foreign currencies are translated into U.S. dollars at the exchange rate in effect on the transaction date.
The effects of exchange rate fluctuations on investments are included with the net realized and unrealized gain (loss) on investment securities. Other foreign currency transactions resulting in realized and unrealized gain (loss) are disclosed separately.
Investment Transactions and Income. For financial reporting purposes, the Fund's investment holdings and NAV include trades executed through the end of the last business day of the period. The NAV per share for processing shareholder transactions is calculated as of the close of business of the New York Stock Exchange (NYSE), normally 4:00 p.m. Eastern time and includes trades executed through the end of the prior business day. Gains and losses on securities sold are determined on the basis of identified cost and may include proceeds received from litigation. Dividend income is recorded on the ex-dividend date, except for certain dividends from foreign securities where the ex-dividend date may have passed, which are recorded as soon as the Fund is informed of the ex-dividend date. Non-cash dividends included in dividend income, if any, are recorded at the fair market value of the securities received. Distributions received on securities that represent a return of capital or capital gain are recorded as a reduction of cost of investments and/or as a realized gain. The Fund estimates the components of distributions received that may be considered return of capital distributions or capital gain distributions. Interest income and distributions from the Fidelity Central Funds are accrued as earned. Interest income includes coupon interest and amortization of
Annual Report
3. Significant Accounting Policies - continued
Investment Transactions and Income - continued
premium and accretion of discount on debt securities. Investment income is recorded net of foreign taxes withheld where recovery of such taxes is uncertain.
Expenses. Expenses directly attributable to a fund are charged to that fund. Expenses attributable to more than one fund are allocated among the respective funds on the basis of relative net assets or other appropriate methods. Expense estimates are accrued in the period to which they relate and adjustments are made when actual amounts are known.
Income Tax Information and Distributions to Shareholders. Each year, the Fund intends to qualify as a regulated investment company under Subchapter M of the Internal Revenue Code, including distributing substantially all of its taxable income and realized gains. As a result, no provision for income taxes is required. As of October 31, 2012, the Fund did not have any unrecognized tax benefits in the financial statements; nor is the Fund aware of any tax positions for which it is reasonably possible that the total amounts of unrecognized tax benefits will significantly change in the next twelve months. The Fund files a U.S. federal tax return, in addition to state and local tax returns as required. A fund's federal income tax returns are subject to examination by the Internal Revenue Service (IRS) for a period of three fiscal years after they are filed. State and local tax returns may be subject to examination for an additional fiscal year depending on the jurisdiction. Foreign taxes are provided for based on the Fund's understanding of the tax rules and rates that exist in the foreign markets in which it invests.
Distributions are declared and recorded on the ex-dividend date. Income dividends and capital gain distributions are declared separately for each class. Income and capital gain distributions are determined in accordance with income tax regulations, which may differ from GAAP.
Capital accounts within the financial statements are adjusted for permanent book-tax differences. These adjustments have no impact on net assets or the results of operations. Temporary book-tax differences will reverse in a subsequent period.
Book-tax differences are primarily due to foreign currency transactions, passive foreign investment companies (PFIC), net operating losses, capital loss carryforwards, losses deferred due to wash sales and excise tax regulations.
The federal tax cost of investment securities and unrealized appreciation (depreciation) as of period end were as follows:
Gross unrealized appreciation | $ 9,237,229 |
Gross unrealized depreciation | (2,031,244) |
Net unrealized appreciation (depreciation) on securities and other investments | $ 7,205,985 |
| |
Tax Cost | $ 68,231,266 |
Annual Report
Notes to Financial Statements - continued
3. Significant Accounting Policies - continued
Income Tax Information and Distributions to Shareholders - continued
The tax-based components of distributable earnings as of period end were as follows:
Capital loss carryforward | $ (33,384,711) |
Net unrealized appreciation (depreciation) | $ 7,191,129 |
Capital loss carryforwards are only available to offset future capital gains of the Fund to the extent provided by regulations and may be limited. Under the Regulated Investment Company Modernization Act of 2010 (the Act), the Fund is permitted to carry forward capital losses incurred in taxable years beginning after December 22, 2010 for an unlimited period and such capital losses are required to be used prior to any losses that expire. Capital loss carryforwards were as follows:
Fiscal year of expiration | |
2016 | $ (7,618,418) |
2017 | (3,018,401) |
2019 | (14,114,488) |
Total with expiration | (24,751,307) |
No expiration | |
Short-term | (3,098,913) |
Long-term | (5,534,491) |
Total with expiration | (8,633,404) |
Total capital loss carryforward | $ (33,384,711) |
The tax character of distributions paid was as follows:
| October 31, 2012 | October 31, 2011 |
Ordinary Income | $ - | $ 352,610 |
Short-Term Trading (Redemption) Fees. Shares held by investors in the Fund less than 30 days are subject to a redemption fee equal to 1.00% of the net asset value of shares redeemed. All redemption fees, which reduce the proceeds of the shareholder redemption, are retained by the Fund and accounted for as an addition to paid in capital.
New Accounting Pronouncement. In December 2011, the Financial Accounting Standards Board issued Accounting Standard Update No. 2011-11, Disclosures about Offsetting Assets and Liabilities. The update creates new disclosure requirements requiring entities to disclose both gross and net information for derivatives and other financial instruments that are either offset in the Statement of Assets and Liabilities or subject to an enforceable master netting arrangement or similar agreement. The disclosure requirements are effective for annual reporting periods beginning on or after January 1, 2013, and interim periods within those annual periods. Management is currently evaluating the impact of the update's adoption on the Fund's financial statement disclosures.
Annual Report
4. Purchases and Sales of Investments.
Purchases and sales of securities, other than short-term securities, aggregated $126,904,961 and $158,603,258, respectively.
5. Fees and Other Transactions with Affiliates.
Management Fee. FMR and its affiliates provide the Fund with investment management related services for which the Fund pays a monthly management fee. The management fee is the sum of an individual fund fee rate that is based on an annual rate of .45% of the Fund's average net assets and an annualized group fee rate that averaged .26% during the period. The group fee rate is based upon the average net assets of all the mutual funds advised by FMR. The group fee rate decreases as assets under management increase and increases as assets under management decrease. In addition, the management fee is subject to a performance adjustment (up to a maximum of ±.20% of the Fund's average net assets over a 36 month performance period). The upward or downward adjustment to the management fee is based on the relative investment performance of the Institutional Class of the Fund as compared to an appropriate benchmark index. For the period, the total annual management fee rate, including the performance adjustment, was .56% of the Fund's average net assets.
Distribution and Service Plan Fees. In accordance with Rule 12b-1 of the 1940 Act, the Fund has adopted separate Distribution and Service Plans for each class of shares. Certain classes pay Fidelity Distributors Corporation (FDC), an affiliate of FMR, separate Distribution and Service Fees, each of which is based on an annual percentage of each class' average net assets. In addition, FDC may pay financial intermediaries for selling shares of the Fund and providing shareholder support services. For the period, the Distribution and Service Fee rates, total fees and amounts retained by FDC were as follows:
| Distribution
Fee | Service
Fee | Total Fees | Retained
by FDC |
Class A | -% | .25% | $ 73,639 | $ 1,326 |
Class T | .25% | .25% | 90,090 | - |
Class B | .75% | .25% | 15,649 | 11,756 |
Class C | .75% | .25% | 98,635 | 20,443 |
| | | $ 278,013 | $ 33,525 |
Sales Load. FDC may receive a front-end sales charge of up to 5.75% for selling Class A shares and 3.50% for selling Class T shares, some of which is paid to financial intermediaries for selling shares of the Fund. Depending on the holding period, FDC may receive contingent deferred sales charges levied on Class A, Class T, Class B, and Class C redemptions. The deferred sales charges range from 5.00% to 1.00% for Class B shares, 1.00% for Class C shares, 1.00% for certain purchases of Class A shares and .25% for certain purchases of Class T shares.
Annual Report
Notes to Financial Statements - continued
5. Fees and Other Transactions with Affiliates - continued
Sales Load - continued
For the period, sales charge amounts retained by FDC were as follows:
| Retained
by FDC |
Class A | $ 9,613 |
Class T | 2,513 |
Class B* | 1,951 |
Class C* | 4,906 |
| $ 18,983 |
* When Class B and Class C shares are initially sold, FDC pays commissions from its own resources to financial intermediaries through which the sales
are made.
Transfer Agent Fees. Fidelity Investments Institutional Operations Company, Inc. (FIIOC), an affiliate of FMR, is the transfer, dividend disbursing and shareholder servicing agent for each class of the Fund. FIIOC receives account fees and asset-based fees that vary according to the account size and type of account of the shareholders of the respective classes of the Fund. FIIOC pays for typesetting, printing and mailing of shareholder reports, except proxy statements. For the period, transfer agent fees for each class were as follows:
| Amount | % of
Average
Net Assets |
Class A | $ 86,247 | .29 |
Class T | 56,216 | .31 |
Class B | 4,727 | .30 |
Class C | 29,690 | .30 |
Institutional Class | 41,267 | .17 |
| $ 218,147 | |
Accounting and Security Lending Fees. Fidelity Service Company, Inc. (FSC), an affiliate of FMR, maintains the Fund's accounting records. The accounting fee is based on the level of average net assets for each month. Under a separate contract, FSC administers the security lending program. The security lending fee is based on the number and duration of lending transactions.
Brokerage Commissions. The Fund placed a portion of its portfolio transactions with brokerage firms which are affiliates of the investment adviser. The commissions paid to these affiliated firms were $2,857 for the period.
Annual Report
6. Committed Line of Credit.
The Fund participates with other funds managed by FMR or an affiliate in a $4.25 billion credit facility (the "line of credit") to be utilized for temporary or emergency purposes to fund shareholder redemptions or for other short-term liquidity purposes. The Fund has agreed to pay commitment fees on its pro-rata portion of the line of credit, which amounted to $235 and is reflected in Miscellaneous expenses on the Statement of Operations. During the period, there were no borrowings on this line of credit.
7. Security Lending.
The Fund lends portfolio securities through a lending agent from time to time in order to earn additional income. For equity securities, a lending agent is used and may loan securities to certain qualified borrowers, including Fidelity Capital Markets (FCM), a broker-dealer affiliated with the Fund. On the settlement date of the loan, the Fund receives collateral (in the form of U.S. Treasury obligations, letters of credit and/or cash) against the loaned securities and maintains collateral in an amount not less than 100% of the market value of the loaned securities during the period of the loan. The market value of the loaned securities is determined at the close of business of the Fund and any additional required collateral is delivered to the Fund on the next business day. If the borrower defaults on its obligation to return the securities loaned because of insolvency or other reasons, a fund could experience delays and costs in recovering the securities loaned or in gaining access to the collateral. Any cash collateral received is invested in the Fidelity Securities Lending Cash Central Fund. The value of loaned securities and cash collateral at period end are disclosed on the Fund's Statement of Assets and Liabilities. Security lending income represents the income earned on investing cash collateral, less rebates paid to borrowers and any lending agent fees associated with the loan, plus any premium payments received for lending certain types of securities. Security lending income is presented in the Statement of Operations as a component of income from Fidelity Central Funds. Total security lending income during the period amounted to $20,307. During the period, there were no securities loaned to FCM.
8. Expense Reductions.
FMR contractually agreed to reimburse each class to the extent annual operating expenses exceeded certain levels of average net assets as noted in the table below. This reimbursement will remain in place through December 31, 2013. Some expenses, for example interest expense, including commitment fees, are excluded from this reimbursement.
The following classes were in reimbursement during the period:
| Expense
Limitations | Reimbursement
from adviser |
Class T | 1.70% | $ 1,023 |
Annual Report
Notes to Financial Statements - continued
8. Expense Reductions - continued
Many of the brokers with whom FMR places trades on behalf of the Fund provided services to the Fund in addition to trade execution. These services included payments of certain expenses on behalf of the Fund totaling $20,776 for the period.
9. Distributions to Shareholders.
Distributions to shareholders of each class were as follows:
Years ended October 31, | 2012 | 2011 |
From net realized gain | | |
Class A | $ - | $ 149,904 |
Class T | - | 82,578 |
Class B | - | 761 |
Class C | - | 23,129 |
Institutional Class | - | 96,238 |
Total | $ - | $ 352,610 |
10. Share Transactions.
Transactions for each class of shares were as follows:
| Shares | Dollars |
Years ended October 31, | 2012 | 2011 | 2012 | 2011 |
Class A | | | | |
Shares sold | 289,606 | 3,313,300 | $ 2,795,636 | $ 38,257,984 |
Reinvestment of distributions | - | 11,121 | - | 130,500 |
Shares redeemed | (1,497,004) | (2,187,648) | (14,297,470) | (23,557,856) |
Net increase (decrease) | (1,207,398) | 1,136,773 | $ (11,501,834) | $ 14,830,628 |
Class T | | | | |
Shares sold | 143,871 | 1,500,646 | $ 1,346,334 | $ 16,821,913 |
Reinvestment of distributions | - | 7,107 | - | 81,139 |
Shares redeemed | (1,182,171) | (1,001,188) | (10,957,476) | (10,370,670) |
Net increase (decrease) | (1,038,300) | 506,565 | $ (9,611,142) | $ 6,532,382 |
Class B | | | | |
Shares sold | 2,998 | 67,595 | $ 28,531 | $ 715,061 |
Reinvestment of distributions | - | 70 | - | 677 |
Shares redeemed | (74,674) | (108,399) | (653,939) | (1,075,608) |
Net increase (decrease) | (71,676) | (40,734) | $ (625,408) | $ (359,870) |
Class C | | | | |
Shares sold | 167,706 | 1,263,963 | $ 1,486,514 | $ 13,329,175 |
Reinvestment of distributions | - | 1,981 | - | 21,056 |
Shares redeemed | (499,534) | (696,642) | (4,342,453) | (6,685,064) |
Net increase (decrease) | (331,828) | 569,302 | $ (2,855,939) | $ 6,665,167 |
Institutional Class | | | | |
Shares sold | 271,800 | 6,587,351 | $ 2,679,773 | $ 79,174,965 |
Reinvestment of distributions | - | 6,022 | - | 72,484 |
Shares redeemed | (1,086,428) | (4,787,531) | (10,807,260) | (50,353,481) |
Net increase (decrease) | (814,628) | 1,805,842 | $ (8,127,487) | $ 28,893,968 |
Annual Report
11. Other.
The Fund's organizational documents provide former and current trustees and officers with a limited indemnification against liabilities arising in connection with the performance of their duties to the Fund. In the normal course of business, the Fund may also enter into contracts that provide general indemnifications. The Fund's maximum exposure under these arrangements is unknown as this would be dependent on future claims that may be made against the Fund. The risk of material loss from such claims is considered remote.
At the end of the period, Strategic Advisers International II Fund was the owner of record of approximately 13% of the total outstanding shares of the Fund.
Annual Report
To the Trustees of Fidelity Advisor Series VIII and the Shareholders of Fidelity Advisor Global Capital Appreciation Fund:
In our opinion, the accompanying statement of assets and liabilities, including the schedule of investments, and the related statements of operations and of changes in net assets and the financial highlights present fairly, in all material respects, the financial position of Fidelity Advisor Global Capital Appreciation Fund (a fund of Fidelity Advisor Series VIII) at October 31, 2012, the results of its operations for the year then ended, the changes in its net assets for each of the two years in the period then ended and the financial highlights for each of the five years in the period then ended, in conformity with accounting principles generally accepted in the United States of America. These financial statements and financial highlights (hereafter referred to as "financial statements") are the responsibility of the Fidelity Advisor Global Capital Appreciation Fund's management. Our responsibility is to express an opinion on these financial statements based on our audits. We conducted our audits of these financial statements in accordance with the standards of the Public Company Accounting Oversight Board (United States). Those standards require that we plan and perform the audit to obtain reasonable assurance about whether the financial statements are free of material misstatement. An audit includes examining, on a test basis, evidence supporting the amounts and disclosures in the financial statements, assessing the accounting principles used and significant estimates made by management, and evaluating the overall financial statement presentation. We believe that our audits, which included confirmation of securities at October 31, 2012 by correspondence with the custodian and brokers, provide a reasonable basis for our opinion.
PricewaterhouseCoopers LLP
Boston, Massachusetts
December 14, 2012
Annual Report
The Trustees, Members of the Advisory Board, and executive officers of the trust and fund, as applicable, are listed below. The Board of Trustees governs the fund and is responsible for protecting the interests of shareholders. The Trustees are experienced executives who meet periodically throughout the year to oversee the fund's activities, review contractual arrangements with companies that provide services to the fund, oversee management of the risks associated with such activities and contractual arrangements, and review the fund's performance. Except for James C. Curvey, each of the Trustees oversees 236 funds advised by FMR or an affiliate. Mr. Curvey oversees 443 funds advised by FMR or an affiliate.
The Trustees hold office without limit in time except that (a) any Trustee may resign; (b) any Trustee may be removed by written instrument, signed by at least two-thirds of the number of Trustees prior to such removal; (c) any Trustee who requests to be retired or who has become incapacitated by illness or injury may be retired by written instrument signed by a majority of the other Trustees; and (d) any Trustee may be removed at any special meeting of shareholders by a two-thirds vote of the outstanding voting securities of the trust. Each Trustee who is not an interested person (as defined in the 1940 Act) (Independent Trustee), shall retire not later than the last day of the calendar year in which his or her 75th birthday occurs. The Independent Trustees may waive this mandatory retirement age policy with respect to individual Trustees. The executive officers and Advisory Board Members hold office without limit in time, except that any officer and Advisory Board Member may resign or may be removed by a vote of a majority of the Trustees at any regular meeting or any special meeting of the Trustees. Except as indicated, each individual has held the office shown or other offices in the same company for the past five years.
Experience, Skills, Attributes, and Qualifications of the Fund's Trustees. The Governance and Nominating Committee has adopted a statement of policy that describes the experience, qualifications, attributes, and skills that are necessary and desirable for potential Independent Trustee candidates (Statement of Policy). The Board believes that each Trustee satisfied at the time he or she was initially elected or appointed a Trustee, and continues to satisfy, the standards contemplated by the Statement of Policy. The Governance and Nominating Committee also engages professional search firms to help identify potential Independent Trustee candidates who have the experience, qualifications, attributes, and skills consistent with the Statement of Policy. From time to time, additional criteria based on the composition and skills of the current Independent Trustees, as well as experience or skills that may be appropriate in light of future changes to board composition, business conditions, and regulatory or other developments, have also been considered by the professional search firms and the Governance and Nominating Committee. In addition, the Board takes into account the Trustees' commitment and participation in Board and committee meetings, as well as their leadership of standing and ad hoc committees throughout their tenure.
In determining that a particular Trustee was and continues to be qualified to serve as a Trustee, the Board has considered a variety of criteria, none of which, in isolation, was controlling. The Board believes that, collectively, the Trustees have balanced and diverse experience, qualifications, attributes, and skills, which allow the Board to operate effectively in governing the fund and protecting the interests of shareholders. Information about the specific experience, skills, attributes, and qualifications of each Trustee, which in each case led to the Board's conclusion that the Trustee should serve (or continue to serve) as a trustee of the fund, is provided below.
Annual Report
Board Structure and Oversight Function. James C. Curvey is an interested person (as defined in the 1940 Act) and currently serves as Chairman. The Trustees have determined that an interested Chairman is appropriate and benefits shareholders because an interested Chairman has a personal and professional stake in the quality and continuity of services provided to the fund. Independent Trustees exercise their informed business judgment to appoint an individual of their choosing to serve as Chairman, regardless of whether the Trustee happens to be independent or a member of management. The Independent Trustees have determined that they can act independently and effectively without having an Independent Trustee serve as Chairman and that a key structural component for assuring that they are in a position to do so is for the Independent Trustees to constitute a substantial majority for the Board. The Independent Trustees also regularly meet in executive session. Ned C. Lautenbach serves as Chairman of the Independent Trustees and as such (i) acts as a liaison between the Independent Trustees and management with respect to matters important to the Independent Trustees and (ii) with management prepares agendas for Board meetings.
Fidelity funds are overseen by different Boards of Trustees. The fund's Board oversees Fidelity's equity and high income funds and another Board oversees Fidelity's investment-grade bond, money market, and asset allocation funds. The asset allocation funds may invest in Fidelity funds overseen by the fund's Board. The use of separate Boards, each with its own committee structure, allows the Trustees of each group of Fidelity funds to focus on the unique issues of the funds they oversee, including common research, investment, and operational issues. On occasion, the separate Boards establish joint committees to address issues of overlapping consequences for the Fidelity funds overseen by each Board.
The Trustees operate using a system of committees to facilitate the timely and efficient consideration of all matters of importance to the Trustees, the fund, and fund shareholders and to facilitate compliance with legal and regulatory requirements and oversight of the fund's activities and associated risks. The Board, acting through its committees, has charged FMR and its affiliates with (i) identifying events or circumstances the occurrence of which could have demonstrably adverse effects on the fund's business and/or reputation; (ii) implementing processes and controls to lessen the possibility that such events or circumstances occur or to mitigate the effects of such events or circumstances if they do occur; and (iii) creating and maintaining a system designed to evaluate continuously business and market conditions in order to facilitate the identification and implementation processes described in (i) and (ii) above. Because the day-to-day operations and activities of the fund are carried out by or through FMR, its affiliates and other service providers, the fund's exposure to risks is mitigated but not eliminated by the processes overseen by the Trustees. While each of the Board's committees has responsibility for overseeing different aspects of the fund's activities, oversight is exercised primarily through the Operations, Audit, and Compliance Committees. In addition, the Independent Trustees have worked with FMR to enhance the Board's oversight of investment and financial risks, legal and regulatory risks, technology risks, and operational risks, including the development of additional risk reporting to the Board. For example, a working group comprised of Independent Trustees and FMR has worked and continues to work to review the Fidelity funds' valuation-related activities, reporting and risk management. Appropriate personnel, including but not limited to the fund's Chief Compliance Officer (CCO), FMR's internal auditor, the independent accountants, the fund's Treasurer and portfolio management personnel, make periodic reports to the Board's committees, as appropriate, including an annual review of FMR's risk management program for the Fidelity funds. The responsibilities of each standing committee, including their oversight responsibilities, are described further under "Standing Committees of the Fund's Trustees."
Annual Report
Trustees and Officers - continued
The fund's Statement of Additional Information (SAI) includes more information about the Trustees. To request a free copy, call Fidelity at 1-877-208-0098.
Interested Trustees*:
Correspondence intended for each Trustee who is an interested person may be sent to Fidelity Investments, 82 Devonshire Street, Boston, Massachusetts 02109.
Name, Age; Principal Occupations and Other Relevant Experience+ |
James C. Curvey (77) |
| Year of Election or Appointment: 2007 Mr. Curvey is Trustee and Chairman of the Board of Trustees of certain Trusts. Mr. Curvey also serves as Trustee (2007-present) of other investment companies advised by FMR. Mr. Curvey is a Director of Fidelity Investments Money Management, Inc. (2009-present), Director of Fidelity Research & Analysis Co. (2009-present) and Director of FMR and FMR Co., Inc. (2007-present). Mr. Curvey is also Vice Chairman (2007-present) and Director of FMR LLC. In addition, Mr. Curvey serves as an Overseer for the Boston Symphony Orchestra and a member of the Trustees of Villanova University. Previously, Mr. Curvey was the Vice Chairman (2006-2007) and Director (2000-2007) of FMR Corp. |
Ronald P. O'Hanley (55) |
| Year of Election or Appointment: 2011 Mr. O'Hanley is Director of FMR Co., Inc. (2010-present), Director of Fidelity Investments Money Management, Inc. (2010-present), Director of Fidelity Research & Analysis Company (2010-present), President of Fidelity Asset Management and Corporate Services and a member of Fidelity's Executive Committee (2010-present). Previously, Mr. O'Hanley served as President and Chief Executive Officer of BNY Mellon Asset Management (2007-2010). Mr. O'Hanley also served as Vice Chairman of Bank New York Mellon Corp. and a member of that firm's Executive Committee. Prior to the 2007 merger of The Bank of New York and Mellon Financial Corporation, he was Vice Chairman of Mellon Financial Corporation and President and Chief Executive Officer of Mellon Asset Management. He joined Mellon in February 1997. Mr. O'Hanley currently serves as Chairman of the Boston Public Library Foundation Board of Directors and sits on the Board of Directors of Beth Israel Deaconess Medical Center, the Board of Trustees of the Marine Biological Laboratory and the Advisory Board of the Maxwell School of Citizenship and Public Administration at Syracuse University. Mr. O'Hanley also chairs the Council on Asset Management for the Financial Services Roundtable and is a member of the Board of Directors of Institutional Investor's U.S. Institute. |
* Trustees have been determined to be "Interested Trustees" by virtue of, among other things, their affiliation with the trust or various entities under common control with FMR.
+ The information above includes each Trustee's principal occupation during the last five years and other information relating to the experience, attributes, and skills relevant to each Trustee's qualifications to serve as a Trustee, which led to the conclusion that each Trustee should serve as a Trustee for the fund.
Annual Report
Trustees and Officers - continued
Independent Trustees:
Correspondence intended for each Independent Trustee (that is, the Trustees other than the Interested Trustees) may be sent to Fidelity Investments, P.O. Box 55235, Boston, Massachusetts 02205-5235.
Name, Age; Principal Occupations and Other Relevant Experience+ |
Dennis J. Dirks (64) |
| Year of Election or Appointment: 2005 Prior to his retirement in May 2003, Mr. Dirks was Chief Operating Officer and a member of the Board of The Depository Trust & Clearing Corporation (DTCC). He also served as President, Chief Operating Officer, and Board member of The Depository Trust Company (DTC) and President and Board member of the National Securities Clearing Corporation (NSCC). In addition, Mr. Dirks served as Chief Executive Officer and Board member of the Government Securities Clearing Corporation, Chief Executive Officer and Board member of the Mortgage-Backed Securities Clearing Corporation, as a Trustee and a member of the Finance Committee of Manhattan College (2005-2008), and as a Trustee and a member of the Finance Committee of AHRC of Nassau County (2006-2008). Mr. Dirks is a member of the Independent Directors Council (IDC) Governing Council (2010-present) and Board of Directors for The Brookville Center for Children's Services, Inc. (2009-present). |
Alan J. Lacy (59) |
| Year of Election or Appointment: 2008 Mr. Lacy serves as Senior Adviser (2007-present) of Oak Hill Capital Partners, L.P. (private equity). Mr. Lacy also served as Chief Executive Officer (2000-2005) and Vice Chairman (2005-2006) of Sears Holdings Corporation and Sears, Roebuck and Co. (retail). In addition, Mr. Lacy serves as a member of the Board of Directors of Dave & Buster's Entertainment, Inc. (restaurant and entertainment complexes, 2010-present), Earth Fare, Inc. (retail grocery, 2012-present), The Hillman Companies, Inc. (hardware wholesalers, 2010-present), and Bristol-Myers Squibb Company (global pharmaceuticals, 2008-present). Mr. Lacy is a member of the Board of Trustees of The National Parks Conservation Association (2006-present). Previously, Mr. Lacy served as Chairman of the Board of Trustees of the National Parks Conservation Association (2008-2011) and as a member of the Board of Directors for the Western Union Company (global money transfer, 2006-2011). |
Ned C. Lautenbach (68) |
| Year of Election or Appointment: 2000 Mr. Lautenbach is Chairman of the Independent Trustees of the Equity and High Income Funds (2006-present). Mr. Lautenbach currently serves as the Lead Director of the Eaton Corporation Board of Directors (diversified industrial, 1997-present). Mr. Lautenbach is Chairman of the Board of Directors of the Philharmonic Center for the Arts in Naples, Florida (2012-present) and a member of the Council on Foreign Relations (1994-present). Previously, Mr. Lautenbach was a Partner/Advisory Partner at Clayton, Dubilier & Rice, LLC (private equity investment, 1998-2010), as well as a Director of Sony Corporation (2006-2007). |
Joseph Mauriello (68) |
| Year of Election or Appointment: 2008 Prior to his retirement in January 2006, Mr. Mauriello served in numerous senior management positions including Deputy Chairman and Chief Operating Officer (2004-2005), and Vice Chairman of Financial Services (2002-2004) of KPMG LLP US (professional services, 1965-2005). Mr. Mauriello currently serves as a member of the Board of Directors of XL Group plc. (global insurance and re-insurance, 2006-present). Previously, Mr. Mauriello served as a Director of the Hamilton Funds of the Bank of New York (2006-2007) and of Arcadia Resources Inc. (health care services and products, 2007-2012). |
Robert W. Selander (62) |
| Year of Election or Appointment: 2011 Previously, Mr. Selander served as a Member of the Advisory Board of Fidelity's Equity and High Income Funds (2011), Executive Vice Chairman (2010), Chief Executive Officer (2009-2010), and President and Chief Executive Officer (1997-2009) of Mastercard, Inc. |
Cornelia M. Small (68) |
| Year of Election or Appointment: 2005 Ms. Small is a member of the Board of Directors (2009-present) and Chair of the Investment Committee (2010-present) of the Teagle Foundation. Ms. Small also serves on the Investment Committee of the Berkshire Taconic Community Foundation (2008-present). Previously, Ms. Small served as Chairperson (2002-2008) and a member of the Investment Committee and Chairperson (2008-2012) and a member of the Board of Trustees of Smith College. In addition, Ms. Small served as Chief Investment Officer, Director of Global Equity Investments, and a member of the Board of Directors of Scudder, Stevens & Clark and Scudder Kemper Investments. |
William S. Stavropoulos (73) |
| Year of Election or Appointment: 2001 Mr. Stavropoulos is Vice Chairman of the Independent Trustees of the Equity and High Income Funds (2006-present). Mr. Stavropoulos serves as President and Founder of the Michigan Baseball Foundation, the Great Lakes Loons (2007-present). Mr. Stavropoulos is Chairman Emeritus of the Board of Directors of The Dow Chemical Company, where he previously served in numerous senior management positions, including President, CEO (1995-2000; 2002-2004), Chairman of the Executive Committee (2000-2006), and as a member of the Board of Directors (1990-2006). Currently, Mr. Stavropoulos is a Director of Univar Inc. (global distributor of commodity and specialty chemicals, Chairman from 2010-May 2012 and Lead Director from May 2012-present), Teradata Corporation (data warehousing and technology solutions, 2008-present), Maersk Inc. (industrial conglomerate), and Tyco International, Ltd. (multinational manufacturing and services, 2007-present), and a member of the Advisory Board for Metalmark Capital LLC (private equity investment, 2005-present). Mr. Stavropoulos is an operating advisor to Clayton, Dubilier & Rice, LLC (private equity investment). In addition, Mr. Stavropoulos is a member of the University of Notre Dame Advisory Council for the College of Science, a Trustee of the Rollin L. Gerstacker Foundation, and a Director of the Naples Philharmonic Center for the Arts. Previously, Mr. Stavropoulos served as a Director of Chemical Financial Corporation (bank holding company, 1993-2012). |
David M. Thomas (63) |
| Year of Election or Appointment: 2008 Previously, Mr. Thomas served as Executive Chairman (2005-2006) and Chairman and Chief Executive Officer (2000-2005) of IMS Health, Inc. (pharmaceutical and healthcare information solutions), and a Director of Fortune Brands, Inc. (consumer products, 2000-2011). In addition, Mr. Thomas serves as Non-Executive Chairman of the Board of Directors of Fortune Brands Home and Security (home and security products, 2011-present), and as a member of the Board of Directors of Interpublic Group of Companies, Inc. (marketing communication, 2004-present). |
Michael E. Wiley (62) |
| Year of Election or Appointment: 2008 Mr. Wiley also serves as a Director of Asia Pacific Exploration Consolidated (international oil and gas exploration and production, 2008-present). Mr. Wiley serves as a Director of Tesoro Corporation (independent oil refiner and marketer, 2005-present), and a Director of Bill Barrett Corporation (exploration and production, 2005-present). In addition, Mr. Wiley also serves as a Director of Post Oak Bank (privately-held bank, 2004-present). Previously, Mr. Wiley served as a member of the Board of Trustees of the University of Tulsa (2000-2006; 2007-2010), as a Senior Energy Advisor of Katzenbach Partners, LLC (consulting, 2006-2007), as an Advisory Director of Riverstone Holdings (private investment), Chairman, President, and CEO of Baker Hughes, Inc. (oilfield services, 2000-2004), and as Director of Spinnaker Exploration Company (exploration and production, 2001-2005). |
+ The information above includes each Trustee's principal occupation during the last five years and other information relating to the experience, attributes, and skills relevant to each Trustee's qualifications to serve as a Trustee, which led to the conclusion that each Trustee should serve as a Trustee for the fund.
Advisory Board Members and Executive Officers:
Correspondence intended for David A. Rosow and Garnett A. Smith may be sent to Fidelity Investments, P.O. Box 55235, Boston, Massachusetts 02205-5235. Correspondence intended for each executive officer, Edward C. Johnson 3d, and Peter S. Lynch may be sent to Fidelity Investments, 82 Devonshire Street, Boston, Massachusetts 02109.
Name, Age; Principal Occupation |
Edward C. Johnson 3d (82) |
| Year of Election or Appointment: 2011 Member of the Advisory Board of Fidelity's Equity and High Income Funds. Mr. Johnson serves as Chief Executive Officer, Chairman, and a Director of FMR LLC, and also serves as Chairman and Director of FIL Limited. Previously, Mr. Johnson served as a Trustee and Chairman of the Board of certain Fidelity Trusts, Chairman and a Director of FMR, Chairman and a Director of FMR Co., Inc., and President of FMR LLC (2006-2007). |
Peter S. Lynch (68) |
| Year of Election or Appointment: 2003 Member of the Advisory Board of Fidelity's Equity and High Income Funds. Mr. Lynch is Vice Chairman and a Director of FMR and FMR Co., Inc. In addition, Mr. Lynch serves as a Trustee of Boston College and as the Chairman of the Inner-City Scholarship Fund. Previously, Mr. Lynch served on the Special Olympics International Board of Directors (1997-2006). |
David A. Rosow (70) |
| Year of Election or Appointment: 2012 Member of the Advisory Board of Fidelity's Equity and High Income Funds. Chairman and Chief Executive Officer of International Golf Group, Inc. (golf course development, 1989-present). Previously, Mr. Rosow served as Chairman and Chief Executive Officer of Rosow & Company, Inc. (private investment company, 1989-2011), a Lead Director of Hudson United Bancorp (2001-2006) and as a Director of TD Banknorth (1996-2006). In addition, Mr. Rosow is a member (2008-present) and President (2009-present) of the Town Council of Palm Beach, Florida. |
Garnett A. Smith (65) |
| Year of Election or Appointment: 2012 Member of the Advisory Board of Fidelity's Equity and High Income Funds. Prior to Mr. Smith's retirement, he served as Chairman and Chief Executive Officer of Inbrand Corp. (manufacturer of personal absorbent products, 1990-1997). He also served as President (1986-1990) of Inbrand Corp. Prior to his employment with Inbrand Corp., he was employed by a retail fabric chain and North Carolina National Bank. In addition, Mr. Smith is a board member of the Jackson Hole Land Trust (2009-present). |
Kenneth B. Robins (43) |
| Year of Election or Appointment: 2008 President and Treasurer of Fidelity's Equity and High Income Funds. Mr. Robins also serves as President and Treasurer (2010-present) and Assistant Treasurer (2009-present) of other Fidelity funds and is an employee of Fidelity Investments (2004-present). Previously, Mr. Robins served as Deputy Treasurer of the Fidelity funds (2005-2008) and Treasurer and Chief Financial Officer of The North Carolina Capital Management Trust: Cash and Term Portfolios (2006-2008). |
Bruce T. Herring (47) |
| Year of Election or Appointment: 2006 Vice President of certain Equity Funds. Mr. Herring also serves as President of Fidelity Research & Analysis Company (2010-present), Chief Investment Officer and Director of Fidelity Management & Research (U.K.) Inc. (2010-present) and Group Chief Investment Officer of FMR. Previously, Mr. Herring served as Vice President (2005-2006) and Senior Vice President (2006-2007) of Fidelity Management & Research Company, Vice President of FMR Co., Inc. (2001-2007) and as a portfolio manager for Fidelity U.S. Equity Funds. |
Brian B. Hogan (48) |
| Year of Election or Appointment: 2009 Vice President of Equity and High Income Funds. Mr. Hogan also serves as President of FMR's Equity Division (2009-present). Previously, Mr. Hogan served as Senior Vice President, Equity Research of FMR (2006-2009) and as a portfolio manager. |
Scott C. Goebel (44) |
| Year of Election or Appointment: 2008 Secretary and Chief Legal Officer (CLO) of the Fidelity funds. Mr. Goebel also serves as Secretary of Fidelity Investments Money Management, Inc. (FIMM) (2010-present) and Fidelity Research and Analysis Company (FRAC) (2010-present); Secretary and CLO of The North Carolina Capital Management Trust: Cash and Term Portfolios (2008-present); General Counsel, Secretary, and Senior Vice President of FMR (2008-present) and FMR Co., Inc. (2008-present); employed by FMR LLC or an affiliate (2001-present); Chief Legal Officer of Fidelity Management & Research (Hong Kong) Limited (2008-present) and Assistant Secretary of Fidelity Management & Research (Japan) Inc. (2008-present), and Fidelity Management & Research (U.K.) Inc. (2008-present). Previously, Mr. Goebel served as Assistant Secretary of FIMM (2008-2010), FRAC (2008-2010), and the Funds (2007-2008) and as Vice President and Secretary of Fidelity Distributors Corporation (FDC) (2005-2007). |
William C. Coffey (43) |
| Year of Election or Appointment: 2009 Assistant Secretary of Fidelity's Equity and High Income Funds. Mr. Coffey also serves as Senior Vice President and Deputy General Counsel of FMR LLC (2010-present), and is an employee of Fidelity Investments. Previously, Mr. Coffey served as Vice President and Associate General Counsel of FMR LLC (2005-2009). |
Elizabeth Paige Baumann (44) |
| Year of Election or Appointment: 2012 Anti-Money Laundering (AML) Officer of the Fidelity funds. Ms. Baumann also serves as AML Officer of The North Carolina Capital Management Trust: Cash and Term Portfolios (2012-present), Chief AML Officer of FMR LLC (2012-present), and is an employee of Fidelity Investments. Previously, Ms. Baumann served as Vice President and Deputy Anti-Money Laundering Officer (2007-2012). |
Christine Reynolds (54) |
| Year of Election or Appointment: 2008 Chief Financial Officer of the Fidelity funds. Ms. Reynolds became President of Fidelity Pricing and Cash Management Services (FPCMS) in August 2008. Ms. Reynolds served as Chief Operating Officer of FPCMS (2007-2008). Previously, Ms. Reynolds served as President, Treasurer, and Anti-Money Laundering officer of the Fidelity funds (2004-2007). |
Joseph A. Hanlon (44) |
| Year of Election or Appointment: 2012 Chief Compliance Officer of Fidelity's Equity and High Income Funds. Mr. Hanlon serves as Compliance Officer of FMR, FMR Co., Inc., Fidelity Investments Money Management, Inc. (FIMM), Fidelity Research and Analysis Company (FRAC), Fidelity Management & Research (Japan) Inc., Fidelity Management & Research (U.K.) Inc., Fidelity Management & Research (Hong Kong), and Strategic Advisers, Inc. (2009-present), as Senior Vice President of the Fidelity Asset Management Division (2009-present), and is an employee of Fidelity Investments. |
Joseph F. Zambello (55) |
| Year of Election or Appointment: 2011 Deputy Treasurer of the Fidelity funds. Mr. Zambello is an employee of Fidelity Investments. Previously, Mr. Zambello served as Vice President of FMR's Program Management Group (2009-2011) and Vice President of the Transfer Agent Oversight Group (2005-2009). |
Adrien E. Deberghes (45) |
| Year of Election or Appointment: 2008 Deputy Treasurer of Fidelity's Equity and High Income Funds. Mr. Deberghes also serves as Vice President (2011-present) and Assistant Treasurer (2010-present) of other Fidelity funds, and is an employee of Fidelity Investments (2008-present). Previously, Mr. Deberghes served as Senior Vice President of Mutual Fund Administration at State Street Corporation (2007-2008), Senior Director of Mutual Fund Administration at Investors Bank & Trust (2005-2007), and Director of Finance for Dunkin' Brands (2000-2005). |
Name, Age; Principal Occupation |
Stephen Sadoski (41) |
| Year of Election or Appointment: 2012 Deputy Treasurer of Fidelity's Equity and High Income Funds. Mr. Sadoski also serves as Assistant Treasurer of other Fidelity funds (2012-present) and is an employee of Fidelity Investments (2012-present). Previously, Mr. Sadoski served as an assistant chief accountant in the Division of Investment Management of the Securities and Exchange Commission (SEC) (2009-2012) and as a senior manager at Deloitte & Touche (1997-2009). |
Stephanie J. Dorsey (43) |
| Year of Election or Appointment: 2010 Assistant Treasurer of Fidelity's Equity and High Income Funds. Ms. Dorsey also serves as Deputy Treasurer of other Fidelity funds (2008-present) and is an employee of Fidelity Investments (2008-present). Previously, Ms. Dorsey served as Treasurer (2004-2008) of the JPMorgan Mutual Funds and Vice President (2004-2008) of JPMorgan Chase Bank. |
John R. Hebble (54) |
| Year of Election or Appointment: 2009 Assistant Treasurer of Fidelity's Equity and High Income Funds. Mr. Hebble also serves as President (2011-present), Treasurer, and Chief Financial Officer of The North Carolina Capital Management Trust: Cash and Term Portfolios (2008-present), President and Treasurer of other Fidelity funds (2008-present) and is an employee of Fidelity Investments. |
Gary W. Ryan (54) |
| Year of Election or Appointment: 2005 Assistant Treasurer of the Fidelity funds. Mr. Ryan is an employee of Fidelity Investments. Previously, Mr. Ryan served as Vice President of Fund Reporting in Fidelity Pricing and Cash Management Services (FPCMS) (1999-2005). |
Jonathan Davis (44) |
| Year of Election or Appointment: 2010 Assistant Treasurer of the Fidelity funds. Mr. Davis is also Assistant Treasurer of Fidelity Rutland Square Trust II and Fidelity Commonwealth Trust II. Mr. Davis is an employee of Fidelity Investments. Previously, Mr. Davis served as Vice President and Associate General Counsel of FMR LLC (2003-2010). |
Annual Report
Board Approval of Investment Advisory Contracts and Management Fees
Fidelity Advisor Global Capital Appreciation Fund
Each year, the Board of Trustees, including the Independent Trustees (together, the Board), votes on the renewal of the management contract and sub-advisory agreements (together, the Advisory Contracts) for the fund. The Board, assisted by the advice of fund counsel and Independent Trustees' counsel, requests and considers a broad range of information relevant to the renewal of the Advisory Contracts throughout the year.
The Board meets regularly and, at each of its meetings, considers factors that are relevant to its annual consideration of the renewal of the fund's Advisory Contracts, including the services and support provided to the fund and its shareholders. The Board has established various standing committees, each composed of and chaired by Independent Trustees with varying backgrounds, to which the Board has assigned specific subject matter responsibilities in order to enhance effective decision-making by the Board. The Board, acting directly and through its Committees, requests and receives information concerning the annual consideration of the renewal of the fund's Advisory Contracts. The Board also meets as needed to consider matters specifically related to the Board's annual consideration of the renewal of Advisory Contracts. Members of the Board may also meet with trustees of other Fidelity funds through ad hoc joint committees to discuss certain matters relevant to the Fidelity funds.
At its July 2012 meeting, the Board of Trustees, including the Independent Trustees, unanimously determined to renew the fund's Advisory Contracts. In reaching its determination, the Board considered all factors it believed relevant, including (i) the nature, extent, and quality of the services to be provided to the fund and its shareholders (including the investment performance of the fund); (ii) the competitiveness of the fund's management fee and total expense ratio relative to peer funds; (iii) the total costs of the services to be provided by and the profits to be realized by Fidelity from its relationship with the fund; (iv) the extent to which economies of scale exist and would be realized as the fund grows; and (v) whether fee levels reflect these economies of scale, if any, for the benefit of fund shareholders.
In considering whether to renew the Advisory Contracts for the fund, the Board reached a determination, with the assistance of fund counsel and Independent Trustees' counsel and through the exercise of its business judgment, that the renewal of the Advisory Contracts is in the best interests of the fund and its shareholders and that the compensation payable under the Advisory Contracts is fair and reasonable. The Board's decision to renew the Advisory Contracts was not based on any single factor, but rather was based on a comprehensive consideration of all the information provided to the Board at its meetings throughout the year. The Board, in reaching its determination to renew the Advisory Contracts, is aware that shareholders in the fund have a broad range of investment choices available to them, including a wide choice among mutual funds offered by Fidelity's competitors, and that the fund's shareholders, who have the opportunity to review and weigh the disclosure provided by the fund in its prospectus and other public disclosures, have chosen to invest in this fund, managed by Fidelity.
Annual Report
Nature, Extent, and Quality of Services Provided. The Board considered the staffing within the investment adviser, FMR, and the sub-advisers (together, the Investment Advisers), including the backgrounds of the fund's investment personnel, and also considered the fund's investment objective, strategies, and related investment philosophy. The Independent Trustees also had discussions with senior management of Fidelity's investment operations and investment groups. The Board considered the structure of the portfolio manager compensation program and whether this structure provides appropriate incentives to act in the best interests of the fund.
Resources Dedicated to Investment Management and Support Services. The Board and the Fund Oversight and Research Committees reviewed the general qualifications and capabilities of the Investment Advisers' investment staff, including its size, education, experience, and resources, as well as the Investment Advisers' approach to recruiting, training, managing, and compensating investment personnel. The Board also noted that FMR has continued to increase the resources devoted to non-U.S. offices, including expansion of Fidelity's global investment organization. The Board noted that Fidelity's analysts have extensive resources, tools and capabilities that allow them to conduct sophisticated quantitative and fundamental analysis, as well as credit analysis of issuers, counterparties and guarantors. The Board also believes that Fidelity's investment professionals have sufficient access to global information and data so as to provide competitive investment results over time, and that those professionals also have access to sophisticated tools that permit them to assess portfolio construction and risk and performance attribution characteristics continuously, as well as to transmit new information and research conclusions rapidly around the world. Additionally, in its deliberations, the Board considered the Investment Advisers' trading and risk management capabilities and resources, which are an integral part of the investment management process.
Shareholder and Administrative Services. The Board considered (i) the nature, extent, quality, and cost of advisory, administrative, and shareholder services performed by the Investment Advisers and their affiliates under the Advisory Contracts and under separate agreements covering transfer agency, pricing and bookkeeping, and securities lending services for the fund; (ii) the nature and extent of the supervision of third party service providers, principally custodians and subcustodians; and (iii) the resources devoted to, and the record of compliance with, the fund's compliance policies and procedures. The Board also reviewed the allocation of fund brokerage, including allocations to brokers affiliated with the Investment Advisers, the use of brokerage commissions to pay fund expenses, and the use of "soft" commission dollars to pay for research services.
Annual Report
Board Approval of Investment Advisory Contracts and
Management Fees - continued
The Board noted that the growth of fund assets over time across the complex allows Fidelity to reinvest in the development of services designed to enhance the value or convenience of the Fidelity funds as investment vehicles. These services include 24-hour access to account information and market information through telephone representatives and over the Internet, investor education materials and asset allocation tools, and the expanded availability of Fidelity Investor Centers.
Investment in a Large Fund Family. The Board considered the benefits to shareholders of investing in a Fidelity fund, including the benefits of investing in a fund that is part of a large family of funds offering a variety of investment disciplines and providing a large variety of mutual fund investor services. The Board noted that Fidelity had taken, or had made recommendations that resulted in the Fidelity funds taking, a number of actions over the previous year that benefited particular funds, including (i) continuing to dedicate additional resources to investment research and support of the senior management team that oversees asset management; (ii) persisting in efforts to enhance Fidelity's research capabilities, in particular, international research; (iii) launching new funds and making other enhancements to meet client needs for global and income-oriented solutions; (iv) continuing to launch dedicated lower cost underlying funds to meet investment management's portfolio construction needs related to expanding underlying fund options, specifically for the Freedom Fund product lines; (v) adopting a "Stock Selector" sector neutral investment approach and employing a team of portfolio managers who are sector specialists to manage certain funds; (vi) rationalizing product lines and gaining increased efficiencies through the mergers of several funds into other funds; (vii) strengthening the Spartan Index Fund product line by adding new funds and/or new low-cost institutional share classes, restructuring fund expenses to accommodate new classes, and reducing investment minimums for certain classes of shares; (viii) modifying the eligibility criteria for Institutional Class shares to increase their appeal to government entities and charitable investors; and (ix) reducing certain transfer agent fee rates.
Investment Performance. The Board considered whether the fund has operated in accordance with its investment objective, as well as its record of compliance with its investment restrictions. It also reviewed the fund's absolute investment performance for each class, as well as the fund's relative investment performance for each class measured over multiple periods against (i) a broad-based securities market index, and (ii) a peer group of mutual funds deemed appropriate by Fidelity and reviewed by the Board. The following charts considered by the Board show, over the one-, three-, and five-year periods ended December 31, 2011, the cumulative total returns of Institutional Class (Class I) and Class C of the fund, the cumulative total returns of a broad-based securities market index ("benchmark"), and a range of cumulative total returns of a peer group of mutual funds identified by Morningstar, Inc. as having an investment style similar to that of the fund based on underlying portfolio holdings. The returns of Institutional Class (Class I) and Class C show the performance of the highest and lowest performing classes, respectively (based on five-year performance). The box within each chart shows the 25th percentile return (top of box) and the 75th percentile return (bottom of box) of the peer group. Returns shown above the box are in the first quartile and returns shown below the box are in the fourth quartile. The percentage beaten numbers noted below each chart correspond to the percentile box and represent the percentage of funds in the peer group whose performance was equal to or lower than that of the class indicated.
Annual Report
Fidelity Advisor Global Capital Appreciation Fund

The Board reviewed the fund's relative investment performance against its peer group and noted that the performance of Institutional Class (Class I) of the fund was in the fourth quartile for the one- and five-year periods and the third quartile for the three-year period. The Board also noted that the investment performance of the fund was lower than its benchmark for all the periods shown. The Board considered that the variations in performance among the fund's classes reflect the variations in class expenses, which result in lower performance for higher expense classes. The Board discussed with FMR actions to improve the fund's disappointing performance relative to its peer group and benchmark. The Board also reviewed the fund's performance since inception as well as performance in the current year. The Board will continue to closely monitor the performance of the fund in the coming year and discuss with FMR other appropriate actions to address the performance of the fund.
The Board also considered that the fund's management fee is subject to upward or downward adjustment depending upon whether, and to what extent, the fund's investment performance for the performance period exceeds, or is exceeded by, the record (over the same period) of a Board-approved performance adjustment index. The Board noted that the performance adjustment provides FMR with a strong economic incentive to seek to achieve superior performance for the fund's shareholders and helps to more closely align the interests of FMR and the fund's shareholders.
Annual Report
Board Approval of Investment Advisory Contracts and
Management Fees - continued
Based on its review, the Board concluded that the nature, extent, and quality of services provided to the fund under the Advisory Contracts should benefit the fund's shareholders.
Competitiveness of Management Fee and Total Expense Ratio. The Board considered the fund's management fee and total expense ratio compared to "mapped groups" of competitive funds and classes. Fidelity creates "mapped groups" by combining similar Lipper investment objective categories that have comparable management fee characteristics. Combining Lipper investment objective categories aids the Board's management fee and total expense ratio comparisons by broadening the competitive group used for comparison and by reducing the number of universes to which various Fidelity funds are compared.
Management Fee. The Board considered two proprietary management fee comparisons for the 12-month periods shown in the chart below. The group of Lipper funds used by the Board for management fee comparisons is referred to below as the "Total Mapped Group." The Total Mapped Group comparison focuses on a fund's standing relative to the total universe of comparable funds available to investors in terms of gross management fees before expense reimbursements or caps, and without giving effect to the fund's performance adjustment. "TMG %" represents the percentage of funds in the Total Mapped Group that had management fees that were lower than the fund's. For example, a TMG % of 17% means that 83% of the funds in the Total Mapped Group had higher management fees than the fund. The "Asset-Size Peer Group" (ASPG) comparison focuses on a fund's standing relative to non-Fidelity funds similar in size to the fund within the Total Mapped Group. The ASPG represents at least 15% of the funds in the Total Mapped Group with comparable asset size and management fee characteristics, subject to a minimum of 50 funds (or all funds in the Total Mapped Group if fewer than 50). Additional information, such as the ASPG quartile in which the fund's management fee ranked and the impact of the fund's performance adjustment, is also included in the chart and considered by the Board.
Annual Report
Fidelity Advisor Global Capital Appreciation Fund

The Board noted that the fund's management fee ranked below the median of its Total Mapped Group and below the median of its ASPG for 2011. The Board also noted the effect of the fund's negative performance adjustment on the fund's management fee ranking. The Board noted that the performance adjustment for each year represents calculations for performance periods that differ from the periods shown in the performance charts above.
Based on its review, the Board concluded that the fund's management fee is fair and reasonable in light of the services that the fund receives and the other factors considered.
Total Expense Ratio. In its review of each class's total expense ratio, the Board considered the fund's management fee as well as other fund or class expenses, as applicable, such as transfer agent fees, pricing and bookkeeping fees, fund-paid 12b-1 fees, and custodial, legal, and audit fees. The Board also noted the effects of any waivers and reimbursements on fees and expenses, as well as the impact of the fund's performance adjustment. As part of its review, the Board also considered the current and historical total expense ratios of each class of the fund compared to competitive fund median expenses. Each class of the fund is compared to those funds and classes in the Total Mapped Group (used by the Board for management fee comparisons) that have a similar sales load structure.
The Board noted that the total expense ratio of Class A ranked below its competitive median for 2011, the total expense ratio of Class B ranked equal to its competitive median for 2011, and the total expense ratio of each of Class T, Class C, and Institutional Class ranked above its competitive median for 2011. The Board considered that various factors, including 12b-1 fees, positive or negative performance adjustments, and relatively higher other expenses in the case of small fund size, can affect total expense ratios. The Board noted that the total expense ratio of Class T was above the competitive median primarily because of higher 12b-1 fees on Class T. Class T has a higher 12b-1 fee, but a lower front-end sales charge, than traditionally priced front-end sales charge classes. The Board considered that Class T is primarily sold load-waived in the retirement plan market where its 0.50% 12b-1 fee is comparable to competing no-load, higher 12b-1 fee classes designed specifically for retirement plans. The Board noted that the fund offers multiple classes, each of which has a different sales load and 12b-1 fee structure, and that the multiple structures are intended to offer a range of pricing options for the intermediary market. The Board also noted that the total expense ratios of the classes vary primarily by the level of their 12b-1 fees, although differences in transfer agent fees may also cause expenses to vary from class to class.
Annual Report
Board Approval of Investment Advisory Contracts and
Management Fees - continued
The Board further considered that FMR contractually agreed to reimburse Class A, Class T, Class B, Class C, and Institutional Class of the fund to the extent that total operating expenses (excluding interest, taxes, certain securities lending costs, brokerage commissions, extraordinary expenses, and acquired fund fees and expenses, if any), as a percentage of their respective average net assets, exceed 1.45%, 1.70%, 2.20%, 2.20%, and 1.20% through December 31, 2012.
Fees Charged to Other Fidelity Clients. The Board also considered Fidelity fee structures and other information with respect to clients of FMR and its affiliates, such as other mutual funds advised or subadvised by FMR or its affiliates, pension plan clients, and other institutional clients. The Board noted the findings of the 2010 ad hoc joint committee (created with the board of other Fidelity funds), which reviewed and compared Fidelity's institutional investment advisory business with its business of providing services to the Fidelity funds, including the differences in services provided, fees charged, and costs incurred, as well as competition in their respective marketplaces.
Based on its review of total expense ratios and fees charged to other Fidelity clients, the Board concluded that the total expense ratio of each class of the fund was reasonable, although in some cases above the median of the universe presented for comparison, in light of the services that the fund and its shareholders receive and the other factors considered.
Costs of the Services and Profitability. The Board considered the revenues earned and the expenses incurred by Fidelity in conducting the business of developing, marketing, distributing, managing, administering and servicing the fund and its shareholders. The Board also considered the level of Fidelity's profits in respect of all the Fidelity funds.
Annual Report
On an annual basis, FMR presents to the Board Fidelity's profitability for the fund. Fidelity calculates the profitability for each fund, as well as aggregate profitability for groups of Fidelity funds and all Fidelity funds, using a series of detailed revenue and cost allocation methodologies which originate with the books and records of Fidelity on which Fidelity's audited financial statements are based. The Audit Committee of the Board reviews any significant changes from the prior year's methodologies.
PricewaterhouseCoopers LLP (PwC), independent registered public accounting firm and auditor to Fidelity and certain Fidelity funds, has been engaged annually by the Board as part of the Board's assessment of Fidelity's profitability analysis. PwC's engagement includes the review and assessment of Fidelity's methodologies used in determining the revenues and expenses attributable to Fidelity's mutual fund business, and completion of agreed-upon procedures surrounding the mathematical accuracy of fund profitability and its conformity to allocation methodologies. After considering PwC's reports issued under the engagement and information provided by Fidelity, the Board concluded that while other allocation methods may also be reasonable, Fidelity's profitability methodologies are reasonable in all material respects.
The Board also reviewed Fidelity's non-fund businesses and fall-out benefits related to the mutual fund business as well as cases where Fidelity's affiliates may benefit from or be related to the fund's business.
The Board considered the costs of the services provided by and the profits realized by Fidelity in connection with the operation of the fund and was satisfied that the profitability was not excessive in the circumstances.
Economies of Scale. The Board considered whether there have been economies of scale in respect of the management of the Fidelity funds, whether the Fidelity funds (including the fund) have appropriately benefited from any such economies of scale, and whether there is potential for realization of any further economies of scale. The Board considered the extent to which the fund will benefit from economies of scale through increased services to the fund, through waivers or reimbursements, or through fee or expense reductions. The Board also noted that in 2009, it and the board of other Fidelity funds created an ad hoc committee (the Economies of Scale Committee) to analyze whether FMR attains economies of scale in respect of the management and servicing of the Fidelity funds, whether the Fidelity funds have appropriately benefited from such economies of scale, and whether there is potential for realization of any further economies of scale.
The Board recognized that the fund's management contract incorporates a "group fee" structure, which provides for lower group fee rates as total fund assets under FMR's management increase, and for higher group fee rates as total fund assets under FMR's management decrease. FMR calculates the group fee rates based on a tiered asset "breakpoint" schedule that varies based on asset class. The Board considered that the group fee is designed to deliver the benefits of economies of scale to fund shareholders when total Fidelity fund assets increase, even if assets of any particular fund are unchanged or have declined, because some portion of Fidelity's costs are attributable to services provided to all Fidelity funds, and all funds benefit if those costs can be allocated among more assets. The Board concluded that, given the group fee structure, fund shareholders will benefit from lower management fees as assets under FMR's management increase at the fund complex level, regardless of whether Fidelity achieves any such economies of scale.
Annual Report
Board Approval of Investment Advisory Contracts and
Management Fees - continued
The Board concluded, taking into account the analysis of the Economies of Scale Committee, that economies of scale, if any, are being appropriately shared between fund shareholders and Fidelity.
Additional Information Requested by the Board. In order to develop fully the factual basis for consideration of the Fidelity funds' Advisory Contracts, the Board requested and received additional information on certain topics, including (i) fund performance trends, actions to be taken by FMR to improve certain funds' overall performance, and Fidelity's long-term strategies for certain funds; (ii) the potential to further rationalize the Fidelity fund lineup with the possibility of achieving savings for the funds and Fidelity; (iii) Fidelity's compensation structure for portfolio managers and other key investment personnel; (iv) the amount of the investment that each portfolio manager has made in the Fidelity fund(s) that he or she manages; (v) the realization of fall-out benefits in certain Fidelity business units; (vi) Fidelity's group fee structures, the potential impact of regulatory changes on such structures, and the rationale for the individual fee rates of certain funds; (vii) fund profitability methodology, including Fidelity's cost allocation methodology, and the impact of certain factors on fund profitability results; (viii) trends regarding industry use of performance fee structures and the possibility of implementing performance fee structures for additional funds; and (ix) the impact of net redemptions from the Fidelity funds.
Based on its evaluation of all of the conclusions noted above, and after considering all factors it believed relevant, the Board ultimately concluded that the advisory fee structures are fair and reasonable, and that the fund's Advisory Contracts should be renewed.
Annual Report
Investment Adviser
Fidelity Management & Research Company
Boston, MA
Investment Sub-Advisers
FMR Co., Inc.
Fidelity Management & Research
(U.K.) Inc.
FIL Investment Advisors
FIL Investments (Japan) Limited
FIL Investment Advisors (UK) Limited
Fidelity Management & Research
(Hong Kong) Limited
Fidelity Management & Research
(Japan) Inc.
General Distributor
Fidelity Distributors Corporation
Smithfield, RI
Transfer and Service Agents
Fidelity Investments Institutional Operations Company, Inc.
Boston, MA
Fidelity Service Company, Inc.
Boston, MA
Custodian
State Street Bank and Trust Company
Quincy, MA
(Fidelity Investment logo)(registered trademark)
AGLO-UANN-1212
1.784744.109
(Fidelity Investment logo)(registered trademark)
Fidelity Advisor®
Global Capital Appreciation
Fund - Institutional Class
Annual Report
October 31, 2012
(Fidelity Cover Art)
Contents
Performance | (Click Here) | How the fund has done over time. |
Management's Discussion of Fund Performance | (Click Here) | The Portfolio Manager's review of fund performance and strategy. |
Shareholder Expense Example | (Click Here) | An example of shareholder expenses. |
Investment Changes | (Click Here) | A summary of major shifts in the fund's investments over the past six months. |
Investments | (Click Here) | A complete list of the fund's investments with their market values. |
Financial Statements | (Click Here) | Statements of assets and liabilities, operations, and changes in net assets, as well as financial highlights. |
Notes | (Click Here) | Notes to financial statements. |
Report of Independent Registered Public Accounting Firm | (Click Here) | |
Trustees and Officers | (Click Here) | |
Board Approval of Investment Advisory Contracts and Management Fees | (Click Here) | |
To view a fund's proxy voting guidelines and proxy voting record for the 12-month period ended June 30, visit http://www.fidelity.com/proxyvotingresults or visit the Securities and Exchange Commission's (SEC) web site at http://www.sec.gov. You may also call 1-877-208-0098 to request a free copy of the proxy voting guidelines.
Standard & Poor's, S&P and S&P 500 are registered service marks of The McGraw-Hill Companies, Inc. and have been licensed for use by Fidelity Distributors Corporation.
Other third party marks appearing herein are the property of their respective owners.
All other marks appearing herein are registered or unregistered trademarks or service marks of FMR LLC or an affiliated company. © 2012 FMR LLC. All rights reserved.
Annual Report
This report and the financial statements contained herein are submitted for the general information of the shareholders of the fund. This report is not authorized for distribution to prospective investors in the fund unless preceded or accompanied by an effective prospectus.
A fund files its complete schedule of portfolio holdings with the SEC for the first and third quarters of each fiscal year on Form N-Q. Forms N-Q are available on the SEC's web site at http://www.sec.gov. A fund's Forms N-Q may be reviewed and copied at the SEC's Public Reference Room in Washington, DC. Information regarding the operation of the SEC's Public Reference Room may be obtained by calling 1-800-SEC-0330. For a complete list of a fund's portfolio holdings, view the most recent holdings listing, semiannual report, or annual report on Fidelity's web site at http://www.fidelity.com, http://www.advisor.fidelity.com, or http://www.401k.com, as applicable.
NOT FDIC INSURED • MAY LOSE VALUE • NO BANK GUARANTEE
Neither the fund nor Fidelity Distributors Corporation is a bank.
Annual Report
Average annual total return reflects the change in the value of an investment, assuming reinvestment of the class' distributions from dividend income and capital gains (the profits earned upon the sale of securities that have grown in value, if any) and assuming a constant rate of performance each year. The $10,000 table and the fund's returns do not reflect the deduction of taxes that a shareholder would pay on fund distributions or the redemption of fund shares. During periods of reimbursement by Fidelity, a fund's total return will be greater than it would be had the reimbursement not occurred. How a fund did yesterday is no guarantee of how it will do tomorrow.
Average Annual Total Returns
Periods ended October 31, 2012 | Past 1
year | Past 5
years | Past 10
years |
Institutional Class | 9.11% | -4.48% | 5.35% |
$10,000 Over 10 Years
Let's say hypothetically that $10,000 was invested in Fidelity Advisor® Global Capital Appreciation Fund - Institutional Class on October 31, 2002. The chart shows how the value of your investment would have changed, and also shows how the MSCI® ACWI® (All Country World Index) Index performed over the same period.
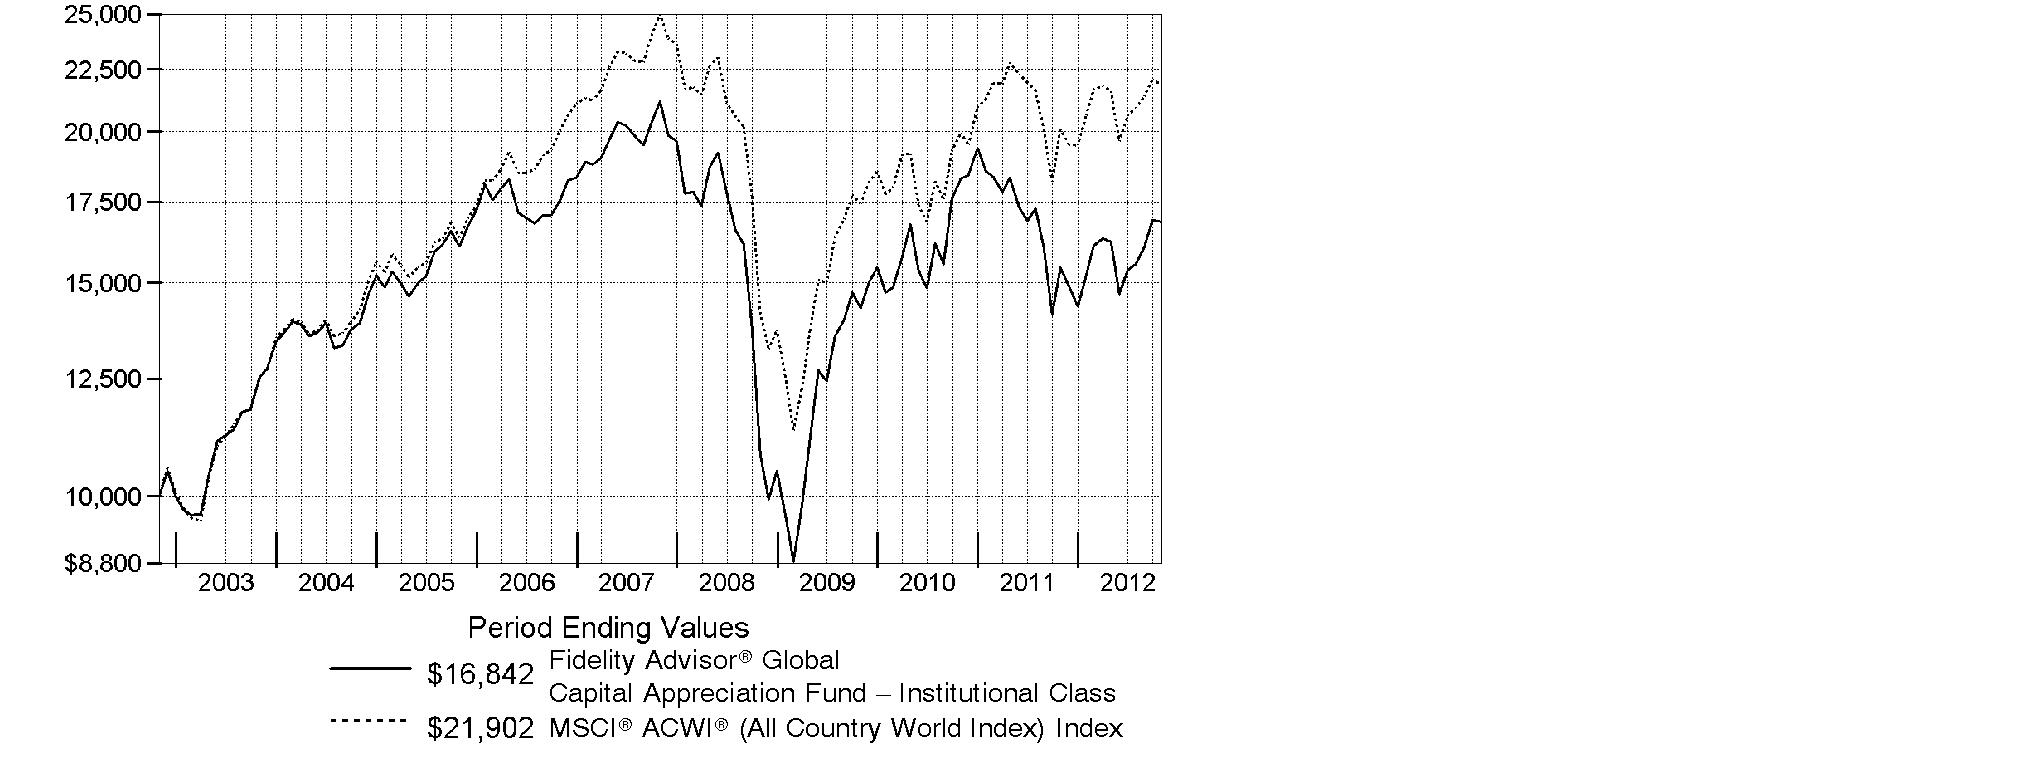
Annual Report
Market Recap: Global stocks experienced pendulum-like swings during the 12 months ending October 31, 2012, finishing the period with a solid advance. The market faced periodic bouts of volatility this past year, as a number of macroeconomic concerns - including the eurozone debt crisis, the strength and pace of the U.S. economic recovery, and a slowdown in China's once-blistering growth - dominated headlines and weighed on investors. While a stronger U.S. dollar provided an additional head wind for foreign investments, stocks worldwide rose 8.96% for the 12 months, as measured by the MSCI® ACWI® (All Country World Index) Index, largely buttressed in the summer by pledges of accommodative monetary action from eurozone officials, as well as signs that the U.S. housing market was on the mend. Within the index, the U.S. showed the most impressive gain among major markets, advancing 15%, closely followed by Asia-Pacific ex Japan (+10%). A number of core European components, most notably Germany (+11%), Switzerland (+10%) and the U.K. (+9%), benefited from optimism about the eurozone's ability to resolve its debt woes. However, continued weakness in peripheral European markets caused the region to lag the index overall. Elsewhere, results from Canada (+3%) and the generally more volatile emerging markets (+2%) each fell short of the MSCI index, while Japan was among the few benchmark constituents to finish in the red, returning about -3%.
Comments from Thomas Allen, Portfolio Manager of Fidelity Advisor® Global Capital Appreciation Fund: During the year, the fund's Institutional Class shares returned 9.11%, edging the MSCI index. Stock picking and an overweighting in Japan proved counterproductive, along with my choices in Russia. A modest cash position further dampened results. At the stock level, Japanese price-comparison site Kakaku.com detracted the most, as disappointing earnings and untimely ownership hurt. Other detractors included Russian drug company Pharmstandard, U.S. glass manufacturer Corning and Proto, a Japan-based provider of online data on used cars. Conversely, stock selection in India stood out as a significant positive, although much of the benefit there was offset by a large overweighting in that relatively weak market. My picks in Brazil, the United Kingdom and the Netherlands bolstered results as well. Noteworthy individual contributors included Indian restaurant chain Jubilant FoodWorks, Dutch holding Gemalto - a leading provider of digital security solutions - and Carsales.com, an Australian an Australian website for used-car data. Most stocks I've mentioned were not part of the benchmark, and all of the detractors I've referenced were sold from the fund by period end.
The views expressed above reflect those of the portfolio manager(s) only through the end of the period as stated on the cover of this report and do not necessarily represent the views of Fidelity or any other person in the Fidelity organization. Any such views are subject to change at any time based upon market or other conditions and Fidelity disclaims any responsibility to update such views. These views may not be relied on as investment advice and, because investment decisions for a Fidelity fund are based on numerous factors, may not be relied on as an indication of trading intent on behalf of any Fidelity fund.
Annual Report
Shareholder Expense Example
As a shareholder of the Fund, you incur two types of costs: (1) transaction costs, including sales charges (loads) on purchase payments or redemption proceeds, redemption fees and (2) ongoing costs, including management fees, distribution and/or service (12b-1) fees and other Fund expenses. This Example is intended to help you understand your ongoing costs (in dollars) of investing in the Fund and to compare these costs with the ongoing costs of investing in other mutual funds.
The Example is based on an investment of $1,000 invested at the beginning of the period and held for the entire period (May 1, 2012 to October 31, 2012).
Actual Expenses
The first line of the accompanying table for each class of the Fund provides information about actual account values and actual expenses. You may use the information in this line, together with the amount you invested, to estimate the expenses that you paid over the period. Simply divide your account value by $1,000.00 (for example, an $8,600 account value divided by $1,000.00 = 8.6), then multiply the result by the number in the first line for a class of the Fund under the heading entitled "Expenses Paid During Period" to estimate the expenses you paid on your account during this period. In addition, the Fund, as a shareholder in the underlying Fidelity Central Funds, will indirectly bear its pro-rata share of the fees and expenses incurred by the underlying Fidelity Central Funds. These fees and expenses are not included in the Fund's annualized expense ratio used to calculate the expense estimate in the table below.
Hypothetical Example for Comparison Purposes
The second line of the accompanying table for each class of the Fund provides information about hypothetical account values and hypothetical expenses based on a Class' actual expense ratio and an assumed rate of return of 5% per year before expenses, which is not the Class' actual return. The hypothetical account values and expenses may not be used to estimate the actual ending account balance or expenses you paid for the period. You may use this information to compare the ongoing costs of investing in the Fund and other funds. To do so, compare this 5% hypothetical example with the 5% hypothetical examples that appear in the shareholder reports of the other funds. In addition, the Fund, as a shareholder in the underlying Fidelity Central Funds, will indirectly bear its pro-rata share of the fees and expenses incurred by the underlying Fidelity Central Funds. These fees and expenses are not included in the Fund's annualized expense ratio used to calculate the expense estimate in the table below.
Please note that the expenses shown in the table are meant to highlight your ongoing costs only and do not reflect any transaction costs. Therefore, the second line of the table is useful in comparing ongoing costs only, and will not help you determine the relative total costs of owning different funds. In addition, if these transactional costs were included, your costs would have been higher.
Annual Report
Shareholder Expense Example - continued
| Annualized
Expense Ratio | Beginning
Account Value
May 1, 2012 | Ending
Account Value
October 31, 2012 | Expenses Paid
During Period*
May 1, 2012 to October 31, 2012 |
Class A | 1.40% | | | |
Actual | | $ 1,000.00 | $ 1,037.90 | $ 7.17 |
HypotheticalA | | $ 1,000.00 | $ 1,018.10 | $ 7.10 |
Class T | 1.70% | | | |
Actual | | $ 1,000.00 | $ 1,035.90 | $ 8.70 |
HypotheticalA | | $ 1,000.00 | $ 1,016.59 | $ 8.62 |
Class B | 2.17% | | | |
Actual | | $ 1,000.00 | $ 1,034.00 | $ 11.09 |
HypotheticalA | | $ 1,000.00 | $ 1,014.23 | $ 10.99 |
Class C | 2.16% | | | |
Actual | | $ 1,000.00 | $ 1,032.90 | $ 11.04 |
Hypothetical A | | $ 1,000.00 | $ 1,014.28 | $ 10.94 |
Institutional Class | .91% | | | |
Actual | | $ 1,000.00 | $ 1,039.50 | $ 4.67 |
HypotheticalA | | $ 1,000.00 | $ 1,020.56 | $ 4.62 |
A 5% return per year before expenses
* Expenses are equal to each Class' annualized expense ratio, multiplied by the average account value over the period, multiplied by 184/366 (to reflect the one-half year period).
Annual Report
Investment Changes (Unaudited)
Top Five Stocks as of October 31, 2012 |
| % of fund's
net assets | % of fund's net assets
6 months ago |
Jubilant Foodworks Ltd. (India, Hotels, Restaurants & Leisure) | 1.7 | 1.5 |
Sanofi SA sponsored ADR (France, Pharmaceuticals) | 1.4 | 1.6 |
Google, Inc. Class A (United States of America, Internet Software & Services) | 1.3 | 1.4 |
Wyndham Worldwide Corp. (United States of America, Hotels, Restaurants & Leisure) | 1.2 | 0.3 |
The Walt Disney Co. (United States of America, Media) | 1.2 | 1.3 |
| 6.8 | |
Top Five Market Sectors as of October 31, 2012 |
| % of fund's
net assets | % of fund's net assets
6 months ago |
Consumer Discretionary | 22.0 | 22.7 |
Information Technology | 20.6 | 21.7 |
Financials | 14.7 | 13.2 |
Industrials | 12.2 | 8.9 |
Health Care | 8.9 | 10.3 |
Top Five Countries as of October 31, 2012 |
(excluding cash equivalents) | % of fund's
net assets | % of fund's net assets
6 months ago |
United States of America | 38.7 | 42.9 |
Japan | 9.5 | 13.6 |
India | 6.7 | 6.0 |
United Kingdom | 4.4 | 3.9 |
Korea (South) | 3.6 | 1.9 |
Percentages are adjusted for the effect of open futures contracts, if applicable. |
Asset Allocation (% of fund's net assets) |
As of October 31, 2012 | As of April 30, 2012 |
| Stocks 98.8% | | | Stocks 99.9% | |
| Short-Term
Investments and
Net Other Assets (Liabilities) 1.2% | | | Short-Term
Investments and
Net Other Assets (Liabilities) 0.1% | |

Annual Report
Investments October 31, 2012
Showing Percentage of Net Assets
Common Stocks - 98.8% |
| Shares | | Value |
Australia - 1.7% |
Carsales.com Ltd. | 99,645 | | $ 771,636 |
Flexigroup Ltd. | 53,144 | | 218,458 |
Goodman Group unit | 29,684 | | 136,504 |
Nufarm Ltd. | 24,640 | | 147,071 |
TOTAL AUSTRALIA | | 1,273,669 |
Austria - 0.5% |
OMV AG | 4,700 | | 171,792 |
Schoeller-Bleckmann Oilfield Equipment AG | 2,100 | | 202,647 |
TOTAL AUSTRIA | | 374,439 |
Bailiwick of Jersey - 0.3% |
Delphi Automotive PLC | 1,800 | | 56,592 |
Experian PLC | 11,000 | | 189,938 |
TOTAL BAILIWICK OF JERSEY | | 246,530 |
Belgium - 0.8% |
Anheuser-Busch InBev SA NV ADR | 7,000 | | 586,600 |
Bermuda - 0.8% |
China Foods Ltd. | 190,000 | | 192,205 |
China Resources Gas Group Ltd. | 88,000 | | 195,075 |
Fairwood Holdings Ltd. | 66,000 | | 138,471 |
Soundwill Holdings Ltd. | 38,000 | | 69,135 |
TOTAL BERMUDA | | 594,886 |
Brazil - 2.3% |
Abril Educacao SA unit | 11,300 | | 204,185 |
CCR SA | 31,600 | | 277,874 |
Companhia de Bebidas das Americas (AmBev) (PN) | 5,000 | | 204,328 |
Mills Estruturas e Servicos de Engenharia SA | 13,300 | | 203,915 |
Multiplus SA | 8,100 | | 188,198 |
Qualicorp SA (a) | 21,000 | | 215,475 |
Totvs SA | 21,100 | | 429,054 |
TOTAL BRAZIL | | 1,723,029 |
British Virgin Islands - 0.4% |
Mail.ru Group Ltd. GDR (Reg. S) | 8,800 | | 293,480 |
Canada - 1.8% |
Canadian National Railway Co. | 1,500 | | 129,522 |
Canadian Natural Resources Ltd. | 7,100 | | 213,977 |
CGI Group, Inc. Class A (sub. vtg.) (a) | 5,800 | | 151,744 |
Petrobank Energy & Resources Ltd. (a) | 15,700 | | 215,674 |
Common Stocks - continued |
| Shares | | Value |
Canada - continued |
Sandstorm Gold Ltd. (a) | 18,500 | | $ 259,139 |
Suncor Energy, Inc. | 6,400 | | 214,797 |
Westshore Terminals Investment Corp. | 7,200 | | 204,159 |
TOTAL CANADA | | 1,389,012 |
Cayman Islands - 3.5% |
AAC Acoustic Technology Holdings, Inc. | 55,000 | | 196,579 |
China Medical System Holdings Ltd. | 351,000 | | 202,446 |
China State Construction International Holdings Ltd. | 168,000 | | 200,081 |
Cimc Enric Holdings Ltd. | 316,000 | | 229,557 |
Nagacorp Ltd. | 364,000 | | 202,430 |
NetDragon WebSoft, Inc. | 287,000 | | 306,625 |
Pico Far East Holdings Ltd. | 674,000 | | 165,238 |
Sa Sa International Holdings Ltd. | 286,000 | | 196,693 |
Shenzhou International Group Holdings Ltd. | 175,000 | | 340,966 |
SITC International Holdings Co. Ltd. | 191,000 | | 50,769 |
SOHO China Ltd. | 291,500 | | 198,219 |
Tencent Holdings Ltd. | 6,000 | | 212,128 |
Towngas China Co. Ltd. | 257,000 | | 202,283 |
TOTAL CAYMAN ISLANDS | | 2,704,014 |
Finland - 0.3% |
KCI Konecranes Oyj | 6,300 | | 199,244 |
France - 3.5% |
BNP Paribas SA | 5,000 | | 251,518 |
Club Mediterranee SA (a) | 22,500 | | 357,251 |
Compagnie Generale de Geophysique SA sponsored ADR (d) | 11,800 | | 383,264 |
Eurofins Scientific SA | 1,400 | | 216,483 |
Ingenico SA | 7,760 | | 410,774 |
Sanofi SA sponsored ADR | 24,000 | | 1,052,400 |
TOTAL FRANCE | | 2,671,690 |
Germany - 2.2% |
Aareal Bank AG (a) | 10,646 | | 228,370 |
adidas AG | 2,500 | | 212,990 |
Bertrandt AG | 2,400 | | 200,800 |
Carl Zeiss Meditec AG | 7,400 | | 202,956 |
Isra Vision AG | 2,500 | | 69,555 |
KUKA AG (a) | 6,600 | | 197,868 |
MTU Aero Engines Holdings AG | 2,300 | | 193,119 |
Common Stocks - continued |
| Shares | | Value |
Germany - continued |
Rational AG | 800 | | $ 202,303 |
SAP AG | 2,824 | | 205,935 |
TOTAL GERMANY | | 1,713,896 |
Hong Kong - 0.3% |
Galaxy Entertainment Group Ltd. (a) | 57,000 | | 196,005 |
India - 6.7% |
Bata India Ltd. (a) | 11,393 | | 180,874 |
Cipla Ltd. | 13,138 | | 88,710 |
ICRA Ltd. | 6,228 | | 157,995 |
IndusInd Bank Ltd. | 28,365 | | 199,577 |
INFO Edge India Ltd. | 121,252 | | 789,642 |
Ipca Laboratories Ltd. | 27,605 | | 235,544 |
Jubilant Foodworks Ltd. (a) | 55,955 | | 1,313,466 |
Manappuram General Finance & Leasing Ltd. | 520,816 | | 356,697 |
Max India Ltd. (a) | 64,536 | | 290,385 |
Oracle Finance Services Software Ltd. (a) | 3,317 | | 178,793 |
Page Industries Ltd. | 4,642 | | 289,248 |
Pidilite Industries Ltd. (a) | 56,696 | | 202,632 |
Smithkline Beecham Consumer Healthcare Ltd. | 1,614 | | 91,102 |
Sobha Developers Ltd. (a) | 30,974 | | 206,551 |
Speciality Restaurants Ltd. | 55,563 | | 188,515 |
Talwalkars Better Value Fitness Ltd. | 28,910 | | 103,970 |
Tata Consultancy Services Ltd. | 7,907 | | 193,321 |
TOTAL INDIA | | 5,067,022 |
Indonesia - 0.8% |
PT Global Mediacom Tbk | 1,003,000 | | 237,565 |
PT Holcim Indonesia Tbk | 607,000 | | 205,387 |
PT Surya Semesta Internusa Tbk | 1,560,000 | | 191,649 |
TOTAL INDONESIA | | 634,601 |
Ireland - 1.5% |
Paddy Power PLC (Ireland) | 4,200 | | 309,972 |
Trinity Biotech PLC sponsored ADR | 60,641 | | 857,464 |
TOTAL IRELAND | | 1,167,436 |
Israel - 0.2% |
Mellanox Technologies Ltd. (a) | 1,900 | | 146,243 |
Italy - 1.1% |
De Longhi SpA | 18,200 | | 242,269 |
ENI SpA | 13,400 | | 308,346 |
Common Stocks - continued |
| Shares | | Value |
Italy - continued |
Gentium SpA sponsored ADR (a) | 4,100 | | $ 45,633 |
Prada SpA | 26,400 | | 215,286 |
TOTAL ITALY | | 811,534 |
Japan - 9.5% |
Ajinomoto Co., Inc. | 18,000 | | 274,859 |
ARNEST ONE Corp. | 10,200 | | 151,409 |
Asahi Glass Co. Ltd. | 23,000 | | 156,157 |
CAC Corp. | 22,700 | | 191,086 |
Chiyoda Corp. | 14,000 | | 225,880 |
cocokara fine HOLDINGS, Inc. | 6,100 | | 205,396 |
Cosmos Pharmaceutical Corp. | 2,500 | | 246,461 |
Credit Saison Co. Ltd. | 6,700 | | 147,126 |
Hamakyorex Co. Ltd. | 3,400 | | 106,008 |
Hitachi Capital Corp. | 15,200 | | 291,700 |
IT Holdings Corp. | 22,400 | | 278,913 |
J Trust Co. Ltd. | 15,300 | | 225,197 |
Kanto Natural Gas Development | 36,000 | | 190,304 |
Micronics Japan Co. Ltd. | 10,100 | | 36,690 |
Mitsubishi UFJ Lease & Finance Co. Ltd. | 4,250 | | 183,139 |
Monex Group, Inc. | 769 | | 130,816 |
Nihon Kohden Corp. | 8,100 | | 301,048 |
NSD Co. Ltd. | 22,800 | | 218,204 |
ORIX Corp. | 2,510 | | 257,823 |
Otsuka Corp. | 3,800 | | 309,884 |
Otsuka Holdings Co. Ltd. | 6,400 | | 197,139 |
Park24 Co. Ltd. | 11,300 | | 194,208 |
Relo Holdings Corp. | 9,200 | | 305,860 |
Ryoyo Electro Corp. | 16,500 | | 164,938 |
Sekisui House Ltd. | 23,000 | | 234,811 |
Shinsei Bank Ltd. | 242,000 | | 354,679 |
Ship Healthcare Holdings, Inc. | 13,500 | | 450,338 |
The Suruga Bank Ltd. | 24,000 | | 288,012 |
Tohokushinsha Film Corp. | 15,100 | | 105,925 |
Toshiba Plant Systems & Services Corp. | 24,000 | | 324,991 |
Tsutsumi Jewelry Co. Ltd. | 15,500 | | 355,512 |
Utoc Corp. | 18,700 | | 54,580 |
Wacom Co. Ltd. | 34 | | 98,767 |
TOTAL JAPAN | | 7,257,860 |
Korea (South) - 3.6% |
Cheil Worldwide, Inc. | 10,120 | | 194,915 |
Common Stocks - continued |
| Shares | | Value |
Korea (South) - continued |
GS Retail Co. Ltd. | 7,240 | | $ 211,824 |
Hyundai Greenfood Co. Ltd. | 12,480 | | 207,176 |
Hyundai Wia Corp. | 1,166 | | 188,751 |
KT Skylife Co. Ltd. (a) | 7,650 | | 212,944 |
LG Household & Health Care Ltd. | 561 | | 329,812 |
LIG Non-Life Insurance Co. Ltd. | 6,710 | | 171,086 |
Lotte Samkang Co. Ltd. | 382 | | 256,110 |
Orion Corp. | 224 | | 210,375 |
Paradise Co. Ltd. | 14,721 | | 246,403 |
Sajo Industries Co. Ltd. | 3,501 | | 180,778 |
Suprema, Inc. | 12,490 | | 214,215 |
UBIVELOX, Inc. (a) | 4,129 | | 100,544 |
TOTAL KOREA (SOUTH) | | 2,724,933 |
Luxembourg - 1.2% |
Altisource Portfolio Solutions SA (a) | 6,300 | | 715,050 |
L'Occitane Ltd. | 68,500 | | 213,453 |
TOTAL LUXEMBOURG | | 928,503 |
Mexico - 1.7% |
Alsea SAB de CV | 251,900 | | 403,994 |
America Movil SAB de CV Series L sponsored ADR | 10,100 | | 255,429 |
Embotelladoras Arca SAB de CC | 27,200 | | 197,363 |
Fomento Economico Mexicano SAB de CV unit | 22,100 | | 199,025 |
Grupo Financiero Banorte SAB de CV Series O | 37,400 | | 207,794 |
TOTAL MEXICO | | 1,263,605 |
Netherlands - 1.9% |
Brunel International NV | 4,200 | | 202,238 |
Gemalto NV | 6,356 | | 573,552 |
LyondellBasell Industries NV Class A | 4,900 | | 261,611 |
Unilever NV (Certificaten Van Aandelen) (Bearer) | 11,915 | | 437,932 |
TOTAL NETHERLANDS | | 1,475,333 |
New Zealand - 0.1% |
Summerset Group Holdings Ltd. | 55,476 | | 92,159 |
Norway - 0.4% |
TGS Nopec Geophysical Co. ASA | 9,700 | | 330,065 |
Panama - 0.8% |
Copa Holdings SA Class A | 2,702 | | 250,800 |
McDermott International, Inc. (a) | 33,900 | | 363,069 |
TOTAL PANAMA | | 613,869 |
Common Stocks - continued |
| Shares | | Value |
Philippines - 1.1% |
Bank of the Philippine Islands (BPI) | 103,660 | | $ 204,293 |
EastWest Banking Corp. | 385,000 | | 222,944 |
First Gen Corp. (a) | 425,000 | | 231,113 |
Vista Land & Lifescapes, Inc. | 1,755,000 | | 204,964 |
TOTAL PHILIPPINES | | 863,314 |
Russia - 0.9% |
Gazprom OAO sponsored ADR (Reg. S) | 18,700 | | 170,825 |
Vozrozhdenie Bank (a) | 27,400 | | 481,338 |
TOTAL RUSSIA | | 652,163 |
Singapore - 0.3% |
Breadtalk Group Ltd. | 209,000 | | 102,804 |
Global Logistic Properties Ltd. | 45,000 | | 94,811 |
TOTAL SINGAPORE | | 197,615 |
South Africa - 1.8% |
Assore Ltd. | 4,900 | | 202,315 |
DataTec Ltd. | 32,000 | | 198,555 |
Life Healthcare Group Holdings Ltd. | 52,000 | | 196,650 |
Naspers Ltd. Class N | 3,600 | | 233,717 |
Omnia Holdings Ltd. | 13,800 | | 204,279 |
Super Group Ltd. (a) | 179,100 | | 320,166 |
TOTAL SOUTH AFRICA | | 1,355,682 |
Sweden - 1.2% |
AarhusKarlshamn AB | 16,600 | | 653,198 |
DIBS Payment Services AB | 7,300 | | 57,230 |
Hexagon AB (B Shares) | 8,400 | | 193,255 |
TOTAL SWEDEN | | 903,683 |
Switzerland - 0.2% |
Syngenta AG (Switzerland) | 380 | | 148,158 |
Thailand - 1.5% |
Asian Property Development PCL (For. Reg.) | 1,117,900 | | 317,109 |
Berli Jucker PCL | 125,400 | | 262,698 |
Hemaraj Land & Development PCL NVDR | 1,883,000 | | 192,782 |
Kasikornbank PCL (For. Reg.) | 38,000 | | 223,019 |
Supalai PCL (For. Reg.) | 209,400 | | 131,088 |
TOTAL THAILAND | | 1,126,696 |
Turkey - 0.8% |
Koza Altin Isletmeleri A/S | 9,000 | | 195,816 |
Common Stocks - continued |
| Shares | | Value |
Turkey - continued |
Turkiye Halk Bankasi A/S | 23,000 | | $ 202,734 |
Yazicilar Holding A/S | 26,000 | | 208,145 |
TOTAL TURKEY | | 606,695 |
United Kingdom - 4.4% |
Aberdeen Asset Management PLC | 71,400 | | 373,895 |
Anite Group PLC | 89,700 | | 204,392 |
Ashtead Group PLC | 45,600 | | 274,480 |
Barclays PLC | 33,613 | | 124,292 |
Dechra Pharmaceuticals PLC | 8,500 | | 84,633 |
Domino Printing Sciences PLC | 21,300 | | 186,301 |
Genus PLC | 8,300 | | 195,286 |
Great Portland Estates PLC | 9,700 | | 73,195 |
Hikma Pharmaceuticals PLC | 16,713 | | 199,448 |
HSBC Holdings PLC (United Kingdom) | 21,000 | | 207,045 |
iomart Group PLC | 76,318 | | 245,085 |
Michael Page International PLC | 31,300 | | 182,039 |
Moneysupermarket.com Group PLC | 255,800 | | 553,148 |
Oxford Instruments PLC | 9,000 | | 195,199 |
Speedy Hire PLC | 411,500 | | 214,159 |
Whitbread PLC | 111 | | 4,209 |
TOTAL UNITED KINGDOM | | 3,316,806 |
United States of America - 38.7% |
Aceto Corp. | 46,300 | | 463,926 |
Alliance Data Systems Corp. (a) | 3,800 | | 543,590 |
American Public Education, Inc. (a) | 8,100 | | 295,083 |
Amgen, Inc. | 6,600 | | 571,197 |
AMN Healthcare Services, Inc. (a) | 24,500 | | 243,040 |
Apache Corp. | 3,900 | | 322,725 |
Apple, Inc. | 681 | | 405,263 |
Barrett Business Services, Inc. | 22,800 | | 680,124 |
Baxter International, Inc. | 800 | | 50,104 |
BB&T Corp. | 7,600 | | 220,020 |
Biogen Idec, Inc. (a) | 600 | | 82,932 |
Blucora, Inc. (a) | 18,335 | | 321,779 |
Brocade Communications Systems, Inc. (a) | 35,500 | | 188,150 |
Celgene Corp. (a) | 1,800 | | 131,976 |
Chart Industries, Inc. (a) | 2,600 | | 184,054 |
Chuys Holdings, Inc. | 700 | | 17,101 |
Computer Task Group, Inc. (a) | 35,900 | | 669,535 |
Corporate Executive Board Co. | 8,600 | | 386,656 |
Common Stocks - continued |
| Shares | | Value |
United States of America - continued |
Corrections Corp. of America | 7,100 | | $ 238,915 |
Cracker Barrel Old Country Store, Inc. | 5,100 | | 324,615 |
Discovery Communications, Inc. (a) | 3,000 | | 177,060 |
eBay, Inc. (a) | 11,000 | | 531,190 |
EPAM Systems, Inc. | 2,300 | | 41,354 |
Equifax, Inc. | 7,100 | | 355,284 |
Expedia, Inc. | 4,500 | | 266,175 |
Fiesta Restaurant Group, Inc. (a) | 32,600 | | 430,972 |
First Commonwealth Financial Corp. | 104,700 | | 685,785 |
Fiserv, Inc. (a) | 5,250 | | 393,435 |
FleetCor Technologies, Inc. (a) | 4,400 | | 208,604 |
FMC Corp. | 5,800 | | 310,416 |
Foot Locker, Inc. | 5,400 | | 180,900 |
Francescas Holdings Corp. (a) | 6,600 | | 194,898 |
General Electric Co. | 30,700 | | 646,542 |
Google, Inc. Class A (a) | 1,500 | | 1,019,655 |
Group 1 Automotive, Inc. | 3,800 | | 235,638 |
Guidance Software, Inc. (a) | 19,100 | | 232,638 |
Heartland Payment Systems, Inc. | 6,500 | | 169,520 |
Hess Corp. | 7,700 | | 402,402 |
HollyFrontier Corp. | 6,100 | | 235,643 |
Huntington Bancshares, Inc. | 20,000 | | 127,800 |
Icahn Enterprises LP rights | 8,000 | | 0 |
International Paper Co. | 2,000 | | 71,660 |
Jarden Corp. | 15,300 | | 761,940 |
Landec Corp. (a) | 49,500 | | 535,590 |
Lincoln National Corp. | 3,100 | | 76,849 |
Lithia Motors, Inc. Class A (sub. vtg.) | 6,200 | | 212,040 |
LKQ Corp. (a) | 10,600 | | 221,434 |
LSI Industries, Inc. | 29,300 | | 198,654 |
Lydall, Inc. (a) | 6,800 | | 87,788 |
Marathon Petroleum Corp. | 7,800 | | 428,454 |
Maximus, Inc. | 5,500 | | 303,490 |
Mentor Graphics Corp. (a) | 18,300 | | 284,016 |
Merck & Co., Inc. | 6,300 | | 287,469 |
Murphy Oil Corp. | 5,400 | | 324,000 |
Natus Medical, Inc. (a) | 16,300 | | 184,190 |
Papa John's International, Inc. (a) | 5,200 | | 277,264 |
PDF Solutions, Inc. (a) | 46,700 | | 618,308 |
Penske Automotive Group, Inc. | 15,300 | | 468,180 |
Phillips 66 | 8,800 | | 415,008 |
Polaris Industries, Inc. | 2,200 | | 185,900 |
Common Stocks - continued |
| Shares | | Value |
United States of America - continued |
Portfolio Recovery Associates, Inc. (a) | 1,200 | | $ 125,580 |
PPG Industries, Inc. | 1,100 | | 128,788 |
PrivateBancorp, Inc. | 3,200 | | 51,712 |
PVH Corp. | 1,300 | | 142,987 |
QEP Resources, Inc. | 7,800 | | 226,200 |
Rayonier, Inc. | 2,300 | | 112,723 |
Ross Stores, Inc. | 8,200 | | 499,790 |
Snap-On, Inc. | 900 | | 69,597 |
Sonic Automotive, Inc. Class A (sub. vtg.) | 43,000 | | 834,200 |
SurModics, Inc. (a) | 6,100 | | 109,678 |
Synopsys, Inc. (a) | 25,400 | | 817,880 |
Synta Pharmaceuticals Corp. (a) | 15,900 | | 125,133 |
Sypris Solutions, Inc. | 15,200 | | 95,760 |
Teletech Holdings, Inc. (a) | 14,400 | | 242,496 |
The Walt Disney Co. | 18,800 | | 922,516 |
Time Warner Cable, Inc. | 4,300 | | 426,173 |
TJX Companies, Inc. | 3,800 | | 158,194 |
Total System Services, Inc. | 32,000 | | 719,680 |
U.S. Bancorp | 4,600 | | 152,766 |
Valero Energy Corp. | 11,400 | | 331,740 |
Valspar Corp. | 8,900 | | 498,667 |
Viacom, Inc. Class B (non-vtg.) | 5,000 | | 256,350 |
W.R. Grace & Co. (a) | 9,000 | | 577,440 |
Wal-Mart Stores, Inc. | 5,300 | | 397,606 |
Walter Investment Management Corp. | 15,700 | | 758,781 |
Wells Fargo & Co. | 14,500 | | 488,505 |
Western Refining, Inc. | 4,800 | | 119,376 |
Wyndham Worldwide Corp. | 18,800 | | 947,520 |
TOTAL UNITED STATES OF AMERICA | | 29,466,768 |
TOTAL COMMON STOCKS (Cost $67,701,745) |
75,117,237
|
Money Market Funds - 0.4% |
| Shares | | Value |
Fidelity Cash Central Fund, 0.19% (b) | 60,014 | | $ 60,014 |
Fidelity Securities Lending Cash Central Fund, 0.19% (b)(c) | 260,000 | | 260,000 |
TOTAL MONEY MARKET FUNDS (Cost $320,014) |
320,014
|
TOTAL INVESTMENT PORTFOLIO - 99.2% (Cost $68,021,759) | | 75,437,251 |
NET OTHER ASSETS (LIABILITIES) - 0.8% | | 625,378 |
NET ASSETS - 100% | $ 76,062,629 |
Legend |
(a) Non-income producing |
(b) Affiliated fund that is available only to investment companies and other accounts managed by Fidelity Investments. The rate quoted is the annualized seven-day yield of the fund at period end. A complete unaudited listing of the fund's holdings as of its most recent quarter end is available upon request. In addition, each Fidelity Central Fund's financial statements, which are not covered by the Fund's Report of Independent Registered Public Accounting Firm, are available on the SEC's website or upon request. |
(c) Investment made with cash collateral received from securities on loan. |
(d) Security or a portion of the security is on loan at period end. |
Affiliated Central Funds |
Information regarding fiscal year to date income earned by the Fund from investments in Fidelity Central Funds is as follows: |
Fund | Income earned |
Fidelity Cash Central Fund | $ 1,682 |
Fidelity Securities Lending Cash Central Fund | 20,307 |
Total | $ 21,989 |
Other Information |
Categorizations in the Schedule of Investments are based on country or territory of incorporation. |
The following is a summary of the inputs used, as of October 31, 2012, involving the Fund's assets and liabilities carried at fair value. The inputs or methodology used for valuing securities may not be an indication of the risk associated with investing in those securities. For more information on valuation inputs, and their aggregation into the levels used in the table below, please refer to the Security Valuation section in the accompanying Notes to Financial Statements. |
Valuation Inputs at Reporting Date: |
Description | Total | Level 1 | Level 2 | Level 3 |
Investments in Securities: | | | | |
Equities: | | | | |
Consumer Discretionary | $ 16,662,301 | $ 16,662,301 | $ - | $ - |
Consumer Staples | 4,977,778 | 4,539,846 | 437,932 | - |
Energy | 5,570,308 | 5,261,962 | 308,346 | - |
Financials | 11,029,756 | 10,498,842 | 530,914 | - |
Health Care | 6,619,531 | 6,619,531 | - | - |
Industrials | 9,338,644 | 9,338,644 | - | - |
Information Technology | 16,086,050 | 15,880,115 | 205,935 | - |
Materials | 3,948,969 | 3,800,811 | 148,158 | - |
Telecommunication Services | 255,429 | 255,429 | - | - |
Utilities | 628,471 | 628,471 | - | - |
Money Market Funds | 320,014 | 320,014 | - | - |
Total Investments in Securities: | $ 75,437,251 | $ 73,805,966 | $ 1,631,285 | $ - |
The following is a summary of transfers between Level 1 and Level 2 for the period ended October 31, 2012. Transfers are assumed to have occurred at the beginning of the period, and are primarily attributable to the valuation techniques used for foreign equity securities, as discussed in the accompanying Notes to Financial Statements: |
Transfers | Total |
Level 1 to Level 2 | $ 0 |
Level 2 to Level 1 | $ 10,603,563 |
See accompanying notes which are an integral part of the financial statements.
Annual Report
Statement of Assets and Liabilities
| October 31, 2012 |
| | |
Assets | | |
Investment in securities, at value (including securities loaned of $259,840) - See accompanying schedule: Unaffiliated issuers (cost $67,701,745) | $ 75,117,237 | |
Fidelity Central Funds (cost $320,014) | 320,014 | |
Total Investments (cost $68,021,759) | | $ 75,437,251 |
Cash | | 18,776 |
Foreign currency held at value (cost $10,536) | | 10,536 |
Receivable for investments sold | | 1,862,118 |
Receivable for fund shares sold | | 25,012 |
Dividends receivable | | 59,492 |
Distributions receivable from Fidelity Central Funds | | 849 |
Other receivables | | 69,966 |
Total assets | | 77,484,000 |
| | |
Liabilities | | |
Payable for investments purchased | $ 787,739 | |
Payable for fund shares redeemed | 235,250 | |
Accrued management fee | 37,378 | |
Distribution and service plan fees payable | 21,660 | |
Other affiliated payables | 19,921 | |
Other payables and accrued expenses | 59,423 | |
Collateral on securities loaned, at value | 260,000 | |
Total liabilities | | 1,421,371 |
| | |
Net Assets | | $ 76,062,629 |
Net Assets consist of: | | |
Paid in capital | | $ 102,304,518 |
Distributions in excess of net investment income | | (48,305) |
Accumulated undistributed net realized gain (loss) on investments and foreign currency transactions | | (33,594,220) |
Net unrealized appreciation (depreciation) on investments and assets and liabilities in foreign currencies | | 7,400,636 |
Net Assets | | $ 76,062,629 |
See accompanying notes which are an integral part of the financial statements.
Annual Report
Financial Statements - continued
Statement of Assets and Liabilities - continued
| October 31, 2012 |
| | |
Calculation of Maximum Offering Price
Class A:
Net Asset Value and redemption price per share
($26,961,296 ÷ 2,592,971 shares) | | $ 10.40 |
| | |
Maximum offering price per share (100/94.25 of $10.40) | | $ 11.03 |
Class T:
Net Asset Value and redemption price per share ($15,730,837 ÷ 1,559,807 shares) | | $ 10.09 |
| | |
Maximum offering price per share (100/96.50 of $10.09) | | $ 10.46 |
Class B:
Net Asset Value and offering price per share ($1,401,494 ÷ 148,693 shares)A | | $ 9.43 |
| | |
Class C:
Net Asset Value and offering price per share ($9,420,804 ÷ 1,000,885 shares)A | | $ 9.41 |
| | |
| | |
Institutional Class:
Net Asset Value, offering price and redemption price per share ($22,548,198 ÷ 2,091,464 shares) | | $ 10.78 |
A Redemption price per share is equal to net asset value less any applicable contingent deferred sales charge.
See accompanying notes which are an integral part of the financial statements.
Annual Report
Statement of Operations
| Year ended October 31, 2012 |
| | |
Investment Income | | |
Dividends | | $ 1,393,654 |
Interest | | 2 |
Income from Fidelity Central Funds | | 21,989 |
Income before foreign taxes withheld | | 1,415,645 |
Less foreign taxes withheld | | (72,356) |
Total income | | 1,343,289 |
| | |
Expenses | | |
Management fee
Basic fee | $ 584,893 | |
Performance adjustment | (124,577) | |
Transfer agent fees | 218,147 | |
Distribution and service plan fees | 278,013 | |
Accounting and security lending fees | 43,254 | |
Custodian fees and expenses | 85,371 | |
Independent trustees' compensation | 558 | |
Registration fees | 66,707 | |
Audit | 73,511 | |
Legal | 333 | |
Miscellaneous | 1,266 | |
Total expenses before reductions | 1,227,476 | |
Expense reductions | (21,799) | 1,205,677 |
Net investment income (loss) | | 137,612 |
Realized and Unrealized Gain (Loss) Net realized gain (loss) on: | | |
Investment securities: | | |
Unaffiliated issuers | (8,549,404) | |
Foreign currency transactions | (292,648) | |
Total net realized gain (loss) | | (8,842,052) |
Change in net unrealized appreciation (depreciation) on: Investment securities | 14,577,096 | |
Assets and liabilities in foreign currencies | 81,010 | |
Total change in net unrealized appreciation (depreciation) | | 14,658,106 |
Net gain (loss) | | 5,816,054 |
Net increase (decrease) in net assets resulting from operations | | $ 5,953,666 |
See accompanying notes which are an integral part of the financial statements.
Annual Report
Financial Statements - continued
Statement of Changes in Net Assets
| Year ended
October 31,
2012 | Year ended
October 31,
2011 |
Increase (Decrease) in Net Assets | | |
Operations | | |
Net investment income (loss) | $ 137,612 | $ (393,823) |
Net realized gain (loss) | (8,842,052) | (13,816,008) |
Change in net unrealized appreciation (depreciation) | 14,658,106 | (16,449,325) |
Net increase (decrease) in net assets resulting
from operations | 5,953,666 | (30,659,156) |
Distributions to shareholders from net realized gain | - | (352,610) |
Share transactions - net increase (decrease) | (32,721,810) | 56,562,275 |
Redemption fees | 954 | 6,577 |
Total increase (decrease) in net assets | (26,767,190) | 25,557,086 |
| | |
Net Assets | | |
Beginning of period | 102,829,819 | 77,272,733 |
End of period (including distributions in excess of net investment income of $48,305 and undistributed net investment income of $0, respectively) | $ 76,062,629 | $ 102,829,819 |
See accompanying notes which are an integral part of the financial statements.
Annual Report
Financial Highlights - Class A
Years ended October 31, | 2012 | 2011 | 2010 | 2009 | 2008 |
Selected Per-Share Data | | | | | |
Net asset value, beginning of period | $ 9.57 | $ 11.41 | $ 9.04 | $ 6.88 | $ 15.38 |
Income from Investment Operations | | | | | |
Net investment income (loss)C | .02 | (.03) | .01 | .04 | .04 |
Net realized and unrealized gain (loss) | .81 | (1.76) | 2.47 | 2.13 | (6.74) |
Total from investment operations | .83 | (1.79) | 2.48 | 2.17 | (6.70) |
Distributions from net investment income | - | - | (.03) | (.01) | - |
Distributions from net realized gain | - | (.05) | (.08) | - | (1.80) |
Total distributions | - | (.05) | (.11) | (.01) | (1.80) |
Redemption fees added to paid in capital C, G | - | - | - | - | - |
Net asset value, end of period | $ 10.40 | $ 9.57 | $ 11.41 | $ 9.04 | $ 6.88 |
Total ReturnA, B | 8.67% | (15.81)% | 27.68% | 31.68% | (48.99)% |
Ratios to Average Net Assets D, F | | | | | |
Expenses before reductions | 1.43% | 1.51% | 1.89% | 2.22% | 1.90% |
Expenses net of fee waivers, if any | 1.43% | 1.45% | 1.50% | 1.50% | 1.50% |
Expenses net of all reductions | 1.40% | 1.43% | 1.44% | 1.43% | 1.41% |
Net investment income (loss) | .22% | (.24)% | .13% | .53% | .38% |
Supplemental Data | | | | | |
Net assets, end of period (000 omitted) | $ 26,961 | $ 36,367 | $ 30,383 | $ 6,997 | $ 6,904 |
Portfolio turnover rate E | 155% | 140% | 179% | 258% | 257% |
A Total returns would have been lower if certain expenses had not been reduced during the applicable periods shown.
B Total returns do not include the effect of the sales charges.
C Calculated based on average shares outstanding during the period.
D Fees and expenses of any underlying Fidelity Central Funds are not included in the Fund's expense ratio. The Fund indirectly bears its proportionate share of the expenses of any underlying Fidelity Central Funds.
E Amount does not include the portfolio activity of any underlying Fidelity Central Funds.
F Expense ratios reflect operating expenses of the class. Expenses before reductions do not reflect amounts reimbursed by the investment adviser or reductions from brokerage service arrangements or reductions from other expense offset arrangements and do not represent the amount paid by the class during periods when reimbursements or reductions occur. Expenses net of fee waivers reflect expenses after reimbursement by the investment adviser but prior to reductions from brokerage service arrangements or other expense offset arrangements. Expenses net of all reductions represent the net expenses paid by the class.
G Amount represents less than $.01 per share.
See accompanying notes which are an integral part of the financial statements.
Annual Report
Financial Highlights - Class T
Years ended October 31, | 2012 | 2011 | 2010 | 2009 | 2008 |
Selected Per-Share Data | | | | | |
Net asset value, beginning of period | $ 9.31 | $ 11.11 | $ 8.82 | $ 6.72 | $ 15.05 |
Income from Investment Operations | | | | | |
Net investment income (loss)C | - | (.05) | (.01) | .02 | .01 |
Net realized and unrealized gain (loss) | .78 | (1.72) | 2.39 | 2.09 | (6.59) |
Total from investment operations | .78 | (1.77) | 2.38 | 2.11 | (6.58) |
Distributions from net investment income | - | - | (.01) | (.01) | - |
Distributions from net realized gain | - | (.03) | (.08) | - | (1.75) |
Total distributions | - | (.03) | (.09) | (.01) | (1.75) |
Redemption fees added to paid in capital C, G | - | - | - | - | - |
Net asset value, end of period | $ 10.09 | $ 9.31 | $ 11.11 | $ 8.82 | $ 6.72 |
Total ReturnA, B | 8.38% | (15.97)% | 27.20% | 31.50% | (49.12)% |
Ratios to Average Net Assets D, F | | | | | |
Expenses before reductions | 1.71% | 1.80% | 2.32% | 2.50% | 2.17% |
Expenses net of fee waivers, if any | 1.70% | 1.70% | 1.75% | 1.75% | 1.75% |
Expenses net of all reductions | 1.68% | 1.68% | 1.70% | 1.69% | 1.66% |
Net investment income (loss) | (.05)% | (.49)% | (.13)% | .27% | .13% |
Supplemental Data | | | | | |
Net assets, end of period (000 omitted) | $ 15,731 | $ 24,180 | $ 23,237 | $ 10,494 | $ 8,104 |
Portfolio turnover rateE | 155% | 140% | 179% | 258% | 257% |
A Total returns would have been lower if certain expenses had not been reduced during the applicable periods shown.
B Total returns do not include the effect of the sales charges.
C Calculated based on average shares outstanding during the period.
D Fees and expenses of any underlying Fidelity Central Funds are not included in the Fund's expense ratio. The Fund indirectly bears its proportionate share of the expenses of any underlying Fidelity Central Funds.
E Amount does not include the portfolio activity of any underlying Fidelity Central Funds.
F Expense ratios reflect operating expenses of the class. Expenses before reductions do not reflect amounts reimbursed by the investment adviser or reductions from brokerage service arrangements or reductions from other expense offset arrangements and do not represent the amount paid by the class during periods when reimbursements or reductions occur. Expenses net of fee waivers reflect expenses after reimbursement by the investment adviser but prior to reductions from brokerage service arrangements or other expense offset arrangements. Expenses net of all reductions represent the net expenses paid by the class.
G Amount represents less than $.01 per share.
See accompanying notes which are an integral part of the financial statements.
Annual Report
Financial Highlights - Class B
Years ended October 31, | 2012 | 2011 | 2010 | 2009 | 2008 |
Selected Per-Share Data | | | | | |
Net asset value, beginning of period | $ 8.74 | $ 10.46 | $ 8.31 | $ 6.37 | $ 14.34 |
Income from Investment Operations | | | | | |
Net investment income (loss) C | (.05) | (.10) | (.06) | (.02) | (.04) |
Net realized and unrealized gain (loss) | .74 | (1.62) | 2.26 | 1.97 | (6.25) |
Total from investment operations | .69 | (1.72) | 2.20 | 1.95 | (6.29) |
Distributions from net investment income | - | - | - | (.01) | - |
Distributions from net realized gain | - | - G | (.05) | - | (1.68) |
Total distributions | - | - G | (.05) | (.01) | (1.68) |
Redemption fees added to paid in capital C, G | - | - | - | - | - |
Net asset value, end of period | $ 9.43 | $ 8.74 | $ 10.46 | $ 8.31 | $ 6.37 |
Total ReturnA, B | 7.89% | (16.42)% | 26.64% | 30.62% | (49.33)% |
Ratios to Average Net Assets D, F | | | | | |
Expenses before reductions | 2.19% | 2.32% | 2.82% | 2.98% | 2.66% |
Expenses net of fee waivers, if any | 2.19% | 2.20% | 2.25% | 2.25% | 2.25% |
Expenses net of all reductions | 2.17% | 2.18% | 2.19% | 2.18% | 2.16% |
Net investment income (loss) | (.54)% | (.99)% | (.62)% | (.22)% | (.37)% |
Supplemental Data | | | | | |
Net assets, end of period (000 omitted) | $ 1,401 | $ 1,926 | $ 2,731 | $ 2,162 | $ 1,918 |
Portfolio turnover rate E | 155% | 140% | 179% | 258% | 257% |
A Total returns would have been lower if certain expenses had not been reduced during the applicable periods shown.
B Total returns do not include the effect of the contingent deferred sales charge.
C Calculated based on average shares outstanding during the period.
D Fees and expenses of any underlying Fidelity Central Funds are not included in the Fund's expense ratio. The Fund indirectly bears its proportionate share of the expenses of any underlying Fidelity Central Funds.
E Amount does not include the portfolio activity of any underlying Fidelity Central Funds.
F Expense ratios reflect operating expenses of the class. Expenses before reductions do not reflect amounts reimbursed by the investment adviser or reductions from brokerage service arrangements or reductions from other expense offset arrangements and do not represent the amount paid by the class during periods when reimbursements or reductions occur. Expenses net of fee waivers reflect expenses after reimbursement by the investment adviser but prior to reductions from brokerage service arrangements or other expense offset arrangements. Expenses net of all reductions represent the net expenses paid by the class.
G Amount represents less than $.01 per share.
See accompanying notes which are an integral part of the financial statements.
Annual Report
Financial Highlights - Class C
Years ended October 31, | 2012 | 2011 | 2010 | 2009 | 2008 |
Selected Per-Share Data | | | | | |
Net asset value, beginning of period | $ 8.73 | $ 10.46 | $ 8.31 | $ 6.37 | $ 14.36 |
Income from Investment Operations | | | | | |
Net investment income (loss) C | (.05) | (.10) | (.06) | (.02) | (.04) |
Net realized and unrealized gain (loss) | .73 | (1.61) | 2.27 | 1.97 | (6.26) |
Total from investment operations | .68 | (1.71) | 2.21 | 1.95 | (6.30) |
Distributions from net investment income | - | - | - | (.01) | - |
Distributions from net realized gain | - | (.02) | (.06) | - | (1.69) |
Total distributions | - | (.02) | (.06) | (.01) | (1.69) |
Redemption fees added to paid in capital C, G | - | - | - | - | - |
Net asset value, end of period | $ 9.41 | $ 8.73 | $ 10.46 | $ 8.31 | $ 6.37 |
Total Return A, B | 7.79% | (16.38)% | 26.68% | 30.62% | (49.35)% |
Ratios to Average Net Assets D, F | | | | | |
Expenses before reductions | 2.18% | 2.28% | 2.77% | 2.97% | 2.63% |
Expenses net of fee waivers, if any | 2.18% | 2.20% | 2.25% | 2.25% | 2.25% |
Expenses net of all reductions | 2.16% | 2.18% | 2.20% | 2.18% | 2.16% |
Net investment income (loss) | (.53)% | (.99)% | (.63)% | (.22)% | (.37)% |
Supplemental Data | | | | | |
Net assets, end of period (000 omitted) | $ 9,421 | $ 11,632 | $ 7,986 | $ 3,378 | $ 2,697 |
Portfolio turnover rate E | 155% | 140% | 179% | 258% | 257% |
A Total returns would have been lower if certain expenses had not been reduced during the applicable periods shown.
B Total returns do not include the effect of the contingent deferred sales charge.
C Calculated based on average shares outstanding during the period.
D Fees and expenses of any underlying Fidelity Central Funds are not included in the Fund's expense ratio. The Fund indirectly bears its proportionate share of the expenses of any underlying Fidelity Central Funds.
E Amount does not include the portfolio activity of any underlying Fidelity Central Funds.
F Expense ratios reflect operating expenses of the class. Expenses before reductions do not reflect amounts reimbursed by the investment adviser or reductions from brokerage service arrangements or reductions from other expense offset arrangements and do not represent the amount paid by the class during periods when reimbursements or reductions occur. Expenses net of fee waivers reflect expenses after reimbursement by the investment adviser but prior to reductions from brokerage service arrangements or other expense offset arrangements. Expenses net of all reductions represent the net expenses paid by the class.
G Amount represents less than $.01 per share.
See accompanying notes which are an integral part of the financial statements.
Annual Report
Financial Highlights - Institutional Class
Years ended October 31, | 2012 | 2011 | 2010 | 2009 | 2008 |
Selected Per-Share Data | | | | | |
Net asset value, beginning of period | $ 9.88 | $ 11.76 | $ 9.31 | $ 7.07 | $ 15.76 |
Income from Investment Operations | | | | | |
Net investment income (loss) B | .06 | - F | .04 | .06 | .07 |
Net realized and unrealized gain (loss) | .84 | (1.82) | 2.54 | 2.20 | (6.93) |
Total from investment operations | .90 | (1.82) | 2.58 | 2.26 | (6.86) |
Distributions from net investment income | - | - | (.05) | (.02) | - |
Distributions from net realized gain | - | (.06) | (.08) | - | (1.83) |
Total distributions | - | (.06) | (.13) | (.02) | (1.83) |
Redemption fees added to paid in capital B, F | - | - | - | - | - |
Net asset value, end of period | $ 10.78 | $ 9.88 | $ 11.76 | $ 9.31 | $ 7.07 |
Total Return A | 9.11% | (15.60)% | 28.00% | 32.03% | (48.89)% |
Ratios to Average Net Assets C, E | | | | | |
Expenses before reductions | 1.06% | 1.18% | 1.43% | 1.88% | 1.51% |
Expenses net of fee waivers, if any | 1.06% | 1.17% | 1.25% | 1.25% | 1.25% |
Expenses net of all reductions | 1.03% | 1.15% | 1.19% | 1.18% | 1.16% |
Net investment income (loss) | .59% | .04% | .38% | .78% | .63% |
Supplemental Data | | | | | |
Net assets, end of period (000 omitted) | $ 22,548 | $ 28,725 | $ 12,936 | $ 1,148 | $ 1,166 |
Portfolio turnover rate D | 155% | 140% | 179% | 258% | 257% |
A Total returns would have been lower if certain expenses had not been reduced during the applicable periods shown.
B Calculated based on average shares outstanding during the period.
C Fees and expenses of any underlying Fidelity Central Funds are not included in the Fund's expense ratio. The Fund indirectly bears its proportionate share of the expenses of any underlying Fidelity Central Funds.
D Amount does not include the portfolio activity of any underlying Fidelity Central Funds.
E Expense ratios reflect operating expenses of the class. Expenses before reductions do not reflect amounts reimbursed by the investment adviser or reductions from brokerage service arrangements or reductions from other expense offset arrangements and do not represent the amount paid by the class during periods when reimbursements or reductions occur. Expenses net of fee waivers reflect expenses after reimbursement by the investment adviser but prior to reductions from brokerage service arrangements or other expense offset arrangements. Expenses net of all reductions represent the net expenses paid by the class.
F Amount represents less than $.01 per share.
See accompanying notes which are an integral part of the financial statements.
Annual Report
Notes to Financial Statements
For the period ended October 31, 2012
1. Organization.
Fidelity Advisor Global Capital Appreciation Fund (the Fund) is a fund of Fidelity Advisor Series VIII (the Trust) and is authorized to issue an unlimited number of shares. The Trust is registered under the Investment Company Act of 1940, as amended (the 1940 Act), as an open-end management investment company organized as a Massachusetts business trust. The Fund offers Class A, Class T, Class C, and Institutional Class shares, each of which, along with Class B shares, has equal rights as to assets and voting privileges. Effective after the close of business on September 1, 2010, Class B shares were closed to new accounts and additional purchases, except for exchanges and reinvestments. Each class has exclusive voting rights with respect to matters that affect that class. Class B shares will automatically convert to Class A shares after a holding period of seven years from the initial date of purchase. Investment income, realized and unrealized capital gains and losses, the common expenses of the Fund, and certain fund-level expense reductions, if any, are allocated on a pro-rata basis to each class based on the relative net assets of each class to the total net assets of the Fund. Each class differs with respect to transfer agent and distribution and service plan fees incurred. Certain expense reductions may also differ by class. The Fund's investments in emerging markets can be subject to social, economic, regulatory, and political uncertainties and can be extremely volatile.
2. Investments in Fidelity Central Funds.
The Fund invests in Fidelity Central Funds, which are open-end investment companies available only to other investment companies and accounts managed by Fidelity Management & Research Company (FMR) and its affiliates. The Fund's Schedule of Investments lists each of the Fidelity Central Funds held as of period end, if any, as an investment of the Fund, but does not include the underlying holdings of each Fidelity Central Fund. As an Investing Fund, the Fund indirectly bears its proportionate share of the expenses of the underlying Fidelity Central Funds.
The Money Market Central Funds seek preservation of capital and current income and are managed by Fidelity Investments Money Management, Inc. (FIMM), an affiliate of FMR.
A complete unaudited list of holdings for each Fidelity Central Fund is available upon request or at the Securities and Exchange Commission (the SEC) web site at www.sec.gov. In addition, the financial statements of the Fidelity Central Funds, which are not covered by the Fund's Report of Independent Registered Public Accounting Firm, are available on the SEC web site or upon request.
Annual Report
3. Significant Accounting Policies.
The financial statements have been prepared in conformity with accounting principles generally accepted in the United States of America (GAAP), which require management to make certain estimates and assumptions at the date of the financial statements. Actual results could differ from those estimates. Subsequent events, if any, through the date that the financial statements were issued have been evaluated in the preparation of the financial statements. The following summarizes the significant accounting policies of the Fund:
Security Valuation. Investments are valued as of 4:00 p.m. Eastern time on the last calendar day of the period. In accordance with valuation policies and procedures approved by the Board of Trustees (the Board), the Fund attempts to obtain prices from one or more third party pricing vendors or brokers to value its investments. When current market prices, quotations or rates are not readily available or reliable, securities will be fair valued in good faith by the FMR Fair Value Committee (the Committee), in accordance with procedures adopted by the Fund's Board. Factors used in determining fair value vary by security type and may include market or security specific events. The frequency with which these procedures are used cannot be predicted and they may be utilized to a significant extent. The Committee oversees the Fund's valuation policies and procedures and is responsible for approving and reporting to the Board all fair value determinations.
The Fund categorizes the inputs to valuation techniques used to value its investments into a disclosure hierarchy consisting of three levels as shown below:
Level 1 - quoted prices in active markets for identical investments
Level 2 - other significant observable inputs (including quoted prices for similar investments, interest rates, prepayment speeds, etc.)
Level 3 - unobservable inputs (including the Fund's own assumptions based on the best information available)
Valuation techniques used to value the Fund's investments by major category are as follows:
Equity securities, including restricted securities, for which market quotations are readily available, are valued at the last reported sale price or official closing price as reported by a third party pricing vendor on the primary market or exchange on which they are traded and are categorized as Level 1 in the hierarchy. In the event there were no sales during the day or closing prices are not available, securities are valued at the last quoted bid price or may be valued using the last available price and are generally categorized as Level 2 in the hierarchy. For foreign equity securities, when significant market or security specific events arise, comparisons to the valuation of American Depositary Receipts
Annual Report
Notes to Financial Statements - continued
3. Significant Accounting Policies - continued
Security Valuation - continued
(ADRs), futures contracts, Exchange-Traded Funds (ETFs) and certain indexes as well as quoted prices for similar securities are used and are categorized as Level 2 in the hierarchy. Utilizing these techniques may result in transfers between Level 1 and Level 2.
Investments in open-end mutual funds, including the Fidelity Central Funds, are valued at their closing net asset value (NAV) each business day and are categorized as Level 1 in the hierarchy.
Changes in valuation techniques may result in transfers in or out of an assigned level within the disclosure hierarchy. The aggregate value of investments by input level, as of October 31, 2012, including information on transfers between Levels 1 and 2, is included at the end of the applicable Fund's Schedule of Investments.
Foreign Currency Translation. The Fund may use foreign currency contracts to facilitate transactions in foreign-denominated securities. Gains and losses from these transactions may arise from changes in the value of the foreign currency or if the counterparties do not perform under the contracts' terms.
Foreign-denominated assets, including investment securities, and liabilities are translated into U.S. dollars at the exchange rates at period end. Purchases and sales of investment securities, income and dividends received and expenses denominated in foreign currencies are translated into U.S. dollars at the exchange rate in effect on the transaction date.
The effects of exchange rate fluctuations on investments are included with the net realized and unrealized gain (loss) on investment securities. Other foreign currency transactions resulting in realized and unrealized gain (loss) are disclosed separately.
Investment Transactions and Income. For financial reporting purposes, the Fund's investment holdings and NAV include trades executed through the end of the last business day of the period. The NAV per share for processing shareholder transactions is calculated as of the close of business of the New York Stock Exchange (NYSE), normally 4:00 p.m. Eastern time and includes trades executed through the end of the prior business day. Gains and losses on securities sold are determined on the basis of identified cost and may include proceeds received from litigation. Dividend income is recorded on the ex-dividend date, except for certain dividends from foreign securities where the ex-dividend date may have passed, which are recorded as soon as the Fund is informed of the ex-dividend date. Non-cash dividends included in dividend income, if any, are recorded at the fair market value of the securities received. Distributions received on securities that represent a return of capital or capital gain are recorded as a reduction of cost of investments and/or as a realized gain. The Fund estimates the components of distributions received that may be considered return of capital distributions or capital gain distributions. Interest income and distributions from the Fidelity Central Funds are accrued as earned. Interest income includes coupon interest and amortization of
Annual Report
3. Significant Accounting Policies - continued
Investment Transactions and Income - continued
premium and accretion of discount on debt securities. Investment income is recorded net of foreign taxes withheld where recovery of such taxes is uncertain.
Expenses. Expenses directly attributable to a fund are charged to that fund. Expenses attributable to more than one fund are allocated among the respective funds on the basis of relative net assets or other appropriate methods. Expense estimates are accrued in the period to which they relate and adjustments are made when actual amounts are known.
Income Tax Information and Distributions to Shareholders. Each year, the Fund intends to qualify as a regulated investment company under Subchapter M of the Internal Revenue Code, including distributing substantially all of its taxable income and realized gains. As a result, no provision for income taxes is required. As of October 31, 2012, the Fund did not have any unrecognized tax benefits in the financial statements; nor is the Fund aware of any tax positions for which it is reasonably possible that the total amounts of unrecognized tax benefits will significantly change in the next twelve months. The Fund files a U.S. federal tax return, in addition to state and local tax returns as required. A fund's federal income tax returns are subject to examination by the Internal Revenue Service (IRS) for a period of three fiscal years after they are filed. State and local tax returns may be subject to examination for an additional fiscal year depending on the jurisdiction. Foreign taxes are provided for based on the Fund's understanding of the tax rules and rates that exist in the foreign markets in which it invests.
Distributions are declared and recorded on the ex-dividend date. Income dividends and capital gain distributions are declared separately for each class. Income and capital gain distributions are determined in accordance with income tax regulations, which may differ from GAAP.
Capital accounts within the financial statements are adjusted for permanent book-tax differences. These adjustments have no impact on net assets or the results of operations. Temporary book-tax differences will reverse in a subsequent period.
Book-tax differences are primarily due to foreign currency transactions, passive foreign investment companies (PFIC), net operating losses, capital loss carryforwards, losses deferred due to wash sales and excise tax regulations.
The federal tax cost of investment securities and unrealized appreciation (depreciation) as of period end were as follows:
Gross unrealized appreciation | $ 9,237,229 |
Gross unrealized depreciation | (2,031,244) |
Net unrealized appreciation (depreciation) on securities and other investments | $ 7,205,985 |
| |
Tax Cost | $ 68,231,266 |
Annual Report
Notes to Financial Statements - continued
3. Significant Accounting Policies - continued
Income Tax Information and Distributions to Shareholders - continued
The tax-based components of distributable earnings as of period end were as follows:
Capital loss carryforward | $ (33,384,711) |
Net unrealized appreciation (depreciation) | $ 7,191,129 |
Capital loss carryforwards are only available to offset future capital gains of the Fund to the extent provided by regulations and may be limited. Under the Regulated Investment Company Modernization Act of 2010 (the Act), the Fund is permitted to carry forward capital losses incurred in taxable years beginning after December 22, 2010 for an unlimited period and such capital losses are required to be used prior to any losses that expire. Capital loss carryforwards were as follows:
Fiscal year of expiration | |
2016 | $ (7,618,418) |
2017 | (3,018,401) |
2019 | (14,114,488) |
Total with expiration | (24,751,307) |
No expiration | |
Short-term | (3,098,913) |
Long-term | (5,534,491) |
Total with expiration | (8,633,404) |
Total capital loss carryforward | $ (33,384,711) |
The tax character of distributions paid was as follows:
| October 31, 2012 | October 31, 2011 |
Ordinary Income | $ - | $ 352,610 |
Short-Term Trading (Redemption) Fees. Shares held by investors in the Fund less than 30 days are subject to a redemption fee equal to 1.00% of the net asset value of shares redeemed. All redemption fees, which reduce the proceeds of the shareholder redemption, are retained by the Fund and accounted for as an addition to paid in capital.
New Accounting Pronouncement. In December 2011, the Financial Accounting Standards Board issued Accounting Standard Update No. 2011-11, Disclosures about Offsetting Assets and Liabilities. The update creates new disclosure requirements requiring entities to disclose both gross and net information for derivatives and other financial instruments that are either offset in the Statement of Assets and Liabilities or subject to an enforceable master netting arrangement or similar agreement. The disclosure requirements are effective for annual reporting periods beginning on or after January 1, 2013, and interim periods within those annual periods. Management is currently evaluating the impact of the update's adoption on the Fund's financial statement disclosures.
Annual Report
4. Purchases and Sales of Investments.
Purchases and sales of securities, other than short-term securities, aggregated $126,904,961 and $158,603,258, respectively.
5. Fees and Other Transactions with Affiliates.
Management Fee. FMR and its affiliates provide the Fund with investment management related services for which the Fund pays a monthly management fee. The management fee is the sum of an individual fund fee rate that is based on an annual rate of .45% of the Fund's average net assets and an annualized group fee rate that averaged .26% during the period. The group fee rate is based upon the average net assets of all the mutual funds advised by FMR. The group fee rate decreases as assets under management increase and increases as assets under management decrease. In addition, the management fee is subject to a performance adjustment (up to a maximum of ±.20% of the Fund's average net assets over a 36 month performance period). The upward or downward adjustment to the management fee is based on the relative investment performance of the Institutional Class of the Fund as compared to an appropriate benchmark index. For the period, the total annual management fee rate, including the performance adjustment, was .56% of the Fund's average net assets.
Distribution and Service Plan Fees. In accordance with Rule 12b-1 of the 1940 Act, the Fund has adopted separate Distribution and Service Plans for each class of shares. Certain classes pay Fidelity Distributors Corporation (FDC), an affiliate of FMR, separate Distribution and Service Fees, each of which is based on an annual percentage of each class' average net assets. In addition, FDC may pay financial intermediaries for selling shares of the Fund and providing shareholder support services. For the period, the Distribution and Service Fee rates, total fees and amounts retained by FDC were as follows:
| Distribution
Fee | Service
Fee | Total Fees | Retained
by FDC |
Class A | -% | .25% | $ 73,639 | $ 1,326 |
Class T | .25% | .25% | 90,090 | - |
Class B | .75% | .25% | 15,649 | 11,756 |
Class C | .75% | .25% | 98,635 | 20,443 |
| | | $ 278,013 | $ 33,525 |
Sales Load. FDC may receive a front-end sales charge of up to 5.75% for selling Class A shares and 3.50% for selling Class T shares, some of which is paid to financial intermediaries for selling shares of the Fund. Depending on the holding period, FDC may receive contingent deferred sales charges levied on Class A, Class T, Class B, and Class C redemptions. The deferred sales charges range from 5.00% to 1.00% for Class B shares, 1.00% for Class C shares, 1.00% for certain purchases of Class A shares and .25% for certain purchases of Class T shares.
Annual Report
Notes to Financial Statements - continued
5. Fees and Other Transactions with Affiliates - continued
Sales Load - continued
For the period, sales charge amounts retained by FDC were as follows:
| Retained
by FDC |
Class A | $ 9,613 |
Class T | 2,513 |
Class B* | 1,951 |
Class C* | 4,906 |
| $ 18,983 |
* When Class B and Class C shares are initially sold, FDC pays commissions from its own resources to financial intermediaries through which the sales
are made.
Transfer Agent Fees. Fidelity Investments Institutional Operations Company, Inc. (FIIOC), an affiliate of FMR, is the transfer, dividend disbursing and shareholder servicing agent for each class of the Fund. FIIOC receives account fees and asset-based fees that vary according to the account size and type of account of the shareholders of the respective classes of the Fund. FIIOC pays for typesetting, printing and mailing of shareholder reports, except proxy statements. For the period, transfer agent fees for each class were as follows:
| Amount | % of
Average
Net Assets |
Class A | $ 86,247 | .29 |
Class T | 56,216 | .31 |
Class B | 4,727 | .30 |
Class C | 29,690 | .30 |
Institutional Class | 41,267 | .17 |
| $ 218,147 | |
Accounting and Security Lending Fees. Fidelity Service Company, Inc. (FSC), an affiliate of FMR, maintains the Fund's accounting records. The accounting fee is based on the level of average net assets for each month. Under a separate contract, FSC administers the security lending program. The security lending fee is based on the number and duration of lending transactions.
Brokerage Commissions. The Fund placed a portion of its portfolio transactions with brokerage firms which are affiliates of the investment adviser. The commissions paid to these affiliated firms were $2,857 for the period.
Annual Report
6. Committed Line of Credit.
The Fund participates with other funds managed by FMR or an affiliate in a $4.25 billion credit facility (the "line of credit") to be utilized for temporary or emergency purposes to fund shareholder redemptions or for other short-term liquidity purposes. The Fund has agreed to pay commitment fees on its pro-rata portion of the line of credit, which amounted to $235 and is reflected in Miscellaneous expenses on the Statement of Operations. During the period, there were no borrowings on this line of credit.
7. Security Lending.
The Fund lends portfolio securities through a lending agent from time to time in order to earn additional income. For equity securities, a lending agent is used and may loan securities to certain qualified borrowers, including Fidelity Capital Markets (FCM), a broker-dealer affiliated with the Fund. On the settlement date of the loan, the Fund receives collateral (in the form of U.S. Treasury obligations, letters of credit and/or cash) against the loaned securities and maintains collateral in an amount not less than 100% of the market value of the loaned securities during the period of the loan. The market value of the loaned securities is determined at the close of business of the Fund and any additional required collateral is delivered to the Fund on the next business day. If the borrower defaults on its obligation to return the securities loaned because of insolvency or other reasons, a fund could experience delays and costs in recovering the securities loaned or in gaining access to the collateral. Any cash collateral received is invested in the Fidelity Securities Lending Cash Central Fund. The value of loaned securities and cash collateral at period end are disclosed on the Fund's Statement of Assets and Liabilities. Security lending income represents the income earned on investing cash collateral, less rebates paid to borrowers and any lending agent fees associated with the loan, plus any premium payments received for lending certain types of securities. Security lending income is presented in the Statement of Operations as a component of income from Fidelity Central Funds. Total security lending income during the period amounted to $20,307. During the period, there were no securities loaned to FCM.
8. Expense Reductions.
FMR contractually agreed to reimburse each class to the extent annual operating expenses exceeded certain levels of average net assets as noted in the table below. This reimbursement will remain in place through December 31, 2013. Some expenses, for example interest expense, including commitment fees, are excluded from this reimbursement.
The following classes were in reimbursement during the period:
| Expense
Limitations | Reimbursement
from adviser |
Class T | 1.70% | $ 1,023 |
Annual Report
Notes to Financial Statements - continued
8. Expense Reductions - continued
Many of the brokers with whom FMR places trades on behalf of the Fund provided services to the Fund in addition to trade execution. These services included payments of certain expenses on behalf of the Fund totaling $20,776 for the period.
9. Distributions to Shareholders.
Distributions to shareholders of each class were as follows:
Years ended October 31, | 2012 | 2011 |
From net realized gain | | |
Class A | $ - | $ 149,904 |
Class T | - | 82,578 |
Class B | - | 761 |
Class C | - | 23,129 |
Institutional Class | - | 96,238 |
Total | $ - | $ 352,610 |
10. Share Transactions.
Transactions for each class of shares were as follows:
| Shares | Dollars |
Years ended October 31, | 2012 | 2011 | 2012 | 2011 |
Class A | | | | |
Shares sold | 289,606 | 3,313,300 | $ 2,795,636 | $ 38,257,984 |
Reinvestment of distributions | - | 11,121 | - | 130,500 |
Shares redeemed | (1,497,004) | (2,187,648) | (14,297,470) | (23,557,856) |
Net increase (decrease) | (1,207,398) | 1,136,773 | $ (11,501,834) | $ 14,830,628 |
Class T | | | | |
Shares sold | 143,871 | 1,500,646 | $ 1,346,334 | $ 16,821,913 |
Reinvestment of distributions | - | 7,107 | - | 81,139 |
Shares redeemed | (1,182,171) | (1,001,188) | (10,957,476) | (10,370,670) |
Net increase (decrease) | (1,038,300) | 506,565 | $ (9,611,142) | $ 6,532,382 |
Class B | | | | |
Shares sold | 2,998 | 67,595 | $ 28,531 | $ 715,061 |
Reinvestment of distributions | - | 70 | - | 677 |
Shares redeemed | (74,674) | (108,399) | (653,939) | (1,075,608) |
Net increase (decrease) | (71,676) | (40,734) | $ (625,408) | $ (359,870) |
Class C | | | | |
Shares sold | 167,706 | 1,263,963 | $ 1,486,514 | $ 13,329,175 |
Reinvestment of distributions | - | 1,981 | - | 21,056 |
Shares redeemed | (499,534) | (696,642) | (4,342,453) | (6,685,064) |
Net increase (decrease) | (331,828) | 569,302 | $ (2,855,939) | $ 6,665,167 |
Institutional Class | | | | |
Shares sold | 271,800 | 6,587,351 | $ 2,679,773 | $ 79,174,965 |
Reinvestment of distributions | - | 6,022 | - | 72,484 |
Shares redeemed | (1,086,428) | (4,787,531) | (10,807,260) | (50,353,481) |
Net increase (decrease) | (814,628) | 1,805,842 | $ (8,127,487) | $ 28,893,968 |
Annual Report
11. Other.
The Fund's organizational documents provide former and current trustees and officers with a limited indemnification against liabilities arising in connection with the performance of their duties to the Fund. In the normal course of business, the Fund may also enter into contracts that provide general indemnifications. The Fund's maximum exposure under these arrangements is unknown as this would be dependent on future claims that may be made against the Fund. The risk of material loss from such claims is considered remote.
At the end of the period, Strategic Advisers International II Fund was the owner of record of approximately 13% of the total outstanding shares of the Fund.
Annual Report
To the Trustees of Fidelity Advisor Series VIII and the Shareholders of Fidelity Advisor Global Capital Appreciation Fund:
In our opinion, the accompanying statement of assets and liabilities, including the schedule of investments, and the related statements of operations and of changes in net assets and the financial highlights present fairly, in all material respects, the financial position of Fidelity Advisor Global Capital Appreciation Fund (a fund of Fidelity Advisor Series VIII) at October 31, 2012, the results of its operations for the year then ended, the changes in its net assets for each of the two years in the period then ended and the financial highlights for each of the five years in the period then ended, in conformity with accounting principles generally accepted in the United States of America. These financial statements and financial highlights (hereafter referred to as "financial statements") are the responsibility of the Fidelity Advisor Global Capital Appreciation Fund's management. Our responsibility is to express an opinion on these financial statements based on our audits. We conducted our audits of these financial statements in accordance with the standards of the Public Company Accounting Oversight Board (United States). Those standards require that we plan and perform the audit to obtain reasonable assurance about whether the financial statements are free of material misstatement. An audit includes examining, on a test basis, evidence supporting the amounts and disclosures in the financial statements, assessing the accounting principles used and significant estimates made by management, and evaluating the overall financial statement presentation. We believe that our audits, which included confirmation of securities at October 31, 2012 by correspondence with the custodian and brokers, provide a reasonable basis for our opinion.
PricewaterhouseCoopers LLP
Boston, Massachusetts
December 14, 2012
Annual Report
The Trustees, Members of the Advisory Board, and executive officers of the trust and fund, as applicable, are listed below. The Board of Trustees governs the fund and is responsible for protecting the interests of shareholders. The Trustees are experienced executives who meet periodically throughout the year to oversee the fund's activities, review contractual arrangements with companies that provide services to the fund, oversee management of the risks associated with such activities and contractual arrangements, and review the fund's performance. Except for James C. Curvey, each of the Trustees oversees 236 funds advised by FMR or an affiliate. Mr. Curvey oversees 443 funds advised by FMR or an affiliate.
The Trustees hold office without limit in time except that (a) any Trustee may resign; (b) any Trustee may be removed by written instrument, signed by at least two-thirds of the number of Trustees prior to such removal; (c) any Trustee who requests to be retired or who has become incapacitated by illness or injury may be retired by written instrument signed by a majority of the other Trustees; and (d) any Trustee may be removed at any special meeting of shareholders by a two-thirds vote of the outstanding voting securities of the trust. Each Trustee who is not an interested person (as defined in the 1940 Act) (Independent Trustee), shall retire not later than the last day of the calendar year in which his or her 75th birthday occurs. The Independent Trustees may waive this mandatory retirement age policy with respect to individual Trustees. The executive officers and Advisory Board Members hold office without limit in time, except that any officer and Advisory Board Member may resign or may be removed by a vote of a majority of the Trustees at any regular meeting or any special meeting of the Trustees. Except as indicated, each individual has held the office shown or other offices in the same company for the past five years.
Experience, Skills, Attributes, and Qualifications of the Fund's Trustees. The Governance and Nominating Committee has adopted a statement of policy that describes the experience, qualifications, attributes, and skills that are necessary and desirable for potential Independent Trustee candidates (Statement of Policy). The Board believes that each Trustee satisfied at the time he or she was initially elected or appointed a Trustee, and continues to satisfy, the standards contemplated by the Statement of Policy. The Governance and Nominating Committee also engages professional search firms to help identify potential Independent Trustee candidates who have the experience, qualifications, attributes, and skills consistent with the Statement of Policy. From time to time, additional criteria based on the composition and skills of the current Independent Trustees, as well as experience or skills that may be appropriate in light of future changes to board composition, business conditions, and regulatory or other developments, have also been considered by the professional search firms and the Governance and Nominating Committee. In addition, the Board takes into account the Trustees' commitment and participation in Board and committee meetings, as well as their leadership of standing and ad hoc committees throughout their tenure.
In determining that a particular Trustee was and continues to be qualified to serve as a Trustee, the Board has considered a variety of criteria, none of which, in isolation, was controlling. The Board believes that, collectively, the Trustees have balanced and diverse experience, qualifications, attributes, and skills, which allow the Board to operate effectively in governing the fund and protecting the interests of shareholders. Information about the specific experience, skills, attributes, and qualifications of each Trustee, which in each case led to the Board's conclusion that the Trustee should serve (or continue to serve) as a trustee of the fund, is provided below.
Annual Report
Board Structure and Oversight Function. James C. Curvey is an interested person (as defined in the 1940 Act) and currently serves as Chairman. The Trustees have determined that an interested Chairman is appropriate and benefits shareholders because an interested Chairman has a personal and professional stake in the quality and continuity of services provided to the fund. Independent Trustees exercise their informed business judgment to appoint an individual of their choosing to serve as Chairman, regardless of whether the Trustee happens to be independent or a member of management. The Independent Trustees have determined that they can act independently and effectively without having an Independent Trustee serve as Chairman and that a key structural component for assuring that they are in a position to do so is for the Independent Trustees to constitute a substantial majority for the Board. The Independent Trustees also regularly meet in executive session. Ned C. Lautenbach serves as Chairman of the Independent Trustees and as such (i) acts as a liaison between the Independent Trustees and management with respect to matters important to the Independent Trustees and (ii) with management prepares agendas for Board meetings.
Fidelity funds are overseen by different Boards of Trustees. The fund's Board oversees Fidelity's equity and high income funds and another Board oversees Fidelity's investment-grade bond, money market, and asset allocation funds. The asset allocation funds may invest in Fidelity funds overseen by the fund's Board. The use of separate Boards, each with its own committee structure, allows the Trustees of each group of Fidelity funds to focus on the unique issues of the funds they oversee, including common research, investment, and operational issues. On occasion, the separate Boards establish joint committees to address issues of overlapping consequences for the Fidelity funds overseen by each Board.
The Trustees operate using a system of committees to facilitate the timely and efficient consideration of all matters of importance to the Trustees, the fund, and fund shareholders and to facilitate compliance with legal and regulatory requirements and oversight of the fund's activities and associated risks. The Board, acting through its committees, has charged FMR and its affiliates with (i) identifying events or circumstances the occurrence of which could have demonstrably adverse effects on the fund's business and/or reputation; (ii) implementing processes and controls to lessen the possibility that such events or circumstances occur or to mitigate the effects of such events or circumstances if they do occur; and (iii) creating and maintaining a system designed to evaluate continuously business and market conditions in order to facilitate the identification and implementation processes described in (i) and (ii) above. Because the day-to-day operations and activities of the fund are carried out by or through FMR, its affiliates and other service providers, the fund's exposure to risks is mitigated but not eliminated by the processes overseen by the Trustees. While each of the Board's committees has responsibility for overseeing different aspects of the fund's activities, oversight is exercised primarily through the Operations, Audit, and Compliance Committees. In addition, the Independent Trustees have worked with FMR to enhance the Board's oversight of investment and financial risks, legal and regulatory risks, technology risks, and operational risks, including the development of additional risk reporting to the Board. For example, a working group comprised of Independent Trustees and FMR has worked and continues to work to review the Fidelity funds' valuation-related activities, reporting and risk management. Appropriate personnel, including but not limited to the fund's Chief Compliance Officer (CCO), FMR's internal auditor, the independent accountants, the fund's Treasurer and portfolio management personnel, make periodic reports to the Board's committees, as appropriate, including an annual review of FMR's risk management program for the Fidelity funds. The responsibilities of each standing committee, including their oversight responsibilities, are described further under "Standing Committees of the Fund's Trustees."
Annual Report
Trustees and Officers - continued
The fund's Statement of Additional Information (SAI) includes more information about the Trustees. To request a free copy, call Fidelity at 1-877-208-0098.
Interested Trustees*:
Correspondence intended for each Trustee who is an interested person may be sent to Fidelity Investments, 82 Devonshire Street, Boston, Massachusetts 02109.
Name, Age; Principal Occupations and Other Relevant Experience+ |
James C. Curvey (77) |
| Year of Election or Appointment: 2007 Mr. Curvey is Trustee and Chairman of the Board of Trustees of certain Trusts. Mr. Curvey also serves as Trustee (2007-present) of other investment companies advised by FMR. Mr. Curvey is a Director of Fidelity Investments Money Management, Inc. (2009-present), Director of Fidelity Research & Analysis Co. (2009-present) and Director of FMR and FMR Co., Inc. (2007-present). Mr. Curvey is also Vice Chairman (2007-present) and Director of FMR LLC. In addition, Mr. Curvey serves as an Overseer for the Boston Symphony Orchestra and a member of the Trustees of Villanova University. Previously, Mr. Curvey was the Vice Chairman (2006-2007) and Director (2000-2007) of FMR Corp. |
Ronald P. O'Hanley (55) |
| Year of Election or Appointment: 2011 Mr. O'Hanley is Director of FMR Co., Inc. (2010-present), Director of Fidelity Investments Money Management, Inc. (2010-present), Director of Fidelity Research & Analysis Company (2010-present), President of Fidelity Asset Management and Corporate Services and a member of Fidelity's Executive Committee (2010-present). Previously, Mr. O'Hanley served as President and Chief Executive Officer of BNY Mellon Asset Management (2007-2010). Mr. O'Hanley also served as Vice Chairman of Bank New York Mellon Corp. and a member of that firm's Executive Committee. Prior to the 2007 merger of The Bank of New York and Mellon Financial Corporation, he was Vice Chairman of Mellon Financial Corporation and President and Chief Executive Officer of Mellon Asset Management. He joined Mellon in February 1997. Mr. O'Hanley currently serves as Chairman of the Boston Public Library Foundation Board of Directors and sits on the Board of Directors of Beth Israel Deaconess Medical Center, the Board of Trustees of the Marine Biological Laboratory and the Advisory Board of the Maxwell School of Citizenship and Public Administration at Syracuse University. Mr. O'Hanley also chairs the Council on Asset Management for the Financial Services Roundtable and is a member of the Board of Directors of Institutional Investor's U.S. Institute. |
* Trustees have been determined to be "Interested Trustees" by virtue of, among other things, their affiliation with the trust or various entities under common control with FMR.
+ The information above includes each Trustee's principal occupation during the last five years and other information relating to the experience, attributes, and skills relevant to each Trustee's qualifications to serve as a Trustee, which led to the conclusion that each Trustee should serve as a Trustee for the fund.
Annual Report
Trustees and Officers - continued
Independent Trustees:
Correspondence intended for each Independent Trustee (that is, the Trustees other than the Interested Trustees) may be sent to Fidelity Investments, P.O. Box 55235, Boston, Massachusetts 02205-5235.
Name, Age; Principal Occupations and Other Relevant Experience+ |
Dennis J. Dirks (64) |
| Year of Election or Appointment: 2005 Prior to his retirement in May 2003, Mr. Dirks was Chief Operating Officer and a member of the Board of The Depository Trust & Clearing Corporation (DTCC). He also served as President, Chief Operating Officer, and Board member of The Depository Trust Company (DTC) and President and Board member of the National Securities Clearing Corporation (NSCC). In addition, Mr. Dirks served as Chief Executive Officer and Board member of the Government Securities Clearing Corporation, Chief Executive Officer and Board member of the Mortgage-Backed Securities Clearing Corporation, as a Trustee and a member of the Finance Committee of Manhattan College (2005-2008), and as a Trustee and a member of the Finance Committee of AHRC of Nassau County (2006-2008). Mr. Dirks is a member of the Independent Directors Council (IDC) Governing Council (2010-present) and Board of Directors for The Brookville Center for Children's Services, Inc. (2009-present). |
Alan J. Lacy (59) |
| Year of Election or Appointment: 2008 Mr. Lacy serves as Senior Adviser (2007-present) of Oak Hill Capital Partners, L.P. (private equity). Mr. Lacy also served as Chief Executive Officer (2000-2005) and Vice Chairman (2005-2006) of Sears Holdings Corporation and Sears, Roebuck and Co. (retail). In addition, Mr. Lacy serves as a member of the Board of Directors of Dave & Buster's Entertainment, Inc. (restaurant and entertainment complexes, 2010-present), Earth Fare, Inc. (retail grocery, 2012-present), The Hillman Companies, Inc. (hardware wholesalers, 2010-present), and Bristol-Myers Squibb Company (global pharmaceuticals, 2008-present). Mr. Lacy is a member of the Board of Trustees of The National Parks Conservation Association (2006-present). Previously, Mr. Lacy served as Chairman of the Board of Trustees of the National Parks Conservation Association (2008-2011) and as a member of the Board of Directors for the Western Union Company (global money transfer, 2006-2011). |
Ned C. Lautenbach (68) |
| Year of Election or Appointment: 2000 Mr. Lautenbach is Chairman of the Independent Trustees of the Equity and High Income Funds (2006-present). Mr. Lautenbach currently serves as the Lead Director of the Eaton Corporation Board of Directors (diversified industrial, 1997-present). Mr. Lautenbach is Chairman of the Board of Directors of the Philharmonic Center for the Arts in Naples, Florida (2012-present) and a member of the Council on Foreign Relations (1994-present). Previously, Mr. Lautenbach was a Partner/Advisory Partner at Clayton, Dubilier & Rice, LLC (private equity investment, 1998-2010), as well as a Director of Sony Corporation (2006-2007). |
Joseph Mauriello (68) |
| Year of Election or Appointment: 2008 Prior to his retirement in January 2006, Mr. Mauriello served in numerous senior management positions including Deputy Chairman and Chief Operating Officer (2004-2005), and Vice Chairman of Financial Services (2002-2004) of KPMG LLP US (professional services, 1965-2005). Mr. Mauriello currently serves as a member of the Board of Directors of XL Group plc. (global insurance and re-insurance, 2006-present). Previously, Mr. Mauriello served as a Director of the Hamilton Funds of the Bank of New York (2006-2007) and of Arcadia Resources Inc. (health care services and products, 2007-2012). |
Robert W. Selander (62) |
| Year of Election or Appointment: 2011 Previously, Mr. Selander served as a Member of the Advisory Board of Fidelity's Equity and High Income Funds (2011), Executive Vice Chairman (2010), Chief Executive Officer (2009-2010), and President and Chief Executive Officer (1997-2009) of Mastercard, Inc. |
Cornelia M. Small (68) |
| Year of Election or Appointment: 2005 Ms. Small is a member of the Board of Directors (2009-present) and Chair of the Investment Committee (2010-present) of the Teagle Foundation. Ms. Small also serves on the Investment Committee of the Berkshire Taconic Community Foundation (2008-present). Previously, Ms. Small served as Chairperson (2002-2008) and a member of the Investment Committee and Chairperson (2008-2012) and a member of the Board of Trustees of Smith College. In addition, Ms. Small served as Chief Investment Officer, Director of Global Equity Investments, and a member of the Board of Directors of Scudder, Stevens & Clark and Scudder Kemper Investments. |
William S. Stavropoulos (73) |
| Year of Election or Appointment: 2001 Mr. Stavropoulos is Vice Chairman of the Independent Trustees of the Equity and High Income Funds (2006-present). Mr. Stavropoulos serves as President and Founder of the Michigan Baseball Foundation, the Great Lakes Loons (2007-present). Mr. Stavropoulos is Chairman Emeritus of the Board of Directors of The Dow Chemical Company, where he previously served in numerous senior management positions, including President, CEO (1995-2000; 2002-2004), Chairman of the Executive Committee (2000-2006), and as a member of the Board of Directors (1990-2006). Currently, Mr. Stavropoulos is a Director of Univar Inc. (global distributor of commodity and specialty chemicals, Chairman from 2010-May 2012 and Lead Director from May 2012-present), Teradata Corporation (data warehousing and technology solutions, 2008-present), Maersk Inc. (industrial conglomerate), and Tyco International, Ltd. (multinational manufacturing and services, 2007-present), and a member of the Advisory Board for Metalmark Capital LLC (private equity investment, 2005-present). Mr. Stavropoulos is an operating advisor to Clayton, Dubilier & Rice, LLC (private equity investment). In addition, Mr. Stavropoulos is a member of the University of Notre Dame Advisory Council for the College of Science, a Trustee of the Rollin L. Gerstacker Foundation, and a Director of the Naples Philharmonic Center for the Arts. Previously, Mr. Stavropoulos served as a Director of Chemical Financial Corporation (bank holding company, 1993-2012). |
David M. Thomas (63) |
| Year of Election or Appointment: 2008 Previously, Mr. Thomas served as Executive Chairman (2005-2006) and Chairman and Chief Executive Officer (2000-2005) of IMS Health, Inc. (pharmaceutical and healthcare information solutions), and a Director of Fortune Brands, Inc. (consumer products, 2000-2011). In addition, Mr. Thomas serves as Non-Executive Chairman of the Board of Directors of Fortune Brands Home and Security (home and security products, 2011-present), and as a member of the Board of Directors of Interpublic Group of Companies, Inc. (marketing communication, 2004-present). |
Michael E. Wiley (62) |
| Year of Election or Appointment: 2008 Mr. Wiley also serves as a Director of Asia Pacific Exploration Consolidated (international oil and gas exploration and production, 2008-present). Mr. Wiley serves as a Director of Tesoro Corporation (independent oil refiner and marketer, 2005-present), and a Director of Bill Barrett Corporation (exploration and production, 2005-present). In addition, Mr. Wiley also serves as a Director of Post Oak Bank (privately-held bank, 2004-present). Previously, Mr. Wiley served as a member of the Board of Trustees of the University of Tulsa (2000-2006; 2007-2010), as a Senior Energy Advisor of Katzenbach Partners, LLC (consulting, 2006-2007), as an Advisory Director of Riverstone Holdings (private investment), Chairman, President, and CEO of Baker Hughes, Inc. (oilfield services, 2000-2004), and as Director of Spinnaker Exploration Company (exploration and production, 2001-2005). |
+ The information above includes each Trustee's principal occupation during the last five years and other information relating to the experience, attributes, and skills relevant to each Trustee's qualifications to serve as a Trustee, which led to the conclusion that each Trustee should serve as a Trustee for the fund.
Advisory Board Members and Executive Officers:
Correspondence intended for David A. Rosow and Garnett A. Smith may be sent to Fidelity Investments, P.O. Box 55235, Boston, Massachusetts 02205-5235. Correspondence intended for each executive officer, Edward C. Johnson 3d, and Peter S. Lynch may be sent to Fidelity Investments, 82 Devonshire Street, Boston, Massachusetts 02109.
Name, Age; Principal Occupation |
Edward C. Johnson 3d (82) |
| Year of Election or Appointment: 2011 Member of the Advisory Board of Fidelity's Equity and High Income Funds. Mr. Johnson serves as Chief Executive Officer, Chairman, and a Director of FMR LLC, and also serves as Chairman and Director of FIL Limited. Previously, Mr. Johnson served as a Trustee and Chairman of the Board of certain Fidelity Trusts, Chairman and a Director of FMR, Chairman and a Director of FMR Co., Inc., and President of FMR LLC (2006-2007). |
Peter S. Lynch (68) |
| Year of Election or Appointment: 2003 Member of the Advisory Board of Fidelity's Equity and High Income Funds. Mr. Lynch is Vice Chairman and a Director of FMR and FMR Co., Inc. In addition, Mr. Lynch serves as a Trustee of Boston College and as the Chairman of the Inner-City Scholarship Fund. Previously, Mr. Lynch served on the Special Olympics International Board of Directors (1997-2006). |
David A. Rosow (70) |
| Year of Election or Appointment: 2012 Member of the Advisory Board of Fidelity's Equity and High Income Funds. Chairman and Chief Executive Officer of International Golf Group, Inc. (golf course development, 1989-present). Previously, Mr. Rosow served as Chairman and Chief Executive Officer of Rosow & Company, Inc. (private investment company, 1989-2011), a Lead Director of Hudson United Bancorp (2001-2006) and as a Director of TD Banknorth (1996-2006). In addition, Mr. Rosow is a member (2008-present) and President (2009-present) of the Town Council of Palm Beach, Florida. |
Garnett A. Smith (65) |
| Year of Election or Appointment: 2012 Member of the Advisory Board of Fidelity's Equity and High Income Funds. Prior to Mr. Smith's retirement, he served as Chairman and Chief Executive Officer of Inbrand Corp. (manufacturer of personal absorbent products, 1990-1997). He also served as President (1986-1990) of Inbrand Corp. Prior to his employment with Inbrand Corp., he was employed by a retail fabric chain and North Carolina National Bank. In addition, Mr. Smith is a board member of the Jackson Hole Land Trust (2009-present). |
Kenneth B. Robins (43) |
| Year of Election or Appointment: 2008 President and Treasurer of Fidelity's Equity and High Income Funds. Mr. Robins also serves as President and Treasurer (2010-present) and Assistant Treasurer (2009-present) of other Fidelity funds and is an employee of Fidelity Investments (2004-present). Previously, Mr. Robins served as Deputy Treasurer of the Fidelity funds (2005-2008) and Treasurer and Chief Financial Officer of The North Carolina Capital Management Trust: Cash and Term Portfolios (2006-2008). |
Bruce T. Herring (47) |
| Year of Election or Appointment: 2006 Vice President of certain Equity Funds. Mr. Herring also serves as President of Fidelity Research & Analysis Company (2010-present), Chief Investment Officer and Director of Fidelity Management & Research (U.K.) Inc. (2010-present) and Group Chief Investment Officer of FMR. Previously, Mr. Herring served as Vice President (2005-2006) and Senior Vice President (2006-2007) of Fidelity Management & Research Company, Vice President of FMR Co., Inc. (2001-2007) and as a portfolio manager for Fidelity U.S. Equity Funds. |
Brian B. Hogan (48) |
| Year of Election or Appointment: 2009 Vice President of Equity and High Income Funds. Mr. Hogan also serves as President of FMR's Equity Division (2009-present). Previously, Mr. Hogan served as Senior Vice President, Equity Research of FMR (2006-2009) and as a portfolio manager. |
Scott C. Goebel (44) |
| Year of Election or Appointment: 2008 Secretary and Chief Legal Officer (CLO) of the Fidelity funds. Mr. Goebel also serves as Secretary of Fidelity Investments Money Management, Inc. (FIMM) (2010-present) and Fidelity Research and Analysis Company (FRAC) (2010-present); Secretary and CLO of The North Carolina Capital Management Trust: Cash and Term Portfolios (2008-present); General Counsel, Secretary, and Senior Vice President of FMR (2008-present) and FMR Co., Inc. (2008-present); employed by FMR LLC or an affiliate (2001-present); Chief Legal Officer of Fidelity Management & Research (Hong Kong) Limited (2008-present) and Assistant Secretary of Fidelity Management & Research (Japan) Inc. (2008-present), and Fidelity Management & Research (U.K.) Inc. (2008-present). Previously, Mr. Goebel served as Assistant Secretary of FIMM (2008-2010), FRAC (2008-2010), and the Funds (2007-2008) and as Vice President and Secretary of Fidelity Distributors Corporation (FDC) (2005-2007). |
William C. Coffey (43) |
| Year of Election or Appointment: 2009 Assistant Secretary of Fidelity's Equity and High Income Funds. Mr. Coffey also serves as Senior Vice President and Deputy General Counsel of FMR LLC (2010-present), and is an employee of Fidelity Investments. Previously, Mr. Coffey served as Vice President and Associate General Counsel of FMR LLC (2005-2009). |
Elizabeth Paige Baumann (44) |
| Year of Election or Appointment: 2012 Anti-Money Laundering (AML) Officer of the Fidelity funds. Ms. Baumann also serves as AML Officer of The North Carolina Capital Management Trust: Cash and Term Portfolios (2012-present), Chief AML Officer of FMR LLC (2012-present), and is an employee of Fidelity Investments. Previously, Ms. Baumann served as Vice President and Deputy Anti-Money Laundering Officer (2007-2012). |
Christine Reynolds (54) |
| Year of Election or Appointment: 2008 Chief Financial Officer of the Fidelity funds. Ms. Reynolds became President of Fidelity Pricing and Cash Management Services (FPCMS) in August 2008. Ms. Reynolds served as Chief Operating Officer of FPCMS (2007-2008). Previously, Ms. Reynolds served as President, Treasurer, and Anti-Money Laundering officer of the Fidelity funds (2004-2007). |
Joseph A. Hanlon (44) |
| Year of Election or Appointment: 2012 Chief Compliance Officer of Fidelity's Equity and High Income Funds. Mr. Hanlon serves as Compliance Officer of FMR, FMR Co., Inc., Fidelity Investments Money Management, Inc. (FIMM), Fidelity Research and Analysis Company (FRAC), Fidelity Management & Research (Japan) Inc., Fidelity Management & Research (U.K.) Inc., Fidelity Management & Research (Hong Kong), and Strategic Advisers, Inc. (2009-present), as Senior Vice President of the Fidelity Asset Management Division (2009-present), and is an employee of Fidelity Investments. |
Joseph F. Zambello (55) |
| Year of Election or Appointment: 2011 Deputy Treasurer of the Fidelity funds. Mr. Zambello is an employee of Fidelity Investments. Previously, Mr. Zambello served as Vice President of FMR's Program Management Group (2009-2011) and Vice President of the Transfer Agent Oversight Group (2005-2009). |
Adrien E. Deberghes (45) |
| Year of Election or Appointment: 2008 Deputy Treasurer of Fidelity's Equity and High Income Funds. Mr. Deberghes also serves as Vice President (2011-present) and Assistant Treasurer (2010-present) of other Fidelity funds, and is an employee of Fidelity Investments (2008-present). Previously, Mr. Deberghes served as Senior Vice President of Mutual Fund Administration at State Street Corporation (2007-2008), Senior Director of Mutual Fund Administration at Investors Bank & Trust (2005-2007), and Director of Finance for Dunkin' Brands (2000-2005). |
Name, Age; Principal Occupation |
Stephen Sadoski (41) |
| Year of Election or Appointment: 2012 Deputy Treasurer of Fidelity's Equity and High Income Funds. Mr. Sadoski also serves as Assistant Treasurer of other Fidelity funds (2012-present) and is an employee of Fidelity Investments (2012-present). Previously, Mr. Sadoski served as an assistant chief accountant in the Division of Investment Management of the Securities and Exchange Commission (SEC) (2009-2012) and as a senior manager at Deloitte & Touche (1997-2009). |
Stephanie J. Dorsey (43) |
| Year of Election or Appointment: 2010 Assistant Treasurer of Fidelity's Equity and High Income Funds. Ms. Dorsey also serves as Deputy Treasurer of other Fidelity funds (2008-present) and is an employee of Fidelity Investments (2008-present). Previously, Ms. Dorsey served as Treasurer (2004-2008) of the JPMorgan Mutual Funds and Vice President (2004-2008) of JPMorgan Chase Bank. |
John R. Hebble (54) |
| Year of Election or Appointment: 2009 Assistant Treasurer of Fidelity's Equity and High Income Funds. Mr. Hebble also serves as President (2011-present), Treasurer, and Chief Financial Officer of The North Carolina Capital Management Trust: Cash and Term Portfolios (2008-present), President and Treasurer of other Fidelity funds (2008-present) and is an employee of Fidelity Investments. |
Gary W. Ryan (54) |
| Year of Election or Appointment: 2005 Assistant Treasurer of the Fidelity funds. Mr. Ryan is an employee of Fidelity Investments. Previously, Mr. Ryan served as Vice President of Fund Reporting in Fidelity Pricing and Cash Management Services (FPCMS) (1999-2005). |
Jonathan Davis (44) |
| Year of Election or Appointment: 2010 Assistant Treasurer of the Fidelity funds. Mr. Davis is also Assistant Treasurer of Fidelity Rutland Square Trust II and Fidelity Commonwealth Trust II. Mr. Davis is an employee of Fidelity Investments. Previously, Mr. Davis served as Vice President and Associate General Counsel of FMR LLC (2003-2010). |
Annual Report
Board Approval of Investment Advisory Contracts and Management Fees
Fidelity Advisor Global Capital Appreciation Fund
Each year, the Board of Trustees, including the Independent Trustees (together, the Board), votes on the renewal of the management contract and sub-advisory agreements (together, the Advisory Contracts) for the fund. The Board, assisted by the advice of fund counsel and Independent Trustees' counsel, requests and considers a broad range of information relevant to the renewal of the Advisory Contracts throughout the year.
The Board meets regularly and, at each of its meetings, considers factors that are relevant to its annual consideration of the renewal of the fund's Advisory Contracts, including the services and support provided to the fund and its shareholders. The Board has established various standing committees, each composed of and chaired by Independent Trustees with varying backgrounds, to which the Board has assigned specific subject matter responsibilities in order to enhance effective decision-making by the Board. The Board, acting directly and through its Committees, requests and receives information concerning the annual consideration of the renewal of the fund's Advisory Contracts. The Board also meets as needed to consider matters specifically related to the Board's annual consideration of the renewal of Advisory Contracts. Members of the Board may also meet with trustees of other Fidelity funds through ad hoc joint committees to discuss certain matters relevant to the Fidelity funds.
At its July 2012 meeting, the Board of Trustees, including the Independent Trustees, unanimously determined to renew the fund's Advisory Contracts. In reaching its determination, the Board considered all factors it believed relevant, including (i) the nature, extent, and quality of the services to be provided to the fund and its shareholders (including the investment performance of the fund); (ii) the competitiveness of the fund's management fee and total expense ratio relative to peer funds; (iii) the total costs of the services to be provided by and the profits to be realized by Fidelity from its relationship with the fund; (iv) the extent to which economies of scale exist and would be realized as the fund grows; and (v) whether fee levels reflect these economies of scale, if any, for the benefit of fund shareholders.
In considering whether to renew the Advisory Contracts for the fund, the Board reached a determination, with the assistance of fund counsel and Independent Trustees' counsel and through the exercise of its business judgment, that the renewal of the Advisory Contracts is in the best interests of the fund and its shareholders and that the compensation payable under the Advisory Contracts is fair and reasonable. The Board's decision to renew the Advisory Contracts was not based on any single factor, but rather was based on a comprehensive consideration of all the information provided to the Board at its meetings throughout the year. The Board, in reaching its determination to renew the Advisory Contracts, is aware that shareholders in the fund have a broad range of investment choices available to them, including a wide choice among mutual funds offered by Fidelity's competitors, and that the fund's shareholders, who have the opportunity to review and weigh the disclosure provided by the fund in its prospectus and other public disclosures, have chosen to invest in this fund, managed by Fidelity.
Annual Report
Nature, Extent, and Quality of Services Provided. The Board considered the staffing within the investment adviser, FMR, and the sub-advisers (together, the Investment Advisers), including the backgrounds of the fund's investment personnel, and also considered the fund's investment objective, strategies, and related investment philosophy. The Independent Trustees also had discussions with senior management of Fidelity's investment operations and investment groups. The Board considered the structure of the portfolio manager compensation program and whether this structure provides appropriate incentives to act in the best interests of the fund.
Resources Dedicated to Investment Management and Support Services. The Board and the Fund Oversight and Research Committees reviewed the general qualifications and capabilities of the Investment Advisers' investment staff, including its size, education, experience, and resources, as well as the Investment Advisers' approach to recruiting, training, managing, and compensating investment personnel. The Board also noted that FMR has continued to increase the resources devoted to non-U.S. offices, including expansion of Fidelity's global investment organization. The Board noted that Fidelity's analysts have extensive resources, tools and capabilities that allow them to conduct sophisticated quantitative and fundamental analysis, as well as credit analysis of issuers, counterparties and guarantors. The Board also believes that Fidelity's investment professionals have sufficient access to global information and data so as to provide competitive investment results over time, and that those professionals also have access to sophisticated tools that permit them to assess portfolio construction and risk and performance attribution characteristics continuously, as well as to transmit new information and research conclusions rapidly around the world. Additionally, in its deliberations, the Board considered the Investment Advisers' trading and risk management capabilities and resources, which are an integral part of the investment management process.
Shareholder and Administrative Services. The Board considered (i) the nature, extent, quality, and cost of advisory, administrative, and shareholder services performed by the Investment Advisers and their affiliates under the Advisory Contracts and under separate agreements covering transfer agency, pricing and bookkeeping, and securities lending services for the fund; (ii) the nature and extent of the supervision of third party service providers, principally custodians and subcustodians; and (iii) the resources devoted to, and the record of compliance with, the fund's compliance policies and procedures. The Board also reviewed the allocation of fund brokerage, including allocations to brokers affiliated with the Investment Advisers, the use of brokerage commissions to pay fund expenses, and the use of "soft" commission dollars to pay for research services.
Annual Report
Board Approval of Investment Advisory Contracts and
Management Fees - continued
The Board noted that the growth of fund assets over time across the complex allows Fidelity to reinvest in the development of services designed to enhance the value or convenience of the Fidelity funds as investment vehicles. These services include 24-hour access to account information and market information through telephone representatives and over the Internet, investor education materials and asset allocation tools, and the expanded availability of Fidelity Investor Centers.
Investment in a Large Fund Family. The Board considered the benefits to shareholders of investing in a Fidelity fund, including the benefits of investing in a fund that is part of a large family of funds offering a variety of investment disciplines and providing a large variety of mutual fund investor services. The Board noted that Fidelity had taken, or had made recommendations that resulted in the Fidelity funds taking, a number of actions over the previous year that benefited particular funds, including (i) continuing to dedicate additional resources to investment research and support of the senior management team that oversees asset management; (ii) persisting in efforts to enhance Fidelity's research capabilities, in particular, international research; (iii) launching new funds and making other enhancements to meet client needs for global and income-oriented solutions; (iv) continuing to launch dedicated lower cost underlying funds to meet investment management's portfolio construction needs related to expanding underlying fund options, specifically for the Freedom Fund product lines; (v) adopting a "Stock Selector" sector neutral investment approach and employing a team of portfolio managers who are sector specialists to manage certain funds; (vi) rationalizing product lines and gaining increased efficiencies through the mergers of several funds into other funds; (vii) strengthening the Spartan Index Fund product line by adding new funds and/or new low-cost institutional share classes, restructuring fund expenses to accommodate new classes, and reducing investment minimums for certain classes of shares; (viii) modifying the eligibility criteria for Institutional Class shares to increase their appeal to government entities and charitable investors; and (ix) reducing certain transfer agent fee rates.
Investment Performance. The Board considered whether the fund has operated in accordance with its investment objective, as well as its record of compliance with its investment restrictions. It also reviewed the fund's absolute investment performance for each class, as well as the fund's relative investment performance for each class measured over multiple periods against (i) a broad-based securities market index, and (ii) a peer group of mutual funds deemed appropriate by Fidelity and reviewed by the Board. The following charts considered by the Board show, over the one-, three-, and five-year periods ended December 31, 2011, the cumulative total returns of Institutional Class (Class I) and Class C of the fund, the cumulative total returns of a broad-based securities market index ("benchmark"), and a range of cumulative total returns of a peer group of mutual funds identified by Morningstar, Inc. as having an investment style similar to that of the fund based on underlying portfolio holdings. The returns of Institutional Class (Class I) and Class C show the performance of the highest and lowest performing classes, respectively (based on five-year performance). The box within each chart shows the 25th percentile return (top of box) and the 75th percentile return (bottom of box) of the peer group. Returns shown above the box are in the first quartile and returns shown below the box are in the fourth quartile. The percentage beaten numbers noted below each chart correspond to the percentile box and represent the percentage of funds in the peer group whose performance was equal to or lower than that of the class indicated.
Annual Report
Fidelity Advisor Global Capital Appreciation Fund
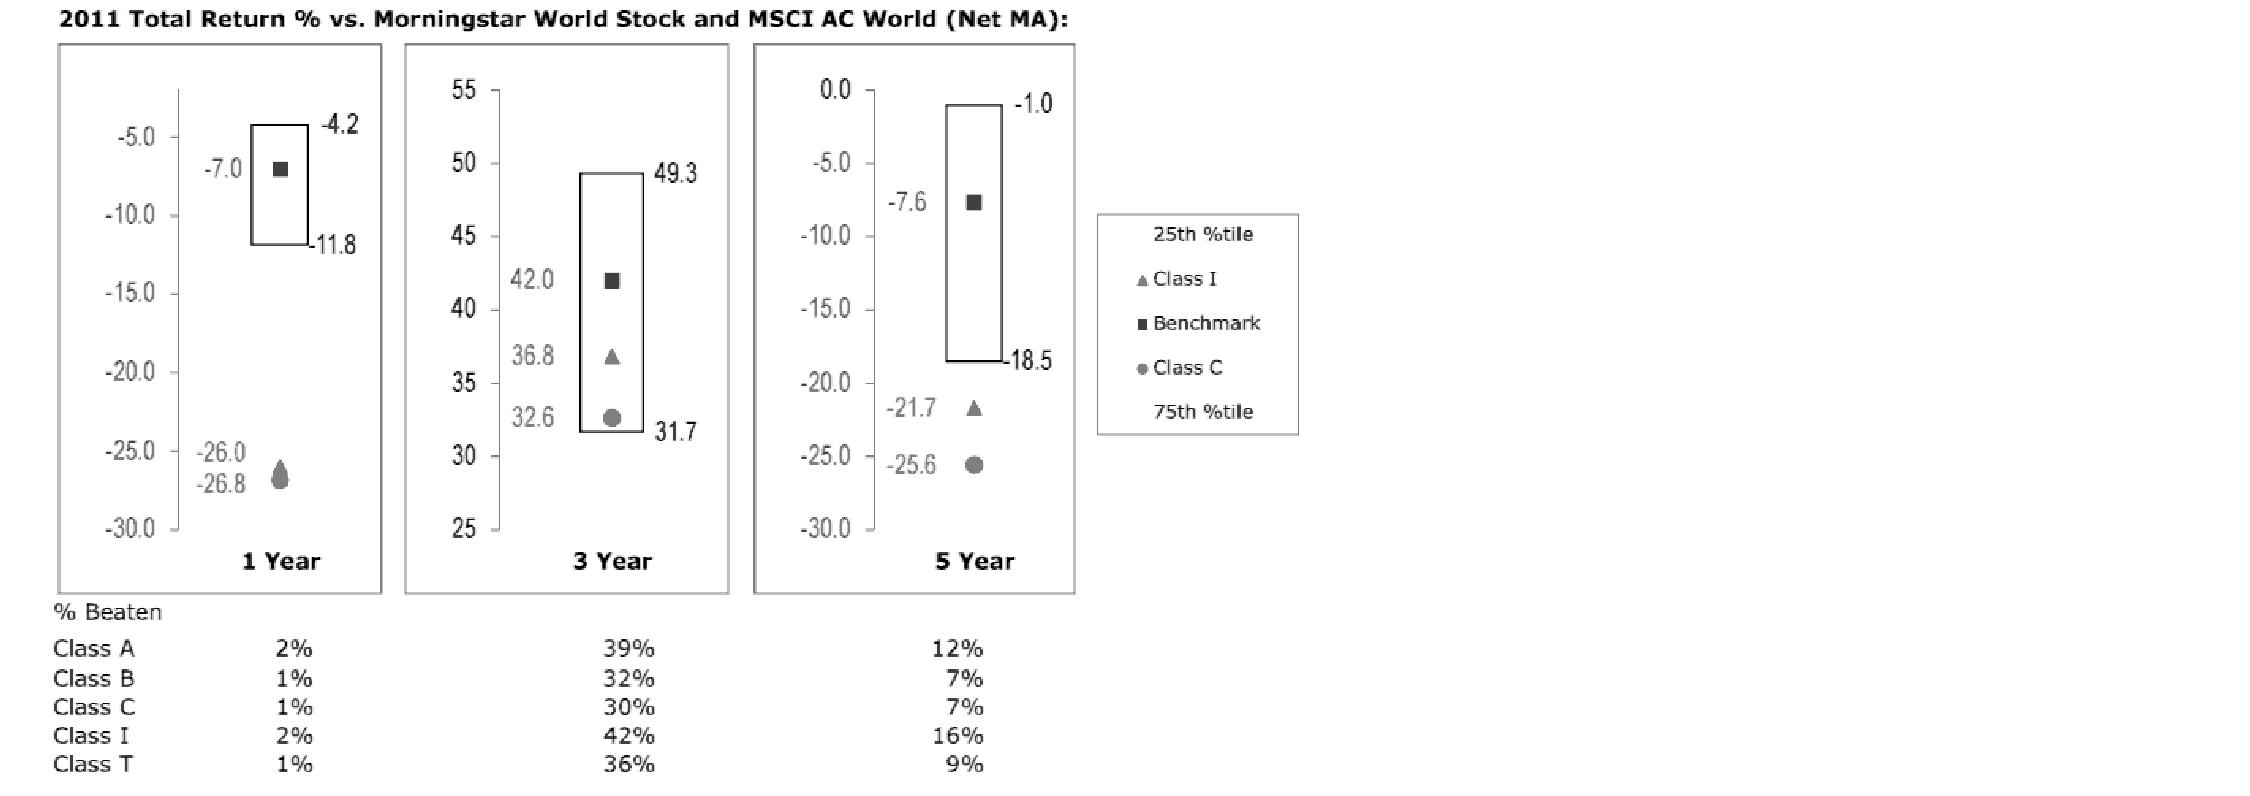
The Board reviewed the fund's relative investment performance against its peer group and noted that the performance of Institutional Class (Class I) of the fund was in the fourth quartile for the one- and five-year periods and the third quartile for the three-year period. The Board also noted that the investment performance of the fund was lower than its benchmark for all the periods shown. The Board considered that the variations in performance among the fund's classes reflect the variations in class expenses, which result in lower performance for higher expense classes. The Board discussed with FMR actions to improve the fund's disappointing performance relative to its peer group and benchmark. The Board also reviewed the fund's performance since inception as well as performance in the current year. The Board will continue to closely monitor the performance of the fund in the coming year and discuss with FMR other appropriate actions to address the performance of the fund.
The Board also considered that the fund's management fee is subject to upward or downward adjustment depending upon whether, and to what extent, the fund's investment performance for the performance period exceeds, or is exceeded by, the record (over the same period) of a Board-approved performance adjustment index. The Board noted that the performance adjustment provides FMR with a strong economic incentive to seek to achieve superior performance for the fund's shareholders and helps to more closely align the interests of FMR and the fund's shareholders.
Annual Report
Board Approval of Investment Advisory Contracts and
Management Fees - continued
Based on its review, the Board concluded that the nature, extent, and quality of services provided to the fund under the Advisory Contracts should benefit the fund's shareholders.
Competitiveness of Management Fee and Total Expense Ratio. The Board considered the fund's management fee and total expense ratio compared to "mapped groups" of competitive funds and classes. Fidelity creates "mapped groups" by combining similar Lipper investment objective categories that have comparable management fee characteristics. Combining Lipper investment objective categories aids the Board's management fee and total expense ratio comparisons by broadening the competitive group used for comparison and by reducing the number of universes to which various Fidelity funds are compared.
Management Fee. The Board considered two proprietary management fee comparisons for the 12-month periods shown in the chart below. The group of Lipper funds used by the Board for management fee comparisons is referred to below as the "Total Mapped Group." The Total Mapped Group comparison focuses on a fund's standing relative to the total universe of comparable funds available to investors in terms of gross management fees before expense reimbursements or caps, and without giving effect to the fund's performance adjustment. "TMG %" represents the percentage of funds in the Total Mapped Group that had management fees that were lower than the fund's. For example, a TMG % of 17% means that 83% of the funds in the Total Mapped Group had higher management fees than the fund. The "Asset-Size Peer Group" (ASPG) comparison focuses on a fund's standing relative to non-Fidelity funds similar in size to the fund within the Total Mapped Group. The ASPG represents at least 15% of the funds in the Total Mapped Group with comparable asset size and management fee characteristics, subject to a minimum of 50 funds (or all funds in the Total Mapped Group if fewer than 50). Additional information, such as the ASPG quartile in which the fund's management fee ranked and the impact of the fund's performance adjustment, is also included in the chart and considered by the Board.
Annual Report
Fidelity Advisor Global Capital Appreciation Fund

The Board noted that the fund's management fee ranked below the median of its Total Mapped Group and below the median of its ASPG for 2011. The Board also noted the effect of the fund's negative performance adjustment on the fund's management fee ranking. The Board noted that the performance adjustment for each year represents calculations for performance periods that differ from the periods shown in the performance charts above.
Based on its review, the Board concluded that the fund's management fee is fair and reasonable in light of the services that the fund receives and the other factors considered.
Total Expense Ratio. In its review of each class's total expense ratio, the Board considered the fund's management fee as well as other fund or class expenses, as applicable, such as transfer agent fees, pricing and bookkeeping fees, fund-paid 12b-1 fees, and custodial, legal, and audit fees. The Board also noted the effects of any waivers and reimbursements on fees and expenses, as well as the impact of the fund's performance adjustment. As part of its review, the Board also considered the current and historical total expense ratios of each class of the fund compared to competitive fund median expenses. Each class of the fund is compared to those funds and classes in the Total Mapped Group (used by the Board for management fee comparisons) that have a similar sales load structure.
The Board noted that the total expense ratio of Class A ranked below its competitive median for 2011, the total expense ratio of Class B ranked equal to its competitive median for 2011, and the total expense ratio of each of Class T, Class C, and Institutional Class ranked above its competitive median for 2011. The Board considered that various factors, including 12b-1 fees, positive or negative performance adjustments, and relatively higher other expenses in the case of small fund size, can affect total expense ratios. The Board noted that the total expense ratio of Class T was above the competitive median primarily because of higher 12b-1 fees on Class T. Class T has a higher 12b-1 fee, but a lower front-end sales charge, than traditionally priced front-end sales charge classes. The Board considered that Class T is primarily sold load-waived in the retirement plan market where its 0.50% 12b-1 fee is comparable to competing no-load, higher 12b-1 fee classes designed specifically for retirement plans. The Board noted that the fund offers multiple classes, each of which has a different sales load and 12b-1 fee structure, and that the multiple structures are intended to offer a range of pricing options for the intermediary market. The Board also noted that the total expense ratios of the classes vary primarily by the level of their 12b-1 fees, although differences in transfer agent fees may also cause expenses to vary from class to class.
Annual Report
Board Approval of Investment Advisory Contracts and
Management Fees - continued
The Board further considered that FMR contractually agreed to reimburse Class A, Class T, Class B, Class C, and Institutional Class of the fund to the extent that total operating expenses (excluding interest, taxes, certain securities lending costs, brokerage commissions, extraordinary expenses, and acquired fund fees and expenses, if any), as a percentage of their respective average net assets, exceed 1.45%, 1.70%, 2.20%, 2.20%, and 1.20% through December 31, 2012.
Fees Charged to Other Fidelity Clients. The Board also considered Fidelity fee structures and other information with respect to clients of FMR and its affiliates, such as other mutual funds advised or subadvised by FMR or its affiliates, pension plan clients, and other institutional clients. The Board noted the findings of the 2010 ad hoc joint committee (created with the board of other Fidelity funds), which reviewed and compared Fidelity's institutional investment advisory business with its business of providing services to the Fidelity funds, including the differences in services provided, fees charged, and costs incurred, as well as competition in their respective marketplaces.
Based on its review of total expense ratios and fees charged to other Fidelity clients, the Board concluded that the total expense ratio of each class of the fund was reasonable, although in some cases above the median of the universe presented for comparison, in light of the services that the fund and its shareholders receive and the other factors considered.
Costs of the Services and Profitability. The Board considered the revenues earned and the expenses incurred by Fidelity in conducting the business of developing, marketing, distributing, managing, administering and servicing the fund and its shareholders. The Board also considered the level of Fidelity's profits in respect of all the Fidelity funds.
Annual Report
On an annual basis, FMR presents to the Board Fidelity's profitability for the fund. Fidelity calculates the profitability for each fund, as well as aggregate profitability for groups of Fidelity funds and all Fidelity funds, using a series of detailed revenue and cost allocation methodologies which originate with the books and records of Fidelity on which Fidelity's audited financial statements are based. The Audit Committee of the Board reviews any significant changes from the prior year's methodologies.
PricewaterhouseCoopers LLP (PwC), independent registered public accounting firm and auditor to Fidelity and certain Fidelity funds, has been engaged annually by the Board as part of the Board's assessment of Fidelity's profitability analysis. PwC's engagement includes the review and assessment of Fidelity's methodologies used in determining the revenues and expenses attributable to Fidelity's mutual fund business, and completion of agreed-upon procedures surrounding the mathematical accuracy of fund profitability and its conformity to allocation methodologies. After considering PwC's reports issued under the engagement and information provided by Fidelity, the Board concluded that while other allocation methods may also be reasonable, Fidelity's profitability methodologies are reasonable in all material respects.
The Board also reviewed Fidelity's non-fund businesses and fall-out benefits related to the mutual fund business as well as cases where Fidelity's affiliates may benefit from or be related to the fund's business.
The Board considered the costs of the services provided by and the profits realized by Fidelity in connection with the operation of the fund and was satisfied that the profitability was not excessive in the circumstances.
Economies of Scale. The Board considered whether there have been economies of scale in respect of the management of the Fidelity funds, whether the Fidelity funds (including the fund) have appropriately benefited from any such economies of scale, and whether there is potential for realization of any further economies of scale. The Board considered the extent to which the fund will benefit from economies of scale through increased services to the fund, through waivers or reimbursements, or through fee or expense reductions. The Board also noted that in 2009, it and the board of other Fidelity funds created an ad hoc committee (the Economies of Scale Committee) to analyze whether FMR attains economies of scale in respect of the management and servicing of the Fidelity funds, whether the Fidelity funds have appropriately benefited from such economies of scale, and whether there is potential for realization of any further economies of scale.
The Board recognized that the fund's management contract incorporates a "group fee" structure, which provides for lower group fee rates as total fund assets under FMR's management increase, and for higher group fee rates as total fund assets under FMR's management decrease. FMR calculates the group fee rates based on a tiered asset "breakpoint" schedule that varies based on asset class. The Board considered that the group fee is designed to deliver the benefits of economies of scale to fund shareholders when total Fidelity fund assets increase, even if assets of any particular fund are unchanged or have declined, because some portion of Fidelity's costs are attributable to services provided to all Fidelity funds, and all funds benefit if those costs can be allocated among more assets. The Board concluded that, given the group fee structure, fund shareholders will benefit from lower management fees as assets under FMR's management increase at the fund complex level, regardless of whether Fidelity achieves any such economies of scale.
Annual Report
Board Approval of Investment Advisory Contracts and
Management Fees - continued
The Board concluded, taking into account the analysis of the Economies of Scale Committee, that economies of scale, if any, are being appropriately shared between fund shareholders and Fidelity.
Additional Information Requested by the Board. In order to develop fully the factual basis for consideration of the Fidelity funds' Advisory Contracts, the Board requested and received additional information on certain topics, including (i) fund performance trends, actions to be taken by FMR to improve certain funds' overall performance, and Fidelity's long-term strategies for certain funds; (ii) the potential to further rationalize the Fidelity fund lineup with the possibility of achieving savings for the funds and Fidelity; (iii) Fidelity's compensation structure for portfolio managers and other key investment personnel; (iv) the amount of the investment that each portfolio manager has made in the Fidelity fund(s) that he or she manages; (v) the realization of fall-out benefits in certain Fidelity business units; (vi) Fidelity's group fee structures, the potential impact of regulatory changes on such structures, and the rationale for the individual fee rates of certain funds; (vii) fund profitability methodology, including Fidelity's cost allocation methodology, and the impact of certain factors on fund profitability results; (viii) trends regarding industry use of performance fee structures and the possibility of implementing performance fee structures for additional funds; and (ix) the impact of net redemptions from the Fidelity funds.
Based on its evaluation of all of the conclusions noted above, and after considering all factors it believed relevant, the Board ultimately concluded that the advisory fee structures are fair and reasonable, and that the fund's Advisory Contracts should be renewed.
Annual Report
Investment Adviser
Fidelity Management & Research Company
Boston, MA
Investment Sub-Advisers
FMR Co., Inc.
Fidelity Management & Research
(U.K.) Inc.
FIL Investment Advisors
FIL Investments (Japan) Limited
FIL Investment Advisors (UK) Limited
Fidelity Management & Research
(Hong Kong) Limited
Fidelity Management & Research
(Japan) Inc.
General Distributor
Fidelity Distributors Corporation
Smithfield, RI
Transfer and Service Agents
Fidelity Investments Institutional Operations Company, Inc.
Boston, MA
Fidelity Service Company, Inc.
Boston, MA
Custodian
State Street Bank and Trust Company
Quincy, MA
(Fidelity Investment logo)(registered trademark)
AGLOI-UANN-1212
1.784745.109
(Fidelity Investment logo)(registered trademark)
Fidelity Advisor®
Europe Capital Appreciation
Fund - Class A, Class T, Class B
and Class C
Annual Report
October 31, 2012
(Fidelity Cover Art)
Contents
Performance | (Click Here) | How the fund has done over time. |
Management's Discussion of Fund Performance | (Click Here) | The Portfolio Manager's review of fund performance and strategy. |
Shareholder Expense Example | (Click Here) | An example of shareholder expenses. |
Investment Changes | (Click Here) | A summary of major shifts in the fund's investments over the past six months. |
Investments | (Click Here) | A complete list of the fund's investments with their market values. |
Financial Statements | (Click Here) | Statements of assets and liabilities, operations, and changes in net assets,
as well as financial highlights. |
Notes | (Click Here) | Notes to financial statements. |
Report of Independent Registered Public Accounting Firm | (Click Here) | |
Trustees and Officers | (Click Here) | |
Distributions | (Click Here) | |
Board Approval of Investment Advisory Contracts and Management Fees | (Click Here) | |
To view a fund's proxy voting guidelines and proxy voting record for the 12-month period ended June 30, visit http://www.fidelity.com/proxyvotingresults or visit the Securities and Exchange Commission's (SEC) web site at http://www.sec.gov. You may also call 1-877-208-0098 to request a free copy of the proxy voting guidelines.
Standard & Poor's, S&P and S&P 500 are registered service marks of The McGraw-Hill Companies, Inc. and have been licensed for use by Fidelity Distributors Corporation.
Other third party marks appearing herein are the property of their respective owners.
All other marks appearing herein are registered or unregistered trademarks or service marks of FMR LLC or an affiliated company. © 2012 FMR LLC. All rights reserved.
Annual Report
This report and the financial statements contained herein are submitted for the general information of the shareholders of the fund. This report is not authorized for distribution to prospective investors in the fund unless preceded or accompanied by an effective prospectus.
A fund files its complete schedule of portfolio holdings with the SEC for the first and third quarters of each fiscal year on Form N-Q. Forms N-Q are available on the SEC's web site at http://www.sec.gov. A fund's Forms N-Q may be reviewed and copied at the SEC's Public Reference Room in Washington, DC. Information regarding the operation of the SEC's Public Reference Room may be obtained by calling 1-800-SEC-0330. For a complete list of a fund's portfolio holdings, view the most recent holdings listing, semiannual report, or annual report on Fidelity's web site at http://www.fidelity.com, http://www.advisor.fidelity.com, or http://www.401k.com, as applicable.
NOT FDIC INSURED • MAY LOSE VALUE • NO BANK GUARANTEE
Neither the fund nor Fidelity Distributors Corporation is a bank.
Annual Report
Average annual total return reflects the change in the value of an investment, assuming reinvestment of the class' distributions from dividend income and capital gains (the profits earned upon the sale of securities that have grown in value, if any) and assuming a constant rate of performance each year. The $10,000 table and the fund's returns do not reflect the deduction of taxes that a shareholder would pay on fund distributions or the redemption of fund shares. During periods of reimbursement by Fidelity, a fund's total return will be greater than it would be had the reimbursement not occurred. How a fund did yesterday is no guarantee of how it will do tomorrow. Returns reflect the conversion of Class B shares to Class A shares after a maximum of seven years.
Average Annual Total Returns
Periods ended October 31, 2012 | Past 1
year | Past 5
years | Past 10
years |
Class A (incl. 5.75% sales charge) | 4.75% | -8.06% | 6.75% |
Class T (incl. 3.50% sales charge) | 6.94% | -7.87% | 6.74% |
Class B (incl. contingent deferred sales charge) A | 5.26% | -7.98% | 6.85% |
Class C (incl. contingent deferred sales charge) B | 9.33% | -7.66% | 6.58% |
A Class B shares' contingent deferred sales charges included in the past one year, past five years, and past ten years total return figures are 5%, 2%, and 0%, respectively.
B Class C shares' contingent deferred sales charges included in the past one year, past five years, and past ten years total return figures are 1%, 0%, and 0%, respectively.
Annual Report
$10,000 Over 10 Years
Let's say hypothetically that $10,000 was invested in Fidelity Advisor® Europe Capital Appreciation Fund - Class A on October 31, 2002, and the current 5.75% sales charge was paid. The chart shows how the value of your investment would have changed, and also shows how the MSCI® Europe Index performed over the same period.
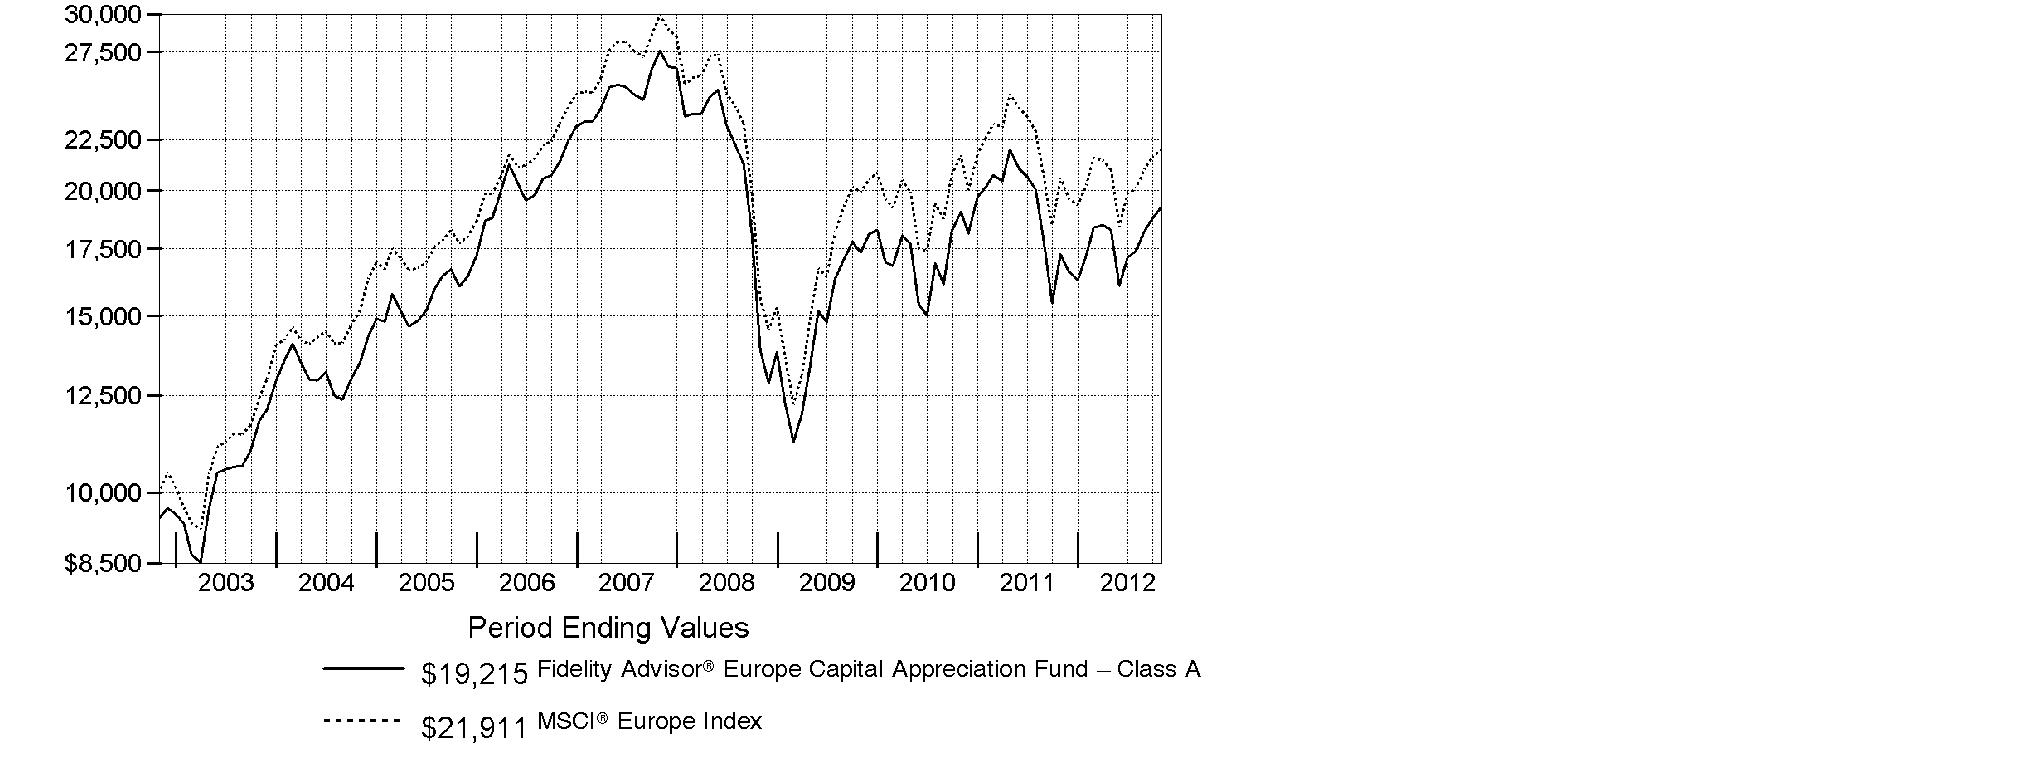
Annual Report
Market Recap: International stocks experienced pendulum-like swings during the 12 months ending October 31, 2012, finishing the period with a modest advance. The market faced periodic bouts of volatility this past year, as a number of macroeconomic concerns - including the eurozone debt crisis, the strength and pace of the U.S. economic recovery, and a slowdown in China's once-blistering growth - dominated headlines and weighed on investors. While a stronger U.S. dollar provided an additional head wind, foreign developed- and emerging-markets stocks still managed a gain for the 12 months, as the MSCI® ACWI® (All Country World Index) ex USA Index rose 4.11%, largely buttressed in the summertime by pledges of accommodative monetary action from eurozone officials, as well as signs that the U.S. housing market was on the mend. Within the index, Asia-Pacific ex Japan showed the most impressive gains, advancing roughly 11%. A number of core European components, most notably Germany (+11%), Switzerland (+10%) and the U.K. (+9%), benefited from optimism about the eurozone's ability to resolve its debt woes, which also helped the region outpace the index overall. Elsewhere, results from Canada (+3%) and the generally more volatile emerging markets (+2%) each fell short of the MSCI index, while Japan was among the few benchmark constituents to finish in the red, returning about -3%.
Comments from Melissa Reilly, Portfolio Manager of Fidelity Advisor® Europe Capital Appreciation Fund: For the year, the fund's Class A, Class T, Class B and Class C shares rose 11.14%, 10.82%, 10.26% and 10.33%, respectively (excluding sales charges), outperforming the 6.48% gain of the MSCI® Europe Index. Stock selection overall was beneficial, particularly in the consumer durables/apparel and media groups within consumer discretionary. Positioning in information technology, mostly within technology hardware/equipment, was additive. Stock selection in Spain, France and the U.K. also helped. Individual contributors included: an out-of-index position in U.K. marketing services company Aegis Group, which was sold; Spanish blood plasma developer Grifols; not owning index component Telefonica, a Spanish telecommunication firm, for most of the period; and an out-of-benchmark stake in U.K. homebuilder Barratt Developments. Conversely, positioning in the food/beverage/tobacco and household/personal products segments of consumer staples hurt, as did positioning in the insurance area of financials. Also detrimental was a slight average overweighting among banks, despite strong picks in this group. Out-of-index picks in the U.S. and positioning in Belgium and Switzerland were negative. On an individual basis, untimely ownership of Anglo American, a U.K. mining company, detracted. The stock was sold by period end. The fund also was hurt by underweighting two solidly performing index components, Belgian brewer Anheuser-Busch InBev and Swiss pharmaceutical giant Roche Holding.
The views expressed above reflect those of the portfolio manager(s) only through the end of the period as stated on the cover of this report and do not necessarily represent the views of Fidelity or any other person in the Fidelity organization. Any such views are subject to change at any time based upon market or other conditions and Fidelity disclaims any responsibility to update such views. These views may not be relied on as investment advice and, because investment decisions for a Fidelity fund are based on numerous factors, may not be relied on as an indication of trading intent on behalf of any Fidelity fund.
Annual Report
Shareholder Expense Example
As a shareholder of the Fund, you incur two types of costs: (1) transaction costs, including sales charges (loads) on purchase payments or redemption proceeds, redemption fees and (2) ongoing costs, including management fees, distribution and/or service (12b-1) fees and other Fund expenses. This Example is intended to help you understand your ongoing costs (in dollars) of investing in the Fund and to compare these costs with the ongoing costs of investing in other mutual funds.
The Example is based on an investment of $1,000 invested at the beginning of the period and held for the entire period (May 1, 2012 to October 31, 2012).
Actual Expenses
The first line of the accompanying table for each class of the Fund provides information about actual account values and actual expenses. You may use the information in this line, together with the amount you invested, to estimate the expenses that you paid over the period. Simply divide your account value by $1,000.00 (for example, an $8,600 account value divided by $1,000.00 = 8.6), then multiply the result by the number in the first line for a class of the Fund under the heading entitled "Expenses Paid During Period" to estimate the expenses you paid on your account during this period. In addition, the Fund, as a shareholder in the underlying Fidelity Central Funds, will indirectly bear its pro-rata share of the fees and expenses incurred by the underlying Fidelity Central Funds. These fees and expenses are not included in the Fund's annualized expense ratio used to calculate the expense estimate in the table below.
Hypothetical Example for Comparison Purposes
The second line of the accompanying table for each class of the Fund provides information about hypothetical account values and hypothetical expenses based on a Class' actual expense ratio and an assumed rate of return of 5% per year before expenses, which is not the Class' actual return. The hypothetical account values and expenses may not be used to estimate the actual ending account balance or expenses you paid for the period. You may use this information to compare the ongoing costs of investing in the Fund and other funds. To do so, compare this 5% hypothetical example with the 5% hypothetical examples that appear in the shareholder reports of the other funds. In addition, the Fund, as a shareholder in the underlying Fidelity Central Funds, will indirectly bear its pro-rata share of the fees and expenses incurred by the underlying Fidelity Central Funds. These fees and expenses are not included in the Fund's annualized expense ratio used to calculate the expense estimate in the table below.
Please note that the expenses shown in the table are meant to highlight your ongoing costs only and do not reflect any transaction costs. Therefore, the second line of the table is useful in comparing ongoing costs only, and will not help you determine the relative total costs of owning different funds. In addition, if these transactional costs were included, your costs would have been higher.
Annual Report
| Annualized
Expense Ratio | Beginning
Account Value
May 1, 2012 | Ending
Account Value
October 31, 2012 | Expenses Paid
During Period*
May 1, 2012
to October 31, 2012 |
Class A | 1.45% | | | |
Actual | | $ 1,000.00 | $ 1,052.60 | $ 7.48 |
HypotheticalA | | $ 1,000.00 | $ 1,017.85 | $ 7.35 |
Class T | 1.70% | | | |
Actual | | $ 1,000.00 | $ 1,051.00 | $ 8.76 |
HypotheticalA | | $ 1,000.00 | $ 1,016.59 | $ 8.62 |
Class B | 2.20% | | | |
Actual | | $ 1,000.00 | $ 1,048.60 | $ 11.33 |
HypotheticalA | | $ 1,000.00 | $ 1,014.08 | $ 11.14 |
Class C | 2.20% | | | |
Actual | | $ 1,000.00 | $ 1,048.90 | $ 11.33 |
HypotheticalA | | $ 1,000.00 | $ 1,014.08 | $ 11.14 |
Institutional Class | 1.20% | | | |
Actual | | $ 1,000.00 | $ 1,054.40 | $ 6.20 |
HypotheticalA | | $ 1,000.00 | $ 1,019.10 | $ 6.09 |
A 5% return per year before expenses
* Expenses are equal to each Class' annualized expense ratio, multiplied by the average account value over the period, multiplied by 184/366 (to reflect the one-half year period).
Annual Report
Investment Changes (Unaudited)
Top Five Stocks as of October 31, 2012 |
| % of fund's
net assets | % of fund's net assets
6 months ago |
Nestle SA (Switzerland, Food Products) | 3.6 | 3.6 |
Royal Dutch Shell PLC Class A (United Kingdom) (United Kingdom, Oil, Gas & Consumable Fuels) | 3.5 | 3.7 |
Sanofi SA (France, Pharmaceuticals) | 3.1 | 2.5 |
HSBC Holdings PLC (United Kingdom) (United Kingdom, Commercial Banks) | 3.1 | 2.0 |
Vodafone Group PLC (United Kingdom, Wireless Telecommunication Services) | 2.2 | 1.3 |
| 15.5 | |
Top Five Market Sectors as of October 31, 2012 |
| % of fund's
net assets | % of fund's net assets
6 months ago |
Consumer Discretionary | 17.3 | 18.6 |
Financials | 17.0 | 17.5 |
Consumer Staples | 16.7 | 14.1 |
Health Care | 11.8 | 12.1 |
Industrials | 10.0 | 9.1 |
Top Five Countries as of October 31, 2012 |
(excluding cash equivalents) | % of fund's
net assets | % of fund's net assets
6 months ago |
United Kingdom | 36.7 | 38.5 |
France | 10.7 | 13.0 |
Germany | 9.9 | 9.6 |
Switzerland | 8.1 | 7.2 |
Spain | 6.7 | 3.1 |
Percentages are adjusted for the effect of open futures contracts, if applicable. |
Asset Allocation (% of fund's net assets) |
As of October 31, 2012 | As of April 30, 2012 |
| Stocks 99.0% | | | Stocks 97.6% | |
| Short-Term
Investments and
Net Other Assets (Liabilities) 1.0% | | | Short-Term
Investments and
Net Other Assets (Liabilities) 2.4% | |

Annual Report
Investments October 31, 2012
Showing Percentage of Net Assets
Common Stocks - 97.1% |
| Shares | | Value |
Bailiwick of Jersey - 3.7% |
Experian PLC | 14,700 | | $ 253,827 |
Randgold Resources Ltd. | 1,100 | | 131,491 |
Shire PLC | 4,090 | | 115,009 |
Wolseley PLC | 3,100 | | 135,521 |
TOTAL BAILIWICK OF JERSEY | | 635,848 |
Belgium - 2.2% |
Anheuser-Busch InBev SA NV | 2,700 | | 225,804 |
KBC Groupe SA | 4,301 | | 100,959 |
UCB SA | 800 | | 46,661 |
TOTAL BELGIUM | | 373,424 |
Canada - 0.5% |
Suncor Energy, Inc. | 2,600 | | 87,261 |
Denmark - 1.7% |
Novo Nordisk A/S Series B | 1,837 | | 294,500 |
Finland - 0.8% |
Fortum Corp. | 3,700 | | 68,435 |
Sampo OYJ (A Shares) | 2,300 | | 72,084 |
TOTAL FINLAND | | 140,519 |
France - 10.7% |
Arkema SA | 1,100 | | 100,288 |
Atos Origin SA | 1,221 | | 81,994 |
BNP Paribas SA | 4,795 | | 241,206 |
Carrefour SA | 3,952 | | 95,481 |
Christian Dior SA | 700 | | 100,484 |
Credit Agricole SA (a) | 9,400 | | 70,764 |
Dassault Systemes SA | 800 | | 84,291 |
Essilor International SA | 1,241 | | 111,873 |
Eurofins Scientific SA | 700 | | 108,241 |
PPR SA | 1,100 | | 193,405 |
Sanofi SA | 6,078 | | 533,815 |
Vivendi SA | 6,898 | | 141,131 |
TOTAL FRANCE | | 1,862,973 |
Germany - 8.0% |
adidas AG | 1,400 | | 119,274 |
BASF AG | 1,560 | | 129,266 |
Bayer AG | 3,400 | | 296,100 |
Brenntag AG | 700 | | 88,226 |
Deutsche Boerse AG | 1,400 | | 75,778 |
Common Stocks - continued |
| Shares | | Value |
Germany - continued |
Fresenius Medical Care AG & Co. KGaA | 1,300 | | $ 91,344 |
GSW Immobilien AG | 2,300 | | 94,636 |
HeidelbergCement Finance AG | 2,500 | | 132,499 |
KUKA AG (a) | 1,300 | | 38,974 |
SAP AG | 2,746 | | 200,247 |
Software AG (Bearer) | 1,100 | | 44,070 |
Wirecard AG | 3,700 | | 84,549 |
TOTAL GERMANY | | 1,394,963 |
Greece - 0.2% |
Jumbo SA | 6,400 | | 42,306 |
Ireland - 1.6% |
Elan Corp. PLC (a) | 10,300 | | 112,096 |
Glanbia PLC | 7,000 | | 66,415 |
Ingersoll-Rand PLC | 2,100 | | 98,763 |
TOTAL IRELAND | | 277,274 |
Italy - 3.8% |
Brunello Cucinelli SpA | 2,000 | | 35,385 |
ENI SpA | 11,700 | | 269,228 |
Geox SpA | 22,000 | | 62,677 |
Prada SpA | 13,700 | | 111,721 |
Prysmian SpA | 5,200 | | 100,021 |
Saipem SpA | 1,723 | | 77,405 |
TOTAL ITALY | | 656,437 |
Netherlands - 4.6% |
Aalberts Industries NV | 2,800 | | 50,809 |
AEGON NV | 19,900 | | 111,294 |
ASML Holding NV (Netherlands) | 1,100 | | 60,469 |
D.E. Master Blenders 1753 NV (a) | 10,800 | | 131,991 |
Heineken NV (Bearer) | 1,500 | | 92,477 |
Koninklijke Philips Electronics NV | 4,400 | | 110,203 |
LyondellBasell Industries NV Class A | 2,100 | | 112,119 |
NXP Semiconductors NV (a) | 2,700 | | 65,502 |
Randstad Holding NV | 2,000 | | 65,287 |
TOTAL NETHERLANDS | | 800,151 |
Norway - 0.5% |
DnB NOR ASA | 6,800 | | 84,921 |
South Africa - 0.3% |
Naspers Ltd. Class N | 900 | | 58,429 |
Common Stocks - continued |
| Shares | | Value |
Spain - 6.7% |
Amadeus IT Holding SA Class A | 2,700 | | $ 66,842 |
Banco Bilbao Vizcaya Argentaria SA | 29,106 | | 243,208 |
Distribuidora Internacional de Alimentacion SA | 7,800 | | 47,214 |
Grifols SA (a) | 3,000 | | 104,055 |
Grifols SA ADR | 3,700 | | 93,092 |
Inditex SA | 2,072 | | 264,373 |
Repsol YPF SA | 8,499 | | 169,866 |
Telefonica SA | 13,177 | | 173,921 |
TOTAL SPAIN | | 1,162,571 |
Sweden - 2.4% |
H&M Hennes & Mauritz AB (B Shares) | 4,148 | | 140,395 |
Swedbank AB (A Shares) | 8,505 | | 157,716 |
Swedish Match Co. AB | 3,400 | | 115,847 |
TOTAL SWEDEN | | 413,958 |
Switzerland - 8.1% |
Actelion Ltd. | 1,224 | | 59,038 |
Adecco SA (Reg.) | 1,365 | | 66,015 |
Credit Suisse Group | 2,372 | | 55,162 |
Credit Suisse Group sponsored ADR | 1,100 | | 25,674 |
Nestle SA | 9,844 | | 624,701 |
Schindler Holding AG (participation certificate) | 1,065 | | 140,315 |
Syngenta AG (Switzerland) | 460 | | 179,349 |
UBS AG | 17,154 | | 257,372 |
TOTAL SWITZERLAND | | 1,407,626 |
United Kingdom - 36.7% |
Antofagasta PLC | 4,300 | | 87,225 |
ASOS PLC (a) | 1,100 | | 40,029 |
Barclays PLC | 53,349 | | 197,270 |
Barratt Developments PLC (a) | 63,400 | | 193,983 |
Bellway PLC | 8,300 | | 135,415 |
BG Group PLC | 6,673 | | 123,569 |
BHP Billiton PLC | 8,713 | | 279,263 |
British American Tobacco PLC (United Kingdom) | 6,500 | | 322,397 |
British Land Co. PLC | 15,396 | | 131,307 |
Ensco PLC Class A | 1,600 | | 92,512 |
Filtrona PLC | 14,000 | | 129,455 |
Hilton Food Group PLC | 9,700 | | 43,477 |
HSBC Holdings PLC (United Kingdom) | 53,700 | | 529,444 |
Intertek Group PLC | 1,900 | | 86,434 |
Kingfisher PLC | 23,500 | | 109,787 |
Common Stocks - continued |
| Shares | | Value |
United Kingdom - continued |
Lloyds Banking Group PLC (a) | 109,000 | | $ 71,777 |
Meggitt PLC | 21,600 | | 134,548 |
Michael Page International PLC | 17,600 | | 102,361 |
Next PLC | 2,800 | | 161,130 |
Old Mutual PLC | 44,012 | | 122,162 |
Persimmon PLC | 12,000 | | 153,952 |
Prudential PLC | 13,152 | | 180,624 |
Reckitt Benckiser Group PLC | 3,800 | | 229,959 |
Redrow PLC (a) | 48,900 | | 124,524 |
Rightmove PLC | 1,300 | | 33,797 |
Rolls-Royce Group PLC | 13,286 | | 183,207 |
Rolls-Royce Group PLC Class C | 1,009,736 | | 1,629 |
Royal Dutch Shell PLC Class A (United Kingdom) | 17,873 | | 613,272 |
SABMiller PLC | 5,200 | | 222,752 |
Serco Group PLC | 5,653 | | 51,679 |
Standard Chartered PLC (United Kingdom) | 5,708 | | 134,807 |
Taylor Wimpey PLC | 265,300 | | 261,586 |
Ted Baker PLC | 6,600 | | 100,969 |
Tesco PLC | 27,700 | | 142,976 |
Unilever PLC | 9,500 | | 354,380 |
Vodafone Group PLC | 137,800 | | 374,215 |
Whitbread PLC | 3,243 | | 122,985 |
TOTAL UNITED KINGDOM | | 6,380,858 |
United States of America - 4.6% |
Apple, Inc. | 115 | | 68,437 |
Beam, Inc. | 2,000 | | 111,120 |
Estee Lauder Companies, Inc. Class A | 1,130 | | 69,631 |
Freeport-McMoRan Copper & Gold, Inc. | 1,700 | | 66,096 |
Gilead Sciences, Inc. (a) | 1,000 | | 67,160 |
McGraw-Hill Companies, Inc. | 1,300 | | 71,864 |
Noble Energy, Inc. | 500 | | 47,505 |
salesforce.com, Inc. (a) | 500 | | 72,990 |
Theravance, Inc. (a) | 1,600 | | 36,016 |
Visa, Inc. Class A | 900 | | 124,884 |
Yum! Brands, Inc. | 1,000 | | 70,110 |
TOTAL UNITED STATES OF AMERICA | | 805,813 |
TOTAL COMMON STOCKS (Cost $15,551,366) |
16,879,832
|
Nonconvertible Preferred Stocks - 1.9% |
| Shares | | Value |
Germany - 1.9% |
Porsche Automobil Holding SE (Germany) | 1,600 | | $ 106,222 |
ProSiebenSat.1 Media AG | 2,800 | | 78,028 |
Volkswagen AG | 700 | | 144,806 |
TOTAL NONCONVERTIBLE PREFERRED STOCKS (Cost $279,312) |
329,056
|
Money Market Funds - 1.3% |
| | | |
Fidelity Cash Central Fund, 0.19% (b)
(Cost $220,653) | 220,653 | |
220,653
|
TOTAL INVESTMENT PORTFOLIO - 100.3% (Cost $16,051,331) | | 17,429,541 |
NET OTHER ASSETS (LIABILITIES) - (0.3)% | | (49,067) |
NET ASSETS - 100% | $ 17,380,474 |
Legend |
(a) Non-income producing |
(b) Affiliated fund that is available only to investment companies and other accounts managed by Fidelity Investments. The rate quoted is the annualized seven-day yield of the fund at period end. A complete unaudited listing of the fund's holdings as of its most recent quarter end is available upon request. In addition, each Fidelity Central Fund's financial statements, which are not covered by the Fund's Report of Independent Registered Public Accounting Firm, are available on the SEC's website or upon request. |
Affiliated Central Funds |
Information regarding fiscal year to date income earned by the Fund from investments in Fidelity Central Funds is as follows: |
Fund | Income earned |
Fidelity Cash Central Fund | $ 509 |
Fidelity Securities Lending Cash Central Fund | 10,194 |
Total | $ 10,703 |
Other Information |
Categorizations in the Schedule of Investments are based on country or territory of incorporation. |
The following is a summary of the inputs used, as of October 31, 2012, involving the Fund's assets and liabilities carried at fair value. The inputs or methodology used for valuing securities may not be an indication of the risk associated with investing in those securities. For more information on valuation inputs, and their aggregation into the levels used in the tables below, please refer to the Security Valuation section in the accompanying Notes to Financial Statements. |
Valuation Inputs at Reporting Date: |
Description | Total | Level 1 | Level 2 | Level 3 |
Investments in Securities: | | | | |
Equities: | | | | |
Consumer Discretionary | $ 3,037,636 | $ 3,037,636 | $ - | $ - |
Consumer Staples | 2,896,622 | 1,994,041 | 902,581 | - |
Energy | 1,480,618 | 598,118 | 882,500 | - |
Financials | 2,958,165 | 1,312,014 | 1,646,151 | - |
Health Care | 2,069,000 | 922,236 | 1,146,764 | - |
Industrials | 1,707,819 | 1,597,616 | 110,203 | - |
Information Technology | 954,275 | 693,559 | 260,716 | - |
Materials | 1,347,051 | 756,948 | 590,103 | - |
Telecommunication Services | 689,267 | 141,131 | 548,136 | - |
Utilities | 68,435 | 68,435 | - | - |
Money Market Funds | 220,653 | 220,653 | - | - |
Total Investments in Securities: | $ 17,429,541 | $ 11,342,387 | $ 6,087,154 | $ - |
The following is a summary of transfers between Level 1 and Level 2 for the period ended October 31, 2012. Transfers are assumed to have occurred at the beginning of the period, and are primarily attributable to the valuation techniques used for foreign equity securities, as discussed in the accompanying Notes to Financial Statements: |
Transfers | Total |
Level 1 to Level 2 | $ 0 |
Level 2 to Level 1 | $ 179,447 |
See accompanying notes which are an integral part of the financial statements.
Annual Report
Statement of Assets and Liabilities
| October 31, 2012 |
| | |
Assets | | |
Investment in securities, at value - See accompanying schedule: Unaffiliated issuers (cost $15,830,678) | $ 17,208,888 | |
Fidelity Central Funds (cost $220,653) | 220,653 | |
Total Investments (cost $16,051,331) | | $ 17,429,541 |
Foreign currency held at value (cost $368) | | 368 |
Receivable for investments sold | | 162,992 |
Receivable for fund shares sold | | 53,301 |
Dividends receivable | | 27,810 |
Distributions receivable from Fidelity Central Funds | | 72 |
Receivable from investment adviser for expense reductions | | 5,035 |
Other receivables | | 1,130 |
Total assets | | 17,680,249 |
| | |
Liabilities | | |
Payable for investments purchased | $ 192,567 | |
Payable for fund shares redeemed | 46,198 | |
Accrued management fee | 10,203 | |
Distribution and service plan fees payable | 6,776 | |
Other affiliated payables | 5,008 | |
Audit fees payable | 34,782 | |
Custodian fees payable | 4,241 | |
Total liabilities | | 299,775 |
| | |
Net Assets | | $ 17,380,474 |
Net Assets consist of: | | |
Paid in capital | | $ 34,355,184 |
Undistributed net investment income | | 239,630 |
Accumulated undistributed net realized gain (loss) on investments and foreign currency transactions | | (18,592,421) |
Net unrealized appreciation (depreciation) on investments and assets and liabilities in foreign currencies | | 1,378,081 |
Net Assets | | $ 17,380,474 |
See accompanying notes which are an integral part of the financial statements.
Annual Report
Statement of Assets and Liabilities - continued
| October 31, 2012 |
| | |
Calculation of Maximum Offering Price Class A:
Net Asset Value and redemption price per share ($7,869,601 ÷ 678,502 shares) | | $ 11.60 |
| | |
Maximum offering price per share (100/94.25 of $11.60) | | $ 12.31 |
Class T:
Net Asset Value and redemption price per share ($5,835,260 ÷ 505,212 shares) | | $ 11.55 |
| | |
Maximum offering price per share (100/96.50 of $11.55) | | $ 11.97 |
Class B:
Net Asset Value and offering price per share($786,424 ÷ 70,003 shares)A | | $ 11.23 |
| | |
Class C:
Net Asset Value and offering price per share ($2,450,433 ÷ 219,641 shares)A | | $ 11.16 |
| | |
Institutional Class:
Net Asset Value, offering price and redemption price per share ($438,756 ÷ 37,096 shares) | | $ 11.83 |
A Redemption price per share is equal to net asset value less any applicable contingent deferred sales charge.
See accompanying notes which are an integral part of the financial statements.
Annual Report
Financial Statements - continued
Statement of Operations
| Year ended October 31, 2012 |
| | |
Investment Income | | |
Dividends | | $ 567,545 |
Income from Fidelity Central Funds | | 10,703 |
Income before foreign taxes withheld | | 578,248 |
Less foreign taxes withheld | | (40,953) |
Total income | | 537,295 |
| | |
Expenses | | |
Management fee | $ 120,600 | |
Transfer agent fees | 53,393 | |
Distribution and service plan fees | 80,124 | |
Accounting and security lending fees | 8,882 | |
Custodian fees and expenses | 22,076 | |
Independent trustees' compensation | 112 | |
Registration fees | 57,224 | |
Audit | 49,461 | |
Legal | 112 | |
Miscellaneous | 174 | |
Total expenses before reductions | 392,158 | |
Expense reductions | (113,910) | 278,248 |
Net investment income (loss) | | 259,047 |
Realized and Unrealized Gain (Loss) Net realized gain (loss) on: | | |
Investment securities: | | |
Unaffiliated issuers | (879,913) | |
Foreign currency transactions | (4,711) | |
Total net realized gain (loss) | | (884,624) |
Change in net unrealized appreciation (depreciation) on: Investment securities | 2,358,451 | |
Assets and liabilities in foreign currencies | (132) | |
Total change in net unrealized appreciation (depreciation) | | 2,358,319 |
Net gain (loss) | | 1,473,695 |
Net increase (decrease) in net assets resulting from operations | | $ 1,732,742 |
See accompanying notes which are an integral part of the financial statements.
Annual Report
Statement of Changes in Net Assets
| Year ended
October 31,
2012 | Year ended
October 31,
2011 |
Increase (Decrease) in Net Assets | | |
Operations | | |
Net investment income (loss) | $ 259,047 | $ 207,981 |
Net realized gain (loss) | (884,624) | 1,827,999 |
Change in net unrealized appreciation (depreciation) | 2,358,319 | (3,861,503) |
Net increase (decrease) in net assets resulting
from operations | 1,732,742 | (1,825,523) |
Distributions to shareholders from net investment income | (221,435) | (69,262) |
Share transactions - net increase (decrease) | (2,112,308) | (3,369,781) |
Redemption fees | 35,973 | 300 |
Total increase (decrease) in net assets | (565,028) | (5,264,266) |
| | |
Net Assets | | |
Beginning of period | 17,945,502 | 23,209,768 |
End of period (including undistributed net investment income of $239,630 and undistributed net investment income of $204,426, respectively) | $ 17,380,474 | $ 17,945,502 |
See accompanying notes which are an integral part of the financial statements.
Annual Report
Financial Highlights - Class A
Years ended October 31, | 2012 | 2011 | 2010 | 2009 | 2008 |
Selected Per-Share Data | | | | | |
Net asset value, beginning of period | $ 10.61 | $ 11.74 | $ 10.82 | $ 8.98 | $ 20.94 |
Income from Investment Operations | | | | | |
Net investment income (loss) C | .18 | .14 | .06 | .15 | .25 |
Net realized and unrealized gain (loss) | .96 | (1.21) | .99 | 1.99 | (9.22) |
Total from investment operations | 1.14 | (1.07) | 1.05 | 2.14 | (8.97) |
Distributions from net investment income | (.17) | (.06) | (.13) | (.30) | (.31) |
Distributions from net realized gain | - | - | - | - | (2.68) |
Total distributions | (.17) | (.06) | (.13) | (.30) | (2.99) |
Redemption fees added to paid in capital C | .02 | - G | - G | - G | - G |
Net asset value, end of period | $ 11.60 | $ 10.61 | $ 11.74 | $ 10.82 | $ 8.98 |
Total Return A, B | 11.14% | (9.19)% | 9.74% | 25.27% | (49.77)% |
Ratios to Average Net Assets D, F | | | | | |
Expenses before reductions | 2.07% | 2.00% | 2.05% | 2.00% | 1.63% |
Expenses net of fee waivers, if any | 1.45% | 1.45% | 1.50% | 1.50% | 1.50% |
Expenses net of all reductions | 1.42% | 1.41% | 1.43% | 1.46% | 1.46% |
Net investment income (loss) | 1.74% | 1.18% | .61% | 1.73% | 1.65% |
Supplemental Data | | | | | |
Net assets, end of period (000 omitted) | $ 7,870 | $ 8,025 | $ 10,276 | $ 10,904 | $ 10,286 |
Portfolio turnover rate E | 108% | 118% | 143% | 109% | 112% |
A Total returns would have been lower if certain expenses had not been reduced during the applicable periods shown.
B Total returns do not include the effect of the sales charges.
C Calculated based on average shares outstanding during the period.
D Fees and expenses of any underlying Fidelity Central Funds are not included in the Fund's expense ratio. The Fund indirectly bears its proportionate share of the expenses of any underlying Fidelity Central Funds.
E Amount does not include the portfolio activity of any underlying Fidelity Central Funds.
F Expense ratios reflect operating expenses of the class. Expenses before reductions do not reflect amounts reimbursed by the investment adviser or reductions from brokerage service arrangements or reductions from other expense offset arrangements and do not represent the amount paid by the class during periods when reimbursements or reductions occur. Expenses net of fee waivers reflect expenses after reimbursement by the investment adviser but prior to reductions from brokerage service arrangements or other expense offset arrangements. Expenses net of all reductions represent the net expenses paid by the class.
G Amount represents less than $.01 per share.
See accompanying notes which are an integral part of the financial statements.
Annual Report
Financial Highlights - Class T
Years ended October 31, | 2012 | 2011 | 2010 | 2009 | 2008 |
Selected Per-Share Data | | | | | |
Net asset value, beginning of period | $ 10.56 | $ 11.68 | $ 10.78 | $ 8.92 | $ 20.75 |
Income from Investment Operations | | | | | |
Net investment income (loss) C | .16 | .11 | .04 | .13 | .21 |
Net realized and unrealized gain (loss) | .94 | (1.20) | .97 | 1.99 | (9.17) |
Total from investment operations | 1.10 | (1.09) | 1.01 | 2.12 | (8.96) |
Distributions from net investment income | (.13) | (.03) | (.11) | (.26) | (.19) |
Distributions from net realized gain | - | - | - | - | (2.68) |
Total distributions | (.13) | (.03) | (.11) | (.26) | (2.87) |
Redemption fees added to paid in capital C | .02 | - G | - G | - G | - G |
Net asset value, end of period | $ 11.55 | $ 10.56 | $ 11.68 | $ 10.78 | $ 8.92 |
Total Return A, B | 10.82% | (9.38)% | 9.42% | 24.99% | (49.91)% |
Ratios to Average Net Assets D, F | | | | | |
Expenses before reductions | 2.36% | 2.27% | 2.34% | 2.28% | 1.88% |
Expenses net of fee waivers, if any | 1.70% | 1.70% | 1.75% | 1.75% | 1.75% |
Expenses net of all reductions | 1.66% | 1.66% | 1.67% | 1.71% | 1.71% |
Net investment income (loss) | 1.49% | .93% | .36% | 1.48% | 1.40% |
Supplemental Data | | | | | |
Net assets, end of period (000 omitted) | $ 5,835 | $ 5,965 | $ 7,496 | $ 8,014 | $ 7,866 |
Portfolio turnover rate E | 108% | 118% | 143% | 109% | 112% |
A Total returns would have been lower if certain expenses had not been reduced during the applicable periods shown.
B Total returns do not include the effect of the sales charges.
C Calculated based on average shares outstanding during the period.
D Fees and expenses of any underlying Fidelity Central Funds are not included in the Fund's expense ratio. The Fund indirectly bears its proportionate share of the expenses of any underlying Fidelity Central Funds.
E Amount does not include the portfolio activity of any underlying Fidelity Central Funds.
F Expense ratios reflect operating expenses of the class. Expenses before reductions do not reflect amounts reimbursed by the investment adviser or reductions from brokerage service arrangements or reductions from other expense offset arrangements and do not represent the amount paid by the class during periods when reimbursements or reductions occur. Expenses net of fee waivers reflect expenses after reimbursement by the investment adviser but prior to reductions from brokerage service arrangements or other expense offset arrangements. Expenses net of all reductions represent the net expenses paid by the class.
G Amount represents less than $.01 per share.
See accompanying notes which are an integral part of the financial statements.
Annual Report
Financial Highlights - Class B
Years ended October 31, | 2012 | 2011 | 2010 | 2009 | 2008 |
Selected Per-Share Data | | | | | |
Net asset value, beginning of period | $ 10.23 | $ 11.35 | $ 10.48 | $ 8.61 | $ 20.16 |
Income from Investment Operations | | | | | |
Net investment income (loss) C | .10 | .05 | (.01) | .08 | .13 |
Net realized and unrealized gain (loss) | .92 | (1.17) | .94 | 1.95 | (8.86) |
Total from investment operations | 1.02 | (1.12) | .93 | 2.03 | (8.73) |
Distributions from net investment income | (.04) | - | (.06) | (.16) | (.14) |
Distributions from net realized gain | - | - | - | - | (2.68) |
Total distributions | (.04) | - | (.06) | (.16) | (2.82) |
Redemption fees added to paid in capital C | .02 | - G | - G | - G | - G |
Net asset value, end of period | $ 11.23 | $ 10.23 | $ 11.35 | $ 10.48 | $ 8.61 |
Total Return A, B | 10.26% | (9.87)% | 8.87% | 24.34% | (50.13)% |
Ratios to Average Net Assets D, F | | | | | |
Expenses before reductions | 2.89% | 2.78% | 2.82% | 2.77% | 2.39% |
Expenses net of fee waivers, if any | 2.20% | 2.20% | 2.25% | 2.25% | 2.25% |
Expenses net of all reductions | 2.16% | 2.16% | 2.18% | 2.21% | 2.21% |
Net investment income (loss) | .99% | .43% | (.14)% | .98% | .90% |
Supplemental Data | | | | | |
Net assets, end of period (000 omitted) | $ 786 | $ 1,136 | $ 1,935 | $ 2,490 | $ 2,806 |
Portfolio turnover rate E | 108% | 118% | 143% | 109% | 112% |
A Total returns would have been lower if certain expenses had not been reduced during the applicable periods shown.
B Total returns do not include the effect of the contingent deferred sales charge.
C Calculated based on average shares outstanding during the period.
D Fees and expenses of any underlying Fidelity Central Funds are not included in the Fund's expense ratio. The Fund indirectly bears its proportionate share of the expenses of any underlying Fidelity Central Funds.
E Amount does not include the portfolio activity of any underlying Fidelity Central Funds.
F Expense ratios reflect operating expenses of the class. Expenses before reductions do not reflect amounts reimbursed by the investment adviser or reductions from brokerage service arrangements or reductions from other expense offset arrangements and do not represent the amount paid by the class during periods when reimbursements or reductions occur. Expenses net of fee waivers reflect expenses after reimbursement by the investment adviser but prior to reductions from brokerage service arrangements or other expense offset arrangements. Expenses net of all reductions represent the net expenses paid by the class.
G Amount represents less than $.01 per share.
See accompanying notes which are an integral part of the financial statements.
Annual Report
Financial Highlights - Class C
Years ended October 31, | 2012 | 2011 | 2010 | 2009 | 2008 |
Selected Per-Share Data | | | | | |
Net asset value, beginning of period | $ 10.18 | $ 11.30 | $ 10.43 | $ 8.58 | $ 20.10 |
Income from Investment Operations | | | | | |
Net investment income (loss) C | .10 | .05 | (.01) | .08 | .13 |
Net realized and unrealized gain (loss) | .92 | (1.17) | .94 | 1.94 | (8.82) |
Total from investment operations | 1.02 | (1.12) | .93 | 2.02 | (8.69) |
Distributions from net investment income | (.06) | - | (.06) | (.17) | (.15) |
Distributions from net realized gain | - | - | - | - | (2.68) |
Total distributions | (.06) | - | (.06) | (.17) | (2.83) |
Redemption fees added to paid in capital C | .02 | - G | - G | - G | - G |
Net asset value, end of period | $ 11.16 | $ 10.18 | $ 11.30 | $ 10.43 | $ 8.58 |
Total Return A, B | 10.33% | (9.91)% | 8.92% | 24.29% | (50.11)% |
Ratios to Average Net Assets D, F | | | | | |
Expenses before reductions | 2.83% | 2.75% | 2.82% | 2.77% | 2.38% |
Expenses net of fee waivers, if any | 2.20% | 2.20% | 2.25% | 2.25% | 2.25% |
Expenses net of all reductions | 2.16% | 2.16% | 2.18% | 2.21% | 2.21% |
Net investment income (loss) | 1.00% | .43% | (.14)% | .98% | .90% |
Supplemental Data | | | | | |
Net assets, end of period (000 omitted) | $ 2,450 | $ 2,524 | $ 3,166 | $ 3,913 | $ 4,522 |
Portfolio turnover rate E | 108% | 118% | 143% | 109% | 112% |
A Total returns would have been lower if certain expenses had not been reduced during the applicable periods shown.
B Total returns do not include the effect of the contingent deferred sales charge.
C Calculated based on average shares outstanding during the period.
D Fees and expenses of any underlying Fidelity Central Funds are not included in the Fund's expense ratio. The Fund indirectly bears its proportionate share of the expenses of any underlying Fidelity Central Funds.
E Amount does not include the portfolio activity of any underlying Fidelity Central Funds.
F Expense ratios reflect operating expenses of the class. Expenses before reductions do not reflect amounts reimbursed by the investment adviser or reductions from brokerage service arrangements or reductions from other expense offset arrangements and do not represent the amount paid by the class during periods when reimbursements or reductions occur. Expenses net of fee waivers reflect expenses after reimbursement by the investment adviser but prior to reductions from brokerage service arrangements or other expense offset arrangements. Expenses net of all reductions represent the net expenses paid by the class.
G Amount represents less than $.01 per share.
See accompanying notes which are an integral part of the financial statements.
Annual Report
Financial Highlights - Institutional Class
Years ended October 31, | 2012 | 2011 | 2010 | 2009 | 2008 |
Selected Per-Share Data | | | | | |
Net asset value, beginning of period | $ 10.83 | $ 11.98 | $ 11.03 | $ 9.13 | $ 21.27 |
Income from Investment Operations | | | | | |
Net investment income (loss) B | .22 | .18 | .09 | .18 | .30 |
Net realized and unrealized gain (loss) | .96 | (1.24) | 1.01 | 2.03 | (9.38) |
Total from investment operations | 1.18 | (1.06) | 1.10 | 2.21 | (9.08) |
Distributions from net investment income | (.20) | (.09) | (.15) | (.31) | (.38) |
Distributions from net realized gain | - | - | - | - | (2.68) |
Total distributions | (.20) | (.09) | (.15) | (.31) | (3.06) |
Redemption fees added to paid in capital B | .02 | - F | - F | - F | - F |
Net asset value, end of period | $ 11.83 | $ 10.83 | $ 11.98 | $ 11.03 | $ 9.13 |
Total Return A | 11.41% | (8.95)% | 10.00% | 25.57% | (49.63)% |
Ratios to Average Net Assets C, E | | | | | |
Expenses before reductions | 1.60% | 1.54% | 1.80% | 1.68% | 1.27% |
Expenses net of fee waivers, if any | 1.20% | 1.20% | 1.25% | 1.25% | 1.25% |
Expenses net of all reductions | 1.16% | 1.16% | 1.17% | 1.21% | 1.21% |
Net investment income (loss) | 2.00% | 1.43% | .86% | 1.98% | 1.90% |
Supplemental Data | | | | | |
Net assets, end of period (000 omitted) | $ 439 | $ 296 | $ 336 | $ 434 | $ 378 |
Portfolio turnover rate D | 108% | 118% | 143% | 109% | 112% |
A Total returns would have been lower if certain expenses had not been reduced during the applicable periods shown.
B Calculated based on average shares outstanding during the period.
C Fees and expenses of any underlying Fidelity Central Funds are not included in the Fund's expense ratio. The Fund indirectly bears its proportionate share of the expenses of any underlying Fidelity Central Funds.
D Amount does not include the portfolio activity of any underlying Fidelity Central Funds.
E Expense ratios reflect operating expenses of the class. Expenses before reductions do not reflect amounts reimbursed by the investment adviser or reductions from brokerage service arrangements or reductions from other expense offset arrangements and do not represent the amount paid by the class during periods when reimbursements or reductions occur. Expenses net of fee waivers reflect expenses after reimbursement by the investment adviser but prior to reductions from brokerage service arrangements or other expense offset arrangements. Expenses net of all reductions represent the net expenses paid by the class.
F Amount represents less than $.01 per share.
See accompanying notes which are an integral part of the financial statements.
Annual Report
Notes to Financial Statements
For the period ended October 31, 2012
1. Organization.
Fidelity Advisor® Europe Capital Appreciation Fund (the Fund) is a fund of Fidelity Advisor Series VIII (the Trust) and is authorized to issue an unlimited number of shares. The Trust is registered under the Investment Company Act of 1940, as amended (the 1940 Act), as an open-end management investment company organized as a Massachusetts business trust. The Fund offers Class A, Class T, Class C and Institutional Class shares, each of which, along with Class B shares, has equal rights as to assets and voting privileges. Effective after the close of business on September 1, 2010, Class B shares were closed to new accounts and additional purchases, except for exchanges and reinvestments. Each class has exclusive voting rights with respect to matters that affect that class. Class B shares will automatically convert to Class A shares after a holding period of seven years from the initial date of purchase. Investment income, realized and unrealized capital gains and losses, the common expenses of the Fund, and certain fund-level expense reductions, if any, are allocated on a pro-rata basis to each class based on the relative net assets of each class to the total net assets of the Fund. Each class differs with respect to transfer agent and distribution and service plan fees incurred. Certain expense reductions may also differ by class.
2. Investments in Fidelity Central Funds.
The Fund invests in Fidelity Central Funds, which are open-end investment companies available only to other investment companies and accounts managed by Fidelity Management & Research Company (FMR) and its affiliates. The Fund's Schedule of Investments lists each of the Fidelity Central Funds held as of period end, if any, as an investment of the Fund, but does not include the underlying holdings of each Fidelity Central Fund. As an Investing Fund, the Fund indirectly bears its proportionate share of the expenses of the underlying Fidelity Central Funds.
The Money Market Central Funds seek preservation of capital and current income and are managed by Fidelity Investments Money Management, Inc. (FIMM), an affiliate of FMR.
A complete unaudited list of holdings for each Fidelity Central Fund is available upon request or at the Securities and Exchange Commission (the SEC) web site at www.sec.gov. In addition, the financial statements of the Fidelity Central Funds, which are not covered by the Fund's Report of Independent Registered Public Accounting Firm, are available on the SEC web site or upon request.
3. Significant Accounting Policies.
The financial statements have been prepared in conformity with accounting principles generally accepted in the United States of America (GAAP), which require management to make certain estimates and assumptions at the date of the financial statements.
Annual Report
Notes to Financial Statements - continued
3. Significant Accounting Policies - continued
Actual results could differ from those estimates. Subsequent events, if any, through the date that the financial statements were issued have been evaluated in the preparation of the financial statements. The following summarizes the significant accounting policies of the Fund:
Security Valuation. Investments are valued as of 4:00 p.m. Eastern time on the last calendar day of the period. In accordance with valuation policies and procedures approved by the Board of Trustees (the Board), the Fund attempts to obtain prices from one or more third party pricing vendors or brokers to value its investments. When current market prices, quotations or rates are not readily available or reliable, securities will be fair valued in good faith by the FMR Fair Value Committee (the Committee), in accordance with procedures adopted by the Fund's Board. Factors used in determining fair value vary by security type and may include market or security specific events. The frequency with which these procedures are used cannot be predicted and they may be utilized to a significant extent. The Committee oversees the Fund's valuation policies and procedures and is responsible for approving and reporting to the Board all fair value determinations.
The Fund categorizes the inputs to valuation techniques used to value its investments into a disclosure hierarchy consisting of three levels as shown below:
Level 1 - quoted prices in active markets for identical investments
Level 2 - other significant observable inputs (including quoted prices for similar investments, interest rates, prepayment speeds, etc.)
Level 3 - unobservable inputs (including the Fund's own assumptions based on the best information available)
Valuation techniques used to value the Fund's investments by major category are as follows:
Equity securities, including restricted securities, for which market quotations are readily available, are valued at the last reported sale price or official closing price as reported by a third party pricing vendor on the primary market or exchange on which they are traded and are categorized as Level 1 in the hierarchy. In the event there were no sales during the day or closing prices are not available, securities are valued at the last quoted bid price or may be valued using the last available price and are generally categorized as Level 2 in the hierarchy. For foreign equity securities, when significant market or security specific events arise, comparisons to the valuation of American Depositary Receipts (ADRs), futures contracts, Exchange-Traded Funds (ETFs) and certain indexes as well as quoted prices for similar securities are used and are categorized as Level 2 in the hierarchy. Utilizing these techniques may result in transfers between Level 1 and Level 2.
Annual Report
3. Significant Accounting Policies - continued
Security Valuation - continued
Investments in open-end mutual funds, including the Fidelity Central Funds, are valued at their closing net asset value (NAV) each business day and are categorized as Level 1 in the hierarchy.
Changes in valuation techniques may result in transfers in or out of an assigned level within the disclosure hierarchy. The aggregate value of investments by input level, as of October 31, 2012, including information on transfers between Levels 1 and 2, is included at the end of the Fund's Schedule of Investments.
Foreign Currency Translation. The Fund may use foreign currency contracts to facilitate transactions in foreign-denominated securities. Gains and losses from these transactions may arise from changes in the value of the foreign currency or if the counterparties do not perform under the contracts' terms.
Foreign-denominated assets, including investment securities, and liabilities are translated into U.S. dollars at the exchange rates at period end. Purchases and sales of investment securities, income and dividends received and expenses denominated in foreign currencies are translated into U.S. dollars at the exchange rate in effect on the transaction date.
The effects of exchange rate fluctuations on investments are included with the net realized and unrealized gain (loss) on investment securities. Other foreign currency transactions resulting in realized and unrealized gain (loss) are disclosed separately.
Investment Transactions and Income. For financial reporting purposes, the Fund's investment holdings and NAV include trades executed through the end of the last business day of the period. The NAV per share for processing shareholder transactions is calculated as of the close of business of the New York Stock Exchange (NYSE), normally 4:00 p.m. Eastern time and includes trades executed through the end of the prior business day. Gains and losses on securities sold are determined on the basis of identified cost. Dividend income is recorded on the ex-dividend date, except for certain dividends from foreign securities where the ex-dividend date may have passed, which are recorded as soon as the Fund is informed of the ex-dividend date. Non-cash dividends included in dividend income, if any, are recorded at the fair market value of the securities received. Distributions received on securities that represent a return of capital or capital gain are recorded as a reduction of cost of investments and/or as a realized gain. The Fund estimates the components of distributions received that may be considered return of capital distributions or capital gain distributions. Interest income and distributions from the Fidelity Central Funds are accrued as earned. Investment income is recorded net of foreign taxes withheld where recovery of such taxes is uncertain.
Annual Report
Notes to Financial Statements - continued
3. Significant Accounting Policies - continued
Expenses. Expenses directly attributable to a fund are charged to that fund. Expenses attributable to more than one fund are allocated among the respective funds on the basis of relative net assets or other appropriate methods. Expense estimates are accrued in the period to which they relate and adjustments are made when actual amounts are known.
Income Tax Information and Distributions to Shareholders. Each year, the Fund intends to qualify as a regulated investment company under Subchapter M of the Internal Revenue Code, including distributing substantially all of its taxable income and realized gains. As a result, no provision for income taxes is required. As of October 31, 2012, the Fund did not have any unrecognized tax benefits in the financial statements; nor is the Fund aware of any tax positions for which it is reasonably possible that the total amounts of unrecognized tax benefits will significantly change in the next twelve months. The Fund files a U.S. federal tax return, in addition to state and local tax returns as required. A fund's federal income tax returns are subject to examination by the Internal Revenue Service (IRS) for a period of three fiscal years after they are filed. State and local tax returns may be subject to examination for an additional fiscal year depending on the jurisdiction. Foreign taxes are provided for based on the Fund's understanding of the tax rules and rates that exist in the foreign markets in which it invests.
Distributions are declared and recorded on the ex-dividend date. Income dividends and capital gain distributions are declared separately for each class. Income and capital gain distributions are determined in accordance with income tax regulations, which may differ from GAAP.
Capital accounts within the financial statements are adjusted for permanent book-tax differences. These adjustments have no impact on net assets or the results of operations. Temporary book-tax differences will reverse in a subsequent period.
Book-tax differences are primarily due to foreign currency transactions, passive foreign investment companies (PFIC), partnerships, capital loss carryforwards and losses deferred due to wash sales.
The federal tax cost of investment securities and unrealized appreciation (depreciation) as of period end were as follows:
Gross unrealized appreciation | $ 1,908,174 |
Gross unrealized depreciation | (661,174) |
Net unrealized appreciation (depreciation) on securities and other investments | $ 1,247,000 |
| |
Tax Cost | $ 16,182,541 |
Annual Report
3. Significant Accounting Policies - continued
Income Tax Information and Distributions to Shareholders - continued
The tax-based components of distributable earnings as of period end were as follows:
Undistributed ordinary income | $ 239,630 |
Capital loss carryforward | $ (18,461,212) |
Net unrealized appreciation (depreciation) | $ 1,246,871 |
Capital loss carryforwards are only available to offset future capital gains of the Fund to the extent provided by regulations and may be limited. Under the Regulated Investment Company Modernization Act of 2010 (the Act), the Fund is permitted to carry forward capital losses incurred in taxable years beginning after December 22, 2010 for an unlimited period and such capital losses are required to be used prior to any losses that expire. Capital loss carryforwards were as follows:
Fiscal year of expiration | |
2016 | $ (9,488,054) |
2017 | (8,044,625) |
Total with expiration | (17,532,679) |
No expiration | |
Short-term | (483,952) |
Long-term | (444,581) |
Total no expiration | (928,533) |
Total capital loss carryforward | $ (18,461,212) |
The tax character of distributions paid was as follows:
| October 31, 2012 | October 31, 2011 |
Ordinary Income | $ 221,435 | $ 69,262 |
Short-Term Trading (Redemption) Fees. Shares held by investors in the Fund less than 30 days are subject to a redemption fee equal to 1.00% of the net asset value of shares redeemed. All redemption fees, which reduce the proceeds of the shareholder redemption, are retained by the Fund and accounted for as an addition to paid in capital.
New Accounting Pronouncement. In December 2011, the Financial Accounting Standards Board issued Accounting Standard Update No. 2011-11, Disclosures about Offsetting Assets and Liabilities. The update creates new disclosure requirements requiring entities to disclose both gross and net information for derivatives and other financial instruments that are either offset in the Statement of Assets and Liabilities or subject to an enforceable master netting arrangement or similar agreement. The disclosure requirements are effective for annual reporting periods beginning on or after
Annual Report
Notes to Financial Statements - continued
3. Significant Accounting Policies - continued
New Accounting Pronouncement - continued
January 1, 2013, and interim periods within those annual periods. Management is currently evaluating the impact of the update's adoption on the Fund's financial statement disclosures.
4. Purchases and Sales of Investments.
Purchases and sales of securities, other than short-term securities, aggregated $18,203,316 and $20,130,074, respectively.
5. Fees and Other Transactions with Affiliates.
Management Fee. FMR and its affiliates provide the Fund with investment management related services for which the Fund pays a monthly management fee. The management fee is the sum of an individual fund fee rate that is based on an annual rate of .45% of the Fund's average net assets and an annualized group fee rate that averaged .26% during the period. The group fee rate is based upon the average net assets of all the mutual funds advised by FMR. The group fee rate decreases as assets under management increase and increases as assets under management decrease. For the period, the total annual management fee rate was .71% of the Fund's average net assets.
Distribution and Service Plan Fees. In accordance with Rule 12b-1 of the 1940 Act, the Fund has adopted separate Distribution and Service Plans for each class of shares. Certain classes pay Fidelity Distributors Corporation (FDC), an affiliate of FMR, separate Distribution and Service Fees, each of which is based on an annual percentage of each class' average net assets. In addition, FDC may pay financial intermediaries for selling shares of the Fund and providing shareholder support services. For the period, the Distribution and Service Fee rates, total fees and amounts retained by FDC were as follows:
| Distribution
Fee | Service
Fee | Total Fees | Retained
by FDC |
Class A | -% | .25% | $ 19,601 | $ 468 |
Class T | .25% | .25% | 27,756 | 131 |
Class B | .75% | .25% | 9,182 | 6,900 |
Class C | .75% | .25% | 23,585 | 3,042 |
| | | $ 80,124 | $ 10,541 |
Sales Load. FDC may receive a front-end sales charge of up to 5.75% for selling Class A shares and 3.50% for selling Class T shares, some of which is paid to financial intermediaries for selling shares of the Fund. Depending on the holding period, FDC may receive contingent deferred sales charges levied on Class A, Class T, Class B, and Class C
Annual Report
5. Fees and Other Transactions with Affiliates - continued
Sales Load - continued
redemptions. The deferred sales charges range from 5.00% to 1.00% for Class B shares, 1.00% for Class C shares, 1.00% for certain purchases of Class A shares and .25% for certain purchases of Class T shares.
For the period, sales charge amounts retained by FDC were as follows:
| Retained
by FDC |
Class A | $ 1,628 |
Class T | 1,101 |
Class B* | 1,433 |
Class C* | 380 |
| $ 4,542 |
* When Class B and Class C shares are initially sold, FDC pays commissions from its own resources to financial intermediaries through which the sales are made.
Transfer Agent Fees. Fidelity Investments Institutional Operations Company, Inc. (FIIOC), an affiliate of FMR, is the transfer, dividend disbursing and shareholder servicing agent for each class of the Fund. FIIOC receives account fees and asset-based fees that vary according to the account size and type of account of the shareholders of the respective classes of the Fund. FIIOC pays for typesetting, printing and mailing of shareholder reports, except proxy statements. For the period, transfer agent fees for each class were as follows:
| Amount | % of
Average
Net Assets |
Class A | $ 24,214 | .31 |
Class T | 18,252 | .33 |
Class B | 2,833 | .31 |
Class C | 7,355 | .31 |
Institutional Class | 739 | .20 |
| $ 53,393 | |
Accounting and Security Lending Fees. Fidelity Service Company, Inc. (FSC), an affiliate of FMR, maintains the Fund's accounting records. The accounting fee is based on the level of average net assets for each month. Under a separate contract, FSC administers the security lending program. The security lending fee is based on the number and duration of lending transactions.
Brokerage Commissions. The Fund placed a portion of its portfolio transactions with brokerage firms which are affiliates of the investment adviser. The commissions paid to these affiliated firms were $45 for the period.
Annual Report
Notes to Financial Statements - continued
6. Committed Line of Credit.
The Fund participates with other funds managed by FMR or an affiliate in a $4.25 billion credit facility (the "line of credit") to be utilized for temporary or emergency purposes to fund shareholder redemptions or for other short-term liquidity purposes. The Fund has agreed to pay commitment fees on its pro-rata portion of the line of credit, which amounted to $47 and is reflected in Miscellaneous expenses on the Statement of Operations. During the period, there were no borrowings on this line of credit.
7. Security Lending.
The Fund lends portfolio securities through a lending agent from time to time in order to earn additional income. For equity securities, a lending agent is used and may loan securities to certain qualified borrowers, including Fidelity Capital Markets (FCM), a broker-dealer affiliated with the Fund. On the settlement date of the loan, the Fund receives collateral (in the form of U.S. Treasury obligations, letters of credit and/or cash) against the loaned securities and maintains collateral in an amount not less than 100% of the market value of the loaned securities during the period of the loan. The market value of the loaned securities is determined at the close of business of the Fund and any additional required collateral is delivered to the Fund on the next business day. If the borrower defaults on its obligation to return the securities loaned because of insolvency or other reasons, a fund could experience delays and costs in recovering the securities loaned or in gaining access to the collateral. Any cash collateral received is invested in the Fidelity Securities Lending Cash Central Fund. At period end, there were no security loans outstanding. Security lending income represents the income earned on investing cash collateral, less rebates paid to borrowers and any lending agent fees associated with the loan, plus any premium payments received for lending certain types of securities. Security lending income is presented in the Statement of Operations as a component of income from Fidelity Central Funds. Total security lending income during the period amounted to $10,194. During the period, there were no securities loaned to FCM.
8. Expense Reductions.
FMR voluntarily agreed to reimburse each class to the extent annual operating expenses exceeded certain levels of average net assets as noted in the table below. Some expenses, for example interest expense, including commitment fees, are excluded from this reimbursement.
Annual Report
8. Expense Reductions - continued
The following classes were in reimbursement during the period:
| Expense
Limitations | Reimbursement
from adviser |
Class A | 1.45% | $ 48,120 |
Class T | 1.70% | 36,942 |
Class B | 2.20% | 6,350 |
Class C | 2.20% | 14,886 |
Institutional Class | 1.20% | 1,529 |
| | $ 107,827 |
Many of the brokers with whom FMR places trades on behalf of the Fund provided services to the Fund in addition to trade execution. These services included payments of certain expenses on behalf of the Fund totaling $6,083 for the period.
9. Distributions to Shareholders.
Distributions to shareholders of each class were as follows:
Years ended October 31, | 2012 | 2011 |
From net investment income | | |
Class A | $ 122,753 | $ 48,533 |
Class T | 73,896 | 17,367 |
Class B | 4,700 | - |
Class C | 15,083 | - |
Institutional Class | 5,003 | 3,362 |
Total | $ 221,435 | $ 69,262 |
10. Share Transactions.
Transactions for each class of shares were as follows:
| Shares | Dollars |
Years ended October 31, | 2012 | 2011 | 2012 | 2011 |
Class A | | | | |
Shares sold | 401,078 | 113,790 | $ 4,178,943 | $ 1,369,180 |
Reinvestment of distributions | 10,620 | 3,553 | 106,515 | 42,460 |
Shares redeemed | (489,592) | (236,239) | (5,195,802) | (2,808,784) |
Net increase (decrease) | (77,894) | (118,896) | $ (910,344) | $ (1,397,144) |
Class T | | | | |
Shares sold | 65,298 | 87,655 | $ 714,626 | $ 1,039,691 |
Reinvestment of distributions | 7,166 | 1,416 | 71,732 | 16,885 |
Shares redeemed | (132,306) | (165,637) | (1,389,315) | (1,980,913) |
Net increase (decrease) | (59,842) | (76,566) | $ (602,957) | $ (924,337) |
Annual Report
Notes to Financial Statements - continued
10. Share Transactions - continued
| Shares | Dollars |
Years ended October 31, | 2012 | 2011 | 2012 | 2011 |
Class B | | | | |
Shares sold | 229 | 1,700 | $ 2,308 | $ 19,713 |
Reinvestment of distributions | 422 | - | 4,127 | - |
Shares redeemed | (41,741) | (61,103) | (429,868) | (715,010) |
Net increase (decrease) | (41,090) | (59,403) | $ (423,433) | $ (695,297) |
Class C | | | | |
Shares sold | 50,841 | 39,446 | $ 527,022 | $ 455,073 |
Reinvestment of distributions | 1,320 | - | 12,817 | - |
Shares redeemed | (80,504) | (71,785) | (833,417) | (822,473) |
Net increase (decrease) | (28,343) | (32,339) | $ (293,578) | $ (367,400) |
Institutional Class | | | | |
Shares sold | 85,776 | 55,800 | $ 893,128 | $ 702,293 |
Reinvestment of distributions | 381 | 124 | 3,887 | 1,508 |
Shares redeemed | (76,353) | (56,680) | (779,011) | (689,404) |
Net increase (decrease) | 9,804 | (756) | $ 118,004 | $ 14,397 |
11. Other.
The Fund's organizational documents provide former and current trustees and officers with a limited indemnification against liabilities arising in connection with the performance of their duties to the Fund. In the normal course of business, the Fund may also enter into contracts that provide general indemnifications. The Fund's maximum exposure under these arrangements is unknown as this would be dependent on future claims that may be made against the Fund. The risk of material loss from such claims is considered remote.
Annual Report
To the Trustees of Fidelity Advisor Series VIII and Shareholders of Fidelity Advisor Europe Capital Appreciation Fund:
We have audited the accompanying statement of assets and liabilities of Fidelity Advisor Europe Capital Appreciation Fund (the Fund), a fund of Fidelity Advisor Series VIII, including the schedule of investments, as of October 31, 2012, and the related statement of operations for the year then ended, the statement of changes in net assets for each of the two years in the period then ended, and the financial highlights for each of the five years in the period then ended. These financial statements and financial highlights are the responsibility of the Fund's management. Our responsibility is to express an opinion on these financial statements and financial highlights based on our audits.
We conducted our audits in accordance with the standards of the Public Company Accounting Oversight Board (United States). Those standards require that we plan and perform the audit to obtain reasonable assurance about whether the financial statements and financial highlights are free of material misstatement. The Fund is not required to have, nor were we engaged to perform, an audit of its internal control over financial reporting. Our audits included consideration of internal control over financial reporting as a basis for designing audit procedures that are appropriate in the circumstances, but not for the purpose of expressing an opinion on the effectiveness of the Fund's internal control over financial reporting. Accordingly, we express no such opinion. An audit also includes examining, on a test basis, evidence supporting the amounts and disclosures in the financial statements, assessing the accounting principles used and significant estimates made by management, as well as evaluating the overall financial statement presentation. Our procedures included confirmation of securities owned as of October 31, 2012, by correspondence with the custodians and brokers; where replies were not received from brokers, we performed other auditing procedures. We believe that our audits provide a reasonable basis for our opinion.
In our opinion, the financial statements and financial highlights referred to above present fairly, in all material respects, the financial position of Fidelity Advisor Europe Capital Appreciation Fund as of October 31, 2012, the results of its operations for the year then ended, the changes in its net assets for each of the two years in the period then ended, and the financial highlights for each of the five years in the period then ended, in conformity with accounting principles generally accepted in the United States of America.
DELOITTE & TOUCHE LLP
Boston, Massachusetts
December 14, 2012
Annual Report
The Trustees, Members of the Advisory Board, and executive officers of the trust and fund, as applicable, are listed below. The Board of Trustees governs the fund and is responsible for protecting the interests of shareholders. The Trustees are experienced executives who meet periodically throughout the year to oversee the fund's activities, review contractual arrangements with companies that provide services to the fund, oversee management of the risks associated with such activities and contractual arrangements, and review the fund's performance. Except for James C. Curvey, each of the Trustees oversees 236 funds advised by FMR or an affiliate. Mr. Curvey oversees 443 funds advised by FMR or an affiliate.
The Trustees hold office without limit in time except that (a) any Trustee may resign; (b) any Trustee may be removed by written instrument, signed by at least two-thirds of the number of Trustees prior to such removal; (c) any Trustee who requests to be retired or who has become incapacitated by illness or injury may be retired by written instrument signed by a majority of the other Trustees; and (d) any Trustee may be removed at any special meeting of shareholders by a two-thirds vote of the outstanding voting securities of the trust. Each Trustee who is not an interested person (as defined in the 1940 Act) (Independent Trustee), shall retire not later than the last day of the calendar year in which his or her 75th birthday occurs. The Independent Trustees may waive this mandatory retirement age policy with respect to individual Trustees. The executive officers and Advisory Board Members hold office without limit in time, except that any officer and Advisory Board Member may resign or may be removed by a vote of a majority of the Trustees at any regular meeting or any special meeting of the Trustees. Except as indicated, each individual has held the office shown or other offices in the same company for the past five years.
Experience, Skills, Attributes, and Qualifications of the Fund's Trustees. The Governance and Nominating Committee has adopted a statement of policy that describes the experience, qualifications, attributes, and skills that are necessary and desirable for potential Independent Trustee candidates (Statement of Policy). The Board believes that each Trustee satisfied at the time he or she was initially elected or appointed a Trustee, and continues to satisfy, the standards contemplated by the Statement of Policy. The Governance and Nominating Committee also engages professional search firms to help identify potential Independent Trustee candidates who have the experience, qualifications, attributes, and skills consistent with the Statement of Policy. From time to time, additional criteria based on the composition and skills of the current Independent Trustees, as well as experience or skills that may be appropriate in light of future changes to board composition, business conditions, and regulatory or other developments, have also been considered by the professional search firms and the Governance and Nominating Committee. In addition, the Board takes into account the Trustees' commitment and participation in Board and committee meetings, as well as their leadership of standing and ad hoc committees throughout their tenure.
In determining that a particular Trustee was and continues to be qualified to serve as a Trustee, the Board has considered a variety of criteria, none of which, in isolation, was controlling. The Board believes that, collectively, the Trustees have balanced and diverse experience, qualifications, attributes, and skills, which allow the Board to operate effectively in governing the fund and protecting the interests of shareholders. Information about the specific experience, skills, attributes, and qualifications of each Trustee, which in each case led to the Board's conclusion that the Trustee should serve (or continue to serve) as a trustee of the fund, is provided below.
Annual Report
Board Structure and Oversight Function. James C. Curvey is an interested person (as defined in the 1940 Act) and currently serves as Chairman. The Trustees have determined that an interested Chairman is appropriate and benefits shareholders because an interested Chairman has a personal and professional stake in the quality and continuity of services provided to the fund. Independent Trustees exercise their informed business judgment to appoint an individual of their choosing to serve as Chairman, regardless of whether the Trustee happens to be independent or a member of management. The Independent Trustees have determined that they can act independently and effectively without having an Independent Trustee serve as Chairman and that a key structural component for assuring that they are in a position to do so is for the Independent Trustees to constitute a substantial majority for the Board. The Independent Trustees also regularly meet in executive session. Ned C. Lautenbach serves as Chairman of the Independent Trustees and as such (i) acts as a liaison between the Independent Trustees and management with respect to matters important to the Independent Trustees and (ii) with management prepares agendas for Board meetings.
Fidelity funds are overseen by different Boards of Trustees. The fund's Board oversees Fidelity's equity and high income funds and another Board oversees Fidelity's investment-grade bond, money market, and asset allocation funds. The asset allocation funds may invest in Fidelity funds overseen by the fund's Board. The use of separate Boards, each with its own committee structure, allows the Trustees of each group of Fidelity funds to focus on the unique issues of the funds they oversee, including common research, investment, and operational issues. On occasion, the separate Boards establish joint committees to address issues of overlapping consequences for the Fidelity funds overseen by each Board.
The Trustees operate using a system of committees to facilitate the timely and efficient consideration of all matters of importance to the Trustees, the fund, and fund shareholders and to facilitate compliance with legal and regulatory requirements and oversight of the fund's activities and associated risks. The Board, acting through its committees, has charged FMR and its affiliates with (i) identifying events or circumstances the occurrence of which could have demonstrably adverse effects on the fund's business and/or reputation; (ii) implementing processes and controls to lessen the possibility that such events or circumstances occur or to mitigate the effects of such events or circumstances if they do occur; and (iii) creating and maintaining a system designed to evaluate continuously business and market conditions in order to facilitate the identification and implementation processes described in (i) and (ii) above. Because the day-to-day operations and activities of the fund are carried out by or through FMR, its affiliates and other service providers, the fund's exposure to risks is mitigated but not eliminated by the processes overseen by the Trustees. While each of the Board's committees has responsibility for overseeing different aspects of the fund's activities, oversight is exercised primarily through the Operations, Audit, and Compliance Committees. In addition, the Independent Trustees have worked with FMR to enhance the Board's oversight of investment and financial risks, legal and regulatory risks, technology risks, and operational risks, including the development of additional risk reporting to the Board. For example, a working group comprised of Independent Trustees and FMR has worked and continues to work to review the Fidelity funds' valuation-related activities, reporting and risk management. Appropriate personnel, including but not limited to the fund's Chief Compliance Officer (CCO), FMR's internal auditor, the independent accountants, the fund's Treasurer and portfolio management personnel, make periodic reports to the Board's committees, as appropriate, including an annual review of FMR's risk management program for the Fidelity funds. The responsibilities of each standing committee, including their oversight responsibilities, are described further under "Standing Committees of the Fund's Trustees."
Annual Report
Trustees and Officers - continued
The fund's Statement of Additional Information (SAI) includes more information about the Trustees. To request a free copy, call Fidelity at 1-877-208-0098.
Interested Trustees*:
Correspondence intended for each Trustee who is an interested person may be sent to Fidelity Investments, 82 Devonshire Street, Boston, Massachusetts 02109.
Name, Age; Principal Occupations and Other Relevant Experience+ |
James C. Curvey (77) |
| Year of Election or Appointment: 2007 Mr. Curvey is Trustee and Chairman of the Board of Trustees of certain Trusts. Mr. Curvey also serves as Trustee (2007-present) of other investment companies advised by FMR. Mr. Curvey is a Director of Fidelity Investments Money Management, Inc. (2009-present), Director of Fidelity Research & Analysis Co. (2009-present) and Director of FMR and FMR Co., Inc. (2007-present). Mr. Curvey is also Vice Chairman (2007-present) and Director of FMR LLC. In addition, Mr. Curvey serves as an Overseer for the Boston Symphony Orchestra and a member of the Trustees of Villanova University. Previously, Mr. Curvey was the Vice Chairman (2006-2007) and Director (2000-2007) of FMR Corp. |
Ronald P. O'Hanley (55) |
| Year of Election or Appointment: 2011 Mr. O'Hanley is Director of FMR Co., Inc. (2010-present), Director of Fidelity Investments Money Management, Inc. (2010-present), Director of Fidelity Research & Analysis Company (2010-present), President of Fidelity Asset Management and Corporate Services and a member of Fidelity's Executive Committee (2010-present). Previously, Mr. O'Hanley served as President and Chief Executive Officer of BNY Mellon Asset Management (2007-2010). Mr. O'Hanley also served as Vice Chairman of Bank New York Mellon Corp. and a member of that firm's Executive Committee. Prior to the 2007 merger of The Bank of New York and Mellon Financial Corporation, he was Vice Chairman of Mellon Financial Corporation and President and Chief Executive Officer of Mellon Asset Management. He joined Mellon in February 1997. Mr. O'Hanley currently serves as Chairman of the Boston Public Library Foundation Board of Directors and sits on the Board of Directors of Beth Israel Deaconess Medical Center, the Board of Trustees of the Marine Biological Laboratory and the Advisory Board of the Maxwell School of Citizenship and Public Administration at Syracuse University. Mr. O'Hanley also chairs the Council on Asset Management for the Financial Services Roundtable and is a member of the Board of Directors of Institutional Investor's U.S. Institute. |
* Trustees have been determined to be "Interested Trustees" by virtue of, among other things, their affiliation with the trust or various entities under common control with FMR.
+ The information above includes each Trustee's principal occupation during the last five years and other information relating to the experience, attributes, and skills relevant to each Trustee's qualifications to serve as a Trustee, which led to the conclusion that each Trustee should serve as a Trustee for the fund.
Annual Report
Trustees and Officers - continued
Independent Trustees:
Correspondence intended for each Independent Trustee (that is, the Trustees other than the Interested Trustees) may be sent to Fidelity Investments, P.O. Box 55235, Boston, Massachusetts 02205-5235.
Name, Age; Principal Occupations and Other Relevant Experience+ |
Dennis J. Dirks (64) |
| Year of Election or Appointment: 2005 Prior to his retirement in May 2003, Mr. Dirks was Chief Operating Officer and a member of the Board of The Depository Trust & Clearing Corporation (DTCC). He also served as President, Chief Operating Officer, and Board member of The Depository Trust Company (DTC) and President and Board member of the National Securities Clearing Corporation (NSCC). In addition, Mr. Dirks served as Chief Executive Officer and Board member of the Government Securities Clearing Corporation, Chief Executive Officer and Board member of the Mortgage-Backed Securities Clearing Corporation, as a Trustee and a member of the Finance Committee of Manhattan College (2005-2008), and as a Trustee and a member of the Finance Committee of AHRC of Nassau County (2006-2008). Mr. Dirks is a member of the Independent Directors Council (IDC) Governing Council (2010-present) and Board of Directors for The Brookville Center for Children's Services, Inc. (2009-present). |
Alan J. Lacy (59) |
| Year of Election or Appointment: 2008 Mr. Lacy serves as Senior Adviser (2007-present) of Oak Hill Capital Partners, L.P. (private equity). Mr. Lacy also served as Chief Executive Officer (2000-2005) and Vice Chairman (2005-2006) of Sears Holdings Corporation and Sears, Roebuck and Co. (retail). In addition, Mr. Lacy serves as a member of the Board of Directors of Dave & Buster's Entertainment, Inc. (restaurant and entertainment complexes, 2010-present), Earth Fare, Inc. (retail grocery, 2012-present), The Hillman Companies, Inc. (hardware wholesalers, 2010-present), and Bristol-Myers Squibb Company (global pharmaceuticals, 2008-present). Mr. Lacy is a member of the Board of Trustees of The National Parks Conservation Association (2006-present). Previously, Mr. Lacy served as Chairman of the Board of Trustees of the National Parks Conservation Association (2008-2011) and as a member of the Board of Directors for the Western Union Company (global money transfer, 2006-2011). |
Ned C. Lautenbach (68) |
| Year of Election or Appointment: 2000 Mr. Lautenbach is Chairman of the Independent Trustees of the Equity and High Income Funds (2006-present). Mr. Lautenbach currently serves as the Lead Director of the Eaton Corporation Board of Directors (diversified industrial, 1997-present). Mr. Lautenbach is Chairman of the Board of Directors of the Philharmonic Center for the Arts in Naples, Florida (2012-present) and a member of the Council on Foreign Relations (1994-present). Previously, Mr. Lautenbach was a Partner/Advisory Partner at Clayton, Dubilier & Rice, LLC (private equity investment, 1998-2010), as well as a Director of Sony Corporation (2006-2007). |
Joseph Mauriello (68) |
| Year of Election or Appointment: 2008 Prior to his retirement in January 2006, Mr. Mauriello served in numerous senior management positions including Deputy Chairman and Chief Operating Officer (2004-2005), and Vice Chairman of Financial Services (2002-2004) of KPMG LLP US (professional services, 1965-2005). Mr. Mauriello currently serves as a member of the Board of Directors of XL Group plc. (global insurance and re-insurance, 2006-present). Previously, Mr. Mauriello served as a Director of the Hamilton Funds of the Bank of New York (2006-2007) and of Arcadia Resources Inc. (health care services and products, 2007-2012). |
Robert W. Selander (62) |
| Year of Election or Appointment: 2011 Previously, Mr. Selander served as a Member of the Advisory Board of Fidelity's Equity and High Income Funds (2011), Executive Vice Chairman (2010), Chief Executive Officer (2009-2010), and President and Chief Executive Officer (1997-2009) of Mastercard, Inc. |
Cornelia M. Small (68) |
| Year of Election or Appointment: 2005 Ms. Small is a member of the Board of Directors (2009-present) and Chair of the Investment Committee (2010-present) of the Teagle Foundation. Ms. Small also serves on the Investment Committee of the Berkshire Taconic Community Foundation (2008-present). Previously, Ms. Small served as Chairperson (2002-2008) and a member of the Investment Committee and Chairperson (2008-2012) and a member of the Board of Trustees of Smith College. In addition, Ms. Small served as Chief Investment Officer, Director of Global Equity Investments, and a member of the Board of Directors of Scudder, Stevens & Clark and Scudder Kemper Investments. |
William S. Stavropoulos (73) |
| Year of Election or Appointment: 2001 Mr. Stavropoulos is Vice Chairman of the Independent Trustees of the Equity and High Income Funds (2006-present). Mr. Stavropoulos serves as President and Founder of the Michigan Baseball Foundation, the Great Lakes Loons (2007-present). Mr. Stavropoulos is Chairman Emeritus of the Board of Directors of The Dow Chemical Company, where he previously served in numerous senior management positions, including President, CEO (1995-2000; 2002-2004), Chairman of the Executive Committee (2000-2006), and as a member of the Board of Directors (1990-2006). Currently, Mr. Stavropoulos is a Director of Univar Inc. (global distributor of commodity and specialty chemicals, Chairman from 2010-May 2012 and Lead Director from May 2012-present), Teradata Corporation (data warehousing and technology solutions, 2008-present), Maersk Inc. (industrial conglomerate), and Tyco International, Ltd. (multinational manufacturing and services, 2007-present), and a member of the Advisory Board for Metalmark Capital LLC (private equity investment, 2005-present). Mr. Stavropoulos is an operating advisor to Clayton, Dubilier & Rice, LLC (private equity investment). In addition, Mr. Stavropoulos is a member of the University of Notre Dame Advisory Council for the College of Science, a Trustee of the Rollin L. Gerstacker Foundation, and a Director of the Naples Philharmonic Center for the Arts. Previously, Mr. Stavropoulos served as a Director of Chemical Financial Corporation (bank holding company, 1993-2012). |
David M. Thomas (63) |
| Year of Election or Appointment: 2008 Previously, Mr. Thomas served as Executive Chairman (2005-2006) and Chairman and Chief Executive Officer (2000-2005) of IMS Health, Inc. (pharmaceutical and healthcare information solutions), and a Director of Fortune Brands, Inc. (consumer products, 2000-2011). In addition, Mr. Thomas serves as Non-Executive Chairman of the Board of Directors of Fortune Brands Home and Security (home and security products, 2011-present), and as a member of the Board of Directors of Interpublic Group of Companies, Inc. (marketing communication, 2004-present). |
Michael E. Wiley (62) |
| Year of Election or Appointment: 2008 Mr. Wiley also serves as a Director of Asia Pacific Exploration Consolidated (international oil and gas exploration and production, 2008-present). Mr. Wiley serves as a Director of Tesoro Corporation (independent oil refiner and marketer, 2005-present), and a Director of Bill Barrett Corporation (exploration and production, 2005-present). In addition, Mr. Wiley also serves as a Director of Post Oak Bank (privately-held bank, 2004-present). Previously, Mr. Wiley served as a member of the Board of Trustees of the University of Tulsa (2000-2006; 2007-2010), as a Senior Energy Advisor of Katzenbach Partners, LLC (consulting, 2006-2007), as an Advisory Director of Riverstone Holdings (private investment), Chairman, President, and CEO of Baker Hughes, Inc. (oilfield services, 2000-2004), and as Director of Spinnaker Exploration Company (exploration and production, 2001-2005). |
+ The information above includes each Trustee's principal occupation during the last five years and other information relating to the experience, attributes, and skills relevant to each Trustee's qualifications to serve as a Trustee, which led to the conclusion that each Trustee should serve as a Trustee for the fund.
Advisory Board Members and Executive Officers:
Correspondence intended for David A. Rosow and Garnett A. Smith may be sent to Fidelity Investments, P.O. Box 55235, Boston, Massachusetts 02205-5235. Correspondence intended for each executive officer, Edward C. Johnson 3d, and Peter S. Lynch may be sent to Fidelity Investments, 82 Devonshire Street, Boston, Massachusetts 02109.
Name, Age; Principal Occupation |
Edward C. Johnson 3d (82) |
| Year of Election or Appointment: 2011 Member of the Advisory Board of Fidelity's Equity and High Income Funds. Mr. Johnson serves as Chief Executive Officer, Chairman, and a Director of FMR LLC, and also serves as Chairman and Director of FIL Limited. Previously, Mr. Johnson served as a Trustee and Chairman of the Board of certain Fidelity Trusts, Chairman and a Director of FMR, Chairman and a Director of FMR Co., Inc., and President of FMR LLC (2006-2007). |
Peter S. Lynch (68) |
| Year of Election or Appointment: 2003 Member of the Advisory Board of Fidelity's Equity and High Income Funds. Mr. Lynch is Vice Chairman and a Director of FMR and FMR Co., Inc. In addition, Mr. Lynch serves as a Trustee of Boston College and as the Chairman of the Inner-City Scholarship Fund. Previously, Mr. Lynch served on the Special Olympics International Board of Directors (1997-2006). |
David A. Rosow (70) |
| Year of Election or Appointment: 2012 Member of the Advisory Board of Fidelity's Equity and High Income Funds. Chairman and Chief Executive Officer of International Golf Group, Inc. (golf course development, 1989-present). Previously, Mr. Rosow served as Chairman and Chief Executive Officer of Rosow & Company, Inc. (private investment company, 1989-2011), a Lead Director of Hudson United Bancorp (2001-2006) and as a Director of TD Banknorth (1996-2006). In addition, Mr. Rosow is a member (2008-present) and President (2009-present) of the Town Council of Palm Beach, Florida. |
Garnett A. Smith (65) |
| Year of Election or Appointment: 2012 Member of the Advisory Board of Fidelity's Equity and High Income Funds. Prior to Mr. Smith's retirement, he served as Chairman and Chief Executive Officer of Inbrand Corp. (manufacturer of personal absorbent products, 1990-1997). He also served as President (1986-1990) of Inbrand Corp. Prior to his employment with Inbrand Corp., he was employed by a retail fabric chain and North Carolina National Bank. In addition, Mr. Smith is a board member of the Jackson Hole Land Trust (2009-present). |
Kenneth B. Robins (43) |
| Year of Election or Appointment: 2008 President and Treasurer of Fidelity's Equity and High Income Funds. Mr. Robins also serves as President and Treasurer (2010-present) and Assistant Treasurer (2009-present) of other Fidelity funds and is an employee of Fidelity Investments (2004-present). Previously, Mr. Robins served as Deputy Treasurer of the Fidelity funds (2005-2008) and Treasurer and Chief Financial Officer of The North Carolina Capital Management Trust: Cash and Term Portfolios (2006-2008). |
Bruce T. Herring (47) |
| Year of Election or Appointment: 2006 Vice President of certain Equity Funds. Mr. Herring also serves as President of Fidelity Research & Analysis Company (2010-present), Chief Investment Officer and Director of Fidelity Management & Research (U.K.) Inc. (2010-present) and Group Chief Investment Officer of FMR. Previously, Mr. Herring served as Vice President (2005-2006) and Senior Vice President (2006-2007) of Fidelity Management & Research Company, Vice President of FMR Co., Inc. (2001-2007) and as a portfolio manager for Fidelity U.S. Equity Funds. |
Brian B. Hogan (48) |
| Year of Election or Appointment: 2009 Vice President of Equity and High Income Funds. Mr. Hogan also serves as President of FMR's Equity Division (2009-present). Previously, Mr. Hogan served as Senior Vice President, Equity Research of FMR (2006-2009) and as a portfolio manager. |
Scott C. Goebel (44) |
| Year of Election or Appointment: 2008 Secretary and Chief Legal Officer (CLO) of the Fidelity funds. Mr. Goebel also serves as Secretary of Fidelity Investments Money Management, Inc. (FIMM) (2010-present) and Fidelity Research and Analysis Company (FRAC) (2010-present); Secretary and CLO of The North Carolina Capital Management Trust: Cash and Term Portfolios (2008-present); General Counsel, Secretary, and Senior Vice President of FMR (2008-present) and FMR Co., Inc. (2008-present); employed by FMR LLC or an affiliate (2001-present); Chief Legal Officer of Fidelity Management & Research (Hong Kong) Limited (2008-present) and Assistant Secretary of Fidelity Management & Research (Japan) Inc. (2008-present), and Fidelity Management & Research (U.K.) Inc. (2008-present). Previously, Mr. Goebel served as Assistant Secretary of FIMM (2008-2010), FRAC (2008-2010), and the Funds (2007-2008) and as Vice President and Secretary of Fidelity Distributors Corporation (FDC) (2005-2007). |
William C. Coffey (43) |
| Year of Election or Appointment: 2009 Assistant Secretary of Fidelity's Equity and High Income Funds. Mr. Coffey also serves as Senior Vice President and Deputy General Counsel of FMR LLC (2010-present), and is an employee of Fidelity Investments. Previously, Mr. Coffey served as Vice President and Associate General Counsel of FMR LLC (2005-2009). |
Elizabeth Paige Baumann (44) |
| Year of Election or Appointment: 2012 Anti-Money Laundering (AML) Officer of the Fidelity funds. Ms. Baumann also serves as AML Officer of The North Carolina Capital Management Trust: Cash and Term Portfolios (2012-present), Chief AML Officer of FMR LLC (2012-present), and is an employee of Fidelity Investments. Previously, Ms. Baumann served as Vice President and Deputy Anti-Money Laundering Officer (2007-2012). |
Christine Reynolds (54) |
| Year of Election or Appointment: 2008 Chief Financial Officer of the Fidelity funds. Ms. Reynolds became President of Fidelity Pricing and Cash Management Services (FPCMS) in August 2008. Ms. Reynolds served as Chief Operating Officer of FPCMS (2007-2008). Previously, Ms. Reynolds served as President, Treasurer, and Anti-Money Laundering officer of the Fidelity funds (2004-2007). |
Joseph A. Hanlon (44) |
| Year of Election or Appointment: 2012 Chief Compliance Officer of Fidelity's Equity and High Income Funds. Mr. Hanlon serves as Compliance Officer of FMR, FMR Co., Inc., Fidelity Investments Money Management, Inc. (FIMM), Fidelity Research and Analysis Company (FRAC), Fidelity Management & Research (Japan) Inc., Fidelity Management & Research (U.K.) Inc., Fidelity Management & Research (Hong Kong), and Strategic Advisers, Inc. (2009-present), as Senior Vice President of the Fidelity Asset Management Division (2009-present), and is an employee of Fidelity Investments. |
Joseph F. Zambello (55) |
| Year of Election or Appointment: 2011 Deputy Treasurer of the Fidelity funds. Mr. Zambello is an employee of Fidelity Investments. Previously, Mr. Zambello served as Vice President of FMR's Program Management Group (2009-2011) and Vice President of the Transfer Agent Oversight Group (2005-2009). |
Adrien E. Deberghes (45) |
| Year of Election or Appointment: 2008 Deputy Treasurer of Fidelity's Equity and High Income Funds. Mr. Deberghes also serves as Vice President (2011-present) and Assistant Treasurer (2010-present) of other Fidelity funds, and is an employee of Fidelity Investments (2008-present). Previously, Mr. Deberghes served as Senior Vice President of Mutual Fund Administration at State Street Corporation (2007-2008), Senior Director of Mutual Fund Administration at Investors Bank & Trust (2005-2007), and Director of Finance for Dunkin' Brands (2000-2005). |
Stephen Sadoski (41) |
| Year of Election or Appointment: 2012 Deputy Treasurer of Fidelity's Equity and High Income Funds. Mr. Sadoski also serves as Assistant Treasurer of other Fidelity funds (2012-present) and is an employee of Fidelity Investments (2012-present). Previously, Mr. Sadoski served as an assistant chief accountant in the Division of Investment Management of the Securities and Exchange Commission (SEC) (2009-2012) and as a senior manager at Deloitte & Touche (1997-2009). |
Stephanie J. Dorsey (43) |
| Year of Election or Appointment: 2010 Assistant Treasurer of Fidelity's Equity and High Income Funds. Ms. Dorsey also serves as Deputy Treasurer of other Fidelity funds (2008-present) and is an employee of Fidelity Investments (2008-present). Previously, Ms. Dorsey served as Treasurer (2004-2008) of the JPMorgan Mutual Funds and Vice President (2004-2008) of JPMorgan Chase Bank. |
John R. Hebble (54) |
| Year of Election or Appointment: 2009 Assistant Treasurer of Fidelity's Equity and High Income Funds. Mr. Hebble also serves as President (2011-present), Treasurer, and Chief Financial Officer of The North Carolina Capital Management Trust: Cash and Term Portfolios (2008-present), President and Treasurer of other Fidelity funds (2008-present) and is an employee of Fidelity Investments. |
Gary W. Ryan (54) |
| Year of Election or Appointment: 2005 Assistant Treasurer of the Fidelity funds. Mr. Ryan is an employee of Fidelity Investments. Previously, Mr. Ryan served as Vice President of Fund Reporting in Fidelity Pricing and Cash Management Services (FPCMS) (1999-2005). |
Jonathan Davis (44) |
| Year of Election or Appointment: 2010 Assistant Treasurer of the Fidelity funds. Mr. Davis is also Assistant Treasurer of Fidelity Rutland Square Trust II and Fidelity Commonwealth Trust II. Mr. Davis is an employee of Fidelity Investments. Previously, Mr. Davis served as Vice President and Associate General Counsel of FMR LLC (2003-2010). |
Annual Report
Class B and Class C designates 1% of the dividends distributed during the fiscal year as qualifying for the dividends-received deduction for corporate shareholders.
Class A, Class T, Class B, and Class C designates 100% of each, dividends distributed during the fiscal year as amounts which may be taken into account as a dividend for purposes of the maximum rate under section 1(h)(11) of the Internal Revenue Code.
The amounts per share which represent income derived from sources within, and taxes paid to, foreign countries or possessions of the United States are as follows:
| Pay Date | Income | Taxes |
Class A | 12/05/11 | $0.184 | $0.0311 |
Class T | 12/05/11 | $0.153 | $0.0311 |
Class B | 12/05/11 | $0.069 | $0.0311 |
Class C | 12/05/11 | $0.087 | $0.0311 |
The fund will notify shareholders in January 2013 of amounts for use in preparing 2012 income tax returns.
Annual Report
Board Approval of Investment Advisory Contracts and Management Fees
Fidelity Advisor Europe Capital Appreciation Fund
Each year, the Board of Trustees, including the Independent Trustees (together, the Board), votes on the renewal of the management contract and sub-advisory agreements (together, the Advisory Contracts) for the fund. The Board, assisted by the advice of fund counsel and Independent Trustees' counsel, requests and considers a broad range of information relevant to the renewal of the Advisory Contracts throughout the year.
The Board meets regularly and, at each of its meetings, considers factors that are relevant to its annual consideration of the renewal of the fund's Advisory Contracts, including the services and support provided to the fund and its shareholders. The Board has established various standing committees, each composed of and chaired by Independent Trustees with varying backgrounds, to which the Board has assigned specific subject matter responsibilities in order to enhance effective decision-making by the Board. The Board, acting directly and through its Committees, requests and receives information concerning the annual consideration of the renewal of the fund's Advisory Contracts. The Board also meets as needed to consider matters specifically related to the Board's annual consideration of the renewal of Advisory Contracts. Members of the Board may also meet with trustees of other Fidelity funds through ad hoc joint committees to discuss certain matters relevant to the Fidelity funds.
At its July 2012 meeting, the Board of Trustees, including the Independent Trustees, unanimously determined to renew the fund's Advisory Contracts. In reaching its determination, the Board considered all factors it believed relevant, including (i) the nature, extent, and quality of the services to be provided to the fund and its shareholders (including the investment performance of the fund); (ii) the competitiveness of the fund's management fee and total expense ratio relative to peer funds; (iii) the total costs of the services to be provided by and the profits to be realized by Fidelity from its relationship with the fund; (iv) the extent to which economies of scale exist and would be realized as the fund grows; and (v) whether fee levels reflect these economies of scale, if any, for the benefit of fund shareholders.
In considering whether to renew the Advisory Contracts for the fund, the Board reached a determination, with the assistance of fund counsel and Independent Trustees' counsel and through the exercise of its business judgment, that the renewal of the Advisory Contracts is in the best interests of the fund and its shareholders and that the compensation payable under the Advisory Contracts is fair and reasonable. The Board's decision to renew the Advisory Contracts was not based on any single factor, but rather was based on a comprehensive consideration of all the information provided to the Board at its meetings throughout the year. The Board, in reaching its determination to renew the Advisory Contracts, is aware that shareholders in the fund have a broad range of investment choices available to them, including a wide choice among mutual funds offered by Fidelity's competitors, and that the fund's shareholders, who have the opportunity to review and weigh the disclosure provided by the fund in its prospectus and other public disclosures, have chosen to invest in this fund, managed by Fidelity.
Annual Report
Board Approval of Investment Advisory Contracts and
Management Fees - continued
Nature, Extent, and Quality of Services Provided. The Board considered the staffing within the investment adviser, FMR, and the sub-advisers (together, the Investment Advisers), including the backgrounds of the fund's investment personnel, and also considered the fund's investment objective, strategies, and related investment philosophy. The Independent Trustees also had discussions with senior management of Fidelity's investment operations and investment groups. The Board considered the structure of the portfolio manager compensation program and whether this structure provides appropriate incentives to act in the best interests of the fund.
Resources Dedicated to Investment Management and Support Services. The Board and the Fund Oversight and Research Committees reviewed the general qualifications and capabilities of the Investment Advisers' investment staff, including its size, education, experience, and resources, as well as the Investment Advisers' approach to recruiting, training, managing, and compensating investment personnel. The Board also noted that FMR has continued to increase the resources devoted to non-U.S. offices, including expansion of Fidelity's global investment organization. The Board noted that Fidelity's analysts have extensive resources, tools and capabilities that allow them to conduct sophisticated quantitative and fundamental analysis, as well as credit analysis of issuers, counterparties and guarantors. The Board also believes that Fidelity's investment professionals have sufficient access to global information and data so as to provide competitive investment results over time, and that those professionals also have access to sophisticated tools that permit them to assess portfolio construction and risk and performance attribution characteristics continuously, as well as to transmit new information and research conclusions rapidly around the world. Additionally, in its deliberations, the Board considered the Investment Advisers' trading and risk management capabilities and resources, which are an integral part of the investment management process.
Shareholder and Administrative Services. The Board considered (i) the nature, extent, quality, and cost of advisory, administrative, and shareholder services performed by the Investment Advisers and their affiliates under the Advisory Contracts and under separate agreements covering transfer agency, pricing and bookkeeping, and securities lending services for the fund; (ii) the nature and extent of the supervision of third party service providers, principally custodians and subcustodians; and (iii) the resources devoted to, and the record of compliance with, the fund's compliance policies and procedures. The Board also reviewed the allocation of fund brokerage, including allocations to brokers affiliated with the Investment Advisers, the use of brokerage commissions to pay fund expenses, and the use of "soft" commission dollars to pay for research services.
Annual Report
The Board noted that the growth of fund assets over time across the complex allows Fidelity to reinvest in the development of services designed to enhance the value or convenience of the Fidelity funds as investment vehicles. These services include 24-hour access to account information and market information through telephone representatives and over the Internet, investor education materials and asset allocation tools, and the expanded availability of Fidelity Investor Centers.
Investment in a Large Fund Family. The Board considered the benefits to shareholders of investing in a Fidelity fund, including the benefits of investing in a fund that is part of a large family of funds offering a variety of investment disciplines and providing a large variety of mutual fund investor services. The Board noted that Fidelity had taken, or had made recommendations that resulted in the Fidelity funds taking, a number of actions over the previous year that benefited particular funds, including (i) continuing to dedicate additional resources to investment research and support of the senior management team that oversees asset management; (ii) persisting in efforts to enhance Fidelity's research capabilities, in particular, international research; (iii) launching new funds and making other enhancements to meet client needs for global and income-oriented solutions; (iv) continuing to launch dedicated lower cost underlying funds to meet investment management's portfolio construction needs related to expanding underlying fund options, specifically for the Freedom Fund product lines; (v) adopting a "Stock Selector" sector neutral investment approach and employing a team of portfolio managers who are sector specialists to manage certain funds; (vi) rationalizing product lines and gaining increased efficiencies through the mergers of several funds into other funds; (vii) strengthening the Spartan Index Fund product line by adding new funds and/or new low-cost institutional share classes, restructuring fund expenses to accommodate new classes, and reducing investment minimums for certain classes of shares; (viii) modifying the eligibility criteria for Institutional Class shares to increase their appeal to government entities and charitable investors; and (ix) reducing certain transfer agent fee rates.
Investment Performance. The Board considered whether the fund has operated in accordance with its investment objective, as well as its record of compliance with its investment restrictions. It also reviewed the fund's absolute investment performance for each class, as well as the fund's relative investment performance for each class measured over multiple periods against (i) a broad-based securities market index, and (ii) a peer group of mutual funds deemed appropriate by Fidelity and reviewed by the Board. The following charts considered by the Board show, over the one-, three-, and five-year periods ended December 31, 2011, the cumulative total returns of Institutional Class (Class I) and Class C of the fund, the cumulative total returns of a broad-based securities market index ("benchmark"), and a range of cumulative total returns of a peer group of mutual funds identified by Morningstar, Inc. as having an investment style similar to that of the fund based on underlying portfolio holdings. The returns of Institutional Class (Class I) and Class C show the performance of the highest and lowest performing classes, respectively (based on five-year performance). The box within each chart shows the 25th percentile return (top of box) and the 75th percentile return (bottom of box) of the peer group. Returns shown above the box are in the first quartile and returns shown below the box are in the fourth quartile. The percentage beaten numbers noted below each chart correspond to the percentile box and represent the percentage of funds in the peer group whose performance was equal to or lower than that of the class indicated.
Annual Report
Board Approval of Investment Advisory Contracts and
Management Fees - continued
Fidelity Advisor Europe Capital Appreciation Fund
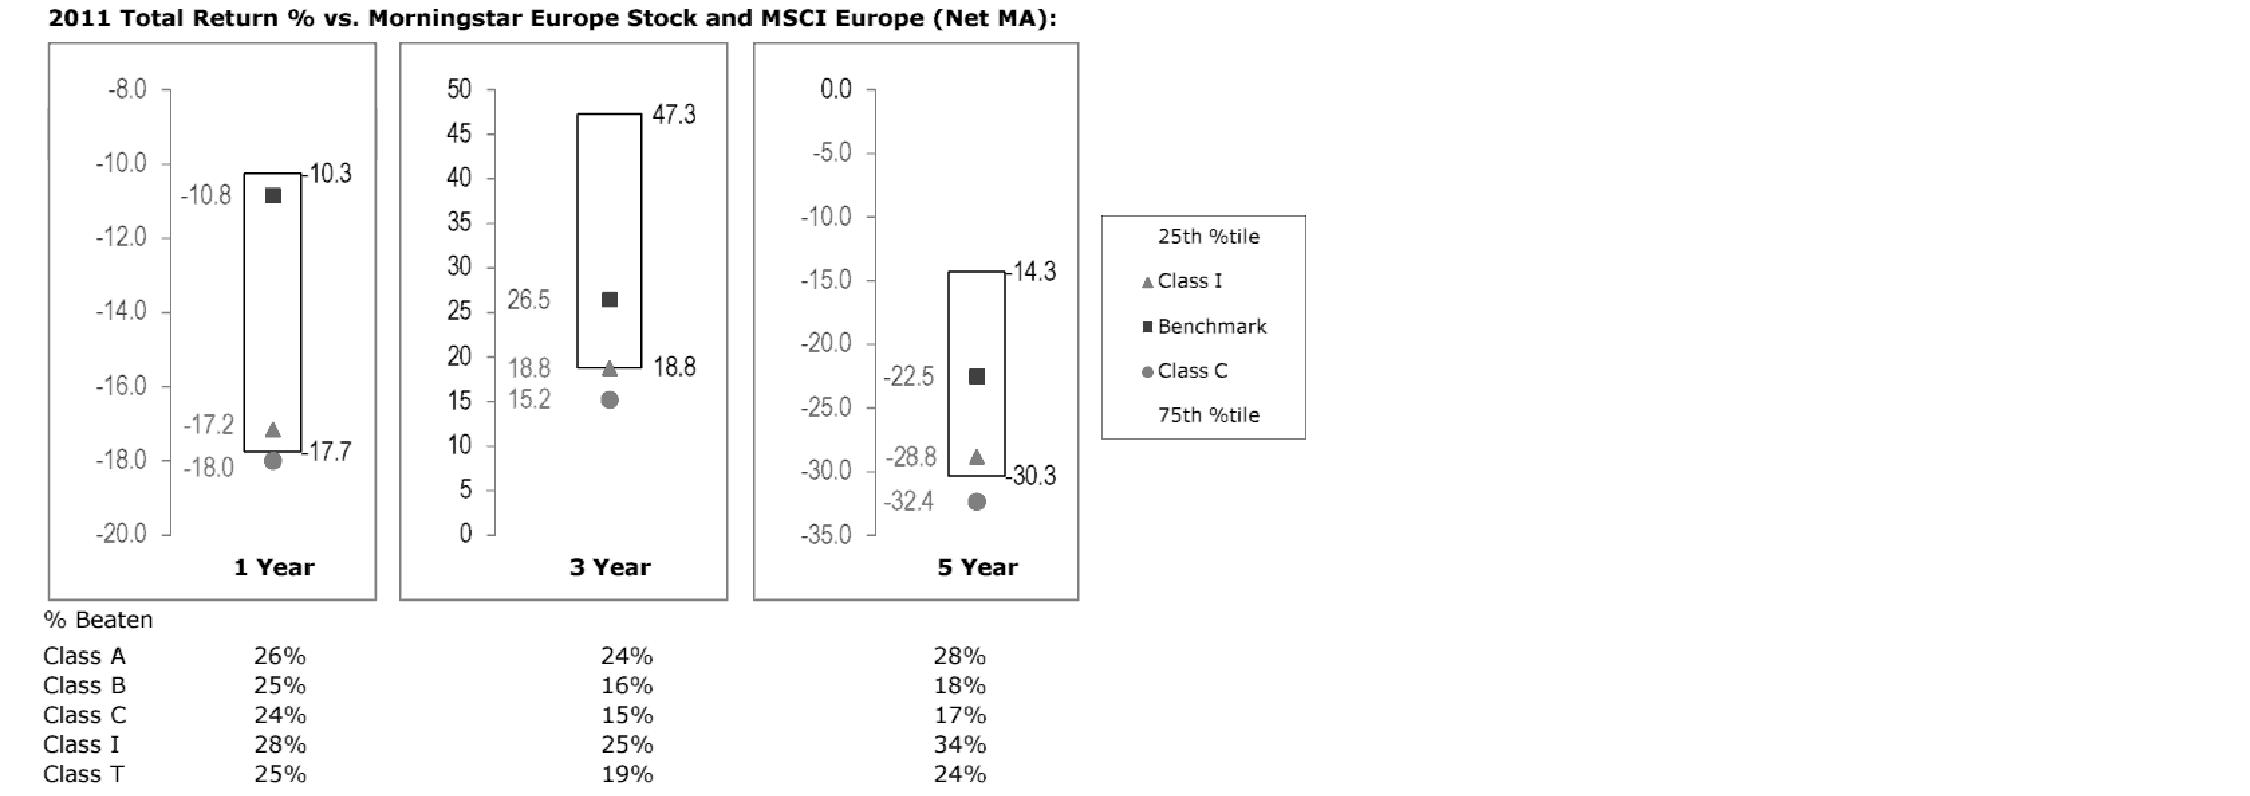
The Board reviewed the fund's relative investment performance against its peer group and noted that the performance of Institutional Class (Class I) of the fund was in the third quartile for all the periods shown. The Board also noted that the investment performance of the fund was lower than its benchmark for all the periods shown. The Board considered that the variations in performance among the fund's classes reflect the variations in class expenses, which result in lower performance for higher expense classes. The Board discussed with FMR actions to improve the fund's disappointing performance relative to its peer group and benchmark. The Board noted that this fund had underperformed in the past and discussed with FMR its disappointment with the continued underperformance of the fund. The Board also reviewed the fund's performance since inception as well as performance in the current year. The Board will continue to closely monitor the performance of the fund in the coming year and discuss with FMR other appropriate actions to address the performance of the fund.
Annual Report
Based on its review, the Board concluded that the nature, extent, and quality of services provided to the fund under the Advisory Contracts should benefit the fund's shareholders.
Competitiveness of Management Fee and Total Expense Ratio. The Board considered the fund's management fee and total expense ratio compared to "mapped groups" of competitive funds and classes. Fidelity creates "mapped groups" by combining similar Lipper investment objective categories that have comparable management fee characteristics. Combining Lipper investment objective categories aids the Board's management fee and total expense ratio comparisons by broadening the competitive group used for comparison and by reducing the number of universes to which various Fidelity funds are compared.
Management Fee. The Board considered two proprietary management fee comparisons for the 12-month periods shown in the chart below. The group of Lipper funds used by the Board for management fee comparisons is referred to below as the "Total Mapped Group." The Total Mapped Group comparison focuses on a fund's standing relative to the total universe of comparable funds available to investors in terms of gross management fees before expense reimbursements or caps. "TMG %" represents the percentage of funds in the Total Mapped Group that had management fees that were lower than the fund's. For example, a TMG % of 17% means that 83% of the funds in the Total Mapped Group had higher management fees than the fund. The "Asset-Size Peer Group" (ASPG) comparison focuses on a fund's standing relative to non-Fidelity funds similar in size to the fund within the Total Mapped Group. The ASPG represents at least 15% of the funds in the Total Mapped Group with comparable asset size and management fee characteristics, subject to a minimum of 50 funds (or all funds in the Total Mapped Group if fewer than 50). Additional information, such as the ASPG quartile in which the fund's management fee ranked, is also included in the chart and considered by the Board.
Annual Report
Board Approval of Investment Advisory Contracts and
Management Fees - continued
Fidelity Advisor Europe Capital Appreciation Fund

The Board noted that the fund's management fee ranked below the median of its Total Mapped Group and below the median of its ASPG for 2011.
Based on its review, the Board concluded that the fund's management fee is fair and reasonable in light of the services that the fund receives and the other factors considered.
Total Expense Ratio. In its review of each class's total expense ratio, the Board considered the fund's management fee as well as other fund or class expenses, as applicable, such as transfer agent fees, pricing and bookkeeping fees, fund-paid 12b-1 fees, and custodial, legal, and audit fees. The Board also noted the effects of any waivers and reimbursements on fees and expenses. As part of its review, the Board also considered the current and historical total expense ratios of each class of the fund compared to competitive fund median expenses. Each class of the fund is compared to those funds and classes in the Total Mapped Group (used by the Board for management fee comparisons) that have a similar sales load structure.
The Board noted that the total expense ratio of Class A ranked below its competitive median for 2011, the total expense ratio of Class B ranked equal to its competitive median for 2011, and the total expense ratio of each of Class T, Class C, and Institutional Class ranked above its competitive median for 2011. The Board considered that various factors, including 12b-1 fees, positive or negative performance adjustments, and relatively higher other expenses in the case of small fund size, can affect total expense ratios. The Board noted that the total expense ratio of Class T was above the competitive median primarily because of higher 12b-1 fees on Class T. Class T has a higher 12b-1 fee, but a lower front-end sales charge, than traditionally priced front-end sales charge classes. The Board considered that Class T is primarily sold load-waived in the retirement plan market where its 0.50% 12b-1 fee is comparable to competing no-load, higher 12b-1 fee classes designed specifically for retirement plans. The Board noted that the fund offers multiple classes, each of which has a different sales load and 12b-1 fee structure, and that the multiple structures are intended to offer a range of pricing options for the intermediary market. The Board also noted that the total expense ratios of the classes vary primarily by the level of their 12b-1 fees, although differences in transfer agent fees may also cause expenses to vary from class to class.
Annual Report
Fees Charged to Other Fidelity Clients. The Board also considered Fidelity fee structures and other information with respect to clients of FMR and its affiliates, such as other mutual funds advised or subadvised by FMR or its affiliates, pension plan clients, and other institutional clients. The Board noted the findings of the 2010 ad hoc joint committee (created with the board of other Fidelity funds), which reviewed and compared Fidelity's institutional investment advisory business with its business of providing services to the Fidelity funds, including the differences in services provided, fees charged, and costs incurred, as well as competition in their respective marketplaces.
Based on its review of total expense ratios and fees charged to other Fidelity clients, the Board concluded that the total expense ratio of each class of the fund was reasonable, although in some cases above the median of the universe presented for comparison, in light of the services that the fund and its shareholders receive and the other factors considered.
Costs of the Services and Profitability. The Board considered the revenues earned and the expenses incurred by Fidelity in conducting the business of developing, marketing, distributing, managing, administering and servicing the fund and its shareholders. The Board also considered the level of Fidelity's profits in respect of all the Fidelity funds.
On an annual basis, FMR presents to the Board Fidelity's profitability for the fund. Fidelity calculates the profitability for each fund, as well as aggregate profitability for groups of Fidelity funds and all Fidelity funds, using a series of detailed revenue and cost allocation methodologies which originate with the books and records of Fidelity on which Fidelity's audited financial statements are based. The Audit Committee of the Board reviews any significant changes from the prior year's methodologies.
PricewaterhouseCoopers LLP (PwC), independent registered public accounting firm and auditor to Fidelity and certain Fidelity funds, has been engaged annually by the Board as part of the Board's assessment of Fidelity's profitability analysis. PwC's engagement includes the review and assessment of Fidelity's methodologies used in determining the revenues and expenses attributable to Fidelity's mutual fund business, and completion of agreed-upon procedures surrounding the mathematical accuracy of fund profitability and its conformity to allocation methodologies. After considering PwC's reports issued under the engagement and information provided by Fidelity, the Board concluded that while other allocation methods may also be reasonable, Fidelity's profitability methodologies are reasonable in all material respects.
Annual Report
Board Approval of Investment Advisory Contracts and
Management Fees - continued
The Board also reviewed Fidelity's non-fund businesses and fall-out benefits related to the mutual fund business as well as cases where Fidelity's affiliates may benefit from or be related to the fund's business.
The Board considered the costs of the services provided by and the profits realized by Fidelity in connection with the operation of the fund and was satisfied that the profitability was not excessive in the circumstances.
Economies of Scale. The Board considered whether there have been economies of scale in respect of the management of the Fidelity funds, whether the Fidelity funds (including the fund) have appropriately benefited from any such economies of scale, and whether there is potential for realization of any further economies of scale. The Board considered the extent to which the fund will benefit from economies of scale through increased services to the fund, through waivers or reimbursements, or through fee or expense reductions. The Board also noted that in 2009, it and the board of other Fidelity funds created an ad hoc committee (the Economies of Scale Committee) to analyze whether FMR attains economies of scale in respect of the management and servicing of the Fidelity funds, whether the Fidelity funds have appropriately benefited from such economies of scale, and whether there is potential for realization of any further economies of scale.
The Board recognized that the fund's management contract incorporates a "group fee" structure, which provides for lower group fee rates as total fund assets under FMR's management increase, and for higher group fee rates as total fund assets under FMR's management decrease. FMR calculates the group fee rates based on a tiered asset "breakpoint" schedule that varies based on asset class. The Board considered that the group fee is designed to deliver the benefits of economies of scale to fund shareholders when total Fidelity fund assets increase, even if assets of any particular fund are unchanged or have declined, because some portion of Fidelity's costs are attributable to services provided to all Fidelity funds, and all funds benefit if those costs can be allocated among more assets. The Board concluded that, given the group fee structure, fund shareholders will benefit from lower management fees as assets under FMR's management increase at the fund complex level, regardless of whether Fidelity achieves any such economies of scale.
The Board concluded, taking into account the analysis of the Economies of Scale Committee, that economies of scale, if any, are being appropriately shared between fund shareholders and Fidelity.
Annual Report
Additional Information Requested by the Board. In order to develop fully the factual basis for consideration of the Fidelity funds' Advisory Contracts, the Board requested and received additional information on certain topics, including (i) fund performance trends, actions to be taken by FMR to improve certain funds' overall performance, and Fidelity's long-term strategies for certain funds; (ii) the potential to further rationalize the Fidelity fund lineup with the possibility of achieving savings for the funds and Fidelity; (iii) Fidelity's compensation structure for portfolio managers and other key investment personnel; (iv) the amount of the investment that each portfolio manager has made in the Fidelity fund(s) that he or she manages; (v) the realization of fall-out benefits in certain Fidelity business units; (vi) Fidelity's group fee structures, the potential impact of regulatory changes on such structures, and the rationale for the individual fee rates of certain funds; (vii) fund profitability methodology, including Fidelity's cost allocation methodology, and the impact of certain factors on fund profitability results; (viii) trends regarding industry use of performance fee structures and the possibility of implementing performance fee structures for additional funds; and (ix) the impact of net redemptions from the Fidelity funds.
Based on its evaluation of all of the conclusions noted above, and after considering all factors it believed relevant, the Board ultimately concluded that the advisory fee structures are fair and reasonable, and that the fund's Advisory Contracts should be renewed.
Annual Report
Investment Adviser
Fidelity Management & Research Company
Boston, MA
Investment Sub-Advisers
FMR Co., Inc.
Fidelity Management & Research
(U.K.) Inc.
FIL Investment Advisors
FIL Investment Advisors (U.K.) Limited
Fidelity Management & Research
(Hong Kong) Limited
Fidelity Management & Research
(Japan) Inc.
General Distributor
Fidelity Distributors Corporation
Smithfield, RI
Transfer and Service Agents
Fidelity Investments Institutional Operations Company, Inc.
Boston, MA
Fidelity Service Company, Inc.
Boston, MA
Custodian
State Street Bank and Trust Company
Quincy, MA
(Fidelity Investment logo)(registered trademark)
AEUR-UANN-1212
1.784739.109
(Fidelity Investment logo)(registered trademark)
Fidelity Advisor®
Europe Capital Appreciation
Fund - Institutional Class
Annual Report
October 31, 2012
(Fidelity Cover Art)
Contents
Performance | (Click Here) | How the fund has done over time. |
Management's Discussion of Fund Performance | (Click Here) | The Portfolio Manager's review of fund performance and strategy. |
Shareholder Expense Example | (Click Here) | An example of shareholder expenses. |
Investment Changes | (Click Here) | A summary of major shifts in the fund's investments over the past six months. |
Investments | (Click Here) | A complete list of the fund's investments with their market values. |
Financial Statements | (Click Here) | Statements of assets and liabilities, operations, and changes in net assets,
as well as financial highlights. |
Notes | (Click Here) | Notes to financial statements. |
Report of Independent Registered Public Accounting Firm | (Click Here) | |
Trustees and Officers | (Click Here) | |
Distributions | (Click Here) | |
Board Approval of Investment Advisory Contracts and Management Fees | (Click Here) | |
To view a fund's proxy voting guidelines and proxy voting record for the 12-month period ended June 30, visit http://www.fidelity.com/proxyvotingresults or visit the Securities and Exchange Commission's (SEC) web site at http://www.sec.gov. You may also call 1-877-208-0098 to request a free copy of the proxy voting guidelines.
Standard & Poor's, S&P and S&P 500 are registered service marks of The McGraw-Hill Companies, Inc. and have been licensed for use by Fidelity Distributors Corporation.
Other third party marks appearing herein are the property of their respective owners.
All other marks appearing herein are registered or unregistered trademarks or service marks of FMR LLC or an affiliated company. © 2012 FMR LLC. All rights reserved.
Annual Report
This report and the financial statements contained herein are submitted for the general information of the shareholders of the fund. This report is not authorized for distribution to prospective investors in the fund unless preceded or accompanied by an effective prospectus.
A fund files its complete schedule of portfolio holdings with the SEC for the first and third quarters of each fiscal year on Form N-Q. Forms N-Q are available on the SEC's web site at http://www.sec.gov. A fund's Forms N-Q may be reviewed and copied at the SEC's Public Reference Room in Washington, DC. Information regarding the operation of the SEC's Public Reference Room may be obtained by calling 1-800-SEC-0330. For a complete list of a fund's portfolio holdings, view the most recent holdings listing, semiannual report, or annual report on Fidelity's web site at http://www.fidelity.com, http://www.advisor.fidelity.com, or http://www.401k.com, as applicable.
NOT FDIC INSURED • MAY LOSE VALUE • NO BANK GUARANTEE
Neither the fund nor Fidelity Distributors Corporation is a bank.
Annual Report
Average annual total return reflects the change in the value of an investment, assuming reinvestment of the class' distributions from dividend income and capital gains (the profits earned upon the sale of securities that have grown in value, if any) and assuming a constant rate of performance each year. The $10,000 table and the fund's returns do not reflect the deduction of taxes that a shareholder would pay on fund distributions or the redemption of fund shares. During periods of reimbursement by Fidelity, a fund's total return will be greater than it would be had the reimbursement not occurred. How a fund did yesterday is no guarantee of how it will do tomorrow.
Average Annual Total Returns
Periods ended October 31, 2012 | Past 1
year | Past 5
years | Past 10
years |
Institutional Class | 11.41% | -6.73% | 7.65% |
$10,000 Over 10 Years
Let's say hypothetically that $10,000 was invested in Fidelity Advisor® Europe Capital Appreciation Fund - Institutional Class on October 31, 2002. The chart shows how the value of your investment would have changed, and also shows how the MSCI® Europe Index performed over the same period.
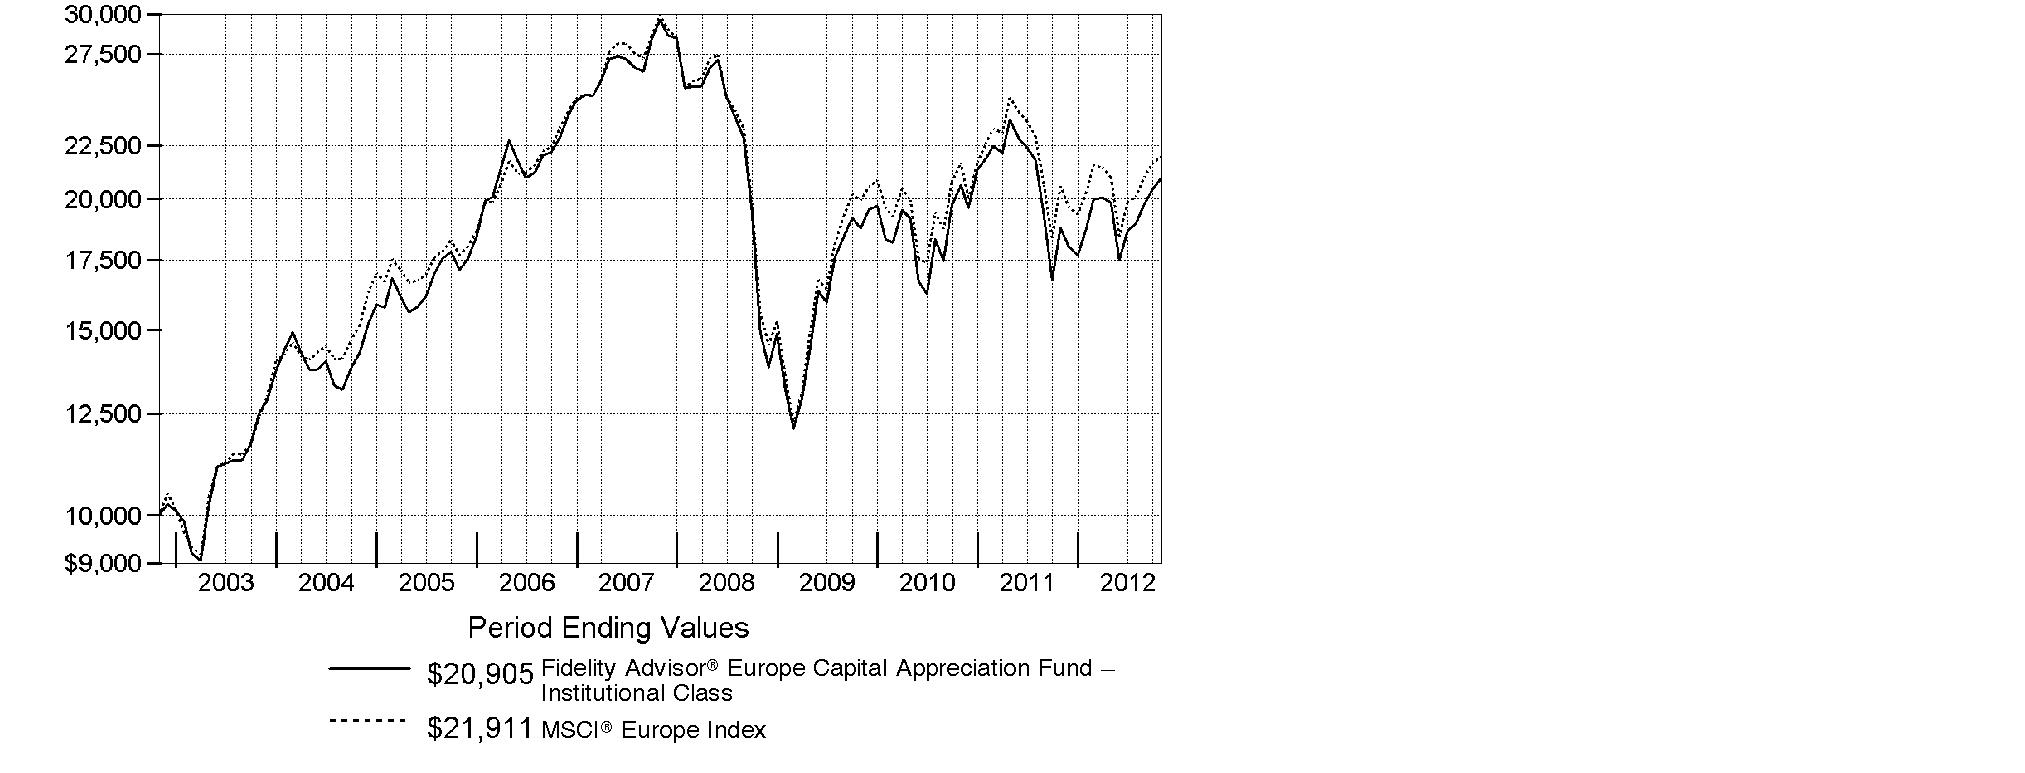
Annual Report
Market Recap: International stocks experienced pendulum-like swings during the 12 months ending October 31, 2012, finishing the period with a modest advance. The market faced periodic bouts of volatility this past year, as a number of macroeconomic concerns - including the eurozone debt crisis, the strength and pace of the U.S. economic recovery, and a slowdown in China's once-blistering growth - dominated headlines and weighed on investors. While a stronger U.S. dollar provided an additional head wind, foreign developed- and emerging-markets stocks still managed a gain for the 12 months, as the MSCI® ACWI® (All Country World Index) ex USA Index rose 4.11%, largely buttressed in the summertime by pledges of accommodative monetary action from eurozone officials, as well as signs that the U.S. housing market was on the mend. Within the index, Asia-Pacific ex Japan showed the most impressive gains, advancing roughly 11%. A number of core European components, most notably Germany (+11%), Switzerland (+10%) and the U.K. (+9%), benefited from optimism about the eurozone's ability to resolve its debt woes, which also helped the region outpace the index overall. Elsewhere, results from Canada (+3%) and the generally more volatile emerging markets (+2%) each fell short of the MSCI index, while Japan was among the few benchmark constituents to finish in the red, returning about -3%.
Comments from Melissa Reilly, Portfolio Manager of Fidelity Advisor® Europe Capital Appreciation Fund: For the year, the fund's Institutional Class shares rose 11.41%, outperforming the 6.48% gain of the MSCI® Europe Index. Stock selection overall was beneficial, particularly in the consumer durables/apparel and media groups within consumer discretionary. Positioning in information technology, mostly within technology hardware/equipment, was additive. Stock selection in Spain, France and the U.K. also helped. Individual contributors included: an out-of-index position in U.K. marketing services company Aegis Group, which was sold; Spanish blood plasma developer Grifols; not owning index component Telefonica, a Spanish telecommunication firm, for most of the period; and an out-of-benchmark stake in U.K. homebuilder Barratt Developments. Conversely, positioning in the food/beverage/tobacco and household/personal products segments of consumer staples hurt, as did positioning in the insurance area of financials. Also detrimental was a slight average overweighting among banks, despite strong picks in this group. Out-of-index picks in the U.S. and positioning in Belgium and Switzerland were negative. On an individual basis, untimely ownership of Anglo American, a U.K. mining company, detracted. The stock was sold by period end. The fund also was hurt by underweighting two solidly performing index components, Belgian brewer Anheuser-Busch InBev, and Swiss pharmaceutical giant Roche Holding.
The views expressed above reflect those of the portfolio manager(s) only through the end of the period as stated on the cover of this report and do not necessarily represent the views of Fidelity or any other person in the Fidelity organization. Any such views are subject to change at any time based upon market or other conditions and Fidelity disclaims any responsibility to update such views. These views may not be relied on as investment advice and, because investment decisions for a Fidelity fund are based on numerous factors, may not be relied on as an indication of trading intent on behalf of any Fidelity fund.
Annual Report
Shareholder Expense Example
As a shareholder of the Fund, you incur two types of costs: (1) transaction costs, including sales charges (loads) on purchase payments or redemption proceeds, redemption fees and (2) ongoing costs, including management fees, distribution and/or service (12b-1) fees and other Fund expenses. This Example is intended to help you understand your ongoing costs (in dollars) of investing in the Fund and to compare these costs with the ongoing costs of investing in other mutual funds.
The Example is based on an investment of $1,000 invested at the beginning of the period and held for the entire period (May 1, 2012 to October 31, 2012).
Actual Expenses
The first line of the accompanying table for each class of the Fund provides information about actual account values and actual expenses. You may use the information in this line, together with the amount you invested, to estimate the expenses that you paid over the period. Simply divide your account value by $1,000.00 (for example, an $8,600 account value divided by $1,000.00 = 8.6), then multiply the result by the number in the first line for a class of the Fund under the heading entitled "Expenses Paid During Period" to estimate the expenses you paid on your account during this period. In addition, the Fund, as a shareholder in the underlying Fidelity Central Funds, will indirectly bear its pro-rata share of the fees and expenses incurred by the underlying Fidelity Central Funds. These fees and expenses are not included in the Fund's annualized expense ratio used to calculate the expense estimate in the table below.
Hypothetical Example for Comparison Purposes
The second line of the accompanying table for each class of the Fund provides information about hypothetical account values and hypothetical expenses based on a Class' actual expense ratio and an assumed rate of return of 5% per year before expenses, which is not the Class' actual return. The hypothetical account values and expenses may not be used to estimate the actual ending account balance or expenses you paid for the period. You may use this information to compare the ongoing costs of investing in the Fund and other funds. To do so, compare this 5% hypothetical example with the 5% hypothetical examples that appear in the shareholder reports of the other funds. In addition, the Fund, as a shareholder in the underlying Fidelity Central Funds, will indirectly bear its pro-rata share of the fees and expenses incurred by the underlying Fidelity Central Funds. These fees and expenses are not included in the Fund's annualized expense ratio used to calculate the expense estimate in the table below.
Please note that the expenses shown in the table are meant to highlight your ongoing costs only and do not reflect any transaction costs. Therefore, the second line of the table is useful in comparing ongoing costs only, and will not help you determine the relative total costs of owning different funds. In addition, if these transactional costs were included, your costs would have been higher.
Annual Report
Shareholder Expense Example - continued
| Annualized
Expense Ratio | Beginning
Account Value
May 1, 2012 | Ending
Account Value
October 31, 2012 | Expenses Paid
During Period*
May 1, 2012
to October 31, 2012 |
Class A | 1.45% | | | |
Actual | | $ 1,000.00 | $ 1,052.60 | $ 7.48 |
HypotheticalA | | $ 1,000.00 | $ 1,017.85 | $ 7.35 |
Class T | 1.70% | | | |
Actual | | $ 1,000.00 | $ 1,051.00 | $ 8.76 |
HypotheticalA | | $ 1,000.00 | $ 1,016.59 | $ 8.62 |
Class B | 2.20% | | | |
Actual | | $ 1,000.00 | $ 1,048.60 | $ 11.33 |
HypotheticalA | | $ 1,000.00 | $ 1,014.08 | $ 11.14 |
Class C | 2.20% | | | |
Actual | | $ 1,000.00 | $ 1,048.90 | $ 11.33 |
HypotheticalA | | $ 1,000.00 | $ 1,014.08 | $ 11.14 |
Institutional Class | 1.20% | | | |
Actual | | $ 1,000.00 | $ 1,054.40 | $ 6.20 |
HypotheticalA | | $ 1,000.00 | $ 1,019.10 | $ 6.09 |
A 5% return per year before expenses
* Expenses are equal to each Class' annualized expense ratio, multiplied by the average account value over the period, multiplied by 184/366 (to reflect the one-half year period).
Annual Report
Investment Changes (Unaudited)
Top Five Stocks as of October 31, 2012 |
| % of fund's
net assets | % of fund's net assets
6 months ago |
Nestle SA (Switzerland, Food Products) | 3.6 | 3.6 |
Royal Dutch Shell PLC Class A (United Kingdom) (United Kingdom, Oil, Gas & Consumable Fuels) | 3.5 | 3.7 |
Sanofi SA (France, Pharmaceuticals) | 3.1 | 2.5 |
HSBC Holdings PLC (United Kingdom) (United Kingdom, Commercial Banks) | 3.1 | 2.0 |
Vodafone Group PLC (United Kingdom, Wireless Telecommunication Services) | 2.2 | 1.3 |
| 15.5 | |
Top Five Market Sectors as of October 31, 2012 |
| % of fund's
net assets | % of fund's net assets
6 months ago |
Consumer Discretionary | 17.3 | 18.6 |
Financials | 17.0 | 17.5 |
Consumer Staples | 16.7 | 14.1 |
Health Care | 11.8 | 12.1 |
Industrials | 10.0 | 9.1 |
Top Five Countries as of October 31, 2012 |
(excluding cash equivalents) | % of fund's
net assets | % of fund's net assets
6 months ago |
United Kingdom | 36.7 | 38.5 |
France | 10.7 | 13.0 |
Germany | 9.9 | 9.6 |
Switzerland | 8.1 | 7.2 |
Spain | 6.7 | 3.1 |
Percentages are adjusted for the effect of open futures contracts, if applicable. |
Asset Allocation (% of fund's net assets) |
As of October 31, 2012 | As of April 30, 2012 |
| Stocks 99.0% | | | Stocks 97.6% | |
| Short-Term
Investments and
Net Other Assets (Liabilities) 1.0% | | | Short-Term
Investments and
Net Other Assets (Liabilities) 2.4% | |

Annual Report
Investments October 31, 2012
Showing Percentage of Net Assets
Common Stocks - 97.1% |
| Shares | | Value |
Bailiwick of Jersey - 3.7% |
Experian PLC | 14,700 | | $ 253,827 |
Randgold Resources Ltd. | 1,100 | | 131,491 |
Shire PLC | 4,090 | | 115,009 |
Wolseley PLC | 3,100 | | 135,521 |
TOTAL BAILIWICK OF JERSEY | | 635,848 |
Belgium - 2.2% |
Anheuser-Busch InBev SA NV | 2,700 | | 225,804 |
KBC Groupe SA | 4,301 | | 100,959 |
UCB SA | 800 | | 46,661 |
TOTAL BELGIUM | | 373,424 |
Canada - 0.5% |
Suncor Energy, Inc. | 2,600 | | 87,261 |
Denmark - 1.7% |
Novo Nordisk A/S Series B | 1,837 | | 294,500 |
Finland - 0.8% |
Fortum Corp. | 3,700 | | 68,435 |
Sampo OYJ (A Shares) | 2,300 | | 72,084 |
TOTAL FINLAND | | 140,519 |
France - 10.7% |
Arkema SA | 1,100 | | 100,288 |
Atos Origin SA | 1,221 | | 81,994 |
BNP Paribas SA | 4,795 | | 241,206 |
Carrefour SA | 3,952 | | 95,481 |
Christian Dior SA | 700 | | 100,484 |
Credit Agricole SA (a) | 9,400 | | 70,764 |
Dassault Systemes SA | 800 | | 84,291 |
Essilor International SA | 1,241 | | 111,873 |
Eurofins Scientific SA | 700 | | 108,241 |
PPR SA | 1,100 | | 193,405 |
Sanofi SA | 6,078 | | 533,815 |
Vivendi SA | 6,898 | | 141,131 |
TOTAL FRANCE | | 1,862,973 |
Germany - 8.0% |
adidas AG | 1,400 | | 119,274 |
BASF AG | 1,560 | | 129,266 |
Bayer AG | 3,400 | | 296,100 |
Brenntag AG | 700 | | 88,226 |
Deutsche Boerse AG | 1,400 | | 75,778 |
Common Stocks - continued |
| Shares | | Value |
Germany - continued |
Fresenius Medical Care AG & Co. KGaA | 1,300 | | $ 91,344 |
GSW Immobilien AG | 2,300 | | 94,636 |
HeidelbergCement Finance AG | 2,500 | | 132,499 |
KUKA AG (a) | 1,300 | | 38,974 |
SAP AG | 2,746 | | 200,247 |
Software AG (Bearer) | 1,100 | | 44,070 |
Wirecard AG | 3,700 | | 84,549 |
TOTAL GERMANY | | 1,394,963 |
Greece - 0.2% |
Jumbo SA | 6,400 | | 42,306 |
Ireland - 1.6% |
Elan Corp. PLC (a) | 10,300 | | 112,096 |
Glanbia PLC | 7,000 | | 66,415 |
Ingersoll-Rand PLC | 2,100 | | 98,763 |
TOTAL IRELAND | | 277,274 |
Italy - 3.8% |
Brunello Cucinelli SpA | 2,000 | | 35,385 |
ENI SpA | 11,700 | | 269,228 |
Geox SpA | 22,000 | | 62,677 |
Prada SpA | 13,700 | | 111,721 |
Prysmian SpA | 5,200 | | 100,021 |
Saipem SpA | 1,723 | | 77,405 |
TOTAL ITALY | | 656,437 |
Netherlands - 4.6% |
Aalberts Industries NV | 2,800 | | 50,809 |
AEGON NV | 19,900 | | 111,294 |
ASML Holding NV (Netherlands) | 1,100 | | 60,469 |
D.E. Master Blenders 1753 NV (a) | 10,800 | | 131,991 |
Heineken NV (Bearer) | 1,500 | | 92,477 |
Koninklijke Philips Electronics NV | 4,400 | | 110,203 |
LyondellBasell Industries NV Class A | 2,100 | | 112,119 |
NXP Semiconductors NV (a) | 2,700 | | 65,502 |
Randstad Holding NV | 2,000 | | 65,287 |
TOTAL NETHERLANDS | | 800,151 |
Norway - 0.5% |
DnB NOR ASA | 6,800 | | 84,921 |
South Africa - 0.3% |
Naspers Ltd. Class N | 900 | | 58,429 |
Common Stocks - continued |
| Shares | | Value |
Spain - 6.7% |
Amadeus IT Holding SA Class A | 2,700 | | $ 66,842 |
Banco Bilbao Vizcaya Argentaria SA | 29,106 | | 243,208 |
Distribuidora Internacional de Alimentacion SA | 7,800 | | 47,214 |
Grifols SA (a) | 3,000 | | 104,055 |
Grifols SA ADR | 3,700 | | 93,092 |
Inditex SA | 2,072 | | 264,373 |
Repsol YPF SA | 8,499 | | 169,866 |
Telefonica SA | 13,177 | | 173,921 |
TOTAL SPAIN | | 1,162,571 |
Sweden - 2.4% |
H&M Hennes & Mauritz AB (B Shares) | 4,148 | | 140,395 |
Swedbank AB (A Shares) | 8,505 | | 157,716 |
Swedish Match Co. AB | 3,400 | | 115,847 |
TOTAL SWEDEN | | 413,958 |
Switzerland - 8.1% |
Actelion Ltd. | 1,224 | | 59,038 |
Adecco SA (Reg.) | 1,365 | | 66,015 |
Credit Suisse Group | 2,372 | | 55,162 |
Credit Suisse Group sponsored ADR | 1,100 | | 25,674 |
Nestle SA | 9,844 | | 624,701 |
Schindler Holding AG (participation certificate) | 1,065 | | 140,315 |
Syngenta AG (Switzerland) | 460 | | 179,349 |
UBS AG | 17,154 | | 257,372 |
TOTAL SWITZERLAND | | 1,407,626 |
United Kingdom - 36.7% |
Antofagasta PLC | 4,300 | | 87,225 |
ASOS PLC (a) | 1,100 | | 40,029 |
Barclays PLC | 53,349 | | 197,270 |
Barratt Developments PLC (a) | 63,400 | | 193,983 |
Bellway PLC | 8,300 | | 135,415 |
BG Group PLC | 6,673 | | 123,569 |
BHP Billiton PLC | 8,713 | | 279,263 |
British American Tobacco PLC (United Kingdom) | 6,500 | | 322,397 |
British Land Co. PLC | 15,396 | | 131,307 |
Ensco PLC Class A | 1,600 | | 92,512 |
Filtrona PLC | 14,000 | | 129,455 |
Hilton Food Group PLC | 9,700 | | 43,477 |
HSBC Holdings PLC (United Kingdom) | 53,700 | | 529,444 |
Intertek Group PLC | 1,900 | | 86,434 |
Kingfisher PLC | 23,500 | | 109,787 |
Common Stocks - continued |
| Shares | | Value |
United Kingdom - continued |
Lloyds Banking Group PLC (a) | 109,000 | | $ 71,777 |
Meggitt PLC | 21,600 | | 134,548 |
Michael Page International PLC | 17,600 | | 102,361 |
Next PLC | 2,800 | | 161,130 |
Old Mutual PLC | 44,012 | | 122,162 |
Persimmon PLC | 12,000 | | 153,952 |
Prudential PLC | 13,152 | | 180,624 |
Reckitt Benckiser Group PLC | 3,800 | | 229,959 |
Redrow PLC (a) | 48,900 | | 124,524 |
Rightmove PLC | 1,300 | | 33,797 |
Rolls-Royce Group PLC | 13,286 | | 183,207 |
Rolls-Royce Group PLC Class C | 1,009,736 | | 1,629 |
Royal Dutch Shell PLC Class A (United Kingdom) | 17,873 | | 613,272 |
SABMiller PLC | 5,200 | | 222,752 |
Serco Group PLC | 5,653 | | 51,679 |
Standard Chartered PLC (United Kingdom) | 5,708 | | 134,807 |
Taylor Wimpey PLC | 265,300 | | 261,586 |
Ted Baker PLC | 6,600 | | 100,969 |
Tesco PLC | 27,700 | | 142,976 |
Unilever PLC | 9,500 | | 354,380 |
Vodafone Group PLC | 137,800 | | 374,215 |
Whitbread PLC | 3,243 | | 122,985 |
TOTAL UNITED KINGDOM | | 6,380,858 |
United States of America - 4.6% |
Apple, Inc. | 115 | | 68,437 |
Beam, Inc. | 2,000 | | 111,120 |
Estee Lauder Companies, Inc. Class A | 1,130 | | 69,631 |
Freeport-McMoRan Copper & Gold, Inc. | 1,700 | | 66,096 |
Gilead Sciences, Inc. (a) | 1,000 | | 67,160 |
McGraw-Hill Companies, Inc. | 1,300 | | 71,864 |
Noble Energy, Inc. | 500 | | 47,505 |
salesforce.com, Inc. (a) | 500 | | 72,990 |
Theravance, Inc. (a) | 1,600 | | 36,016 |
Visa, Inc. Class A | 900 | | 124,884 |
Yum! Brands, Inc. | 1,000 | | 70,110 |
TOTAL UNITED STATES OF AMERICA | | 805,813 |
TOTAL COMMON STOCKS (Cost $15,551,366) |
16,879,832
|
Nonconvertible Preferred Stocks - 1.9% |
| Shares | | Value |
Germany - 1.9% |
Porsche Automobil Holding SE (Germany) | 1,600 | | $ 106,222 |
ProSiebenSat.1 Media AG | 2,800 | | 78,028 |
Volkswagen AG | 700 | | 144,806 |
TOTAL NONCONVERTIBLE PREFERRED STOCKS (Cost $279,312) |
329,056
|
Money Market Funds - 1.3% |
| | | |
Fidelity Cash Central Fund, 0.19% (b)
(Cost $220,653) | 220,653 | |
220,653
|
TOTAL INVESTMENT PORTFOLIO - 100.3% (Cost $16,051,331) | | 17,429,541 |
NET OTHER ASSETS (LIABILITIES) - (0.3)% | | (49,067) |
NET ASSETS - 100% | $ 17,380,474 |
Legend |
(a) Non-income producing |
(b) Affiliated fund that is available only to investment companies and other accounts managed by Fidelity Investments. The rate quoted is the annualized seven-day yield of the fund at period end. A complete unaudited listing of the fund's holdings as of its most recent quarter end is available upon request. In addition, each Fidelity Central Fund's financial statements, which are not covered by the Fund's Report of Independent Registered Public Accounting Firm, are available on the SEC's website or upon request. |
Affiliated Central Funds |
Information regarding fiscal year to date income earned by the Fund from investments in Fidelity Central Funds is as follows: |
Fund | Income earned |
Fidelity Cash Central Fund | $ 509 |
Fidelity Securities Lending Cash Central Fund | 10,194 |
Total | $ 10,703 |
Other Information |
Categorizations in the Schedule of Investments are based on country or territory of incorporation. |
The following is a summary of the inputs used, as of October 31, 2012, involving the Fund's assets and liabilities carried at fair value. The inputs or methodology used for valuing securities may not be an indication of the risk associated with investing in those securities. For more information on valuation inputs, and their aggregation into the levels used in the tables below, please refer to the Security Valuation section in the accompanying Notes to Financial Statements. |
Valuation Inputs at Reporting Date: |
Description | Total | Level 1 | Level 2 | Level 3 |
Investments in Securities: | | | | |
Equities: | | | | |
Consumer Discretionary | $ 3,037,636 | $ 3,037,636 | $ - | $ - |
Consumer Staples | 2,896,622 | 1,994,041 | 902,581 | - |
Energy | 1,480,618 | 598,118 | 882,500 | - |
Financials | 2,958,165 | 1,312,014 | 1,646,151 | - |
Health Care | 2,069,000 | 922,236 | 1,146,764 | - |
Industrials | 1,707,819 | 1,597,616 | 110,203 | - |
Information Technology | 954,275 | 693,559 | 260,716 | - |
Materials | 1,347,051 | 756,948 | 590,103 | - |
Telecommunication Services | 689,267 | 141,131 | 548,136 | - |
Utilities | 68,435 | 68,435 | - | - |
Money Market Funds | 220,653 | 220,653 | - | - |
Total Investments in Securities: | $ 17,429,541 | $ 11,342,387 | $ 6,087,154 | $ - |
The following is a summary of transfers between Level 1 and Level 2 for the period ended October 31, 2012. Transfers are assumed to have occurred at the beginning of the period, and are primarily attributable to the valuation techniques used for foreign equity securities, as discussed in the accompanying Notes to Financial Statements: |
Transfers | Total |
Level 1 to Level 2 | $ 0 |
Level 2 to Level 1 | $ 179,447 |
See accompanying notes which are an integral part of the financial statements.
Annual Report
Statement of Assets and Liabilities
| October 31, 2012 |
| | |
Assets | | |
Investment in securities, at value - See accompanying schedule: Unaffiliated issuers (cost $15,830,678) | $ 17,208,888 | |
Fidelity Central Funds (cost $220,653) | 220,653 | |
Total Investments (cost $16,051,331) | | $ 17,429,541 |
Foreign currency held at value (cost $368) | | 368 |
Receivable for investments sold | | 162,992 |
Receivable for fund shares sold | | 53,301 |
Dividends receivable | | 27,810 |
Distributions receivable from Fidelity Central Funds | | 72 |
Receivable from investment adviser for expense reductions | | 5,035 |
Other receivables | | 1,130 |
Total assets | | 17,680,249 |
| | |
Liabilities | | |
Payable for investments purchased | $ 192,567 | |
Payable for fund shares redeemed | 46,198 | |
Accrued management fee | 10,203 | |
Distribution and service plan fees payable | 6,776 | |
Other affiliated payables | 5,008 | |
Audit fees payable | 34,782 | |
Custodian fees payable | 4,241 | |
Total liabilities | | 299,775 |
| | |
Net Assets | | $ 17,380,474 |
Net Assets consist of: | | |
Paid in capital | | $ 34,355,184 |
Undistributed net investment income | | 239,630 |
Accumulated undistributed net realized gain (loss) on investments and foreign currency transactions | | (18,592,421) |
Net unrealized appreciation (depreciation) on investments and assets and liabilities in foreign currencies | | 1,378,081 |
Net Assets | | $ 17,380,474 |
See accompanying notes which are an integral part of the financial statements.
Annual Report
Financial Statements - continued
Statement of Assets and Liabilities - continued
| October 31, 2012 |
| | |
Calculation of Maximum Offering Price Class A:
Net Asset Value and redemption price per share ($7,869,601 ÷ 678,502 shares) | | $ 11.60 |
| | |
Maximum offering price per share (100/94.25 of $11.60) | | $ 12.31 |
Class T:
Net Asset Value and redemption price per share ($5,835,260 ÷ 505,212 shares) | | $ 11.55 |
| | |
Maximum offering price per share (100/96.50 of $11.55) | | $ 11.97 |
Class B:
Net Asset Value and offering price per share($786,424 ÷ 70,003 shares)A | | $ 11.23 |
| | |
Class C:
Net Asset Value and offering price per share ($2,450,433 ÷ 219,641 shares)A | | $ 11.16 |
| | |
Institutional Class:
Net Asset Value, offering price and redemption price per share ($438,756 ÷ 37,096 shares) | | $ 11.83 |
A Redemption price per share is equal to net asset value less any applicable contingent deferred sales charge.
See accompanying notes which are an integral part of the financial statements.
Annual Report
Statement of Operations
| Year ended October 31, 2012 |
| | |
Investment Income | | |
Dividends | | $ 567,545 |
Income from Fidelity Central Funds | | 10,703 |
Income before foreign taxes withheld | | 578,248 |
Less foreign taxes withheld | | (40,953) |
Total income | | 537,295 |
| | |
Expenses | | |
Management fee | $ 120,600 | |
Transfer agent fees | 53,393 | |
Distribution and service plan fees | 80,124 | |
Accounting and security lending fees | 8,882 | |
Custodian fees and expenses | 22,076 | |
Independent trustees' compensation | 112 | |
Registration fees | 57,224 | |
Audit | 49,461 | |
Legal | 112 | |
Miscellaneous | 174 | |
Total expenses before reductions | 392,158 | |
Expense reductions | (113,910) | 278,248 |
Net investment income (loss) | | 259,047 |
Realized and Unrealized Gain (Loss) Net realized gain (loss) on: | | |
Investment securities: | | |
Unaffiliated issuers | (879,913) | |
Foreign currency transactions | (4,711) | |
Total net realized gain (loss) | | (884,624) |
Change in net unrealized appreciation (depreciation) on: Investment securities | 2,358,451 | |
Assets and liabilities in foreign currencies | (132) | |
Total change in net unrealized appreciation (depreciation) | | 2,358,319 |
Net gain (loss) | | 1,473,695 |
Net increase (decrease) in net assets resulting from operations | | $ 1,732,742 |
See accompanying notes which are an integral part of the financial statements.
Annual Report
Financial Statements - continued
Statement of Changes in Net Assets
| Year ended
October 31,
2012 | Year ended
October 31,
2011 |
Increase (Decrease) in Net Assets | | |
Operations | | |
Net investment income (loss) | $ 259,047 | $ 207,981 |
Net realized gain (loss) | (884,624) | 1,827,999 |
Change in net unrealized appreciation (depreciation) | 2,358,319 | (3,861,503) |
Net increase (decrease) in net assets resulting
from operations | 1,732,742 | (1,825,523) |
Distributions to shareholders from net investment income | (221,435) | (69,262) |
Share transactions - net increase (decrease) | (2,112,308) | (3,369,781) |
Redemption fees | 35,973 | 300 |
Total increase (decrease) in net assets | (565,028) | (5,264,266) |
| | |
Net Assets | | |
Beginning of period | 17,945,502 | 23,209,768 |
End of period (including undistributed net investment income of $239,630 and undistributed net investment income of $204,426, respectively) | $ 17,380,474 | $ 17,945,502 |
See accompanying notes which are an integral part of the financial statements.
Annual Report
Financial Highlights - Class A
Years ended October 31, | 2012 | 2011 | 2010 | 2009 | 2008 |
Selected Per-Share Data | | | | | |
Net asset value, beginning of period | $ 10.61 | $ 11.74 | $ 10.82 | $ 8.98 | $ 20.94 |
Income from Investment Operations | | | | | |
Net investment income (loss) C | .18 | .14 | .06 | .15 | .25 |
Net realized and unrealized gain (loss) | .96 | (1.21) | .99 | 1.99 | (9.22) |
Total from investment operations | 1.14 | (1.07) | 1.05 | 2.14 | (8.97) |
Distributions from net investment income | (.17) | (.06) | (.13) | (.30) | (.31) |
Distributions from net realized gain | - | - | - | - | (2.68) |
Total distributions | (.17) | (.06) | (.13) | (.30) | (2.99) |
Redemption fees added to paid in capital C | .02 | - G | - G | - G | - G |
Net asset value, end of period | $ 11.60 | $ 10.61 | $ 11.74 | $ 10.82 | $ 8.98 |
Total Return A, B | 11.14% | (9.19)% | 9.74% | 25.27% | (49.77)% |
Ratios to Average Net Assets D, F | | | | | |
Expenses before reductions | 2.07% | 2.00% | 2.05% | 2.00% | 1.63% |
Expenses net of fee waivers, if any | 1.45% | 1.45% | 1.50% | 1.50% | 1.50% |
Expenses net of all reductions | 1.42% | 1.41% | 1.43% | 1.46% | 1.46% |
Net investment income (loss) | 1.74% | 1.18% | .61% | 1.73% | 1.65% |
Supplemental Data | | | | | |
Net assets, end of period (000 omitted) | $ 7,870 | $ 8,025 | $ 10,276 | $ 10,904 | $ 10,286 |
Portfolio turnover rate E | 108% | 118% | 143% | 109% | 112% |
A Total returns would have been lower if certain expenses had not been reduced during the applicable periods shown.
B Total returns do not include the effect of the sales charges.
C Calculated based on average shares outstanding during the period.
D Fees and expenses of any underlying Fidelity Central Funds are not included in the Fund's expense ratio. The Fund indirectly bears its proportionate share of the expenses of any underlying Fidelity Central Funds.
E Amount does not include the portfolio activity of any underlying Fidelity Central Funds.
F Expense ratios reflect operating expenses of the class. Expenses before reductions do not reflect amounts reimbursed by the investment adviser or reductions from brokerage service arrangements or reductions from other expense offset arrangements and do not represent the amount paid by the class during periods when reimbursements or reductions occur. Expenses net of fee waivers reflect expenses after reimbursement by the investment adviser but prior to reductions from brokerage service arrangements or other expense offset arrangements. Expenses net of all reductions represent the net expenses paid by the class.
G Amount represents less than $.01 per share.
See accompanying notes which are an integral part of the financial statements.
Annual Report
Financial Highlights - Class T
Years ended October 31, | 2012 | 2011 | 2010 | 2009 | 2008 |
Selected Per-Share Data | | | | | |
Net asset value, beginning of period | $ 10.56 | $ 11.68 | $ 10.78 | $ 8.92 | $ 20.75 |
Income from Investment Operations | | | | | |
Net investment income (loss) C | .16 | .11 | .04 | .13 | .21 |
Net realized and unrealized gain (loss) | .94 | (1.20) | .97 | 1.99 | (9.17) |
Total from investment operations | 1.10 | (1.09) | 1.01 | 2.12 | (8.96) |
Distributions from net investment income | (.13) | (.03) | (.11) | (.26) | (.19) |
Distributions from net realized gain | - | - | - | - | (2.68) |
Total distributions | (.13) | (.03) | (.11) | (.26) | (2.87) |
Redemption fees added to paid in capital C | .02 | - G | - G | - G | - G |
Net asset value, end of period | $ 11.55 | $ 10.56 | $ 11.68 | $ 10.78 | $ 8.92 |
Total Return A, B | 10.82% | (9.38)% | 9.42% | 24.99% | (49.91)% |
Ratios to Average Net Assets D, F | | | | | |
Expenses before reductions | 2.36% | 2.27% | 2.34% | 2.28% | 1.88% |
Expenses net of fee waivers, if any | 1.70% | 1.70% | 1.75% | 1.75% | 1.75% |
Expenses net of all reductions | 1.66% | 1.66% | 1.67% | 1.71% | 1.71% |
Net investment income (loss) | 1.49% | .93% | .36% | 1.48% | 1.40% |
Supplemental Data | | | | | |
Net assets, end of period (000 omitted) | $ 5,835 | $ 5,965 | $ 7,496 | $ 8,014 | $ 7,866 |
Portfolio turnover rate E | 108% | 118% | 143% | 109% | 112% |
A Total returns would have been lower if certain expenses had not been reduced during the applicable periods shown.
B Total returns do not include the effect of the sales charges.
C Calculated based on average shares outstanding during the period.
D Fees and expenses of any underlying Fidelity Central Funds are not included in the Fund's expense ratio. The Fund indirectly bears its proportionate share of the expenses of any underlying Fidelity Central Funds.
E Amount does not include the portfolio activity of any underlying Fidelity Central Funds.
F Expense ratios reflect operating expenses of the class. Expenses before reductions do not reflect amounts reimbursed by the investment adviser or reductions from brokerage service arrangements or reductions from other expense offset arrangements and do not represent the amount paid by the class during periods when reimbursements or reductions occur. Expenses net of fee waivers reflect expenses after reimbursement by the investment adviser but prior to reductions from brokerage service arrangements or other expense offset arrangements. Expenses net of all reductions represent the net expenses paid by the class.
G Amount represents less than $.01 per share.
See accompanying notes which are an integral part of the financial statements.
Annual Report
Financial Highlights - Class B
Years ended October 31, | 2012 | 2011 | 2010 | 2009 | 2008 |
Selected Per-Share Data | | | | | |
Net asset value, beginning of period | $ 10.23 | $ 11.35 | $ 10.48 | $ 8.61 | $ 20.16 |
Income from Investment Operations | | | | | |
Net investment income (loss) C | .10 | .05 | (.01) | .08 | .13 |
Net realized and unrealized gain (loss) | .92 | (1.17) | .94 | 1.95 | (8.86) |
Total from investment operations | 1.02 | (1.12) | .93 | 2.03 | (8.73) |
Distributions from net investment income | (.04) | - | (.06) | (.16) | (.14) |
Distributions from net realized gain | - | - | - | - | (2.68) |
Total distributions | (.04) | - | (.06) | (.16) | (2.82) |
Redemption fees added to paid in capital C | .02 | - G | - G | - G | - G |
Net asset value, end of period | $ 11.23 | $ 10.23 | $ 11.35 | $ 10.48 | $ 8.61 |
Total Return A, B | 10.26% | (9.87)% | 8.87% | 24.34% | (50.13)% |
Ratios to Average Net Assets D, F | | | | | |
Expenses before reductions | 2.89% | 2.78% | 2.82% | 2.77% | 2.39% |
Expenses net of fee waivers, if any | 2.20% | 2.20% | 2.25% | 2.25% | 2.25% |
Expenses net of all reductions | 2.16% | 2.16% | 2.18% | 2.21% | 2.21% |
Net investment income (loss) | .99% | .43% | (.14)% | .98% | .90% |
Supplemental Data | | | | | |
Net assets, end of period (000 omitted) | $ 786 | $ 1,136 | $ 1,935 | $ 2,490 | $ 2,806 |
Portfolio turnover rate E | 108% | 118% | 143% | 109% | 112% |
A Total returns would have been lower if certain expenses had not been reduced during the applicable periods shown.
B Total returns do not include the effect of the contingent deferred sales charge.
C Calculated based on average shares outstanding during the period.
D Fees and expenses of any underlying Fidelity Central Funds are not included in the Fund's expense ratio. The Fund indirectly bears its proportionate share of the expenses of any underlying Fidelity Central Funds.
E Amount does not include the portfolio activity of any underlying Fidelity Central Funds.
F Expense ratios reflect operating expenses of the class. Expenses before reductions do not reflect amounts reimbursed by the investment adviser or reductions from brokerage service arrangements or reductions from other expense offset arrangements and do not represent the amount paid by the class during periods when reimbursements or reductions occur. Expenses net of fee waivers reflect expenses after reimbursement by the investment adviser but prior to reductions from brokerage service arrangements or other expense offset arrangements. Expenses net of all reductions represent the net expenses paid by the class.
G Amount represents less than $.01 per share.
See accompanying notes which are an integral part of the financial statements.
Annual Report
Financial Highlights - Class C
Years ended October 31, | 2012 | 2011 | 2010 | 2009 | 2008 |
Selected Per-Share Data | | | | | |
Net asset value, beginning of period | $ 10.18 | $ 11.30 | $ 10.43 | $ 8.58 | $ 20.10 |
Income from Investment Operations | | | | | |
Net investment income (loss) C | .10 | .05 | (.01) | .08 | .13 |
Net realized and unrealized gain (loss) | .92 | (1.17) | .94 | 1.94 | (8.82) |
Total from investment operations | 1.02 | (1.12) | .93 | 2.02 | (8.69) |
Distributions from net investment income | (.06) | - | (.06) | (.17) | (.15) |
Distributions from net realized gain | - | - | - | - | (2.68) |
Total distributions | (.06) | - | (.06) | (.17) | (2.83) |
Redemption fees added to paid in capital C | .02 | - G | - G | - G | - G |
Net asset value, end of period | $ 11.16 | $ 10.18 | $ 11.30 | $ 10.43 | $ 8.58 |
Total Return A, B | 10.33% | (9.91)% | 8.92% | 24.29% | (50.11)% |
Ratios to Average Net Assets D, F | | | | | |
Expenses before reductions | 2.83% | 2.75% | 2.82% | 2.77% | 2.38% |
Expenses net of fee waivers, if any | 2.20% | 2.20% | 2.25% | 2.25% | 2.25% |
Expenses net of all reductions | 2.16% | 2.16% | 2.18% | 2.21% | 2.21% |
Net investment income (loss) | 1.00% | .43% | (.14)% | .98% | .90% |
Supplemental Data | | | | | |
Net assets, end of period (000 omitted) | $ 2,450 | $ 2,524 | $ 3,166 | $ 3,913 | $ 4,522 |
Portfolio turnover rate E | 108% | 118% | 143% | 109% | 112% |
A Total returns would have been lower if certain expenses had not been reduced during the applicable periods shown.
B Total returns do not include the effect of the contingent deferred sales charge.
C Calculated based on average shares outstanding during the period.
D Fees and expenses of any underlying Fidelity Central Funds are not included in the Fund's expense ratio. The Fund indirectly bears its proportionate share of the expenses of any underlying Fidelity Central Funds.
E Amount does not include the portfolio activity of any underlying Fidelity Central Funds.
F Expense ratios reflect operating expenses of the class. Expenses before reductions do not reflect amounts reimbursed by the investment adviser or reductions from brokerage service arrangements or reductions from other expense offset arrangements and do not represent the amount paid by the class during periods when reimbursements or reductions occur. Expenses net of fee waivers reflect expenses after reimbursement by the investment adviser but prior to reductions from brokerage service arrangements or other expense offset arrangements. Expenses net of all reductions represent the net expenses paid by the class.
G Amount represents less than $.01 per share.
See accompanying notes which are an integral part of the financial statements.
Annual Report
Financial Highlights - Institutional Class
Years ended October 31, | 2012 | 2011 | 2010 | 2009 | 2008 |
Selected Per-Share Data | | | | | |
Net asset value, beginning of period | $ 10.83 | $ 11.98 | $ 11.03 | $ 9.13 | $ 21.27 |
Income from Investment Operations | | | | | |
Net investment income (loss) B | .22 | .18 | .09 | .18 | .30 |
Net realized and unrealized gain (loss) | .96 | (1.24) | 1.01 | 2.03 | (9.38) |
Total from investment operations | 1.18 | (1.06) | 1.10 | 2.21 | (9.08) |
Distributions from net investment income | (.20) | (.09) | (.15) | (.31) | (.38) |
Distributions from net realized gain | - | - | - | - | (2.68) |
Total distributions | (.20) | (.09) | (.15) | (.31) | (3.06) |
Redemption fees added to paid in capital B | .02 | - F | - F | - F | - F |
Net asset value, end of period | $ 11.83 | $ 10.83 | $ 11.98 | $ 11.03 | $ 9.13 |
Total Return A | 11.41% | (8.95)% | 10.00% | 25.57% | (49.63)% |
Ratios to Average Net Assets C, E | | | | | |
Expenses before reductions | 1.60% | 1.54% | 1.80% | 1.68% | 1.27% |
Expenses net of fee waivers, if any | 1.20% | 1.20% | 1.25% | 1.25% | 1.25% |
Expenses net of all reductions | 1.16% | 1.16% | 1.17% | 1.21% | 1.21% |
Net investment income (loss) | 2.00% | 1.43% | .86% | 1.98% | 1.90% |
Supplemental Data | | | | | |
Net assets, end of period (000 omitted) | $ 439 | $ 296 | $ 336 | $ 434 | $ 378 |
Portfolio turnover rate D | 108% | 118% | 143% | 109% | 112% |
A Total returns would have been lower if certain expenses had not been reduced during the applicable periods shown.
B Calculated based on average shares outstanding during the period.
C Fees and expenses of any underlying Fidelity Central Funds are not included in the Fund's expense ratio. The Fund indirectly bears its proportionate share of the expenses of any underlying Fidelity Central Funds.
D Amount does not include the portfolio activity of any underlying Fidelity Central Funds.
E Expense ratios reflect operating expenses of the class. Expenses before reductions do not reflect amounts reimbursed by the investment adviser or reductions from brokerage service arrangements or reductions from other expense offset arrangements and do not represent the amount paid by the class during periods when reimbursements or reductions occur. Expenses net of fee waivers reflect expenses after reimbursement by the investment adviser but prior to reductions from brokerage service arrangements or other expense offset arrangements. Expenses net of all reductions represent the net expenses paid by the class.
F Amount represents less than $.01 per share.
See accompanying notes which are an integral part of the financial statements.
Annual Report
Notes to Financial Statements
For the period ended October 31, 2012
1. Organization.
Fidelity Advisor® Europe Capital Appreciation Fund (the Fund) is a fund of Fidelity Advisor Series VIII (the Trust) and is authorized to issue an unlimited number of shares. The Trust is registered under the Investment Company Act of 1940, as amended (the 1940 Act), as an open-end management investment company organized as a Massachusetts business trust. The Fund offers Class A, Class T, Class C and Institutional Class shares, each of which, along with Class B shares, has equal rights as to assets and voting privileges. Effective after the close of business on September 1, 2010, Class B shares were closed to new accounts and additional purchases, except for exchanges and reinvestments. Each class has exclusive voting rights with respect to matters that affect that class. Class B shares will automatically convert to Class A shares after a holding period of seven years from the initial date of purchase. Investment income, realized and unrealized capital gains and losses, the common expenses of the Fund, and certain fund-level expense reductions, if any, are allocated on a pro-rata basis to each class based on the relative net assets of each class to the total net assets of the Fund. Each class differs with respect to transfer agent and distribution and service plan fees incurred. Certain expense reductions may also differ by class.
2. Investments in Fidelity Central Funds.
The Fund invests in Fidelity Central Funds, which are open-end investment companies available only to other investment companies and accounts managed by Fidelity Management & Research Company (FMR) and its affiliates. The Fund's Schedule of Investments lists each of the Fidelity Central Funds held as of period end, if any, as an investment of the Fund, but does not include the underlying holdings of each Fidelity Central Fund. As an Investing Fund, the Fund indirectly bears its proportionate share of the expenses of the underlying Fidelity Central Funds.
The Money Market Central Funds seek preservation of capital and current income and are managed by Fidelity Investments Money Management, Inc. (FIMM), an affiliate of FMR.
A complete unaudited list of holdings for each Fidelity Central Fund is available upon request or at the Securities and Exchange Commission (the SEC) web site at www.sec.gov. In addition, the financial statements of the Fidelity Central Funds, which are not covered by the Fund's Report of Independent Registered Public Accounting Firm, are available on the SEC web site or upon request.
3. Significant Accounting Policies.
The financial statements have been prepared in conformity with accounting principles generally accepted in the United States of America (GAAP), which require management to make certain estimates and assumptions at the date of the financial statements.
Annual Report
Notes to Financial Statements - continued
3. Significant Accounting Policies - continued
Actual results could differ from those estimates. Subsequent events, if any, through the date that the financial statements were issued have been evaluated in the preparation of the financial statements. The following summarizes the significant accounting policies of the Fund:
Security Valuation. Investments are valued as of 4:00 p.m. Eastern time on the last calendar day of the period. In accordance with valuation policies and procedures approved by the Board of Trustees (the Board), the Fund attempts to obtain prices from one or more third party pricing vendors or brokers to value its investments. When current market prices, quotations or rates are not readily available or reliable, securities will be fair valued in good faith by the FMR Fair Value Committee (the Committee), in accordance with procedures adopted by the Fund's Board. Factors used in determining fair value vary by security type and may include market or security specific events. The frequency with which these procedures are used cannot be predicted and they may be utilized to a significant extent. The Committee oversees the Fund's valuation policies and procedures and is responsible for approving and reporting to the Board all fair value determinations.
The Fund categorizes the inputs to valuation techniques used to value its investments into a disclosure hierarchy consisting of three levels as shown below:
Level 1 - quoted prices in active markets for identical investments
Level 2 - other significant observable inputs (including quoted prices for similar investments, interest rates, prepayment speeds, etc.)
Level 3 - unobservable inputs (including the Fund's own assumptions based on the best information available)
Valuation techniques used to value the Fund's investments by major category are as follows:
Equity securities, including restricted securities, for which market quotations are readily available, are valued at the last reported sale price or official closing price as reported by a third party pricing vendor on the primary market or exchange on which they are traded and are categorized as Level 1 in the hierarchy. In the event there were no sales during the day or closing prices are not available, securities are valued at the last quoted bid price or may be valued using the last available price and are generally categorized as Level 2 in the hierarchy. For foreign equity securities, when significant market or security specific events arise, comparisons to the valuation of American Depositary Receipts (ADRs), futures contracts, Exchange-Traded Funds (ETFs) and certain indexes as well as quoted prices for similar securities are used and are categorized as Level 2 in the hierarchy. Utilizing these techniques may result in transfers between Level 1 and Level 2.
Annual Report
3. Significant Accounting Policies - continued
Security Valuation - continued
Investments in open-end mutual funds, including the Fidelity Central Funds, are valued at their closing net asset value (NAV) each business day and are categorized as Level 1 in the hierarchy.
Changes in valuation techniques may result in transfers in or out of an assigned level within the disclosure hierarchy. The aggregate value of investments by input level, as of October 31, 2012, including information on transfers between Levels 1 and 2, is included at the end of the Fund's Schedule of Investments.
Foreign Currency Translation. The Fund may use foreign currency contracts to facilitate transactions in foreign-denominated securities. Gains and losses from these transactions may arise from changes in the value of the foreign currency or if the counterparties do not perform under the contracts' terms.
Foreign-denominated assets, including investment securities, and liabilities are translated into U.S. dollars at the exchange rates at period end. Purchases and sales of investment securities, income and dividends received and expenses denominated in foreign currencies are translated into U.S. dollars at the exchange rate in effect on the transaction date.
The effects of exchange rate fluctuations on investments are included with the net realized and unrealized gain (loss) on investment securities. Other foreign currency transactions resulting in realized and unrealized gain (loss) are disclosed separately.
Investment Transactions and Income. For financial reporting purposes, the Fund's investment holdings and NAV include trades executed through the end of the last business day of the period. The NAV per share for processing shareholder transactions is calculated as of the close of business of the New York Stock Exchange (NYSE), normally 4:00 p.m. Eastern time and includes trades executed through the end of the prior business day. Gains and losses on securities sold are determined on the basis of identified cost. Dividend income is recorded on the ex-dividend date, except for certain dividends from foreign securities where the ex-dividend date may have passed, which are recorded as soon as the Fund is informed of the ex-dividend date. Non-cash dividends included in dividend income, if any, are recorded at the fair market value of the securities received. Distributions received on securities that represent a return of capital or capital gain are recorded as a reduction of cost of investments and/or as a realized gain. The Fund estimates the components of distributions received that may be considered return of capital distributions or capital gain distributions. Interest income and distributions from the Fidelity Central Funds are accrued as earned. Investment income is recorded net of foreign taxes withheld where recovery of such taxes is uncertain.
Annual Report
Notes to Financial Statements - continued
3. Significant Accounting Policies - continued
Expenses. Expenses directly attributable to a fund are charged to that fund. Expenses attributable to more than one fund are allocated among the respective funds on the basis of relative net assets or other appropriate methods. Expense estimates are accrued in the period to which they relate and adjustments are made when actual amounts are known.
Income Tax Information and Distributions to Shareholders. Each year, the Fund intends to qualify as a regulated investment company under Subchapter M of the Internal Revenue Code, including distributing substantially all of its taxable income and realized gains. As a result, no provision for income taxes is required. As of October 31, 2012, the Fund did not have any unrecognized tax benefits in the financial statements; nor is the Fund aware of any tax positions for which it is reasonably possible that the total amounts of unrecognized tax benefits will significantly change in the next twelve months. The Fund files a U.S. federal tax return, in addition to state and local tax returns as required. A fund's federal income tax returns are subject to examination by the Internal Revenue Service (IRS) for a period of three fiscal years after they are filed. State and local tax returns may be subject to examination for an additional fiscal year depending on the jurisdiction. Foreign taxes are provided for based on the Fund's understanding of the tax rules and rates that exist in the foreign markets in which it invests.
Distributions are declared and recorded on the ex-dividend date. Income dividends and capital gain distributions are declared separately for each class. Income and capital gain distributions are determined in accordance with income tax regulations, which may differ from GAAP.
Capital accounts within the financial statements are adjusted for permanent book-tax differences. These adjustments have no impact on net assets or the results of operations. Temporary book-tax differences will reverse in a subsequent period.
Book-tax differences are primarily due to foreign currency transactions, passive foreign investment companies (PFIC), partnerships, capital loss carryforwards and losses deferred due to wash sales.
The federal tax cost of investment securities and unrealized appreciation (depreciation) as of period end were as follows:
Gross unrealized appreciation | $ 1,908,174 |
Gross unrealized depreciation | (661,174) |
Net unrealized appreciation (depreciation) on securities and other investments | $ 1,247,000 |
| |
Tax Cost | $ 16,182,541 |
Annual Report
3. Significant Accounting Policies - continued
Income Tax Information and Distributions to Shareholders - continued
The tax-based components of distributable earnings as of period end were as follows:
Undistributed ordinary income | $ 239,630 |
Capital loss carryforward | $ (18,461,212) |
Net unrealized appreciation (depreciation) | $ 1,246,871 |
Capital loss carryforwards are only available to offset future capital gains of the Fund to the extent provided by regulations and may be limited. Under the Regulated Investment Company Modernization Act of 2010 (the Act), the Fund is permitted to carry forward capital losses incurred in taxable years beginning after December 22, 2010 for an unlimited period and such capital losses are required to be used prior to any losses that expire. Capital loss carryforwards were as follows:
Fiscal year of expiration | |
2016 | $ (9,488,054) |
2017 | (8,044,625) |
Total with expiration | (17,532,679) |
No expiration | |
Short-term | (483,952) |
Long-term | (444,581) |
Total no expiration | (928,533) |
Total capital loss carryforward | $ (18,461,212) |
The tax character of distributions paid was as follows:
| October 31, 2012 | October 31, 2011 |
Ordinary Income | $ 221,435 | $ 69,262 |
Short-Term Trading (Redemption) Fees. Shares held by investors in the Fund less than 30 days are subject to a redemption fee equal to 1.00% of the net asset value of shares redeemed. All redemption fees, which reduce the proceeds of the shareholder redemption, are retained by the Fund and accounted for as an addition to paid in capital.
New Accounting Pronouncement. In December 2011, the Financial Accounting Standards Board issued Accounting Standard Update No. 2011-11, Disclosures about Offsetting Assets and Liabilities. The update creates new disclosure requirements requiring entities to disclose both gross and net information for derivatives and other financial instruments that are either offset in the Statement of Assets and Liabilities or subject to an enforceable master netting arrangement or similar agreement. The disclosure requirements are effective for annual reporting periods beginning on or after
Annual Report
Notes to Financial Statements - continued
3. Significant Accounting Policies - continued
New Accounting Pronouncement - continued
January 1, 2013, and interim periods within those annual periods. Management is currently evaluating the impact of the update's adoption on the Fund's financial statement disclosures.
4. Purchases and Sales of Investments.
Purchases and sales of securities, other than short-term securities, aggregated $18,203,316 and $20,130,074, respectively.
5. Fees and Other Transactions with Affiliates.
Management Fee. FMR and its affiliates provide the Fund with investment management related services for which the Fund pays a monthly management fee. The management fee is the sum of an individual fund fee rate that is based on an annual rate of .45% of the Fund's average net assets and an annualized group fee rate that averaged .26% during the period. The group fee rate is based upon the average net assets of all the mutual funds advised by FMR. The group fee rate decreases as assets under management increase and increases as assets under management decrease. For the period, the total annual management fee rate was .71% of the Fund's average net assets.
Distribution and Service Plan Fees. In accordance with Rule 12b-1 of the 1940 Act, the Fund has adopted separate Distribution and Service Plans for each class of shares. Certain classes pay Fidelity Distributors Corporation (FDC), an affiliate of FMR, separate Distribution and Service Fees, each of which is based on an annual percentage of each class' average net assets. In addition, FDC may pay financial intermediaries for selling shares of the Fund and providing shareholder support services. For the period, the Distribution and Service Fee rates, total fees and amounts retained by FDC were as follows:
| Distribution
Fee | Service
Fee | Total Fees | Retained
by FDC |
Class A | -% | .25% | $ 19,601 | $ 468 |
Class T | .25% | .25% | 27,756 | 131 |
Class B | .75% | .25% | 9,182 | 6,900 |
Class C | .75% | .25% | 23,585 | 3,042 |
| | | $ 80,124 | $ 10,541 |
Sales Load. FDC may receive a front-end sales charge of up to 5.75% for selling Class A shares and 3.50% for selling Class T shares, some of which is paid to financial intermediaries for selling shares of the Fund. Depending on the holding period, FDC may receive contingent deferred sales charges levied on Class A, Class T, Class B, and Class C
Annual Report
5. Fees and Other Transactions with Affiliates - continued
Sales Load - continued
redemptions. The deferred sales charges range from 5.00% to 1.00% for Class B shares, 1.00% for Class C shares, 1.00% for certain purchases of Class A shares and .25% for certain purchases of Class T shares.
For the period, sales charge amounts retained by FDC were as follows:
| Retained
by FDC |
Class A | $ 1,628 |
Class T | 1,101 |
Class B* | 1,433 |
Class C* | 380 |
| $ 4,542 |
* When Class B and Class C shares are initially sold, FDC pays commissions from its own resources to financial intermediaries through which the sales are made.
Transfer Agent Fees. Fidelity Investments Institutional Operations Company, Inc. (FIIOC), an affiliate of FMR, is the transfer, dividend disbursing and shareholder servicing agent for each class of the Fund. FIIOC receives account fees and asset-based fees that vary according to the account size and type of account of the shareholders of the respective classes of the Fund. FIIOC pays for typesetting, printing and mailing of shareholder reports, except proxy statements. For the period, transfer agent fees for each class were as follows:
| Amount | % of
Average
Net Assets |
Class A | $ 24,214 | .31 |
Class T | 18,252 | .33 |
Class B | 2,833 | .31 |
Class C | 7,355 | .31 |
Institutional Class | 739 | .20 |
| $ 53,393 | |
Accounting and Security Lending Fees. Fidelity Service Company, Inc. (FSC), an affiliate of FMR, maintains the Fund's accounting records. The accounting fee is based on the level of average net assets for each month. Under a separate contract, FSC administers the security lending program. The security lending fee is based on the number and duration of lending transactions.
Brokerage Commissions. The Fund placed a portion of its portfolio transactions with brokerage firms which are affiliates of the investment adviser. The commissions paid to these affiliated firms were $45 for the period.
Annual Report
Notes to Financial Statements - continued
6. Committed Line of Credit.
The Fund participates with other funds managed by FMR or an affiliate in a $4.25 billion credit facility (the "line of credit") to be utilized for temporary or emergency purposes to fund shareholder redemptions or for other short-term liquidity purposes. The Fund has agreed to pay commitment fees on its pro-rata portion of the line of credit, which amounted to $47 and is reflected in Miscellaneous expenses on the Statement of Operations. During the period, there were no borrowings on this line of credit.
7. Security Lending.
The Fund lends portfolio securities through a lending agent from time to time in order to earn additional income. For equity securities, a lending agent is used and may loan securities to certain qualified borrowers, including Fidelity Capital Markets (FCM), a broker-dealer affiliated with the Fund. On the settlement date of the loan, the Fund receives collateral (in the form of U.S. Treasury obligations, letters of credit and/or cash) against the loaned securities and maintains collateral in an amount not less than 100% of the market value of the loaned securities during the period of the loan. The market value of the loaned securities is determined at the close of business of the Fund and any additional required collateral is delivered to the Fund on the next business day. If the borrower defaults on its obligation to return the securities loaned because of insolvency or other reasons, a fund could experience delays and costs in recovering the securities loaned or in gaining access to the collateral. Any cash collateral received is invested in the Fidelity Securities Lending Cash Central Fund. At period end, there were no security loans outstanding. Security lending income represents the income earned on investing cash collateral, less rebates paid to borrowers and any lending agent fees associated with the loan, plus any premium payments received for lending certain types of securities. Security lending income is presented in the Statement of Operations as a component of income from Fidelity Central Funds. Total security lending income during the period amounted to $10,194. During the period, there were no securities loaned to FCM.
8. Expense Reductions.
FMR voluntarily agreed to reimburse each class to the extent annual operating expenses exceeded certain levels of average net assets as noted in the table below. Some expenses, for example interest expense, including commitment fees, are excluded from this reimbursement.
Annual Report
8. Expense Reductions - continued
The following classes were in reimbursement during the period:
| Expense
Limitations | Reimbursement
from adviser |
Class A | 1.45% | $ 48,120 |
Class T | 1.70% | 36,942 |
Class B | 2.20% | 6,350 |
Class C | 2.20% | 14,886 |
Institutional Class | 1.20% | 1,529 |
| | $ 107,827 |
Many of the brokers with whom FMR places trades on behalf of the Fund provided services to the Fund in addition to trade execution. These services included payments of certain expenses on behalf of the Fund totaling $6,083 for the period.
9. Distributions to Shareholders.
Distributions to shareholders of each class were as follows:
Years ended October 31, | 2012 | 2011 |
From net investment income | | |
Class A | $ 122,753 | $ 48,533 |
Class T | 73,896 | 17,367 |
Class B | 4,700 | - |
Class C | 15,083 | - |
Institutional Class | 5,003 | 3,362 |
Total | $ 221,435 | $ 69,262 |
10. Share Transactions.
Transactions for each class of shares were as follows:
| Shares | Dollars |
Years ended October 31, | 2012 | 2011 | 2012 | 2011 |
Class A | | | | |
Shares sold | 401,078 | 113,790 | $ 4,178,943 | $ 1,369,180 |
Reinvestment of distributions | 10,620 | 3,553 | 106,515 | 42,460 |
Shares redeemed | (489,592) | (236,239) | (5,195,802) | (2,808,784) |
Net increase (decrease) | (77,894) | (118,896) | $ (910,344) | $ (1,397,144) |
Class T | | | | |
Shares sold | 65,298 | 87,655 | $ 714,626 | $ 1,039,691 |
Reinvestment of distributions | 7,166 | 1,416 | 71,732 | 16,885 |
Shares redeemed | (132,306) | (165,637) | (1,389,315) | (1,980,913) |
Net increase (decrease) | (59,842) | (76,566) | $ (602,957) | $ (924,337) |
Annual Report
Notes to Financial Statements - continued
10. Share Transactions - continued
| Shares | Dollars |
Years ended October 31, | 2012 | 2011 | 2012 | 2011 |
Class B | | | | |
Shares sold | 229 | 1,700 | $ 2,308 | $ 19,713 |
Reinvestment of distributions | 422 | - | 4,127 | - |
Shares redeemed | (41,741) | (61,103) | (429,868) | (715,010) |
Net increase (decrease) | (41,090) | (59,403) | $ (423,433) | $ (695,297) |
Class C | | | | |
Shares sold | 50,841 | 39,446 | $ 527,022 | $ 455,073 |
Reinvestment of distributions | 1,320 | - | 12,817 | - |
Shares redeemed | (80,504) | (71,785) | (833,417) | (822,473) |
Net increase (decrease) | (28,343) | (32,339) | $ (293,578) | $ (367,400) |
Institutional Class | | | | |
Shares sold | 85,776 | 55,800 | $ 893,128 | $ 702,293 |
Reinvestment of distributions | 381 | 124 | 3,887 | 1,508 |
Shares redeemed | (76,353) | (56,680) | (779,011) | (689,404) |
Net increase (decrease) | 9,804 | (756) | $ 118,004 | $ 14,397 |
11. Other.
The Fund's organizational documents provide former and current trustees and officers with a limited indemnification against liabilities arising in connection with the performance of their duties to the Fund. In the normal course of business, the Fund may also enter into contracts that provide general indemnifications. The Fund's maximum exposure under these arrangements is unknown as this would be dependent on future claims that may be made against the Fund. The risk of material loss from such claims is considered remote.
Annual Report
To the Trustees of Fidelity Advisor Series VIII and Shareholders of Fidelity Advisor Europe Capital Appreciation Fund:
We have audited the accompanying statement of assets and liabilities of Fidelity Advisor Europe Capital Appreciation Fund (the Fund), a fund of Fidelity Advisor Series VIII, including the schedule of investments, as of October 31, 2012, and the related statement of operations for the year then ended, the statement of changes in net assets for each of the two years in the period then ended, and the financial highlights for each of the five years in the period then ended. These financial statements and financial highlights are the responsibility of the Fund's management. Our responsibility is to express an opinion on these financial statements and financial highlights based on our audits.
We conducted our audits in accordance with the standards of the Public Company Accounting Oversight Board (United States). Those standards require that we plan and perform the audit to obtain reasonable assurance about whether the financial statements and financial highlights are free of material misstatement. The Fund is not required to have, nor were we engaged to perform, an audit of its internal control over financial reporting. Our audits included consideration of internal control over financial reporting as a basis for designing audit procedures that are appropriate in the circumstances, but not for the purpose of expressing an opinion on the effectiveness of the Fund's internal control over financial reporting. Accordingly, we express no such opinion. An audit also includes examining, on a test basis, evidence supporting the amounts and disclosures in the financial statements, assessing the accounting principles used and significant estimates made by management, as well as evaluating the overall financial statement presentation. Our procedures included confirmation of securities owned as of October 31, 2012, by correspondence with the custodians and brokers; where replies were not received from brokers, we performed other auditing procedures. We believe that our audits provide a reasonable basis for our opinion.
In our opinion, the financial statements and financial highlights referred to above present fairly, in all material respects, the financial position of Fidelity Advisor Europe Capital Appreciation Fund as of October 31, 2012, the results of its operations for the year then ended, the changes in its net assets for each of the two years in the period then ended, and the financial highlights for each of the five years in the period then ended, in conformity with accounting principles generally accepted in the United States of America.
DELOITTE & TOUCHE LLP
Boston, Massachusetts
December 14, 2012
Annual Report
The Trustees, Members of the Advisory Board, and executive officers of the trust and fund, as applicable, are listed below. The Board of Trustees governs the fund and is responsible for protecting the interests of shareholders. The Trustees are experienced executives who meet periodically throughout the year to oversee the fund's activities, review contractual arrangements with companies that provide services to the fund, oversee management of the risks associated with such activities and contractual arrangements, and review the fund's performance. Except for James C. Curvey, each of the Trustees oversees 236 funds advised by FMR or an affiliate. Mr. Curvey oversees 443 funds advised by FMR or an affiliate.
The Trustees hold office without limit in time except that (a) any Trustee may resign; (b) any Trustee may be removed by written instrument, signed by at least two-thirds of the number of Trustees prior to such removal; (c) any Trustee who requests to be retired or who has become incapacitated by illness or injury may be retired by written instrument signed by a majority of the other Trustees; and (d) any Trustee may be removed at any special meeting of shareholders by a two-thirds vote of the outstanding voting securities of the trust. Each Trustee who is not an interested person (as defined in the 1940 Act) (Independent Trustee), shall retire not later than the last day of the calendar year in which his or her 75th birthday occurs. The Independent Trustees may waive this mandatory retirement age policy with respect to individual Trustees. The executive officers and Advisory Board Members hold office without limit in time, except that any officer and Advisory Board Member may resign or may be removed by a vote of a majority of the Trustees at any regular meeting or any special meeting of the Trustees. Except as indicated, each individual has held the office shown or other offices in the same company for the past five years.
Experience, Skills, Attributes, and Qualifications of the Fund's Trustees. The Governance and Nominating Committee has adopted a statement of policy that describes the experience, qualifications, attributes, and skills that are necessary and desirable for potential Independent Trustee candidates (Statement of Policy). The Board believes that each Trustee satisfied at the time he or she was initially elected or appointed a Trustee, and continues to satisfy, the standards contemplated by the Statement of Policy. The Governance and Nominating Committee also engages professional search firms to help identify potential Independent Trustee candidates who have the experience, qualifications, attributes, and skills consistent with the Statement of Policy. From time to time, additional criteria based on the composition and skills of the current Independent Trustees, as well as experience or skills that may be appropriate in light of future changes to board composition, business conditions, and regulatory or other developments, have also been considered by the professional search firms and the Governance and Nominating Committee. In addition, the Board takes into account the Trustees' commitment and participation in Board and committee meetings, as well as their leadership of standing and ad hoc committees throughout their tenure.
In determining that a particular Trustee was and continues to be qualified to serve as a Trustee, the Board has considered a variety of criteria, none of which, in isolation, was controlling. The Board believes that, collectively, the Trustees have balanced and diverse experience, qualifications, attributes, and skills, which allow the Board to operate effectively in governing the fund and protecting the interests of shareholders. Information about the specific experience, skills, attributes, and qualifications of each Trustee, which in each case led to the Board's conclusion that the Trustee should serve (or continue to serve) as a trustee of the fund, is provided below.
Annual Report
Board Structure and Oversight Function. James C. Curvey is an interested person (as defined in the 1940 Act) and currently serves as Chairman. The Trustees have determined that an interested Chairman is appropriate and benefits shareholders because an interested Chairman has a personal and professional stake in the quality and continuity of services provided to the fund. Independent Trustees exercise their informed business judgment to appoint an individual of their choosing to serve as Chairman, regardless of whether the Trustee happens to be independent or a member of management. The Independent Trustees have determined that they can act independently and effectively without having an Independent Trustee serve as Chairman and that a key structural component for assuring that they are in a position to do so is for the Independent Trustees to constitute a substantial majority for the Board. The Independent Trustees also regularly meet in executive session. Ned C. Lautenbach serves as Chairman of the Independent Trustees and as such (i) acts as a liaison between the Independent Trustees and management with respect to matters important to the Independent Trustees and (ii) with management prepares agendas for Board meetings.
Fidelity funds are overseen by different Boards of Trustees. The fund's Board oversees Fidelity's equity and high income funds and another Board oversees Fidelity's investment-grade bond, money market, and asset allocation funds. The asset allocation funds may invest in Fidelity funds overseen by the fund's Board. The use of separate Boards, each with its own committee structure, allows the Trustees of each group of Fidelity funds to focus on the unique issues of the funds they oversee, including common research, investment, and operational issues. On occasion, the separate Boards establish joint committees to address issues of overlapping consequences for the Fidelity funds overseen by each Board.
The Trustees operate using a system of committees to facilitate the timely and efficient consideration of all matters of importance to the Trustees, the fund, and fund shareholders and to facilitate compliance with legal and regulatory requirements and oversight of the fund's activities and associated risks. The Board, acting through its committees, has charged FMR and its affiliates with (i) identifying events or circumstances the occurrence of which could have demonstrably adverse effects on the fund's business and/or reputation; (ii) implementing processes and controls to lessen the possibility that such events or circumstances occur or to mitigate the effects of such events or circumstances if they do occur; and (iii) creating and maintaining a system designed to evaluate continuously business and market conditions in order to facilitate the identification and implementation processes described in (i) and (ii) above. Because the day-to-day operations and activities of the fund are carried out by or through FMR, its affiliates and other service providers, the fund's exposure to risks is mitigated but not eliminated by the processes overseen by the Trustees. While each of the Board's committees has responsibility for overseeing different aspects of the fund's activities, oversight is exercised primarily through the Operations, Audit, and Compliance Committees. In addition, the Independent Trustees have worked with FMR to enhance the Board's oversight of investment and financial risks, legal and regulatory risks, technology risks, and operational risks, including the development of additional risk reporting to the Board. For example, a working group comprised of Independent Trustees and FMR has worked and continues to work to review the Fidelity funds' valuation-related activities, reporting and risk management. Appropriate personnel, including but not limited to the fund's Chief Compliance Officer (CCO), FMR's internal auditor, the independent accountants, the fund's Treasurer and portfolio management personnel, make periodic reports to the Board's committees, as appropriate, including an annual review of FMR's risk management program for the Fidelity funds. The responsibilities of each standing committee, including their oversight responsibilities, are described further under "Standing Committees of the Fund's Trustees."
Annual Report
Trustees and Officers - continued
The fund's Statement of Additional Information (SAI) includes more information about the Trustees. To request a free copy, call Fidelity at 1-877-208-0098.
Interested Trustees*:
Correspondence intended for each Trustee who is an interested person may be sent to Fidelity Investments, 82 Devonshire Street, Boston, Massachusetts 02109.
Name, Age; Principal Occupations and Other Relevant Experience+ |
James C. Curvey (77) |
| Year of Election or Appointment: 2007 Mr. Curvey is Trustee and Chairman of the Board of Trustees of certain Trusts. Mr. Curvey also serves as Trustee (2007-present) of other investment companies advised by FMR. Mr. Curvey is a Director of Fidelity Investments Money Management, Inc. (2009-present), Director of Fidelity Research & Analysis Co. (2009-present) and Director of FMR and FMR Co., Inc. (2007-present). Mr. Curvey is also Vice Chairman (2007-present) and Director of FMR LLC. In addition, Mr. Curvey serves as an Overseer for the Boston Symphony Orchestra and a member of the Trustees of Villanova University. Previously, Mr. Curvey was the Vice Chairman (2006-2007) and Director (2000-2007) of FMR Corp. |
Ronald P. O'Hanley (55) |
| Year of Election or Appointment: 2011 Mr. O'Hanley is Director of FMR Co., Inc. (2010-present), Director of Fidelity Investments Money Management, Inc. (2010-present), Director of Fidelity Research & Analysis Company (2010-present), President of Fidelity Asset Management and Corporate Services and a member of Fidelity's Executive Committee (2010-present). Previously, Mr. O'Hanley served as President and Chief Executive Officer of BNY Mellon Asset Management (2007-2010). Mr. O'Hanley also served as Vice Chairman of Bank New York Mellon Corp. and a member of that firm's Executive Committee. Prior to the 2007 merger of The Bank of New York and Mellon Financial Corporation, he was Vice Chairman of Mellon Financial Corporation and President and Chief Executive Officer of Mellon Asset Management. He joined Mellon in February 1997. Mr. O'Hanley currently serves as Chairman of the Boston Public Library Foundation Board of Directors and sits on the Board of Directors of Beth Israel Deaconess Medical Center, the Board of Trustees of the Marine Biological Laboratory and the Advisory Board of the Maxwell School of Citizenship and Public Administration at Syracuse University. Mr. O'Hanley also chairs the Council on Asset Management for the Financial Services Roundtable and is a member of the Board of Directors of Institutional Investor's U.S. Institute. |
* Trustees have been determined to be "Interested Trustees" by virtue of, among other things, their affiliation with the trust or various entities under common control with FMR.
+ The information above includes each Trustee's principal occupation during the last five years and other information relating to the experience, attributes, and skills relevant to each Trustee's qualifications to serve as a Trustee, which led to the conclusion that each Trustee should serve as a Trustee for the fund.
Annual Report
Trustees and Officers - continued
Independent Trustees:
Correspondence intended for each Independent Trustee (that is, the Trustees other than the Interested Trustees) may be sent to Fidelity Investments, P.O. Box 55235, Boston, Massachusetts 02205-5235.
Name, Age; Principal Occupations and Other Relevant Experience+ |
Dennis J. Dirks (64) |
| Year of Election or Appointment: 2005 Prior to his retirement in May 2003, Mr. Dirks was Chief Operating Officer and a member of the Board of The Depository Trust & Clearing Corporation (DTCC). He also served as President, Chief Operating Officer, and Board member of The Depository Trust Company (DTC) and President and Board member of the National Securities Clearing Corporation (NSCC). In addition, Mr. Dirks served as Chief Executive Officer and Board member of the Government Securities Clearing Corporation, Chief Executive Officer and Board member of the Mortgage-Backed Securities Clearing Corporation, as a Trustee and a member of the Finance Committee of Manhattan College (2005-2008), and as a Trustee and a member of the Finance Committee of AHRC of Nassau County (2006-2008). Mr. Dirks is a member of the Independent Directors Council (IDC) Governing Council (2010-present) and Board of Directors for The Brookville Center for Children's Services, Inc. (2009-present). |
Alan J. Lacy (59) |
| Year of Election or Appointment: 2008 Mr. Lacy serves as Senior Adviser (2007-present) of Oak Hill Capital Partners, L.P. (private equity). Mr. Lacy also served as Chief Executive Officer (2000-2005) and Vice Chairman (2005-2006) of Sears Holdings Corporation and Sears, Roebuck and Co. (retail). In addition, Mr. Lacy serves as a member of the Board of Directors of Dave & Buster's Entertainment, Inc. (restaurant and entertainment complexes, 2010-present), Earth Fare, Inc. (retail grocery, 2012-present), The Hillman Companies, Inc. (hardware wholesalers, 2010-present), and Bristol-Myers Squibb Company (global pharmaceuticals, 2008-present). Mr. Lacy is a member of the Board of Trustees of The National Parks Conservation Association (2006-present). Previously, Mr. Lacy served as Chairman of the Board of Trustees of the National Parks Conservation Association (2008-2011) and as a member of the Board of Directors for the Western Union Company (global money transfer, 2006-2011). |
Ned C. Lautenbach (68) |
| Year of Election or Appointment: 2000 Mr. Lautenbach is Chairman of the Independent Trustees of the Equity and High Income Funds (2006-present). Mr. Lautenbach currently serves as the Lead Director of the Eaton Corporation Board of Directors (diversified industrial, 1997-present). Mr. Lautenbach is Chairman of the Board of Directors of the Philharmonic Center for the Arts in Naples, Florida (2012-present) and a member of the Council on Foreign Relations (1994-present). Previously, Mr. Lautenbach was a Partner/Advisory Partner at Clayton, Dubilier & Rice, LLC (private equity investment, 1998-2010), as well as a Director of Sony Corporation (2006-2007). |
Joseph Mauriello (68) |
| Year of Election or Appointment: 2008 Prior to his retirement in January 2006, Mr. Mauriello served in numerous senior management positions including Deputy Chairman and Chief Operating Officer (2004-2005), and Vice Chairman of Financial Services (2002-2004) of KPMG LLP US (professional services, 1965-2005). Mr. Mauriello currently serves as a member of the Board of Directors of XL Group plc. (global insurance and re-insurance, 2006-present). Previously, Mr. Mauriello served as a Director of the Hamilton Funds of the Bank of New York (2006-2007) and of Arcadia Resources Inc. (health care services and products, 2007-2012). |
Robert W. Selander (62) |
| Year of Election or Appointment: 2011 Previously, Mr. Selander served as a Member of the Advisory Board of Fidelity's Equity and High Income Funds (2011), Executive Vice Chairman (2010), Chief Executive Officer (2009-2010), and President and Chief Executive Officer (1997-2009) of Mastercard, Inc. |
Cornelia M. Small (68) |
| Year of Election or Appointment: 2005 Ms. Small is a member of the Board of Directors (2009-present) and Chair of the Investment Committee (2010-present) of the Teagle Foundation. Ms. Small also serves on the Investment Committee of the Berkshire Taconic Community Foundation (2008-present). Previously, Ms. Small served as Chairperson (2002-2008) and a member of the Investment Committee and Chairperson (2008-2012) and a member of the Board of Trustees of Smith College. In addition, Ms. Small served as Chief Investment Officer, Director of Global Equity Investments, and a member of the Board of Directors of Scudder, Stevens & Clark and Scudder Kemper Investments. |
William S. Stavropoulos (73) |
| Year of Election or Appointment: 2001 Mr. Stavropoulos is Vice Chairman of the Independent Trustees of the Equity and High Income Funds (2006-present). Mr. Stavropoulos serves as President and Founder of the Michigan Baseball Foundation, the Great Lakes Loons (2007-present). Mr. Stavropoulos is Chairman Emeritus of the Board of Directors of The Dow Chemical Company, where he previously served in numerous senior management positions, including President, CEO (1995-2000; 2002-2004), Chairman of the Executive Committee (2000-2006), and as a member of the Board of Directors (1990-2006). Currently, Mr. Stavropoulos is a Director of Univar Inc. (global distributor of commodity and specialty chemicals, Chairman from 2010-May 2012 and Lead Director from May 2012-present), Teradata Corporation (data warehousing and technology solutions, 2008-present), Maersk Inc. (industrial conglomerate), and Tyco International, Ltd. (multinational manufacturing and services, 2007-present), and a member of the Advisory Board for Metalmark Capital LLC (private equity investment, 2005-present). Mr. Stavropoulos is an operating advisor to Clayton, Dubilier & Rice, LLC (private equity investment). In addition, Mr. Stavropoulos is a member of the University of Notre Dame Advisory Council for the College of Science, a Trustee of the Rollin L. Gerstacker Foundation, and a Director of the Naples Philharmonic Center for the Arts. Previously, Mr. Stavropoulos served as a Director of Chemical Financial Corporation (bank holding company, 1993-2012). |
David M. Thomas (63) |
| Year of Election or Appointment: 2008 Previously, Mr. Thomas served as Executive Chairman (2005-2006) and Chairman and Chief Executive Officer (2000-2005) of IMS Health, Inc. (pharmaceutical and healthcare information solutions), and a Director of Fortune Brands, Inc. (consumer products, 2000-2011). In addition, Mr. Thomas serves as Non-Executive Chairman of the Board of Directors of Fortune Brands Home and Security (home and security products, 2011-present), and as a member of the Board of Directors of Interpublic Group of Companies, Inc. (marketing communication, 2004-present). |
Michael E. Wiley (62) |
| Year of Election or Appointment: 2008 Mr. Wiley also serves as a Director of Asia Pacific Exploration Consolidated (international oil and gas exploration and production, 2008-present). Mr. Wiley serves as a Director of Tesoro Corporation (independent oil refiner and marketer, 2005-present), and a Director of Bill Barrett Corporation (exploration and production, 2005-present). In addition, Mr. Wiley also serves as a Director of Post Oak Bank (privately-held bank, 2004-present). Previously, Mr. Wiley served as a member of the Board of Trustees of the University of Tulsa (2000-2006; 2007-2010), as a Senior Energy Advisor of Katzenbach Partners, LLC (consulting, 2006-2007), as an Advisory Director of Riverstone Holdings (private investment), Chairman, President, and CEO of Baker Hughes, Inc. (oilfield services, 2000-2004), and as Director of Spinnaker Exploration Company (exploration and production, 2001-2005). |
+ The information above includes each Trustee's principal occupation during the last five years and other information relating to the experience, attributes, and skills relevant to each Trustee's qualifications to serve as a Trustee, which led to the conclusion that each Trustee should serve as a Trustee for the fund.
Advisory Board Members and Executive Officers:
Correspondence intended for David A. Rosow and Garnett A. Smith may be sent to Fidelity Investments, P.O. Box 55235, Boston, Massachusetts 02205-5235. Correspondence intended for each executive officer, Edward C. Johnson 3d, and Peter S. Lynch may be sent to Fidelity Investments, 82 Devonshire Street, Boston, Massachusetts 02109.
Name, Age; Principal Occupation |
Edward C. Johnson 3d (82) |
| Year of Election or Appointment: 2011 Member of the Advisory Board of Fidelity's Equity and High Income Funds. Mr. Johnson serves as Chief Executive Officer, Chairman, and a Director of FMR LLC, and also serves as Chairman and Director of FIL Limited. Previously, Mr. Johnson served as a Trustee and Chairman of the Board of certain Fidelity Trusts, Chairman and a Director of FMR, Chairman and a Director of FMR Co., Inc., and President of FMR LLC (2006-2007). |
Peter S. Lynch (68) |
| Year of Election or Appointment: 2003 Member of the Advisory Board of Fidelity's Equity and High Income Funds. Mr. Lynch is Vice Chairman and a Director of FMR and FMR Co., Inc. In addition, Mr. Lynch serves as a Trustee of Boston College and as the Chairman of the Inner-City Scholarship Fund. Previously, Mr. Lynch served on the Special Olympics International Board of Directors (1997-2006). |
David A. Rosow (70) |
| Year of Election or Appointment: 2012 Member of the Advisory Board of Fidelity's Equity and High Income Funds. Chairman and Chief Executive Officer of International Golf Group, Inc. (golf course development, 1989-present). Previously, Mr. Rosow served as Chairman and Chief Executive Officer of Rosow & Company, Inc. (private investment company, 1989-2011), a Lead Director of Hudson United Bancorp (2001-2006) and as a Director of TD Banknorth (1996-2006). In addition, Mr. Rosow is a member (2008-present) and President (2009-present) of the Town Council of Palm Beach, Florida. |
Garnett A. Smith (65) |
| Year of Election or Appointment: 2012 Member of the Advisory Board of Fidelity's Equity and High Income Funds. Prior to Mr. Smith's retirement, he served as Chairman and Chief Executive Officer of Inbrand Corp. (manufacturer of personal absorbent products, 1990-1997). He also served as President (1986-1990) of Inbrand Corp. Prior to his employment with Inbrand Corp., he was employed by a retail fabric chain and North Carolina National Bank. In addition, Mr. Smith is a board member of the Jackson Hole Land Trust (2009-present). |
Kenneth B. Robins (43) |
| Year of Election or Appointment: 2008 President and Treasurer of Fidelity's Equity and High Income Funds. Mr. Robins also serves as President and Treasurer (2010-present) and Assistant Treasurer (2009-present) of other Fidelity funds and is an employee of Fidelity Investments (2004-present). Previously, Mr. Robins served as Deputy Treasurer of the Fidelity funds (2005-2008) and Treasurer and Chief Financial Officer of The North Carolina Capital Management Trust: Cash and Term Portfolios (2006-2008). |
Bruce T. Herring (47) |
| Year of Election or Appointment: 2006 Vice President of certain Equity Funds. Mr. Herring also serves as President of Fidelity Research & Analysis Company (2010-present), Chief Investment Officer and Director of Fidelity Management & Research (U.K.) Inc. (2010-present) and Group Chief Investment Officer of FMR. Previously, Mr. Herring served as Vice President (2005-2006) and Senior Vice President (2006-2007) of Fidelity Management & Research Company, Vice President of FMR Co., Inc. (2001-2007) and as a portfolio manager for Fidelity U.S. Equity Funds. |
Brian B. Hogan (48) |
| Year of Election or Appointment: 2009 Vice President of Equity and High Income Funds. Mr. Hogan also serves as President of FMR's Equity Division (2009-present). Previously, Mr. Hogan served as Senior Vice President, Equity Research of FMR (2006-2009) and as a portfolio manager. |
Scott C. Goebel (44) |
| Year of Election or Appointment: 2008 Secretary and Chief Legal Officer (CLO) of the Fidelity funds. Mr. Goebel also serves as Secretary of Fidelity Investments Money Management, Inc. (FIMM) (2010-present) and Fidelity Research and Analysis Company (FRAC) (2010-present); Secretary and CLO of The North Carolina Capital Management Trust: Cash and Term Portfolios (2008-present); General Counsel, Secretary, and Senior Vice President of FMR (2008-present) and FMR Co., Inc. (2008-present); employed by FMR LLC or an affiliate (2001-present); Chief Legal Officer of Fidelity Management & Research (Hong Kong) Limited (2008-present) and Assistant Secretary of Fidelity Management & Research (Japan) Inc. (2008-present), and Fidelity Management & Research (U.K.) Inc. (2008-present). Previously, Mr. Goebel served as Assistant Secretary of FIMM (2008-2010), FRAC (2008-2010), and the Funds (2007-2008) and as Vice President and Secretary of Fidelity Distributors Corporation (FDC) (2005-2007). |
William C. Coffey (43) |
| Year of Election or Appointment: 2009 Assistant Secretary of Fidelity's Equity and High Income Funds. Mr. Coffey also serves as Senior Vice President and Deputy General Counsel of FMR LLC (2010-present), and is an employee of Fidelity Investments. Previously, Mr. Coffey served as Vice President and Associate General Counsel of FMR LLC (2005-2009). |
Elizabeth Paige Baumann (44) |
| Year of Election or Appointment: 2012 Anti-Money Laundering (AML) Officer of the Fidelity funds. Ms. Baumann also serves as AML Officer of The North Carolina Capital Management Trust: Cash and Term Portfolios (2012-present), Chief AML Officer of FMR LLC (2012-present), and is an employee of Fidelity Investments. Previously, Ms. Baumann served as Vice President and Deputy Anti-Money Laundering Officer (2007-2012). |
Christine Reynolds (54) |
| Year of Election or Appointment: 2008 Chief Financial Officer of the Fidelity funds. Ms. Reynolds became President of Fidelity Pricing and Cash Management Services (FPCMS) in August 2008. Ms. Reynolds served as Chief Operating Officer of FPCMS (2007-2008). Previously, Ms. Reynolds served as President, Treasurer, and Anti-Money Laundering officer of the Fidelity funds (2004-2007). |
Joseph A. Hanlon (44) |
| Year of Election or Appointment: 2012 Chief Compliance Officer of Fidelity's Equity and High Income Funds. Mr. Hanlon serves as Compliance Officer of FMR, FMR Co., Inc., Fidelity Investments Money Management, Inc. (FIMM), Fidelity Research and Analysis Company (FRAC), Fidelity Management & Research (Japan) Inc., Fidelity Management & Research (U.K.) Inc., Fidelity Management & Research (Hong Kong), and Strategic Advisers, Inc. (2009-present), as Senior Vice President of the Fidelity Asset Management Division (2009-present), and is an employee of Fidelity Investments. |
Joseph F. Zambello (55) |
| Year of Election or Appointment: 2011 Deputy Treasurer of the Fidelity funds. Mr. Zambello is an employee of Fidelity Investments. Previously, Mr. Zambello served as Vice President of FMR's Program Management Group (2009-2011) and Vice President of the Transfer Agent Oversight Group (2005-2009). |
Adrien E. Deberghes (45) |
| Year of Election or Appointment: 2008 Deputy Treasurer of Fidelity's Equity and High Income Funds. Mr. Deberghes also serves as Vice President (2011-present) and Assistant Treasurer (2010-present) of other Fidelity funds, and is an employee of Fidelity Investments (2008-present). Previously, Mr. Deberghes served as Senior Vice President of Mutual Fund Administration at State Street Corporation (2007-2008), Senior Director of Mutual Fund Administration at Investors Bank & Trust (2005-2007), and Director of Finance for Dunkin' Brands (2000-2005). |
Stephen Sadoski (41) |
| Year of Election or Appointment: 2012 Deputy Treasurer of Fidelity's Equity and High Income Funds. Mr. Sadoski also serves as Assistant Treasurer of other Fidelity funds (2012-present) and is an employee of Fidelity Investments (2012-present). Previously, Mr. Sadoski served as an assistant chief accountant in the Division of Investment Management of the Securities and Exchange Commission (SEC) (2009-2012) and as a senior manager at Deloitte & Touche (1997-2009). |
Stephanie J. Dorsey (43) |
| Year of Election or Appointment: 2010 Assistant Treasurer of Fidelity's Equity and High Income Funds. Ms. Dorsey also serves as Deputy Treasurer of other Fidelity funds (2008-present) and is an employee of Fidelity Investments (2008-present). Previously, Ms. Dorsey served as Treasurer (2004-2008) of the JPMorgan Mutual Funds and Vice President (2004-2008) of JPMorgan Chase Bank. |
John R. Hebble (54) |
| Year of Election or Appointment: 2009 Assistant Treasurer of Fidelity's Equity and High Income Funds. Mr. Hebble also serves as President (2011-present), Treasurer, and Chief Financial Officer of The North Carolina Capital Management Trust: Cash and Term Portfolios (2008-present), President and Treasurer of other Fidelity funds (2008-present) and is an employee of Fidelity Investments. |
Gary W. Ryan (54) |
| Year of Election or Appointment: 2005 Assistant Treasurer of the Fidelity funds. Mr. Ryan is an employee of Fidelity Investments. Previously, Mr. Ryan served as Vice President of Fund Reporting in Fidelity Pricing and Cash Management Services (FPCMS) (1999-2005). |
Jonathan Davis (44) |
| Year of Election or Appointment: 2010 Assistant Treasurer of the Fidelity funds. Mr. Davis is also Assistant Treasurer of Fidelity Rutland Square Trust II and Fidelity Commonwealth Trust II. Mr. Davis is an employee of Fidelity Investments. Previously, Mr. Davis served as Vice President and Associate General Counsel of FMR LLC (2003-2010). |
Annual Report
Institutional Class designates 100% of the dividends distributed during the fiscal year as amounts which may be taken into account as a dividend for purposes of the maximum rate under section 1(h)(11) of the Internal Revenue Code.
The amounts per share which represent income derived from sources within, and taxes paid to, foreign countries or possessions of the United States are as follows:
| Pay Date | Income | Taxes |
Institutional Class | 12/05/11 | $0.219 | $0.0311 |
The fund will notify shareholders in January 2013 of amounts for use in preparing 2012 income tax returns.
Annual Report
Board Approval of Investment Advisory Contracts and Management Fees
Fidelity Advisor Europe Capital Appreciation Fund
Each year, the Board of Trustees, including the Independent Trustees (together, the Board), votes on the renewal of the management contract and sub-advisory agreements (together, the Advisory Contracts) for the fund. The Board, assisted by the advice of fund counsel and Independent Trustees' counsel, requests and considers a broad range of information relevant to the renewal of the Advisory Contracts throughout the year.
The Board meets regularly and, at each of its meetings, considers factors that are relevant to its annual consideration of the renewal of the fund's Advisory Contracts, including the services and support provided to the fund and its shareholders. The Board has established various standing committees, each composed of and chaired by Independent Trustees with varying backgrounds, to which the Board has assigned specific subject matter responsibilities in order to enhance effective decision-making by the Board. The Board, acting directly and through its Committees, requests and receives information concerning the annual consideration of the renewal of the fund's Advisory Contracts. The Board also meets as needed to consider matters specifically related to the Board's annual consideration of the renewal of Advisory Contracts. Members of the Board may also meet with trustees of other Fidelity funds through ad hoc joint committees to discuss certain matters relevant to the Fidelity funds.
At its July 2012 meeting, the Board of Trustees, including the Independent Trustees, unanimously determined to renew the fund's Advisory Contracts. In reaching its determination, the Board considered all factors it believed relevant, including (i) the nature, extent, and quality of the services to be provided to the fund and its shareholders (including the investment performance of the fund); (ii) the competitiveness of the fund's management fee and total expense ratio relative to peer funds; (iii) the total costs of the services to be provided by and the profits to be realized by Fidelity from its relationship with the fund; (iv) the extent to which economies of scale exist and would be realized as the fund grows; and (v) whether fee levels reflect these economies of scale, if any, for the benefit of fund shareholders.
In considering whether to renew the Advisory Contracts for the fund, the Board reached a determination, with the assistance of fund counsel and Independent Trustees' counsel and through the exercise of its business judgment, that the renewal of the Advisory Contracts is in the best interests of the fund and its shareholders and that the compensation payable under the Advisory Contracts is fair and reasonable. The Board's decision to renew the Advisory Contracts was not based on any single factor, but rather was based on a comprehensive consideration of all the information provided to the Board at its meetings throughout the year. The Board, in reaching its determination to renew the Advisory Contracts, is aware that shareholders in the fund have a broad range of investment choices available to them, including a wide choice among mutual funds offered by Fidelity's competitors, and that the fund's shareholders, who have the opportunity to review and weigh the disclosure provided by the fund in its prospectus and other public disclosures, have chosen to invest in this fund, managed by Fidelity.
Annual Report
Board Approval of Investment Advisory Contracts and
Management Fees - continued
Nature, Extent, and Quality of Services Provided. The Board considered the staffing within the investment adviser, FMR, and the sub-advisers (together, the Investment Advisers), including the backgrounds of the fund's investment personnel, and also considered the fund's investment objective, strategies, and related investment philosophy. The Independent Trustees also had discussions with senior management of Fidelity's investment operations and investment groups. The Board considered the structure of the portfolio manager compensation program and whether this structure provides appropriate incentives to act in the best interests of the fund.
Resources Dedicated to Investment Management and Support Services. The Board and the Fund Oversight and Research Committees reviewed the general qualifications and capabilities of the Investment Advisers' investment staff, including its size, education, experience, and resources, as well as the Investment Advisers' approach to recruiting, training, managing, and compensating investment personnel. The Board also noted that FMR has continued to increase the resources devoted to non-U.S. offices, including expansion of Fidelity's global investment organization. The Board noted that Fidelity's analysts have extensive resources, tools and capabilities that allow them to conduct sophisticated quantitative and fundamental analysis, as well as credit analysis of issuers, counterparties and guarantors. The Board also believes that Fidelity's investment professionals have sufficient access to global information and data so as to provide competitive investment results over time, and that those professionals also have access to sophisticated tools that permit them to assess portfolio construction and risk and performance attribution characteristics continuously, as well as to transmit new information and research conclusions rapidly around the world. Additionally, in its deliberations, the Board considered the Investment Advisers' trading and risk management capabilities and resources, which are an integral part of the investment management process.
Shareholder and Administrative Services. The Board considered (i) the nature, extent, quality, and cost of advisory, administrative, and shareholder services performed by the Investment Advisers and their affiliates under the Advisory Contracts and under separate agreements covering transfer agency, pricing and bookkeeping, and securities lending services for the fund; (ii) the nature and extent of the supervision of third party service providers, principally custodians and subcustodians; and (iii) the resources devoted to, and the record of compliance with, the fund's compliance policies and procedures. The Board also reviewed the allocation of fund brokerage, including allocations to brokers affiliated with the Investment Advisers, the use of brokerage commissions to pay fund expenses, and the use of "soft" commission dollars to pay for research services.
Annual Report
The Board noted that the growth of fund assets over time across the complex allows Fidelity to reinvest in the development of services designed to enhance the value or convenience of the Fidelity funds as investment vehicles. These services include 24-hour access to account information and market information through telephone representatives and over the Internet, investor education materials and asset allocation tools, and the expanded availability of Fidelity Investor Centers.
Investment in a Large Fund Family. The Board considered the benefits to shareholders of investing in a Fidelity fund, including the benefits of investing in a fund that is part of a large family of funds offering a variety of investment disciplines and providing a large variety of mutual fund investor services. The Board noted that Fidelity had taken, or had made recommendations that resulted in the Fidelity funds taking, a number of actions over the previous year that benefited particular funds, including (i) continuing to dedicate additional resources to investment research and support of the senior management team that oversees asset management; (ii) persisting in efforts to enhance Fidelity's research capabilities, in particular, international research; (iii) launching new funds and making other enhancements to meet client needs for global and income-oriented solutions; (iv) continuing to launch dedicated lower cost underlying funds to meet investment management's portfolio construction needs related to expanding underlying fund options, specifically for the Freedom Fund product lines; (v) adopting a "Stock Selector" sector neutral investment approach and employing a team of portfolio managers who are sector specialists to manage certain funds; (vi) rationalizing product lines and gaining increased efficiencies through the mergers of several funds into other funds; (vii) strengthening the Spartan Index Fund product line by adding new funds and/or new low-cost institutional share classes, restructuring fund expenses to accommodate new classes, and reducing investment minimums for certain classes of shares; (viii) modifying the eligibility criteria for Institutional Class shares to increase their appeal to government entities and charitable investors; and (ix) reducing certain transfer agent fee rates.
Investment Performance. The Board considered whether the fund has operated in accordance with its investment objective, as well as its record of compliance with its investment restrictions. It also reviewed the fund's absolute investment performance for each class, as well as the fund's relative investment performance for each class measured over multiple periods against (i) a broad-based securities market index, and (ii) a peer group of mutual funds deemed appropriate by Fidelity and reviewed by the Board. The following charts considered by the Board show, over the one-, three-, and five-year periods ended December 31, 2011, the cumulative total returns of Institutional Class (Class I) and Class C of the fund, the cumulative total returns of a broad-based securities market index ("benchmark"), and a range of cumulative total returns of a peer group of mutual funds identified by Morningstar, Inc. as having an investment style similar to that of the fund based on underlying portfolio holdings. The returns of Institutional Class (Class I) and Class C show the performance of the highest and lowest performing classes, respectively (based on five-year performance). The box within each chart shows the 25th percentile return (top of box) and the 75th percentile return (bottom of box) of the peer group. Returns shown above the box are in the first quartile and returns shown below the box are in the fourth quartile. The percentage beaten numbers noted below each chart correspond to the percentile box and represent the percentage of funds in the peer group whose performance was equal to or lower than that of the class indicated.
Annual Report
Board Approval of Investment Advisory Contracts and
Management Fees - continued
Fidelity Advisor Europe Capital Appreciation Fund

The Board reviewed the fund's relative investment performance against its peer group and noted that the performance of Institutional Class (Class I) of the fund was in the third quartile for all the periods shown. The Board also noted that the investment performance of the fund was lower than its benchmark for all the periods shown. The Board considered that the variations in performance among the fund's classes reflect the variations in class expenses, which result in lower performance for higher expense classes. The Board discussed with FMR actions to improve the fund's disappointing performance relative to its peer group and benchmark. The Board noted that this fund had underperformed in the past and discussed with FMR its disappointment with the continued underperformance of the fund. The Board also reviewed the fund's performance since inception as well as performance in the current year. The Board will continue to closely monitor the performance of the fund in the coming year and discuss with FMR other appropriate actions to address the performance of the fund.
Annual Report
Based on its review, the Board concluded that the nature, extent, and quality of services provided to the fund under the Advisory Contracts should benefit the fund's shareholders.
Competitiveness of Management Fee and Total Expense Ratio. The Board considered the fund's management fee and total expense ratio compared to "mapped groups" of competitive funds and classes. Fidelity creates "mapped groups" by combining similar Lipper investment objective categories that have comparable management fee characteristics. Combining Lipper investment objective categories aids the Board's management fee and total expense ratio comparisons by broadening the competitive group used for comparison and by reducing the number of universes to which various Fidelity funds are compared.
Management Fee. The Board considered two proprietary management fee comparisons for the 12-month periods shown in the chart below. The group of Lipper funds used by the Board for management fee comparisons is referred to below as the "Total Mapped Group." The Total Mapped Group comparison focuses on a fund's standing relative to the total universe of comparable funds available to investors in terms of gross management fees before expense reimbursements or caps. "TMG %" represents the percentage of funds in the Total Mapped Group that had management fees that were lower than the fund's. For example, a TMG % of 17% means that 83% of the funds in the Total Mapped Group had higher management fees than the fund. The "Asset-Size Peer Group" (ASPG) comparison focuses on a fund's standing relative to non-Fidelity funds similar in size to the fund within the Total Mapped Group. The ASPG represents at least 15% of the funds in the Total Mapped Group with comparable asset size and management fee characteristics, subject to a minimum of 50 funds (or all funds in the Total Mapped Group if fewer than 50). Additional information, such as the ASPG quartile in which the fund's management fee ranked, is also included in the chart and considered by the Board.
Annual Report
Board Approval of Investment Advisory Contracts and
Management Fees - continued
Fidelity Advisor Europe Capital Appreciation Fund
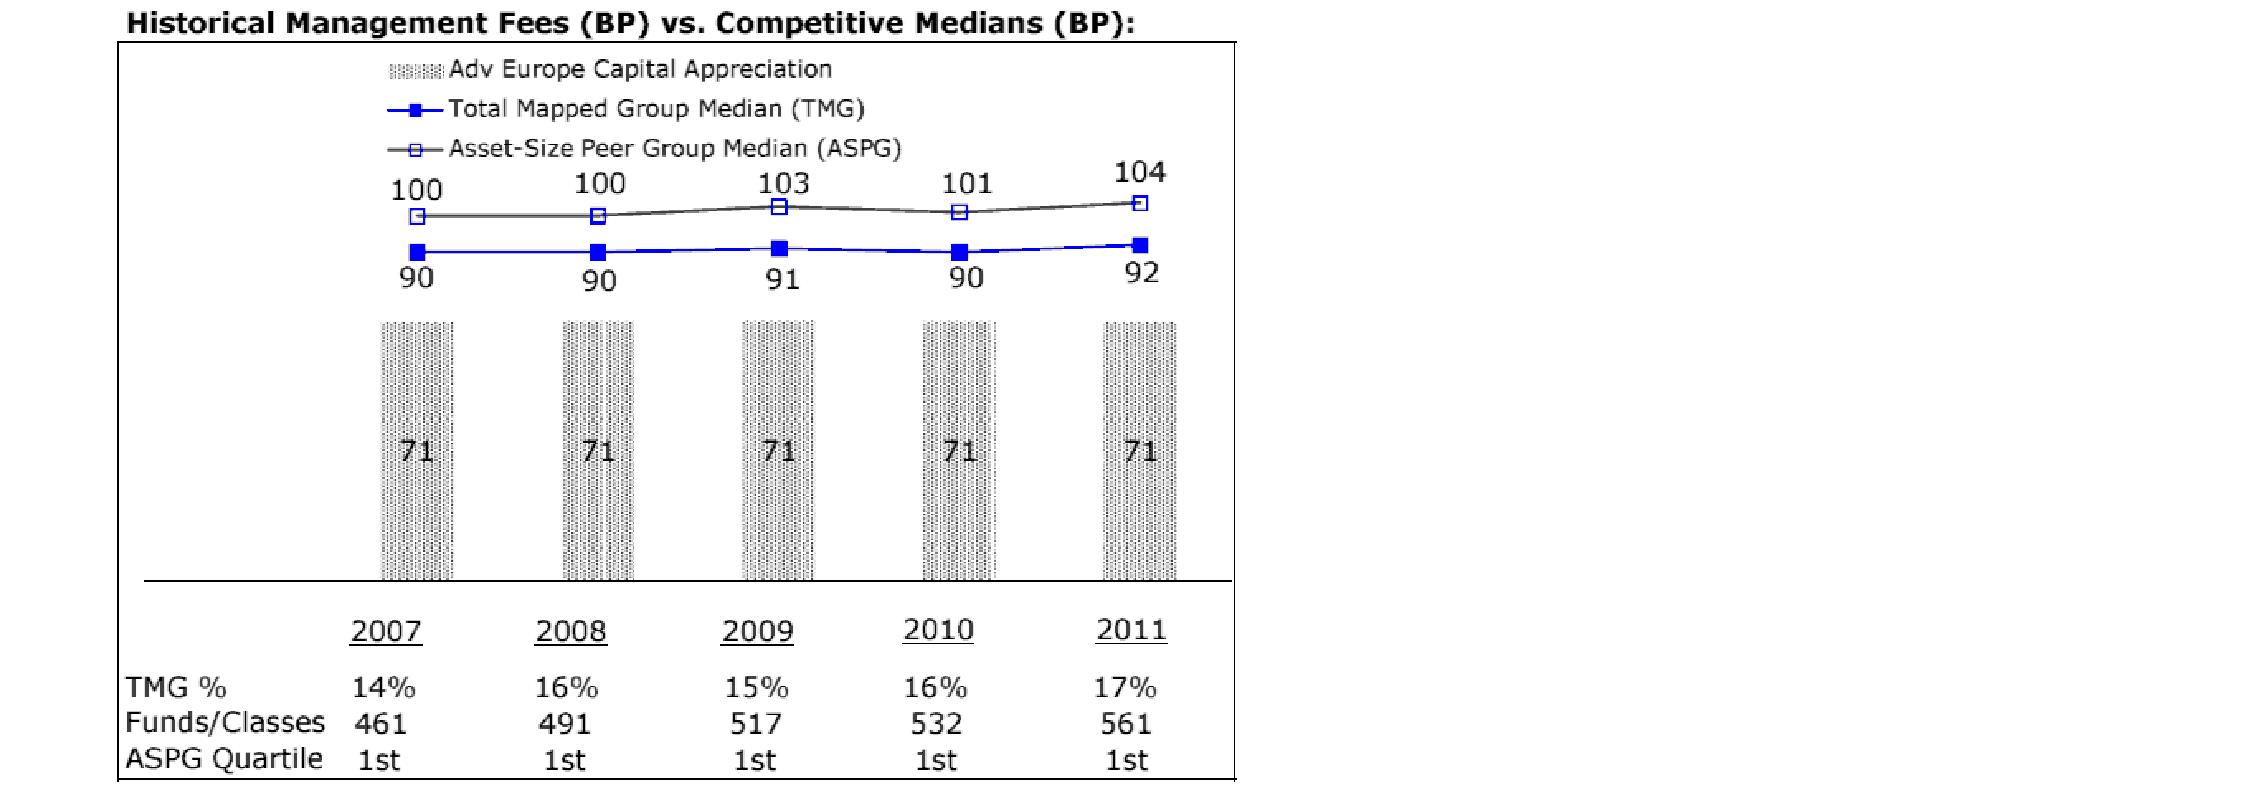
The Board noted that the fund's management fee ranked below the median of its Total Mapped Group and below the median of its ASPG for 2011.
Based on its review, the Board concluded that the fund's management fee is fair and reasonable in light of the services that the fund receives and the other factors considered.
Total Expense Ratio. In its review of each class's total expense ratio, the Board considered the fund's management fee as well as other fund or class expenses, as applicable, such as transfer agent fees, pricing and bookkeeping fees, fund-paid 12b-1 fees, and custodial, legal, and audit fees. The Board also noted the effects of any waivers and reimbursements on fees and expenses. As part of its review, the Board also considered the current and historical total expense ratios of each class of the fund compared to competitive fund median expenses. Each class of the fund is compared to those funds and classes in the Total Mapped Group (used by the Board for management fee comparisons) that have a similar sales load structure.
The Board noted that the total expense ratio of Class A ranked below its competitive median for 2011, the total expense ratio of Class B ranked equal to its competitive median for 2011, and the total expense ratio of each of Class T, Class C, and Institutional Class ranked above its competitive median for 2011. The Board considered that various factors, including 12b-1 fees, positive or negative performance adjustments, and relatively higher other expenses in the case of small fund size, can affect total expense ratios. The Board noted that the total expense ratio of Class T was above the competitive median primarily because of higher 12b-1 fees on Class T. Class T has a higher 12b-1 fee, but a lower front-end sales charge, than traditionally priced front-end sales charge classes. The Board considered that Class T is primarily sold load-waived in the retirement plan market where its 0.50% 12b-1 fee is comparable to competing no-load, higher 12b-1 fee classes designed specifically for retirement plans. The Board noted that the fund offers multiple classes, each of which has a different sales load and 12b-1 fee structure, and that the multiple structures are intended to offer a range of pricing options for the intermediary market. The Board also noted that the total expense ratios of the classes vary primarily by the level of their 12b-1 fees, although differences in transfer agent fees may also cause expenses to vary from class to class.
Annual Report
Fees Charged to Other Fidelity Clients. The Board also considered Fidelity fee structures and other information with respect to clients of FMR and its affiliates, such as other mutual funds advised or subadvised by FMR or its affiliates, pension plan clients, and other institutional clients. The Board noted the findings of the 2010 ad hoc joint committee (created with the board of other Fidelity funds), which reviewed and compared Fidelity's institutional investment advisory business with its business of providing services to the Fidelity funds, including the differences in services provided, fees charged, and costs incurred, as well as competition in their respective marketplaces.
Based on its review of total expense ratios and fees charged to other Fidelity clients, the Board concluded that the total expense ratio of each class of the fund was reasonable, although in some cases above the median of the universe presented for comparison, in light of the services that the fund and its shareholders receive and the other factors considered.
Costs of the Services and Profitability. The Board considered the revenues earned and the expenses incurred by Fidelity in conducting the business of developing, marketing, distributing, managing, administering and servicing the fund and its shareholders. The Board also considered the level of Fidelity's profits in respect of all the Fidelity funds.
On an annual basis, FMR presents to the Board Fidelity's profitability for the fund. Fidelity calculates the profitability for each fund, as well as aggregate profitability for groups of Fidelity funds and all Fidelity funds, using a series of detailed revenue and cost allocation methodologies which originate with the books and records of Fidelity on which Fidelity's audited financial statements are based. The Audit Committee of the Board reviews any significant changes from the prior year's methodologies.
PricewaterhouseCoopers LLP (PwC), independent registered public accounting firm and auditor to Fidelity and certain Fidelity funds, has been engaged annually by the Board as part of the Board's assessment of Fidelity's profitability analysis. PwC's engagement includes the review and assessment of Fidelity's methodologies used in determining the revenues and expenses attributable to Fidelity's mutual fund business, and completion of agreed-upon procedures surrounding the mathematical accuracy of fund profitability and its conformity to allocation methodologies. After considering PwC's reports issued under the engagement and information provided by Fidelity, the Board concluded that while other allocation methods may also be reasonable, Fidelity's profitability methodologies are reasonable in all material respects.
Annual Report
Board Approval of Investment Advisory Contracts and
Management Fees - continued
The Board also reviewed Fidelity's non-fund businesses and fall-out benefits related to the mutual fund business as well as cases where Fidelity's affiliates may benefit from or be related to the fund's business.
The Board considered the costs of the services provided by and the profits realized by Fidelity in connection with the operation of the fund and was satisfied that the profitability was not excessive in the circumstances.
Economies of Scale. The Board considered whether there have been economies of scale in respect of the management of the Fidelity funds, whether the Fidelity funds (including the fund) have appropriately benefited from any such economies of scale, and whether there is potential for realization of any further economies of scale. The Board considered the extent to which the fund will benefit from economies of scale through increased services to the fund, through waivers or reimbursements, or through fee or expense reductions. The Board also noted that in 2009, it and the board of other Fidelity funds created an ad hoc committee (the Economies of Scale Committee) to analyze whether FMR attains economies of scale in respect of the management and servicing of the Fidelity funds, whether the Fidelity funds have appropriately benefited from such economies of scale, and whether there is potential for realization of any further economies of scale.
The Board recognized that the fund's management contract incorporates a "group fee" structure, which provides for lower group fee rates as total fund assets under FMR's management increase, and for higher group fee rates as total fund assets under FMR's management decrease. FMR calculates the group fee rates based on a tiered asset "breakpoint" schedule that varies based on asset class. The Board considered that the group fee is designed to deliver the benefits of economies of scale to fund shareholders when total Fidelity fund assets increase, even if assets of any particular fund are unchanged or have declined, because some portion of Fidelity's costs are attributable to services provided to all Fidelity funds, and all funds benefit if those costs can be allocated among more assets. The Board concluded that, given the group fee structure, fund shareholders will benefit from lower management fees as assets under FMR's management increase at the fund complex level, regardless of whether Fidelity achieves any such economies of scale.
The Board concluded, taking into account the analysis of the Economies of Scale Committee, that economies of scale, if any, are being appropriately shared between fund shareholders and Fidelity.
Annual Report
Additional Information Requested by the Board. In order to develop fully the factual basis for consideration of the Fidelity funds' Advisory Contracts, the Board requested and received additional information on certain topics, including (i) fund performance trends, actions to be taken by FMR to improve certain funds' overall performance, and Fidelity's long-term strategies for certain funds; (ii) the potential to further rationalize the Fidelity fund lineup with the possibility of achieving savings for the funds and Fidelity; (iii) Fidelity's compensation structure for portfolio managers and other key investment personnel; (iv) the amount of the investment that each portfolio manager has made in the Fidelity fund(s) that he or she manages; (v) the realization of fall-out benefits in certain Fidelity business units; (vi) Fidelity's group fee structures, the potential impact of regulatory changes on such structures, and the rationale for the individual fee rates of certain funds; (vii) fund profitability methodology, including Fidelity's cost allocation methodology, and the impact of certain factors on fund profitability results; (viii) trends regarding industry use of performance fee structures and the possibility of implementing performance fee structures for additional funds; and (ix) the impact of net redemptions from the Fidelity funds.
Based on its evaluation of all of the conclusions noted above, and after considering all factors it believed relevant, the Board ultimately concluded that the advisory fee structures are fair and reasonable, and that the fund's Advisory Contracts should be renewed.
Annual Report
Investment Adviser
Fidelity Management & Research Company
Boston, MA
Investment Sub-Advisers
FMR Co., Inc.
Fidelity Management & Research
(U.K.) Inc.
FIL Investment Advisors
FIL Investment Advisors (U.K.) Limited
Fidelity Management & Research
(Hong Kong) Limited
Fidelity Management & Research
(Japan) Inc.
General Distributor
Fidelity Distributors Corporation
Smithfield, RI
Transfer and Service Agents
Fidelity Investments Institutional Operations Company, Inc.
Boston, MA
Fidelity Service Company, Inc.
Boston, MA
Custodian
State Street Bank and Trust Company
Quincy, MA
(Fidelity Investment logo)(registered trademark)
AEURI-UANN-1212
1.784740.109
(Fidelity Investment logo)(registered trademark)
Fidelity Advisor®
Global Equity Income
Fund - Class A, Class T, and Class C
Annual Report
October 31, 2012
(Fidelity Cover Art)
Contents
Management's Discussion of Fund Performance | (Click Here) | The Portfolio Manager's review of fund performance and strategy. |
Shareholder Expense Example | (Click Here) | An example of shareholder expenses. |
Investment Summary | (Click Here) | A summary of the fund's holdings. |
Investments | (Click Here) | A complete list of the fund's investments with their market values. |
Financial Statements | (Click Here) | Statements of assets and liabilities, operations, and changes in net assets, as well as financial highlights. |
Notes | (Click Here) | Notes to the financial statements. |
Report of Independent Registered Public Accounting Firm | (Click Here) | |
Trustees and Officers | (Click Here) | |
Distributions | (Click Here) | |
Board Approval of Investment Advisory Contracts and Management Fees | (Click Here) | |
To view a fund's proxy voting guidelines and proxy voting record for the 12-month period ended June 30, visit http://www.fidelity.com/proxyvotingresults or visit the Securities and Exchange Commission's (SEC) web site at http://www.sec.gov. You may also call 1-877-208-0098 to request a free copy of the proxy voting guidelines.
Standard & Poor's, S&P and S&P 500 are registered service marks of The McGraw-Hill Companies, Inc. and have been licensed for use by Fidelity Distributors Corporation.
Other third party marks appearing herein are the property of their respective owners.
All other marks appearing herein are registered or unregistered trademarks or service marks of FMR LLC or an affiliated company. © 2012 FMR LLC. All rights reserved.
Annual Report
This report and the financial statements contained herein are submitted for the general information of the shareholders of the fund. This report is not authorized for distribution to prospective investors in the fund unless preceded or accompanied by an effective prospectus.
A fund files its complete schedule of portfolio holdings with the SEC for the first and third quarters of each fiscal year on Form N-Q. Forms N-Q are available on the SEC's web site at http://www.sec.gov. A fund's Forms N-Q may be reviewed and copied at the SEC's Public Reference Room in Washington, DC. Information regarding the operation of the SEC's Public Reference Room may be obtained by calling 1-800-SEC-0330. For a complete list of a fund's portfolio holdings, view the most recent holdings listing, semiannual report, or annual report on Fidelity's web site at http://www.fidelity.com, http://www.advisor.fidelity.com, or http://www.401k.com, as applicable.
NOT FDIC INSURED • MAY LOSE VALUE • NO BANK GUARANTEE
Neither the fund nor Fidelity Distributors Corporation is a bank.
Annual Report
Market Recap: Global stocks experienced pendulum-like swings during the 12 months ending October 31, 2012, finishing the period with a solid advance. The market faced periodic bouts of volatility this past year, as a number of macroeconomic concerns - including the eurozone debt crisis, the strength and pace of the U.S. economic recovery, and a slowdown in China's once-blistering growth - dominated headlines and weighed on investors. While a stronger U.S. dollar provided an additional head wind for foreign investments, stocks worldwide rose 8.96% for the 12 months, as measured by the MSCI® ACWI® (All Country World Index) Index, largely buttressed in the summer by pledges of accommodative monetary action from eurozone officials, as well as signs that the U.S. housing market was on the mend. Within the index, the U.S. showed the most impressive gain among major markets, advancing 15%, closely followed by Asia-Pacific ex Japan (+10%). A number of core European components, most notably Germany (+11%), Switzerland (+10%) and the U.K. (+9%), benefited from optimism about the eurozone's ability to resolve its debt woes. However, continued weakness in peripheral European markets caused the region to lag the index overall. Elsewhere, results from Canada (+3%) and the generally more volatile emerging markets (+2%) each fell short of the MSCI index, while Japan was among the few benchmark constituents to finish in the red, returning about -3%.
Comments from Ramona Persaud, Portfolio Manager of Fidelity Advisor® Global Equity Income Fund: Since its inception on May 2, 2012, through October 31, 2012, the fund's Class A, Class T and Class C shares returned 2.51%, 2.31% and 2.12%, respectively (excluding sales charges), outperforming the 1.67% gain of the MSCI® ACWI®. Stock selection and sector positioning were equally additive for the period, with the biggest boosts coming from positioning in health care and materials. At the stock level, large-cap pharmaceuticals firm Merck was our top contributor. Merck was trading at what I believed to be a reasonable valuation, but was also benefiting from an improving product pipeline and its continued focus on shareholder friendliness. French pharma firm Sanofi also helped bolster our results within health care, as the stock rebounded off a very cheap valuation. In materials, shares of chemicals company LyondellBassell Industries contributed when cyclical names gained favor later in the period. Conversely, the food/beverage/tobacco industry fell out of favor when the market took a "risk-on" tilt, and our positions here struggled, mainly tobacco stocks Swedish Match, Lorillard and U.K.-based British American Tobacco.
The views expressed above reflect those of the portfolio manager(s) only through the end of the period as stated on the cover of this report and do not necessarily represent the views of Fidelity or any other person in the Fidelity organization. Any such views are subject to change at any time based upon market or other conditions and Fidelity disclaims any responsibility to update such views. These views may not be relied on as investment advice and, because investment decisions for a Fidelity fund are based on numerous factors, may not be relied on as an indication of trading intent on behalf of any Fidelity fund.
Annual Report
Shareholder Expense Example
As a shareholder of the Fund, you incur two types of costs: (1) transaction costs, including sales charges (loads) on purchase payments or redemption proceeds, and (2) ongoing costs, including management fees, distribution and/or service (12b-1) fees and other Fund expenses. This Example is intended to help you understand your ongoing costs (in dollars) of investing in the Fund and to compare these costs with the ongoing costs of investing in other mutual funds.
The actual expense Example is based on an investment of $1,000 invested at the beginning of the period and held for the entire period (May 2, 2012 to October 31, 2012). The hypothetical expense Example is based on an investment of $1,000 invested for the one-half year period (May 1, 2012 to October 31, 2012).
Actual Expenses
The first line of the accompanying table for each class of the Fund provides information about actual account values and actual expenses. You may use the information in this line, together with the amount you invested, to estimate the expenses that you paid over the period. Simply divide your account value by $1,000.00 (for example, an $8,600 account value divided by $1,000.00 = 8.6), then multiply the result by the number in the first line for a class of the Fund under the heading entitled "Expenses Paid During Period" to estimate the expenses you paid on your account during this period. In addition, the Fund, as a shareholder in the underlying Fidelity Central Funds, will indirectly bear its pro-rata share of the fees and expenses incurred by the underlying Fidelity Central Funds. These fees and expenses are not included in the Fund's annualized expense ratio used to calculate the expense estimate in the table below.
Hypothetical Example for Comparison Purposes
The second line of the accompanying table for each class of the Fund provides information about hypothetical account values and hypothetical expenses based on a Class' actual expense ratio and an assumed rate of return of 5% per year before expenses, which is not the Class' actual return. The hypothetical account values and expenses may not be used to estimate the actual ending account balance or expenses you paid for the period. You may use this information to compare the ongoing costs of investing in the Fund and other funds. To do so, compare this 5% hypothetical example with the 5% hypothetical examples that appear in the shareholder reports of the other funds. In addition, the Fund, as a shareholder in the underlying Fidelity Central Funds, will indirectly bear its pro-rata share of the fees and expenses incurred by the underlying Fidelity Central Funds. These fees and expenses are not included in the Fund's annualized expense ratio used to calculate the expense estimate in the table below.
Please note that the expenses shown in the table are meant to highlight your ongoing costs only and do not reflect any transaction costs. Therefore, the second line of the table is useful in comparing ongoing costs only, and will not help you determine the relative total costs of owning different funds. In addition, if these transactional costs were included, your costs would have been higher.
Annual Report
| Annualized
Expense Ratio | Beginning
Account Value | Ending
Account Value
October 31, 2012 | Expenses Paid
During Period |
Class A | 1.45% | | | |
Actual | | $ 1,000.00 | $ 1,025.10 | $ 7.34 B |
HypotheticalA | | $ 1,000.00 | $ 1,017.85 | $ 7.35 C |
Class T | 1.70% | | | |
Actual | | $ 1,000.00 | $ 1,023.10 | $ 8.60 B |
HypotheticalA | | $ 1,000.00 | $ 1,016.59 | $ 8.62 C |
Class C | 2.20% | | | |
Actual | | $ 1,000.00 | $ 1,021.20 | $ 11.12 B |
HypotheticalA | | $ 1,000.00 | $ 1,014.08 | $ 11.14 C |
Institutional Class | 1.20% | | | |
Actual | | $ 1,000.00 | $ 1,026.10 | $ 6.08 B |
HypotheticalA | | $ 1,000.00 | $ 1,019.10 | $ 6.09 C |
A 5% return per year before expenses
B Actual expenses are equal to each Class' annualized expense ratio, multiplied by the average account value over the period, multiplied by 183/366 (to reflect the period May 2, 2012 to October 31, 2012).
C Hypothetical expenses are equal to each Class' annualized expense ratio, multiplied by the average account value over the period, multiplied by 184/366 (to reflect the one-half year period).
Annual Report
Investment Changes (Unaudited)
Top Five Stocks as of October 31, 2012 |
| % of fund's
net assets |
Johnson & Johnson (United States of America, Pharmaceuticals) | 2.7 |
Apple, Inc. (United States of America, Computers & Peripherals) | 2.6 |
Chevron Corp. (United States of America, Oil, Gas & Consumable Fuels) | 2.4 |
Merck & Co., Inc. (United States of America, Pharmaceuticals) | 2.3 |
IBM Corp. (United States of America, IT Services) | 2.2 |
| 12.2 |
Top Five Market Sectors as of October 31, 2012 |
| % of fund's
net assets |
Financials | 17.1 |
Consumer Staples | 14.2 |
Health Care | 13.4 |
Energy | 10.2 |
Information Technology | 9.8 |
Top Five Countries as of October 31, 2012 |
(excluding cash equivalents) | % of fund's
net assets |
United States of America | 43.4 |
United Kingdom | 14.6 |
Japan | 5.7 |
Sweden | 3.5 |
Switzerland | 3.2 |
Percentages are adjusted for the effect of open futures contracts, if applicable. |
Asset Allocation (% of fund's net assets) |
As of October 31, 2012 | |
 | Stocks 95.9% | |  | | |
 | Short-Term
Investments and
Net Other Assets (Liabilities) 4.1% | |  | | |

Annual Report
Investments October 31, 2012
Showing Percentage of Net Assets
Common Stocks - 95.1% |
| Shares | | Value |
Australia - 1.3% |
SP AusNet unit | 11,102 | | $ 12,216 |
Spark Infrastructure Group unit | 7,187 | | 12,608 |
Telstra Corp. Ltd. | 3,485 | | 14,977 |
TOTAL AUSTRALIA | | 39,801 |
Bailiwick of Jersey - 1.1% |
Informa PLC | 2,997 | | 19,355 |
Wolseley PLC | 307 | | 13,421 |
TOTAL BAILIWICK OF JERSEY | | 32,776 |
Brazil - 2.1% |
Companhia de Bebidas das Americas (AmBev) (PN) sponsored ADR | 268 | | 10,932 |
Companhia de Saneamento Basico do Estado de Sao Paulo (SABESP) sponsored ADR | 200 | | 16,802 |
Itau Unibanco Holdings SA sponsored ADR | 1,168 | | 17,029 |
Multiplus SA | 900 | | 20,911 |
TOTAL BRAZIL | | 65,674 |
Canada - 0.4% |
Fairfax Financial Holdings Ltd. (sub. vtg.) | 30 | | 11,129 |
Cayman Islands - 0.2% |
Pico Far East Holdings Ltd. | 32,000 | | 7,845 |
Chile - 0.5% |
Inversiones La Construccion SA | 859 | | 15,175 |
France - 3.1% |
Arkema SA | 200 | | 18,234 |
Euler Hermes SA | 177 | | 12,200 |
Ipsos SA | 400 | | 14,055 |
Sanofi SA | 587 | | 51,555 |
TOTAL FRANCE | | 96,044 |
Germany - 0.6% |
Hugo Boss AG | 110 | | 11,011 |
Muehlbauer Holding AG & Co. | 350 | | 8,905 |
TOTAL GERMANY | | 19,916 |
Hong Kong - 1.4% |
HKT Trust / HKT Ltd. unit | 45,000 | | 41,748 |
Indonesia - 0.4% |
PT Media Nusantara Citra Tbk | 45,000 | | 13,235 |
Common Stocks - continued |
| Shares | | Value |
Ireland - 2.2% |
Accenture PLC Class A | 675 | | $ 45,502 |
CRH PLC | 10 | | 186 |
FBD Holdings PLC | 700 | | 8,755 |
Irish Continental Group PLC unit | 500 | | 12,184 |
TOTAL IRELAND | | 66,627 |
Israel - 1.0% |
Israel Chemicals Ltd. | 1,500 | | 18,771 |
Rami Levi Chain Stores Hashikma Marketing 2006 Ltd. | 400 | | 11,917 |
TOTAL ISRAEL | | 30,688 |
Italy - 1.3% |
ENI SpA | 1,700 | | 39,119 |
Japan - 5.7% |
Aozora Bank Ltd. | 3,000 | | 8,455 |
Autobacs Seven Co. Ltd. | 200 | | 8,205 |
Canon, Inc. | 400 | | 13,000 |
Daito Trust Construction Co. Ltd. | 200 | | 20,193 |
Japan Retail Fund Investment Corp. | 9 | | 16,404 |
Japan Tobacco, Inc. | 1,400 | | 38,687 |
Nippon Telegraph & Telephone Corp. | 400 | | 18,291 |
Relo Holdings Corp. | 700 | | 23,272 |
Seven Bank Ltd. | 6,900 | | 19,707 |
USS Co. Ltd. | 100 | | 10,510 |
TOTAL JAPAN | | 176,724 |
Korea (South) - 2.0% |
DGB Financial Group Co. Ltd. | 760 | | 9,619 |
KT&G Corp. | 382 | | 29,115 |
LG Telecom Ltd. | 2,020 | | 12,913 |
YESCO Co. Ltd. | 320 | | 8,819 |
TOTAL KOREA (SOUTH) | | 60,466 |
Netherlands - 1.8% |
Koninklijke Philips Electronics NV | 1,000 | | 25,046 |
LyondellBasell Industries NV Class A | 568 | | 30,326 |
TOTAL NETHERLANDS | | 55,372 |
Nigeria - 0.5% |
Guaranty Trust Bank PLC | 59,682 | | 7,524 |
Nestle Foods Nigeria PLC | 1,752 | | 7,530 |
TOTAL NIGERIA | | 15,054 |
Common Stocks - continued |
| Shares | | Value |
Norway - 0.8% |
Telenor ASA | 1,200 | | $ 23,595 |
Panama - 1.0% |
Copa Holdings SA Class A | 350 | | 32,487 |
South Africa - 1.0% |
Clicks Group Ltd. | 3,434 | | 23,676 |
Foschini Ltd. | 500 | | 7,260 |
TOTAL SOUTH AFRICA | | 30,936 |
Spain - 0.5% |
Grifols SA ADR | 600 | | 15,096 |
Sweden - 3.5% |
Intrum Justitia AB | 1,450 | | 20,986 |
Svenska Handelsbanken AB (A Shares) | 1,210 | | 41,447 |
Swedish Match Co. AB | 1,310 | | 44,635 |
TOTAL SWEDEN | | 107,068 |
Switzerland - 3.2% |
Clariant AG (Reg.) | 1,664 | | 17,814 |
Roche Holding AG (participation certificate) | 310 | | 59,617 |
UBS AG | 1,510 | | 22,655 |
TOTAL SWITZERLAND | | 100,086 |
Taiwan - 1.6% |
Far EasTone Telecommunications Co. Ltd. | 8,000 | | 18,459 |
Taiwan Semiconductor Manufacturing Co. Ltd. | 10,000 | | 30,473 |
TOTAL TAIWAN | | 48,932 |
United Kingdom - 14.6% |
Barclays PLC | 6,534 | | 24,161 |
BP PLC | 5,324 | | 38,022 |
British American Tobacco PLC (United Kingdom) | 1,100 | | 54,560 |
Dunelm Group PLC | 1,200 | | 12,975 |
Ensco PLC Class A | 278 | | 16,074 |
GlaxoSmithKline PLC | 2,363 | | 52,949 |
Hilton Food Group PLC | 4,288 | | 19,220 |
ICAP PLC | 3,000 | | 15,739 |
London Stock Exchange Group PLC | 1,400 | | 22,039 |
Reckitt Benckiser Group PLC | 878 | | 53,133 |
Royal Dutch Shell PLC Class A (United Kingdom) | 1,498 | | 51,400 |
Common Stocks - continued |
| Shares | | Value |
United Kingdom - continued |
Vodafone Group PLC | 21,351 | | $ 57,982 |
WH Smith PLC | 2,956 | | 29,623 |
TOTAL UNITED KINGDOM | | 447,877 |
United States of America - 43.3% |
Altria Group, Inc. | 1,033 | | 32,849 |
American Tower Corp. | 260 | | 19,575 |
Analog Devices, Inc. | 909 | | 35,551 |
Apple, Inc. | 135 | | 80,339 |
Cardinal Health, Inc. | 240 | | 9,871 |
Cedar Fair LP (depository unit) | 1,006 | | 36,065 |
CenturyLink, Inc. | 505 | | 19,382 |
Chevron Corp. | 664 | | 73,179 |
CME Group, Inc. | 203 | | 11,354 |
Colgate-Palmolive Co. | 288 | | 30,228 |
Comcast Corp. Class A | 964 | | 36,160 |
Corrections Corp. of America | 260 | | 8,749 |
Dr Pepper Snapple Group, Inc. | 1,024 | | 43,878 |
Eli Lilly & Co. | 481 | | 23,391 |
Emerson Electric Co. | 440 | | 21,309 |
Exxon Mobil Corp. | 364 | | 33,186 |
General Electric Co. | 2,628 | | 55,346 |
Hubbell, Inc. Class B | 390 | | 32,651 |
IBM Corp. | 346 | | 67,307 |
Johnson & Johnson | 1,176 | | 83,284 |
JPMorgan Chase & Co. | 1,000 | | 41,680 |
Limited Brands, Inc. | 340 | | 16,283 |
Lorillard, Inc. | 233 | | 27,030 |
M&T Bank Corp. | 256 | | 26,650 |
McDonald's Corp. | 200 | | 17,360 |
Merck & Co., Inc. | 1,584 | | 72,278 |
Microsoft Corp. | 1,100 | | 31,389 |
Pfizer, Inc. | 1,423 | | 35,390 |
PG&E Corp. | 435 | | 18,496 |
PNC Financial Services Group, Inc. | 300 | | 17,457 |
Psychemedics Corp. | 960 | | 10,982 |
Sempra Energy | 280 | | 19,530 |
The Williams Companies, Inc. | 1,298 | | 45,417 |
U.S. Bancorp | 1,718 | | 57,055 |
United Technologies Corp. | 390 | | 30,482 |
VF Corp. | 215 | | 33,643 |
Common Stocks - continued |
| Shares | | Value |
United States of America - continued |
Wells Fargo & Co. | 1,931 | | $ 65,055 |
Western Gas Partners LP | 220 | | 11,216 |
TOTAL UNITED STATES OF AMERICA | | 1,331,047 |
TOTAL COMMON STOCKS (Cost $2,849,958) |
2,924,517
|
Preferred Stocks - 0.8% |
| | | |
Convertible Preferred Stocks - 0.1% |
United States of America - 0.1% |
United Technologies Corp. 7.50% | 60 | | 3,263 |
Nonconvertible Preferred Stocks - 0.7% |
Germany - 0.7% |
Volkswagen AG | 110 | | 22,755 |
TOTAL PREFERRED STOCKS (Cost $23,375) |
26,018
|
Money Market Funds - 4.3% |
| | | |
Fidelity Cash Central Fund, 0.19% (a)
(Cost $131,140) | 131,140 | |
131,140
|
TOTAL INVESTMENT PORTFOLIO - 100.2% (Cost $3,004,473) | 3,081,675 |
NET OTHER ASSETS (LIABILITIES) - (0.2)% | (6,824) |
NET ASSETS - 100% | $ 3,074,851 |
Legend |
(a) Affiliated fund that is available only to investment companies and other accounts managed by Fidelity Investments. The rate quoted is the annualized seven-day yield of the fund at period end. A complete unaudited listing of the fund's holdings as of its most recent quarter end is available upon request. In addition, each Fidelity Central Fund's financial statements, which are not covered by the Fund's Report of Independent Registered Public Accounting Firm, are available on the SEC's website or upon request. |
Affiliated Central Funds |
Information regarding fiscal year to date income earned by the Fund from investments in Fidelity Central Funds is as follows: |
Fund | Income earned |
Fidelity Cash Central Fund | $ 162 |
Other Information |
Categorizations in the Schedule of Investments are based on country or territory of incorporation. |
The following is a summary of the inputs used, as of October 31, 2012, involving the Fund's assets and liabilities carried at fair value. The inputs or methodology used for valuing securities may not be an indication of the risk associated with investing in those securities. For more information on valuation inputs, and their aggregation into the levels used in the table below, please refer to the Security Valuation section in the accompanying Notes to Financial Statements. |
Valuation Inputs at Reporting Date: |
Description | Total | Level 1 | Level 2 | Level 3 |
Investments in Securities: | | | | |
Equities: | | | | |
Consumer Discretionary | $ 296,340 | $ 296,340 | $ - | $ - |
Consumer Staples | 427,390 | 372,830 | 54,560 | - |
Energy | 307,613 | 179,072 | 128,541 | - |
Financials | 534,329 | 487,513 | 46,816 | - |
Health Care | 414,413 | 309,909 | 104,504 | - |
Industrials | 285,740 | 260,694 | 25,046 | - |
Information Technology | 303,561 | 260,088 | 43,473 | - |
Materials | 85,331 | 85,145 | 186 | - |
Telecommunication Services | 207,347 | 131,074 | 76,273 | - |
Utilities | 88,471 | 88,471 | - | - |
Money Market Funds | 131,140 | 131,140 | - | - |
Total Investments in Securities: | $ 3,081,675 | $ 2,602,276 | $ 479,399 | $ - |
See accompanying notes which are an integral part of the financial statements.
Annual Report
Statement of Assets and Liabilities
| October 31, 2012 |
| | |
Assets | | |
Investment in securities, at value - See accompanying schedule: Unaffiliated issuers (cost $2,873,333) | $ 2,950,535 | |
Fidelity Central Funds (cost $131,140) | 131,140 | |
Total Investments (cost $3,004,473) | | $ 3,081,675 |
Receivable for investments sold | | 66,825 |
Dividends receivable | | 5,018 |
Distributions receivable from Fidelity Central Funds | | 28 |
Prepaid expenses | | 32,926 |
Receivable from investment adviser for expense reductions | | 14,923 |
Other receivables | | 13 |
Total assets | | 3,201,408 |
| | |
Liabilities | | |
Payable to custodian bank | $ 25 | |
Payable for investments purchased | 82,801 | |
Accrued management fee | 1,798 | |
Distribution and service plan fees payable | 1,011 | |
Custodian fees payable | 2,736 | |
Audit fees payable | 37,757 | |
Other affiliated payables | 429 | |
Total liabilities | | 126,557 |
| | |
Net Assets | | $ 3,074,851 |
Net Assets consist of: | | |
Paid in capital | | $ 3,025,772 |
Distributions in excess of net investment income | | (1) |
Accumulated undistributed net realized gain (loss) on investments and foreign currency transactions | | (28,076) |
Net unrealized appreciation (depreciation) on investments and assets and liabilities in foreign currencies | | 77,156 |
Net Assets | | $ 3,074,851 |
See accompanying notes which are an integral part of the financial statements.
Annual Report
Statement of Assets and Liabilities - continued
| October 31, 2012 |
| | |
Calculation of Maximum Offering Price
Class A:
Net Asset Value and redemption price per share
($756,412 ÷ 74,554 shares) | | $ 10.15 |
| | |
Maximum offering price per share (100/94.25 of $10.15) | | $ 10.77 |
Class T:
Net Asset Value and redemption price per share ($713,863 ÷ 70,379 shares) | | $ 10.14 |
| | |
Maximum offering price per share (100/96.50 of $10.14) | | $ 10.51 |
Class C:
Net Asset Value and offering price per share ($665,870 ÷ 65,690 shares)A | | $ 10.14 |
| | |
Institutional Class:
Net Asset Value, offering price and redemption price per share ($938,706 ÷ 92,498 shares) | | $ 10.15 |
A Redemption price per share is equal to net asset value less any applicable contingent deferred sales charge.
See accompanying notes which are an integral part of the financial statements.
Annual Report
Financial Statements - continued
Statement of Operations
| | For the period
May 2, 2012
(commencement of
operations) to
October 31, 2012 |
| | |
Investment Income | | |
Dividends | | $ 49,208 |
Interest | | 32 |
Income from Fidelity Central Funds | | 162 |
Income before foreign taxes withheld | | 49,402 |
Less foreign taxes withheld | | (2,230) |
Total income | | 47,172 |
| | |
Expenses | | |
Management fee | $ 9,913 | |
Transfer agent fees | 1,775 | |
Distribution and service plan fees | 5,523 | |
Accounting fees and expenses | 726 | |
Custodian fees and expenses | 8,809 | |
Independent trustees' compensation | 8 | |
Registration fees | 34,895 | |
Audit | 45,803 | |
Legal | 3 | |
Total expenses before reductions | 107,455 | |
Expense reductions | (84,989) | 22,466 |
Net investment income (loss) | | 24,706 |
Realized and Unrealized Gain (Loss) Net realized gain (loss) on: | | |
Investment securities: | | |
Unaffiliated issuers | (26,546) | |
Foreign currency transactions | 298 | |
Total net realized gain (loss) | | (26,248) |
Change in net unrealized appreciation (depreciation) on: Investment securities | 77,202 | |
Assets and liabilities in foreign currencies | (46) | |
Total change in net unrealized appreciation (depreciation) | | 77,156 |
Net gain (loss) | | 50,908 |
Net increase (decrease) in net assets resulting from operations | | $ 75,614 |
See accompanying notes which are an integral part of the financial statements.
Annual Report
Statement of Changes in Net Assets
| For the period
May 2, 2012
(commencement of
operations) to
October 31, 2012 |
Increase (Decrease) in Net Assets | |
Operations | |
Net investment income (loss) | $ 24,706 |
Net realized gain (loss) | (26,248) |
Change in net unrealized appreciation (depreciation) | 77,156 |
Net increase (decrease) in net assets resulting
from operations | 75,614 |
Distributions to shareholders from net investment income | (26,857) |
Share transactions - net increase (decrease) | 3,026,094 |
Total increase (decrease) in net assets | 3,074,851 |
| |
Net Assets | |
Beginning of period | - |
End of period (including distributions in excess of net investment income of $1) | $ 3,074,851 |
See accompanying notes which are an integral part of the financial statements.
Annual Report
Financial Highlights - Class A
Period ended October 31, | 2012H |
Selected Per-Share Data | |
Net asset value, beginning of period | $ 10.00 |
Income from Investment Operations | |
Net investment income (loss) E | .09 |
Net realized and unrealized gain (loss) | .16 |
Total from investment operations | .25 |
Distributions from net investment income | (.10) |
Net asset value, end of period | $ 10.15 |
Total ReturnB, C, D | 2.51% |
Ratios to Average Net Assets F, I | |
Expenses before reductions | 7.41% A |
Expenses net of fee waivers, if any | 1.45% A |
Expenses net of all reductions | 1.44% A |
Net investment income (loss) | 1.89% A |
Supplemental Data | |
Net assets, end of period (000 omitted) | $ 756 |
Portfolio turnover rate G | 36% J |
A Annualized
B Total returns for periods of less than one year are not annualized.
C Total returns would have been lower if certain expenses had not been reduced during the applicable periods shown.
D Total returns do not include the effect of the sales charges.
E Calculated based on average shares outstanding during the period.
F Fees and expenses of any underlying Fidelity Central Funds are not included in the Fund's expense ratio. The Fund indirectly bears its proportionate share of the expenses of any underlying Fidelity Central Funds.
G Amount does not include the portfolio activity of any underlying Fidelity Central Funds.
H For the period May 2, 2012 (commencement of operations) to October 31, 2012.
I Expense ratios reflect operating expenses of the class. Expenses before reductions do not reflect amounts reimbursed by the investment adviser or reductions from brokerage service arrangements or reductions from other expense offset arrangements and do not represent the amount paid by the class during periods when reimbursements or reductions occur. Expense ratios before reductions for start-up periods may not be representative of longer-term operating periods. Expenses net of fee waivers reflect expenses after reimbursement by the investment adviser but prior to reductions from brokerage service arrangements or other expense offset arrangements. Expenses net of all reductions represent the net expenses paid by the class.
J Amount not annualized.
See accompanying notes which are an integral part of the financial statements.
Annual Report
Financial Highlights - Class T
Period ended October 31, | 2012H |
Selected Per-Share Data | |
Net asset value, beginning of period | $ 10.00 |
Income from Investment Operations | |
Net investment income (loss) E | .08 |
Net realized and unrealized gain (loss) | .15 |
Total from investment operations | .23 |
Distributions from net investment income | (.09) |
Net asset value, end of period | $ 10.14 |
Total ReturnB, C, D | 2.31% |
Ratios to Average Net Assets F, I | |
Expenses before reductions | 7.68% A |
Expenses net of fee waivers, if any | 1.70% A |
Expenses net of all reductions | 1.69% A |
Net investment income (loss) | 1.64% A |
Supplemental Data | |
Net assets, end of period (000 omitted) | $ 714 |
Portfolio turnover rate G | 36% J |
A Annualized
B Total returns for periods of less than one year are not annualized.
C Total returns would have been lower if certain expenses had not been reduced during the applicable periods shown.
D Total returns do not include the effect of the sales charges.
E Calculated based on average shares outstanding during the period.
F Fees and expenses of any underlying Fidelity Central Funds are not included in the Fund's expense ratio. The Fund indirectly bears its proportionate share of the expenses of any underlying Fidelity Central Funds.
G Amount does not include the portfolio activity of any underlying Fidelity Central Funds.
H For the period May 2, 2012 (commencement of operations) to October 31, 2012.
I Expense ratios reflect operating expenses of the class. Expenses before reductions do not reflect amounts reimbursed by the investment adviser or reductions from brokerage service arrangements or reductions from other expense offset arrangements and do not represent the amount paid by the class during periods when reimbursements or reductions occur. Expense ratios before reductions for start-up periods may not be representative of longer-term operating periods. Expenses net of fee waivers reflect expenses after reimbursement by the investment adviser but prior to reductions from brokerage service arrangements or other expense offset arrangements. Expenses net of all reductions represent the net expenses paid by the class.
J Amount not annualized.
See accompanying notes which are an integral part of the financial statements.
Annual Report
Financial Highlights - Class C
Period ended October 31, | 2012H |
Selected Per-Share Data | |
Net asset value, beginning of period | $ 10.00 |
Income from Investment Operations | |
Net investment income (loss)E | .06 |
Net realized and unrealized gain (loss) | .15 |
Total from investment operations | .21 |
Distributions from net investment income | (.07) |
Net asset value, end of period | $ 10.14 |
Total ReturnB, C, D | 2.12% |
Ratios to Average Net AssetsF, I | |
Expenses before reductions | 8.19% A |
Expenses net of fee waivers, if any | 2.20% A |
Expenses net of all reductions | 2.19% A |
Net investment income (loss) | 1.14% A |
Supplemental Data | |
Net assets, end of period (000 omitted) | $ 666 |
Portfolio turnover rateG | 36% J |
A Annualized
B Total returns for periods of less than one year are not annualized.
C Total returns would have been lower if certain expenses had not been reduced during the applicable periods shown.
D Total returns do not include the effect of the contingent deferred sales charge.
E Calculated based on average shares outstanding during the period.
F Fees and expenses of any underlying Fidelity Central Funds are not included in the Fund's expense ratio. The Fund indirectly bears its proportionate share of the expenses of any underlying Fidelity Central Funds.
G Amount does not include the portfolio activity of any underlying Fidelity Central Funds.
H For the period May 2, 2012 (commencement of operations) to October 31, 2012.
I Expense ratios reflect operating expenses of the class. Expenses before reductions do not reflect amounts reimbursed by the investment adviser or reductions from brokerage service arrangements or reductions from other expense offset arrangements and do not represent the amount paid by the class during periods when reimbursements or reductions occur. Expense ratios before reductions for start-up periods may not be representative of longer-term operating periods. Expenses net of fee waivers reflect expenses after reimbursement by the investment adviser but prior to reductions from brokerage service arrangements or other expense offset arrangements. Expenses net of all reductions represent the net expenses paid by the class.
J Amount not annualized.
See accompanying notes which are an integral part of the financial statements.
Annual Report
Financial Highlights - Institutional Class
Period ended October 31, | 2012 G |
Selected Per-Share Data | |
Net asset value, beginning of period | $ 10.00 |
Income from Investment Operations | |
Net investment income (loss)D | .10 |
Net realized and unrealized gain (loss) | .16 |
Total from investment operations | .26 |
Distributions from net investment income | (.11) |
Net asset value, end of period | $ 10.15 |
Total ReturnB, C | 2.61% |
Ratios to Average Net AssetsE, H | |
Expenses before reductions | 7.23% A |
Expenses net of fee waivers, if any | 1.20% A |
Expenses net of all reductions | 1.19% A |
Net investment income (loss) | 2.14% A |
Supplemental Data | |
Net assets, end of period (000 omitted) | $ 939 |
Portfolio turnover rate F | 36% I |
A Annualized
B Total returns for periods of less than one year are not annualized.
C Total returns would have been lower if certain expenses had not been reduced during the applicable periods shown.
D Calculated based on average shares outstanding during the period.
E Fees and expenses of any underlying Fidelity Central Funds are not included in the Fund's expense ratio. The Fund indirectly bears its proportionate share of the expenses of any underlying Fidelity Central Funds.
F Amount does not include the portfolio activity of any underlying Fidelity Central Funds.
G For the period May 2, 2012 (commencement of operations) to October 31, 2012.
H Expense ratios reflect operating expenses of the class. Expenses before reductions do not reflect amounts reimbursed by the investment adviser or reductions from brokerage service arrangements or reductions from other expense offset arrangements and do not represent the amount paid by the class during periods when reimbursements or reductions occur. Expense ratios before reductions for start-up periods may not be representative of longer-term operating periods. Expenses net of fee waivers reflect expenses after reimbursement by the investment adviser but prior to reductions from brokerage service arrangements or other expense offset arrangements. Expenses net of all reductions represent the net expenses paid by the class.
I Amount not annualized.
See accompanying notes which are an integral part of the financial statements.
Annual Report
Notes to Financial Statements
For the period ended October 31, 2012
1. Organization.
Fidelity Advisor Global Equity Income Fund (the Fund) is a fund of Fidelity Advisor Series VIII (the Trust) and is authorized to issue an unlimited number of shares. The Trust is registered under the Investment Company Act of 1940, as amended (the 1940 Act), as an open-end management investment company organized as a Massachusetts business trust. The Fund offers Class A, Class T, Class C, and Institutional Class shares, each of which has equal rights as to assets and voting privileges. Each class has exclusive voting rights with respect to matters that affect that class. Investment income, realized and unrealized capital gains and losses, the common expenses of the Fund, and certain fund-level expense reductions, if any, are allocated on a pro-rata basis to each class based on the relative net assets of each class to the total net assets of the Fund. Each class differs with respect to transfer agent and distribution and service plan fees incurred. Certain expense reductions may also differ by class. The Fund's investments in emerging markets can be subject to social, economic, regulatory, and political uncertainties and can be extremely volatile.
2. Investments in Fidelity Central Funds.
The Fund invests in Fidelity Central Funds, which are open-end investment companies available only to other investment companies and accounts managed by Fidelity Management & Research Company (FMR) and its affiliates. The Fund's Schedule of Investments lists each of the Fidelity Central Funds held as of period end, if any, as an investment of the Fund, but does not include the underlying holdings of each Fidelity Central Fund. As an Investing Fund, the Fund indirectly bears its proportionate share of the expenses of the underlying Fidelity Central Funds.
The Money Market Central Funds seek preservation of capital and current income and are managed by Fidelity Investments Money Management, Inc. (FIMM), an affiliate of FMR.
A complete unaudited list of holdings for each Fidelity Central Fund is available upon request or at the Securities and Exchange Commission (the SEC) web site at www.sec.gov. In addition, the financial statements of the Fidelity Central Funds, which are not covered by the Fund's Report of Independent Registered Public Accounting Firm, are available on the SEC web site or upon request.
3. Significant Accounting Policies.
The financial statements have been prepared in conformity with accounting principles generally accepted in the United States of America (GAAP), which require management to make certain estimates and assumptions at the date of the financial statements. Actual results could differ from those estimates. Subsequent events, if any, through the date that the financial statements were issued have been evaluated in the preparation of the financial statements. The following summarizes the significant accounting policies of the Fund:
Annual Report
Notes to Financial Statements - continued
3. Significant Accounting Policies - continued
Security Valuation. Investments are valued as of 4:00 p.m. Eastern time on the last calendar day of the period. In accordance with valuation policies and procedures approved by the Board of Trustees (the Board), the Fund attempts to obtain prices from one or more third party pricing vendors or brokers to value its investments. When current market prices, quotations or rates are not readily available or reliable, securities will be fair valued in good faith by the FMR Fair Value Committee (the Committee), in accordance with procedures adopted by the Fund's Board. Factors used in determining fair value vary by security type and may include market or security specific events. The frequency with which these procedures are used cannot be predicted and they may be utilized to a significant extent. The Committee oversees the Fund's valuation policies and procedures and is responsible for approving and reporting to the Board all fair value determinations.
The Fund categorizes the inputs to valuation techniques used to value its investments into a disclosure hierarchy consisting of three levels as shown below:
Level 1 - quoted prices in active markets for identical investments
Level 2 - other significant observable inputs (including quoted prices for similar investments, interest rates, prepayment speeds, etc.)
Level 3 - unobservable inputs (including the Fund's own assumptions based on the best information available)
Valuation techniques used to value the Fund's investments by major category are as follows:
Equity securities, including restricted securities, for which market quotations are readily available, are valued at the last reported sale price or official closing price as reported by a third party pricing vendor on the primary market or exchange on which they are traded and are categorized as Level 1 in the hierarchy. In the event there were no sales during the day or closing prices are not available, securities are valued at the last quoted bid price or may be valued using the last available price and are generally categorized as Level 2 in the hierarchy. For foreign equity securities, when significant market or security specific events arise, comparisons to the valuation of American Depositary Receipts (ADRs), futures contracts, Exchange-Traded Funds (ETFs) and certain indexes as well as quoted prices for similar securities are used and are categorized as Level 2 in the hierarchy. Utilizing these techniques may result in transfers between Level 1 and Level 2.
Investments in open-end mutual funds, including the Fidelity Central Funds, are valued at their closing net asset value (NAV) each business day and are categorized as Level 1 in the hierarchy.
Annual Report
3. Significant Accounting Policies - continued
Security Valuation - continued
Changes in valuation techniques may result in transfers in or out of an assigned level within the disclosure hierarchy. The aggregate value of investments by input level, as of October 31, 2012, is included at the end of the Fund's Schedule of Investments.
Foreign Currency Translation. The Fund may use foreign currency contracts to facilitate transactions in foreign-denominated securities. Gains and losses from these transactions may arise from changes in the value of the foreign currency or if the counterparties do not perform under the contracts' terms.
Foreign-denominated assets, including investment securities, and liabilities are translated into U.S. dollars at the exchange rates at period end. Purchases and sales of investment securities, income and dividends received and expenses denominated in foreign currencies are translated into U.S. dollars at the exchange rate in effect on the transaction date.
The effects of exchange rate fluctuations on investments are included with the net realized and unrealized gain (loss) on investment securities. Other foreign currency transactions resulting in realized and unrealized gain (loss) are disclosed separately.
Investment Transactions and Income. For financial reporting purposes, the Fund's investment holdings and NAV include trades executed through the end of the last business day of the period. The NAV per share for processing shareholder transactions is calculated as of the close of business of the New York Stock Exchange (NYSE), normally 4:00 p.m. Eastern time and includes trades executed through the end of the prior business day. Gains and losses on securities sold are determined on the basis of identified cost. Dividend income is recorded on the ex-dividend date, except for certain dividends from foreign securities where the ex-dividend date may have passed, which are recorded as soon as the Fund is informed of the ex-dividend date. Non-cash dividends included in dividend income, if any, are recorded at the fair market value of the securities received. Distributions received on securities that represent a return of capital or capital gain are recorded as a reduction of cost of investments and/or as a realized gain. The Fund estimates the components of distributions received that may be considered return of capital distributions or capital gain distributions. Interest income and distributions from the Fidelity Central Funds are accrued as earned. Interest income includes coupon interest and amortization of premium and accretion of discount on debt securities. Investment income is recorded net of foreign taxes withheld where recovery of such taxes is uncertain.
Expenses. Expenses directly attributable to a fund are charged to that fund. Expenses attributable to more than one fund are allocated among the respective funds on the basis of relative net assets or other appropriate methods. Expense estimates are accrued in the period to which they relate and adjustments are made when actual amounts are known.
Annual Report
Notes to Financial Statements - continued
3. Significant Accounting Policies - continued
Income Tax Information and Distributions to Shareholders. Each year, the Fund intends to qualify as a regulated investment company under Subchapter M of the Internal Revenue Code, including distributing substantially all of its taxable income and realized gains. As a result, no provision for income taxes is required. As of October 31, 2012, the Fund did not have any unrecognized tax benefits in the financial statements; nor is the Fund aware of any tax positions for which it is reasonably possible that the total amounts of unrecognized tax benefits will significantly change in the next twelve months. The Fund files a U.S. federal tax return, in addition to state and local tax returns as required. A fund's federal income tax returns are subject to examination by the Internal Revenue Service (IRS) for a period of three fiscal years after they are filed. State and local tax returns may be subject to examination for an additional fiscal year depending on the jurisdiction. Foreign taxes are provided for based on the Fund's understanding of the tax rules and rates that exist in the foreign markets in which it invests.
Distributions are declared and recorded on the ex-dividend date. Income dividends and capital gain distributions are declared separately for each class. Income and capital gain distributions are determined in accordance with income tax regulations, which may differ from GAAP.
Capital accounts within the financial statements are adjusted for permanent book-tax differences. These adjustments have no impact on net assets or the results of operations. Temporary book-tax differences will reverse in a subsequent period.
Book-tax differences are primarily due to foreign currency transactions, passive foreign investment companies (PFIC), partnerships, capital loss carryforwards, equity-debt classifications and losses deferred due to wash sales.
The federal tax cost of investment securities and unrealized appreciation (depreciation) as of period end were as follows:
Gross unrealized appreciation | $ 143,679 |
Gross unrealized depreciation | (69,695) |
Net unrealized appreciation (depreciation) on securities and other investments | $ 73,984 |
| |
Tax Cost | $ 3,007,691 |
The tax-based components of distributable earnings as of period end were as follows:
Capital loss carryforward | $ (24,859) |
Net unrealized appreciation (depreciation) | $ 73,938 |
Annual Report
3. Significant Accounting Policies - continued
Income Tax Information and Distributions to Shareholders - continued
Capital loss carryforwards are only available to offset future capital gains of the Fund to the extent provided by regulations and may be limited. Under the Regulated Investment Company Modernization Act of 2010 (the Act), the Fund is permitted to carry forward capital losses incurred in taxable years beginning after December 22, 2010 for an unlimited period and such capital losses are required to be used prior to any losses that expire. Capital loss carryforwards were as follows:
No expiration | |
Short-term | $ (24,859) |
Total capital loss carryforward | $ (24,859) |
The tax character of distributions paid was as follows:
| October 31, 2012 |
Ordinary Income | $ 26,857 |
New Accounting Pronouncement. In December 2011, the Financial Accounting Standards Board issued Accounting Standard Update No. 2011-11, Disclosures about Offsetting Assets and Liabilities. The update creates new disclosure requirements requiring entities to disclose both gross and net information for derivatives and other financial instruments that are either offset in the Statement of Assets and Liabilities or subject to an enforceable master netting arrangement or similar agreement. The disclosure requirements are effective for annual reporting periods beginning on or after January 1, 2013, and interim periods within those annual periods. Management is currently evaluating the impact of the update's adoption on the Fund's financial statement disclosures.
4. Purchases and Sales of Investments.
Purchases and sales of securities, other than short-term securities, aggregated $3,883,843 and $983,904, respectively.
5. Fees and Other Transactions with Affiliates.
Management Fee. FMR and its affiliates provide the Fund with investment management related services for which the Fund pays a monthly management fee. The management fee is the sum of an individual fund fee rate that is based on an annual rate of .45% of the Fund's average net assets and an annualized group fee rate that averaged .26% during the period. The group fee rate is based upon the average net assets of all the mutual funds advised by FMR. The group fee rate decreases as assets under management increase and increases as assets under management decrease. For the period, the total annualized management fee rate was .71% of the Fund's average net assets.
Annual Report
Notes to Financial Statements - continued
5. Fees and Other Transactions with Affiliates - continued
Distribution and Service Plan Fees. In accordance with Rule 12b-1 of the 1940 Act, the Fund has adopted separate Distribution and Service Plans for each class of shares, except for the Institutional Class. Certain classes pay Fidelity Distributors Corporation (FDC), an affiliate of FMR, separate Distribution and Service Fees, each of which is based on an annual percentage of each class' average net assets. In addition, FDC may pay financial intermediaries for selling shares of the Fund and providing shareholder support services. For the period, the Distribution and Service Fee rates, total fees and amounts retained by FDC were as follows:
| Distribution
Fee | Service
Fee | Total Fees | Retained
by FDC |
Class A | -% | .25% | $ 833 | $ 808 |
Class T | .25% | .25% | 1,572 | 1,530 |
Class C | .75% | .25% | 3,118 | 3,118 |
| | | $ 5,523 | $ 5,456 |
Sales Load. FDC may receive a front-end sales charge of up to 5.75% for selling Class A shares and 3.50% for selling Class T shares, some of which is paid to financial intermediaries for selling shares of the Fund. Depending on the holding period, FDC may receive contingent deferred sales charges levied on Class A, Class T and Class C redemptions. The deferred sales charges range from 1.00% for Class C shares, 1.00% for certain purchases of Class A shares and .25% for certain purchases of Class T shares.
For the period, sales charge amounts retained by FDC were as follows:
| Retained
by FDC |
Class A | $ 1,829 |
Class T | 139 |
Class C* | 34 |
| $ 2,002 |
* When Class C shares are initially sold, FDC pays commissions from its own resources to financial intermediaries through which the sales are made.
Transfer Agent Fees. Fidelity Investments Institutional Operations Company, Inc. (FIIOC), an affiliate of FMR, is the transfer, dividend disbursing and shareholder servicing agent for each class of the Fund. FIIOC receives account fees and asset-based fees that vary according to the account size and type of account of the shareholders of the respective classes of the Fund. FIIOC pays for typesetting, printing and mailing of shareholder reports, except proxy statements. For the period, transfer agent fees for each applicable class were as follows:
| Amount | % of
Average
Net Assets |
Class A | $ 451 | .14 |
Class T | 356 | .11 |
Class C | 396 | .13 |
Institutional Class | 572 | .13 |
| $ 1,775 | |
Annual Report
5. Fees and Other Transactions with Affiliates - continued
Accounting Fees. Fidelity Service Company, Inc. (FSC), an affiliate of FMR, maintains the Fund's accounting records. The fee is based on the level of average net assets for each month.
Brokerage Commissions. The Fund placed a portion of its portfolio transactions with brokerage firms which are affiliates of the investment adviser. The commissions paid to these affiliated firms were $7 for the period.
6. Expense Reductions.
FMR contractually agreed to reimburse each class to the extent annual operating expenses exceeded certain levels of average net assets as noted in the table below. This reimbursement will remain in place through December 31, 2013. Some expenses, for example interest expense, are excluded from this reimbursement.
The following classes were in reimbursement during the period:
| Expense
Limitations | Reimbursement
from adviser |
| | |
Class A | 1.45% | $ 20,071 |
Class T | 1.70% | 19,001 |
Class C | 2.20% | 18,874 |
Institutional Class | 1.20% | 26,932 |
| | $ 84,878 |
Many of the brokers with whom FMR places trades on behalf of the Fund provided services to the Fund in addition to trade execution. These services included payments of certain expenses on behalf of the Fund totaling $107 for the period. In addition, through arrangements with the Fund's custodian, credits realized as a result of uninvested cash balances were used to reduce the Fund's expenses. During the period, these credits reduced the Fund's custody expenses by $4.
7. Distributions to Shareholders.
Distributions to shareholders of each class were as follows:
Period ended October 31, | 2012 A |
From net investment income | |
Class A | $ 6,925 |
Class T | 5,775 |
Class C | 4,470 |
Institutional Class | 9,687 |
Total | $ 26,857 |
A For the period May 2, 2012 (commencement of operations) to October 31, 2012.
Annual Report
Notes to Financial Statements - continued
8. Share Transactions.
Transactions for each class of shares were as follows:
Period October 31, | Shares A | Dollars A |
Class A | | |
Shares sold | 73,860 | $ 736,903 |
Reinvestment of distributions | 694 | 6,925 |
Net increase (decrease) | 74,554 | $ 743,828 |
Class T | | |
Shares sold | 69,801 | $ 699,717 |
Reinvestment of distributions | 579 | 5,775 |
Shares redeemed | (1) | (15) |
Net increase (decrease) | 70,379 | $ 705,477 |
Class C | | |
Shares sold | 65,575 | $ 655,827 |
Reinvestment of distributions | 450 | 4,470 |
Shares redeemed | (335) | (3,402) |
Net increase (decrease) | 65,690 | $ 656,895 |
Institutional Class | | |
Shares sold | 106,504 | $ 1,051,902 |
Reinvestment of distributions | 972 | 9,687 |
Shares redeemed | (14,978) | (141,695) |
Net increase (decrease) | 92,498 | $ 919,894 |
A For the period May 2, 2012 (commencement of operations) to October 31, 2012.
9. Other.
The Fund's organizational documents provide former and current trustees and officers with a limited indemnification against liabilities arising in connection with the performance of their duties to the Fund. In the normal course of business, the Fund may also enter into contracts that provide general indemnifications. The Fund's maximum exposure under these arrangements is unknown as this would be dependent on future claims that may be made against the Fund. The risk of material loss from such claims is considered remote.
At the end of the period, FMR or its affiliates were the owners of record of 83% of the total outstanding shares of the Fund.
Annual Report
To the Trustees of Fidelity Advisor Series VIII and the Shareholders of Fidelity Advisor Global Equity Income Fund:
In our opinion, the accompanying statement of assets and liabilities, including the schedule of investments, and the related statements of operations and of changes in net assets and the financial highlights present fairly, in all material respects, the financial position of Fidelity Advisor Global Equity Income Fund (a fund of Fidelity Advisor Series VIII) at October 31, 2012, the results of its operations, the changes in its net assets and the financial highlights for the period from May 2, 2012 (commencement of operations) to October 31, 2012 indicate, in conformity with accounting principles generally accepted in the United States of America. These financial statements and financial highlights (hereafter referred to as "financial statements") are the responsibility of the Fidelity Advisor Global Equity Income Fund's management. Our responsibility is to express an opinion on these financial statements based on our audits. We conducted our audits of these financial statements in accordance with the standards of the Public Company Accounting Oversight Board (United States). Those standards require that we plan and perform the audit to obtain reasonable assurance about whether the financial statements are free of material misstatement. An audit includes examining, on a test basis, evidence supporting the amounts and disclosures in the financial statements, assessing the accounting principles used and significant estimates made by management, and evaluating the overall financial statement presentation. We believe that our audits, which included confirmation of securities at October 31, 2012 by correspondence with the custodian and brokers, provide a reasonable basis for our opinion.
PricewaterhouseCoopers LLP
Boston, Massachusetts
December 18, 2012
Annual Report
The Trustees, Members of the Advisory Board, and executive officers of the trust and fund, as applicable, are listed below. The Board of Trustees governs the fund and is responsible for protecting the interests of shareholders. The Trustees are experienced executives who meet periodically throughout the year to oversee the fund's activities, review contractual arrangements with companies that provide services to the fund, oversee management of the risks associated with such activities and contractual arrangements, and review the fund's performance. Except for James C. Curvey, each of the Trustees oversees 236 funds advised by FMR or an affiliate. Mr. Curvey oversees 443 funds advised by FMR or an affiliate.
The Trustees hold office without limit in time except that (a) any Trustee may resign; (b) any Trustee may be removed by written instrument, signed by at least two-thirds of the number of Trustees prior to such removal; (c) any Trustee who requests to be retired or who has become incapacitated by illness or injury may be retired by written instrument signed by a majority of the other Trustees; and (d) any Trustee may be removed at any special meeting of shareholders by a two-thirds vote of the outstanding voting securities of the trust. Each Trustee who is not an interested person (as defined in the 1940 Act) (Independent Trustee), shall retire not later than the last day of the calendar year in which his or her 75th birthday occurs. The Independent Trustees may waive this mandatory retirement age policy with respect to individual Trustees. The executive officers and Advisory Board Members hold office without limit in time, except that any officer and Advisory Board Member may resign or may be removed by a vote of a majority of the Trustees at any regular meeting or any special meeting of the Trustees. Except as indicated, each individual has held the office shown or other offices in the same company for the past five years.
Experience, Skills, Attributes, and Qualifications of the Fund's Trustees. The Governance and Nominating Committee has adopted a statement of policy that describes the experience, qualifications, attributes, and skills that are necessary and desirable for potential Independent Trustee candidates (Statement of Policy). The Board believes that each Trustee satisfied at the time he or she was initially elected or appointed a Trustee, and continues to satisfy, the standards contemplated by the Statement of Policy. The Governance and Nominating Committee also engages professional search firms to help identify potential Independent Trustee candidates who have the experience, qualifications, attributes, and skills consistent with the Statement of Policy. From time to time, additional criteria based on the composition and skills of the current Independent Trustees, as well as experience or skills that may be appropriate in light of future changes to board composition, business conditions, and regulatory or other developments, have also been considered by the professional search firms and the Governance and Nominating Committee. In addition, the Board takes into account the Trustees' commitment and participation in Board and committee meetings, as well as their leadership of standing and ad hoc committees throughout their tenure.
In determining that a particular Trustee was and continues to be qualified to serve as a Trustee, the Board has considered a variety of criteria, none of which, in isolation, was controlling. The Board believes that, collectively, the Trustees have balanced and diverse experience, qualifications, attributes, and skills, which allow the Board to operate effectively in governing the fund and protecting the interests of shareholders. Information about the specific experience, skills, attributes, and qualifications of each Trustee, which in each case led to the Board's conclusion that the Trustee should serve (or continue to serve) as a trustee of the fund, is provided below.
Annual Report
Board Structure and Oversight Function. James C. Curvey is an interested person (as defined in the 1940 Act) and currently serves as Chairman. The Trustees have determined that an interested Chairman is appropriate and benefits shareholders because an interested Chairman has a personal and professional stake in the quality and continuity of services provided to the fund. Independent Trustees exercise their informed business judgment to appoint an individual of their choosing to serve as Chairman, regardless of whether the Trustee happens to be independent or a member of management. The Independent Trustees have determined that they can act independently and effectively without having an Independent Trustee serve as Chairman and that a key structural component for assuring that they are in a position to do so is for the Independent Trustees to constitute a substantial majority for the Board. The Independent Trustees also regularly meet in executive session. Ned C. Lautenbach serves as Chairman of the Independent Trustees and as such (i) acts as a liaison between the Independent Trustees and management with respect to matters important to the Independent Trustees and (ii) with management prepares agendas for Board meetings.
Fidelity funds are overseen by different Boards of Trustees. The fund's Board oversees Fidelity's equity and high income funds and another Board oversees Fidelity's investment-grade bond, money market, and asset allocation funds. The asset allocation funds may invest in Fidelity funds overseen by the fund's Board. The use of separate Boards, each with its own committee structure, allows the Trustees of each group of Fidelity funds to focus on the unique issues of the funds they oversee, including common research, investment, and operational issues. On occasion, the separate Boards establish joint committees to address issues of overlapping consequences for the Fidelity funds overseen by each Board.
The Trustees operate using a system of committees to facilitate the timely and efficient consideration of all matters of importance to the Trustees, the fund, and fund shareholders and to facilitate compliance with legal and regulatory requirements and oversight of the fund's activities and associated risks. The Board, acting through its committees, has charged FMR and its affiliates with (i) identifying events or circumstances the occurrence of which could have demonstrably adverse effects on the fund's business and/or reputation; (ii) implementing processes and controls to lessen the possibility that such events or circumstances occur or to mitigate the effects of such events or circumstances if they do occur; and (iii) creating and maintaining a system designed to evaluate continuously business and market conditions in order to facilitate the identification and implementation processes described in (i) and (ii) above. Because the day-to-day operations and activities of the fund are carried out by or through FMR, its affiliates and other service providers, the fund's exposure to risks is mitigated but not eliminated by the processes overseen by the Trustees. While each of the Board's committees has responsibility for overseeing different aspects of the fund's activities, oversight is exercised primarily through the Operations, Audit, and Compliance Committees. In addition, the Independent Trustees have worked with FMR to enhance the Board's oversight of investment and financial risks, legal and regulatory risks, technology risks, and operational risks, including the development of additional risk reporting to the Board. For example, a working group comprised of Independent Trustees and FMR has worked and continues to work to review the Fidelity funds' valuation-related activities, reporting and risk management. Appropriate personnel, including but not limited to the fund's Chief Compliance Officer (CCO), FMR's internal auditor, the independent accountants, the fund's Treasurer and portfolio management personnel, make periodic reports to the Board's committees, as appropriate, including an annual review of FMR's risk management program for the Fidelity funds. The responsibilities of each standing committee, including their oversight responsibilities, are described further under "Standing Committees of the Fund's Trustees."
Annual Report
Trustees and Officers - continued
The fund's Statement of Additional Information (SAI) includes more information about the Trustees. To request a free copy, call Fidelity at 1-877-208-0098.
Interested Trustees*:
Correspondence intended for each Trustee who is an interested person may be sent to Fidelity Investments, 82 Devonshire Street, Boston, Massachusetts 02109.
Name, Age; Principal Occupations and Other Relevant Experience+ |
James C. Curvey (77) |
| Year of Election or Appointment: 2007 Mr. Curvey is Trustee and Chairman of the Board of Trustees of certain Trusts. Mr. Curvey also serves as Trustee (2007-present) of other investment companies advised by FMR. Mr. Curvey is a Director of Fidelity Investments Money Management, Inc. (2009-present), Director of Fidelity Research & Analysis Co. (2009-present) and Director of FMR and FMR Co., Inc. (2007-present). Mr. Curvey is also Vice Chairman (2007-present) and Director of FMR LLC. In addition, Mr. Curvey serves as an Overseer for the Boston Symphony Orchestra and a member of the Trustees of Villanova University. Previously, Mr. Curvey was the Vice Chairman (2006-2007) and Director (2000-2007) of FMR Corp. |
Ronald P. O'Hanley (55) |
| Year of Election or Appointment: 2011 Mr. O'Hanley is Director of FMR Co., Inc. (2010-present), Director of Fidelity Investments Money Management, Inc. (2010-present), Director of Fidelity Research & Analysis Company (2010-present), President of Fidelity Asset Management and Corporate Services and a member of Fidelity's Executive Committee (2010-present). Previously, Mr. O'Hanley served as President and Chief Executive Officer of BNY Mellon Asset Management (2007-2010). Mr. O'Hanley also served as Vice Chairman of Bank New York Mellon Corp. and a member of that firm's Executive Committee. Prior to the 2007 merger of The Bank of New York and Mellon Financial Corporation, he was Vice Chairman of Mellon Financial Corporation and President and Chief Executive Officer of Mellon Asset Management. He joined Mellon in February 1997. Mr. O'Hanley currently serves as Chairman of the Boston Public Library Foundation Board of Directors and sits on the Board of Directors of Beth Israel Deaconess Medical Center, the Board of Trustees of the Marine Biological Laboratory and the Advisory Board of the Maxwell School of Citizenship and Public Administration at Syracuse University. Mr. O'Hanley also chairs the Council on Asset Management for the Financial Services Roundtable and is a member of the Board of Directors of Institutional Investor's U.S. Institute. |
* Trustees have been determined to be "Interested Trustees" by virtue of, among other things, their affiliation with the trust or various entities under common control with FMR.
+ The information above includes each Trustee's principal occupation during the last five years and other information relating to the experience, attributes, and skills relevant to each Trustee's qualifications to serve as a Trustee, which led to the conclusion that each Trustee should serve as a Trustee for the fund.
Annual Report
Trustees and Officers - continued
Independent Trustees:
Correspondence intended for each Independent Trustee (that is, the Trustees other than the Interested Trustees) may be sent to Fidelity Investments, P.O. Box 55235, Boston, Massachusetts 02205-5235.
Name, Age; Principal Occupations and Other Relevant Experience+ |
Dennis J. Dirks (64) |
| Year of Election or Appointment: 2005 Prior to his retirement in May 2003, Mr. Dirks was Chief Operating Officer and a member of the Board of The Depository Trust & Clearing Corporation (DTCC). He also served as President, Chief Operating Officer, and Board member of The Depository Trust Company (DTC) and President and Board member of the National Securities Clearing Corporation (NSCC). In addition, Mr. Dirks served as Chief Executive Officer and Board member of the Government Securities Clearing Corporation, Chief Executive Officer and Board member of the Mortgage-Backed Securities Clearing Corporation, as a Trustee and a member of the Finance Committee of Manhattan College (2005-2008), and as a Trustee and a member of the Finance Committee of AHRC of Nassau County (2006-2008). Mr. Dirks is a member of the Independent Directors Council (IDC) Governing Council (2010-present) and Board of Directors for The Brookville Center for Children's Services, Inc. (2009-present). |
Alan J. Lacy (59) |
| Year of Election or Appointment: 2008 Mr. Lacy serves as Senior Adviser (2007-present) of Oak Hill Capital Partners, L.P. (private equity). Mr. Lacy also served as Chief Executive Officer (2000-2005) and Vice Chairman (2005-2006) of Sears Holdings Corporation and Sears, Roebuck and Co. (retail). In addition, Mr. Lacy serves as a member of the Board of Directors of Dave & Buster's Entertainment, Inc. (restaurant and entertainment complexes, 2010-present), Earth Fare, Inc. (retail grocery, 2012-present), The Hillman Companies, Inc. (hardware wholesalers, 2010-present), and Bristol-Myers Squibb Company (global pharmaceuticals, 2008-present). Mr. Lacy is a member of the Board of Trustees of The National Parks Conservation Association (2006-present). Previously, Mr. Lacy served as Chairman of the Board of Trustees of the National Parks Conservation Association (2008-2011) and as a member of the Board of Directors for the Western Union Company (global money transfer, 2006-2011). |
Ned C. Lautenbach (68) |
| Year of Election or Appointment: 2000 Mr. Lautenbach is Chairman of the Independent Trustees of the Equity and High Income Funds (2006-present). Mr. Lautenbach currently serves as the Lead Director of the Eaton Corporation Board of Directors (diversified industrial, 1997-present). Mr. Lautenbach is Chairman of the Board of Directors of the Philharmonic Center for the Arts in Naples, Florida (2012-present) and a member of the Council on Foreign Relations (1994-present). Previously, Mr. Lautenbach was a Partner/Advisory Partner at Clayton, Dubilier & Rice, LLC (private equity investment, 1998-2010), as well as a Director of Sony Corporation (2006-2007). |
Joseph Mauriello (68) |
| Year of Election or Appointment: 2008 Prior to his retirement in January 2006, Mr. Mauriello served in numerous senior management positions including Deputy Chairman and Chief Operating Officer (2004-2005), and Vice Chairman of Financial Services (2002-2004) of KPMG LLP US (professional services, 1965-2005). Mr. Mauriello currently serves as a member of the Board of Directors of XL Group plc. (global insurance and re-insurance, 2006-present). Previously, Mr. Mauriello served as a Director of the Hamilton Funds of the Bank of New York (2006-2007) and of Arcadia Resources Inc. (health care services and products, 2007-2012). |
Robert W. Selander (62) |
| Year of Election or Appointment: 2011 Previously, Mr. Selander served as a Member of the Advisory Board of Fidelity's Equity and High Income Funds (2011), Executive Vice Chairman (2010), Chief Executive Officer (2009-2010), and President and Chief Executive Officer (1997-2009) of Mastercard, Inc. |
Cornelia M. Small (68) |
| Year of Election or Appointment: 2005 Ms. Small is a member of the Board of Directors (2009-present) and Chair of the Investment Committee (2010-present) of the Teagle Foundation. Ms. Small also serves on the Investment Committee of the Berkshire Taconic Community Foundation (2008-present). Previously, Ms. Small served as Chairperson (2002-2008) and a member of the Investment Committee and Chairperson (2008-2012) and a member of the Board of Trustees of Smith College. In addition, Ms. Small served as Chief Investment Officer, Director of Global Equity Investments, and a member of the Board of Directors of Scudder, Stevens & Clark and Scudder Kemper Investments. |
William S. Stavropoulos (73) |
| Year of Election or Appointment: 2001 Mr. Stavropoulos is Vice Chairman of the Independent Trustees of the Equity and High Income Funds (2006-present). Mr. Stavropoulos serves as President and Founder of the Michigan Baseball Foundation, the Great Lakes Loons (2007-present). Mr. Stavropoulos is Chairman Emeritus of the Board of Directors of The Dow Chemical Company, where he previously served in numerous senior management positions, including President, CEO (1995-2000; 2002-2004), Chairman of the Executive Committee (2000-2006), and as a member of the Board of Directors (1990-2006). Currently, Mr. Stavropoulos is a Director of Univar Inc. (global distributor of commodity and specialty chemicals, Chairman from 2010-May 2012 and Lead Director from May 2012-present), Teradata Corporation (data warehousing and technology solutions, 2008-present), Maersk Inc. (industrial conglomerate), and Tyco International, Ltd. (multinational manufacturing and services, 2007-present), and a member of the Advisory Board for Metalmark Capital LLC (private equity investment, 2005-present). Mr. Stavropoulos is an operating advisor to Clayton, Dubilier & Rice, LLC (private equity investment). In addition, Mr. Stavropoulos is a member of the University of Notre Dame Advisory Council for the College of Science, a Trustee of the Rollin L. Gerstacker Foundation, and a Director of the Naples Philharmonic Center for the Arts. Previously, Mr. Stavropoulos served as a Director of Chemical Financial Corporation (bank holding company, 1993-2012). |
David M. Thomas (63) |
| Year of Election or Appointment: 2008 Previously, Mr. Thomas served as Executive Chairman (2005-2006) and Chairman and Chief Executive Officer (2000-2005) of IMS Health, Inc. (pharmaceutical and healthcare information solutions), and a Director of Fortune Brands, Inc. (consumer products, 2000-2011). In addition, Mr. Thomas serves as Non-Executive Chairman of the Board of Directors of Fortune Brands Home and Security (home and security products, 2011-present), and as a member of the Board of Directors of Interpublic Group of Companies, Inc. (marketing communication, 2004-present). |
Michael E. Wiley (62) |
| Year of Election or Appointment: 2008 Mr. Wiley also serves as a Director of Asia Pacific Exploration Consolidated (international oil and gas exploration and production, 2008-present). Mr. Wiley serves as a Director of Tesoro Corporation (independent oil refiner and marketer, 2005-present), and a Director of Bill Barrett Corporation (exploration and production, 2005-present). In addition, Mr. Wiley also serves as a Director of Post Oak Bank (privately-held bank, 2004-present). Previously, Mr. Wiley served as a member of the Board of Trustees of the University of Tulsa (2000-2006; 2007-2010), as a Senior Energy Advisor of Katzenbach Partners, LLC (consulting, 2006-2007), as an Advisory Director of Riverstone Holdings (private investment), Chairman, President, and CEO of Baker Hughes, Inc. (oilfield services, 2000-2004), and as Director of Spinnaker Exploration Company (exploration and production, 2001-2005). |
+ The information above includes each Trustee's principal occupation during the last five years and other information relating to the experience, attributes, and skills relevant to each Trustee's qualifications to serve as a Trustee, which led to the conclusion that each Trustee should serve as a Trustee for the fund.
Advisory Board Members and Executive Officers:
Correspondence intended for David A. Rosow and Garnett A. Smith may be sent to Fidelity Investments, P.O. Box 55235, Boston, Massachusetts 02205-5235. Correspondence intended for each executive officer, Edward C. Johnson 3d, and Peter S. Lynch may be sent to Fidelity Investments, 82 Devonshire Street, Boston, Massachusetts 02109.
Name, Age; Principal Occupation |
Edward C. Johnson 3d (82) |
| Year of Election or Appointment: 2011 Member of the Advisory Board of Fidelity's Equity and High Income Funds. Mr. Johnson serves as Chief Executive Officer, Chairman, and a Director of FMR LLC, and also serves as Chairman and Director of FIL Limited. Previously, Mr. Johnson served as a Trustee and Chairman of the Board of certain Fidelity Trusts, Chairman and a Director of FMR, Chairman and a Director of FMR Co., Inc., and President of FMR LLC (2006-2007). |
Peter S. Lynch (68) |
| Year of Election or Appointment: 2003 Member of the Advisory Board of Fidelity's Equity and High Income Funds. Mr. Lynch is Vice Chairman and a Director of FMR and FMR Co., Inc. In addition, Mr. Lynch serves as a Trustee of Boston College and as the Chairman of the Inner-City Scholarship Fund. Previously, Mr. Lynch served on the Special Olympics International Board of Directors (1997-2006). |
David A. Rosow (70) |
| Year of Election or Appointment: 2012 Member of the Advisory Board of Fidelity's Equity and High Income Funds. Chairman and Chief Executive Officer of International Golf Group, Inc. (golf course development, 1989-present). Previously, Mr. Rosow served as Chairman and Chief Executive Officer of Rosow & Company, Inc. (private investment company, 1989-2011), a Lead Director of Hudson United Bancorp (2001-2006) and as a Director of TD Banknorth (1996-2006). In addition, Mr. Rosow is a member (2008-present) and President (2009-present) of the Town Council of Palm Beach, Florida. |
Garnett A. Smith (65) |
| Year of Election or Appointment: 2012 Member of the Advisory Board of Fidelity's Equity and High Income Funds. Prior to Mr. Smith's retirement, he served as Chairman and Chief Executive Officer of Inbrand Corp. (manufacturer of personal absorbent products, 1990-1997). He also served as President (1986-1990) of Inbrand Corp. Prior to his employment with Inbrand Corp., he was employed by a retail fabric chain and North Carolina National Bank. In addition, Mr. Smith is a board member of the Jackson Hole Land Trust (2009-present). |
Kenneth B. Robins (43) |
| Year of Election or Appointment: 2008 President and Treasurer of Fidelity's Equity and High Income Funds. Mr. Robins also serves as President and Treasurer (2010-present) and Assistant Treasurer (2009-present) of other Fidelity funds and is an employee of Fidelity Investments (2004-present). Previously, Mr. Robins served as Deputy Treasurer of the Fidelity funds (2005-2008) and Treasurer and Chief Financial Officer of The North Carolina Capital Management Trust: Cash and Term Portfolios (2006-2008). |
Bruce T. Herring (47) |
| Year of Election or Appointment: 2006 Vice President of certain Equity Funds. Mr. Herring also serves as President of Fidelity Research & Analysis Company (2010-present), Chief Investment Officer and Director of Fidelity Management & Research (U.K.) Inc. (2010-present) and Group Chief Investment Officer of FMR. Previously, Mr. Herring served as Vice President (2005-2006) and Senior Vice President (2006-2007) of Fidelity Management & Research Company, Vice President of FMR Co., Inc. (2001-2007) and as a portfolio manager for Fidelity U.S. Equity Funds. |
Brian B. Hogan (48) |
| Year of Election or Appointment: 2009 Vice President of Equity and High Income Funds. Mr. Hogan also serves as President of FMR's Equity Division (2009-present). Previously, Mr. Hogan served as Senior Vice President, Equity Research of FMR (2006-2009) and as a portfolio manager. |
Scott C. Goebel (44) |
| Year of Election or Appointment: 2008 Secretary and Chief Legal Officer (CLO) of the Fidelity funds. Mr. Goebel also serves as Secretary of Fidelity Investments Money Management, Inc. (FIMM) (2010-present) and Fidelity Research and Analysis Company (FRAC) (2010-present); Secretary and CLO of The North Carolina Capital Management Trust: Cash and Term Portfolios (2008-present); General Counsel, Secretary, and Senior Vice President of FMR (2008-present) and FMR Co., Inc. (2008-present); employed by FMR LLC or an affiliate (2001-present); Chief Legal Officer of Fidelity Management & Research (Hong Kong) Limited (2008-present) and Assistant Secretary of Fidelity Management & Research (Japan) Inc. (2008-present), and Fidelity Management & Research (U.K.) Inc. (2008-present). Previously, Mr. Goebel served as Assistant Secretary of FIMM (2008-2010), FRAC (2008-2010), and the Funds (2007-2008) and as Vice President and Secretary of Fidelity Distributors Corporation (FDC) (2005-2007). |
William C. Coffey (43) |
| Year of Election or Appointment: 2009 Assistant Secretary of Fidelity's Equity and High Income Funds. Mr. Coffey also serves as Senior Vice President and Deputy General Counsel of FMR LLC (2010-present), and is an employee of Fidelity Investments. Previously, Mr. Coffey served as Vice President and Associate General Counsel of FMR LLC (2005-2009). |
Elizabeth Paige Baumann (44) |
| Year of Election or Appointment: 2012 Anti-Money Laundering (AML) Officer of the Fidelity funds. Ms. Baumann also serves as AML Officer of The North Carolina Capital Management Trust: Cash and Term Portfolios (2012-present), Chief AML Officer of FMR LLC (2012-present), and is an employee of Fidelity Investments. Previously, Ms. Baumann served as Vice President and Deputy Anti-Money Laundering Officer (2007-2012). |
Christine Reynolds (54) |
| Year of Election or Appointment: 2008 Chief Financial Officer of the Fidelity funds. Ms. Reynolds became President of Fidelity Pricing and Cash Management Services (FPCMS) in August 2008. Ms. Reynolds served as Chief Operating Officer of FPCMS (2007-2008). Previously, Ms. Reynolds served as President, Treasurer, and Anti-Money Laundering officer of the Fidelity funds (2004-2007). |
Joseph A. Hanlon (44) |
| Year of Election or Appointment: 2012 Chief Compliance Officer of Fidelity's Equity and High Income Funds. Mr. Hanlon serves as Compliance Officer of FMR, FMR Co., Inc., Fidelity Investments Money Management, Inc. (FIMM), Fidelity Research and Analysis Company (FRAC), Fidelity Management & Research (Japan) Inc., Fidelity Management & Research (U.K.) Inc., Fidelity Management & Research (Hong Kong), and Strategic Advisers, Inc. (2009-present), as Senior Vice President of the Fidelity Asset Management Division (2009-present), and is an employee of Fidelity Investments. |
Joseph F. Zambello (55) |
| Year of Election or Appointment: 2011 Deputy Treasurer of the Fidelity funds. Mr. Zambello is an employee of Fidelity Investments. Previously, Mr. Zambello served as Vice President of FMR's Program Management Group (2009-2011) and Vice President of the Transfer Agent Oversight Group (2005-2009). |
Adrien E. Deberghes (45) |
| Year of Election or Appointment: 2008 Deputy Treasurer of Fidelity's Equity and High Income Funds. Mr. Deberghes also serves as Vice President (2011-present) and Assistant Treasurer (2010-present) of other Fidelity funds, and is an employee of Fidelity Investments (2008-present). Previously, Mr. Deberghes served as Senior Vice President of Mutual Fund Administration at State Street Corporation (2007-2008), Senior Director of Mutual Fund Administration at Investors Bank & Trust (2005-2007), and Director of Finance for Dunkin' Brands (2000-2005). |
Stephen Sadoski (41) |
| Year of Election or Appointment: 2012 Deputy Treasurer of Fidelity's Equity and High Income Funds. Mr. Sadoski also serves as Assistant Treasurer of other Fidelity funds (2012-present) and is an employee of Fidelity Investments (2012-present). Previously, Mr. Sadoski served as an assistant chief accountant in the Division of Investment Management of the Securities and Exchange Commission (SEC) (2009-2012) and as a senior manager at Deloitte & Touche (1997-2009). |
Stephanie J. Dorsey (43) |
| Year of Election or Appointment: 2010 Assistant Treasurer of Fidelity's Equity and High Income Funds. Ms. Dorsey also serves as Deputy Treasurer of other Fidelity funds (2008-present) and is an employee of Fidelity Investments (2008-present). Previously, Ms. Dorsey served as Treasurer (2004-2008) of the JPMorgan Mutual Funds and Vice President (2004-2008) of JPMorgan Chase Bank. |
John R. Hebble (54) |
| Year of Election or Appointment: 2009 Assistant Treasurer of Fidelity's Equity and High Income Funds. Mr. Hebble also serves as President (2011-present), Treasurer, and Chief Financial Officer of The North Carolina Capital Management Trust: Cash and Term Portfolios (2008-present), President and Treasurer of other Fidelity funds (2008-present) and is an employee of Fidelity Investments. |
Gary W. Ryan (54) |
| Year of Election or Appointment: 2005 Assistant Treasurer of the Fidelity funds. Mr. Ryan is an employee of Fidelity Investments. Previously, Mr. Ryan served as Vice President of Fund Reporting in Fidelity Pricing and Cash Management Services (FPCMS) (1999-2005). |
Jonathan Davis (44) |
| Year of Election or Appointment: 2010 Assistant Treasurer of the Fidelity funds. Mr. Davis is also Assistant Treasurer of Fidelity Rutland Square Trust II and Fidelity Commonwealth Trust II. Mr. Davis is an employee of Fidelity Investments. Previously, Mr. Davis served as Vice President and Associate General Counsel of FMR LLC (2003-2010). |
Annual Report
Class A designates 55% and 53%, Class T designates 59% and 60%, and Class C designates 69% and 80% of the dividends distributed in July 2012 and October 2012, respectively during the fiscal year as qualifying for the dividends-received deduction for corporate shareholders.
Class A, Class T, and Class C designates 100% of the dividends distributed in during the fiscal year as amounts which may be taken into account as a dividend for the purposes of the maximum rate under section 1(h)(11) of the Internal Revenue Code.
The amounts per share which represent income derived from sources within, and taxes paid to, foreign countries or possessions of the United States are as follows:
| Pay Date | Income | Taxes |
Class A | 07/09/12 | $0.015 | $0.0040 |
| 10/08/12 | $0.015 | $0.0038 |
Class T | 07/09/12 | $0.014 | $0.0040 |
| 10/08/12 | $0.013 | $0.0038 |
Class C | 07/09/12 | $0.012 | $0.0040 |
| 10/08/12 | $0.010 | $0.0038 |
The fund will notify shareholders in January 2013 of amounts for use in preparing 2012 income tax returns.
Annual Report
Board Approval of Investment Advisory Contracts and Management Fees
Fidelity Advisor Global Equity Income Fund
On March 14, 2012, the Board of Trustees, including the Independent Trustees (together, the Board), voted to approve the management contract and sub-advisory agreements (together, the Advisory Contracts) for the fund. The Board, assisted by the advice of fund counsel and Independent Trustees' counsel, considered a broad range of information.
Nature, Extent, and Quality of Services Provided. The Board considered the staffing within the investment adviser, FMR, and the sub-advisers (together, the Investment Advisers), including the backgrounds of the fund's investment personnel and the fund's investment objective and discipline. The Board considered the structure of the portfolio manager compensation program and whether this structure provides appropriate incentives to act in the best interests of the fund.
Resources Dedicated to Investment Management and Support Services. The Board and the Fund Oversight and Research Committees reviewed the general qualifications and capabilities of the Investment Advisers' investment staff, including its size, education, experience, and resources, as well as the Investment Advisers' approach to recruiting, training, managing, and compensating investment personnel. The Board also noted that FMR has devoted increased resources to non-U.S. offices. The Board noted that Fidelity's analysts have extensive resources, tools and capabilities which allow them to conduct sophisticated quantitative and fundamental analysis, as well as credit analysis of issuers, counterparties and enhancers. The Board also believes that Fidelity's investment professionals have sufficient access to global information and data so as to provide competitive investment results over time, and that those professionals also have access to sophisticated tools which permit them to assess portfolio construction and risk and performance attribution characteristics continuously, as well as to transmit new information and research conclusions rapidly around the world. Additionally, in their deliberations, the Board considered the Investment Advisers' trading capabilities and resources which are an integral part of the investment management process.
Shareholder and Administrative Services. The Board considered the nature, extent, quality, and cost of advisory, administrative, and shareholder services to be performed by the Investment Advisers and their affiliates under the Advisory Contracts and under separate agreements covering transfer agency, pricing and bookkeeping, and securities lending services for the fund. The Board also considered the nature and extent of the investment adviser's supervision of third party service providers, principally custodians and subcustodians.
The Board noted that the growth of fund assets over time across the complex allows Fidelity to reinvest in the development of services designed to enhance the value or convenience of the Fidelity funds as investment vehicles. These services include 24-hour access to account information and market information through telephone representatives and over the Internet, investor education materials and asset allocation tools, and the expanded availability of Fidelity Investor Centers, with 35 new branches opening since 2010.
Annual Report
Board Approval of Investment Advisory Contracts and
Management Fees - continued
Investment Performance. The fund is a new fund and therefore had no historical performance for the Board to review at the time it approved the fund's Advisory Contracts. The Board considered the Investment Advisers' strength in fundamental, research-driven global and equity income securities selection, which the Board is familiar with through its supervision of other Fidelity funds that invest in such securities.
Based on its review, the Board concluded that the nature, extent, and quality of services to be provided to the fund under the Advisory Contracts should benefit the fund's shareholders.
Competitiveness of Management Fee and Total Expense Ratio. The Board considered the fund's proposed management fee and the projected total expense ratio of each class of the fund in reviewing the Advisory Contracts. The Board noted that the fund's proposed management fee rate is lower than the median fee rate of funds with similar Lipper investment objective categories and comparable management fee characteristics. The Board also noted that the projected total expense ratios for certain classes would rank above the median for funds with the same load structure but considered that the projected total expense ratios are comparable to those of similar classes and funds that Fidelity offers to shareholders.
The Board also noted that FMR had contractually agreed to reimburse each class of the fund to the extent that each class's total operating expenses (excluding interest, taxes, securities lending costs, brokerage commissions, extraordinary expenses, and acquired fund fees and expenses, if any), as a percentage of its average net assets exceed a certain limit.
Based on its review, the Board concluded that the management fee and projected total expense ratio of each class of the fund were reasonable in light of the services that the fund and its shareholders will receive and the other factors considered.
Costs of the Services and Profitability. The fund is a new fund and therefore no revenue, cost, or profitability data was available for the Board to review in respect of the fund at the time it approved the Advisory Contracts. In connection with its future renewal of the fund's Advisory Contracts, the Board will consider the revenues earned and the expenses incurred by Fidelity in conducting the business of developing, marketing, distributing, managing, administering and servicing the fund and its shareholders.
Economies of Scale. The Board will consider economies of scale when there is operating experience to permit assessment thereof. It noted that, notwithstanding the entrepreneurial risk associated with a new fund, the management fee was at a level normally associated, by comparison with competitors, with very high fund net assets, and Fidelity asserted to the Board that the level of the fee anticipated economies of scale at lower asset levels even before, if ever, economies of scale are achieved. The Board also noted that the fund and its shareholders would have access to the very considerable number and variety of services available through Fidelity and its affiliates.
Based on its evaluation of all of the conclusions noted above, and after considering all factors it believed relevant, the Board ultimately concluded that the advisory fee structures are fair and reasonable, and that the fund's Advisory Contracts should be approved.
Annual Report
Investment Adviser
Fidelity Management & Research Company
Boston, MA
Investment Sub-Advisers
FMR Co., Inc.
Fidelity Management & Research
(U.K.) Inc.
Fidelity Management & Research
(Hong Kong) Limited
Fidelity Management & Research
(Japan) Inc.
FIL Investments (Japan) Limited
FIL Investment Advisors
FIL Investment Advisors (UK) Limited
General Distributor
Fidelity Distributors Corporation
Smithfield, RI
Transfer and Service Agents
Fidelity Investments Institutional
Operations Company, Inc.
Boston, MA
Fidelity Service Company, Inc.
Boston, MA
Custodian
Citibank, N.A.
New York, NY
(Fidelity Investment logo)(registered trademark)
AGED-UANN-1212
1.938150.100
(Fidelity Investment logo)(registered trademark)
Fidelity Advisor®
Global Equity Income
Fund - Institutional Class
Annual Report
October 31, 2012
(Fidelity Cover Art)
Contents
Management's Discussion of Fund Performance | (Click Here) | The Portfolio Manager's review of fund performance and strategy. |
Shareholder Expense Example | (Click Here) | An example of shareholder expenses. |
Investment Summary | (Click Here) | A summary of the fund's holdings. |
Investments | (Click Here) | A complete list of the fund's investments with their market values. |
Financial Statements | (Click Here) | Statements of assets and liabilities, operations, and changes in net assets, as well as financial highlights. |
Notes | (Click Here) | Notes to the financial statements. |
Report of Independent Registered Public Accounting Firm | (Click Here) | |
Trustees and Officers | (Click Here) | |
Distributions | (Click Here) | |
Board Approval of Investment Advisory Contracts and Management Fees | (Click Here) | |
To view a fund's proxy voting guidelines and proxy voting record for the 12-month period ended June 30, visit http://www.fidelity.com/proxyvotingresults or visit the Securities and Exchange Commission's (SEC) web site at http://www.sec.gov. You may also call 1-877-208-0098 to request a free copy of the proxy voting guidelines.
Standard & Poor's, S&P and S&P 500 are registered service marks of The McGraw-Hill Companies, Inc. and have been licensed for use by Fidelity Distributors Corporation.
Other third party marks appearing herein are the property of their respective owners.
All other marks appearing herein are registered or unregistered trademarks or service marks of FMR LLC or an affiliated company. © 2012 FMR LLC. All rights reserved.
Annual Report
This report and the financial statements contained herein are submitted for the general information of the shareholders of the fund. This report is not authorized for distribution to prospective investors in the fund unless preceded or accompanied by an effective prospectus.
A fund files its complete schedule of portfolio holdings with the SEC for the first and third quarters of each fiscal year on Form N-Q. Forms N-Q are available on the SEC's web site at http://www.sec.gov. A fund's Forms N-Q may be reviewed and copied at the SEC's Public Reference Room in Washington, DC. Information regarding the operation of the SEC's Public Reference Room may be obtained by calling 1-800-SEC-0330. For a complete list of a fund's portfolio holdings, view the most recent holdings listing, semiannual report, or annual report on Fidelity's web site at http://www.fidelity.com, http://www.advisor.fidelity.com, or http://www.401k.com, as applicable.
NOT FDIC INSURED • MAY LOSE VALUE • NO BANK GUARANTEE
Neither the fund nor Fidelity Distributors Corporation is a bank.
Annual Report
Market Recap: Global stocks experienced pendulum-like swings during the 12 months ending October 31, 2012, finishing the period with a solid advance. The market faced periodic bouts of volatility this past year, as a number of macroeconomic concerns - including the eurozone debt crisis, the strength and pace of the U.S. economic recovery, and a slowdown in China's once-blistering growth - dominated headlines and weighed on investors. While a stronger U.S. dollar provided an additional head wind for foreign investments, stocks worldwide rose 8.96% for the 12 months, as measured by the MSCI® ACWI® (All Country World Index) Index, largely buttressed in the summer by pledges of accommodative monetary action from eurozone officials, as well as signs that the U.S. housing market was on the mend. Within the index, the U.S. showed the most impressive gain among major markets, advancing 15%, closely followed by Asia-Pacific ex Japan (+10%). A number of core European components, most notably Germany (+11%), Switzerland (+10%) and the U.K. (+9%), benefited from optimism about the eurozone's ability to resolve its debt woes. However, continued weakness in peripheral European markets caused the region to lag the index overall. Elsewhere, results from Canada (+3%) and the generally more volatile emerging markets (+2%) each fell short of the MSCI index, while Japan was among the few benchmark constituents to finish in the red, returning about -3%.
Comments from Ramona Persaud, Portfolio Manager of Fidelity Advisor® Global Equity Income Fund: Since its inception on May 2, 2012, through October 31, 2012, the fund's Institutional Class shares returned 2.61%, outperforming the 1.67% gain of the MSCI® ACWI®. Stock selection and sector positioning were equally additive for the period, with the biggest boosts coming from positioning in health care and materials. At the stock level, large-cap pharmaceuticals firm Merck was our top contributor. Merck was trading at what I believed to be a reasonable valuation, but was also benefiting from an improving product pipeline and its continued focus on shareholder friendliness. French pharma firm Sanofi also helped bolster our results within health care, as the stock rebounded off a very cheap valuation. In materials, shares of chemicals company LyondellBassell Industries contributed when cyclical names gained favor later in the period. Conversely, the food/beverage/tobacco industry fell out of favor when the market took a "risk-on" tilt, and our positions here struggled, mainly tobacco stocks Swedish Match, Lorillard and U.K.-based British American Tobacco.
The views expressed above reflect those of the portfolio manager(s) only through the end of the period as stated on the cover of this report and do not necessarily represent the views of Fidelity or any other person in the Fidelity organization. Any such views are subject to change at any time based upon market or other conditions and Fidelity disclaims any responsibility to update such views. These views may not be relied on as investment advice and, because investment decisions for a Fidelity fund are based on numerous factors, may not be relied on as an indication of trading intent on behalf of any Fidelity fund.
Annual Report
Shareholder Expense Example
As a shareholder of the Fund, you incur two types of costs: (1) transaction costs, including sales charges (loads) on purchase payments or redemption proceeds, and (2) ongoing costs, including management fees, distribution and/or service (12b-1) fees and other Fund expenses. This Example is intended to help you understand your ongoing costs (in dollars) of investing in the Fund and to compare these costs with the ongoing costs of investing in other mutual funds.
The actual expense Example is based on an investment of $1,000 invested at the beginning of the period and held for the entire period (May 2, 2012 to October 31, 2012). The hypothetical expense Example is based on an investment of $1,000 invested for the one-half year period (May 1, 2012 to October 31, 2012).
Actual Expenses
The first line of the accompanying table for each class of the Fund provides information about actual account values and actual expenses. You may use the information in this line, together with the amount you invested, to estimate the expenses that you paid over the period. Simply divide your account value by $1,000.00 (for example, an $8,600 account value divided by $1,000.00 = 8.6), then multiply the result by the number in the first line for a class of the Fund under the heading entitled "Expenses Paid During Period" to estimate the expenses you paid on your account during this period. In addition, the Fund, as a shareholder in the underlying Fidelity Central Funds, will indirectly bear its pro-rata share of the fees and expenses incurred by the underlying Fidelity Central Funds. These fees and expenses are not included in the Fund's annualized expense ratio used to calculate the expense estimate in the table below.
Hypothetical Example for Comparison Purposes
The second line of the accompanying table for each class of the Fund provides information about hypothetical account values and hypothetical expenses based on a Class' actual expense ratio and an assumed rate of return of 5% per year before expenses, which is not the Class' actual return. The hypothetical account values and expenses may not be used to estimate the actual ending account balance or expenses you paid for the period. You may use this information to compare the ongoing costs of investing in the Fund and other funds. To do so, compare this 5% hypothetical example with the 5% hypothetical examples that appear in the shareholder reports of the other funds. In addition, the Fund, as a shareholder in the underlying Fidelity Central Funds, will indirectly bear its pro-rata share of the fees and expenses incurred by the underlying Fidelity Central Funds. These fees and expenses are not included in the Fund's annualized expense ratio used to calculate the expense estimate in the table below.
Please note that the expenses shown in the table are meant to highlight your ongoing costs only and do not reflect any transaction costs. Therefore, the second line of the table is useful in comparing ongoing costs only, and will not help you determine the relative total costs of owning different funds. In addition, if these transactional costs were included, your costs would have been higher.
Annual Report
| Annualized
Expense Ratio | Beginning
Account Value | Ending
Account Value
October 31, 2012 | Expenses Paid
During Period |
Class A | 1.45% | | | |
Actual | | $ 1,000.00 | $ 1,025.10 | $ 7.34 B |
HypotheticalA | | $ 1,000.00 | $ 1,017.85 | $ 7.35 C |
Class T | 1.70% | | | |
Actual | | $ 1,000.00 | $ 1,023.10 | $ 8.60 B |
HypotheticalA | | $ 1,000.00 | $ 1,016.59 | $ 8.62 C |
Class C | 2.20% | | | |
Actual | | $ 1,000.00 | $ 1,021.20 | $ 11.12 B |
HypotheticalA | | $ 1,000.00 | $ 1,014.08 | $ 11.14 C |
Institutional Class | 1.20% | | | |
Actual | | $ 1,000.00 | $ 1,026.10 | $ 6.08 B |
HypotheticalA | | $ 1,000.00 | $ 1,019.10 | $ 6.09 C |
A 5% return per year before expenses
B Actual expenses are equal to each Class' annualized expense ratio, multiplied by the average account value over the period, multiplied by 183/366 (to reflect the period May 2, 2012 to October 31, 2012).
C Hypothetical expenses are equal to each Class' annualized expense ratio, multiplied by the average account value over the period, multiplied by 184/366 (to reflect the one-half year period).
Annual Report
Investment Changes (Unaudited)
Top Five Stocks as of October 31, 2012 |
| % of fund's
net assets |
Johnson & Johnson (United States of America, Pharmaceuticals) | 2.7 |
Apple, Inc. (United States of America, Computers & Peripherals) | 2.6 |
Chevron Corp. (United States of America, Oil, Gas & Consumable Fuels) | 2.4 |
Merck & Co., Inc. (United States of America, Pharmaceuticals) | 2.3 |
IBM Corp. (United States of America, IT Services) | 2.2 |
| 12.2 |
Top Five Market Sectors as of October 31, 2012 |
| % of fund's
net assets |
Financials | 17.1 |
Consumer Staples | 14.2 |
Health Care | 13.4 |
Energy | 10.2 |
Information Technology | 9.8 |
Top Five Countries as of October 31, 2012 |
(excluding cash equivalents) | % of fund's
net assets |
United States of America | 43.4 |
United Kingdom | 14.6 |
Japan | 5.7 |
Sweden | 3.5 |
Switzerland | 3.2 |
Percentages are adjusted for the effect of open futures contracts, if applicable. |
Asset Allocation (% of fund's net assets) |
As of October 31, 2012 | |
| Stocks 95.9% | | | | |
| Short-Term
Investments and
Net Other Assets (Liabilities) 4.1% | | | | |

Annual Report
Investments October 31, 2012
Showing Percentage of Net Assets
Common Stocks - 95.1% |
| Shares | | Value |
Australia - 1.3% |
SP AusNet unit | 11,102 | | $ 12,216 |
Spark Infrastructure Group unit | 7,187 | | 12,608 |
Telstra Corp. Ltd. | 3,485 | | 14,977 |
TOTAL AUSTRALIA | | 39,801 |
Bailiwick of Jersey - 1.1% |
Informa PLC | 2,997 | | 19,355 |
Wolseley PLC | 307 | | 13,421 |
TOTAL BAILIWICK OF JERSEY | | 32,776 |
Brazil - 2.1% |
Companhia de Bebidas das Americas (AmBev) (PN) sponsored ADR | 268 | | 10,932 |
Companhia de Saneamento Basico do Estado de Sao Paulo (SABESP) sponsored ADR | 200 | | 16,802 |
Itau Unibanco Holdings SA sponsored ADR | 1,168 | | 17,029 |
Multiplus SA | 900 | | 20,911 |
TOTAL BRAZIL | | 65,674 |
Canada - 0.4% |
Fairfax Financial Holdings Ltd. (sub. vtg.) | 30 | | 11,129 |
Cayman Islands - 0.2% |
Pico Far East Holdings Ltd. | 32,000 | | 7,845 |
Chile - 0.5% |
Inversiones La Construccion SA | 859 | | 15,175 |
France - 3.1% |
Arkema SA | 200 | | 18,234 |
Euler Hermes SA | 177 | | 12,200 |
Ipsos SA | 400 | | 14,055 |
Sanofi SA | 587 | | 51,555 |
TOTAL FRANCE | | 96,044 |
Germany - 0.6% |
Hugo Boss AG | 110 | | 11,011 |
Muehlbauer Holding AG & Co. | 350 | | 8,905 |
TOTAL GERMANY | | 19,916 |
Hong Kong - 1.4% |
HKT Trust / HKT Ltd. unit | 45,000 | | 41,748 |
Indonesia - 0.4% |
PT Media Nusantara Citra Tbk | 45,000 | | 13,235 |
Common Stocks - continued |
| Shares | | Value |
Ireland - 2.2% |
Accenture PLC Class A | 675 | | $ 45,502 |
CRH PLC | 10 | | 186 |
FBD Holdings PLC | 700 | | 8,755 |
Irish Continental Group PLC unit | 500 | | 12,184 |
TOTAL IRELAND | | 66,627 |
Israel - 1.0% |
Israel Chemicals Ltd. | 1,500 | | 18,771 |
Rami Levi Chain Stores Hashikma Marketing 2006 Ltd. | 400 | | 11,917 |
TOTAL ISRAEL | | 30,688 |
Italy - 1.3% |
ENI SpA | 1,700 | | 39,119 |
Japan - 5.7% |
Aozora Bank Ltd. | 3,000 | | 8,455 |
Autobacs Seven Co. Ltd. | 200 | | 8,205 |
Canon, Inc. | 400 | | 13,000 |
Daito Trust Construction Co. Ltd. | 200 | | 20,193 |
Japan Retail Fund Investment Corp. | 9 | | 16,404 |
Japan Tobacco, Inc. | 1,400 | | 38,687 |
Nippon Telegraph & Telephone Corp. | 400 | | 18,291 |
Relo Holdings Corp. | 700 | | 23,272 |
Seven Bank Ltd. | 6,900 | | 19,707 |
USS Co. Ltd. | 100 | | 10,510 |
TOTAL JAPAN | | 176,724 |
Korea (South) - 2.0% |
DGB Financial Group Co. Ltd. | 760 | | 9,619 |
KT&G Corp. | 382 | | 29,115 |
LG Telecom Ltd. | 2,020 | | 12,913 |
YESCO Co. Ltd. | 320 | | 8,819 |
TOTAL KOREA (SOUTH) | | 60,466 |
Netherlands - 1.8% |
Koninklijke Philips Electronics NV | 1,000 | | 25,046 |
LyondellBasell Industries NV Class A | 568 | | 30,326 |
TOTAL NETHERLANDS | | 55,372 |
Nigeria - 0.5% |
Guaranty Trust Bank PLC | 59,682 | | 7,524 |
Nestle Foods Nigeria PLC | 1,752 | | 7,530 |
TOTAL NIGERIA | | 15,054 |
Common Stocks - continued |
| Shares | | Value |
Norway - 0.8% |
Telenor ASA | 1,200 | | $ 23,595 |
Panama - 1.0% |
Copa Holdings SA Class A | 350 | | 32,487 |
South Africa - 1.0% |
Clicks Group Ltd. | 3,434 | | 23,676 |
Foschini Ltd. | 500 | | 7,260 |
TOTAL SOUTH AFRICA | | 30,936 |
Spain - 0.5% |
Grifols SA ADR | 600 | | 15,096 |
Sweden - 3.5% |
Intrum Justitia AB | 1,450 | | 20,986 |
Svenska Handelsbanken AB (A Shares) | 1,210 | | 41,447 |
Swedish Match Co. AB | 1,310 | | 44,635 |
TOTAL SWEDEN | | 107,068 |
Switzerland - 3.2% |
Clariant AG (Reg.) | 1,664 | | 17,814 |
Roche Holding AG (participation certificate) | 310 | | 59,617 |
UBS AG | 1,510 | | 22,655 |
TOTAL SWITZERLAND | | 100,086 |
Taiwan - 1.6% |
Far EasTone Telecommunications Co. Ltd. | 8,000 | | 18,459 |
Taiwan Semiconductor Manufacturing Co. Ltd. | 10,000 | | 30,473 |
TOTAL TAIWAN | | 48,932 |
United Kingdom - 14.6% |
Barclays PLC | 6,534 | | 24,161 |
BP PLC | 5,324 | | 38,022 |
British American Tobacco PLC (United Kingdom) | 1,100 | | 54,560 |
Dunelm Group PLC | 1,200 | | 12,975 |
Ensco PLC Class A | 278 | | 16,074 |
GlaxoSmithKline PLC | 2,363 | | 52,949 |
Hilton Food Group PLC | 4,288 | | 19,220 |
ICAP PLC | 3,000 | | 15,739 |
London Stock Exchange Group PLC | 1,400 | | 22,039 |
Reckitt Benckiser Group PLC | 878 | | 53,133 |
Royal Dutch Shell PLC Class A (United Kingdom) | 1,498 | | 51,400 |
Common Stocks - continued |
| Shares | | Value |
United Kingdom - continued |
Vodafone Group PLC | 21,351 | | $ 57,982 |
WH Smith PLC | 2,956 | | 29,623 |
TOTAL UNITED KINGDOM | | 447,877 |
United States of America - 43.3% |
Altria Group, Inc. | 1,033 | | 32,849 |
American Tower Corp. | 260 | | 19,575 |
Analog Devices, Inc. | 909 | | 35,551 |
Apple, Inc. | 135 | | 80,339 |
Cardinal Health, Inc. | 240 | | 9,871 |
Cedar Fair LP (depository unit) | 1,006 | | 36,065 |
CenturyLink, Inc. | 505 | | 19,382 |
Chevron Corp. | 664 | | 73,179 |
CME Group, Inc. | 203 | | 11,354 |
Colgate-Palmolive Co. | 288 | | 30,228 |
Comcast Corp. Class A | 964 | | 36,160 |
Corrections Corp. of America | 260 | | 8,749 |
Dr Pepper Snapple Group, Inc. | 1,024 | | 43,878 |
Eli Lilly & Co. | 481 | | 23,391 |
Emerson Electric Co. | 440 | | 21,309 |
Exxon Mobil Corp. | 364 | | 33,186 |
General Electric Co. | 2,628 | | 55,346 |
Hubbell, Inc. Class B | 390 | | 32,651 |
IBM Corp. | 346 | | 67,307 |
Johnson & Johnson | 1,176 | | 83,284 |
JPMorgan Chase & Co. | 1,000 | | 41,680 |
Limited Brands, Inc. | 340 | | 16,283 |
Lorillard, Inc. | 233 | | 27,030 |
M&T Bank Corp. | 256 | | 26,650 |
McDonald's Corp. | 200 | | 17,360 |
Merck & Co., Inc. | 1,584 | | 72,278 |
Microsoft Corp. | 1,100 | | 31,389 |
Pfizer, Inc. | 1,423 | | 35,390 |
PG&E Corp. | 435 | | 18,496 |
PNC Financial Services Group, Inc. | 300 | | 17,457 |
Psychemedics Corp. | 960 | | 10,982 |
Sempra Energy | 280 | | 19,530 |
The Williams Companies, Inc. | 1,298 | | 45,417 |
U.S. Bancorp | 1,718 | | 57,055 |
United Technologies Corp. | 390 | | 30,482 |
VF Corp. | 215 | | 33,643 |
Common Stocks - continued |
| Shares | | Value |
United States of America - continued |
Wells Fargo & Co. | 1,931 | | $ 65,055 |
Western Gas Partners LP | 220 | | 11,216 |
TOTAL UNITED STATES OF AMERICA | | 1,331,047 |
TOTAL COMMON STOCKS (Cost $2,849,958) |
2,924,517
|
Preferred Stocks - 0.8% |
| | | |
Convertible Preferred Stocks - 0.1% |
United States of America - 0.1% |
United Technologies Corp. 7.50% | 60 | | 3,263 |
Nonconvertible Preferred Stocks - 0.7% |
Germany - 0.7% |
Volkswagen AG | 110 | | 22,755 |
TOTAL PREFERRED STOCKS (Cost $23,375) |
26,018
|
Money Market Funds - 4.3% |
| | | |
Fidelity Cash Central Fund, 0.19% (a)
(Cost $131,140) | 131,140 | |
131,140
|
TOTAL INVESTMENT PORTFOLIO - 100.2% (Cost $3,004,473) | 3,081,675 |
NET OTHER ASSETS (LIABILITIES) - (0.2)% | (6,824) |
NET ASSETS - 100% | $ 3,074,851 |
Legend |
(a) Affiliated fund that is available only to investment companies and other accounts managed by Fidelity Investments. The rate quoted is the annualized seven-day yield of the fund at period end. A complete unaudited listing of the fund's holdings as of its most recent quarter end is available upon request. In addition, each Fidelity Central Fund's financial statements, which are not covered by the Fund's Report of Independent Registered Public Accounting Firm, are available on the SEC's website or upon request. |
Affiliated Central Funds |
Information regarding fiscal year to date income earned by the Fund from investments in Fidelity Central Funds is as follows: |
Fund | Income earned |
Fidelity Cash Central Fund | $ 162 |
Other Information |
Categorizations in the Schedule of Investments are based on country or territory of incorporation. |
The following is a summary of the inputs used, as of October 31, 2012, involving the Fund's assets and liabilities carried at fair value. The inputs or methodology used for valuing securities may not be an indication of the risk associated with investing in those securities. For more information on valuation inputs, and their aggregation into the levels used in the table below, please refer to the Security Valuation section in the accompanying Notes to Financial Statements. |
Valuation Inputs at Reporting Date: |
Description | Total | Level 1 | Level 2 | Level 3 |
Investments in Securities: | | | | |
Equities: | | | | |
Consumer Discretionary | $ 296,340 | $ 296,340 | $ - | $ - |
Consumer Staples | 427,390 | 372,830 | 54,560 | - |
Energy | 307,613 | 179,072 | 128,541 | - |
Financials | 534,329 | 487,513 | 46,816 | - |
Health Care | 414,413 | 309,909 | 104,504 | - |
Industrials | 285,740 | 260,694 | 25,046 | - |
Information Technology | 303,561 | 260,088 | 43,473 | - |
Materials | 85,331 | 85,145 | 186 | - |
Telecommunication Services | 207,347 | 131,074 | 76,273 | - |
Utilities | 88,471 | 88,471 | - | - |
Money Market Funds | 131,140 | 131,140 | - | - |
Total Investments in Securities: | $ 3,081,675 | $ 2,602,276 | $ 479,399 | $ - |
See accompanying notes which are an integral part of the financial statements.
Annual Report
Statement of Assets and Liabilities
| October 31, 2012 |
| | |
Assets | | |
Investment in securities, at value - See accompanying schedule: Unaffiliated issuers (cost $2,873,333) | $ 2,950,535 | |
Fidelity Central Funds (cost $131,140) | 131,140 | |
Total Investments (cost $3,004,473) | | $ 3,081,675 |
Receivable for investments sold | | 66,825 |
Dividends receivable | | 5,018 |
Distributions receivable from Fidelity Central Funds | | 28 |
Prepaid expenses | | 32,926 |
Receivable from investment adviser for expense reductions | | 14,923 |
Other receivables | | 13 |
Total assets | | 3,201,408 |
| | |
Liabilities | | |
Payable to custodian bank | $ 25 | |
Payable for investments purchased | 82,801 | |
Accrued management fee | 1,798 | |
Distribution and service plan fees payable | 1,011 | |
Custodian fees payable | 2,736 | |
Audit fees payable | 37,757 | |
Other affiliated payables | 429 | |
Total liabilities | | 126,557 |
| | |
Net Assets | | $ 3,074,851 |
Net Assets consist of: | | |
Paid in capital | | $ 3,025,772 |
Distributions in excess of net investment income | | (1) |
Accumulated undistributed net realized gain (loss) on investments and foreign currency transactions | | (28,076) |
Net unrealized appreciation (depreciation) on investments and assets and liabilities in foreign currencies | | 77,156 |
Net Assets | | $ 3,074,851 |
See accompanying notes which are an integral part of the financial statements.
Annual Report
Statement of Assets and Liabilities - continued
| October 31, 2012 |
| | |
Calculation of Maximum Offering Price
Class A:
Net Asset Value and redemption price per share
($756,412 ÷ 74,554 shares) | | $ 10.15 |
| | |
Maximum offering price per share (100/94.25 of $10.15) | | $ 10.77 |
Class T:
Net Asset Value and redemption price per share ($713,863 ÷ 70,379 shares) | | $ 10.14 |
| | |
Maximum offering price per share (100/96.50 of $10.14) | | $ 10.51 |
Class C:
Net Asset Value and offering price per share ($665,870 ÷ 65,690 shares)A | | $ 10.14 |
| | |
Institutional Class:
Net Asset Value, offering price and redemption price per share ($938,706 ÷ 92,498 shares) | | $ 10.15 |
A Redemption price per share is equal to net asset value less any applicable contingent deferred sales charge.
See accompanying notes which are an integral part of the financial statements.
Annual Report
Financial Statements - continued
Statement of Operations
| | For the period
May 2, 2012
(commencement of
operations) to
October 31, 2012 |
| | |
Investment Income | | |
Dividends | | $ 49,208 |
Interest | | 32 |
Income from Fidelity Central Funds | | 162 |
Income before foreign taxes withheld | | 49,402 |
Less foreign taxes withheld | | (2,230) |
Total income | | 47,172 |
| | |
Expenses | | |
Management fee | $ 9,913 | |
Transfer agent fees | 1,775 | |
Distribution and service plan fees | 5,523 | |
Accounting fees and expenses | 726 | |
Custodian fees and expenses | 8,809 | |
Independent trustees' compensation | 8 | |
Registration fees | 34,895 | |
Audit | 45,803 | |
Legal | 3 | |
Total expenses before reductions | 107,455 | |
Expense reductions | (84,989) | 22,466 |
Net investment income (loss) | | 24,706 |
Realized and Unrealized Gain (Loss) Net realized gain (loss) on: | | |
Investment securities: | | |
Unaffiliated issuers | (26,546) | |
Foreign currency transactions | 298 | |
Total net realized gain (loss) | | (26,248) |
Change in net unrealized appreciation (depreciation) on: Investment securities | 77,202 | |
Assets and liabilities in foreign currencies | (46) | |
Total change in net unrealized appreciation (depreciation) | | 77,156 |
Net gain (loss) | | 50,908 |
Net increase (decrease) in net assets resulting from operations | | $ 75,614 |
See accompanying notes which are an integral part of the financial statements.
Annual Report
Statement of Changes in Net Assets
| For the period
May 2, 2012
(commencement of
operations) to
October 31, 2012 |
Increase (Decrease) in Net Assets | |
Operations | |
Net investment income (loss) | $ 24,706 |
Net realized gain (loss) | (26,248) |
Change in net unrealized appreciation (depreciation) | 77,156 |
Net increase (decrease) in net assets resulting
from operations | 75,614 |
Distributions to shareholders from net investment income | (26,857) |
Share transactions - net increase (decrease) | 3,026,094 |
Total increase (decrease) in net assets | 3,074,851 |
| |
Net Assets | |
Beginning of period | - |
End of period (including distributions in excess of net investment income of $1) | $ 3,074,851 |
See accompanying notes which are an integral part of the financial statements.
Annual Report
Financial Highlights - Class A
Period ended October 31, | 2012H |
Selected Per-Share Data | |
Net asset value, beginning of period | $ 10.00 |
Income from Investment Operations | |
Net investment income (loss) E | .09 |
Net realized and unrealized gain (loss) | .16 |
Total from investment operations | .25 |
Distributions from net investment income | (.10) |
Net asset value, end of period | $ 10.15 |
Total ReturnB, C, D | 2.51% |
Ratios to Average Net Assets F, I | |
Expenses before reductions | 7.41% A |
Expenses net of fee waivers, if any | 1.45% A |
Expenses net of all reductions | 1.44% A |
Net investment income (loss) | 1.89% A |
Supplemental Data | |
Net assets, end of period (000 omitted) | $ 756 |
Portfolio turnover rate G | 36% J |
A Annualized
B Total returns for periods of less than one year are not annualized.
C Total returns would have been lower if certain expenses had not been reduced during the applicable periods shown.
D Total returns do not include the effect of the sales charges.
E Calculated based on average shares outstanding during the period.
F Fees and expenses of any underlying Fidelity Central Funds are not included in the Fund's expense ratio. The Fund indirectly bears its proportionate share of the expenses of any underlying Fidelity Central Funds.
G Amount does not include the portfolio activity of any underlying Fidelity Central Funds.
H For the period May 2, 2012 (commencement of operations) to October 31, 2012.
I Expense ratios reflect operating expenses of the class. Expenses before reductions do not reflect amounts reimbursed by the investment adviser or reductions from brokerage service arrangements or reductions from other expense offset arrangements and do not represent the amount paid by the class during periods when reimbursements or reductions occur. Expense ratios before reductions for start-up periods may not be representative of longer-term operating periods. Expenses net of fee waivers reflect expenses after reimbursement by the investment adviser but prior to reductions from brokerage service arrangements or other expense offset arrangements. Expenses net of all reductions represent the net expenses paid by the class.
J Amount not annualized.
See accompanying notes which are an integral part of the financial statements.
Annual Report
Financial Highlights - Class T
Period ended October 31, | 2012H |
Selected Per-Share Data | |
Net asset value, beginning of period | $ 10.00 |
Income from Investment Operations | |
Net investment income (loss) E | .08 |
Net realized and unrealized gain (loss) | .15 |
Total from investment operations | .23 |
Distributions from net investment income | (.09) |
Net asset value, end of period | $ 10.14 |
Total ReturnB, C, D | 2.31% |
Ratios to Average Net Assets F, I | |
Expenses before reductions | 7.68% A |
Expenses net of fee waivers, if any | 1.70% A |
Expenses net of all reductions | 1.69% A |
Net investment income (loss) | 1.64% A |
Supplemental Data | |
Net assets, end of period (000 omitted) | $ 714 |
Portfolio turnover rate G | 36% J |
A Annualized
B Total returns for periods of less than one year are not annualized.
C Total returns would have been lower if certain expenses had not been reduced during the applicable periods shown.
D Total returns do not include the effect of the sales charges.
E Calculated based on average shares outstanding during the period.
F Fees and expenses of any underlying Fidelity Central Funds are not included in the Fund's expense ratio. The Fund indirectly bears its proportionate share of the expenses of any underlying Fidelity Central Funds.
G Amount does not include the portfolio activity of any underlying Fidelity Central Funds.
H For the period May 2, 2012 (commencement of operations) to October 31, 2012.
I Expense ratios reflect operating expenses of the class. Expenses before reductions do not reflect amounts reimbursed by the investment adviser or reductions from brokerage service arrangements or reductions from other expense offset arrangements and do not represent the amount paid by the class during periods when reimbursements or reductions occur. Expense ratios before reductions for start-up periods may not be representative of longer-term operating periods. Expenses net of fee waivers reflect expenses after reimbursement by the investment adviser but prior to reductions from brokerage service arrangements or other expense offset arrangements. Expenses net of all reductions represent the net expenses paid by the class.
J Amount not annualized.
See accompanying notes which are an integral part of the financial statements.
Annual Report
Financial Highlights - Class C
Period ended October 31, | 2012H |
Selected Per-Share Data | |
Net asset value, beginning of period | $ 10.00 |
Income from Investment Operations | |
Net investment income (loss)E | .06 |
Net realized and unrealized gain (loss) | .15 |
Total from investment operations | .21 |
Distributions from net investment income | (.07) |
Net asset value, end of period | $ 10.14 |
Total ReturnB, C, D | 2.12% |
Ratios to Average Net AssetsF, I | |
Expenses before reductions | 8.19% A |
Expenses net of fee waivers, if any | 2.20% A |
Expenses net of all reductions | 2.19% A |
Net investment income (loss) | 1.14% A |
Supplemental Data | |
Net assets, end of period (000 omitted) | $ 666 |
Portfolio turnover rateG | 36% J |
A Annualized
B Total returns for periods of less than one year are not annualized.
C Total returns would have been lower if certain expenses had not been reduced during the applicable periods shown.
D Total returns do not include the effect of the contingent deferred sales charge.
E Calculated based on average shares outstanding during the period.
F Fees and expenses of any underlying Fidelity Central Funds are not included in the Fund's expense ratio. The Fund indirectly bears its proportionate share of the expenses of any underlying Fidelity Central Funds.
G Amount does not include the portfolio activity of any underlying Fidelity Central Funds.
H For the period May 2, 2012 (commencement of operations) to October 31, 2012.
I Expense ratios reflect operating expenses of the class. Expenses before reductions do not reflect amounts reimbursed by the investment adviser or reductions from brokerage service arrangements or reductions from other expense offset arrangements and do not represent the amount paid by the class during periods when reimbursements or reductions occur. Expense ratios before reductions for start-up periods may not be representative of longer-term operating periods. Expenses net of fee waivers reflect expenses after reimbursement by the investment adviser but prior to reductions from brokerage service arrangements or other expense offset arrangements. Expenses net of all reductions represent the net expenses paid by the class.
J Amount not annualized.
See accompanying notes which are an integral part of the financial statements.
Annual Report
Financial Highlights - Institutional Class
Period ended October 31, | 2012 G |
Selected Per-Share Data | |
Net asset value, beginning of period | $ 10.00 |
Income from Investment Operations | |
Net investment income (loss)D | .10 |
Net realized and unrealized gain (loss) | .16 |
Total from investment operations | .26 |
Distributions from net investment income | (.11) |
Net asset value, end of period | $ 10.15 |
Total ReturnB, C | 2.61% |
Ratios to Average Net AssetsE, H | |
Expenses before reductions | 7.23% A |
Expenses net of fee waivers, if any | 1.20% A |
Expenses net of all reductions | 1.19% A |
Net investment income (loss) | 2.14% A |
Supplemental Data | |
Net assets, end of period (000 omitted) | $ 939 |
Portfolio turnover rate F | 36% I |
A Annualized
B Total returns for periods of less than one year are not annualized.
C Total returns would have been lower if certain expenses had not been reduced during the applicable periods shown.
D Calculated based on average shares outstanding during the period.
E Fees and expenses of any underlying Fidelity Central Funds are not included in the Fund's expense ratio. The Fund indirectly bears its proportionate share of the expenses of any underlying Fidelity Central Funds.
F Amount does not include the portfolio activity of any underlying Fidelity Central Funds.
G For the period May 2, 2012 (commencement of operations) to October 31, 2012.
H Expense ratios reflect operating expenses of the class. Expenses before reductions do not reflect amounts reimbursed by the investment adviser or reductions from brokerage service arrangements or reductions from other expense offset arrangements and do not represent the amount paid by the class during periods when reimbursements or reductions occur. Expense ratios before reductions for start-up periods may not be representative of longer-term operating periods. Expenses net of fee waivers reflect expenses after reimbursement by the investment adviser but prior to reductions from brokerage service arrangements or other expense offset arrangements. Expenses net of all reductions represent the net expenses paid by the class.
I Amount not annualized.
See accompanying notes which are an integral part of the financial statements.
Annual Report
Notes to Financial Statements
For the period ended October 31, 2012
1. Organization.
Fidelity Advisor Global Equity Income Fund (the Fund) is a fund of Fidelity Advisor Series VIII (the Trust) and is authorized to issue an unlimited number of shares. The Trust is registered under the Investment Company Act of 1940, as amended (the 1940 Act), as an open-end management investment company organized as a Massachusetts business trust. The Fund offers Class A, Class T, Class C, and Institutional Class shares, each of which has equal rights as to assets and voting privileges. Each class has exclusive voting rights with respect to matters that affect that class. Investment income, realized and unrealized capital gains and losses, the common expenses of the Fund, and certain fund-level expense reductions, if any, are allocated on a pro-rata basis to each class based on the relative net assets of each class to the total net assets of the Fund. Each class differs with respect to transfer agent and distribution and service plan fees incurred. Certain expense reductions may also differ by class. The Fund's investments in emerging markets can be subject to social, economic, regulatory, and political uncertainties and can be extremely volatile.
2. Investments in Fidelity Central Funds.
The Fund invests in Fidelity Central Funds, which are open-end investment companies available only to other investment companies and accounts managed by Fidelity Management & Research Company (FMR) and its affiliates. The Fund's Schedule of Investments lists each of the Fidelity Central Funds held as of period end, if any, as an investment of the Fund, but does not include the underlying holdings of each Fidelity Central Fund. As an Investing Fund, the Fund indirectly bears its proportionate share of the expenses of the underlying Fidelity Central Funds.
The Money Market Central Funds seek preservation of capital and current income and are managed by Fidelity Investments Money Management, Inc. (FIMM), an affiliate of FMR.
A complete unaudited list of holdings for each Fidelity Central Fund is available upon request or at the Securities and Exchange Commission (the SEC) web site at www.sec.gov. In addition, the financial statements of the Fidelity Central Funds, which are not covered by the Fund's Report of Independent Registered Public Accounting Firm, are available on the SEC web site or upon request.
3. Significant Accounting Policies.
The financial statements have been prepared in conformity with accounting principles generally accepted in the United States of America (GAAP), which require management to make certain estimates and assumptions at the date of the financial statements. Actual results could differ from those estimates. Subsequent events, if any, through the date that the financial statements were issued have been evaluated in the preparation of the financial statements. The following summarizes the significant accounting policies of the Fund:
Annual Report
Notes to Financial Statements - continued
3. Significant Accounting Policies - continued
Security Valuation. Investments are valued as of 4:00 p.m. Eastern time on the last calendar day of the period. In accordance with valuation policies and procedures approved by the Board of Trustees (the Board), the Fund attempts to obtain prices from one or more third party pricing vendors or brokers to value its investments. When current market prices, quotations or rates are not readily available or reliable, securities will be fair valued in good faith by the FMR Fair Value Committee (the Committee), in accordance with procedures adopted by the Fund's Board. Factors used in determining fair value vary by security type and may include market or security specific events. The frequency with which these procedures are used cannot be predicted and they may be utilized to a significant extent. The Committee oversees the Fund's valuation policies and procedures and is responsible for approving and reporting to the Board all fair value determinations.
The Fund categorizes the inputs to valuation techniques used to value its investments into a disclosure hierarchy consisting of three levels as shown below:
Level 1 - quoted prices in active markets for identical investments
Level 2 - other significant observable inputs (including quoted prices for similar investments, interest rates, prepayment speeds, etc.)
Level 3 - unobservable inputs (including the Fund's own assumptions based on the best information available)
Valuation techniques used to value the Fund's investments by major category are as follows:
Equity securities, including restricted securities, for which market quotations are readily available, are valued at the last reported sale price or official closing price as reported by a third party pricing vendor on the primary market or exchange on which they are traded and are categorized as Level 1 in the hierarchy. In the event there were no sales during the day or closing prices are not available, securities are valued at the last quoted bid price or may be valued using the last available price and are generally categorized as Level 2 in the hierarchy. For foreign equity securities, when significant market or security specific events arise, comparisons to the valuation of American Depositary Receipts (ADRs), futures contracts, Exchange-Traded Funds (ETFs) and certain indexes as well as quoted prices for similar securities are used and are categorized as Level 2 in the hierarchy. Utilizing these techniques may result in transfers between Level 1 and Level 2.
Investments in open-end mutual funds, including the Fidelity Central Funds, are valued at their closing net asset value (NAV) each business day and are categorized as Level 1 in the hierarchy.
Annual Report
3. Significant Accounting Policies - continued
Security Valuation - continued
Changes in valuation techniques may result in transfers in or out of an assigned level within the disclosure hierarchy. The aggregate value of investments by input level, as of October 31, 2012, is included at the end of the Fund's Schedule of Investments.
Foreign Currency Translation. The Fund may use foreign currency contracts to facilitate transactions in foreign-denominated securities. Gains and losses from these transactions may arise from changes in the value of the foreign currency or if the counterparties do not perform under the contracts' terms.
Foreign-denominated assets, including investment securities, and liabilities are translated into U.S. dollars at the exchange rates at period end. Purchases and sales of investment securities, income and dividends received and expenses denominated in foreign currencies are translated into U.S. dollars at the exchange rate in effect on the transaction date.
The effects of exchange rate fluctuations on investments are included with the net realized and unrealized gain (loss) on investment securities. Other foreign currency transactions resulting in realized and unrealized gain (loss) are disclosed separately.
Investment Transactions and Income. For financial reporting purposes, the Fund's investment holdings and NAV include trades executed through the end of the last business day of the period. The NAV per share for processing shareholder transactions is calculated as of the close of business of the New York Stock Exchange (NYSE), normally 4:00 p.m. Eastern time and includes trades executed through the end of the prior business day. Gains and losses on securities sold are determined on the basis of identified cost. Dividend income is recorded on the ex-dividend date, except for certain dividends from foreign securities where the ex-dividend date may have passed, which are recorded as soon as the Fund is informed of the ex-dividend date. Non-cash dividends included in dividend income, if any, are recorded at the fair market value of the securities received. Distributions received on securities that represent a return of capital or capital gain are recorded as a reduction of cost of investments and/or as a realized gain. The Fund estimates the components of distributions received that may be considered return of capital distributions or capital gain distributions. Interest income and distributions from the Fidelity Central Funds are accrued as earned. Interest income includes coupon interest and amortization of premium and accretion of discount on debt securities. Investment income is recorded net of foreign taxes withheld where recovery of such taxes is uncertain.
Expenses. Expenses directly attributable to a fund are charged to that fund. Expenses attributable to more than one fund are allocated among the respective funds on the basis of relative net assets or other appropriate methods. Expense estimates are accrued in the period to which they relate and adjustments are made when actual amounts are known.
Annual Report
Notes to Financial Statements - continued
3. Significant Accounting Policies - continued
Income Tax Information and Distributions to Shareholders. Each year, the Fund intends to qualify as a regulated investment company under Subchapter M of the Internal Revenue Code, including distributing substantially all of its taxable income and realized gains. As a result, no provision for income taxes is required. As of October 31, 2012, the Fund did not have any unrecognized tax benefits in the financial statements; nor is the Fund aware of any tax positions for which it is reasonably possible that the total amounts of unrecognized tax benefits will significantly change in the next twelve months. The Fund files a U.S. federal tax return, in addition to state and local tax returns as required. A fund's federal income tax returns are subject to examination by the Internal Revenue Service (IRS) for a period of three fiscal years after they are filed. State and local tax returns may be subject to examination for an additional fiscal year depending on the jurisdiction. Foreign taxes are provided for based on the Fund's understanding of the tax rules and rates that exist in the foreign markets in which it invests.
Distributions are declared and recorded on the ex-dividend date. Income dividends and capital gain distributions are declared separately for each class. Income and capital gain distributions are determined in accordance with income tax regulations, which may differ from GAAP.
Capital accounts within the financial statements are adjusted for permanent book-tax differences. These adjustments have no impact on net assets or the results of operations. Temporary book-tax differences will reverse in a subsequent period.
Book-tax differences are primarily due to foreign currency transactions, passive foreign investment companies (PFIC), partnerships, capital loss carryforwards, equity-debt classifications and losses deferred due to wash sales.
The federal tax cost of investment securities and unrealized appreciation (depreciation) as of period end were as follows:
Gross unrealized appreciation | $ 143,679 |
Gross unrealized depreciation | (69,695) |
Net unrealized appreciation (depreciation) on securities and other investments | $ 73,984 |
| |
Tax Cost | $ 3,007,691 |
The tax-based components of distributable earnings as of period end were as follows:
Capital loss carryforward | $ (24,859) |
Net unrealized appreciation (depreciation) | $ 73,938 |
Annual Report
3. Significant Accounting Policies - continued
Income Tax Information and Distributions to Shareholders - continued
Capital loss carryforwards are only available to offset future capital gains of the Fund to the extent provided by regulations and may be limited. Under the Regulated Investment Company Modernization Act of 2010 (the Act), the Fund is permitted to carry forward capital losses incurred in taxable years beginning after December 22, 2010 for an unlimited period and such capital losses are required to be used prior to any losses that expire. Capital loss carryforwards were as follows:
No expiration | |
Short-term | $ (24,859) |
Total capital loss carryforward | $ (24,859) |
The tax character of distributions paid was as follows:
| October 31, 2012 |
Ordinary Income | $ 26,857 |
New Accounting Pronouncement. In December 2011, the Financial Accounting Standards Board issued Accounting Standard Update No. 2011-11, Disclosures about Offsetting Assets and Liabilities. The update creates new disclosure requirements requiring entities to disclose both gross and net information for derivatives and other financial instruments that are either offset in the Statement of Assets and Liabilities or subject to an enforceable master netting arrangement or similar agreement. The disclosure requirements are effective for annual reporting periods beginning on or after January 1, 2013, and interim periods within those annual periods. Management is currently evaluating the impact of the update's adoption on the Fund's financial statement disclosures.
4. Purchases and Sales of Investments.
Purchases and sales of securities, other than short-term securities, aggregated $3,883,843 and $983,904, respectively.
5. Fees and Other Transactions with Affiliates.
Management Fee. FMR and its affiliates provide the Fund with investment management related services for which the Fund pays a monthly management fee. The management fee is the sum of an individual fund fee rate that is based on an annual rate of .45% of the Fund's average net assets and an annualized group fee rate that averaged .26% during the period. The group fee rate is based upon the average net assets of all the mutual funds advised by FMR. The group fee rate decreases as assets under management increase and increases as assets under management decrease. For the period, the total annualized management fee rate was .71% of the Fund's average net assets.
Annual Report
Notes to Financial Statements - continued
5. Fees and Other Transactions with Affiliates - continued
Distribution and Service Plan Fees. In accordance with Rule 12b-1 of the 1940 Act, the Fund has adopted separate Distribution and Service Plans for each class of shares, except for the Institutional Class. Certain classes pay Fidelity Distributors Corporation (FDC), an affiliate of FMR, separate Distribution and Service Fees, each of which is based on an annual percentage of each class' average net assets. In addition, FDC may pay financial intermediaries for selling shares of the Fund and providing shareholder support services. For the period, the Distribution and Service Fee rates, total fees and amounts retained by FDC were as follows:
| Distribution
Fee | Service
Fee | Total Fees | Retained
by FDC |
Class A | -% | .25% | $ 833 | $ 808 |
Class T | .25% | .25% | 1,572 | 1,530 |
Class C | .75% | .25% | 3,118 | 3,118 |
| | | $ 5,523 | $ 5,456 |
Sales Load. FDC may receive a front-end sales charge of up to 5.75% for selling Class A shares and 3.50% for selling Class T shares, some of which is paid to financial intermediaries for selling shares of the Fund. Depending on the holding period, FDC may receive contingent deferred sales charges levied on Class A, Class T and Class C redemptions. The deferred sales charges range from 1.00% for Class C shares, 1.00% for certain purchases of Class A shares and .25% for certain purchases of Class T shares.
For the period, sales charge amounts retained by FDC were as follows:
| Retained
by FDC |
Class A | $ 1,829 |
Class T | 139 |
Class C* | 34 |
| $ 2,002 |
* When Class C shares are initially sold, FDC pays commissions from its own resources to financial intermediaries through which the sales are made.
Transfer Agent Fees. Fidelity Investments Institutional Operations Company, Inc. (FIIOC), an affiliate of FMR, is the transfer, dividend disbursing and shareholder servicing agent for each class of the Fund. FIIOC receives account fees and asset-based fees that vary according to the account size and type of account of the shareholders of the respective classes of the Fund. FIIOC pays for typesetting, printing and mailing of shareholder reports, except proxy statements. For the period, transfer agent fees for each applicable class were as follows:
| Amount | % of
Average
Net Assets |
Class A | $ 451 | .14 |
Class T | 356 | .11 |
Class C | 396 | .13 |
Institutional Class | 572 | .13 |
| $ 1,775 | |
Annual Report
5. Fees and Other Transactions with Affiliates - continued
Accounting Fees. Fidelity Service Company, Inc. (FSC), an affiliate of FMR, maintains the Fund's accounting records. The fee is based on the level of average net assets for each month.
Brokerage Commissions. The Fund placed a portion of its portfolio transactions with brokerage firms which are affiliates of the investment adviser. The commissions paid to these affiliated firms were $7 for the period.
6. Expense Reductions.
FMR contractually agreed to reimburse each class to the extent annual operating expenses exceeded certain levels of average net assets as noted in the table below. This reimbursement will remain in place through December 31, 2013. Some expenses, for example interest expense, are excluded from this reimbursement.
The following classes were in reimbursement during the period:
| Expense
Limitations | Reimbursement
from adviser |
| | |
Class A | 1.45% | $ 20,071 |
Class T | 1.70% | 19,001 |
Class C | 2.20% | 18,874 |
Institutional Class | 1.20% | 26,932 |
| | $ 84,878 |
Many of the brokers with whom FMR places trades on behalf of the Fund provided services to the Fund in addition to trade execution. These services included payments of certain expenses on behalf of the Fund totaling $107 for the period. In addition, through arrangements with the Fund's custodian, credits realized as a result of uninvested cash balances were used to reduce the Fund's expenses. During the period, these credits reduced the Fund's custody expenses by $4.
7. Distributions to Shareholders.
Distributions to shareholders of each class were as follows:
Period ended October 31, | 2012 A |
From net investment income | |
Class A | $ 6,925 |
Class T | 5,775 |
Class C | 4,470 |
Institutional Class | 9,687 |
Total | $ 26,857 |
A For the period May 2, 2012 (commencement of operations) to October 31, 2012.
Annual Report
Notes to Financial Statements - continued
8. Share Transactions.
Transactions for each class of shares were as follows:
Period October 31, | Shares A | Dollars A |
Class A | | |
Shares sold | 73,860 | $ 736,903 |
Reinvestment of distributions | 694 | 6,925 |
Net increase (decrease) | 74,554 | $ 743,828 |
Class T | | |
Shares sold | 69,801 | $ 699,717 |
Reinvestment of distributions | 579 | 5,775 |
Shares redeemed | (1) | (15) |
Net increase (decrease) | 70,379 | $ 705,477 |
Class C | | |
Shares sold | 65,575 | $ 655,827 |
Reinvestment of distributions | 450 | 4,470 |
Shares redeemed | (335) | (3,402) |
Net increase (decrease) | 65,690 | $ 656,895 |
Institutional Class | | |
Shares sold | 106,504 | $ 1,051,902 |
Reinvestment of distributions | 972 | 9,687 |
Shares redeemed | (14,978) | (141,695) |
Net increase (decrease) | 92,498 | $ 919,894 |
A For the period May 2, 2012 (commencement of operations) to October 31, 2012.
9. Other.
The Fund's organizational documents provide former and current trustees and officers with a limited indemnification against liabilities arising in connection with the performance of their duties to the Fund. In the normal course of business, the Fund may also enter into contracts that provide general indemnifications. The Fund's maximum exposure under these arrangements is unknown as this would be dependent on future claims that may be made against the Fund. The risk of material loss from such claims is considered remote.
At the end of the period, FMR or its affiliates were the owners of record of 83% of the total outstanding shares of the Fund.
Annual Report
To the Trustees of Fidelity Advisor Series VIII and the Shareholders of Fidelity Advisor Global Equity Income Fund:
In our opinion, the accompanying statement of assets and liabilities, including the schedule of investments, and the related statements of operations and of changes in net assets and the financial highlights present fairly, in all material respects, the financial position of Fidelity Advisor Global Equity Income Fund (a fund of Fidelity Advisor Series VIII) at October 31, 2012, the results of its operations, the changes in its net assets and the financial highlights for the period from May 2, 2012 (commencement of operations) to October 31, 2012 indicate, in conformity with accounting principles generally accepted in the United States of America. These financial statements and financial highlights (hereafter referred to as "financial statements") are the responsibility of the Fidelity Advisor Global Equity Income Fund's management. Our responsibility is to express an opinion on these financial statements based on our audits. We conducted our audits of these financial statements in accordance with the standards of the Public Company Accounting Oversight Board (United States). Those standards require that we plan and perform the audit to obtain reasonable assurance about whether the financial statements are free of material misstatement. An audit includes examining, on a test basis, evidence supporting the amounts and disclosures in the financial statements, assessing the accounting principles used and significant estimates made by management, and evaluating the overall financial statement presentation. We believe that our audits, which included confirmation of securities at October 31, 2012 by correspondence with the custodian and brokers, provide a reasonable basis for our opinion.
PricewaterhouseCoopers LLP
Boston, Massachusetts
December 18, 2012
Annual Report
The Trustees, Members of the Advisory Board, and executive officers of the trust and fund, as applicable, are listed below. The Board of Trustees governs the fund and is responsible for protecting the interests of shareholders. The Trustees are experienced executives who meet periodically throughout the year to oversee the fund's activities, review contractual arrangements with companies that provide services to the fund, oversee management of the risks associated with such activities and contractual arrangements, and review the fund's performance. Except for James C. Curvey, each of the Trustees oversees 236 funds advised by FMR or an affiliate. Mr. Curvey oversees 443 funds advised by FMR or an affiliate.
The Trustees hold office without limit in time except that (a) any Trustee may resign; (b) any Trustee may be removed by written instrument, signed by at least two-thirds of the number of Trustees prior to such removal; (c) any Trustee who requests to be retired or who has become incapacitated by illness or injury may be retired by written instrument signed by a majority of the other Trustees; and (d) any Trustee may be removed at any special meeting of shareholders by a two-thirds vote of the outstanding voting securities of the trust. Each Trustee who is not an interested person (as defined in the 1940 Act) (Independent Trustee), shall retire not later than the last day of the calendar year in which his or her 75th birthday occurs. The Independent Trustees may waive this mandatory retirement age policy with respect to individual Trustees. The executive officers and Advisory Board Members hold office without limit in time, except that any officer and Advisory Board Member may resign or may be removed by a vote of a majority of the Trustees at any regular meeting or any special meeting of the Trustees. Except as indicated, each individual has held the office shown or other offices in the same company for the past five years.
Experience, Skills, Attributes, and Qualifications of the Fund's Trustees. The Governance and Nominating Committee has adopted a statement of policy that describes the experience, qualifications, attributes, and skills that are necessary and desirable for potential Independent Trustee candidates (Statement of Policy). The Board believes that each Trustee satisfied at the time he or she was initially elected or appointed a Trustee, and continues to satisfy, the standards contemplated by the Statement of Policy. The Governance and Nominating Committee also engages professional search firms to help identify potential Independent Trustee candidates who have the experience, qualifications, attributes, and skills consistent with the Statement of Policy. From time to time, additional criteria based on the composition and skills of the current Independent Trustees, as well as experience or skills that may be appropriate in light of future changes to board composition, business conditions, and regulatory or other developments, have also been considered by the professional search firms and the Governance and Nominating Committee. In addition, the Board takes into account the Trustees' commitment and participation in Board and committee meetings, as well as their leadership of standing and ad hoc committees throughout their tenure.
In determining that a particular Trustee was and continues to be qualified to serve as a Trustee, the Board has considered a variety of criteria, none of which, in isolation, was controlling. The Board believes that, collectively, the Trustees have balanced and diverse experience, qualifications, attributes, and skills, which allow the Board to operate effectively in governing the fund and protecting the interests of shareholders. Information about the specific experience, skills, attributes, and qualifications of each Trustee, which in each case led to the Board's conclusion that the Trustee should serve (or continue to serve) as a trustee of the fund, is provided below.
Annual Report
Board Structure and Oversight Function. James C. Curvey is an interested person (as defined in the 1940 Act) and currently serves as Chairman. The Trustees have determined that an interested Chairman is appropriate and benefits shareholders because an interested Chairman has a personal and professional stake in the quality and continuity of services provided to the fund. Independent Trustees exercise their informed business judgment to appoint an individual of their choosing to serve as Chairman, regardless of whether the Trustee happens to be independent or a member of management. The Independent Trustees have determined that they can act independently and effectively without having an Independent Trustee serve as Chairman and that a key structural component for assuring that they are in a position to do so is for the Independent Trustees to constitute a substantial majority for the Board. The Independent Trustees also regularly meet in executive session. Ned C. Lautenbach serves as Chairman of the Independent Trustees and as such (i) acts as a liaison between the Independent Trustees and management with respect to matters important to the Independent Trustees and (ii) with management prepares agendas for Board meetings.
Fidelity funds are overseen by different Boards of Trustees. The fund's Board oversees Fidelity's equity and high income funds and another Board oversees Fidelity's investment-grade bond, money market, and asset allocation funds. The asset allocation funds may invest in Fidelity funds overseen by the fund's Board. The use of separate Boards, each with its own committee structure, allows the Trustees of each group of Fidelity funds to focus on the unique issues of the funds they oversee, including common research, investment, and operational issues. On occasion, the separate Boards establish joint committees to address issues of overlapping consequences for the Fidelity funds overseen by each Board.
The Trustees operate using a system of committees to facilitate the timely and efficient consideration of all matters of importance to the Trustees, the fund, and fund shareholders and to facilitate compliance with legal and regulatory requirements and oversight of the fund's activities and associated risks. The Board, acting through its committees, has charged FMR and its affiliates with (i) identifying events or circumstances the occurrence of which could have demonstrably adverse effects on the fund's business and/or reputation; (ii) implementing processes and controls to lessen the possibility that such events or circumstances occur or to mitigate the effects of such events or circumstances if they do occur; and (iii) creating and maintaining a system designed to evaluate continuously business and market conditions in order to facilitate the identification and implementation processes described in (i) and (ii) above. Because the day-to-day operations and activities of the fund are carried out by or through FMR, its affiliates and other service providers, the fund's exposure to risks is mitigated but not eliminated by the processes overseen by the Trustees. While each of the Board's committees has responsibility for overseeing different aspects of the fund's activities, oversight is exercised primarily through the Operations, Audit, and Compliance Committees. In addition, the Independent Trustees have worked with FMR to enhance the Board's oversight of investment and financial risks, legal and regulatory risks, technology risks, and operational risks, including the development of additional risk reporting to the Board. For example, a working group comprised of Independent Trustees and FMR has worked and continues to work to review the Fidelity funds' valuation-related activities, reporting and risk management. Appropriate personnel, including but not limited to the fund's Chief Compliance Officer (CCO), FMR's internal auditor, the independent accountants, the fund's Treasurer and portfolio management personnel, make periodic reports to the Board's committees, as appropriate, including an annual review of FMR's risk management program for the Fidelity funds. The responsibilities of each standing committee, including their oversight responsibilities, are described further under "Standing Committees of the Fund's Trustees."
Annual Report
Trustees and Officers - continued
The fund's Statement of Additional Information (SAI) includes more information about the Trustees. To request a free copy, call Fidelity at 1-877-208-0098.
Interested Trustees*:
Correspondence intended for each Trustee who is an interested person may be sent to Fidelity Investments, 82 Devonshire Street, Boston, Massachusetts 02109.
Name, Age; Principal Occupations and Other Relevant Experience+ |
James C. Curvey (77) |
| Year of Election or Appointment: 2007 Mr. Curvey is Trustee and Chairman of the Board of Trustees of certain Trusts. Mr. Curvey also serves as Trustee (2007-present) of other investment companies advised by FMR. Mr. Curvey is a Director of Fidelity Investments Money Management, Inc. (2009-present), Director of Fidelity Research & Analysis Co. (2009-present) and Director of FMR and FMR Co., Inc. (2007-present). Mr. Curvey is also Vice Chairman (2007-present) and Director of FMR LLC. In addition, Mr. Curvey serves as an Overseer for the Boston Symphony Orchestra and a member of the Trustees of Villanova University. Previously, Mr. Curvey was the Vice Chairman (2006-2007) and Director (2000-2007) of FMR Corp. |
Ronald P. O'Hanley (55) |
| Year of Election or Appointment: 2011 Mr. O'Hanley is Director of FMR Co., Inc. (2010-present), Director of Fidelity Investments Money Management, Inc. (2010-present), Director of Fidelity Research & Analysis Company (2010-present), President of Fidelity Asset Management and Corporate Services and a member of Fidelity's Executive Committee (2010-present). Previously, Mr. O'Hanley served as President and Chief Executive Officer of BNY Mellon Asset Management (2007-2010). Mr. O'Hanley also served as Vice Chairman of Bank New York Mellon Corp. and a member of that firm's Executive Committee. Prior to the 2007 merger of The Bank of New York and Mellon Financial Corporation, he was Vice Chairman of Mellon Financial Corporation and President and Chief Executive Officer of Mellon Asset Management. He joined Mellon in February 1997. Mr. O'Hanley currently serves as Chairman of the Boston Public Library Foundation Board of Directors and sits on the Board of Directors of Beth Israel Deaconess Medical Center, the Board of Trustees of the Marine Biological Laboratory and the Advisory Board of the Maxwell School of Citizenship and Public Administration at Syracuse University. Mr. O'Hanley also chairs the Council on Asset Management for the Financial Services Roundtable and is a member of the Board of Directors of Institutional Investor's U.S. Institute. |
* Trustees have been determined to be "Interested Trustees" by virtue of, among other things, their affiliation with the trust or various entities under common control with FMR.
+ The information above includes each Trustee's principal occupation during the last five years and other information relating to the experience, attributes, and skills relevant to each Trustee's qualifications to serve as a Trustee, which led to the conclusion that each Trustee should serve as a Trustee for the fund.
Annual Report
Trustees and Officers - continued
Independent Trustees:
Correspondence intended for each Independent Trustee (that is, the Trustees other than the Interested Trustees) may be sent to Fidelity Investments, P.O. Box 55235, Boston, Massachusetts 02205-5235.
Name, Age; Principal Occupations and Other Relevant Experience+ |
Dennis J. Dirks (64) |
| Year of Election or Appointment: 2005 Prior to his retirement in May 2003, Mr. Dirks was Chief Operating Officer and a member of the Board of The Depository Trust & Clearing Corporation (DTCC). He also served as President, Chief Operating Officer, and Board member of The Depository Trust Company (DTC) and President and Board member of the National Securities Clearing Corporation (NSCC). In addition, Mr. Dirks served as Chief Executive Officer and Board member of the Government Securities Clearing Corporation, Chief Executive Officer and Board member of the Mortgage-Backed Securities Clearing Corporation, as a Trustee and a member of the Finance Committee of Manhattan College (2005-2008), and as a Trustee and a member of the Finance Committee of AHRC of Nassau County (2006-2008). Mr. Dirks is a member of the Independent Directors Council (IDC) Governing Council (2010-present) and Board of Directors for The Brookville Center for Children's Services, Inc. (2009-present). |
Alan J. Lacy (59) |
| Year of Election or Appointment: 2008 Mr. Lacy serves as Senior Adviser (2007-present) of Oak Hill Capital Partners, L.P. (private equity). Mr. Lacy also served as Chief Executive Officer (2000-2005) and Vice Chairman (2005-2006) of Sears Holdings Corporation and Sears, Roebuck and Co. (retail). In addition, Mr. Lacy serves as a member of the Board of Directors of Dave & Buster's Entertainment, Inc. (restaurant and entertainment complexes, 2010-present), Earth Fare, Inc. (retail grocery, 2012-present), The Hillman Companies, Inc. (hardware wholesalers, 2010-present), and Bristol-Myers Squibb Company (global pharmaceuticals, 2008-present). Mr. Lacy is a member of the Board of Trustees of The National Parks Conservation Association (2006-present). Previously, Mr. Lacy served as Chairman of the Board of Trustees of the National Parks Conservation Association (2008-2011) and as a member of the Board of Directors for the Western Union Company (global money transfer, 2006-2011). |
Ned C. Lautenbach (68) |
| Year of Election or Appointment: 2000 Mr. Lautenbach is Chairman of the Independent Trustees of the Equity and High Income Funds (2006-present). Mr. Lautenbach currently serves as the Lead Director of the Eaton Corporation Board of Directors (diversified industrial, 1997-present). Mr. Lautenbach is Chairman of the Board of Directors of the Philharmonic Center for the Arts in Naples, Florida (2012-present) and a member of the Council on Foreign Relations (1994-present). Previously, Mr. Lautenbach was a Partner/Advisory Partner at Clayton, Dubilier & Rice, LLC (private equity investment, 1998-2010), as well as a Director of Sony Corporation (2006-2007). |
Joseph Mauriello (68) |
| Year of Election or Appointment: 2008 Prior to his retirement in January 2006, Mr. Mauriello served in numerous senior management positions including Deputy Chairman and Chief Operating Officer (2004-2005), and Vice Chairman of Financial Services (2002-2004) of KPMG LLP US (professional services, 1965-2005). Mr. Mauriello currently serves as a member of the Board of Directors of XL Group plc. (global insurance and re-insurance, 2006-present). Previously, Mr. Mauriello served as a Director of the Hamilton Funds of the Bank of New York (2006-2007) and of Arcadia Resources Inc. (health care services and products, 2007-2012). |
Robert W. Selander (62) |
| Year of Election or Appointment: 2011 Previously, Mr. Selander served as a Member of the Advisory Board of Fidelity's Equity and High Income Funds (2011), Executive Vice Chairman (2010), Chief Executive Officer (2009-2010), and President and Chief Executive Officer (1997-2009) of Mastercard, Inc. |
Cornelia M. Small (68) |
| Year of Election or Appointment: 2005 Ms. Small is a member of the Board of Directors (2009-present) and Chair of the Investment Committee (2010-present) of the Teagle Foundation. Ms. Small also serves on the Investment Committee of the Berkshire Taconic Community Foundation (2008-present). Previously, Ms. Small served as Chairperson (2002-2008) and a member of the Investment Committee and Chairperson (2008-2012) and a member of the Board of Trustees of Smith College. In addition, Ms. Small served as Chief Investment Officer, Director of Global Equity Investments, and a member of the Board of Directors of Scudder, Stevens & Clark and Scudder Kemper Investments. |
William S. Stavropoulos (73) |
| Year of Election or Appointment: 2001 Mr. Stavropoulos is Vice Chairman of the Independent Trustees of the Equity and High Income Funds (2006-present). Mr. Stavropoulos serves as President and Founder of the Michigan Baseball Foundation, the Great Lakes Loons (2007-present). Mr. Stavropoulos is Chairman Emeritus of the Board of Directors of The Dow Chemical Company, where he previously served in numerous senior management positions, including President, CEO (1995-2000; 2002-2004), Chairman of the Executive Committee (2000-2006), and as a member of the Board of Directors (1990-2006). Currently, Mr. Stavropoulos is a Director of Univar Inc. (global distributor of commodity and specialty chemicals, Chairman from 2010-May 2012 and Lead Director from May 2012-present), Teradata Corporation (data warehousing and technology solutions, 2008-present), Maersk Inc. (industrial conglomerate), and Tyco International, Ltd. (multinational manufacturing and services, 2007-present), and a member of the Advisory Board for Metalmark Capital LLC (private equity investment, 2005-present). Mr. Stavropoulos is an operating advisor to Clayton, Dubilier & Rice, LLC (private equity investment). In addition, Mr. Stavropoulos is a member of the University of Notre Dame Advisory Council for the College of Science, a Trustee of the Rollin L. Gerstacker Foundation, and a Director of the Naples Philharmonic Center for the Arts. Previously, Mr. Stavropoulos served as a Director of Chemical Financial Corporation (bank holding company, 1993-2012). |
David M. Thomas (63) |
| Year of Election or Appointment: 2008 Previously, Mr. Thomas served as Executive Chairman (2005-2006) and Chairman and Chief Executive Officer (2000-2005) of IMS Health, Inc. (pharmaceutical and healthcare information solutions), and a Director of Fortune Brands, Inc. (consumer products, 2000-2011). In addition, Mr. Thomas serves as Non-Executive Chairman of the Board of Directors of Fortune Brands Home and Security (home and security products, 2011-present), and as a member of the Board of Directors of Interpublic Group of Companies, Inc. (marketing communication, 2004-present). |
Michael E. Wiley (62) |
| Year of Election or Appointment: 2008 Mr. Wiley also serves as a Director of Asia Pacific Exploration Consolidated (international oil and gas exploration and production, 2008-present). Mr. Wiley serves as a Director of Tesoro Corporation (independent oil refiner and marketer, 2005-present), and a Director of Bill Barrett Corporation (exploration and production, 2005-present). In addition, Mr. Wiley also serves as a Director of Post Oak Bank (privately-held bank, 2004-present). Previously, Mr. Wiley served as a member of the Board of Trustees of the University of Tulsa (2000-2006; 2007-2010), as a Senior Energy Advisor of Katzenbach Partners, LLC (consulting, 2006-2007), as an Advisory Director of Riverstone Holdings (private investment), Chairman, President, and CEO of Baker Hughes, Inc. (oilfield services, 2000-2004), and as Director of Spinnaker Exploration Company (exploration and production, 2001-2005). |
+ The information above includes each Trustee's principal occupation during the last five years and other information relating to the experience, attributes, and skills relevant to each Trustee's qualifications to serve as a Trustee, which led to the conclusion that each Trustee should serve as a Trustee for the fund.
Advisory Board Members and Executive Officers:
Correspondence intended for David A. Rosow and Garnett A. Smith may be sent to Fidelity Investments, P.O. Box 55235, Boston, Massachusetts 02205-5235. Correspondence intended for each executive officer, Edward C. Johnson 3d, and Peter S. Lynch may be sent to Fidelity Investments, 82 Devonshire Street, Boston, Massachusetts 02109.
Name, Age; Principal Occupation |
Edward C. Johnson 3d (82) |
| Year of Election or Appointment: 2011 Member of the Advisory Board of Fidelity's Equity and High Income Funds. Mr. Johnson serves as Chief Executive Officer, Chairman, and a Director of FMR LLC, and also serves as Chairman and Director of FIL Limited. Previously, Mr. Johnson served as a Trustee and Chairman of the Board of certain Fidelity Trusts, Chairman and a Director of FMR, Chairman and a Director of FMR Co., Inc., and President of FMR LLC (2006-2007). |
Peter S. Lynch (68) |
| Year of Election or Appointment: 2003 Member of the Advisory Board of Fidelity's Equity and High Income Funds. Mr. Lynch is Vice Chairman and a Director of FMR and FMR Co., Inc. In addition, Mr. Lynch serves as a Trustee of Boston College and as the Chairman of the Inner-City Scholarship Fund. Previously, Mr. Lynch served on the Special Olympics International Board of Directors (1997-2006). |
David A. Rosow (70) |
| Year of Election or Appointment: 2012 Member of the Advisory Board of Fidelity's Equity and High Income Funds. Chairman and Chief Executive Officer of International Golf Group, Inc. (golf course development, 1989-present). Previously, Mr. Rosow served as Chairman and Chief Executive Officer of Rosow & Company, Inc. (private investment company, 1989-2011), a Lead Director of Hudson United Bancorp (2001-2006) and as a Director of TD Banknorth (1996-2006). In addition, Mr. Rosow is a member (2008-present) and President (2009-present) of the Town Council of Palm Beach, Florida. |
Garnett A. Smith (65) |
| Year of Election or Appointment: 2012 Member of the Advisory Board of Fidelity's Equity and High Income Funds. Prior to Mr. Smith's retirement, he served as Chairman and Chief Executive Officer of Inbrand Corp. (manufacturer of personal absorbent products, 1990-1997). He also served as President (1986-1990) of Inbrand Corp. Prior to his employment with Inbrand Corp., he was employed by a retail fabric chain and North Carolina National Bank. In addition, Mr. Smith is a board member of the Jackson Hole Land Trust (2009-present). |
Kenneth B. Robins (43) |
| Year of Election or Appointment: 2008 President and Treasurer of Fidelity's Equity and High Income Funds. Mr. Robins also serves as President and Treasurer (2010-present) and Assistant Treasurer (2009-present) of other Fidelity funds and is an employee of Fidelity Investments (2004-present). Previously, Mr. Robins served as Deputy Treasurer of the Fidelity funds (2005-2008) and Treasurer and Chief Financial Officer of The North Carolina Capital Management Trust: Cash and Term Portfolios (2006-2008). |
Bruce T. Herring (47) |
| Year of Election or Appointment: 2006 Vice President of certain Equity Funds. Mr. Herring also serves as President of Fidelity Research & Analysis Company (2010-present), Chief Investment Officer and Director of Fidelity Management & Research (U.K.) Inc. (2010-present) and Group Chief Investment Officer of FMR. Previously, Mr. Herring served as Vice President (2005-2006) and Senior Vice President (2006-2007) of Fidelity Management & Research Company, Vice President of FMR Co., Inc. (2001-2007) and as a portfolio manager for Fidelity U.S. Equity Funds. |
Brian B. Hogan (48) |
| Year of Election or Appointment: 2009 Vice President of Equity and High Income Funds. Mr. Hogan also serves as President of FMR's Equity Division (2009-present). Previously, Mr. Hogan served as Senior Vice President, Equity Research of FMR (2006-2009) and as a portfolio manager. |
Scott C. Goebel (44) |
| Year of Election or Appointment: 2008 Secretary and Chief Legal Officer (CLO) of the Fidelity funds. Mr. Goebel also serves as Secretary of Fidelity Investments Money Management, Inc. (FIMM) (2010-present) and Fidelity Research and Analysis Company (FRAC) (2010-present); Secretary and CLO of The North Carolina Capital Management Trust: Cash and Term Portfolios (2008-present); General Counsel, Secretary, and Senior Vice President of FMR (2008-present) and FMR Co., Inc. (2008-present); employed by FMR LLC or an affiliate (2001-present); Chief Legal Officer of Fidelity Management & Research (Hong Kong) Limited (2008-present) and Assistant Secretary of Fidelity Management & Research (Japan) Inc. (2008-present), and Fidelity Management & Research (U.K.) Inc. (2008-present). Previously, Mr. Goebel served as Assistant Secretary of FIMM (2008-2010), FRAC (2008-2010), and the Funds (2007-2008) and as Vice President and Secretary of Fidelity Distributors Corporation (FDC) (2005-2007). |
William C. Coffey (43) |
| Year of Election or Appointment: 2009 Assistant Secretary of Fidelity's Equity and High Income Funds. Mr. Coffey also serves as Senior Vice President and Deputy General Counsel of FMR LLC (2010-present), and is an employee of Fidelity Investments. Previously, Mr. Coffey served as Vice President and Associate General Counsel of FMR LLC (2005-2009). |
Elizabeth Paige Baumann (44) |
| Year of Election or Appointment: 2012 Anti-Money Laundering (AML) Officer of the Fidelity funds. Ms. Baumann also serves as AML Officer of The North Carolina Capital Management Trust: Cash and Term Portfolios (2012-present), Chief AML Officer of FMR LLC (2012-present), and is an employee of Fidelity Investments. Previously, Ms. Baumann served as Vice President and Deputy Anti-Money Laundering Officer (2007-2012). |
Christine Reynolds (54) |
| Year of Election or Appointment: 2008 Chief Financial Officer of the Fidelity funds. Ms. Reynolds became President of Fidelity Pricing and Cash Management Services (FPCMS) in August 2008. Ms. Reynolds served as Chief Operating Officer of FPCMS (2007-2008). Previously, Ms. Reynolds served as President, Treasurer, and Anti-Money Laundering officer of the Fidelity funds (2004-2007). |
Joseph A. Hanlon (44) |
| Year of Election or Appointment: 2012 Chief Compliance Officer of Fidelity's Equity and High Income Funds. Mr. Hanlon serves as Compliance Officer of FMR, FMR Co., Inc., Fidelity Investments Money Management, Inc. (FIMM), Fidelity Research and Analysis Company (FRAC), Fidelity Management & Research (Japan) Inc., Fidelity Management & Research (U.K.) Inc., Fidelity Management & Research (Hong Kong), and Strategic Advisers, Inc. (2009-present), as Senior Vice President of the Fidelity Asset Management Division (2009-present), and is an employee of Fidelity Investments. |
Joseph F. Zambello (55) |
| Year of Election or Appointment: 2011 Deputy Treasurer of the Fidelity funds. Mr. Zambello is an employee of Fidelity Investments. Previously, Mr. Zambello served as Vice President of FMR's Program Management Group (2009-2011) and Vice President of the Transfer Agent Oversight Group (2005-2009). |
Adrien E. Deberghes (45) |
| Year of Election or Appointment: 2008 Deputy Treasurer of Fidelity's Equity and High Income Funds. Mr. Deberghes also serves as Vice President (2011-present) and Assistant Treasurer (2010-present) of other Fidelity funds, and is an employee of Fidelity Investments (2008-present). Previously, Mr. Deberghes served as Senior Vice President of Mutual Fund Administration at State Street Corporation (2007-2008), Senior Director of Mutual Fund Administration at Investors Bank & Trust (2005-2007), and Director of Finance for Dunkin' Brands (2000-2005). |
Stephen Sadoski (41) |
| Year of Election or Appointment: 2012 Deputy Treasurer of Fidelity's Equity and High Income Funds. Mr. Sadoski also serves as Assistant Treasurer of other Fidelity funds (2012-present) and is an employee of Fidelity Investments (2012-present). Previously, Mr. Sadoski served as an assistant chief accountant in the Division of Investment Management of the Securities and Exchange Commission (SEC) (2009-2012) and as a senior manager at Deloitte & Touche (1997-2009). |
Stephanie J. Dorsey (43) |
| Year of Election or Appointment: 2010 Assistant Treasurer of Fidelity's Equity and High Income Funds. Ms. Dorsey also serves as Deputy Treasurer of other Fidelity funds (2008-present) and is an employee of Fidelity Investments (2008-present). Previously, Ms. Dorsey served as Treasurer (2004-2008) of the JPMorgan Mutual Funds and Vice President (2004-2008) of JPMorgan Chase Bank. |
John R. Hebble (54) |
| Year of Election or Appointment: 2009 Assistant Treasurer of Fidelity's Equity and High Income Funds. Mr. Hebble also serves as President (2011-present), Treasurer, and Chief Financial Officer of The North Carolina Capital Management Trust: Cash and Term Portfolios (2008-present), President and Treasurer of other Fidelity funds (2008-present) and is an employee of Fidelity Investments. |
Gary W. Ryan (54) |
| Year of Election or Appointment: 2005 Assistant Treasurer of the Fidelity funds. Mr. Ryan is an employee of Fidelity Investments. Previously, Mr. Ryan served as Vice President of Fund Reporting in Fidelity Pricing and Cash Management Services (FPCMS) (1999-2005). |
Jonathan Davis (44) |
| Year of Election or Appointment: 2010 Assistant Treasurer of the Fidelity funds. Mr. Davis is also Assistant Treasurer of Fidelity Rutland Square Trust II and Fidelity Commonwealth Trust II. Mr. Davis is an employee of Fidelity Investments. Previously, Mr. Davis served as Vice President and Associate General Counsel of FMR LLC (2003-2010). |
Annual Report
Institutional Class designates 51% and 48% of the dividends distributed in July 2012 and October 2012, respectively during the fiscal year as qualifying for the dividends-received deduction for corporate shareholders.
Institutional Class designates 100% of the dividends distributed in during the fiscal year as amounts which may be taken into account as a dividend for the purposes of the maximum rate under section 1(h)(11) of the Internal Revenue Code.
The amounts per share which represent income derived from sources within, and taxes paid to, foreign countries or possessions of the United States are as follows:
| Pay Date | Income | Taxes |
Institutional Class | 07/09/12 | $0.016 | $0.0040 |
| 10/08/12 | $0.016 | $0.0038 |
The fund will notify shareholders in January 2013 of amounts for use in preparing 2012 income tax returns.
Annual Report
Board Approval of Investment Advisory Contracts and Management Fees
Fidelity Advisor Global Equity Income Fund
On March 14, 2012, the Board of Trustees, including the Independent Trustees (together, the Board), voted to approve the management contract and sub-advisory agreements (together, the Advisory Contracts) for the fund. The Board, assisted by the advice of fund counsel and Independent Trustees' counsel, considered a broad range of information.
Nature, Extent, and Quality of Services Provided. The Board considered the staffing within the investment adviser, FMR, and the sub-advisers (together, the Investment Advisers), including the backgrounds of the fund's investment personnel and the fund's investment objective and discipline. The Board considered the structure of the portfolio manager compensation program and whether this structure provides appropriate incentives to act in the best interests of the fund.
Resources Dedicated to Investment Management and Support Services. The Board and the Fund Oversight and Research Committees reviewed the general qualifications and capabilities of the Investment Advisers' investment staff, including its size, education, experience, and resources, as well as the Investment Advisers' approach to recruiting, training, managing, and compensating investment personnel. The Board also noted that FMR has devoted increased resources to non-U.S. offices. The Board noted that Fidelity's analysts have extensive resources, tools and capabilities which allow them to conduct sophisticated quantitative and fundamental analysis, as well as credit analysis of issuers, counterparties and enhancers. The Board also believes that Fidelity's investment professionals have sufficient access to global information and data so as to provide competitive investment results over time, and that those professionals also have access to sophisticated tools which permit them to assess portfolio construction and risk and performance attribution characteristics continuously, as well as to transmit new information and research conclusions rapidly around the world. Additionally, in their deliberations, the Board considered the Investment Advisers' trading capabilities and resources which are an integral part of the investment management process.
Shareholder and Administrative Services. The Board considered the nature, extent, quality, and cost of advisory, administrative, and shareholder services to be performed by the Investment Advisers and their affiliates under the Advisory Contracts and under separate agreements covering transfer agency, pricing and bookkeeping, and securities lending services for the fund. The Board also considered the nature and extent of the investment adviser's supervision of third party service providers, principally custodians and subcustodians.
The Board noted that the growth of fund assets over time across the complex allows Fidelity to reinvest in the development of services designed to enhance the value or convenience of the Fidelity funds as investment vehicles. These services include 24-hour access to account information and market information through telephone representatives and over the Internet, investor education materials and asset allocation tools, and the expanded availability of Fidelity Investor Centers, with 35 new branches opening since 2010.
Annual Report
Board Approval of Investment Advisory Contracts and
Management Fees - continued
Investment Performance. The fund is a new fund and therefore had no historical performance for the Board to review at the time it approved the fund's Advisory Contracts. The Board considered the Investment Advisers' strength in fundamental, research-driven global and equity income securities selection, which the Board is familiar with through its supervision of other Fidelity funds that invest in such securities.
Based on its review, the Board concluded that the nature, extent, and quality of services to be provided to the fund under the Advisory Contracts should benefit the fund's shareholders.
Competitiveness of Management Fee and Total Expense Ratio. The Board considered the fund's proposed management fee and the projected total expense ratio of each class of the fund in reviewing the Advisory Contracts. The Board noted that the fund's proposed management fee rate is lower than the median fee rate of funds with similar Lipper investment objective categories and comparable management fee characteristics. The Board also noted that the projected total expense ratios for certain classes would rank above the median for funds with the same load structure but considered that the projected total expense ratios are comparable to those of similar classes and funds that Fidelity offers to shareholders.
The Board also noted that FMR had contractually agreed to reimburse each class of the fund to the extent that each class's total operating expenses (excluding interest, taxes, securities lending costs, brokerage commissions, extraordinary expenses, and acquired fund fees and expenses, if any), as a percentage of its average net assets exceed a certain limit.
Based on its review, the Board concluded that the management fee and projected total expense ratio of each class of the fund were reasonable in light of the services that the fund and its shareholders will receive and the other factors considered.
Costs of the Services and Profitability. The fund is a new fund and therefore no revenue, cost, or profitability data was available for the Board to review in respect of the fund at the time it approved the Advisory Contracts. In connection with its future renewal of the fund's Advisory Contracts, the Board will consider the revenues earned and the expenses incurred by Fidelity in conducting the business of developing, marketing, distributing, managing, administering and servicing the fund and its shareholders.
Economies of Scale. The Board will consider economies of scale when there is operating experience to permit assessment thereof. It noted that, notwithstanding the entrepreneurial risk associated with a new fund, the management fee was at a level normally associated, by comparison with competitors, with very high fund net assets, and Fidelity asserted to the Board that the level of the fee anticipated economies of scale at lower asset levels even before, if ever, economies of scale are achieved. The Board also noted that the fund and its shareholders would have access to the very considerable number and variety of services available through Fidelity and its affiliates.
Based on its evaluation of all of the conclusions noted above, and after considering all factors it believed relevant, the Board ultimately concluded that the advisory fee structures are fair and reasonable, and that the fund's Advisory Contracts should be approved.
Annual Report
Investment Adviser
Fidelity Management & Research Company
Boston, MA
Investment Sub-Advisers
FMR Co., Inc.
Fidelity Management & Research
(U.K.) Inc.
Fidelity Management & Research
(Hong Kong) Limited
Fidelity Management & Research
(Japan) Inc.
FIL Investments (Japan) Limited
FIL Investment Advisors
FIL Investment Advisors (UK) Limited
General Distributor
Fidelity Distributors Corporation
Smithfield, RI
Transfer and Service Agents
Fidelity Investments Institutional
Operations Company, Inc.
Boston, MA
Fidelity Service Company, Inc.
Boston, MA
Custodian
Citibank, N.A.
New York, NY
(Fidelity Investment logo)(registered trademark)
AGEDI-UANN-1212
1.938141.100
(Fidelity Investment logo)(registered trademark)
Fidelity Advisor®
Value Leaders
Fund - Class A, Class T, Class B
and Class C
Annual Report
October 31, 2012
(Fidelity Cover Art)
Contents
Performance | (Click Here) | How the fund has done over time. |
Management's Discussion of Fund Performance | (Click Here) | The Portfolio Manager's review of fund performance and strategy. |
Shareholder Expense Example | (Click Here) | An example of shareholder expenses. |
Investment Changes | (Click Here) | A summary of major shifts in the fund's investments over the past six months. |
Investments | (Click Here) | A complete list of the fund's investments with their market values. |
Financial Statements | (Click Here) | Statements of assets and liabilities, operations, and changes in net assets, as well as financial highlights. |
Notes | (Click Here) | Notes to the financial statements. |
Report of Independent Registered Public Accounting Firm | (Click Here) | |
Trustees and Officers | (Click Here) | |
Distributions | (Click Here) | |
Board Approval of Investment Advisory Contracts and Management Fees | (Click Here) | |
To view a fund's proxy voting guidelines and proxy voting record for the 12-month period ended June 30, visit http://www.fidelity.com/proxyvotingresults or visit the Securities and Exchange Commission's (SEC) web site at http://www.sec.gov. You may also call 1-877-208-0098 to request a free copy of the proxy voting guidelines.
Standard & Poor's, S&P and S&P 500 are registered service marks of The McGraw-Hill Companies, Inc. and have been licensed for use by Fidelity Distributors Corporation.
Other third party marks appearing herein are the property of their respective owners.
All other marks appearing herein are registered or unregistered trademarks or service marks of FMR LLC or an affiliated company. © 2012 FMR LLC. All rights reserved.
Annual Report
This report and the financial statements contained herein are submitted for the general information of the shareholders of the fund. This report is not authorized for distribution to prospective investors in the fund unless preceded or accompanied by an effective prospectus.
A fund files its complete schedule of portfolio holdings with the SEC for the first and third quarters of each fiscal year on Form N-Q. Forms N-Q are available on the SEC's web site at http://www.sec.gov. A fund's Forms N-Q may be reviewed and copied at the SEC's Public Reference Room in Washington, DC. Information regarding the operation of the SEC's Public Reference Room may be obtained by calling 1-800-SEC-0330. For a complete list of a fund's portfolio holdings, view the most recent holdings listing, semiannual report, or annual report on Fidelity's web site at http://www.fidelity.com, http://www.advisor.fidelity.com, or http://www.401k.com, as applicable.
NOT FDIC INSURED • MAY LOSE VALUE • NO BANK GUARANTEE
Neither the fund nor Fidelity Distributors Corporation is a bank.
Annual Report
Average annual total return reflects the change in the value of an investment, assuming reinvestment of the class' distributions from dividend income and capital gains (the profits earned upon the sale of securities that have grown in value, if any) and assuming a constant rate of performance each year. The $10,000 table and the fund's returns do not reflect the deduction of taxes that a shareholder would pay on fund distributions or the redemption of fund shares. During periods of reimbursement by Fidelity, a fund's total return will be greater than it would be had the reimbursement not occurred. How a fund did yesterday is no guarantee of how it will do tomorrow. Returns reflect the conversion of Class B shares to Class A shares after a maximum of seven years.
Average Annual Total Returns
Periods ended October 31, 2012 | Past 1
year | Past 5
years | Life of
fund A |
Class A (incl. 5.75% sales charge) | 3.67% | -7.03% | 2.30% |
Class T (incl. 3.50% sales charge) | 5.84% | -6.83% | 2.30% |
Class B (incl. contingent deferred sales charge) B | 4.14% | -6.99% | 2.37% |
Class C (incl. contingent deferred sales charge) C | 8.21% | -6.62% | 2.17% |
A From June 17, 2003.
B Class B shares' contingent deferred sales charges included in the past one year, past five years, and life of fund total return figures are 5%, 2%, and 0%, respectively.
C Class C shares' contingent deferred sales charges included in the past one year, past five years, and life of fund total return figures are 1%, 0%, and 0%, respectively.
Annual Report
$10,000 Over Life of Fund
Let's say hypothetically that $10,000 was invested in Fidelity Advisor® Value Leaders Fund - Class A on June 17, 2003, when the fund started, and the current 5.75% sales charge was paid. The chart shows how the value of your investment would have changed, and also shows how the Russell 1000® Value Index performed over the same period.
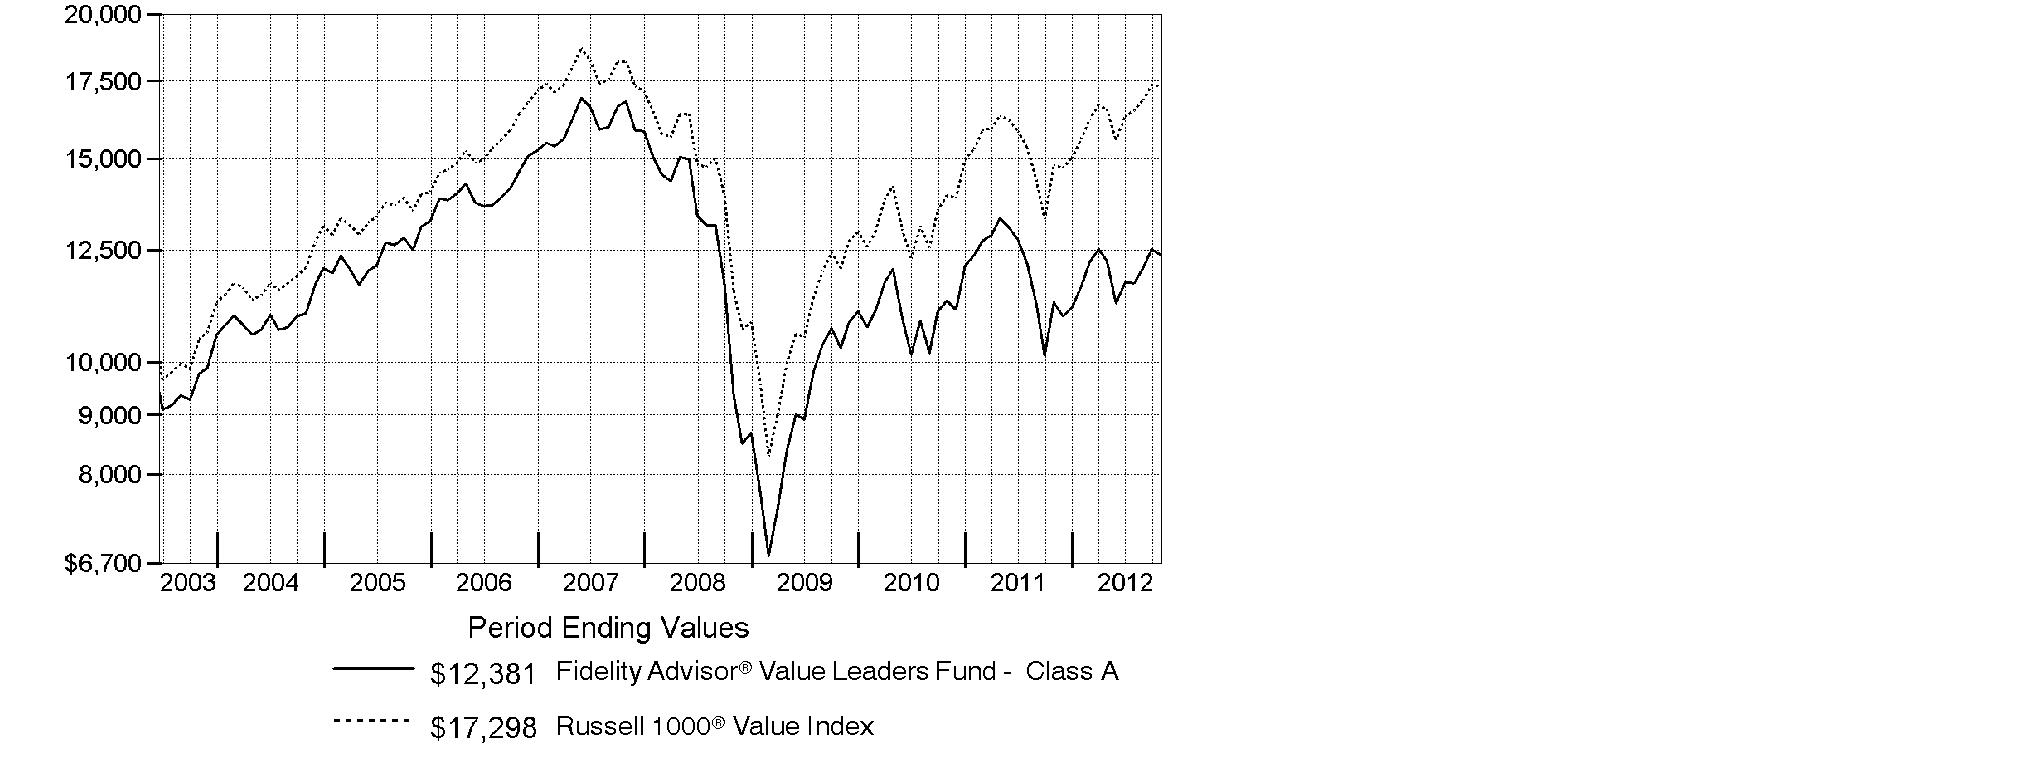
Annual Report
Market Recap: U.S. stocks overcame bouts of volatility to post strong gains for the year ending October 31, 2012, and extend an uptrend that began in March 2009. The broad-based S&P 500® Index advanced 15.21% for the 12-month period, while the blue-chip-laden Dow Jones Industrial AverageSM and technology-heavy Nasdaq Composite® Index rose 12.56% and 12.21%, respectively. Debt problems in Europe, slower growth in China and uncertainty about a U.S. economic recovery put downward pressure on stocks early on and during a turbulent spring. However, beginning in June, stocks rose on central bank stimulus, steps to repair the eurozone and signs of life in the U.S. housing market. Equity benchmarks hit multiyear highs in September, with the Dow and the S&P® achieving their best marks since 2007, and the Nasdaq reaching a 12-year high. Stocks retreated in October, which was marked by disappointing corporate earnings reports and a two-day weather-related closure of the New York Stock Exchange. Among the 10 sectors that comprise the S&P 500®, most posted a double-digit gain, led by telecommunication services (+26%) and health care (+22%), with energy (+7%) and materials (+7%) lagging the most. Despite lingering eurozone turmoil and weaker local currencies versus the U.S. dollar, foreign developed-markets stocks rose modestly, with the MSCI® EAFE® Index adding 4.76%.
Comments from Michael Chren, Portfolio Manager of Fidelity Advisor® Value Leaders Fund: For the year, the fund's Class A, Class T, Class B and Class C shares returned 10.00%, 9.68%, 9.14% and 9.21%, respectively (excluding sales charges), significantly underperforming the 16.89% gain of the Russell® 1000 Value Index. By far, the biggest source of underperformance was the information technology sector, led by a stake in Alcatel-Lucent, a French manufacturer of network communications equipment that failed to deliver on key financial targets. Other disappointments in tech included personal computer/printer manufacturer Hewlett-Packard, semiconductor maker Advanced Micro Devices and software/services provider Comverse Technology. A large overweighting in department store retailer JCPenney hurt because the company's turnaround plan failed to gain traction. Stock picking in energy also detracted, as did the fund's cash position. On the positive side, favorable positioning in health care helped, including holdings in large drug manufacturers Pfizer and Merck. Other key contributors were consumer staples giant Kraft Foods and Switzerland's navigation products manufacturer Garmin. Some of these stocks were not in the benchmark and I sold Alcatel-Lucent prior to period end.
The views expressed above reflect those of the portfolio manager(s) only through the end of the period as stated on the cover of this report and do not necessarily represent the views of Fidelity or any other person in the Fidelity organization. Any such views are subject to change at any time based upon market or other conditions and Fidelity disclaims any responsibility to update such views. These views may not be relied on as investment advice and, because investment decisions for a Fidelity fund are based on numerous factors, may not be relied on as an indication of trading intent on behalf of any Fidelity fund.
Annual Report
Shareholder Expense Example
As a shareholder of the Fund, you incur two types of costs: (1) transaction costs, including sales charges (loads) on purchase payments or redemption proceeds, and (2) ongoing costs, including management fees, distribution and/or service (12b-1) fees and other Fund expenses. This Example is intended to help you understand your ongoing costs (in dollars) of investing in the Fund and to compare these costs with the ongoing costs of investing in other mutual funds.
The Example is based on an investment of $1,000 invested at the beginning of the period and held for the entire period (May 1, 2012 to October 31, 2012).
Actual Expenses
The first line of the accompanying table for each class of the Fund provides information about actual account values and actual expenses. You may use the information in this line, together with the amount you invested, to estimate the expenses that you paid over the period. Simply divide your account value by $1,000.00 (for example, an $8,600 account value divided by $1,000.00 = 8.6), then multiply the result by the number in the first line for a class of the Fund under the heading entitled "Expenses Paid During Period" to estimate the expenses you paid on your account during this period. In addition, the Fund, as a shareholder in the underlying Fidelity Central Funds, will indirectly bear its pro-rata share of the fees and expenses incurred by the underlying Fidelity Central Funds. These fees and expenses are not included in the Fund's annualized expense ratio used to calculate the expense estimate in the table below.
Hypothetical Example for Comparison Purposes
The second line of the accompanying table for each class of the Fund provides information about hypothetical account values and hypothetical expenses based on a Class' actual expense ratio and an assumed rate of return of 5% per year before expenses, which is not the Class' actual return. The hypothetical account values and expenses may not be used to estimate the actual ending account balance or expenses you paid for the period. You may use this information to compare the ongoing costs of investing in the Fund and other funds. To do so, compare this 5% hypothetical example with the 5% hypothetical examples that appear in the shareholder reports of the other funds. In addition, the Fund, as a shareholder in the underlying Fidelity Central Funds, will indirectly bear its pro-rata share of the fees and expenses incurred by the underlying Fidelity Central Funds. These fees and expenses are not included in the Fund's annualized expense ratio used to calculate the expense estimate in the table below.
Please note that the expenses shown in the table are meant to highlight your ongoing costs only and do not reflect any transaction costs. Therefore, the second line of the table is useful in comparing ongoing costs only, and will not help you determine the relative total costs of owning different funds. In addition, if these transactional costs were included, your costs would have been higher.
Annual Report
| Annualized
Expense Ratio | Beginning
Account Value
May 1, 2012 | Ending
Account Value
October 31, 2012 | Expenses Paid
During Period*
May 1, 2012 to
October 31, 2012 |
Class A | 1.25% | | | |
Actual | | $ 1,000.00 | $ 1,012.20 | $ 6.32 |
HypotheticalA | | $ 1,000.00 | $ 1,018.85 | $ 6.34 |
Class T | 1.50% | | | |
Actual | | $ 1,000.00 | $ 1,010.30 | $ 7.58 |
HypotheticalA | | $ 1,000.00 | $ 1,017.60 | $ 7.61 |
Class B | 2.00% | | | |
Actual | | $ 1,000.00 | $ 1,008.50 | $ 10.10 |
HypotheticalA | | $ 1,000.00 | $ 1,015.08 | $ 10.13 |
Class C | 2.00% | | | |
Actual | | $ 1,000.00 | $ 1,008.60 | $ 10.10 |
HypotheticalA | | $ 1,000.00 | $ 1,015.08 | $ 10.13 |
Institutional Class | .76% | | | |
Actual | | $ 1,000.00 | $ 1,014.00 | $ 3.85 |
HypotheticalA | | $ 1,000.00 | $ 1,021.32 | $ 3.86 |
A 5% return per year before expenses
* Expenses are equal to each Class' annualized expense ratio, multiplied by the average account value over the period, multiplied by 184/366 (to reflect the one-half year period).
Annual Report
Investment Changes (Unaudited)
Top Ten Stocks as of October 31, 2012 |
| % of fund's
net assets | % of fund's net assets
6 months ago |
Exxon Mobil Corp. | 4.5 | 2.2 |
Pfizer, Inc. | 4.0 | 4.6 |
General Electric Co. | 4.0 | 3.0 |
Merck & Co., Inc. | 3.2 | 3.4 |
Citigroup, Inc. | 3.2 | 3.6 |
Chevron Corp. | 2.9 | 3.2 |
Anadarko Petroleum Corp. | 2.3 | 1.2 |
Textron, Inc. | 2.2 | 1.3 |
Comverse Technology, Inc. | 2.1 | 2.0 |
Wells Fargo & Co. | 2.0 | 2.5 |
| 30.4 | |
Top Five Market Sectors as of October 31, 2012 |
| % of fund's
net assets | % of fund's net assets
6 months ago |
Financials | 24.5 | 26.7 |
Energy | 17.1 | 11.5 |
Health Care | 12.9 | 15.9 |
Information Technology | 8.4 | 11.4 |
Consumer Staples | 7.7 | 9.5 |
Asset Allocation (% of fund's net assets) |
As of October 31, 2012* | As of April 30, 2012** |
| Stocks and
Equity Futures 95.5% | | | Stocks
96.9% | |
| Short-Term
Investments and
Net Other Assets
(Liabilities) 4.5% | | | Short-Term
Investments and
Net Other Assets
(Liabilities) 3.1% | |
* Foreign investments | 9.3% | | ** Foreign investments | 11.4% | |

Annual Report
Investments October 31, 2012
Showing Percentage of Net Assets
Common Stocks - 95.0% |
| Shares | | Value |
CONSUMER DISCRETIONARY - 7.4% |
Diversified Consumer Services - 1.3% |
DeVry, Inc. | 12,993 | | $ 341,196 |
Household Durables - 1.6% |
Garmin Ltd. | 10,712 | | 406,949 |
Media - 3.0% |
DISH Network Corp. Class A | 12,078 | | 430,339 |
Washington Post Co. Class B (d) | 1,066 | | 355,522 |
| | 785,861 |
Multiline Retail - 1.5% |
JCPenney Co., Inc. (d) | 16,813 | | 403,680 |
TOTAL CONSUMER DISCRETIONARY | | 1,937,686 |
CONSUMER STAPLES - 7.7% |
Beverages - 1.7% |
Grupo Modelo SAB de CV Series C | 51,100 | | 450,354 |
Food & Staples Retailing - 1.9% |
CVS Caremark Corp. | 5,107 | | 236,965 |
Wal-Mart Stores, Inc. | 3,446 | | 258,519 |
| | 495,484 |
Food Products - 3.9% |
Kraft Foods Group, Inc. (a) | 4,706 | | 214,029 |
Mondelez International, Inc. (a) | 16,918 | | 449,004 |
Ralcorp Holdings, Inc. (a) | 5,168 | | 373,078 |
| | 1,036,111 |
Household Products - 0.2% |
Procter & Gamble Co. | 647 | | 44,798 |
TOTAL CONSUMER STAPLES | | 2,026,747 |
ENERGY - 17.1% |
Energy Equipment & Services - 3.0% |
Cameron International Corp. (a) | 8,251 | | 417,831 |
Halliburton Co. | 3,927 | | 126,803 |
Weatherford International Ltd. (a) | 23,142 | | 261,505 |
| | 806,139 |
Oil, Gas & Consumable Fuels - 14.1% |
Anadarko Petroleum Corp. | 8,911 | | 613,166 |
Apache Corp. | 800 | | 66,200 |
Chevron Corp. | 6,915 | | 762,102 |
Common Stocks - continued |
| Shares | | Value |
ENERGY - continued |
Oil, Gas & Consumable Fuels - continued |
Exxon Mobil Corp. | 12,928 | | $ 1,178,644 |
Hess Corp. | 7,676 | | 401,148 |
Marathon Petroleum Corp. | 3,981 | | 218,676 |
Occidental Petroleum Corp. | 3,780 | | 298,469 |
The Williams Companies, Inc. | 4,413 | | 154,411 |
| | 3,692,816 |
TOTAL ENERGY | | 4,498,955 |
FINANCIALS - 24.5% |
Capital Markets - 4.0% |
Bank of New York Mellon Corp. | 6,500 | | 160,615 |
E*TRADE Financial Corp. (a) | 49,608 | | 414,723 |
Goldman Sachs Group, Inc. | 1,204 | | 147,358 |
State Street Corp. | 7,350 | | 327,590 |
| | 1,050,286 |
Commercial Banks - 7.3% |
Aozora Bank Ltd. | 148,000 | | 417,136 |
Fifth Third Bancorp | 14,705 | | 213,664 |
KeyCorp | 46,528 | | 391,766 |
U.S. Bancorp | 6,370 | | 211,548 |
Wells Fargo & Co. | 15,626 | | 526,440 |
Zions Bancorporation | 7,498 | | 160,982 |
| | 1,921,536 |
Consumer Finance - 1.0% |
Capital One Financial Corp. | 4,400 | | 264,748 |
Diversified Financial Services - 5.5% |
Bank of America Corp. | 19,355 | | 180,389 |
Citigroup, Inc. | 21,991 | | 822,243 |
JPMorgan Chase & Co. | 10,225 | | 426,178 |
| | 1,428,810 |
Insurance - 4.7% |
Allstate Corp. | 3,140 | | 125,537 |
Assurant, Inc. | 6,067 | | 229,393 |
Berkshire Hathaway, Inc. Class B (a) | 989 | | 85,400 |
MetLife, Inc. | 2,788 | | 98,946 |
RenaissanceRe Holdings Ltd. | 3,019 | | 245,626 |
Common Stocks - continued |
| Shares | | Value |
FINANCIALS - continued |
Insurance - continued |
The Chubb Corp. | 1,885 | | $ 145,107 |
XL Group PLC Class A | 12,639 | | 312,689 |
| | 1,242,698 |
Real Estate Investment Trusts - 0.9% |
Weyerhaeuser Co. | 8,000 | | 221,520 |
Thrifts & Mortgage Finance - 1.1% |
Radian Group, Inc. (d) | 61,950 | | 290,546 |
TOTAL FINANCIALS | | 6,420,144 |
HEALTH CARE - 12.9% |
Health Care Providers & Services - 1.1% |
HCA Holdings, Inc. | 9,659 | | 274,412 |
Pharmaceuticals - 11.8% |
Bristol-Myers Squibb Co. | 7,577 | | 251,935 |
Eli Lilly & Co. | 2,429 | | 118,122 |
Johnson & Johnson | 6,892 | | 488,091 |
Merck & Co., Inc. | 18,341 | | 836,900 |
Pfizer, Inc. | 42,601 | | 1,059,487 |
Sanofi SA sponsored ADR | 7,940 | | 348,169 |
| | 3,102,704 |
TOTAL HEALTH CARE | | 3,377,116 |
INDUSTRIALS - 7.4% |
Aerospace & Defense - 2.2% |
Textron, Inc. | 22,752 | | 573,578 |
Construction & Engineering - 1.2% |
Jacobs Engineering Group, Inc. (a) | 7,807 | | 301,272 |
Industrial Conglomerates - 4.0% |
General Electric Co. | 50,047 | | 1,053,990 |
TOTAL INDUSTRIALS | | 1,928,840 |
INFORMATION TECHNOLOGY - 8.4% |
Communications Equipment - 0.8% |
Cisco Systems, Inc. | 12,614 | | 216,204 |
Computers & Peripherals - 1.4% |
Hewlett-Packard Co. | 27,753 | | 384,379 |
Common Stocks - continued |
| Shares | | Value |
INFORMATION TECHNOLOGY - continued |
Electronic Equipment & Components - 0.9% |
Corning, Inc. | 21,004 | | $ 246,797 |
Office Electronics - 0.9% |
Xerox Corp. | 35,384 | | 227,873 |
Semiconductors & Semiconductor Equipment - 0.5% |
Advanced Micro Devices, Inc. (a) | 60,281 | | 123,576 |
Software - 3.9% |
Comverse Technology, Inc. (a) | 84,352 | | 555,880 |
Microsoft Corp. | 2,810 | | 80,183 |
Symantec Corp. (a) | 21,018 | | 382,317 |
| | 1,018,380 |
TOTAL INFORMATION TECHNOLOGY | | 2,217,209 |
MATERIALS - 1.6% |
Metals & Mining - 1.6% |
Newmont Mining Corp. | 7,562 | | 412,507 |
TELECOMMUNICATION SERVICES - 2.3% |
Diversified Telecommunication Services - 0.5% |
AT&T, Inc. | 3,596 | | 124,386 |
CenturyLink, Inc. | 178 | | 6,832 |
| | 131,218 |
Wireless Telecommunication Services - 1.8% |
Sprint Nextel Corp. (a) | 86,010 | | 476,495 |
TOTAL TELECOMMUNICATION SERVICES | | 607,713 |
UTILITIES - 5.7% |
Electric Utilities - 5.0% |
Duke Energy Corp. | 2,300 | | 151,087 |
Edison International | 8,016 | | 376,271 |
FirstEnergy Corp. | 10,134 | | 463,326 |
NextEra Energy, Inc. | 4,596 | | 321,996 |
| | 1,312,680 |
Common Stocks - continued |
| Shares | | Value |
UTILITIES - continued |
Multi-Utilities - 0.7% |
Sempra Energy | 2,700 | | $ 188,325 |
TOTAL UTILITIES | | 1,501,005 |
TOTAL COMMON STOCKS (Cost $25,752,905) |
24,927,922
|
U.S. Treasury Obligations - 0.2% |
| Principal
Amount | | |
U.S. Treasury Bills, yield at date of purchase 0.08% to 0.1% 11/23/12 to 12/20/12 (e)
(Cost $49,996) | | $ 50,000 | |
49,997
|
Money Market Funds - 8.2% |
| Shares | | |
Fidelity Cash Central Fund, 0.19% (b) | 1,340,546 | | 1,340,546 |
Fidelity Securities Lending Cash Central Fund, 0.19% (b)(c) | 805,057 | | 805,057 |
TOTAL MONEY MARKET FUNDS (Cost $2,145,603) |
2,145,603
|
TOTAL INVESTMENT PORTFOLIO - 103.4% (Cost $27,948,504) | | 27,123,522 |
NET OTHER ASSETS (LIABILITIES) - (3.4)% | | (883,997) |
NET ASSETS - 100% | $ 26,239,525 |
Futures Contracts |
| Expiration
Date | | Underlying
Face Amount
at Value | | Unrealized
Appreciation/
(Depreciation) |
Purchased |
Equity Index Contracts |
2 NYFE Russell 1000 Index Contracts | Dec. 2012 | | $ 140,040 | | $ (1,484) |
|
The face value of futures purchased as a percentage of net assets is 0.5% |
Legend |
(a) Non-income producing |
(b) Affiliated fund that is available only to investment companies and other accounts managed by Fidelity Investments. The rate quoted is the annualized seven-day yield of the fund at period end. A complete unaudited listing of the fund's holdings as of its most recent quarter end is available upon request. In addition, each Fidelity Central Fund's financial statements, which are not covered by the Fund's Report of Independent Registered Public Accounting Firm, are available on the SEC's website or upon request. |
(c) Investment made with cash collateral received from securities on loan. |
(d) Security or a portion of the security is on loan at period end. |
(e) Security or a portion of the security was pledged to cover margin requirements for futures contracts. At the period end, the value of securities pledged amounted to $9,999. |
Affiliated Central Funds |
Information regarding fiscal year to date income earned by the Fund from investments in Fidelity Central Funds is as follows: |
Fund | Income earned |
Fidelity Cash Central Fund | $ 2,062 |
Fidelity Securities Lending Cash Central Fund | 9,056 |
Total | $ 11,118 |
Other Information |
The following is a summary of the inputs used, as of October 31, 2012, involving the Fund's assets and liabilities carried at fair value. The inputs or methodology used for valuing securities may not be an indication of the risk associated with investing in those securities. For more information on valuation inputs, and their aggregation into the levels used in the table below, please refer to the Security Valuation section in the accompanying Notes to Financial Statements. |
Valuation Inputs at Reporting Date: |
Description | Total | Level 1 | Level 2 | Level 3 |
Investments in Securities: | | | | |
Equities: | | | | |
Consumer Discretionary | $ 1,937,686 | $ 1,937,686 | $ - | $ - |
Consumer Staples | 2,026,747 | 2,026,747 | - | - |
Energy | 4,498,955 | 4,498,955 | - | - |
Financials | 6,420,144 | 6,420,144 | - | - |
Health Care | 3,377,116 | 3,377,116 | - | - |
Industrials | 1,928,840 | 1,928,840 | - | - |
Information Technology | 2,217,209 | 2,217,209 | - | - |
Materials | 412,507 | 412,507 | - | - |
Telecommunication Services | 607,713 | 607,713 | - | - |
Utilities | 1,501,005 | 1,501,005 | - | - |
U.S. Government and Government Agency Obligations | 49,997 | - | 49,997 | - |
Money Market Funds | 2,145,603 | 2,145,603 | - | - |
Total Investments in Securities: | $ 27,123,522 | $ 27,073,525 | $ 49,997 | $ - |
Derivative Instruments: | | | | |
Liabilities | | | | |
Futures Contracts | $ (1,484) | $ (1,484) | $ - | $ - |
The following is a summary of transfers between Level 1 and Level 2 for the period ended October 31, 2012. Transfers are assumed to have occurred at the beginning of the period, and are primarily attributable to the valuation techniques used for foreign equity securities, as discussed in the accompanying Notes to Financial Statements: |
Transfers | Total |
Level 1 to Level 2 | $ 0 |
Level 2 to Level 1 | $ 548,652 |
Value of Derivative Instruments |
The following table is a summary of the Fund's value of derivative instruments by primary risk exposure as of October 31, 2012. For additional information on derivative instruments, please refer to the Derivative Instruments section in the accompanying Notes to Financial Statements. |
Risk Exposure /
Derivative Type | Value |
| Asset | Liability |
Equity Risk | | |
Futures Contracts (a) | $ - | $ (1,484) |
Total Value of Derivatives | $ - | $ (1,484) |
(a) Reflects cumulative appreciation/(depreciation) on futures contracts as disclosed on the Schedule of Investments. Only the period end variation margin is separately disclosed on the Statement of Assets and Liabilities. |
See accompanying notes which are an integral part of the financial statements.
Annual Report
Statement of Assets and Liabilities
| October 31, 2012 |
| | |
Assets | | |
Investment in securities, at value (including securities loaned of $783,885) - See accompanying schedule: Unaffiliated issuers (cost $25,802,901) | $ 24,977,919 | |
Fidelity Central Funds (cost $2,145,603) | 2,145,603 | |
Total Investments (cost $27,948,504) | | $ 27,123,522 |
Receivable for investments sold | | 23,833 |
Receivable for fund shares sold | | 33,192 |
Dividends receivable | | 36,231 |
Distributions receivable from Fidelity Central Funds | | 1,116 |
Other receivables | | 1,299 |
Total assets | | 27,219,193 |
| | |
Liabilities | | |
Payable for investments purchased | $ 84,348 | |
Payable for fund shares redeemed | 23,362 | |
Accrued management fee | 9,433 | |
Distribution and service plan fees payable | 9,286 | |
Payable for daily variation margin on futures contracts | 220 | |
Other affiliated payables | 7,461 | |
Other payables and accrued expenses | 40,501 | |
Collateral on securities loaned, at value | 805,057 | |
Total liabilities | | 979,668 |
| | |
Net Assets | | $ 26,239,525 |
Net Assets consist of: | | |
Paid in capital | | $ 61,836,458 |
Undistributed net investment income | | 192,867 |
Accumulated undistributed net realized gain (loss) on investments and foreign currency transactions | | (34,963,285) |
Net unrealized appreciation (depreciation) on investments and assets and liabilities in foreign currencies | | (826,515) |
Net Assets | | $ 26,239,525 |
See accompanying notes which are an integral part of the financial statements.
Annual Report
Statement of Assets and Liabilities - continued
| October 31, 2012 |
| | |
Calculation of Maximum Offering Price Class A:
Net Asset Value and redemption price per share ($14,705,442 ÷ 1,359,593 shares) | | $ 10.82 |
| | |
Maximum offering price per share (100/94.25 of $10.82) | | $ 11.48 |
Class T:
Net Asset Value and redemption price per share ($6,144,983 ÷ 567,737 shares) | | $ 10.82 |
| | |
Maximum offering price per share (100/96.50 of $10.82) | | $ 11.21 |
Class B:
Net Asset Value and offering price per share ($894,797 ÷ 83,603 shares)A | | $ 10.70 |
| | |
Class C:
Net Asset Value and offering price per share ($3,299,257 ÷ 311,586 shares)A | | $ 10.59 |
| | |
Institutional Class:
Net Asset Value, offering price and redemption price per share ($1,195,046 ÷ 109,703 shares) | | $ 10.89 |
A Redemption price per share is equal to net asset value less any applicable contingent deferred sales charge.
See accompanying notes which are an integral part of the financial statements.
Annual Report
Financial Statements - continued
Statement of Operations
| Year ended October 31, 2012 |
| | |
Investment Income | | |
Dividends | | $ 678,286 |
Interest | | 24 |
Income from Fidelity Central Funds | | 11,118 |
Total income | | 689,428 |
| | |
Expenses | | |
Management fee
Basic fee | $ 153,618 | |
Performance adjustment | (89,148) | |
Transfer agent fees | 83,058 | |
Distribution and service plan fees | 119,442 | |
Accounting and security lending fees | 11,072 | |
Custodian fees and expenses | 18,632 | |
Independent trustees' compensation | 183 | |
Registration fees | 57,735 | |
Audit | 48,633 | |
Legal | 186 | |
Miscellaneous | 267 | |
Total expenses before reductions | 403,678 | |
Expense reductions | (12,877) | 390,801 |
Net investment income (loss) | | 298,627 |
Realized and Unrealized Gain (Loss) Net realized gain (loss) on: | | |
Investment securities: | | |
Unaffiliated issuers | (46,394) | |
Foreign currency transactions | (7,979) | |
Futures contracts | 12,499 | |
Total net realized gain (loss) | | (41,874) |
Change in net unrealized appreciation (depreciation) on: Investment securities | 2,307,798 | |
Assets and liabilities in foreign currencies | (253) | |
Futures contracts | (1,484) | |
Total change in net unrealized appreciation (depreciation) | | 2,306,061 |
Net gain (loss) | | 2,264,187 |
Net increase (decrease) in net assets resulting from operations | | $ 2,562,814 |
See accompanying notes which are an integral part of the financial statements.
Annual Report
Statement of Changes in Net Assets
| Year ended
October 31,
2012 | Year ended
October 31,
2011 |
Increase (Decrease) in Net Assets | | |
Operations | | |
Net investment income (loss) | $ 298,627 | $ 290,432 |
Net realized gain (loss) | (41,874) | 720,203 |
Change in net unrealized appreciation (depreciation) | 2,306,061 | (343,386) |
Net increase (decrease) in net assets resulting
from operations | 2,562,814 | 667,249 |
Distributions to shareholders from net investment income | (279,421) | (358,603) |
Distributions to shareholders from net realized gain | (11,550) | (41,497) |
Total distributions | (290,971) | (400,100) |
Share transactions - net increase (decrease) | (5,178,957) | (15,871,835) |
Total increase (decrease) in net assets | (2,907,114) | (15,604,686) |
| | |
Net Assets | | |
Beginning of period | 29,146,639 | 44,751,325 |
End of period (including undistributed net investment income of $192,867 and undistributed net investment income of $188,125, respectively) | $ 26,239,525 | $ 29,146,639 |
See accompanying notes which are an integral part of the financial statements.
Annual Report
Financial Highlights - Class A
Years ended October 31, | 2012 | 2011 | 2010 | 2009 | 2008 |
Selected Per-Share Data | | | | | |
Net asset value, beginning of period | $ 9.96 | $ 10.12 | $ 9.30 | $ 8.63 | $ 16.40 |
Income from Investment Operations | | | | | |
Net investment income (loss) C | .13 | .10 | .07 F | .09 | .16 |
Net realized and unrealized gain (loss) | .85 | (.14) G | .85 | .75 | (7.09) |
Total from investment operations | .98 | (.04) | .92 | .84 | (6.93) |
Distributions from net investment income | (.12) | (.11) | (.09) | (.17) | (.12) |
Distributions from net realized gain | - I | (.01) | (.01) | - | (.72) |
Total distributions | (.12) | (.12) | (.10) | (.17) | (.84) J |
Net asset value, end of period | $ 10.82 | $ 9.96 | $ 10.12 | $ 9.30 | $ 8.63 |
Total Return A, B | 10.00% | (.40)% | 9.91% | 10.13% | (44.43)% |
Ratios to Average Net Assets D, H | | | | | |
Expenses before reductions | 1.28% | 1.24% | 1.22% | 1.25% | 1.26% |
Expenses net of fee waivers, if any | 1.25% | 1.24% | 1.22% | 1.25% | 1.25% |
Expenses net of all reductions | 1.24% | 1.23% | 1.21% | 1.25% | 1.25% |
Net investment income (loss) | 1.26% | .91% | .75% F | 1.10% | 1.21% |
Supplemental Data | | | | | |
Net assets, end of period (000 omitted) | $ 14,705 | $ 15,484 | $ 25,431 | $ 28,585 | $ 34,864 |
Portfolio turnover rate E | 94% | 161% | 51% | 56% | 74% |
A Total returns would have been lower if certain expenses had not been reduced during the applicable periods shown.
B Total returns do not include the effect of the sales charges.
C Calculated based on average shares outstanding during the period.
D Fees and expenses of any underlying Fidelity Central Funds are not included in the Fund's expense ratio. The Fund indirectly bears its proportionate share of the expenses of any underlying Fidelity Central Funds.
E Amount does not include the portfolio activity of any underlying Fidelity Central Funds.
F Investment income per share reflects a large, non-recurring dividend which amounted to $.02 per share. Excluding this non-recurring dividend, the ratio of net investment income (loss) to average net assets would have been .57%.
G The amount shown for a share outstanding does not correspond with the aggregate net gain (loss) on investments for the period due to the timing of sales and repurchases of shares in relation to fluctuating market values of the investments of the Fund.
H Expense ratios reflect operating expenses of the class. Expenses before reductions do not reflect amounts reimbursed by the investment adviser or reductions from brokerage service arrangements or reductions from other expense offset arrangements and do not represent the amount paid by the class during periods when reimbursements or reductions occur. Expenses net of fee waivers reflect expenses after reimbursement by the investment adviser but prior to reductions from brokerage service arrangements or other expense offset arrangements. Expenses net of all reductions represent the net expenses paid by the class.
I Amount represents less than $.01 per share.
J Total distributions of $.839 per share is comprised of distributions from net investment income of $.117 and distributions from net realized gain of $.722 per share.
See accompanying notes which are an integral part of the financial statements.
Annual Report
Financial Highlights - Class T
Years ended October 31, | 2012 | 2011 | 2010 | 2009 | 2008 |
Selected Per-Share Data | | | | | |
Net asset value, beginning of period | $ 9.96 | $ 10.08 | $ 9.27 | $ 8.58 | $ 16.30 |
Income from Investment Operations | | | | | |
Net investment income (loss) C | .10 | .07 | .05 F | .07 | .13 |
Net realized and unrealized gain (loss) | .85 | (.13) G | .84 | .75 | (7.06) |
Total from investment operations | .95 | (.06) | .89 | .82 | (6.93) |
Distributions from net investment income | (.09) | (.05) | (.07) | (.13) | (.07) |
Distributions from net realized gain | - I | (.01) | (.01) | - | (.72) |
Total distributions | (.09) | (.06) | (.08) | (.13) | (.79) J |
Net asset value, end of period | $ 10.82 | $ 9.96 | $ 10.08 | $ 9.27 | $ 8.58 |
Total Return A, B | 9.68% | (.64)% | 9.62% | 9.90% | (44.57)% |
Ratios to Average Net Assets D, H | | | | | |
Expenses before reductions | 1.55% | 1.49% | 1.45% | 1.50% | 1.49% |
Expenses net of fee waivers, if any | 1.50% | 1.49% | 1.45% | 1.50% | 1.49% |
Expenses net of all reductions | 1.49% | 1.48% | 1.45% | 1.49% | 1.49% |
Net investment income (loss) | 1.01% | .67% | .52% F | .85% | .97% |
Supplemental Data | | | | | |
Net assets, end of period (000 omitted) | $ 6,145 | $ 8,254 | $ 12,735 | $ 20,652 | $ 22,720 |
Portfolio turnover rate E | 94% | 161% | 51% | 56% | 74% |
A Total returns would have been lower if certain expenses had not been reduced during the applicable periods shown.
B Total returns do not include the effect of the sales charges.
C Calculated based on average shares outstanding during the period.
D Fees and expenses of any underlying Fidelity Central Funds are not included in the Fund's expense ratio. The Fund indirectly bears its proportionate share of the expenses of any underlying Fidelity Central Funds.
E Amount does not include the portfolio activity of any underlying Fidelity Central Funds.
F Investment income per share reflects a large, non-recurring dividend which amounted to $.02 per share. Excluding this non-recurring dividend, the ratio of net investment income (loss) to average net assets would have been .33%.
G The amount shown for a share outstanding does not correspond with the aggregate net gain (loss) on investments for the period due to the timing of sales and repurchases of shares in relation to fluctuating market values of the investments of the Fund.
H Expense ratios reflect operating expenses of the class. Expenses before reductions do not reflect amounts reimbursed by the investment adviser or reductions from brokerage service arrangements or reductions from other expense offset arrangements and do not represent the amount paid by the class during periods when reimbursements or reductions occur. Expenses net of fee waivers reflect expenses after reimbursement by the investment adviser but prior to reductions from brokerage service arrangements or other expense offset arrangements. Expenses net of all reductions represent the net expenses paid by the class.
I Amount represents less than $.01 per share.
J Total distributions of $.790 per share is comprised of distributions from net investment income of $.068 and distributions from net realized gain of $.722 per share.
See accompanying notes which are an integral part of the financial statements.
Annual Report
Financial Highlights - Class B
Years ended October 31, | 2012 | 2011 | 2010 | 2009 | 2008 |
Selected Per-Share Data | | | | | |
Net asset value, beginning of period | $ 9.84 | $ 9.99 | $ 9.18 | $ 8.47 | $ 16.07 |
Income from Investment Operations | | | | | |
Net investment income (loss) C | .05 | .02 | - F, I | .03 | .06 |
Net realized and unrealized gain (loss) | .85 | (.13) G | .84 | .74 | (6.96) |
Total from investment operations | .90 | (.11) | .84 | .77 | (6.90) |
Distributions from net investment income | (.03) | (.03) | (.02) | (.06) | - |
Distributions from net realized gain | - I | (.01) | (.01) | - | (.70) |
Total distributions | (.04) J | (.04) | (.03) | (.06) | (.70) K |
Net asset value, end of period | $ 10.70 | $ 9.84 | $ 9.99 | $ 9.18 | $ 8.47 |
Total Return A, B | 9.14% | (1.14)% | 9.11% | 9.19% | (44.80)% |
Ratios to Average Net Assets D, H | | | | | |
Expenses before reductions | 2.04% | 1.99% | 1.97% | 2.00% | 2.03% |
Expenses net of fee waivers, if any | 2.00% | 1.99% | 1.97% | 2.00% | 2.00% |
Expenses net of all reductions | 1.99% | 1.98% | 1.97% | 2.00% | 2.00% |
Net investment income (loss) | .51% | .16% | (.01)% F | .35% | .45% |
Supplemental Data | | | | | |
Net assets, end of period (000 omitted) | $ 895 | $ 1,110 | $ 1,605 | $ 1,989 | $ 2,615 |
Portfolio turnover rate E | 94% | 161% | 51% | 56% | 74% |
A Total returns would have been lower if certain expenses had not been reduced during the applicable periods shown.
B Total returns do not include the effect of the contingent deferred sales charge.
C Calculated based on average shares outstanding during the period.
D Fees and expenses of any underlying Fidelity Central Funds are not included in the Fund's expense ratio. The Fund indirectly bears its proportionate share of the expenses of any underlying Fidelity Central Funds.
E Amount does not include the portfolio activity of any underlying Fidelity Central Funds.
F Investment income per share reflects a large, non-recurring dividend which amounted to $.02 per share. Excluding this non-recurring dividend, the ratio of net investment income (loss) to average net assets would have been (.19)%.
G The amount shown for a share outstanding does not correspond with the aggregate net gain (loss) on investments for the period due to the timing of sales and repurchases of shares in relation to fluctuating market values of the investments of the Fund.
H Expense ratios reflect operating expenses of the class. Expenses before reductions do not reflect amounts reimbursed by the investment adviser or reductions from brokerage service arrangements or reductions from other expense offset arrangements and do not represent the amount paid by the class during periods when reimbursements or reductions occur. Expenses net of fee waivers reflect expenses after reimbursement by the investment adviser but prior to reductions from brokerage service arrangements or other expense offset arrangements. Expenses net of all reductions represent the net expenses paid by the class.
I Amount represents less than $.01 per share.
J Total distributions of $.04 per share is comprised of distributions from net investment income of $.031 and distributions from net realized gain of $.004 per share.
K Total distributions of $.698 per share is comprised of distributions from net investment income of $.000 and distributions from net realized gain of $.698 per share.
See accompanying notes which are an integral part of the financial statements.
Annual Report
Financial Highlights - Class C
Years ended October 31, | 2012 | 2011 | 2010 | 2009 | 2008 |
Selected Per-Share Data | | | | | |
Net asset value, beginning of period | $ 9.75 | $ 9.92 | $ 9.11 | $ 8.44 | $ 16.04 |
Income from Investment Operations | | | | | |
Net investment income (loss) C | .05 | .02 | - F, I | .03 | .06 |
Net realized and unrealized gain (loss) | .84 | (.13) G | .83 | .73 | (6.95) |
Total from investment operations | .89 | (.11) | .83 | .76 | (6.89) |
Distributions from net investment income | (.05) | (.05) | (.02) | (.09) | - |
Distributions from net realized gain | - I | (.01) | (.01) | - | (.71) |
Total distributions | (.05) | (.06) | (.02) J | (.09) | (.71) K |
Net asset value, end of period | $ 10.59 | $ 9.75 | $ 9.92 | $ 9.11 | $ 8.44 |
Total Return A, B | 9.21% | (1.18)% | 9.12% | 9.28% | (44.84)% |
Ratios to Average Net Assets D, H | | | | | |
Expenses before reductions | 2.04% | 2.00% | 1.97% | 2.01% | 2.03% |
Expenses net of fee waivers, if any | 2.00% | 2.00% | 1.97% | 2.00% | 2.00% |
Expenses net of all reductions | 1.99% | 1.98% | 1.97% | 2.00% | 2.00% |
Net investment income (loss) | .51% | .16% | -% F,L | .35% | .45% |
Supplemental Data | | | | | |
Net assets, end of period (000 omitted) | $ 3,299 | $ 3,775 | $ 4,139 | $ 4,088 | $ 5,358 |
Portfolio turnover rate E | 94% | 161% | 51% | 56% | 74% |
A Total returns would have been lower if certain expenses had not been reduced during the applicable periods shown.
B Total returns do not include the effect of the contingent deferred sales charge.
C Calculated based on average shares outstanding during the period.
D Fees and expenses of any underlying Fidelity Central Funds are not included in the Fund's expense ratio. The Fund indirectly bears its proportionate share of the expenses of any underlying Fidelity Central Funds.
E Amount does not include the portfolio activity of any underlying Fidelity Central Funds.
F Investment income per share reflects a large, non-recurring dividend which amounted to $.02 per share. Excluding this non-recurring dividend, the ratio of net investment income (loss) to average net assets would have been (.19)%.
G The amount shown for a share outstanding does not correspond with the aggregate net gain (loss) on investments for the period due to the timing of sales and repurchases of shares in relation to fluctuating market values of the investments of the Fund.
H Expense ratios reflect operating expenses of the class. Expenses before reductions do not reflect amounts reimbursed by the investment adviser or reductions from brokerage service arrangements or reductions from other expense offset arrangements and do not represent the amount paid by the class during periods when reimbursements or reductions occur. Expenses net of fee waivers reflect expenses after reimbursement by the investment adviser but prior to reductions from brokerage service arrangements or other expense offset arrangements. Expenses net of all reductions represent the net expenses paid by the class.
I Amount represents less than $.01 per share.
J Total distributions of $.02 per share is comprised of distributions from net investment income of $.015 and distributions from net realized gain of $.005 per share.
K Total distributions of $.712 per share is comprised of distributions from net investment income of $.000 and distributions from net realized gain of $.712 per share.
L Amount represents less than .01%.
See accompanying notes which are an integral part of the financial statements.
Annual Report
Financial Highlights - Institutional Class
Years ended October 31, | 2012 | 2011 | 2010 | 2009 | 2008 |
Selected Per-Share Data | | | | | |
Net asset value, beginning of period | $ 10.04 | $ 10.19 | $ 9.35 | $ 8.70 | $ 16.51 |
Income from Investment Operations | | | | | |
Net investment income (loss) B | .18 | .14 | .10 E | .11 | .20 |
Net realized and unrealized gain (loss) | .83 | (.15) F | .86 | .74 | (7.13) |
Total from investment operations | 1.01 | (.01) | .96 | .85 | (6.93) |
Distributions from net investment income | (.16) | (.13) | (.11) | (.20) | (.15) |
Distributions from net realized gain | - H | (.01) | (.01) | - | (.72) |
Total distributions | (.16) | (.14) | (.12) | (.20) | (.88) I |
Net asset value, end of period | $ 10.89 | $ 10.04 | $ 10.19 | $ 9.35 | $ 8.70 |
Total Return A | 10.30% | (.11)% | 10.28% | 10.26% | (44.24)% |
Ratios to Average Net Assets C, G | | | | | |
Expenses before reductions | .83% | .89% | .98% | 1.00% | .98% |
Expenses net of fee waivers, if any | .83% | .89% | .98% | 1.00% | .98% |
Expenses net of all reductions | .82% | .88% | .97% | 1.00% | .97% |
Net investment income (loss) | 1.68% | 1.27% | .99% E | 1.35% | 1.48% |
Supplemental Data | | | | | |
Net assets, end of period (000 omitted) | $ 1,195 | $ 523 | $ 841 | $ 2,341 | $ 2,021 |
Portfolio turnover rate D | 94% | 161% | 51% | 56% | 74% |
A Total returns would have been lower if certain expenses had not been reduced during the applicable periods shown.
B Calculated based on average shares outstanding during the period.
C Fees and expenses of any underlying Fidelity Central Funds are not included in the Fund's expense ratio. The Fund indirectly bears its proportionate share of the expenses of any underlying Fidelity Central Funds.
D Amount does not include the portfolio activity of any underlying Fidelity Central Funds.
E Investment income per share reflects a large, non-recurring dividend which amounted to $.02 per share. Excluding this non-recurring dividend, the ratio of net investment income (loss) to average net assets would have been .81%.
F The amount shown for a share outstanding does not correspond with the aggregate net gain (loss) on investments for the period due to the timing of sales and repurchases of shares in relation to fluctuating market values of the investments of the Fund.
G Expense ratios reflect operating expenses of the class. Expenses before reductions do not reflect amounts reimbursed by the investment adviser or reductions from brokerage service arrangements or reductions from other expense offset arrangements and do not represent the amount paid by the class during periods when reimbursements or reductions occur. Expenses net of fee waivers reflect expenses after reimbursement by the investment adviser but prior to reductions from brokerage service arrangements or other expense offset arrangements. Expenses net of all reductions represent the net expenses paid by the class.
H Amount represents less than $.01 per share.
I Total distributions of $.876 per share is comprised of distributions from net investment income of $.154 and distributions from net realized gain of $.722 per share.
See accompanying notes which are an integral part of the financial statements.
Annual Report
Notes to Financial Statements
For the period ended October 31, 2012
1. Organization.
Fidelity Advisor Value Leaders Fund (the Fund) is a fund of Fidelity Advisor Series VIII (the Trust) and is authorized to issue an unlimited number of shares. The Trust is registered under the Investment Company Act of 1940, as amended (the 1940 Act), as an open-end management investment company organized as a Massachusetts business trust. The Fund offers Class A, Class T, Class C, and Institutional Class shares, each of which, along with Class B shares, has equal rights as to assets and voting privileges. Effective after the close of business on September 1, 2010, Class B shares were closed to new accounts and additional purchases, except for exchanges and reinvestments. Each class has exclusive voting rights with respect to matters that affect that class. Class B shares will automatically convert to Class A shares after a holding period of seven years from the initial date of purchase. Investment income, realized and unrealized capital gains and losses, the common expenses of the Fund, and certain fund-level expense reductions, if any, are allocated on a pro-rata basis to each class based on the relative net assets of each class to the total net assets of the Fund. Each class differs with respect to transfer agent and distribution and service plan fees incurred. Certain expense reductions may also differ by class.
2. Investments in Fidelity Central Funds.
The Fund invests in Fidelity Central Funds, which are open-end investment companies available only to other investment companies and accounts managed by Fidelity Management & Research Company (FMR) and its affiliates. The Fund's Schedule of Investments lists each of the Fidelity Central Funds held as of period end, if any, as an investment of the Fund, but does not include the underlying holdings of each Fidelity Central Fund. As an Investing Fund, the Fund indirectly bears its proportionate share of the expenses of the underlying Fidelity Central Funds.
The Money Market Central Funds seek preservation of capital and current income and are managed by Fidelity Investments Money Management, Inc. (FIMM), an affiliate of FMR.
A complete unaudited list of holdings for each Fidelity Central Fund is available upon request or at the Securities and Exchange Commission (the SEC) web site at www.sec.gov. In addition, the financial statements of the Fidelity Central Funds, which are not covered by the Fund's Report of Independent Registered Public Accounting Firm, are available on the SEC web site or upon request.
3. Significant Accounting Policies.
The financial statements have been prepared in conformity with accounting principles generally accepted in the United States of America (GAAP), which require management to make certain estimates and assumptions at the date of the financial statements.
Annual Report
Notes to Financial Statements - continued
3. Significant Accounting Policies - continued
Actual results could differ from those estimates. Subsequent events, if any, through the date that the financial statements were issued have been evaluated in the preparation of the financial statements. The following summarizes the significant accounting policies of the Fund:
Security Valuation. Investments are valued as of 4:00 p.m. Eastern time on the last calendar day of the period. In accordance with valuation policies and procedures approved by the Board of Trustees (the Board), the Fund attempts to obtain prices from one or more third party pricing vendors or brokers to value its investments. When current market prices, quotations or rates are not readily available or reliable, securities will be fair valued in good faith by the FMR Fair Value Committee (the Committee), in accordance with procedures adopted by the Fund's Board. Factors used in determining fair value vary by security type and may include market or security specific events, changes in interest rates and credit quality. The frequency with which these procedures are used cannot be predicted and they may be utilized to a significant extent. The Committee oversees the Fund's valuation policies and procedures and is responsible for approving and reporting to the Board all fair value determinations.
The Fund categorizes the inputs to valuation techniques used to value its investments into a disclosure hierarchy consisting of three levels as shown below:
Level 1 - quoted prices in active markets for identical investments
Level 2 - other significant observable inputs (including quoted prices for similar investments, interest rates, prepayment speeds, etc.)
Level 3 - unobservable inputs (including the Fund's own assumptions based on the best information available)
Valuation techniques used to value the Fund's investments by major category are as follows:
Equity securities, including restricted securities, for which market quotations are readily available, are valued at the last reported sale price or official closing price as reported by a third party pricing vendor on the primary market or exchange on which they are traded and are categorized as Level 1 in the hierarchy. In the event there were no sales during the day or closing prices are not available, securities are valued at the last quoted bid price or may be valued using the last available price and are generally categorized as Level 2 in the hierarchy. For foreign equity securities, when significant market or security specific events arise, comparisons to the valuation of American Depositary Receipts (ADRs), futures contracts, Exchange-Traded Funds (ETFs) and certain indexes as well as quoted prices for similar securities are used and are categorized as Level 2 in the hierarchy. Utilizing these techniques may result in transfers between Level 1 and Level 2.
Annual Report
3. Significant Accounting Policies - continued
Security Valuation - continued
Debt securities, including restricted securities, are valued based on evaluated prices received from third party pricing vendors or from brokers who make markets in such securities. For U.S. government and government agency obligations, pricing vendors utilize matrix pricing which considers yield or price of bonds of comparable quality, coupon, maturity and type as well as broker-supplied prices and are generally categorized as Level 2 in the hierarchy.
Futures contracts are valued at the settlement price established each day by the board of trade or exchange on which they are traded and are categorized as Level 1 in the hierarchy. Investments in open-end mutual funds, including the Fidelity Central Funds, are valued at their closing net asset value (NAV) each business day and are categorized as Level 1 in the hierarchy.
Changes in valuation techniques may result in transfers in or out of an assigned level within the disclosure hierarchy. The aggregate value of investments by input level, as of October 31, 2012, including information on transfers between Levels 1 and 2, is included at the end of the Fund's Schedule of Investments.
Foreign Currency Translation. The Fund may use foreign currency contracts to facilitate transactions in foreign-denominated securities. Gains and losses from these transactions may arise from changes in the value of the foreign currency or if the counterparties do not perform under the contracts' terms.
Foreign-denominated assets, including investment securities, and liabilities are translated into U.S. dollars at the exchange rates at period end. Purchases and sales of investment securities, income and dividends received and expenses denominated in foreign currencies are translated into U.S. dollars at the exchange rate in effect on the transaction date.
The effects of exchange rate fluctuations on investments are included with the net realized and unrealized gain (loss) on investment securities. Other foreign currency transactions resulting in realized and unrealized gain (loss) are disclosed separately.
Investment Transactions and Income. For financial reporting purposes, the Fund's investment holdings and NAV include trades executed through the end of the last business day of the period. The NAV per share for processing shareholder transactions is calculated as of the close of business of the New York Stock Exchange (NYSE), normally 4:00 p.m. Eastern time and includes trades executed through the end of the prior business day. Gains and losses on securities sold are determined on the basis of identified cost and may include proceeds received from litigation. Dividend income is recorded on the ex-dividend date, except for certain dividends from foreign securities where the
Annual Report
Notes to Financial Statements - continued
3. Significant Accounting Policies - continued
Investment Transactions and Income - continued
ex-dividend date may have passed, which are recorded as soon as the Fund is informed of the ex-dividend date. Non-cash dividends included in dividend income, if any, are recorded at the fair market value of the securities received. Distributions received on securities that represent a return of capital or capital gain are recorded as a reduction of cost of investments and/or as a realized gain. The Fund estimates the components of distributions received that may be considered return of capital distributions or capital gain distributions. Interest income and distributions from the Fidelity Central Funds are accrued as earned. Interest income includes coupon interest and amortization of premium and accretion of discount on debt securities. Investment income is recorded net of foreign taxes withheld where recovery of such taxes is uncertain.
Expenses. Expenses directly attributable to a fund are charged to that fund. Expenses attributable to more than one fund are allocated among the respective funds on the basis of relative net assets or other appropriate methods. Expense estimates are accrued in the period to which they relate and adjustments are made when actual amounts are known.
Income Tax Information and Distributions to Shareholders. Each year, the Fund intends to qualify as a regulated investment company under Subchapter M of the Internal Revenue Code, including distributing substantially all of its taxable income and realized gains. As a result, no provision for income taxes is required. As of October 31, 2012, the Fund did not have any unrecognized tax benefits in the financial statements; nor is the Fund aware of any tax positions for which it is reasonably possible that the total amounts of unrecognized tax benefits will significantly change in the next twelve months. The Fund files a U.S. federal tax return, in addition to state and local tax returns as required. A fund's federal income tax returns are subject to examination by the Internal Revenue Service (IRS) for a period of three fiscal years after they are filed. State and local tax returns may be subject to examination for an additional fiscal year depending on the jurisdiction. Foreign taxes are provided for based on the Fund's understanding of the tax rules and rates that exist in the foreign markets in which it invests.
Distributions are declared and recorded on the ex-dividend date. Income dividends and capital gain distributions are declared separately for each class. Income and capital gain distributions are determined in accordance with income tax regulations, which may differ from GAAP.
Capital accounts within the financial statements are adjusted for permanent book-tax differences. These adjustments have no impact on net assets or the results of operations. Temporary book-tax differences will reverse in a subsequent period.
Annual Report
3. Significant Accounting Policies - continued
Income Tax Information and Distributions to Shareholders - continued
Book-tax differences are primarily due to futures transactions, foreign currency transactions, partnerships, capital loss carryforwards and losses deferred due to wash sales.
The federal tax cost of investment securities and unrealized appreciation (depreciation) as of period end were as follows:
Gross unrealized appreciation | $ 1,926,856 |
Gross unrealized depreciation | (3,292,556) |
Net unrealized appreciation (depreciation) on securities and other investments | $ (1,365,700) |
| |
Tax Cost | $ 28,489,222 |
The tax-based components of distributable earnings as of period end were as follows:
Undistributed ordinary income | $ 192,867 |
Capital loss carryforward | $ (34,424,052) |
Net unrealized appreciation (depreciation) | $ (1,365,749) |
Capital loss carryforwards are only available to offset future capital gains of the Fund to the extent provided by regulations and may be limited. Under the Regulated Investment Company Modernization Act of 2010 (the Act), the Fund is permitted to carry forward capital losses incurred in taxable years beginning after December 22, 2010 for an unlimited period and such capital losses are required to be used prior to any losses that expire. Capital loss carryforwards were as follows:
Fiscal year of expiration | |
2016 | $ (19,194,348) |
2017 | (14,819,668) |
2019 | (169,201) |
Total with expiration | (34,183,217) |
No expiration | |
Short-term | (210,874) |
Long-term | (29,961) |
Total no expiration | (240,835) |
Total capital loss carryforward | $ (34,424,052) |
The tax character of distributions paid was as follows:
| October 31, 2012 | October 31, 2011 |
Ordinary Income | $ 290,971 | $ 400,100 |
Annual Report
Notes to Financial Statements - continued
3. Significant Accounting Policies - continued
New Accounting Pronouncement. In December 2011, the Financial Accounting Standards Board issued Accounting Standard Update No. 2011-11, Disclosures about Offsetting Assets and Liabilities. The update creates new disclosure requirements requiring entities to disclose both gross and net information for derivatives and other financial instruments that are either offset in the Statement of Assets and Liabilities or subject to an enforceable master netting arrangement or similar agreement. The disclosure requirements are effective for annual reporting periods beginning on or after January 1, 2013, and interim periods within those annual periods. Management is currently evaluating the impact of the update's adoption on the Fund's financial statement disclosures.
4. Derivative Instruments.
Risk Exposures and the Use of Derivative Instruments. The Fund's investment objective allows the Fund to enter into various types of derivative contracts, including futures contracts. Derivatives are investments whose value is primarily derived from underlying assets, indices or reference rates and may be transacted on an exchange or over-the-counter (OTC). Derivatives may involve a future commitment to buy or sell a specified instrument based on specified terms, to exchange future cash flows at periodic intervals based on a notional principal amount, or for one party to make one or more payments upon the occurrence of specified events in exchange for periodic payments from the other party.
The Fund used derivatives to increase returns and to manage exposure to certain risks as defined below. The success of any strategy involving derivatives depends on analysis of numerous economic factors, and if the strategies for investment do not work as intended, the Fund may not achieve its objectives.
The Fund's use of derivatives increased or decreased its exposure to the following risk:
Equity Risk | Equity risk relates to the fluctuations in the value of financial instruments as a result of changes in market prices (other than those arising from interest rate risk or foreign exchange risk), whether caused by factors specific to an individual investment, its issuer, or all factors affecting all instruments traded in a market or market segment. |
The Fund is also exposed to additional risks from investing in derivatives, such as liquidity risk and counterparty credit risk. Liquidity risk is the risk that the Fund will be unable to close out the derivative in the open market in a timely manner. Counterparty credit risk is the risk that the counterparty will not be able to fulfill its obligation to the Fund. Counterparty credit risk related to exchange-traded futures contracts is minimal because of the protection provided by the exchange on which they trade.
Annual Report
4. Derivative Instruments - continued
Risk Exposures and the Use of Derivative Instruments - continued
Investing in derivatives may involve greater risks than investing in the underlying assets directly and, to varying degrees, may involve risk of loss in excess of any initial investment and collateral received and amounts recognized in the Statement of Assets and Liabilities. In addition, there may be the risk that the change in value of the derivative contract does not correspond to the change in value of the underlying instrument.
Futures Contracts. A futures contract is an agreement between two parties to buy or sell a specified underlying instrument for a fixed price at a specified future date. The Fund used futures contracts to manage its exposure to the stock market.
Upon entering into a futures contract, a fund is required to deposit either cash or securities (initial margin) with a clearing broker in an amount equal to a certain percentage of the face value of the contract. Futures contracts are marked-to-market daily and subsequent payments (variation margin) are made or received by a fund depending on the daily fluctuations in the value of the futures contracts and are recorded as unrealized appreciation or (depreciation). This receivable and/or payable is included in daily variation margin on futures contracts in the Statement of Assets and Liabilities. Realized gain or (loss) is recorded upon the expiration or closing of a futures contract.
Any open futures contracts at period end are shown in the Schedule of Investments under the caption "Futures Contracts." The underlying face amount at value reflects each contract's exposure to the underlying instrument at period end and is representative of activity for the period. Securities deposited to meet initial margin requirements are identified in the Schedule of Investments.
During the period the Fund recognized net realized gain (loss) of $12,499 and a change in net unrealized appreciation (depreciation) of $(1,484) related to its investment in futures contracts. These amounts are included in the Statement of Operations.
5. Purchases and Sales of Investments.
Purchases and sales of securities, other than short-term securities, aggregated $24,511,759 and $29,514,913, respectively.
6. Fees and Other Transactions with Affiliates.
Management Fee. FMR and its affiliates provide the Fund with investment management related services for which the Fund pays a monthly management fee. The management fee is the sum of an individual fund fee rate that is based on an annual rate of .30% of the Fund's average net assets and an annualized group fee rate that averaged .26% during the period. The group fee rate is based upon the average net assets of all the
Annual Report
Notes to Financial Statements - continued
6. Fees and Other Transactions with Affiliates - continued
Management Fee - continued
mutual funds advised by FMR. The group fee rate decreases as assets under management increase and increases as assets under management decrease. In addition, the management fee is subject to a performance adjustment (up to a maximum of ± .20% of the Fund's average net assets over a 36 month performance period). The upward or downward adjustment to the management fee is based on the relative investment performance of the Institutional Class of the Fund as compared to an appropriate benchmark index. For the period, the total annual management fee rate, including the performance adjustment, was .23% of the Fund's average net assets.
Distribution and Service Plan Fees. In accordance with Rule 12b-1 of the 1940 Act, the Fund has adopted separate Distribution and Service Plans for each class of shares. Certain classes pay Fidelity Distributors Corporation (FDC), an affiliate of FMR, separate Distribution and Service Fees, each of which is based on an annual percentage of each class' average net assets. In addition, FDC may pay financial intermediaries for selling shares of the Fund and providing shareholder support services. For the period, the Distribution and Service Fee rates, total fees and amounts retained by FDC were as follows:
| Distribution
Fee | Service
Fee | Total Fees | Retained
by FDC |
Class A | -% | .25% | $ 37,876 | $ 255 |
Class T | .25% | .25% | 35,980 | 177 |
Class B | .75% | .25% | 9,972 | 7,494 |
Class C | .75% | .25% | 35,614 | 2,985 |
| | | $ 119,442 | $ 10,911 |
Sales Load. FDC may receive a front-end sales charge of up to 5.75% for selling Class A shares and 3.50% for selling Class T shares, some of which is paid to financial intermediaries for selling shares of the Fund. Depending on the holding period, FDC may receive contingent deferred sales charges levied on Class A, Class T, Class B, and Class C redemptions. The deferred sales charges range from 5.00% to 1.00% for Class B shares, 1.00% for Class C shares, 1.00% for certain purchases of Class A shares and .25% for certain purchases of Class T shares.
Annual Report
6. Fees and Other Transactions with Affiliates - continued
Sales Load - continued
For the period, sales charge amounts retained by FDC were as follows:
| Retained
by FDC |
Class A | $ 1,394 |
Class T | 954 |
Class B* | 1,484 |
Class C* | 559 |
| $ 4,391 |
* When Class B and Class C shares are initially sold, FDC pays commissions from its own resources to financial intermediaries through which the sales
are made.
Transfer Agent Fees. Fidelity Investments Institutional Operations Company, Inc. (FIIOC), an affiliate of FMR, is the transfer, dividend disbursing and shareholder servicing agent for each class of the Fund. FIIOC receives account fees and asset-based fees that vary according to the account size and type of account of the shareholders of the respective classes of the Fund. For the period, transfer agent fees for each class were as follows:
| Amount | % of
Average
Net Assets |
Class A | $ 45,630 | .30 |
Class T | 22,288 | .31 |
Class B | 3,006 | .30 |
Class C | 10,839 | .30 |
Institutional Class | 1,295 | .20 |
| $ 83,058 | |
Accounting and Security Lending Fees. Fidelity Service Company, Inc. (FSC), an affiliate of FMR, maintains the Fund's accounting records. The accounting fee is based on the level of average net assets for each month. Under a separate contract, FSC administers the security lending program. The security lending fee is based on the number and duration of lending transactions.
Brokerage Commissions. The Fund placed a portion of its portfolio transactions with brokerage firms which are affiliates of the investment adviser. The commissions paid to these affiliated firms were $1,636 for the period.
7. Committed Line of Credit.
The Fund participates with other funds managed by FMR or an affiliate in a $4.25 billion credit facility (the "line of credit") to be utilized for temporary or emergency purposes to
Annual Report
Notes to Financial Statements - continued
7. Committed Line of Credit - continued
fund shareholder redemptions or for other short-term liquidity purposes. The Fund has agreed to pay commitment fees on its pro-rata portion of the line of credit, which amounted to $77 and is reflected in Miscellaneous expenses on the Statement of Operations. During the period, there were no borrowings on this line of credit.
8. Security Lending.
The Fund lends portfolio securities through a lending agent from time to time in order to earn additional income. For equity securities, a lending agent is used and may loan securities to certain qualified borrowers, including Fidelity Capital Markets (FCM), a broker-dealer affiliated with the Fund. On the settlement date of the loan, the Fund receives collateral (in the form of U.S. Treasury obligations, letters of credit and/or cash) against the loaned securities and maintains collateral in an amount not less than 100% of the market value of the loaned securities during the period of the loan. The market value of the loaned securities is determined at the close of business of the Fund and any additional required collateral is delivered to the Fund on the next business day. If the borrower defaults on its obligation to return the securities loaned because of insolvency or other reasons, a fund could experience delays and costs in recovering the securities loaned or in gaining access to the collateral. Any cash collateral received is invested in the Fidelity Securities Lending Cash Central Fund. The value of loaned securities and cash collateral at period end are disclosed on the Fund's Statement of Assets and Liabilities. Security lending income represents the income earned on investing cash collateral, less rebates paid to borrowers and any lending agent fees associated with the loan, plus any premium payments received for lending certain types of securities. Security lending income is presented in the Statement of Operations as a component of income from Fidelity Central Funds. Total security lending income during the period amounted to $9,056. During the period, there were no securities loaned to FCM.
9. Expense Reductions.
FMR voluntarily agreed to reimburse each class to the extent annual operating expenses exceeded certain levels of average net assets as noted in the table below. Some expenses, for example interest expense, including commitment fees, are excluded from this reimbursement.
The following classes were in reimbursement during the period:
| Expense
Limitations | Reimbursement
from adviser |
Class A | 1.25% | $ 4,916 |
Class T | 1.50% | 3,368 |
Annual Report
9. Expense Reductions - continued
| Expense
Limitations | Reimbursement
from adviser |
Class B | 2.00% | $ 359 |
Class C | 2.00% | 1,366 |
| | $ 10,009 |
Many of the brokers with whom FMR places trades on behalf of the Fund provided services to the Fund in addition to trade execution. These services included payments of certain expenses on behalf of the Fund totaling $2,856 for the period. In addition, through arrangements with the Fund's custodian, credits realized as a result of uninvested cash balances were used to reduce the Fund's expenses. During the period, these credits reduced the Fund's custody expenses by $12.
10. Distributions to Shareholders.
Distributions to shareholders of each class were as follows:
Years ended October 31, | 2012 | 2011 |
From net investment income | | |
Class A | $ 180,927 | $ 274,577 |
Class T | 68,454 | 50,441 |
Class B | 3,401 | 4,151 |
Class C | 18,732 | 18,471 |
Institutional Class | 7,907 | 10,963 |
Total | $ 279,421 | $ 358,603 |
From net realized gain | | |
Class A | $ 6,239 | $ 24,299 |
Class T | 3,111 | 10,732 |
Class B | 439 | 1,537 |
Class C | 1,561 | 4,105 |
Institutional Class | 200 | 824 |
Total | $ 11,550 | $ 41,497 |
11. Share Transactions.
Transactions for each class of shares were as follows:
| Shares | Dollars |
Years ended October 31, | 2012 | 2011 | 2012 | 2011 |
Class A | | | | |
Shares sold | 281,767 | 334,576 | $ 2,860,417 | $ 3,612,152 |
Reinvestment of distributions | 18,760 | 28,074 | 179,532 | 288,043 |
Shares redeemed | (496,141) | (1,320,166) | (5,059,962) | (14,109,969) |
Net increase (decrease) | (195,614) | (957,516) | $ (2,020,013) | $ (10,209,774) |
Annual Report
Notes to Financial Statements - continued
11. Share Transactions - continued
| Shares | Dollars |
Years ended October 31, | 2012 | 2011 | 2012 | 2011 |
Class T | | | | |
Shares sold | 48,701 | 157,819 | $ 501,218 | $ 1,706,564 |
Reinvestment of distributions | 7,282 | 5,816 | 69,834 | 59,851 |
Shares redeemed | (317,050) | (597,712) | (3,256,292) | (6,300,709) |
Net increase (decrease) | (261,067) | (434,077) | $ (2,685,240) | $ (4,534,294) |
Class B | | | | |
Shares sold | 26 | 248 | $ 248 | $ 2,692 |
Reinvestment of distributions | 355 | 507 | 3,383 | 5,175 |
Shares redeemed | (29,605) | (48,512) | (301,504) | (509,116) |
Net increase (decrease) | (29,224) | (47,757) | $ (297,873) | $ (501,249) |
Class C | | | | |
Shares sold | 47,718 | 69,631 | $ 476,581 | $ 733,867 |
Reinvestment of distributions | 1,986 | 2,055 | 18,732 | 20,799 |
Shares redeemed | (125,244) | (101,679) | (1,268,866) | (1,050,311) |
Net increase (decrease) | (75,540) | (29,993) | $ (773,553) | $ (295,645) |
Institutional Class | | | | |
Shares sold | 90,752 | 74,917 | $ 942,038 | $ 747,771 |
Reinvestment of distributions | 750 | 1,083 | 7,203 | 11,162 |
Shares redeemed | (33,948) | (106,405) | (351,519) | (1,089,806) |
Net increase (decrease) | 57,554 | (30,405) | $ 597,722 | $ (330,873) |
12. Other.
The Fund's organizational documents provide former and current trustees and officers with a limited indemnification against liabilities arising in connection with the performance of their duties to the Fund. In the normal course of business, the Fund may also enter into contracts that provide general indemnifications. The Fund's maximum exposure under these arrangements is unknown as this would be dependent on future claims that may be made against the Fund. The risk of material loss from such claims is considered remote.
Annual Report
To the Trustees of Fidelity Advisor Series VIII and the Shareholders of Fidelity Advisor Value Leaders Fund:
In our opinion, the accompanying statement of assets and liabilities, including the schedule of investments, and the related statements of operations and of changes in net assets and the financial highlights present fairly, in all material respects, the financial position of Fidelity Advisor Value Leaders Fund (a fund of Fidelity Advisor Series VIII) at October 31, 2012, the results of its operations for the year then ended, the changes in its net assets for each of the two years in the period then ended and the financial highlights for each of the five years in the period then ended, in conformity with accounting principles generally accepted in the United States of America. These financial statements and financial highlights (hereafter referred to as "financial statements") are the responsibility of the Fidelity Advisor Value Leaders Fund's management. Our responsibility is to express an opinion on these financial statements based on our audits. We conducted our audits of these financial statements in accordance with the standards of the Public Company Accounting Oversight Board (United States). Those standards require that we plan and perform the audit to obtain reasonable assurance about whether the financial statements are free of material misstatement. An audit includes examining, on a test basis, evidence supporting the amounts and disclosures in the financial statements, assessing the accounting principles used and significant estimates made by management, and evaluating the overall financial statement presentation. We believe that our audits, which included confirmation of securities at October 31, 2012 by correspondence with the custodian and brokers, provide a reasonable basis for our opinion.
PricewaterhouseCoopers LLP
Boston, Massachusetts
December 17, 2012
Annual Report
The Trustees, Members of the Advisory Board, and executive officers of the trust and fund, as applicable, are listed below. The Board of Trustees governs the fund and is responsible for protecting the interests of shareholders. The Trustees are experienced executives who meet periodically throughout the year to oversee the fund's activities, review contractual arrangements with companies that provide services to the fund, oversee management of the risks associated with such activities and contractual arrangements, and review the fund's performance. Except for James C. Curvey, each of the Trustees oversees 236 funds advised by FMR or an affiliate. Mr. Curvey oversees 443 funds advised by FMR or an affiliate.
The Trustees hold office without limit in time except that (a) any Trustee may resign; (b) any Trustee may be removed by written instrument, signed by at least two-thirds of the number of Trustees prior to such removal; (c) any Trustee who requests to be retired or who has become incapacitated by illness or injury may be retired by written instrument signed by a majority of the other Trustees; and (d) any Trustee may be removed at any special meeting of shareholders by a two-thirds vote of the outstanding voting securities of the trust. Each Trustee who is not an interested person (as defined in the 1940 Act) (Independent Trustee), shall retire not later than the last day of the calendar year in which his or her 75th birthday occurs. The Independent Trustees may waive this mandatory retirement age policy with respect to individual Trustees. The executive officers and Advisory Board Members hold office without limit in time, except that any officer and Advisory Board Member may resign or may be removed by a vote of a majority of the Trustees at any regular meeting or any special meeting of the Trustees. Except as indicated, each individual has held the office shown or other offices in the same company for the past five years.
Experience, Skills, Attributes, and Qualifications of the Fund's Trustees. The Governance and Nominating Committee has adopted a statement of policy that describes the experience, qualifications, attributes, and skills that are necessary and desirable for potential Independent Trustee candidates (Statement of Policy). The Board believes that each Trustee satisfied at the time he or she was initially elected or appointed a Trustee, and continues to satisfy, the standards contemplated by the Statement of Policy. The Governance and Nominating Committee also engages professional search firms to help identify potential Independent Trustee candidates who have the experience, qualifications, attributes, and skills consistent with the Statement of Policy. From time to time, additional criteria based on the composition and skills of the current Independent Trustees, as well as experience or skills that may be appropriate in light of future changes to board composition, business conditions, and regulatory or other developments, have also been considered by the professional search firms and the Governance and Nominating Committee. In addition, the Board takes into account the Trustees' commitment and participation in Board and committee meetings, as well as their leadership of standing and ad hoc committees throughout their tenure.
In determining that a particular Trustee was and continues to be qualified to serve as a Trustee, the Board has considered a variety of criteria, none of which, in isolation, was controlling. The Board believes that, collectively, the Trustees have balanced and diverse experience, qualifications, attributes, and skills, which allow the Board to operate effectively in governing the fund and protecting the interests of shareholders. Information about the specific experience, skills, attributes, and qualifications of each Trustee, which in each case led to the Board's conclusion that the Trustee should serve (or continue to serve) as a trustee of the fund, is provided below.
Annual Report
Board Structure and Oversight Function. James C. Curvey is an interested person (as defined in the 1940 Act) and currently serves as Chairman. The Trustees have determined that an interested Chairman is appropriate and benefits shareholders because an interested Chairman has a personal and professional stake in the quality and continuity of services provided to the fund. Independent Trustees exercise their informed business judgment to appoint an individual of their choosing to serve as Chairman, regardless of whether the Trustee happens to be independent or a member of management. The Independent Trustees have determined that they can act independently and effectively without having an Independent Trustee serve as Chairman and that a key structural component for assuring that they are in a position to do so is for the Independent Trustees to constitute a substantial majority for the Board. The Independent Trustees also regularly meet in executive session. Ned C. Lautenbach serves as Chairman of the Independent Trustees and as such (i) acts as a liaison between the Independent Trustees and management with respect to matters important to the Independent Trustees and (ii) with management prepares agendas for Board meetings.
Fidelity funds are overseen by different Boards of Trustees. The fund's Board oversees Fidelity's equity and high income funds and another Board oversees Fidelity's investment-grade bond, money market, and asset allocation funds. The asset allocation funds may invest in Fidelity funds overseen by the fund's Board. The use of separate Boards, each with its own committee structure, allows the Trustees of each group of Fidelity funds to focus on the unique issues of the funds they oversee, including common research, investment, and operational issues. On occasion, the separate Boards establish joint committees to address issues of overlapping consequences for the Fidelity funds overseen by each Board.
The Trustees operate using a system of committees to facilitate the timely and efficient consideration of all matters of importance to the Trustees, the fund, and fund shareholders and to facilitate compliance with legal and regulatory requirements and oversight of the fund's activities and associated risks. The Board, acting through its committees, has charged FMR and its affiliates with (i) identifying events or circumstances the occurrence of which could have demonstrably adverse effects on the fund's business and/or reputation; (ii) implementing processes and controls to lessen the possibility that such events or circumstances occur or to mitigate the effects of such events or circumstances if they do occur; and (iii) creating and maintaining a system designed to evaluate continuously business and market conditions in order to facilitate the identification and implementation processes described in (i) and (ii) above. Because the day-to-day operations and activities of the fund are carried out by or through FMR, its affiliates and other service providers, the fund's exposure to risks is mitigated but not eliminated by the processes overseen by the Trustees. While each of the Board's committees has responsibility for overseeing different aspects of the fund's activities, oversight is exercised primarily through the Operations, Audit, and Compliance Committees. In addition, the Independent Trustees have worked with FMR to enhance the Board's oversight of investment and financial risks, legal and regulatory risks, technology risks, and operational risks, including the development of additional risk reporting to the Board. For example, a working group comprised of Independent Trustees and FMR has worked and continues to work to review the Fidelity funds' valuation-related activities, reporting and risk management. Appropriate personnel, including but not limited to the fund's Chief Compliance Officer (CCO), FMR's internal auditor, the independent accountants, the fund's Treasurer and portfolio management personnel, make periodic reports to the Board's committees, as appropriate, including an annual review of FMR's risk management program for the Fidelity funds. The responsibilities of each standing committee, including their oversight responsibilities, are described further under "Standing Committees of the Fund's Trustees."
Annual Report
Trustees and Officers - continued
The fund's Statement of Additional Information (SAI) includes more information about the Trustees. To request a free copy, call Fidelity at 1-877-208-0098.
Interested Trustees*:
Correspondence intended for each Trustee who is an interested person may be sent to Fidelity Investments, 82 Devonshire Street, Boston, Massachusetts 02109.
Name, Age; Principal Occupations and Other Relevant Experience+ |
James C. Curvey (77) |
| Year of Election or Appointment: 2007 Mr. Curvey is Trustee and Chairman of the Board of Trustees of certain Trusts. Mr. Curvey also serves as Trustee (2007-present) of other investment companies advised by FMR. Mr. Curvey is a Director of Fidelity Investments Money Management, Inc. (2009-present), Director of Fidelity Research & Analysis Co. (2009-present) and Director of FMR and FMR Co., Inc. (2007-present). Mr. Curvey is also Vice Chairman (2007-present) and Director of FMR LLC. In addition, Mr. Curvey serves as an Overseer for the Boston Symphony Orchestra and a member of the Trustees of Villanova University. Previously, Mr. Curvey was the Vice Chairman (2006-2007) and Director (2000-2007) of FMR Corp. |
Ronald P. O'Hanley (55) |
| Year of Election or Appointment: 2011 Mr. O'Hanley is Director of FMR Co., Inc. (2010-present), Director of Fidelity Investments Money Management, Inc. (2010-present), Director of Fidelity Research & Analysis Company (2010-present), President of Fidelity Asset Management and Corporate Services and a member of Fidelity's Executive Committee (2010-present). Previously, Mr. O'Hanley served as President and Chief Executive Officer of BNY Mellon Asset Management (2007-2010). Mr. O'Hanley also served as Vice Chairman of Bank New York Mellon Corp. and a member of that firm's Executive Committee. Prior to the 2007 merger of The Bank of New York and Mellon Financial Corporation, he was Vice Chairman of Mellon Financial Corporation and President and Chief Executive Officer of Mellon Asset Management. He joined Mellon in February 1997. Mr. O'Hanley currently serves as Chairman of the Boston Public Library Foundation Board of Directors and sits on the Board of Directors of Beth Israel Deaconess Medical Center, the Board of Trustees of the Marine Biological Laboratory and the Advisory Board of the Maxwell School of Citizenship and Public Administration at Syracuse University. Mr. O'Hanley also chairs the Council on Asset Management for the Financial Services Roundtable and is a member of the Board of Directors of Institutional Investor's U.S. Institute. |
* Trustees have been determined to be "Interested Trustees" by virtue of, among other things, their affiliation with the trust or various entities under common control with FMR.
+ The information above includes each Trustee's principal occupation during the last five years and other information relating to the experience, attributes, and skills relevant to each Trustee's qualifications to serve as a Trustee, which led to the conclusion that each Trustee should serve as a Trustee for the fund.
Annual Report
Trustees and Officers - continued
Independent Trustees:
Correspondence intended for each Independent Trustee (that is, the Trustees other than the Interested Trustees) may be sent to Fidelity Investments, P.O. Box 55235, Boston, Massachusetts 02205-5235.
Name, Age; Principal Occupations and Other Relevant Experience+ |
Dennis J. Dirks (64) |
| Year of Election or Appointment: 2005 Prior to his retirement in May 2003, Mr. Dirks was Chief Operating Officer and a member of the Board of The Depository Trust & Clearing Corporation (DTCC). He also served as President, Chief Operating Officer, and Board member of The Depository Trust Company (DTC) and President and Board member of the National Securities Clearing Corporation (NSCC). In addition, Mr. Dirks served as Chief Executive Officer and Board member of the Government Securities Clearing Corporation, Chief Executive Officer and Board member of the Mortgage-Backed Securities Clearing Corporation, as a Trustee and a member of the Finance Committee of Manhattan College (2005-2008), and as a Trustee and a member of the Finance Committee of AHRC of Nassau County (2006-2008). Mr. Dirks is a member of the Independent Directors Council (IDC) Governing Council (2010-present) and Board of Directors for The Brookville Center for Children's Services, Inc. (2009-present). |
Alan J. Lacy (59) |
| Year of Election or Appointment: 2008 Mr. Lacy serves as Senior Adviser (2007-present) of Oak Hill Capital Partners, L.P. (private equity). Mr. Lacy also served as Chief Executive Officer (2000-2005) and Vice Chairman (2005-2006) of Sears Holdings Corporation and Sears, Roebuck and Co. (retail). In addition, Mr. Lacy serves as a member of the Board of Directors of Dave & Buster's Entertainment, Inc. (restaurant and entertainment complexes, 2010-present), Earth Fare, Inc. (retail grocery, 2012-present), The Hillman Companies, Inc. (hardware wholesalers, 2010-present), and Bristol-Myers Squibb Company (global pharmaceuticals, 2008-present). Mr. Lacy is a member of the Board of Trustees of The National Parks Conservation Association (2006-present). Previously, Mr. Lacy served as Chairman of the Board of Trustees of the National Parks Conservation Association (2008-2011) and as a member of the Board of Directors for the Western Union Company (global money transfer, 2006-2011). |
Ned C. Lautenbach (68) |
| Year of Election or Appointment: 2000 Mr. Lautenbach is Chairman of the Independent Trustees of the Equity and High Income Funds (2006-present). Mr. Lautenbach currently serves as the Lead Director of the Eaton Corporation Board of Directors (diversified industrial, 1997-present). Mr. Lautenbach is Chairman of the Board of Directors of the Philharmonic Center for the Arts in Naples, Florida (2012-present) and a member of the Council on Foreign Relations (1994-present). Previously, Mr. Lautenbach was a Partner/Advisory Partner at Clayton, Dubilier & Rice, LLC (private equity investment, 1998-2010), as well as a Director of Sony Corporation (2006-2007). |
Joseph Mauriello (68) |
| Year of Election or Appointment: 2008 Prior to his retirement in January 2006, Mr. Mauriello served in numerous senior management positions including Deputy Chairman and Chief Operating Officer (2004-2005), and Vice Chairman of Financial Services (2002-2004) of KPMG LLP US (professional services, 1965-2005). Mr. Mauriello currently serves as a member of the Board of Directors of XL Group plc. (global insurance and re-insurance, 2006-present). Previously, Mr. Mauriello served as a Director of the Hamilton Funds of the Bank of New York (2006-2007) and of Arcadia Resources Inc. (health care services and products, 2007-2012). |
Robert W. Selander (62) |
| Year of Election or Appointment: 2011 Previously, Mr. Selander served as a Member of the Advisory Board of Fidelity's Equity and High Income Funds (2011), Executive Vice Chairman (2010), Chief Executive Officer (2009-2010), and President and Chief Executive Officer (1997-2009) of Mastercard, Inc. |
Cornelia M. Small (68) |
| Year of Election or Appointment: 2005 Ms. Small is a member of the Board of Directors (2009-present) and Chair of the Investment Committee (2010-present) of the Teagle Foundation. Ms. Small also serves on the Investment Committee of the Berkshire Taconic Community Foundation (2008-present). Previously, Ms. Small served as Chairperson (2002-2008) and a member of the Investment Committee and Chairperson (2008-2012) and a member of the Board of Trustees of Smith College. In addition, Ms. Small served as Chief Investment Officer, Director of Global Equity Investments, and a member of the Board of Directors of Scudder, Stevens & Clark and Scudder Kemper Investments. |
William S. Stavropoulos (73) |
| Year of Election or Appointment: 2001 Mr. Stavropoulos is Vice Chairman of the Independent Trustees of the Equity and High Income Funds (2006-present). Mr. Stavropoulos serves as President and Founder of the Michigan Baseball Foundation, the Great Lakes Loons (2007-present). Mr. Stavropoulos is Chairman Emeritus of the Board of Directors of The Dow Chemical Company, where he previously served in numerous senior management positions, including President, CEO (1995-2000; 2002-2004), Chairman of the Executive Committee (2000-2006), and as a member of the Board of Directors (1990-2006). Currently, Mr. Stavropoulos is a Director of Univar Inc. (global distributor of commodity and specialty chemicals, Chairman from 2010-May 2012 and Lead Director from May 2012-present), Teradata Corporation (data warehousing and technology solutions, 2008-present), Maersk Inc. (industrial conglomerate), and Tyco International, Ltd. (multinational manufacturing and services, 2007-present), and a member of the Advisory Board for Metalmark Capital LLC (private equity investment, 2005-present). Mr. Stavropoulos is an operating advisor to Clayton, Dubilier & Rice, LLC (private equity investment). In addition, Mr. Stavropoulos is a member of the University of Notre Dame Advisory Council for the College of Science, a Trustee of the Rollin L. Gerstacker Foundation, and a Director of the Naples Philharmonic Center for the Arts. Previously, Mr. Stavropoulos served as a Director of Chemical Financial Corporation (bank holding company, 1993-2012). |
David M. Thomas (63) |
| Year of Election or Appointment: 2008 Previously, Mr. Thomas served as Executive Chairman (2005-2006) and Chairman and Chief Executive Officer (2000-2005) of IMS Health, Inc. (pharmaceutical and healthcare information solutions), and a Director of Fortune Brands, Inc. (consumer products, 2000-2011). In addition, Mr. Thomas serves as Non-Executive Chairman of the Board of Directors of Fortune Brands Home and Security (home and security products, 2011-present), and as a member of the Board of Directors of Interpublic Group of Companies, Inc. (marketing communication, 2004-present). |
Michael E. Wiley (62) |
| Year of Election or Appointment: 2008 Mr. Wiley also serves as a Director of Asia Pacific Exploration Consolidated (international oil and gas exploration and production, 2008-present). Mr. Wiley serves as a Director of Tesoro Corporation (independent oil refiner and marketer, 2005-present), and a Director of Bill Barrett Corporation (exploration and production, 2005-present). In addition, Mr. Wiley also serves as a Director of Post Oak Bank (privately-held bank, 2004-present). Previously, Mr. Wiley served as a member of the Board of Trustees of the University of Tulsa (2000-2006; 2007-2010), as a Senior Energy Advisor of Katzenbach Partners, LLC (consulting, 2006-2007), as an Advisory Director of Riverstone Holdings (private investment), Chairman, President, and CEO of Baker Hughes, Inc. (oilfield services, 2000-2004), and as Director of Spinnaker Exploration Company (exploration and production, 2001-2005). |
+ The information above includes each Trustee's principal occupation during the last five years and other information relating to the experience, attributes, and skills relevant to each Trustee's qualifications to serve as a Trustee, which led to the conclusion that each Trustee should serve as a Trustee for the fund.
Advisory Board Members and Executive Officers:
Correspondence intended for David A. Rosow and Garnett A. Smith may be sent to Fidelity Investments, P.O. Box 55235, Boston, Massachusetts 02205-5235. Correspondence intended for each executive officer, Edward C. Johnson 3d, and Peter S. Lynch may be sent to Fidelity Investments, 82 Devonshire Street, Boston, Massachusetts 02109.
Name, Age; Principal Occupation |
Edward C. Johnson 3d (82) |
| Year of Election or Appointment: 2011 Member of the Advisory Board of Fidelity's Equity and High Income Funds. Mr. Johnson serves as Chief Executive Officer, Chairman, and a Director of FMR LLC, and also serves as Chairman and Director of FIL Limited. Previously, Mr. Johnson served as a Trustee and Chairman of the Board of certain Fidelity Trusts, Chairman and a Director of FMR, Chairman and a Director of FMR Co., Inc., and President of FMR LLC (2006-2007). |
Peter S. Lynch (68) |
| Year of Election or Appointment: 2003 Member of the Advisory Board of Fidelity's Equity and High Income Funds. Mr. Lynch is Vice Chairman and a Director of FMR and FMR Co., Inc. In addition, Mr. Lynch serves as a Trustee of Boston College and as the Chairman of the Inner-City Scholarship Fund. Previously, Mr. Lynch served on the Special Olympics International Board of Directors (1997-2006). |
David A. Rosow (70) |
| Year of Election or Appointment: 2012 Member of the Advisory Board of Fidelity's Equity and High Income Funds. Chairman and Chief Executive Officer of International Golf Group, Inc. (golf course development, 1989-present). Previously, Mr. Rosow served as Chairman and Chief Executive Officer of Rosow & Company, Inc. (private investment company, 1989-2011), a Lead Director of Hudson United Bancorp (2001-2006) and as a Director of TD Banknorth (1996-2006). In addition, Mr. Rosow is a member (2008-present) and President (2009-present) of the Town Council of Palm Beach, Florida. |
Garnett A. Smith (65) |
| Year of Election or Appointment: 2012 Member of the Advisory Board of Fidelity's Equity and High Income Funds. Prior to Mr. Smith's retirement, he served as Chairman and Chief Executive Officer of Inbrand Corp. (manufacturer of personal absorbent products, 1990-1997). He also served as President (1986-1990) of Inbrand Corp. Prior to his employment with Inbrand Corp., he was employed by a retail fabric chain and North Carolina National Bank. In addition, Mr. Smith is a board member of the Jackson Hole Land Trust (2009-present). |
Kenneth B. Robins (43) |
| Year of Election or Appointment: 2008 President and Treasurer of Fidelity's Equity and High Income Funds. Mr. Robins also serves as President and Treasurer (2010-present) and Assistant Treasurer (2009-present) of other Fidelity funds and is an employee of Fidelity Investments (2004-present). Previously, Mr. Robins served as Deputy Treasurer of the Fidelity funds (2005-2008) and Treasurer and Chief Financial Officer of The North Carolina Capital Management Trust: Cash and Term Portfolios (2006-2008). |
Brian B. Hogan (48) |
| Year of Election or Appointment: 2009 Vice President of Equity and High Income Funds. Mr. Hogan also serves as President of FMR's Equity Division (2009-present). Previously, Mr. Hogan served as Senior Vice President, Equity Research of FMR (2006-2009) and as a portfolio manager. |
Thomas C. Hense (48) |
| Year of Election or Appointment: 2008 or 2010 Vice President of Fidelity's High Income (2008), Small Cap (2008), and Value (2010) Funds. Previously, Mr. Hense served as a portfolio manager for Fidelity's Institutional Money Management Group (Pyramis) (2003-2008). |
Scott C. Goebel (44) |
| Year of Election or Appointment: 2008 Secretary and Chief Legal Officer (CLO) of the Fidelity funds. Mr. Goebel also serves as Secretary of Fidelity Investments Money Management, Inc. (FIMM) (2010-present) and Fidelity Research and Analysis Company (FRAC) (2010-present); Secretary and CLO of The North Carolina Capital Management Trust: Cash and Term Portfolios (2008-present); General Counsel, Secretary, and Senior Vice President of FMR (2008-present) and FMR Co., Inc. (2008-present); employed by FMR LLC or an affiliate (2001-present); Chief Legal Officer of Fidelity Management & Research (Hong Kong) Limited (2008-present) and Assistant Secretary of Fidelity Management & Research (Japan) Inc. (2008-present), and Fidelity Management & Research (U.K.) Inc. (2008-present). Previously, Mr. Goebel served as Assistant Secretary of FIMM (2008-2010), FRAC (2008-2010), and the Funds (2007-2008) and as Vice President and Secretary of Fidelity Distributors Corporation (FDC) (2005-2007). |
William C. Coffey (43) |
| Year of Election or Appointment: 2009 Assistant Secretary of Fidelity's Equity and High Income Funds. Mr. Coffey also serves as Senior Vice President and Deputy General Counsel of FMR LLC (2010-present), and is an employee of Fidelity Investments. Previously, Mr. Coffey served as Vice President and Associate General Counsel of FMR LLC (2005-2009). |
Elizabeth Paige Baumann (44) |
| Year of Election or Appointment: 2012 Anti-Money Laundering (AML) Officer of the Fidelity funds. Ms. Baumann also serves as AML Officer of The North Carolina Capital Management Trust: Cash and Term Portfolios (2012-present), Chief AML Officer of FMR LLC (2012-present), and is an employee of Fidelity Investments. Previously, Ms. Baumann served as Vice President and Deputy Anti-Money Laundering Officer (2007-2012). |
Christine Reynolds (54) |
| Year of Election or Appointment: 2008 Chief Financial Officer of the Fidelity funds. Ms. Reynolds became President of Fidelity Pricing and Cash Management Services (FPCMS) in August 2008. Ms. Reynolds served as Chief Operating Officer of FPCMS (2007-2008). Previously, Ms. Reynolds served as President, Treasurer, and Anti-Money Laundering officer of the Fidelity funds (2004-2007). |
Joseph A. Hanlon (44) |
| Year of Election or Appointment: 2012 Chief Compliance Officer of Fidelity's Equity and High Income Funds. Mr. Hanlon serves as Compliance Officer of FMR, FMR Co., Inc., Fidelity Investments Money Management, Inc. (FIMM), Fidelity Research and Analysis Company (FRAC), Fidelity Management & Research (Japan) Inc., Fidelity Management & Research (U.K.) Inc., Fidelity Management & Research (Hong Kong), and Strategic Advisers, Inc. (2009-present), as Senior Vice President of the Fidelity Asset Management Division (2009-present), and is an employee of Fidelity Investments. |
Joseph F. Zambello (55) |
| Year of Election or Appointment: 2011 Deputy Treasurer of the Fidelity funds. Mr. Zambello is an employee of Fidelity Investments. Previously, Mr. Zambello served as Vice President of FMR's Program Management Group (2009-2011) and Vice President of the Transfer Agent Oversight Group (2005-2009). |
Adrien E. Deberghes (45) |
| Year of Election or Appointment: 2008 Deputy Treasurer of Fidelity's Equity and High Income Funds. Mr. Deberghes also serves as Vice President (2011-present) and Assistant Treasurer (2010-present) of other Fidelity funds, and is an employee of Fidelity Investments (2008-present). Previously, Mr. Deberghes served as Senior Vice President of Mutual Fund Administration at State Street Corporation (2007-2008), Senior Director of Mutual Fund Administration at Investors Bank & Trust (2005-2007), and Director of Finance for Dunkin' Brands (2000-2005). |
Stephen Sadoski (41) |
| Year of Election or Appointment: 2012 Deputy Treasurer of Fidelity's Equity and High Income Funds. Mr. Sadoski also serves as Assistant Treasurer of other Fidelity funds (2012-present) and is an employee of Fidelity Investments (2012-present). Previously, Mr. Sadoski served as an assistant chief accountant in the Division of Investment Management of the Securities and Exchange Commission (SEC) (2009-2012) and as a senior manager at Deloitte & Touche (1997-2009). |
Stephanie J. Dorsey (43) |
| Year of Election or Appointment: 2010 Assistant Treasurer of Fidelity's Equity and High Income Funds. Ms. Dorsey also serves as Deputy Treasurer of other Fidelity funds (2008-present) and is an employee of Fidelity Investments (2008-present). Previously, Ms. Dorsey served as Treasurer (2004-2008) of the JPMorgan Mutual Funds and Vice President (2004-2008) of JPMorgan Chase Bank. |
John R. Hebble (54) |
| Year of Election or Appointment: 2009 Assistant Treasurer of Fidelity's Equity and High Income Funds. Mr. Hebble also serves as President (2011-present), Treasurer, and Chief Financial Officer of The North Carolina Capital Management Trust: Cash and Term Portfolios (2008-present), President and Treasurer of other Fidelity funds (2008-present) and is an employee of Fidelity Investments. |
Gary W. Ryan (54) |
| Year of Election or Appointment: 2005 Assistant Treasurer of the Fidelity funds. Mr. Ryan is an employee of Fidelity Investments. Previously, Mr. Ryan served as Vice President of Fund Reporting in Fidelity Pricing and Cash Management Services (FPCMS) (1999-2005). |
Jonathan Davis (44) |
| Year of Election or Appointment: 2010 Assistant Treasurer of the Fidelity funds. Mr. Davis is also Assistant Treasurer of Fidelity Rutland Square Trust II and Fidelity Commonwealth Trust II. Mr. Davis is an employee of Fidelity Investments. Previously, Mr. Davis served as Vice President and Associate General Counsel of FMR LLC (2003-2010). |
Annual Report
Class A, Class T, Class B and Class C designate 100% of the dividends distributed during the fiscal year as qualifying for the dividends-received deduction for corporate shareholders.
Class A, Class T, Class B and Class C designate 100% of the dividends distributed during the fiscal year as amounts which may be taken into account as a dividend for purposes of the maximum rate under section 1(h)(11) of the Internal Revenue Code.
The fund will notify shareholders in January 2013 of amounts for use in preparing 2012 income tax returns.
Annual Report
Board Approval of Investment Advisory Contracts and Management Fees
Fidelity Advisor Value Leaders Fund
Each year, the Board of Trustees, including the Independent Trustees (together, the Board), votes on the renewal of the management contract and sub-advisory agreements (together, the Advisory Contracts) for the fund. The Board, assisted by the advice of fund counsel and Independent Trustees' counsel, requests and considers a broad range of information relevant to the renewal of the Advisory Contracts throughout the year.
The Board meets regularly and, at each of its meetings, considers factors that are relevant to its annual consideration of the renewal of the fund's Advisory Contracts, including the services and support provided to the fund and its shareholders. The Board has established various standing committees, each composed of and chaired by Independent Trustees with varying backgrounds, to which the Board has assigned specific subject matter responsibilities in order to enhance effective decision-making by the Board. The Board, acting directly and through its Committees, requests and receives information concerning the annual consideration of the renewal of the fund's Advisory Contracts. The Board also meets as needed to consider matters specifically related to the Board's annual consideration of the renewal of Advisory Contracts. Members of the Board may also meet with trustees of other Fidelity funds through ad hoc joint committees to discuss certain matters relevant to the Fidelity funds.
At its July 2012 meeting, the Board of Trustees, including the Independent Trustees, unanimously determined to renew the fund's Advisory Contracts. In reaching its determination, the Board considered all factors it believed relevant, including (i) the nature, extent, and quality of the services to be provided to the fund and its shareholders (including the investment performance of the fund); (ii) the competitiveness of the fund's management fee and total expense ratio relative to peer funds; (iii) the total costs of the services to be provided by and the profits to be realized by Fidelity from its relationship with the fund; (iv) the extent to which economies of scale exist and would be realized as the fund grows; and (v) whether fee levels reflect these economies of scale, if any, for the benefit of fund shareholders.
In considering whether to renew the Advisory Contracts for the fund, the Board reached a determination, with the assistance of fund counsel and Independent Trustees' counsel and through the exercise of its business judgment, that the renewal of the Advisory Contracts is in the best interests of the fund and its shareholders and that the compensation payable under the Advisory Contracts is fair and reasonable. The Board's decision to renew the Advisory Contracts was not based on any single factor, but rather was based on a comprehensive consideration of all the information provided to the Board at its meetings throughout the year. The Board, in reaching its determination to renew the Advisory Contracts, is aware that shareholders in the fund have a broad range of investment choices available to them, including a wide choice among mutual funds offered by Fidelity's competitors, and that the fund's shareholders, who have the opportunity to review and weigh the disclosure provided by the fund in its prospectus and other public disclosures, have chosen to invest in this fund, managed by Fidelity.
Annual Report
Board Approval of Investment Advisory Contracts and
Management Fees - continued
Nature, Extent, and Quality of Services Provided. The Board considered the staffing within the investment adviser, FMR, and the sub-advisers (together, the Investment Advisers), including the backgrounds of the fund's investment personnel, and also considered the fund's investment objective, strategies, and related investment philosophy. The Independent Trustees also had discussions with senior management of Fidelity's investment operations and investment groups. The Board considered the structure of the portfolio manager compensation program and whether this structure provides appropriate incentives to act in the best interests of the fund.
Resources Dedicated to Investment Management and Support Services. The Board and the Fund Oversight and Research Committees reviewed the general qualifications and capabilities of the Investment Advisers' investment staff, including its size, education, experience, and resources, as well as the Investment Advisers' approach to recruiting, training, managing, and compensating investment personnel. The Board also noted that FMR has continued to increase the resources devoted to non-U.S. offices, including expansion of Fidelity's global investment organization. The Board noted that Fidelity's analysts have extensive resources, tools and capabilities that allow them to conduct sophisticated quantitative and fundamental analysis, as well as credit analysis of issuers, counterparties and guarantors. The Board also believes that Fidelity's investment professionals have sufficient access to global information and data so as to provide competitive investment results over time, and that those professionals also have access to sophisticated tools that permit them to assess portfolio construction and risk and performance attribution characteristics continuously, as well as to transmit new information and research conclusions rapidly around the world. Additionally, in its deliberations, the Board considered the Investment Advisers' trading and risk management capabilities and resources, which are an integral part of the investment management process.
Shareholder and Administrative Services. The Board considered (i) the nature, extent, quality, and cost of advisory, administrative, and shareholder services performed by the Investment Advisers and their affiliates under the Advisory Contracts and under separate agreements covering transfer agency, pricing and bookkeeping, and securities lending services for the fund; (ii) the nature and extent of the supervision of third party service providers, principally custodians and subcustodians; and (iii) the resources devoted to, and the record of compliance with, the fund's compliance policies and procedures. The Board also reviewed the allocation of fund brokerage, including allocations to brokers affiliated with the Investment Advisers, the use of brokerage commissions to pay fund expenses, and the use of "soft" commission dollars to pay for research services.
Annual Report
The Board noted that the growth of fund assets over time across the complex allows Fidelity to reinvest in the development of services designed to enhance the value or convenience of the Fidelity funds as investment vehicles. These services include 24-hour access to account information and market information through telephone representatives and over the Internet, investor education materials and asset allocation tools, and the expanded availability of Fidelity Investor Centers.
Investment in a Large Fund Family. The Board considered the benefits to shareholders of investing in a Fidelity fund, including the benefits of investing in a fund that is part of a large family of funds offering a variety of investment disciplines and providing a large variety of mutual fund investor services. The Board noted that Fidelity had taken, or had made recommendations that resulted in the Fidelity funds taking, a number of actions over the previous year that benefited particular funds, including (i) continuing to dedicate additional resources to investment research and support of the senior management team that oversees asset management; (ii) persisting in efforts to enhance Fidelity's research capabilities, in particular, international research; (iii) launching new funds and making other enhancements to meet client needs for global and income-oriented solutions; (iv) continuing to launch dedicated lower cost underlying funds to meet investment management's portfolio construction needs related to expanding underlying fund options, specifically for the Freedom Fund product lines; (v) adopting a "Stock Selector" sector neutral investment approach and employing a team of portfolio managers who are sector specialists to manage certain funds; (vi) rationalizing product lines and gaining increased efficiencies through the mergers of several funds into other funds; (vii) strengthening the Spartan Index Fund product line by adding new funds and/or new low-cost institutional share classes, restructuring fund expenses to accommodate new classes, and reducing investment minimums for certain classes of shares; (viii) modifying the eligibility criteria for Institutional Class shares to increase their appeal to government entities and charitable investors; and (ix) reducing certain transfer agent fee rates.
Investment Performance. The Board considered whether the fund has operated in accordance with its investment objective, as well as its record of compliance with its investment restrictions. It also reviewed the fund's absolute investment performance for each class, as well as the fund's relative investment performance for each class measured over multiple periods against (i) a broad-based securities market index, and (ii) a peer group of mutual funds deemed appropriate by Fidelity and reviewed by the Board. The following charts considered by the Board show, over the one-, three-, and five-year periods ended December 31, 2011, the cumulative total returns of Institutional Class (Class I) and Class C of the fund, the cumulative total returns of a broad-based securities market index ("benchmark"), and a range of cumulative total returns of a peer group of mutual funds identified by Morningstar, Inc. as having an investment style similar to that of the fund based on underlying portfolio holdings. The returns of Institutional Class (Class I) and Class C show the performance of the highest and lowest performing classes, respectively (based on five-year performance). The box within each chart shows the 25th percentile return (top of box) and the 75th percentile return (bottom of box) of the peer group. Returns shown above the box are in the first quartile and returns shown below the box are in the fourth quartile. The percentage beaten numbers noted below each chart correspond to the percentile box and represent the percentage of funds in the peer group whose performance was equal to or lower than that of the class indicated.
Annual Report
Board Approval of Investment Advisory Contracts and
Management Fees - continued
Fidelity Advisor Value Leaders Fund
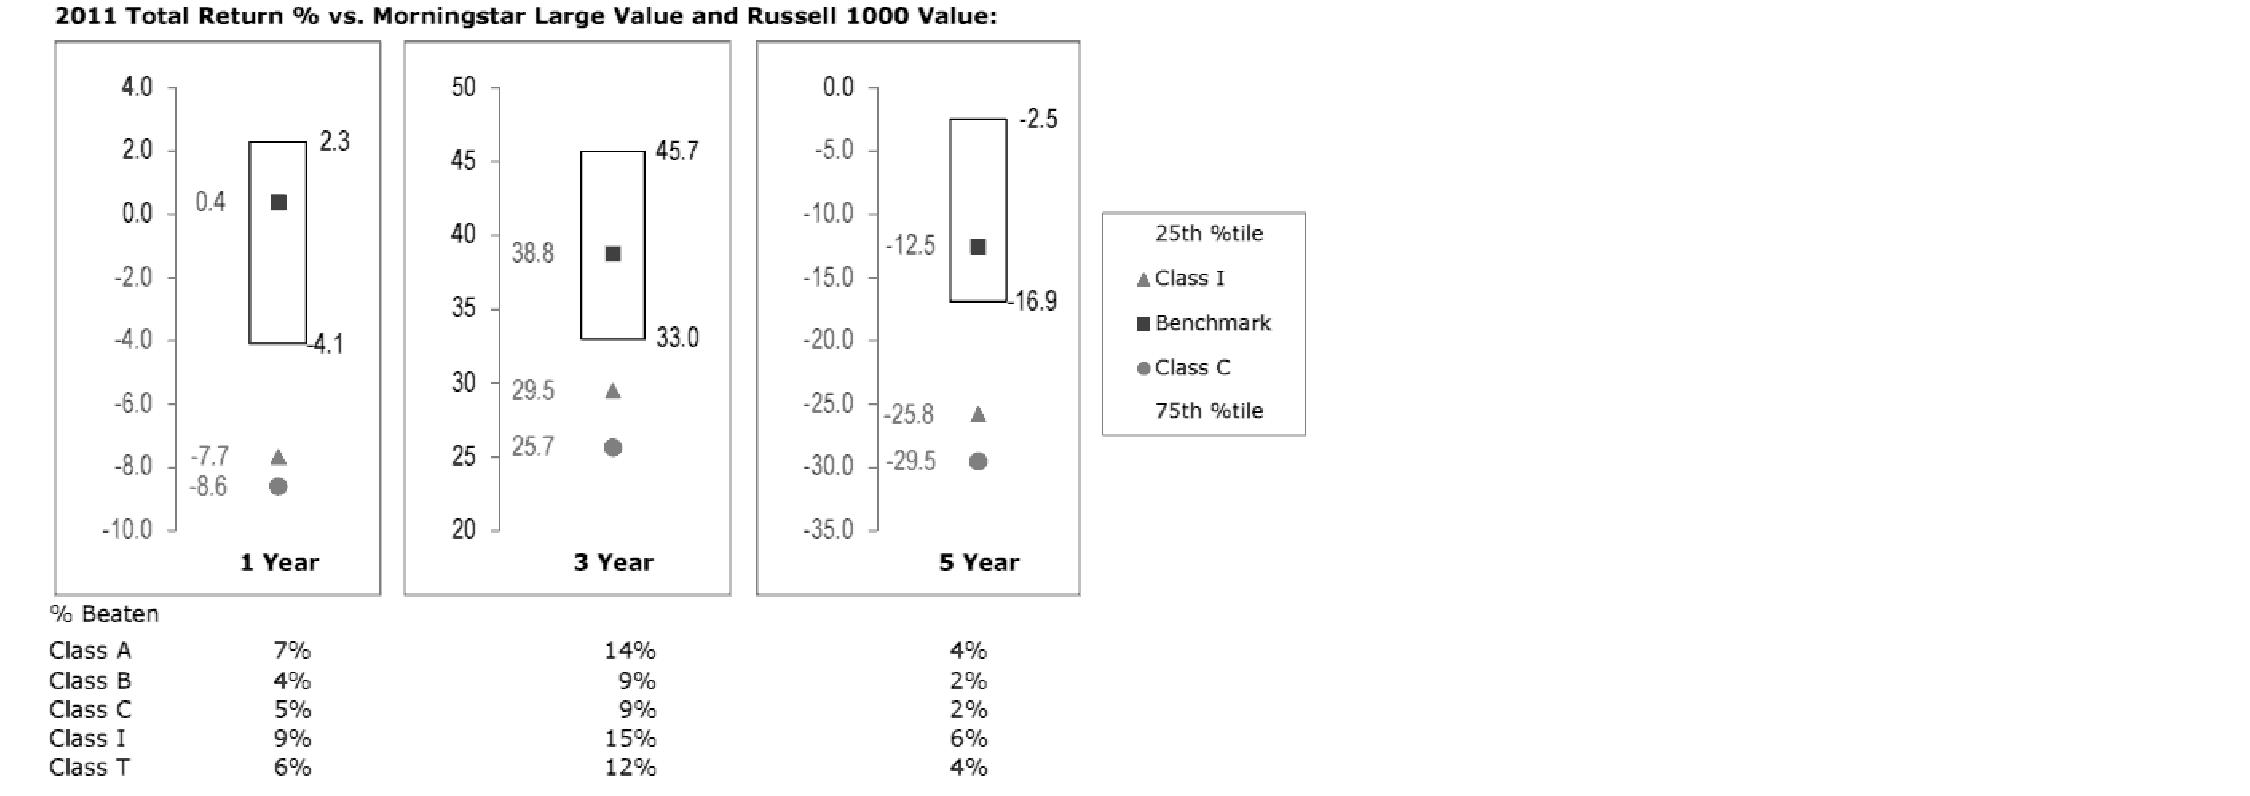
The Board reviewed the fund's relative investment performance against its peer group and noted that the performance of Institutional Class (Class I) of the fund was in the fourth quartile for all the periods shown. The Board also noted that the investment performance of the fund was lower than its benchmark for all the periods shown. The Board considered that the variations in performance among the fund's classes reflect the variations in class expenses, which result in lower performance for higher expense classes. The Board discussed with FMR actions to improve the fund's disappointing performance relative to its peer group and benchmark. The Board noted that this fund had underperformed in the past and discussed with FMR its disappointment with the continued underperformance of the fund. The Board also reviewed the fund's performance since inception as well as performance in the current year. The Board will continue to closely monitor the performance of the fund in the coming year and discuss with FMR other appropriate actions to address the performance of the fund.
The Board also considered that the fund's management fee is subject to upward or downward adjustment depending upon whether, and to what extent, the fund's investment performance for the performance period exceeds, or is exceeded by, the record (over the same period) of a Board-approved performance adjustment index. The Board noted that the performance adjustment provides FMR with a strong economic incentive to seek to achieve superior performance for the fund's shareholders and helps to more closely align the interests of FMR and the fund's shareholders.
Annual Report
Based on its review, the Board concluded that the nature, extent, and quality of services provided to the fund under the Advisory Contracts should benefit the fund's shareholders.
Competitiveness of Management Fee and Total Expense Ratio. The Board considered the fund's management fee and total expense ratio compared to "mapped groups" of competitive funds and classes. Fidelity creates "mapped groups" by combining similar Lipper investment objective categories that have comparable management fee characteristics. Combining Lipper investment objective categories aids the Board's management fee and total expense ratio comparisons by broadening the competitive group used for comparison and by reducing the number of universes to which various Fidelity funds are compared.
Management Fee. The Board considered two proprietary management fee comparisons for the 12-month periods shown in the chart below. The group of Lipper funds used by the Board for management fee comparisons is referred to below as the "Total Mapped Group." The Total Mapped Group comparison focuses on a fund's standing relative to the total universe of comparable funds available to investors in terms of gross management fees before expense reimbursements or caps, and without giving effect to the fund's performance adjustment. "TMG %" represents the percentage of funds in the Total Mapped Group that had management fees that were lower than the fund's. For example, a TMG % of 10% means that 90% of the funds in the Total Mapped Group had higher management fees than the fund. The "Asset-Size Peer Group" (ASPG) comparison focuses on a fund's standing relative to non-Fidelity funds similar in size to the fund within the Total Mapped Group. The ASPG represents at least 15% of the funds in the Total Mapped Group with comparable asset size and management fee characteristics, subject to a minimum of 50 funds (or all funds in the Total Mapped Group if fewer than 50). Additional information, such as the ASPG quartile in which the fund's management fee ranked and the impact of the fund's performance adjustment, is also included in the chart and considered by the Board.
Annual Report
Board Approval of Investment Advisory Contracts and
Management Fees - continued
Fidelity Advisor Value Leaders Fund
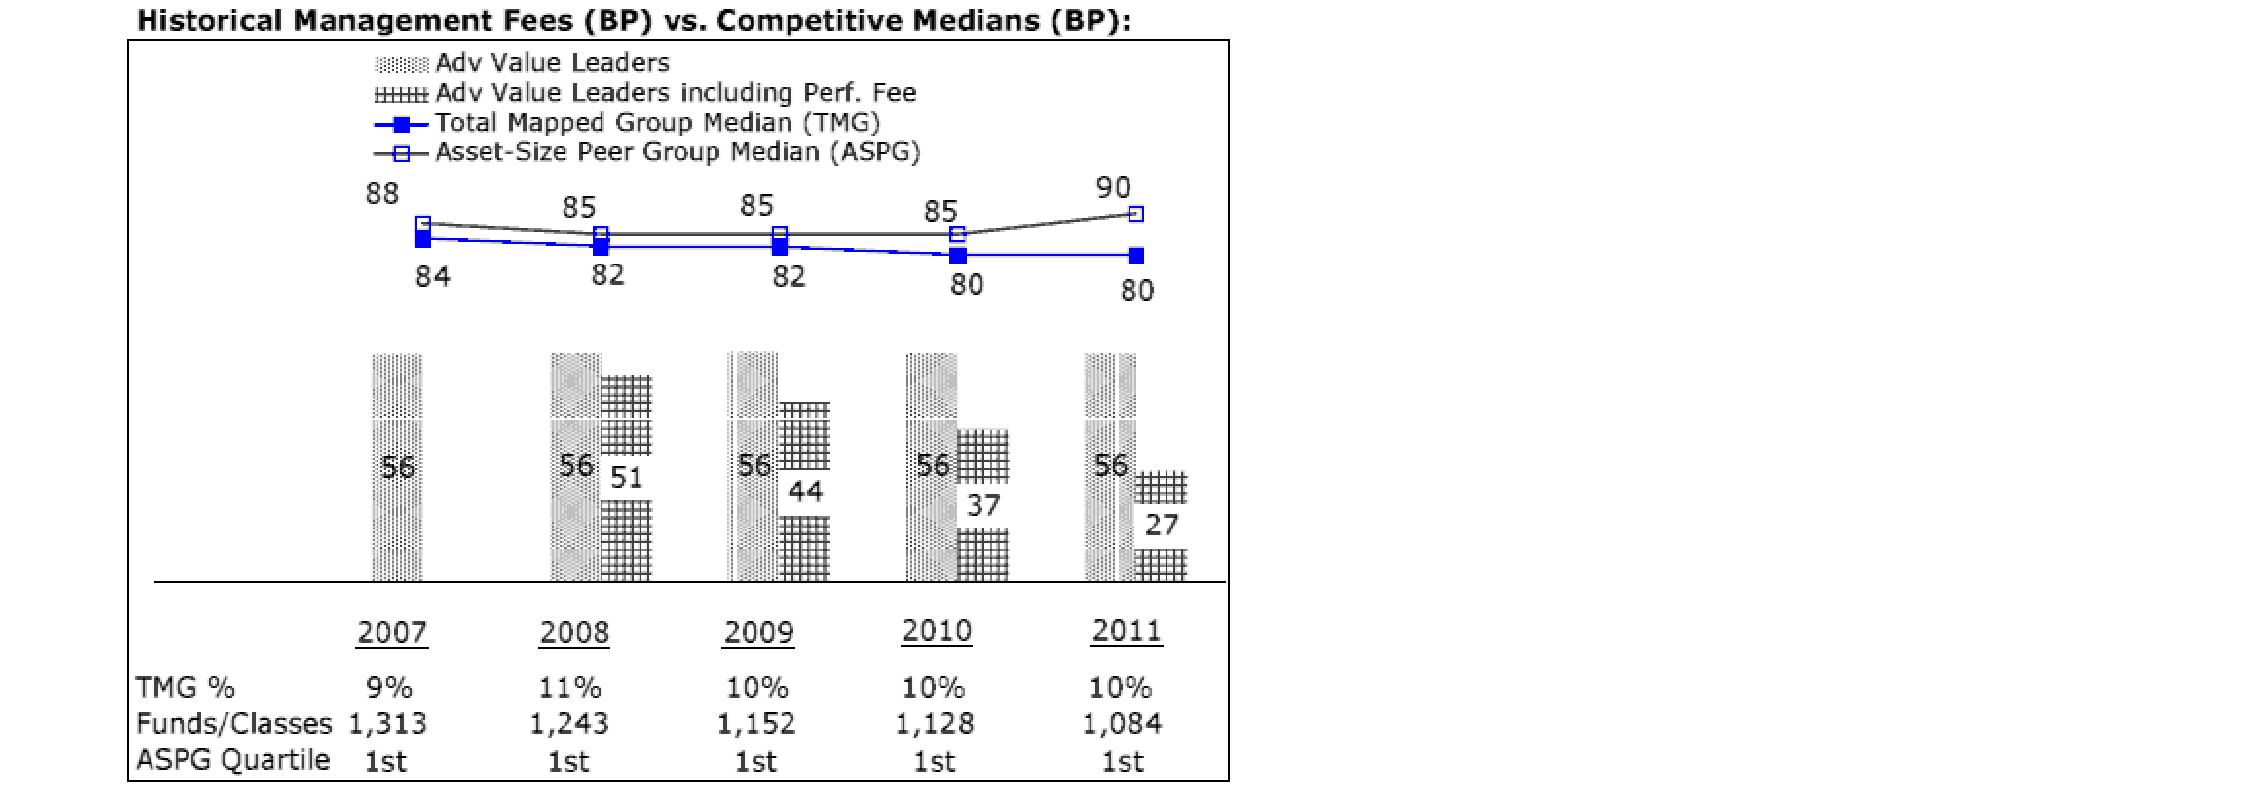
The Board noted that the fund's management fee ranked below the median of its Total Mapped Group and below the median of its ASPG for 2011. The Board also noted the effect of the fund's negative performance adjustment on the fund's management fee ranking. The Board noted that the performance adjustment for each year represents calculations for performance periods that differ from the periods shown in the performance charts above.
Based on its review, the Board concluded that the fund's management fee is fair and reasonable in light of the services that the fund receives and the other factors considered.
Total Expense Ratio. In its review of each class's total expense ratio, the Board considered the fund's management fee as well as other fund or class expenses, as applicable, such as transfer agent fees, pricing and bookkeeping fees, fund-paid 12b-1 fees, and custodial, legal, and audit fees. The Board also noted the effects of any waivers and reimbursements on fees and expenses, as well as the impact of the fund's performance adjustment. As part of its review, the Board also considered the current and historical total expense ratios of each class of the fund compared to competitive fund median expenses. Each class of the fund is compared to those funds and classes in the Total Mapped Group (used by the Board for management fee comparisons) that have a similar sales load structure.
The Board noted that the total expense ratio of each of Class A, Class B, and Institutional Class ranked below its competitive median for 2011 and the total expense ratio of each of Class T and Class C ranked above its competitive median for 2011. The Board considered that various factors, including 12b-1 fees, positive or negative performance adjustments, and relatively higher other expenses in the case of small fund size, can affect total expense ratios. The Board noted that the total expense ratio of Class T was above the competitive median primarily because of higher 12b-1 fees on Class T. Class T has a higher 12b-1 fee, but a lower front-end sales charge, than traditionally priced front-end sales charge classes. The Board considered that Class T is primarily sold load-waived in the retirement plan market where its 0.50% 12b-1 fee is comparable to competing no-load, higher 12b-1 fee classes designed specifically for retirement plans. The Board noted that the fund offers multiple classes, each of which has a different sales load and 12b-1 fee structure, and that the multiple structures are intended to offer a range of pricing options for the intermediary market. The Board also noted that the total expense ratios of the classes vary primarily by the level of their 12b-1 fees, although differences in transfer agent fees may also cause expenses to vary from class to class.
Annual Report
Fees Charged to Other Fidelity Clients. The Board also considered Fidelity fee structures and other information with respect to clients of FMR and its affiliates, such as other mutual funds advised or subadvised by FMR or its affiliates, pension plan clients, and other institutional clients. The Board noted the findings of the 2010 ad hoc joint committee (created with the board of other Fidelity funds), which reviewed and compared Fidelity's institutional investment advisory business with its business of providing services to the Fidelity funds, including the differences in services provided, fees charged, and costs incurred, as well as competition in their respective marketplaces.
Based on its review of total expense ratios and fees charged to other Fidelity clients, the Board concluded that the total expense ratio of each class of the fund was reasonable, although in some cases above the median of the universe presented for comparison, in light of the services that the fund and its shareholders receive and the other factors considered.
Costs of the Services and Profitability. The Board considered the revenues earned and the expenses incurred by Fidelity in conducting the business of developing, marketing, distributing, managing, administering and servicing the fund and its shareholders. The Board also considered the level of Fidelity's profits in respect of all the Fidelity funds.
On an annual basis, FMR presents to the Board Fidelity's profitability for the fund. Fidelity calculates the profitability for each fund, as well as aggregate profitability for groups of Fidelity funds and all Fidelity funds, using a series of detailed revenue and cost allocation methodologies which originate with the books and records of Fidelity on which Fidelity's audited financial statements are based. The Audit Committee of the Board reviews any significant changes from the prior year's methodologies.
PricewaterhouseCoopers LLP (PwC), independent registered public accounting firm and auditor to Fidelity and certain Fidelity funds, has been engaged annually by the Board as part of the Board's assessment of Fidelity's profitability analysis. PwC's engagement includes the review and assessment of Fidelity's methodologies used in determining the revenues and expenses attributable to Fidelity's mutual fund business, and completion of agreed-upon procedures surrounding the mathematical accuracy of fund profitability and its conformity to allocation methodologies. After considering PwC's reports issued under the engagement and information provided by Fidelity, the Board concluded that while other allocation methods may also be reasonable, Fidelity's profitability methodologies are reasonable in all material respects.
Annual Report
Board Approval of Investment Advisory Contracts and
Management Fees - continued
The Board also reviewed Fidelity's non-fund businesses and fall-out benefits related to the mutual fund business as well as cases where Fidelity's affiliates may benefit from or be related to the fund's business.
The Board considered the costs of the services provided by and the profits realized by Fidelity in connection with the operation of the fund and was satisfied that the profitability was not excessive in the circumstances.
Economies of Scale. The Board considered whether there have been economies of scale in respect of the management of the Fidelity funds, whether the Fidelity funds (including the fund) have appropriately benefited from any such economies of scale, and whether there is potential for realization of any further economies of scale. The Board considered the extent to which the fund will benefit from economies of scale through increased services to the fund, through waivers or reimbursements, or through fee or expense reductions. The Board also noted that in 2009, it and the board of other Fidelity funds created an ad hoc committee (the Economies of Scale Committee) to analyze whether FMR attains economies of scale in respect of the management and servicing of the Fidelity funds, whether the Fidelity funds have appropriately benefited from such economies of scale, and whether there is potential for realization of any further economies of scale.
The Board recognized that the fund's management contract incorporates a "group fee" structure, which provides for lower group fee rates as total fund assets under FMR's management increase, and for higher group fee rates as total fund assets under FMR's management decrease. FMR calculates the group fee rates based on a tiered asset "breakpoint" schedule that varies based on asset class. The Board considered that the group fee is designed to deliver the benefits of economies of scale to fund shareholders when total Fidelity fund assets increase, even if assets of any particular fund are unchanged or have declined, because some portion of Fidelity's costs are attributable to services provided to all Fidelity funds, and all funds benefit if those costs can be allocated among more assets. The Board concluded that, given the group fee structure, fund shareholders will benefit from lower management fees as assets under FMR's management increase at the fund complex level, regardless of whether Fidelity achieves any such economies of scale.
Annual Report
The Board concluded, taking into account the analysis of the Economies of Scale Committee, that economies of scale, if any, are being appropriately shared between fund shareholders and Fidelity.
Additional Information Requested by the Board. In order to develop fully the factual basis for consideration of the Fidelity funds' Advisory Contracts, the Board requested and received additional information on certain topics, including (i) fund performance trends, actions to be taken by FMR to improve certain funds' overall performance, and Fidelity's long-term strategies for certain funds; (ii) the potential to further rationalize the Fidelity fund lineup with the possibility of achieving savings for the funds and Fidelity; (iii) Fidelity's compensation structure for portfolio managers and other key investment personnel; (iv) the amount of the investment that each portfolio manager has made in the Fidelity fund(s) that he or she manages; (v) the realization of fall-out benefits in certain Fidelity business units; (vi) Fidelity's group fee structures, the potential impact of regulatory changes on such structures, and the rationale for the individual fee rates of certain funds; (vii) fund profitability methodology, including Fidelity's cost allocation methodology, and the impact of certain factors on fund profitability results; (viii) trends regarding industry use of performance fee structures and the possibility of implementing performance fee structures for additional funds; and (ix) the impact of net redemptions from the Fidelity funds.
Based on its evaluation of all of the conclusions noted above, and after considering all factors it believed relevant, the Board ultimately concluded that the advisory fee structures are fair and reasonable, and that the fund's Advisory Contracts should be renewed.
Annual Report
Investment Adviser
Fidelity Management & Research Company
Boston, MA
Investment Sub-Advisers
FMR Co., Inc.
Fidelity Management & Research
(U.K.) Inc.
Fidelity Management & Research
(Hong Kong) Limited
Fidelity Management & Research
(Japan) Inc.
General Distributor
Fidelity Distributors Corporation
Smithfield, RI
Transfer and Service Agents
Fidelity Investments Institutional Operations Company, Inc.
Boston, MA
Fidelity Service Company, Inc.
Boston, MA
Custodian
Brown Brothers Harriman & Company
Boston, MA
(Fidelity Investment logo)(registered trademark)
AVLF-UANN-1212
1.793576.109
(Fidelity Investment logo)(registered trademark)
Fidelity Advisor®
Value Leaders
Fund - Institutional Class
Annual Report
October 31, 2012
(Fidelity Cover Art)
Contents
Performance | (Click Here) | How the fund has done over time. |
Management's Discussion of Fund Performance | (Click Here) | The Portfolio Manager's review of fund performance and strategy. |
Shareholder Expense Example | (Click Here) | An example of shareholder expenses. |
Investment Changes | (Click Here) | A summary of major shifts in the fund's investments over the past six months. |
Investments | (Click Here) | A complete list of the fund's investments with their market values. |
Financial Statements | (Click Here) | Statements of assets and liabilities, operations, and changes in net assets, as well as financial highlights. |
Notes | (Click Here) | Notes to the financial statements. |
Report of Independent Registered Public Accounting Firm | (Click Here) | |
Trustees and Officers | (Click Here) | |
Distributions | (Click Here) | |
Board Approval of Investment Advisory Contracts and Management Fees | (Click Here) | |
To view a fund's proxy voting guidelines and proxy voting record for the 12-month period ended June 30, visit http://www.fidelity.com/proxyvotingresults or visit the Securities and Exchange Commission's (SEC) web site at http://www.sec.gov. You may also call 1-877-208-0098 to request a free copy of the proxy voting guidelines.
Standard & Poor's, S&P and S&P 500 are registered service marks of The McGraw-Hill Companies, Inc. and have been licensed for use by Fidelity Distributors Corporation.
Other third party marks appearing herein are the property of their respective owners.
All other marks appearing herein are registered or unregistered trademarks or service marks of FMR LLC or an affiliated company. © 2012 FMR LLC. All rights reserved.
Annual Report
This report and the financial statements contained herein are submitted for the general information of the shareholders of the fund. This report is not authorized for distribution to prospective investors in the fund unless preceded or accompanied by an effective prospectus.
A fund files its complete schedule of portfolio holdings with the SEC for the first and third quarters of each fiscal year on Form N-Q. Forms N-Q are available on the SEC's web site at http://www.sec.gov. A fund's Forms N-Q may be reviewed and copied at the SEC's Public Reference Room in Washington, DC. Information regarding the operation of the SEC's Public Reference Room may be obtained by calling 1-800-SEC-0330. For a complete list of a fund's portfolio holdings, view the most recent holdings listing, semiannual report, or annual report on Fidelity's web site at http://www.fidelity.com, http://www.advisor.fidelity.com, or http://www.401k.com, as applicable.
NOT FDIC INSURED • MAY LOSE VALUE • NO BANK GUARANTEE
Neither the fund nor Fidelity Distributors Corporation is a bank.
Annual Report
Average annual total return reflects the change in the value of an investment, assuming reinvestment of the class' distributions from dividend income and capital gains (the profits earned upon the sale of securities that have grown in value, if any) and assuming a constant rate of performance each year. The $10,000 table and the fund's returns do not reflect the deduction of taxes that a shareholder would pay on fund distributions or the redemption of fund shares. During periods of reimbursement by Fidelity, a fund's total return will be greater than it would be had the reimbursement not occurred. How a fund did yesterday is no guarantee of how it will do tomorrow.
Average Annual Total Returns
Periods ended October 31, 2012 | Past 1
year | Past 5
years | Life of
fund A |
Institutional Class | 10.30% | -5.66% | 3.22% |
A From June 17, 2003.
$10,000 Over Life of Fund
Let's say hypothetically that $10,000 was invested in Fidelity Advisor® Value Leaders Fund - Institutional Class on June 17, 2003, when the fund started. The chart shows how the value of your investment would have changed, and also shows how the Russell 1000® Value Index performed over the same period.
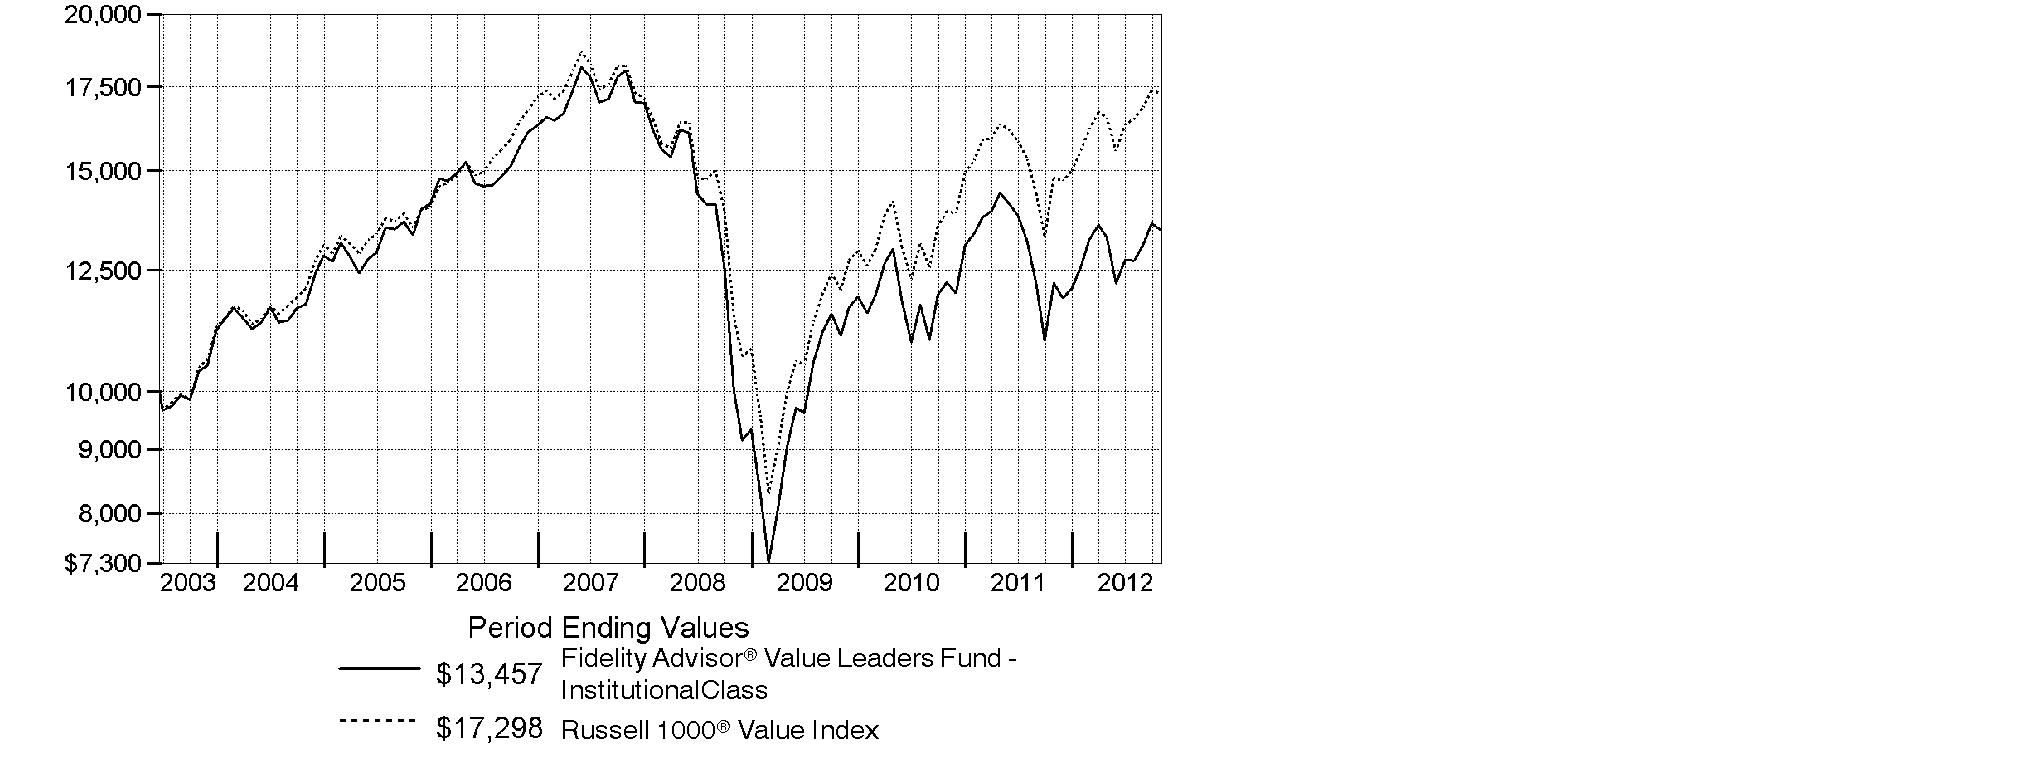
Annual Report
Market Recap: U.S. stocks overcame bouts of volatility to post strong gains for the year ending October 31, 2012, and extend an uptrend that began in March 2009. The broad-based S&P 500® Index advanced 15.21% for the 12-month period, while the blue-chip-laden Dow Jones Industrial AverageSM and technology-heavy Nasdaq Composite® Index rose 12.56% and 12.21%, respectively. Debt problems in Europe, slower growth in China and uncertainty about a U.S. economic recovery put downward pressure on stocks early on and during a turbulent spring. However, beginning in June, stocks rose on central bank stimulus, steps to repair the eurozone and signs of life in the U.S. housing market. Equity benchmarks hit multiyear highs in September, with the Dow and the S&P® achieving their best marks since 2007, and the Nasdaq reaching a 12-year high. Stocks retreated in October, which was marked by disappointing corporate earnings reports and a two-day weather-related closure of the New York Stock Exchange. Among the 10 sectors that comprise the S&P 500®, most posted a double-digit gain, led by telecommunication services (+26%) and health care (+22%), with energy (+7%) and materials (+7%) lagging the most. Despite lingering eurozone turmoil and weaker local currencies versus the U.S. dollar, foreign developed-markets stocks rose modestly, with the MSCI® EAFE® Index adding 4.76%.
Comments from Michael Chren, Portfolio Manager of Fidelity Advisor® Value Leaders Fund: For the year, the fund's Institutional Class shares returned 10.30%, significantly underperforming the 16.89% gain of the Russell® 1000 Value Index. By far, the biggest source of underperformance was the information technology sector, led by a stake in Alcatel-Lucent, a French manufacturer of network communications equipment that failed to deliver on key financial targets. Other disappointments in tech included personal computer/printer manufacturer Hewlett-Packard, semiconductor maker Advanced Micro Devices and software/services provider Comverse Technology. A large overweighting in department store retailer JCPenney hurt because the company's turnaround plan failed to gain traction. Stock picking in energy also detracted, as did the fund's cash position. On the positive side, favorable positioning in health care helped, including holdings in large drug manufacturers Pfizer and Merck. Other key contributors were consumer staples giant Kraft Foods and Switzerland's navigation products manufacturer Garmin. Some of these stocks were not in the benchmark and I sold Alcatel-Lucent prior to period end.
The views expressed above reflect those of the portfolio manager(s) only through the end of the period as stated on the cover of this report and do not necessarily represent the views of Fidelity or any other person in the Fidelity organization. Any such views are subject to change at any time based upon market or other conditions and Fidelity disclaims any responsibility to update such views. These views may not be relied on as investment advice and, because investment decisions for a Fidelity fund are based on numerous factors, may not be relied on as an indication of trading intent on behalf of any Fidelity fund.
Annual Report
Shareholder Expense Example
As a shareholder of the Fund, you incur two types of costs: (1) transaction costs, including sales charges (loads) on purchase payments or redemption proceeds, and (2) ongoing costs, including management fees, distribution and/or service (12b-1) fees and other Fund expenses. This Example is intended to help you understand your ongoing costs (in dollars) of investing in the Fund and to compare these costs with the ongoing costs of investing in other mutual funds.
The Example is based on an investment of $1,000 invested at the beginning of the period and held for the entire period (May 1, 2012 to October 31, 2012).
Actual Expenses
The first line of the accompanying table for each class of the Fund provides information about actual account values and actual expenses. You may use the information in this line, together with the amount you invested, to estimate the expenses that you paid over the period. Simply divide your account value by $1,000.00 (for example, an $8,600 account value divided by $1,000.00 = 8.6), then multiply the result by the number in the first line for a class of the Fund under the heading entitled "Expenses Paid During Period" to estimate the expenses you paid on your account during this period. In addition, the Fund, as a shareholder in the underlying Fidelity Central Funds, will indirectly bear its pro-rata share of the fees and expenses incurred by the underlying Fidelity Central Funds. These fees and expenses are not included in the Fund's annualized expense ratio used to calculate the expense estimate in the table below.
Hypothetical Example for Comparison Purposes
The second line of the accompanying table for each class of the Fund provides information about hypothetical account values and hypothetical expenses based on a Class' actual expense ratio and an assumed rate of return of 5% per year before expenses, which is not the Class' actual return. The hypothetical account values and expenses may not be used to estimate the actual ending account balance or expenses you paid for the period. You may use this information to compare the ongoing costs of investing in the Fund and other funds. To do so, compare this 5% hypothetical example with the 5% hypothetical examples that appear in the shareholder reports of the other funds. In addition, the Fund, as a shareholder in the underlying Fidelity Central Funds, will indirectly bear its pro-rata share of the fees and expenses incurred by the underlying Fidelity Central Funds. These fees and expenses are not included in the Fund's annualized expense ratio used to calculate the expense estimate in the table below.
Please note that the expenses shown in the table are meant to highlight your ongoing costs only and do not reflect any transaction costs. Therefore, the second line of the table is useful in comparing ongoing costs only, and will not help you determine the relative total costs of owning different funds. In addition, if these transactional costs were included, your costs would have been higher.
Annual Report
| Annualized
Expense Ratio | Beginning
Account Value
May 1, 2012 | Ending
Account Value
October 31, 2012 | Expenses Paid
During Period*
May 1, 2012 to
October 31, 2012 |
Class A | 1.25% | | | |
Actual | | $ 1,000.00 | $ 1,012.20 | $ 6.32 |
HypotheticalA | | $ 1,000.00 | $ 1,018.85 | $ 6.34 |
Class T | 1.50% | | | |
Actual | | $ 1,000.00 | $ 1,010.30 | $ 7.58 |
HypotheticalA | | $ 1,000.00 | $ 1,017.60 | $ 7.61 |
Class B | 2.00% | | | |
Actual | | $ 1,000.00 | $ 1,008.50 | $ 10.10 |
HypotheticalA | | $ 1,000.00 | $ 1,015.08 | $ 10.13 |
Class C | 2.00% | | | |
Actual | | $ 1,000.00 | $ 1,008.60 | $ 10.10 |
HypotheticalA | | $ 1,000.00 | $ 1,015.08 | $ 10.13 |
Institutional Class | .76% | | | |
Actual | | $ 1,000.00 | $ 1,014.00 | $ 3.85 |
HypotheticalA | | $ 1,000.00 | $ 1,021.32 | $ 3.86 |
A 5% return per year before expenses
* Expenses are equal to each Class' annualized expense ratio, multiplied by the average account value over the period, multiplied by 184/366 (to reflect the one-half year period).
Annual Report
Investment Changes (Unaudited)
Top Ten Stocks as of October 31, 2012 |
| % of fund's
net assets | % of fund's net assets
6 months ago |
Exxon Mobil Corp. | 4.5 | 2.2 |
Pfizer, Inc. | 4.0 | 4.6 |
General Electric Co. | 4.0 | 3.0 |
Merck & Co., Inc. | 3.2 | 3.4 |
Citigroup, Inc. | 3.2 | 3.6 |
Chevron Corp. | 2.9 | 3.2 |
Anadarko Petroleum Corp. | 2.3 | 1.2 |
Textron, Inc. | 2.2 | 1.3 |
Comverse Technology, Inc. | 2.1 | 2.0 |
Wells Fargo & Co. | 2.0 | 2.5 |
| 30.4 | |
Top Five Market Sectors as of October 31, 2012 |
| % of fund's
net assets | % of fund's net assets
6 months ago |
Financials | 24.5 | 26.7 |
Energy | 17.1 | 11.5 |
Health Care | 12.9 | 15.9 |
Information Technology | 8.4 | 11.4 |
Consumer Staples | 7.7 | 9.5 |
Asset Allocation (% of fund's net assets) |
As of October 31, 2012* | As of April 30, 2012** |
| Stocks and
Equity Futures 95.5% | | | Stocks
96.9% | |
| Short-Term
Investments and
Net Other Assets
(Liabilities) 4.5% | | | Short-Term
Investments and
Net Other Assets
(Liabilities) 3.1% | |
* Foreign investments | 9.3% | | ** Foreign investments | 11.4% | |

Annual Report
Investments October 31, 2012
Showing Percentage of Net Assets
Common Stocks - 95.0% |
| Shares | | Value |
CONSUMER DISCRETIONARY - 7.4% |
Diversified Consumer Services - 1.3% |
DeVry, Inc. | 12,993 | | $ 341,196 |
Household Durables - 1.6% |
Garmin Ltd. | 10,712 | | 406,949 |
Media - 3.0% |
DISH Network Corp. Class A | 12,078 | | 430,339 |
Washington Post Co. Class B (d) | 1,066 | | 355,522 |
| | 785,861 |
Multiline Retail - 1.5% |
JCPenney Co., Inc. (d) | 16,813 | | 403,680 |
TOTAL CONSUMER DISCRETIONARY | | 1,937,686 |
CONSUMER STAPLES - 7.7% |
Beverages - 1.7% |
Grupo Modelo SAB de CV Series C | 51,100 | | 450,354 |
Food & Staples Retailing - 1.9% |
CVS Caremark Corp. | 5,107 | | 236,965 |
Wal-Mart Stores, Inc. | 3,446 | | 258,519 |
| | 495,484 |
Food Products - 3.9% |
Kraft Foods Group, Inc. (a) | 4,706 | | 214,029 |
Mondelez International, Inc. (a) | 16,918 | | 449,004 |
Ralcorp Holdings, Inc. (a) | 5,168 | | 373,078 |
| | 1,036,111 |
Household Products - 0.2% |
Procter & Gamble Co. | 647 | | 44,798 |
TOTAL CONSUMER STAPLES | | 2,026,747 |
ENERGY - 17.1% |
Energy Equipment & Services - 3.0% |
Cameron International Corp. (a) | 8,251 | | 417,831 |
Halliburton Co. | 3,927 | | 126,803 |
Weatherford International Ltd. (a) | 23,142 | | 261,505 |
| | 806,139 |
Oil, Gas & Consumable Fuels - 14.1% |
Anadarko Petroleum Corp. | 8,911 | | 613,166 |
Apache Corp. | 800 | | 66,200 |
Chevron Corp. | 6,915 | | 762,102 |
Common Stocks - continued |
| Shares | | Value |
ENERGY - continued |
Oil, Gas & Consumable Fuels - continued |
Exxon Mobil Corp. | 12,928 | | $ 1,178,644 |
Hess Corp. | 7,676 | | 401,148 |
Marathon Petroleum Corp. | 3,981 | | 218,676 |
Occidental Petroleum Corp. | 3,780 | | 298,469 |
The Williams Companies, Inc. | 4,413 | | 154,411 |
| | 3,692,816 |
TOTAL ENERGY | | 4,498,955 |
FINANCIALS - 24.5% |
Capital Markets - 4.0% |
Bank of New York Mellon Corp. | 6,500 | | 160,615 |
E*TRADE Financial Corp. (a) | 49,608 | | 414,723 |
Goldman Sachs Group, Inc. | 1,204 | | 147,358 |
State Street Corp. | 7,350 | | 327,590 |
| | 1,050,286 |
Commercial Banks - 7.3% |
Aozora Bank Ltd. | 148,000 | | 417,136 |
Fifth Third Bancorp | 14,705 | | 213,664 |
KeyCorp | 46,528 | | 391,766 |
U.S. Bancorp | 6,370 | | 211,548 |
Wells Fargo & Co. | 15,626 | | 526,440 |
Zions Bancorporation | 7,498 | | 160,982 |
| | 1,921,536 |
Consumer Finance - 1.0% |
Capital One Financial Corp. | 4,400 | | 264,748 |
Diversified Financial Services - 5.5% |
Bank of America Corp. | 19,355 | | 180,389 |
Citigroup, Inc. | 21,991 | | 822,243 |
JPMorgan Chase & Co. | 10,225 | | 426,178 |
| | 1,428,810 |
Insurance - 4.7% |
Allstate Corp. | 3,140 | | 125,537 |
Assurant, Inc. | 6,067 | | 229,393 |
Berkshire Hathaway, Inc. Class B (a) | 989 | | 85,400 |
MetLife, Inc. | 2,788 | | 98,946 |
RenaissanceRe Holdings Ltd. | 3,019 | | 245,626 |
Common Stocks - continued |
| Shares | | Value |
FINANCIALS - continued |
Insurance - continued |
The Chubb Corp. | 1,885 | | $ 145,107 |
XL Group PLC Class A | 12,639 | | 312,689 |
| | 1,242,698 |
Real Estate Investment Trusts - 0.9% |
Weyerhaeuser Co. | 8,000 | | 221,520 |
Thrifts & Mortgage Finance - 1.1% |
Radian Group, Inc. (d) | 61,950 | | 290,546 |
TOTAL FINANCIALS | | 6,420,144 |
HEALTH CARE - 12.9% |
Health Care Providers & Services - 1.1% |
HCA Holdings, Inc. | 9,659 | | 274,412 |
Pharmaceuticals - 11.8% |
Bristol-Myers Squibb Co. | 7,577 | | 251,935 |
Eli Lilly & Co. | 2,429 | | 118,122 |
Johnson & Johnson | 6,892 | | 488,091 |
Merck & Co., Inc. | 18,341 | | 836,900 |
Pfizer, Inc. | 42,601 | | 1,059,487 |
Sanofi SA sponsored ADR | 7,940 | | 348,169 |
| | 3,102,704 |
TOTAL HEALTH CARE | | 3,377,116 |
INDUSTRIALS - 7.4% |
Aerospace & Defense - 2.2% |
Textron, Inc. | 22,752 | | 573,578 |
Construction & Engineering - 1.2% |
Jacobs Engineering Group, Inc. (a) | 7,807 | | 301,272 |
Industrial Conglomerates - 4.0% |
General Electric Co. | 50,047 | | 1,053,990 |
TOTAL INDUSTRIALS | | 1,928,840 |
INFORMATION TECHNOLOGY - 8.4% |
Communications Equipment - 0.8% |
Cisco Systems, Inc. | 12,614 | | 216,204 |
Computers & Peripherals - 1.4% |
Hewlett-Packard Co. | 27,753 | | 384,379 |
Common Stocks - continued |
| Shares | | Value |
INFORMATION TECHNOLOGY - continued |
Electronic Equipment & Components - 0.9% |
Corning, Inc. | 21,004 | | $ 246,797 |
Office Electronics - 0.9% |
Xerox Corp. | 35,384 | | 227,873 |
Semiconductors & Semiconductor Equipment - 0.5% |
Advanced Micro Devices, Inc. (a) | 60,281 | | 123,576 |
Software - 3.9% |
Comverse Technology, Inc. (a) | 84,352 | | 555,880 |
Microsoft Corp. | 2,810 | | 80,183 |
Symantec Corp. (a) | 21,018 | | 382,317 |
| | 1,018,380 |
TOTAL INFORMATION TECHNOLOGY | | 2,217,209 |
MATERIALS - 1.6% |
Metals & Mining - 1.6% |
Newmont Mining Corp. | 7,562 | | 412,507 |
TELECOMMUNICATION SERVICES - 2.3% |
Diversified Telecommunication Services - 0.5% |
AT&T, Inc. | 3,596 | | 124,386 |
CenturyLink, Inc. | 178 | | 6,832 |
| | 131,218 |
Wireless Telecommunication Services - 1.8% |
Sprint Nextel Corp. (a) | 86,010 | | 476,495 |
TOTAL TELECOMMUNICATION SERVICES | | 607,713 |
UTILITIES - 5.7% |
Electric Utilities - 5.0% |
Duke Energy Corp. | 2,300 | | 151,087 |
Edison International | 8,016 | | 376,271 |
FirstEnergy Corp. | 10,134 | | 463,326 |
NextEra Energy, Inc. | 4,596 | | 321,996 |
| | 1,312,680 |
Common Stocks - continued |
| Shares | | Value |
UTILITIES - continued |
Multi-Utilities - 0.7% |
Sempra Energy | 2,700 | | $ 188,325 |
TOTAL UTILITIES | | 1,501,005 |
TOTAL COMMON STOCKS (Cost $25,752,905) |
24,927,922
|
U.S. Treasury Obligations - 0.2% |
| Principal
Amount | | |
U.S. Treasury Bills, yield at date of purchase 0.08% to 0.1% 11/23/12 to 12/20/12 (e)
(Cost $49,996) | | $ 50,000 | |
49,997
|
Money Market Funds - 8.2% |
| Shares | | |
Fidelity Cash Central Fund, 0.19% (b) | 1,340,546 | | 1,340,546 |
Fidelity Securities Lending Cash Central Fund, 0.19% (b)(c) | 805,057 | | 805,057 |
TOTAL MONEY MARKET FUNDS (Cost $2,145,603) |
2,145,603
|
TOTAL INVESTMENT PORTFOLIO - 103.4% (Cost $27,948,504) | | 27,123,522 |
NET OTHER ASSETS (LIABILITIES) - (3.4)% | | (883,997) |
NET ASSETS - 100% | $ 26,239,525 |
Futures Contracts |
| Expiration
Date | | Underlying
Face Amount
at Value | | Unrealized
Appreciation/
(Depreciation) |
Purchased |
Equity Index Contracts |
2 NYFE Russell 1000 Index Contracts | Dec. 2012 | | $ 140,040 | | $ (1,484) |
|
The face value of futures purchased as a percentage of net assets is 0.5% |
Legend |
(a) Non-income producing |
(b) Affiliated fund that is available only to investment companies and other accounts managed by Fidelity Investments. The rate quoted is the annualized seven-day yield of the fund at period end. A complete unaudited listing of the fund's holdings as of its most recent quarter end is available upon request. In addition, each Fidelity Central Fund's financial statements, which are not covered by the Fund's Report of Independent Registered Public Accounting Firm, are available on the SEC's website or upon request. |
(c) Investment made with cash collateral received from securities on loan. |
(d) Security or a portion of the security is on loan at period end. |
(e) Security or a portion of the security was pledged to cover margin requirements for futures contracts. At the period end, the value of securities pledged amounted to $9,999. |
Affiliated Central Funds |
Information regarding fiscal year to date income earned by the Fund from investments in Fidelity Central Funds is as follows: |
Fund | Income earned |
Fidelity Cash Central Fund | $ 2,062 |
Fidelity Securities Lending Cash Central Fund | 9,056 |
Total | $ 11,118 |
Other Information |
The following is a summary of the inputs used, as of October 31, 2012, involving the Fund's assets and liabilities carried at fair value. The inputs or methodology used for valuing securities may not be an indication of the risk associated with investing in those securities. For more information on valuation inputs, and their aggregation into the levels used in the table below, please refer to the Security Valuation section in the accompanying Notes to Financial Statements. |
Valuation Inputs at Reporting Date: |
Description | Total | Level 1 | Level 2 | Level 3 |
Investments in Securities: | | | | |
Equities: | | | | |
Consumer Discretionary | $ 1,937,686 | $ 1,937,686 | $ - | $ - |
Consumer Staples | 2,026,747 | 2,026,747 | - | - |
Energy | 4,498,955 | 4,498,955 | - | - |
Financials | 6,420,144 | 6,420,144 | - | - |
Health Care | 3,377,116 | 3,377,116 | - | - |
Industrials | 1,928,840 | 1,928,840 | - | - |
Information Technology | 2,217,209 | 2,217,209 | - | - |
Materials | 412,507 | 412,507 | - | - |
Telecommunication Services | 607,713 | 607,713 | - | - |
Utilities | 1,501,005 | 1,501,005 | - | - |
U.S. Government and Government Agency Obligations | 49,997 | - | 49,997 | - |
Money Market Funds | 2,145,603 | 2,145,603 | - | - |
Total Investments in Securities: | $ 27,123,522 | $ 27,073,525 | $ 49,997 | $ - |
Derivative Instruments: | | | | |
Liabilities | | | | |
Futures Contracts | $ (1,484) | $ (1,484) | $ - | $ - |
The following is a summary of transfers between Level 1 and Level 2 for the period ended October 31, 2012. Transfers are assumed to have occurred at the beginning of the period, and are primarily attributable to the valuation techniques used for foreign equity securities, as discussed in the accompanying Notes to Financial Statements: |
Transfers | Total |
Level 1 to Level 2 | $ 0 |
Level 2 to Level 1 | $ 548,652 |
Value of Derivative Instruments |
The following table is a summary of the Fund's value of derivative instruments by primary risk exposure as of October 31, 2012. For additional information on derivative instruments, please refer to the Derivative Instruments section in the accompanying Notes to Financial Statements. |
Risk Exposure /
Derivative Type | Value |
| Asset | Liability |
Equity Risk | | |
Futures Contracts (a) | $ - | $ (1,484) |
Total Value of Derivatives | $ - | $ (1,484) |
(a) Reflects cumulative appreciation/(depreciation) on futures contracts as disclosed on the Schedule of Investments. Only the period end variation margin is separately disclosed on the Statement of Assets and Liabilities. |
See accompanying notes which are an integral part of the financial statements.
Annual Report
Statement of Assets and Liabilities
| October 31, 2012 |
| | |
Assets | | |
Investment in securities, at value (including securities loaned of $783,885) - See accompanying schedule: Unaffiliated issuers (cost $25,802,901) | $ 24,977,919 | |
Fidelity Central Funds (cost $2,145,603) | 2,145,603 | |
Total Investments (cost $27,948,504) | | $ 27,123,522 |
Receivable for investments sold | | 23,833 |
Receivable for fund shares sold | | 33,192 |
Dividends receivable | | 36,231 |
Distributions receivable from Fidelity Central Funds | | 1,116 |
Other receivables | | 1,299 |
Total assets | | 27,219,193 |
| | |
Liabilities | | |
Payable for investments purchased | $ 84,348 | |
Payable for fund shares redeemed | 23,362 | |
Accrued management fee | 9,433 | |
Distribution and service plan fees payable | 9,286 | |
Payable for daily variation margin on futures contracts | 220 | |
Other affiliated payables | 7,461 | |
Other payables and accrued expenses | 40,501 | |
Collateral on securities loaned, at value | 805,057 | |
Total liabilities | | 979,668 |
| | |
Net Assets | | $ 26,239,525 |
Net Assets consist of: | | |
Paid in capital | | $ 61,836,458 |
Undistributed net investment income | | 192,867 |
Accumulated undistributed net realized gain (loss) on investments and foreign currency transactions | | (34,963,285) |
Net unrealized appreciation (depreciation) on investments and assets and liabilities in foreign currencies | | (826,515) |
Net Assets | | $ 26,239,525 |
See accompanying notes which are an integral part of the financial statements.
Annual Report
Statement of Assets and Liabilities - continued
| October 31, 2012 |
| | |
Calculation of Maximum Offering Price Class A:
Net Asset Value and redemption price per share ($14,705,442 ÷ 1,359,593 shares) | | $ 10.82 |
| | |
Maximum offering price per share (100/94.25 of $10.82) | | $ 11.48 |
Class T:
Net Asset Value and redemption price per share ($6,144,983 ÷ 567,737 shares) | | $ 10.82 |
| | |
Maximum offering price per share (100/96.50 of $10.82) | | $ 11.21 |
Class B:
Net Asset Value and offering price per share ($894,797 ÷ 83,603 shares)A | | $ 10.70 |
| | |
Class C:
Net Asset Value and offering price per share ($3,299,257 ÷ 311,586 shares)A | | $ 10.59 |
| | |
Institutional Class:
Net Asset Value, offering price and redemption price per share ($1,195,046 ÷ 109,703 shares) | | $ 10.89 |
A Redemption price per share is equal to net asset value less any applicable contingent deferred sales charge.
See accompanying notes which are an integral part of the financial statements.
Annual Report
Financial Statements - continued
Statement of Operations
| Year ended October 31, 2012 |
| | |
Investment Income | | |
Dividends | | $ 678,286 |
Interest | | 24 |
Income from Fidelity Central Funds | | 11,118 |
Total income | | 689,428 |
| | |
Expenses | | |
Management fee
Basic fee | $ 153,618 | |
Performance adjustment | (89,148) | |
Transfer agent fees | 83,058 | |
Distribution and service plan fees | 119,442 | |
Accounting and security lending fees | 11,072 | |
Custodian fees and expenses | 18,632 | |
Independent trustees' compensation | 183 | |
Registration fees | 57,735 | |
Audit | 48,633 | |
Legal | 186 | |
Miscellaneous | 267 | |
Total expenses before reductions | 403,678 | |
Expense reductions | (12,877) | 390,801 |
Net investment income (loss) | | 298,627 |
Realized and Unrealized Gain (Loss) Net realized gain (loss) on: | | |
Investment securities: | | |
Unaffiliated issuers | (46,394) | |
Foreign currency transactions | (7,979) | |
Futures contracts | 12,499 | |
Total net realized gain (loss) | | (41,874) |
Change in net unrealized appreciation (depreciation) on: Investment securities | 2,307,798 | |
Assets and liabilities in foreign currencies | (253) | |
Futures contracts | (1,484) | |
Total change in net unrealized appreciation (depreciation) | | 2,306,061 |
Net gain (loss) | | 2,264,187 |
Net increase (decrease) in net assets resulting from operations | | $ 2,562,814 |
See accompanying notes which are an integral part of the financial statements.
Annual Report
Statement of Changes in Net Assets
| Year ended
October 31,
2012 | Year ended
October 31,
2011 |
Increase (Decrease) in Net Assets | | |
Operations | | |
Net investment income (loss) | $ 298,627 | $ 290,432 |
Net realized gain (loss) | (41,874) | 720,203 |
Change in net unrealized appreciation (depreciation) | 2,306,061 | (343,386) |
Net increase (decrease) in net assets resulting
from operations | 2,562,814 | 667,249 |
Distributions to shareholders from net investment income | (279,421) | (358,603) |
Distributions to shareholders from net realized gain | (11,550) | (41,497) |
Total distributions | (290,971) | (400,100) |
Share transactions - net increase (decrease) | (5,178,957) | (15,871,835) |
Total increase (decrease) in net assets | (2,907,114) | (15,604,686) |
| | |
Net Assets | | |
Beginning of period | 29,146,639 | 44,751,325 |
End of period (including undistributed net investment income of $192,867 and undistributed net investment income of $188,125, respectively) | $ 26,239,525 | $ 29,146,639 |
See accompanying notes which are an integral part of the financial statements.
Annual Report
Financial Highlights - Class A
Years ended October 31, | 2012 | 2011 | 2010 | 2009 | 2008 |
Selected Per-Share Data | | | | | |
Net asset value, beginning of period | $ 9.96 | $ 10.12 | $ 9.30 | $ 8.63 | $ 16.40 |
Income from Investment Operations | | | | | |
Net investment income (loss) C | .13 | .10 | .07 F | .09 | .16 |
Net realized and unrealized gain (loss) | .85 | (.14) G | .85 | .75 | (7.09) |
Total from investment operations | .98 | (.04) | .92 | .84 | (6.93) |
Distributions from net investment income | (.12) | (.11) | (.09) | (.17) | (.12) |
Distributions from net realized gain | - I | (.01) | (.01) | - | (.72) |
Total distributions | (.12) | (.12) | (.10) | (.17) | (.84) J |
Net asset value, end of period | $ 10.82 | $ 9.96 | $ 10.12 | $ 9.30 | $ 8.63 |
Total Return A, B | 10.00% | (.40)% | 9.91% | 10.13% | (44.43)% |
Ratios to Average Net Assets D, H | | | | | |
Expenses before reductions | 1.28% | 1.24% | 1.22% | 1.25% | 1.26% |
Expenses net of fee waivers, if any | 1.25% | 1.24% | 1.22% | 1.25% | 1.25% |
Expenses net of all reductions | 1.24% | 1.23% | 1.21% | 1.25% | 1.25% |
Net investment income (loss) | 1.26% | .91% | .75% F | 1.10% | 1.21% |
Supplemental Data | | | | | |
Net assets, end of period (000 omitted) | $ 14,705 | $ 15,484 | $ 25,431 | $ 28,585 | $ 34,864 |
Portfolio turnover rate E | 94% | 161% | 51% | 56% | 74% |
A Total returns would have been lower if certain expenses had not been reduced during the applicable periods shown.
B Total returns do not include the effect of the sales charges.
C Calculated based on average shares outstanding during the period.
D Fees and expenses of any underlying Fidelity Central Funds are not included in the Fund's expense ratio. The Fund indirectly bears its proportionate share of the expenses of any underlying Fidelity Central Funds.
E Amount does not include the portfolio activity of any underlying Fidelity Central Funds.
F Investment income per share reflects a large, non-recurring dividend which amounted to $.02 per share. Excluding this non-recurring dividend, the ratio of net investment income (loss) to average net assets would have been .57%.
G The amount shown for a share outstanding does not correspond with the aggregate net gain (loss) on investments for the period due to the timing of sales and repurchases of shares in relation to fluctuating market values of the investments of the Fund.
H Expense ratios reflect operating expenses of the class. Expenses before reductions do not reflect amounts reimbursed by the investment adviser or reductions from brokerage service arrangements or reductions from other expense offset arrangements and do not represent the amount paid by the class during periods when reimbursements or reductions occur. Expenses net of fee waivers reflect expenses after reimbursement by the investment adviser but prior to reductions from brokerage service arrangements or other expense offset arrangements. Expenses net of all reductions represent the net expenses paid by the class.
I Amount represents less than $.01 per share.
J Total distributions of $.839 per share is comprised of distributions from net investment income of $.117 and distributions from net realized gain of $.722 per share.
See accompanying notes which are an integral part of the financial statements.
Annual Report
Financial Highlights - Class T
Years ended October 31, | 2012 | 2011 | 2010 | 2009 | 2008 |
Selected Per-Share Data | | | | | |
Net asset value, beginning of period | $ 9.96 | $ 10.08 | $ 9.27 | $ 8.58 | $ 16.30 |
Income from Investment Operations | | | | | |
Net investment income (loss) C | .10 | .07 | .05 F | .07 | .13 |
Net realized and unrealized gain (loss) | .85 | (.13) G | .84 | .75 | (7.06) |
Total from investment operations | .95 | (.06) | .89 | .82 | (6.93) |
Distributions from net investment income | (.09) | (.05) | (.07) | (.13) | (.07) |
Distributions from net realized gain | - I | (.01) | (.01) | - | (.72) |
Total distributions | (.09) | (.06) | (.08) | (.13) | (.79) J |
Net asset value, end of period | $ 10.82 | $ 9.96 | $ 10.08 | $ 9.27 | $ 8.58 |
Total Return A, B | 9.68% | (.64)% | 9.62% | 9.90% | (44.57)% |
Ratios to Average Net Assets D, H | | | | | |
Expenses before reductions | 1.55% | 1.49% | 1.45% | 1.50% | 1.49% |
Expenses net of fee waivers, if any | 1.50% | 1.49% | 1.45% | 1.50% | 1.49% |
Expenses net of all reductions | 1.49% | 1.48% | 1.45% | 1.49% | 1.49% |
Net investment income (loss) | 1.01% | .67% | .52% F | .85% | .97% |
Supplemental Data | | | | | |
Net assets, end of period (000 omitted) | $ 6,145 | $ 8,254 | $ 12,735 | $ 20,652 | $ 22,720 |
Portfolio turnover rate E | 94% | 161% | 51% | 56% | 74% |
A Total returns would have been lower if certain expenses had not been reduced during the applicable periods shown.
B Total returns do not include the effect of the sales charges.
C Calculated based on average shares outstanding during the period.
D Fees and expenses of any underlying Fidelity Central Funds are not included in the Fund's expense ratio. The Fund indirectly bears its proportionate share of the expenses of any underlying Fidelity Central Funds.
E Amount does not include the portfolio activity of any underlying Fidelity Central Funds.
F Investment income per share reflects a large, non-recurring dividend which amounted to $.02 per share. Excluding this non-recurring dividend, the ratio of net investment income (loss) to average net assets would have been .33%.
G The amount shown for a share outstanding does not correspond with the aggregate net gain (loss) on investments for the period due to the timing of sales and repurchases of shares in relation to fluctuating market values of the investments of the Fund.
H Expense ratios reflect operating expenses of the class. Expenses before reductions do not reflect amounts reimbursed by the investment adviser or reductions from brokerage service arrangements or reductions from other expense offset arrangements and do not represent the amount paid by the class during periods when reimbursements or reductions occur. Expenses net of fee waivers reflect expenses after reimbursement by the investment adviser but prior to reductions from brokerage service arrangements or other expense offset arrangements. Expenses net of all reductions represent the net expenses paid by the class.
I Amount represents less than $.01 per share.
J Total distributions of $.790 per share is comprised of distributions from net investment income of $.068 and distributions from net realized gain of $.722 per share.
See accompanying notes which are an integral part of the financial statements.
Annual Report
Financial Highlights - Class B
Years ended October 31, | 2012 | 2011 | 2010 | 2009 | 2008 |
Selected Per-Share Data | | | | | |
Net asset value, beginning of period | $ 9.84 | $ 9.99 | $ 9.18 | $ 8.47 | $ 16.07 |
Income from Investment Operations | | | | | |
Net investment income (loss) C | .05 | .02 | - F, I | .03 | .06 |
Net realized and unrealized gain (loss) | .85 | (.13) G | .84 | .74 | (6.96) |
Total from investment operations | .90 | (.11) | .84 | .77 | (6.90) |
Distributions from net investment income | (.03) | (.03) | (.02) | (.06) | - |
Distributions from net realized gain | - I | (.01) | (.01) | - | (.70) |
Total distributions | (.04) J | (.04) | (.03) | (.06) | (.70) K |
Net asset value, end of period | $ 10.70 | $ 9.84 | $ 9.99 | $ 9.18 | $ 8.47 |
Total Return A, B | 9.14% | (1.14)% | 9.11% | 9.19% | (44.80)% |
Ratios to Average Net Assets D, H | | | | | |
Expenses before reductions | 2.04% | 1.99% | 1.97% | 2.00% | 2.03% |
Expenses net of fee waivers, if any | 2.00% | 1.99% | 1.97% | 2.00% | 2.00% |
Expenses net of all reductions | 1.99% | 1.98% | 1.97% | 2.00% | 2.00% |
Net investment income (loss) | .51% | .16% | (.01)% F | .35% | .45% |
Supplemental Data | | | | | |
Net assets, end of period (000 omitted) | $ 895 | $ 1,110 | $ 1,605 | $ 1,989 | $ 2,615 |
Portfolio turnover rate E | 94% | 161% | 51% | 56% | 74% |
A Total returns would have been lower if certain expenses had not been reduced during the applicable periods shown.
B Total returns do not include the effect of the contingent deferred sales charge.
C Calculated based on average shares outstanding during the period.
D Fees and expenses of any underlying Fidelity Central Funds are not included in the Fund's expense ratio. The Fund indirectly bears its proportionate share of the expenses of any underlying Fidelity Central Funds.
E Amount does not include the portfolio activity of any underlying Fidelity Central Funds.
F Investment income per share reflects a large, non-recurring dividend which amounted to $.02 per share. Excluding this non-recurring dividend, the ratio of net investment income (loss) to average net assets would have been (.19)%.
G The amount shown for a share outstanding does not correspond with the aggregate net gain (loss) on investments for the period due to the timing of sales and repurchases of shares in relation to fluctuating market values of the investments of the Fund.
H Expense ratios reflect operating expenses of the class. Expenses before reductions do not reflect amounts reimbursed by the investment adviser or reductions from brokerage service arrangements or reductions from other expense offset arrangements and do not represent the amount paid by the class during periods when reimbursements or reductions occur. Expenses net of fee waivers reflect expenses after reimbursement by the investment adviser but prior to reductions from brokerage service arrangements or other expense offset arrangements. Expenses net of all reductions represent the net expenses paid by the class.
I Amount represents less than $.01 per share.
J Total distributions of $.04 per share is comprised of distributions from net investment income of $.031 and distributions from net realized gain of $.004 per share.
K Total distributions of $.698 per share is comprised of distributions from net investment income of $.000 and distributions from net realized gain of $.698 per share.
See accompanying notes which are an integral part of the financial statements.
Annual Report
Financial Highlights - Class C
Years ended October 31, | 2012 | 2011 | 2010 | 2009 | 2008 |
Selected Per-Share Data | | | | | |
Net asset value, beginning of period | $ 9.75 | $ 9.92 | $ 9.11 | $ 8.44 | $ 16.04 |
Income from Investment Operations | | | | | |
Net investment income (loss) C | .05 | .02 | - F, I | .03 | .06 |
Net realized and unrealized gain (loss) | .84 | (.13) G | .83 | .73 | (6.95) |
Total from investment operations | .89 | (.11) | .83 | .76 | (6.89) |
Distributions from net investment income | (.05) | (.05) | (.02) | (.09) | - |
Distributions from net realized gain | - I | (.01) | (.01) | - | (.71) |
Total distributions | (.05) | (.06) | (.02) J | (.09) | (.71) K |
Net asset value, end of period | $ 10.59 | $ 9.75 | $ 9.92 | $ 9.11 | $ 8.44 |
Total Return A, B | 9.21% | (1.18)% | 9.12% | 9.28% | (44.84)% |
Ratios to Average Net Assets D, H | | | | | |
Expenses before reductions | 2.04% | 2.00% | 1.97% | 2.01% | 2.03% |
Expenses net of fee waivers, if any | 2.00% | 2.00% | 1.97% | 2.00% | 2.00% |
Expenses net of all reductions | 1.99% | 1.98% | 1.97% | 2.00% | 2.00% |
Net investment income (loss) | .51% | .16% | -% F,L | .35% | .45% |
Supplemental Data | | | | | |
Net assets, end of period (000 omitted) | $ 3,299 | $ 3,775 | $ 4,139 | $ 4,088 | $ 5,358 |
Portfolio turnover rate E | 94% | 161% | 51% | 56% | 74% |
A Total returns would have been lower if certain expenses had not been reduced during the applicable periods shown.
B Total returns do not include the effect of the contingent deferred sales charge.
C Calculated based on average shares outstanding during the period.
D Fees and expenses of any underlying Fidelity Central Funds are not included in the Fund's expense ratio. The Fund indirectly bears its proportionate share of the expenses of any underlying Fidelity Central Funds.
E Amount does not include the portfolio activity of any underlying Fidelity Central Funds.
F Investment income per share reflects a large, non-recurring dividend which amounted to $.02 per share. Excluding this non-recurring dividend, the ratio of net investment income (loss) to average net assets would have been (.19)%.
G The amount shown for a share outstanding does not correspond with the aggregate net gain (loss) on investments for the period due to the timing of sales and repurchases of shares in relation to fluctuating market values of the investments of the Fund.
H Expense ratios reflect operating expenses of the class. Expenses before reductions do not reflect amounts reimbursed by the investment adviser or reductions from brokerage service arrangements or reductions from other expense offset arrangements and do not represent the amount paid by the class during periods when reimbursements or reductions occur. Expenses net of fee waivers reflect expenses after reimbursement by the investment adviser but prior to reductions from brokerage service arrangements or other expense offset arrangements. Expenses net of all reductions represent the net expenses paid by the class.
I Amount represents less than $.01 per share.
J Total distributions of $.02 per share is comprised of distributions from net investment income of $.015 and distributions from net realized gain of $.005 per share.
K Total distributions of $.712 per share is comprised of distributions from net investment income of $.000 and distributions from net realized gain of $.712 per share.
L Amount represents less than .01%.
See accompanying notes which are an integral part of the financial statements.
Annual Report
Financial Highlights - Institutional Class
Years ended October 31, | 2012 | 2011 | 2010 | 2009 | 2008 |
Selected Per-Share Data | | | | | |
Net asset value, beginning of period | $ 10.04 | $ 10.19 | $ 9.35 | $ 8.70 | $ 16.51 |
Income from Investment Operations | | | | | |
Net investment income (loss) B | .18 | .14 | .10 E | .11 | .20 |
Net realized and unrealized gain (loss) | .83 | (.15) F | .86 | .74 | (7.13) |
Total from investment operations | 1.01 | (.01) | .96 | .85 | (6.93) |
Distributions from net investment income | (.16) | (.13) | (.11) | (.20) | (.15) |
Distributions from net realized gain | - H | (.01) | (.01) | - | (.72) |
Total distributions | (.16) | (.14) | (.12) | (.20) | (.88) I |
Net asset value, end of period | $ 10.89 | $ 10.04 | $ 10.19 | $ 9.35 | $ 8.70 |
Total Return A | 10.30% | (.11)% | 10.28% | 10.26% | (44.24)% |
Ratios to Average Net Assets C, G | | | | | |
Expenses before reductions | .83% | .89% | .98% | 1.00% | .98% |
Expenses net of fee waivers, if any | .83% | .89% | .98% | 1.00% | .98% |
Expenses net of all reductions | .82% | .88% | .97% | 1.00% | .97% |
Net investment income (loss) | 1.68% | 1.27% | .99% E | 1.35% | 1.48% |
Supplemental Data | | | | | |
Net assets, end of period (000 omitted) | $ 1,195 | $ 523 | $ 841 | $ 2,341 | $ 2,021 |
Portfolio turnover rate D | 94% | 161% | 51% | 56% | 74% |
A Total returns would have been lower if certain expenses had not been reduced during the applicable periods shown.
B Calculated based on average shares outstanding during the period.
C Fees and expenses of any underlying Fidelity Central Funds are not included in the Fund's expense ratio. The Fund indirectly bears its proportionate share of the expenses of any underlying Fidelity Central Funds.
D Amount does not include the portfolio activity of any underlying Fidelity Central Funds.
E Investment income per share reflects a large, non-recurring dividend which amounted to $.02 per share. Excluding this non-recurring dividend, the ratio of net investment income (loss) to average net assets would have been .81%.
F The amount shown for a share outstanding does not correspond with the aggregate net gain (loss) on investments for the period due to the timing of sales and repurchases of shares in relation to fluctuating market values of the investments of the Fund.
G Expense ratios reflect operating expenses of the class. Expenses before reductions do not reflect amounts reimbursed by the investment adviser or reductions from brokerage service arrangements or reductions from other expense offset arrangements and do not represent the amount paid by the class during periods when reimbursements or reductions occur. Expenses net of fee waivers reflect expenses after reimbursement by the investment adviser but prior to reductions from brokerage service arrangements or other expense offset arrangements. Expenses net of all reductions represent the net expenses paid by the class.
H Amount represents less than $.01 per share.
I Total distributions of $.876 per share is comprised of distributions from net investment income of $.154 and distributions from net realized gain of $.722 per share.
See accompanying notes which are an integral part of the financial statements.
Annual Report
Notes to Financial Statements
For the period ended October 31, 2012
1. Organization.
Fidelity Advisor Value Leaders Fund (the Fund) is a fund of Fidelity Advisor Series VIII (the Trust) and is authorized to issue an unlimited number of shares. The Trust is registered under the Investment Company Act of 1940, as amended (the 1940 Act), as an open-end management investment company organized as a Massachusetts business trust. The Fund offers Class A, Class T, Class C, and Institutional Class shares, each of which, along with Class B shares, has equal rights as to assets and voting privileges. Effective after the close of business on September 1, 2010, Class B shares were closed to new accounts and additional purchases, except for exchanges and reinvestments. Each class has exclusive voting rights with respect to matters that affect that class. Class B shares will automatically convert to Class A shares after a holding period of seven years from the initial date of purchase. Investment income, realized and unrealized capital gains and losses, the common expenses of the Fund, and certain fund-level expense reductions, if any, are allocated on a pro-rata basis to each class based on the relative net assets of each class to the total net assets of the Fund. Each class differs with respect to transfer agent and distribution and service plan fees incurred. Certain expense reductions may also differ by class.
2. Investments in Fidelity Central Funds.
The Fund invests in Fidelity Central Funds, which are open-end investment companies available only to other investment companies and accounts managed by Fidelity Management & Research Company (FMR) and its affiliates. The Fund's Schedule of Investments lists each of the Fidelity Central Funds held as of period end, if any, as an investment of the Fund, but does not include the underlying holdings of each Fidelity Central Fund. As an Investing Fund, the Fund indirectly bears its proportionate share of the expenses of the underlying Fidelity Central Funds.
The Money Market Central Funds seek preservation of capital and current income and are managed by Fidelity Investments Money Management, Inc. (FIMM), an affiliate of FMR.
A complete unaudited list of holdings for each Fidelity Central Fund is available upon request or at the Securities and Exchange Commission (the SEC) web site at www.sec.gov. In addition, the financial statements of the Fidelity Central Funds, which are not covered by the Fund's Report of Independent Registered Public Accounting Firm, are available on the SEC web site or upon request.
3. Significant Accounting Policies.
The financial statements have been prepared in conformity with accounting principles generally accepted in the United States of America (GAAP), which require management to make certain estimates and assumptions at the date of the financial statements.
Annual Report
Notes to Financial Statements - continued
3. Significant Accounting Policies - continued
Actual results could differ from those estimates. Subsequent events, if any, through the date that the financial statements were issued have been evaluated in the preparation of the financial statements. The following summarizes the significant accounting policies of the Fund:
Security Valuation. Investments are valued as of 4:00 p.m. Eastern time on the last calendar day of the period. In accordance with valuation policies and procedures approved by the Board of Trustees (the Board), the Fund attempts to obtain prices from one or more third party pricing vendors or brokers to value its investments. When current market prices, quotations or rates are not readily available or reliable, securities will be fair valued in good faith by the FMR Fair Value Committee (the Committee), in accordance with procedures adopted by the Fund's Board. Factors used in determining fair value vary by security type and may include market or security specific events, changes in interest rates and credit quality. The frequency with which these procedures are used cannot be predicted and they may be utilized to a significant extent. The Committee oversees the Fund's valuation policies and procedures and is responsible for approving and reporting to the Board all fair value determinations.
The Fund categorizes the inputs to valuation techniques used to value its investments into a disclosure hierarchy consisting of three levels as shown below:
Level 1 - quoted prices in active markets for identical investments
Level 2 - other significant observable inputs (including quoted prices for similar investments, interest rates, prepayment speeds, etc.)
Level 3 - unobservable inputs (including the Fund's own assumptions based on the best information available)
Valuation techniques used to value the Fund's investments by major category are as follows:
Equity securities, including restricted securities, for which market quotations are readily available, are valued at the last reported sale price or official closing price as reported by a third party pricing vendor on the primary market or exchange on which they are traded and are categorized as Level 1 in the hierarchy. In the event there were no sales during the day or closing prices are not available, securities are valued at the last quoted bid price or may be valued using the last available price and are generally categorized as Level 2 in the hierarchy. For foreign equity securities, when significant market or security specific events arise, comparisons to the valuation of American Depositary Receipts (ADRs), futures contracts, Exchange-Traded Funds (ETFs) and certain indexes as well as quoted prices for similar securities are used and are categorized as Level 2 in the hierarchy. Utilizing these techniques may result in transfers between Level 1 and Level 2.
Annual Report
3. Significant Accounting Policies - continued
Security Valuation - continued
Debt securities, including restricted securities, are valued based on evaluated prices received from third party pricing vendors or from brokers who make markets in such securities. For U.S. government and government agency obligations, pricing vendors utilize matrix pricing which considers yield or price of bonds of comparable quality, coupon, maturity and type as well as broker-supplied prices and are generally categorized as Level 2 in the hierarchy.
Futures contracts are valued at the settlement price established each day by the board of trade or exchange on which they are traded and are categorized as Level 1 in the hierarchy. Investments in open-end mutual funds, including the Fidelity Central Funds, are valued at their closing net asset value (NAV) each business day and are categorized as Level 1 in the hierarchy.
Changes in valuation techniques may result in transfers in or out of an assigned level within the disclosure hierarchy. The aggregate value of investments by input level, as of October 31, 2012, including information on transfers between Levels 1 and 2, is included at the end of the Fund's Schedule of Investments.
Foreign Currency Translation. The Fund may use foreign currency contracts to facilitate transactions in foreign-denominated securities. Gains and losses from these transactions may arise from changes in the value of the foreign currency or if the counterparties do not perform under the contracts' terms.
Foreign-denominated assets, including investment securities, and liabilities are translated into U.S. dollars at the exchange rates at period end. Purchases and sales of investment securities, income and dividends received and expenses denominated in foreign currencies are translated into U.S. dollars at the exchange rate in effect on the transaction date.
The effects of exchange rate fluctuations on investments are included with the net realized and unrealized gain (loss) on investment securities. Other foreign currency transactions resulting in realized and unrealized gain (loss) are disclosed separately.
Investment Transactions and Income. For financial reporting purposes, the Fund's investment holdings and NAV include trades executed through the end of the last business day of the period. The NAV per share for processing shareholder transactions is calculated as of the close of business of the New York Stock Exchange (NYSE), normally 4:00 p.m. Eastern time and includes trades executed through the end of the prior business day. Gains and losses on securities sold are determined on the basis of identified cost and may include proceeds received from litigation. Dividend income is recorded on the ex-dividend date, except for certain dividends from foreign securities where the
Annual Report
Notes to Financial Statements - continued
3. Significant Accounting Policies - continued
Investment Transactions and Income - continued
ex-dividend date may have passed, which are recorded as soon as the Fund is informed of the ex-dividend date. Non-cash dividends included in dividend income, if any, are recorded at the fair market value of the securities received. Distributions received on securities that represent a return of capital or capital gain are recorded as a reduction of cost of investments and/or as a realized gain. The Fund estimates the components of distributions received that may be considered return of capital distributions or capital gain distributions. Interest income and distributions from the Fidelity Central Funds are accrued as earned. Interest income includes coupon interest and amortization of premium and accretion of discount on debt securities. Investment income is recorded net of foreign taxes withheld where recovery of such taxes is uncertain.
Expenses. Expenses directly attributable to a fund are charged to that fund. Expenses attributable to more than one fund are allocated among the respective funds on the basis of relative net assets or other appropriate methods. Expense estimates are accrued in the period to which they relate and adjustments are made when actual amounts are known.
Income Tax Information and Distributions to Shareholders. Each year, the Fund intends to qualify as a regulated investment company under Subchapter M of the Internal Revenue Code, including distributing substantially all of its taxable income and realized gains. As a result, no provision for income taxes is required. As of October 31, 2012, the Fund did not have any unrecognized tax benefits in the financial statements; nor is the Fund aware of any tax positions for which it is reasonably possible that the total amounts of unrecognized tax benefits will significantly change in the next twelve months. The Fund files a U.S. federal tax return, in addition to state and local tax returns as required. A fund's federal income tax returns are subject to examination by the Internal Revenue Service (IRS) for a period of three fiscal years after they are filed. State and local tax returns may be subject to examination for an additional fiscal year depending on the jurisdiction. Foreign taxes are provided for based on the Fund's understanding of the tax rules and rates that exist in the foreign markets in which it invests.
Distributions are declared and recorded on the ex-dividend date. Income dividends and capital gain distributions are declared separately for each class. Income and capital gain distributions are determined in accordance with income tax regulations, which may differ from GAAP.
Capital accounts within the financial statements are adjusted for permanent book-tax differences. These adjustments have no impact on net assets or the results of operations. Temporary book-tax differences will reverse in a subsequent period.
Annual Report
3. Significant Accounting Policies - continued
Income Tax Information and Distributions to Shareholders - continued
Book-tax differences are primarily due to futures transactions, foreign currency transactions, partnerships, capital loss carryforwards and losses deferred due to wash sales.
The federal tax cost of investment securities and unrealized appreciation (depreciation) as of period end were as follows:
Gross unrealized appreciation | $ 1,926,856 |
Gross unrealized depreciation | (3,292,556) |
Net unrealized appreciation (depreciation) on securities and other investments | $ (1,365,700) |
| |
Tax Cost | $ 28,489,222 |
The tax-based components of distributable earnings as of period end were as follows:
Undistributed ordinary income | $ 192,867 |
Capital loss carryforward | $ (34,424,052) |
Net unrealized appreciation (depreciation) | $ (1,365,749) |
Capital loss carryforwards are only available to offset future capital gains of the Fund to the extent provided by regulations and may be limited. Under the Regulated Investment Company Modernization Act of 2010 (the Act), the Fund is permitted to carry forward capital losses incurred in taxable years beginning after December 22, 2010 for an unlimited period and such capital losses are required to be used prior to any losses that expire. Capital loss carryforwards were as follows:
Fiscal year of expiration | |
2016 | $ (19,194,348) |
2017 | (14,819,668) |
2019 | (169,201) |
Total with expiration | (34,183,217) |
No expiration | |
Short-term | (210,874) |
Long-term | (29,961) |
Total no expiration | (240,835) |
Total capital loss carryforward | $ (34,424,052) |
The tax character of distributions paid was as follows:
| October 31, 2012 | October 31, 2011 |
Ordinary Income | $ 290,971 | $ 400,100 |
Annual Report
Notes to Financial Statements - continued
3. Significant Accounting Policies - continued
New Accounting Pronouncement. In December 2011, the Financial Accounting Standards Board issued Accounting Standard Update No. 2011-11, Disclosures about Offsetting Assets and Liabilities. The update creates new disclosure requirements requiring entities to disclose both gross and net information for derivatives and other financial instruments that are either offset in the Statement of Assets and Liabilities or subject to an enforceable master netting arrangement or similar agreement. The disclosure requirements are effective for annual reporting periods beginning on or after January 1, 2013, and interim periods within those annual periods. Management is currently evaluating the impact of the update's adoption on the Fund's financial statement disclosures.
4. Derivative Instruments.
Risk Exposures and the Use of Derivative Instruments. The Fund's investment objective allows the Fund to enter into various types of derivative contracts, including futures contracts. Derivatives are investments whose value is primarily derived from underlying assets, indices or reference rates and may be transacted on an exchange or over-the-counter (OTC). Derivatives may involve a future commitment to buy or sell a specified instrument based on specified terms, to exchange future cash flows at periodic intervals based on a notional principal amount, or for one party to make one or more payments upon the occurrence of specified events in exchange for periodic payments from the other party.
The Fund used derivatives to increase returns and to manage exposure to certain risks as defined below. The success of any strategy involving derivatives depends on analysis of numerous economic factors, and if the strategies for investment do not work as intended, the Fund may not achieve its objectives.
The Fund's use of derivatives increased or decreased its exposure to the following risk:
Equity Risk | Equity risk relates to the fluctuations in the value of financial instruments as a result of changes in market prices (other than those arising from interest rate risk or foreign exchange risk), whether caused by factors specific to an individual investment, its issuer, or all factors affecting all instruments traded in a market or market segment. |
The Fund is also exposed to additional risks from investing in derivatives, such as liquidity risk and counterparty credit risk. Liquidity risk is the risk that the Fund will be unable to close out the derivative in the open market in a timely manner. Counterparty credit risk is the risk that the counterparty will not be able to fulfill its obligation to the Fund. Counterparty credit risk related to exchange-traded futures contracts is minimal because of the protection provided by the exchange on which they trade.
Annual Report
4. Derivative Instruments - continued
Risk Exposures and the Use of Derivative Instruments - continued
Investing in derivatives may involve greater risks than investing in the underlying assets directly and, to varying degrees, may involve risk of loss in excess of any initial investment and collateral received and amounts recognized in the Statement of Assets and Liabilities. In addition, there may be the risk that the change in value of the derivative contract does not correspond to the change in value of the underlying instrument.
Futures Contracts. A futures contract is an agreement between two parties to buy or sell a specified underlying instrument for a fixed price at a specified future date. The Fund used futures contracts to manage its exposure to the stock market.
Upon entering into a futures contract, a fund is required to deposit either cash or securities (initial margin) with a clearing broker in an amount equal to a certain percentage of the face value of the contract. Futures contracts are marked-to-market daily and subsequent payments (variation margin) are made or received by a fund depending on the daily fluctuations in the value of the futures contracts and are recorded as unrealized appreciation or (depreciation). This receivable and/or payable is included in daily variation margin on futures contracts in the Statement of Assets and Liabilities. Realized gain or (loss) is recorded upon the expiration or closing of a futures contract.
Any open futures contracts at period end are shown in the Schedule of Investments under the caption "Futures Contracts." The underlying face amount at value reflects each contract's exposure to the underlying instrument at period end and is representative of activity for the period. Securities deposited to meet initial margin requirements are identified in the Schedule of Investments.
During the period the Fund recognized net realized gain (loss) of $12,499 and a change in net unrealized appreciation (depreciation) of $(1,484) related to its investment in futures contracts. These amounts are included in the Statement of Operations.
5. Purchases and Sales of Investments.
Purchases and sales of securities, other than short-term securities, aggregated $24,511,759 and $29,514,913, respectively.
6. Fees and Other Transactions with Affiliates.
Management Fee. FMR and its affiliates provide the Fund with investment management related services for which the Fund pays a monthly management fee. The management fee is the sum of an individual fund fee rate that is based on an annual rate of .30% of the Fund's average net assets and an annualized group fee rate that averaged .26% during the period. The group fee rate is based upon the average net assets of all the
Annual Report
Notes to Financial Statements - continued
6. Fees and Other Transactions with Affiliates - continued
Management Fee - continued
mutual funds advised by FMR. The group fee rate decreases as assets under management increase and increases as assets under management decrease. In addition, the management fee is subject to a performance adjustment (up to a maximum of ± .20% of the Fund's average net assets over a 36 month performance period). The upward or downward adjustment to the management fee is based on the relative investment performance of the Institutional Class of the Fund as compared to an appropriate benchmark index. For the period, the total annual management fee rate, including the performance adjustment, was .23% of the Fund's average net assets.
Distribution and Service Plan Fees. In accordance with Rule 12b-1 of the 1940 Act, the Fund has adopted separate Distribution and Service Plans for each class of shares. Certain classes pay Fidelity Distributors Corporation (FDC), an affiliate of FMR, separate Distribution and Service Fees, each of which is based on an annual percentage of each class' average net assets. In addition, FDC may pay financial intermediaries for selling shares of the Fund and providing shareholder support services. For the period, the Distribution and Service Fee rates, total fees and amounts retained by FDC were as follows:
| Distribution
Fee | Service
Fee | Total Fees | Retained
by FDC |
Class A | -% | .25% | $ 37,876 | $ 255 |
Class T | .25% | .25% | 35,980 | 177 |
Class B | .75% | .25% | 9,972 | 7,494 |
Class C | .75% | .25% | 35,614 | 2,985 |
| | | $ 119,442 | $ 10,911 |
Sales Load. FDC may receive a front-end sales charge of up to 5.75% for selling Class A shares and 3.50% for selling Class T shares, some of which is paid to financial intermediaries for selling shares of the Fund. Depending on the holding period, FDC may receive contingent deferred sales charges levied on Class A, Class T, Class B, and Class C redemptions. The deferred sales charges range from 5.00% to 1.00% for Class B shares, 1.00% for Class C shares, 1.00% for certain purchases of Class A shares and .25% for certain purchases of Class T shares.
Annual Report
6. Fees and Other Transactions with Affiliates - continued
Sales Load - continued
For the period, sales charge amounts retained by FDC were as follows:
| Retained
by FDC |
Class A | $ 1,394 |
Class T | 954 |
Class B* | 1,484 |
Class C* | 559 |
| $ 4,391 |
* When Class B and Class C shares are initially sold, FDC pays commissions from its own resources to financial intermediaries through which the sales
are made.
Transfer Agent Fees. Fidelity Investments Institutional Operations Company, Inc. (FIIOC), an affiliate of FMR, is the transfer, dividend disbursing and shareholder servicing agent for each class of the Fund. FIIOC receives account fees and asset-based fees that vary according to the account size and type of account of the shareholders of the respective classes of the Fund. For the period, transfer agent fees for each class were as follows:
| Amount | % of
Average
Net Assets |
Class A | $ 45,630 | .30 |
Class T | 22,288 | .31 |
Class B | 3,006 | .30 |
Class C | 10,839 | .30 |
Institutional Class | 1,295 | .20 |
| $ 83,058 | |
Accounting and Security Lending Fees. Fidelity Service Company, Inc. (FSC), an affiliate of FMR, maintains the Fund's accounting records. The accounting fee is based on the level of average net assets for each month. Under a separate contract, FSC administers the security lending program. The security lending fee is based on the number and duration of lending transactions.
Brokerage Commissions. The Fund placed a portion of its portfolio transactions with brokerage firms which are affiliates of the investment adviser. The commissions paid to these affiliated firms were $1,636 for the period.
7. Committed Line of Credit.
The Fund participates with other funds managed by FMR or an affiliate in a $4.25 billion credit facility (the "line of credit") to be utilized for temporary or emergency purposes to
Annual Report
Notes to Financial Statements - continued
7. Committed Line of Credit - continued
fund shareholder redemptions or for other short-term liquidity purposes. The Fund has agreed to pay commitment fees on its pro-rata portion of the line of credit, which amounted to $77 and is reflected in Miscellaneous expenses on the Statement of Operations. During the period, there were no borrowings on this line of credit.
8. Security Lending.
The Fund lends portfolio securities through a lending agent from time to time in order to earn additional income. For equity securities, a lending agent is used and may loan securities to certain qualified borrowers, including Fidelity Capital Markets (FCM), a broker-dealer affiliated with the Fund. On the settlement date of the loan, the Fund receives collateral (in the form of U.S. Treasury obligations, letters of credit and/or cash) against the loaned securities and maintains collateral in an amount not less than 100% of the market value of the loaned securities during the period of the loan. The market value of the loaned securities is determined at the close of business of the Fund and any additional required collateral is delivered to the Fund on the next business day. If the borrower defaults on its obligation to return the securities loaned because of insolvency or other reasons, a fund could experience delays and costs in recovering the securities loaned or in gaining access to the collateral. Any cash collateral received is invested in the Fidelity Securities Lending Cash Central Fund. The value of loaned securities and cash collateral at period end are disclosed on the Fund's Statement of Assets and Liabilities. Security lending income represents the income earned on investing cash collateral, less rebates paid to borrowers and any lending agent fees associated with the loan, plus any premium payments received for lending certain types of securities. Security lending income is presented in the Statement of Operations as a component of income from Fidelity Central Funds. Total security lending income during the period amounted to $9,056. During the period, there were no securities loaned to FCM.
9. Expense Reductions.
FMR voluntarily agreed to reimburse each class to the extent annual operating expenses exceeded certain levels of average net assets as noted in the table below. Some expenses, for example interest expense, including commitment fees, are excluded from this reimbursement.
The following classes were in reimbursement during the period:
| Expense
Limitations | Reimbursement
from adviser |
Class A | 1.25% | $ 4,916 |
Class T | 1.50% | 3,368 |
Annual Report
9. Expense Reductions - continued
| Expense
Limitations | Reimbursement
from adviser |
Class B | 2.00% | $ 359 |
Class C | 2.00% | 1,366 |
| | $ 10,009 |
Many of the brokers with whom FMR places trades on behalf of the Fund provided services to the Fund in addition to trade execution. These services included payments of certain expenses on behalf of the Fund totaling $2,856 for the period. In addition, through arrangements with the Fund's custodian, credits realized as a result of uninvested cash balances were used to reduce the Fund's expenses. During the period, these credits reduced the Fund's custody expenses by $12.
10. Distributions to Shareholders.
Distributions to shareholders of each class were as follows:
Years ended October 31, | 2012 | 2011 |
From net investment income | | |
Class A | $ 180,927 | $ 274,577 |
Class T | 68,454 | 50,441 |
Class B | 3,401 | 4,151 |
Class C | 18,732 | 18,471 |
Institutional Class | 7,907 | 10,963 |
Total | $ 279,421 | $ 358,603 |
From net realized gain | | |
Class A | $ 6,239 | $ 24,299 |
Class T | 3,111 | 10,732 |
Class B | 439 | 1,537 |
Class C | 1,561 | 4,105 |
Institutional Class | 200 | 824 |
Total | $ 11,550 | $ 41,497 |
11. Share Transactions.
Transactions for each class of shares were as follows:
| Shares | Dollars |
Years ended October 31, | 2012 | 2011 | 2012 | 2011 |
Class A | | | | |
Shares sold | 281,767 | 334,576 | $ 2,860,417 | $ 3,612,152 |
Reinvestment of distributions | 18,760 | 28,074 | 179,532 | 288,043 |
Shares redeemed | (496,141) | (1,320,166) | (5,059,962) | (14,109,969) |
Net increase (decrease) | (195,614) | (957,516) | $ (2,020,013) | $ (10,209,774) |
Annual Report
Notes to Financial Statements - continued
11. Share Transactions - continued
| Shares | Dollars |
Years ended October 31, | 2012 | 2011 | 2012 | 2011 |
Class T | | | | |
Shares sold | 48,701 | 157,819 | $ 501,218 | $ 1,706,564 |
Reinvestment of distributions | 7,282 | 5,816 | 69,834 | 59,851 |
Shares redeemed | (317,050) | (597,712) | (3,256,292) | (6,300,709) |
Net increase (decrease) | (261,067) | (434,077) | $ (2,685,240) | $ (4,534,294) |
Class B | | | | |
Shares sold | 26 | 248 | $ 248 | $ 2,692 |
Reinvestment of distributions | 355 | 507 | 3,383 | 5,175 |
Shares redeemed | (29,605) | (48,512) | (301,504) | (509,116) |
Net increase (decrease) | (29,224) | (47,757) | $ (297,873) | $ (501,249) |
Class C | | | | |
Shares sold | 47,718 | 69,631 | $ 476,581 | $ 733,867 |
Reinvestment of distributions | 1,986 | 2,055 | 18,732 | 20,799 |
Shares redeemed | (125,244) | (101,679) | (1,268,866) | (1,050,311) |
Net increase (decrease) | (75,540) | (29,993) | $ (773,553) | $ (295,645) |
Institutional Class | | | | |
Shares sold | 90,752 | 74,917 | $ 942,038 | $ 747,771 |
Reinvestment of distributions | 750 | 1,083 | 7,203 | 11,162 |
Shares redeemed | (33,948) | (106,405) | (351,519) | (1,089,806) |
Net increase (decrease) | 57,554 | (30,405) | $ 597,722 | $ (330,873) |
12. Other.
The Fund's organizational documents provide former and current trustees and officers with a limited indemnification against liabilities arising in connection with the performance of their duties to the Fund. In the normal course of business, the Fund may also enter into contracts that provide general indemnifications. The Fund's maximum exposure under these arrangements is unknown as this would be dependent on future claims that may be made against the Fund. The risk of material loss from such claims is considered remote.
Annual Report
To the Trustees of Fidelity Advisor Series VIII and the Shareholders of Fidelity Advisor Value Leaders Fund:
In our opinion, the accompanying statement of assets and liabilities, including the schedule of investments, and the related statements of operations and of changes in net assets and the financial highlights present fairly, in all material respects, the financial position of Fidelity Advisor Value Leaders Fund (a fund of Fidelity Advisor Series VIII) at October 31, 2012, the results of its operations for the year then ended, the changes in its net assets for each of the two years in the period then ended and the financial highlights for each of the five years in the period then ended, in conformity with accounting principles generally accepted in the United States of America. These financial statements and financial highlights (hereafter referred to as "financial statements") are the responsibility of the Fidelity Advisor Value Leaders Fund's management. Our responsibility is to express an opinion on these financial statements based on our audits. We conducted our audits of these financial statements in accordance with the standards of the Public Company Accounting Oversight Board (United States). Those standards require that we plan and perform the audit to obtain reasonable assurance about whether the financial statements are free of material misstatement. An audit includes examining, on a test basis, evidence supporting the amounts and disclosures in the financial statements, assessing the accounting principles used and significant estimates made by management, and evaluating the overall financial statement presentation. We believe that our audits, which included confirmation of securities at October 31, 2012 by correspondence with the custodian and brokers, provide a reasonable basis for our opinion.
PricewaterhouseCoopers LLP
Boston, Massachusetts
December 17, 2012
Annual Report
The Trustees, Members of the Advisory Board, and executive officers of the trust and fund, as applicable, are listed below. The Board of Trustees governs the fund and is responsible for protecting the interests of shareholders. The Trustees are experienced executives who meet periodically throughout the year to oversee the fund's activities, review contractual arrangements with companies that provide services to the fund, oversee management of the risks associated with such activities and contractual arrangements, and review the fund's performance. Except for James C. Curvey, each of the Trustees oversees 236 funds advised by FMR or an affiliate. Mr. Curvey oversees 443 funds advised by FMR or an affiliate.
The Trustees hold office without limit in time except that (a) any Trustee may resign; (b) any Trustee may be removed by written instrument, signed by at least two-thirds of the number of Trustees prior to such removal; (c) any Trustee who requests to be retired or who has become incapacitated by illness or injury may be retired by written instrument signed by a majority of the other Trustees; and (d) any Trustee may be removed at any special meeting of shareholders by a two-thirds vote of the outstanding voting securities of the trust. Each Trustee who is not an interested person (as defined in the 1940 Act) (Independent Trustee), shall retire not later than the last day of the calendar year in which his or her 75th birthday occurs. The Independent Trustees may waive this mandatory retirement age policy with respect to individual Trustees. The executive officers and Advisory Board Members hold office without limit in time, except that any officer and Advisory Board Member may resign or may be removed by a vote of a majority of the Trustees at any regular meeting or any special meeting of the Trustees. Except as indicated, each individual has held the office shown or other offices in the same company for the past five years.
Experience, Skills, Attributes, and Qualifications of the Fund's Trustees. The Governance and Nominating Committee has adopted a statement of policy that describes the experience, qualifications, attributes, and skills that are necessary and desirable for potential Independent Trustee candidates (Statement of Policy). The Board believes that each Trustee satisfied at the time he or she was initially elected or appointed a Trustee, and continues to satisfy, the standards contemplated by the Statement of Policy. The Governance and Nominating Committee also engages professional search firms to help identify potential Independent Trustee candidates who have the experience, qualifications, attributes, and skills consistent with the Statement of Policy. From time to time, additional criteria based on the composition and skills of the current Independent Trustees, as well as experience or skills that may be appropriate in light of future changes to board composition, business conditions, and regulatory or other developments, have also been considered by the professional search firms and the Governance and Nominating Committee. In addition, the Board takes into account the Trustees' commitment and participation in Board and committee meetings, as well as their leadership of standing and ad hoc committees throughout their tenure.
In determining that a particular Trustee was and continues to be qualified to serve as a Trustee, the Board has considered a variety of criteria, none of which, in isolation, was controlling. The Board believes that, collectively, the Trustees have balanced and diverse experience, qualifications, attributes, and skills, which allow the Board to operate effectively in governing the fund and protecting the interests of shareholders. Information about the specific experience, skills, attributes, and qualifications of each Trustee, which in each case led to the Board's conclusion that the Trustee should serve (or continue to serve) as a trustee of the fund, is provided below.
Annual Report
Board Structure and Oversight Function. James C. Curvey is an interested person (as defined in the 1940 Act) and currently serves as Chairman. The Trustees have determined that an interested Chairman is appropriate and benefits shareholders because an interested Chairman has a personal and professional stake in the quality and continuity of services provided to the fund. Independent Trustees exercise their informed business judgment to appoint an individual of their choosing to serve as Chairman, regardless of whether the Trustee happens to be independent or a member of management. The Independent Trustees have determined that they can act independently and effectively without having an Independent Trustee serve as Chairman and that a key structural component for assuring that they are in a position to do so is for the Independent Trustees to constitute a substantial majority for the Board. The Independent Trustees also regularly meet in executive session. Ned C. Lautenbach serves as Chairman of the Independent Trustees and as such (i) acts as a liaison between the Independent Trustees and management with respect to matters important to the Independent Trustees and (ii) with management prepares agendas for Board meetings.
Fidelity funds are overseen by different Boards of Trustees. The fund's Board oversees Fidelity's equity and high income funds and another Board oversees Fidelity's investment-grade bond, money market, and asset allocation funds. The asset allocation funds may invest in Fidelity funds overseen by the fund's Board. The use of separate Boards, each with its own committee structure, allows the Trustees of each group of Fidelity funds to focus on the unique issues of the funds they oversee, including common research, investment, and operational issues. On occasion, the separate Boards establish joint committees to address issues of overlapping consequences for the Fidelity funds overseen by each Board.
The Trustees operate using a system of committees to facilitate the timely and efficient consideration of all matters of importance to the Trustees, the fund, and fund shareholders and to facilitate compliance with legal and regulatory requirements and oversight of the fund's activities and associated risks. The Board, acting through its committees, has charged FMR and its affiliates with (i) identifying events or circumstances the occurrence of which could have demonstrably adverse effects on the fund's business and/or reputation; (ii) implementing processes and controls to lessen the possibility that such events or circumstances occur or to mitigate the effects of such events or circumstances if they do occur; and (iii) creating and maintaining a system designed to evaluate continuously business and market conditions in order to facilitate the identification and implementation processes described in (i) and (ii) above. Because the day-to-day operations and activities of the fund are carried out by or through FMR, its affiliates and other service providers, the fund's exposure to risks is mitigated but not eliminated by the processes overseen by the Trustees. While each of the Board's committees has responsibility for overseeing different aspects of the fund's activities, oversight is exercised primarily through the Operations, Audit, and Compliance Committees. In addition, the Independent Trustees have worked with FMR to enhance the Board's oversight of investment and financial risks, legal and regulatory risks, technology risks, and operational risks, including the development of additional risk reporting to the Board. For example, a working group comprised of Independent Trustees and FMR has worked and continues to work to review the Fidelity funds' valuation-related activities, reporting and risk management. Appropriate personnel, including but not limited to the fund's Chief Compliance Officer (CCO), FMR's internal auditor, the independent accountants, the fund's Treasurer and portfolio management personnel, make periodic reports to the Board's committees, as appropriate, including an annual review of FMR's risk management program for the Fidelity funds. The responsibilities of each standing committee, including their oversight responsibilities, are described further under "Standing Committees of the Fund's Trustees."
Annual Report
Trustees and Officers - continued
The fund's Statement of Additional Information (SAI) includes more information about the Trustees. To request a free copy, call Fidelity at 1-877-208-0098.
Interested Trustees*:
Correspondence intended for each Trustee who is an interested person may be sent to Fidelity Investments, 82 Devonshire Street, Boston, Massachusetts 02109.
Name, Age; Principal Occupations and Other Relevant Experience+ |
James C. Curvey (77) |
| Year of Election or Appointment: 2007 Mr. Curvey is Trustee and Chairman of the Board of Trustees of certain Trusts. Mr. Curvey also serves as Trustee (2007-present) of other investment companies advised by FMR. Mr. Curvey is a Director of Fidelity Investments Money Management, Inc. (2009-present), Director of Fidelity Research & Analysis Co. (2009-present) and Director of FMR and FMR Co., Inc. (2007-present). Mr. Curvey is also Vice Chairman (2007-present) and Director of FMR LLC. In addition, Mr. Curvey serves as an Overseer for the Boston Symphony Orchestra and a member of the Trustees of Villanova University. Previously, Mr. Curvey was the Vice Chairman (2006-2007) and Director (2000-2007) of FMR Corp. |
Ronald P. O'Hanley (55) |
| Year of Election or Appointment: 2011 Mr. O'Hanley is Director of FMR Co., Inc. (2010-present), Director of Fidelity Investments Money Management, Inc. (2010-present), Director of Fidelity Research & Analysis Company (2010-present), President of Fidelity Asset Management and Corporate Services and a member of Fidelity's Executive Committee (2010-present). Previously, Mr. O'Hanley served as President and Chief Executive Officer of BNY Mellon Asset Management (2007-2010). Mr. O'Hanley also served as Vice Chairman of Bank New York Mellon Corp. and a member of that firm's Executive Committee. Prior to the 2007 merger of The Bank of New York and Mellon Financial Corporation, he was Vice Chairman of Mellon Financial Corporation and President and Chief Executive Officer of Mellon Asset Management. He joined Mellon in February 1997. Mr. O'Hanley currently serves as Chairman of the Boston Public Library Foundation Board of Directors and sits on the Board of Directors of Beth Israel Deaconess Medical Center, the Board of Trustees of the Marine Biological Laboratory and the Advisory Board of the Maxwell School of Citizenship and Public Administration at Syracuse University. Mr. O'Hanley also chairs the Council on Asset Management for the Financial Services Roundtable and is a member of the Board of Directors of Institutional Investor's U.S. Institute. |
* Trustees have been determined to be "Interested Trustees" by virtue of, among other things, their affiliation with the trust or various entities under common control with FMR.
+ The information above includes each Trustee's principal occupation during the last five years and other information relating to the experience, attributes, and skills relevant to each Trustee's qualifications to serve as a Trustee, which led to the conclusion that each Trustee should serve as a Trustee for the fund.
Annual Report
Trustees and Officers - continued
Independent Trustees:
Correspondence intended for each Independent Trustee (that is, the Trustees other than the Interested Trustees) may be sent to Fidelity Investments, P.O. Box 55235, Boston, Massachusetts 02205-5235.
Name, Age; Principal Occupations and Other Relevant Experience+ |
Dennis J. Dirks (64) |
| Year of Election or Appointment: 2005 Prior to his retirement in May 2003, Mr. Dirks was Chief Operating Officer and a member of the Board of The Depository Trust & Clearing Corporation (DTCC). He also served as President, Chief Operating Officer, and Board member of The Depository Trust Company (DTC) and President and Board member of the National Securities Clearing Corporation (NSCC). In addition, Mr. Dirks served as Chief Executive Officer and Board member of the Government Securities Clearing Corporation, Chief Executive Officer and Board member of the Mortgage-Backed Securities Clearing Corporation, as a Trustee and a member of the Finance Committee of Manhattan College (2005-2008), and as a Trustee and a member of the Finance Committee of AHRC of Nassau County (2006-2008). Mr. Dirks is a member of the Independent Directors Council (IDC) Governing Council (2010-present) and Board of Directors for The Brookville Center for Children's Services, Inc. (2009-present). |
Alan J. Lacy (59) |
| Year of Election or Appointment: 2008 Mr. Lacy serves as Senior Adviser (2007-present) of Oak Hill Capital Partners, L.P. (private equity). Mr. Lacy also served as Chief Executive Officer (2000-2005) and Vice Chairman (2005-2006) of Sears Holdings Corporation and Sears, Roebuck and Co. (retail). In addition, Mr. Lacy serves as a member of the Board of Directors of Dave & Buster's Entertainment, Inc. (restaurant and entertainment complexes, 2010-present), Earth Fare, Inc. (retail grocery, 2012-present), The Hillman Companies, Inc. (hardware wholesalers, 2010-present), and Bristol-Myers Squibb Company (global pharmaceuticals, 2008-present). Mr. Lacy is a member of the Board of Trustees of The National Parks Conservation Association (2006-present). Previously, Mr. Lacy served as Chairman of the Board of Trustees of the National Parks Conservation Association (2008-2011) and as a member of the Board of Directors for the Western Union Company (global money transfer, 2006-2011). |
Ned C. Lautenbach (68) |
| Year of Election or Appointment: 2000 Mr. Lautenbach is Chairman of the Independent Trustees of the Equity and High Income Funds (2006-present). Mr. Lautenbach currently serves as the Lead Director of the Eaton Corporation Board of Directors (diversified industrial, 1997-present). Mr. Lautenbach is Chairman of the Board of Directors of the Philharmonic Center for the Arts in Naples, Florida (2012-present) and a member of the Council on Foreign Relations (1994-present). Previously, Mr. Lautenbach was a Partner/Advisory Partner at Clayton, Dubilier & Rice, LLC (private equity investment, 1998-2010), as well as a Director of Sony Corporation (2006-2007). |
Joseph Mauriello (68) |
| Year of Election or Appointment: 2008 Prior to his retirement in January 2006, Mr. Mauriello served in numerous senior management positions including Deputy Chairman and Chief Operating Officer (2004-2005), and Vice Chairman of Financial Services (2002-2004) of KPMG LLP US (professional services, 1965-2005). Mr. Mauriello currently serves as a member of the Board of Directors of XL Group plc. (global insurance and re-insurance, 2006-present). Previously, Mr. Mauriello served as a Director of the Hamilton Funds of the Bank of New York (2006-2007) and of Arcadia Resources Inc. (health care services and products, 2007-2012). |
Robert W. Selander (62) |
| Year of Election or Appointment: 2011 Previously, Mr. Selander served as a Member of the Advisory Board of Fidelity's Equity and High Income Funds (2011), Executive Vice Chairman (2010), Chief Executive Officer (2009-2010), and President and Chief Executive Officer (1997-2009) of Mastercard, Inc. |
Cornelia M. Small (68) |
| Year of Election or Appointment: 2005 Ms. Small is a member of the Board of Directors (2009-present) and Chair of the Investment Committee (2010-present) of the Teagle Foundation. Ms. Small also serves on the Investment Committee of the Berkshire Taconic Community Foundation (2008-present). Previously, Ms. Small served as Chairperson (2002-2008) and a member of the Investment Committee and Chairperson (2008-2012) and a member of the Board of Trustees of Smith College. In addition, Ms. Small served as Chief Investment Officer, Director of Global Equity Investments, and a member of the Board of Directors of Scudder, Stevens & Clark and Scudder Kemper Investments. |
William S. Stavropoulos (73) |
| Year of Election or Appointment: 2001 Mr. Stavropoulos is Vice Chairman of the Independent Trustees of the Equity and High Income Funds (2006-present). Mr. Stavropoulos serves as President and Founder of the Michigan Baseball Foundation, the Great Lakes Loons (2007-present). Mr. Stavropoulos is Chairman Emeritus of the Board of Directors of The Dow Chemical Company, where he previously served in numerous senior management positions, including President, CEO (1995-2000; 2002-2004), Chairman of the Executive Committee (2000-2006), and as a member of the Board of Directors (1990-2006). Currently, Mr. Stavropoulos is a Director of Univar Inc. (global distributor of commodity and specialty chemicals, Chairman from 2010-May 2012 and Lead Director from May 2012-present), Teradata Corporation (data warehousing and technology solutions, 2008-present), Maersk Inc. (industrial conglomerate), and Tyco International, Ltd. (multinational manufacturing and services, 2007-present), and a member of the Advisory Board for Metalmark Capital LLC (private equity investment, 2005-present). Mr. Stavropoulos is an operating advisor to Clayton, Dubilier & Rice, LLC (private equity investment). In addition, Mr. Stavropoulos is a member of the University of Notre Dame Advisory Council for the College of Science, a Trustee of the Rollin L. Gerstacker Foundation, and a Director of the Naples Philharmonic Center for the Arts. Previously, Mr. Stavropoulos served as a Director of Chemical Financial Corporation (bank holding company, 1993-2012). |
David M. Thomas (63) |
| Year of Election or Appointment: 2008 Previously, Mr. Thomas served as Executive Chairman (2005-2006) and Chairman and Chief Executive Officer (2000-2005) of IMS Health, Inc. (pharmaceutical and healthcare information solutions), and a Director of Fortune Brands, Inc. (consumer products, 2000-2011). In addition, Mr. Thomas serves as Non-Executive Chairman of the Board of Directors of Fortune Brands Home and Security (home and security products, 2011-present), and as a member of the Board of Directors of Interpublic Group of Companies, Inc. (marketing communication, 2004-present). |
Michael E. Wiley (62) |
| Year of Election or Appointment: 2008 Mr. Wiley also serves as a Director of Asia Pacific Exploration Consolidated (international oil and gas exploration and production, 2008-present). Mr. Wiley serves as a Director of Tesoro Corporation (independent oil refiner and marketer, 2005-present), and a Director of Bill Barrett Corporation (exploration and production, 2005-present). In addition, Mr. Wiley also serves as a Director of Post Oak Bank (privately-held bank, 2004-present). Previously, Mr. Wiley served as a member of the Board of Trustees of the University of Tulsa (2000-2006; 2007-2010), as a Senior Energy Advisor of Katzenbach Partners, LLC (consulting, 2006-2007), as an Advisory Director of Riverstone Holdings (private investment), Chairman, President, and CEO of Baker Hughes, Inc. (oilfield services, 2000-2004), and as Director of Spinnaker Exploration Company (exploration and production, 2001-2005). |
+ The information above includes each Trustee's principal occupation during the last five years and other information relating to the experience, attributes, and skills relevant to each Trustee's qualifications to serve as a Trustee, which led to the conclusion that each Trustee should serve as a Trustee for the fund.
Advisory Board Members and Executive Officers:
Correspondence intended for David A. Rosow and Garnett A. Smith may be sent to Fidelity Investments, P.O. Box 55235, Boston, Massachusetts 02205-5235. Correspondence intended for each executive officer, Edward C. Johnson 3d, and Peter S. Lynch may be sent to Fidelity Investments, 82 Devonshire Street, Boston, Massachusetts 02109.
Name, Age; Principal Occupation |
Edward C. Johnson 3d (82) |
| Year of Election or Appointment: 2011 Member of the Advisory Board of Fidelity's Equity and High Income Funds. Mr. Johnson serves as Chief Executive Officer, Chairman, and a Director of FMR LLC, and also serves as Chairman and Director of FIL Limited. Previously, Mr. Johnson served as a Trustee and Chairman of the Board of certain Fidelity Trusts, Chairman and a Director of FMR, Chairman and a Director of FMR Co., Inc., and President of FMR LLC (2006-2007). |
Peter S. Lynch (68) |
| Year of Election or Appointment: 2003 Member of the Advisory Board of Fidelity's Equity and High Income Funds. Mr. Lynch is Vice Chairman and a Director of FMR and FMR Co., Inc. In addition, Mr. Lynch serves as a Trustee of Boston College and as the Chairman of the Inner-City Scholarship Fund. Previously, Mr. Lynch served on the Special Olympics International Board of Directors (1997-2006). |
David A. Rosow (70) |
| Year of Election or Appointment: 2012 Member of the Advisory Board of Fidelity's Equity and High Income Funds. Chairman and Chief Executive Officer of International Golf Group, Inc. (golf course development, 1989-present). Previously, Mr. Rosow served as Chairman and Chief Executive Officer of Rosow & Company, Inc. (private investment company, 1989-2011), a Lead Director of Hudson United Bancorp (2001-2006) and as a Director of TD Banknorth (1996-2006). In addition, Mr. Rosow is a member (2008-present) and President (2009-present) of the Town Council of Palm Beach, Florida. |
Garnett A. Smith (65) |
| Year of Election or Appointment: 2012 Member of the Advisory Board of Fidelity's Equity and High Income Funds. Prior to Mr. Smith's retirement, he served as Chairman and Chief Executive Officer of Inbrand Corp. (manufacturer of personal absorbent products, 1990-1997). He also served as President (1986-1990) of Inbrand Corp. Prior to his employment with Inbrand Corp., he was employed by a retail fabric chain and North Carolina National Bank. In addition, Mr. Smith is a board member of the Jackson Hole Land Trust (2009-present). |
Kenneth B. Robins (43) |
| Year of Election or Appointment: 2008 President and Treasurer of Fidelity's Equity and High Income Funds. Mr. Robins also serves as President and Treasurer (2010-present) and Assistant Treasurer (2009-present) of other Fidelity funds and is an employee of Fidelity Investments (2004-present). Previously, Mr. Robins served as Deputy Treasurer of the Fidelity funds (2005-2008) and Treasurer and Chief Financial Officer of The North Carolina Capital Management Trust: Cash and Term Portfolios (2006-2008). |
Brian B. Hogan (48) |
| Year of Election or Appointment: 2009 Vice President of Equity and High Income Funds. Mr. Hogan also serves as President of FMR's Equity Division (2009-present). Previously, Mr. Hogan served as Senior Vice President, Equity Research of FMR (2006-2009) and as a portfolio manager. |
Thomas C. Hense (48) |
| Year of Election or Appointment: 2008 or 2010 Vice President of Fidelity's High Income (2008), Small Cap (2008), and Value (2010) Funds. Previously, Mr. Hense served as a portfolio manager for Fidelity's Institutional Money Management Group (Pyramis) (2003-2008). |
Scott C. Goebel (44) |
| Year of Election or Appointment: 2008 Secretary and Chief Legal Officer (CLO) of the Fidelity funds. Mr. Goebel also serves as Secretary of Fidelity Investments Money Management, Inc. (FIMM) (2010-present) and Fidelity Research and Analysis Company (FRAC) (2010-present); Secretary and CLO of The North Carolina Capital Management Trust: Cash and Term Portfolios (2008-present); General Counsel, Secretary, and Senior Vice President of FMR (2008-present) and FMR Co., Inc. (2008-present); employed by FMR LLC or an affiliate (2001-present); Chief Legal Officer of Fidelity Management & Research (Hong Kong) Limited (2008-present) and Assistant Secretary of Fidelity Management & Research (Japan) Inc. (2008-present), and Fidelity Management & Research (U.K.) Inc. (2008-present). Previously, Mr. Goebel served as Assistant Secretary of FIMM (2008-2010), FRAC (2008-2010), and the Funds (2007-2008) and as Vice President and Secretary of Fidelity Distributors Corporation (FDC) (2005-2007). |
William C. Coffey (43) |
| Year of Election or Appointment: 2009 Assistant Secretary of Fidelity's Equity and High Income Funds. Mr. Coffey also serves as Senior Vice President and Deputy General Counsel of FMR LLC (2010-present), and is an employee of Fidelity Investments. Previously, Mr. Coffey served as Vice President and Associate General Counsel of FMR LLC (2005-2009). |
Elizabeth Paige Baumann (44) |
| Year of Election or Appointment: 2012 Anti-Money Laundering (AML) Officer of the Fidelity funds. Ms. Baumann also serves as AML Officer of The North Carolina Capital Management Trust: Cash and Term Portfolios (2012-present), Chief AML Officer of FMR LLC (2012-present), and is an employee of Fidelity Investments. Previously, Ms. Baumann served as Vice President and Deputy Anti-Money Laundering Officer (2007-2012). |
Christine Reynolds (54) |
| Year of Election or Appointment: 2008 Chief Financial Officer of the Fidelity funds. Ms. Reynolds became President of Fidelity Pricing and Cash Management Services (FPCMS) in August 2008. Ms. Reynolds served as Chief Operating Officer of FPCMS (2007-2008). Previously, Ms. Reynolds served as President, Treasurer, and Anti-Money Laundering officer of the Fidelity funds (2004-2007). |
Joseph A. Hanlon (44) |
| Year of Election or Appointment: 2012 Chief Compliance Officer of Fidelity's Equity and High Income Funds. Mr. Hanlon serves as Compliance Officer of FMR, FMR Co., Inc., Fidelity Investments Money Management, Inc. (FIMM), Fidelity Research and Analysis Company (FRAC), Fidelity Management & Research (Japan) Inc., Fidelity Management & Research (U.K.) Inc., Fidelity Management & Research (Hong Kong), and Strategic Advisers, Inc. (2009-present), as Senior Vice President of the Fidelity Asset Management Division (2009-present), and is an employee of Fidelity Investments. |
Joseph F. Zambello (55) |
| Year of Election or Appointment: 2011 Deputy Treasurer of the Fidelity funds. Mr. Zambello is an employee of Fidelity Investments. Previously, Mr. Zambello served as Vice President of FMR's Program Management Group (2009-2011) and Vice President of the Transfer Agent Oversight Group (2005-2009). |
Adrien E. Deberghes (45) |
| Year of Election or Appointment: 2008 Deputy Treasurer of Fidelity's Equity and High Income Funds. Mr. Deberghes also serves as Vice President (2011-present) and Assistant Treasurer (2010-present) of other Fidelity funds, and is an employee of Fidelity Investments (2008-present). Previously, Mr. Deberghes served as Senior Vice President of Mutual Fund Administration at State Street Corporation (2007-2008), Senior Director of Mutual Fund Administration at Investors Bank & Trust (2005-2007), and Director of Finance for Dunkin' Brands (2000-2005). |
Stephen Sadoski (41) |
| Year of Election or Appointment: 2012 Deputy Treasurer of Fidelity's Equity and High Income Funds. Mr. Sadoski also serves as Assistant Treasurer of other Fidelity funds (2012-present) and is an employee of Fidelity Investments (2012-present). Previously, Mr. Sadoski served as an assistant chief accountant in the Division of Investment Management of the Securities and Exchange Commission (SEC) (2009-2012) and as a senior manager at Deloitte & Touche (1997-2009). |
Stephanie J. Dorsey (43) |
| Year of Election or Appointment: 2010 Assistant Treasurer of Fidelity's Equity and High Income Funds. Ms. Dorsey also serves as Deputy Treasurer of other Fidelity funds (2008-present) and is an employee of Fidelity Investments (2008-present). Previously, Ms. Dorsey served as Treasurer (2004-2008) of the JPMorgan Mutual Funds and Vice President (2004-2008) of JPMorgan Chase Bank. |
John R. Hebble (54) |
| Year of Election or Appointment: 2009 Assistant Treasurer of Fidelity's Equity and High Income Funds. Mr. Hebble also serves as President (2011-present), Treasurer, and Chief Financial Officer of The North Carolina Capital Management Trust: Cash and Term Portfolios (2008-present), President and Treasurer of other Fidelity funds (2008-present) and is an employee of Fidelity Investments. |
Gary W. Ryan (54) |
| Year of Election or Appointment: 2005 Assistant Treasurer of the Fidelity funds. Mr. Ryan is an employee of Fidelity Investments. Previously, Mr. Ryan served as Vice President of Fund Reporting in Fidelity Pricing and Cash Management Services (FPCMS) (1999-2005). |
Jonathan Davis (44) |
| Year of Election or Appointment: 2010 Assistant Treasurer of the Fidelity funds. Mr. Davis is also Assistant Treasurer of Fidelity Rutland Square Trust II and Fidelity Commonwealth Trust II. Mr. Davis is an employee of Fidelity Investments. Previously, Mr. Davis served as Vice President and Associate General Counsel of FMR LLC (2003-2010). |
Annual Report
Institutional Class designates 100% of the dividend distributed during the fiscal year as qualifying for the dividends-received deduction for corporate shareholders.
Institutional Class designates 100% of the dividend distributed during the fiscal year as amounts which may be taken into account as a dividend for purposes of the maximum rate under section 1(h)(11) of the Internal Revenue Code.
The fund will notify shareholders in January 2013 of amounts for use in preparing 2012 income tax returns.
Annual Report
Board Approval of Investment Advisory Contracts and Management Fees
Fidelity Advisor Value Leaders Fund
Each year, the Board of Trustees, including the Independent Trustees (together, the Board), votes on the renewal of the management contract and sub-advisory agreements (together, the Advisory Contracts) for the fund. The Board, assisted by the advice of fund counsel and Independent Trustees' counsel, requests and considers a broad range of information relevant to the renewal of the Advisory Contracts throughout the year.
The Board meets regularly and, at each of its meetings, considers factors that are relevant to its annual consideration of the renewal of the fund's Advisory Contracts, including the services and support provided to the fund and its shareholders. The Board has established various standing committees, each composed of and chaired by Independent Trustees with varying backgrounds, to which the Board has assigned specific subject matter responsibilities in order to enhance effective decision-making by the Board. The Board, acting directly and through its Committees, requests and receives information concerning the annual consideration of the renewal of the fund's Advisory Contracts. The Board also meets as needed to consider matters specifically related to the Board's annual consideration of the renewal of Advisory Contracts. Members of the Board may also meet with trustees of other Fidelity funds through ad hoc joint committees to discuss certain matters relevant to the Fidelity funds.
At its July 2012 meeting, the Board of Trustees, including the Independent Trustees, unanimously determined to renew the fund's Advisory Contracts. In reaching its determination, the Board considered all factors it believed relevant, including (i) the nature, extent, and quality of the services to be provided to the fund and its shareholders (including the investment performance of the fund); (ii) the competitiveness of the fund's management fee and total expense ratio relative to peer funds; (iii) the total costs of the services to be provided by and the profits to be realized by Fidelity from its relationship with the fund; (iv) the extent to which economies of scale exist and would be realized as the fund grows; and (v) whether fee levels reflect these economies of scale, if any, for the benefit of fund shareholders.
In considering whether to renew the Advisory Contracts for the fund, the Board reached a determination, with the assistance of fund counsel and Independent Trustees' counsel and through the exercise of its business judgment, that the renewal of the Advisory Contracts is in the best interests of the fund and its shareholders and that the compensation payable under the Advisory Contracts is fair and reasonable. The Board's decision to renew the Advisory Contracts was not based on any single factor, but rather was based on a comprehensive consideration of all the information provided to the Board at its meetings throughout the year. The Board, in reaching its determination to renew the Advisory Contracts, is aware that shareholders in the fund have a broad range of investment choices available to them, including a wide choice among mutual funds offered by Fidelity's competitors, and that the fund's shareholders, who have the opportunity to review and weigh the disclosure provided by the fund in its prospectus and other public disclosures, have chosen to invest in this fund, managed by Fidelity.
Annual Report
Board Approval of Investment Advisory Contracts and
Management Fees - continued
Nature, Extent, and Quality of Services Provided. The Board considered the staffing within the investment adviser, FMR, and the sub-advisers (together, the Investment Advisers), including the backgrounds of the fund's investment personnel, and also considered the fund's investment objective, strategies, and related investment philosophy. The Independent Trustees also had discussions with senior management of Fidelity's investment operations and investment groups. The Board considered the structure of the portfolio manager compensation program and whether this structure provides appropriate incentives to act in the best interests of the fund.
Resources Dedicated to Investment Management and Support Services. The Board and the Fund Oversight and Research Committees reviewed the general qualifications and capabilities of the Investment Advisers' investment staff, including its size, education, experience, and resources, as well as the Investment Advisers' approach to recruiting, training, managing, and compensating investment personnel. The Board also noted that FMR has continued to increase the resources devoted to non-U.S. offices, including expansion of Fidelity's global investment organization. The Board noted that Fidelity's analysts have extensive resources, tools and capabilities that allow them to conduct sophisticated quantitative and fundamental analysis, as well as credit analysis of issuers, counterparties and guarantors. The Board also believes that Fidelity's investment professionals have sufficient access to global information and data so as to provide competitive investment results over time, and that those professionals also have access to sophisticated tools that permit them to assess portfolio construction and risk and performance attribution characteristics continuously, as well as to transmit new information and research conclusions rapidly around the world. Additionally, in its deliberations, the Board considered the Investment Advisers' trading and risk management capabilities and resources, which are an integral part of the investment management process.
Shareholder and Administrative Services. The Board considered (i) the nature, extent, quality, and cost of advisory, administrative, and shareholder services performed by the Investment Advisers and their affiliates under the Advisory Contracts and under separate agreements covering transfer agency, pricing and bookkeeping, and securities lending services for the fund; (ii) the nature and extent of the supervision of third party service providers, principally custodians and subcustodians; and (iii) the resources devoted to, and the record of compliance with, the fund's compliance policies and procedures. The Board also reviewed the allocation of fund brokerage, including allocations to brokers affiliated with the Investment Advisers, the use of brokerage commissions to pay fund expenses, and the use of "soft" commission dollars to pay for research services.
Annual Report
The Board noted that the growth of fund assets over time across the complex allows Fidelity to reinvest in the development of services designed to enhance the value or convenience of the Fidelity funds as investment vehicles. These services include 24-hour access to account information and market information through telephone representatives and over the Internet, investor education materials and asset allocation tools, and the expanded availability of Fidelity Investor Centers.
Investment in a Large Fund Family. The Board considered the benefits to shareholders of investing in a Fidelity fund, including the benefits of investing in a fund that is part of a large family of funds offering a variety of investment disciplines and providing a large variety of mutual fund investor services. The Board noted that Fidelity had taken, or had made recommendations that resulted in the Fidelity funds taking, a number of actions over the previous year that benefited particular funds, including (i) continuing to dedicate additional resources to investment research and support of the senior management team that oversees asset management; (ii) persisting in efforts to enhance Fidelity's research capabilities, in particular, international research; (iii) launching new funds and making other enhancements to meet client needs for global and income-oriented solutions; (iv) continuing to launch dedicated lower cost underlying funds to meet investment management's portfolio construction needs related to expanding underlying fund options, specifically for the Freedom Fund product lines; (v) adopting a "Stock Selector" sector neutral investment approach and employing a team of portfolio managers who are sector specialists to manage certain funds; (vi) rationalizing product lines and gaining increased efficiencies through the mergers of several funds into other funds; (vii) strengthening the Spartan Index Fund product line by adding new funds and/or new low-cost institutional share classes, restructuring fund expenses to accommodate new classes, and reducing investment minimums for certain classes of shares; (viii) modifying the eligibility criteria for Institutional Class shares to increase their appeal to government entities and charitable investors; and (ix) reducing certain transfer agent fee rates.
Investment Performance. The Board considered whether the fund has operated in accordance with its investment objective, as well as its record of compliance with its investment restrictions. It also reviewed the fund's absolute investment performance for each class, as well as the fund's relative investment performance for each class measured over multiple periods against (i) a broad-based securities market index, and (ii) a peer group of mutual funds deemed appropriate by Fidelity and reviewed by the Board. The following charts considered by the Board show, over the one-, three-, and five-year periods ended December 31, 2011, the cumulative total returns of Institutional Class (Class I) and Class C of the fund, the cumulative total returns of a broad-based securities market index ("benchmark"), and a range of cumulative total returns of a peer group of mutual funds identified by Morningstar, Inc. as having an investment style similar to that of the fund based on underlying portfolio holdings. The returns of Institutional Class (Class I) and Class C show the performance of the highest and lowest performing classes, respectively (based on five-year performance). The box within each chart shows the 25th percentile return (top of box) and the 75th percentile return (bottom of box) of the peer group. Returns shown above the box are in the first quartile and returns shown below the box are in the fourth quartile. The percentage beaten numbers noted below each chart correspond to the percentile box and represent the percentage of funds in the peer group whose performance was equal to or lower than that of the class indicated.
Annual Report
Board Approval of Investment Advisory Contracts and
Management Fees - continued
Fidelity Advisor Value Leaders Fund

The Board reviewed the fund's relative investment performance against its peer group and noted that the performance of Institutional Class (Class I) of the fund was in the fourth quartile for all the periods shown. The Board also noted that the investment performance of the fund was lower than its benchmark for all the periods shown. The Board considered that the variations in performance among the fund's classes reflect the variations in class expenses, which result in lower performance for higher expense classes. The Board discussed with FMR actions to improve the fund's disappointing performance relative to its peer group and benchmark. The Board noted that this fund had underperformed in the past and discussed with FMR its disappointment with the continued underperformance of the fund. The Board also reviewed the fund's performance since inception as well as performance in the current year. The Board will continue to closely monitor the performance of the fund in the coming year and discuss with FMR other appropriate actions to address the performance of the fund.
The Board also considered that the fund's management fee is subject to upward or downward adjustment depending upon whether, and to what extent, the fund's investment performance for the performance period exceeds, or is exceeded by, the record (over the same period) of a Board-approved performance adjustment index. The Board noted that the performance adjustment provides FMR with a strong economic incentive to seek to achieve superior performance for the fund's shareholders and helps to more closely align the interests of FMR and the fund's shareholders.
Annual Report
Based on its review, the Board concluded that the nature, extent, and quality of services provided to the fund under the Advisory Contracts should benefit the fund's shareholders.
Competitiveness of Management Fee and Total Expense Ratio. The Board considered the fund's management fee and total expense ratio compared to "mapped groups" of competitive funds and classes. Fidelity creates "mapped groups" by combining similar Lipper investment objective categories that have comparable management fee characteristics. Combining Lipper investment objective categories aids the Board's management fee and total expense ratio comparisons by broadening the competitive group used for comparison and by reducing the number of universes to which various Fidelity funds are compared.
Management Fee. The Board considered two proprietary management fee comparisons for the 12-month periods shown in the chart below. The group of Lipper funds used by the Board for management fee comparisons is referred to below as the "Total Mapped Group." The Total Mapped Group comparison focuses on a fund's standing relative to the total universe of comparable funds available to investors in terms of gross management fees before expense reimbursements or caps, and without giving effect to the fund's performance adjustment. "TMG %" represents the percentage of funds in the Total Mapped Group that had management fees that were lower than the fund's. For example, a TMG % of 10% means that 90% of the funds in the Total Mapped Group had higher management fees than the fund. The "Asset-Size Peer Group" (ASPG) comparison focuses on a fund's standing relative to non-Fidelity funds similar in size to the fund within the Total Mapped Group. The ASPG represents at least 15% of the funds in the Total Mapped Group with comparable asset size and management fee characteristics, subject to a minimum of 50 funds (or all funds in the Total Mapped Group if fewer than 50). Additional information, such as the ASPG quartile in which the fund's management fee ranked and the impact of the fund's performance adjustment, is also included in the chart and considered by the Board.
Annual Report
Board Approval of Investment Advisory Contracts and
Management Fees - continued
Fidelity Advisor Value Leaders Fund

The Board noted that the fund's management fee ranked below the median of its Total Mapped Group and below the median of its ASPG for 2011. The Board also noted the effect of the fund's negative performance adjustment on the fund's management fee ranking. The Board noted that the performance adjustment for each year represents calculations for performance periods that differ from the periods shown in the performance charts above.
Based on its review, the Board concluded that the fund's management fee is fair and reasonable in light of the services that the fund receives and the other factors considered.
Total Expense Ratio. In its review of each class's total expense ratio, the Board considered the fund's management fee as well as other fund or class expenses, as applicable, such as transfer agent fees, pricing and bookkeeping fees, fund-paid 12b-1 fees, and custodial, legal, and audit fees. The Board also noted the effects of any waivers and reimbursements on fees and expenses, as well as the impact of the fund's performance adjustment. As part of its review, the Board also considered the current and historical total expense ratios of each class of the fund compared to competitive fund median expenses. Each class of the fund is compared to those funds and classes in the Total Mapped Group (used by the Board for management fee comparisons) that have a similar sales load structure.
The Board noted that the total expense ratio of each of Class A, Class B, and Institutional Class ranked below its competitive median for 2011 and the total expense ratio of each of Class T and Class C ranked above its competitive median for 2011. The Board considered that various factors, including 12b-1 fees, positive or negative performance adjustments, and relatively higher other expenses in the case of small fund size, can affect total expense ratios. The Board noted that the total expense ratio of Class T was above the competitive median primarily because of higher 12b-1 fees on Class T. Class T has a higher 12b-1 fee, but a lower front-end sales charge, than traditionally priced front-end sales charge classes. The Board considered that Class T is primarily sold load-waived in the retirement plan market where its 0.50% 12b-1 fee is comparable to competing no-load, higher 12b-1 fee classes designed specifically for retirement plans. The Board noted that the fund offers multiple classes, each of which has a different sales load and 12b-1 fee structure, and that the multiple structures are intended to offer a range of pricing options for the intermediary market. The Board also noted that the total expense ratios of the classes vary primarily by the level of their 12b-1 fees, although differences in transfer agent fees may also cause expenses to vary from class to class.
Annual Report
Fees Charged to Other Fidelity Clients. The Board also considered Fidelity fee structures and other information with respect to clients of FMR and its affiliates, such as other mutual funds advised or subadvised by FMR or its affiliates, pension plan clients, and other institutional clients. The Board noted the findings of the 2010 ad hoc joint committee (created with the board of other Fidelity funds), which reviewed and compared Fidelity's institutional investment advisory business with its business of providing services to the Fidelity funds, including the differences in services provided, fees charged, and costs incurred, as well as competition in their respective marketplaces.
Based on its review of total expense ratios and fees charged to other Fidelity clients, the Board concluded that the total expense ratio of each class of the fund was reasonable, although in some cases above the median of the universe presented for comparison, in light of the services that the fund and its shareholders receive and the other factors considered.
Costs of the Services and Profitability. The Board considered the revenues earned and the expenses incurred by Fidelity in conducting the business of developing, marketing, distributing, managing, administering and servicing the fund and its shareholders. The Board also considered the level of Fidelity's profits in respect of all the Fidelity funds.
On an annual basis, FMR presents to the Board Fidelity's profitability for the fund. Fidelity calculates the profitability for each fund, as well as aggregate profitability for groups of Fidelity funds and all Fidelity funds, using a series of detailed revenue and cost allocation methodologies which originate with the books and records of Fidelity on which Fidelity's audited financial statements are based. The Audit Committee of the Board reviews any significant changes from the prior year's methodologies.
PricewaterhouseCoopers LLP (PwC), independent registered public accounting firm and auditor to Fidelity and certain Fidelity funds, has been engaged annually by the Board as part of the Board's assessment of Fidelity's profitability analysis. PwC's engagement includes the review and assessment of Fidelity's methodologies used in determining the revenues and expenses attributable to Fidelity's mutual fund business, and completion of agreed-upon procedures surrounding the mathematical accuracy of fund profitability and its conformity to allocation methodologies. After considering PwC's reports issued under the engagement and information provided by Fidelity, the Board concluded that while other allocation methods may also be reasonable, Fidelity's profitability methodologies are reasonable in all material respects.
Annual Report
Board Approval of Investment Advisory Contracts and
Management Fees - continued
The Board also reviewed Fidelity's non-fund businesses and fall-out benefits related to the mutual fund business as well as cases where Fidelity's affiliates may benefit from or be related to the fund's business.
The Board considered the costs of the services provided by and the profits realized by Fidelity in connection with the operation of the fund and was satisfied that the profitability was not excessive in the circumstances.
Economies of Scale. The Board considered whether there have been economies of scale in respect of the management of the Fidelity funds, whether the Fidelity funds (including the fund) have appropriately benefited from any such economies of scale, and whether there is potential for realization of any further economies of scale. The Board considered the extent to which the fund will benefit from economies of scale through increased services to the fund, through waivers or reimbursements, or through fee or expense reductions. The Board also noted that in 2009, it and the board of other Fidelity funds created an ad hoc committee (the Economies of Scale Committee) to analyze whether FMR attains economies of scale in respect of the management and servicing of the Fidelity funds, whether the Fidelity funds have appropriately benefited from such economies of scale, and whether there is potential for realization of any further economies of scale.
The Board recognized that the fund's management contract incorporates a "group fee" structure, which provides for lower group fee rates as total fund assets under FMR's management increase, and for higher group fee rates as total fund assets under FMR's management decrease. FMR calculates the group fee rates based on a tiered asset "breakpoint" schedule that varies based on asset class. The Board considered that the group fee is designed to deliver the benefits of economies of scale to fund shareholders when total Fidelity fund assets increase, even if assets of any particular fund are unchanged or have declined, because some portion of Fidelity's costs are attributable to services provided to all Fidelity funds, and all funds benefit if those costs can be allocated among more assets. The Board concluded that, given the group fee structure, fund shareholders will benefit from lower management fees as assets under FMR's management increase at the fund complex level, regardless of whether Fidelity achieves any such economies of scale.
Annual Report
The Board concluded, taking into account the analysis of the Economies of Scale Committee, that economies of scale, if any, are being appropriately shared between fund shareholders and Fidelity.
Additional Information Requested by the Board. In order to develop fully the factual basis for consideration of the Fidelity funds' Advisory Contracts, the Board requested and received additional information on certain topics, including (i) fund performance trends, actions to be taken by FMR to improve certain funds' overall performance, and Fidelity's long-term strategies for certain funds; (ii) the potential to further rationalize the Fidelity fund lineup with the possibility of achieving savings for the funds and Fidelity; (iii) Fidelity's compensation structure for portfolio managers and other key investment personnel; (iv) the amount of the investment that each portfolio manager has made in the Fidelity fund(s) that he or she manages; (v) the realization of fall-out benefits in certain Fidelity business units; (vi) Fidelity's group fee structures, the potential impact of regulatory changes on such structures, and the rationale for the individual fee rates of certain funds; (vii) fund profitability methodology, including Fidelity's cost allocation methodology, and the impact of certain factors on fund profitability results; (viii) trends regarding industry use of performance fee structures and the possibility of implementing performance fee structures for additional funds; and (ix) the impact of net redemptions from the Fidelity funds.
Based on its evaluation of all of the conclusions noted above, and after considering all factors it believed relevant, the Board ultimately concluded that the advisory fee structures are fair and reasonable, and that the fund's Advisory Contracts should be renewed.
Annual Report
Investment Adviser
Fidelity Management & Research Company
Boston, MA
Investment Sub-Advisers
FMR Co., Inc.
Fidelity Management & Research
(U.K.) Inc.
Fidelity Management & Research
(Japan) Inc.
Fidelity Management & Research
(Hong Kong) Limited
General Distributor
Fidelity Distributors Corporation
Smithfield, RI
Transfer and Service Agents
Fidelity Investments Institutional Operations Company, Inc.
Boston, MA
Fidelity Service Company, Inc.
Boston, MA
Custodian
Brown Brothers Harriman & Company
Boston, MA
(Fidelity Investment logo)(registered trademark)
AVLFI-UANN-1212
1.793580.109
Item 2. Code of Ethics
As of the end of the period, October 31, 2012, Fidelity Advisor Series VIII (the trust) has adopted a code of ethics, as defined in Item 2 of Form N-CSR, that applies to its President and Treasurer and its Chief Financial Officer. A copy of the code of ethics is filed as an exhibit to this Form N-CSR.
Item 3. Audit Committee Financial Expert
The Board of Trustees of the trust has determined that Joseph Mauriello is an audit committee financial expert, as defined in Item 3 of Form N-CSR. Mr. Mauriello is independent for purposes of Item 3 of Form N-CSR.
Item 4. Principal Accountant Fees and Services
Fees and Services
The following table presents fees billed by Deloitte & Touche LLP, the member firms of Deloitte Touche Tohmatsu, and their respective affiliates (collectively, "Deloitte Entities") in each of the last two fiscal years for services rendered to Fidelity Advisor Emerging Markets Fund, Fidelity Advisor Europe Capital Appreciation Fund, and Fidelity Advisor International Capital Appreciation Fund (the "Funds"):
Services Billed by Deloitte Entities
October 31, 2012 FeesA
| Audit Fees | Audit-Related Fees | Tax Fees | All Other Fees |
Fidelity Advisor Emerging Markets Fund | $39,000 | $- | $6,800 | $400 |
Fidelity Advisor Europe Capital Appreciation Fund | $39,000 | $- | $5,700 | $400 |
Fidelity Advisor International Capital Appreciation Fund | $49,000 | $- | $6,800 | $400 |
October 31, 2011 FeesA
| Audit Fees | Audit-Related Fees | Tax Fees | All Other Fees |
Fidelity Advisor Emerging Markets Fund | $39,000 | $- | $6,800 | $300 |
Fidelity Advisor Europe Capital Appreciation Fund | $39,000 | $- | $5,700 | $300 |
Fidelity Advisor International Capital Appreciation Fund | $49,000 | $- | $6,800 | $300 |
A Amounts may reflect rounding.
The following table presents fees billed by PricewaterhouseCoopers LLP ("PwC") in each of the last two fiscal years for services rendered to Fidelity Advisor Diversified International Fund, Fidelity Advisor Emerging Asia Fund, Fidelity Advisor Global Capital Appreciation Fund, Fidelity Advisor Global Equity Income Fund, Fidelity Advisor Overseas Fund, and Fidelity Advisor Value Leaders Fund (the "Funds"):
Services Billed by PwC
October 31, 2012 FeesA, B
| Audit Fees | Audit-Related Fees | Tax Fees | All Other Fees |
Fidelity Advisor Diversified International Fund | $58,000 | $- | $6,100 | $2,400 |
Fidelity Advisor Emerging Asia Fund | $63,000 | $- | $5,100 | $1,700 |
Fidelity Advisor Global Capital Appreciation Fund | $47,000 | $- | $5,100 | $1,500 |
Fidelity Advisor Global Equity Income Fund | $34,000 | $- | $5,100 | $- |
Fidelity Advisor Overseas Fund | $63,000 | $- | $5,300 | $1,800 |
Fidelity Advisor Value Leaders Fund | $42,000 | $- | $4,300 | $1,500 |
October 31, 2011 FeesA, B
| Audit Fees | Audit-Related Fees | Tax Fees | All Other Fees |
Fidelity Advisor Diversified International Fund | $59,000 | $- | $15,500 | $3,300 |
Fidelity Advisor Emerging Asia Fund | $64,000 | $- | $5,100 | $1,900 |
Fidelity Advisor Global Capital Appreciation Fund | $48,000 | $- | $5,100 | $1,700 |
Fidelity Advisor Global Equity Income Fund | $- | $- | $- | $- |
Fidelity Advisor Overseas Fund | $63,000 | $- | $10,000 | $2,200 |
Fidelity Advisor Value Leaders Fund | $43,000 | $- | $4,300 | $1,700 |
A Amounts may reflect rounding.
B Fidelity Advisor Global Equity Income Fund commenced operations on May 2, 2012.
The following table presents fees billed by PwC and Deloitte Entities that were required to be approved by the Audit Committee for services that relate directly to the operations and financial reporting of the Funds and that are rendered on behalf of Fidelity Management & Research Company ("FMR") and entities controlling, controlled by, or under common control with FMR (not including any sub-adviser whose role is primarily portfolio management and is subcontracted with or overseen by another investment adviser) that provide ongoing services to the Funds ("Fund Service Providers"):
Services Billed by Deloitte Entities
| October 31, 2012A | October 31, 2011A |
Audit-Related Fees | $720,000 | $440,000 |
Tax Fees | $- | $- |
All Other Fees | $1,305,000 | $430,000 |
A Amounts may reflect rounding.
Services Billed by PwC
| October 31, 2012A, B | October 31, 2011A, B |
Audit-Related Fees | $3,640,000 | $3,835,000 |
Tax Fees | $- | $- |
All Other Fees | $- | $- |
A Amounts may reflect rounding.
B May include amounts billed prior to the Fidelity Advisor Global Equity Income Fund's commencement of operations.
"Audit-Related Fees" represent fees billed for assurance and related services that are reasonably related to the performance of the fund audit or the review of the fund's financial statements and that are not reported under Audit Fees.
"Tax Fees" represent fees billed for tax compliance, tax advice or tax planning that relate directly to the operations and financial reporting of the fund.
"All Other Fees" represent fees billed for services provided to the fund or Fund Service Provider, a significant portion of which are assurance related, that relate directly to the operations and financial reporting of the fund, excluding those services that are reported under Audit Fees, Audit-Related Fees or Tax Fees.
Assurance services must be performed by an independent public accountant.
* * *
The aggregate non-audit fees billed by PwC and Deloitte Entities for services rendered to the Funds, FMR (not including any sub-adviser whose role is primarily portfolio management and is subcontracted with or overseen by another investment adviser), and any Fund Service Provider for each of the last two fiscal years of the Funds are as follows:
Billed By | October 31, 2012 A,B | October 31, 2011 A,B |
PwC | $4,210,000 | $5,885,000 |
Deloitte Entities | $2,085,000 | $980,000 |
A Amounts may reflect rounding.
B May include amounts billed prior to the Fidelity Advisor Global Equity Income Fund's commencement of operations.
The trust's Audit Committee has considered non-audit services that were not pre-approved that were provided by PwC and Deloitte Entities to Fund Service Providers to be compatible with maintaining the independence of PwC and Deloitte Entities in their audits of the Funds, taking into account representations from PwC and Deloitte Entities, in accordance with Public Company Accounting Oversight Board rules, regarding their independence from the Funds and their related entities and FMR's review of the appropriateness and permissibility under applicable law of such non-audit services prior to their provision to the Fund Service Providers.
Audit Committee Pre-Approval Policies and Procedures
The trust's Audit Committee must pre-approve all audit and non-audit services provided by a fund's independent registered public accounting firm relating to the operations or financial reporting of the fund. Prior to the commencement of any audit or non-audit services to a fund, the Audit Committee reviews the services to determine whether they are appropriate and permissible under applicable law.
The Audit Committee has adopted policies and procedures to, among other purposes, provide a framework for the Committee's consideration of non-audit services by the audit firms that audit the Fidelity funds. The policies and procedures require that any non-audit service provided by a fund audit firm to a Fidelity fund and any non-audit service provided by a fund auditor to a Fund Service Provider that relates directly to the operations and financial reporting of a Fidelity fund ("Covered Service") are subject to approval by the Audit Committee before such service is provided.
All Covered Services must be approved in advance of provision of the service either: (i) by formal resolution of the Audit Committee, or (ii) by oral or written approval of the service by the Chair of the Audit Committee (or if the Chair is unavailable, such other member of the Audit Committee as may be designated by the Chair to act in the Chair's absence). The approval contemplated by (ii) above is permitted where the Treasurer determines that action on such an engagement is necessary before the next meeting of the Audit Committee.
Non-audit services provided by a fund audit firm to a Fund Service Provider that do not relate directly to the operations and financial reporting of a Fidelity fund are reported to the Audit Committee on a periodic basis.
Non-Audit Services Approved Pursuant to Rule 2-01(c)(7)(i)(C) and (ii) of Regulation S-X ("De Minimis Exception")
There were no non-audit services approved or required to be approved by the Audit Committee pursuant to the De Minimis Exception during the Funds' last two fiscal years relating to services provided to (i) the Funds or (ii) any Fund Service Provider that relate directly to the operations and financial reporting of the Funds.
Item 5. Audit Committee of Listed Registrants
Not applicable.
Item 6. Investments
(a) Not applicable.
(b) Not applicable
Item 7. Disclosure of Proxy Voting Policies and Procedures for Closed-End Management Investment Companies
Not applicable.
Item 8. Portfolio Managers of Closed-End Management Investment Companies
Not applicable.
Item 9. Purchase of Equity Securities by Closed-End Management Investment Company and Affiliated Purchasers
Not applicable.
Item 10. Submission of Matters to a Vote of Security Holders
There were no material changes to the procedures by which shareholders may recommend nominees to the trust's Board of Trustees.
Item 11. Controls and Procedures
(a)(i) The President and Treasurer and the Chief Financial Officer have concluded that the trust's disclosure controls and procedures (as defined in Rule 30a-3(c) under the Investment Company Act) provide reasonable assurances that material information relating to the trust is made known to them by the appropriate persons, based on their evaluation of these controls and procedures as of a date within 90 days of the filing date of this report.
(a)(ii) There was no change in the trust's internal control over financial reporting (as defined in Rule 30a-3(d) under the Investment Company Act) that occurred during the second fiscal quarter of the period covered by this report that has materially affected, or is reasonably likely to materially affect, the trust's internal control over financial reporting.
Item 12. Exhibits
(a) | (1) | Code of Ethics pursuant to Item 2 of Form N-CSR is filed and attached hereto as EX-99.CODE ETH. |
(a) | (2) | Certification pursuant to Rule 30a-2(a) under the Investment Company Act of 1940 (17 CFR 270.30a-2(a)) is filed and attached hereto as Exhibit 99.CERT. |
(a) | (3) | Not applicable. |
(b) | | Certification pursuant to Rule 30a-2(b) under the Investment Company Act of 1940 (17 CFR 270.30a-2(b)) is furnished and attached hereto as Exhibit 99.906CERT. |
SIGNATURES
Pursuant to the requirements of the Securities Exchange Act of 1934 and the Investment Company Act of 1940, the registrant has duly caused this report to be signed on its behalf by the undersigned, thereunto duly authorized.
Fidelity Advisor Series VIII
By: | /s/Kenneth B. Robins |
| Kenneth B. Robins |
| President and Treasurer |
| |
Date: | December 26, 2012 |
Pursuant to the requirements of the Securities Exchange Act of 1934 and the Investment Company Act of 1940, this report has been signed below by the following persons on behalf of the registrant and in the capacities and on the dates indicated.
By: | /s/Kenneth B. Robins |
| Kenneth B. Robins |
| President and Treasurer |
| |
Date: | December 26, 2012 |
By: | /s/Christine Reynolds |
| Christine Reynolds |
| Chief Financial Officer |
| |
Date: | December 26, 2012 |